General rights Copyright and moral rights for the publications made accessible in the public portal are retained by the authors and/or other copyright owners and it is a condition of accessing publications that users recognise and abide by the legal requirements associated with these rights. Users may download and print one copy of any publication from the public portal for the purpose of private study or research. You may not further distribute the material or use it for any profit-making activity or commercial gain You may freely distribute the URL identifying the publication in the public portal If you believe that this document breaches copyright please contact us providing details, and we will remove access to the work immediately and investigate your claim. Downloaded from orbit.dtu.dk on: Jul 27, 2022 Adhesive Joints in Wind Turbine Blades Jørgensen, Jeppe Bjørn Link to article, DOI: 10.11581/DTU:00000027 Publication date: 2017 Document Version Publisher's PDF, also known as Version of record Link back to DTU Orbit Citation (APA): Jørgensen, J. B. (2017). Adhesive Joints in Wind Turbine Blades. DTU Wind Energy. DTU Wind Energy PhD Vol. 79 https://doi.org/10.11581/DTU:00000027

Welcome message from author
This document is posted to help you gain knowledge. Please leave a comment to let me know what you think about it! Share it to your friends and learn new things together.
Transcript

General rights Copyright and moral rights for the publications made accessible in the public portal are retained by the authors and/or other copyright owners and it is a condition of accessing publications that users recognise and abide by the legal requirements associated with these rights.
Users may download and print one copy of any publication from the public portal for the purpose of private study or research.
You may not further distribute the material or use it for any profit-making activity or commercial gain
You may freely distribute the URL identifying the publication in the public portal If you believe that this document breaches copyright please contact us providing details, and we will remove access to the work immediately and investigate your claim.
Downloaded from orbit.dtu.dk on: Jul 27, 2022
Adhesive Joints in Wind Turbine Blades
Jørgensen, Jeppe Bjørn
Link to article, DOI:10.11581/DTU:00000027
Publication date:2017
Document VersionPublisher's PDF, also known as Version of record
Link back to DTU Orbit
Citation (APA):Jørgensen, J. B. (2017). Adhesive Joints in Wind Turbine Blades. DTU Wind Energy. DTU Wind Energy PhDVol. 79 https://doi.org/10.11581/DTU:00000027

Dep
artm
ent o
f W
ind
Ener
gy
PhD
Rep
ort 2
017
Adhesive Joints in Wind Turbine Blades
Jeppe Bjørn Jørgensen
DTU Wind Energy PhD-0079(EN) DOI number: 10.11581/DTU:00000027
September 2017

Prepared by:Jeppe Bjørn Jørgensen, Industrial PhD studentLM Wind Power, Department of Composites Engineering and TechnologyTechnical University of Denmark, Department of Wind EnergyMail:[email protected]/[email protected]
Main supervisors:Bent F. Sørensen, Dr.Techn., Head of SectionTechnical University of DenmarkDepartment of Wind Energy, Section of Composite and Materials MechanicsMail:[email protected]
Casper Kildegaard, PhD, Chief EngineerLM Wind PowerDepartment of Composites Engineering and TechnologyMail:[email protected]
Technical University of DenmarkDTU Wind EnergySection of Composite and Materials Mechanics
DTU Risø CampusFrederiksborgvej 399 Building 2284000 Roskilde, Denmarkwww.vindenergi.dtu.dk

PrefaceThis thesis was prepared at LM Wind Power (LM) and at the department of WindEnergy at the Technical University of Denmark (DTU) in fulfillment of the requirementsfor acquiring a PhD degree. Furthermore, the thesis was prepared in accordance withthe requirements of the industrial PhD programme in Denmark that is regulated byInnovation Fund Denmark.
The research described in this thesis is based on the work of an industrial PhD projectin a collaboration between LM Wind Power, Department of Composites Engineering& Technology, and DTU Wind Energy, Section of Composites Mechanics & Materials.The main topic is adhesive joints in wind turbine blades with the primary objective ofdeveloping novel design rules to improve the existing joint design for the three primaryjoint types in the wind turbine blade; the leading-edge joint, the trailing-edge joint andthe web joint. The need for developing larger and more cost effective wind turbine bladeswas a motivation to work in the field of fracture mechanics for adhesive joints used inwind turbine blades. Personally, it was challenging and motivating to couple modelpredictions with lab scale experiments in order to predict the response on full scale windturbine blade joints.
This research was primarily supported by grant no. 4135-00010B from InnovationFund Denmark. This research was also supported by the Danish Centre for CompositeStructures and Materials for Wind Turbines (DCCSM), grant no. 0603-00301B, fromInnovation Fund Denmark. The project has primarily been supervised by Bent F. Søren-sen (DTU Wind Energy) and Casper Kildegaard (LM Wind Power).
Risø campus, Roskilde, November 15, 2017
Jeppe Bjørn Jørgensen

ii

AcknowledgementsDuring this PhD project several persons have supported me such that I could keep themotivation high. Without this support it would not have been possible to overcomethe challenges and obstacles on the way. This section is assigned the institutions thatsupported the project and the people that helped me on the way to complete the PhDproject.
First of all, I would like to thank my two main supervisors, Bent F. Sørensen andCasper Kildegaard for the supervision, guidance and for pointing in the right direction.There has been many non-trivial problems to solve and I believe we all learned somethingnew. Also thanks to my colleagues at LM Wind Power and DTU Wind Energy forcreating a great working environment and a nice approachable atmosphere. This opennessformed the basis for many valuable discussions e.g. about composites, adhesives andfracture mechanics.
In the duration of the PhD project more than 400 test specimens were manufacturedat the laboratory of LM Wind Power and tested at the laboratories of LM Wind Power,DTU Wind Energy and University of Michigan. The valuable discussions with the staffin the laboratories gave me valuable inputs for the project as well as personal learnings.Especially, thanks to the technicians for supervision and guidance during the laboratorywork.
A research stay at University of Michigan, Ann Arbor under supervision of prof.Michael D. Thouless were arranged to work on crack deflection at interfaces experimentally.The topics in this PhD project were within the research field of prof. Thouless e.g.adhesive joints, crack deflection and cohesive laws. Thus, it was possible to share differentviewpoints, methods, experimental approaches and experience on the applicability ofthe methods on adhesive joints. These valuable discussions are gratefully acknowledged.Further, acknowledgements to Fulbright for supporting the research stay at the Universityof Michigan. Thanks to James Gorman, University of Michigan for his help when preparingsome of the Python scripts used for the DIC data analysis and for his help during thelaboratory work at the Department of Mechanical Engineering, University of Michigan,MI, USA. Also, thanks to William LePage for guidance in the lab at University ofMichigan and for the social events during the stay.
A special thank to my wife Nanna Amorsen for delivering two lovely kids (Lili andAksel) in the duration of the project and for reminding me that there is other thingsin life than adhesive joints. Finally, thanks to Nanna and Lili for travelling with me toUSA and for making the research stay at University of Michigan unforgettable.

iv

AbstractThe industrial goal of this PhD project is to enable manufacturing of larger wind turbineblades by improving the existing design methods for adhesive joints. This should improvethe present joint design such that more efficient wind turbine blades can be produced.The main scientific goal of the project is to develop new- and to improve the existingdesign rules for adhesive joints in wind turbine blades. The first scientific studies ofadhesive joints were based on stress analysis, which requires that the bond-line is freeof defects, but this is rarely the case for a wind turbine blade. Instead linear-elasticfracture mechanics are used in this project since it is appropriate to assume that a crackcan initiate and propagate from a pre-existing defect.
The project was divided into three sub-projects. In the first sub-project, the effect ofdifferent parameters (e.g. laminate thickness, post curing and test temperatures) on theformation of transverse cracks in the adhesive were tested experimentally. It was assumedthat the transverse cracks evolved due to a combination of mechanical- and residualstresses in the adhesive. A new approach was developed that allows the residual stressto be determined in several different ways. The accuracy of different ways of measuringresidual stresses in the adhesive was tested by applying five different methods on a singlesandwich test specimen (laminate/adhesive/laminate) that was instrumented with straingauges and fiber Bragg gratings. Quasi-static tensile tests of sandwich specimens showedthat higher post curing temperature and lower test temperature had a negative effect onthe formation of transverse cracks in the adhesive i.e. transverse cracks initiated at lowerapplied mechanical loadings. The effect of increased laminate thickness was minimalunder both static and cyclic loading.
In the second sub-project, tunneling cracks in adhesive joints were analyzed numericallyand experimentally. Simulations with a new tri-material finite element model showedthat the energy release rate of the tunneling crack could be reduced by embedding aso-called buffer-layer with a well-chosen stiffness and -thickness. However, it was foundfor adhesive joints in wind turbine blades that the laminates were already sufficientlystiff. Thus, the effect of a stiffer buffer-layer was small in comparison with the effect ofreducing the thickness of the adhesive layer. A new approach was in combination with ageneric tunneling crack tool used to predict the cyclic crack growth rate for tunnelingcracks in the adhesive joint of a full scale wind turbine blade. Model predictions weretested on a full scale wind turbine blade that was loaded excessively in an edgewisefatigue test in a laboratory. It was demonstrated that the model predictions were inagreement with measurements on the full scale test blade.
In the third sub-project crack deflection at interfaces in adhesive joints was investigatedexperimentally. Therefore, it was necessary to design a test specimen, where a crackcould propagate stable and orthogonal towards a bi-material interface. A four-point
vi Abstract
single-edge-notch-beam (SENB) test specimen loaded in displacement control (fixed grip)was designed and manufactured for the purpose. In order to design the test specimen,new models were established to ensure stable crack growth and thus enable that crackdeflection could be observed during loading (in-situ). A new analytical model of thefour-point SENB specimen was derived, and together with numerical models it was foundthat the test specimen should be short and thick and the start-crack length relativelydeep for the crack to propagate in a stable manner. Using the design from the developedmodels, crack deflection at interfaces for different material systems was tested successfully.For test specimens in selected test series it was observed that a new crack initiated atthe interface before the main crack propagated and reached the interface. This crackingmechanism was used to develop a novel approach to determine the cohesive strengthof the interface. The novel approach was applied to determine the cohesive strength ofdifferent material systems including an adhesive/laminate interface. It was found thatthe cohesive strength of the interfaces was small in comparison with the macroscopicstrength of the adhesive.
ResumeDet industrielle formål med dette ph.d. projekt er at muliggøre fremstilling af størrevindmøllevinger ved at forbedre de eksisterende designmetoder for limsamlinger. Detteskal føre til en forbedring af det nuværende design for limsamlinger således mere effektivevindmøllevinger kan produceres. Det overordnede videnskabelige formål med projektet erat udvikle nye- samt forbedre de eksisterende designregler for limsamlinger i vindmølle-vinger. De første videnskabelige studier af limsamlinger var baseret på spændingsanalyse,som forudsætter at limsamlingen er fremstillet uden defekter, hvilket dog sjældent ertilfældet i en vindmøllevinge. I dette projekt anvendes istedet en fremgangsmåde baseretpå lineær-elastisk brudmekanik, da det med rimelighed kan antages at en revne kaninitiere og vokse fra en allerede eksisterende defekt i limen.
Projektet blev opdelt i tre delprojekter. I det første delprojekt blev dannelsen aftværgående revner i limen testet eksperimentelt og effekten af forskellige parametreblev undersøgt (f.eks. laminattykkelse, efterhærdningstemperatur og testtemperatur).Det blev antaget at de tværgående revner initierede som følge af en kombination afmekaniske- og residualspændinger i limen. En ny fremgangsmåde muliggjorde at residualspændinger i limen kunne bestemmes på forskellige måder. Nøjagtigheden af femforskellige metoder til at måle residualspændinger i limen blev testet vha. et sandwichtestemne (laminat/lim/laminat), som var instrumenteret med strain gauges og fiber Bragggratings. Statiske træktests af sandwichemnerne viste at højere efterhærdningstemperaturog lavere testtemperatur havde en negativ effekt på dannelsen af tværgående revner ilimen, dvs. tværgående revner initierede ved lavere mekanisk belastning. Effekten aftykkere laminat var minimal under både statisk og cyklisk belastning.
I det andet delprojekt blev tunnelrevner i limsamlinger analyseret numerisk ogeksperimentelt. Simuleringer vha. en ny symmetrisk finite element model med treforskellige materialer viste at energifrigørelsesgraden for tunnelrevnen kunne reduceresved at inkludere et såkaldt buffer-lag med en velvalgt stivhed og -tykkelse. Dog vistedet sig for limsamlinger i vindmøllevinger, at stivheden af laminaterne allerede vartilstrækkeligt stor således effekten af et buffer-lag var lille sammenlignet med effektenaf at reducere tykkelsen af limlaget. En ny fremgangsmåde blev anvendt sammenmed et generisk tunnelrevneværktøj til at forudsige cyklisk revnevæksthastighed for enrække af tunnelrevner i en limsamling på en vindmøllevinge. Modelforudsigelserne blevtestet på en fuldskalavinge, som blev belastet ekstremt højt cyklisk under en kantvisudmattelsestest i et laboratorie. Revnelængden for 27 tunnelrevner blev løbende opmåltpå bagkantslimsamlingen under den cyklisk belastede test og det blev demonstreret atmodelforudsigelserne var i overensstemmelse med målingerne på fuldskala-testvingen.
I det tredje delprojekt blev revneafbøjning ved grænseflader i limsamlinger undersøgteksperimentelt. Derfor var det nødvendigt at designe et testemne, hvor en revne kunne
viii Resume
vokse stabilt og vinkelret ind mod en bi-materiale grænseflade. Til formålet blev ettestemne med en sidekærv fremstillet. Testemnet blev belastet i firepunktsbøjning meden påtrykt flytning. Modeller blev udviklet til at designe testemnets geometri for at sikrestabil revnevækst og således muliggøre observation af revneafbøjning under belastning (in-situ). En ny analytisk model af testemnet blev udledt og sammen med numeriske modellerblev det bestemt at testemnet skulle være kort og tykt samt at start-revnelængden skullevære dyb for at revnen kunne vokse stabilt. På baggrund af modellerne blev succesfuldeforsøg med revneafbøjning udført for forskellige materialesystemer med lim. For testemneri udvalgte testserier blev det observeret at en ny revne initierede i grænsefladen indenhovedrevnen nåede at vokse frem. Denne revnemekanisme blev anvendt til at udvikle enny metode til at bestemme den kohæsive styrke af grænsefladen. Metoden blev anvendttil at bestemme den kohæsive styrke af grænsefladen for forskellige materialesystemer,herunder en lim/laminat grænseflade. De målte kohæsive styrker af grænsefladerne varsmå sammenlignet med den makroskopiske styrke af limen.
PublicationsList of publications appended to the thesis and presented in Appendix A:P1 Jeppe B. Jørgensen, Bent F. Sørensen and Casper Kildegaard. ”The effect of
residual stresses on the formation of transverse cracks in adhesive joints for windturbine blades.” Submitted to: International Journal of Solids and Structures(2017).
P2 Jeppe B. Jørgensen, Bent F. Sørensen and Casper Kildegaard. ”The effect ofbuffer-layer on the steady-state energy release rate of a tunneling crack in a windturbine blade joint”. Submitted to: Composite Structures (2017).
P3 Jeppe B. Jørgensen, Bent F. Sørensen and Casper Kildegaard. ”Tunneling cracks infull scale wind turbine blade joints”. Accepted for: Engineering Fracture Mechanics(2017).
P4 Jeppe B. Jørgensen, Casper Kildegaard and Bent F. Sørensen. ”Design of four-pointSENB specimens with stable crack growth”. Submitted to: Engineering FractureMechanics (2017).
P5 Jeppe B. Jørgensen, Bent F. Sørensen and Casper Kildegaard. ”Crack deflection atinterfaces in adhesive joints for wind turbine blades”. Submitted to: CompositesPart A: Applied Science and Manufacturing (2017).
P6 Jeppe B. Jørgensen, Michael D. Thouless, Bent F. Sørensen and Casper Kildegaard.”Determination of mode-I cohesive strength of interfaces”. In: IOP Conf. Series:Materials Science and Engineering, 139, 012024 (2016).

x
ContentsPreface i
Acknowledgements iii
Abstract v
Resume vii
Publications ix
Contents xi
1 Introduction 11.1 Motivation and Problem Statement . . . . . . . . . . . . . . . . . . . . . 21.2 Design Failure Mode and Effects Analysis . . . . . . . . . . . . . . . . . 51.3 State of the Art for Adhesive Bonded Joints . . . . . . . . . . . . . . . . 91.4 Scientific Objectives and Sub-projects based on a Family of Joints . . . . 111.5 Thesis Outline . . . . . . . . . . . . . . . . . . . . . . . . . . . . . . . . . 13
2 Background 152.1 Structural Adhesives for Wind Turbine Blades . . . . . . . . . . . . . . . 152.2 Material Assumptions . . . . . . . . . . . . . . . . . . . . . . . . . . . . 162.3 Material Parameters . . . . . . . . . . . . . . . . . . . . . . . . . . . . . 18
3 The Effect of Residual Stresses on the Formation of Transverse Cracks 213.1 Introduction of Residual Stress Model . . . . . . . . . . . . . . . . . . . . 223.2 Approach for Determination of Stress in the Adhesive at First Crack . . 223.3 Modeling of the Center Cracked Test Specimen . . . . . . . . . . . . . . 243.4 Determination of Residual Stresses . . . . . . . . . . . . . . . . . . . . . 263.5 The Formation of Transverse Cracks in Adhesive Joints . . . . . . . . . . 303.6 Conclusions . . . . . . . . . . . . . . . . . . . . . . . . . . . . . . . . . . 34
4 Tunneling Cracks in Adhesive Bonded Joints 354.1 The Effect of a Buffer-layer on the Propagation of a Tunneling Crack . . 354.2 Prediction of Crack Growth Rates for Tunneling Cracks . . . . . . . . . . 414.3 Conclusions . . . . . . . . . . . . . . . . . . . . . . . . . . . . . . . . . . 45
5 Crack Deflection at Interfaces in Adhesive Bonded Joints 47

xii Contents
5.1 Design of Four-point SENB Specimens with Stable Crack Growth . . . . 485.2 Experimental Test of Crack Deflection at Interfaces in Adhesive Joints . 535.3 Determination of the Mode-I Cohesive Strength for Interfaces . . . . . . 565.4 Conclusions . . . . . . . . . . . . . . . . . . . . . . . . . . . . . . . . . . 60
6 Summary of Results and Concluding Remarks 636.1 Summary of Results . . . . . . . . . . . . . . . . . . . . . . . . . . . . . 636.2 Discussion of Contributions and Impact . . . . . . . . . . . . . . . . . . . 676.3 Determination of Novel Design Rules for Adhesive Bonded Joints . . . . 686.4 Future Work and Challenges for Adhesive Joints in Wind Turbine Blades 716.5 Conclusion . . . . . . . . . . . . . . . . . . . . . . . . . . . . . . . . . . . 72
Bibliography 73
A Appended papers 83
CHAPTER 1Introduction
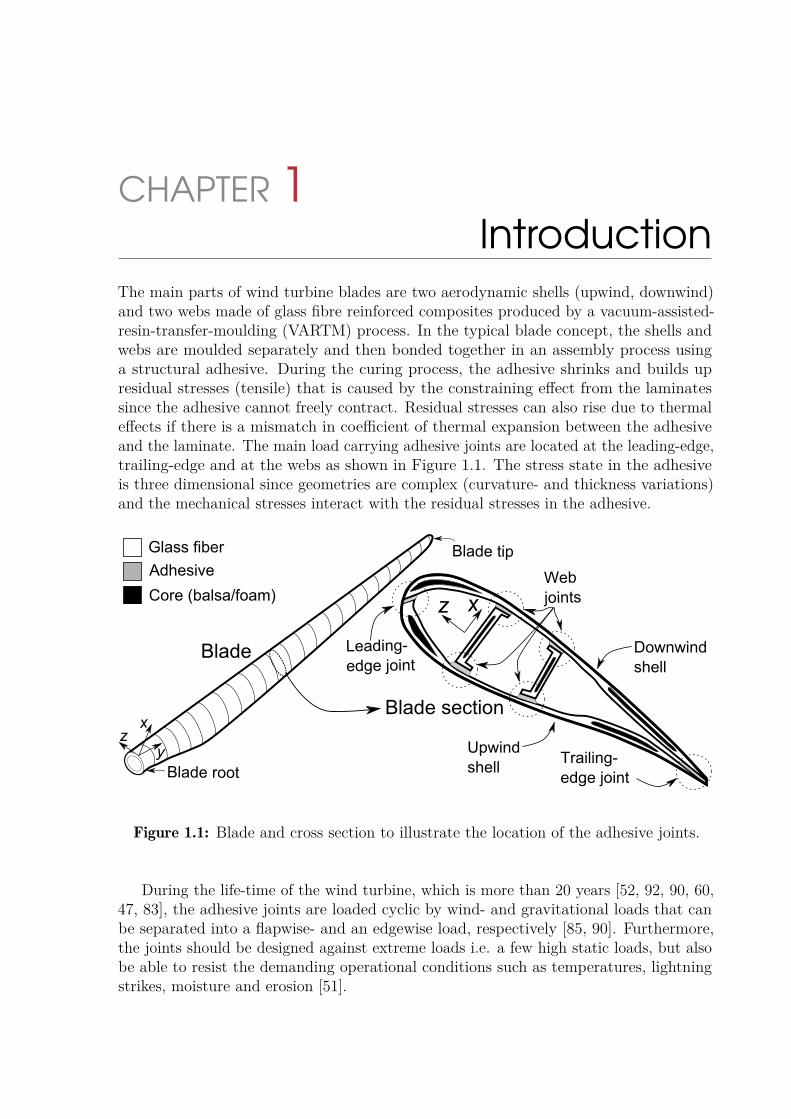
The main parts of wind turbine blades are two aerodynamic shells (upwind, downwind)and two webs made of glass fibre reinforced composites produced by a vacuum-assisted-resin-transfer-moulding (VARTM) process. In the typical blade concept, the shells andwebs are moulded separately and then bonded together in an assembly process usinga structural adhesive. During the curing process, the adhesive shrinks and builds upresidual stresses (tensile) that is caused by the constraining effect from the laminatessince the adhesive cannot freely contract. Residual stresses can also rise due to thermaleffects if there is a mismatch in coefficient of thermal expansion between the adhesiveand the laminate. The main load carrying adhesive joints are located at the leading-edge,trailing-edge and at the webs as shown in Figure 1.1. The stress state in the adhesiveis three dimensional since geometries are complex (curvature- and thickness variations)and the mechanical stresses interact with the residual stresses in the adhesive.
zx
y
Blade
Blade tip
Blade root
Leading- edge joint
Core (balsa/foam)
Glass fiber
Adhesive Webjoints
Blade section
Trailing- edge joint
Upwindshell
Downwindshell
z x
Figure 1.1: Blade and cross section to illustrate the location of the adhesive joints.
During the life-time of the wind turbine, which is more than 20 years [52, 92, 90, 60,47, 83], the adhesive joints are loaded cyclic by wind- and gravitational loads that canbe separated into a flapwise- and an edgewise load, respectively [85, 90]. Furthermore,the joints should be designed against extreme loads i.e. a few high static loads, but alsobe able to resist the demanding operational conditions such as temperatures, lightningstrikes, moisture and erosion [51].

2 1 Introduction
1.1 Motivation and Problem StatementIn the recent decades, technology developments and improvements have increased thepower ratings for wind turbines. Thus, the levelized cost of energy (LCOE) has decreasedand further capacity of wind energy were installed [54]. In order to reduce the LCOE,wind turbines, and particular the blades have increased in size over the past years asillustrated in Figure 1.2.
93.0 m(Statue of Liberty)
68.5 m(Wing span onAirbus A380)
Figure 1.2: The increase in blade sizes over the last four decades (LM Wind Power).
Larger wind turbines means that for the same level of energy production, fewer unitsare required, which reduces the operation costs of the wind farm [29]. The power ratingsare now above 8 MW and the length of the blades has exceeded 85 m. It is expectedthat even longer blades will be produced in the near future to fit wind turbines withpower ratings of about 12-15 MW [5]. Even concept designs of wind turbines up to 20MW are being explored, where one of the most important challenges is to limit the bladeweight [61]. Another benefit of manufacturing lighter blades is the cost reduction for theremaining components (hub, nacelle, tower, foundation [32]) in the wind turbine sincethe loadings on these components become smaller.
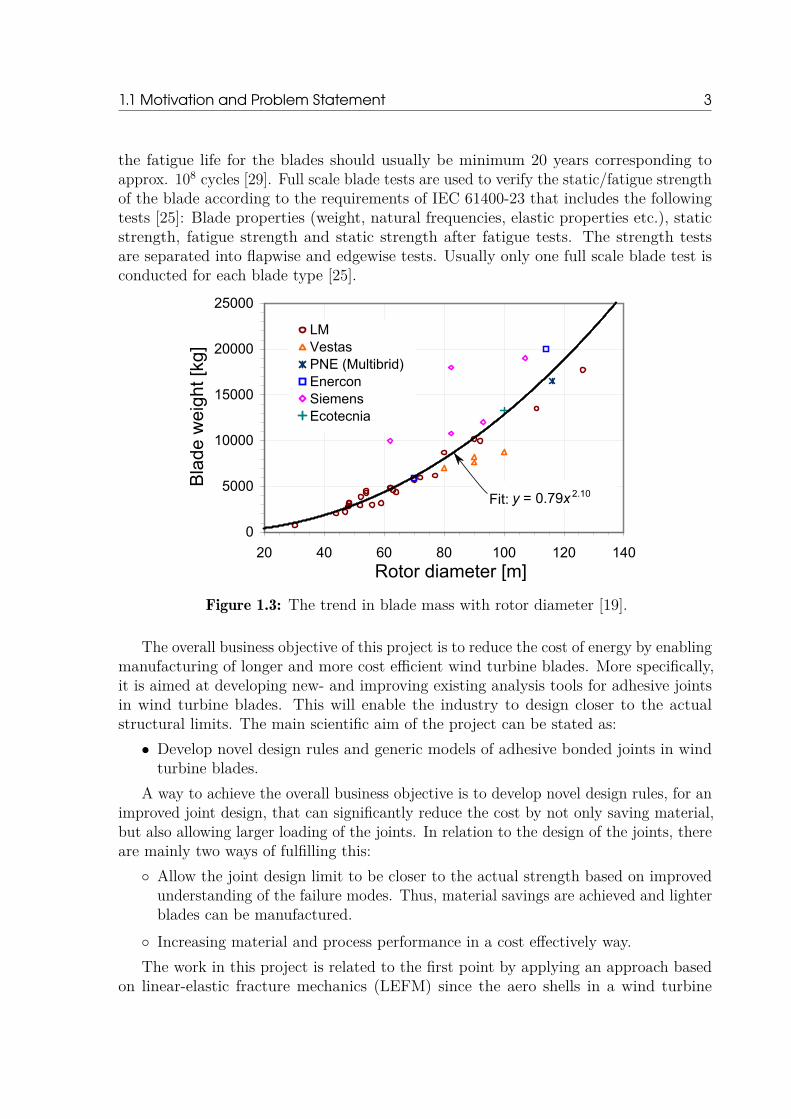
Historically, the weight of the blades measured in kg, has increased to the power ofabout 2.1 of the rotor diameter in meters as shown in Figure 1.3 [19, 65]. With increasingsize and weight of the blades, the structural performance requirements become moredifficult to achieve. For wind turbine blades, two important design requirements aresufficiently bending stiffness to maintain tip clearance towards the tower and sufficientlyblade bending strength against extreme static loadings e.g. a 50-year gust. Furthermore,
1.1 Motivation and Problem Statement 3
the fatigue life for the blades should usually be minimum 20 years corresponding toapprox. 108 cycles [29]. Full scale blade tests are used to verify the static/fatigue strengthof the blade according to the requirements of IEC 61400-23 that includes the followingtests [25]: Blade properties (weight, natural frequencies, elastic properties etc.), staticstrength, fatigue strength and static strength after fatigue tests. The strength testsare separated into flapwise and edgewise tests. Usually only one full scale blade test isconducted for each blade type [25].
y = 0.79x 2.10
0
5000
10000
15000
20000
25000
20 40 60 80 100 120 140
Rotor diameter [m]
Bla
de w
eigh
t [kg
]
LMVestasPNE (Multibrid)EnerconSiemensEcotecnia
Fit:
Figure 1.3: The trend in blade mass with rotor diameter [19].
The overall business objective of this project is to reduce the cost of energy by enablingmanufacturing of longer and more cost efficient wind turbine blades. More specifically,it is aimed at developing new- and improving existing analysis tools for adhesive jointsin wind turbine blades. This will enable the industry to design closer to the actualstructural limits. The main scientific aim of the project can be stated as:• Develop novel design rules and generic models of adhesive bonded joints in wind
turbine blades.A way to achieve the overall business objective is to develop novel design rules, for an
improved joint design, that can significantly reduce the cost by not only saving material,but also allowing larger loading of the joints. In relation to the design of the joints, thereare mainly two ways of fulfilling this: Allow the joint design limit to be closer to the actual strength based on improved
understanding of the failure modes. Thus, material savings are achieved and lighterblades can be manufactured. Increasing material and process performance in a cost effectively way.The work in this project is related to the first point by applying an approach based
on linear-elastic fracture mechanics (LEFM) since the aero shells in a wind turbine

4 1 Introduction
rotor blade are bonded by a structural adhesive and it is appropriate to assume that theadhesive contains manufacturing flaws from which a crack can initiate and propagate. Thismeans that cost reductions can be achieved by improved understanding of the crackingmechanisms in the joints, which enable a design closer to the actual structural/materiallimits. As exemplified in Figure 1.4, the larger design margin, the more safe or conservativedesign, but too large design margins adds unnecessary, and costly, material to the blade.
Fre
quen
cy
design margin
Fre
quen
cy
design margin(A) (B)
failure
load variability
material variabilityload variability
material variability
Figure 1.4: (A) Overly conservative joint design. (B) Joint design with desired probabilityof failure (modified from Straalen et al. [94]).
The variable nature of both the loadings (e.g. energy release rate) and the adhesivejoint resistance (e.g. fracture toughness) complicates the development of design rules[94]. The variation of the loadings, i.a. caused by the random nature of the wind,cannot directly be changed. The load distribution can be translated (reduced) by addingmaterial, but this increases the blade weight in an undesired manner. Alternatively, theload distribution can be translated (reduced) e.g. by reducing the residual stresses inthe adhesive. The residual stress magnitude can be reduced by improved understandingof the residual stress development in the adhesive during the manufacturing process.The joint material distribution can be translated (enhanced/increased) by improving themechanical properties of the joints e.g. by using a better but more expensive adhesivematerial systems.
Design based solely on probabilistic considerations is an old fashioned way of designingadhesive bonded joints. Another way of improving the structural performance of anadhesive joint is to apply a modern fracture mechanics based approach to design thejoint, such that, if an isolated crack initiates and starts to grow, then crack propagationis stable i.e. the energy release rate decreases with crack length. A good damage tolerantdesign for wind turbine blade joints contains only cracks that deflects or arrests beforereaching a critical length. This can be achieved by improved understanding of thecracking mechanisms in the joint, which is the main problem to investigate in this thesis.
1.2 Design Failure Mode and Effects Analysis 5
1.1.1 Cracking Mechanisms and Damage Tolerance ofAdhesive Joints
Adhesive joints are typically one of the first structural details in a blade to developdamage that is defined as distributed adhesive cracks [90]. If several distributed cracksinitiate and evolve simultaneously, then a damage based design approach can be appliedto improve the joint design [75, 64].
Although, the joints are designed properly according to the structural design limitsfor crack initiation, it is advantageous to ensure that the joint design is damage toleranti.e. building in an extra safety feature. Thus, the damage develops in a stable mannerand is detectable before it reaches a critical state i.e. joint failure [90]. The term failuredefines the critical state where the joint loses its capability to carry load. Models andexperimental test results of damage development are also desirable since they can beused to plan maintenance by evaluating the damage growth rates and -sizes [37].
Adhesive joints can develop damage or fail in several different ways (failure modes)depending on material properties, temperatures, environmental conditions, loadings andgeometry. Accounting for these parameters are necessary in order to design a reliable anddamage tolerant adhesive joint. Especially, adhesive joints made of composite materialscan fail in a number of ways since cracks can develop in both the adhesive and thelaminate, and these can even interact and thereby complicate the design process further.Thus, the blade designer has to consider a broad range of different potential failure modesas elaborated next.
1.2 Design Failure Mode and Effects AnalysisDesign Failure Mode and Effects Analysis (DFMEA) is a methodology to identify theways a given product potentially can fail and it includes a prioritization of the potentialmodes of failure evaluated based on the severity of the failure, the occurrence of thefailure and the detectability of the failure [63]. For the present analysis, the productis the adhesive joint component in a wind turbine blade. Generally, about ten stepsare needed to complete a full DFMEA [63]. Since it is out of the scope to conduct afull DFMEA, a brief (mini) DFMEA of adhesive joints in wind turbine blades will bepresented. Therefore, only the first two steps in the DFMEA methodology presented byMcDermott et al. [63] is applied:
(1) Review the product.(2) Brainstorm potential failure modes.
The main idea of step (1) is to be familiar with the product e.g. by drawings or prototypes.The primary purpose of this mini DFMEA is to identify potential failure modes thatare generic i.e. frequent in the three main structural adhesive joints (the leading-edge,trailing-edge and web joints).

6 1 Introduction
1.2.1 Potential Failure ModesThe first step in the mini DFMEA presented here is a brief review of the manufacturingprocedure and the typical design of the adhesive joints. From a geometrical point of view,the leading-edge, trailing-edge and web joints are different as shown in Figure 1.5. Theleading-edge joint is connecting the upwind and downwind shells that are produced ofglass fibre reinforced laminates in a VARTM process. The leading-edge joint is designedwith a flange to support the joint in order to re-direct the load transfer from peel stressesto shear stresses. The trailing-edge joint is manufactured by bonding the upwind- anddownwind shells (two laminates) that are produced of glass fibre reinforced laminates.The web joint is manufactured by bonding the web foot onto the main laminate of theblade. The main laminate is primarily made of a thick stack of uni-directional glassfibre layers. The web body is produced by infusion of a balsa/foam core with thin skinlaminates, whereas the web foot is primarily made of different types of glass fibre.
The second step in the mini DFMEA is a brief brainstorm of the potential failuremodes that can be thought to be identified for the leading-edge, trailing-edge and webjoints. From a fracture mechanics point of view, the three joints are similar as shown bycomparing the types of potential cracking modes in Figure 1.5. The potential cracks inthe x-z plane of the adhesive joints are numbered (#1.i) and those in the x-y plane arenumbered (#2.i), where i is an integer between 1 and 6. The potential types of cracksare listed below:
# 1.1 Cohesive failure of the adhesive.# 1.2 Debond crack in the laminate-adhesive interface.# 1.3 Debond crack that is kinking into the laminate.# 1.4 Delamination in the laminate.# 2.1 Transverse crack (tunneling crack loaded in tension (mode-I)).# 2.2 Singly deflected crack (L-shaped tunneling crack with debonding).# 2.3 One-sided doubly deflected crack (T -shaped tunneling crack with debonding).# 2.4 Two-sided doubly deflected crack (H-shaped tunneling crack with debonding).# 2.5 Crack penetration into laminate (tunneling crack penetrating the laminate).# 2.6 Oblique crack (tunneling crack loaded in shear (mode-II)).
The description of the potential cracking mode outside the parenthesis of the list is the2D version and the description inside the parenthesis of the list is the 3D version ofthe potential cracking mode. The coordinate system is oriented such that the y-axis ispointing from the blade root towards the blade tip according to Figure 1.1. The loadingcomponents are named according to:• P : Normal force• T : Shear force (longitudinal shear)• M : Bending moment (in transverse plane)

1.2 Design Failure Mode and Effects Analysis 7
#2.1 #2.2 #2.3 #2.4#2.5 #2.6
#1.4 #1.3
#1.2#1.1
#1.4
#2.1#2.2
#2.3#2.4
#2.5#2.6
T
#1.1
#1.3
#1.4#1.2
#2.1 #2.2#2.3 #2.4 #2.5 #2.6
#1.1
#1.2
#1.3
#1.4
(A)
(B)
(C)
T
T
T
PP
M
M
P
P
P
P
P P P
TT
TT
T T T
TT
TPPPM M
M
M MM
M
M
xyz
MM
P M
xyz
P
P
P
P
P
P
P
P
PP P
P
P
Core (balsa/foam)
Glass fiber
Adhesive
xyz
Figure 1.5: Potential cracking modes in: (A) leading-edge joint, (B) trailing-edge joint,(C) web joint.
8 1 Introduction
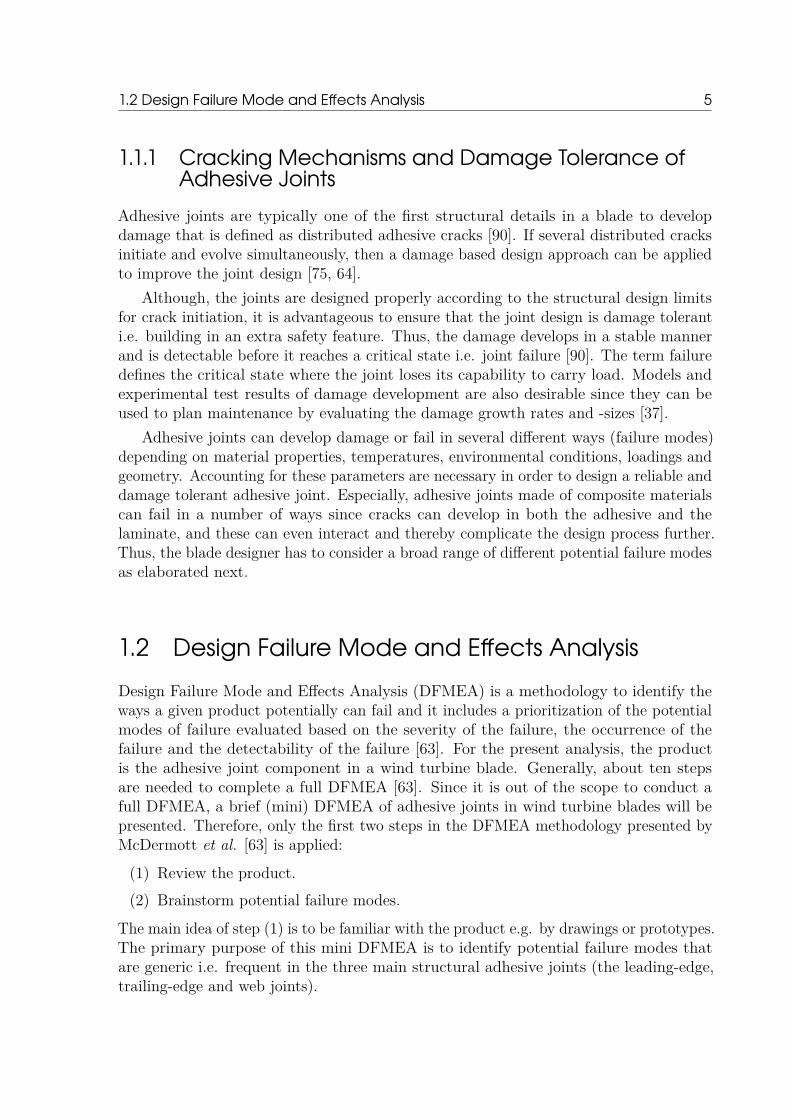
1.2.2 Evaluation of Potential Failure Modes andIdentification of a Family of Joints
The potential failure modes identified and presented in Figure 1.5 (A-C) are foundto be comparable, especially the types of cracks named #2.i. Since the leading-edge,trailing-edge and web joints contain similar potential failure modes, they are referred toas a ”family of joints”. Although the geometrical and structural details of the joints aredifferent, from a fracture mechanics point of view the joints are similar.
In order to cover the most important failure modes in the joint design process withthe least amount of different models/tests, it is desirable to select and analyze failuremodes that are present in all three members of the ”family of joints”. Since the transversecracking mode (#2.1 in Figure 1.6) is one of the first steps in the cracking processand potentially can be found in all three members of the ”family of joints” i.e. theleading-edge, the trailing-edge and the web joints, it is advantageous to analyze thisparticular cracking mode in details. Thus, it is aimed at analyzing transverse cracking ofthe adhesive using the same model concept for the three members of the ”family of joints”.When a transverse crack in the bondline of the ”family of joints” is fully developed, itmay deflect along the interface (#2.2, #2.3 and #2.4 in Figure 1.6) or penetrate intothe laminate (#2.5 in Figure 1.6).
#2.1 #2.2 #2.3 #2.4 #2.5
x yz
x y P(A) (B)
P
Figure 1.6: (A) Blade section. (B) Potential cracking modes in the x-y plane of theadhesive joint under loading by the normal force, P .
According to Figure 1.5, the main loading components on the different types of cracksnamed #2.i are the normal force, P , and the shear force, T . The forces P and T arecausing longitudinal tension and -shearing deformation of the joint, respectively. Tosimplify the analysis, the shear loading component is neglected meaning that the potentialcracking mode numbered #2.6 in Figure 1.5 is not considered. Thus, the primary crackingmodes to be analyzed in the present work are those presented in Figure 1.6 (#2.1, #2.2,#2.3, #2.4 and #2.5). There will be a primary focus on the fundamental cracking modenumbered #2.1 in Figure 1.6. In order to analyze these cracking modes and -phenomenafor adhesive joints in wind turbine blades novel approaches, test methods and modelconcepts are desired.

1.3 State of the Art for Adhesive Bonded Joints 9
1.3 State of the Art for Adhesive Bonded JointsSome of the first scientific studies of adhesive bonded joints, by Volkersen [109], Goland &Reissner [26] and Hart-Smith [35], were closed form solutions based on stress for single lapjoints. Later, other joint types were modeled using a similar approach [33] and accordingto Figure 1.7 by Hart-Smith [34], a double scarf joint was the preferable joint type if theadherends were thick and high strength was a requirement. More advanced elastic-plasticmodels were also developed by Hart-Smith [36] in order to account for plasticity of theadhesive and the effect of flaws at the adhesive-substrate interface. Another applicationof modeling based on stress was the interaction between an elliptical shaped crack and aplane of weakness (such as an interface) under various conditions as demonstrated byCook and Gordon [18]. They established a criterion (Cook-Gordon criterion) statingthat the interface fails if the interface-to-substrate strength ratio is less than about 1/3to 1/5.
scarf joint
stepped-lap joint
tapered-strap joint
single-lap joint
double-strap jointBon
ded
join
t str
engt
h
Adherend thickness
adhe
rend
failu
res
outs
ide
join
t
shear failures
shear failures
peel failures
bending of adherendsdue to eccentric load path
Figure 1.7: Bonded joint strength for various joint types with different thickness ofadherends. The failure modes on the diagram represent the limit on efficientdesign for each joint type (modified from Hart-Smith [34]).
Design based on stress analysis requires that the bond line is free of manufacturingflaws and defects, which is rarely the case in a wind turbine blade joint. It is thereforeappropriate to assume that the joint contains manufacturing flaws [91]. Classical linear-elastic fracture mechanics (LEFM) can be applied if a flaw or a pre-crack is present. For

10 1 Introduction
LEFM to be accurate the materials must deform in a linear-elastic manner, be isotropicand the plastic zone size and the fracture process zone at the crack tip must be small[44, 42]. When these assumptions are satisfied, the energy release rate approach byGriffith [28] is related to the stress intensity approach through the Irwin relation [45].Solutions for practical crack problems have been developed based on LEFM to predictcrack propagation [101, 43, 104]. One of the important applications of LEFM is themodeling of a channeling crack propagating through a thin film [11]. A related problem isthat of a tunneling crack propagating through an adhesive layer constrained in-betweentwo substrates as demonstrated by Ho and Suo [100, 41]. The energy release rate of asteady-state tunneling crack can be determined using a plane strain solution althoughthe tunneling crack problem is a 3D process [41]. In turn, 3D finite element (FE) modelsare needed for transient modeling of channeling/tunneling cracks since the crack lengthmust reach a certain length for the crack to become steady-state [68, 111, 4, 6]. For atunneling crack in a homogenous solid this length is about twice the thickness of thecracked layer [68, 41]. For tunneling crack models, delamination between the adhesiveand the substrate can be included as well [17, 97].
LEFM can also be applied for the prediction of crack deflection at interfaces [39, 40,38, 30, 62]. He and Hutchinson [39] established a criterion for crack deflection statingthat the interface-to-substrate toughness ratio should be less than 1/4 for the crackto deflect at the interface. For cyclic crack propagation, the Paris law can be used tocouple the stress intensity factor range to the crack growth rate [69]. These models areimportant for the prediction of crack propagation in adhesive joints for wind turbineblades [22]. The analytical methods based on LEFM are useful since they are reliableand quick to apply, but they have their limitations.
The recent studies have found a way to account for the influence of non-linear effects inthe fracture process zone and to predict the initiation of a new crack. The non-linearitiescan be accounted for by using a cohesive law, which is relating the separation of thecrack surfaces with the prescribed tractions [90]. The cohesive law can be measuredexperimentally, e.g. by the J-integral approach [59, 88, 89, 7, 27]. Alternatively,Mohammed and Liechti [66] measured the cohesive law parameters for a bi-materialinterface using a calibration procedure. The cohesive law can, based on cohesive zonemodeling (CZM) and inputs from small scale test specimens, be used to predict thefailure strength of larger adhesive joints [87]. Cohesive zone modeling with finite elementsimulations can also be used to predict both crack initiation and crack propagation foradhesive bonded joints [114, 113, 66]. Another application of cohesive zone modeling iscrack deflection at interfaces as demonstrated in the studies by Parmigiani and Thouless[72] and Brinckmann et al. [13]. They concluded that both the fracture toughness andthe cohesive strength are important parameters in an accurate crack deflection criterion.
As demonstrated, methodologies exist for the modeling of cracking mechanismsin adhesive bonded joints, although primarily for simplified geometries and loadings.However, the methodologies applicability on the complicated cracking mechanisms inadhesive joints for wind turbine blades needs to be further investigated. Therefore, thetheme of this thesis is, based the fundamental methodologies, to develop novel approachesand to test their applicability on adhesive joints for wind turbine blades.
1.4 Scientific Objectives and Sub-projects based on a Family of Joints 11
1.4 Scientific Objectives and Sub-projects basedon a Family of Joints
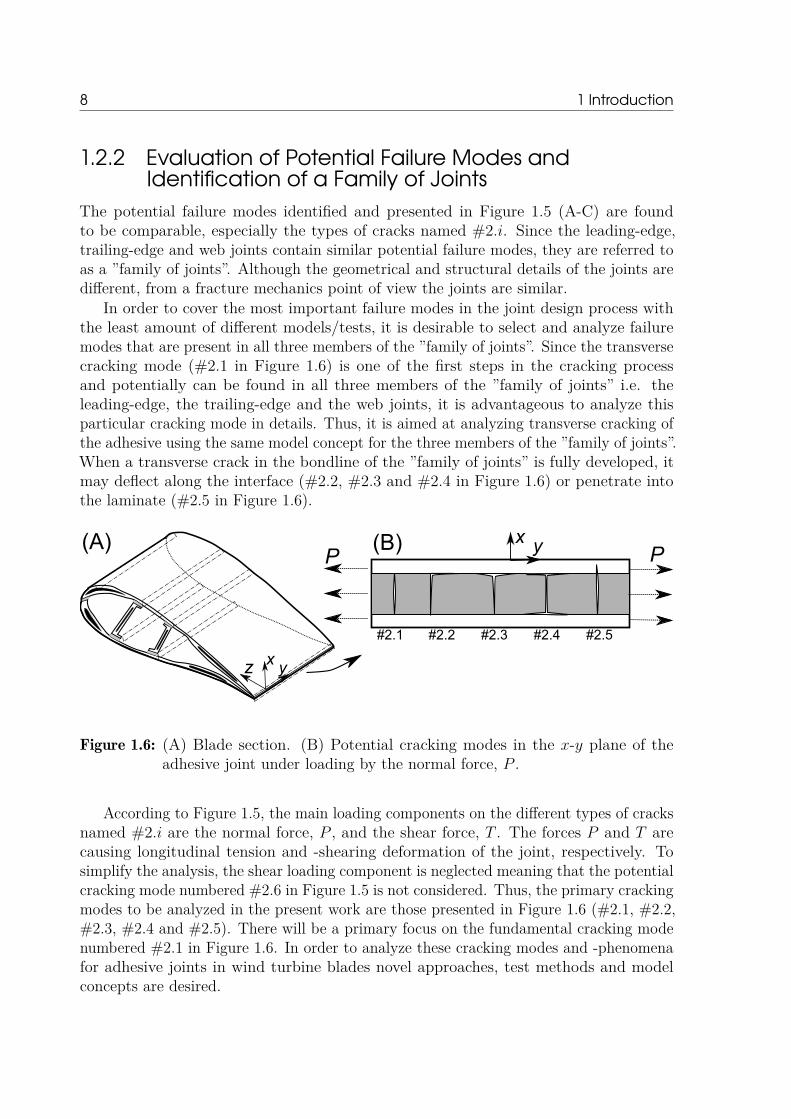
As mentioned, the structural details of the ”family of joints” are different, but from afracture mechanics point of view, the cracking sequence is the same (see Figure 1.8):
1. A crack initiates from a pre-exising defect in the adhesive and evolves to a transversecrack.
2. The transverse crack propagates as a tunneling crack across the adhesive layer.3. When the transverse crack reaches the interface, it can deflect along the interface
or penetrate into the laminate.
This sequence of potential cracking defines the three main sub projects of the presentwork, see Figure 1.8. It is assumed that cracks in the adhesive propagate under combinedmechanical stress, σm, and residual stress, σr. This should be taken into account in thedevelopment of generic design rules and model concepts for the ”family of joints”.
Leading-edge joint
Initiation of a transverse crack
Propagation of atunneling crack
Sub project 1:Residual stress andinitiation of cracks
Sub project 2:Tunneling cracks
Crack penetration
Crack deflection
Sub project 3:Crack deflectionat interfacesx
y
Web joint Trailing-edge joint
Family of joints
Sub projects
σ rσm+
zx y z
x y
zx y
CrackCrack
Crack
#1#2#1
#1
#2
#1
#1
#2
#1
#1#2
#1
z
Figure 1.8: Sub projects and the ”family of joints” (#1: Laminate/substrate, #2: Adhe-sive).
12 1 Introduction
1.4.1 Definition of Scientific ObjectivesFor each sub project, scientific objectives should be defined based on the gaps identifiedin the state of the art literature.
Sub project 1: The evolution of transverse cracks is promoted by residual stressesin the adhesive. Therefore, it is the aim to improve the measuring techniques fordetermination of residual stresses and establish a robust method where the residualstress measurement can be included in the determination of the stress in the adhesiveat first transverse crack. Furthermore, it is the goal to investigate the effect of differentparameters such as temperatures on the evolution of transverse cracks in adhesive joints.General techniques for the measurement of residual stresses is well known in the literature[110] e.g. by using different types of beam specimens [67]. However, the applicability andaccuracy of the different methods for the particular adhesive joints needs to be testedexperimentally. Furthermore, it is desired to measure the residual stress during themanufacturing of the adhesive joints such that the manufacturing step where the largestpart of the residual stress builds up in the adhesive can be identified. Other complicatingfactors are the specific joint geometry and the constraining effect of the laminates on theadhesive (during curing), which might affect the residual stress magnitude. Therefore, itis needed to develop a new type of test specimen and approach where these effects canbe included.
Sub project 2: The existing tunneling crack models found in the literature [100, 43,41, 97, 98, 10] are limited to bi-material models e.g. a layer of adhesive constrainedin-between two substrates. In turn, for a wind turbine blade joint the substrates aremade of several different layers of materials that for some cases needs to be modeled asorthotropic. Therefore, the existing tunneling crack models needs to be expanded andtailored to the applicability on adhesive joints for wind turbine blades. The applicabilityof tunneling crack models on real full scale structures are limited and complicated due tothe many parameters (e.g. environments, loads, geometries, material variations) thatneeds to be accounted for in an accurate analysis. Also, the difficulty of collecting data(e.g. crack lengths, geometries, loadings) on structures in operation makes measurementsof tunneling cracks challenging, especially under cyclic loading. Therefore, a generictunneling crack tool is desired that is easy to apply (with sufficient accuracy) on realengineering structures that are loaded cyclic e.g. wind turbine blades.
Sub project 3: Modeling the deflection of a crack meeting an interface were, at first,based on either stress criteria [18, 31] or energy criteria [40, 38, 30, 62, 106]. The stresscriteria and energy based approach can be unified using a cohesive law with cohesivezone finite element simulations [72, 13]. The parameters for the cohesive law can e.g. bemeasured by the J-integral approach [59, 27], but accurate experimental determination ofcohesive strength magnitude for bi-material interfaces is challenging. Furthermore, stablecrack growth experiments where the crack deflection process are clearly documentedare limited [57]. It is therefore the aim to design an experiment to test crack deflectionat interfaces, where the crack deflection process can be clearly identified. Thus, novelmodels need to be developed in order to design the experiment properly i.e. with stablecrack propagation. A successful crack deflection experiment should be demonstrated in
1.5 Thesis Outline 13
practice. Finally, it is the aim to develop a novel approach to determine the cohesivestrength of a bi-material interface, σi, since this is an important parameter in an accuratecrack deflection criterion.
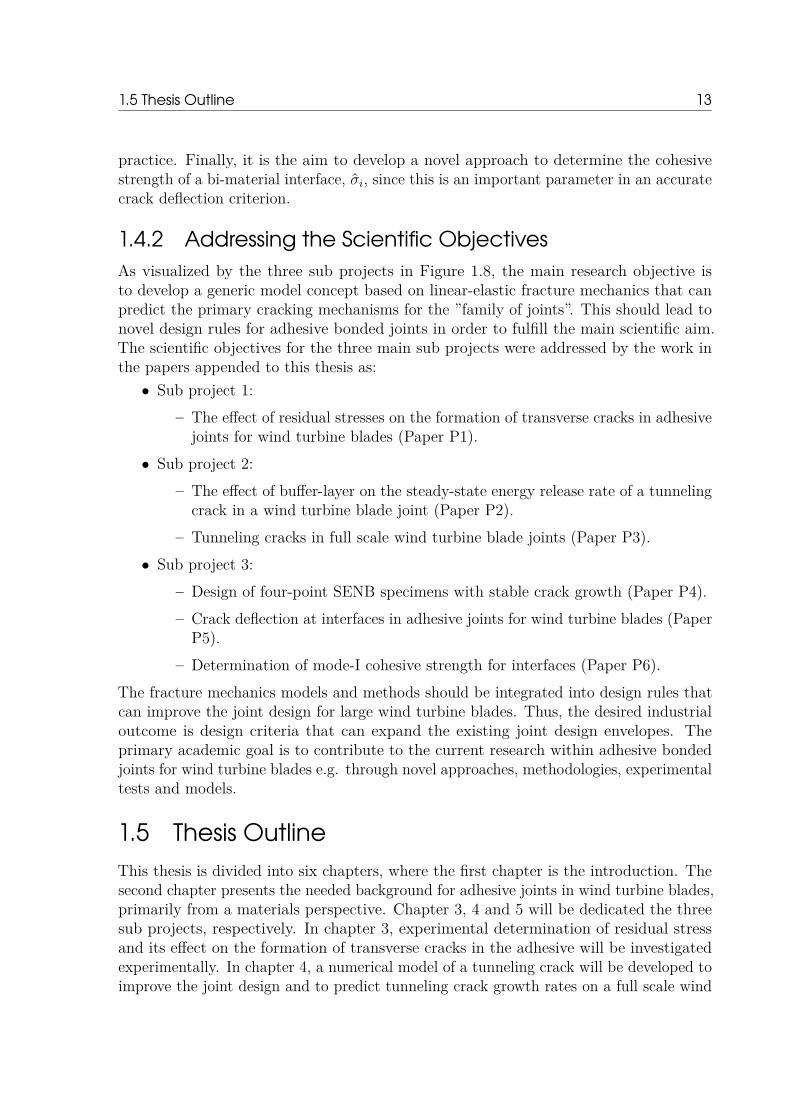
1.4.2 Addressing the Scientific ObjectivesAs visualized by the three sub projects in Figure 1.8, the main research objective isto develop a generic model concept based on linear-elastic fracture mechanics that canpredict the primary cracking mechanisms for the ”family of joints”. This should lead tonovel design rules for adhesive bonded joints in order to fulfill the main scientific aim.The scientific objectives for the three main sub projects were addressed by the work inthe papers appended to this thesis as:• Sub project 1:
– The effect of residual stresses on the formation of transverse cracks in adhesivejoints for wind turbine blades (Paper P1).
• Sub project 2:– The effect of buffer-layer on the steady-state energy release rate of a tunneling
crack in a wind turbine blade joint (Paper P2).– Tunneling cracks in full scale wind turbine blade joints (Paper P3).
• Sub project 3:– Design of four-point SENB specimens with stable crack growth (Paper P4).– Crack deflection at interfaces in adhesive joints for wind turbine blades (Paper
P5).– Determination of mode-I cohesive strength for interfaces (Paper P6).
The fracture mechanics models and methods should be integrated into design rules thatcan improve the joint design for large wind turbine blades. Thus, the desired industrialoutcome is design criteria that can expand the existing joint design envelopes. Theprimary academic goal is to contribute to the current research within adhesive bondedjoints for wind turbine blades e.g. through novel approaches, methodologies, experimentaltests and models.
1.5 Thesis OutlineThis thesis is divided into six chapters, where the first chapter is the introduction. Thesecond chapter presents the needed background for adhesive joints in wind turbine blades,primarily from a materials perspective. Chapter 3, 4 and 5 will be dedicated the threesub projects, respectively. In chapter 3, experimental determination of residual stressand its effect on the formation of transverse cracks in the adhesive will be investigatedexperimentally. In chapter 4, a numerical model of a tunneling crack will be developed toimprove the joint design and to predict tunneling crack growth rates on a full scale wind

14 1 Introduction
turbine blade joint. Chapter 5 presents investigations of the problem of crack deflectionat interfaces through modeling and experimental tests. Finally in chapter 6, the novelmodel concepts and experimental results will be discussed in relation to the existingknowledge in the literature. Furthermore, in this last part of the thesis, the papers willbe summarized and the main findings will be combined in order to provide a broaderperspective and to establish novel design rules for adhesive bonded joints. To conclude,the future challenges for adhesive joints in wind turbine blades will be discussed and abrief conclusion will sum up the major results.

CHAPTER 2Background
In this chapter the background of adhesive joints for wind turbine blade and materialswill be presented beginning with an introduction of structural adhesives.
2.1 Structural Adhesives for Wind Turbine BladesAccording to Slütter [84], in a typical wind turbine blade with a length of 43 meter, theshells are bonded by applying about 165 kg adhesive and the adhesive layer thicknesscan be up to 30 mm. Therefore, the price- and properties of the adhesive, e.g. strength,stiffness and fracture toughness, are important parameters when selecting the rightstructural adhesive for the wind turbine blade. Some of the largest suppliers of structuraladhesives for the wind turbine blade industry are: Huntsman, ITW Plexus, SciGrip,Reichhold, Sika and Scott Bader.
Structural adhesives are load-bearing adhesives since they are capable of addingstrength to the adherends [46]. Structural adhesives are usually two-component resin-hardener systems, where a thermosetting resin and a hardener are mixed to start thechemical reaction (sometimes accelerated by heat). During the reaction the molecules arelinked together and the material becomes solid such that a permanent bond is created.Fillers can be added to the adhesive in order to tailor specific properties such as chemicalshrinkage, stiffness or toughness [8]. Heat treatment is another way to enhance certainproperties. The main types of structural adhesives, commonly used for wind turbineblade joints, are [84]:• Epoxy adhesives (EP)• Polyurethane adhesives (PU)• Methyl methacrylate adhesives (MMA)• Vinylester adhesives (VE)
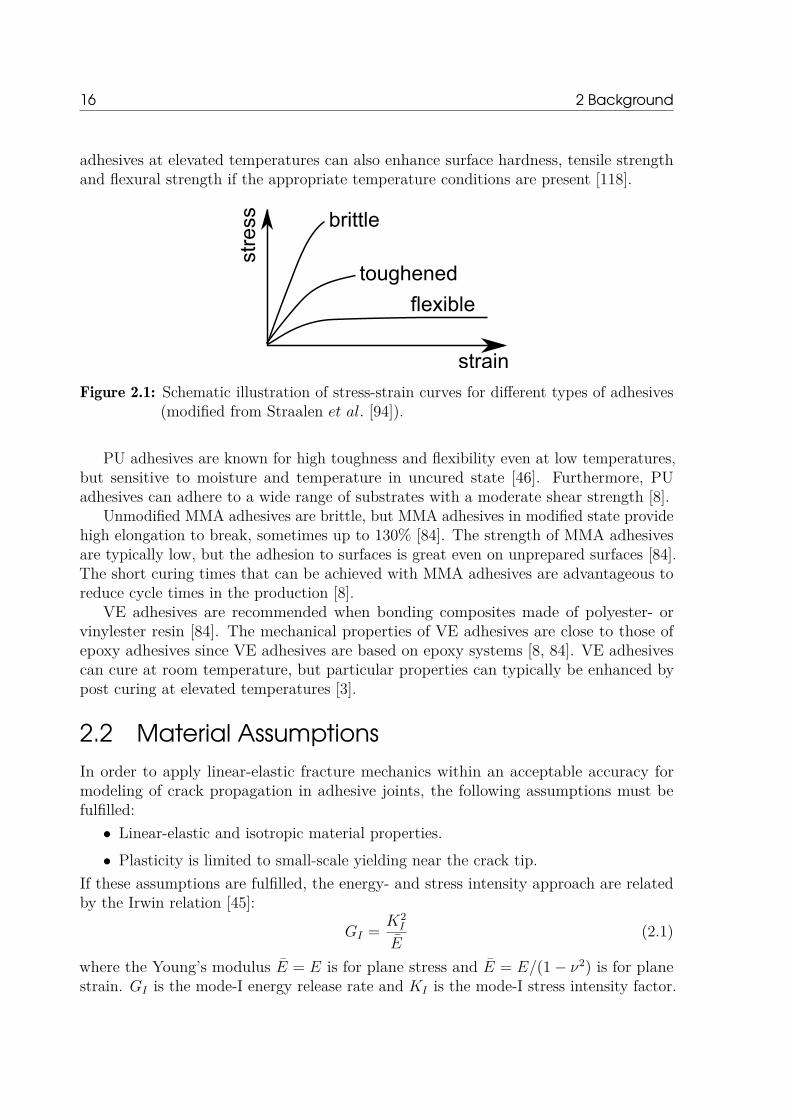
The choice of adhesive type is important since the mechanical properties of the adhesiveaffects the reliability of the joint significantly. Schematic stress-strain curves for differentgroups of adhesives are presented in Figure 2.1.
In general, epoxy adhesives are the most widely used structural adhesive and havebeen used longer than other structural adhesives [46]. Epoxy adhesives can bond a widerange of materials e.g. composites, metals, ceramics and rubber [8]. The shear strengthof epoxy adhesives are generally high in comparison with other structural adhesives.Both the curing temperature and post curing temperature have an effect on the Young’smodulus and tensile strength of the epoxy adhesive [16, 15]. Post curing of epoxy
16 2 Background
adhesives at elevated temperatures can also enhance surface hardness, tensile strengthand flexural strength if the appropriate temperature conditions are present [118].
strain
stress brittle
toughened
flexible
Figure 2.1: Schematic illustration of stress-strain curves for different types of adhesives(modified from Straalen et al. [94]).
PU adhesives are known for high toughness and flexibility even at low temperatures,but sensitive to moisture and temperature in uncured state [46]. Furthermore, PUadhesives can adhere to a wide range of substrates with a moderate shear strength [8].
Unmodified MMA adhesives are brittle, but MMA adhesives in modified state providehigh elongation to break, sometimes up to 130% [84]. The strength of MMA adhesivesare typically low, but the adhesion to surfaces is great even on unprepared surfaces [84].The short curing times that can be achieved with MMA adhesives are advantageous toreduce cycle times in the production [8].
VE adhesives are recommended when bonding composites made of polyester- orvinylester resin [84]. The mechanical properties of VE adhesives are close to those ofepoxy adhesives since VE adhesives are based on epoxy systems [8, 84]. VE adhesivescan cure at room temperature, but particular properties can typically be enhanced bypost curing at elevated temperatures [3].
2.2 Material AssumptionsIn order to apply linear-elastic fracture mechanics within an acceptable accuracy formodeling of crack propagation in adhesive joints, the following assumptions must befulfilled:• Linear-elastic and isotropic material properties.• Plasticity is limited to small-scale yielding near the crack tip.
If these assumptions are fulfilled, the energy- and stress intensity approach are relatedby the Irwin relation [45]:
GI = K2I
E(2.1)
where the Young’s modulus E = E is for plane stress and E = E/(1− ν2) is for planestrain. GI is the mode-I energy release rate and KI is the mode-I stress intensity factor.

2.2 Material Assumptions 17
To satisfy small-scale yielding, the plastic zone size near the crack tip must be small incomparison with the characteristic length scale in the problem, which is typically thecrack length, a, or the start-crack length, a0, in the adhesive. The first order estimationof the radius of the plastic zone size, rp, can be determined by [42]:
rp = 13π
(KIC
σY S
)2(plane strain) (2.2)
rp = 1π
(KIC
σY S
)2(plane stress) (2.3)
where σY S is the yield strength of the material and KIC is the mode-I critical stressintensity factor. Dependent on the specimen geometry, material properties and loadingconfiguration, the crack will propagate stable or dynamic once the magnitude of thecritical energy release rate, GIC , (or KIC) is reached [42]. For a material exhibitingR-curve behavior, i.e. a material with rising fracture resistance as shown in Figure 2.2,the condition for continued crack extension is; G = GR(∆a), where G is the appliedenergy release rate. GR versus ∆a is the resistance curve of a material when the crackhas extended an amount ∆a to the current crack length, a, under quasi-static loading.To ensure stable crack propagation (not dynamic), the following generalized conditionmust be satisfied [42, 104]: [
∂G
∂a
]L<
[dGR
d∆a
](2.4)
where L is the loading parameter (prescribed dead load or prescribed fixed displacement).A mode-I crack in a perfectly brittle material will propagate under constant GI = GIC
as illustrated in Figure 2.2. Thus, the condition for stable crack growth reduces to [42]:[∂GI
∂a
]L< 0 (2.5)
This means that GI must decrease with crack length for the crack to propagate in astable manner.
GIC
G (Δa)
perfectly brittle material
Δa
Rmaterial with rising fracture resistance
Figure 2.2: Resistance curves (modified from Hutchinson [42]).
In the present project, the materials are assumed to be perfectly brittle, i.e. no R-curve behavior as shown in Figure 2.2, such that the assumptions of small-scale yielding

18 2 Background
and a small fracture process zone are satisfied. Furthermore, it is assumed that theadhesive is deforming elastic (not visco-elastic) and phenomena such as creep and stressrelaxation are negligible.
2.3 Material ParametersIn order to simplify the modeling, non-dimensional parameters can be introduced toreduce the number of material parameters in the specific problem.
2.3.1 Laminate ParametersThe number of stiffness parameters for an orthotropic material can be reduced byintroducing the dimensionless parameters proposed by Suo [99, 102] that for in-planematerial orientations are:
λx′y′ = Ey′y′
Ex′x′, ρx′y′ =
√Ex′x′Ey′y′
2Gx′y′−√νx′y′νy′x′ (2.6)
or for out-of-plane material orientation:
λx′z′ = Ez′z′
Ex′x′, ρx′z′ =
√Ex′x′Ez′z′
2Gx′z′−√νx′z′νz′x′ (2.7)
where Eij is the Young’s modulus, νij is the Poisson’s ratio and Gij is the shear modulus.The material orientations are shown in Figure 2.3. The structural coordinate system(x, y, z) and the material coordinate system (x′, y′, z′) are not oriented in the same way.The structural coordinate system (x, y, z) is oriented such that z is pointing in thedirection where the plane strain assumption typically is applied in the modeling and thematerial coordinate system (x′, y′, z′) is oriented such that x′ is pointing in the typicaluni-directional (UD) fiber direction of the laminate, see Figure 2.3.
Substrate #1Adhesive #2
Interface
z'x'y'x
yz
Figure 2.3: Bi-material specimen with adhesive bonded to a uni-directional glass fiberlaminate including material coordinate system (x′, y′, z′) and structuralcoordinate system (x, y, z).
The material properties of the glass fibre reinforced epoxy laminates presented byLeong et al. [58] and the material properties of the carbon fibre reinforced epoxy laminatefrom Yang et al. [115] are representative for wind turbine blades. The values for λ and ρ

2.3 Material Parameters 19
for a bi-axial glass fiber laminate (Glass Biax), for a uni-directional glass fiber laminate(Glass UD), and for uni-directional carbon fiber laminate (Carbon UD) can be found inTable 2.1.
Material name λx′y′ ρx′y′ λx′z′ ρx′z′
Glass Biax 0.92 0.06 0.85 2.79Glass UD 0.33 2.43 0.33 2.75Carbon UD 0.08 4.12 0.08 4.41
Table 2.1: Typical material properties for wind turbine blade relevant materials (basedon values from Leong et al. [58] and Yang et al. [115]).
Typical values of λx′y′ and ρx′y′ for various materials are presented in Figure 2.4including the values of Glass Biax, Glass UD and Carbon UD that are marked by ”x”. Ifthe laminate is assumed isotropic then Ex′x′ and νx′z′ are the only stiffness parametersused in the models i.e. λ = ρ = 1 [102].
100 101 102
1/ λ [ -]
0
1
2
3
4
5
6
ρ[-
]
Glass Biax
Glass UD
Carbon UD
Al (FCC)
Fe (BCC)Pb (FCC)
Ash
Balsa
OakPine
Graphite/Epoxy
GY70/Epoxy
Boron/Epoxy
Graphite/Al
x'y'
x'y'
x
x
x
Figure 2.4: Orthotropy parameters λx′y′ and ρx′y′ for selected materials. Materialsmarked by dots are from Suo [99] and materials marked by ”x” are the bladerelevant materials in Table 2.1.
2.3.2 Bi-material ParametersWhen loadings are prescribed as displacements, the stiffness mismatch (elastic) for thebi-material models, e.g. the specimen shown in Figure 2.3, can be presented in termsof three non-dimensional parameters E1/E2, ν1, and ν2 for the substrate/adhesive. Thetypical elastic mismatch between the adhesive and an isotropic substrate with stiffness ofa uni-directional glass fibre reinforced polyester laminate is E1/E2 ≈ 12.
20 2 Background
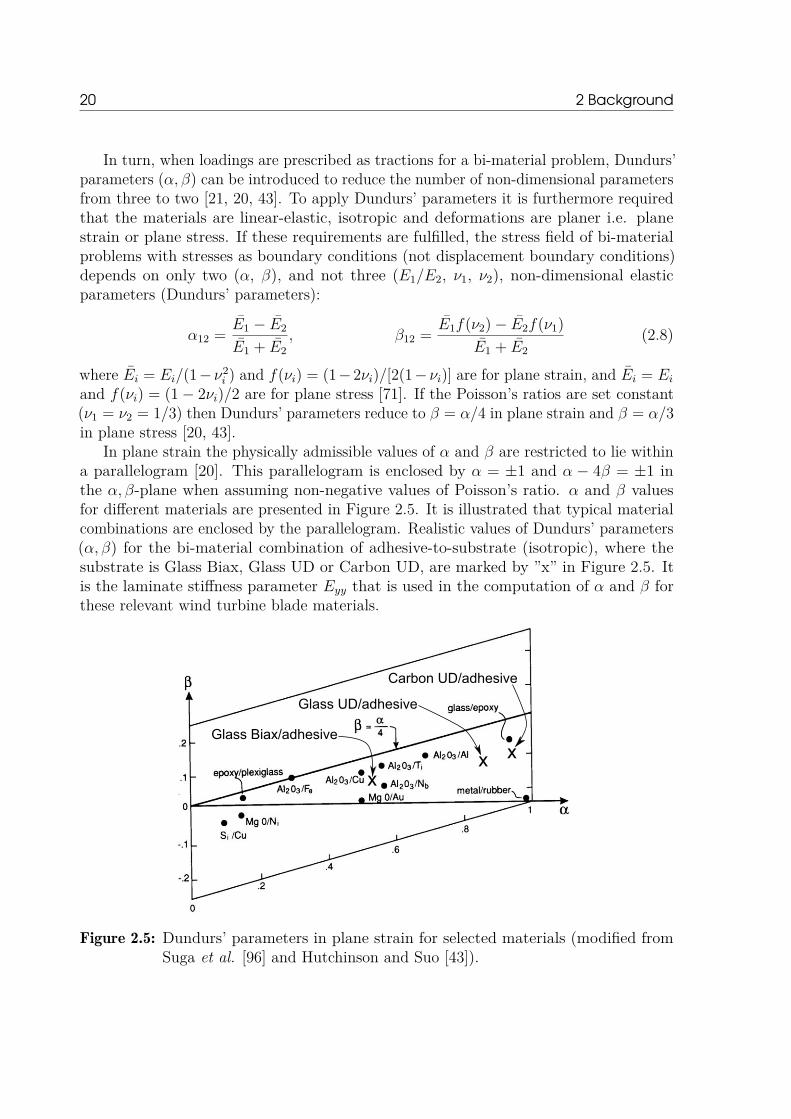
In turn, when loadings are prescribed as tractions for a bi-material problem, Dundurs’parameters (α, β) can be introduced to reduce the number of non-dimensional parametersfrom three to two [21, 20, 43]. To apply Dundurs’ parameters it is furthermore requiredthat the materials are linear-elastic, isotropic and deformations are planer i.e. planestrain or plane stress. If these requirements are fulfilled, the stress field of bi-materialproblems with stresses as boundary conditions (not displacement boundary conditions)depends on only two (α, β), and not three (E1/E2, ν1, ν2), non-dimensional elasticparameters (Dundurs’ parameters):
α12 = E1 − E2
E1 + E2, β12 = E1f(ν2)− E2f(ν1)
E1 + E2(2.8)
where Ei = Ei/(1− ν2i ) and f(νi) = (1− 2νi)/[2(1− νi)] are for plane strain, and Ei = Ei
and f(νi) = (1− 2νi)/2 are for plane stress [71]. If the Poisson’s ratios are set constant(ν1 = ν2 = 1/3) then Dundurs’ parameters reduce to β = α/4 in plane strain and β = α/3in plane stress [20, 43].
In plane strain the physically admissible values of α and β are restricted to lie withina parallelogram [20]. This parallelogram is enclosed by α = ±1 and α − 4β = ±1 inthe α, β-plane when assuming non-negative values of Poisson’s ratio. α and β valuesfor different materials are presented in Figure 2.5. It is illustrated that typical materialcombinations are enclosed by the parallelogram. Realistic values of Dundurs’ parameters(α, β) for the bi-material combination of adhesive-to-substrate (isotropic), where thesubstrate is Glass Biax, Glass UD or Carbon UD, are marked by ”x” in Figure 2.5. Itis the laminate stiffness parameter Eyy that is used in the computation of α and β forthese relevant wind turbine blade materials.
Glass Biax/adhesive
Glass UD/adhesive
Carbon UD/adhesive
x
xx
Figure 2.5: Dundurs’ parameters in plane strain for selected materials (modified fromSuga et al. [96] and Hutchinson and Suo [43]).
CHAPTER 3The Effect of Residual Stresses
on the Formation of TransverseCracks
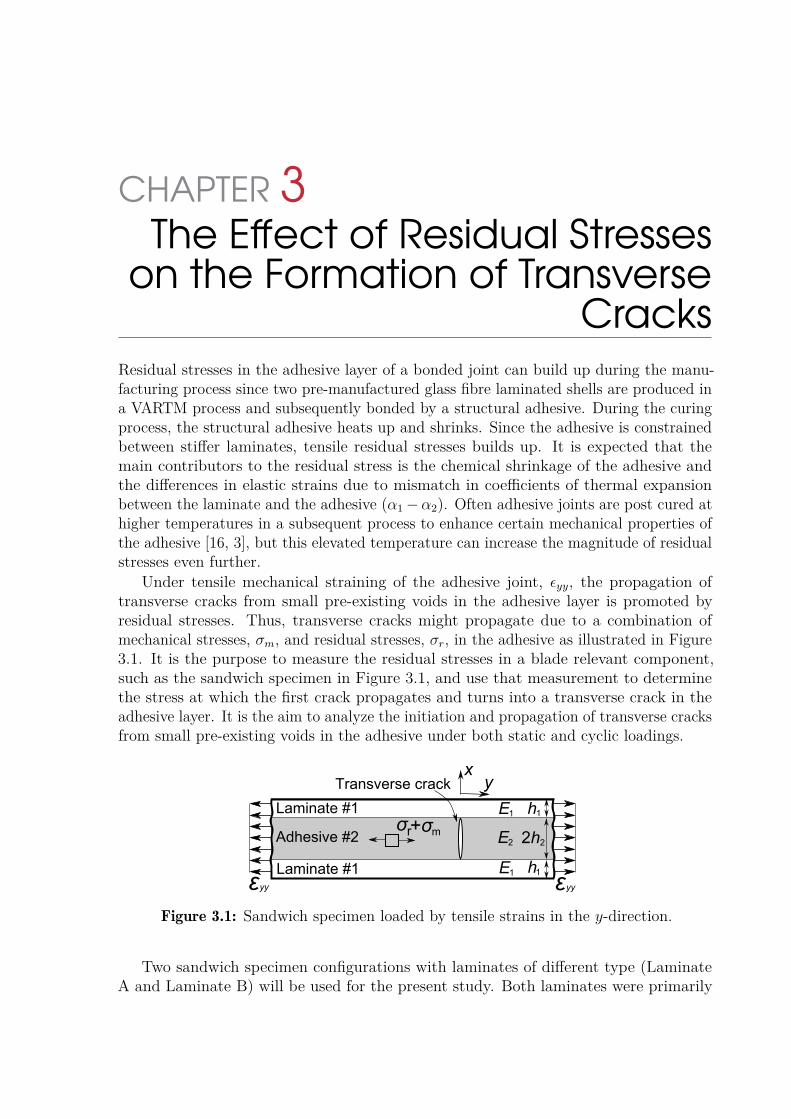
Residual stresses in the adhesive layer of a bonded joint can build up during the manu-facturing process since two pre-manufactured glass fibre laminated shells are produced ina VARTM process and subsequently bonded by a structural adhesive. During the curingprocess, the structural adhesive heats up and shrinks. Since the adhesive is constrainedbetween stiffer laminates, tensile residual stresses builds up. It is expected that themain contributors to the residual stress is the chemical shrinkage of the adhesive andthe differences in elastic strains due to mismatch in coefficients of thermal expansionbetween the laminate and the adhesive (α1−α2). Often adhesive joints are post cured athigher temperatures in a subsequent process to enhance certain mechanical properties ofthe adhesive [16, 3], but this elevated temperature can increase the magnitude of residualstresses even further.
Under tensile mechanical straining of the adhesive joint, εyy, the propagation oftransverse cracks from small pre-existing voids in the adhesive layer is promoted byresidual stresses. Thus, transverse cracks might propagate due to a combination ofmechanical stresses, σm, and residual stresses, σr, in the adhesive as illustrated in Figure3.1. It is the purpose to measure the residual stresses in a blade relevant component,such as the sandwich specimen in Figure 3.1, and use that measurement to determinethe stress at which the first crack propagates and turns into a transverse crack in theadhesive layer. It is the aim to analyze the initiation and propagation of transverse cracksfrom small pre-existing voids in the adhesive under both static and cyclic loadings.
Laminate #1
Laminate #1
Adhesive #2
1
h1
2h2
E1
E1
E2
h
Transverse crack
σr+σm
εyyεyy
xy
Figure 3.1: Sandwich specimen loaded by tensile strains in the y-direction.
Two sandwich specimen configurations with laminates of different type (LaminateA and Laminate B) will be used for the present study. Both laminates were primarily

22 3 The Effect of Residual Stresses on the Formation of Transverse Cracks
made of uni-directional glass fibres oriented in the y-direction and the stiffness werecomparable. The same type of adhesive was used for all specimens. The exact propertiesof the laminates and adhesive are confidential and therefore the results will be presentedin a non-dimensional form.
This chapter is organized as follows. First, a new approach will be presented fordetermination of stress in the adhesive at first crack in the sandwich specimen. Theresults of a bi-material FE model of the center cracked test specimen will be presentedand included as a part of the approach. Hereafter, the residual stress will be determinedin five different ways. Experimental tests of sandwich specimens loaded in quasi-statictension will be presented. A model prediction will be compared with the experimentaldetermination of stress in the adhesive at first crack. Furthermore, the sandwich specimenswill be loaded cyclic and multiple cracking of the adhesive will be studied.
3.1 Introduction of Residual Stress ModelTo measure a realistic value of residual stresses in a wind turbine blade joint, the testspecimen must reflect the manufacturing process that is used for adhesive joints in windturbine blades in order to ensure that the curing conditions, constraining of the adhesiveand thermal boundary conditions are realistic. Therefore, the sandwich specimen inFigure 3.1 is a relevant component to analyze in details. It is convenient to relate theresidual stress, σr, to a socalled misfit stress, σT , through a non-dimensional function, q[23]:
σr = qσT (3.1)where σT is defined as the stress induced in an infinitely thin film adhered to an infinitelythick substrate. q is a non-dimensional function accounting for e.g. geometry and elasticproperties. The misfit stress cannot be predicted by modeling - it must be measuredexperimentally [23].
A relation between the misfit stress and the residual stress in the adhesive of thesandwich specimen shown in Figure 3.1 can be derived by equilibrium considerations(interface perfectly bonded) and by Hooke’s law in plane stress (x-direction) [93]:
σr = σT1 + ζ2Σ2
(3.2)
where Σ2 = [E2/(1− ν2)] /[E1/(1− ν1)] and ζ2 = h2/h1 are the parameters for thesandwich specimen shown in Figure 3.1. The misfit stress, σT , of the adhesive can bemeasured in different ways as demonstrated in section 3.4.
3.2 Approach for Determination of Stress in theAdhesive at First Crack
The approach for determination of stress in the adhesive at first crack, σfc, in statictensile tests of the sandwich specimen, shown in Figure 3.1, is presented schematic in
3.2 Approach for Determination of Stress in the Adhesive at First Crack 23
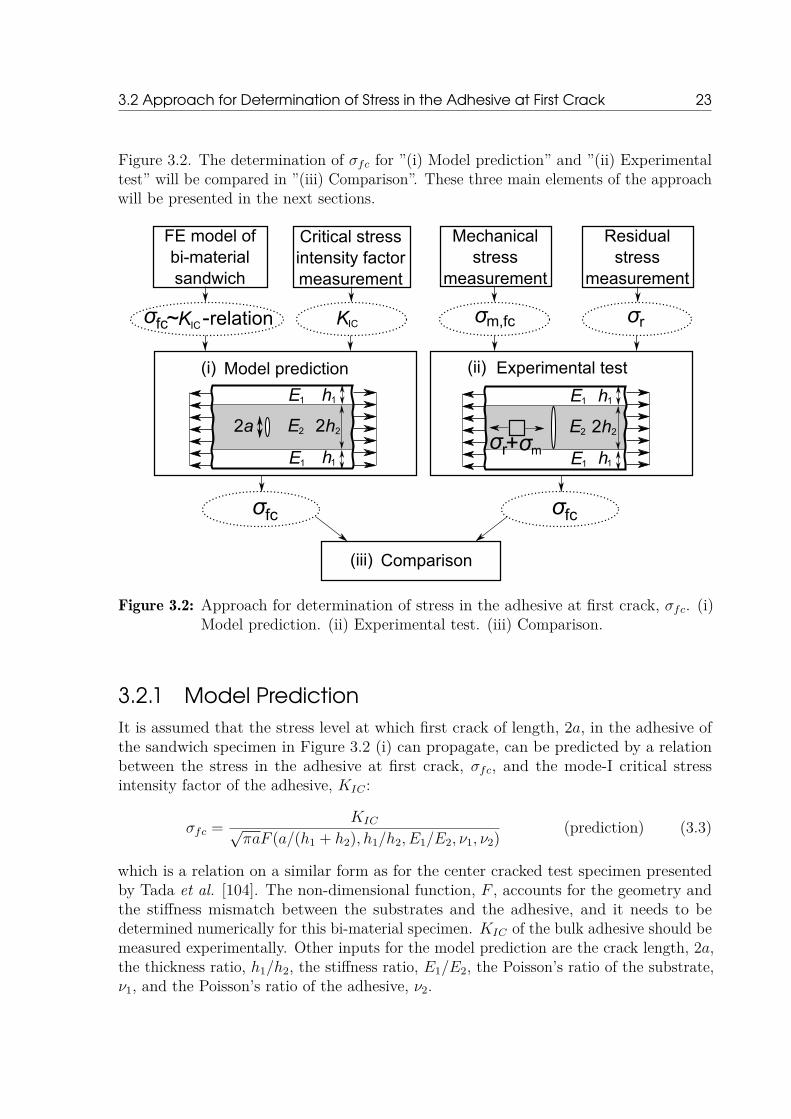
Figure 3.2. The determination of σfc for ”(i) Model prediction” and ”(ii) Experimentaltest” will be compared in ”(iii) Comparison”. These three main elements of the approachwill be presented in the next sections.
FE model ofbi-materialsandwich
Mechanicalstress
measurement
Residualstress
measurement
σrσm,fc
1
h1
2h2
E1
E1
E2
h 1
h1
2h2
E1
E1
E2
h
Model prediction Experimental test
KICσfc -~ relation
σfcσfc
2aσr+σm
Critical stressintensity factormeasurement
KIC
Comparison
(i) (ii)
(iii)
Figure 3.2: Approach for determination of stress in the adhesive at first crack, σfc. (i)Model prediction. (ii) Experimental test. (iii) Comparison.
3.2.1 Model PredictionIt is assumed that the stress level at which first crack of length, 2a, in the adhesive ofthe sandwich specimen in Figure 3.2 (i) can propagate, can be predicted by a relationbetween the stress in the adhesive at first crack, σfc, and the mode-I critical stressintensity factor of the adhesive, KIC :
σfc = KIC√πaF (a/(h1 + h2), h1/h2, E1/E2, ν1, ν2) (prediction) (3.3)
which is a relation on a similar form as for the center cracked test specimen presentedby Tada et al. [104]. The non-dimensional function, F , accounts for the geometry andthe stiffness mismatch between the substrates and the adhesive, and it needs to bedetermined numerically for this bi-material specimen. KIC of the bulk adhesive should bemeasured experimentally. Other inputs for the model prediction are the crack length, 2a,the thickness ratio, h1/h2, the stiffness ratio, E1/E2, the Poisson’s ratio of the substrate,ν1, and the Poisson’s ratio of the adhesive, ν2.
24 3 The Effect of Residual Stresses on the Formation of Transverse Cracks
3.2.2 Experimental TestFor the experimental tests of the sandwich specimens (static tensile loading), shown inFigure 3.2 (ii), the stress in the adhesive at first crack, i.e. the onset of growth of a crackwith length, 2a, is assumed to be the sum of the residual stress, σr, and the mechanicalstress in the adhesive at first crack, σm,fc, as:
σfc = σm,fc + σr (experimental) (3.4)
where σm,fc can be determined based on the measured strain at first crack, εm,fc, andHooke’s law in plane strain:
σm,fc = E2εm,fc (3.5)
where E2 is the plane strain Young’s modulus of the adhesive. When the residual stressis determined by (3.2), the stress in the adhesive at onset of first crack can be determinedby (3.4).
3.2.3 Comparison of Model Prediction and ExperimentalTest
In order to test the accuracy of the methods (”Model prediction” and ”Experimental test”in Figure 3.2), a comparison will be made at two different temperatures (23C and −40C)according to the last step in the approach i.e. Figure 3.2 (iii). The material properties ofthe adhesive (KIC and E2) are taken to depend on temperature, T , meaning that σfcwill be a function of KIC(T ) and E2(T ). Furthermore, the experimental test method inFigure 3.2 (ii) to determine the stress in the adhesive at first crack experimentally willbe applied on other sandwich specimens in order to test the effect of different parameterssuch as post curing temperature, test temperature and laminate thickness.
3.3 Modeling of the Center Cracked TestSpecimen
If a pre-existing crack exists in the adhesive, LEFM with FE simulations can be appliedto predict the propagation of the crack.
3.3.1 MethodsThe sandwich specimen in Figure 3.1 is comparable to the center cracked test specimenpresented by Tada et al. [104] where the mode-I stress intensity factor, KI , is given onthe form:
KI = σyy,2√πaF (a/h2) (3.6)
where σyy,2 is the stress in the adhesive and 2a is the crack length, see Figure 3.1 andFigure 3.3. However, the non-dimensional function, F , from Tada et al. [104] is onlyvalid in absence of elastic mismatch between the substrate and the adhesive i.e. for the
3.3 Modeling of the Center Cracked Test Specimen 25
homogenous specimen. If elastic mismatch is included, the stress intensity factor dependson additional parameters and (3.6) should be modified to:
KI = σyy,2√πaF (a/(h1 + h2), h1/h2, E1/E2, ν1, ν2) (3.7)
The non-dimensional function, F , is determined numerically by the use of a parametric2D FE model, simulated in Abaqus CAE 6.14 (Dassault Systemes) with eight-nodedplane strain elements.
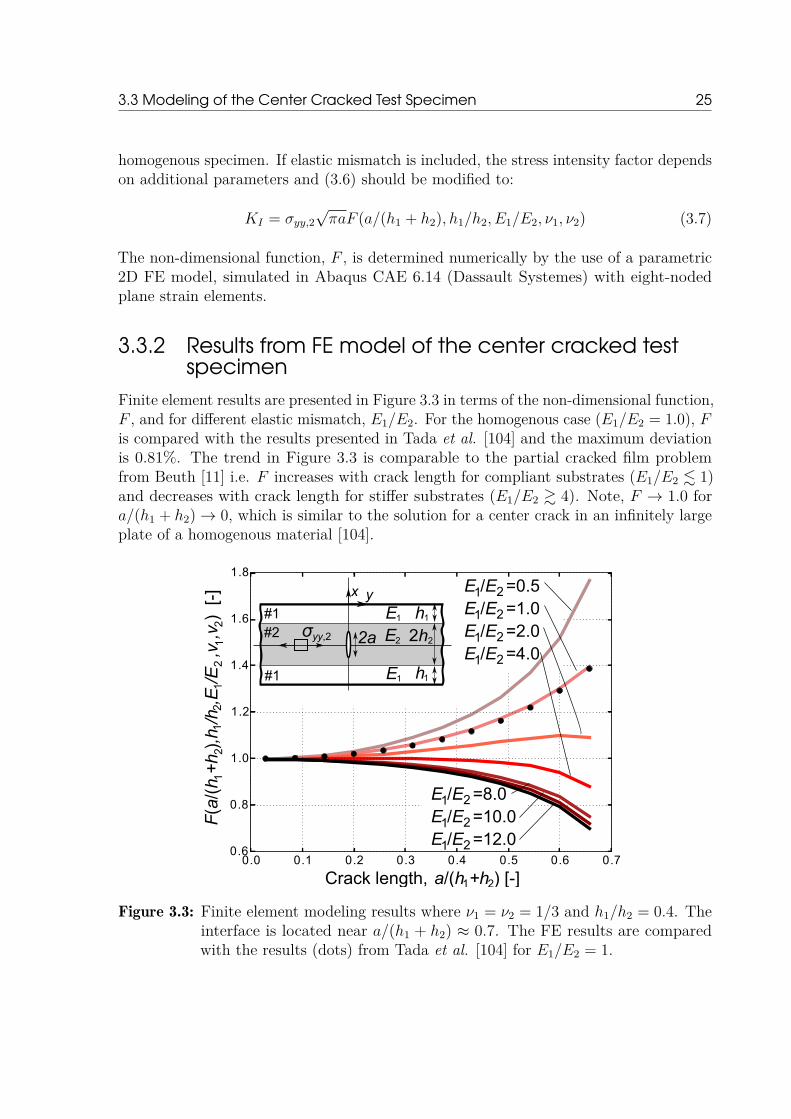
3.3.2 Results from FE model of the center cracked testspecimen
Finite element results are presented in Figure 3.3 in terms of the non-dimensional function,F , and for different elastic mismatch, E1/E2. For the homogenous case (E1/E2 = 1.0), Fis compared with the results presented in Tada et al. [104] and the maximum deviationis 0.81%. The trend in Figure 3.3 is comparable to the partial cracked film problemfrom Beuth [11] i.e. F increases with crack length for compliant substrates (E1/E2 . 1)and decreases with crack length for stiffer substrates (E1/E2 & 4). Note, F → 1.0 fora/(h1 + h2)→ 0, which is similar to the solution for a center crack in an infinitely largeplate of a homogenous material [104].
0.0 0.1 0.2 0.3 0.4 0.5 0.6 0.70.6
0.8
1.0
1.2
1.4
1.6
1.8E /E =0.51 2
E /E =1.01 2
E /E =2.01 2
E /E =4.01 2
E /E =8.01 2
E /E =10.01 2
E /E =12.01 2
F(a
/(h
+h
),h
/h ,E
/E ,
ν ,ν
) [
-]
21
21
21
a/(h +h ) [-]21
21
yx
#1
#1
#21
h1
2h2
E1
E1
E2
hσyy,2 2a
Crack length,
Figure 3.3: Finite element modeling results where ν1 = ν2 = 1/3 and h1/h2 = 0.4. Theinterface is located near a/(h1 + h2) ≈ 0.7. The FE results are comparedwith the results (dots) from Tada et al. [104] for E1/E2 = 1.
26 3 The Effect of Residual Stresses on the Formation of Transverse Cracks
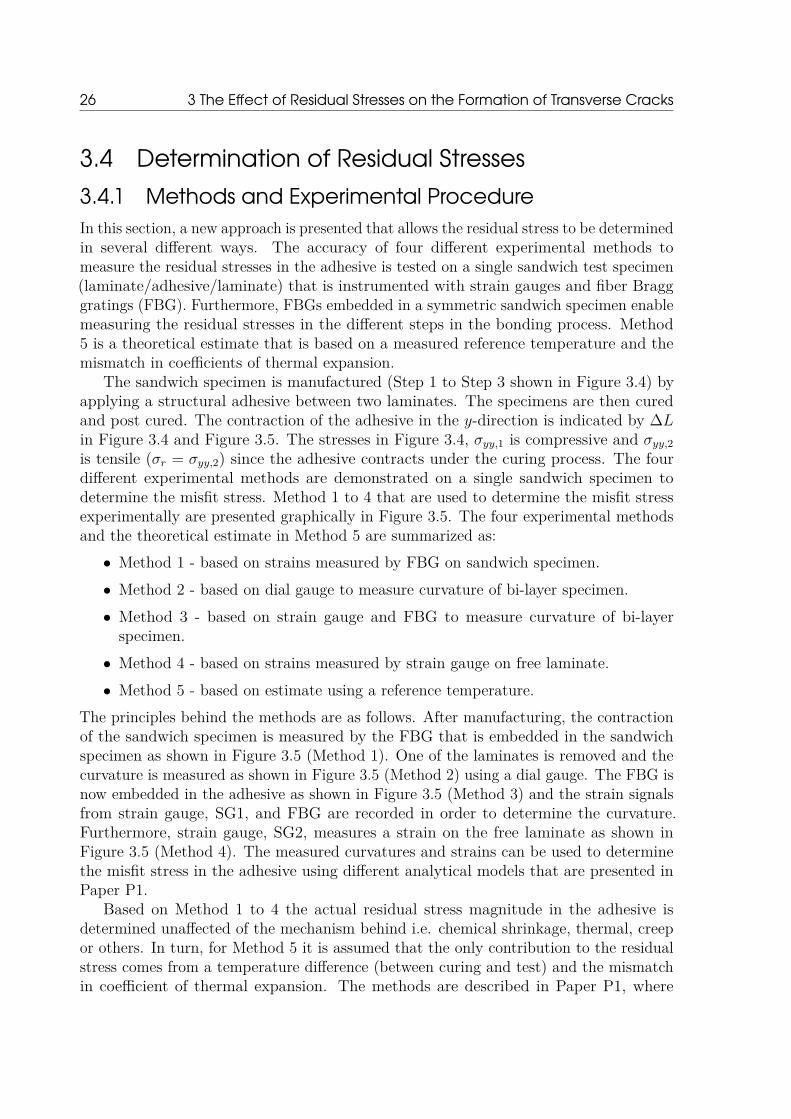
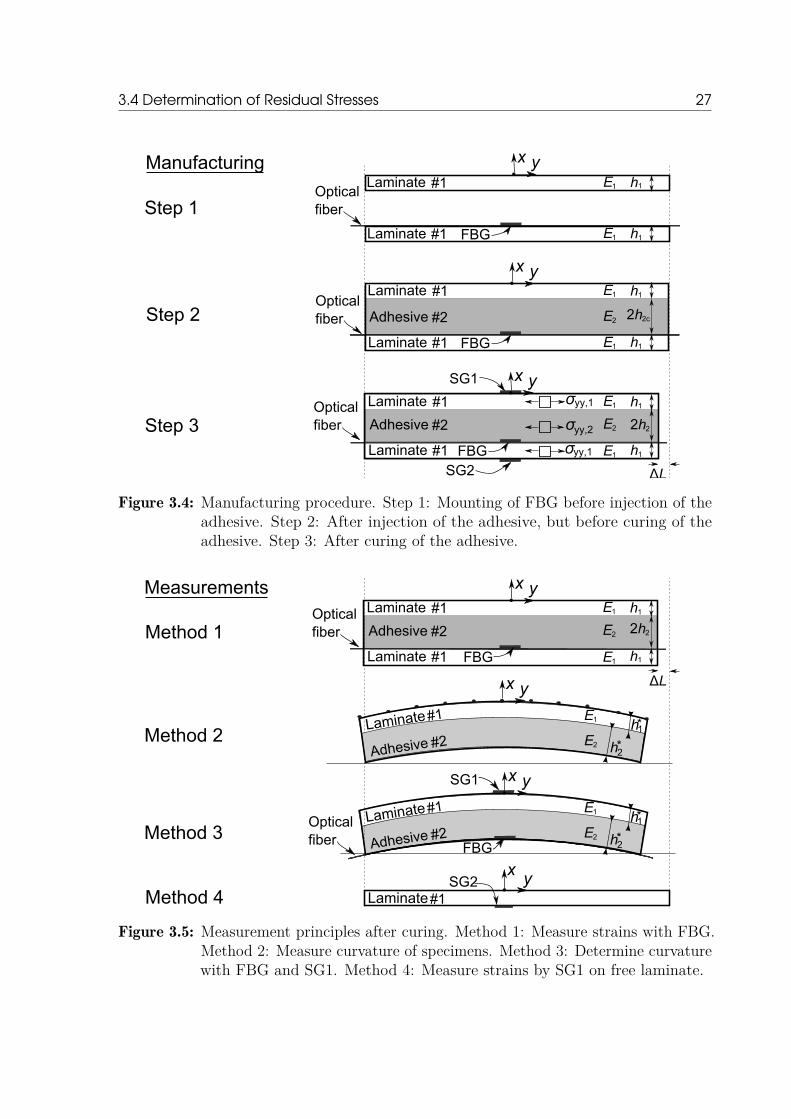
3.4 Determination of Residual Stresses3.4.1 Methods and Experimental ProcedureIn this section, a new approach is presented that allows the residual stress to be determinedin several different ways. The accuracy of four different experimental methods tomeasure the residual stresses in the adhesive is tested on a single sandwich test specimen(laminate/adhesive/laminate) that is instrumented with strain gauges and fiber Bragggratings (FBG). Furthermore, FBGs embedded in a symmetric sandwich specimen enablemeasuring the residual stresses in the different steps in the bonding process. Method5 is a theoretical estimate that is based on a measured reference temperature and themismatch in coefficients of thermal expansion.
The sandwich specimen is manufactured (Step 1 to Step 3 shown in Figure 3.4) byapplying a structural adhesive between two laminates. The specimens are then curedand post cured. The contraction of the adhesive in the y-direction is indicated by ∆Lin Figure 3.4 and Figure 3.5. The stresses in Figure 3.4, σyy,1 is compressive and σyy,2is tensile (σr = σyy,2) since the adhesive contracts under the curing process. The fourdifferent experimental methods are demonstrated on a single sandwich specimen todetermine the misfit stress. Method 1 to 4 that are used to determine the misfit stressexperimentally are presented graphically in Figure 3.5. The four experimental methodsand the theoretical estimate in Method 5 are summarized as:• Method 1 - based on strains measured by FBG on sandwich specimen.• Method 2 - based on dial gauge to measure curvature of bi-layer specimen.• Method 3 - based on strain gauge and FBG to measure curvature of bi-layer
specimen.• Method 4 - based on strains measured by strain gauge on free laminate.• Method 5 - based on estimate using a reference temperature.
The principles behind the methods are as follows. After manufacturing, the contractionof the sandwich specimen is measured by the FBG that is embedded in the sandwichspecimen as shown in Figure 3.5 (Method 1). One of the laminates is removed and thecurvature is measured as shown in Figure 3.5 (Method 2) using a dial gauge. The FBG isnow embedded in the adhesive as shown in Figure 3.5 (Method 3) and the strain signalsfrom strain gauge, SG1, and FBG are recorded in order to determine the curvature.Furthermore, strain gauge, SG2, measures a strain on the free laminate as shown inFigure 3.5 (Method 4). The measured curvatures and strains can be used to determinethe misfit stress in the adhesive using different analytical models that are presented inPaper P1.
Based on Method 1 to 4 the actual residual stress magnitude in the adhesive isdetermined unaffected of the mechanism behind i.e. chemical shrinkage, thermal, creepor others. In turn, for Method 5 it is assumed that the only contribution to the residualstress comes from a temperature difference (between curing and test) and the mismatchin coefficient of thermal expansion. The methods are described in Paper P1, where
3.4 Determination of Residual Stresses 27
h1E1
E1 h1
Laminate
Laminate
#1
#1
h1
2h2
E1
E1
E2
h1
SG1
SG2FBG
Laminate
Laminate
Adhesive
#1
#2
#1
Step 3
Step 2 2h2cE2Adhesive #2
h1E1Laminate #1
E1Laminate #1 h1FBG
Step 1FBG
yx
yx
yx
Opticalfiber
Opticalfiber
Opticalfiber
Manufacturing
σyy,2
σyy,1
σyy,1
ΔL
Figure 3.4: Manufacturing procedure. Step 1: Mounting of FBG before injection of theadhesive. Step 2: After injection of the adhesive, but before curing of theadhesive. Step 3: After curing of the adhesive.
h1
2h2
E1
E1
E2
h1
Laminate
Laminate
AdhesiveMethod 1#1
#2
#1
Method 2
Laminate#1
Adhesive #2FBG
SG1
Method 3
SG2Method 4 Laminate#1
Opticalfiber
h2*
h1*
FBG
yx
yx
yx
Opticalfiber
E1
E2
Measurements
Laminate#1
Adhesive #2 h2*
h1*
yx
E1
E2
ΔL
Figure 3.5: Measurement principles after curing. Method 1: Measure strains with FBG.Method 2: Measure curvature of specimens. Method 3: Determine curvaturewith FBG and SG1. Method 4: Measure strains by SG1 on free laminate.
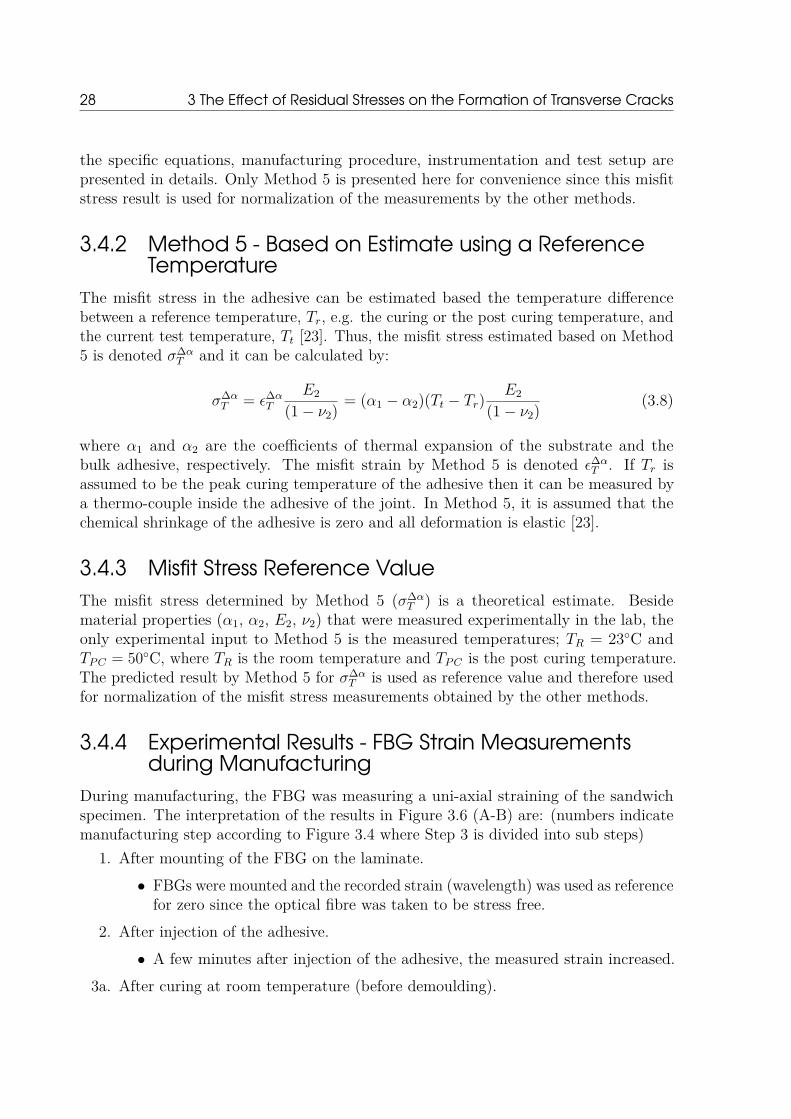
28 3 The Effect of Residual Stresses on the Formation of Transverse Cracks
the specific equations, manufacturing procedure, instrumentation and test setup arepresented in details. Only Method 5 is presented here for convenience since this misfitstress result is used for normalization of the measurements by the other methods.
3.4.2 Method 5 - Based on Estimate using a ReferenceTemperature
The misfit stress in the adhesive can be estimated based the temperature differencebetween a reference temperature, Tr, e.g. the curing or the post curing temperature, andthe current test temperature, Tt [23]. Thus, the misfit stress estimated based on Method5 is denoted σ∆α
T and it can be calculated by:
σ∆αT = ε∆αT
E2
(1− ν2) = (α1 − α2)(Tt − Tr)E2
(1− ν2) (3.8)
where α1 and α2 are the coefficients of thermal expansion of the substrate and thebulk adhesive, respectively. The misfit strain by Method 5 is denoted ε∆αT . If Tr isassumed to be the peak curing temperature of the adhesive then it can be measured bya thermo-couple inside the adhesive of the joint. In Method 5, it is assumed that thechemical shrinkage of the adhesive is zero and all deformation is elastic [23].
3.4.3 Misfit Stress Reference ValueThe misfit stress determined by Method 5 (σ∆α
T ) is a theoretical estimate. Besidematerial properties (α1, α2, E2, ν2) that were measured experimentally in the lab, theonly experimental input to Method 5 is the measured temperatures; TR = 23C andTPC = 50C, where TR is the room temperature and TPC is the post curing temperature.The predicted result by Method 5 for σ∆α
T is used as reference value and therefore usedfor normalization of the misfit stress measurements obtained by the other methods.
3.4.4 Experimental Results - FBG Strain Measurementsduring Manufacturing
During manufacturing, the FBG was measuring a uni-axial straining of the sandwichspecimen. The interpretation of the results in Figure 3.6 (A-B) are: (numbers indicatemanufacturing step according to Figure 3.4 where Step 3 is divided into sub steps)
1. After mounting of the FBG on the laminate.• FBGs were mounted and the recorded strain (wavelength) was used as reference
for zero since the optical fibre was taken to be stress free.2. After injection of the adhesive.
• A few minutes after injection of the adhesive, the measured strain increased.3a. After curing at room temperature (before demoulding).

3.4 Determination of Residual Stresses 29
• The measured strain decreased after the adhesive had cured at room tempera-ture for 20 hours.
3b. After demoulding (plates were removed from bonding fixture).• The measured strain was not affected significantly by demoulding (no trend
identified).3c. After post curing (the specimens were still in one sandwich plate).
• The measured strain decreased after post curing.3d. After cutting of the sandwich plate into specimens.
• When the sandwich specimens were cut out from the sandwich plate, themeasured strains decreased.
0.20
0.15
0.10
0.05
0.00
0.05
0.10
1 20.20
0.15
0.10
0.05
0.00
0.05
0.10
Laminate A Laminate B(A) (B)
Manufacturing step [-] Manufacturing step [-]
FB
G s
trai
n,
[-
]ε
/ε
FB
G
1.0A
1.1A 1.0B
1.1B
Failure of FBG
Not measuredNot measured
Step 5: Not measured
3a 3b 3c 3d
Δα
T
FB
G s
trai
n,
[-
]ε
/ε
FB
GΔ
αT
1 2 3a 3b 3c 3d
Figure 3.6: Strain measured with FBG during the manufacturing steps with four differenttest series of sandwich specimens: (A) Laminate A (1.0A with dashed lineand 1.1A with solid line). (B) Laminate B (1.0B with dashed line and 1.1Bwith solid line).
All FBG strains were measured at room temperature in the laboratory, but in Step2 the adhesive had just started to generate exothermal heat. This temperature effectexplains why the measured strain increased for Step 2 in Figure 3.6. The manufacturingStep 3c (post curing) is identified, based on Figure 3.6, as the step in the manufacturingprocess where the primary residual stress builds up. Manufacturing Step 3a (curing atroom temperature) is identified as the second most important step in the manufacturingstep wrt. residual stress.
3.4.5 Experimental Results - Misfit Stress for Method 1 to 5The misfit stress results determined using Method 1 to 5 are presented in Figure 3.7 forLaminate A and Laminate B, where Method 1 to 4 is shown graphically in Figure 3.5.
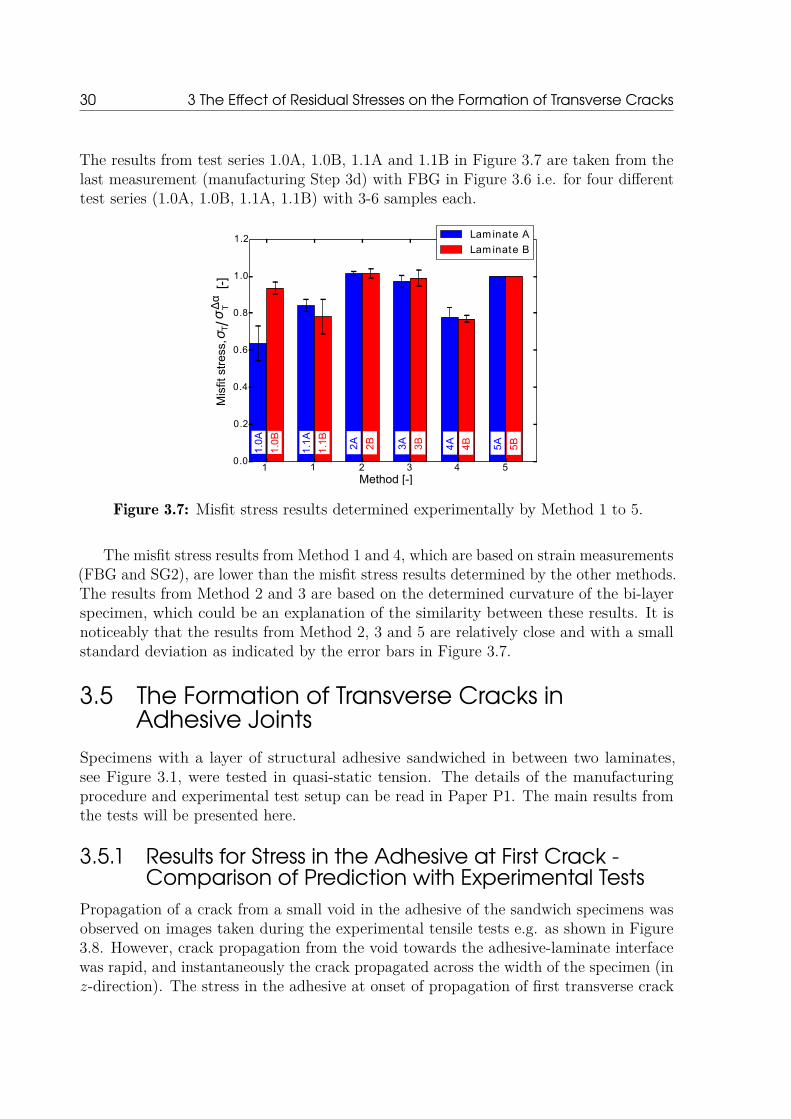
30 3 The Effect of Residual Stresses on the Formation of Transverse Cracks
The results from test series 1.0A, 1.0B, 1.1A and 1.1B in Figure 3.7 are taken from thelast measurement (manufacturing Step 3d) with FBG in Figure 3.6 i.e. for four differenttest series (1.0A, 1.0B, 1.1A, 1.1B) with 3-6 samples each.
0.0
0.2
0.4
0.6
0.8
1.0
1.2
2 3 4 5
T
Lam inate A
Lam inate B
1 1
σM
isfit
str
ess,
Method [-]
1.0A
1.0B
1.1A
1.1B 2A 2B 3A 3B 4A 4B 5A 5B
σ /[-
]Δ
αT
Figure 3.7: Misfit stress results determined experimentally by Method 1 to 5.
The misfit stress results from Method 1 and 4, which are based on strain measurements(FBG and SG2), are lower than the misfit stress results determined by the other methods.The results from Method 2 and 3 are based on the determined curvature of the bi-layerspecimen, which could be an explanation of the similarity between these results. It isnoticeably that the results from Method 2, 3 and 5 are relatively close and with a smallstandard deviation as indicated by the error bars in Figure 3.7.
3.5 The Formation of Transverse Cracks inAdhesive Joints
Specimens with a layer of structural adhesive sandwiched in between two laminates,see Figure 3.1, were tested in quasi-static tension. The details of the manufacturingprocedure and experimental test setup can be read in Paper P1. The main results fromthe tests will be presented here.
3.5.1 Results for Stress in the Adhesive at First Crack -Comparison of Prediction with Experimental Tests
Propagation of a crack from a small void in the adhesive of the sandwich specimens wasobserved on images taken during the experimental tensile tests e.g. as shown in Figure3.8. However, crack propagation from the void towards the adhesive-laminate interfacewas rapid, and instantaneously the crack propagated across the width of the specimen (inz-direction). The stress in the adhesive at onset of propagation of first transverse crack
3.5 The Formation of Transverse Cracks in Adhesive Joints 31
from a small void, σfc, was determined at temperatures of 23C and −40C using thetwo different methods of the approach in Figure 3.2 i.e. based on ”(i) Model predictions”and based on ”(ii) Experimental tests”.
The input parameters for the two methods were measured experimentally on the bulkmaterials in the laboratory. The material properties of the adhesive were measured attemperatures of 23C and −40C on specimens that were manufactured under similarprocess conditions as the sandwich specimens. The mode-I critical stress intensity factor,KIC , was measured by a compact tension test of the bulk adhesive using the standard”ASTM D5045” at temperatures of 23C and−40C. The Young’s modulus of the adhesive,E2, was measured by a dog bone specimen using the standard ”ISO 527-2: 2012” attemperatures of 23C and −40C.
(i) Prediction: The stress in the adhesive at first crack of the sandwich specimenshown in Figure 3.1 can be predicted based on the FE model and equation 3.3. As anapproximation the crack length, 2a, was taken to be the maximum measured void size inthe adhesive of the sandwich specimens. The size of the six largest voids in the adhesiveof the sandwich specimen in Figure 3.8 was measured to an average of a/(h1 +h2) ≈ 0.042with a standard deviation of ±0.01. Thus, the value of the non-dimensional function,F , could be determined based on the modeling result in Figure 3.3 to F ≈ 1. Havingdetermined KIC , F and a, the value of σfc was determined by equation 3.3 and presentedin Figure 3.9.
x11
43
52
a/h
=1
2
4
31
52
yx
(A) (B)
62h 22h 2
6
Figure 3.8: The sizes of six voids in the adhesive layer of a sandwich specimen loadedin tension were measured on a photo. (A) Before transverse cracking. (B)After transverse cracking.
(ii) Experimental test: For experimental tests of two series of sandwich test specimens(23C and −40C), the stress in the adhesive at first crack, σfc, was taken to be thesum of the residual stress and the mechanical stress as shown in equation 3.4. For theexperimental tests, σm,fc was determined based on the measured mechanical strain fromthe clip gauge, εm,fc, using equation 3.5. The misfit stress was determined at 23C byMethod 2 and at −40C by Method 5 (section 3.4.2). Thus, the residual stress, σr, couldbe determined based on equation 3.2 and finally σfc could be calculated by equation 3.4.This experimental result are presented in Figure 3.9.
(iii) Comparison: A comparison between the predicted results and the experimentalresults for σfc at temperatures of 23C and −40C is presented in Figure 3.9. It was
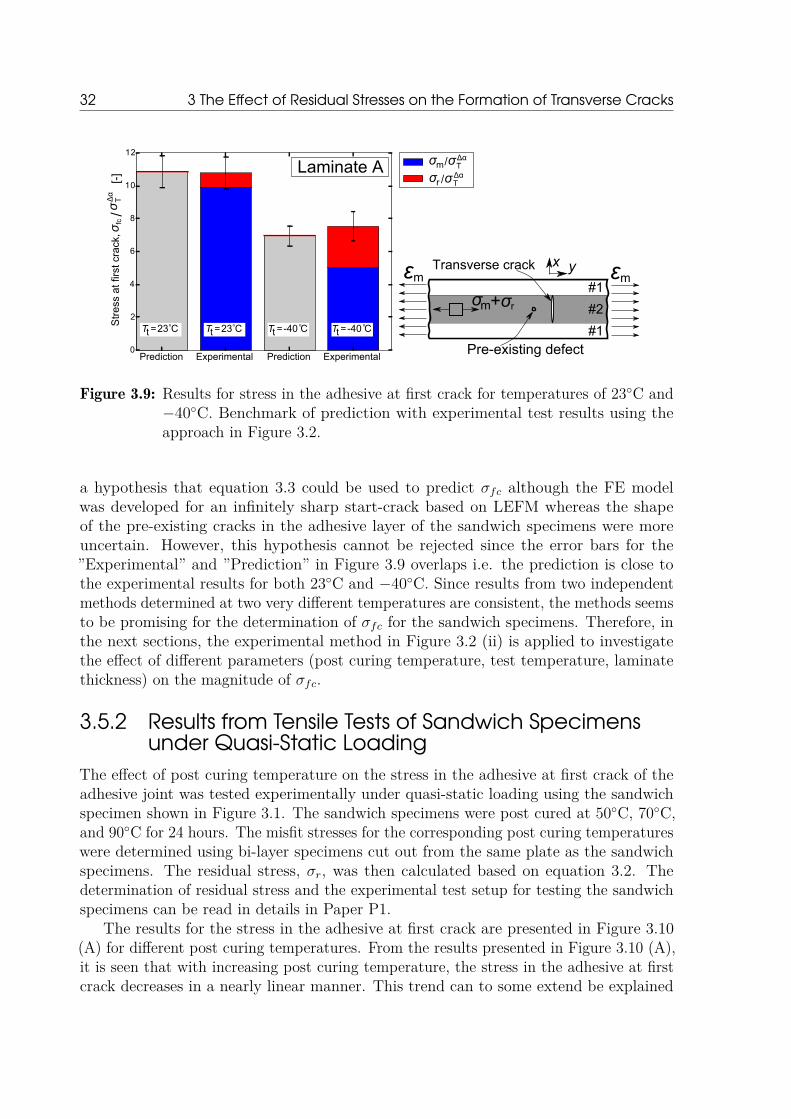
32 3 The Effect of Residual Stresses on the Formation of Transverse Cracks
0
2
4
6
8
10
12
-40 Co
T =t -40 Co
T =t23 Co
T =t 23 Co
T =t
Experimental ExperimentalPrediction PredictionPre-existing defect
fcσ
Str
ess
at fi
rst c
rack
,σ /
[-]
/
/
ΔαT
ΔαT
Δα
T
Figure 3.9: Results for stress in the adhesive at first crack for temperatures of 23C and−40C. Benchmark of prediction with experimental test results using theapproach in Figure 3.2.
a hypothesis that equation 3.3 could be used to predict σfc although the FE modelwas developed for an infinitely sharp start-crack based on LEFM whereas the shapeof the pre-existing cracks in the adhesive layer of the sandwich specimens were moreuncertain. However, this hypothesis cannot be rejected since the error bars for the”Experimental” and ”Prediction” in Figure 3.9 overlaps i.e. the prediction is close tothe experimental results for both 23C and −40C. Since results from two independentmethods determined at two very different temperatures are consistent, the methods seemsto be promising for the determination of σfc for the sandwich specimens. Therefore, inthe next sections, the experimental method in Figure 3.2 (ii) is applied to investigatethe effect of different parameters (post curing temperature, test temperature, laminatethickness) on the magnitude of σfc.
3.5.2 Results from Tensile Tests of Sandwich Specimensunder Quasi-Static Loading
The effect of post curing temperature on the stress in the adhesive at first crack of theadhesive joint was tested experimentally under quasi-static loading using the sandwichspecimen shown in Figure 3.1. The sandwich specimens were post cured at 50C, 70C,and 90C for 24 hours. The misfit stresses for the corresponding post curing temperatureswere determined using bi-layer specimens cut out from the same plate as the sandwichspecimens. The residual stress, σr, was then calculated based on equation 3.2. Thedetermination of residual stress and the experimental test setup for testing the sandwichspecimens can be read in details in Paper P1.
The results for the stress in the adhesive at first crack are presented in Figure 3.10(A) for different post curing temperatures. From the results presented in Figure 3.10 (A),it is seen that with increasing post curing temperature, the stress in the adhesive at firstcrack decreases in a nearly linear manner. This trend can to some extend be explained
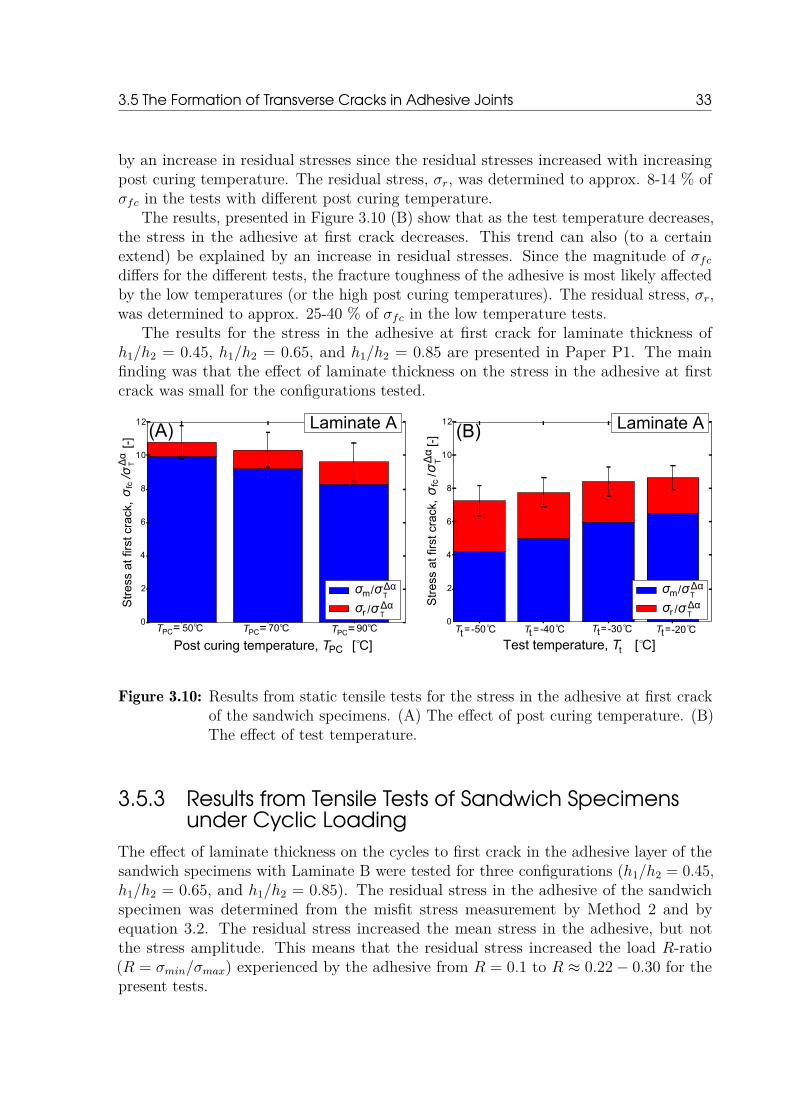
3.5 The Formation of Transverse Cracks in Adhesive Joints 33
by an increase in residual stresses since the residual stresses increased with increasingpost curing temperature. The residual stress, σr, was determined to approx. 8-14 % ofσfc in the tests with different post curing temperature.
The results, presented in Figure 3.10 (B) show that as the test temperature decreases,the stress in the adhesive at first crack decreases. This trend can also (to a certainextend) be explained by an increase in residual stresses. Since the magnitude of σfcdiffers for the different tests, the fracture toughness of the adhesive is most likely affectedby the low temperatures (or the high post curing temperatures). The residual stress, σr,was determined to approx. 25-40 % of σfc in the low temperature tests.
The results for the stress in the adhesive at first crack for laminate thickness ofh1/h2 = 0.45, h1/h2 = 0.65, and h1/h2 = 0.85 are presented in Paper P1. The mainfinding was that the effect of laminate thickness on the stress in the adhesive at firstcrack was small for the configurations tested.
0
2
4
6
8
10
12
Post curing temperature, T [ C]PC
50 Co 70 Co 90 CoT =PC T =PC T =PC
Str
ess
at fi
rst c
rack
,
[
-]σ
/σ
fc
Laminate A
0
2
4
6
8
10
12
Test temperature, T [ C]t
Str
ess
at fi
rst c
rack
,
/
[
-]σ
fcLaminate A
-20 Co-30 C
o-40 C
o-50 C
oT =tT =tT =tT =t
σΔ
αTΔα
T
/
/
ΔαT
ΔαT
/
/
ΔαT
ΔαT
(A) (B)
Figure 3.10: Results from static tensile tests for the stress in the adhesive at first crackof the sandwich specimens. (A) The effect of post curing temperature. (B)The effect of test temperature.
3.5.3 Results from Tensile Tests of Sandwich Specimensunder Cyclic Loading
The effect of laminate thickness on the cycles to first crack in the adhesive layer of thesandwich specimens with Laminate B were tested for three configurations (h1/h2 = 0.45,h1/h2 = 0.65, and h1/h2 = 0.85). The residual stress in the adhesive of the sandwichspecimen was determined from the misfit stress measurement by Method 2 and byequation 3.2. The residual stress increased the mean stress in the adhesive, but notthe stress amplitude. This means that the residual stress increased the load R-ratio(R = σmin/σmax) experienced by the adhesive from R = 0.1 to R ≈ 0.22− 0.30 for thepresent tests.
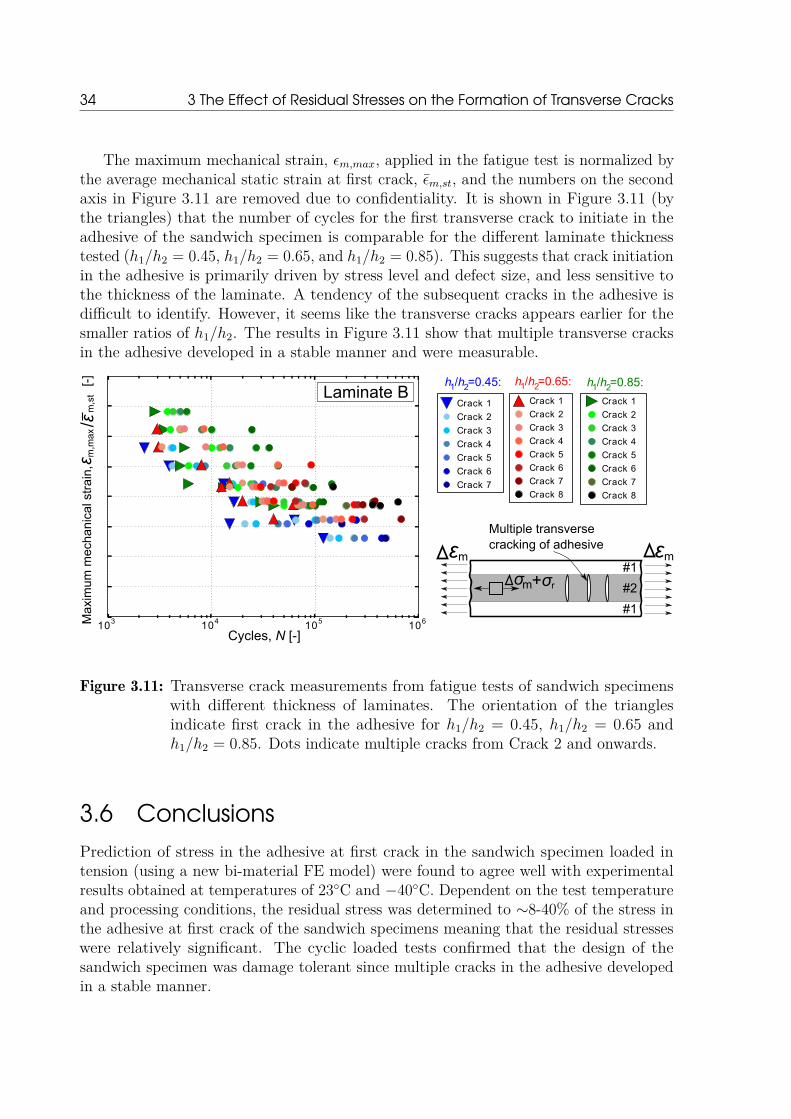
34 3 The Effect of Residual Stresses on the Formation of Transverse Cracks
The maximum mechanical strain, εm,max, applied in the fatigue test is normalized bythe average mechanical static strain at first crack, εm,st, and the numbers on the secondaxis in Figure 3.11 are removed due to confidentiality. It is shown in Figure 3.11 (bythe triangles) that the number of cycles for the first transverse crack to initiate in theadhesive of the sandwich specimen is comparable for the different laminate thicknesstested (h1/h2 = 0.45, h1/h2 = 0.65, and h1/h2 = 0.85). This suggests that crack initiationin the adhesive is primarily driven by stress level and defect size, and less sensitive tothe thickness of the laminate. A tendency of the subsequent cracks in the adhesive isdifficult to identify. However, it seems like the transverse cracks appears earlier for thesmaller ratios of h1/h2. The results in Figure 3.11 show that multiple transverse cracksin the adhesive developed in a stable manner and were measurable.
Crack 1
Crack 2
Crack 3
Crack 4
Crack 5
Crack 6
Crack 7
Crack 8
Crack 1
Crack 2
Crack 3
Crack 4
Crack 5
Crack 6
Crack 7
Crack 1
Crack 2
Crack 3
Crack 4
Crack 5
Crack 6
Crack 7
Crack 8
h /h =0.45:1 2 h /h =0.65:1 2 h /h =0.85:1 2
103 104 105 106
Cycles, N [-]
Multiple transversecracking of adhesive
σm+σ r
#1
#2
#1
εmεm
Laminate B
Max
imum
mec
hani
cal s
trai
n,
[-]
ε m,m
ax/ε
m,s
t
Figure 3.11: Transverse crack measurements from fatigue tests of sandwich specimenswith different thickness of laminates. The orientation of the trianglesindicate first crack in the adhesive for h1/h2 = 0.45, h1/h2 = 0.65 andh1/h2 = 0.85. Dots indicate multiple cracks from Crack 2 and onwards.
3.6 ConclusionsPrediction of stress in the adhesive at first crack in the sandwich specimen loaded intension (using a new bi-material FE model) were found to agree well with experimentalresults obtained at temperatures of 23C and −40C. Dependent on the test temperatureand processing conditions, the residual stress was determined to ∼8-40% of the stress inthe adhesive at first crack of the sandwich specimens meaning that the residual stresseswere relatively significant. The cyclic loaded tests confirmed that the design of thesandwich specimen was damage tolerant since multiple cracks in the adhesive developedin a stable manner.
CHAPTER 4Tunneling Cracks in Adhesive
Bonded JointsTunneling cracks have been modeled extensively through the last three decades using theconcepts of LEFM [100, 43, 41, 97, 98, 6, 10]. From a modeling perspective, tunnelingcracks are closely related to channeling cracks in thin films [105, 11, 108, 107, 9]. Asintroduced in the state of the art literature in section 1.3, one of the first models of asingle tunneling crack embedded in-between two substrates were developed using 2D FEsimulations and LEFM by Ho and Suo [100, 41].
Material orthotropy of the substrates and the adhesive layers can also be accountedfor using FE simulations as demonstrated by Yang et al. [115] and Beom et al. [10].In the work of Beom et al. [10], orthotropy was only modeled for the adhesive layermeaning that the tunneling crack model was limited to isotropic substrates of infinitelythickness. In a wind turbine blade joint the adhesive can be assumed isotropic, but thesubstrates are laminates of finite thickness manufactured of several layers of differenttypes of materials. These materials are typically uni-directional (UD) and bi-axial (Biax)glass fibre reinforced laminates that can be assumed to be orthotropic.
This chapter is organized in two main sections. The first section covers a numericalstudy of a tunneling crack in a wind turbine blade joint with focus on the effect ofembedding a buffer-layer to reduce the tunneling crack energy release rate. In the secondsection, the tunneling crack model will be included in a novel approach to predict thecyclic crack growth rate for tunneling cracks propagating across the adhesive layer of awind turbine blade joint.
4.1 The Effect of a Buffer-layer on the Propagationof a Tunneling Crack
A trailing-edge joint in a wind turbine blade consists of an adhesive layer constrainedin-between stiffer laminates as shown in Figure 4.1. Observations from this joint loadedin tension show that cracks may initiate at the free-edge and propagate through theadhesive layer as a tunneling crack constrained by the laminates. A potential way toprevent tunneling crack propagation across the adhesive layer of the joint is to add anew layer, called a buffer-layer, near the adhesive and control the stiffness- and thicknessof this layer in order to reduce the steady-state energy release rate.
Therefore, the objective is to study the effect of in-plane stiffness, Ei, and thickness,hi, on the steady-state energy release rate for a structural adhesive joint with materialproperties that are realistic for wind turbine blade joints. More specifically, it is the aim
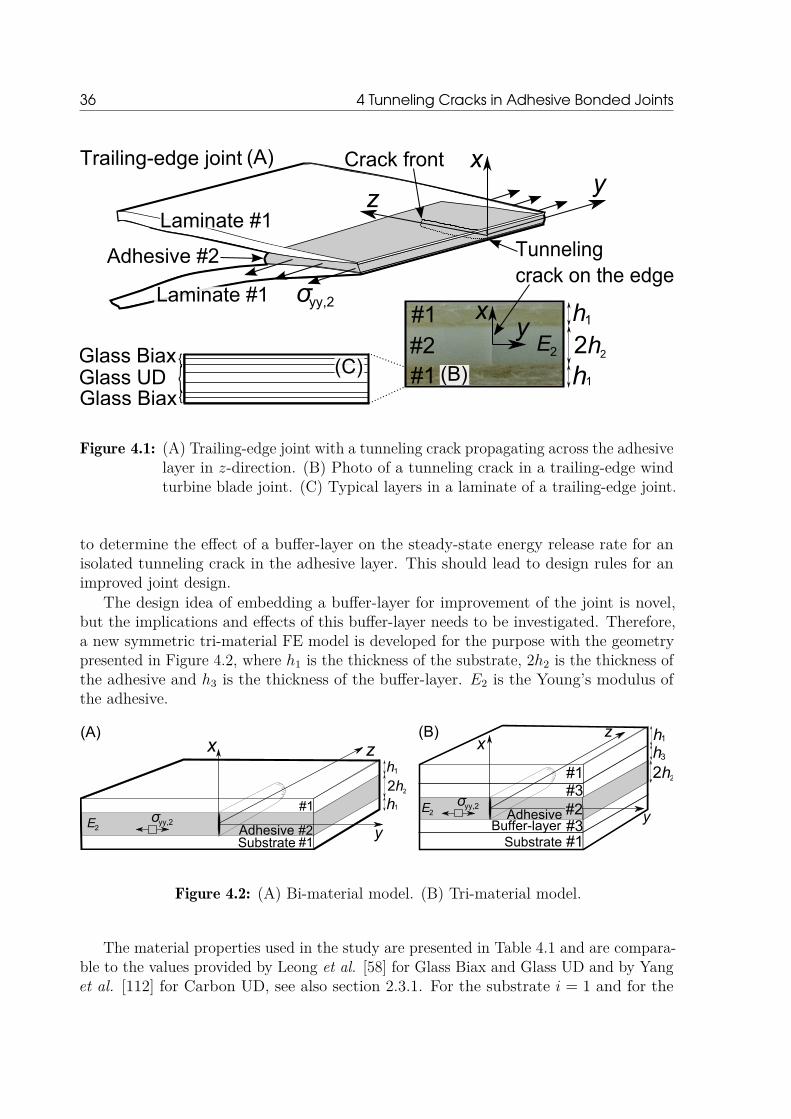
36 4 Tunneling Cracks in Adhesive Bonded Joints
xy
Trailing-edge joint
Adhesive #2
(A)
Glass Biax
Glass BiaxGlass UD
Tunneling crack on the edge
z
xy
Crack front
Laminate #1
(C)
Laminate #1
yy,2σ
E2 2h2
h1
h1
#1#2#1
(B)
Figure 4.1: (A) Trailing-edge joint with a tunneling crack propagating across the adhesivelayer in z-direction. (B) Photo of a tunneling crack in a trailing-edge windturbine blade joint. (C) Typical layers in a laminate of a trailing-edge joint.
to determine the effect of a buffer-layer on the steady-state energy release rate for anisolated tunneling crack in the adhesive layer. This should lead to design rules for animproved joint design.
The design idea of embedding a buffer-layer for improvement of the joint is novel,but the implications and effects of this buffer-layer needs to be investigated. Therefore,a new symmetric tri-material FE model is developed for the purpose with the geometrypresented in Figure 4.2, where h1 is the thickness of the substrate, 2h2 is the thickness ofthe adhesive and h3 is the thickness of the buffer-layer. E2 is the Young’s modulus ofthe adhesive.
2h2
h1
hx
y
z
#1
#1
1
#2
x
y
z
Adhesive
SubstrateBuffer-layer
#1#3
#1#3
σ yy,2
2h2
h1h3
(A) (B)
AdhesiveSubstrate
#2σ yy,2E2
E2
Figure 4.2: (A) Bi-material model. (B) Tri-material model.
The material properties used in the study are presented in Table 4.1 and are compara-ble to the values provided by Leong et al. [58] for Glass Biax and Glass UD and by Yanget al. [112] for Carbon UD, see also section 2.3.1. For the substrate i = 1 and for the
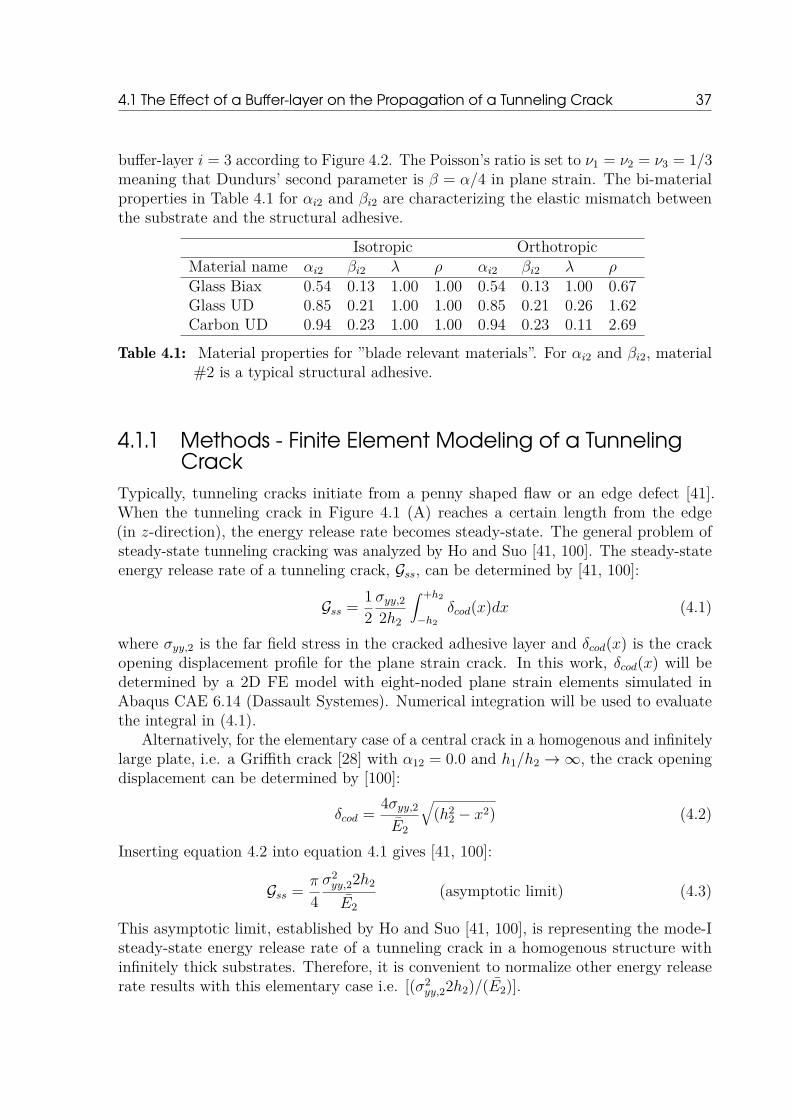
4.1 The Effect of a Buffer-layer on the Propagation of a Tunneling Crack 37
buffer-layer i = 3 according to Figure 4.2. The Poisson’s ratio is set to ν1 = ν2 = ν3 = 1/3meaning that Dundurs’ second parameter is β = α/4 in plane strain. The bi-materialproperties in Table 4.1 for αi2 and βi2 are characterizing the elastic mismatch betweenthe substrate and the structural adhesive.
Isotropic OrthotropicMaterial name αi2 βi2 λ ρ αi2 βi2 λ ρGlass Biax 0.54 0.13 1.00 1.00 0.54 0.13 1.00 0.67Glass UD 0.85 0.21 1.00 1.00 0.85 0.21 0.26 1.62Carbon UD 0.94 0.23 1.00 1.00 0.94 0.23 0.11 2.69
Table 4.1: Material properties for ”blade relevant materials”. For αi2 and βi2, material#2 is a typical structural adhesive.
4.1.1 Methods - Finite Element Modeling of a TunnelingCrack
Typically, tunneling cracks initiate from a penny shaped flaw or an edge defect [41].When the tunneling crack in Figure 4.1 (A) reaches a certain length from the edge(in z-direction), the energy release rate becomes steady-state. The general problem ofsteady-state tunneling cracking was analyzed by Ho and Suo [41, 100]. The steady-stateenergy release rate of a tunneling crack, Gss, can be determined by [41, 100]:
Gss = 12σyy,22h2
∫ +h2
−h2δcod(x)dx (4.1)
where σyy,2 is the far field stress in the cracked adhesive layer and δcod(x) is the crackopening displacement profile for the plane strain crack. In this work, δcod(x) will bedetermined by a 2D FE model with eight-noded plane strain elements simulated inAbaqus CAE 6.14 (Dassault Systemes). Numerical integration will be used to evaluatethe integral in (4.1).
Alternatively, for the elementary case of a central crack in a homogenous and infinitelylarge plate, i.e. a Griffith crack [28] with α12 = 0.0 and h1/h2 →∞, the crack openingdisplacement can be determined by [100]:
δcod = 4σyy,2E2
√(h2
2 − x2) (4.2)
Inserting equation 4.2 into equation 4.1 gives [41, 100]:
Gss = π
4σ2yy,22h2
E2(asymptotic limit) (4.3)
This asymptotic limit, established by Ho and Suo [41, 100], is representing the mode-Isteady-state energy release rate of a tunneling crack in a homogenous structure withinfinitely thick substrates. Therefore, it is convenient to normalize other energy releaserate results with this elementary case i.e. [(σ2
yy,22h2)/(E2)].

38 4 Tunneling Cracks in Adhesive Bonded Joints
4.1.2 Results from Finite Element ModelingFinite element results are presented in Figure 4.3 and compared with the modelingresults by Ho and Suo [41] in order to test the accuracy of the model implementation.For α12 = 0.0 in Figure 4.3 (A), the deviation between the numerical solution andthe asymptotic limit (Ho and Suo [41]) of π/4 in equation 4.3 is less than 0.3% whenh1/h2 ≥ 6.0. The trend of the modeling results in Figure 4.3 (B) is that the steady-stateenergy release rate, Gss, decreases with increasing substrate stiffness and -thickness. Themaximum deviation between the curve for h1/h2 = 2.0 in Figure 4.3 (B) and the modelingresults by Ho and Suo is below 2%.
1.0 0.5 0.0 0.5 1.00.0
0.5
1.0
1.5
2.0
2.5
3.0
3.5
4.0
4.5
[-]α12
[-]
(B)
= 0.5= 1.0= 2.0= 4.0= 10.0
= 2.0
2σ
2h2
yy,2
Ess
2(
)/(
)
0 2 4 6 8 100.0
0.5
1.0
1.5
2.0
2.5
3.0
3.5
4.0
4.5
= − 0.80
= − 0.50
= 0.00
= 0.80
= 0.50
2σ
2h2
yy,2
Ess
2(
)/(
)
(A)
= 0.00
E1
E1
E2 2h2
h1
h
x
y
z
σ yy,2
#1
#11
#2E1
E1
E2 2h2
h1
h
x
y
z
σ yy,2
#1
#11
#2[-]
h /h [-]1 2
(Asymptotic limit) (Ho and Suo)α12
α12 α12
α12
α12
α12 h /h 1 2
h /h 1 2
h /h 1 2
h /h 1 2
h /h 1 2
h /h 1 2
G G
Figure 4.3: (A) FE results from bi-material model compared with the asymptotic limit(π/4) from Ho and Suo [41]. (B) FE results from bi-material model comparedwith the results by Ho and Suo [41]. Materials are modeled as isotropic andβ12 = α12/4.
The bi-material model in Figure 4.2 (A) is extended by embedding a buffer-layer,named #3 in Figure 4.2 (B), to investigate the effect of buffer-layer stiffness and -thicknesson Gss. For the tri-material model, design curves are presented in Figure 4.4 where α32is varied for different h3/h2 and α12. The design curves in Figure 4.4 for each stiffnessmismatch, α12, intersect at a specific point, namely the ”point of intersection” (PoI) thatis marked with ”X” in Figure 4.4. On the right hand side of the ”point of intersection”(α32 > PoI), it is advantageous to increase the buffer-layer thickness. In turn, on theleft hand side of the ”point of intersection” (α32 < PoI), it is advantageous to decreasethe buffer-layer thickness. It can also be seen in Figure 4.4 that with increasing α12 the”point of intersection” moves to the right (to a larger α32 value).
Another study with the tri-material FE model is presented in Figure 4.5. Thesubstrates are modeled as both isotropic and orthotropic with the properties in Table 4.1in order to investigate the effect of material orthotropy on Gss. Glass Biax and CarbonUD are used as buffer-layers in the study and the properties of the basis substrate are

4.1 The Effect of a Buffer-layer on the Propagation of a Tunneling Crack 39
1.0 0.5 0.0 0.5 1.00.5
1.0
1.5
2.0
2.5
3.0
1.0 0.5 0.0 0.5 1.00.5
1.0
1.5
2.0
2.5
3.0
1.0 0.5 0.0 0.5 1.00.5
1.0
1.5
2.0
2.5
3.0
2σ
2h2
yy,2
Ess
2(
)/(
)[-
]
2σ
2h2
yy,2
Ess
2(
)/(
)[-
]
2σ
2h2
yy,2
Ess
2(
)/(
)[-
]
(A) (B)
(C)
α12=-0.5 α12=0.0
α12=0.5
PoIx PoI
x PoI
α32 [-]
α32 [-]
α32 [-]
1.0 0.5 0.0 0.5 1.00.5
1.0
1.5
2.0
2.5
3.0
x
h3 / h2 = 0.5h3 / h2 = 1.0h3 / h2 = 2.0h3 / h2 = 4.0h3 / h2 = 10.0
α32 [-]x
PoI
α12=0.9
(D)2σ
2h2
yy,2
Ess
2(
)/(
)[-
]
h3 / h2 = 0.5h3 / h2 = 1.0h3 / h2 = 2.0h3 / h2 = 4.0h3 / h2 = 10.0
h3 / h2 = 0.5h3 / h2 = 1.0h3 / h2 = 2.0h3 / h2 = 4.0h3 / h2 = 10.0
h3 / h2 = 0.5h3 / h2 = 1.0h3 / h2 = 2.0h3 / h2 = 4.0h3 / h2 = 10.0
GG G
G
Figure 4.4: Steady-state energy release rate results from a symmetric tri-material FEmodel with isotropic materials and selected parameters fixed: βi2 = αi2/4,h1/h2 = 1.0. Substrate stiffness mismatch of: (A) α12 = −0.5, (B) α12 = 0.0,(C) α12 = 0.5 and (D) α12 = 0.9.
taken from Glass UD. As shown in Table 4.1, the stiffness of Glass Biax is lower thanthe stiffness of the substrate (Glass UD), whereas the stiffness of Carbon UD is higherthan that of the substrate (Glass UD).
In the first case, the stiffness of the substrate is comparable to a uni-directional glassfibre reinforced laminate and the stiffness of the buffer-layer is similar to a glass fibrereinforced bi-axial laminate according to the material properties for Glass UD and GlassBiax in Table 4.1. The buffer-layer thus has a lower stiffness than the (original) substrate.Figure 4.5 shows that an increase of h3 increases Gss although the total thickness of thesubstrate (h1 + h3) increases. This can be explained by the stiffer substrate is movedfurther away from the tunneling crack tip and by the lower stiffness of the buffer-layerclosest to the adhesive that is reducing the constraint. The effect of material orthotropywhen Glass Biax is used as buffer layer is small (below 2%).
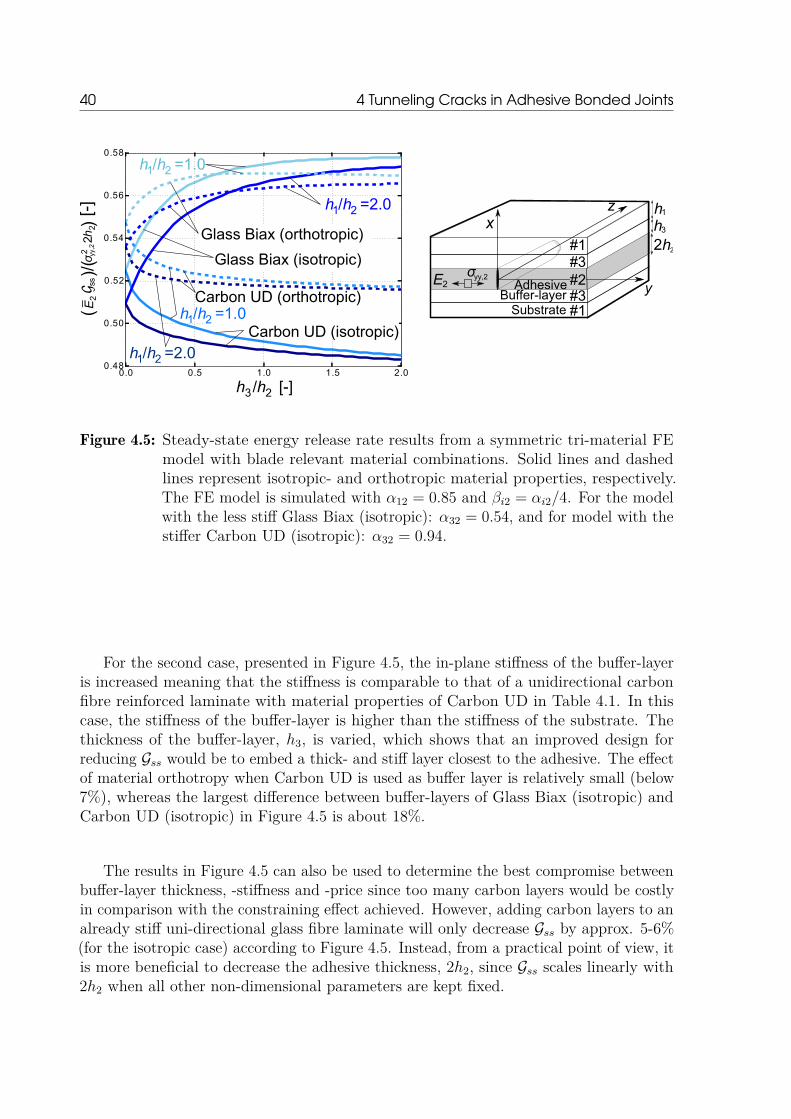
40 4 Tunneling Cracks in Adhesive Bonded Joints
0.0 0.5 1.0 1.5 2.00.48
0.50
0.52
0.54
0.56
0.58
x
y
z
Adhesive
SubstrateBuffer-layer
#1#3
#1#3
σ yy,2
2h2
h1
h3
h /h =1.01 2
h /h =2.01 2
h /h =2.01 2
/h [-]3 2
2σ
2h2
yy,2
E
ss2
(
)/
(
)
[-]
Glass Biax (isotropic)
Glass Biax (orthotropic)
Carbon UD (orthotropic)
Carbon UD (isotropic)h /h =1.01 2
E2 #2
G
h
Figure 4.5: Steady-state energy release rate results from a symmetric tri-material FEmodel with blade relevant material combinations. Solid lines and dashedlines represent isotropic- and orthotropic material properties, respectively.The FE model is simulated with α12 = 0.85 and βi2 = αi2/4. For the modelwith the less stiff Glass Biax (isotropic): α32 = 0.54, and for model with thestiffer Carbon UD (isotropic): α32 = 0.94.
For the second case, presented in Figure 4.5, the in-plane stiffness of the buffer-layeris increased meaning that the stiffness is comparable to that of a unidirectional carbonfibre reinforced laminate with material properties of Carbon UD in Table 4.1. In thiscase, the stiffness of the buffer-layer is higher than the stiffness of the substrate. Thethickness of the buffer-layer, h3, is varied, which shows that an improved design forreducing Gss would be to embed a thick- and stiff layer closest to the adhesive. The effectof material orthotropy when Carbon UD is used as buffer layer is relatively small (below7%), whereas the largest difference between buffer-layers of Glass Biax (isotropic) andCarbon UD (isotropic) in Figure 4.5 is about 18%.
The results in Figure 4.5 can also be used to determine the best compromise betweenbuffer-layer thickness, -stiffness and -price since too many carbon layers would be costlyin comparison with the constraining effect achieved. However, adding carbon layers to analready stiff uni-directional glass fibre laminate will only decrease Gss by approx. 5-6%(for the isotropic case) according to Figure 4.5. Instead, from a practical point of view, itis more beneficial to decrease the adhesive thickness, 2h2, since Gss scales linearly with2h2 when all other non-dimensional parameters are kept fixed.

4.2 Prediction of Crack Growth Rates for Tunneling Cracks 41
4.2 Prediction of Crack Growth Rates for TunnelingCracks
A generic tunneling crack tool is presented for the prediction of crack growth rates fortunneling cracks propagating across a bond-line in a wind turbine blade under high cyclicloadings. The main input to the tool is the mode-I Paris law for the adhesive that ismeasured experimentally in the laboratory using a moment-loaded double cantileverbeam specimen. Another input is the residual stresses in the adhesive that are determinedfrom measured curvature of bi-layer specimens. Additionally, the generic tunneling cracktool takes input from blade geometry, -loads, and -constitutive properties, see Figure4.6. Here, the dashed square at position z = ai(Ni) shows the crack configuration that isanalyzed using a plane strain condition (in z-direction) and LEFM modeling. To applyDundurs parameters (α, β) in the x-y plane [21, 20], it is also a prerequisite that thematerials are isotropic, linear-elastic and deformations are planar i.e. either plane stressor plane strain. These prerequisites are satisfied for the sandwich in Figure 4.1 (B) if theadhesive and laminates are assumed isotropic, linear-elastic and the tunneling crack hasreached a certain length from the edge (in z-direction) i.e. the crack propagates understeady-state conditions.
E1
E1
zx
Crack front
a
h1
h1
i
(y,z)
(y,z)(y,z)
(y,z)
Laminate
Laminate
Adhesive
Crack direction
E2 2h2(y,z)
z a i(N )= i
(N )i
Figure 4.6: Tunneling crack configuration in the trailing-edge joint.
In order to demonstrate the applicability of the tool, model predictions are comparedwith measured crack growth rates from a full scale blade tested in an edgewise fatiguetest in the laboratory. Tunneling cracks in the adhesive layer of the trailing-edge jointare monitored as they propagate under excessive high cyclic loadings.
4.2.1 ApproachThe tunneling crack tool takes the local -stiffness and -geometry input from blademodels/measurements including the mechanical stress, σm, and the residual stress, σr, inthe adhesive, see e.g. Figure 3.1. In the real structural blade application shown in Figure4.6, these many parameters depend on the crack tip location (y, z). This dependenceon (y, z) for each tunneling crack complicates the modeling significantly. Therefore, themode-I steady-state energy release rate, Gss, for a single isolated tunneling crack, shown
42 4 Tunneling Cracks in Adhesive Bonded Joints
in Figure 4.6, should be determined by [41]:
Gss(y, z) = [σm(y) + σr(y, z)]22h2(y, z)E2
f [α(y, z), β(y, z), h1(y, z)/h2(y, z)] (4.4)
where subscripts 1 and 2 refer to substrate and adhesive, respectively. f is a non-dimensional function that is determined by 2D FE simulations. Since the loading iscyclic, Gss varies in between a minimum and a maximum value that are denoted Gminss
and Gmaxss , respectively. Gminss and Gmaxss are converted to a cyclic stress intensity factorrange, ∆K, using an analytical model and the Irwin relation [45] in equation 2.1. Thetunneling crack modeling results, the measured residual stresses and the measured Parislaw for the adhesive are combined in the approach in Figure 4.7 to predict the crackgrowth rate for each tunneling crack along the length of the blade section. The steps ofthe approach, presented in Figure 4.7, are summarized:(i) DCB: Double cantilever beam specimen fatigue tested in laboratory to measure
Paris law (da/dN , ∆K) for a mode-I crack in the adhesive.(ii) Bi-layer: Residual stress (σr) determination in the adhesive of the joint using misfit
stress (σT ) that is determined by measuring the curvature of bi-layer specimens.(iii) Blade: Characterization of geometry (h1, 2h2), crack length for each crack (ai),
cycles for each crack (Ni), constitutive properties (E1, E2, ν1, ν2), and mechanicalstresses (σminm , σmaxm ) from blade inspection/model, CAD model, aero/FE model orsimilar.
(iv) Modeling: Tunneling cracks modeled using finite elements to determine ∆Ki asa function of blade geometry/properties, mechanical stress, and residual stress(h1, 2h2, E1, E2, ν1, ν2,∆σm, σr) for each tunneling crack configuration (ai, Ni) de-pendent on location (y, z).
(v) Blade prediction: Prediction of dai/dNi for each tunneling crack in the blade using∆Ki from tunneling crack model and Paris law (da/dN) for the adhesive that ismeasured by a DCB test in laboratory. Note, F is a function that relates ∆K withda/dN .
The methods and results for step (i) to step (iv) in the above list are presented indetails in Paper P3. The main results determined in step (i) and step (v) in the approachin Figure 4.7 are presented next and compared with cyclic crack growth rates measuredon the trailing-edge joint of the full scale blade tested in the laboratory. The generic fullscale research blade was loaded excessively high in the fatigue test in order to propagatethe tunneling cracks.
4.2.2 ResultsFor the prediction of cyclic tunneling crack growth rates on the blade, the parametersfor the mode-I Paris law of the adhesive were measured by a cyclic moment-loaded DCBspecimen. The Paris law for the adhesive were measured for different load R-ratio andpresented in Figure 4.8. The Paris law parameters (C, m) were determined by a least
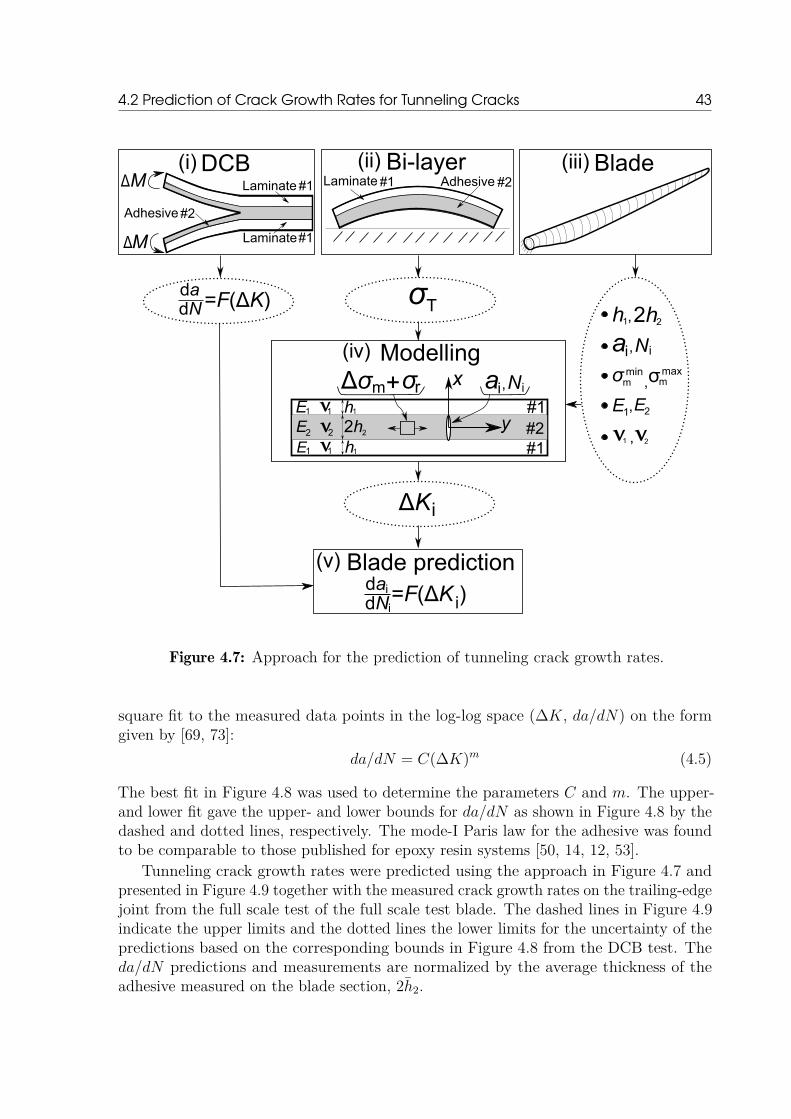
4.2 Prediction of Crack Growth Rates for Tunneling Cracks 43
AdhesiveLaminate(ii) Bi-layer
E1
E1
E2 2h2
h1
h1
x
y
rΔσ σ+m
Blade(iii)
Modelling(iv)
σTdadN =F(ΔK)
#1 #2
#1#2#1
dadN
Blade prediction(v)i
i
ΔKi
=F(ΔK )i
E1 E2,
v v21 ,
σmaxσminm m,
h1 2h2,
ai Ni,
v1
v1
2v
ai Ni,
DCB(i)M
MΔ
Δ
Adhesive
Laminate
Laminate
#1
#1
#2
Figure 4.7: Approach for the prediction of tunneling crack growth rates.
square fit to the measured data points in the log-log space (∆K, da/dN) on the formgiven by [69, 73]:
da/dN = C(∆K)m (4.5)
The best fit in Figure 4.8 was used to determine the parameters C and m. The upper-and lower fit gave the upper- and lower bounds for da/dN as shown in Figure 4.8 by thedashed and dotted lines, respectively. The mode-I Paris law for the adhesive was foundto be comparable to those published for epoxy resin systems [50, 14, 12, 53].
Tunneling crack growth rates were predicted using the approach in Figure 4.7 andpresented in Figure 4.9 together with the measured crack growth rates on the trailing-edgejoint from the full scale test of the full scale test blade. The dashed lines in Figure 4.9indicate the upper limits and the dotted lines the lower limits for the uncertainty of thepredictions based on the corresponding bounds in Figure 4.8 from the DCB test. Theda/dN predictions and measurements are normalized by the average thickness of theadhesive measured on the blade section, 2h2.

44 4 Tunneling Cracks in Adhesive Bonded Joints
10-310-7
10-6
10-5
10-4
10-3
da/(
dN2h
2)
[1/c
ycl
e]
upper fitbest fit
lower fit
R=0.33R=0.35R=0.36R=0.43R=0.51
∆ K / E2 2h2 [ -]10-3310-44C
rack
gro
wth
rat
e,
Stress intensity factor range,1
Figure 4.8: Results from cyclic loaded DCB test of the adhesive including Paris lawbest fit. The axes are normalized by the average thickness of the adhesivemeasured on the blade section, 2h2.
10-7
10-6
10-5
10-4
10-3
Blade m easurem ents
Upper limit
0.24 0.26 0.28 0.30 0.32 0.34 0.36 0.38y/L [-]b
da/(
dN 2
h )
2[1
/cyc
le]
Cra
ck g
row
th r
ate,
Predict ion on blade without residual st ress
Lower limit
Predict ion on blade with residual st ress
Lower limit
Upper limit
(σ ,σ =0)m r
(σ +σ )m r
Position along blade,
Figure 4.9: Comparison of predicted crack growth rates (triangles) with the crack growthrates measured (circles) on the full scale blade joint.
4.3 Conclusions 45
The predicted crack growth rates vary relative to crack location (y, z) due to thevariations in the parameters α, h1/h2, ∆σm and σr. However, the variation of ∆σm issmall meaning that the cyclic stress state of each individual tunneling crack is similar.On the other hand, the effect of σr on da/dN is significant. The crack growth ratesmeasured individually for each tunneling crack in the blade are similar, which can beexplained by the small variations in load levels and geometry along the blade section. Asshown in Figure 4.8 and elaborated in Paper P3, the slope of the Paris law was relativelysteep meaning that the resulting crack growth rates were sensitive to small variationsin loadings. Thus, the main uncertainty comes from the measured Paris law for theadhesive.
The crack growth rates predicted on the blade joint falls above and below the crackgrowth rates measured on the blade. The crack growth rates predicted without includingresidual stress are closest to the crack growth rates measured on the blade. The inclusionof residual stress increased the level of the stress intensity factor range since the R-ratiochanged from R = −1 to between R ≈ 0.3 and R ≈ 0.5. Therefore, the inclusion ofresidual stress increased da/dN as shown in Figure 4.9. The influence of this effect iselaborated in Paper P3.
4.3 ConclusionsIt was found advantageous to embed a stiff buffer-layer near the adhesive with controllablethickness- and stiffness properties in order to improve the joint design against thepropagation of tunneling cracks. However, for wind turbine blade specific materials, thiseffect was found to be relatively small since the substrate to adhesive stiffness mismatchwas already high. Instead, it was proposed to reduce the thickness of the adhesive layersince this parameter had a higher effect on the steady-state energy release rate of thetunneling crack.
The tunneling crack growth rates predicted with- and without accounting for theresidual stress in the adhesive were interpreted as upper- and lower-bounds for the crackgrowth rates in the wind turbine blade joint. The crack growth rates, measured for aseveral metre long section along the trailing-edge joint during an edgewise fatigue test,were found to be in-between the upper- and lower-bound predictions. This suggeststhat the tunneling crack tool can predict crack growth rates for tunneling cracks in atrailing-edge joint of a wind turbine blade sufficiently accurate.

46

CHAPTER 5Crack Deflection at Interfaces
in Adhesive Bonded JointsIf it is assumed that the bond-line of an adhesive joint contains pre-existing defectsthen a crack might be able to initiate and evolve into a transverse crack in the adhesive.After a small crack is formed in the adhesive, the typical cracking sequence is as shownschematically in Figure 5.1. The main crack in the adhesive propagates towards theadhesive/laminate interface (Figure 5.1 (A)). The main crack might reach the interface(Figure 5.1 (B)) or initiate a new crack at the adhesive/laminate interface (Figure 5.1(C)). If the crack reaches the interface it may stop here (Figure 5.1 (B)), but it canalso penetrate into the laminate (Figure 5.1 (D)) or deflect along the adhesive/laminateinterface (Figure 5.1 (E)).
(A)(C)
(B)interface
(E)
(D)
#1
#2
#1
xy
adhesive
laminate/substrate
yyσεyy εyy
x yz
εyy
εyy
Trailing- edge joint
Leading- edge joint
Web joints
main crackdebond crack
crack penetration
crack deflection
Figure 5.1: Crack deflection mechanisms in adhesive joints for wind turbine blades.
One of the first models for the cracking mechanism in Figure 5.1 (C) were developed byCook and Gordon [18]. A stress based criterion (Cook-Gordon criterion) was establishedfor an elliptical shaped crack in a homogenous solid. The Cook-Gordon deflection criterionstates that the interface will fail if the interface strength is less than about 1/3 to 1/5 ofthe bulk material strength.
Later, a fracture mechanics based approach was applied to predict crack deflectionfor the cracking mechanism in Figure 5.1 (B), by introducing an infinitesimal small crackat the interface and in the substrate [40, 38, 106]. In absence of elastic mismatch, the

48 5 Crack Deflection at Interfaces in Adhesive Bonded Joints
deflection criterion states that the interface-to-substrate toughness ratio should be onefourth or less for the crack to deflect.
Modeling the deflection of a crack meeting an interface were, at first, based on eitherstress [18, 31] or energy [40, 38, 30, 62, 106]. The stress based and fracture mechanicsbased approach can be unified using a cohesive law combined with cohesive zone FEmodeling [72, 70, 95, 13, 2, 1]. The cohesive law can be measured experimentally, e.g. bythe J-integral approach [59, 88, 89, 7, 27]. Alternatively, Mohammed and Liechti [66]measured the cohesive law parameters for an aluminum-epoxy bi-material interface usingan iterative calibration procedure where cohesive zone modeling by FE simulations werecombined with measurements from an experimental test of a four-point bend specimen.
It was demonstrated in the literature that crack deflection at interfaces can be modeledusing approaches based on stress, fracture energy or cohesive zone modeling. In turn,rigorous experimental tests of crack deflection at interfaces, where the crack deflectionprocess is clearly documented, are limited [57]. Therefore, it is desired to design a robustexperimental test setup in order to study the problem of crack deflection at interfaces.
This chapter is organized as follows. First an experiment will be designed usinganalytical/numerical models in order to test crack deflection at interfaces. Hereafter,experimental tests will be used to test crack deflection and a new approach will be appliedto measure the cohesive strength of a bi-material interface. Lastly, these measurementswill be discussed in relation to existing results from the literature.
5.1 Design of Four-point SENB Specimens withStable Crack Growth
In order to investigate crack deflection at interfaces experimentally, the four-point single-edge-notch-beam (SENB) specimen in Figure 5.2 is selected like in the studies by Zhangand Lewandowski [117]. However, in their experiments, crack propagation was unstableand crack deflection could only be seen as a sudden decrease in the measured moment.Therefore, further investigations are needed in order to design the experiment suchthat the crack in the displacement-loaded four-point SENB specimen grows stable inmode-I. This means that for the bi-material four-point SENB specimen in Figure 5.2, itis necessary that the crack can propagate stable towards the interface in order to enableobservation of the crack deflection mechanism.
P/2 P/2
c
Bh
a
yx
b
#1
#2
substrateinterfaceadhesive
Figure 5.2: Bi-material four-point SENB specimen (here shown with fixed load, P ).

5.1 Design of Four-point SENB Specimens with Stable Crack Growth 49
The parameters defining the bi-material four-point SENB test specimen geometry arepresented in Figure 5.2 and can be written on a non-dimensional form as; a/b, h/b, B/band c/b, where a is the actual crack length, h is the horizontal distance between loadpoint and main crack, B is the horizontal distance between load- and support point andc is the substrate thickness. Furthermore, a0 is the start-crack length, b is the thicknessof the adhesive layer and δ is the load point displacement.
The models and methods will developed for a class of materials that satisfy LEFMassumptions (isotropic, linear-elastic material and small plastic zone size and smallfracture process zone at crack tip compared with crack length), see also section 2.2. Thegeneral condition for stable crack growth in equation 2.5 in a perfectly brittle materialcan be specified for fixed displacement loading (fixed grip) as:[
∂GI
∂a
]δ
< 0 (5.1)
where δ is the displacement at the force/grip. Thus, the mode-I energy release rate, GI ,must decrease with crack length for the crack to propagate stable.
5.1.1 The Homogenous Four-Point SENB SpecimenThe homogenous four-point SENB specimen in Figure 5.3 is a special case of the bi-material specimen where c/b = 0. Since it is a simpler specimen than the bi-materialversion, it can be used to clarify the effect of different parameters in a convenient way. Ananalytical model of the homogenous four-point SENB specimen, loaded by displacements(fixed grip), is derived since the experimental tests are controlled by fixed grip andanalysis of this is not available in the literature.
P/2 P/2
Bh
a
yx
b adhesive
Figure 5.3: Homogenous four-point SENB specimen (here shown with fixed load, P ).
The model was derived in Paper P4 based on the work of Tada et al. [104] and theassumptions from LEFM and Bernoulli-Euler beam theory. Thus, an expression for themode-I energy release rate, GI , as a function of applied displacement, δ, is:
GIb
Eδ2= π
ab
B2
32
F (a/b)[Bb
+ 3hb
+ 35bBν + 3S(a/b)
]2
(5.2)
where E = E/(1− ν2) and ν = 1/(1− ν) is for plane strain, and E = E and ν = (1 + ν)is for plane stress. F (a/b) and S(a/b) are non-dimensional functions that can be found
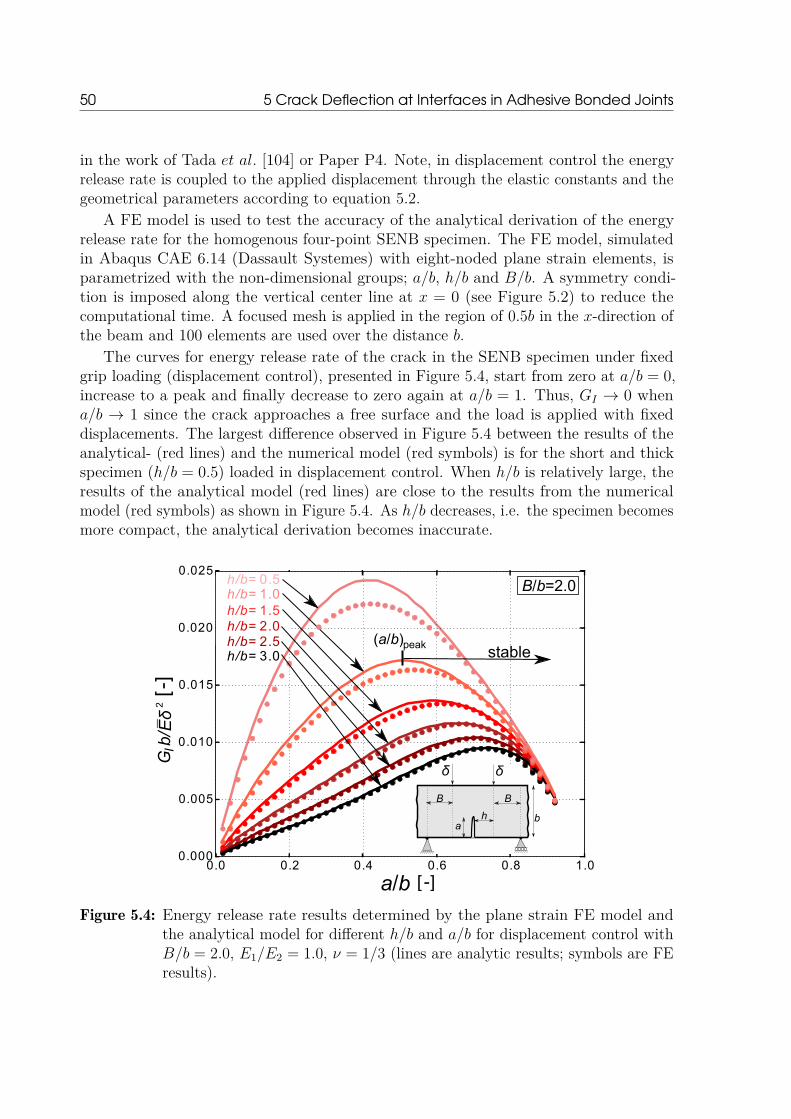
50 5 Crack Deflection at Interfaces in Adhesive Bonded Joints
in the work of Tada et al. [104] or Paper P4. Note, in displacement control the energyrelease rate is coupled to the applied displacement through the elastic constants and thegeometrical parameters according to equation 5.2.
A FE model is used to test the accuracy of the analytical derivation of the energyrelease rate for the homogenous four-point SENB specimen. The FE model, simulatedin Abaqus CAE 6.14 (Dassault Systemes) with eight-noded plane strain elements, isparametrized with the non-dimensional groups; a/b, h/b and B/b. A symmetry condi-tion is imposed along the vertical center line at x = 0 (see Figure 5.2) to reduce thecomputational time. A focused mesh is applied in the region of 0.5b in the x-direction ofthe beam and 100 elements are used over the distance b.
The curves for energy release rate of the crack in the SENB specimen under fixedgrip loading (displacement control), presented in Figure 5.4, start from zero at a/b = 0,increase to a peak and finally decrease to zero again at a/b = 1. Thus, GI → 0 whena/b → 1 since the crack approaches a free surface and the load is applied with fixeddisplacements. The largest difference observed in Figure 5.4 between the results of theanalytical- (red lines) and the numerical model (red symbols) is for the short and thickspecimen (h/b = 0.5) loaded in displacement control. When h/b is relatively large, theresults of the analytical model (red lines) are close to the results from the numericalmodel (red symbols) as shown in Figure 5.4. As h/b decreases, i.e. the specimen becomesmore compact, the analytical derivation becomes inaccurate.
0.0 0.2 0.4 0.6 0.8 1.00.000
0.005
0.010
0.015
0.020
0.025
[-]
G b
/ Eδ2
h/b= 0.5h/b= 1.0h/b= 1.5h/b= 2.0h/b= 2.5h/b= 3.0
B/b=2.0
[ -]a/b
ab
BB
h
δδ
I
(a/b)peakstable
Figure 5.4: Energy release rate results determined by the plane strain FE model andthe analytical model for different h/b and a/b for displacement control withB/b = 2.0, E1/E2 = 1.0, ν = 1/3 (lines are analytic results; symbols are FEresults).

5.1 Design of Four-point SENB Specimens with Stable Crack Growth 51
It is the aim to design the test specimen such that the criterion for stable crack growthin equation 5.1 is satisfied. From Figure 5.4 it is seen that equation 5.1 is fullfilled whena exceeds a critical value, denoted (a/b)peak. The crack grows stable if the start-cracklength is a0/b ≥ (a/b)peak hence the energy release rate decreases with crack length inaccordance with (5.1). It is desired that (a/b)peak is as small as possible such that thecrack can grow stable for a long distance before reaching the free surface. This is toenlarge the design space with stable crack growth. As an example, take the curve forh/b = 1.0 in Figure 5.4 where (a/b)peak ≈ 0.5. For this case, the start-crack length shouldbe a0/b ≥ 0.5 for the crack to propagate stable as exemplified in Figure 5.4.
5.1.2 The Bi-material Four-Point SENB SpecimenA function similar to F (a/b) from Tada et al. [104] can be established for the bi-materialfour-point SENB specimen in Figure 5.2 to account for the presence of a substrate withthickness, c and Young’s modulus, E1. Thus, for the bi-material specimen in load controland with the adhesive and the substrate assumed isotropic:
GI = 1E2σ2xxπaF (a/(b+ c), c/b, E1/E2)2, σxx = ME2Ω
E1I1 + E2I2(5.3)
where subscript 1 and 2 represent the substrate and adhesive, respectively. As shown inFigure 5.5, Ω is the distance from the bottom of the beam and to the global neutral axisof the beam (in the beam specimen without crack) [101]. I1 and I2 are the local areamoment of inertia for the substrate and adhesive, respectively:
I1 = c3
12 + c(c
2 + b− Ω)2, I2 = b3
12 + b
(Ω− b
2
)2
, Ω = c1 + 2E1
E2cb
+ E1E2
(cb
)2
2 cb
(1 + E1
E2cb
) (5.4)
The function, F , in equation 5.3 is determined as shown in Figure 5.5 by FE simulations,which is compared with the solution by Tada et al. [104] for E1/E2 = 1. It can beseen that when a/(b + c) → 0 then F (a/(b + c)) → 1.12 (independently of elasticmismatch). This limit is similar to the solution for a side-crack in an infinitely largehomogenous plate under uni-directional tension [104, 24]. The trend in Figure 5.5 iscomparable to the partial cracked film problem from Beuth [11]. For compliant substrates(E1/E2 . 3), F increases monotonic with increasing crack length, whereas for stiffersubstrates (E1/E2 & 9), F reaches a peak and subsequently starts decreasing (close toa/(b+ c) = 0.8).
Dimension analysis reveals that the energy release rate of the crack for the bi-materialspecimen presented in Figure 5.2 can, when loaded in displacement control, be writtenas:
GI(b+ c)E2δ2
= 9π4a(b+ c)B2 Fδ(a/(b+ c), h/b, B/b, c/b, E1/E2)2 (5.5)
where the non-dimensional function, Fδ, is determined numerically. Fδ is introduced as anumerical function since it is out of the scope to derive an expression analytically for the
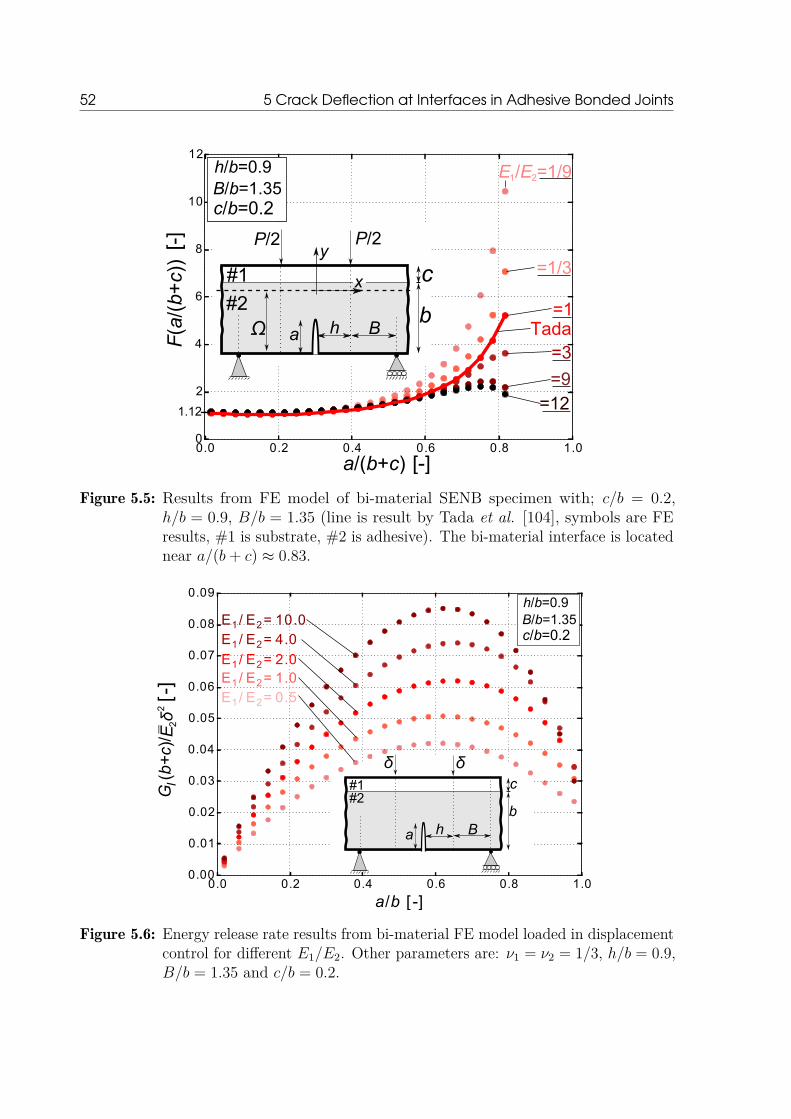
52 5 Crack Deflection at Interfaces in Adhesive Bonded Joints
0.0 0.2 0.4 0.6 0.8 1.00
2
4
6
8
10
12
[-]
[-]
=1
=12
=3
=9
=1/3
E /E =1/91 2
c/b=0.2B/b=1.35h/b=0.9
a/(b+c)
F(a
/(b+c)
)
Tadaa
P/2 P/2
Bhb
c#1
#2
1.12
y
x
Ω
Figure 5.5: Results from FE model of bi-material SENB specimen with; c/b = 0.2,h/b = 0.9, B/b = 1.35 (line is result by Tada et al. [104], symbols are FEresults, #1 is substrate, #2 is adhesive). The bi-material interface is locatednear a/(b+ c) ≈ 0.83.
0.0 0.2 0.4 0.6 0.8 1.0
a/b [ -]
0.00
0.01
0.02
0.03
0.04
0.05
0.06
0.07
0.08
0.09
[-]
G (
b+c)
/ E δ
22
c/b=0.2B/b=1.35h/b=0.9
E1/ E2= 0.5E1/ E2= 1.0E1/ E2= 2.0
E1/ E2= 4.0E1/ E2= 10.0
a Bhb
c
δδ#1#2
I
Figure 5.6: Energy release rate results from bi-material FE model loaded in displacementcontrol for different E1/E2. Other parameters are: ν1 = ν2 = 1/3, h/b = 0.9,B/b = 1.35 and c/b = 0.2.
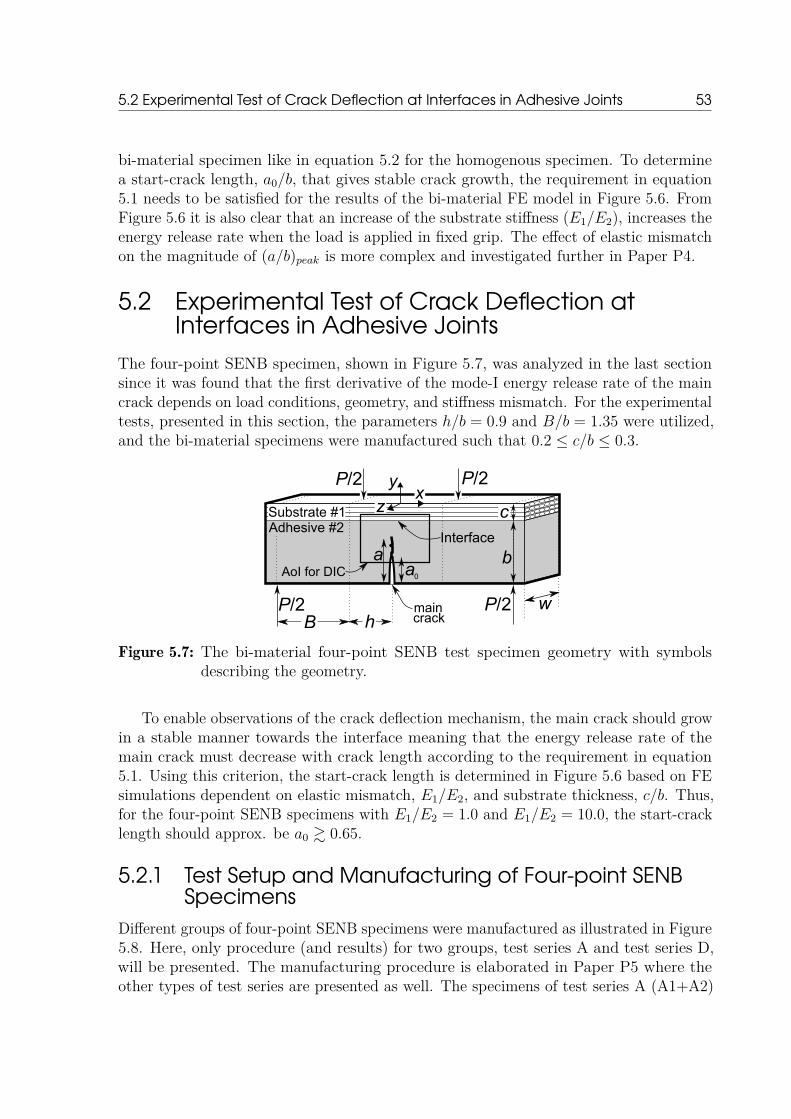
5.2 Experimental Test of Crack Deflection at Interfaces in Adhesive Joints 53
bi-material specimen like in equation 5.2 for the homogenous specimen. To determinea start-crack length, a0/b, that gives stable crack growth, the requirement in equation5.1 needs to be satisfied for the results of the bi-material FE model in Figure 5.6. FromFigure 5.6 it is also clear that an increase of the substrate stiffness (E1/E2), increases theenergy release rate when the load is applied in fixed grip. The effect of elastic mismatchon the magnitude of (a/b)peak is more complex and investigated further in Paper P4.
5.2 Experimental Test of Crack Deflection atInterfaces in Adhesive Joints
The four-point SENB specimen, shown in Figure 5.7, was analyzed in the last sectionsince it was found that the first derivative of the mode-I energy release rate of the maincrack depends on load conditions, geometry, and stiffness mismatch. For the experimentaltests, presented in this section, the parameters h/b = 0.9 and B/b = 1.35 were utilized,and the bi-material specimens were manufactured such that 0.2 ≤ c/b ≤ 0.3.
BP/2
ab
c
0
a
w
P/2P/2
Substrate #1
main
Adhesive #2
y
zx
Interface
crackhP/2
AoI for DIC
Figure 5.7: The bi-material four-point SENB test specimen geometry with symbolsdescribing the geometry.
To enable observations of the crack deflection mechanism, the main crack should growin a stable manner towards the interface meaning that the energy release rate of themain crack must decrease with crack length according to the requirement in equation5.1. Using this criterion, the start-crack length is determined in Figure 5.6 based on FEsimulations dependent on elastic mismatch, E1/E2, and substrate thickness, c/b. Thus,for the four-point SENB specimens with E1/E2 = 1.0 and E1/E2 = 10.0, the start-cracklength should approx. be a0 & 0.65.
5.2.1 Test Setup and Manufacturing of Four-point SENBSpecimens
Different groups of four-point SENB specimens were manufactured as illustrated in Figure5.8. Here, only procedure (and results) for two groups, test series A and test series D,will be presented. The manufacturing procedure is elaborated in Paper P5 where theother types of test series are presented as well. The specimens of test series A (A1+A2)
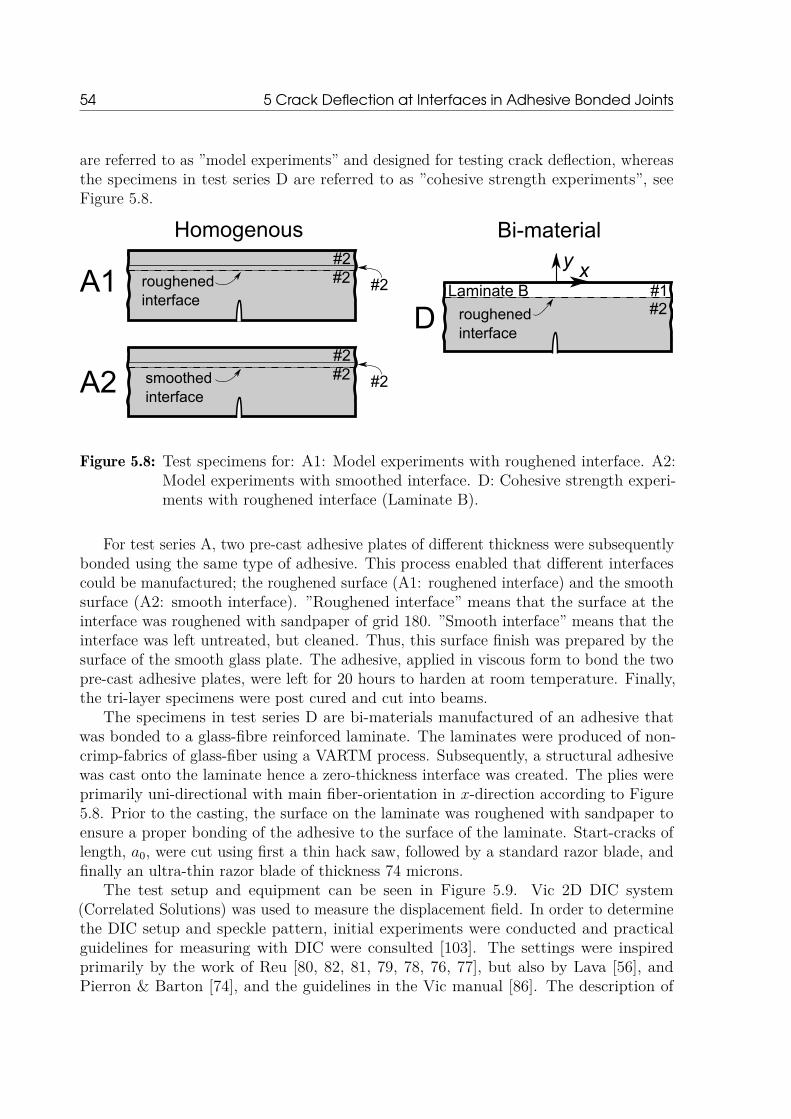
54 5 Crack Deflection at Interfaces in Adhesive Bonded Joints
are referred to as ”model experiments” and designed for testing crack deflection, whereasthe specimens in test series D are referred to as ”cohesive strength experiments”, seeFigure 5.8.
A1D
A2 smoothedinterface
#2#2 #2
roughenedinterface
#2#2 #2
roughenedinterface
#1#2
Laminate B
Bi-materialHomogenous
xy
Figure 5.8: Test specimens for: A1: Model experiments with roughened interface. A2:Model experiments with smoothed interface. D: Cohesive strength experi-ments with roughened interface (Laminate B).
For test series A, two pre-cast adhesive plates of different thickness were subsequentlybonded using the same type of adhesive. This process enabled that different interfacescould be manufactured; the roughened surface (A1: roughened interface) and the smoothsurface (A2: smooth interface). ”Roughened interface” means that the surface at theinterface was roughened with sandpaper of grid 180. ”Smooth interface” means that theinterface was left untreated, but cleaned. Thus, this surface finish was prepared by thesurface of the smooth glass plate. The adhesive, applied in viscous form to bond the twopre-cast adhesive plates, were left for 20 hours to harden at room temperature. Finally,the tri-layer specimens were post cured and cut into beams.
The specimens in test series D are bi-materials manufactured of an adhesive thatwas bonded to a glass-fibre reinforced laminate. The laminates were produced of non-crimp-fabrics of glass-fiber using a VARTM process. Subsequently, a structural adhesivewas cast onto the laminate hence a zero-thickness interface was created. The plies wereprimarily uni-directional with main fiber-orientation in x-direction according to Figure5.8. Prior to the casting, the surface on the laminate was roughened with sandpaper toensure a proper bonding of the adhesive to the surface of the laminate. Start-cracks oflength, a0, were cut using first a thin hack saw, followed by a standard razor blade, andfinally an ultra-thin razor blade of thickness 74 microns.
The test setup and equipment can be seen in Figure 5.9. Vic 2D DIC system(Correlated Solutions) was used to measure the displacement field. In order to determinethe DIC setup and speckle pattern, initial experiments were conducted and practicalguidelines for measuring with DIC were consulted [103]. The settings were inspiredprimarily by the work of Reu [80, 82, 81, 79, 78, 76, 77], but also by Lava [56], andPierron & Barton [74], and the guidelines in the Vic manual [86]. The description of

5.2 Experimental Test of Crack Deflection at Interfaces in Adhesive Joints 55
speckle pattern preparation and the settings used for the DIC measurements can be readin details in Paper P5.
Extension tube CCD sensor
LensFiber optic light
RollersMain
w
xz
crack
B 2h BBackside
Frontside
Fiber optic light
Figure 5.9: Top-view of the four-point bend test setup and equipment.
A MTS 858 Mini Bionix II servo-hydraulic test machine applied the load through aconstant displacement rate. A load cell, calibrated for 1.5 kN, measured the load, P . ACCD sensor of type Grasshopper GRAS-50S5M (2448x2048 pixels) was mounted to atri-pod and to the Fujinon CCTV Lens (HF50SA-1, 1:1.8/50mm) as shown in Figure 5.9.Extension tubes were used to achieve a proper magnification [81].
5.2.2 Experimental ResultsHighlights of the results from the experimental tests of the four-point SENB specimens arepresented here; a complete presentation of the results are given in Paper P5. The primaryresult of test series A1 was that the main crack propagated through the roughenedinterface of the specimen i.e. penetrated into the substrate. For test series A2, thecrack deflected along the smoothed interface. Test specimen A2-1 is selected for furtheranalysis. The moment and crack length measured for test A2-1 are presented in Figure5.10 (A). The moment increased linearly with time until the main crack started to growat time t ≈ 1200 s. The main crack grew stable towards the interface until time t ≈ 1402s, see the image in Figure 5.10 (B). εmaxyy is the maximum vertical strain in Figure 5.10(B) measured by DIC and used for normalization of the strains in the figure. The cracklength was measured to a/b = 0.92. Next, at time t ≈ 1404 s, it was observed that themain crack deflected along the interface, see Figure 5.10 (C). As elaborated in Paper P5,it was observed that the main crack, in test series A2, first reached the interface andthen deflected along the interface.
The results for all specimens in test series D (bi-material) can be found in PaperP5. For these tests, the main crack grew stable towards the interface until the interfacesuddenly debonded as indicated by the sudden drop in measured moment. Test specimenD-9 was selected for further analysis. The moment and crack length were measured andpresented in Figure 5.11 (A) for test D-9.
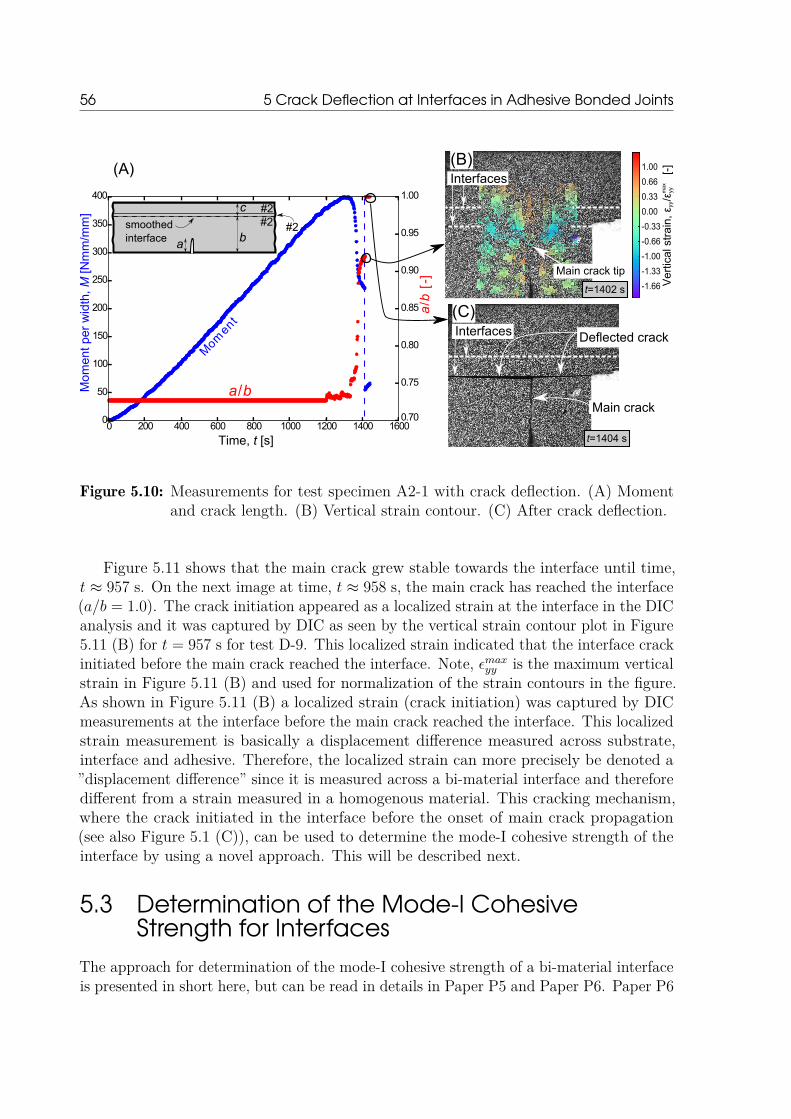
56 5 Crack Deflection at Interfaces in Adhesive Bonded Joints
0.70
0.75
0.80
0.85
0.90
0.95
1.00
a/b
[-]
0 200 400 600 800 1000 1200 1400 1600Tim e [sec.]
0
50
100
150
200
250
300
350
400
Interfaces1.00
0.66
0.33
0.00
-0.33
-0.66
-1.00
-1.33
-1.66
Mom
ent
a/b
Time, t [s]
Mom
ent p
er w
idth
, M [N
mm
/mm
]
smoothedinterface
#2#2 #2
a
c
b
(B)(A)
Interfaces
(C)
Ver
tical
str
ain,
ε /
ε
[-]
yyyym
ax
Deflected crack
Main crack
Main crack tip
t=1402 s
t=1404 s
Figure 5.10: Measurements for test specimen A2-1 with crack deflection. (A) Momentand crack length. (B) Vertical strain contour. (C) After crack deflection.
Figure 5.11 shows that the main crack grew stable towards the interface until time,t ≈ 957 s. On the next image at time, t ≈ 958 s, the main crack has reached the interface(a/b = 1.0). The crack initiation appeared as a localized strain at the interface in the DICanalysis and it was captured by DIC as seen by the vertical strain contour plot in Figure5.11 (B) for t = 957 s for test D-9. This localized strain indicated that the interface crackinitiated before the main crack reached the interface. Note, εmaxyy is the maximum verticalstrain in Figure 5.11 (B) and used for normalization of the strain contours in the figure.As shown in Figure 5.11 (B) a localized strain (crack initiation) was captured by DICmeasurements at the interface before the main crack reached the interface. This localizedstrain measurement is basically a displacement difference measured across substrate,interface and adhesive. Therefore, the localized strain can more precisely be denoted a”displacement difference” since it is measured across a bi-material interface and thereforedifferent from a strain measured in a homogenous material. This cracking mechanism,where the crack initiated in the interface before the onset of main crack propagation(see also Figure 5.1 (C)), can be used to determine the mode-I cohesive strength of theinterface by using a novel approach. This will be described next.
5.3 Determination of the Mode-I CohesiveStrength for Interfaces
The approach for determination of the mode-I cohesive strength of a bi-material interfaceis presented in short here, but can be read in details in Paper P5 and Paper P6. Paper P6
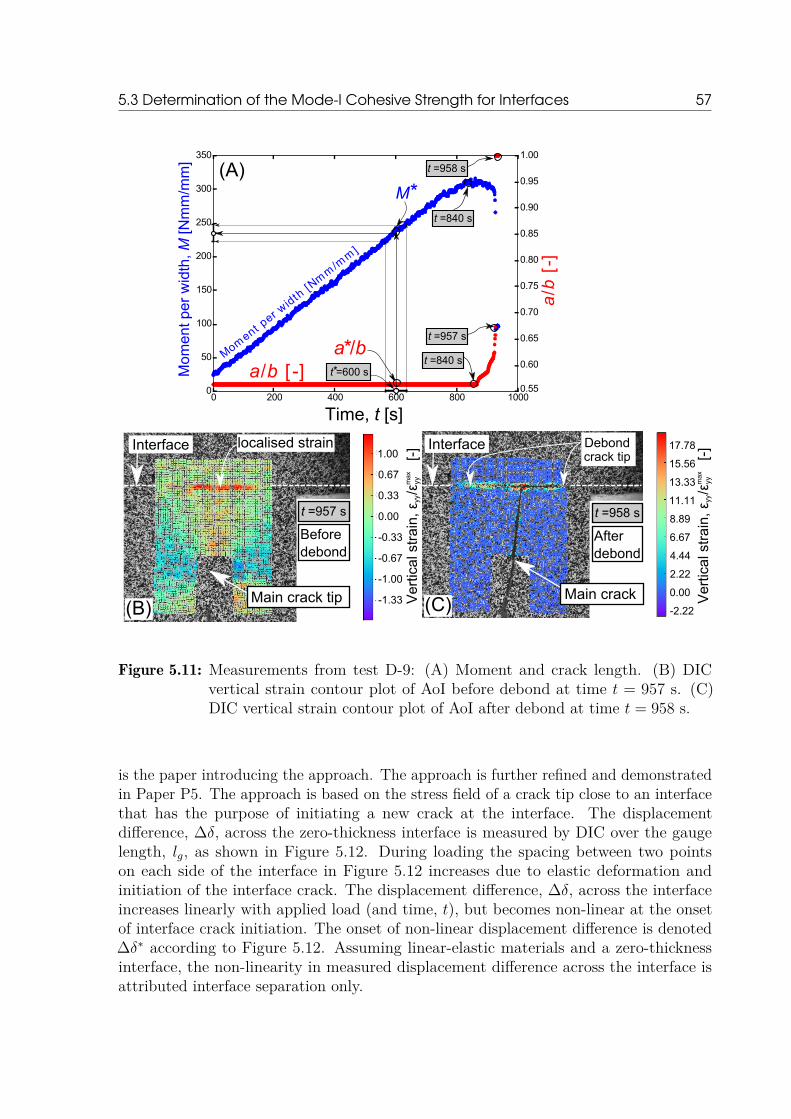
5.3 Determination of the Mode-I Cohesive Strength for Interfaces 57
Interfacecrack tipDebond 17.78
15.56
13.33
11.11
8.89
6.67
4.44
2.22
0.00
-2.22
Interface1.00
0.67
0.33
0.00
-0.33
-0.67
-1.00
-1.33
Time, t [s]
Moment p
er wid
th [N
mm
/mm
]
a /b [ -]
t =840 s
t =840 s
t =958 s
0.55
0.60
0.65
0.70
0.75
0.80
0.85
0.90
0.95
1.00
a/b
[-]
0 200 400 600 800 10000
50
100
150
200
250
300
350
t =957 s
Mom
ent p
er w
idth
, M [N
mm
/mm
]
Ver
tical
str
ain,
ε /
ε
[-]
yyyym
ax
Ver
tical
str
ain,
ε /
ε
[-]
yyyym
ax
M*
* a /bt =600 s*
localised strain
Beforedebond
t =957 s
Afterdebond
t =958 s
Main crack tip Main crack
(A)
(B) (C)
Figure 5.11: Measurements from test D-9: (A) Moment and crack length. (B) DICvertical strain contour plot of AoI before debond at time t = 957 s. (C)DIC vertical strain contour plot of AoI after debond at time t = 958 s.
is the paper introducing the approach. The approach is further refined and demonstratedin Paper P5. The approach is based on the stress field of a crack tip close to an interfacethat has the purpose of initiating a new crack at the interface. The displacementdifference, ∆δ, across the zero-thickness interface is measured by DIC over the gaugelength, lg, as shown in Figure 5.12. During loading the spacing between two pointson each side of the interface in Figure 5.12 increases due to elastic deformation andinitiation of the interface crack. The displacement difference, ∆δ, across the interfaceincreases linearly with applied load (and time, t), but becomes non-linear at the onsetof interface crack initiation. The onset of non-linear displacement difference is denoted∆δ∗ according to Figure 5.12. Assuming linear-elastic materials and a zero-thicknessinterface, the non-linearity in measured displacement difference across the interface isattributed interface separation only.
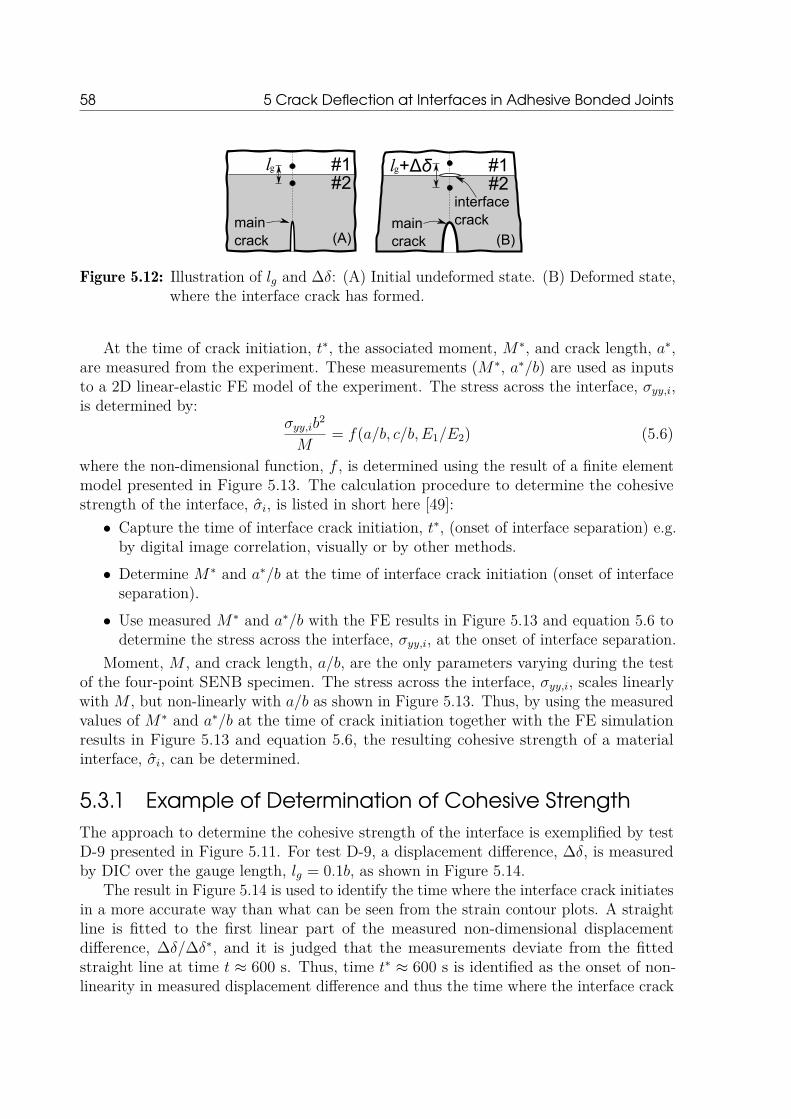
58 5 Crack Deflection at Interfaces in Adhesive Bonded Joints
Verticalsymmetry line
lg #1#2
maincrack
Verticalsymmetry line
lg
interfacecrack
#1#2
maincrack
+Δδ
(A) (B)
Figure 5.12: Illustration of lg and ∆δ: (A) Initial undeformed state. (B) Deformed state,where the interface crack has formed.
At the time of crack initiation, t∗, the associated moment, M∗, and crack length, a∗,are measured from the experiment. These measurements (M∗, a∗/b) are used as inputsto a 2D linear-elastic FE model of the experiment. The stress across the interface, σyy,i,is determined by:
σyy,ib2
M= f(a/b, c/b, E1/E2) (5.6)
where the non-dimensional function, f , is determined using the result of a finite elementmodel presented in Figure 5.13. The calculation procedure to determine the cohesivestrength of the interface, σi, is listed in short here [49]:• Capture the time of interface crack initiation, t∗, (onset of interface separation) e.g.
by digital image correlation, visually or by other methods.• Determine M∗ and a∗/b at the time of interface crack initiation (onset of interface
separation).• Use measured M∗ and a∗/b with the FE results in Figure 5.13 and equation 5.6 to
determine the stress across the interface, σyy,i, at the onset of interface separation.Moment, M , and crack length, a/b, are the only parameters varying during the test
of the four-point SENB specimen. The stress across the interface, σyy,i, scales linearlywith M , but non-linearly with a/b as shown in Figure 5.13. Thus, by using the measuredvalues of M∗ and a∗/b at the time of crack initiation together with the FE simulationresults in Figure 5.13 and equation 5.6, the resulting cohesive strength of a materialinterface, σi, can be determined.
5.3.1 Example of Determination of Cohesive StrengthThe approach to determine the cohesive strength of the interface is exemplified by testD-9 presented in Figure 5.11. For test D-9, a displacement difference, ∆δ, is measuredby DIC over the gauge length, lg = 0.1b, as shown in Figure 5.14.
The result in Figure 5.14 is used to identify the time where the interface crack initiatesin a more accurate way than what can be seen from the strain contour plots. A straightline is fitted to the first linear part of the measured non-dimensional displacementdifference, ∆δ/∆δ∗, and it is judged that the measurements deviate from the fittedstraight line at time t ≈ 600 s. Thus, time t∗ ≈ 600 s is identified as the onset of non-linearity in measured displacement difference and thus the time where the interface crack
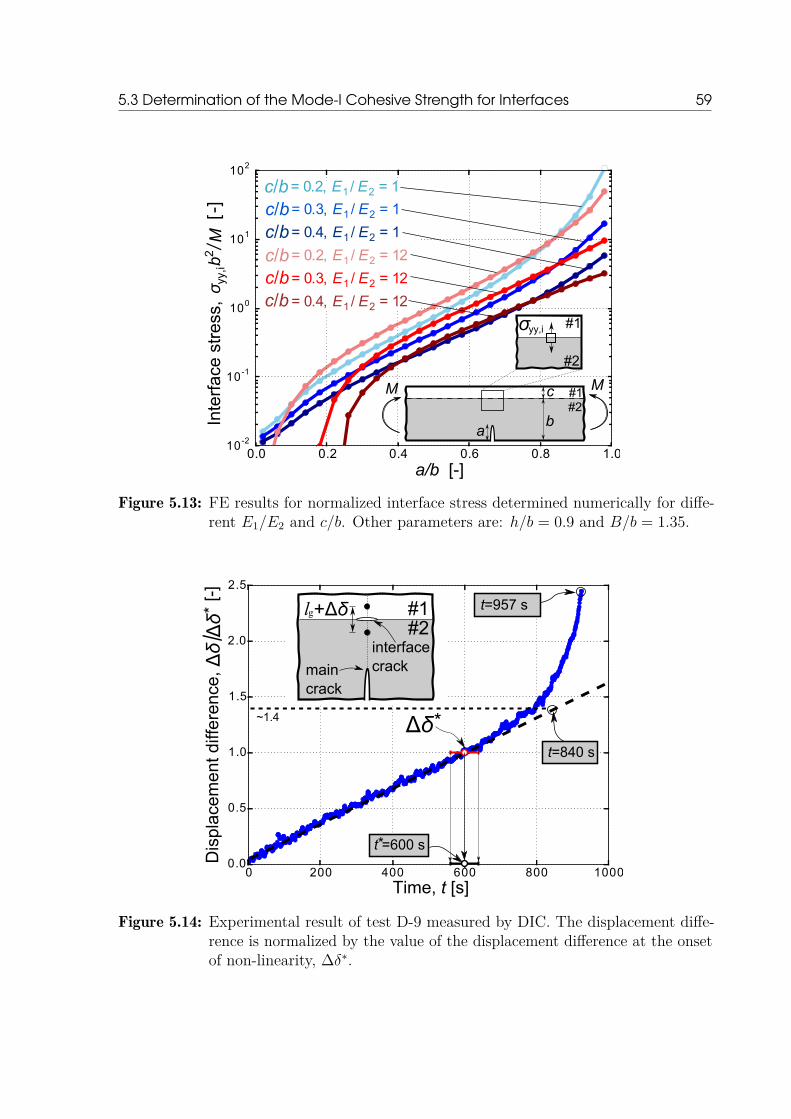
5.3 Determination of the Mode-I Cohesive Strength for Interfaces 59
0.0 0.2 0.4 0.6 0.8 1.010-2
10-1
100
101
102
σyy
,ib
2M
[-]
/
a/b [-]
Inte
rfac
e st
ress
,
= 0.2, E1 / E2 = 1c/b= 0.3, E1 / E2 = 1c/b= 0.4, E1 / E2 = 1c/b= 0.2, E1 / E2 = 12c/b= 0.3, E1 / E2 = 12c/b= 0.4, E1 / E2 = 12c/b
#1#2
a
c
b
#2
MM
σ yy,i #1
Figure 5.13: FE results for normalized interface stress determined numerically for diffe-rent E1/E2 and c/b. Other parameters are: h/b = 0.9 and B/b = 1.35.
0 200 400 600 800 10000.0
0.5
1.0
1.5
2.0
2.5
[-]
t=957 s
~1.4
t=840 s
Dis
plac
emen
t diff
eren
ce,
Δδ*
/Δ
δΔ
δ*
Time, t [s]
Verticalsymmetry line
lg
interfacecrack
#1#2
maincrack
+Δδ
t =600 s*
Figure 5.14: Experimental result of test D-9 measured by DIC. The displacement diffe-rence is normalized by the value of the displacement difference at the onsetof non-linearity, ∆δ∗.

60 5 Crack Deflection at Interfaces in Adhesive Bonded Joints
initiated. The onset of interface separation begins at time t∗ = 600 s whereas the maincrack started to propagate at time t = 840 s. This time measurement (t∗ = 600 s) is usedin Figure 5.11 (A) to determine M∗ = 240 Nmm/mm and a∗/b = 0.57. These parameters(M∗ = 240 Nmm/mm, a∗/b = 0.57) together with E1/E2 = 12.0 and c/b = 0.2 are theinputs to equation 5.6. From the results in Figure 5.13, the mode-I cohesive strengthof the interface can be determined to σi/σa = 0.078 ± 0.004 for test D-9, where σi isnormalized with the macroscopic strength of the adhesive, σa, that was measured by auni-directional tensile test of a dog bone specimen.
5.3.2 Discussion of Cohesive Strength ResultsFurther results for the non-dimensional cohesive strength, σi/σa, are presented in PaperP5 and ranges between 0.05 < σi/σa < 0.20 for the different material interfaces tested.
Mohammed and Liechti [66] measured the cohesive strength of an aluminum-epoxybi-material interface to σi = 3 MPa, which can be normalized by the bulk strength ofthe epoxy adhesive of σa = 13.4 MPa (provided by Mohammed and Liechti [66]) to giveσi/σa = 0.22. Although the material systems are different, the non-dimensional result byMohammed and Liechti [66] are close to the range of the cohesive strengths measuredin Paper P5 of 0.05 < σi/σa < 0.20. This consistency leads to confidence in the novelapproach applied in the present work.
Normalization of σi by σa is equivalent to the way Cook and Gordon [18] presentedtheir modeling results based on stress. They [18] suggested that the interface strengthshould be less than about 1/3 to 1/5 of the bulk material strength in order to ensurethat a new crack initiates along the weaker interface ahead of the main crack. Althoughthe Cook and Gordon model was established for a homogenous solid, the criterion isconsistent with the experimental test results presented in Paper P5 since all measurednormalized cohesive strengths of the interfaces were below 1/5. Since crack penetrationinto the substrate was observed in test series A1, it is expected based on the Cook-Gordoncriterion that the cohesive strength of the interfaces for the specimens in test series A1 isσi/σa > 1/3.
5.4 ConclusionsAn analytical model of the displacement loaded four-point SENB test specimen wasderived and found to agree well with FE simulations. The models (analytical andnumerical) were found appropriate to design the experiment with stable crack growthsince it was found that ∂GI/∂a depends on load configuration, crack length and geometry.These models suggested that the beam should be short and thick, and the start-cracklength should be relatively deep for the main crack to propagate stable.
A model experiment of four-point SENB specimens with different interfaces, weredesigned, manufactured, and tested. The tests were successful in that crack propagationwas stable and the crack deflection at interfaces could be observed during loading (in-situ).For bi-material test specimens, it was observed that a new crack initiated at the interface.This cracking mechanism enabled determination of the cohesive strength of the interface

5.4 Conclusions 61
using a novel approach. The cohesive strength of the interfaces were found to be smallin comparison with the macroscopic strength of the adhesive and found to be consistentwith the measurements by Mohammed and Liechti [66] and the Cook-Gordon criterion[18].

62
CHAPTER 6Summary of Results and
Concluding RemarksIn this chapter, the six papers addressing the main goals of the project will be summarizedand the findings in the papers will be used to establish novel design rules for adhesivebonded joints. The outcome of the papers will be discussed in relation to the existingknowledge in the literature. To conclude, the future challenges will be discussed and afinal conclusion completes the thesis.
6.1 Summary of ResultsIn this section summaries of the six appended papers are presented. The main resultsand conclusions are highlighted, but details should be read in the full papers listed below.P1 Jeppe B. Jørgensen, Bent F. Sørensen and Casper Kildegaard. ”The effect of
residual stresses on the formation of transverse cracks in adhesive joints for windturbine blades.” Submitted to: International Journal of Solids and Structures(2017).
P2 Jeppe B. Jørgensen, Bent F. Sørensen and Casper Kildegaard. ”The effect ofbuffer-layer on the steady-state energy release rate of a tunneling crack in a windturbine blade joint”. Submitted to: Composite Structures (2017).
P3 Jeppe B. Jørgensen, Bent F. Sørensen and Casper Kildegaard. ”Tunneling cracks infull scale wind turbine blade joints”. Accepted for: Engineering Fracture Mechanics(2017).
P4 Jeppe B. Jørgensen, Casper Kildegaard and Bent F. Sørensen. ”Design of four-pointSENB specimens with stable crack growth”. Submitted to: Engineering FractureMechanics (2017).
P5 Jeppe B. Jørgensen, Bent F. Sørensen and Casper Kildegaard. ”Crack deflection atinterfaces in adhesive joints for wind turbine blades”. Submitted to: CompositesPart A: Applied Science and Manufacturing (2017).
P6 Jeppe B. Jørgensen, Michael D. Thouless, Bent F. Sørensen and Casper Kildegaard.”Determination of mode-I cohesive strength of interfaces”. In: IOP Conf. Series:Materials Science and Engineering, 139, 012024 (2016).
64 6 Summary of Results and Concluding Remarks
6.1.1 Summary of Paper P1: The effect of residual stresseson the formation of transverse cracks in adhesivejoints for wind turbine blades
An experimental approach was applied to test the effect of different parameters on theformation of transverse cracks in an adhesive joint. Transverse cracks were assumedto evolve due to a combination of mechanical- and residual stresses. A new approachwas developed that allows the residual stress to be determined in several different ways.The accuracy of different methods to measure residual stresses in the adhesive wastested on a single bi-layer/sandwich test specimen (laminate/adhesive/laminate) thatwas instrumented with strain gauges and fiber Bragg gratings (FBG). One of the methodswith FBGs was used to clarify which of the steps in the bonding process that had thelargest contribution to the residual stress.
A bi-material FE model of the sandwich specimen were developed to predict thestress in the adhesive at first crack from knowledge of fracture energy and geometry.Transverse cracking of the adhesive was investigated experimentally by manufacturingdifferent series of sandwich test specimens made of two laminates that were bonded by athick layer of structural adhesive. The sandwich specimens were tested in quasi-statictension to explore the effect of test temperature, post curing temperature and thicknessof the laminate. The effect of laminate thickness on the formation of transverse cracks inthe adhesive was also tested under cyclic loading.
Using the measured residual stress as input to the model, the predictions of thestress in the adhesive at first crack were made. The predictions were found to agree wellwith the experimental results from tensile tests of the sandwich specimens at 23C and−40C. The residual stress in the adhesive was found to contribute to the formation oftransverse cracks in the sandwich specimens, especially at low test temperatures. Thestatic tensile tests of the sandwich specimens showed that higher post curing temperatureand lower test temperature had a negative effect on the formation of transverse cracks inthe adhesive in the sense that transverse cracks initiated at lower applied mechanicalloadings. The effect of increased laminate thickness was minimal under both staticand cyclic loading. The cyclic loaded tests confirmed that the design of the sandwichspecimen was damage tolerant since multiple cracking of the adhesive developed in astable manner.
6.1.2 Summary of Paper P2: The effect of buffer-layer onthe steady-state energy release rate of a tunnelingcrack in a wind turbine blade joint
A new tri-material FE model was developed in order to design the wind turbine blade jointsuch that the energy release rate of a tunneling crack, propagating across the adhesivelayer, was reduced. Results from the tri-material FE model was found comparable withthe results of Ho and Suo [41] for the simplified case of a bi-material model. Othersimulations showed that the energy release rate of the tunneling crack could be reducedby embedding a so-called buffer-layer near the adhesive with a well-chosen stiffness and
6.1 Summary of Results 65
-thickness. It was found that the appropriate thickness of the buffer-layer depended onthe stiffness of the buffer-layer. In any case it was found advantageous to increase thestiffness of the buffer-layer in order to reduce the energy release rate of the tunnelingcrack. However, it was found for adhesive joints with properties comparable to materialsused for wind turbine blades that the laminates were already sufficiently stiff. Thus, theeffect of the buffer-layer was small in comparison with the effect of reducing the thicknessof the adhesive layer.
6.1.3 Summary of Paper P3: Tunneling cracks in full scalewind turbine blade joints
A generic tunneling crack tool was presented and used in a novel approach for theprediction of crack growth rates for tunneling cracks propagating across a bond-linein a wind turbine blade under high cyclic loadings. Inputs to the generic tool wasthe Paris law for the adhesive, the residual stresses in the adhesive, and informationabout the loadings, geometry and material properties for the adhesive joint in the blade.First, a DCB specimen was fatigue tested in the laboratory to measure Paris law for amode-I crack in the adhesive. The parameters for Paris law of the adhesive was foundcomparable to those of epoxy resin systems reported in the literature. Residual stressesin the adhesive of the joint was determined based on misfit stress that was measuredusing a curvature experiment of bi-layer specimen tested in the laboratory.
The model prediction of crack growth rates on the joint with and without residualstresses included were taken to be the upper and lower bounds, respectively. Themodel predictions by the generic tunneling crack tool was tested on a full scale windturbine blade that was loaded cyclic in an edgewise fatigue test in a laboratory. The fullscale blade, which was more than 40 meter long, was tested with cyclic loads that wassignificantly higher than standard design loads in order to propagate the tunneling cracksin the trailing-edge joint. The crack length for 27 tunneling cracks was measured on thetrailing-edge during the edgewise fatigue test. It was demonstrated that the upper- andlower bounds for the model predictions were in agreement with the measurements on thefull scale test blade.
6.1.4 Summary of Paper P4: Design of four-point SENBspecimens with stable crack growth
In order to investigate crack deflection at interfaces experimentally, it was necessary todesign a test specimen where a crack could propagate stable and orthogonal towards abi-material interface. A four-point single-edge-notch-beam (SENB) test specimen loadedby applied displacements was developed and manufactured for the purpose. In order todesign the test specimen, models were established to ensure stable crack growth and thusenable that crack deflection at the interface could be observed (in-situ) during loading. Toexplore a parameter space an analytical model was derived for the homogenous four-pointSENB specimen, and it was found that the test specimen should be short and thick andthe start-crack length relatively deep for the crack to propagate in a stable manner. The
66 6 Summary of Results and Concluding Remarks
analytical model was compared with a numerical model. The results from the numericalmodel of the bi-material four-point SENB specimen showed the same tendencies. Anexperiment with the homogenous four-point SENB specimen showed that the crack couldgrow stable if the start-crack-length was made sufficiently long and unstable if not. Thiswas in agreement with the model prediction.
6.1.5 Summary of Paper P5: Crack deflection atinterfaces in adhesive joints for wind turbine blades
Crack deflection at interfaces for different material systems was tested experimentally. Afour-point SENB specimen was manufactured by bonding two pre-cast beams of structuraladhesive. Thus, different interfaces could be prepared by varying the roughness of thesurface prior to casting. It was found that the main crack penetrated into the substrate ifthe surface of the interface was roughened, but deflected along the interface if the surfaceof the interface was smooth. The test specimens used for studying crack deflection atinterfaces were tested successfully since the crack deflection mechanism could be observedby DIC during loading (in-situ).
Other four-point SENB test specimens of different materials systems (adhesive/la-minate, adhesive/adhesive) were manufactured with different interface properties andtested experimentally. For some of the test series it was observed that a new crackinitiated at the interface before the main crack propagated and reached the interface.This cracking mechanism was used to develop a novel approach to determine the mode-Icohesive strength of the interface.
The novel approach were first presented in Paper P6, where it was demonstrated ona bi-material SENB specimen. The approach was further refined and demonstrated inPaper P5 for SENB specimens with different interface properties. The novel approachwas based on measuring the displacement field across the interface during loading usingDIC. Initially, the relative displacement across the interface increased linearly with theapplied loading, but became non-linear at the time where the new crack at the interfaceinitiated. At this time, the measured crack length and moment from the experimental testwere applied to a FE model such that the stress across the interface could be determinednumerically. Assuming that the measured non-linearity was the onset of separation (crackinitiation) then the stress across the interface were taken to be the cohesive strength ofthe interface. The method was applied to determine the mode-I cohesive strength ofdifferent bi-material interfaces. The cohesive strength of these interfaces was found to below in comparison with the macroscopic strength of the adhesive.
6.1.6 Summary of Paper P6: Determination of mode-Icohesive strength for interfaces
This is the first paper introducing the novel approach for determination of the cohesivestrength of a bi-material interface. The cohesive strength of the interface is one of thegoverning properties for crack deflection at interfaces as demonstrated by the cohesivezone models by Parmigiani and Thouless [72]. The novel approach for determination of

6.2 Discussion of Contributions and Impact 67
the cohesive strength of a bi-material interface was successfully applied and demonstratedon a four-point SENB specimen made of an adhesive that was cast onto a glass fiberlaminate. This bi-material four-point SENB specimen was tested experimentally andit was observed that a new crack initiated in the bi-material interface before the mainstarted to grow. DIC was applied to identify the onset of interface separation (crackinitiation) and, at this time, a 2D finite element model was used to determine the stressacross the interface. At the time of crack initiation, this stress can be associated withthe cohesive strength of the interface. It was found that the mode-I cohesive strengthof the tested adhesive/laminate interface was low in comparison with the macroscopicstrength of the adhesive.
6.2 Discussion of Contributions and ImpactThe results of Paper P1 in section 3.4 and section 3.5 showed that the processingparameters (e.g. post curing temperatures in Figure 3.10) used in the manufacturing ofadhesive joints are important parameters in order to control the magnitude of residualstress in the adhesive layer. These findings could also be relevant in other applications(e.g. aircrafts or cars) where the adhesive is constrained between stiffer substrates andtherefore cannot freely contract. Under cyclic loading it was shown by the results inFigure 3.11 in section 3.5.3 that the adhesive joint (sandwich specimen) was a damagetolerant component since multiple cracking of the adhesive evolved in a stable manner.Since it was found that the evolution of multiple transverse cracks in the adhesive wereslow and measurable, it is proposed to use structural health monitoring systems to detectand monitor the development of transverse cracks. FBGs could be one way to firstmeasure the residual strains (stresses) and subsequently monitor the stable developmentof multiple cracks in the adhesive.
A new tri-material FE model was used to design a structural adhesive joint againstthe propagation of a tunneling crack as demonstrated in section 4.1. For wind turbineblade specific materials the stiffness of the substrates were already sufficiently highmeaning that the effect of increasing the substrate stiffness was small. Although theeffect of embedding a buffer-layer in a wind turbine blade joint was small, the buffer-layeridea and -model could be applied to other engineering structures where the effect of abuffer-layer is more pronounced. Especially, the identification of the point of intersection(PoI) in Figure 4.4 (in section 4.1.2 for the tri-material FE model and in Paper P2) is animportant scientific contribution since it can be used to select the optimal properties ofthe buffer-layer in order reduce the risk of tunneling crack propagation in the specificapplication.
Another important scientific result is the approach and tunneling crack tool for theprediction of crack growth rates of tunneling cracks in an adhesive joint of a wind turbineblade in section 4.2 (Paper P3). The tunneling crack tool is not just limited to windturbine blade joints under cyclic loading. Basically, the approach can be adapted to othertypes of propagating fatigue cracks, where the energy release rate can be determined bya model and the inputs to the model are measurable e.g. by using lab scale experiments
68 6 Summary of Results and Concluding Remarks
to characterize the needed material properties, like demonstrated in Paper P3.As presented in chapter 5 and Paper P4, rigorous experimental studies of crack
deflection at interfaces were identified as a gap in the literature. One of the challenges,which was not addressed in the literature, was to design an experiment with stablecrack growth so that the crack deflection mechanism could be observed during loading.Four-point SENB geometries found in the literature vary significantly from test to testand no justifications for the chosen geometry were presented. An analytical model ofthe four-point SENB specimen was derived and compared with numerical models inorder to design an experiment where crack propagation towards the bi-material interfacewas stable (see e.g. Figure 5.4 in section 5.1.1). These models were comparable andfound applicable on experiments. The new results, presented in Paper P4, exploredand clarified the complexity of the problem since stable crack growth of the crack inthe four-point SENB specimen depends on the test specimen geometry, test setup andstart-crack length (section 5.1). The parameter studies presented in Paper P4 are ofsignificant scientific importance since it is difficult to design a crack deflection experimentwhere the crack grows stable and orthogonal towards a bi-material interface. Therefore,the modeling results and experimental demonstration will be valuable to others workingon crack growth experiments, particularly with experimental test of crack deflection atinterfaces.
Accurate experimental determination of cohesive strength for bi-material interfaces ischallenging, especially for material interfaces with small separations [48], and thereforenovel methodologies are desired (chapter 5). Thus, it is a valuable scientific contributionthat a novel approach to determine the mode-I cohesive strength of a bi-material interfacewere developed and presented in Paper P6 and further refined and applied in Paper P5(section 5.3). One of the advantages of the novel approach is that there is no need fora complicated calibration procedure or CZM model. Only a linear-elastic solution isrequired. Furthermore, it is not necessary to use advanced microscope equipment sincea standard four-point bend rig with a DIC camera system is the primary equipmentneeded. The new approach is not limited to the four-point SENB specimen and it couldbe applicable on other test specimens, provided the initiation of the interface crack canbe captured by DIC (or another method) and the interface stress can be accuratelydetermined using a model (e.g. FE or analytical). Therefore, this new approach couldwin popularity on other types of test specimens where it is difficult to measure thecohesive strength of the interface.
6.3 Determination of Novel Design Rules forAdhesive Bonded Joints
This section has the purpose of addressing the main scientific goal of the project that, inshort, was to develop new- and to improve the existing design rules for adhesive joints inwind turbine blades. This section is divided into design rules based on each of the threesub-projects and finally a section dedicated the three most important design rules.

6.3 Determination of Novel Design Rules for Adhesive Bonded Joints 69
6.3.1 Design Rules based on Sub-project 1In Paper P1, it was assumed that the stress in the adhesive at first crack was a com-bination of tensile residual stress and tensile mechanical stress (section 3.2). Thus, byreducing the tensile residual stress, the mechanical load to initiate the first crack in theadhesive can be increased. For the low temperature tensile tests of sandwich specimens(laminate/adhesive/laminate) in Figure 3.10, presented in section 3.5.2, the residualstresses were measured to between 8-40% of the mechanical stress in the adhesive toinitiate the first crack. Therefore, if the residual stress could be removed, e.g. in themanufacturing process, the mechanical stress can potentially be increased by up to40%. However, it would be even better to manufacture adhesive joints with compressiveresidual stresses in the adhesive since this gives room for loading the joint even further.
Based on the conclusions in Paper P1, it was found desirable to post cure at tempera-tures that are not too high in order to reduce residual stresses. If possible, low operationtemperatures should be avoided in order to keep the residual stresses small.
Beside the standard desired adhesive properties of high strength and fracture toughness,for the application on wind turbine blade joints, it is desirable that the chemical shrinkageof the adhesive and the mismatch in coefficient of thermal expansion is low since the ad-hesive is constrained in-between stiffer laminates (and are therefore not free to contract).Reducing the chemical shrinkage and the mismatch in coefficient of thermal expansion aretwo ways to reduce the residual stress in the adhesive. Lowering the chemical shrinkagemight be achievable by adding different fillers to the adhesive, but this might affectthe other material properties of the adhesive negatively. In practice for wind turbineblade joints, it might be challenging to eliminate the mismatch in coefficient of thermalexpansion since various types of layups are used in different regions of the blade.
6.3.2 Design Rules based on Sub-project 2Since it is the layer closest to the adhesive that has the main constraining effect on thetunneling crack, it was found advantageous to embed a stiff buffer-layer near the adhesive(section 4.1.2). However, the effect was small for adhesive joints with stiff substrates.The optimal properties (thickness and stiffness) of the buffer-layer can be determinedbased on the new tri-material models in Paper P2. To exemplify a design rule, takethe results in Figure 4.5 in section 4.1.2 for the adhesive joint with substrates of GlassUD with thickness h1/2h2 = 1 and include a buffer-layer of Carbon UD. By increasingthe buffer-layer thickness (starting from zero thickness), the energy release rate can bereduced until the buffer-layer thickness is about the same as the adhesive thickness i.e.h3/2h2 = 1. At this point, the energy release rate cannot be reduced much further. Thus,one applicability of the models is to determine the appropriate buffer-layer thicknessaccording to a desired energy release rate level. Furthermore, a price constraint can beincluded since adding extra material can be costly in comparison with the effect achieved.
The use of tunneling crack models for design criteria is conservative since the load topropagate a tunneling crack is lower than the load to initiate a tunneling crack accordingto the homogenous models by Ho and Suo [41]. Since the stiffness of the laminates

70 6 Summary of Results and Concluding Remarks
in a wind turbine blade joint is relatively high, the most efficient way of reducing thetunneling crack energy release rate is to decrease the thickness of the adhesive layer.
It was demonstrated in Paper P3 that for an edgewise full scale blade test withload R-ratio of R = −1, residual stresses increased the R-ratio in the adhesive in anundesirable manner (to R > 0) and enhanced the crack growth rates of the tunnelingcracks, see also section 4.2.2. In this perspective, elimination of residual stress in theadhesive is advantageous in order to reduce the crack growth rates for the tunnelingcracks. This is particularly important since the measured slope of the Paris law curve ofthe adhesive, presented in Figure 4.8, is relatively steep meaning that small variations ofthe loadings give large variations of the crack growth rates (section 4.2.2).
6.3.3 Design Rules based on Sub-project 3The cohesive strength is one of the governing properties for crack deflection at interfaces[72, 13]. The cohesive zone modeling results for crack deflection by Parmigiani andThouless [72] were found consistent with the stress based Cook-Gordon criterion [18] (ifinterface-to-substrate toughness ratio was a constant of one). The Cook-Gordon criterionstates that the interface will fail if the interface strength is less than about 1/3 to 1/5of the bulk material strength. Although, the Cook-Gordon criterion was established bystress analysis of a homogenous solid, the criterion is consistent with the experimentaltest results presented in Paper P5 and Paper P6 since all measured normalized cohesivestrengths of the interfaces were below 1/5. Therefore, it is judged that the Cook-Gordoncriterion can be used as a good approximation for the prediction of crack deflection atinterfaces. Although, it is a rather simple design rule, the experimental test results inPaper P5 and Paper P6 (and section 5.3.1) indicate that it can be applied with sufficientlyaccuracy in practice.
6.3.4 Main Design RulesBased on the present work, the three most important design rules for adhesive bondedjoints are identified to be:
• Sub project 1: Eliminate residual stresses - this can potentially enhance the stressin the adhesive at first crack by up to 40% based on the experimental tensile testsof the sandwich specimens.• Sub project 2: Reduce the thickness of the adhesive layer since the energy release
rate of a tunneling crack in the adhesive is proportional to the adhesive thickness.• Sub project 3: Ensure that the cohesive strength of the interface is less than 1/5 of
the cohesive strength of the bulk material (or substrate) for the crack to deflect atthe interface.
6.4 Future Work and Challenges for Adhesive Joints in Wind Turbine Blades 71
6.4 Future Work and Challenges for AdhesiveJoints in Wind Turbine Blades
Although the PhD project has contributed to the research within adhesive joints forwind turbine blades, there are still many challenges to face in the future. This section isdedicated a discussion about the future challenges based on the findings in the presentwork and the gaps identified in the state of the art literature.
The adhesive materials used in the present work were analyzed by different testmethods, but further material related challenges for adhesive bonded joints in windturbine blades exists. The small scale test specimens used in the present work weremanufactured under process conditions in the laboratory that were different from themanufacturing of a full scale wind turbine blade.
Temperature was found to be an important parameter affecting the properties ofthe adhesive. This was demonstrated by the tensile tests of the sandwich specimens(laminate/adhesive/laminate) where the results were presented in Figure 3.9 and Figure3.10 in section 3.5.2. It was found that the approach in Figure 3.2 could predict the stressin the adhesive at first crack at temperatures of 23C and −40C relatively accurate (seeFigure 3.9) if the input parameters were measured at the same temperatures. A relevantextension of this study could explore the effect of elevated test temperatures e.g. 40C.This would require to measure KIC , E2 and ν2 for the adhesive at similar temperatures.
Another complicating factor is the time dependency of the adhesive (stress relaxation,creep, visco-elasticity). These effects might be present in the real application, but theywere assumed to be negligible in the modeling (section 2.2). Therefore, it would berelevant to look further into the time dependency of the adhesive i.a. since this will affectthe residual stresses in the adhesive.
In the present work residual stresses were measured on adhesive test specimens thatwere tested within a few weeks after manufacturing whereas typical wind turbine bladesin the field operate in harsh conditions for more than 20 years. Since the life time ofwind turbine blades is more than 20 years, the effect of creep and stress relaxation ofthe adhesive might be significant and thus reduce the residual stress magnitude in theadhesive of a full scale blade. Therefore, the problem of residual stresses might be smallerin reality than what was measured on the test specimens in the laboratory. A futurestudy could investigate the contradictory effects of residual stresses and the level of creepover time. This could possibly be tested using the bi-layer specimen (e.g. with FBGs)where the curvature over time could be measured and compared with creep experiments.The measurements could be supported by visco-elastic models. Another material relatedchallenge is the effect of residual stresses on the R-ratio and on the parameters in Parislaw, which is not well documented in the literature for polymeric materials. Furtherunderstanding and testing of adhesives loaded cyclic by different R-ratio and residualstress levels are proposed as a future study.
The tunneling crack tool, in combination with the approach presented in Paper P3and Figure 4.7, can predict crack growth rates for tunneling cracks in a trailing-edge jointof a wind turbine blade within acceptable accuracy, see Figure 4.9 in section 4.2.2. The

72 6 Summary of Results and Concluding Remarks
tunneling crack tool could be extended to account for delamination during the tunnelingprocess [17, 97, 98], to handle gel coat channeling cracks in wind turbine blade surfacesduring cyclic loading [116], or be applied on tunneling cracks in grid-scored balsa/foampanels used in wind turbine blades, where the crack tunnels through the resin filledgrid-scores [55]. The range of proposed applications are broad.
In Paper P5 and Paper P6, a novel approach was presented to determine the cohesivestrength of a bi-material interface. The approach were summarized in section 5.3.Alternatively, the cohesive strength could be determined with environmental scanning-electron microscopy (ESEM) using a J-integral based approach [27]. A benchmark ofthese two distinct approaches is proposed as a future study to evaluate the accuracy ofthe methods. The geometry of the four-point SENB specimen, used to determine thecohesive strength, could be changed by machining an elliptical-shaped notch instead of asharp start crack. The advantage of the geometry with an elliptical-shaped notch is thatthe stress concentration factor would be known, and it will be harder for the main crackto start propagating. This might simplify the analysis.
During this PhD project, novel approaches were developed and their applicability onadhesive joints for wind turbine blades were tested experimentally in order to establishnovel design rules. In Paper P3 the approach were tested and compared with actualmeasurements from a full scale blade fatigue test. The approaches developed in the otherpapers were primarily compared with lab scale experiments. Generally, these approachesshould be compared with tests on full scale blades since this is an important step towardsintegration of the design rules into the current joint design package. Furthermore, theprocess related design rules needs to be tested in a real production environment beforethey can be implemented in the manufacturing technology such that the advantages ofthese design rules can be fully utilized.
6.5 ConclusionBased on residual stress measurements and experimental tensile tests of adhesive bondedjoints, it was found that residual stresses were of relative significant magnitude, primarilyat low temperatures. The cyclic loaded tests confirmed that the design of the adhesivejoint was damage tolerant since multiple cracking of the adhesive evolved in a stablemanner. Using a new tunneling crack tool (approach) and accounting for the residualstresses in the adhesive, crack growth rates predicted for tunneling cracks in a trailing-edge joint were found to agree well with crack growth rates measured on a full scale bladetested with high cyclic loadings. By applying a novel approach, the cohesive strengthmeasured for a number of model interfaces, were found to be low in comparison withthe macroscopic strength of the adhesive. These experimental results were found to beconsistent with the Cook-Gordon criterion for crack deflection.
The experimental-, analytical- and numerical results can, in combination with thenovel approaches, be used to improve the current design methods for adhesive joints.Thus, the design limits for adhesive joints in wind turbine blades can, safely, be pushedcloser towards the actual structural limits.
Bibliography[1] M. Alam, B. Grimm, and J. P. Parmigiani. “Effect of incident angle on crack pro-
pagation at interfaces”. In: Engineering Fracture Mechanics 162 (2016), pages 155–163.
[2] M. Alam and J. P. Parmigiani. “Crack propagation at bi-material interfaces”. In:Proc. Appl. Math. Mech. Volume 15. 2015, pages 143–144. doi: 10.1002/pamm.201510062.
[3] C. Aliá et al. “Influence of post-curing temperature on the structure, properties,and adhesion of vinyl ester adhesive”. In: Journal of Adhesion Science and Techno-logy 29.6 (2015), pages 518–531. issn: 15685616. doi: 10.1080/01694243.2014.995910.
[4] J. M. Ambrico and M. R. Begley. “The role of initial flaw size, elastic complianceand plasticity in channel cracking of thin films”. In: Thin Solid Films 419 (2002),pages 144–153. issn: 00406090. doi: 10.1016/S0040-6090(02)00718-6.
[5] J. Ambrose. World’s largest wind turbines may double in size before 2024. 2017.[6] J. Andersons, P. H. M. Timmermans, and J. Modniks. “Mechanics of tunnelling
cracks in trilayer elastic materials in tension”. In: International Journal of Fracture148.3 (April 2008), pages 233–241. issn: 0376-9429. doi: 10.1007/s10704-008-9197-3.
[7] T. Andersson and U. Stigh. “The stress-elongation relation for an adhesive layerloaded in peel using equilibrium of energetic forces”. In: International Journal ofSolids and Structures 41.2 (2004), pages 413–434. issn: 00207683. doi: 10.1016/j.ijsolstr.2003.09.039.
[8] Scott Bader. Crystic Composites Handbook. Technical report. Wollaston, UK,2005, pages 1–90.
[9] H. G. Beom and H. S. Jang. “Effect of elastic constants on crack channeling in a thinfilm bonded to an orthotropic substrate”. In: Archive of Applied Mechanics 83.11(2013), pages 1577–1589. issn: 0939-1533. doi: 10.1007/s00419-013-0766-1.
[10] H. G. Beom, X. R. Zhuo, and C. B. Cui. “Tunneling cracks in the adhesive layerof an orthotropic sandwich structure”. In: International Journal of EngineeringScience 63 (February 2013), pages 40–51. issn: 00207225. doi: 10 . 1016 / j .ijengsci.2012.11.001.
[11] J. L. Beuth. “Cracking of thin bonded films in residual tension”. In: Int. J. SolidStructures 2.13 (1992), pages 1657–1675.
74 Bibliography
[12] A. Boonyapookana, K. Nagata, and Y. Mutoh. “Fatigue crack growth behaviorof silica particulate reinforced epoxy resin composite”. In: Composites Scienceand Technology 71.8 (2011), pages 1124–1131. issn: 02663538. doi: 10.1016/j.compscitech.2011.02.015.
[13] S. Brinckmann, B. Völker, and G. Dehm. “Crack deflection in multi-layered four-point bending samples”. In: International Journal of Fracture 190.1-2 (2014),pages 167–176. issn: 15732673. doi: 10.1007/s10704-014-9981-1.
[14] E. N. Brown, S. R. White, and N. R. Sottos. “Fatigue crack propagation inmicrocapsule-toughened epoxy”. In: Journal of Materials Science 41.19 (2006),pages 6266–6273. issn: 00222461. doi: 10.1007/s10853-006-0512-y.
[15] R. J. C. Carbas, E. A. S. Marques, and L. F. M. da Silva. “Effect of CureTemperature on the Glass Transition Temperature and Mechanical Properties ofEpoxy Adhesives”. In: The Journal of Adhesion 90 (2014), pages 104–119. doi:10.1080/00218464.2013.779559.
[16] R. J. C. Carbas et al. “Effect of post-cure on the glass transition temperatureand mechanical properties of epoxy adhesives.” In: Journal of Adhesion Science& Technology 27.23 (2013), pages 2542–2557. issn: 01694243. doi: 10.1080/01694243.2013.790294.
[17] K. S. Chan, M. Y. He, and J. W. Hutchinson. “Cracking and stress redistributionin ceramic layered composites”. In: Materials Science and Engineering A167(1993), pages 57–64.
[18] J. Cook et al. “A mechanism for the control of crack propagation in all-brittlesystems”. In: Mathematical and Physical Sciences 282.1391 (1964), pages 508–520.
[19] C. A. Crawford. “The Path from Functional to Detailed Design of a Coning RotorWind Turbine Concept”. In: Proceedings of the Canadian Engineering EducationAssociation (2011), pages 1–10. doi: 10.24908/pceea.v0i0.3768.
[20] J. Dundurs. “Edge-Bonded Dissimilar Orthogonal Elastic Wedges Under Normaland Shear Loading”. In: Journal of Applied Mechanics (1969), pages 650–652.
[21] J. Dundurs. “Effect of elastic constants on stress in a composite under planedeformation”. In: Journal of Composite Materials 1 (1967), pages 310–322. issn:00137944. doi: 10.1177/002199836700100306.
[22] M. A. Eder and R. D. Bitsche. “Fracture Analysis of Adhesive Joints in WindTurbine Blades”. In: Wind Energy 00 (2012), pages 1–18. doi: 10.1002/we.
[23] A. G. Evans and J. W. Hutchinson. “The Thermomechanical Integrity of ThinFilms and Multilayers”. In: Acta metall. mater. 43.7 (1995), pages 2507–2530.
[24] S. Fenster and A. Ugural. Advanced Strength and Applied Elasticity. 4th. UpperSaddle River, New Jersey: Prentice Hall, 2003, pages 1–545. isbn: 0-13-047392-8.
Bibliography 75
[25] G. Fernandez, H. Usabiaga, and D. Vandepitte. “Subcomponent development forsandwich composite wind turbine blade bonded joints analysis”. In: CompositeStructures 180 (2017), pages 41–62. issn: 02638223. doi: 10.1016/j.compstruct.2017.07.098.
[26] M. Goland and E. Reissner. “The Stresses in Cemented Joints”. In: Journal ofApplied Mechanics 11 (1944), pages 17–27.
[27] S. Goutianos et al. “Effect of Processing Conditions on Fracture Resistance andCohesive Laws of Binderfree All-Cellulose Composites”. In: Applied CompositeMaterials 21.6 (2014), pages 805–825. issn: 0929189X. doi: 10.1007/s10443-013-9381-0.
[28] A. A. Griffith. “The phenomena of Rupture and Flow in solids”. In: Royal Soc. ofLondon 221 (A 587 (1920), pages 163–198.
[29] M. Grujicic et al. “Multidisciplinary design optimization for glass-fiber epoxy-matrix composite 5 MW horizontal-axis wind-turbine blades”. In: Journal of Ma-terials Engineering and Performance 19.8 (2010), pages 1116–1127. issn: 10599495.doi: 10.1007/s11665-010-9596-2.
[30] V. Gupta, A. S. Argon, and Z. Suo. “Crack Deflection at an Interface Between TwoOrthotropic Media”. In: Journal of Applied Mechanics 59 (1992), pages 79–87.
[31] V. Gupta, J. Yuan, and D. Martinez. “Calculation, measurements, and control ofinterface strength in composites”. In: J. Am. Ceram. Soc 76.2 (1993), pages 305–315.
[32] J. Z. Hansen. “The effects of fibre architecture on fatigue life-time of compositematerials”. PhD thesis. Technical University of Denmark. Dept. of Wind Energy,2013. isbn: 9788792896483.
[33] L. J. Hart-Smith. Adhesive bonded double-lap Joints. Technical report. 1973,pages 1–106.
[34] L. J. Hart-Smith. “Adhesive Bonded Joints for Composites - Phenomenologi-cal Considerations”. In: Conference on Advanced Composites Technology. 1978,pages 1–18.
[35] L. J. Hart-Smith. Adhesive bonded single lap joints. Technical report. 1973, pages 1–104.
[36] L. J. Hart-Smith. “Further Developments in Design and Analysis of Adhesive-Bonded Structural Joints”. In: ASTM Symposium on Joining of Composite Mate-rials. 1980, pages 1–26.
[37] B. Hayman, J. Wedel-Heinen, and P. Brøndsted. “Materials Challenges in Presentand Future Wind Energy”. In: MRS Bulletin 33.04 (2008), pages 343–353. issn:1938-1425. doi: 10.1557/mrs2008.70.

76 Bibliography
[38] M. Y. He, A. G. Evans, and J. W. Hutchinson. “Crack deflection at an interfacebetween dissimilar elastic materials: Role of residual stresses”. In: InternationalJournal of Solids and Structures 31.24 (December 1994), pages 3443–3455. issn:00207683. doi: 10.1016/0020-7683(94)90025-6.
[39] M. Y. He and J. W. Hutchinson. “Crack deflection at an interface betweendissimilar elastic materials”. In: Int. J. Solid Structures 25.9 (1989), pages 1053–1067.
[40] M. Y. He and J. W. Hutchinson. “Kinking of a crack out of an interface”. In:Journal of Applied Mechanics 111 (1989).
[41] S. Ho and Z. Suo. “Tunneling cracks in constrained layers”. In: J. Appl. Mech 60(1993), pages 890–894.
[42] J. W. Hutchinson. “Fundamentals of the Phenomenological Theory of NonlinearFracture Mechanics”. In: Journal of Applied Mechanics 50.4 (1983), pages 1042–1051. issn: 0021-8936. doi: 10.1115/1.3167187.
[43] J. W. Hutchinson and Z. Suo. “Mixed Mode Cracking in Layered Materials”. In:Advances in Applied Mechanics 29 (1992), pages 63–191.
[44] G. Irwin. “Linear fracture mechanics, fracture transition, and fracture control”.In: Engineering Fracture Mechanics 1.2 (1968), pages 241–257. issn: 00137944.doi: 10.1016/0013-7944(68)90001-5.
[45] G. Irwin and D. Washington. “Analysis of Stresses and Strains Near the Endof a Crack Traversing a Plate”. In: Journal of Applied Mechanics 24 (1957),pages 361–364.
[46] ITW Plexus. Plexus Guide To Bonding of Plastics, Composites and Metals. Techni-cal report. ITW Plexus, 2017, pages 1–46.
[47] K. K. Jin et al. “International Conferences on Composite Materials”. In: LifePrediction of Wind Turbine Blades. 2009, pages 1–12.
[48] R. K. Joki et al. “Determination of a cohesive law for delamination modelling -Accounting for variation in crack opening and stress state across the test specimenwidth”. In: Composites Science and Technology 128 (2016), pages 49–57. issn:02663538. doi: 10.1016/j.compscitech.2016.01.026.
[49] J. B. Jørgensen et al. “Determination of mode-I cohesive strength for interfaces”. In:IOP Conference Series: Materials Science and Engineering 139 (2016), pages 267–274. issn: 1757-8981. doi: 10.1088/1757-899X/139/1/012025.
[50] C. Kanchanomai and A. Thammaruechuc. “Effects of stress ratio on fatigue crackgrowth of thermoset epoxy resin”. In: Polymer Degradation and Stability 94.10(2009), pages 1772–1778. issn: 01413910. doi: 10.1016/j.polymdegradstab.2009.06.012.
[51] K. B. Katnam et al. “Composite Repair in Wind Turbine Blades: An Overview”.In: The Journal of Adhesion 91.1-2 (2014), pages 113–139. issn: 0021-8464. doi:10.1080/00218464.2014.900449.
Bibliography 77
[52] C. Kong et al. “Investigation of fatigue life for a medium scale composite windturbine blade”. In: International Journal of Fatigue 28.10 SPEC. ISS. (2006),pages 1382–1388. issn: 01421123. doi: 10.1016/j.ijfatigue.2006.02.034.
[53] M. H. Kothmann et al. “Fatigue crack propagation behaviour of epoxy resinsmodified with silica-nanoparticles”. In: Polymer (United Kingdom) 60 (2015),pages 157–163. issn: 00323861. doi: 10.1016/j.polymer.2015.01.036.
[54] S. Krohn, P. E. Morthorst, and S. Awerbuch. The Economics of Wind Energy.Technical report 6-7. 2012, pages 714–728. doi: 10.1016/j.renene.2014.01.017.
[55] S. Laustsen et al. “Development of a high-fidelity experimental substructure testrig for grid-scored sandwich panels in wind turbine blades”. In: Strain 50.2 (2014),pages 111–131. issn: 14751305. doi: 10.1111/str.12072.
[56] P. Lava and D. Debruyne. “Practical considerations in DIC measurements Mat-chID : new spin-off company of KULeuven”. In: Practical considerations in DICmeasurements. Edinburgh, 2015, pages 1–79.
[57] W. Lee and W. J. Clegg. “The Deflection of Cracks at Interfaces”. In: KeyEngineering Materials 116-117 (1996), pages 193–208. issn: 10139826. doi: 10.4028/www.scientific.net/KEM.132-136.1886.
[58] M. Leong et al. “Fatigue failure of sandwich beams with face sheet wrinkledefects”. In: Composites Science and Technology 72.13 (2012), pages 1539–1547.issn: 02663538. doi: 10.1016/j.compscitech.2012.06.001.
[59] V. C. Li and R. J. Ward. “A novel testing technique for post peak tensile behaviourof cementitious materials”. In: Fracture Toughness and Fracture Energy. Editedby Mihashi et a. (eds). 1989, pages 183–195. isbn: 9061919886.
[60] X. Liu et al. “Dynamic Response Analysis of the Blade of Horizontal Axis WindTurbines”. In: Journal of Mechanical Engineering 46.12 (2010), page 128. issn:0577-6686. doi: 10.3901/JME.2010.12.128.
[61] E. Loth et al. “Downwind pre-aligned rotors for extreme-scale wind turbines”. In:Wind Energy 20 (2017), pages 1241–1259.
[62] D. Martinez and V. Gupta. “Energy Criterion for Crack Deflection at an Inter-face Between Two Orthotropic Media”. In: J. Mech. Phys. Solids 42.8 (1994),pages 1247–1271.
[63] R. E. McDermott, R. J. Mikulak, and M. R. Beauregard. The Basics of FMEA.Second edi. New York: CRC Press, 2008, pages 1–91. isbn: 9781563273773.
[64] G. Meneghetti, M. Quaresimin, and M. Ricotta. “Life prediction for bonded jointsin composite material based on actual fatigue damage”. In: Advances in structuraladhesive bonding. Edited by David A. Dillard. Cambirdge: Woodhead PublishingLimited, 2010. Chapter 12, pages 316–349. isbn: 978-1-84569-435-7.
78 Bibliography
[65] L. P. Mikkelsen. “A simplified model predicting the weight of the load carryingbeam in a wind turbine blade”. In: IOP Conference Series: Materials Scienceand Engineering 139 (2016), pages 1–8. issn: 1757-8981. doi: 10.1088/1757-899X/139/1/012038.
[66] I. Mohammed and K. M. Liechti. “Cohesive zone modeling of crack nucleation atbimaterial corners”. In: Journal of the Mechanics and Physics of Solids 48.4 (April2000), pages 735–764. issn: 00225096. doi: 10.1016/S0022-5096(99)00052-6.
[67] J. A. Nairn. “Energy release rate analysis for adhesive and laminate double cantile-ver beam specimens emphasizing the effect of residual stresses”. In: InternationalJournal of Adhesion and Adhesives 20 (1999), pages 59–70.
[68] T. Nakamura and S. M. Kamath. “Three-dimensional effects in thin film fracturemechanics”. In: Mechanics of Materials 13.1 (March 1992), pages 67–77. issn:01676636. doi: 10.1016/0167-6636(92)90037-E.
[69] P. C. Paris and F. Erdogan. “A Critical Analysis of Crack Propagation Laws”. In:Journal of Basic Engineering 85.4 (1963), pages 528–534.
[70] J. P. Parmigiani. “Delamination and deflection at interfaces”. PhD thesis. Univer-sity of Michigan, 2006, pages 1–129.
[71] J. P. Parmigiani and M. D. Thouless. “The effects of cohesive strength andtoughness on mixed-mode delamination of beam-like geometries”. In: EngineeringFracture Mechanics 74.17 (November 2007), pages 2675–2699. issn: 00137944.doi: 10.1016/j.engfracmech.2007.02.005.
[72] J. P. Parmigiani and M. D. Thouless. “The roles of toughness and cohesivestrength on crack deflection at interfaces”. In: Journal of the Mechanics andPhysics of Solids 54.2 (February 2006), pages 266–287. issn: 00225096. doi:10.1016/j.jmps.2005.09.002.
[73] J. A. Pascoe, R. C. Alderliesten, and R. Benedictus. “Methods for the predictionof fatigue delamination growth in composites and adhesive bonds - A criticalreview”. In: Engineering Fracture Mechanics 112-113 (2013), pages 72–96. issn:00137944. doi: 10.1016/j.engfracmech.2013.10.003.
[74] F. Pierron. Metrology and uncertainty quantification in DIC. Technical report.Southampton: University of Southampton, 2015.
[75] M. Quaresimin. “Modelling the fatigue behaviour of bonded joints in compositematerials”. In: Multi-Scale Modelling of Composite Material Systems. Edited by C.Soutis and P. W. R. Beaumont. Cambridge: Woodhead Publishing Limited, 2005.Chapter 16, pages 469–494. isbn: 9781855739369. doi: 10.1533/9781845690847.469.
[76] P. Reu. “All about speckles: Contrast”. In: Experimental Techniques 39.1 (2015),pages 1–2. issn: 17471567. doi: 10.1111/ext.12126.
[77] P. Reu. “All about speckles: Speckle density”. In: Experimental Techniques 39.3(2015), pages 1–2. issn: 17471567. doi: 10.1111/ext.12161.
Bibliography 79
[78] P. Reu. “Points on Paint”. In: Experimental Techniques 39.4 (2015), pages 1–2.issn: 0732-8818. doi: 10.1111/ext.12147.
[79] P. Reu. “Speckles and their relationship to the digital camera”. In: ExperimentalTechniques 38.4 (2014), pages 1–2. issn: 1747-1567. doi: 10.1111/ext.12105.
[80] P. Reu. “Stereo-rig design: Camera selection-part 2”. In: Experimental Techniques36.6 (2012), pages 3–4. issn: 07328818. doi: 10.1111/j.1747-1567.2012.00872.x.
[81] P. Reu. “Stereo-rig design: Lens selection - Part 3”. In: Experimental Techniques37.1 (2013), pages 1–3. issn: 07328818. doi: 10.1111/ext.12000.
[82] P. Reu. “Stereo-rig design: Lighting - Part 5”. In: Experimental Techniques 37.3(2013), pages 1–2. issn: 07328818. doi: 10.1111/ext.12020.
[83] D. Salimi-Majd, V. Azimzadeh, and B. Mohammadi. “Loading Analysis of Com-posite Wind Turbine Blade for Fatigue Life Prediction of Adhesively BondedRoot Joint”. In: Applied Composite Materials 22.3 (2014), pages 269–287. issn:0929189X. doi: 10.1007/s10443-014-9405-4.
[84] S. M. M. Slütter. Crack formation of adhesive bonded joints in wind turbine blades.Technical report. Aeronautical Engineering of Inholland University of AppliedSciences at Delft, 2013, pages 1–164. doi: http://www.royalcommission.vic.gov.au/finaldocuments/summary/PF/VBRC_Summary_PF.pdf.
[85] H. Söker. “Loads on wind turbine blades”. In: Advances in Wind Turbine BladeDesign and Materials. 2013, pages 29–58. isbn: 9780857094261. doi: 10.1533/9780857097286.1.29.
[86] Correlated Solutions. Vic-2D Reference Manual. Technical report. CorrelatedSolutions, 2009, pages 1–58.
[87] B. F. Sørensen, S. Goutianos, and T. K. Jacobsen. “Strength scaling of adhesivejoints in polymer matrix composites”. In: International Journal of Solids andStructures 46 (February 2009), pages 741–761. issn: 00207683. doi: 10.1016/j.ijsolstr.2008.09.024. url: http://linkinghub.elsevier.com/retrieve/pii/S0020768308003971.
[88] B. F. Sørensen and T. K. Jacobsen. “Large-scale bridging in composites: R-curvesand bridging laws”. In: Composites Part A: Applied Science and Manufacturing 29(1998), pages 1443–1451. issn: 1359835X. doi: 10.1016/S1359-835X(98)00025-6.
[89] B. F. Sørensen et al. “A general mixed mode fracture mechanics test specimen :The DCB-specimen loaded with uneven bending moments”. In: Int J Fract 141(2006), pages 163–176.
[90] B. F. Sørensen et al. “Blade materials, testing methods and structural design”.In: Wind Power Generation and Wind Turbine Design. Edited by Wei Tong.Volume 44. Boston: WIT Press, 2010. Chapter 13, pages 417–460. isbn: 978-1-84564-205-1. doi: 10.2495/978-1-84564-.

80 Bibliography
[91] B. F. Sørensen et al. “From interface laws to composite behaviour”. In: InterfaceDesign of Polymer Matrix Composites – Mechanics, Chemistry, Modelling andManufacturing. Risø, 2007, pages 55–74.
[92] B. F. Sørensen et al. Improved design for large wind turbine blades of fibrecomposites (Phase 3) Summary report. Technical report June. 2009, pages 1–30.
[93] B. F. Sørensen et al. “Strength and failure modes of ceramic multilayers”. In:Journal of the European Ceramic Society 32.16 (2012), pages 4165–4176. issn:09552219. doi: 10.1016/j.jeurceramsoc.2012.06.012.
[94] IJ. J. van Straalen et al. “Structural adhesive bonded joints in engineering–draftingdesign rules”. In: International Journal of Adhesion and Adhesives 18 (1998),pages 41–49. issn: 01437496. doi: 10.1016/S0143-7496(97)00068-7.
[95] J. L. Strom and J. P. Parmigiani. “Transition of crack path at bi-material interfa-ces”. In: Engineering Fracture Mechanics 115 (2014), pages 13–21. issn: 00137944.doi: 10.1016/j.engfracmech.2013.11.015.
[96] T. Suga, G. Elssner, and S. Schmauder. “Composite Parameters and MechanicalCompatibility of Material Joints”. In: Journal of Composite Materials 22.10 (1988),pages 917–934. issn: 0021-9983. doi: 10.1177/002199838802201002.
[97] A. S. J. Suiker and N. A. Fleck. “Crack tunneling and plane-strain delaminationin layered solids”. In: International Journal of Fracture 125.1 (January 2004),pages 1–32. issn: 0376-9429. doi: 10.1023/B:FRAC.0000021064.52949.e2.
[98] A. S. J. Suiker and N. A. Fleck. “Modelling of fatigue crack tunneling anddelamination in layered composites”. In: Composites Part A: Applied Scienceand Manufacturing 37.10 (October 2006), pages 1722–1733. issn: 1359835X. doi:10.1016/j.compositesa.2005.09.006.
[99] Z. Suo. “Delamination specimens for orthotropic materials”. In: Journal of AppliedMechanics 57 (1990), pages 627–634.
[100] Z. Suo. “Failure of brittle adhesive joints”. In: Appl. Mech. Rev. 43.5 (1990),pages 275–279.
[101] Z. Suo and J. W. Hutchinson. “Interface crack between two elastic layers”. In:International Journal of Fracture 43 (1990), pages 1–18.
[102] Z. Suo et al. “Orthotropy rescaling and implications for fracture in composites”.In: Int. J. Solid Structures 28.2 (1991), pages 235–248.
[103] M. A. Sutton, J.J. Orteu, and H. W. Schreier. Image Correlation for Shape, Motionand Deformation Measurements. Volume 1. Springer, 2009. isbn: 9788578110796.doi: 10.1017/CBO9781107415324.004. arXiv: arXiv:1011.1669v3.
[104] H. Tada, P. C. Paris, and G. R. Irwin. The Stress Analysis of Cracks Handbook.Third. Volume 3. New York: ASME Press, 2000, pages 1–677.
[105] M. D. Thouless. “Crack Spacing in Brittle Films on Elastic Substrates”. In: J.Am. Ceram. Soc. 73.7 (1990), pages 2144–46.
Bibliography 81
[106] M. D. Thouless, H. C. Cao, and P. A. Mataga. “Delamination from surface cracksin composite materials”. In: Journal of Materials Science 24 (1989), pages 1406–1412.
[107] T. Y. Tsui, A. J. McKerrow, and J. J. Vlassak. “Constraint Effects on ThinFilm Channel Cracking Behavior”. In: Journal of Materials Research 20 (2005),pages 2266–2273. issn: 0884-2914. doi: 10.1557/jmr.2005.0317.
[108] J. J. Vlassak. “Channel cracking in thin films on substrates of finite thickness”.In: International Journal of Fracture 119/120.1979 (2003), pages 299–323. issn:0376-9429. doi: 10.1023/A:1024962825938.
[109] O. Volkersen. “Nietkraftverteiligung in zugbeanspruchten nietverbindungen mitkonstanten Laschenquerschnitten”. In: Luftfahrtforschung (1938), pages 15–41.
[110] P. J. Withers and H. K. D. H. Bhadeshia. “Residual stress part 1 - Measurementtechniques”. In: Materials Science and Technology 17.4 (2001), pages 355–365.issn: 02670836. doi: 10.1179/026708301101509980.
[111] Z. C. Xia and J. W. Hutchinson. “Crack patterns in thin films”. In: Journal ofthe Mechanics and Physics of Solids 48 (2000), pages 1107–1131.
[112] J. Yang et al. “Structural investigation of composite wind turbine blade consideringstructural collapse in full-scale static tests”. In: Composite Structures 97 (2013),pages 15–29. issn: 02638223. doi: 10.1016/j.compstruct.2012.10.055.
[113] Q. D. Yang and M. D. Thouless. “Mixed-mode fracture analyses of plastically-deforming adhesive joints”. In: International Journal of Fracture 110.2 (2001),pages 175–187. issn: 03769429. doi: 10.1023/A:1010869706996.
[114] Q. D. Yang, M. D. Thouless, and S. M. Ward. “Numerical Simulations ofAdhesively-bonded Beams Failing with Extensive Plastic Deformation”. In: Jour-nal of the Mechanics and Physics of Solids 47 (1999), pages 1337–1353.
[115] T. Yang, Y. Liu, and J. Wang. “A study of the propagation of an embedded crackin a composite laminate of finite thickness”. In: Composite Structures 59.4 (March2003), pages 473–479. issn: 02638223. doi: 10.1016/S0263-8223(02)00284-2.
[116] H. Zhang and J. Jackman. “Feasibility of Automatic Detection of Surface Cracksin Wind Turbine Blades”. In: Wind Engineering 38.6 (2014), pages 575–586.
[117] J. Zhang and J. J. Lewandowski. “Delamination study using four-point bendingof bilayers”. In: Journal of Materials Science 32.14 (1997), pages 3851–3856. issn:00222461.
[118] Y. Zhang, R. D. Adams, and L. F. M. da Silva. “Effects of curing cycle andthermal history on the glass transition temperature of adhesives”. In: Journal ofAdhesion 90.4 (2014), pages 327–345. issn: 00218464. doi: 10.1080/00218464.2013.795116.

82
APPENDIX AAppended papers
List of appended papers in the thesis:P1 Jeppe B. Jørgensen, Bent F. Sørensen and Casper Kildegaard. ”The effect of
residual stresses on the formation of transverse cracks in adhesive joints for windturbine blades.” Submitted to: International Journal of Solids and Structures(2017).
P2 Jeppe B. Jørgensen, Bent F. Sørensen and Casper Kildegaard. ”The effect ofbuffer-layer on the steady-state energy release rate of a tunneling crack in a windturbine blade joint”. Submitted to: Composite Structures (2017).
P3 Jeppe B. Jørgensen, Bent F. Sørensen and Casper Kildegaard. ”Tunneling cracks infull scale wind turbine blade joints”. Accepted for: Engineering Fracture Mechanics(2017).
P4 Jeppe B. Jørgensen, Casper Kildegaard and Bent F. Sørensen. ”Design of four-pointSENB specimens with stable crack growth”. Submitted to: Engineering FractureMechanics (2017).
P5 Jeppe B. Jørgensen, Bent F. Sørensen and Casper Kildegaard. ”Crack deflection atinterfaces in adhesive joints for wind turbine blades”. Submitted to: CompositesPart A: Applied Science and Manufacturing (2017).
P6 Jeppe B. Jørgensen, Michael D. Thouless, Bent F. Sørensen and Casper Kildegaard.”Determination of mode-I cohesive strength of interfaces”. In: IOP Conf. Series:Materials Science and Engineering, 139, 012024 (2016).

APPENDED PAPERP1
The effect of residual stresses on theformation of transverse cracks in adhesive
joints for wind turbine blades
Jeppe B. Jørgensen, Bent F. Sørensen and Casper KildegaardInternational Journal of Solids and StructuresSubmitted, 2017
The effect of residual stresses on the formation of transverse cracks inadhesive joints for wind turbine blades
Jeppe B. Jørgensena,b,∗, Bent F. Sørensenb, Casper Kildegaarda
aLM Wind Power, Østre Alle 1, 6640 Lunderskov, Denmark.bThe Technical University of Denmark, Dept. of Wind Energy, Frederiksborgvej 399, 4000 Roskilde, Denmark.
Abstract
Transverse cracks in adhesive bonded joints evolve typically due to a combination of mechanical- and
residual stresses. In this paper, a new approach that allows the residual stress to be determined in
several different ways is presented. The residual stress measurements were used in combination with a
novel bi-material model to predict the stress at first transverse crack in the adhesive layer of a sandwich
specimen (laminate/adhesive/laminate).
The model prediction was consistent with measurements from quasi-static tensile tests of the sand-
wich specimens. These experimental results showed that higher post curing temperature and lower
test temperature had a negative effect on the formation of transverse cracks in the adhesive layer i.e.
residual stresses were higher and transverse cracks initiated at lower applied mechanical loading. The
effect of increased laminate thickness was found to be small under both static and cyclic loading of the
sandwich specimens. Furthermore, the cyclic loaded tests confirmed that the design of the sandwich
specimen was damage tolerant since multiple cracking of the adhesive developed in a stable manner.
Keywords: Residual stress, Fracture, Crack, Adhesion, Finite element
Nomenclature
a crack length
E1, E2 Young’s modulus (substrate, adhesive)
E1, E2 plane strain Young’s modulus (substrate, adhesive)
F non-dimensional function (for crack model)
GI mode-I energy release rate
∗Corresponding authorEmail address: [email protected] (Jeppe B. Jørgensen)
Preprint submitted to International Journal of Solids and Structures November 11, 2017

h1, h2 thickness for sandwich specimen (substrate, adhesive)
h∗1, h∗2 thickness for bi-layer specimen (substrate, adhesive)
KI mode-I stress intensity factor
KIC mode-I critical stress intensity factor
N number of cycles
P applied force
q non-dimensional function (for misfit stress model)
r radius of curvature
R load R-ratio
t time
T temperature
TC curing temperature
TPC post curing temperature
Tr reference temperature
TR room temperature
Tt test temperature
Ut total strain energy
Ucrack strain energy caused by the formation of a crack
Uno,crack strain energy of specimen without crack
Vt total work done by external forces
x, y, z coordinates
α1, α2 coefficient of thermal expansion (substrate, adhesive)
δ displacement
εfc strain in adhesive at first crack
εFBG strain measured by fiber Bragg grating
εSG1 strain measured by strain gauge number 1
εSG2 strain measured by strain gauge number 2
εm mechanical strain
2

εm,fc mechanical strain at first crack in the adhesive
εm,max maximum mechanical strain in cyclic tests
εm,st average mechanical strain at first crack in the adhesive for static tests
εyy normal strain
εT misfit strain
ε∆αT misfit strain for Method 5 (reference value)
ζ2, ζ2∗ adhesive to substrate thickness ratio (sandwich, bi-layer)
ηyy surface traction in the y-direction in the finite element model
κ curvature of the bi-layer specimen
ν1, ν2 Poisson’s ratio (substrate, adhesive)
σm mechanical stress in the adhesive
σm,fc mechanical stress in the adhesive at first crack
σfc stress in the adhesive at first crack
σr residual stress in the adhesive
σT misfit stress
σ∆αT misfit stress for Method 5 (reference value)
σyy,1 generalised normal stress in the substrate in y-direction
σyy,2 generalised normal stress in the adhesive in y-direction
Σ2 adhesive to substrate stiffness ratio
FBG fiber Bragg grating
FE finite element
LEFM linear-elastic fracture mechanics
VARTM vacuum-assisted-resin-transfer-moulding
3
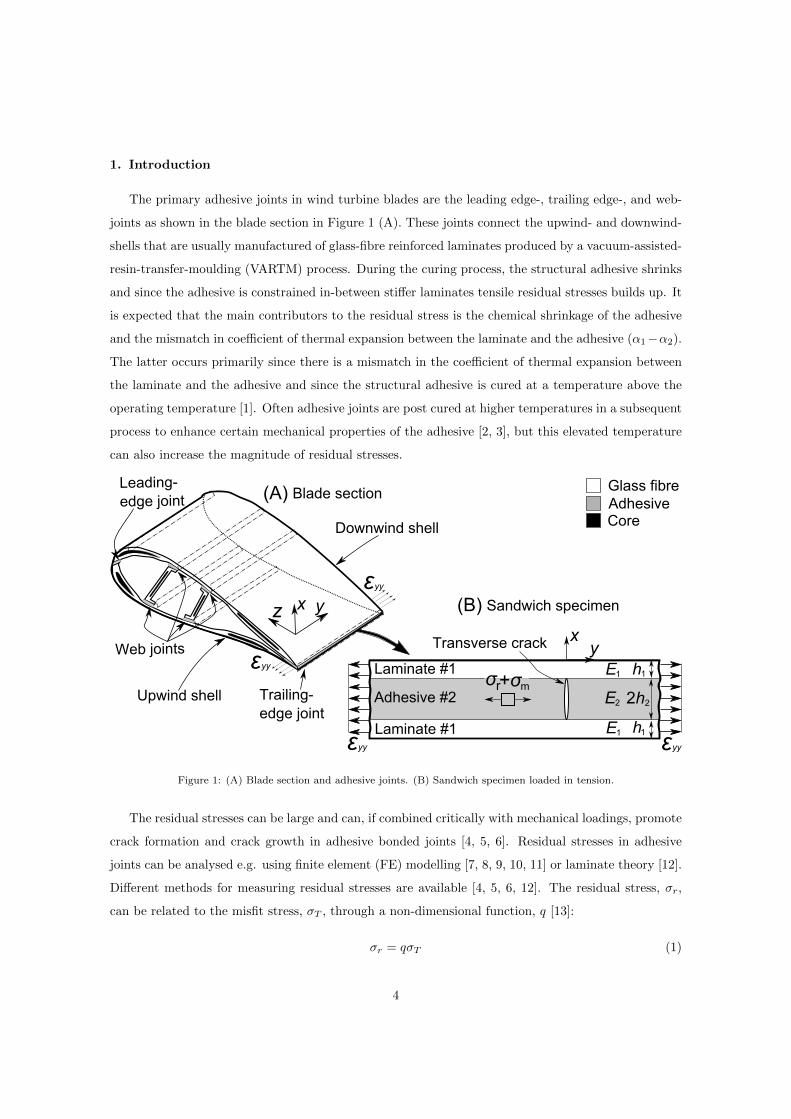
1. Introduction
The primary adhesive joints in wind turbine blades are the leading edge-, trailing edge-, and web-
joints as shown in the blade section in Figure 1 (A). These joints connect the upwind- and downwind-
shells that are usually manufactured of glass-fibre reinforced laminates produced by a vacuum-assisted-
resin-transfer-moulding (VARTM) process. During the curing process, the structural adhesive shrinks
and since the adhesive is constrained in-between stiffer laminates tensile residual stresses builds up. It
is expected that the main contributors to the residual stress is the chemical shrinkage of the adhesive
and the mismatch in coefficient of thermal expansion between the laminate and the adhesive (α1−α2).
The latter occurs primarily since there is a mismatch in the coefficient of thermal expansion between
the laminate and the adhesive and since the structural adhesive is cured at a temperature above the
operating temperature [1]. Often adhesive joints are post cured at higher temperatures in a subsequent
process to enhance certain mechanical properties of the adhesive [2, 3], but this elevated temperature
can also increase the magnitude of residual stresses.
Blade section
Laminate #1
Laminate #1
Adhesive #2
1
h1
2h2
E1
E1
E2
h
Transverse crack
Core
Glass fibreAdhesive
εyyεyy
(A)
(B) Sandwich specimenx yz
εyy
εyy
Trailing- edge joint
Leading- edge joint
Web jointsxy
σr+σmUpwind shell
Downwind shell
Figure 1: (A) Blade section and adhesive joints. (B) Sandwich specimen loaded in tension.
The residual stresses can be large and can, if combined critically with mechanical loadings, promote
crack formation and crack growth in adhesive bonded joints [4, 5, 6]. Residual stresses in adhesive
joints can be analysed e.g. using finite element (FE) modelling [7, 8, 9, 10, 11] or laminate theory [12].
Different methods for measuring residual stresses are available [4, 5, 6, 12]. The residual stress, σr,
can be related to the misfit stress, σT , through a non-dimensional function, q [13]:
σr = qσT (1)
4
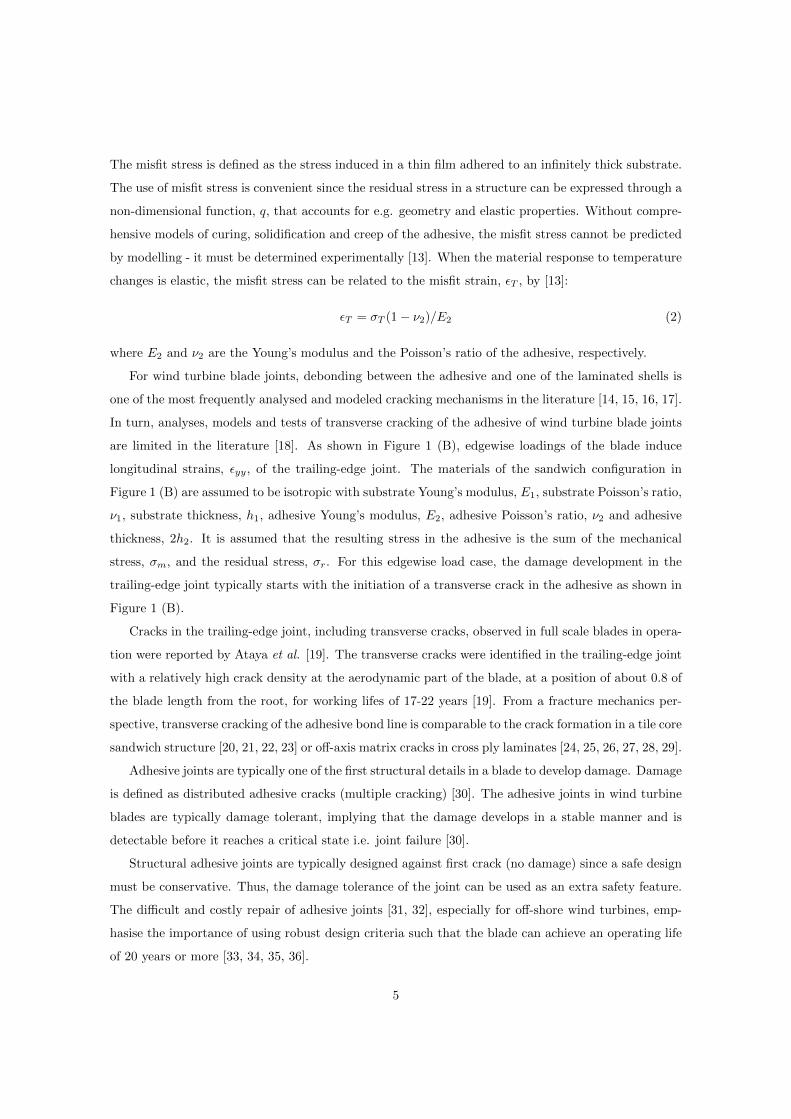
The misfit stress is defined as the stress induced in a thin film adhered to an infinitely thick substrate.
The use of misfit stress is convenient since the residual stress in a structure can be expressed through a
non-dimensional function, q, that accounts for e.g. geometry and elastic properties. Without compre-
hensive models of curing, solidification and creep of the adhesive, the misfit stress cannot be predicted
by modelling - it must be determined experimentally [13]. When the material response to temperature
changes is elastic, the misfit stress can be related to the misfit strain, εT , by [13]:
εT = σT (1− ν2)/E2 (2)
where E2 and ν2 are the Young’s modulus and the Poisson’s ratio of the adhesive, respectively.
For wind turbine blade joints, debonding between the adhesive and one of the laminated shells is
one of the most frequently analysed and modeled cracking mechanisms in the literature [14, 15, 16, 17].
In turn, analyses, models and tests of transverse cracking of the adhesive of wind turbine blade joints
are limited in the literature [18]. As shown in Figure 1 (B), edgewise loadings of the blade induce
longitudinal strains, εyy, of the trailing-edge joint. The materials of the sandwich configuration in
Figure 1 (B) are assumed to be isotropic with substrate Young’s modulus, E1, substrate Poisson’s ratio,
ν1, substrate thickness, h1, adhesive Young’s modulus, E2, adhesive Poisson’s ratio, ν2 and adhesive
thickness, 2h2. It is assumed that the resulting stress in the adhesive is the sum of the mechanical
stress, σm, and the residual stress, σr. For this edgewise load case, the damage development in the
trailing-edge joint typically starts with the initiation of a transverse crack in the adhesive as shown in
Figure 1 (B).
Cracks in the trailing-edge joint, including transverse cracks, observed in full scale blades in opera-
tion were reported by Ataya et al. [19]. The transverse cracks were identified in the trailing-edge joint
with a relatively high crack density at the aerodynamic part of the blade, at a position of about 0.8 of
the blade length from the root, for working lifes of 17-22 years [19]. From a fracture mechanics per-
spective, transverse cracking of the adhesive bond line is comparable to the crack formation in a tile core
sandwich structure [20, 21, 22, 23] or off-axis matrix cracks in cross ply laminates [24, 25, 26, 27, 28, 29].
Adhesive joints are typically one of the first structural details in a blade to develop damage. Damage
is defined as distributed adhesive cracks (multiple cracking) [30]. The adhesive joints in wind turbine
blades are typically damage tolerant, implying that the damage develops in a stable manner and is
detectable before it reaches a critical state i.e. joint failure [30].
Structural adhesive joints are typically designed against first crack (no damage) since a safe design
must be conservative. Thus, the damage tolerance of the joint can be used as an extra safety feature.
The difficult and costly repair of adhesive joints [31, 32], especially for off-shore wind turbines, emp-
hasise the importance of using robust design criteria such that the blade can achieve an operating life
of 20 years or more [33, 34, 35, 36].
5

Structural health monitoring systems are desirable in order to identify damage before it reaches
a critical state and cause catastrophic failure of a joint or a full structure e.g. a wind turbine blade
[37, 38, 39, 40, 41]. The use of optical fibers with fiber Bragg gratings (FBG) in structural adhesive
joints is attractive since residual strains during manufacturing can be measured, and subsequently
the FBG can potentially be used as a part of a structural health monitoring system during operation
[40, 42, 43]. The FBG measures a wavelength that can through the FBGs gauge factor be converted
to a strain value [42]. Advantages of the use of optical fibers with FBGs are described in the work of
Guemes et al. [44, 45].
The problem studied in the present work is transverse cracking of the adhesive layer of the struc-
tural adhesive joint shown in Figure 1 (B), where crack formation and growth are expected to be
driven by a combination of mechanical- and residual stresses. The study includes the effect of re-
sidual stresses, laminate type, laminate thickness, post curing temperature, and operational (test)
temperature. Furthermore, the effect of laminate thickness on the evolution of multiple cracking of
the adhesive under cyclic loading is studied. Additionally in this work, a new approach that allows
the residual stress in the adhesive to be determined in several different ways is presented. The accu-
racy of four different methods to measure residual stress is tested on a single sandwich test specimen
(laminate/adhesive/laminate). The instrumentation of the test specimen includes strain gauges and
FBGs. FBGs are also embedded in the adhesive to determine residual stresses during the different
manufacturing steps in the bonding process.
The paper is structured as follows. First, a new approach to predict the stress in the adhesive at
which the first crack can propagate from a void in the adhesive layer of the sandwich specimen will
be introduced. Secondly, a novel bi-material FE model of the sandwich specimen in Figure 1 (B) will
be presented and included in the approach. The principles of measuring residual stresses will then be
described. Hereafter, the materials and manufacturing procedures for preparation of the test specimens
will be described including the experimental procedures. The results section includes a comparison
of the different residual stress measurements and a comparison between predicted and experimentally
determined stress in the adhesive at first transverse crack in the sandwich specimen. Additionally,
results from the static- and cyclic loaded tests of the different sandwich specimen configurations will
be presented. Finally, the results will be discussed and the major findings will be used to propose
novel design rules for adhesive bonded joints.
2. Problem definition
The adhesive joint in Figure 1 (B) is basically a sandwich specimen (laminate/adhesive/laminate)
loaded in tension. Experimental tests of this sandwich specimen should lead to novel design rules for
6

structural adhesive joints. Two types of laminates (Laminate A and Laminate B) that are presented
in section 6, are used to investigate the effect of different variables:
• The effect of variables on the magnitude of residual stresses in the adhesive layer of the sandwich
specimen:
– Test temperature (−50oC, −40oC, −30oC, −20oC, 23oC).
– Post curing temperature (50oC, 70oC, 90oC).
– Laminate thickness (Laminate B).
• The effect of variables to initiate a transverse crack in the adhesive layer of the sandwich speci-
mens loaded in static tension:
– Test temperature (−50oC, −40oC, −30oC, −20oC, 23oC).
– Post curing temperature (50oC, 70oC, 90oC).
– Laminate type (Laminate A, Laminate B).
– Laminate thickness (Laminate B).
• The effect of variables on the evolution of multiple cracking of the adhesive layer of the sandwich
specimen loaded cyclic:
– Laminate thickness (Laminate B).
3. Approach for determination of stress in the adhesive at first crack
The approach for determination of stress in the adhesive at first crack, σfc, in static tensile tests
of the sandwich specimen, shown in Figure 1 (B), is presented schematic in Figure 2.
3.1. Model prediction
It is assumed that the stress level at which first crack of length, 2a, in the adhesive of the sandwich
specimen in Figure 2 (i) can propagate, can be predicted by a relation between the stress in the
adhesive at first crack, σfc, and the mode-I critical stress intensity factor of the adhesive, KIC :
σfc =KIC√
πaF (a/(h1 + h2), h1/h2, E1/E2, ν1, ν2)(prediction) (3)
which is a relation on a similar form as for the center cracked test specimen presented by Tada et al.
[46]. The non-dimensional function, F , accounts for the geometry and the stiffness mismatch between
the substrates and the adhesive. F needs to be determined numerically for this bi-material specimen.
KIC of the bulk adhesive should be measured experimentally.
7
FE model ofbi-materialsandwich
Mechanicalstress
measurement
Residualstress
measurement
σrσm,fc
1
h1
2h2
E1
E1
E2
h 1
h1
2h2
E1
E1
E2
h
Model prediction Experimental test
KICσfc -~ relation
σfcσfc
2aσr+σm
Critical stressintensity factormeasurement
KIC
Comparison
(i) (ii)
(iii)
Figure 2: Approach for determination of stress in the adhesive at first crack, σfc. (i) Model prediction. (ii) Experimental
test. (iii) Comparison of model prediction and experimental test.
3.2. Experimental test
For the experimental tests of the sandwich specimens (static), shown in Figure 2 (ii), the stress in
the adhesive at first crack, i.e. the onset of growth of a crack with length, 2a, is assumed to be the
sum of the residual stress, σr, and the mechanical stress in the adhesive at first crack, σm,fc, as:
σfc = σm,fc + σr (experimental) (4)
where σm,fc can be determined based on the measured strain at first crack, εm,fc, and Hooke’s law:
σm,fc = E2εm,fc (5)
where E2 is the plane strain Young’s modulus of the adhesive. A relation between the misfit stress and
the residual stress in the adhesive of the sandwich specimen shown in Figure 1 (B) can be derived by
equilibrium considerations (interface perfectly bonded) and by Hooke’s law in plane stress (x-direction)
[47]:
σr =σT
1 + ζ2Σ2(6)
where Σ2 = [E2/(1− ν2)] / [E1/(1− ν1)] and ζ2 = h2/h1 are for the sandwich specimen shown in Figure
1 (B). The misfit stress, σT , of the adhesive can be measured by different methods as demonstrated in
section 5. When the residual stress is determined, the magnitude of σfc can be determined by equation
4.
8

3.3. Comparison of model prediction and experimental test
In order to test the accuracy of the methods (”Model prediction” and ”Experimental test” in
Figure 2), a comparison will be made at two different temperatures (23oC and −40oC) according to
the last step in the approach i.e. Figure 2 (iii). The material properties of the adhesive (KIC and E2)
are taken to depend on temperature, T , meaning that σfc will be a function of KIC(T ) and E2(T ).
Furthermore, the experimental method in Figure 2 (ii) will be applied on other sandwich specimens
in order to test the effect of different parameters e.g. post curing temperature, test temperature and
laminate thickness.
4. Modelling of the center cracked test specimen
If pre-existing cracks are present in the adhesive, linear-elastic fracture mechanics (LEFM) with
finite element simulations can be applied to predict the propagation of the crack.
4.1. Methods
The sandwich specimen in Figure 1 (B) is comparable to the center cracked test specimen presented
by Tada et al. [46] where the mode-I stress intensity factor, KI , is given on the form:
KI = σyy,2√πaF (a/h2) (7)
where σyy,2 is the stress in the adhesive and 2a is the crack length, see Figure 3 and Figure 4. The
non-dimensional function, F , from Tada et al. [46] is however only valid in absence of elastic mismatch
between substrate and adhesive i.e. for the homogenous specimen. If including elastic mismatch, the
stress intensity factor depends on additional parameters and (7) should be modified to:
KI = σyy,2√πaF (a/(h1 + h2), h1/h2, E1/E2, ν1, ν2) (8)
The non-dimensional function, F , is determined numerically by the use of a parametric 2D FE model,
simulated in Abaqus CAE 6.14 (Dassault Systemes) with eight-noded plane strain elements. A quarter
of the sandwich geometry is modelled by imposing a symmetry condition in both the x- and y-directions
as shown in Figure 3. A surface traction, ηyy, is applied on the free boundary in the y-direction. 100
elements are used over distance h2 near the crack in the quarter of the model. A focused mesh were
used in the y-direction in a distance of h2 from the crack tip. The model is parametric with the
non-dimensional groups of a/(h1 + h2), h1/h2, E1/E2, ν1 and ν2.
9

yx
1
h2
E1
E2
h
σyy,2a
crack tip
yyη
Figure 3: Boundary conditions for the FE model, where a quarter of the full model is analysed by finite element
simulations.
4.2. Results from FE model of center cracked test specimen
Finite element results are presented in Figure 4 in terms of the non-dimensional function, F , and
for different elastic mismatch. For the homogenous case (E1/E2 = 1.0), F is compared with the results
presented by Tada et al. [46]. The maximum deviation between the two results is 0.81%. The trend
in Figure 4 is comparable to the partial cracked film problem from Beuth [48] i.e. F increases with
crack length for compliant substrates (E1/E2 . 1) and decreases with crack length for stiff substrates
(E1/E2 & 4). Note, F → 1.0 for a/(h1 + h2) → 0, which is similar to the solution for a center crack
in an infinitely large plate [46] of a homogenous material.
0.0 0.1 0.2 0.3 0.4 0.5 0.6 0.70.6
0.8
1.0
1.2
1.4
1.6
1.8E /E =0.51 2
E /E =1.01 2
E /E =2.01 2
E /E =4.01 2
E /E =8.01 2
E /E =10.01 2
E /E =12.01 2
F(a
/(h
+h
),h
/h ,E
/E ,
ν ,ν
) [
-]
21
21
21
a/(h +h ) [-]21
21
yx
#1
#1
#21
h1
2h2
E1
E1
E2
hσyy,2 2a
Figure 4: Finite element modelling results where ν1 = ν2 = 1/3 and h1/h2 = 0.4. The interface is located near
a/(h1 + h2) ≈ 0.7. The FE results are compared with the results (dots) from Tada et al. [46] for E1/E2 = 1.
5. Methods
5.1. Methods - determination of strain energies
The strain energies of the sandwich specimen in Figure 1 (B) will be analysed. In general for a
linear relationship between applied force, P , and displacement, δ, of an elastic body the work done by
10

the external force, Vt, to deform the body is [49, 50]:
Vt =1
2Pδ (9)
In a linear-elastic body without energy dissipation (such as heat), the work done by the external force,
Vt, can be equated with the total elastic strain energy, Ut [49, 50]:
Ut = Vt (10)
This relation is also known as Clapeyron’s theorem [51, 52]. The total elastic strain energy, Ut, stored
in the body of the sandwich specimen in Figure 1 (B) can be written as the sum of the elastic strain
energy for the specimen without crack, Uno,crack, and the elastic strain energy for the introduction of
the transverse crack, Ucrack, see Tada et al. [46] (Appendix B) or Rice et al. [53]:
Ut = Uno,crack + Ucrack (11)
The change in strain energy due to the introduction of the transverse crack in the sandwich specimen
in Figure 1 (B) can be determined by the principles presented by Beuth [48] as:
Ucrack =
∫ x=+a
x=−aGIda = 2
∫ x=a
x=0
GIda (12)
where Ucrack can be interpreted as the change in strain energy when the crack extends over the length
from x = −a to x = +a. Using the Irwin relation [54], GI = K2I /E2, and equation 8 for KI , the strain
energy, Ucrack, becomes:
Ucrack =2πσ2
yy,2
E2
∫ x=a
x=0
[a [F (a/(h1 + h2), h1/h2, E1/E2, ν1, ν2)]
2]da (13)
The integral in equation 13 can e.g. be evaluated by numerical integration over the crack length, 2a,
using the finite element modeling result for F in Figure 4. Thus, if the input parameters to equation
13 are known, the increase of strain energy due to the formation of a transverse crack in the adhesive
can be predicted.
5.2. Methods - determination of residual stresses
A new approach is proposed that allows the residual stress to be determined in several different ways.
With this approach, it is possible to mimic the process conditions and constraints of the structural
adhesive joint i.e. reproduce the thermal boundary conditions and the constraining effect from the
laminates on the adhesive. Thus, an advantage of the new approach is that all process related effects
contributing to the residual stress will be included in the measurement. As a part of the new approach,
five different methods can be applied on the same sandwich specimen/bi-layer specimen (in Figure 5
and 6) in order to test the accuracy of each method. Method 1 to 4 to determine the misfit stress
experimentally are presented graphically in Figure 6, whereas Method 5 is a theoretical estimate:
11
• Method 1 - based on strains measured by FBG in sandwich specimens.
• Method 2 - based on dial gauge to measure curvature of bi-layer specimens.
• Method 3 - based on strain gauge and FBG to measure curvature of bi-layer specimens.
• Method 4 - based on strains measured by strain gauge on free laminates (debonded).
• Method 5 - based on theoretical estimate using a reference temperature.
First the sandwich specimen is manufactured (Step 1-3) in Figure 5. The contraction of the
sandwich specimen in the y-direction after curing in Figure 5 and Figure 6 is indicated by ∆L. The
contraction of the adhesive in the x-direction is indicated by the adhesive thickness before curing, 2h2c,
(liquid state) and the thickness of the adhesive after curing, 2h2 (solid state). After manufacturing,
the contraction of the specimen is measured with the FBG in the sandwich specimen (see Method
1 in Figure 6). The bottom laminate is removed and the curvature is measured (see Method 2 in
Figure 6). The FBG is now embedded in the adhesive (see Method 3 in Figure 6) and the strains are
measured by the strain gauge, SG1, and the FBG. The strain gauge, SG2, measures a strain on the
free laminate (Method 4 in Figure 6). Method 5 is a direct estimate of the misfit stress based on a
reference temperature, the test (operational) temperature, and the coefficients of thermal expansion.
Method 1 to 4 is used to determine the actual residual stress magnitude in the adhesive irrespective
of the mechanism behind i.e. chemical shrinkage, thermal expansion mismatch, creep or other phe-
nomena. In turn, for Method 5 it is assumed that the only contribution to the residual stress comes
from the temperature and the coefficient of thermal expansion. The methods are presented in details
in the next sections where dimensionless parameters are introduced to reduce the number of variables
(see symbols in Figure 6):
Σ2 =E2/(1− ν2)
E1/(1− ν1), ζ2 =
h2
h1(sandwich specimen), ζ2∗ =
h∗2h∗1
(bi-layer specimen) (14)
where h∗1 and h∗2 are the thickness of the substrate and adhesive for the bi-layer specimen, respectively.
Note, the relations in Figure 6 between the sandwich and the bi-layers specimens, h∗1 = h1 and
h∗2 = 2h2.
12

h1E1
E1 h1
Laminate
Laminate
#1
#1
h1
2h2
E1
E1
E2
h1
SG1
SG2FBG
Laminate
Laminate
Adhesive
#1
#2
#1
Step 3
Step 2 2h2cE2Adhesive #2
h1E1Laminate #1
E1Laminate #1 h1FBG
Step 1FBG
yx
yx
yx
Opticalfiber
Opticalfiber
Opticalfiber
Manufacturing
σyy,2
σyy,1
σyy,1
ΔL
Figure 5: Manufacturing principle. Step 1: Mounting of FBG before injection of the adhesive. Step 2: After injection
of the adhesive, but before curing of the adhesive. Step 3: After curing of the adhesive. Note, σyy,1 will be compressive
and σyy,2 will be tensile (σr = σyy,2) since the adhesive contracts during the curing process.
h1
2h2
E1
E1
E2
h1
Laminate
Laminate
AdhesiveMethod 1#1
#2
#1
Method 2
Laminate#1
Adhesive #2FBG
SG1
Method 3
SG2Method 4 Laminate#1
Opticalfiber
h2*
h1*
FBG
yx
yx
yx
Opticalfiber
E1
E2
Measurements
Laminate#1
Adhesive #2 h2*
h1*
yx
E1
E2
ΔL
Figure 6: Approach that includes four experimental methods to determine the residual stress of the adhesive after curing.
Method 1: Measure strains with FBG. Method 2: Measure curvature with dial gauge. Method 3: Determine curvature
with FBG and SG1. Method 4: Measure in-plane strains by SG1 on free laminate. Note, h∗1 = h1 and h∗2 = 2h2.
13
5.3. Method 1 - based on strains measured by FBG on sandwich specimen
The procedure for Method 1 is: (see the three steps in Figure 5)
• Attach the FBG to the laminate and read off the absolute wavelength of the FBG (Step 1).
• Inject the adhesive in-between two laminates in order to cast a sandwich specimen (Step 2).
• After curing of the adhesive, measure absolute wavelength of the FBG for the sandwich specimen
(Step 3).
All measurements should be made at room temperature unless a temperature compensation is
applied. The measured absolute wavelength before injection of the adhesive is used as a reference
value. After injection- and curing of the adhesive, the FBG measures an absolute wavelength that can
be converted to an in-plane strain, εFBG, by using the FBGs gauge factor and the reference value. An
equilibrium condition between the forces in the adhesive and the laminate can be used to determine
the residual stress as demonstrated in Appendix A. Thus, the stress in the adhesive of the sandwich
specimen, σyy,2, can be calculated by:
σyy,2 =−E1εFBG
ζ2(15)
where E1 is the plane strain Young’s modulus of the substrate. The misfit stress in the adhesive can
be determined by rewriting equation 6 as:
σT = −σyy,1(
1
ζ2+ Σ2
)= σyy,2 (1 + ζ2Σ2) (16)
where σyy,1 is the normal stress in the substrate acting in the y-direction.
5.4. Method 2 - based on dial gauge to measure curvature of bi-layer specimen
The procedure for Method 2 is:
• After curing of the adhesive, peel off one of the laminates of the sandwich specimen.
• Measure beam height at points on the top surface by a dial gauge (Method 2 in Figure 6).
• Fit circle to the points on the beams top surface to determine the radius of curvature, r.
• Determine the curvature, κ = 1/r.
Having determined κ, of the bi-layer specimens the misfit stress can be determined from [13]:
σT =(Σ2ζ
22∗ − 1)2 + 4Σ2ζ2∗(1 + ζ2∗)2
6ζ22∗(1 + ζ2∗)
[E2h2κ
Σ2(1− ν2)
](17)
14

5.5. Method 3 - based on strain gauge and FBG to measure curvature of bi-layer specimen
The procedure for Method 3 is:
• After curing of the sandwich specimen, zero the strain gauge and read off the absolute wavelength
of the FBG (reference value).
• Peel off the bottom laminate of the sandwich specimen.
• Measure the strain, εSG1, on the top surface by strain gauge SG1 and measure the absolute
wavelength by the FBG on the bottom surface. Convert the absolute wavelength to strain,
εFBG, using the FBGs gauge factor and the reference wavelength.
• Determine the curvature based on measured strains.
The curvature, κ, of the bi-layer specimen can be determined by the measured strains from the strain
gauge SG1, εSG1, on the top of the beam and the strain measured by the FBG on the bottom of the
beam. The relation between the beam normal strain, εyy, and the beam curvature, κ, is:
εyy = κx (18)
where x is the distance from the elastic center to the point of interest. For the determination of κ, the
position of the neutral axis is not needed since it is the sum of the thickness (h∗1 + h∗2) that enters the
equation (SG1 and FBG are mounted on the top and bottom surface, respectively):
κ =(εSG1 − εFBG)
(h∗1 + h∗2)(19)
where εSG1 is a positive value and εFBG is a negative value. Based on κ, the misfit stress can then be
determined from equation 17.
5.6. Method 4 - based on strains measured by strain gauge on free laminate
The procedure for Method 4 is:
• After curing of the sandwich specimen, mount the strain gauge (SG2) on the bottom laminate.
• Peel off the bottom laminate from the sandwich and measure the tensile strain by SG2.
Strain gauge SG2 measures εSG2 on the free laminate that is peeled off from the sandwich specimen
as shown in Figure 6. The stress in the adhesive of the sandwich can then be determined by assuming
perfect bonding of the adhesive/laminate interface in the sandwich specimen and by using an equili-
brium condition between the forces in the laminate and the adhesive as demonstrated in Appendix A.
Thus, the stress in the adhesive of the sandwich specimen, σyy,2, can be determined by:
σyy,2 =E1εSG2
ζ2(20)
For Method 4, the misfit stress in the adhesive can finally be determined by equation 16.
15
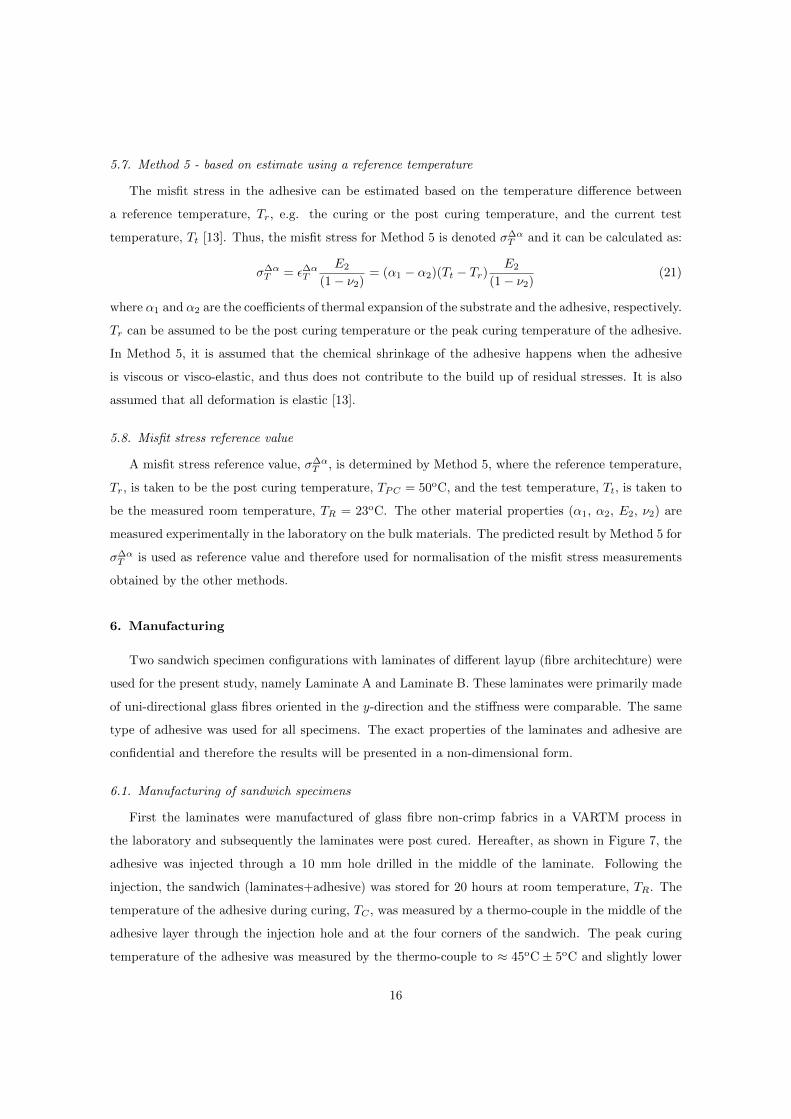
5.7. Method 5 - based on estimate using a reference temperature
The misfit stress in the adhesive can be estimated based on the temperature difference between
a reference temperature, Tr, e.g. the curing or the post curing temperature, and the current test
temperature, Tt [13]. Thus, the misfit stress for Method 5 is denoted σ∆αT and it can be calculated as:
σ∆αT = ε∆αT
E2
(1− ν2)= (α1 − α2)(Tt − Tr)
E2
(1− ν2)(21)
where α1 and α2 are the coefficients of thermal expansion of the substrate and the adhesive, respectively.
Tr can be assumed to be the post curing temperature or the peak curing temperature of the adhesive.
In Method 5, it is assumed that the chemical shrinkage of the adhesive happens when the adhesive
is viscous or visco-elastic, and thus does not contribute to the build up of residual stresses. It is also
assumed that all deformation is elastic [13].
5.8. Misfit stress reference value
A misfit stress reference value, σ∆αT , is determined by Method 5, where the reference temperature,
Tr, is taken to be the post curing temperature, TPC = 50oC, and the test temperature, Tt, is taken to
be the measured room temperature, TR = 23oC. The other material properties (α1, α2, E2, ν2) are
measured experimentally in the laboratory on the bulk materials. The predicted result by Method 5 for
σ∆αT is used as reference value and therefore used for normalisation of the misfit stress measurements
obtained by the other methods.
6. Manufacturing
Two sandwich specimen configurations with laminates of different layup (fibre architechture) were
used for the present study, namely Laminate A and Laminate B. These laminates were primarily made
of uni-directional glass fibres oriented in the y-direction and the stiffness were comparable. The same
type of adhesive was used for all specimens. The exact properties of the laminates and adhesive are
confidential and therefore the results will be presented in a non-dimensional form.
6.1. Manufacturing of sandwich specimens
First the laminates were manufactured of glass fibre non-crimp fabrics in a VARTM process in
the laboratory and subsequently the laminates were post cured. Hereafter, as shown in Figure 7, the
adhesive was injected through a 10 mm hole drilled in the middle of the laminate. Following the
injection, the sandwich (laminates+adhesive) was stored for 20 hours at room temperature, TR. The
temperature of the adhesive during curing, TC , was measured by a thermo-couple in the middle of the
adhesive layer through the injection hole and at the four corners of the sandwich. The peak curing
temperature of the adhesive was measured by the thermo-couple to ≈ 45oC ± 5oC and slightly lower
16
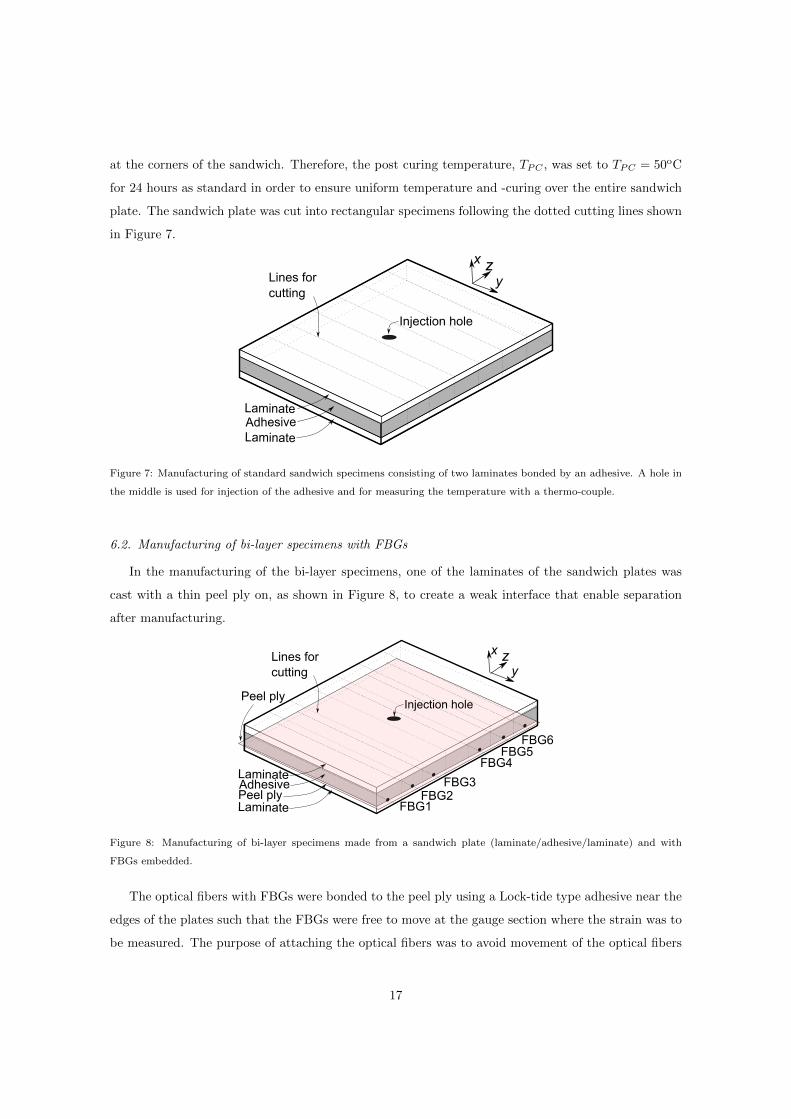
at the corners of the sandwich. Therefore, the post curing temperature, TPC , was set to TPC = 50oC
for 24 hours as standard in order to ensure uniform temperature and -curing over the entire sandwich
plate. The sandwich plate was cut into rectangular specimens following the dotted cutting lines shown
in Figure 7.
Adhesive
Lines forcutting
Laminate
Laminate
x
yz
Injection hole
Figure 7: Manufacturing of standard sandwich specimens consisting of two laminates bonded by an adhesive. A hole in
the middle is used for injection of the adhesive and for measuring the temperature with a thermo-couple.
6.2. Manufacturing of bi-layer specimens with FBGs
In the manufacturing of the bi-layer specimens, one of the laminates of the sandwich plates was
cast with a thin peel ply on, as shown in Figure 8, to create a weak interface that enable separation
after manufacturing.
FBG1FBG2
FBG3
FBG4FBG5
FBG6
Peel ply
Adhesive
UD fiber direction
Lines forcutting
Laminate
Peel plyLaminate
x
yz
Injection hole
Figure 8: Manufacturing of bi-layer specimens made from a sandwich plate (laminate/adhesive/laminate) and with
FBGs embedded.
The optical fibers with FBGs were bonded to the peel ply using a Lock-tide type adhesive near the
edges of the plates such that the FBGs were free to move at the gauge section where the strain was to
be measured. The purpose of attaching the optical fibers was to avoid movement of the optical fibers
17
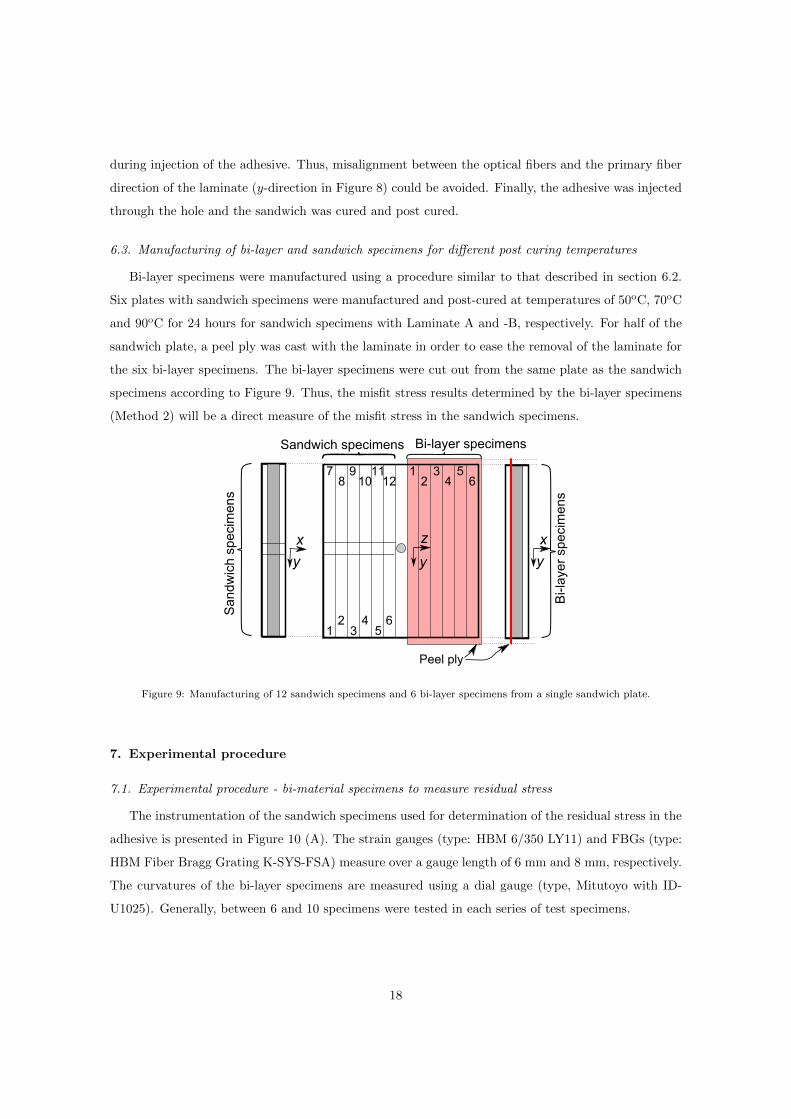
during injection of the adhesive. Thus, misalignment between the optical fibers and the primary fiber
direction of the laminate (y-direction in Figure 8) could be avoided. Finally, the adhesive was injected
through the hole and the sandwich was cured and post cured.
6.3. Manufacturing of bi-layer and sandwich specimens for different post curing temperatures
Bi-layer specimens were manufactured using a procedure similar to that described in section 6.2.
Six plates with sandwich specimens were manufactured and post-cured at temperatures of 50oC, 70oC
and 90oC for 24 hours for sandwich specimens with Laminate A and -B, respectively. For half of the
sandwich plate, a peel ply was cast with the laminate in order to ease the removal of the laminate for
the six bi-layer specimens. The bi-layer specimens were cut out from the same plate as the sandwich
specimens according to Figure 9. Thus, the misfit stress results determined by the bi-layer specimens
(Method 2) will be a direct measure of the misfit stress in the sandwich specimens.
Peel ply
12
34
56
12
34
56
78
910
1112
Bi-l
ayer
spe
cim
ens
y
z
y
x
y
x
San
dwic
h sp
ecim
ens
Sandwich specimens Bi-layer specimens
Figure 9: Manufacturing of 12 sandwich specimens and 6 bi-layer specimens from a single sandwich plate.
7. Experimental procedure
7.1. Experimental procedure - bi-material specimens to measure residual stress
The instrumentation of the sandwich specimens used for determination of the residual stress in the
adhesive is presented in Figure 10 (A). The strain gauges (type: HBM 6/350 LY11) and FBGs (type:
HBM Fiber Bragg Grating K-SYS-FSA) measure over a gauge length of 6 mm and 8 mm, respectively.
The curvatures of the bi-layer specimens are measured using a dial gauge (type, Mitutoyo with ID-
U1025). Generally, between 6 and 10 specimens were tested in each series of test specimens.
18
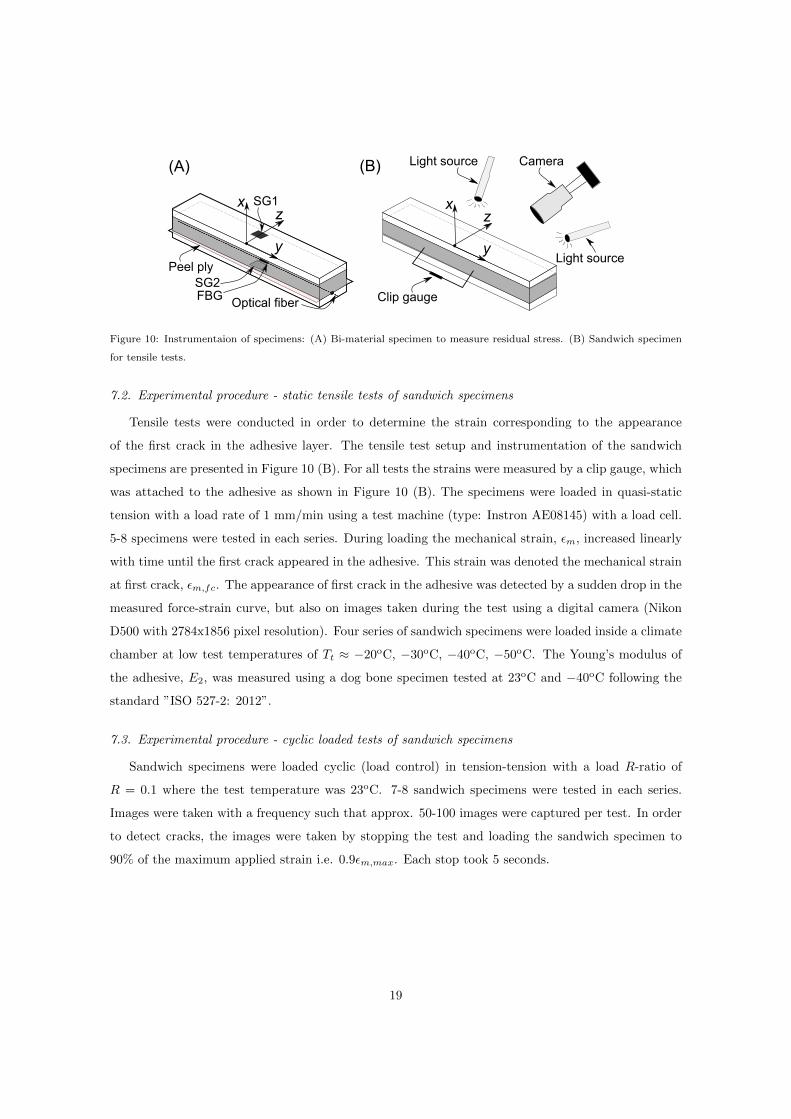
Glue
SG1
SG2
Optical fiber
(A)
Glue
(B)
Clip gauge
Light source
y
xz
Peel ply
FBG
Camera
y
xz
Light source
Figure 10: Instrumentaion of specimens: (A) Bi-material specimen to measure residual stress. (B) Sandwich specimen
for tensile tests.
7.2. Experimental procedure - static tensile tests of sandwich specimens
Tensile tests were conducted in order to determine the strain corresponding to the appearance
of the first crack in the adhesive layer. The tensile test setup and instrumentation of the sandwich
specimens are presented in Figure 10 (B). For all tests the strains were measured by a clip gauge, which
was attached to the adhesive as shown in Figure 10 (B). The specimens were loaded in quasi-static
tension with a load rate of 1 mm/min using a test machine (type: Instron AE08145) with a load cell.
5-8 specimens were tested in each series. During loading the mechanical strain, εm, increased linearly
with time until the first crack appeared in the adhesive. This strain was denoted the mechanical strain
at first crack, εm,fc. The appearance of first crack in the adhesive was detected by a sudden drop in the
measured force-strain curve, but also on images taken during the test using a digital camera (Nikon
D500 with 2784x1856 pixel resolution). Four series of sandwich specimens were loaded inside a climate
chamber at low test temperatures of Tt ≈ −20oC, −30oC, −40oC, −50oC. The Young’s modulus of
the adhesive, E2, was measured using a dog bone specimen tested at 23oC and −40oC following the
standard ”ISO 527-2: 2012”.
7.3. Experimental procedure - cyclic loaded tests of sandwich specimens
Sandwich specimens were loaded cyclic (load control) in tension-tension with a load R-ratio of
R = 0.1 where the test temperature was 23oC. 7-8 sandwich specimens were tested in each series.
Images were taken with a frequency such that approx. 50-100 images were captured per test. In order
to detect cracks, the images were taken by stopping the test and loading the sandwich specimen to
90% of the maximum applied strain i.e. 0.9εm,max. Each stop took 5 seconds.
19
8. Results from residual stress measurements
8.1. Results - FBG strain measurements during manufacturing
In the manufacturing, the FBGs were measuring the straining of the sandwich specimens during
the different steps in the bonding process. The three main steps were presented in Figure 5. The
measurements in Figure 11 (A-B) are numbered to indicate the corresponding manufacturing step:
1. After mounting of the FBG on the laminate.
• FBGs were mounted and the recorded strain (wavelength) was used as reference for zero
since the optical fibre was taken to be stress free.
2. After injection of the adhesive.
• A few minutes after injection of the adhesive, the measured strain increased.
3a. After curing at room temperature (before demoulding).
• The measured strain decreased after the adhesive had cured at room temperature for 20
hours.
3b. After demoulding (plates were removed from bonding fixture).
• The measured strain was not affected significantly by demoulding (no trend identified).
3c. After post curing (the specimens were still in one sandwich plate).
• The measured strain decreased after post curing.
3d. After cutting of the sandwich plate into specimens.
• After the sandwich specimens were cut out from the sandwich plate, the measured strains
decreased.
In the above list, Step 3 in Figure 5 is divided into sub steps in order to cover additional measu-
rements. All FBG strains were measured at room temperature in the laboratory, but in Step 2 the
adhesive had just begun to generate exothermal heat according to the temperature measurements. The
manufacturing Step 3c (post curing) was identified, based on Figure 11 (A-B), as the manufacturing
step where the primary residual stress builds up.
8.2. Misfit stress results for methods 1 to 5
The misfit stress results determined using Method 1 to 5 are presented in Figure 12 for different
test series with Laminate A and Laminate B. The measurements for 1.0A, 2A, 3A and 4A in Figure
12 are from the same series of specimens (from same sandwich plate) and similarly for 1.0B, 2B, 3B
and 4B. Series 1.1A and 1.1B are two additional series of specimens from two separate sandwich plates
with FBGs.
20

0.20
0.15
0.10
0.05
0.00
0.05
0.10
1 20.20
0.15
0.10
0.05
0.00
0.05
0.10
Laminate A Laminate B(A) (B)
Manufacturing step [-] Manufacturing step [-]
FB
G s
trai
n,
[-
]ε
/ε
FB
G
1.0A
1.1A 1.0B
1.1B
Failure of FBG
Not measuredNot measured
Step 5: Not measured
3a 3b 3c 3d
Δα
T
FB
G s
trai
n,
[-
]ε
/ε
FB
GΔ
αT
1 2 3a 3b 3c 3d
Figure 11: Strain measured with FBG during the manufacturing steps with four different test series of sandwich speci-
mens: (A) Two test series with Laminate A (1.0A with dashed lines and 1.1A with solid lines). (B) Two test series with
Laminate B (1.0B with dashed lines and 1.1B with solid lines).
The results based on FBG measurements from test series 1.0A, 1.0B, 1.1A and 1.1B in Figure 12
are taken from the last measurement with FBG (manufacturing Step 3d in Figure 11) i.e. four different
test series with 3-6 samples each. The error bars indicate the standard deviation for each test series
i.e. the specimen-to-specimen variations.
0.0
0.2
0.4
0.6
0.8
1.0
1.2
2 3 4 5
T
Lam inate A
Lam inate B
1 1
σM
isfit
str
ess,
Method [-]
1.0A
1.0B
1.1A
1.1B 2A 2B 3A 3B 4A 4B 5A 5B
σ /[-
]Δ
αT
Figure 12: Misfit stress results determined experimentally by the methods 1 to 5, where σ∆αT is the misfit stress
determined by Method 5 (used as reference value for normalisation).
The results from Method 1 (FBG in sandwich) and Method 4 (strain gauge on free laminate),
which are based on strain measurements, are lower than the misfit stresses determined by the other
methods. Results from Method 2 (bi-layer curvature measured by dial gauge) and Method 3 (bi-layer
curvature measured by strain gauge and FBG) are both based on the determined curvature of the bi-
21
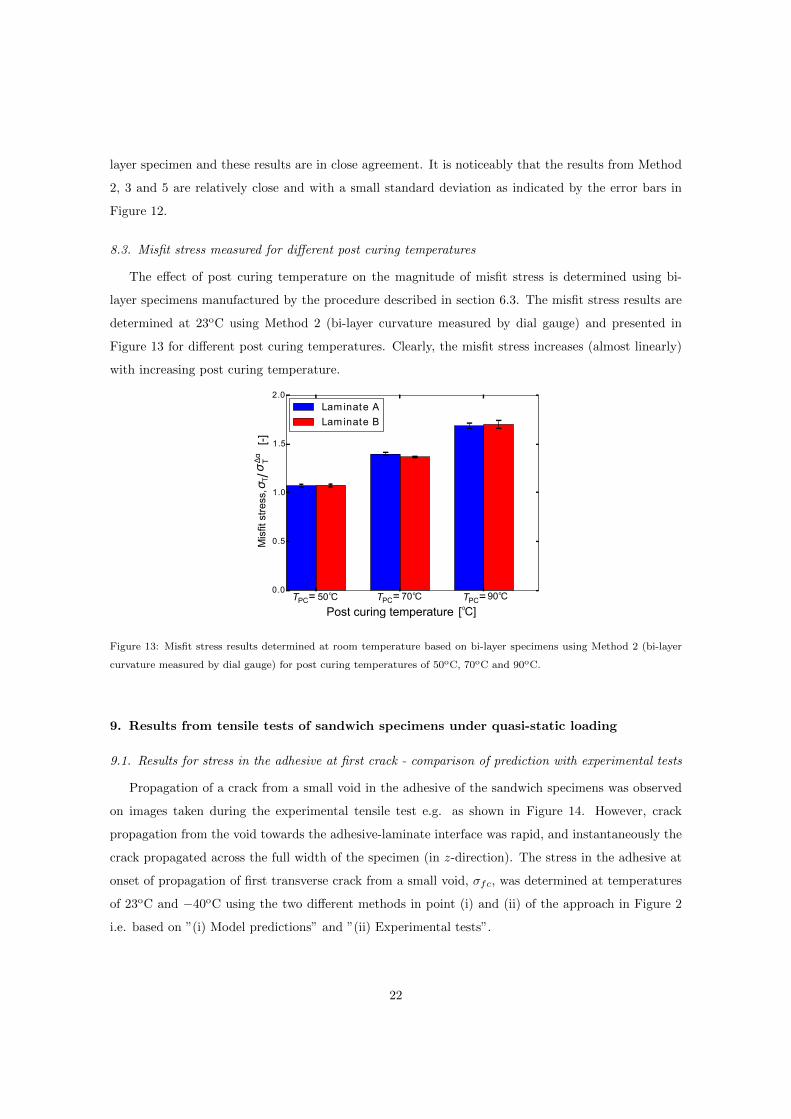
layer specimen and these results are in close agreement. It is noticeably that the results from Method
2, 3 and 5 are relatively close and with a small standard deviation as indicated by the error bars in
Figure 12.
8.3. Misfit stress measured for different post curing temperatures
The effect of post curing temperature on the magnitude of misfit stress is determined using bi-
layer specimens manufactured by the procedure described in section 6.3. The misfit stress results are
determined at 23oC using Method 2 (bi-layer curvature measured by dial gauge) and presented in
Figure 13 for different post curing temperatures. Clearly, the misfit stress increases (almost linearly)
with increasing post curing temperature.
0.0
0.5
1.0
1.5
2.0
50 Co 70 Co 90 CoT =PC T =PC T =PC
Lam inate A
Lam inate B
Post curing temperature [ C]o
Tσ
Mis
fit s
tres
s,σ /
[-]
Δα
T
Figure 13: Misfit stress results determined at room temperature based on bi-layer specimens using Method 2 (bi-layer
curvature measured by dial gauge) for post curing temperatures of 50oC, 70oC and 90oC.
9. Results from tensile tests of sandwich specimens under quasi-static loading
9.1. Results for stress in the adhesive at first crack - comparison of prediction with experimental tests
Propagation of a crack from a small void in the adhesive of the sandwich specimens was observed
on images taken during the experimental tensile test e.g. as shown in Figure 14. However, crack
propagation from the void towards the adhesive-laminate interface was rapid, and instantaneously the
crack propagated across the full width of the specimen (in z-direction). The stress in the adhesive at
onset of propagation of first transverse crack from a small void, σfc, was determined at temperatures
of 23oC and −40oC using the two different methods in point (i) and (ii) of the approach in Figure 2
i.e. based on ”(i) Model predictions” and ”(ii) Experimental tests”.
22

Input parameters for the two methods were measured experimentally on the bulk materials in the
laboratory. The material properties of the adhesive were measured at temperatures of 23oC and −40oC
on specimens that were manufactured under similar process conditions as the sandwich specimens. The
mode-I critical stress intensity factor, KIC , was measured by a compact tension test of the bulk adhesive
using the standard ”ASTM D5045” at temperatures of 23oC and −40oC. The Young’s modulus of
the adhesive, E2, was measured by a dog bone specimen using the standard ”ISO 527-2: 2012” at
temperatures of 23oC and −40oC.
(i) Prediction: The stress in the adhesive at first crack of the sandwich specimen shown in Figure
1 (B) was predicted based on the FE model and equation 3. As an approximation the crack length,
2a, was taken to be the maximum measured void sizes in the adhesive of the sandwich specimens. The
size of the six largest voids on the surface of the adhesive in Figure 14 was measured to a/(h1 + h2) ≈0.042 with a standard deviation of ±0.01. Thus, the value of the non-dimensional function, F , was
determined based on the modeling result in Figure 4 to F ≈ 1. Having determined KIC , F and a, the
value of σfc could be determined by equation 3.
x11
43
52
a/h
=1
2
4
31
52
yx
(A) (B)
62h 22h 2
6
Figure 14: The sizes of six voids in the adhesive layer of a sandwich specimen were measured on the photo. The time
interval between (A) and (B) is six seconds. The laminate thickness was h1/h2 = 0.45, but the laminates are not shown
in the photo due to confidentiality.
(ii) Experimental test: For experimental tests of two series of test specimens (23oC and −40oC),
the stress in the adhesive at first crack for the sandwich specimen shown in Figure 1 (B) was taken
to be the sum of the residual stress and the mechanical stress as shown in equation 4. Here, σm,fc
was determined based on the measured mechanical strain from the clip gauge, εm,fc, using equation
5. The misfit stress was determined at 23oC using Method 2 (section 5.4) and at −40oC by Method 5
(section 5.7). Thus, the residual stress, σr, could be determined based on equation 6 and finally σfc
could be calculated by equation 4.
(iii) Comparison: A comparison between the predicted results and the experimental results for
σfc at temperatures of 23oC and −40oC is presented in Figure 15. It was a hypothesis that equation
3 could be used to predict σfc although the FE model was developed for an infinitely sharp start-
crack using LEFM whereas the shape of the pre-existing cracks in the adhesive layer of the sandwich
23

specimens were more uncertain. However, this hypothesis cannot be rejected since the error bars for the
”Experimental” and ”Prediction” in Figure 15 overlaps i.e. the prediction is close to the experimental
results for both 23oC and −40oC. Since results from two independent methods determined at two very
different temperatures are consistent, the methods seem to be promising for the determination of the
stress in the adhesive at first crack for the sandwich specimens. Therefore in the next sections, the
experimental method in Figure 2 (ii) is applied to investigate the effect of different parameters (post
curing temperature, test temperature, laminate thickness) on the magnitude of σfc.
0
2
4
6
8
10
12
-40 Co
T =t -40 Co
T =t23 Co
T =t 23 Co
T =t
Experimental ExperimentalPrediction Prediction Pre-existing defect
fcσ
Str
ess
at fi
rst c
rack
,σ /
[-]
/
/
ΔαT
ΔαT
Δα
T
Figure 15: Results for stress in the adhesive at first crack for temperatures of 23oC and −40oC. Comparison of prediction
with experimental test results using the approach in Figure 2.
9.2. Stress in the adhesive at first crack - effects of post curing temperature
The effect of post curing temperature on the stress in the adhesive at first crack was investigated
by static tensile tests using the sandwich specimens shown in Figure 9. The sandwich specimens
were post cured at 50oC, 70oC and 90oC and the residual stresses were measured by Method 2 on
bi-layer specimens that were cut out from the same plate as the sandwich specimens, see Figure 9,
i.e. in specimens manufactured under similar process conditions. From the results of the tensile tests
presented in Figure 16, it can be seen that with increasing post curing temperature, the stress in the
adhesive at first crack decreases in a nearly linear manner. This trend can to some extend be explained
by an increase in residual stresses (if it is assumed that Tr = TPC). However, since σfc differs for the
different tests the material properties of the adhesive (e.g. strength, toughness) might have changed
slightly for the different post curing temperatures tested.
9.3. Stress in the adhesive at first crack - effects of low test temperatures
The effect of low temperatures on the stress in the adhesive at first crack was investigated by testing
the sandwich specimens shown in Figure 7. The results presented in Figure 17 show that as the test
24
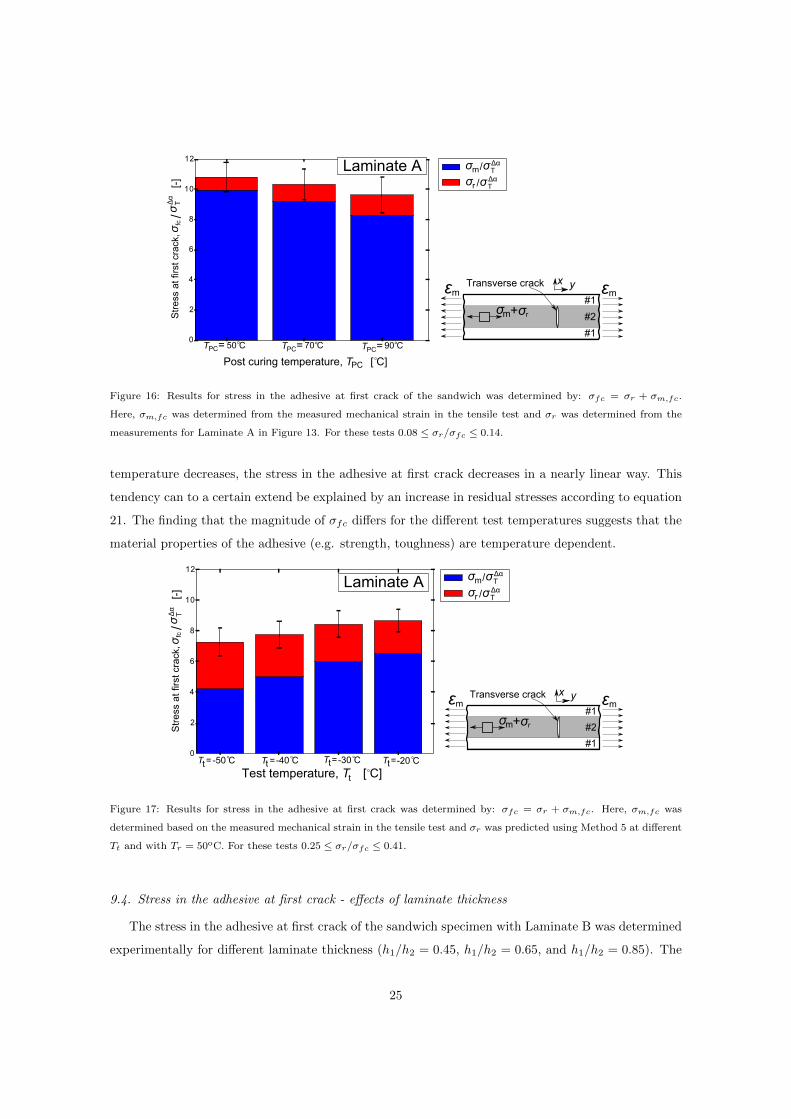
0
2
4
6
8
10
12
Post curing temperature, T [ C]PC
50 Co 70 Co 90 CoT =PC T =PC T =PC
σm+σ r
#1
#2
#1
εmεmTransverse crack x y
Laminate A /
/
ΔαT
ΔαT
fcσ
Str
ess
at fi
rst c
rack
,σ /
[-]
Δα
T
Figure 16: Results for stress in the adhesive at first crack of the sandwich was determined by: σfc = σr + σm,fc.
Here, σm,fc was determined from the measured mechanical strain in the tensile test and σr was determined from the
measurements for Laminate A in Figure 13. For these tests 0.08 ≤ σr/σfc ≤ 0.14.
temperature decreases, the stress in the adhesive at first crack decreases in a nearly linear way. This
tendency can to a certain extend be explained by an increase in residual stresses according to equation
21. The finding that the magnitude of σfc differs for the different test temperatures suggests that the
material properties of the adhesive (e.g. strength, toughness) are temperature dependent.
0
2
4
6
8
10
12
σm+σ r
#1
#2
#1
εmεmTransverse crack x y
Test temperature, T [ C]t
Laminate A
-20 Co-30 C
o-40 C
o-50 C
oT =tT =tT =tT =t
fcσ
Str
ess
at fi
rst c
rack
,σ /
[-]
Δα
T
/
/
ΔαT
ΔαT
Figure 17: Results for stress in the adhesive at first crack was determined by: σfc = σr + σm,fc. Here, σm,fc was
determined based on the measured mechanical strain in the tensile test and σr was predicted using Method 5 at different
Tt and with Tr = 50oC. For these tests 0.25 ≤ σr/σfc ≤ 0.41.
9.4. Stress in the adhesive at first crack - effects of laminate thickness
The stress in the adhesive at first crack of the sandwich specimen with Laminate B was determined
experimentally for different laminate thickness (h1/h2 = 0.45, h1/h2 = 0.65, and h1/h2 = 0.85). The
25
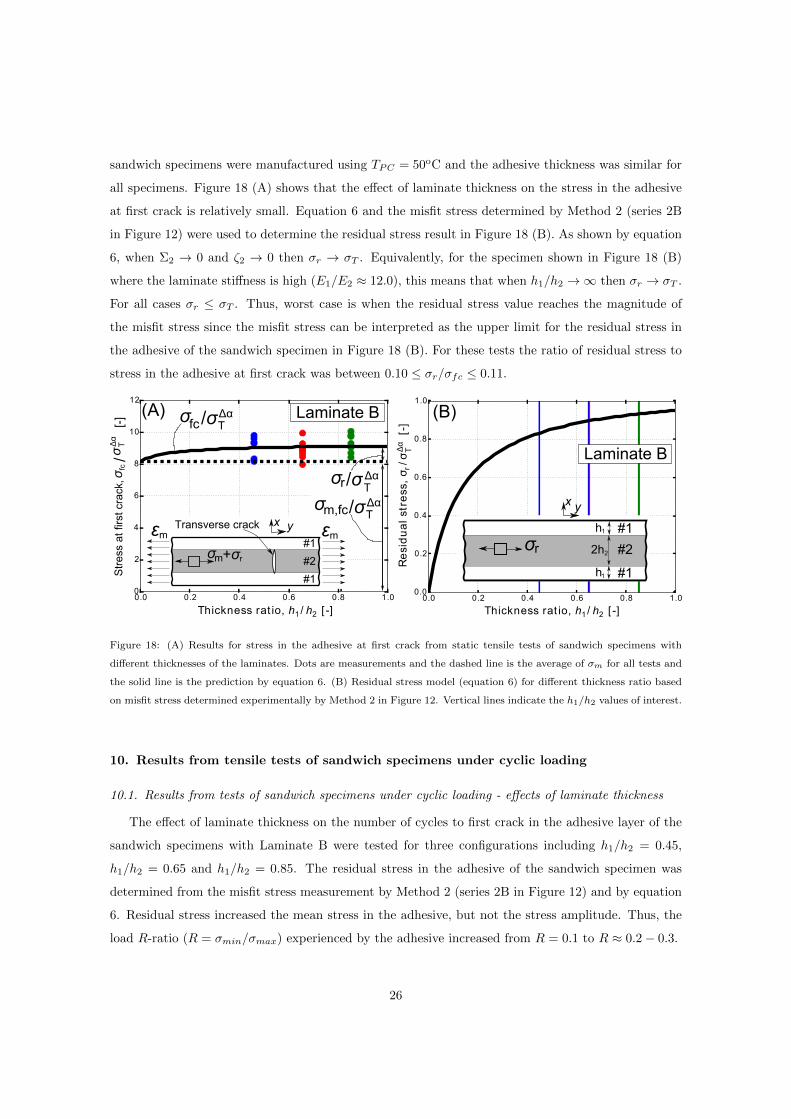
sandwich specimens were manufactured using TPC = 50oC and the adhesive thickness was similar for
all specimens. Figure 18 (A) shows that the effect of laminate thickness on the stress in the adhesive
at first crack is relatively small. Equation 6 and the misfit stress determined by Method 2 (series 2B
in Figure 12) were used to determine the residual stress result in Figure 18 (B). As shown by equation
6, when Σ2 → 0 and ζ2 → 0 then σr → σT . Equivalently, for the specimen shown in Figure 18 (B)
where the laminate stiffness is high (E1/E2 ≈ 12.0), this means that when h1/h2 →∞ then σr → σT .
For all cases σr ≤ σT . Thus, worst case is when the residual stress value reaches the magnitude of
the misfit stress since the misfit stress can be interpreted as the upper limit for the residual stress in
the adhesive of the sandwich specimen in Figure 18 (B). For these tests the ratio of residual stress to
stress in the adhesive at first crack was between 0.10 ≤ σr/σfc ≤ 0.11.
0.0 0.2 0.4 0.6 0.8 1.00.0
0.2
0.4
0.6
0.8
1.0R
esi
du
al
stre
ss,
σr/σ
[-]
0.0 0.2 0.4 0.6 0.8 1.00
2
4
6
8
10
12
Thickness rat io, h1 / h2 [ -]Thickness rat io, h1 / h2 [ -]
Laminate B
(B)(A) Laminate Bσfc /σ
σm,fc/σ
σm+σ r
#1
#2
#1
εmεmTransverse crack x y
rσ /σ
σr
#1
#2
#1
x y
1
h1
2h2
h
fcσ
Str
ess
at fi
rst c
rack
,σ /
[-]
Δα
T
Δα
T
ΔαT
ΔαT
ΔαT
Figure 18: (A) Results for stress in the adhesive at first crack from static tensile tests of sandwich specimens with
different thicknesses of the laminates. Dots are measurements and the dashed line is the average of σm for all tests and
the solid line is the prediction by equation 6. (B) Residual stress model (equation 6) for different thickness ratio based
on misfit stress determined experimentally by Method 2 in Figure 12. Vertical lines indicate the h1/h2 values of interest.
10. Results from tensile tests of sandwich specimens under cyclic loading
10.1. Results from tests of sandwich specimens under cyclic loading - effects of laminate thickness
The effect of laminate thickness on the number of cycles to first crack in the adhesive layer of the
sandwich specimens with Laminate B were tested for three configurations including h1/h2 = 0.45,
h1/h2 = 0.65 and h1/h2 = 0.85. The residual stress in the adhesive of the sandwich specimen was
determined from the misfit stress measurement by Method 2 (series 2B in Figure 12) and by equation
6. Residual stress increased the mean stress in the adhesive, but not the stress amplitude. Thus, the
load R-ratio (R = σmin/σmax) experienced by the adhesive increased from R = 0.1 to R ≈ 0.2− 0.3.
26

The maximum mechanical strain, εm,max, applied in the cyclic loaded test was normalised by the
average mechanical static strain at first crack, εm,st, based on the results in Figure 18 (A). Figure
19 shows that the number of cycles for the first transverse crack to extend across the thickness of
the adhesive layer of the sandwich specimen is comparable for the different laminate thickness tested
(h1/h2 = 0.45, h1/h2 = 0.65, and h1/h2 = 0.85). This suggests that crack initiation in the adhesive
is primarily driven by the stress level and the defect size, and less sensitive to the thickness of the
laminate i.e. the constraining effect of the laminate. Figure 20 shows the number of cycles for the
occurrence of the first and subsequent cracks for various applied maximum strain levels. It seems
that when the maximum applied mechanical strain, εm,max, becomes smaller, the crack density of the
adhesive increases. Although the effect is small, the appearance of subsequent cracks seem to occur
faster (i.e. at a lower number of cycles) for decreasing substrate thickness.
103 104 105 106Max
mec
hani
cal s
trai
n/st
atic
str
ain,
[
-]ε m
,max
/εm
,st
Cycles, N [-]
Laminate B First crackFirst crack
(h /h =0.45)1 2(h /h =0.65)1 2
First crack (h /h =0.85)1 2
First transversecrack in adhesive
σm+σ r
#1
#2
#1
εmεm
Figure 19: Number of cycles to first crack in the adhesive for different configurations of h1/h2.
10.2. Strain energy - comparison of prediction with experimental test
The test with the second highest strain level in Figure 20 (B) with thickness of h1/h2 = 0.65 is
selected for further analysis. The work done by the applied external forces can be used to determine
the strain energy of the sandwich specimen experimentally by equation 9 and equation 10 in section
5.1 based the measured force by the load cell, P , and the measured displacement by the clip gauge, δ.
Thus, the strain energy was measured for the part of the sandwich specimen volume that was within
the gauge length of the clip gauge, see Figure 21 (A). The strain energy during the cyclic loaded test of
this specimen is presented in Figure 21 (A), where the current specimen strain energy, Ut, is normalised
by the initial specimen strain energy, Uno,crack.
The first two transverse cracks in the adhesive were identified on images at about 3000 cycles, see
Figure 20 (B) and Figure 21 (B-C). The increase in strain energy due to the evolution of Crack 1 and
27

103 104 105 106
103 104 105 106
103 104 105 106
Crack 1
Crack 2
Crack 3
Crack 4
Crack 5
Crack 6
Crack 7
Crack 8
Crack 1
Crack 2
Crack 3
Crack 4
Crack 5
Crack 6
Crack 7
Crack 1
Crack 2
Crack 3
Crack 4
Crack 5
Crack 6
Crack 7
Crack 8
Multiple transversecracking of adhesive
σm+σ r
#1
#2
#1
εmεm
h /h =0.65:1 2
h /h =0.45:1 2
h /h =0.85:1 2
Max
mec
hani
cal s
trai
n/st
atic
str
ain,
[
-]ε m
,max
/εm
,st
Max
mec
hani
cal s
trai
n/st
atic
str
ain,
[
-]ε m
,max
/εm
,st
Max
mec
hani
cal s
trai
n/st
atic
str
ain,
[
-]ε m
,max
/εm
,st
Cycles, N [-]
Cycles, N [-] Cycles, N [-]
(A)
(B) (C)
Laminate B
Laminate B Laminate BTest selected for further analysis
Figure 20: Transverse crack measurements from cyclic loaded tests of sandwich specimens with different thickness of
Laminate B. (A) h1/h2 = 0.45, (B) h1/h2 = 0.65, (C) h1/h2 = 0.85.
28

Crack 2 could be measured by the clip gauge since these two cracks initiated inside the gauge length
of the clip gauge (close to the middle of the specimen length). Crack 1 and Crack 2 evolved nearly
simultaneously (at N ≈ 3000 cycles) according to both the measured strain energy in Figure 21 (A)
and the images captured during the test. Crack 3 and Crack 4 evolved outside the gauge length of
the clip gauge and the change in strain energy caused by Crack 3 and Crack 4 could therefore not
be captured by the clip gauge measurement. However, the images and the small bumps on the curve
in Figure 21 (A) indicate that Crack 3 and Crack 4 evolved in the adhesive at N ≈ 9000 cycles and
N ≈ 13000 cycles, respectively.
0 5000 10000 15000 200000.90
0.95
1.00
1.05
1.10
1.15
1.20
1.25
Crack 3 (outside clip gauge area)Crack 4 (outside clip gauge area)
Crack 1 (inside clip gauge area)Crack 2 (inside clip gauge area)
Clip gauge
Crack 3 Crack 1 Crack 2 Crack 4
yx
Cycles, N [-]
1.30
Str
ain
ener
gy, U
/U
[-
]
tno
,cra
ck
(A)
(B)
(C)
2h2
2h2
Figure 21: (A) Strain energy measured by clip gauge during the test with strain level of εm,max/εm,st ≈ 0.48 in the test
series with h1/h2 = 0.65 i.e. the second highest loaded test in Figure 20 (B). (B) Photo near Crack 1 at 2500 cycles
(a < h2). (C) Photo near Crack 1 at 3000 cycles (a = h2).
When the first two cracks appeared across the width of the adhesive layer in the beginning of the
test in Figure 21 (A), the increase in strain energy due to the crack, Ucrack, could be determined by
equation 13. Using the inputs from the test in Figure 21 (h1/h2 = 0.65, E1/E2 = 12, σyy,2) together
with the function, F , in Figure 4 gives a predicted strain energy of Ucrack/Uno,crack = 0.055±0.01 (for
two cracks). In this model prediction it was assumed that the inputs to equation 13 (h1/h2 = 0.65,
E1/E2 = 12, σyy,2) could be determined within an accuracy of ±5%. Note in Figure 4 that when
E1/E2 & 8.0, the sensitivity of E1/E2 on F is small.
Comparing Ucrack/Uno,crack = 0.055 with the measured increase in strain energy Ut/Uno,crack in
Figure 21 (A) for two transverse cracks at N ≈ 3000 cycles gives a relative deviation of ∼ 2% between
the strain energy prediction of Ucrack/Uno,crack and the measured change in Ut/Uno,crack. Thus, the
strain energy prediction is consistent with the measurement.
29
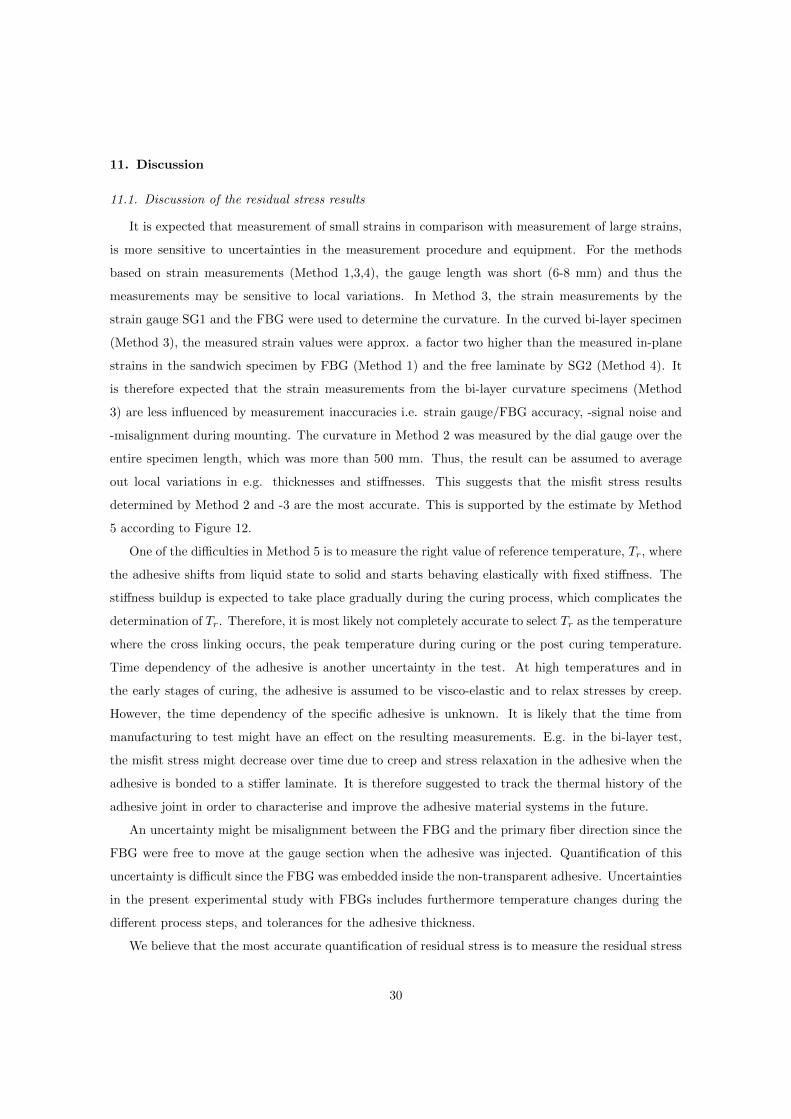
11. Discussion
11.1. Discussion of the residual stress results
It is expected that measurement of small strains in comparison with measurement of large strains,
is more sensitive to uncertainties in the measurement procedure and equipment. For the methods
based on strain measurements (Method 1,3,4), the gauge length was short (6-8 mm) and thus the
measurements may be sensitive to local variations. In Method 3, the strain measurements by the
strain gauge SG1 and the FBG were used to determine the curvature. In the curved bi-layer specimen
(Method 3), the measured strain values were approx. a factor two higher than the measured in-plane
strains in the sandwich specimen by FBG (Method 1) and the free laminate by SG2 (Method 4). It
is therefore expected that the strain measurements from the bi-layer curvature specimens (Method
3) are less influenced by measurement inaccuracies i.e. strain gauge/FBG accuracy, -signal noise and
-misalignment during mounting. The curvature in Method 2 was measured by the dial gauge over the
entire specimen length, which was more than 500 mm. Thus, the result can be assumed to average
out local variations in e.g. thicknesses and stiffnesses. This suggests that the misfit stress results
determined by Method 2 and -3 are the most accurate. This is supported by the estimate by Method
5 according to Figure 12.
One of the difficulties in Method 5 is to measure the right value of reference temperature, Tr, where
the adhesive shifts from liquid state to solid and starts behaving elastically with fixed stiffness. The
stiffness buildup is expected to take place gradually during the curing process, which complicates the
determination of Tr. Therefore, it is most likely not completely accurate to select Tr as the temperature
where the cross linking occurs, the peak temperature during curing or the post curing temperature.
Time dependency of the adhesive is another uncertainty in the test. At high temperatures and in
the early stages of curing, the adhesive is assumed to be visco-elastic and to relax stresses by creep.
However, the time dependency of the specific adhesive is unknown. It is likely that the time from
manufacturing to test might have an effect on the resulting measurements. E.g. in the bi-layer test,
the misfit stress might decrease over time due to creep and stress relaxation in the adhesive when the
adhesive is bonded to a stiffer laminate. It is therefore suggested to track the thermal history of the
adhesive joint in order to characterise and improve the adhesive material systems in the future.
An uncertainty might be misalignment between the FBG and the primary fiber direction since the
FBG were free to move at the gauge section when the adhesive was injected. Quantification of this
uncertainty is difficult since the FBG was embedded inside the non-transparent adhesive. Uncertainties
in the present experimental study with FBGs includes furthermore temperature changes during the
different process steps, and tolerances for the adhesive thickness.
We believe that the most accurate quantification of residual stress is to measure the residual stress
30
directly on the adhesive joint component or in a very similar specimen that are manufactured under
comparable process conditions. Therefore, we believe that it is more accurate to determine the residual
stress in the sandwich specimens than measuring on the neat adhesive in an unconstrained state [55]
or using the ASTM D2566 standard, where the adhesive is cast into an open half pipe shaped steel
mould. The steel mould used in ASTM D2566 cannot reproduce the thermal- and mechanical boundary
conditions of the adhesive joint component correct.
Future studies of residual stresses related to the present work could include measuring the misfit
stress at low temperatures although this would require knowledge of the stiffness properties of the
adhesive at the corresponding temperatures. Investigations of the creep behavior of the adhesive
including stress relaxation at medium high temperatures could be a relevant future study as well.
11.2. Discussion of the tensile test results
Comparing the misfit stress results for the different post curing temperatures in Figure 16 with
the misfit stress results for the different test temperatures in Figure 17, suggests that the change in
residual stress per post curing temperature (σr/TPC) is comparable to the change in residual stress
per test temperature (σr/Tt). Thus, these two distinct types of temperatures seem to have the same
effect on the residual stress in the adhesive.
Alia et al. [3] measured the elongation at break for a bulk adhesive (Bisphenol A-epoxy vinylester
adhesive) as a function of different post curing temperatures using dog bone specimens tested according
to the test standard ISO R527-1-966. They found that the elongation at break decreased with approx.
10% over post curing temperatures ranging from 50oC to 90oC. This result can be compared with the
measurement in the present paper in Figure 16 (post cured at different temperatures) if the residual
stress in the adhesive of the sandwich specimens are taken into account. Furthermore for comparison,
it is a prerequisite that the dog bone specimens tested by Alia et al. [3] are free of residual stresses
and the distribution of defects are comparable. Since, the determined stress in the adhesive at first
crack in Figure 16 decreases with approx. 11 % from 50oC to 90oC of post curing temperature, the
tendency of the results in the present paper are consistent with the measurements by Alia et al. [3]
for a comparable adhesive material system.
The variation of stress in the adhesive at first crack in each test series was relatively large. This
might be attributed the details of the pre-existing defects. The distribution of defect size and shape
from specimen to specimen was not measured, but it is reasonable to assume that there is some
specimen-to-specimen variation. The effect of laminate thickness on the stress in the adhesive at first
crack (shown in Figure 18 (B)) was relatively small, which might be explained by the relatively small
residual stresses for the range of laminate thicknesses tested (at room temperature). The results for
stress in the adhesive at first crack, presented in Figure 16 and Figure 17, are experimentally determined
31

and illustrate the effect of different process parameters on the material properties (strength, fracture
toughness) of the adhesive. However, the consistency of the results in Figure 15 suggests that the
stress in the adhesive at first crack can be predicted sufficiently accurate by the approach in Figure 2
if the material properties of the test specimens are measured under the same process conditions and
temperatures.
12. Summary and conclusions
Dependent on the test temperature and processing conditions, the residual stress in the adhesive
layers was determined to ∼8-40% of the stress in the adhesive at first crack in the sandwich specimens.
This shows that the residual stresses were of relative significant magnitude, especially at low test
temperatures. The post curing of the adhesive was identified by the FBG measurements as the step
in the bonding process where the major part of the residual stress builds up.
Prediction of the stress in the adhesive at first crack in the sandwich specimen loaded in tension,
using a novel bi-material FE model, was found to be consistent with experimental results obtained at
temperatures of 23oC and −40oC. The cyclic loaded tests confirmed that the design of the sandwich
specimen was damage tolerant since multiple cracking of the adhesive developed in a stable manner.
Other main conclusions of this study are:
• The effect of post curing temperature:
– The misfit stress increased with increasing post curing temperature.
– The stress in the adhesive (mechanical+residual stress) at first transverse crack decreased
with increasing post curing temperature.
• The effect of test temperature:
– The stress in the adhesive (mechanical+residual stress) at first transverse crack decreased
with decreasing test temperature.
• The effect of laminate thickness:
– The stress in the adhesive (mechanical+residual stress) at first transverse crack under static
loading was relatively insensitive to the thickness of the laminate.
– The evolution of first crack in the adhesive under cyclic loading was relatively insensitive
to the thickness of the laminates.
Based on the conclusions the following design rules are proposed:
32
• To keep the residual stresses low, avoid post curing at very high temperatures.
• To reduce the residual stresses (especially at low operation temperatures), minimise the mismatch
in coefficient of thermal expansion between the adhesive and the laminate.
• To increase the applied mechanical stress in the adhesive to initiate the first transverse crack,
post cure at temperatures that are not too high.
• To increase the applied mechanical stress in the adhesive to initiate the first transverse crack,
avoid low operation temperatures.
Acknowledgements
Acknowledgements to the staff at the LM Wind Power laboratory for help manufacturing and
testing the specimens. Thanks to the technicians at DTU Wind Energy for help mounting strain
gauges on the bi-layer specimens. Thanks to Gilmar Ferreira Pereira and Marco Aurelio Miranda
Maduro for help assisting with the mounting and measuring with the fiber Bragg gratings. This
research was primarily supported by grant no. 4135-00010B from Innovation Fund Denmark. This
research was also supported by the Danish Centre for Composite Structures and Materials for Wind
Turbines (DCCSM), grant no. 0603-00301B, from Innovation Fund Denmark.
Appendix A. Derivation of misfit stress in adhesive for sandwich specimen
The procedure to determine the normal stress, σyy,2, and the misfit stress, σT , in the adhesive of
the symmetric sandwich specimens for Method 1 and Method 4 are presented. Method 1 and Method
4 are illustrated in Figure 6 in section 5.2. The procedure to determine the misfit stress in the adhesive
of the sandwich specimen based on the strain measurement is in short:
• Measure the straining of the specimen.
• Determine the force in the substrate based on the strain measurement (equation A.1).
• Set up the force balance between the substrate and the adhesive (equation A.2).
• Determine the stress in the adhesive (equation A.4 and equation A.5).
• Determine the misfit stress in the adhesive (equation A.6).
The procedure to determine the normal stress and the misfit stress in the adhesive of the sandwich
specimen is exemplified for Method 1, where the strain is measured by the FBG. The procedure is
similar for Method 4 except that the strain in Method 4 is measured by the strain gauge SG2, see
33
Figure 6. The first step in the procedure is to determine the force in one of the substrates, Pyy,1, which
can be calculated based on the strain measurement, εFBG, and Hooke’s law as:
Pyy,1 = E1h1εFBG (A.1)
where E1 is the plane strain Young’s modulus of the substrate and h1 is the thickness of the substrate
as shown in Figure A.22 (A). εFBG is the change in strain in the sandwich specimen measured by the
FBG after curing of the adhesive as shown in Figure A.22 (B). By assuming perfect bonding at the
adhesive-substrate interface, the forces in the two substrates, 2Pyy,1, and the force in the adhesive,
Pyy,2, must be in equilibrium both before and after solidification of the adhesive such that:
Pyy,2 = −2Pyy,1 (A.2)
The force balance between the adhesive and the substrate is also illustrated graphically in Figure A.22
(C). Now the stress per unit width in the substrate and in the adhesive can be determined, respectively:
σyy,1 =Pyy,1h1
(A.3)
σyy,2 =Pyy,22h2
(A.4)
Equation A.4 for the in-plane normal stress in the adhesive of the sandwich specimen, σyy,2, can be
rewritten by inserting (A.1) in (A.2), and then inserting (A.2) in (A.4) as:
σyy,2 =−E1εFBG
ζ2(A.5)
where ζ2 = h2/h1 is the adhesive to substrate thickness ratio. The misfit stress in the adhesive, σT ,
can be determined by rewriting equation 6 in section 3 to give:
σT = −σyy,1(
1
ζ2+ Σ2
)= σyy,2 (1 + ζ2Σ2) (A.6)
The relation between the normal stresses in the adhesive and the substrates is given by σyy,2 =
−σyy,1/ζ2, which is determined based on equilibrium considerations by inserting equation (A.3) and
(A.4) into equation (A.2).
References
[1] J. L. Hart-Smith, Adhesive Bonded Joints for Composites - Phenomenological Considerations, in:
Conference on Advanced Composites Technology, 1978, pp. 1–18.
[2] R. J. C. Carbas, L. F. M. da Silva, E. A. S. Marques, A. M. Lopes, Effect of post-cure on the
glass transition temperature and mechanical properties of epoxy adhesives, Journal of Adhesion
Science & Technology 27 (23) (2013) 2542–2557. doi:10.1080/01694243.2013.790294.
34
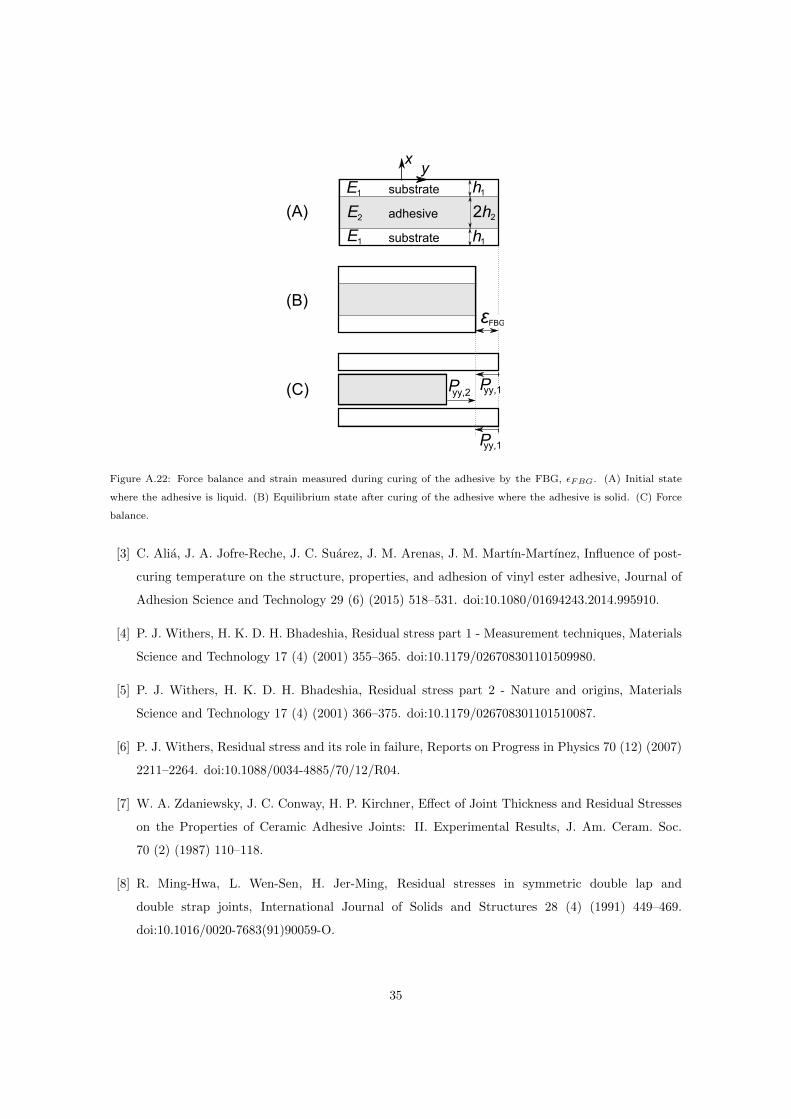
Pyy,2
E12h2h1
h1y
x
E2E1
(A)
(B)
(C)
substrate
adhesive
substrate
εFBG
Pyy,1
Pyy,1
Figure A.22: Force balance and strain measured during curing of the adhesive by the FBG, εFBG. (A) Initial state
where the adhesive is liquid. (B) Equilibrium state after curing of the adhesive where the adhesive is solid. (C) Force
balance.
[3] C. Alia, J. A. Jofre-Reche, J. C. Suarez, J. M. Arenas, J. M. Martın-Martınez, Influence of post-
curing temperature on the structure, properties, and adhesion of vinyl ester adhesive, Journal of
Adhesion Science and Technology 29 (6) (2015) 518–531. doi:10.1080/01694243.2014.995910.
[4] P. J. Withers, H. K. D. H. Bhadeshia, Residual stress part 1 - Measurement techniques, Materials
Science and Technology 17 (4) (2001) 355–365. doi:10.1179/026708301101509980.
[5] P. J. Withers, H. K. D. H. Bhadeshia, Residual stress part 2 - Nature and origins, Materials
Science and Technology 17 (4) (2001) 366–375. doi:10.1179/026708301101510087.
[6] P. J. Withers, Residual stress and its role in failure, Reports on Progress in Physics 70 (12) (2007)
2211–2264. doi:10.1088/0034-4885/70/12/R04.
[7] W. A. Zdaniewsky, J. C. Conway, H. P. Kirchner, Effect of Joint Thickness and Residual Stresses
on the Properties of Ceramic Adhesive Joints: II. Experimental Results, J. Am. Ceram. Soc.
70 (2) (1987) 110–118.
[8] R. Ming-Hwa, L. Wen-Sen, H. Jer-Ming, Residual stresses in symmetric double lap and
double strap joints, International Journal of Solids and Structures 28 (4) (1991) 449–469.
doi:10.1016/0020-7683(91)90059-O.
35
[9] R. G. Humfeld, D. A. Dillard, Residual stress development in adhesive joints subjected to thermal
cycling, The Journal of Adhesion 65 (1-4) (1998) 277–306. doi:10.1080/00218469808012250.
[10] M. K. Apalak, R. Gunes, S. Eroglu, Thermal residual stresses in an adhesively bonded functionally
graded tubular single lap joint, International Journal of Adhesion and Adhesives 27 (1) (2007)
26–48. doi:10.1016/j.ijadhadh.2005.09.009.
[11] A. Mubashar, I. A. Ashcroft, G. W. Critchlow, A. D. Crocombe, A Method of Predicting the
Stresses in Adhesive Joints after Cyclic Moisture Conditioning, The Journal of Adhesion 87 (9)
(2011) 926–950. doi:10.1080/00218464.2011.600675.
[12] J. A. Nairn, Energy release rate analysis for adhesive and laminate double cantilever beam speci-
mens emphasizing the effect of residual stresses, International Journal of Adhesion and Adhesives
20 (1999) 59–70.
[13] A. G. Evans, J. W. Hutchinson, The Thermomechanical Integrity of Thin Films and Multilayers,
Acta metall. mater. 43 (7) (1995) 2507–2530.
[14] M. A. Eder, R. D. Bitsche, Fracture Analysis of Adhesive Joints in Wind Turbine Blades, Wind
Energy 00 (2012) 1–18. doi:10.1002/we.
[15] M. A. Eder, R. D. Bitsche, M. Nielsen, K. Branner, A practical approach to fracture analysis at
the trailing edge of wind turbine rotor blades, Wind Energy 17 (2014) 483–497. doi:10.1002/we.
[16] P. Haselbach, K. Branner, Effect of Trailing Edge Damage on Full-Scale Wind Turbine Blade
Failure, in: Proceedings of the 20th International Conference on Composite Materials, 2015, pp.
1–12.
[17] P. Haselbach, K. Branner, Initiation of trailing edge failure in full-scale wind turbine blade test,
Engineering Fracture Mechanics 162 (2016) 136–154. doi:10.1016/j.engfracmech.2016.04.041.
[18] S. M. M. Slutter, Crack formation of adhesive bonded joints in wind turbine blades, Tech. rep.,
Aeronautical Engineering of Inholland University of Applied Sciences at Delft (2013).
[19] S. Ataya, M. M. Ahmed, Damages of wind turbine blade trailing edge: Forms, location, and root
causes, Engineering Failure Analysis 35 (2013) 480–488. doi:10.1016/j.engfailanal.2013.05.011.
[20] A. A. Gawandi, L. A. Carlsson, T. A. Bogetti, J. W. Gillespie, Mechanics of discontinuous ceramic
tile core sandwich structure: Influence of thermal and interlaminar stresses, Composite Structures
92 (1) (2010) 164–172. doi:10.1016/j.compstruct.2009.07.022.
36
[21] K. S. Alfredsson, A. A. Gawandi, J. W. Gillespie, L. A. Carlsson, T. A. Bogetti, Stress analysis
of axially and thermally loaded discontinuous tile core sandwich with and without adhesive filled
core gaps, Composite Structures 93 (7) (2011) 1621–1630. doi:10.1016/j.compstruct.2011.01.015.
[22] K. S. Alfredsson, A. A. Gawandi, J. W. Gillespie, L. A. Carlsson, T. A. Bogetti, Flexural analysis
of discontinuous tile core sandwich structure, Composite Structures 94 (5) (2012) 1524–1532.
doi:10.1016/j.compstruct.2011.11.028.
[23] J. W. Gillespie, L. A. Carlsson, A. A. Gawandi, T. A. Bogetti, Fatigue crack growth at the face
sheet-core interface in a discontinuous ceramic-tile cored sandwich structure, Composite Structu-
res 94 (11) (2012) 3186–3193. doi:10.1016/j.compstruct.2012.05.021.
[24] K. W. Garret, J. E. Bailey, Multiple transverse fracture in 90 cross-ply laminates of a glass
fibre-reinforced polyester, Journal of Materials Science 12 (1977) 157–168.
[25] R. Talreja, Fatigue of composite materials: damage mechanisms and fatigue-life diagrams, Proc.
R. Soc. Lond. A. 378 (1981) 461–475. doi:10.1098/rspa.1983.0054.
[26] J. A. Nairn, The Strain Energy Release Rate of Composite Microcracking: A Variational Appro-
ach, Journal of Composite Materials 23 (11) (1989) 1106–1129. doi:10.1177/002199838902301102.
[27] J. Varna, L. Berglund, Multiple transverse cracking and stiffness reduction in cross-ply laminates,
Journal of Composites Technology and Research 13 (2) (1991) 97–106. doi:10.1520/CTR10213J.
[28] R. Talreja, S. Yalvac, L. D. Yats, D. G. Wetters, Transverse cracking and stiffness reduction in
cross ply laminates of different matrix toughness, Journal of Composite Materials 26 (11) (1992)
1644–1663.
[29] J.-M. Berthelot, Transverse cracking and delamination in cross-ply glass-fiber and carbon-fiber
reinforced plastic laminates: Static and fatigue loading, Applied Mechanics Reviews 56 (1) (2003)
111–147. doi:10.1115/1.1519557.
[30] B. F. Sørensen, J. W. Holmes, P. Brøndsted, K. Branner, Blade materials, testing methods and
structural design, in: W. Tong (Ed.), Wind Power Generation and Wind Turbine Design, Vol. 44,
WIT Press, Boston, 2010, Ch. 13, pp. 417–460. doi:10.2495/978-1-84564-.
[31] G. Marsh, The challenge of wind turbine blade repair, Renewable Energy Focus 12 (4) (2011)
62–66. doi:10.1016/S1755-0084(11)70104-1.
[32] D. Cripps, The future of blade repair, Reinforced Plastics 55 (1) (2011) 28–32. doi:10.1016/S0034-
3617(11)70034-0.
37
[33] C. Kong, T. Kim, D. Han, Y. Sugiyama, Investigation of fatigue life for a medium scale compo-
site wind turbine blade, International Journal of Fatigue 28 (10 SPEC. ISS.) (2006) 1382–1388.
doi:10.1016/j.ijfatigue.2006.02.034.
[34] X. Liu, Dynamic Response Analysis of the Blade of Horizontal Axis Wind Turbines, Journal of
Mechanical Engineering 46 (12) (2010) 128. doi:10.3901/JME.2010.12.128.
[35] K. K. Jin, M. Ghulam, J. H. Kim, S. K. Ha, B. Lopez, A. Gorostidi, Life Prediction of Wind
Turbine Blades, in: International Conferences on Composite Materials, 2009, pp. 1–12.
[36] D. Salimi-Majd, V. Azimzadeh, B. Mohammadi, Loading Analysis of Composite Wind Turbine
Blade for Fatigue Life Prediction of Adhesively Bonded Root Joint, Applied Composite Materials
22 (3) (2014) 269–287. doi:10.1007/s10443-014-9405-4.
[37] C. C. Ciang, J.-R. Lee, H.-J. Bang, Structural health monitoring for a wind turbine system: a
review of damage detection methods, Measurement Science and Technology 19 (12) (2008) 122001.
doi:10.1088/0957-0233/19/12/122001.
[38] H. F. Zhou, H. Y. Dou, L. Z. Qin, Y. Chen, Y. Q. Ni, J. M. Ko, A review of full-scale structural
testing of wind turbine blades, Renewable and Sustainable Energy Reviews 33 (2014) 177–187.
doi:10.1016/j.rser.2014.01.087.
[39] X. Chen, W. Zhao, X. L. Zhao, J. Z. Xu, Preliminary failure investigation of a 52.3m
glass/epoxy composite wind turbine blade, Engineering Failure Analysis 44 (11) (2014) 345–350.
doi:10.1016/j.engfailanal.2014.05.024.
[40] M. McGugan, G. Pereira, B. F. Sørensen, H. Toftegaard, K. Branner, Damage tolerance and
structural monitoring for wind turbine blades, Phil. Trans. R. Soc. A 373 (2035) (2015) 1–16.
doi:10.1098/rsta.2014.0077.
[41] D. Li, S.-C. M. Ho, G. Song, L. Ren, H. Li, A review of damage detection methods for wind turbine
blades, Smart Materials and Structures 24 (3) (2015) 033001. doi:10.1088/0964-1726/24/3/033001.
[42] G. Pereira, M. McGugan, L. P. Mikkelsen, Method for independent strain and temperature me-
asurement in polymeric tensile test specimen using embedded FBG sensors, Polymer Testing 50
(2016) 125–134. doi:10.1016/j.polymertesting.2016.01.005.
[43] G. Pereira, L. P. Mikkelsen, M. McGugan, Fibre Bragg Grating Sensor Signal Post-processing
Algorithm: Crack Growth Monitoring in Fibre Reinforced Plastic Structures, in: P. Ribeiro,
M. Raposo (Eds.), Springer Proceedings in Physics - Photoptics 2015, Vol. 181, 2016, pp. 63–80.
doi:10.1007/978-3-319-30137-2.
38
[44] J. Guemes, J. Sierra-Perez, Fiber optic sensors, Springer, 2013. doi:10.1134/S0018143908070096.
[45] W. Ostachowicz, J. Guemes, New Trends in Structural Health Monitoring, Springer, 2013.
doi:10.1134/S0018143908070096.
[46] H. Tada, P. C. Paris, G. R. Irwin, The Stress Analysis of Cracks Handbook, 3rd Edition, ASME
Press, New York, 2000.
[47] B. F. Sørensen, H. Toftegaard, S. Linderoth, M. Lundberg, S. Feih, Strength and failure mo-
des of ceramic multilayers, Journal of the European Ceramic Society 32 (16) (2012) 4165–4176.
doi:10.1016/j.jeurceramsoc.2012.06.012.
[48] J. Beuth, Cracking of thin bonded films in residual tension, Int. J. Solids Structures 2 (13) (1992)
1657–1675.
[49] S. Fenster, A. Ugural, Advanced Strength and Applied Elasticity, 4th Edition, Prentice Hall,
Upper Saddle River, New Jersey, 2003.
[50] R. D. Cook, D. S. Malkus, M. E. Plesha, R. J. Witt, Concepts and applications of finite element
analysis, 4th Edition, Wiley, United States, 2001.
[51] A. Love, A Treatise on the Mathematical Theory of Elasticity, 4th Edition, At the University
Press, Cambridge, 1927.
[52] S. S. Timoshenko, History of Strength of Materials, The maple press company, New York, 1953.
doi:10.1016/0022-5096(54)90010-1.
[53] J. R. Rice, P. C. Paris, J. G. Merkle, Some further results of J-integral analysis and esti-
mates, Progress in Flaw Growth and Fracture Toughness Testing 536 (536) (1973) 231–245.
doi:10.1520/STP49643S.
[54] G. Irwin, D. Washington, Analysis of Stresses and Strains Near the End of a Crack Traversing a
Plate, Journal of Applied Mechanics 24 (1957) 361–364.
[55] J. Huther, P. Brøndsted, The Influence of the Curing Cycles on the Fatigue Performance of Uni-
directional Glass Fiber Reinforced Epoxy Composites, IOP Conference Series: Materials Science
and Engineering 139 (2016) 1–11. doi:10.1088/1757-899X/139/1/012023.
39

APPENDED PAPERP2
The effect of buffer-layer on the steady-stateenergy release rate of a tunneling crack in a
wind turbine blade joint
Jeppe B. Jørgensen, Bent F. Sørensen and Casper KildegaardComposite StructuresSubmitted, 2017
The effect of buffer-layer on the steady-state energy release rate of atunneling crack in a wind turbine blade joint
Jeppe B. Jørgensena,b,∗, Bent F. Sørensenb, Casper Kildegaarda
aLM Wind Power, Østre Alle 1, 6640 Lunderskov, Denmark.bThe Technical University of Denmark, Dept. of Wind Energy, Frederiksborgvej 399, 4000 Roskilde, Denmark.
Abstract
The effect of a buffer-layer on the steady-state energy release rate of a tunneling crack in the adhesive
layer of a wind turbine blade joint, loaded in tension, is investigated using a parametric 2D tri-material
finite element model. The idea of embedding a buffer-layer in-between the adhesive and the basis glass
fiber laminate to improve the existing joint design is novel, but the implications hereof need to be
addressed.
The results show that it is advantageous to embed a buffer-layer near the adhesive with controllable
thickness- and stiffness properties in order to improve the joint design against propagation of tunneling
cracks. However, for wind turbine blade relevant material combinations it is found more effective to
reduce the thickness of the adhesive layer since the stiffness mismatch between the existing laminate
and the adhesive is already high. The effect of material orthotropy was found to be relatively small
for the blade relevant materials.
Keywords: Tunneling crack, Adhesive bonded joints, Fracture mechanics, Polymer matrix
composites, Finite element analysis
Nomenclature
E1 Young’s modulus of substrate
E2 Young’s modulus of adhesive
E3 Young’s modulus of buffer-layer
E1 plane strain Young’s modulus of substrate
E2 plane strain Young’s modulus of adhesive
∗Corresponding authorEmail address: [email protected] (Jeppe B. Jørgensen)
Preprint submitted to Composite Structures September 27, 2017
E3 plane strain Young’s modulus of buffer-layer
F non-dimensional function
Gss mode-I steady-state energy release rate
Gxy shear modulus
h1 thickness of substrate
h2 half thickness of the adhesive layer
h3 thickness of buffer-layer
x, y, z coordinates
α12 first Dundurs’ parameter (substrate/adhesive)
α32 first Dundurs’ parameter (buffer-layer/adhesive)
β12 second Dundurs’ parameter (substrate/adhesive)
β32 second Dundurs’ parameter (buffer-layer/adhesive)
δcod crack opening displacement profile
λ first orthotropy parameter
ν Poisson’s ratio
ρ second orthotropy parameter
σyy,2 stress in the adhesive (y-direction)
Biax bi-axial
FE finite element
UD uni-directional
1. Introduction
A typical wind turbine blade joint is manufactured of a structural adhesive layer that is bonding
two glass fiber laminated shells meaning that the structural adhesive is constrained in-between stiffer
laminates. This is exemplified in Figure 1 (A) for a trailing-edge joint in a wind turbine blade.
Observations from full scale blade tests of this joint with tensile stresses, σyy,2, in the adhesive, show
that cracks can initiate at the free-edge and propagate through the adhesive layer as a so-called
tunneling crack. The tunneling crack is constrained by the laminates as shown in the sketch in Figure
1 (A) and the photo in Figure 1 (B).
2
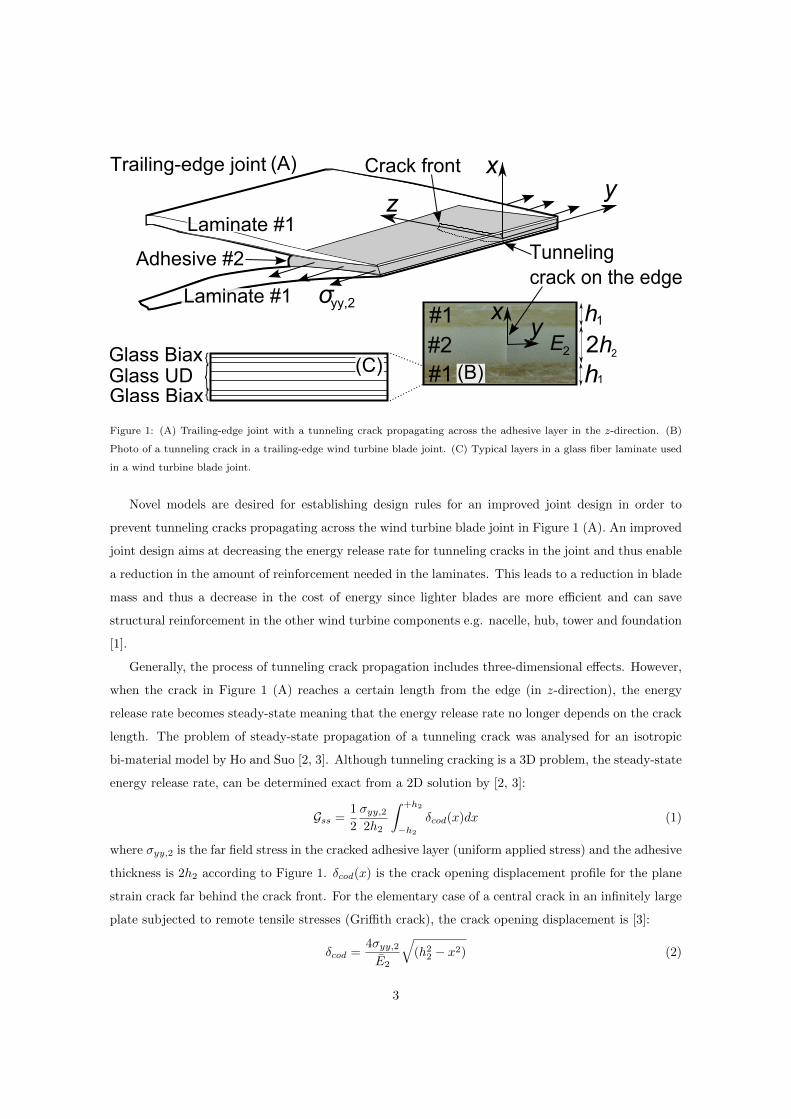
xy
Trailing-edge joint
Adhesive #2
(A)
Glass Biax
Glass BiaxGlass UD
Tunneling crack on the edge
z
xy
Crack front
Laminate #1
(C)
Laminate #1
yy,2σ
E2 2h2
h1
h1
#1#2#1
(B)
Figure 1: (A) Trailing-edge joint with a tunneling crack propagating across the adhesive layer in the z-direction. (B)
Photo of a tunneling crack in a trailing-edge wind turbine blade joint. (C) Typical layers in a glass fiber laminate used
in a wind turbine blade joint.
Novel models are desired for establishing design rules for an improved joint design in order to
prevent tunneling cracks propagating across the wind turbine blade joint in Figure 1 (A). An improved
joint design aims at decreasing the energy release rate for tunneling cracks in the joint and thus enable
a reduction in the amount of reinforcement needed in the laminates. This leads to a reduction in blade
mass and thus a decrease in the cost of energy since lighter blades are more efficient and can save
structural reinforcement in the other wind turbine components e.g. nacelle, hub, tower and foundation
[1].
Generally, the process of tunneling crack propagation includes three-dimensional effects. However,
when the crack in Figure 1 (A) reaches a certain length from the edge (in z-direction), the energy
release rate becomes steady-state meaning that the energy release rate no longer depends on the crack
length. The problem of steady-state propagation of a tunneling crack was analysed for an isotropic
bi-material model by Ho and Suo [2, 3]. Although tunneling cracking is a 3D problem, the steady-state
energy release rate, can be determined exact from a 2D solution by [2, 3]:
Gss =1
2
σyy,22h2
∫ +h2
−h2
δcod(x)dx (1)
where σyy,2 is the far field stress in the cracked adhesive layer (uniform applied stress) and the adhesive
thickness is 2h2 according to Figure 1. δcod(x) is the crack opening displacement profile for the plane
strain crack far behind the crack front. For the elementary case of a central crack in an infinitely large
plate subjected to remote tensile stresses (Griffith crack), the crack opening displacement is [3]:
δcod =4σyy,2E2
√(h22 − x2) (2)
3
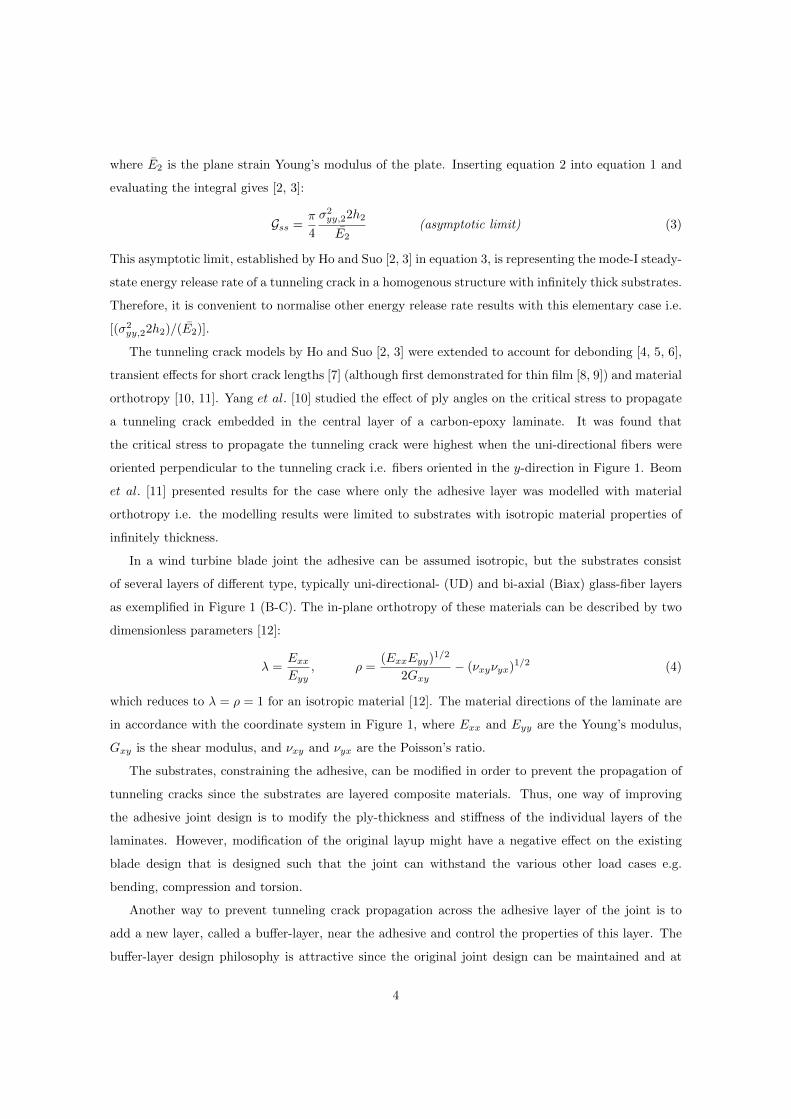
where E2 is the plane strain Young’s modulus of the plate. Inserting equation 2 into equation 1 and
evaluating the integral gives [2, 3]:
Gss =π
4
σ2yy,22h2
E2(asymptotic limit) (3)
This asymptotic limit, established by Ho and Suo [2, 3] in equation 3, is representing the mode-I steady-
state energy release rate of a tunneling crack in a homogenous structure with infinitely thick substrates.
Therefore, it is convenient to normalise other energy release rate results with this elementary case i.e.
[(σ2yy,22h2)/(E2)].
The tunneling crack models by Ho and Suo [2, 3] were extended to account for debonding [4, 5, 6],
transient effects for short crack lengths [7] (although first demonstrated for thin film [8, 9]) and material
orthotropy [10, 11]. Yang et al. [10] studied the effect of ply angles on the critical stress to propagate
a tunneling crack embedded in the central layer of a carbon-epoxy laminate. It was found that
the critical stress to propagate the tunneling crack were highest when the uni-directional fibers were
oriented perpendicular to the tunneling crack i.e. fibers oriented in the y-direction in Figure 1. Beom
et al. [11] presented results for the case where only the adhesive layer was modelled with material
orthotropy i.e. the modelling results were limited to substrates with isotropic material properties of
infinitely thickness.
In a wind turbine blade joint the adhesive can be assumed isotropic, but the substrates consist
of several layers of different type, typically uni-directional- (UD) and bi-axial (Biax) glass-fiber layers
as exemplified in Figure 1 (B-C). The in-plane orthotropy of these materials can be described by two
dimensionless parameters [12]:
λ =Exx
Eyy, ρ =
(ExxEyy)1/2
2Gxy− (νxyνyx)1/2 (4)
which reduces to λ = ρ = 1 for an isotropic material [12]. The material directions of the laminate are
in accordance with the coordinate system in Figure 1, where Exx and Eyy are the Young’s modulus,
Gxy is the shear modulus, and νxy and νyx are the Poisson’s ratio.
The substrates, constraining the adhesive, can be modified in order to prevent the propagation of
tunneling cracks since the substrates are layered composite materials. Thus, one way of improving
the adhesive joint design is to modify the ply-thickness and stiffness of the individual layers of the
laminates. However, modification of the original layup might have a negative effect on the existing
blade design that is designed such that the joint can withstand the various other load cases e.g.
bending, compression and torsion.
Another way to prevent tunneling crack propagation across the adhesive layer of the joint is to
add a new layer, called a buffer-layer, near the adhesive and control the properties of this layer. The
buffer-layer design philosophy is attractive since the original joint design can be maintained and at
4

the same time, by adding the buffer-layer, the joint design can be improved against the propagation
of tunneling cracks. Furthermore, it is well known for thin films that it is the thickness and stiffness
of the layer closest to the adhesive that has the greatest constraining effect on the crack [13].
The objective of this research is to study the effect of in-plane stiffness, E, and layer-thickness, h,
on the steady-state energy release rate, Gss, using finite element (FE) models. More specifically, it is
the aim to determine the effect of a buffer-layer on the steady-state energy release rate for an isolated
tunneling crack in the adhesive layer of a wind turbine blade joint. This should lead to design rules for
an improved bonded joint design. The primary applicability is for wind turbine blade relevant joint
design and -material combinations since there is a high demand for novel design rules for adhesive
joints in the wind turbine blade industry.
The design idea of a buffer-layer for improvement of a wind turbine blade joint is novel and the
implications and effects of this buffer-layer need to be investigated before potential implementation
in the future joint design. Therefore, parameter studies with a new symmetric tri-material FE model
is used to address the design challenge. Furthermore, the study of steady-state tunnel cracking for a
multi-layered sandwich structure with orthotropic substrates has not been addressed in the literature.
This includes the applicability on wind turbine blade joints with realistic material combinations.
The paper is organised as follows. In section 2 the materials and the problem are defined, and
in section 3 the finite element modelling techniques are described. Hereafter, tunneling cracking in a
generalised perspective is analysed using first bi-material FE models in section 4 and tri-material FE
models in section 5 (see Figure 2). In section 6, a case study with blade relevant materials demonstrates
how a wind turbine blade joint design are influenced by the presence of a buffer-layer including the
effect of material orthotropy. Finally, a discussion and conclusion highlights the major findings of the
present study.
2. Problem definition
The problem we investigate in the present study is that of an isolated tunneling crack in Figure
2 (A), which is used to clarify the effect of substrate stiffness- and thickness, and used to test the
implementation of the numerical models. This model is extended by embedding a buffer-layer, na-
med material #3 in Figure 2 (B), to analyse the effect of buffer-layer thickness and -stiffness on the
steady-state energy release rate of a tunneling crack. The model is limited to three layers since more
layers complicate the modelling unnecessarily. The effect of material orthotropy of the substrates
is investigated in order to test whether it is feasible to model blade relevant materials as isotropic
materials.
Since stress is applied as boundary condition in the tunneling crack models, Dundurs’ parameters
5
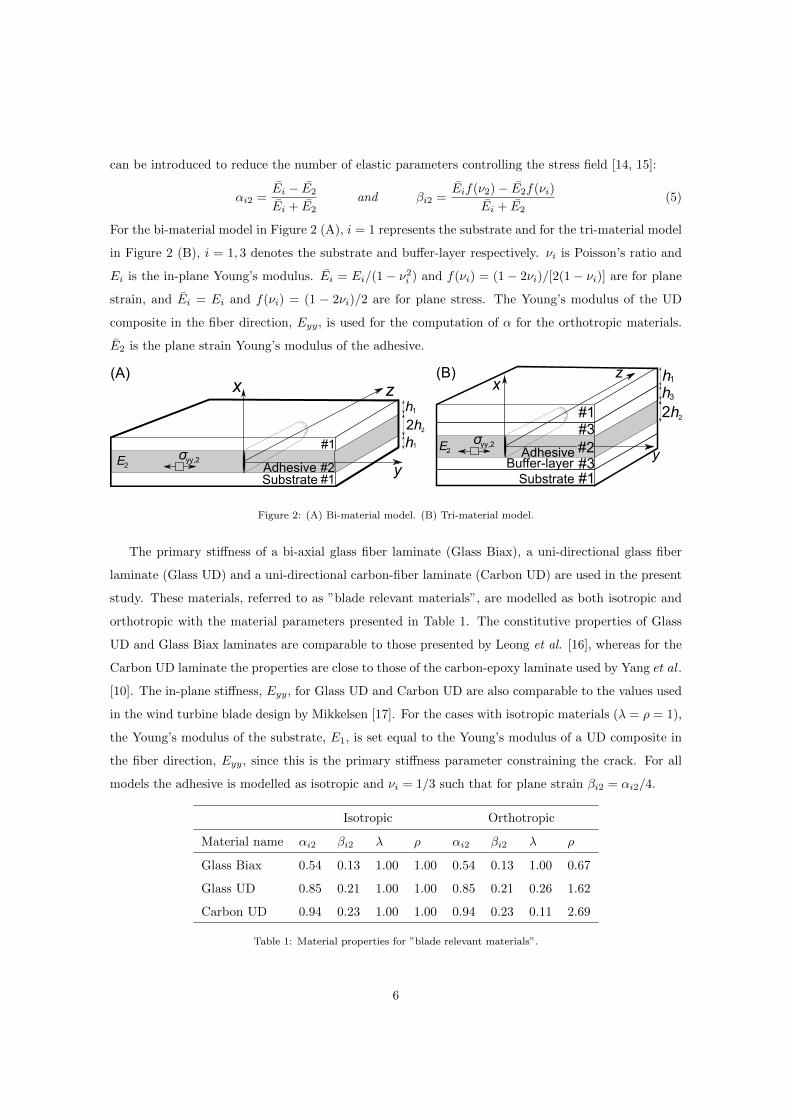
can be introduced to reduce the number of elastic parameters controlling the stress field [14, 15]:
αi2 =Ei − E2
Ei + E2and βi2 =
Eif(ν2)− E2f(νi)
Ei + E2(5)
For the bi-material model in Figure 2 (A), i = 1 represents the substrate and for the tri-material model
in Figure 2 (B), i = 1, 3 denotes the substrate and buffer-layer respectively. νi is Poisson’s ratio and
Ei is the in-plane Young’s modulus. Ei = Ei/(1− ν2i ) and f(νi) = (1− 2νi)/[2(1− νi)] are for plane
strain, and Ei = Ei and f(νi) = (1 − 2νi)/2 are for plane stress. The Young’s modulus of the UD
composite in the fiber direction, Eyy, is used for the computation of α for the orthotropic materials.
E2 is the plane strain Young’s modulus of the adhesive.
2h2
h1
hx
y
z
#1
#1
1
#2
x
y
z
Adhesive
SubstrateBuffer-layer
#1#3
#1#3
σ yy,2
2h2
h1h3
(A) (B)
AdhesiveSubstrate
#2σ yy,2E2
E2
Figure 2: (A) Bi-material model. (B) Tri-material model.
The primary stiffness of a bi-axial glass fiber laminate (Glass Biax), a uni-directional glass fiber
laminate (Glass UD) and a uni-directional carbon-fiber laminate (Carbon UD) are used in the present
study. These materials, referred to as ”blade relevant materials”, are modelled as both isotropic and
orthotropic with the material parameters presented in Table 1. The constitutive properties of Glass
UD and Glass Biax laminates are comparable to those presented by Leong et al. [16], whereas for the
Carbon UD laminate the properties are close to those of the carbon-epoxy laminate used by Yang et al.
[10]. The in-plane stiffness, Eyy, for Glass UD and Carbon UD are also comparable to the values used
in the wind turbine blade design by Mikkelsen [17]. For the cases with isotropic materials (λ = ρ = 1),
the Young’s modulus of the substrate, E1, is set equal to the Young’s modulus of a UD composite in
the fiber direction, Eyy, since this is the primary stiffness parameter constraining the crack. For all
models the adhesive is modelled as isotropic and νi = 1/3 such that for plane strain βi2 = αi2/4.
Isotropic Orthotropic
Material name αi2 βi2 λ ρ αi2 βi2 λ ρ
Glass Biax 0.54 0.13 1.00 1.00 0.54 0.13 1.00 0.67
Glass UD 0.85 0.21 1.00 1.00 0.85 0.21 0.26 1.62
Carbon UD 0.94 0.23 1.00 1.00 0.94 0.23 0.11 2.69
Table 1: Material properties for ”blade relevant materials”.
6

3. Finite element modelling of a tunneling crack
In the present study δcod(x) in equation 1 is determined by a 2D FE model with eight-noded plane
strain elements simulated in Abaqus CAE 6.14 (Dassault Systemes). Numerical integration is used to
evaluate the integral in equation 1. The steady-state energy release rate, Gss, for the tunneling crack
in the bi-material structure, shown in Figure 2 (A), is determined by:
E2Gssσ2yy,22h2
= F (α12, β12, h1/h2) (6)
where F (α12, β12, h1/h2) is a non-dimensional function, determined numerically, that accounts for the
stiffness mismatch and geometry [2]. The steady-state energy release rate for the tunneling crack in
the tri-material structure, shown in Figure 2 (B), can be written as:
E2Gssσ2yy,22h2
= F (α12, α32, β12, β32, h1/h2, h3/h2) (7)
where again the non-dimensional function, F , is determined numerically. For both the bi- and tri-
material models, the smallest element side length is 0.025h2 and approximately 80 elements (eight-
noded plane strain) are used across the thickness of the adhesive.
4. Results from tunneling crack bi-material FE model
Figure 3 (B) shows finite element results; F (α12, β12 = α12/4, h1/h2) decreases with increasing
substrate stiffness and -thickness. Comparing the FE results for h1/h2 = 2.0 with the results by Ho
and Suo [2] shows that the maximum deviation is below 2%, which indicates that the numerical imple-
mentation is sufficiently accurate. The maximum deviation is identified for very compliant substrates.
For α12 = 0.0 in Figure 3 (A), the deviation between the numerical solution and the asymptotic limit
(Ho and Suo [2]) of π/4 in equation 3 is less than 0.3% when h1/h2 ≥ 6.0. Furthermore, Figure 3 (A)
shows that for decreasing elastic mismatch, α12, the larger h1/h2 must be for Gss to reach a constant
value. In Figure 3 (B) an approximate asymptotic limit is identified; when α12 → 1.0 and h1/h2 →∞then F (α12, β12 = α12/4, h1/h2) ≈ 1/2.
Figure 4 shows the effect of increasing substrate thickness on F (α12, β12 = α12/4, h1/h2) for blade
relevant materials. For all types of substrates, where the stiffness of the blade relevant materials are
relatively high in comparison with the adhesive, F (α12, β12 = α12/4, h1/h2) starts high, decays and
approaches a steady level when h1/h2 ≥ 4.0, see Figure 4. The maximum relative deviation between
the models with isotropic- and orthotropic material properties in Figure 4 are 1.9%, 6.0% and 7.2%
for Glass Biax, Glass UD and Carbon UD, respectively.
For orthotropic Glass Biax (for which ρ < 1.0 i.e. the shear modulus, Gxy, is larger for the
orthotropic material than for the corresponding isotropic material) the curve in Figure 4 is slightly
7

1.0 0.5 0.0 0.5 1.00.0
0.5
1.0
1.5
2.0
2.5
3.0
3.5
4.0
4.5
[-]α12[-
]
(B)
= 0.5= 1.0= 2.0= 4.0= 10.0
= 2.02
σ2h
2yy
,2E
ss2
(
)/
(
)
0 2 4 6 8 100.0
0.5
1.0
1.5
2.0
2.5
3.0
3.5
4.0
4.5
= − 0.80
= − 0.50
= 0.00
= 0.80
= 0.50
2σ
2h2
yy,2
Ess
2(
)/(
)
(A)
= 0.00
E1
E1
E2 2h2
h1
h
x
y
z
σ yy,2
#1
#11
#2E1
E1
E2 2h2
h1
h
x
y
z
σ yy,2
#1
#11
#2[-]
h /h [-]1 2
(Asymptotic limit) (Ho and Suo)α12
α12 α12
α12
α12
α12 h /h 1 2
h /h 1 2
h /h 1 2
h /h 1 2
h /h 1 2
h /h 1 2
G G
Figure 3: Steady-state energy release rate results for different h1/h2 and α12: (A) from bi-material FE model compared
with the asymptotic limit (π/4) from Ho and Suo [2] that is valid for infinitely thick substrates. (B) from bi-material
FE model compared with the results by Ho and Suo [2]. Note, for both models β12 = α12/4.
0 2 4 6 8 100.4
0.5
0.6
0.7
0.8
0.9
1.0
E2
2h2
h1
hx
y
z
σ yy,2
#1
#1
1
#2
Glass UD Glass Biax
Carbon UD
2σ
2h2
yy,2
Ess
2(
)/(
)[-
]
/h [-]1 2h
G
Figure 4: Steady-state energy release rate results from a bi-material FE model for ”blade relevant materials” for different
stiffness mismatch and with β12 = α12/4. Solid lines and dashed lines represent isotropic- and orthotropic material
properties, respectively.
8

below the curve of the isotropic material. For Glass UD and Carbon UD where ρ > 1.0, the energy
release rate is higher for the orthotropic case than for the isotropic case.
5. Results from tri-material FE model - generalised joint design
Figure 5 illustrates the influence of buffer-layer thickness and -stiffness on Gss when h1/h2 = 1.0.
For all cases in Figure 5 it is evident that an increase in α32 decreases Gss. It is seen that an increase
of buffer-layer thickness, h3/h2, decreases Gss if α32 & α12. Note, that the limit values indicated by
arrows in Figure 5 are determined using the bi-material FE model at h3/h2 = 10. These limit values
are identical to the results from the bi-material FE model in Figure 3 at h1/h2 = 10 indicating that
for high buffer-layer thickness, the buffer-layer is the primary layer controlling Gss (not the substrate).
0.0 0.5 1.0 1.5 2.00.5
1.0
1.5
2.0
0.0 0.5 1.0 1.5 2.00.5
1.0
1.5
2.0
0.0 0.5 1.0 1.5 2.00.5
1.0
1.5
2.0
2.14
1.24
0.78
0.590.51
2.14
1.24
0.78
0.590.51
2.14
1.24
0.78
0.590.51
2σ
2h2
yy,2
Ess
2(
)/(
)[-
]
2σ
2h2
yy,2
Ess
2(
)/(
)[-
]
2σ
2h2
yy,2
Ess
2(
)/(
)[-
]
(A) (B)
(C)
α12=-0.5α12=0.0
α12=0.5
α32 = − 0.8
α32 = − 0.5
α32 = 0.0
α32 = 0.5α32 = 0.8
α32 = − 0.8
α32 = − 0.5
α32 = 0.0α32 = 0.5α32 = 0.8
α32 = − 0.8
α32 = − 0.5
α32 = 0.0α32 = 0.5α32 = 0.8
h /h [-]3 2
2.25 2.25
2.25
0.0 0.5 1.0 1.5 2.00.5
1.0
1.5
2.0
2.14
1.24
0.78
0.590.51
(D) α12=0.9
2σ
2h2
yy,2
Ess
2(
)/(
)[-
]
α32 = − 0.8
α32 = 0.0α32 = 0.5
α32 = 0.8
α32 = − 0.5
h /h [-]3 2
h /h [-]3 2h /h [-]3 2
GG G
G
Figure 5: Steady-state energy release rate results from a symmetric tri-material FE model with isotropic materials and
selected parameters fixed: βi2 = αi2/4, h1/h2 = 1.0. Substrate stiffness mismatch of: (A) α12 = −0.5, (B) α12 = 0.0,
(C) α12 = 0.5 and (D) α12 = 0.9.
Further design curves are presented in Figure 6 where α32 is varied for different h3/h2 and α12.
The design curves in Figure 6 for each stiffness mismatch, α12, intersect at a specific point, namely the
”point of intersection” (PoI) that is marked with ”X” in Figure 6. On the right hand side of the ”point
of intersection” (α32 > PoI), it is advantageous to increase the buffer-layer thickness, whereas on the
9

left hand side of the ”point of intersection” (α32 < PoI), it is advantageous to decrease the buffer-layer
thickness. It is also evident from Figure 6 that with increasing α12 the ”point of intersection” moves
to the right (to a larger α32 value).
1.0 0.5 0.0 0.5 1.00.5
1.0
1.5
2.0
2.5
3.0
1.0 0.5 0.0 0.5 1.00.5
1.0
1.5
2.0
2.5
3.0
1.0 0.5 0.0 0.5 1.00.5
1.0
1.5
2.0
2.5
3.0
2σ
2h2
yy,2
Ess
2(
)/(
)[-
]
2σ
2h2
yy,2
Ess
2(
)/(
)[-
]
2σ
2h2
yy,2
Ess
2(
)/(
)[-
]
(A) (B)
(C)
α12=-0.5 α12=0.0
α12=0.5
PoIx PoI
x PoI
α32 [-]
α32 [-]
α32 [-]
1.0 0.5 0.0 0.5 1.00.5
1.0
1.5
2.0
2.5
3.0
x
h3 / h2 = 0.5h3 / h2 = 1.0h3 / h2 = 2.0h3 / h2 = 4.0h3 / h2 = 10.0
α32 [-]x
PoI
α12=0.9
(D)
2σ
2h2
yy,2
Ess
2(
)/(
)[-
]
h3 / h2 = 0.5h3 / h2 = 1.0h3 / h2 = 2.0h3 / h2 = 4.0h3 / h2 = 10.0
h3 / h2 = 0.5h3 / h2 = 1.0h3 / h2 = 2.0h3 / h2 = 4.0h3 / h2 = 10.0
h3 / h2 = 0.5h3 / h2 = 1.0h3 / h2 = 2.0h3 / h2 = 4.0h3 / h2 = 10.0
GG G
G
Figure 6: Steady-state energy release rate results from a symmetric tri-material FE model with isotropic materials and
selected parameters fixed: βi2 = αi2/4, h1/h2 = 1.0. Substrate stiffness mismatch of: (A) α12 = −0.5, (B) α12 = 0.0,
(C) α12 = 0.5 and (D) α12 = 0.9.
The best choice (i.e. the one that gives the lowest energy-release rate) of buffer-layer thickness
and stiffness depends on the stiffness of the basis substrate, α12. Without prior knowledge of the
modeling result it would be expected that the stiffness of the buffer-layer should be a least the stiffness
of the substrate in order to reduce the energy release rate. However, the value of α32 at the ”point of
intersection” is less than the value of α12 in the models in Figure 6. For instance, it is seen in Figure
6 (C) that the PoI is located at α32 ≈ 0.25, whereas α12 = 0.5 for the model in Figure 6 (C). Thus,
the ”point of intersection” must be determined accurately in order to ensure that Gss decreases with
increasing h3/h2. An additional study of the transition at the ”point of intersection” is presented in
Appendix A. In the overall picture, changing the stiffness of the basis substrate (α12) has a small
effect on the steady-state energy release rate of the tunneling crack.
10

6. Results for case study with blade relevant materials
The parametric 2D plane strain FE model of an isolated tunneling crack with a buffer-layer, denoted
material #3 in Figure 7, is used to investigate the effect of buffer-layer thickness and -stiffness on Gssfor blade relevant material combinations including the effect of material orthotropy. The stiffness of
the substrate (material #1) is equal to that of Glass UD (α12 = 0.85).
First the results for the case where the stiffness of the buffer-layer (material #3) is similar to that
of Glass Biax (α32 = 0.54) is presented. The curves in Figure 7 for Glass Biax shows that an increase
of the buffer-layer thickness, h3, actually increases Gss although the total thickness of the substrate
(h1 + h3) becomes larger. This can be understood in that with increasing h3, the stiffer material #1
is moved further away from the tunneling crack tip hence reducing the constraint, but also by the
decreased stiffness of the layer closest to the adhesive.
0.0 0.5 1.0 1.5 2.00.48
0.50
0.52
0.54
0.56
0.58
x
y
z
Adhesive
SubstrateBuffer-layer
#1#3
#1#3
σ yy,2
2h2
h1
h3
h /h =1.01 2
h /h =2.01 2
h /h =2.01 2
h /h [-]3 2
2σ
2h2
yy,2
E
ss2
(
)/
(
)
[-]
Glass Biax (isotropic)
Glass Biax (orthotropic)
Carbon UD (orthotropic)
0.565 (limit for Glass Biax - orthotropic)
0.513 (limit for Carbon UD - orthotropic)
0.576 (limit for Glass Biax - isotropic)
0.475 (limit for Carbon UD - isotropic)
Carbon UD (isotropic)h /h =1.01 2
E2 #2G
Figure 7: Steady-state energy release rate results from a symmetric tri-material FE model with blade relevant material
combinations. Solid lines and dashed lines represent isotropic- and orthotropic material properties, respectively. The
limit values indicated by arrows are determined using the results of the bi-material FE model at h3/h2 = 10 in Figure 4.
Figure 7 also includes results for a buffer-layer with stiffness of a Carbon UD laminate (α32 = 0.94).
The thickness, h3, of material #3 is varied and the results show that a design for reducing Gss would
consist of a thick and stiff layer closest to the adhesive e.g. a Carbon UD laminate. Gss is decreased
by approx. 5% for by adding the carbon UD buffer-layer with thickness h3/h2 = 1.0 to the Glass
UD substrate (h1/h2 = 1.0). The largest deviation between Carbon UD isotropic and -orthotropic is
approximately 7%, whereas the largest deviation between buffer-layers of Glass Biax and Carbon UD
(isotropic) in Figure 7 is about 18%. Note, that the limit values indicated by arrows in Figure 7 are
determined using the results of the bi-material FE model at h3/h2 = 10 in Figure 4.
The results in Figure 7 for Carbon UD can also be used to determine the best compromise between
11
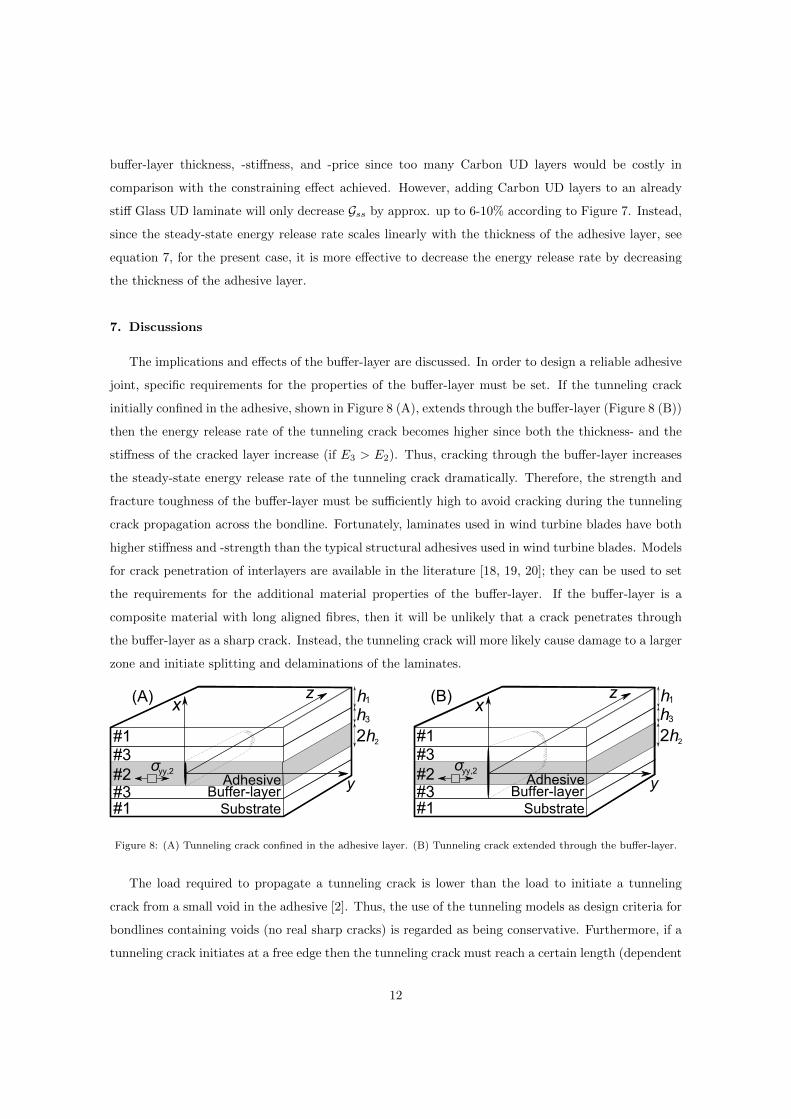
buffer-layer thickness, -stiffness, and -price since too many Carbon UD layers would be costly in
comparison with the constraining effect achieved. However, adding Carbon UD layers to an already
stiff Glass UD laminate will only decrease Gss by approx. up to 6-10% according to Figure 7. Instead,
since the steady-state energy release rate scales linearly with the thickness of the adhesive layer, see
equation 7, for the present case, it is more effective to decrease the energy release rate by decreasing
the thickness of the adhesive layer.
7. Discussions
The implications and effects of the buffer-layer are discussed. In order to design a reliable adhesive
joint, specific requirements for the properties of the buffer-layer must be set. If the tunneling crack
initially confined in the adhesive, shown in Figure 8 (A), extends through the buffer-layer (Figure 8 (B))
then the energy release rate of the tunneling crack becomes higher since both the thickness- and the
stiffness of the cracked layer increase (if E3 > E2). Thus, cracking through the buffer-layer increases
the steady-state energy release rate of the tunneling crack dramatically. Therefore, the strength and
fracture toughness of the buffer-layer must be sufficiently high to avoid cracking during the tunneling
crack propagation across the bondline. Fortunately, laminates used in wind turbine blades have both
higher stiffness and -strength than the typical structural adhesives used in wind turbine blades. Models
for crack penetration of interlayers are available in the literature [18, 19, 20]; they can be used to set
the requirements for the additional material properties of the buffer-layer. If the buffer-layer is a
composite material with long aligned fibres, then it will be unlikely that a crack penetrates through
the buffer-layer as a sharp crack. Instead, the tunneling crack will more likely cause damage to a larger
zone and initiate splitting and delaminations of the laminates.
x
y
z
Adhesive
SubstrateBuffer-layer
#1
#2#3
#1#3
σ yy,2
2h2
h1h3
(A) (B) x
y
z
Adhesive
SubstrateBuffer-layer
#1
#2#3
#1#3
σ yy,2
2h2
h1h3
Figure 8: (A) Tunneling crack confined in the adhesive layer. (B) Tunneling crack extended through the buffer-layer.
The load required to propagate a tunneling crack is lower than the load to initiate a tunneling
crack from a small void in the adhesive [2]. Thus, the use of the tunneling models as design criteria for
bondlines containing voids (no real sharp cracks) is regarded as being conservative. Furthermore, if a
tunneling crack initiates at a free edge then the tunneling crack must reach a certain length (dependent
12
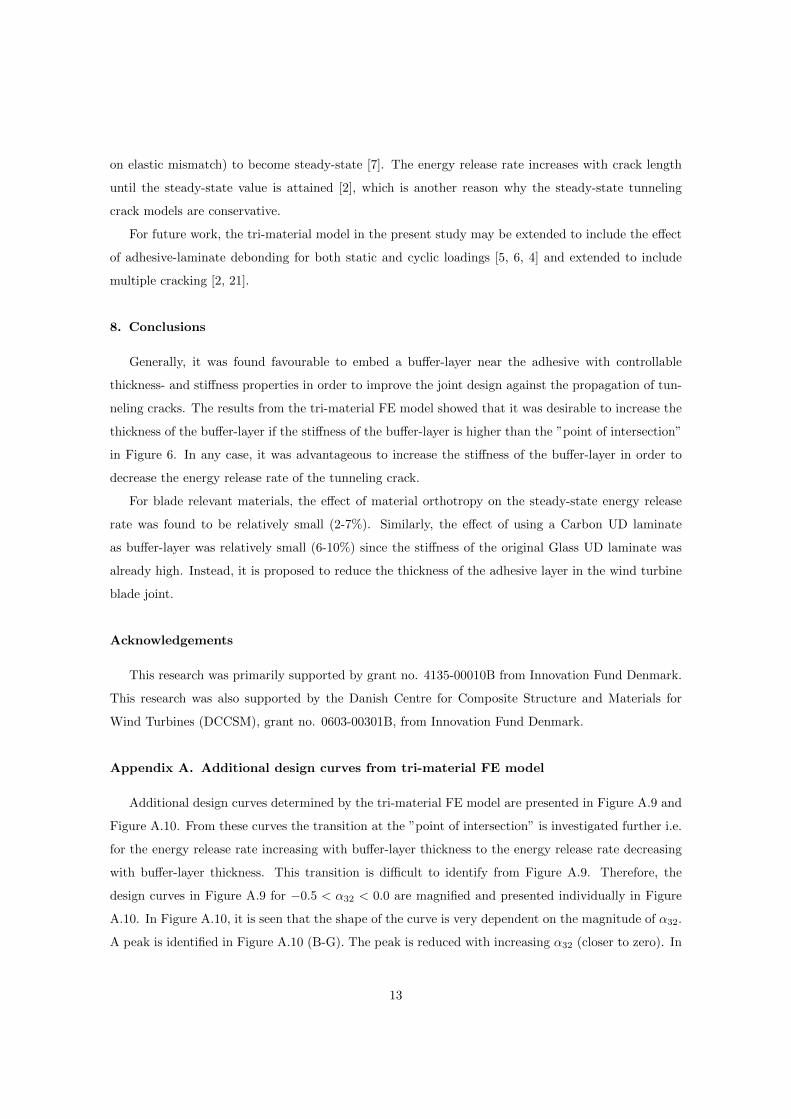
on elastic mismatch) to become steady-state [7]. The energy release rate increases with crack length
until the steady-state value is attained [2], which is another reason why the steady-state tunneling
crack models are conservative.
For future work, the tri-material model in the present study may be extended to include the effect
of adhesive-laminate debonding for both static and cyclic loadings [5, 6, 4] and extended to include
multiple cracking [2, 21].
8. Conclusions
Generally, it was found favourable to embed a buffer-layer near the adhesive with controllable
thickness- and stiffness properties in order to improve the joint design against the propagation of tun-
neling cracks. The results from the tri-material FE model showed that it was desirable to increase the
thickness of the buffer-layer if the stiffness of the buffer-layer is higher than the ”point of intersection”
in Figure 6. In any case, it was advantageous to increase the stiffness of the buffer-layer in order to
decrease the energy release rate of the tunneling crack.
For blade relevant materials, the effect of material orthotropy on the steady-state energy release
rate was found to be relatively small (2-7%). Similarly, the effect of using a Carbon UD laminate
as buffer-layer was relatively small (6-10%) since the stiffness of the original Glass UD laminate was
already high. Instead, it is proposed to reduce the thickness of the adhesive layer in the wind turbine
blade joint.
Acknowledgements
This research was primarily supported by grant no. 4135-00010B from Innovation Fund Denmark.
This research was also supported by the Danish Centre for Composite Structure and Materials for
Wind Turbines (DCCSM), grant no. 0603-00301B, from Innovation Fund Denmark.
Appendix A. Additional design curves from tri-material FE model
Additional design curves determined by the tri-material FE model are presented in Figure A.9 and
Figure A.10. From these curves the transition at the ”point of intersection” is investigated further i.e.
for the energy release rate increasing with buffer-layer thickness to the energy release rate decreasing
with buffer-layer thickness. This transition is difficult to identify from Figure A.9. Therefore, the
design curves in Figure A.9 for −0.5 < α32 < 0.0 are magnified and presented individually in Figure
A.10. In Figure A.10, it is seen that the shape of the curve is very dependent on the magnitude of α32.
A peak is identified in Figure A.10 (B-G). The peak is reduced with increasing α32 (closer to zero). In
13
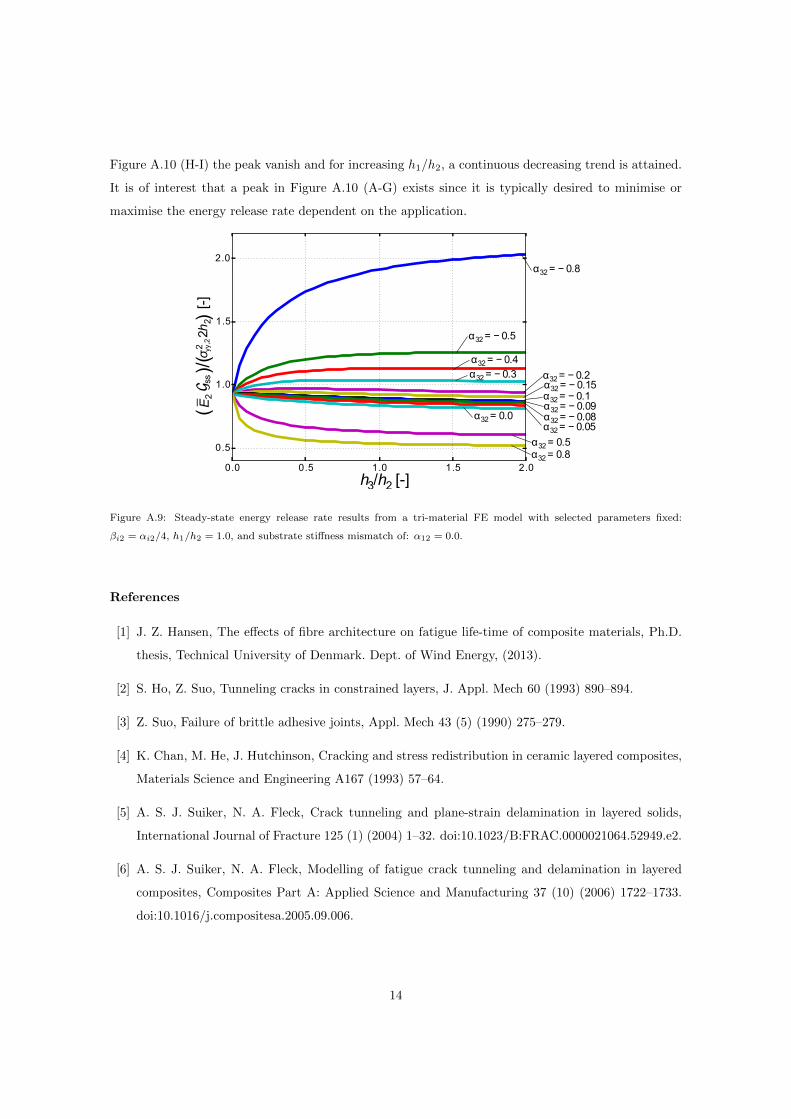
Figure A.10 (H-I) the peak vanish and for increasing h1/h2, a continuous decreasing trend is attained.
It is of interest that a peak in Figure A.10 (A-G) exists since it is typically desired to minimise or
maximise the energy release rate dependent on the application.
0.0 0.5 1.0 1.5 2.0
0.5
1.0
1.5
2.0α32 = − 0.8
α32 = − 0.5
α32 = − 0.4α32 = − 0.3 α32 = − 0.2
α32 = − 0.15α32 = − 0.1α32 = − 0.09α32 = − 0.08α32 = − 0.05
α32 = 0.0
α32 = 0.5α32 = 0.8
2σ
2h2
yy,2
Ess
2(
)/(
)[-
]
h /h [-]3 2
G
Figure A.9: Steady-state energy release rate results from a tri-material FE model with selected parameters fixed:
βi2 = αi2/4, h1/h2 = 1.0, and substrate stiffness mismatch of: α12 = 0.0.
References
[1] J. Z. Hansen, The effects of fibre architecture on fatigue life-time of composite materials, Ph.D.
thesis, Technical University of Denmark. Dept. of Wind Energy, (2013).
[2] S. Ho, Z. Suo, Tunneling cracks in constrained layers, J. Appl. Mech 60 (1993) 890–894.
[3] Z. Suo, Failure of brittle adhesive joints, Appl. Mech 43 (5) (1990) 275–279.
[4] K. Chan, M. He, J. Hutchinson, Cracking and stress redistribution in ceramic layered composites,
Materials Science and Engineering A167 (1993) 57–64.
[5] A. S. J. Suiker, N. A. Fleck, Crack tunneling and plane-strain delamination in layered solids,
International Journal of Fracture 125 (1) (2004) 1–32. doi:10.1023/B:FRAC.0000021064.52949.e2.
[6] A. S. J. Suiker, N. A. Fleck, Modelling of fatigue crack tunneling and delamination in layered
composites, Composites Part A: Applied Science and Manufacturing 37 (10) (2006) 1722–1733.
doi:10.1016/j.compositesa.2005.09.006.
14
0.0 0.5 1.0 1.5 2.00.96
0.98
1.00
1.02
1.04
1.06
1.08
1.10
1.12
1.14
0.0 0.5 1.0 1.5 2.00.96
0.97
0.98
0.99
1.00
1.01
1.02
1.03
1.04
(B)
0.0 0.5 1.0 1.5 2.00.940
0.945
0.950
0.955
0.960
0.965
0.970
0.975
0.0 0.5 1.0 1.5 2.0
0.91
0.92
0.93
0.94
0.95
0.0 0.5 1.0 1.5 2.00.87
0.88
0.89
0.90
0.91
0.92
0.93
0.0 0.5 1.0 1.5 2.01.00
1.05
1.10
1.15
1.20
1.25
1.30
(A)
(C)
(D)
(E) (F)
0.0 0.5 1.0 1.5 2.00.80
0.82
0.84
0.86
0.88
0.90
0.92
(I)
0.0 0.5 1.0 1.5 2.00.85
0.86
0.87
0.88
0.89
0.90
0.91
0.92
0.93
0.0 0.5 1.0 1.5 2.00.86
0.87
0.88
0.89
0.90
0.91
0.92
0.93
(G) (H)
α32=-0.4
α32=-0.3 α32=-0.2
α32=-0.15 α32=-0.1
α32=-0.5
α32=0.0
α32=-0.09 α32=-0.08
x
y
z
Adhesive
SubstrateBuffer-layer
#1
#2#3
#1#3
σ yy,2
2h2
h1
h3
h3 / h2 [ -]
h3 / h2 [ -]
h3 / h2 [ -]
h3 / h2 [ -]
h3 / h2 [ -]
h3 / h2 [ -] h3 / h2 [ -]
h3 / h2 [ -] h3 / h2 [ -]
2σ
2h2
yy,2
Ess
2(
)/(
)[-
]G
2σ
2h2
yy,2
Ess
2(
)/(
)[-
]G
2σ
2h2
yy,2
Ess
2(
)/(
)[-
]G
2σ
2h2
yy,2
Ess
2(
)/(
)[-
]G
2σ
2h2
yy,2
Ess
2(
)/(
)[-
]G
2σ
2h2
yy,2
Ess
2(
)/(
)[-
]G
2σ
2h2
yy,2
Ess
2(
)/(
)[-
]G
2σ
2h2
yy,2
Ess
2(
)/(
)[-
]G
2σ
2h2
yy,2
Ess
2(
)/(
)[-
]G
Figure A.10: Steady-state energy release rate results from a tri-material FE model with selected parameters fixed:
βi2 = αi2/4, h1/h2 = 1.0, and substrate-adhesive stiffness mismatch of: α12 = 0.0.
15
[7] J. Andersons, P. H. M. Timmermans, J. Modniks, Mechanics of tunnelling cracks in trilayer elastic
materials in tension, International Journal of Fracture 148 (3) (2008) 233–241. doi:10.1007/s10704-
008-9197-3.
[8] T. Nakamura, S. M. Kamath, Three-dimensional effects in thin film fracture mechanics, Mechanics
of Materials 13 (1) (1992) 67–77. doi:10.1016/0167-6636(92)90037-E.
[9] J. M. Ambrico, M. R. Begley, The role of initial flaw size, elastic compliance and plasticity in chan-
nel cracking of thin films, Thin Solid Films 419 (2002) 144–153. doi:10.1016/S0040-6090(02)00718-
6.
[10] T. Yang, Y. Liu, J. Wang, A study of the propagation of an embedded crack in a composite
laminate of finite thickness, Composite Structures 59 (4) (2003) 473–479. doi:10.1016/S0263-
8223(02)00284-2.
[11] H. Beom, X. Zhuo, C. Cui, Tunneling cracks in the adhesive layer of an orthotro-
pic sandwich structure, International Journal of Engineering Science 63 (2013) 40–51.
doi:10.1016/j.ijengsci.2012.11.001.
[12] Z. Suo, G. Bao, B. Fan, T. Wang, Orthotropy rescaling and implications for fracture in composites,
Int. J. Solid Structures 28 (2) (1991) 235–248.
[13] T. Y. Tsui, A. J. McKerrow, J. J. Vlassak, Constraint effects on thin film channel cracking
behavior, Journal of Materials Research 20 (2005) 2266–2273. doi:10.1557/jmr.2005.0317.
[14] J. Dundurs, Edge-bonded dissimilar orthogonal elastic wedges under normal and shear loading,
Journal of Applied Mechanics 36 (3) (1969) 650–652.
[15] J. Parmigiani, M. Thouless, The effects of cohesive strength and toughness on mixed-mode de-
lamination of beam-like geometries, Engineering Fracture Mechanics 74 (17) (2007) 2675–2699.
doi:10.1016/j.engfracmech.2007.02.005.
[16] M. Leong, L. C. T. Overgaard, O. T. Thomsen, E. Lund, I. M. Daniel, Investigation of failure
mechanisms in GFRP sandwich structures with face sheet wrinkle defects used for wind turbine
blades, Composite Structures 94 (2) (2012) 768–778. doi:10.1016/j.compstruct.2011.09.012.
[17] L. P. Mikkelsen, A simplified model predicting the weight of the load carrying beam in a
wind turbine blade, IOP Conference Series: Materials Science and Engineering 139 (2016) 1–
8. doi:10.1088/1757-899X/139/1/012038.
[18] M. Y. He, J. W. Hutchinson, Crack deflection at an interface between dissimilar elastic materials,
Int. J. Solid Structures 25 (9) (1989) 1053–1067.
16

[19] M. Y. He, A. G. Evans, Crack deflection at an interface between dissimilar elastic materials: Role
of residual stresses, Int. J. Solids Structures 31 (1994) 3443.
[20] J. Parmigiani, M. Thouless, The roles of toughness and cohesive strength on crack de-
flection at interfaces, Journal of the Mechanics and Physics of Solids 54 (2) (2006) 266–287.
doi:10.1016/j.jmps.2005.09.002.
[21] J. W. Hutchinson, Z. Suo, Mixed mode cracking in layered materials, Advances in applied me-
chanics 29 (1992) 63.
17

APPENDED PAPERP3
Tunneling cracks in full scale wind turbineblade joints
Jeppe B. Jørgensen, Bent F. Sørensen and Casper KildegaardEngineering Fracture MechanicsAccepted, 2017
Tunneling cracks in full scale wind turbine blade joints
Jeppe B. Jørgensena,b, Bent F. Sørensenb, Casper Kildegaarda
aLM Wind Power, Østre Alle 1, 6640 Lunderskov, Denmark.bThe Technical University of Denmark, Dept. of Wind Energy, Frederiksborgvej 399,
4000 Roskilde, Denmark.
Abstract
A novel approach is presented and used in a generic tunneling crack tool for
the prediction of crack growth rates for tunneling cracks propagating across
a bond-line in a wind turbine blade under high cyclic loadings.
In order to test and demonstrate the applicability of the tool, model
predictions are compared with measured crack growth rates from a full scale
blade fatigue test. The crack growth rates, measured for a several metre long
section along the blade trailing-edge joint during the fatigue test, are found
to be in-between the upper- and lower-bound predictions.
Keywords: Bonded joints, Fatigue crack growth, Residual stresses,
Polymer matrix composites, Finite element analysis
Email address: [email protected] (Jeppe B. Jørgensen)
Preprint submitted to Engineering Fracture Mechanics November 10, 2017

Nomenclature
a crack length
C Paris law coefficient
da/dN crack growth rate
E1, E2 Young’s modulus (substrate, adhesive)
E1, E2 plane strain Young’s modulus (substrate, adhesive)
(EI) bending stiffness of DCB specimen arms
f non-dimensional function
F function that relates ∆K with da/dN
Gss mode-I steady-state energy release rate
h1, h2 thickness for sandwich (substrate, adhesive)
h∗1, h∗2 thickness for bi-layer (substrate, adhesive)
h2 average thickness of adhesive in blade section
J J-integral
K stress intensity factor
Lb blade length
Lc crack spacing
Lc average crack spacing
Lr roller distance for DCB
2

m Paris law exponent
M bending moment
Mxx edgewise bending moment
N cycles
P load
q non-dimensional function
r radius
R load R-ratio
t width of cracked area for DCB
x, y, z coordinates
α first Dundurs’ parameter
β second Dundurs’ parameter
δext extensometer opening
δcod crack opening displacement profile
εT , εyy strain (misfit, adhesive/substrate)
ζ, ζ∗ thickness ratio (sandwich, bi-layer)
κ curvature of bi-layer
ν1, ν2 Poisson’s ratio (substrate, adhesive)
σm mechanical stress
σr residual stress
3
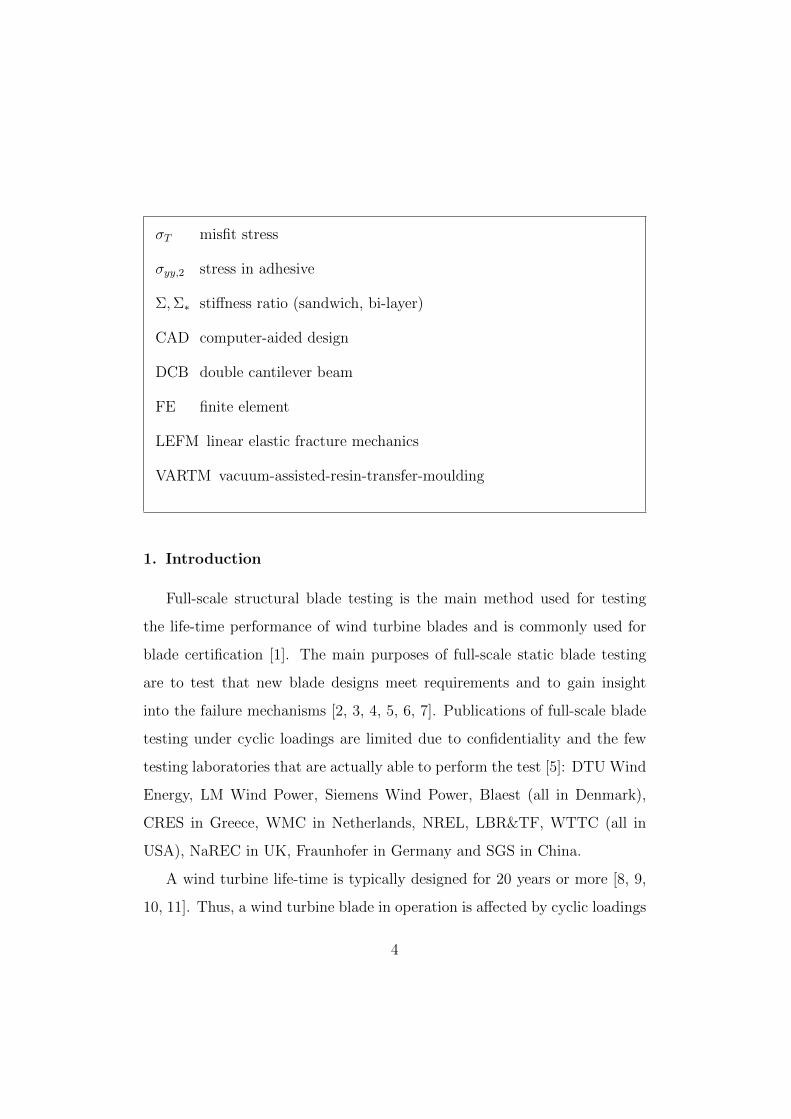
σT misfit stress
σyy,2 stress in adhesive
Σ,Σ∗ stiffness ratio (sandwich, bi-layer)
CAD computer-aided design
DCB double cantilever beam
FE finite element
LEFM linear elastic fracture mechanics
VARTM vacuum-assisted-resin-transfer-moulding
1. Introduction
Full-scale structural blade testing is the main method used for testing
the life-time performance of wind turbine blades and is commonly used for
blade certification [1]. The main purposes of full-scale static blade testing
are to test that new blade designs meet requirements and to gain insight
into the failure mechanisms [2, 3, 4, 5, 6, 7]. Publications of full-scale blade
testing under cyclic loadings are limited due to confidentiality and the few
testing laboratories that are actually able to perform the test [5]: DTU Wind
Energy, LM Wind Power, Siemens Wind Power, Blaest (all in Denmark),
CRES in Greece, WMC in Netherlands, NREL, LBR&TF, WTTC (all in
USA), NaREC in UK, Fraunhofer in Germany and SGS in China.
A wind turbine life-time is typically designed for 20 years or more [8, 9,
10, 11]. Thus, a wind turbine blade in operation is affected by cyclic loadings
4
i.a. caused by gravity loads, see edge-wise bending moment, Mxx in Figure
1. The adhesive joints are one of the critical structural details in large wind
turbine blades. In particular, the trailing-edge is critical since it is located
far from the elastic center of the blade and therefore experiences significantly
higher strains, εyy when subject to edge-wise bending.
z x
y
Blade
Blade tip
Blade root
Leading- edge joint
x yzTrailing- edge joint
Core
Glass fiber
Adhesive
Area of Interest (A
oI)
Webjoints
εyy
εyy
Blade section
a1
a2
ana3
Lb
y/L =0.24b
y/L =0.38b
x y
Laminate
Laminate
Adhesive
E1
E1
E22h 2
h 1
h 1
Tunneling crack (a )i
Mxx
Figure 1: Blade with edge-wise bending moments, Mxx distributed over blade length, Lb.
Blade section includes web-, leading-edge-, and trailing-edge joints.
During excessive high cycle loading, tunneling cracks may initiate in the
trailing-edge adhesive joint as shown in Figure 2, where a tunneling crack
in the adhesive is encircled by red marker on the edge of the joint. The
tunneling cracks propagate in the z-direction as shown by a1, a2, ..., an in
Figure 1. Each tunneling crack with length, ai, has a unique configuration of
laminate stiffness, E1, adhesive stiffness, E2, laminate thickness, h1, adhesive
thickness, 2h2 and strain level, εyy dependent on specific location of the crack
tip in the y-z plane. Note, the average adhesive thickness along the length
5
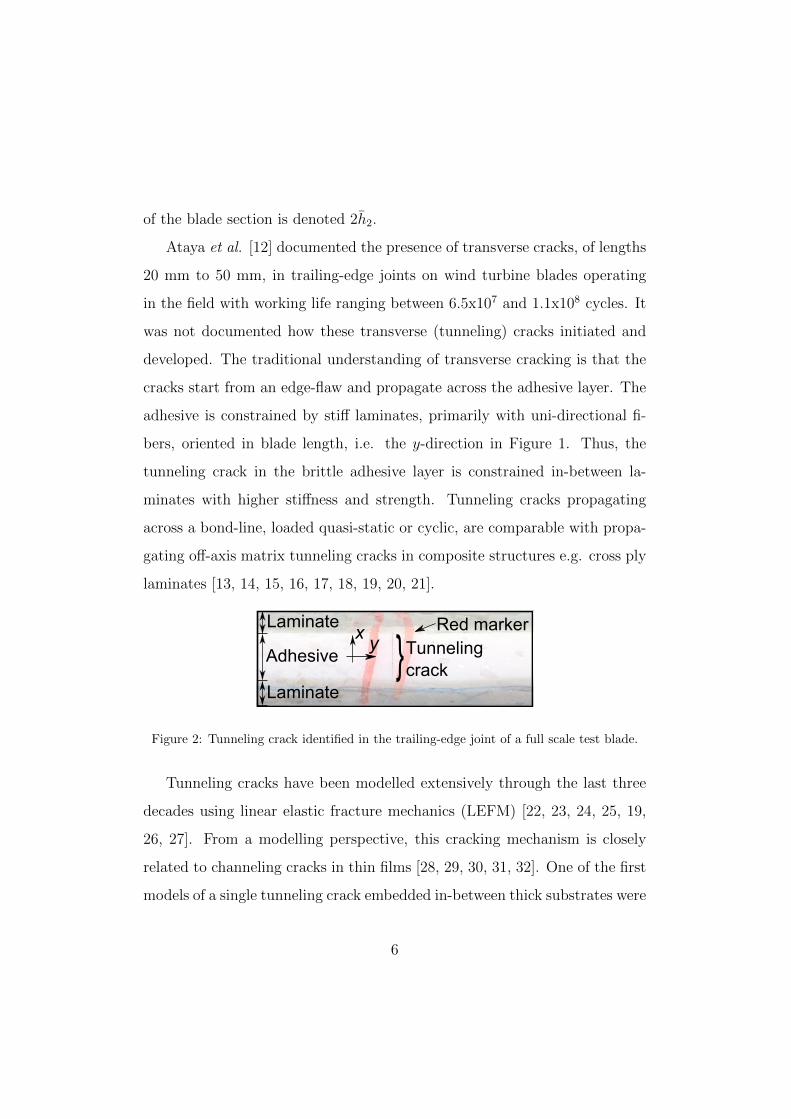
of the blade section is denoted 2h2.
Ataya et al. [12] documented the presence of transverse cracks, of lengths
20 mm to 50 mm, in trailing-edge joints on wind turbine blades operating
in the field with working life ranging between 6.5x10⁷ and 1.1x10⁸ cycles. It
was not documented how these transverse (tunneling) cracks initiated and
developed. The traditional understanding of transverse cracking is that the
cracks start from an edge-flaw and propagate across the adhesive layer. The
adhesive is constrained by stiff laminates, primarily with uni-directional fi-
bers, oriented in blade length, i.e. the y-direction in Figure 1. Thus, the
tunneling crack in the brittle adhesive layer is constrained in-between la-
minates with higher stiffness and strength. Tunneling cracks propagating
across a bond-line, loaded quasi-static or cyclic, are comparable with propa-
gating off-axis matrix tunneling cracks in composite structures e.g. cross ply
laminates [13, 14, 15, 16, 17, 18, 19, 20, 21].
Laminate
Adhesive
Laminate
Tunnelingcrack
Red markery
x
Figure 2: Tunneling crack identified in the trailing-edge joint of a full scale test blade.
Tunneling cracks have been modelled extensively through the last three
decades using linear elastic fracture mechanics (LEFM) [22, 23, 24, 25, 19,
26, 27]. From a modelling perspective, this cracking mechanism is closely
related to channeling cracks in thin films [28, 29, 30, 31, 32]. One of the first
models of a single tunneling crack embedded in-between thick substrates were
6

developed using 2D finite element (FE) modelling and LEFM [22, 23, 24]. 3D
FE models were used for transient modelling of channeling/tunneling cracks
since the crack length must reach a certain length for the crack to become
steady-state [33, 34, 35, 26]. It is well known [36, 37] that the stress field of
bi-material problems with stresses as boundary conditions (not displacement
boundary conditions) depends on only two (not three E1/E2, ν1, ν2) non-
dimensional elastic parameters (Dundurs’ parameters):
α =E1 − E2
E1 + E2
and β =E1
(1−2ν2)2(1−ν2) − E2
(1−2ν1)2(1−ν1)
E1 + E2
(1)
where for plane strain E = E/(1−ν2). ν1 and ν2 are the Poisson’s ratio of the
substrate and adhesive, respectively. In order to apply Dundurs’ parameters,
it is also a prerequisite that the materials are isotropic, linear-elastic and
deformations are planar i.e. either plane strain or plane stress [38, 36]. These
prerequisites are satisfied for the sandwich in Figure 2 if the adhesive and
laminates are assumed isotropic, linear-elastic and the tunneling crack has
reached a certain length from the edge (in z-direction) i.e. steady-state.
Nucleation and propagation of tunneling cracks in the adhesive layer is
the first mode of damage of the joint and would not represent catastrophic
failure of the blade, or even any significant loss in performance. However, if
the tunneling cracks were to initiate delaminations in the laminates or large
debonds at the adhesive-laminate interface, this would be far more critical.
Tracking and prediction of tunneling cracks propagation are important in
order to detect the early stage of damage and to quantify the level of damage
before it transforms into a more critical state such as delamination. A safe
and conservative joint design is thus designed against the propagation of a
7
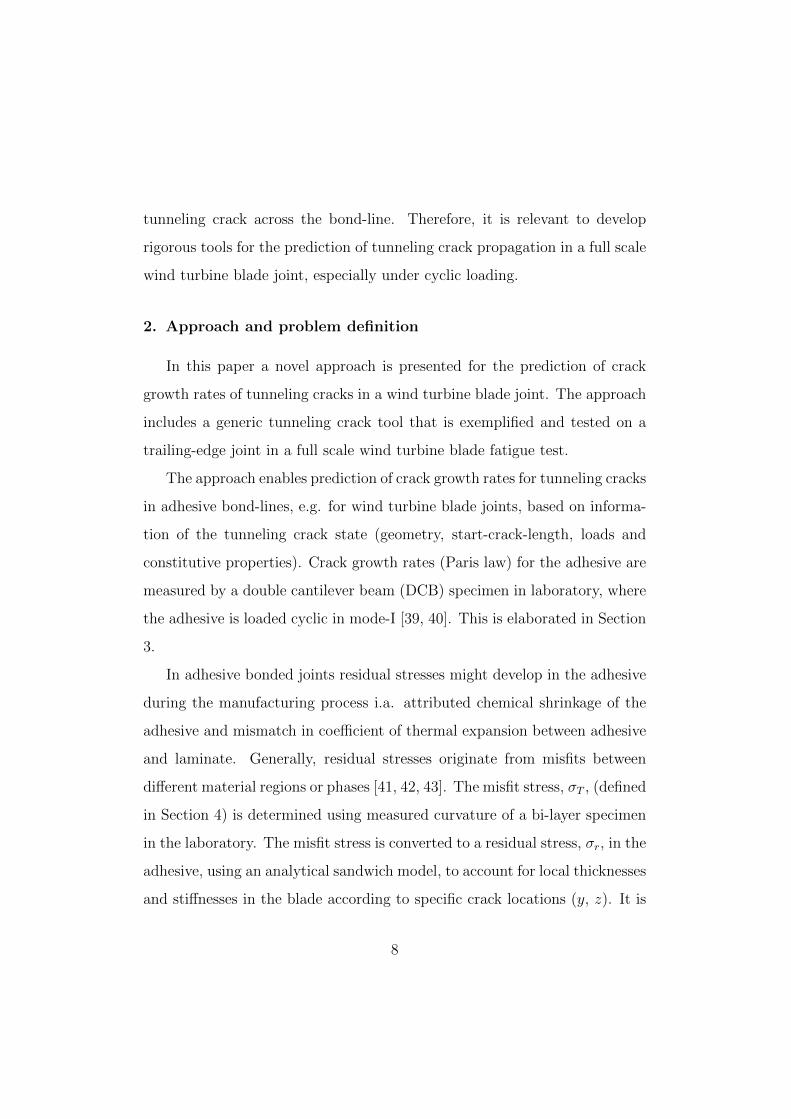
tunneling crack across the bond-line. Therefore, it is relevant to develop
rigorous tools for the prediction of tunneling crack propagation in a full scale
wind turbine blade joint, especially under cyclic loading.
2. Approach and problem definition
In this paper a novel approach is presented for the prediction of crack
growth rates of tunneling cracks in a wind turbine blade joint. The approach
includes a generic tunneling crack tool that is exemplified and tested on a
trailing-edge joint in a full scale wind turbine blade fatigue test.
The approach enables prediction of crack growth rates for tunneling cracks
in adhesive bond-lines, e.g. for wind turbine blade joints, based on informa-
tion of the tunneling crack state (geometry, start-crack-length, loads and
constitutive properties). Crack growth rates (Paris law) for the adhesive are
measured by a double cantilever beam (DCB) specimen in laboratory, where
the adhesive is loaded cyclic in mode-I [39, 40]. This is elaborated in Section
3.
In adhesive bonded joints residual stresses might develop in the adhesive
during the manufacturing process i.a. attributed chemical shrinkage of the
adhesive and mismatch in coefficient of thermal expansion between adhesive
and laminate. Generally, residual stresses originate from misfits between
different material regions or phases [41, 42, 43]. The misfit stress, σT , (defined
in Section 4) is determined using measured curvature of a bi-layer specimen
in the laboratory. The misfit stress is converted to a residual stress, σr, in the
adhesive, using an analytical sandwich model, to account for local thicknesses
and stiffnesses in the blade according to specific crack locations (y, z). It is
8
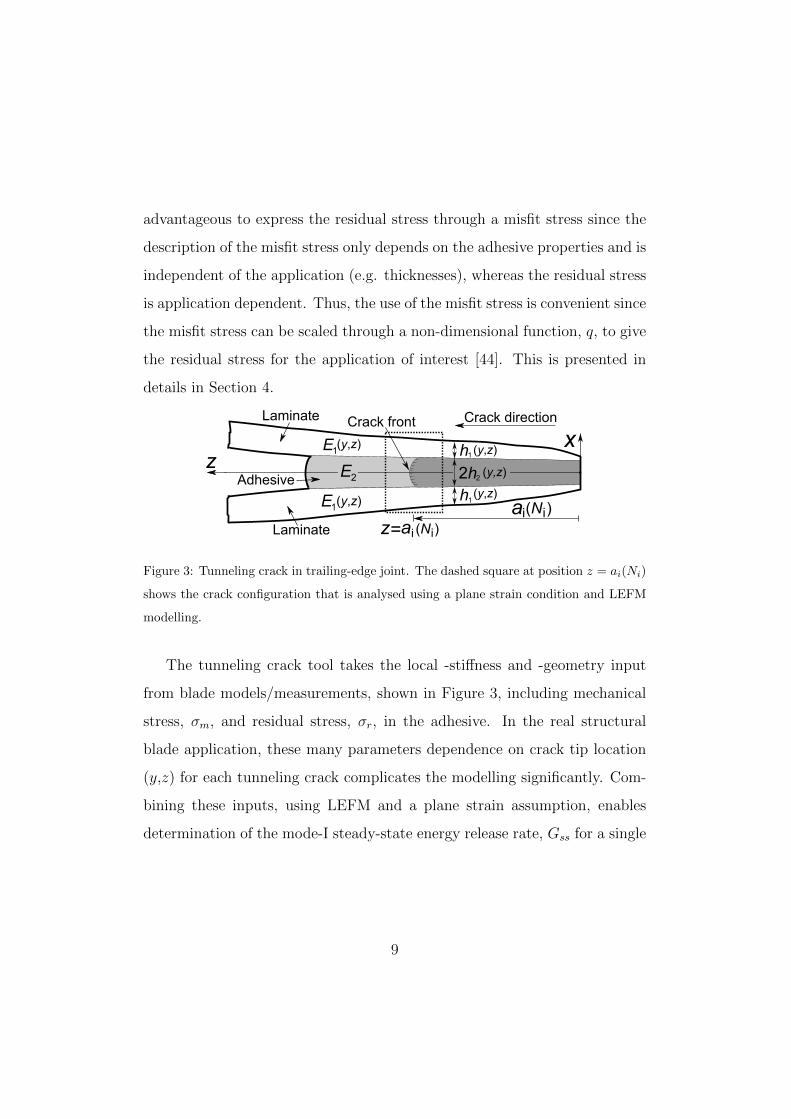
advantageous to express the residual stress through a misfit stress since the
description of the misfit stress only depends on the adhesive properties and is
independent of the application (e.g. thicknesses), whereas the residual stress
is application dependent. Thus, the use of the misfit stress is convenient since
the misfit stress can be scaled through a non-dimensional function, q, to give
the residual stress for the application of interest [44]. This is presented in
details in Section 4.
E1
E1
zx
Crack front
a
h1
h1
i
(y,z)
(y,z)(y,z)
(y,z)
Laminate
Laminate
Adhesive
Crack direction
E2 2h2(y,z)
z a i(N )= i
(N )i
Figure 3: Tunneling crack in trailing-edge joint. The dashed square at position z = ai(Ni)
shows the crack configuration that is analysed using a plane strain condition and LEFM
modelling.
The tunneling crack tool takes the local -stiffness and -geometry input
from blade models/measurements, shown in Figure 3, including mechanical
stress, σm, and residual stress, σr, in the adhesive. In the real structural
blade application, these many parameters dependence on crack tip location
(y,z) for each tunneling crack complicates the modelling significantly. Com-
bining these inputs, using LEFM and a plane strain assumption, enables
determination of the mode-I steady-state energy release rate, Gss for a single
9

isolated tunneling crack [24]:
Gss(y, z) =[σm(y) + σr(y, z)]
22h2(y, z)
E2
f [α(y, z), β(y, z), h1(y, z)/h2(y, z)]
(2)
where subscripts 1 and 2 refer to substrate and adhesive, respectively. f is
a non-dimensional function that will be determined in the present paper by
2D finite element simulations. Since the loading is cyclic, Gminss and Gmax
ss are
converted to a cyclic stress intensity factor range, ∆K using an analytical
model as elaborated in Section 5. Combining the tunneling crack modelling
results with the measured residual stresses and the measured Paris law for
the adhesive, gives the prediction of the crack growth rate for each tunneling
crack along the blade section. The steps of the approach, presented in Figure
4, are summarized:
(i) DCB: Double cantilever beam specimen fatigue tested in laboratory
to measure Paris law (da/dN , ∆K) for a mode-I crack in the adhesive.
(ii) Bi-layer: Residual stress (σr) determination in the adhesive of the joint
using misfit stress (σT ) that is determined by measuring the curvature
of bi-layer specimens.
(iii) Blade: Characterization of geometry (h1, 2h2), crack length for each
crack (ai), cycles for each crack (Ni), constitutive properties (E1, E2, ν1, ν2),
and mechanical stresses (σminm , σmaxm ) from blade inspection/model, CAD
model, aero/FE model or similar.
(iv) Modelling: Tunneling cracks modelled using finite elements to de-
termine ∆Ki as a function of blade geometry/properties, mechanical
stress, and residual stress (h1, 2h2, E1, E2, ν1, ν2,∆σm, σr) for each tun-
neling crack configuration (ai, Ni) dependent on location (y, z).
10
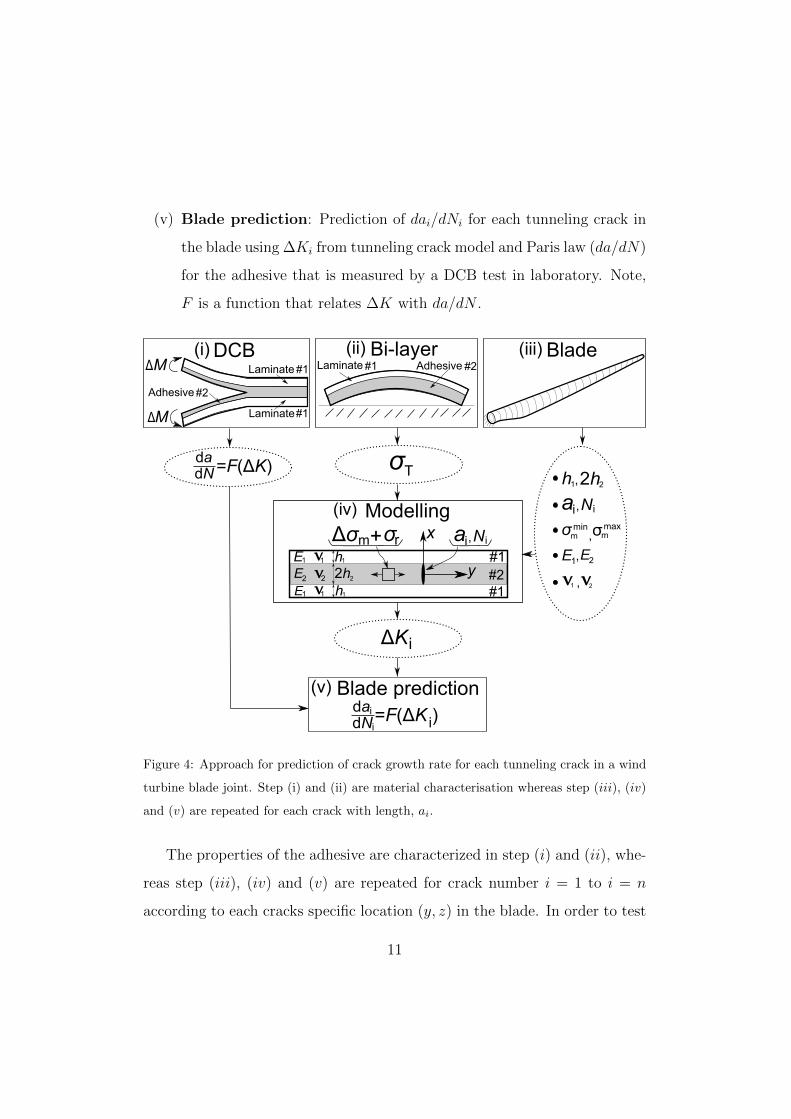
(v) Blade prediction: Prediction of dai/dNi for each tunneling crack in
the blade using ∆Ki from tunneling crack model and Paris law (da/dN)
for the adhesive that is measured by a DCB test in laboratory. Note,
F is a function that relates ∆K with da/dN .
AdhesiveLaminate(ii) Bi-layer
E1
E1
E2 2h2
h1
h1
x
y
rΔσ σ+m
Blade(iii)
Modelling(iv)
σTdadN =F(ΔK)
#1 #2
#1#2#1
dadN
Blade prediction(v)i
i
ΔKi
=F(ΔK )i
E1 E2,
v v21 ,
σmaxσminm m,
h1 2h2,
ai Ni,
v1
v1
2v
ai Ni,
DCB(i)M
MΔ
Δ
Adhesive
Laminate
Laminate
#1
#1
#2
Figure 4: Approach for prediction of crack growth rate for each tunneling crack in a wind
turbine blade joint. Step (i) and (ii) are material characterisation whereas step (iii), (iv)
and (v) are repeated for each crack with length, ai.
The properties of the adhesive are characterized in step (i) and (ii), whe-
reas step (iii), (iv) and (v) are repeated for crack number i = 1 to i = n
according to each cracks specific location (y, z) in the blade. In order to test
11
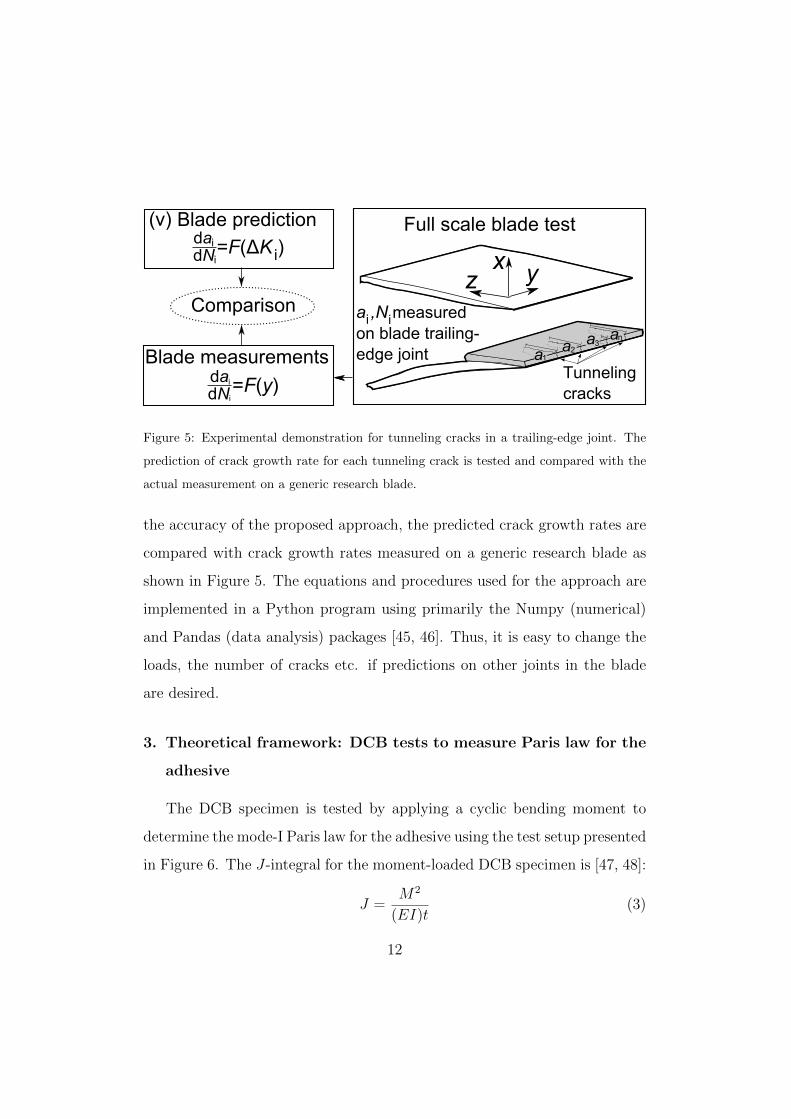
Blade prediction
dadN =F(y)
Blade measurements
(v) Full scale blade test
zx y
Tunneling cracks
a
a ,N measuredon blade trailing-edge joint 1
a2a3
an
i
i
i
iComparison
dadN
i
i=F(ΔK )i
Figure 5: Experimental demonstration for tunneling cracks in a trailing-edge joint. The
prediction of crack growth rate for each tunneling crack is tested and compared with the
actual measurement on a generic research blade.
the accuracy of the proposed approach, the predicted crack growth rates are
compared with crack growth rates measured on a generic research blade as
shown in Figure 5. The equations and procedures used for the approach are
implemented in a Python program using primarily the Numpy (numerical)
and Pandas (data analysis) packages [45, 46]. Thus, it is easy to change the
loads, the number of cracks etc. if predictions on other joints in the blade
are desired.
3. Theoretical framework: DCB tests to measure Paris law for the
adhesive
The DCB specimen is tested by applying a cyclic bending moment to
determine the mode-I Paris law for the adhesive using the test setup presented
in Figure 6. The J-integral for the moment-loaded DCB specimen is [47, 48]:
J =M2
(EI)t(3)
12
where M = PLr and t is the width of the cracked area. P is the measured
load and Lr is the outer distance between rollers according to Figure 6. The
bending stiffness, EI is determined by a layered model of the laminate and
adhesive using classical laminate theory [49]. The mode-I stress intensity
factor for an isotropic material can be related to the mode-I energy release
rate using the well-known Irwin relation [50]:
K =√GE2 (4)
∆K can be related to fatigue crack growth through the empirical Paris-
Erdogan law [39, 40]:
da/dN = C(∆K)m (5)
The parameters in the power law, C and m are material constants that are
determined using a curve fit to actual test data. The use of the Paris law
requires that the linear-elastic fracture mechanics assumptions are satisfied
meaning that the material must be linear elastic, isotropic, and the fracture
process zone must be small in comparison with the other specimen dimensi-
ons. Note, Paris law is an empirical relation rather than theoretically based
[51].
The DCB specimen with side-grooves, shown in Figure 6, is designed ba-
sed on initial experiments, which shows that the crack grows to the adhesive-
laminate interface if no side-grooves are present. The test setup, presented
in Figure 6, has some advantages: 1) energy release rate being independent
of crack-length so that crack growth is stable under displacement (rotatio-
nal) control, 2) easy analytical evaluation of the J-integral. Furthermore, a
full range of mode mixities can be tested from pure mode-I to nearly pure
13

P
P
P
P
L
t
Side-groove
x
z
x
y
Crack
Adhesive #2
w
Laminate #1
a
Crack
#1
#2
#1
Pin spacingrLr
Figure 6: DCB specimen loaded cyclic with even bending moments in mode-I.
mode-II. For the present work and purpose the setup is kept in mode-I since
the tunneling cracks in the adhesive, which is assumed isotropic, propagates
under mode-I conditions.
For experiments conducted under displacement control, the magnitude
of the moment, M decreases as the crack length increases. Thus, a test
in displacement control gives information of crack growth rate for the full
range of load levels using only a single test specimen. Therefore, in the
present study the DCB specimen is loaded cyclic using a constant range of
extensometer opening, ∆δext since it is desired to measure the full Paris law.
4. Theoretical framework: Measuring residual stresses using bi-
layer specimen
The residual normal stress, σr, e.g. in a symmetric sandwich far from
edges as shown in Figure 7, can be related to the misfit stress, σT through a
14

non-dimensional function, q [44]:
σr = qσT (6)
where σT is defined as the stress induced in an infinitely thin film adhered
to an infinitely thick substrate in a bi-layer material. q is a non-dimensional
function accounting for e.g. geometry and elastic properties. The misfit stress
cannot be predicted by modelling - it must be measured experimentally [44]
unless the mechanism of inelastic strain is known and modelled.
x
y
z
h2#1
#12h1
1hσr #2
Figure 7: Sandwich specimen used for residual stress modelling.
The misfit stress can be measured using the bi-layer specimen shown in
Figure 8 [44, 52, 53]. The curvature, κ is determined by fitting a circle to a
number of points measured on top of the surface of the curved beam. The
radius of the fitted circle, determined using a least square fit to the measured
points along the curved surface, expresses the curvature through the radius,
r as; κ = 1/r. The misfit stress, σT can then be determined by [44]:
σT =(∑
∗ ζ2∗ − 1)
2+ 4
∑∗ ζ∗(1 + ζ∗)2
6ζ∗(1 + ζ∗)
[E2h
∗2κ
(1 − ν2)
](7)
where∑
∗ = E1/(1−ν1)E2/(1−ν2) and ζ∗ = h∗1/h
∗2 according to Figure 8 for the bi-layer
specimen.
15

y
x
h2
r
1 2 3 4 5 6 7 8 9 10 11
* h1* #1#2
Figure 8: Curvature specimen including positions for measuring beam height.
Knowing σT , the stress in the adhesive of the sandwich specimen, shown
in Figure 7, can be derived by equilibrium considerations (perfect bonding
between the substrates and the adhesive layer), and by Hooke’s law in plane
stress (in the x-direction):
σr =−σT∑
+ 1ζ
(8)
where∑
= E1/(1−ν1)E2/(1−ν2) and ζ = h1/h2 according to Figure 7 for the sandwich
specimen. The energy release rate of the tunneling crack in the sandwich
specimen can be expressed as:
Gss = (σm + σr)2 2h2E2
f (α, β, h1/h2) =
(σm +
−σT∑+ 1
ζ
)22h2E2
f (α, β, h1/h2)
(9)
where f (α, β, h1/h2) is determined in the next section.
5. Theoretical framework: Modelling of tunneling cracks
The steady-state energy release rate of an isolated tunneling crack can
be expressed using a non-dimensional function, f to account for stiffness and
thickness of the materials [24]:
GssE2
σ2yy,22h2
= f(α, β, h1/h2) (10)
16
where the effective stress in the adhesive remote from the crack is designated
σyy,2. For simplicity, it is assumed that Poisson’s ratio for substrates and
adhesive are similar, ν1 = ν2 = 1/3, leading to β = α/4. The steady-state
energy release rate, which is constant along the entire tunneling crack front,
is determined by [22, 24]:
Gss =1
2
σyy,22h2
∫ +h2
−h2δcod(x)dx (11)
where δcod(x) is the crack opening displacement profile for the plane strain
crack, which is determined by FE modelling. Trapezoidal integration is ap-
plied to evaluate the integral numerically.
The results from the tunneling crack bi-material FE model, simulated in
Abaqus CAE 6.14 (Dassault Systemes) with eight-noded plane strain ele-
ments, are compared with the results of Ho and Suo [24] for a thickness ratio
of h1/h2 = 2.0 as shown in Figure 9.
The difference between the FE model results and those of Ho and Suo [24]
are less than 2%. As the stiffness and thickness of the substrates increase,
f(α, β, h1/h2) becomes smaller. This is in agreement with the conventio-
nal models [23, 24, 27]. Different thickness ratio, h1/h2 are modelled hence
f(α, β, h1/h2) for tunneling cracks at different locations can be determined.
Figure 9 is the main theoretical result and the relevant stiffness ratio for ty-
pical wind turbine blade joints is large as highlighted with the dashed square
(0.7 ≤ α ≤ 0.9).
The anisotropy of the glass fiber laminates is assumed negligible since
it is assumed that the high in-plane laminate stiffness of the uni-directional
fibers in the y-direction is the main constraint to prevent the tunneling crack
propagation [27]. ∆K for an isotropic material can be related to ∆Gss in
17
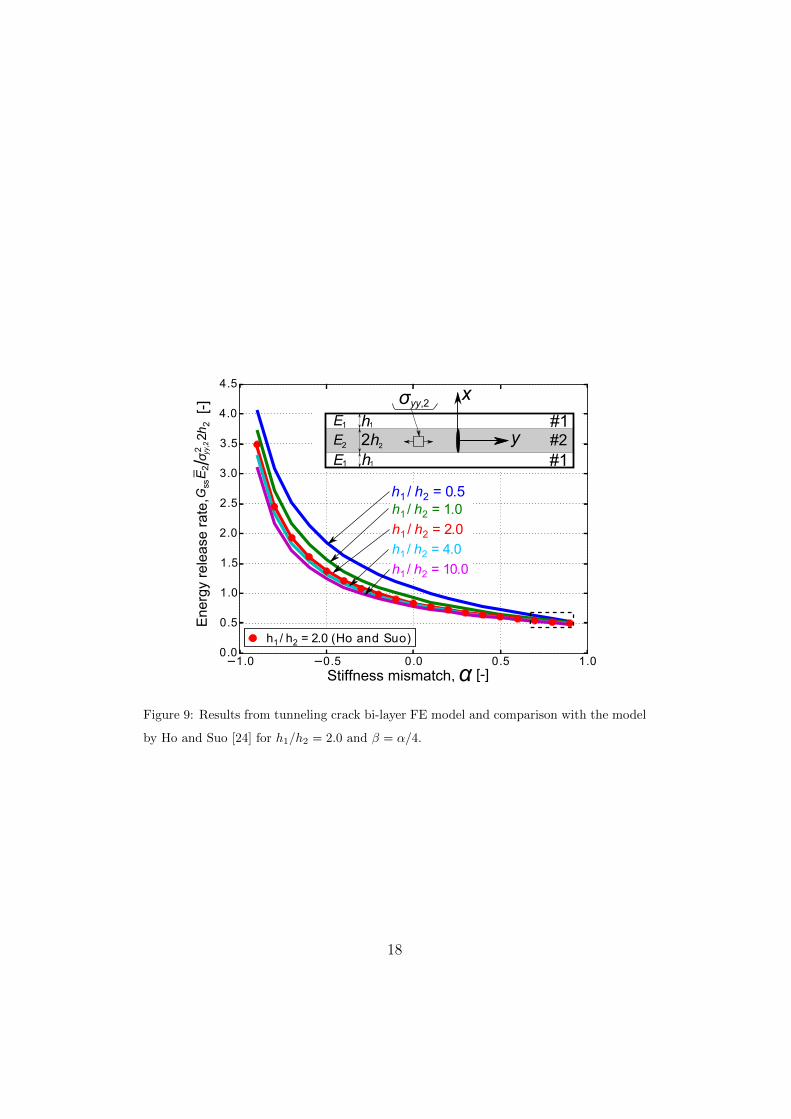
1.0 0.5 0.0 0.5 1.00.0
0.5
1.0
1.5
2.0
2.5
3.0
3.5
4.0
4.5
E2
Gss
σ2h
2
h1 / h2 = 0.5
yy,2
2
h1 / h2 = 1.0
h1 / h2 = 2.0h1 / h2 = 4.0
h1 / h2 = 10.0
h1/ h2 = 2.0 (Ho and Suo)
α [-]
[-]
Stiffness mismatch,
Ene
rgy
rele
ase
rate
,
E1
E1
E2 2h2
h1
h1
x
y#1#2#1
σ yy,2
/
Figure 9: Results from tunneling crack bi-layer FE model and comparison with the model
by Ho and Suo [24] for h1/h2 = 2.0 and β = α/4.
18

mode-I using the Irwin relation [19, 50, 51]:
∆K =√Gmaxss E2 −
√Gminss E2 = ∆σyy,2
√2h2f(α, β, h1/h2) (12)
that is applicable for tension-tension loading where the load R-ratio (R =
σmin/σmax) is 0 ≤ R < 1. However, for tension-compression loading where
R < 0, equation 12 reduces to:
∆K =√Gmaxss E2 = σmaxyy,2
√2h2f(α, β, h1/h2) (13)
For compression-compression loading with R > 1, the stress intensity factor
range becomes zero i.e. ∆K = 0. With the coefficient C and exponent m
determined earlier from the DCB test, the crack growth rate (da/dN) of each
crack can be determined from equation 5. The stress range can be expressed
as a function of load R-ratio, and residual stress (σr) can be added to the
mechanical stresses (σminm , σmaxm ) as shown in Figure 10.
Time
σ
σm
m
σ
Time
+σ
σr
σKKmin
maxK K
ΔK
ΔK
σ
+σr
Kmax
Kmin
Δσ
Δσm
mmax
min
max
min
(A) (B)
Figure 10: Definition of σminm , σmax
m , ∆σ, Kmin, Kmax and ∆K including a schematic
illustration of how ∆K depends on the R-ratio. (A) with R = −1, and (B) with 0 ≤ R < 1.
For negative R-ratio (R < 0) a part of the stress cycle is negative hence
causing crack closure. In that case, only the positive part of the stress cycle is
used in the computation of ∆K as illustrated in Figure 10. For the example
in Figure 10, for the same applied stress range, ∆K is doubled if R-ratio
increases from R = −1 to 0 ≤ R < 1. Thus, Figure 10 illustrates the effect
of increasing residual stresses on R-ratio and ∆K.
19
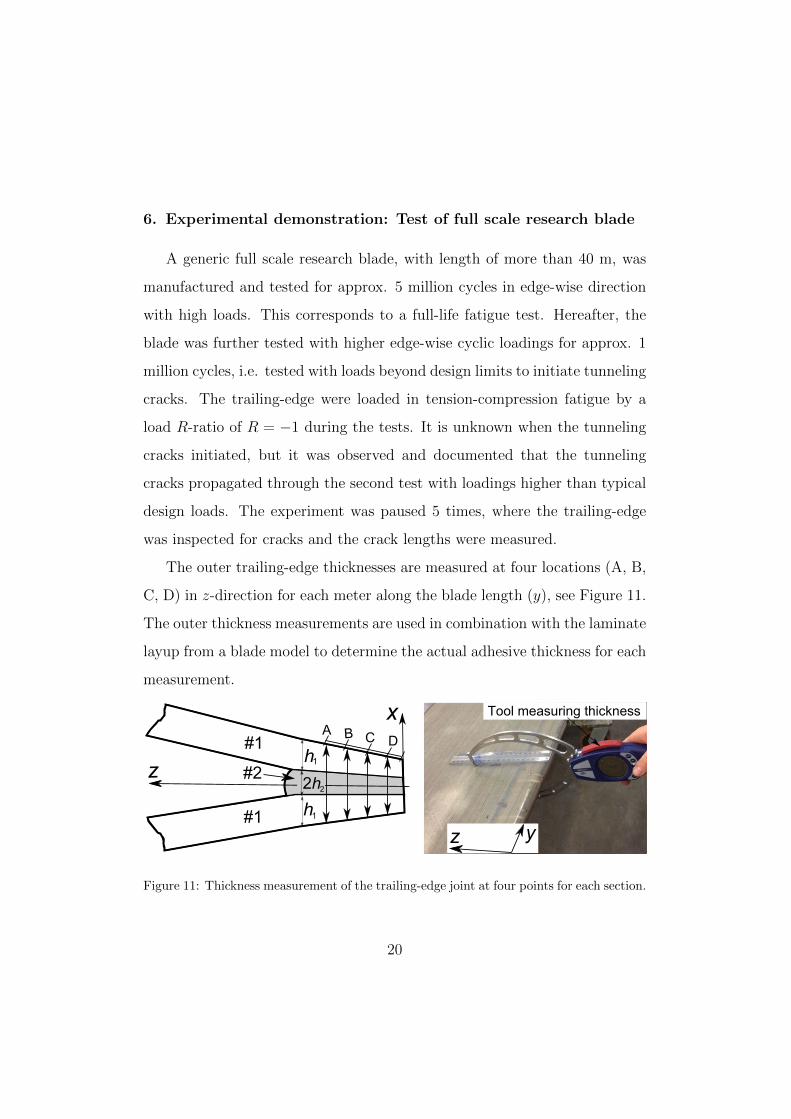
6. Experimental demonstration: Test of full scale research blade
A generic full scale research blade, with length of more than 40 m, was
manufactured and tested for approx. 5 million cycles in edge-wise direction
with high loads. This corresponds to a full-life fatigue test. Hereafter, the
blade was further tested with higher edge-wise cyclic loadings for approx. 1
million cycles, i.e. tested with loads beyond design limits to initiate tunneling
cracks. The trailing-edge were loaded in tension-compression fatigue by a
load R-ratio of R = −1 during the tests. It is unknown when the tunneling
cracks initiated, but it was observed and documented that the tunneling
cracks propagated through the second test with loadings higher than typical
design loads. The experiment was paused 5 times, where the trailing-edge
was inspected for cracks and the crack lengths were measured.
The outer trailing-edge thicknesses are measured at four locations (A, B,
C, D) in z-direction for each meter along the blade length (y), see Figure 11.
The outer thickness measurements are used in combination with the laminate
layup from a blade model to determine the actual adhesive thickness for each
measurement.
A B C D
Tool measuring thickness
yz
z
x
2h2
h1
h1
#1
#1
#2
Figure 11: Thickness measurement of the trailing-edge joint at four points for each section.
20

The stiffness and thickness of the laminates near each crack tip depends
on the position in both y- and z- directions as a result of the ply drops in
both transverse- and longitudinal blade directions, see Figure 3, Figure 12
and Figure 13. The points in Figure 12 near y/Lb = 0.28 and y/Lb = 0.32
are not outliers. They are a result of large crack lengths hence the crack tip
reach a location where the laminates are thicker, see also Figure 3 and Figure
18.
The average substrate-to-adhesive stiffness ratio, α at each crack position,
presented in Figure 13, is determined using linear interpolation (y, z). The
number of uni-directional plies is dominant hence the average stiffness is
simply a small reduction of the uni-directional ply stiffness due to some
biaxial layers surrounding the uni-directional plies. The exact laminate and
adhesive properties in the generic research blade are confidential.
1.0
1.2
1.4
1.6
1.8
2.0
2.2
2.4
2.6
h1/h
2[-
]
0.24 0.26 0.28 0.30 0.32 0.34 0.36 0.38y/L [-]b
Thi
ckne
ss r
atio
,
Position along blade,
Figure 12: Laminate-adhesive thickness ratio determined at each tunneling crack position
along blade length.
The strain range, ∆εyy (= εmaxyy − εminyy ) is measured using strain gauges
21
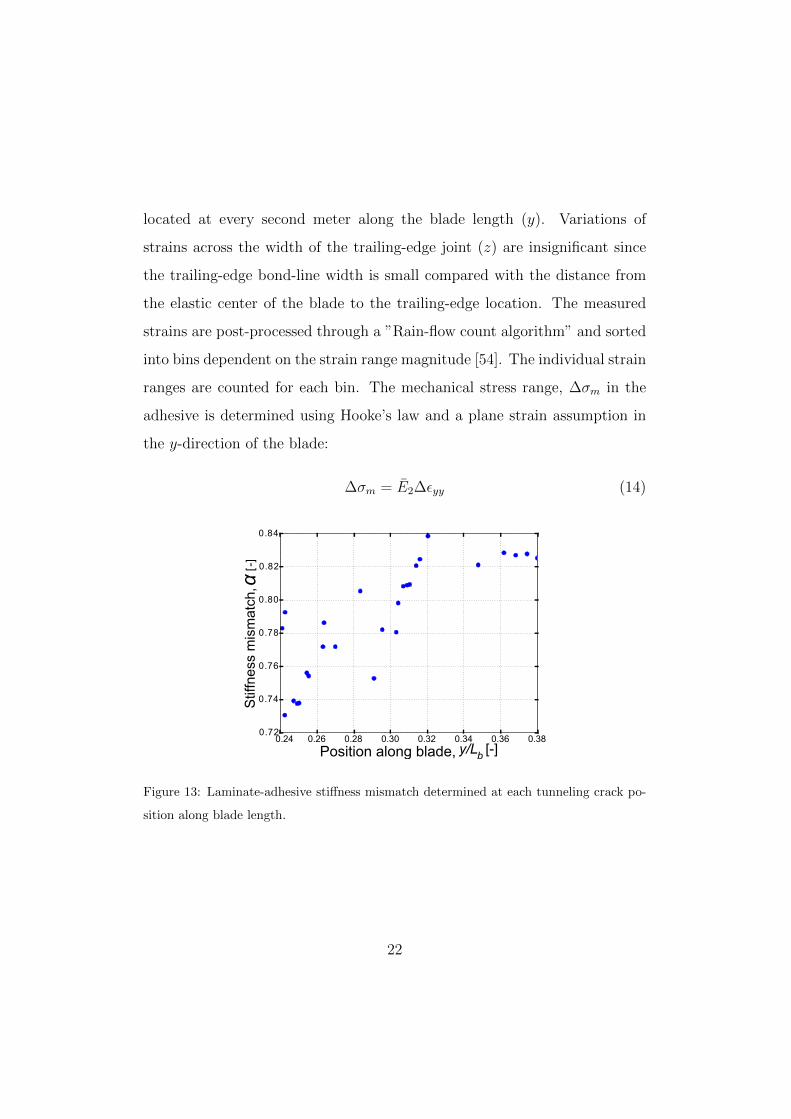
located at every second meter along the blade length (y). Variations of
strains across the width of the trailing-edge joint (z) are insignificant since
the trailing-edge bond-line width is small compared with the distance from
the elastic center of the blade to the trailing-edge location. The measured
strains are post-processed through a ”Rain-flow count algorithm” and sorted
into bins dependent on the strain range magnitude [54]. The individual strain
ranges are counted for each bin. The mechanical stress range, ∆σm in the
adhesive is determined using Hooke’s law and a plane strain assumption in
the y-direction of the blade:
∆σm = E2∆εyy (14)
0.24 0.26 0.28 0.30 0.32 0.34 0.36 0.380.72
0.74
0.76
0.78
0.80
0.82
0.84
α[-
]
y/L [-]b
Stif
fnes
s m
ism
atch
,
Position along blade,
Figure 13: Laminate-adhesive stiffness mismatch determined at each tunneling crack po-
sition along blade length.
22
7. Experimental demonstration: DCB tests to determine Paris law
for the adhesive
Two laminates of glass fiber reinforced polyester are cast using vacuum-
assisted-resin-transfer-moulding (VARTM). The laminates are post cured
and placed in a fixture where a vinylester adhesive is injected to bond the
two laminates. Subsequently, the adhesive and laminate are post cured and
cut into specimens. The side-grooves are CNC machined to meet the design
in Figure 6. The adhesive and laminates are manufactured under laboratory
conditions, but the exact properties are confidential.
An extensometer is attached to pins mounted on each beam as shown in
Figure 6 to measure the extensometer opening. A servo-hydraulic cylinder
applies the load, P to the wires that are attached to two arms on the sides
of the DCB specimen hence a pure bending moment is applied cyclic [55].
The end of each cable is attached to a load cell that measures the load, P
on each wire individually. Load frequency is set to 3 Hz and mode mixity
to 0 degree using same arm length, Lr as shown in Figure 6. The R-ratio is
varied between R ≈ 0.3 and R ≈ 0.5, which is also the R-ratio in the section
of the blade joint when including residual stresses in the adhesive. Images
are captured at adequate intervals following a log-scale. The crack length, a
is measured on the images with help from a program implemented in Python
[45, 46].
The DCB test is controlled by the extensometer opening, δext. A fixed
value of δminext and δmaxext is applied in the duration of the DCB test to maintain
a constant ∆δext. Thus, as the crack grows (increasing a), the measured
moment range, ∆M decreases and a series of ∆K values can be computed
23
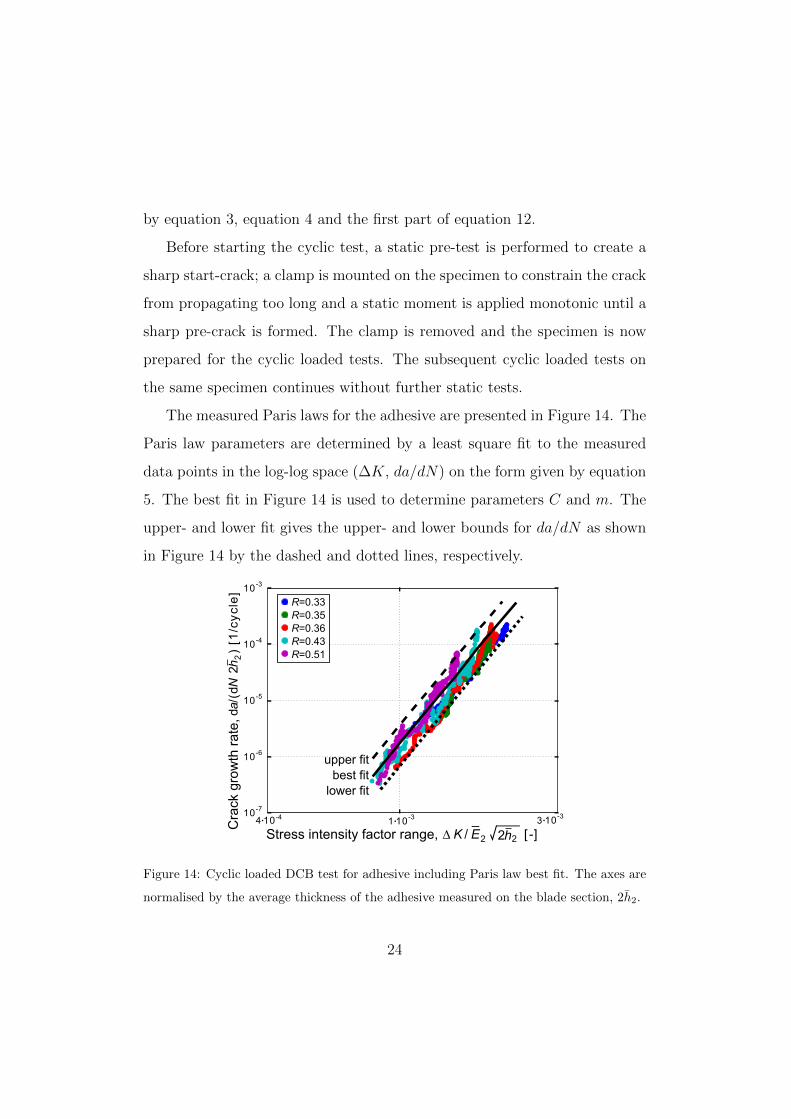
by equation 3, equation 4 and the first part of equation 12.
Before starting the cyclic test, a static pre-test is performed to create a
sharp start-crack; a clamp is mounted on the specimen to constrain the crack
from propagating too long and a static moment is applied monotonic until a
sharp pre-crack is formed. The clamp is removed and the specimen is now
prepared for the cyclic loaded tests. The subsequent cyclic loaded tests on
the same specimen continues without further static tests.
The measured Paris laws for the adhesive are presented in Figure 14. The
Paris law parameters are determined by a least square fit to the measured
data points in the log-log space (∆K, da/dN) on the form given by equation
5. The best fit in Figure 14 is used to determine parameters C and m. The
upper- and lower fit gives the upper- and lower bounds for da/dN as shown
in Figure 14 by the dashed and dotted lines, respectively.
10-310-7
10-6
10-5
10-4
10-3
da/(
dN2h
2)
[1/c
ycl
e]
upper fitbest fit
lower fit
R=0.33R=0.35R=0.36R=0.43R=0.51
∆ K / E2 2h2 [ -]10-3310-44C
rack
gro
wth
rat
e,
Stress intensity factor range,1
Figure 14: Cyclic loaded DCB test for adhesive including Paris law best fit. The axes are
normalised by the average thickness of the adhesive measured on the blade section, 2h2.
24
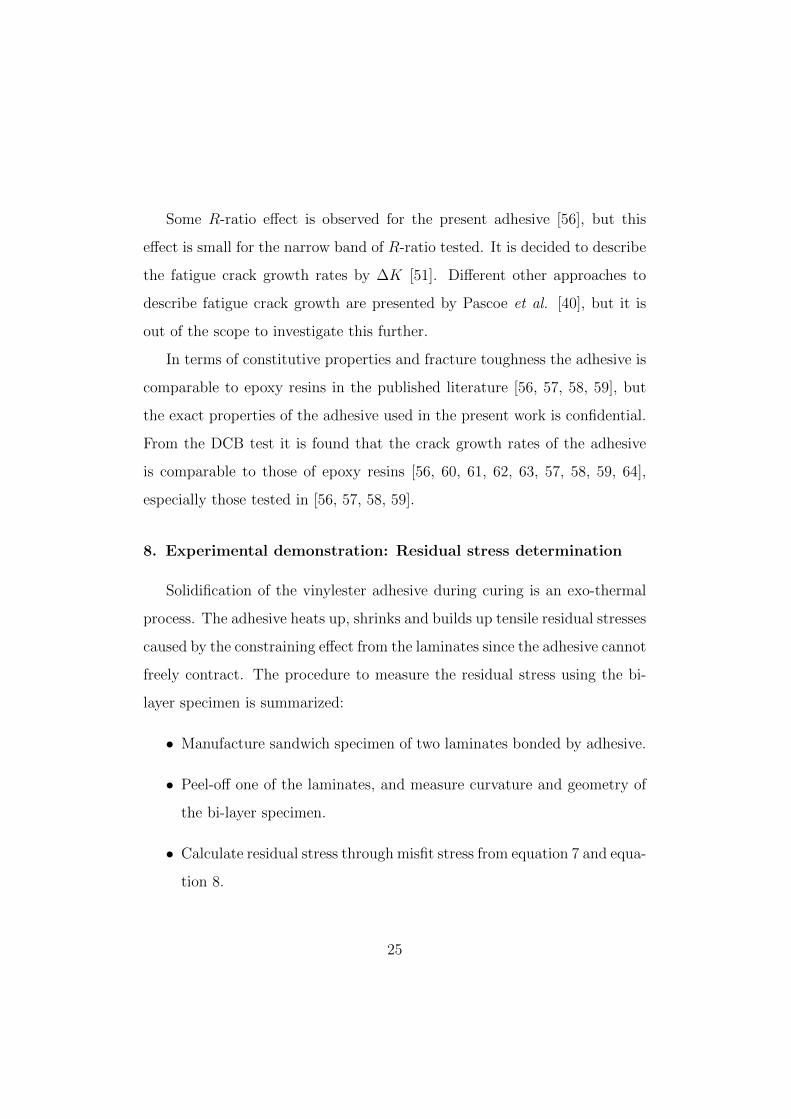
Some R-ratio effect is observed for the present adhesive [56], but this
effect is small for the narrow band of R-ratio tested. It is decided to describe
the fatigue crack growth rates by ∆K [51]. Different other approaches to
describe fatigue crack growth are presented by Pascoe et al. [40], but it is
out of the scope to investigate this further.
In terms of constitutive properties and fracture toughness the adhesive is
comparable to epoxy resins in the published literature [56, 57, 58, 59], but
the exact properties of the adhesive used in the present work is confidential.
From the DCB test it is found that the crack growth rates of the adhesive
is comparable to those of epoxy resins [56, 60, 61, 62, 63, 57, 58, 59, 64],
especially those tested in [56, 57, 58, 59].
8. Experimental demonstration: Residual stress determination
Solidification of the vinylester adhesive during curing is an exo-thermal
process. The adhesive heats up, shrinks and builds up tensile residual stresses
caused by the constraining effect from the laminates since the adhesive cannot
freely contract. The procedure to measure the residual stress using the bi-
layer specimen is summarized:
• Manufacture sandwich specimen of two laminates bonded by adhesive.
• Peel-off one of the laminates, and measure curvature and geometry of
the bi-layer specimen.
• Calculate residual stress through misfit stress from equation 7 and equa-
tion 8.
25
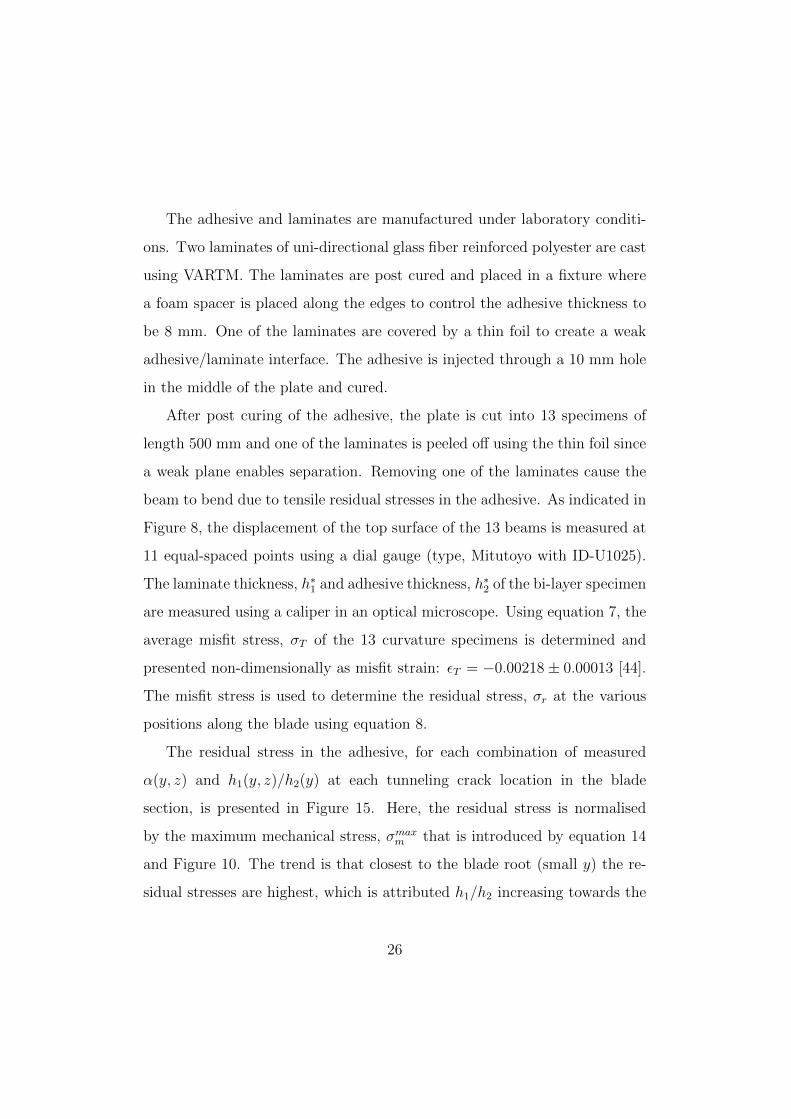
The adhesive and laminates are manufactured under laboratory conditi-
ons. Two laminates of uni-directional glass fiber reinforced polyester are cast
using VARTM. The laminates are post cured and placed in a fixture where
a foam spacer is placed along the edges to control the adhesive thickness to
be 8 mm. One of the laminates are covered by a thin foil to create a weak
adhesive/laminate interface. The adhesive is injected through a 10 mm hole
in the middle of the plate and cured.
After post curing of the adhesive, the plate is cut into 13 specimens of
length 500 mm and one of the laminates is peeled off using the thin foil since
a weak plane enables separation. Removing one of the laminates cause the
beam to bend due to tensile residual stresses in the adhesive. As indicated in
Figure 8, the displacement of the top surface of the 13 beams is measured at
11 equal-spaced points using a dial gauge (type, Mitutoyo with ID-U1025).
The laminate thickness, h∗1 and adhesive thickness, h∗2 of the bi-layer specimen
are measured using a caliper in an optical microscope. Using equation 7, the
average misfit stress, σT of the 13 curvature specimens is determined and
presented non-dimensionally as misfit strain: εT = −0.00218 ± 0.00013 [44].
The misfit stress is used to determine the residual stress, σr at the various
positions along the blade using equation 8.
The residual stress in the adhesive, for each combination of measured
α(y, z) and h1(y, z)/h2(y) at each tunneling crack location in the blade
section, is presented in Figure 15. Here, the residual stress is normalised
by the maximum mechanical stress, σmaxm that is introduced by equation 14
and Figure 10. The trend is that closest to the blade root (small y) the re-
sidual stresses are highest, which is attributed h1/h2 increasing towards the
26

1.6
1.8
2.0
2.2
2.4
2.6
2.8
3.0
3.2
σr/σ
mmax
[-]
0.24 0.26 0.28 0.30 0.32 0.34 0.36 0.38y/L [-]b
Res
idua
l str
ess,
m
Position along blade,
Figure 15: Normalised residual stress in the adhesive of the generic research blade at each
tunneling crack position along the blade length.
blade root according to Figure 12. Note, σr is large in comparison with σmaxm ,
especially closest to the blade root where the laminates are thick.
9. Experimental demonstration: Modelling of tunneling cracks
Curves for energy release rate, determined by the tunneling crack tool,
are presented in Figure 16 including the corresponding ”Experimental points”
that are calculated based on data from the generic research blade test (α, β =
α/4, h1/h2). The ”Experimental points” are determined for each tunneling
crack configuration (z = ai(Ni)) according to Figure 3. Thus, α and h1/h2
are determined for each crack tip location and based on linear interpolation
between the curves in Figure 16, the energy release rate can then be read off
for each point.
Ply drops in both the y- and z-direction of the blade joint complicates the
tunneling crack analysis. However, it is impractical to define a single finite
27
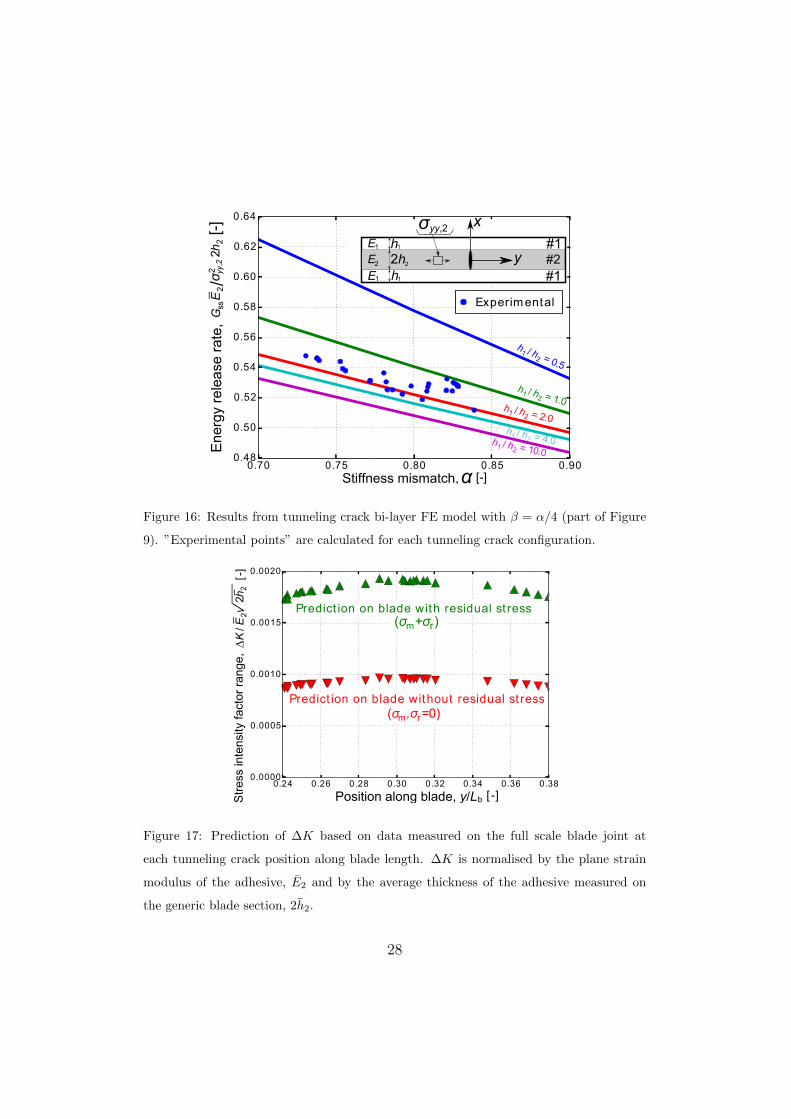
0.70 0.75 0.80 0.85 0.900.48
0.50
0.52
0.54
0.56
0.58
0.60
0.62
0.64E
2G
ssσ
2h2
h1 / h
2 = 0.5
h1 / h
2 = 1.0h1 / h2 = 2.0h1 / h2 = 4.0h1 / h2 = 10.0
Experim ental
α [-]
[-]
yy,2
2E
nerg
y re
leas
e ra
te,
Stiffness mismatch,
E1
E1
E2 2h2
h1
h1
x
y#1#2#1
σ yy,2/
Figure 16: Results from tunneling crack bi-layer FE model with β = α/4 (part of Figure
9). ”Experimental points” are calculated for each tunneling crack configuration.
0.24 0.26 0.28 0.30 0.32 0.34 0.36 0.38
b [ -]
0.0000
0.0005
0.0010
0.0015
0.0020
∆K
/E2
2h2
[-]
Str
ess
inte
nsity
fact
or r
ange
,
Predict ion on blade without residual st ress
Predict ion on blade with residual st ress
m r(σ ,σ =0)
m(σ +σ )r
Position along blade, y/L
Figure 17: Prediction of ∆K based on data measured on the full scale blade joint at
each tunneling crack position along blade length. ∆K is normalised by the plane strain
modulus of the adhesive, E2 and by the average thickness of the adhesive measured on
the generic blade section, 2h2.
28

element model, e.g. with 5-12 different layers, for each crack observed and
change the laminate stacking sequence for each crack analysed. Instead, the
tunneling crack tool is made generic thus it can handle a series of isolated
tunneling cracks and be applied to other blade joints as well. Therefore,
the thickness ratio, h1/h2 and the average laminate stiffness are interpolated
linearly in y- and z-directions based on the actual crack tip location in the
joint.
∆K is determined based on equation 12 and presented in Figure 17 with-
and without including the magnitude of residual stress, σr. ∆K varies only
moderately along y, being highest for y/Lb ≈ 0.30. The inclusion of residual
stresses doubles ∆K since the R-ratio changes from R = −1 to R ≈ 0.4, see
Figure 10 and Figure 17.
10. Experimental demonstration: Inspection of cracks in full scale
blade test
The crack length, measured by a caliper on the trailing-edge joint, for
each tunneling crack is presented in Figure 18 and Figure 19 for the number
of cycles where the test of the generic research blade is paused for inspection.
The a-N measurements in Figure 19 are fitted with a straight line for each
crack and the slopes (da/dN) are presented in Figure 20.
11. Experimental demonstration: Prediction of fatigue crack gro-
wth rates on the blade joint
Tunneling crack growth rates are predicted using the approach in Figure
4 and presented in Figure 20 together with the measured crack growth rates
29
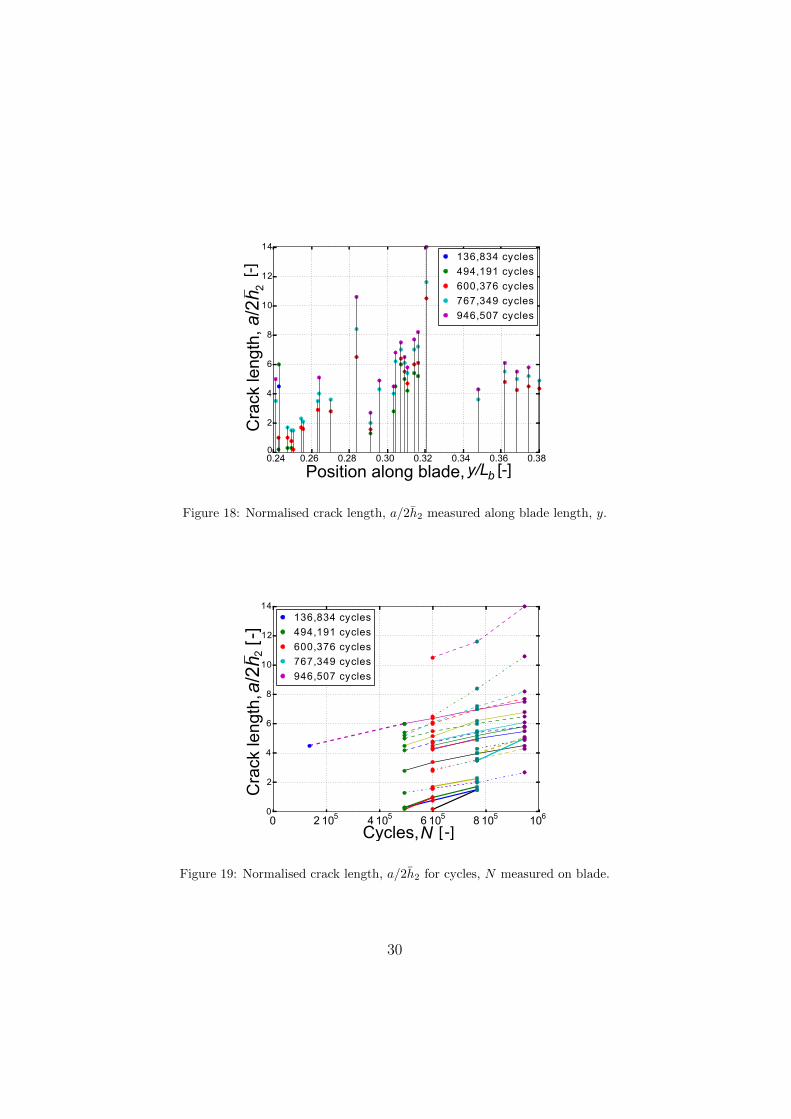
136,834 cycles
494,191 cycles
600,376 cycles
767,349 cycles
946,507 cycles
0
2
4
6
8
10
12
14a/
2h2
[-]
0.24 0.26 0.28 0.30 0.32 0.34 0.36 0.38
y/L [-]b
Cra
ck le
ngth
,
Position along blade,
Figure 18: Normalised crack length, a/2h2 measured along blade length, y.
0
2
4
6
8
10
12
14
N [ -]0 2 105 4 105 6 105 8 105 106
a/2h
2[-
]
136,834 cycles
494,191 cycles
600,376 cycles
767,349 cycles
946,507 cycles
Cra
ck le
ngth
,
Cycles,
Figure 19: Normalised crack length, a/2h2 for cycles, N measured on blade.
30
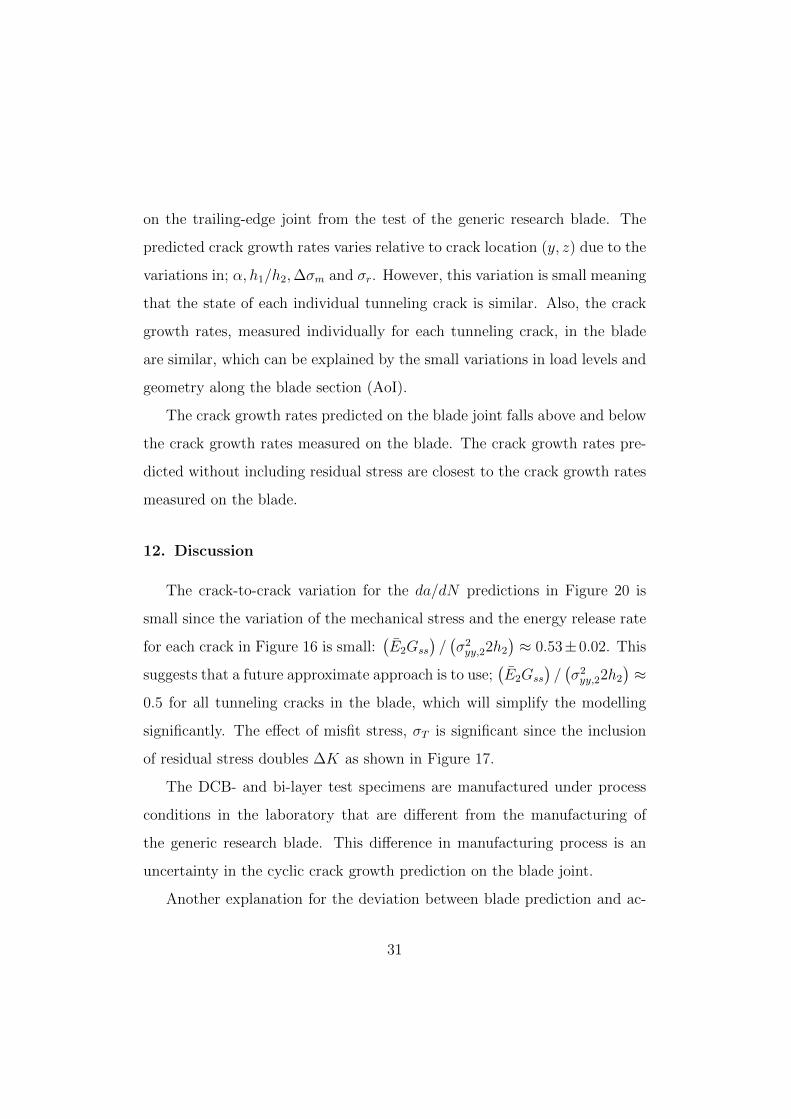
on the trailing-edge joint from the test of the generic research blade. The
predicted crack growth rates varies relative to crack location (y, z) due to the
variations in; α, h1/h2,∆σm and σr. However, this variation is small meaning
that the state of each individual tunneling crack is similar. Also, the crack
growth rates, measured individually for each tunneling crack, in the blade
are similar, which can be explained by the small variations in load levels and
geometry along the blade section (AoI).
The crack growth rates predicted on the blade joint falls above and below
the crack growth rates measured on the blade. The crack growth rates pre-
dicted without including residual stress are closest to the crack growth rates
measured on the blade.
12. Discussion
The crack-to-crack variation for the da/dN predictions in Figure 20 is
small since the variation of the mechanical stress and the energy release rate
for each crack in Figure 16 is small:(E2Gss
)/(σ2yy,22h2
)≈ 0.53±0.02. This
suggests that a future approximate approach is to use;(E2Gss
)/(σ2yy,22h2
)≈
0.5 for all tunneling cracks in the blade, which will simplify the modelling
significantly. The effect of misfit stress, σT is significant since the inclusion
of residual stress doubles ∆K as shown in Figure 17.
The DCB- and bi-layer test specimens are manufactured under process
conditions in the laboratory that are different from the manufacturing of
the generic research blade. This difference in manufacturing process is an
uncertainty in the cyclic crack growth prediction on the blade joint.
Another explanation for the deviation between blade prediction and ac-
31
10-7
10-6
10-5
10-4
10-3
Blade m easurem ents
Upper limit
0.24 0.26 0.28 0.30 0.32 0.34 0.36 0.38y/L [-]b
da/(
dN 2
h )
2[1
/cyc
le]
Cra
ck g
row
th r
ate,
Predict ion on blade without residual st ress
Lower limit
Predict ion on blade with residual st ress
Lower limit
Upper limit
(σ ,σ =0)m r
(σ +σ )m r
Position along blade,
Figure 20: Comparison of predicted crack growth rates (triangles) with the crack growth
rates measured (circles) on the full scale blade joint. Dashed lines indicate the upper limits
and dotted lines the lower limits for the uncertainty of the predictions based on Figure
14 since the main uncertainty comes from the measured Paris law for the adhesive. Note,
da/dN are normalised by the average thickness of the adhesive measured on the blade
section, 2h2.
32

tual blade measurements could be time dependency of the adhesive (stress
relaxation, creep, visco-elasticity), which is unknown. The time scale for the
laboratory tests of the bi-layer specimens is in the order of a few weeks whe-
reas the generic full scale research blade is tested over several months. The
time scale may influence the level of residual stress, which again affects the
R-ratio, ∆K and finally the da/dN prediction. The effect of stress relaxation
in the adhesive in the duration of the full scale blade test is unknown. The
crack growth rates determined for the tunneling cracks including residual
stress must therefore be seen as an upper bound. On the other hand, the
crack growth rates predicted without residual stress should be seen as a lower
bound if all residual stresses are relaxed during the fatigue test.
Multiple cracking of the adhesive is an other stress relaxing process es-
pecially if the crack spacing is small. The tunneling cracks can with good
accuracy be modelled without including interaction between the cracks since
the crack spacing and the stiffness of the substrates are large (0.72 ≤ α ≤0.84) [23, 24]. Crack interaction is only relevant for very compliant sub-
strates [24]. The 27 cracks distributed over the length of the blade section
(0.24 ≤ y/Lb ≤ 0.38) gives a normalised inverse average crack spacing of
2h2/Lc = 0.038, where Lc is the average crack spacing. This number (0.038)
and stiffness mismatch (0.72 ≤ α ≤ 0.84), according to Fig. 5 in Ho and Suo
[24], means that crack interaction is insignificant for the present case.
12.1. Tunneling crack model assumption
It is appropriate to investigate whether the approach of averaging the
stiffness has a significant effect on the tunneling crack energy release rate
since the layers closest to the adhesive is a few number of biaxial layers that
33

are more compliant than the uni-directional layers. The layer closest to the
adhesive, called buffer-layer, is the most important layer since it is well known
that the stiffness and thickness of this layer gives the primary constraining
effect of the tunneling crack [31].
The effect of buffer layer is tested using a tri-layer tunneling crack FE
model. A biaxial layer is added to the existing uni-directional laminate, which
decreases the overall average stiffness ratio to αave = 0.80 from αUD = 0.85
since the added biax-to-adhesive stiffness ratio is αbiax = 0.54.
Modelling the problem using the average stiffness instead of the actual
stiffnesses of the individual layers gave an energy release rate that was approx.
4 % higher, which is acceptable for the present application. It is concluded
that the energy release rate is relatively insensitive to specific layup confi-
gurations for the present case since the uni-directional layers are relatively
stiff. This is also illustrated by the small variations for the experimental data
in Figure 16. Thus, from a practical point of modelling the use of average
stiffness is reasonably.
12.2. Tunneling cracks in full scale blade section
In a full scale blade test many factors play a role on the state of the tunne-
ling crack mechanism. One important factor is the assumption that loading
is pure tensile in the trailing-edge, see εyy in Figure 1. Thus, the cracks in
the adhesive are assumed to propagate under pure mode-I conditions, which
is reasonably to assume in a homogeneous material. The mode-I dominance
is supported by the image in Figure 2 of the tunneling crack that is perpendi-
cular to the laminate. However, it is not measured whether the trailing-edge
joint is loaded in shear as well e.g. caused by large rotations/displacements
34
(”pumping effect”) of the trailing-edge balsa panel [65]. Measuring mixed
mode effects on the tunneling cracks may require additional strain gauges
mounted during the blade test. Models for shear loaded tunneling cracks
(oblique cracks) are available in the literature [24, 66].
The measured crack lengths vary significantly along the length of the
blade. The two cracks with the largest crack growth rates are found in
the highest loaded region. The different crack lengths measured may be a
result of the different times/cycles to crack initiation along the blade length
(y). The initiation is governed by pre-exising defects, but the exact time
(load cycle number) of crack initiation is unknown. For the shortest cracks
measured, see Figure 19, the effect of crack length on energy release rate
could be accounted for using 3D FE simulations [34, 26]. However, for large
elastic mismatch this transient effect is small [35].
12.3. Proposed extensions of the present work
The effect of residual stress on R-ratio and Paris law parameters is not
well documented in the literature for polymeric materials. Further work for
the adhesive loaded cyclic by different residual stress magnitudes and R-ratio
including different models for fitting the crack growth rates is proposed as a
future study [53, 40].
The tunneling crack tool can be extended to account for delamination
during the tunneling process [67, 25, 19] or expanded to handle gel coat
channeling cracks in wind turbine blade surfaces during cyclic loading [68].
It may also be applied to tunneling cracks in grid-scored balsa/foam panels
used in wind turbine blades, where the crack tunnels through the resin filled
grid-scores [65]. The generic tool is demonstrated on a trailing-edge adhesive
35

joint, but could be applied to the leading-edge- or web joints as well.
13. Conclusion
The parameters for the mode-I Paris law for the adhesive, measured by
the cyclic moment-loaded DCB specimen, was found to be comparable to
those published for epoxy resin systems. The energy release rate of a tunne-
ling crack is relatively unaffected by substrate thickness when the substrate
stiffness is large. Furthermore, the energy release rate of a tunneling crack
is relatively insensitive to specific layup near the adhesive since the stiffness
of the primary uni-directional laminate is high.
The crack growth rates predicted for tunneling cracks in a wind turbine
blade trailing-edge joint were found to agree well with the crack growth rates
measured on a full scale test blade. This suggests that the tunneling crack
tool can predict crack growth rates for tunneling cracks in a wind turbine
blade trailing-edge joint within acceptable accuracy.
Acknowledgements
Acknowledgements to the LM Wind Power lab for help manufacturing the
test specimens used for the bi-layer tests and the cyclic DCB tests. Thanks
to Jan Sjølin at DTU Wind Energy for help testing the DCB specimens.
Also, thanks to the test engineers and -technicians at LM Wind Power for
help with the measurements during the full scale blade test. This research
was supported by the Danish Centre for Composite Structure and Materials
for Wind Turbines (DCCSM), grant no. 0603-00301B, from Innovation Fund
36
Denmark. This research was also supported by grant no. 4135-00010B from
Innovation Fund Denmark.
References
[1] DNV GL, DNVGL-ST-0376 Standard - Rotor blades for wind turbines,
Tech. Rep. December, DNV GL (2015).
[2] F. M. Jensen, B. G. Falzon, J. Ankersen, H. Stang, Struc-
tural testing and numerical simulation of a 34 m composite
wind turbine blade, Composite Structures 76 (1-2) (2006) 52–61.
doi:10.1016/j.compstruct.2006.06.008.
[3] L. C. T. Overgaard, E. Lund, O. T. Thomsen, Structural collapse of
a wind turbine blade. Part A: Static test and equivalent single layered
models, Composites Part A: Applied Science and Manufacturing 41 (2)
(2010) 257–270. doi:10.1016/j.compositesa.2009.10.011.
URL http://dx.doi.org/10.1016/j.compositesa.2009.10.011
[4] J. Yang, C. Peng, J. Xiao, J. Zeng, S. Xing, J. Jin, H. Deng, Structu-
ral investigation of composite wind turbine blade considering structural
collapse in full-scale static tests, Composite Structures 97 (2013) 15–29.
doi:10.1016/j.compstruct.2012.10.055.
URL http://dx.doi.org/10.1016/j.compstruct.2012.10.055
[5] H. F. Zhou, H. Y. Dou, L. Z. Qin, Y. Chen, Y. Q. Ni, J. M.
Ko, A review of full-scale structural testing of wind turbine bla-
des, Renewable and Sustainable Energy Reviews 33 (2014) 177–187.
doi:10.1016/j.rser.2014.01.087.
37

[6] X. Chen, W. Zhao, X. L. Zhao, J. Z. Xu, Preliminary fai-
lure investigation of a 52.3m glass/epoxy composite wind tur-
bine blade, Engineering Failure Analysis 44 (11) (2014) 345–350.
doi:10.1016/j.engfailanal.2014.05.024.
URL http://dx.doi.org/10.1016/j.engfailanal.2014.05.024
[7] X. Chen, X. Zhao, X. Jianzhong, Revisiting the structural collapse of a
52.3 m composite wind turbine blade in a full-scale bending test, Wind
Energy 20 (6) (2017) 1111–1127.
[8] C. Kong, T. Kim, D. Han, Y. Sugiyama, Investigation of fati-
gue life for a medium scale composite wind turbine blade, Inter-
national Journal of Fatigue 28 (10 SPEC. ISS.) (2006) 1382–1388.
doi:10.1016/j.ijfatigue.2006.02.034.
[9] X. Liu, Dynamic Response Analysis of the Blade of Horizontal Axis
Wind Turbines, Journal of Mechanical Engineering 46 (12) (2010) 128.
doi:10.3901/JME.2010.12.128.
[10] K. K. Jin, M. Ghulam, J. H. Kim, S. K. Ha, B. Lopez, A. Gorostidi,
International Conferences on Composite Materials, in: Life Prediction
of Wind Turbine Blades, 2009, pp. 1–12.
[11] D. Salimi-Majd, V. Azimzadeh, B. Mohammadi, Loading Analysis of
Composite Wind Turbine Blade for Fatigue Life Prediction of Adhesively
Bonded Root Joint, Applied Composite Materials 22 (3) (2014) 269–287.
doi:10.1007/s10443-014-9405-4.
38
[12] S. Ataya, M. M. Ahmed, Damages of wind turbine blade trailing edge:
Forms, location, and root causes, Engineering Failure Analysis 35
(2013) 480–488. doi:10.1016/j.engfailanal.2013.05.011.
URL http://linkinghub.elsevier.com/retrieve/pii/
S1350630713001878
[13] K. W. Garret, J. E. Bailey, Multiple transverse fracture in 90 cross-
ply laminates of a glass fibre-reinforced polyester, Journal of Materials
Science 12 (1977) 157–168.
[14] Y. Korczynskyj, J. G. Morley, Constrained cracking in cross-ply lami-
nates, Journal of Materials Science 16 (1981) 1785–1795.
[15] J. A. Nairn, The Strain Energy Release Rate of Composite Micro-
cracking: A Variational Approach, Journal of Composite Materials
23 (11) (1989) 1106–1129. doi:10.1177/002199838902301102.
URL http://jcm.sagepub.com/cgi/doi/10.1177/
002199838902301102
[16] J. Varna, L. Berglund, Multiple transverse cracking and stiffness
reduction in cross-ply laminates, Journal of Composites Technology
and Research 13 (2) (1991) 97–106. doi:10.1520/CTR10213J.
URL http://www.scopus.com/inward/record.url?eid=2-s2.
0-0026171255\&partnerID=tZOtx3y1
[17] R. Talreja, S. Yalvac, L. D. Yats, D. G. Wetters, Transverse cracking and
stiffness reduction in cross ply laminates of different matrix toughness,
Journal of Composite Materials 26 (11) (1992) 1644–1663.
39
[18] J.-M. Berthelot, Transverse cracking and delamination in cross-ply
glass-fiber and carbon-fiber reinforced plastic laminates: Static and
fatigue loading, Applied Mechanics Reviews 56 (1) (2003) 111–147.
doi:10.1115/1.1519557.
URL http://dx.doi.org/10.1115/1.1519557
[19] A. S. Suiker, N. a. Fleck, Modelling of fatigue crack tunneling
and delamination in layered composites, Composites Part A:
Applied Science and Manufacturing 37 (10) (2006) 1722–1733.
doi:10.1016/j.compositesa.2005.09.006.
URL http://linkinghub.elsevier.com/retrieve/pii/
S1359835X05003751
[20] J. Varna, Modelling mechanical performance of damaged lamina-
tes, Journal of Composite Materials 47 (20-21) (2012) 2443–2474.
doi:10.1177/0021998312469241.
URL http://jcm.sagepub.com/cgi/doi/10.1177/
0021998312469241
[21] M. Quaresimin, A damage-based approach for the fatigue design of
composite structures, IOP Conference Series: Materials Science and
Engineering 139 (2016) 012006. doi:10.1088/1757-899X/139/1/012006.
URL http://stacks.iop.org/1757-899X/139/i=1/a=012006?key=
crossref.98da71596a191dfd02cdc2b30cfdd12d
[22] Z. Suo, Failure of brittle adhesive joints, Appl. Mech 43 (5) (1990) 275–
279.
40
[23] J. W. Hutchinson, Z. Suo, Mixed Mode Cracking in Layered Materials,
Advances in Applied Mechanics 29 (1992) 63–191.
[24] S. Ho, Z. Suo, Tunneling cracks in constrained layers, Mem. ASME 60
(1993) 890–894.
[25] A. S. Suiker, N. a. Fleck, Crack tunneling and plane-strain delamination
in layered solids, International Journal of Fracture 125 (1) (2004) 1–32.
doi:10.1023/B:FRAC.0000021064.52949.e2.
URL http://link.springer.com/10.1023/B:FRAC.0000021064.
52949.e2
[26] J. Andersons, P. H. M. Timmermans, J. Modniks, Mechanics of tunnel-
ling cracks in trilayer elastic materials in tension, International Journal
of Fracture 148 (3) (2008) 233–241. doi:10.1007/s10704-008-9197-3.
URL http://link.springer.com/10.1007/s10704-008-9197-3
[27] H. Beom, X. Zhuo, C. Cui, Tunneling cracks in the adhesive layer of an
orthotropic sandwich structure, International Journal of Engineering
Science 63 (2013) 40–51. doi:10.1016/j.ijengsci.2012.11.001.
URL http://linkinghub.elsevier.com/retrieve/pii/
S0020722512001978
[28] M. Thouless, Crack Spacing in Brittle Films on Elastic Substrates, J.
Am. Ceram. Soc. 73 (7) (1990) 2144–46.
[29] J. Beuth, Cracking of thin bonded films in residual tension, Int. J. Solid
Structures 2 (13) (1992) 1657–1675.
41

[30] J. J. Vlassak, Channel cracking in thin films on substrates of finite
thickness, International Journal of Fracture 119/120 (1979) (2003) 299–
323. doi:10.1023/A:1024962825938.
[31] T. Y. Tsui, A. J. McKerrow, J. J. Vlassak, Constraint Effects on Thin
Film Channel Cracking Behavior, Journal of Materials Research 20
(2005) 2266–2273. doi:10.1557/jmr.2005.0317.
[32] H. G. Beom, H. S. Jang, Effect of elastic constants on crack channeling
in a thin film bonded to an orthotropic substrate, Archive of Applied
Mechanics 83 (11) (2013) 1577–1589. doi:10.1007/s00419-013-0766-1.
URL http://link.springer.com/10.1007/s00419-013-0766-1
[33] T. Nakamura, S. M. Kamath, Three-dimensional effects in thin film
fracture mechanics, Mechanics of Materials 13 (1) (1992) 67–77.
doi:10.1016/0167-6636(92)90037-E.
URL http://linkinghub.elsevier.com/retrieve/pii/
016766369290037E
[34] Z. C. Xia, J. W. Hutchinson, Crack patterns in thin films, Journal of
the Mechanics and Physics of Solids 48 (2000) 1107–1131.
[35] J. M. Ambrico, M. R. Begley, The role of initial flaw size, elastic com-
pliance and plasticity in channel cracking of thin films, Thin Solid Films
419 (2002) 144–153. doi:10.1016/S0040-6090(02)00718-6.
[36] J. Dundurs, Edge-Bonded Dissimilar Orthogonal Elastic Wedges Under
Normal and Shear Loading, Journal of Applied Mechanics 36 (3) (1969)
650–652.
42

[37] J. Parmigiani, M. Thouless, The effects of cohesive strength and
toughness on mixed-mode delamination of beam-like geome-
tries, Engineering Fracture Mechanics 74 (17) (2007) 2675–2699.
doi:10.1016/j.engfracmech.2007.02.005.
URL http://linkinghub.elsevier.com/retrieve/pii/
S0013794407000677
[38] J. Dundurs, Effect of elastic constants on stress in a composite under
plane deformation, Journal of Composite Materials 1 (1967) 310–322.
doi:10.1177/002199836700100306.
[39] P. Paris, F. Erdogan, Closure to Discussions of A Critical Analysis of
Crack Propagation Laws’, Journal of Basic Engineering 85 (4) (1963)
534. doi:10.1115/1.3656903.
URL http://fluidsengineering.asmedigitalcollection.asme.
org/article.aspx?articleid=1431540
[40] J. A. Pascoe, R. C. Alderliesten, R. Benedictus, Methods for the pre-
diction of fatigue delamination growth in composites and adhesive bonds
- A critical review, Engineering Fracture Mechanics 112-113 (2013) 72–
96. doi:10.1016/j.engfracmech.2013.10.003.
URL http://dx.doi.org/10.1016/j.engfracmech.2013.10.003
[41] P. J. Withers, H. K. D. H. Bhadeshia, Residual stress part 1 - Mea-
surement techniques, Materials Science and Technology 17 (4) (2001)
355–365. doi:10.1179/026708301101509980.
URL http://www.scopus.com/inward/record.url?
43
eid=2-s2.0-0034923107\&partnerID=40\&md5=
814ec6ced08c67e3e5ac9d2ebc9027b2
[42] P. Withers, H. Bhadeshia, Residual stress. Part 2 Nature and
origins, Materials Science and Technology 17 (4) (2001) 366–375.
doi:10.1179/026708301101510087.
[43] P. J. Withers, M. Turski, L. Edwards, P. J. Bouchard, D. J.
Buttle, Recent advances in residual stress measurement, Internatio-
nal Journal of Pressure Vessels and Piping 85 (3) (2008) 118–127.
doi:10.1016/j.ijpvp.2007.10.007.
[44] A. G. Evans, J. W. Hutchinson, The Thermomechanical Integrity of
Thin Films and Multilayers, Acta metall. mater. 43 (7) (1995) 2507–
2530.
[45] H. P. Langtangen, Python Scripting for Computational Science, 2nd
Edition, Springer, 2008.
[46] H. P. Langtangen, A Primer on Scientific Programming with Python,
4th Edition, Springer, 2014.
[47] B. F. Sørensen, K. Jørgensen, T. K. Jacobsen, R. C. Østergaard, A gene-
ral mixed mode fracture mechanics test specimen : The DCB-specimen
loaded with uneven bending moments, Int J Fract 141 (2006) 163–176.
[48] B. F. Sørensen, L. P. Mikkelsen, R. C. Østergaard, S. Goutianos, From
interface laws to composite behaviour, in: Interface Design of Polymer
Matrix Composites Mechanics, Chemistry, Modelling and Manufactu-
ring, Risø, 2007, pp. 55–74.
44
[49] R. M. Jones, Mechanics of composite materials, 2nd Edition, Taylor and
Francis, 1999.
[50] G. Irwin, D. Washington, Analysis of Stresses and Strains Near the End
of a Crack Traversing a Plate, Journal of Applied Mechanics 24 (1957)
361–364.
[51] C. Rans, R. Alderliesten, R. Benedictus, Misinterpreting the results:
How similitude can improve our understanding of fatigue delamina-
tion growth, Composites Science and Technology 71 (2) (2011) 230–238.
doi:10.1016/j.compscitech.2010.11.010.
[52] J. A. Nairn, P. Zoller, The Development of Residual Thermal Stresses
in Amorphous and Semicrystalline Thermoplastic Matrix Composites,
ASTM STP 937 (1987) 328–341.
[53] J. A. Nairn, Energy release rate analysis for adhesive and laminate dou-
ble cantilever beam specimens emphasizing the effect of residual stresses,
International Journal of Adhesion and Adhesives 20 (1999) 59–70.
[54] R. Stephens, A. Fatemi, R. R. Stephens, H. Fuchs, Metal fatigue in
engineering, 2nd Edition, John Wiley & Sons, Inc, 2001.
[55] J. W. Holmes, L. Liu, B. F. Sorensen, S. Wahlgren, Experimental appro-
ach for mixed-mode fatigue delamination crack growth with large-scale
bridging in polymer composites, Journal of Composite Materials 48 (25)
(2014) 3111–3128. doi:10.1177/0021998313507613.
[56] C. Kanchanomai, A. Thammaruechuc, Effects of stress ra-
tio on fatigue crack growth of thermoset epoxy resin, Po-
45

lymer Degradation and Stability 94 (10) (2009) 1772–1778.
doi:10.1016/j.polymdegradstab.2009.06.012.
URL http://dx.doi.org/10.1016/j.polymdegradstab.2009.06.
012
[57] E. N. Brown, S. R. White, N. R. Sottos, Fatigue crack propagation
in microcapsule-toughened epoxy, Journal of Materials Science 41 (19)
(2006) 6266–6273. doi:10.1007/s10853-006-0512-y.
[58] A. Boonyapookana, K. Nagata, Y. Mutoh, Fatigue crack gro-
wth behavior of silica particulate reinforced epoxy resin compo-
site, Composites Science and Technology 71 (8) (2011) 1124–1131.
doi:10.1016/j.compscitech.2011.02.015.
URL http://dx.doi.org/10.1016/j.compscitech.2011.02.015
[59] M. H. Kothmann, R. Zeiler, A. Rios De Anda, A. Bruckner, V. Altstadt,
Fatigue crack propagation behaviour of epoxy resins modified with
silica-nanoparticles, Polymer (United Kingdom) 60 (2015) 157–163.
doi:10.1016/j.polymer.2015.01.036.
[60] S. A. Sutton, Fatigue crack propagation in an epoxy polymer, Engi-
neering Fracture Mechanics 6 (3) (1974) 587–595. doi:10.1016/0013-
7944(74)90015-0.
[61] R. A. Gledhill, A. J. Kinloch, S. Yamini, R. J. Young, Relations-
hip between mechanical properties of and crack progogation in epoxy
resin adhesives, Polymer 19 (5) (1978) 574–582. doi:10.1016/0032-
3861(78)90285-9.
46

[62] M. Dessureautt, J. Spelt, Observations of fatigue crack initiation and
propagation in an epoxy adhesive, International Journal of Adhesion and
Adhesives 17 (3) (1997) 183–195. doi:10.1016/S0143-7496(96)00044-9.
URL http://www.sciencedirect.com/science/article/pii/
S0143749696000449
[63] J. Du, M. D. Thouless, A. F. Yee, Effects of rate on crack growth in
a rubber-modified epoxy, Acta Materialia 48 (13) (2000) 3581–3592.
doi:10.1016/S1359-6454(00)00110-5.
[64] A. Boonyapookana, A. Saengsai, S. Surapunt, K. Nagata, Y. Mutoh,
Time dependent fatigue crack growth behavior of silica particle reinfor-
ced epoxy resin composite, International Journal of Fatigue 87 (2016)
288–293. doi:10.1016/j.ijfatigue.2016.02.013.
[65] S. Laustsen, E. Lund, L. Kuhlmeier, O. T. Thomsen, Development of
a high-fidelity experimental substructure test rig for grid-scored sand-
wich panels in wind turbine blades, Strain 50 (2) (2014) 111–131.
doi:10.1111/str.12072.
[66] Z. Xia, J. W. Hutchinson, Mode II Fracture Toughness of a Brittle
Adhesive Layer.pdf, Int. J. Solids Structures 31 (8) (1994) 1133–1148.
[67] K. Chan, M. He, J. Hutchinson, Cracking and stress redistribution in
ceramic layered composites, Materials Science and Engineering A167
(1993) 57–64.
[68] H. Zhang, J. Jackman, Feasibility of Automatic Detection of Surface
47

Cracks in Wind Turbine Blades, Wind Engineering 38 (6) (2014) 575–
586.
48

APPENDED PAPERP4
Design of four-point SENB specimens withstable crack growth
Jeppe B. Jørgensen, Casper Kildegaard and Bent F. SørensenEngineering Fracture MechanicsSubmitted, 2017
Design of four-point SENB specimens with stable crack growth
Jeppe B. Jørgensena,b,∗, Casper Kildegaarda, Bent F. Sørensenb
aLM Wind Power, Østre Alle 1, 6640 Lunderskov, Denmark.bThe Technical University of Denmark, Dept. of Wind Energy, Frederiksborgvej 399, 4000 Roskilde, Denmark.
Abstract
A four-point single-edge-notch-beam (SENB) test specimen loaded in displacement control (fixed grip)
is proposed for studying crack deflection at bi-material interfaces. In order to ensure stable crack
growth, a novel analytical model of the four-point SENB specimen in fixed grip is derived and compared
with numerical models. Model results show that the specimen should be short and thick, and the
start-crack length should be deep for the crack to propagate stable towards the bi-material interface.
Observations from experimental tests of four-point SENB specimens with different start-crack lengths,
confirmed that the crack grows stable if the start-crack length is deep and unstable if not.
Keywords: Stable crack growth, Bonded joints, Brittle fracture, Adhesive, Finite element analysis
Nomenclature
a actual crack length
a0 start-crack length
A area of cracked surface
b adhesive layer thickness/beam thickness
B horizontal distance between load- and support point
c substrate thickness
C compliance of beam
D length of debond crack at interface
E1, E2 Young’s modulus (substrate, adhesive)
E plane strain Young’s modulus
∗Corresponding authorEmail address: [email protected] (Jeppe B. Jørgensen)
Preprint submitted to Engineering Fracture Mechanics October 10, 2017

f non-dimensional function for interface stress
F Tada F-function
Fδ F-function for bi-material (fixed grip)
GI mode-I energy release rate
GIC critical energy release rate
GR resistance curve (rising critical energy release rate)
h horizontal distance between crack and load point
I area moment of inertia per unit width
KI mode-I stress intensity factor
KIC mode-I critical stress intensity factor
L loading parameter
M bending moment per unit width
P force per width
rp radius of plastic zone size
S Tada S-function
t time
T shear force
U strain energy
U1 strain energy of part 1 of the beam
U2 strain energy of part 2 of the beam
UP strain energy caused by force
UM strain energy caused by bending moment
UT strain energy caused by shear force
Ucrack strain energy caused by crack
Uno,crack strain energy in beam without crack
Ut total strain energy
V work done by external loads
Vt total work done by external loads
2

w width of beam
x, y, z coordinates
α first Dundurs’ parameter
β second Dundurs’ parameter
γ shear strain
δ displacement
ε normal strain
θ rotation angle
θcrack rotation angle caused by introduction of crack
θno,crack rotation angle for beam without crack
θt total rotation angle
κ curvature of beam
λ first orthotropy parameter
µ shear modulus
ν Poisson’s ratio
ν modified Poisson’s ratio
ρ second orthotropy parameter
σ normal stress
σxx maximum normal stress
σyy,i normal stress across interface
σi cohesive strength of interface
σY S yield stress
σi cohesive strength of the interface
τ shear stress
Φ strain energy density
Ω distance to neutral axis from the bottom of the beam
FE finite element
LEFM linear-elastic fracture mechanics
3

SENB single-edge-notch-beam
1. Introduction
Crack deflection at bi-material interfaces is one of the important cracking phenomena for adhesive
joints in large composite structures e.g. wind turbine blades. The bond-line contains defects from
which cracks can initiate and turn into transverse cracks in the adhesive. Cracks in the trailing-edge
joint, including transverse cracks, are observed in full scale blades in operation as demonstrated by
Ataya et al. [1]. After a small crack has formed in the adhesive from a pre-existing defect, the typical
cracking sequence is as shown in Figure 1.
(A)
(C)
(B)
interface
(E)
(D)
#1
#2
#1
xy
adhesivelaminate/substrate
xxσ
main crackdebond crack
crack penetration
crack deflection
Figure 1: Possible cracking sequences for an adhesive joint loaded in tension. The main crack in the adhesive grows
ideally orthogonal towards the adhesive-substrate interface (A). The crack might reach the interface (B) or initiate a
new crack at the adhesive-substrate interface (C). If the crack reach the interface it can stop (B), or penetrate into the
substrate (D) or deflect along the adhesive-substrate interface (E).
Historically, the cracking mechanisms in Figure 1 have been addressed using various approaches.
Models typically describe the problem where the main crack has reached the interface (Figure 1 (B))
and the subsequent crack deflection/penetration process (Figure 1 (D) or Figure 1 (E)). Modelling
the deflection of a crack meeting an interface were, at first, based on either stress criteria [2, 3] or
energy criteria [4, 5, 6, 7, 8]. The stress criteria and energy based approach can be unified using a
cohesive law, which is a traction-separation law that encompasses a peak stress (strength) and work or
separation (energy), typically combined with cohesive zone modelling in finite element (FE) simulations
[9, 10, 11, 12, 13, 14]. The parameters for the cohesive law can e.g. be measured by the J-integral
approach [15, 16]. However, accurate experimental determination of peak stress, σi, (cohesive strength)
4

for bi-material interfaces is challenging, especially for brittle material interfaces with small separations
[17], and therefore novel methodologies are desired.
The problem of interface crack initiation in Figure 1 (C) was addressed using modelling based on
stress by Cook and Gordon [2]. However, rigorous experimental tests of crack deflection at interfaces,
where the crack deflection process is clearly documented are limited [18] since it is difficult to design an
experiment where the crack propagates stable towards a bi-material interface. A few have attempted
but with limited success [19, 20].
Zhang and Lewandowski [20] tested bi-material four-point single-edge-notch-beam (SENB) speci-
mens with different interfaces. Unfortunately, crack propagation was unstable such that the crack
deflection could only be assessed by visual inspection of the cracked specimens after testing i.e. ex-
situ. For the cracking mechanism in Figure 1 (C), the bi-material four-point SENB specimen can also
be used to measure the cohesive strength of the interface, σi, using a recently developed approach
[21]. For this purpose and for the study of crack deflection at interfaces, it is advantageous that the
crack grows stable in mode-I towards the interface so that the crack deflection process can be observed
in-situ e.g. captured on images by a relatively low camera frame rate during loading. Therefore, in the
present paper the bi-material four-point SENB specimen is modeled to design an experimental test
with stable crack growth.
The parameters defining the four-point SENB test specimen geometry and boundary conditions are
presented in Figure 2. The start-crack length is denoted a0 whereas a is the actual crack length. h is
the distance between the crack and the load point, and B is the distance between the load- and support
points. The depth in z-direction is denoted w. P is the total applied force and δ is the load-point
displacement. θ is the resulting rotation for an applied bending moment, M . The primary parameters
can be written in non-dimensional form as: a/b, h/b, and B/b. The dimensionless substrate thickness
for the bi-material specimen in Figure 2 (C) is denoted c/b.
In absence of elastic mismatch, the bi-material four-point SENB specimen (Figure 2 (B)) reduces
to the homogenous four-point SENB specimen (Figure 2 (A)). The homogenous four-point SENB
specimen shown in Figure 2 (A) is a commonly used test specimen during the last five decades e.g. for
measuring fracture toughness, but also for other purposes with varying geometry, material and setup
[22, 23, 24, 25, 26, 27, 28, 29, 30, 12, 31, 32]. Four-point SENB specimen geometries, found in the
literature [15, 27, 33, 20, 30, 12], vary significant from test to test:
• 0.12 < a0/b < 0.80, 0.60 < B/b < 6.90, 0.50 < h/b < 5.10, 0.22 < w/b < 9.66
Justification for the choice of a0/b, B/b, h/b, and w/b are absent in the papers. Crack growth stability
were tested experimentally by Tandon et al. [33] for three different material systems using homogenous
four-point SENB specimens. One of the conclusions was that a smaller h improved the stability of the
5
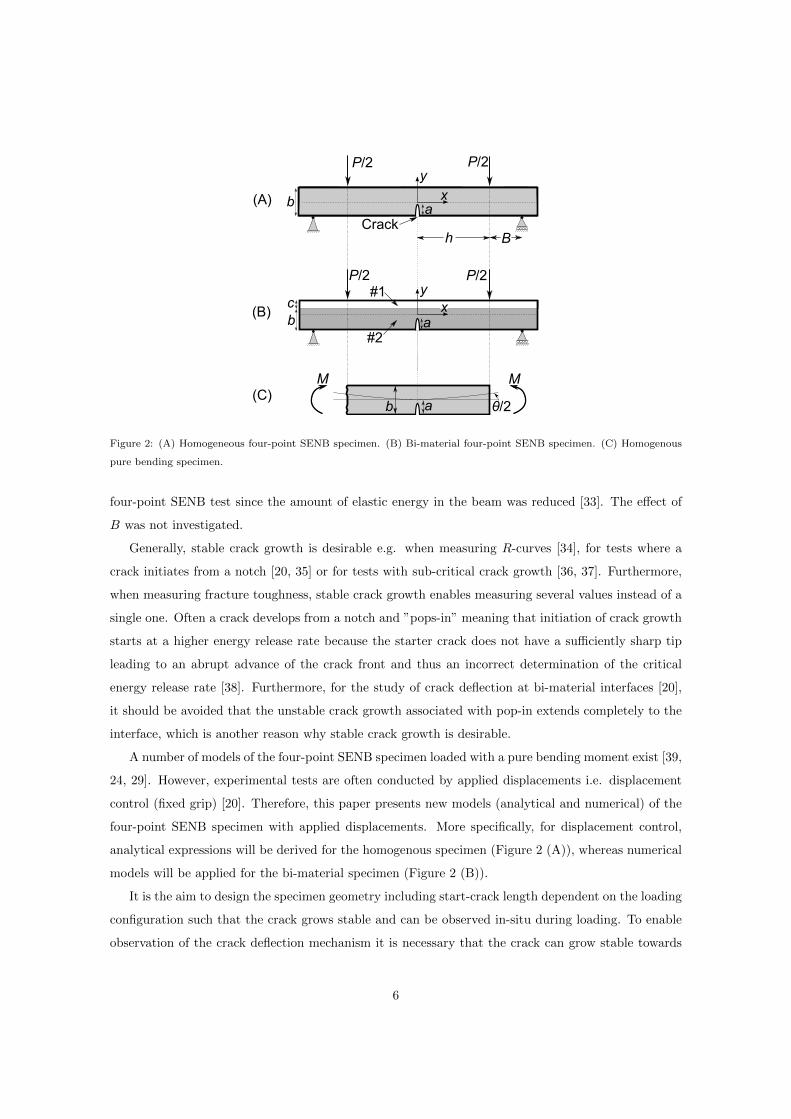
P/2 P/2
ab
y
P/2 P/2
c
x(A)
(B)
B
(C)
Crackh
MM
θ/2a
a
yx
b
#1
#2
b
Figure 2: (A) Homogeneous four-point SENB specimen. (B) Bi-material four-point SENB specimen. (C) Homogenous
pure bending specimen.
four-point SENB test since the amount of elastic energy in the beam was reduced [33]. The effect of
B was not investigated.
Generally, stable crack growth is desirable e.g. when measuring R-curves [34], for tests where a
crack initiates from a notch [20, 35] or for tests with sub-critical crack growth [36, 37]. Furthermore,
when measuring fracture toughness, stable crack growth enables measuring several values instead of a
single one. Often a crack develops from a notch and ”pops-in” meaning that initiation of crack growth
starts at a higher energy release rate because the starter crack does not have a sufficiently sharp tip
leading to an abrupt advance of the crack front and thus an incorrect determination of the critical
energy release rate [38]. Furthermore, for the study of crack deflection at bi-material interfaces [20],
it should be avoided that the unstable crack growth associated with pop-in extends completely to the
interface, which is another reason why stable crack growth is desirable.
A number of models of the four-point SENB specimen loaded with a pure bending moment exist [39,
24, 29]. However, experimental tests are often conducted by applied displacements i.e. displacement
control (fixed grip) [20]. Therefore, this paper presents new models (analytical and numerical) of the
four-point SENB specimen with applied displacements. More specifically, for displacement control,
analytical expressions will be derived for the homogenous specimen (Figure 2 (A)), whereas numerical
models will be applied for the bi-material specimen (Figure 2 (B)).
It is the aim to design the specimen geometry including start-crack length dependent on the loading
configuration such that the crack grows stable and can be observed in-situ during loading. To enable
observation of the crack deflection mechanism it is necessary that the crack can grow stable towards
6
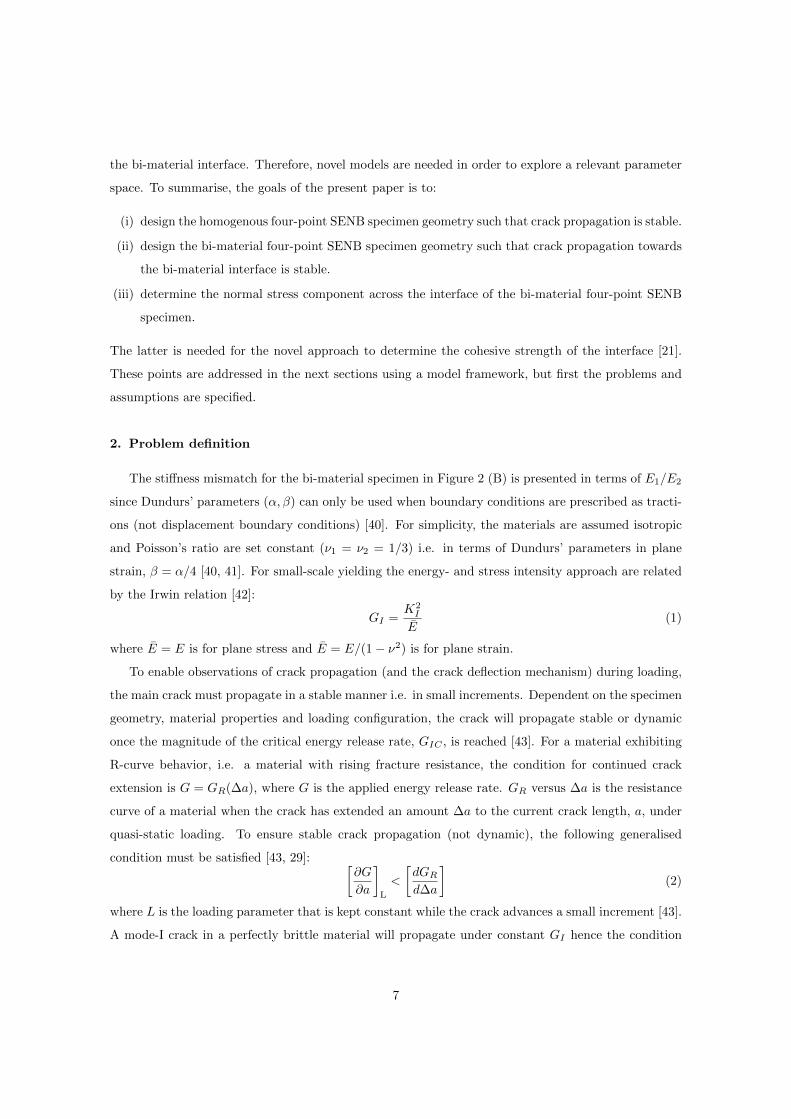
the bi-material interface. Therefore, novel models are needed in order to explore a relevant parameter
space. To summarise, the goals of the present paper is to:
(i) design the homogenous four-point SENB specimen geometry such that crack propagation is stable.
(ii) design the bi-material four-point SENB specimen geometry such that crack propagation towards
the bi-material interface is stable.
(iii) determine the normal stress component across the interface of the bi-material four-point SENB
specimen.
The latter is needed for the novel approach to determine the cohesive strength of the interface [21].
These points are addressed in the next sections using a model framework, but first the problems and
assumptions are specified.
2. Problem definition
The stiffness mismatch for the bi-material specimen in Figure 2 (B) is presented in terms of E1/E2
since Dundurs’ parameters (α, β) can only be used when boundary conditions are prescribed as tracti-
ons (not displacement boundary conditions) [40]. For simplicity, the materials are assumed isotropic
and Poisson’s ratio are set constant (ν1 = ν2 = 1/3) i.e. in terms of Dundurs’ parameters in plane
strain, β = α/4 [40, 41]. For small-scale yielding the energy- and stress intensity approach are related
by the Irwin relation [42]:
GI =K2I
E(1)
where E = E is for plane stress and E = E/(1− ν2) is for plane strain.
To enable observations of crack propagation (and the crack deflection mechanism) during loading,
the main crack must propagate in a stable manner i.e. in small increments. Dependent on the specimen
geometry, material properties and loading configuration, the crack will propagate stable or dynamic
once the magnitude of the critical energy release rate, GIC , is reached [43]. For a material exhibiting
R-curve behavior, i.e. a material with rising fracture resistance, the condition for continued crack
extension is G = GR(∆a), where G is the applied energy release rate. GR versus ∆a is the resistance
curve of a material when the crack has extended an amount ∆a to the current crack length, a, under
quasi-static loading. To ensure stable crack propagation (not dynamic), the following generalised
condition must be satisfied [43, 29]: [∂G
∂a
]
L
<
[dGRd∆a
](2)
where L is the loading parameter that is kept constant while the crack advances a small increment [43].
A mode-I crack in a perfectly brittle material will propagate under constant GI hence the condition
7
for stable crack growth reduces to [43]: [∂GI∂a
]
L
< 0 (3)
In words, the mode-I energy release rate, GI , must decrease with crack length. This general condition
for stable crack growth in a perfectly brittle material can be specified for fixed displacement loading
(fixed grip) as: [∂GI∂a
]
δ
< 0 (4)
or for a fixed loading condition (dead load) as:
[∂GI∂a
]
P
< 0 (5)
Note, for fixed displacement the energy release rate depends on load point displacement and crack
length i.e. GI(δ, a) and similarly for fixed loading i.e. GI(P, a).
The specimens in Figure 2 are analysed for load control, displacement control, and test configuration
since the first derivative of energy release rate, ∂GI/∂a, depends on load conditions, geometry, and
stiffness properties/mismatch. It is therefore non-trivial to determine the best possible test setup and
rigorous models are needed.
The simple pure bending specimen in Figure 2 (A) is analysed in rotation control in Appendix B.
The homogenous four-point SENB specimen in Figure 2 (B) are analysed using analytical expressions
that are derived and used to determine a specimen design with stable crack growth for displacement
control (fixed grip). The assumptions used in the derivations are listed here:
(1) Shear force- and moment distribution are assumed to take the form depicted in Figure C.19 in
Appendix C.
(2) Static equilibrium (no dynamic effects).
(3) LEFM assumptions are satisfied:
(a) Linear-elastic and isotropic material properties.
(b) Brittle material or only small-scale yielding near the crack tip.
(4) Assumptions from Bernoulli-Euler beam theory are fulfilled:
(a) Cross-sections which are plane and normal to the longitudinal axis remain plane and normal
to it after deformation.
(b) Small displacements and small rotations.
The latter requires that linear-elasticity and superposition applies. Numerical models are used to test
the accuracy/limitations of the analytical models and to design the experiment with the bi-material
SENB specimen in Figure 2 (C).
8
3. Analytical model of the homogenous four-point SENB specimen
The standard solution for the stress intensity factor of the crack in the pure bending specimen
(Figure 2 (C)) is given for a homogeneous material by Tada et al. [29] as:
KI = σxx√πaF (a/b), σxx =
6M
b2(6)
where σxx is the maximum normal stress (bending) in the beam in the x-direction at location y = −b/2.
The moment, M , is per width, w. F (a/b) is a non-dimensional function determined by an empirical fit
to semi-analytical data obtained by the boundary collocation procedure [23]. A fit to semi-analytical
data for F (a/b) is given as [24, 29]:
F (a/b) =
√2b
πatan
(πa2b
)0.923 + 0.199(1− sin(πa2b )
)4
cos(πa2b
) (7)
which has an accuracy of better than 0.5% for any a/b. The energy release rate, GI , of a mode-I crack
can be determined using equation 6 and the Irwin relation in equation 1 [42]:
GI =K2I
E=
1
Eσ2xxπa[F (a/b)]2 =
1
E
36M2
b4πa[F (a/b)]2 (8)
For load control, GI in equation 8 can be written on a non-dimensional form as:
GIEb3
M2= 36π
a
b[F (a/b)]2 (9)
In Appendix C an equation for the strain energy of the homogenous four-point SENB specimen is
derived as a function of applied displacements (not moments). It is emphasised in equation 10 that
the strain energy contributions originate from normal stresses, shear stresses and the presence of the
crack according to the principle described by Rice et al. [44]:
Ut =P 2
E
(B
b
)2
B
b+ 3
h
b︸ ︷︷ ︸normal
+3
5
E
2µ
b
B︸ ︷︷ ︸shear
+ 3S(a/b)︸ ︷︷ ︸crack
(10)
where S(a/b) is presented in equation B.9 in Appendix B based on Tada et al. [29]. A relation between
moment, M , and displacement, δ, is derived by combining Ut = Pδ/2, from equation C.1 and equation
C.2 in Appendix C, with the moment, M = PB/2, as:
M =UtB
δ(11)
Inserting Ut from equation 10 in equation 11 and then inserting M from equation 11 in equation 8
gives an expression for GI as a function of applied displacement, δ, as:
GI = πaE
[3
2
δ
B
F (a/b)[Bb + 3hb + 3
5bB ν + 3S(a/b)
]]2
(12)
9
or on a non-dimensional form as:
GIb
Eδ2= π
ab
B2
[3
2
F (a/b)[Bb + 3hb + 3
5bB ν + 3S(a/b)
]]2
(13)
where E = E/(1− ν2) and ν = 1/(1− ν) is for plane strain, and E = E and ν = (1 + ν) is for plane
stress. Note, in displacement control the energy release rate is coupled to the applied displacement
through the elastic constants and the geometrical parameters.
4. Introducing the finite element model
A numerical model is developed in order to test the analytical derivation for the homogeneous
SENB specimen and to analyse the bi-material SENB specimen, see the specimens in Figure 2 (A-B).
The FE model, simulated in Abaqus CAE 6.14 (Dassault Systemes) with eight-noded plane strain
elements, is parametrized with the non-dimensional groups, a/b, h/b and B/b. A symmetry condition
is imposed at x = 0 to reduce the computational time. A focused mesh is applied in the region of 0.5b
in the x-direction of the beam and 100 elements are used over the distance b.
5. Finite element modelling of homogenous SENB specimen
5.1. Benchmark of analytical derivation with finite element simulations
In the beginning of this section, for different geometries of the FE model and analytical model,
two cases are compared; displacement control/load control. The non-dimensional energy release rate
results from the parametric linear-elastic FE model of the homogenous four-point SENB specimen is
presented in Figure 3 (A-B) for both load- and displacement control. The energy release rate results
in Figure 3 (B) for load control are compared with the results of Tada et al. [29].
For displacement control, the curves in Figure 3 (A) start from zero at a/b = 0, increase to a
peak and finally decrease to zero again at a/b = 1. Thus, when a/b → 1 then GI → 0 since the
crack approaches a free surface (at y = b/2) and the load is applied with fixed displacements. A
significant difference is observed in Figure 3 (A) between the results of the analytical- (red curve) and
the numerical model (red symbols) for the short and thick specimen loaded in displacement control.
When h/b and B/b are relatively large, the results of the analytical model (blue curve) are close to the
results from the numerical model (blue dots) as shown in Figure 3 (A). The analytical model becomes
inaccurate for small values of h/b and B/b since assumption (1) used in the derivation is not fulfilled.
For load control, the curves in Figure 3 (B) start from zero at a/b = 0 and increases as the crack
length becomes longer. Thus, for load control (dead load), GI → ∞ when the crack approaches the
free surface, a/b→ 1. For load control in Figure 3 (B), the analytical model deviate from the numerical
10
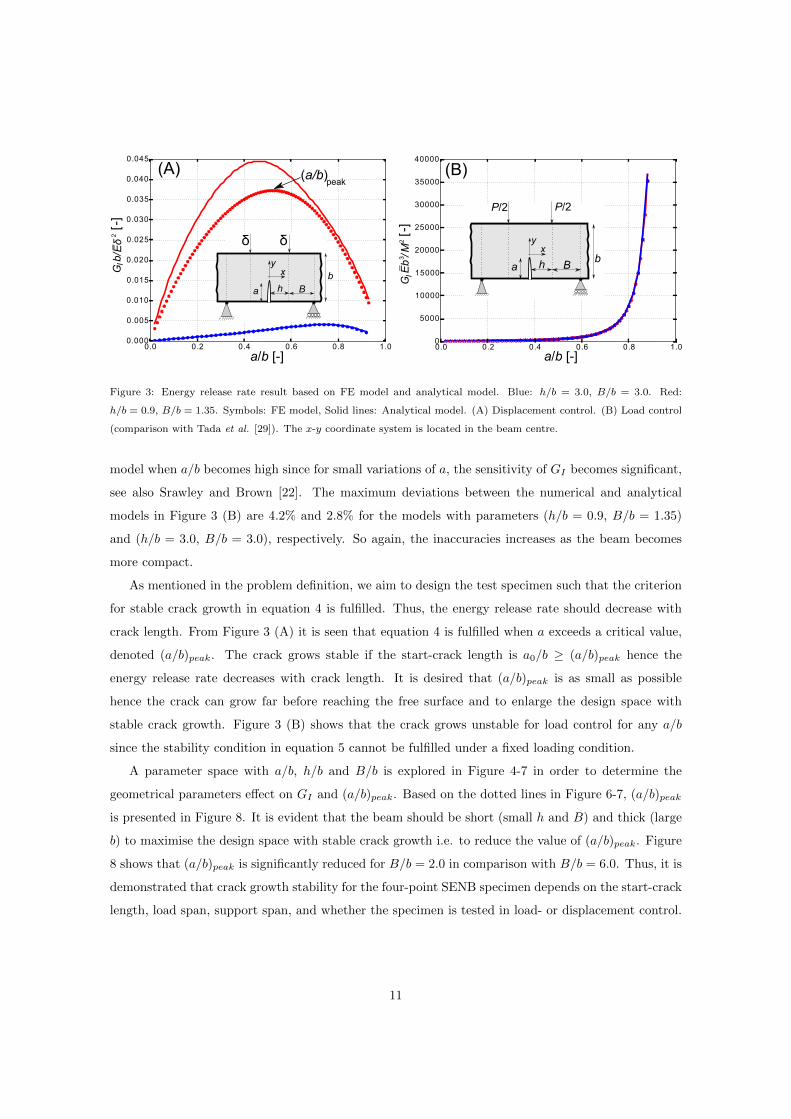
0.0 0.2 0.4 0.6 0.8 1.00.000
0.005
0.010
0.015
0.020
0.025
0.030
0.035
0.040
0.045
(A) (a/b)peak
a/b [-]
[-]
G E
b /3M
2
0.0 0.2 0.4 0.6 0.8 1.00
5000
10000
15000
20000
25000
30000
35000
40000
(B)
a/b [-]
[-]
G b
/ Eδ
2I
I
a
bBh
δ δ
xy a
P/2 P/2
bBh
xy
Figure 3: Energy release rate result based on FE model and analytical model. Blue: h/b = 3.0, B/b = 3.0. Red:
h/b = 0.9, B/b = 1.35. Symbols: FE model, Solid lines: Analytical model. (A) Displacement control. (B) Load control
(comparison with Tada et al. [29]). The x-y coordinate system is located in the beam centre.
model when a/b becomes high since for small variations of a, the sensitivity of GI becomes significant,
see also Srawley and Brown [22]. The maximum deviations between the numerical and analytical
models in Figure 3 (B) are 4.2% and 2.8% for the models with parameters (h/b = 0.9, B/b = 1.35)
and (h/b = 3.0, B/b = 3.0), respectively. So again, the inaccuracies increases as the beam becomes
more compact.
As mentioned in the problem definition, we aim to design the test specimen such that the criterion
for stable crack growth in equation 4 is fulfilled. Thus, the energy release rate should decrease with
crack length. From Figure 3 (A) it is seen that equation 4 is fulfilled when a exceeds a critical value,
denoted (a/b)peak. The crack grows stable if the start-crack length is a0/b ≥ (a/b)peak hence the
energy release rate decreases with crack length. It is desired that (a/b)peak is as small as possible
hence the crack can grow far before reaching the free surface and to enlarge the design space with
stable crack growth. Figure 3 (B) shows that the crack grows unstable for load control for any a/b
since the stability condition in equation 5 cannot be fulfilled under a fixed loading condition.
A parameter space with a/b, h/b and B/b is explored in Figure 4-7 in order to determine the
geometrical parameters effect on GI and (a/b)peak. Based on the dotted lines in Figure 6-7, (a/b)peak
is presented in Figure 8. It is evident that the beam should be short (small h and B) and thick (large
b) to maximise the design space with stable crack growth i.e. to reduce the value of (a/b)peak. Figure
8 shows that (a/b)peak is significantly reduced for B/b = 2.0 in comparison with B/b = 6.0. Thus, it is
demonstrated that crack growth stability for the four-point SENB specimen depends on the start-crack
length, load span, support span, and whether the specimen is tested in load- or displacement control.
11

0.0 0.2 0.4 0.6 0.8 1.00.00
0.01
0.02
0.03
0.04
0.05
0.06
0.07
0.08h/b=1.0
ab
BB
h
δδ
B/b= 1.0B/b= 2.0B/b= 3.0B/b= 4.0B/b= 5.0B/b= 6.0
[-]
G b
/ Eδ2
I
[ -]a/b
Figure 4: Energy release rate results by plane strain FE model and analytical model for different B/b and a/b for
displacement control with h/b = 1.0, E1/E2 = 1.0, ν = 1/3 (lines are analytical results; symbols are FE results).
0.0 0.2 0.4 0.6 0.8 1.00.000
0.005
0.010
0.015
0.020
0.025
0.030
0.035
0.040h/b=3.0
[ -]a/b
ab
B
h
B
δδ
B/b= 1.0B/b= 2.0B/b= 3.0B/b= 4.0B/b= 5.0B/b= 6.0
[-]
G b
/ Eδ2
I
Figure 5: Energy release rate results by plane strain FE model and analytical model for different B/b and a/b for
displacement control with h/b = 3.0, E1/E2 = 1.0 and ν = 1/3 (lines are analytical results; symbols are FE results).
12

0.0 0.2 0.4 0.6 0.8 1.00.000
0.005
0.010
0.015
0.020
0.025
[-]
G b
/ Eδ2
h/b= 0.5h/b= 1.0h/b= 1.5h/b= 2.0h/b= 2.5h/b= 3.0
B/b=2.0
[ -]a/b
ab
BB
h
δδ
I
Figure 6: Energy release rate results by plane strain FE model and analytical model for different h/b and a/b for
displacement control with B/b = 2.0, E1/E2 = 1.0 and ν = 1/3 (lines are analytical results; symbols are FE results).
0.0 0.2 0.4 0.6 0.8 1.00.0000
0.0002
0.0004
0.0006
0.0008
0.0010
0.0012
0.0014
0.0016B/b=6.0
h/b=0.5h/b=1.0h/b=1.5h/b=2.0h/b=2.5h/b=3.0
[ -]a/b
ab
B
h
B
δδ
[-]
G b
/ Eδ2
I
Figure 7: Energy release rate results by plane strain FE model and analytical model for different h/b and a/b for
displacement control with B/b = 6.0, E1/E2 = 1.0 and ν = 1/3 (lines are analytical results; symbols are FE results).
13
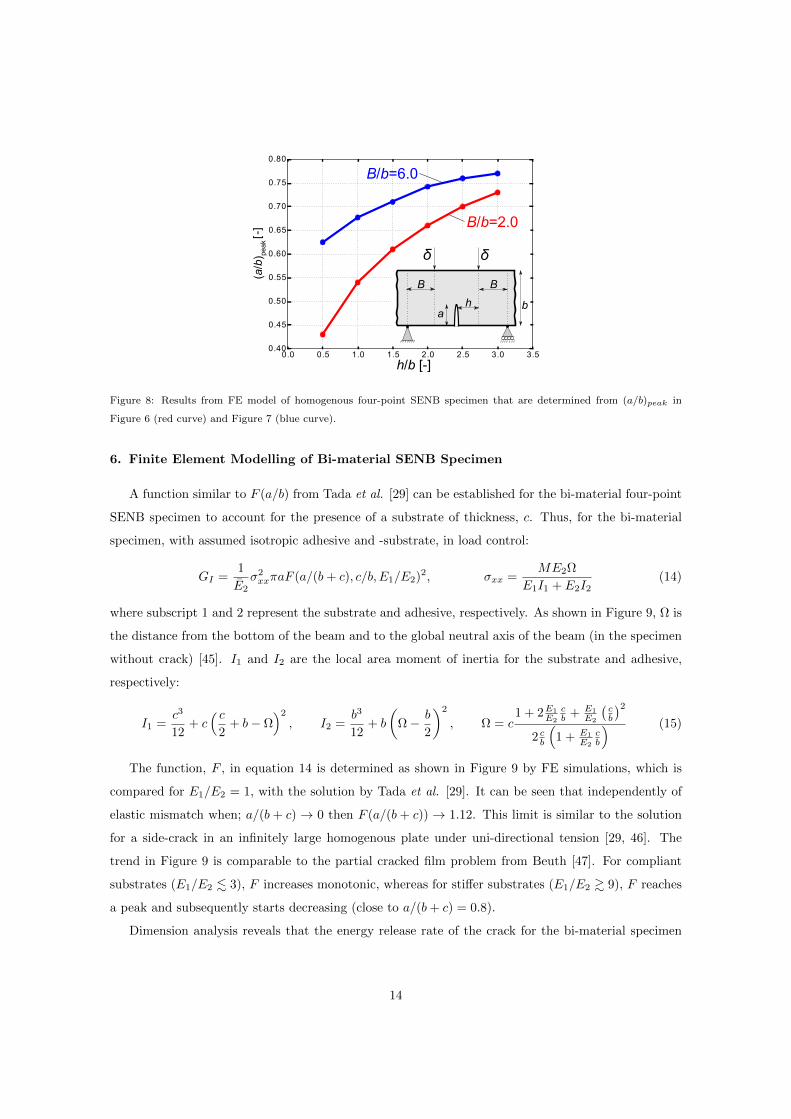
0.0 0.5 1.0 1.5 2.0 2.5 3.0 3.50.40
0.45
0.50
0.55
0.60
0.65
0.70
0.75
0.80
[-] B/b=2.0
B/b=6.0
(a/b
) peak
h/b [-]
ab
BB
h
δδ
Figure 8: Results from FE model of homogenous four-point SENB specimen that are determined from (a/b)peak in
Figure 6 (red curve) and Figure 7 (blue curve).
6. Finite Element Modelling of Bi-material SENB Specimen
A function similar to F (a/b) from Tada et al. [29] can be established for the bi-material four-point
SENB specimen to account for the presence of a substrate of thickness, c. Thus, for the bi-material
specimen, with assumed isotropic adhesive and -substrate, in load control:
GI =1
E2σ2xxπaF (a/(b+ c), c/b, E1/E2)2, σxx =
ME2Ω
E1I1 + E2I2(14)
where subscript 1 and 2 represent the substrate and adhesive, respectively. As shown in Figure 9, Ω is
the distance from the bottom of the beam and to the global neutral axis of the beam (in the specimen
without crack) [45]. I1 and I2 are the local area moment of inertia for the substrate and adhesive,
respectively:
I1 =c3
12+ c
( c2
+ b− Ω)2, I2 =
b3
12+ b
(Ω− b
2
)2
, Ω = c1 + 2E1
E2
cb + E1
E2
(cb
)2
2 cb
(1 + E1
E2
cb
) (15)
The function, F , in equation 14 is determined as shown in Figure 9 by FE simulations, which is
compared for E1/E2 = 1, with the solution by Tada et al. [29]. It can be seen that independently of
elastic mismatch when; a/(b + c) → 0 then F (a/(b + c)) → 1.12. This limit is similar to the solution
for a side-crack in an infinitely large homogenous plate under uni-directional tension [29, 46]. The
trend in Figure 9 is comparable to the partial cracked film problem from Beuth [47]. For compliant
substrates (E1/E2 . 3), F increases monotonic, whereas for stiffer substrates (E1/E2 & 9), F reaches
a peak and subsequently starts decreasing (close to a/(b+ c) = 0.8).
Dimension analysis reveals that the energy release rate of the crack for the bi-material specimen
14
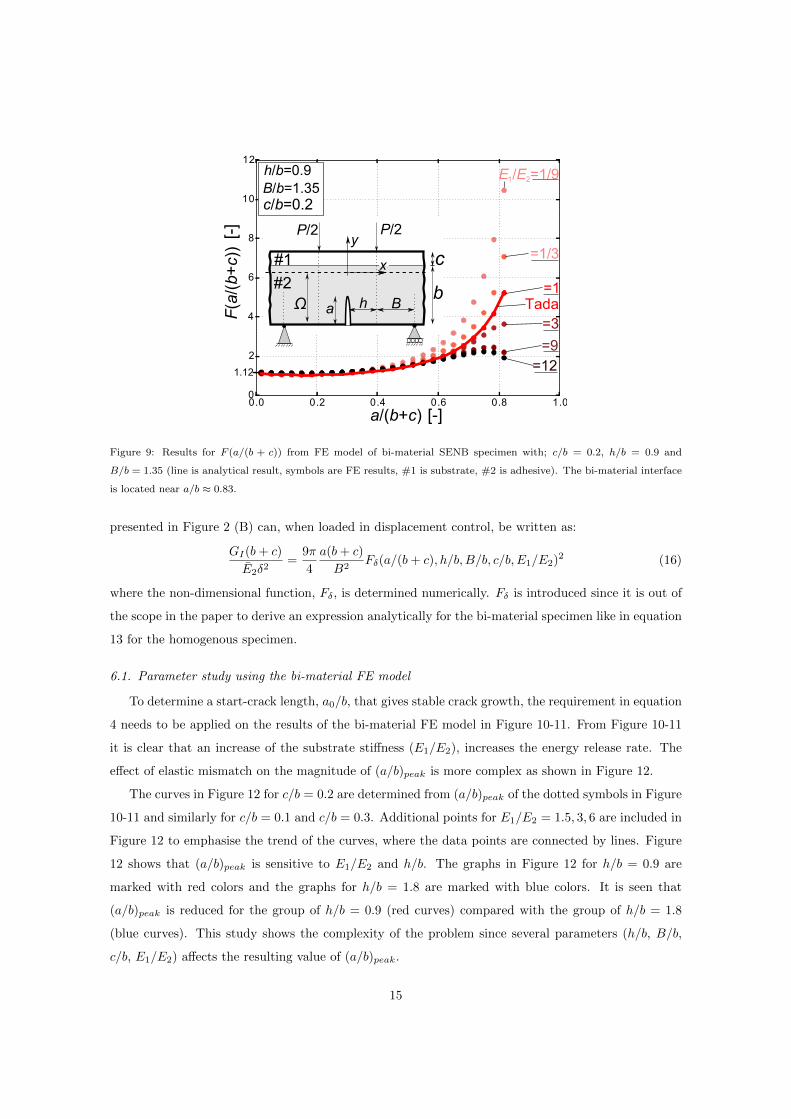
0.0 0.2 0.4 0.6 0.8 1.00
2
4
6
8
10
12
[-]
[-]
=1
=12
=3
=9
=1/3
E /E =1/91 2
c/b=0.2B/b=1.35h/b=0.9
a/(b+c)
F(a
/(b+c)
)
Tadaa
P/2 P/2
Bhb
c#1
#2
1.12
y
x
Ω
Figure 9: Results for F (a/(b + c)) from FE model of bi-material SENB specimen with; c/b = 0.2, h/b = 0.9 and
B/b = 1.35 (line is analytical result, symbols are FE results, #1 is substrate, #2 is adhesive). The bi-material interface
is located near a/b ≈ 0.83.
presented in Figure 2 (B) can, when loaded in displacement control, be written as:
GI(b+ c)
E2δ2=
9π
4
a(b+ c)
B2Fδ(a/(b+ c), h/b,B/b, c/b, E1/E2)2 (16)
where the non-dimensional function, Fδ, is determined numerically. Fδ is introduced since it is out of
the scope in the paper to derive an expression analytically for the bi-material specimen like in equation
13 for the homogenous specimen.
6.1. Parameter study using the bi-material FE model
To determine a start-crack length, a0/b, that gives stable crack growth, the requirement in equation
4 needs to be applied on the results of the bi-material FE model in Figure 10-11. From Figure 10-11
it is clear that an increase of the substrate stiffness (E1/E2), increases the energy release rate. The
effect of elastic mismatch on the magnitude of (a/b)peak is more complex as shown in Figure 12.
The curves in Figure 12 for c/b = 0.2 are determined from (a/b)peak of the dotted symbols in Figure
10-11 and similarly for c/b = 0.1 and c/b = 0.3. Additional points for E1/E2 = 1.5, 3, 6 are included in
Figure 12 to emphasise the trend of the curves, where the data points are connected by lines. Figure
12 shows that (a/b)peak is sensitive to E1/E2 and h/b. The graphs in Figure 12 for h/b = 0.9 are
marked with red colors and the graphs for h/b = 1.8 are marked with blue colors. It is seen that
(a/b)peak is reduced for the group of h/b = 0.9 (red curves) compared with the group of h/b = 1.8
(blue curves). This study shows the complexity of the problem since several parameters (h/b, B/b,
c/b, E1/E2) affects the resulting value of (a/b)peak.
15
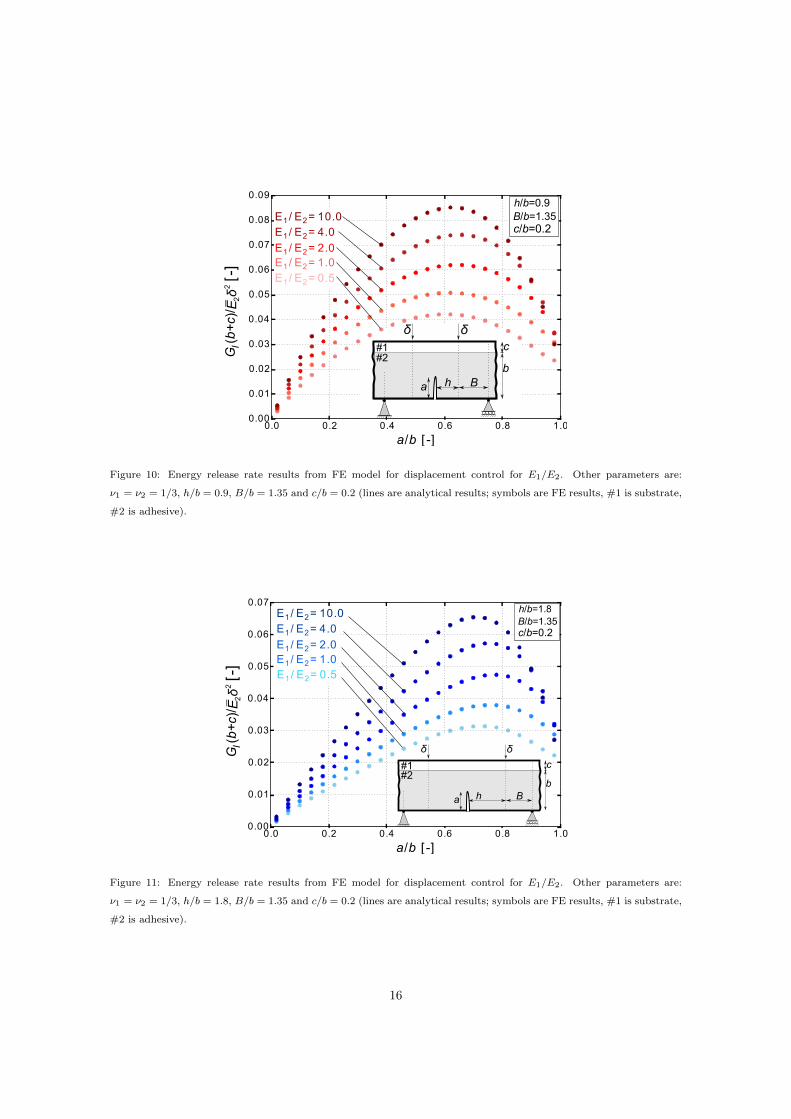
0.0 0.2 0.4 0.6 0.8 1.0
a/b [ -]
0.00
0.01
0.02
0.03
0.04
0.05
0.06
0.07
0.08
0.09
[-]
G (
b+c)
/ E δ
22
c/b=0.2B/b=1.35h/b=0.9
a Bhb
c
δδ#1#2
I
E1/ E2= 0.5E1/ E2= 1.0E1/ E2= 2.0
E1/ E2= 4.0E1/ E2= 10.0
Figure 10: Energy release rate results from FE model for displacement control for E1/E2. Other parameters are:
ν1 = ν2 = 1/3, h/b = 0.9, B/b = 1.35 and c/b = 0.2 (lines are analytical results; symbols are FE results, #1 is substrate,
#2 is adhesive).
0.0 0.2 0.4 0.6 0.8 1.0
a/b [ -]
0.00
0.01
0.02
0.03
0.04
0.05
0.06
0.07
c/b=0.2B/b=1.35h/b=1.8
a Bhb
c
δδ
#1#2
[-]
G (
b+c)
/ E δ
22
I
E1/ E2= 1.0E1/ E2= 2.0
E1/ E2= 4.0E1/ E2= 10.0
E1/ E2= 0.5
Figure 11: Energy release rate results from FE model for displacement control for E1/E2. Other parameters are:
ν1 = ν2 = 1/3, h/b = 1.8, B/b = 1.35 and c/b = 0.2 (lines are analytical results; symbols are FE results, #1 is substrate,
#2 is adhesive).
16
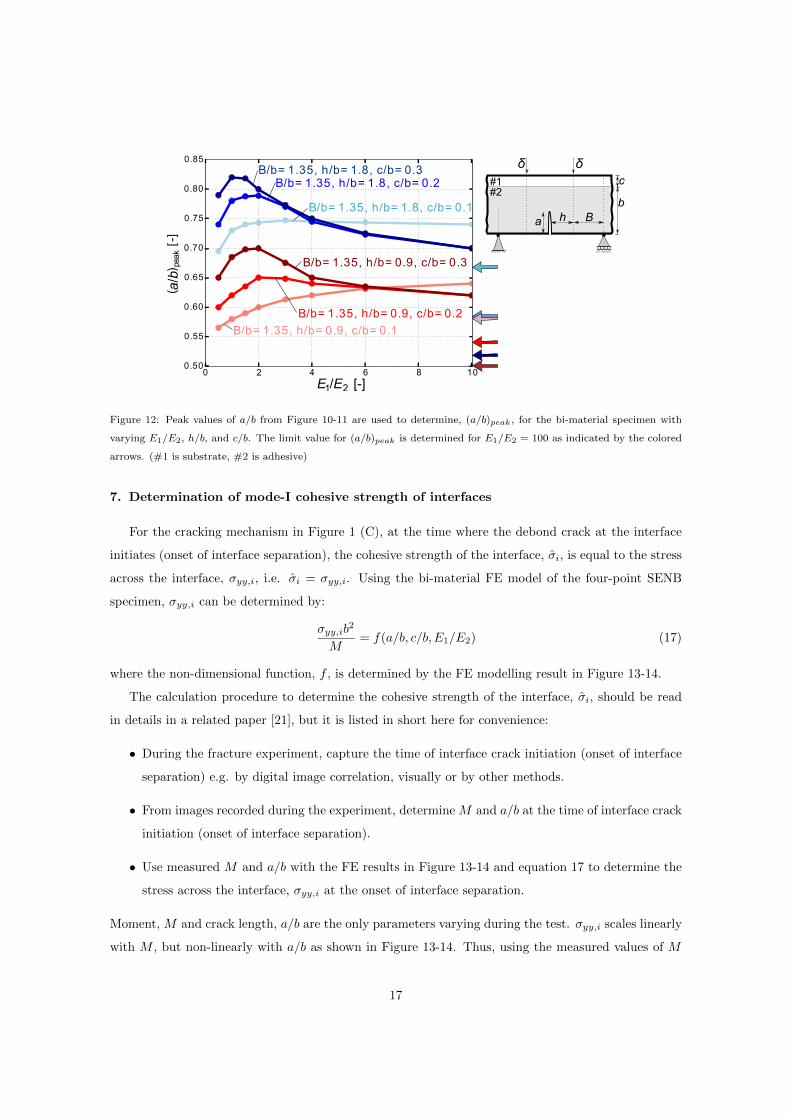
0 2 4 6 8 100.50
0.55
0.60
0.65
0.70
0.75
0.80
0.85(
) pea
k[-
]
B/b= 1.35, h/b= 0.9, c/b= 0.1
B/b= 1.35, h/b= 0.9, c/b= 0.2
B/b= 1.35, h/b= 0.9, c/b= 0.3
B/b= 1.35, h/b= 1.8, c/b= 0.1
B/b= 1.35, h/b= 1.8, c/b= 0.2B/b= 1.35, h/b= 1.8, c/b= 0.3
E /E [-]1 2
a/b
a Bhb
c
δδ#1#2
Figure 12: Peak values of a/b from Figure 10-11 are used to determine, (a/b)peak, for the bi-material specimen with
varying E1/E2, h/b, and c/b. The limit value for (a/b)peak is determined for E1/E2 = 100 as indicated by the colored
arrows. (#1 is substrate, #2 is adhesive)
7. Determination of mode-I cohesive strength of interfaces
For the cracking mechanism in Figure 1 (C), at the time where the debond crack at the interface
initiates (onset of interface separation), the cohesive strength of the interface, σi, is equal to the stress
across the interface, σyy,i, i.e. σi = σyy,i. Using the bi-material FE model of the four-point SENB
specimen, σyy,i can be determined by:
σyy,ib2
M= f(a/b, c/b, E1/E2) (17)
where the non-dimensional function, f , is determined by the FE modelling result in Figure 13-14.
The calculation procedure to determine the cohesive strength of the interface, σi, should be read
in details in a related paper [21], but it is listed in short here for convenience:
• During the fracture experiment, capture the time of interface crack initiation (onset of interface
separation) e.g. by digital image correlation, visually or by other methods.
• From images recorded during the experiment, determine M and a/b at the time of interface crack
initiation (onset of interface separation).
• Use measured M and a/b with the FE results in Figure 13-14 and equation 17 to determine the
stress across the interface, σyy,i at the onset of interface separation.
Moment, M and crack length, a/b are the only parameters varying during the test. σyy,i scales linearly
with M , but non-linearly with a/b as shown in Figure 13-14. Thus, using the measured values of M
17
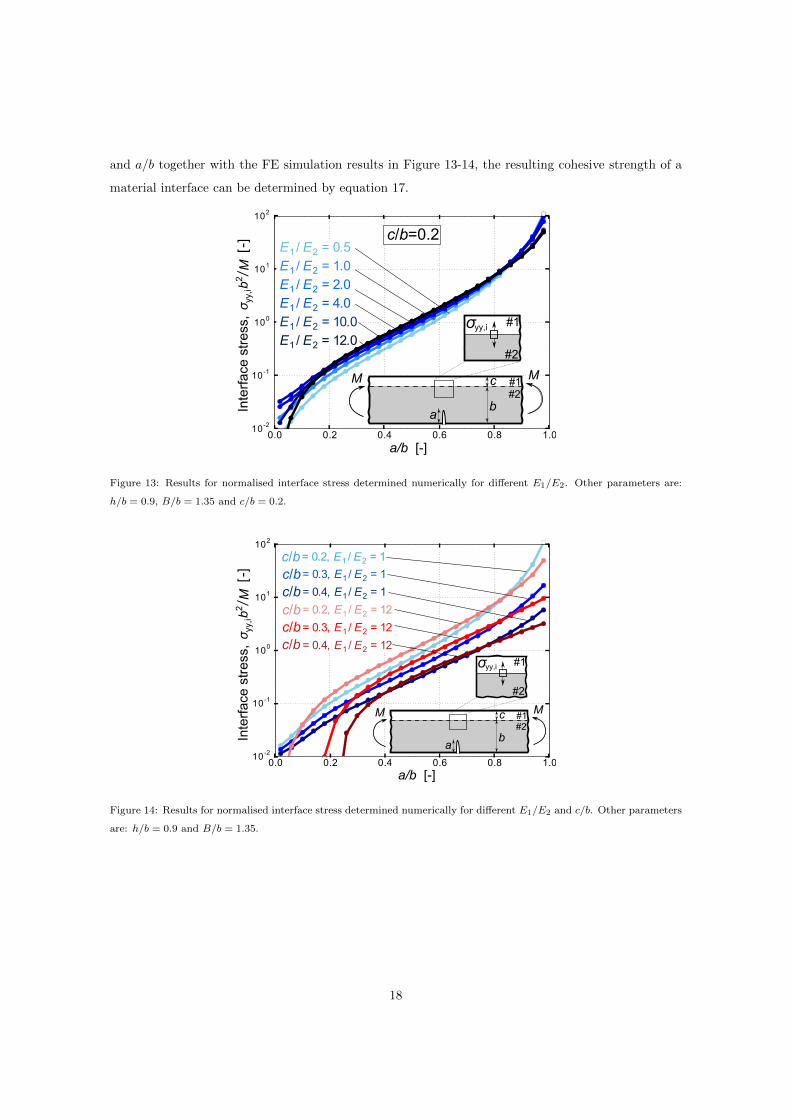
and a/b together with the FE simulation results in Figure 13-14, the resulting cohesive strength of a
material interface can be determined by equation 17.
0.0 0.2 0.4 0.6 0.8 1.010-2
10-1
100
101
102
a/b [-]
c/b=0.2σ
yy,ib
2M
[-]
/In
terf
ace
stre
ss,
E1 / E2 = 0.5E1 / E2 = 1.0E1 / E2 = 2.0E1 / E2 = 4.0E1 / E2 = 10.0E1 / E2 = 12.0
#1#2
a
c
b
#2
MM
σ yy,i #1
Figure 13: Results for normalised interface stress determined numerically for different E1/E2. Other parameters are:
h/b = 0.9, B/b = 1.35 and c/b = 0.2.
0.0 0.2 0.4 0.6 0.8 1.010-2
10-1
100
101
102
σyy
,ib
2M
[-]
/
a/b [-]
Inte
rfac
e st
ress
,
= 0.2, E1 / E2 = 1c/b= 0.3, E1 / E2 = 1c/b= 0.4, E1 / E2 = 1c/b= 0.2, E1 / E2 = 12c/b= 0.3, E1 / E2 = 12c/b= 0.4, E1 / E2 = 12c/b
#1#2
a
c
b
#2
MM
σ yy,i #1
Figure 14: Results for normalised interface stress determined numerically for different E1/E2 and c/b. Other parameters
are: h/b = 0.9 and B/b = 1.35.
18

8. Experimental test of model predictions
In order to test the model predictions for stable growth of the crack, homogenous four-point SENB
specimens cast of adhesive were manufactured and tested experimentally in the laboratory.
8.1. Experimental procedure
The four-point SENB specimens were cast by injection of an adhesive in-between two glass plates
to create a homogenous plate of adhesive. Prior to the injection, the surfaces of the glass plates were
waxed to ease the removal of the cast adhesive plate. The adhesive plate was post-cured and cut into
beams with similar outer dimensions (w/b ≈ 0.7). The adhesive type and processing conditions are
proprietary. Start-cracks were cut using an ultra thin razor blade of thickness 76 microns (Ultra-thin
single edge, stainless steel blade from Ted Pella, Inc.). The test setup were adjusted with h/b = 0.9
and B/b = 1.35. The specimens were placed in a four-point bend fixture and loaded by a MTS 858
Mini Bionix II servo-hydraulic test machine at a constant displacement-rate of 0.015 mm/min, where
the load is measured by a 1.5 kN load cell. For selected tests, the crack length is measured on images
taken during the test by help from a Python script [48, 49].
8.2. Experimental results
The measured bending moment as a function of load point displacement for a selection of test
specimens is presented in Figure 15 (A). The curves (bending moment vs load point displacement)
show similar trend as those curves reported in the literature [15, 33]. All curves, except of the first
∼ 0.05 mm, starts with a linear part until the onset of crack propagation where the moment drops.
Onset of crack propagation is identified near the measured maximum moment (the peak) according to
images taken during the test. The smooth decrease in M is associated with stable crack propagation.
All curves decrease smoothly until zero moment is measured at displacement, δ ≈ 0.9-1.0 mm, except
of the test with a start-crack length of a0/b = 0.34 (Test 1 in Figure 15 (A)). For this test, the
moment initially increases faster with applied displacement since the start-crack length is short. The
moment drops instantaneously to zero at displacement, δ ≈ 0.29 mm, due to unstable crack growth.
In accordance with the model in Figure 15 (B), the sudden drop in moment for this test exemplifies
the response of the crack growth when the start-crack length is made too short i.e. unstable crack
growth.
The observed unstable crack growth for Test 1 with a0/b = 0.34, shown in Figure 15 (A), agrees
fairly well with the prediction by the analytical model presented in Figure 15 (B). The analytical
model in Figure 15 (B) at a0/b = 0.34 illustrates that the crack stability criterion in equation 4 is
not fulfilled. Thus, at the onset of crack propagation the crack grows unstable. As opposed to the
model, in the experiment crack propagation does not become stable again at higher a/b since the
19

50
0
50
100
150
200
250
Mom
ent p
er w
idth
, M
[Nm
m/m
m]
a /b=0.56 (Test 6)0
a /b=0.47 (Test 2)0
a /b=0.49 (Test 4)0
a /b=0.54 (Test 5)0
0a /b=0.34 (un
a /b=0.48 (Test 3)0
a/b=1.0 a/b=1.0
a/b=1.0a/b=1.0
a/b=1.0
(A)(Test 1)
0.0 0.2 0.4 0.6 0.8 1.00.000
0.005
0.010
0.015
0.020
0.025
0.030
0.035
0.040
0.045
[-]
G b
/ Eδ
2
(B)a /b=0.34
0 a /b=0.470
a /b=0.560
(unstable)a/b=1.0
ab
BB
h
δδ
I
a/b [-]
x
xx
x xxunstable stable
0.20.0 0.60.4 0.8 1.0 1.2Displacement, δ [mm]
Figure 15: Adhesive four-point SENB specimens (homogenous with h/b = 0.9 and B/b = 1.35). (A) Experimental test
in displacement control. (B) Analytical model of the experiment.
unstable crack growth activates dynamic effects. For the other test specimens with a0/b ≥ 0.47, the
crack propagates stable as shown by the smoothly decreasing curves in Figure 15 (A) since the crack
stability criterion in equation 4 is satisfied. Thus, it is demonstrated experimentally that a proper
selection of the start-crack length, e.g. by modelling, is useful for determining a start-crack length
that gives stable crack propagation.
The measured bending moment and crack length of another four-point SENB specimen are presen-
ted in Figure 16 to investigate the crack propagation in further details. Overall, the bending moment
decreases smoothly hence the crack propagates stable and the crack length can be measured on images
during the test. However, a small instability is seen in Figure 16 at the onset of crack propagation (at
displacement δ ≈ 0.35 mm). This unexpected behaviour is attributed the manual cutting of the notch
that is not as sharp as a real crack. Thus, the initiation of a crack from the notch gives abrupt crack
growth in the beginning i.e. ”pop-in” effect [50]. Except of this initiation phenomenon, the remaining
growth of the crack is stable as shown by the measured crack length in Figure 16.
9. Discussions
9.1. Discussion of modelling results
When the length of the beam is short, the boundary effects are significant meaning that the moment
and shear force distributions are not as idealised as shown in Figure C.19 in Appendix Appendix C. In
the analytical model, it is assumed that the normal stress is perfectly linear across the beam thickness
and the shear stress distribution is perfectly parabolic, but near the boundaries the shear stress field is
not as assumed in the analytical model. While these localised boundary effects are not included in the
20
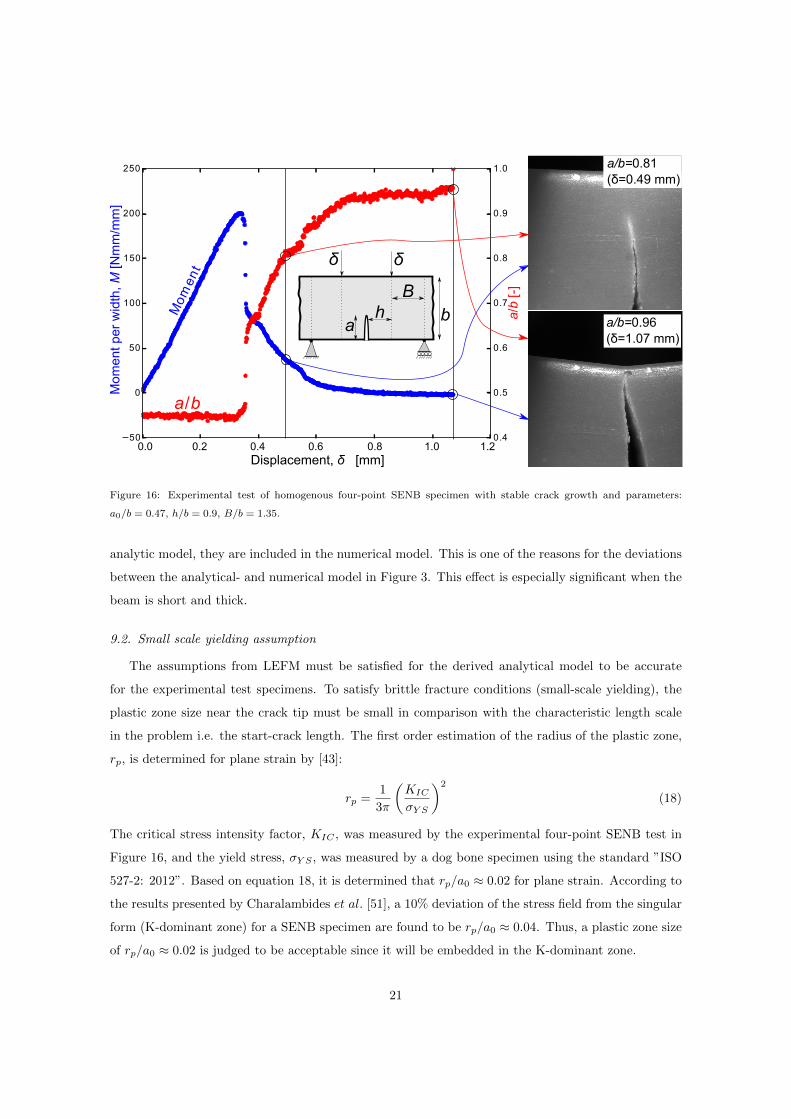
0.4
0.5
0.6
0.7
0.8
0.9
1.0
50
0
50
100
150
200
250M
omen
t
a/b
a/b=0.96(δ=1.07 mm)
a/b=0.81(δ=0.49 mm)
Mom
ent p
er w
idth
, M [N
mm
/mm
]
a/b
[-]
ab
Bh
δδ
0.20.0 0.60.4 0.8 1.0 1.2Displacement, δ [mm]
Figure 16: Experimental test of homogenous four-point SENB specimen with stable crack growth and parameters:
a0/b = 0.47, h/b = 0.9, B/b = 1.35.
analytic model, they are included in the numerical model. This is one of the reasons for the deviations
between the analytical- and numerical model in Figure 3. This effect is especially significant when the
beam is short and thick.
9.2. Small scale yielding assumption
The assumptions from LEFM must be satisfied for the derived analytical model to be accurate
for the experimental test specimens. To satisfy brittle fracture conditions (small-scale yielding), the
plastic zone size near the crack tip must be small in comparison with the characteristic length scale
in the problem i.e. the start-crack length. The first order estimation of the radius of the plastic zone,
rp, is determined for plane strain by [43]:
rp =1
3π
(KIC
σY S
)2
(18)
The critical stress intensity factor, KIC , was measured by the experimental four-point SENB test in
Figure 16, and the yield stress, σY S , was measured by a dog bone specimen using the standard ”ISO
527-2: 2012”. Based on equation 18, it is determined that rp/a0 ≈ 0.02 for plane strain. According to
the results presented by Charalambides et al. [51], a 10% deviation of the stress field from the singular
form (K-dominant zone) for a SENB specimen are found to be rp/a0 ≈ 0.04. Thus, a plastic zone size
of rp/a0 ≈ 0.02 is judged to be acceptable since it will be embedded in the K-dominant zone.
21

9.3. Homogenous four-point SENB experiments - uncertainties
The test-to-test variations observed for the initial linear slope in the results of the four-point SENB
experiments are primarily attributed the differences in start-crack length. Material variations may
affect the measured maximum load. Furthermore, air voids in the adhesive can give variations in the
measured curves in Figure 15 (A). The maximum diameter of the voids in the adhesive is measured
to about 0.04b. Voids of this size may accelerate the crack growth in certain regions of the specimens
e.g. indicated by the fluctuations and bumps on the smooth curves in Figure 15 (A). Adjustment and
alignment of the load rig may affect the shape of the whole curve in Figure 15 (A).
9.4. Stability of crack growth
Typically in the literature, the four-point SENB specimen is used for characterising materials that
have a constant fracture toughness (i.e. no R-curve), which not necessarily requires stable crack pro-
pagation. However, for many applications, as mentioned in the introduction, stable crack propagation
is essential to avoid dynamic effects and enable monitoring crack growth. Furthermore, a test with
stable crack growth means that a sharp crack is formed from the start-notch, which in practice cannot
be made as sharp as a real crack. According to the test standards ISO-15024:2001(E) and ASTM
D5528-01, the start notch should not exceed width of 13 µm when measuring fracture toughness of
uni-directional composites. If the start notch is machined it should not exceed a width of 10 µm
according to the study of fine grained alumina by Nishida et al. [38].
When a sharp crack propagates stable, a more accurate fracture toughness value can be measured
since several measurements can be made using just a single test specimen. In any case, stable crack
growth is attractive, as it can help uncovering unexpected behavior such as rate dependent- or R-curve
behavior. Also, possible errors introduced by having a machined notch as a starter crack, in contrast
to a truly sharp crack, is eliminated.
9.5. Discussion of results in relation to existing literature
From the results in Figure 8, the test specimen design by Brinckmann et al. [12] can be improved
such that crack propagation are stable and can be monitored. For this particular specimen design
(B/b = 6.9), it is recommended to use a smaller B/b in order to reduce the elastic strain energy of the
beam and thereby enhance the probability of stable crack propagation. However, if the substrate is a
laminate, the four-point SENB specimen might fail in shear (mode-II shear crack or delamination) in
between the support- and load points if B is too small and a weak interface exists in the substrate of
the bi-material specimen [26].
22

9.6. Bi-material model with orthotropic substrate:
As mentioned in the introduction, the methods are also aimed to be applicable for designing
experiments with stable crack growth for adhesive-composite joints. Therefore, it is tested, for the bi-
material four-point SENB specimen, how accurate it is to model a uni-directional glass-fiber laminate
as an isotropic substrate. The in-plane orthotropy can be described by the dimensionless parameters
[52]:
λ =EyyExx
, ρ =(ExxEyy)1/2
2Gxy− (νxyνyx)1/2 (19)
where λ = 0.3 and ρ = 2.5 are representative for a uni-directional glass-fiber laminate where material
directions are following the coordinate system shown in Figure 9. For the FE model with isotropic
substrate, Exx and νxy are the only input of stiffness parameters i.e. λ = ρ = 1 [52]. Results from
a bi-material FE model with a substrate of an isotropic material (λ = ρ = 1) were compared with a
bi-material FE model with a substrate of an orthotropic material (λ = 0.3 and ρ = 2.5) for geometrical
parameters of h/b = 0.9, B/b = 1.35 and c/b = 0.2. The energy release rates of the cracks and (a/b)peak
are comparable (within 5%) for the isotropic and orthotropic cases. This suggests that the primary
stiffness in the x-direction, Exx, is the main stiffness parameter that governs the energy release rate
of the crack in the model with orthotropic substrate.
10. Conclusions
An analytical model of the displacement loaded four-point SENB test specimen was derived and
found to agree well with FE simulations under certain geometrical conditions. The models (analytical
and numerical) were efficient to design the experiment with stable crack growth since stability depends
on load configuration, crack length and geometry. These models suggest that the beam should be short
and thick, and the start-crack length should be relatively deep for the main crack to propagate stable.
The model predictions for stable crack growth were tested experimentally by homogenous four-
point SENB specimens cast of pure adhesive. The experiments showed that crack growth is stable if
the start-crack length was made sufficiently long and unstable if not. The stable crack propagation
was documented by a series of images captured in-situ during loading. Thus, for the material systems
used in the present work, the displacement loaded four-point SENB specimen was found appropriate
for studying crack deflection at interfaces since stable crack growth could be achieved.
Acknowledgements
First of all thanks to professor Michael D. Thouless, University of Michigan, for useful discussions
about modelling and mechanical testing. Also, thanks to James Gorman, University of Michigan for his
23
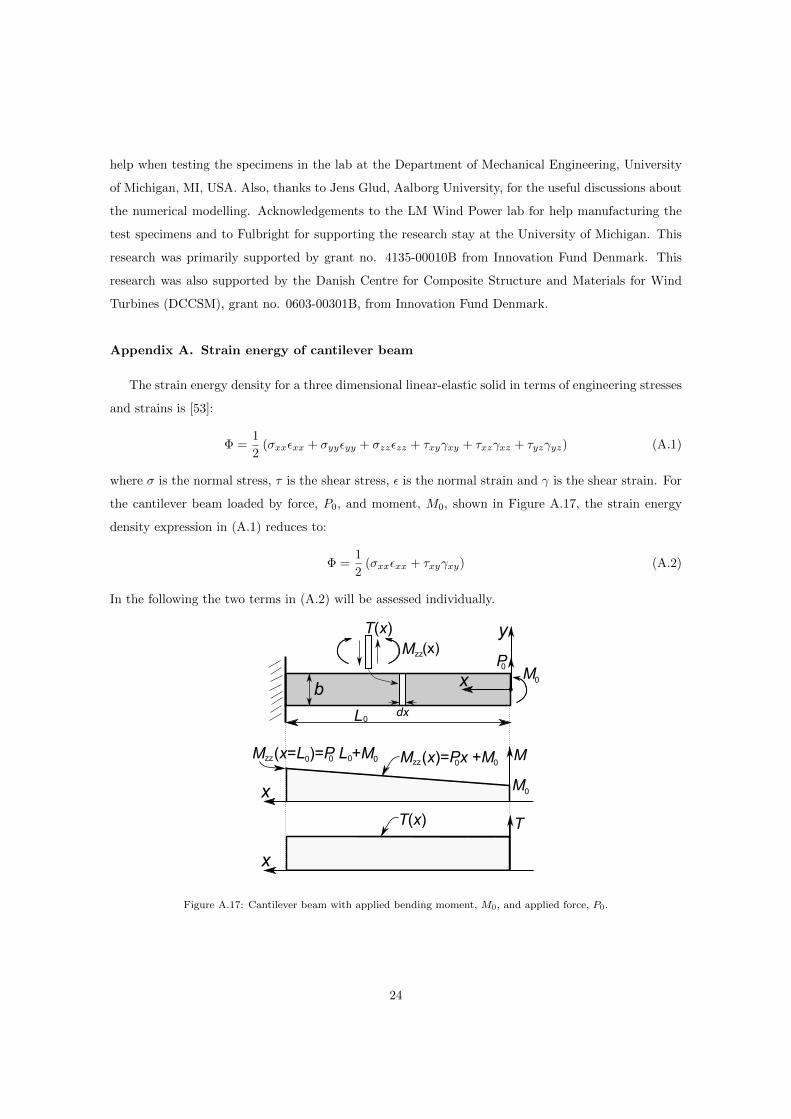
help when testing the specimens in the lab at the Department of Mechanical Engineering, University
of Michigan, MI, USA. Also, thanks to Jens Glud, Aalborg University, for the useful discussions about
the numerical modelling. Acknowledgements to the LM Wind Power lab for help manufacturing the
test specimens and to Fulbright for supporting the research stay at the University of Michigan. This
research was primarily supported by grant no. 4135-00010B from Innovation Fund Denmark. This
research was also supported by the Danish Centre for Composite Structure and Materials for Wind
Turbines (DCCSM), grant no. 0603-00301B, from Innovation Fund Denmark.
Appendix A. Strain energy of cantilever beam
The strain energy density for a three dimensional linear-elastic solid in terms of engineering stresses
and strains is [53]:
Φ =1
2(σxxεxx + σyyεyy + σzzεzz + τxyγxy + τxzγxz + τyzγyz) (A.1)
where σ is the normal stress, τ is the shear stress, ε is the normal strain and γ is the shear strain. For
the cantilever beam loaded by force, P0, and moment, M0, shown in Figure A.17, the strain energy
density expression in (A.1) reduces to:
Φ =1
2(σxxεxx + τxyγxy) (A.2)
In the following the two terms in (A.2) will be assessed individually.
MP0
0
b
L0
M
M0
x
M (x=L )=P L +M0 00 0zz M (x)=Px +M0 0zz
dx
Mzz(x)y
x
TT(x)
x
T(x)
Figure A.17: Cantilever beam with applied bending moment, M0, and applied force, P0.
24

Appendix A.1. Strain energy of cantilever beam due to normal stresses
The strain energy density for the first term in (A.2) due to normal stress is:
Φ(x, y) =1
2σxxεxx (A.3)
Based on the stress across the beam section, σxx(y) = −Mzzy/I, the strain distribution, εxx(y) = −κy,
and Hookes law, σxx = Eσyy, it can be shown that the total strain energy in a beam under pure bending
moments is [53]:
UM =
∫ L0
0
(M2zz
2EI
)dx (A.4)
where the area moment of inertia per width, I, for a rectangular cross section is; I = b3/12. If the
beam is loaded by force, P0, and moment, M0, then the cross-sectional moment, Mzz(x), varies linearly
over the beam length, L0, as shown in Figure A.17. The strain energy of the cantilever beam in Figure
A.17 with an applied moment per width, M0, and an applied force per width, P0, is (see p. 726-731
in [54]):
UM =
∫ L0
0
(Mzz(x)2
2EI
)dx =
∫ L0
0
((P0x+M0)2
2EI
)dx =
6
b3E
(P 20
3+ P0M0L
20 +M2
0L0
)(A.5)
The strain energy in the four-point bend specimen under applied bending forces is (M0 = 0):
UP0 = 2P 20
b3EL30 (A.6)
whereas the strain energy in the beam under pure bending moments is (P0 = 0):
UM0= 6
M20
b3EL0 (A.7)
Appendix A.2. Strain energy of cantilever beam due to shear stresses
The strain energy density for the second term in (A.2) due to shear stress is:
Φ(x, y) =1
2τxyγxy =
1
2
τ2xyµ
(A.8)
where the shear stress, τxy, is given by Hookes law for shear, τxy = µγxy [54]. Here, µ is the shear
modulus and γxy is the shear strain. For a rectangular cross section, the through thickness shear stress
distribution is assumed parabolic on the form (see p. 192 in [46] or p. 392 in [54]):
τxy(x, y) =T (x)
2I
((b
2
)2
− y2)
=3
2
T (x)
b
(1−
(2y
b
)2)(A.9)
where the applied shear force is denoted T . The strain energy density becomes:
Φ(x, y) =1
2
τxy(x, y)2
µ=
1
2µ
[3
2
T (x)
b
(1−
(2y
b
)2)]2=
1
2µ
(3
2
T (x)
b
)2(1 +
(2y
b
)4− 2
(2y
b
)2)
(A.10)
25
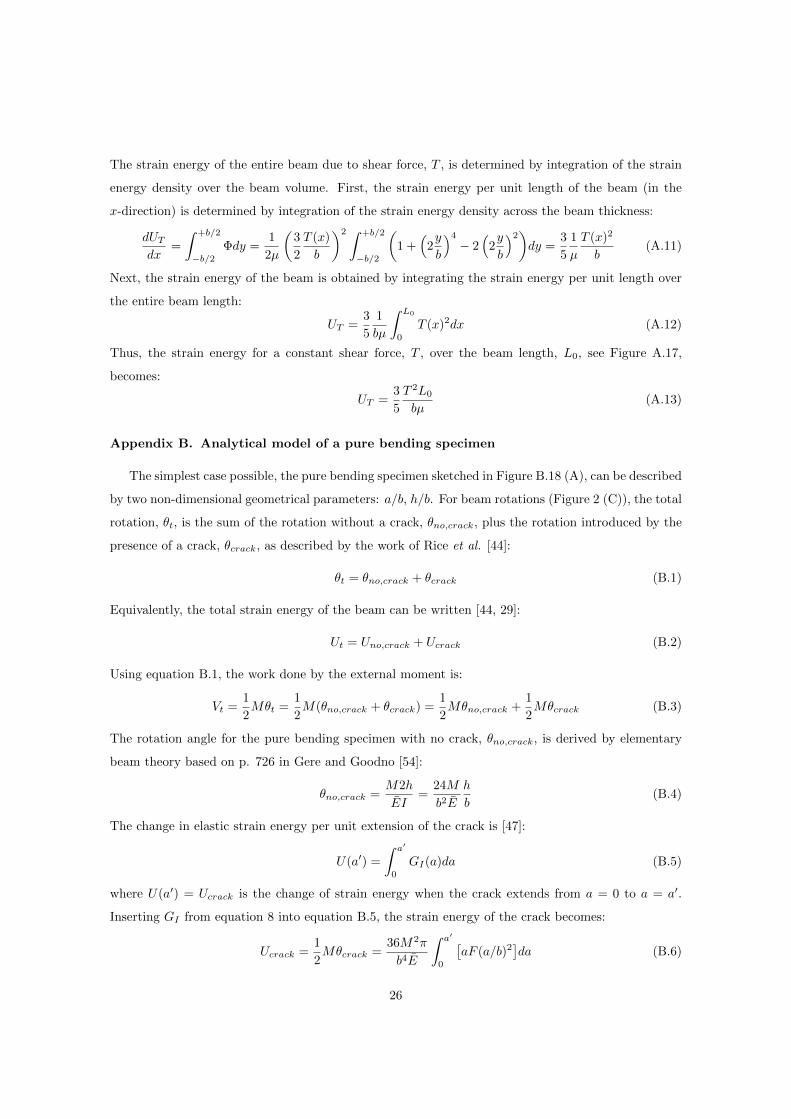
The strain energy of the entire beam due to shear force, T , is determined by integration of the strain
energy density over the beam volume. First, the strain energy per unit length of the beam (in the
x-direction) is determined by integration of the strain energy density across the beam thickness:
dUTdx
=
∫ +b/2
−b/2Φdy =
1
2µ
(3
2
T (x)
b
)2 ∫ +b/2
−b/2
(1 +
(2y
b
)4− 2
(2y
b
)2)dy =
3
5
1
µ
T (x)2
b(A.11)
Next, the strain energy of the beam is obtained by integrating the strain energy per unit length over
the entire beam length:
UT =3
5
1
bµ
∫ L0
0
T (x)2dx (A.12)
Thus, the strain energy for a constant shear force, T , over the beam length, L0, see Figure A.17,
becomes:
UT =3
5
T 2L0
bµ(A.13)
Appendix B. Analytical model of a pure bending specimen
The simplest case possible, the pure bending specimen sketched in Figure B.18 (A), can be described
by two non-dimensional geometrical parameters: a/b, h/b. For beam rotations (Figure 2 (C)), the total
rotation, θt, is the sum of the rotation without a crack, θno,crack, plus the rotation introduced by the
presence of a crack, θcrack, as described by the work of Rice et al. [44]:
θt = θno,crack + θcrack (B.1)
Equivalently, the total strain energy of the beam can be written [44, 29]:
Ut = Uno,crack + Ucrack (B.2)
Using equation B.1, the work done by the external moment is:
Vt =1
2Mθt =
1
2M(θno,crack + θcrack) =
1
2Mθno,crack +
1
2Mθcrack (B.3)
The rotation angle for the pure bending specimen with no crack, θno,crack, is derived by elementary
beam theory based on p. 726 in Gere and Goodno [54]:
θno,crack =M2h
EI=
24M
b2E
h
b(B.4)
The change in elastic strain energy per unit extension of the crack is [47]:
U(a′) =
∫ a′
0
GI(a)da (B.5)
where U(a′) = Ucrack is the change of strain energy when the crack extends from a = 0 to a = a′.
Inserting GI from equation 8 into equation B.5, the strain energy of the crack becomes:
Ucrack =1
2Mθcrack =
36M2π
b4E
∫ a′
0
[aF (a/b)2
]da (B.6)
26
where we arrive at Ucrack = Mθcrack/2 by combining equation B.2 and equation B.3 through equation
C.2. From equation B.6 the rotation angle from the presence of the crack, θcrack, can be determined:
θcrack =72M
b2Eπ
∫ a′
0
[aF (a/b)2
b2
]da (B.7)
Inserting M = σxxb2/6 from equation 6 into equation B.7 gives:
θcrack =12σxxE
π
∫ a′
0
[a[F (a/b)]2
b2
]da =
4σxxE
(3π
∫ a′
0
[a[F (a/b)]2
b2
]da
)=
4σxxE
S(a/b) (B.8)
Thus, from equation B.8 it follows that S(a/b) = 3π∫ a′0
[a[F (a/b)]2
b2
]da. S(a/b) is also given as a fit by
Tada et al. [29]:
S(a/b) =
(a/b
1− a/b
)2 [5.93− 19.69(a/b) + 37.14(a/b)2 − 35.84(a/b)3 + 13.12(a/b)4
](B.9)
The rotation angle, θt, can be determined from equation B.1 by adding θcrack (equation B.8) and
θno,crack (equation B.4). Subsequently, θt in equation B.1 can be used in combination with the general
compliance relation, Ct = θt/M , to derive the compliance, Ct, for the pure bending specimen in Figure
B.18 (A) as:
Ct =24
b2E
(h
b+ S(a/b)
)(B.10)
The energy release rate, GI , for the pure bending specimen can be expressed in terms of an applied
rotation by inserting Ct in equation B.10 in the general relation for compliance, M = θt/Ct, and finally
inserting M into equation 8 for GI :
GI =1
Eσ2xxπa[F (a/b)]2 =
1
E
36M2
b4πaF (a/b)2 =
1
16
θ2t EπaF (a/b)2(hb + S(a/b)
)2 (B.11)
The expression for GI (equation B.11) can also be written on a non-dimensional form as:
GIEb3
M2= 36π
a
b[F (a/b)]
2for load control (B.12)
GIEbθ2t
=1
16
a
b
π [F (a/b)]2
(hb + S(a/b)
)2 for displacement control (B.13)
Equation B.12 and equation B.13, plotted in the graphs in Figure B.18, represent the non-dimensional
energy release rate for a pure bending specimen with applied moment and -rotation, respectively.
Figure B.18 (B) shows that GI increases monotonic with a/b. Figure B.18 (C) shows that GI increases
until a peak values is attained, hereafter GI decreases smoothly towards zero. Note, with increasing
h/b, the shape of the curves approaches the shape of the curve for moment control although the
specimen is loaded in rotation control. On the other hand, stability is enhanced when h/b is small.
Note, the crack approaches a free surface at a/b = 1.0. For rotation control; GI → 0 when a/b→ 1.0,
and for moment control; GI →∞ when a/b→ 1.0.
27

0.0 0.2 0.4 0.6 0.8 1.00.00
0.01
0.02
0.03
0.04
0.05
0.06
0.07
0.08
0.09h/ b= 0.5
h/ b= 1.0
h/ b= 2.0
h/ b= 5.0
h/ b= 10.0
h/ b= 100.0θ
2[-
]E
b
a b
MM
θ/2θ/2
h
0.0 0.2 0.4 0.6 0.8 1.00
500
1000
1500
2000
2500
G E
b /3M
2[-
]
(A)
(C)(B)
a/b [-] a/b [-]
I GI/
Figure B.18: (A) Analytical model of pure bending specimen. (B) Energy release rate result (equation B.12) in moment
control (dashed line). (C) Energy release rate result (equation B.13) in rotation control (solid lines) for different h/b.
Appendix C. Analytical model of a homogenous four-point SENB specimen
The homogeneous four-point SENB specimen in Figure C.19 with applied point loads can be des-
cribed by three non-dimensional geometrical parameters: a/b, h/b and B/b. Equation 8 presents GI
as a function of applied load i.e. load control (dead load), but when designing experiments to be
conducted under displacement control (fixed grip) it is more convenient to express GI as a function of
displacement, δ, of the force(s).
For a linear relationship between load and deflection, the work done by the external forces is (Ugural
and Fenster [46] or Cook et al. [55]):
Vt =1
2Pδ (C.1)
where P is the load and δ is the load point deflection. In an elastic beam structure, without energy
dissipation i.e. a conservative system, the work done by the external force is equivalent to the total
elastic strain energy (Ugural and Fenster [46] or Cook et al. [55]):
Ut = Vt (C.2)
which is also known as Clapeyron’s theorem in linear elasticity theory [56, 57]. The total strain energy,
Ut, stored in the body of the four-point SENB specimen in Figure C.19 is the sum of the strain energy
for the specimen without crack plus the strain energy for the introduction of the crack while holding
28

Mx
Tx1 2
1
Bending momentdistribution:
Homogenousfour-point SENBspecimen:
Shear forcedistribution:
x=-hx=-(h+B) x=h x=h+B
21 1
P/2 P/21
2
1
ab
yx
BCrack
h
Figure C.19: Four-point bending setup including moment and shear distributions.
the forces constant, see Tada et al. [29], Appendix B, Beuth [47] or Rice et al. [44]:
Ut = Uno,crack +
∫ a
0
∂Ut∂a
da (C.3)
where GI(a) = ∂Ut/∂a [29, 58]. The latter term in equation C.3 is the change in elastic energy per
unit cracked area due to the introduction of the crack and related to the ideas by Suo [59] and Beuth
[47]. The strain energies from part 1 and part 2 of the beam specimen, marked with encircled numbers
in Figure C.19 are added to the strain energy of the crack to form the total strain energy as [44]:
Ut = Uno,crack + Ucrack = (U1 + U2) + Ucrack (C.4)
Part 1 of the beam spans over the length of, −(h + B) ≤ x ≤ −h and h ≤ x ≤ h + B, according
to Figure C.19. The strain energy of part 1 of the beam, designated U1, consists of a strain energy
contribution from the force, P , causing both bending deformation and shear deformation of the beam
i.e. normal stresses and shear stresses. These strain energies are denoted UP and UT , respectively.
The strain energy contribution based on normal stress in part 1 of the beam (from the force, P ) is
given by equation A.6 as:
UP =2(P/2)2B3
Eb3(C.5)
The strain energy based on the shear stresses in part 1 of the beam (from shear force, T ) is determined
in equation A.13 as:
UT =3
5
(P/2)2B
µb(C.6)
where µ is the shear modulus that for an isotropic material is µ = E/(2(1 + ν)). The strain energy for
29
part 1 of the beam becomes:
U1 = 2(UP + UT ) = 2
(2(P/2)2B3
Eb3+
3
5
(P/2)2B
µb
)=P 2B
Eb
[(B
b
)2
+3
5
E
2µ
](C.7)
where the factor ”2” outside the parenthesis in equation C.7 is included since two regions of the
specimen are numbered 1, see Figure C.19.
Part 2 of the beam in Figure C.19 spans over −h ≤ x ≤ h. The strain energy for part 2 of the
beam, with length 2h and a pure bending moment applied, is derived using equation A.7 for UM0.
Here, the moment, M = BP/2, and the length, L0 = 2h, are inserted in equation A.7 for UM0to
determine the strain energy for part 2 of the beam:
U2 = 3P 2
E
B2h
b3(C.8)
The strain energy contribution from the crack is determined by inserting σxx = 6M/b2 and M = BP/2
into θcrack = (4σxxS(a/b))/E, which is the rotation due to the presence of the crack from Tada et al.
[29], to give:
Ucrack =1
2Mθcrack =
1
2M
4σxxE
S(a/b) = 3P 2
E
B2
b2S(a/b) (C.9)
where Ucrack = 12Mθcrack comes from equation B.6 and S(a/b) is given by an empirical fit in Tada et
al. [29] and presented in equation B.9 for convenience. Thus, for the homogenous four-point SENB
specimen, the strain energy of part 1, part 2, and the crack (equation C.7, C.8, C.9) can now be added
to give a single expression for the total strain energy of the beam specimens volume as:
Ut = U1 + U2 + Ucrack =P 2B
Eb
[(B
b
)2
+3
5
E
2µ
]+ 3
P 2
E
B2h
b3+ 3
P 2
E
B2
b2S(a/b) (C.10)
This expression (equation C.10) is used in section 3 to determine GI in displacement control (fixed
grip).
References
[1] S. Ataya, M. M. Z. Ahmed, Damages of wind turbine blade trailing edge: Forms, location, and
root causes, Engineering Failure Analysis 35 (2013) 480.
[2] J. Cook, J. E. Gordon, C. C. Evans, D. M. Marsh, A mechanism for the control of crack propa-
gation in all-brittle systems, Mathematical and Physical Sciences 282 (1391) (1964) 508–520.
[3] V. Gupta, J. Yuan, D. Martinez, Calculation, measurement, and control of interface strength in
composites, J. Am. Ce. Soc. 76 (2) (1993) 305.
[4] M. Y. He, J. W. Hutchinson, Crack deflection at an interface between dissimilar elastic materials,
Int. J. Solids Structures 25 (9) (1989) 1053–1067.
30

[5] M. Y. He, A. G. Evans, Crack deflection at an interface between dissimilar elastic materials: Role
of residual stresses, Int. J. Solids Structures 31 (1994) 3443.
[6] V. Gupta, A. S. Argon, Z. Suo, Crack deflection at an interface between two orthotropic media,
J. Appl. Mech. 59 (1992) 79.
[7] D. Martinez, V. Gupta, A. S. Argon, Z. Suo, Energy criterion for crack deflection at an interface
between two orthotropic media, J. Mech. Phys. Solids. 42 (8) (1994) 1247.
[8] M. D. Thouless, H. C. Cao, P. A. Mataga, Delamination from surface cracks in composite mate-
rials, Journal of Materials Science 24 (1989) 1406–1412.
[9] J. Parmigiani, M. Thouless, The roles of toughness and cohesive strength on crack de-
flection at interfaces, Journal of the Mechanics and Physics of Solids 54 (2) (2006) 266–287.
doi:10.1016/j.jmps.2005.09.002.
[10] J. P. Parmigiani, Delamination and deflection at interfaces, Ph.D. thesis, University of Michigan
(2006).
[11] J. L. Strom, J. P. Parmigiani, Transition of crack path at bi-material interfaces, Engineering
Fracture Mechanics 115 (2014) 13–21. doi:10.1016/j.engfracmech.2013.11.015.
[12] S. Brinckmann, B. Volker, G. Dehm, Crack deflection in multi-layered four-point bending samples,
International Journal of Fracture 190 (1-2) (2014) 167–176. doi:10.1007/s10704-014-9981-1.
[13] M. Alam, J. P. Parmigiani, Proc. Appl. Math. Mech., in: Crack propagation at bi-material inter-
faces, Vol. 15, 2015, pp. 143–144. doi:10.1002/pamm.201510062.
[14] M. Alam, B. Grimm, J. P. Parmigiani, Effect of incident angle on crack propagation at interfaces,
Engineering Fracture Mechanics 162 (2016) 155–163.
[15] V. C. Li, R. J. Ward, A novel testing technique for post-peak tensile behavior of cementitious
materials, Fracture Toughness and Fracture Energy, Mihashi et al. (eds). (1989) 183.
[16] S. Goutianos, R. Arevalo, B. F. Sørensen, T. Peijs, Effect of Processing Conditions on Fracture Re-
sistance and Cohesive Laws of Binderfree All-Cellulose Composites, Applied Composite Materials
21 (6) (2014) 805–825. doi:10.1007/s10443-013-9381-0.
[17] R. K. Joki, F. Grytten, B. Hayman, B. F. Sørensen, Determination of a cohesive law
for delamination modelling - Accounting for variation in crack opening and stress state
across the test specimen width, Composites Science and Technology 128 (2016) 49–57.
doi:10.1016/j.compscitech.2016.01.026.
31
[18] W. Lee, W. J. Clegg, The deflection of cracks at interfaces, Key Engineering Materials 116-117
(1996) 1886–1889. doi:10.4028/www.scientific.net/KEM.132-136.1886.
[19] K. Kendall, Transition between cohesive and interfacial failure in a laminate, Proc. R. Soc. Lond.A.
344 (1975) 287–302. doi:10.1098/rspa.1983.0054.
[20] J. Zhang, J. J. Lewandowski, Delamination study using four-point bending of bilayers, Journal of
Materials Science 32 (14) (1997) 3851–3856.
[21] J. B. Jørgensen, M. D. Thouless, B. F. Sørensen, C. Kildegaard, Determination of mode-I cohesive
strength for interfaces, IOP Conference Series: Materials Science and Engineering 139 (2016) 267–
274. doi:10.1088/1757-899X/139/1/012025.
[22] J. E. Srawley, W. F. Brown Jr, Fracture toughness testing methods, ASTM STP 381 (1) (1965)
133–196.
[23] B. Gross, J. Srawley, Stress-intensity factors for single-edge-notch specimens in bending or com-
bined bending and tension by boundary collocation of a stress function., NASA TN D-2603.
[24] W. Brown, J. Strawley, Plane Strain Crack Toughness testing of high strength metallic materials.,
Astm STP 410 (3) (1966) 1–129. doi:10.1520/STP410-EB.
[25] B. Gross, J. Srawley, Stress-intensity factors by boundary collocation for single-edge-notch speci-
mens subject to splitting forces, NASA TN D-3295.
[26] R. K. Bordia, B. Dalgleish, P. G. Charalambides, A. G. Evans, Cracking and Damage in a Notched
Unidirectional Fiber-Reinforced Brittle Matrix composite, J. Am. Ceram. Soc. 74 (11) (1991)
2776–80.
[27] S. Tarafder, M. Tarafder, V. R. Ranganath, Compliance crack length relations for the four-
point bend specimen, Engineering Fracture Mechanics 47 (6) (1994) 901–907. doi:10.1016/0013-
7944(94)90068-X.
[28] F. Fischer, G. Pusch, Fracture mechanical testing of structural steels - SENB-specimen under
four-point-bending, Materialprufung 37 (4) (1995) 115.
[29] H. Tada, P. C. Paris, G. R. Irwin, The Stress Analysis of Cracks Handbook, 3rd Edition, Vol. 3,
ASME Press, New York, 2000.
[30] C. Liu, P. J. Rae, C. M. Cady, M. L. Lovato, Damage and fracture of high-explosive mock subject
to cyclic loading., Proceedings of the 2011 Annual Conference on Experimental and Applied
Mechanics. 3 (2011) 151.
32
[31] A. D. Wargo, S. Safavizadeh, R. Y. Kim, The use of four-point bending notched beam fatigue
tests to rank crack-mitigating interlayers, 8th RILEM International Symposium on Testing and
Characterization of Sustainable and Innovative Bituminous Materials. 11 (2016) 359.
[32] M. L. Nguyen, H. Di Benedetto, C. Sauzeat, Crack propagation characterisation of bituminous
mixtures using a four-point bending notched specimen test, Road Materials and Pavement Design
17 (1) (2016) 70–86. doi:10.1080/14680629.2015.1063535.
[33] S. Tandon, K. T. Faber, Z. P. Bazant, Crack Stability in the Fracture of Cementitious Materials,
in: Mat. Res. Soc. Symp. Proc., Vol. 370, 1995, pp. 387–396.
[34] Z. Suo, G. Bao, B. Fan, Delamination R-curve phenomena due to damage, Mech. Phys. Solids
40 (I) (1992) 1–16.
[35] P. A. Vanniamparambil, U. Guclu, A. Kontsos, Identification of crack initiation in aluminum alloys
using acoustic emission, Experimental Mechanics 55 (5) (2015) 837–850. doi:10.1007/s11340-015-
9984-5.
[36] A. N. Kumar, B. F. Sørensen, Fracture Resistance and Stable Crack-Growth Behavior of 8-mol%-
Yttria-Stabilized Zirconia, Journal of the American Ceramic Society 83 (5) (2000) 1199–1206.
[37] A. N. Kumar, B. F. Sørensen, Fracture energy and crack growth in surface treated Yttria stabilized
Zirconia for SOFC applications, Materials Science and Engineering A 333 (1-2) (2002) 380–389.
doi:10.1016/S0921-5093(01)01863-9.
[38] T. Nishida, Y. Hanaki, G. Pezotti, Effect of notch-root radius on the fracture toughness of a
fine-grained alumina, J. Am. Ceram. Soc. 77 (2) (1994) 707–608.
[39] B. Gross, J. E. Srawley, Stress-Intensity Factors for Single-Edge-Notch Specimens in Bending or
Combined Bending and Tension By Boundary Collacation of a Stress Function, NASA Technical
note TN D-2603 (January 1965) (1964) 1–17.
[40] J. Dundurs, Edge-Bonded Dissimilar Orthogonal Elastic Wedges Under Normal and Shear Loa-
ding, Journal of Applied Mechanics 36 (3) (1969) 650–652.
[41] J. W. Hutchinson, Z. Suo, Mixed mode cracking in layered materials, Advances in applied me-
chanics 29 (1992) 63.
[42] G. Irwin, D. Washington, Analysis of Stresses and Strains Near the End of a Crack Traversing a
Plate, Journal of Applied Mechanics 24 (1957) 361–364.
33

[43] J. W. Hutchinson, Fundamentals of the Phenomenological Theory of Nonlinear Fracture Mecha-
nics, Journal of Applied Mechanics 50 (4) (1983) 1042–1051. doi:10.1115/1.3167187.
[44] J. R. Rice, P. C. Paris, J. G. Merkle, Some further results of J-integral analysis and esti-
mates, Progress in Flaw Growth and Fracture Toughness Testing 536 (536) (1973) 231–245.
doi:10.1520/STP49643S.
[45] Z. Suo, J. W. Hutchinson, Interface crack between two elastic layers, International Journal of
Fracture 43 (1990) 1–18.
[46] S. Fenster, A. Ugural, Advanced Strength and Applied Elasticity, 4th Edition, Prentice Hall,
Upper Saddle River, New Jersey, 2003.
[47] J. L. Beuth, Cracking of thin films in residual tension, Int. J. Solids Structures 29 (13) (1992)
1657.
[48] H. P. Langtangen, Python Scripting for Computational Science, 2nd Edition, Springer, 2008.
[49] H. P. Langtangen, A Primer on Scientific Programming with Python, 4th Edition, Springer, 2014.
[50] U. P. Singh, S. Banerjee, On the origin of pop-in crack extension, Acta metall. mater. 39 (6)
(1991) 1073–1084.
[51] M. Charalambides, A. J. Kinloch, Y. Wang, J. G. Williams, On the analysis of mixed-mode failure,
International Journal of Fracture 54 (3) (1992) 269–291. doi:10.1007/BF00035361.
[52] Z. Suo, G. Bao, B. Fan, T. Wang, Orthotropy rescaling and implications for fracture in composites,
Int. J. Solid Structures 28 (2) (1991) 235–248.
[53] H. P. Gavin, Strain Energy in Linear Elastic Solids, Tech. rep., Duke University, Department of
Civil and Enironmental Engineering (2015).
[54] J. Gere, B. Goodno, Mechanics of Materials, 7th Edition, Cengage learning, 2009.
[55] R. D. Cook, D. S. Malkus, M. E. Plesha, R. J. Witt, Concepts and applications of finite element
analysis, fourth edi Edition, Wiley, United States, 2001.
[56] A. Love, A Treatise on the Mathematical Theory of Elasticity, 4th Edition, At the University
Press, Cambridge, 1927.
[57] S. S. Timoshenko, History of Strength of Materials, The maple press company, New York, 1953.
doi:10.1016/0022-5096(54)90010-1.
34

[58] C. T. Sun, Z. H. Jin, Fracture Mechanics, 1st Edition, Elsevier, Amsterdam, 2012.
[59] Z. Suo, Failure of brittle adhesive joints, Appl. Mech 43 (5) (1990) 275–279.
35

APPENDED PAPERP5
Crack deflection at interfaces in adhesivejoints for wind turbine blades
Jeppe B. Jørgensen, Bent F. Sørensen and Casper KildegaardComposites Part A: Applied Science and ManufacturingSubmitted, 2017
Crack deflection at interfaces in adhesive joints for wind turbine blades
Jeppe B. Jørgensena,b,∗, Bent F. Sørensenb, Casper Kildegaarda
aLM Wind Power, Østre Alle 1, 6640 Lunderskov, Denmark.bThe Technical University of Denmark, Dept. of Wind Energy, Frederiksborgvej 399, 4000 Roskilde, Denmark.
Abstract
Crack deflection at material interfaces is investigated using a new experimental approach by recor-
ding images and applying 2D digital image correlation (DIC) on a four-point single-edge-notch-beam
(SENB) test specimen. A crack grows from the notch towards the adhesive-substrate interface in
mode-I. For six types of test series, measurements from DIC captured three different cracking mecha-
nisms; crack penetration into the substrate, crack deflection along the interface, and initiation of a
new crack at the interface ahead of the main crack.
The latter cracking mechanism, i.a. observed in adhesive-composite bi-material specimens, enabled
the determination of the mode-I cohesive strength of the material interfaces using a novel approach.
The measured cohesive strength of the tested interfaces was found to be low in comparison with the
macroscopic strength of the adhesive.
Keywords:
Cohesive interface modelling, Strength, Mechanical testing, Finite element analysis (FEA)
1. Introduction
In typical wind turbine rotor blades, the main parts are two aerodynamic shells and two webs made
of glass-fibre reinforced composites produced by a vacuum infusion process. The shells and webs are
moulded separately and subsequently bonded in an assembly process using a structural adhesive. The
main load carrying adhesive joints are located at the leading-edge, trailing-edge and at the webs [1].
The primary loads acting on the blade can be simplified to flap-wise- and edge-wise bending moments.
Figure 1 illustrates that edge-wise bending moments, Myy, can lead to tensile stresses, σxx, in the
adhesive of the trailing-edge joint. The trailing-edge joint is located far from the elastic center of the
blade cross section and therefore loaded with significantly higher strains which can cause transverse
cracks to evolve from pre-existing flaws in the adhesive.
∗Corresponding authorEmail address: [email protected] (Jeppe B. Jørgensen)
Preprint submitted to Composites Part A: Applied Science and Manufacturing September 29, 2017

Blade
Blade tip
Blade root
Myy
#1
#2
#1
xy
xxσ
Defects
~μm
Adhesive zxy
Laminate
Trailin
g-ed
geLeading-edge Trailing-edge joint
~m
~cm
~mmzx
yLaminate
Figure 1: Wind turbine rotor blade with trailing-edge joint loaded in tension due to edge-wise bending moments, Myy .
The different order of scale from full scale blade to micro-scale defects in the adhesive layer is exemplified by m, cm,
mm, and µm.
Cracks in the trailing-edge joint, including transverse cracks, are observed in full scale blades in
operation [2]. After a small crack has formed in the adhesive as shown in Figure 2 (A), the cracking
sequence can evolve in three different ways as shown schematically in Figure 2 (B-E). It is the issue
of crack deflection/penetration that is in focus of the present study. Crack deflection at interfaces in
composite materials is known to act as a toughening mechanism for the overall structure [3, 4] which
is why a criterion for deflection is often desired.
(A)
(C)
(B)
interface
(E)
(D)
#1
#2
#1
xy
adhesivelaminate/substrate
xxσ
main crackdebond crack
crack penetration
crack deflection
Figure 2: Possible cracking sequence for an adhesive joint loaded in tension. The main crack in the adhesive grows
orthogonal towards the adhesive/substrate interface (A). The crack might reach the interface (B) or initiate a new crack
at the adhesive/substrate interface (C). If the crack reach the interface it may stop here (B), but it can also penetrate
the substrate (D) or deflect along the adhesive/substrate interface (E).
2

One of the first models for the cracking mechanism in Figure 2 (C) were developed by Cook and
Gordon [5]. A stress based criterion was established for an elliptical shaped crack in a homogeneous
solid. The Cook-Gordon deflection criterion states that the interface will fail if the interface strength
is less than about 1/3 to 1/5 of the bulk material strength. Otherwise, the main crack will propagate
across the interface.
Later, a fracture mechanics based approach was applied to predict crack deflection for the cracking
mechanism in Figure 2 (B), by introducing an infinitesimal small crack at the interface and in the
substrate [6, 7, 8]. In absence of elastic mismatch, the deflection criterion states that the interface-to-
substrate toughness ratio should be one fourth or less for the crack to deflect.
The stress based and fracture mechanics based approaches can be unified in a cohesive zone ap-
proach. Parmigiani and Thouless [9] studied crack deflection in a thin film on a thick substrate using
cohesive zone modelling (CZM) in finite element (FE) simulations and it was concluded that both
the cohesive strength and the toughness are important parameters for an accurate crack deflection
criterion.
Recently, Brinckmann et al. [10] modelled and tested crack deflection in multi-layered four-point
bending samples. A cohesive zone model was developed to predict deflection/penetration of the diffe-
rent layers, by varying the cohesive strength and the fracture toughness. They also conclude that both
the cohesive strength and the fracture toughness are important parameters for the crack deflection
process. Unfortunately for the experiments, crack growth were unstable according to the measured
load-displacement curve such that the crack deflection process could not be documented by images
[10].
There are only a few rigorous experimental studies where the crack deflection process are well
documented [11]. Kendall [12] tested transparent rubber using a single-edge-notch-tension (SENT)
specimen to test a derived crack deflection criterion for a Griffith crack [13]. SENT specimens with
different interface toughness were manufactured and characterized. Details about the crack deflection
process were limited since the crack growth was unstable. Instead, it was assumed that the main
crack reached the interface where it, dependent on interface toughness, continued through its path or
deflected along the interface.
Later, Lee and Clegg [11] tested crack deflection experimentally. A wedge were moved into the
notch of a PMMA laminate while the specimen were placed on a rigid foundation. The foundation
were slowly removed whereby a crack started to grow slowly from the notch in a stable manner. It
was documented that a new crack formed at the interface before the main crack reached the interface,
similarly to the mechanism shown in Figure 2 (C). Different interface toughness were tested and a
toughness based criterion were established to predict the interface debond length: The higher interface
toughness, the smaller debond length and vice versa.
3
In order to test crack deflection at interfaces, Zhang and Lewandowski [14] tested three types of four-
point single-edge-notch-beam (SENB) specimens with varying interface properties. The aluminum-to-
composite adhesion were made by roll bonding, roll bonding with aluminum interlayer and epoxy
bonding. Three different cracking mechanisms were assessed in the light of strength as the governing
property for crack path selection:
• High interface strength: Crack penetrates into substrate (Figure 2 (D)).
• Intermediate interface strength: Crack reaches the interface and deflects. (Figure 2 (E)).
• Low interface strength: Crack initiation at interface ahead of main crack (Figure 2 (C)).
Unfortunately, stable crack growth could only be attained for the specimens with high interface
strength where the crack penetrated the interface. For the other two cases, the crack deflection could
only be seen as a sudden jump in the measured moment-displacement curve.
The recent developments of digital image correlation (DIC) suggests that more accurate experimen-
tal studies can be made in order to identify crack deflection during loading by in-situ observations. DIC
is a white-light full field method using a digital camera and a software package to measure displacements
by comparing images of the deformed- and undeformed specimen. DIC is an experimental mechanics
method that has been successfully applied on adhesive joints to characterize the damage sequence e.g.
for single-lap-joints [15, 16], double-butt-strap-joints [17] or bonded repair patches [18, 19, 20, 21]. DIC
has also been used to determine crack tip location during both static and cyclic loading [22, 23] and
been applied on bending experiments for various applications e.g. for the four-point SENB specimen
[22, 23, 24].
Cohesive laws, also known as traction-separations laws, can conveniently be used in numerical cohe-
sive zone models to simulate both crack initiation that is largely governed by the cohesive strength, σ,
and crack propagation that is primarily governed by fracture energy, Jc [25]. Cohesive zone modelling
of crack deflection requires input in terms of traction-separations laws with the most important para-
meters being the fracture energy, the critical separation, δcr, and the cohesive strength of the interface,
σi, and -substrate, σs, see the example of a traction-separation law in Figure 3. The cohesive law pa-
rameters of a straight-growing crack can be measured e.g. using a J-integral approach [26, 27, 28, 29].
Mohammed and Liechti [30] measured the cohesive law parameters for an aluminum-epoxy bi-material
interface using a calibration procedure where cohesive zone modelling by finite element simulations
were combined with measurements from an experimental test of a four-point bend specimen. However,
experimental methods to measure the cohesive law parameters for bi-material interfaces are limited
and accurate determination of the cohesive strength magnitude is challenging [31]. A novel approach
[32] demonstrated a new way to overcome this problem. Therefore, it is the aim in this paper to apply
4
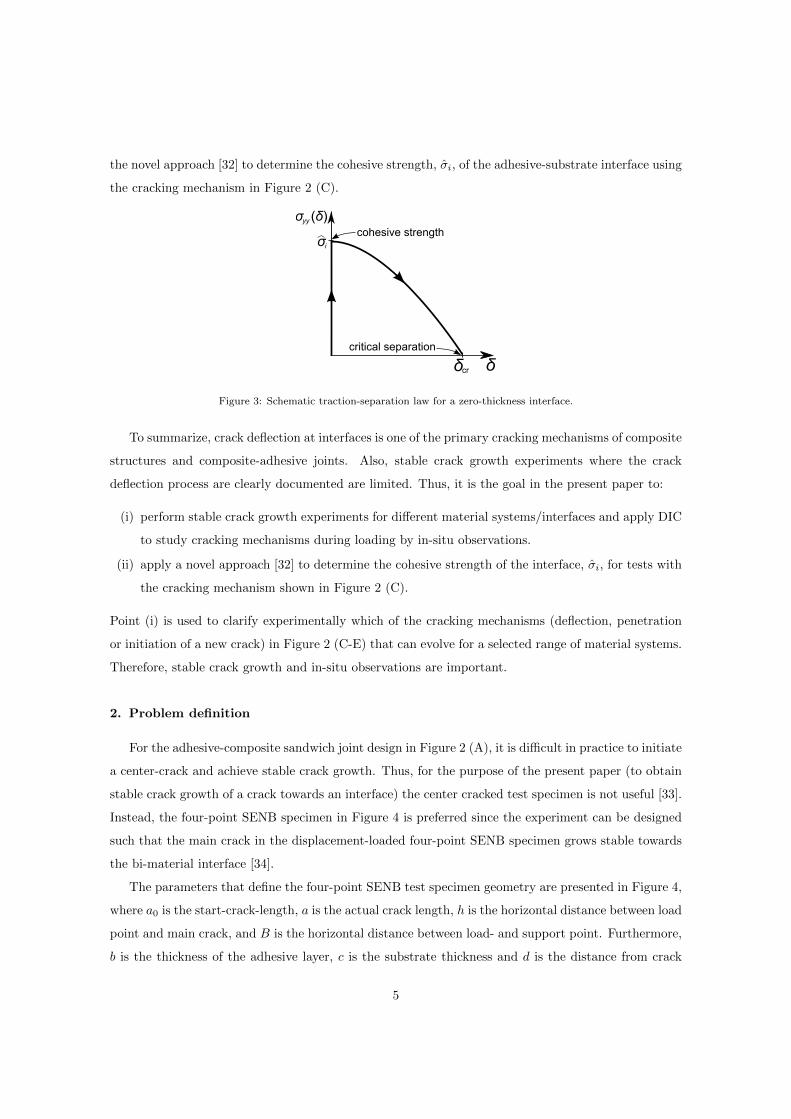
the novel approach [32] to determine the cohesive strength, σi, of the adhesive-substrate interface using
the cracking mechanism in Figure 2 (C).
δcrδ
σ (δ)yy
σ icohesive strength
critical separation
Figure 3: Schematic traction-separation law for a zero-thickness interface.
To summarize, crack deflection at interfaces is one of the primary cracking mechanisms of composite
structures and composite-adhesive joints. Also, stable crack growth experiments where the crack
deflection process are clearly documented are limited. Thus, it is the goal in the present paper to:
(i) perform stable crack growth experiments for different material systems/interfaces and apply DIC
to study cracking mechanisms during loading by in-situ observations.
(ii) apply a novel approach [32] to determine the cohesive strength of the interface, σi, for tests with
the cracking mechanism shown in Figure 2 (C).
Point (i) is used to clarify experimentally which of the cracking mechanisms (deflection, penetration
or initiation of a new crack) in Figure 2 (C-E) that can evolve for a selected range of material systems.
Therefore, stable crack growth and in-situ observations are important.
2. Problem definition
For the adhesive-composite sandwich joint design in Figure 2 (A), it is difficult in practice to initiate
a center-crack and achieve stable crack growth. Thus, for the purpose of the present paper (to obtain
stable crack growth of a crack towards an interface) the center cracked test specimen is not useful [33].
Instead, the four-point SENB specimen in Figure 4 is preferred since the experiment can be designed
such that the main crack in the displacement-loaded four-point SENB specimen grows stable towards
the bi-material interface [34].
The parameters that define the four-point SENB test specimen geometry are presented in Figure 4,
where a0 is the start-crack-length, a is the actual crack length, h is the horizontal distance between load
point and main crack, and B is the horizontal distance between load- and support point. Furthermore,
b is the thickness of the adhesive layer, c is the substrate thickness and d is the distance from crack
5

BP/2
a b
c
0
a
w
P/2P/2
Substrate #1
main
Adhesive #2
y
zx
Interface
crackhP/2
AoI for DIC
Figure 4: The four-point SENB test specimen geometry with symbols describing the geometry for the bi-material
specimens.
tip to interface. The primary geometric parameters can be written in non-dimensional form as: a/b,
h/b, B/b and c/b.
The four-point SENB specimen is analyzed in a related paper [34] for load control, displacement
control, and test configuration since the mode-I energy release rate, GI , of the main crack depends
on load conditions, geometry, and stiffness mismatch. For all experiments in the present study, we
use h/b = 0.9 and B/b = 1.35, and the specimens are manufactured such that 0.2 ≤ c/b ≤ 0.3.
To enable observations of the crack deflection mechanism, the main crack should grow in a stable
manner towards the interface requiring that the energy release rate of the main crack must decrease
with crack length i.e. ∂GI/∂a < 0. Using this criterion it was determined that the start-crack-length
should be 0.55 ≤ a0/b ≤ 0.70 for elastic mismatch of 1.0 ≤ E1/E2 ≤ 12.0, and substrate thickness of
0.1 ≤ c/b ≤ 0.3 using the FE model presented in a related paper [34].
If a crack initiates in the interface between adhesive and substrate as shown in Figure 4, it will do
so in pure mode-I since shear stresses, τxy, are zero along the vertical symmetry line (at x = 0). In
order to study crack initiation, crack propagation and potentially crack deflection, an optical camera
and DIC are applied to measure the displacement field in the area of interest (AoI) shown in Figure 4.
The identification of interface crack initiation is the first step in the approach to determine the mode-I
cohesive strength of the interface.
3. Approach for determination of mode-I cohesive strength of interfaces
For the cracking mechanism in Figure 2 (C), a novel approach [32] for determination of the cohesive
strength of an adhesive-laminate interface, σi, was demonstrated using a four-point SENB specimen,
DIC, and a FE model. In the present study, the original approach [32] is elaborated and further
extended to account for propagation of the main crack as illustrated in Figure 5.
The approach is based on the stress field of a crack tip close to an interface that has the purpose
of initiating a new crack at the interface, see Figure 5 (A). Two scenarios can evolve during the test:
6
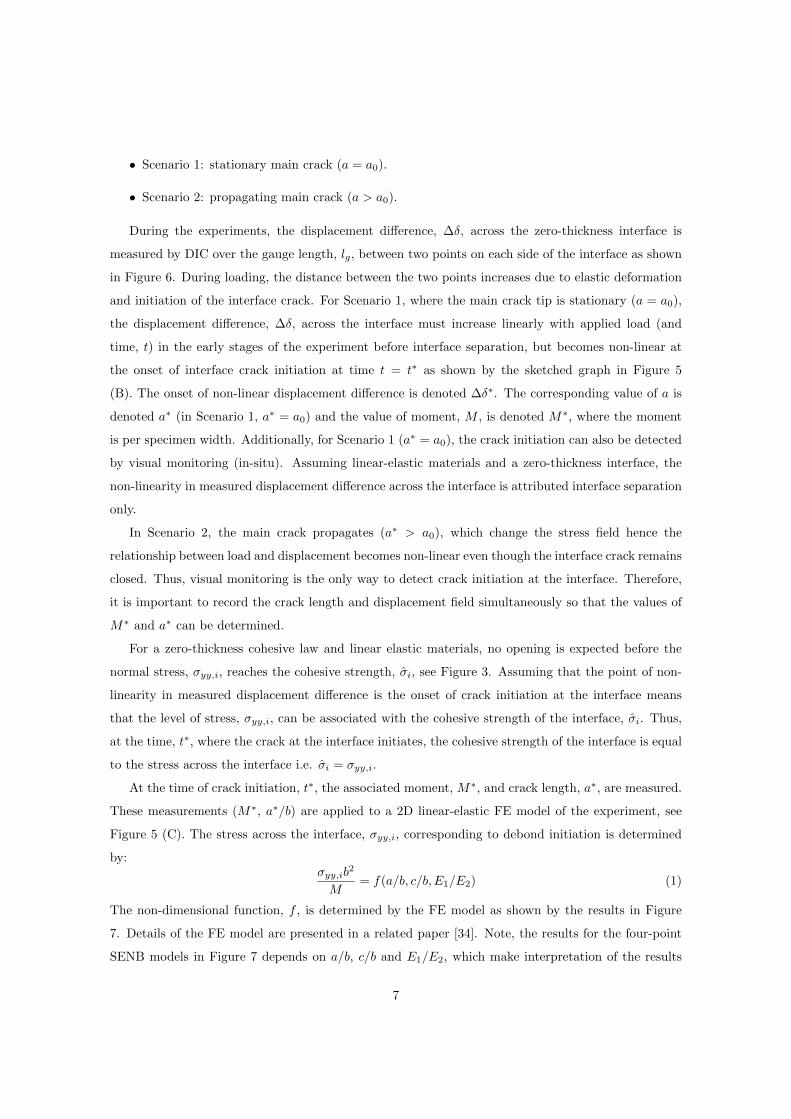
• Scenario 1: stationary main crack (a = a0).
• Scenario 2: propagating main crack (a > a0).
During the experiments, the displacement difference, ∆δ, across the zero-thickness interface is
measured by DIC over the gauge length, lg, between two points on each side of the interface as shown
in Figure 6. During loading, the distance between the two points increases due to elastic deformation
and initiation of the interface crack. For Scenario 1, where the main crack tip is stationary (a = a0),
the displacement difference, ∆δ, across the interface must increase linearly with applied load (and
time, t) in the early stages of the experiment before interface separation, but becomes non-linear at
the onset of interface crack initiation at time t = t∗ as shown by the sketched graph in Figure 5
(B). The onset of non-linear displacement difference is denoted ∆δ∗. The corresponding value of a is
denoted a∗ (in Scenario 1, a∗ = a0) and the value of moment, M , is denoted M∗, where the moment
is per specimen width. Additionally, for Scenario 1 (a∗ = a0), the crack initiation can also be detected
by visual monitoring (in-situ). Assuming linear-elastic materials and a zero-thickness interface, the
non-linearity in measured displacement difference across the interface is attributed interface separation
only.
In Scenario 2, the main crack propagates (a∗ > a0), which change the stress field hence the
relationship between load and displacement becomes non-linear even though the interface crack remains
closed. Thus, visual monitoring is the only way to detect crack initiation at the interface. Therefore,
it is important to record the crack length and displacement field simultaneously so that the values of
M∗ and a∗ can be determined.
For a zero-thickness cohesive law and linear elastic materials, no opening is expected before the
normal stress, σyy,i, reaches the cohesive strength, σi, see Figure 3. Assuming that the point of non-
linearity in measured displacement difference is the onset of crack initiation at the interface means
that the level of stress, σyy,i, can be associated with the cohesive strength of the interface, σi. Thus,
at the time, t∗, where the crack at the interface initiates, the cohesive strength of the interface is equal
to the stress across the interface i.e. σi = σyy,i.
At the time of crack initiation, t∗, the associated moment, M∗, and crack length, a∗, are measured.
These measurements (M∗, a∗/b) are applied to a 2D linear-elastic FE model of the experiment, see
Figure 5 (C). The stress across the interface, σyy,i, corresponding to debond initiation is determined
by:σyy,ib
2
M= f(a/b, c/b, E1/E2) (1)
The non-dimensional function, f , is determined by the FE model as shown by the results in Figure
7. Details of the FE model are presented in a related paper [34]. Note, the results for the four-point
SENB models in Figure 7 depends on a/b, c/b and E1/E2, which make interpretation of the results
7
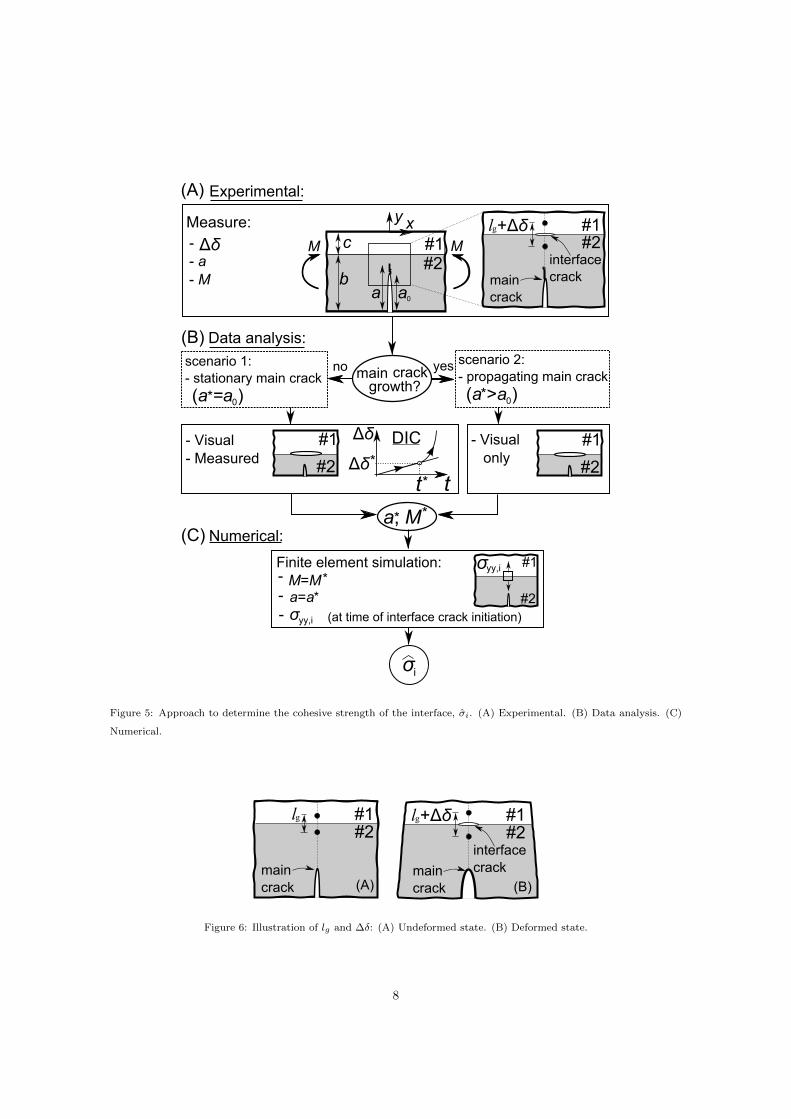
Experimental:
- - a- M
Finite element simulation:
σ
a, M
i
- Visual - Measured
- Visual only
t
#1
#2
#1
#2
DIC
(a =a )0(a >a )0
σ yy,i #1
#2
-
Mc
ba
xy
#1#2
a0
(at time of interface crack initiation)
main crackgrowth?
yesno
(A)
(B)
(C)
Data analysis:
Numerical:
Verticalsymmetry line
lg
interfacecrack
#1#2
maincrack
+ΔδΔδ
Measure:
scenario 1:- stationary main crack
scenario 2:- propagating main crack
Δδ
Δδ*
**
M
*
- σ yy,i-
M=M*
a=a*
t*
*
Figure 5: Approach to determine the cohesive strength of the interface, σi. (A) Experimental. (B) Data analysis. (C)
Numerical.
Verticalsymmetry line
lg #1#2
maincrack
Verticalsymmetry line
lg
interfacecrack
#1#2
maincrack
+Δδ
(A) (B)
Figure 6: Illustration of lg and ∆δ: (A) Undeformed state. (B) Deformed state.
8
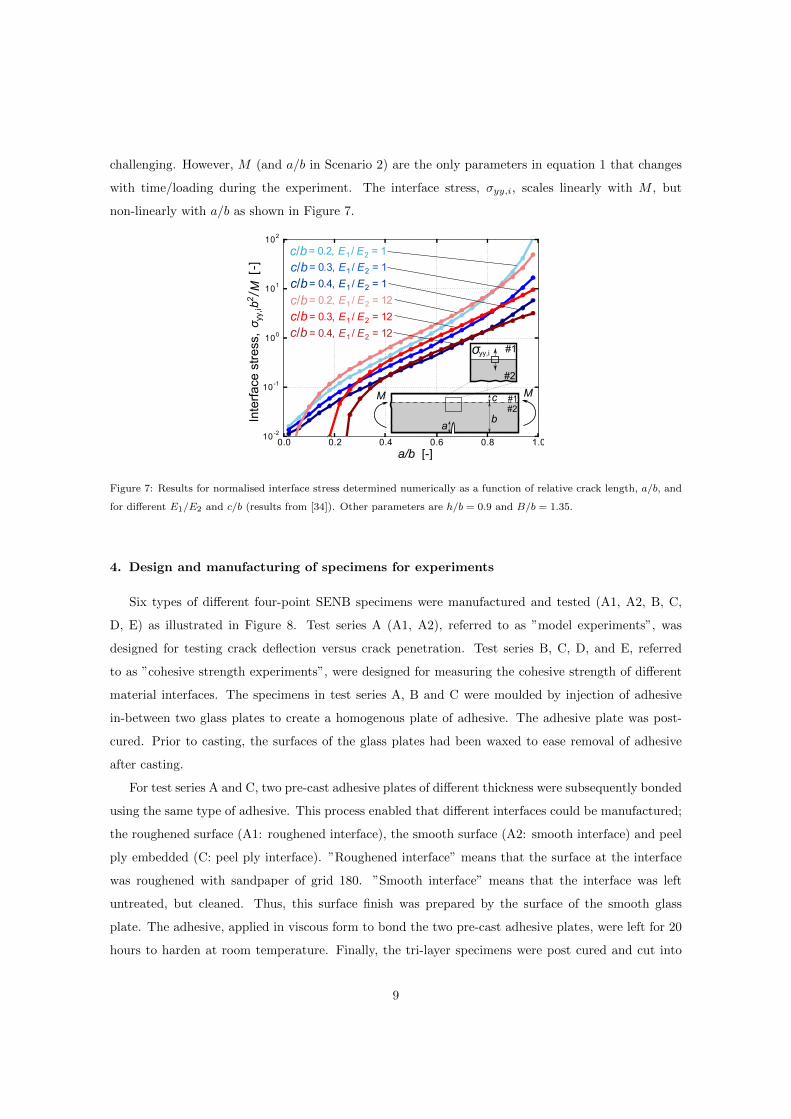
challenging. However, M (and a/b in Scenario 2) are the only parameters in equation 1 that changes
with time/loading during the experiment. The interface stress, σyy,i, scales linearly with M , but
non-linearly with a/b as shown in Figure 7.
0.0 0.2 0.4 0.6 0.8 1.010-2
10-1
100
101
102
σyy
,ib
2M
[-]
/
a/b [-]
Inte
rfac
e st
ress
,= 0.2, E1 / E2 = 1c/b= 0.3, E1 / E2 = 1c/b= 0.4, E1 / E2 = 1c/b= 0.2, E1 / E2 = 12c/b= 0.3, E1 / E2 = 12c/b= 0.4, E1 / E2 = 12c/b
#1#2
a
c
b
#2
MM
σ yy,i #1
Figure 7: Results for normalised interface stress determined numerically as a function of relative crack length, a/b, and
for different E1/E2 and c/b (results from [34]). Other parameters are h/b = 0.9 and B/b = 1.35.
4. Design and manufacturing of specimens for experiments
Six types of different four-point SENB specimens were manufactured and tested (A1, A2, B, C,
D, E) as illustrated in Figure 8. Test series A (A1, A2), referred to as ”model experiments”, was
designed for testing crack deflection versus crack penetration. Test series B, C, D, and E, referred
to as ”cohesive strength experiments”, were designed for measuring the cohesive strength of different
material interfaces. The specimens in test series A, B and C were moulded by injection of adhesive
in-between two glass plates to create a homogenous plate of adhesive. The adhesive plate was post-
cured. Prior to casting, the surfaces of the glass plates had been waxed to ease removal of adhesive
after casting.
For test series A and C, two pre-cast adhesive plates of different thickness were subsequently bonded
using the same type of adhesive. This process enabled that different interfaces could be manufactured;
the roughened surface (A1: roughened interface), the smooth surface (A2: smooth interface) and peel
ply embedded (C: peel ply interface). ”Roughened interface” means that the surface at the interface
was roughened with sandpaper of grid 180. ”Smooth interface” means that the interface was left
untreated, but cleaned. Thus, this surface finish was prepared by the surface of the smooth glass
plate. The adhesive, applied in viscous form to bond the two pre-cast adhesive plates, were left for 20
hours to harden at room temperature. Finally, the tri-layer specimens were post cured and cut into
9

A1 C
D
E
A2
B VHB tape
a
#2#2
smoothedinterface
#2#2 #2
peel plyinterface
#2#2
#2roughenedinterface
#2#2 #2
roughenedinterface
#1#2
Laminate B
roughenedinterface
#1#2
Laminate Axy
c
b
c
b
Figure 8: Six types of SENB test specimens divided into different categories. Model experiments: A1: roughened
interface. A2: smoothed interface. Cohesive strength experiments: B: VHB tape interface, C: peel ply interface, D:
roughened (Laminate B), E: roughened (Laminate A). Dashed lines indicate the material interface. (For bi-material
experiments; #1: Laminate, #2: Adhesive).
beams.
For test series B, two pre-cast adhesive beams of different thickness were bonded by Very High
Bond (VHB) tape (3M VHB Acrylic Adhesive 100MP).
The bi-material specimens in test series D and -E were manufactured of adhesive and glass-fiber
laminates. The laminates were produced of polyester reinforced with non-crimp-fabrics of glass-fiber
using vacuum-assisted-resin-transfer-moulding (VARTM). Subsequently, a vinylester adhesive paste
was cast onto the laminate, creating a zero-thickness interface between the adhesive and the laminate.
The plies were primarily uni-directional with main fiber-orientation in x-direction as shown in Figure
4 and Figure 8. The non-crimp-fabrics of glass fiber used for laminate A and laminate B had different
fibre-architecture. The surface on the laminate was roughened with sandpaper of grid 180 to ensure a
proper bonding of the adhesive to the surface of the laminate.
Start-cracks of length, a0, for all test specimen types, were cut using first a thin hack saw, followed
by a standard razor blade, and finally an ultra-thin razor blade of thickness 74 microns, see Figure
A.21 in Appendix A.
It was the same adhesive type that was used as material #2 for all specimens, see Figure 8. The
material systems were manufactured in a laboratory and are not representative for materials used in
wind turbine blades. However, exact material properties are confidential and results are therefore
presented in normalised form.
5. Test- and DIC setup
The test setup and equipment are presented in Figure 9. Vic 2D DIC system (Correlated Soluti-
ons) is employed to measure displacements. Practical guidelines for measuring with DIC and initial
10

experiments are used to determine the DIC setup and speckle pattern [35]. The settings are primarily
inspired by the work of Reu [36, 37, 38, 39, 40, 41, 42], but also by Lava [43], and Pierron & Barton
[44], and the guidelines in the Vic manual [45]. The description of preparation of speckle pattern and
the settings used for the DIC measurements are presented in Appendix A.
Extension tube CCD sensor
LensFiber optic light
RollersMain
w
xz
crack
B 2h BBackside
Frontside
Fiber optic light
Figure 9: Top-view of the four-point bend test setup and equipment.
5.1. Experimental test setup
A MTS 858 Mini Bionix II servo-hydraulic test machine applied the monotic loading in displacement
control. A load cell, calibrated for 1.5 kN, measured the load, P . A CCD sensor of type Grasshopper
GRAS-50S5M (2448x2048 pixels) was mounted to a tri-pod and to the Fujinon CCTV Lens (HF50SA-
1, 1:1.8/50mm) as shown in Figure 9. Extension tubes were used to achieve a proper magnification
[38]. During the experiments, images were recorded with a frequency of 1 Hz.
5.2. Data analysis
Vic-2D (Vic Snap Software) was used to correlate the images by applying a normalized squared
differences correlation algorithm (Optimized 8-tap interpolation scheme), see the Vic manual [45]. The
displacement and strain fields were determined in the selected AoI thus the main crack tip and the
interface were covered simultaneously.
The displacement field is the primary measurement and should preferably be used since it is de-
termined with a better accuracy than the strain field [46]. For the studies of crack deflection, the
primary use of DIC strain contours is to capture crack initiation (not to rely on a specific strain value),
which by DIC manifests itself as localised strain at the interface. The displacement difference, ∆δ,
is determined as the relative displacement over the initial gauge length, lg, and thus based on the
raw displacement measurements. The crack length, a, was measured directly on the images using a
developed Python script [47, 48].
11
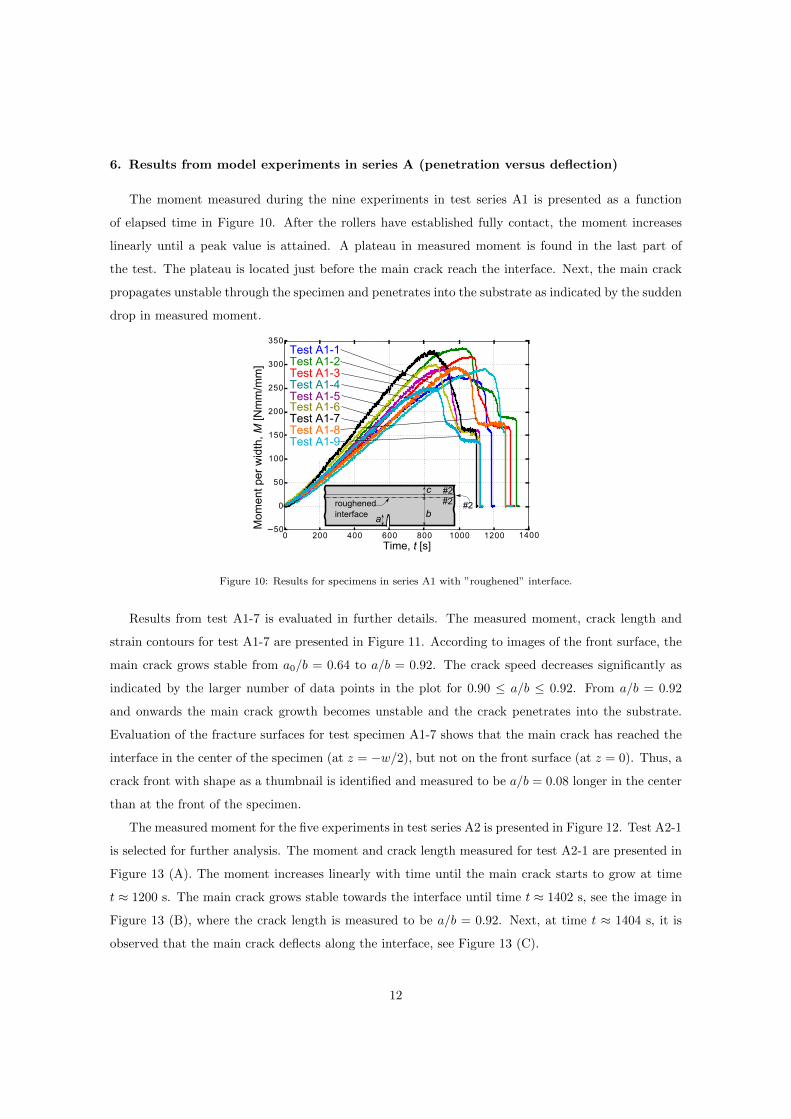
6. Results from model experiments in series A (penetration versus deflection)
The moment measured during the nine experiments in test series A1 is presented as a function
of elapsed time in Figure 10. After the rollers have established fully contact, the moment increases
linearly until a peak value is attained. A plateau in measured moment is found in the last part of
the test. The plateau is located just before the main crack reach the interface. Next, the main crack
propagates unstable through the specimen and penetrates into the substrate as indicated by the sudden
drop in measured moment.
0 200 400 600 800 1000 1200 1400
Tim e [sec.]
50
0
50
100
150
200
250
300
350
Mom
ent p
er w
idth
, M [N
mm
/mm
]
roughenedinterface
#2#2 #2
a
c
b
Test A1-1Test A1-2Test A1-3Test A1-4Test A1-5Test A1-6Test A1-7Test A1-8Test A1-9
Time, t [s]
Figure 10: Results for specimens in series A1 with ”roughened” interface.
Results from test A1-7 is evaluated in further details. The measured moment, crack length and
strain contours for test A1-7 are presented in Figure 11. According to images of the front surface, the
main crack grows stable from a0/b = 0.64 to a/b = 0.92. The crack speed decreases significantly as
indicated by the larger number of data points in the plot for 0.90 ≤ a/b ≤ 0.92. From a/b = 0.92
and onwards the main crack growth becomes unstable and the crack penetrates into the substrate.
Evaluation of the fracture surfaces for test specimen A1-7 shows that the main crack has reached the
interface in the center of the specimen (at z = −w/2), but not on the front surface (at z = 0). Thus, a
crack front with shape as a thumbnail is identified and measured to be a/b = 0.08 longer in the center
than at the front of the specimen.
The measured moment for the five experiments in test series A2 is presented in Figure 12. Test A2-1
is selected for further analysis. The moment and crack length measured for test A2-1 are presented in
Figure 13 (A). The moment increases linearly with time until the main crack starts to grow at time
t ≈ 1200 s. The main crack grows stable towards the interface until time t ≈ 1402 s, see the image in
Figure 13 (B), where the crack length is measured to be a/b = 0.92. Next, at time t ≈ 1404 s, it is
observed that the main crack deflects along the interface, see Figure 13 (C).
12

Figure 11: Results for test specimen A1-7 with crack penetration. εmaxyy is the maximum vertical strain measured
measured by DIC in (B). DIC contour plots illustrate: (B) the vertical strain and (C) horizontal strain just before crack
penetration.
0 200 400 600 800 1000 1200 1400 1600 1800100
0
100
200
300
400
500
Mom
ent p
er w
idth
, M [N
mm
/mm
] Test A2-1Test A2-2Test A2-3Test A2-4Test A2-5
Time, t [s]
Smoothedinterface
#2#2 #2
a
c
b
Figure 12: Results for specimens in series A2 with ”smooth” interface.
13
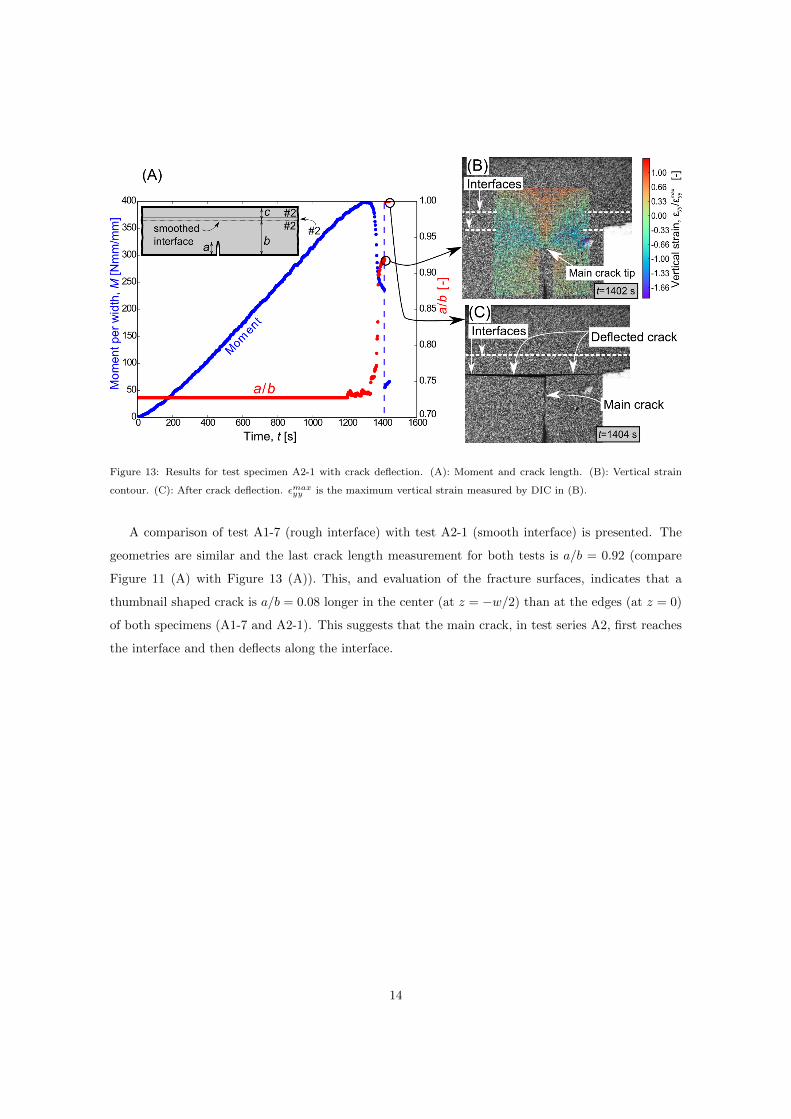
Figure 13: Results for test specimen A2-1 with crack deflection. (A): Moment and crack length. (B): Vertical strain
contour. (C): After crack deflection. εmaxyy is the maximum vertical strain measured by DIC in (B).
A comparison of test A1-7 (rough interface) with test A2-1 (smooth interface) is presented. The
geometries are similar and the last crack length measurement for both tests is a/b = 0.92 (compare
Figure 11 (A) with Figure 13 (A)). This, and evaluation of the fracture surfaces, indicates that a
thumbnail shaped crack is a/b = 0.08 longer in the center (at z = −w/2) than at the edges (at z = 0)
of both specimens (A1-7 and A2-1). This suggests that the main crack, in test series A2, first reaches
the interface and then deflects along the interface.
14
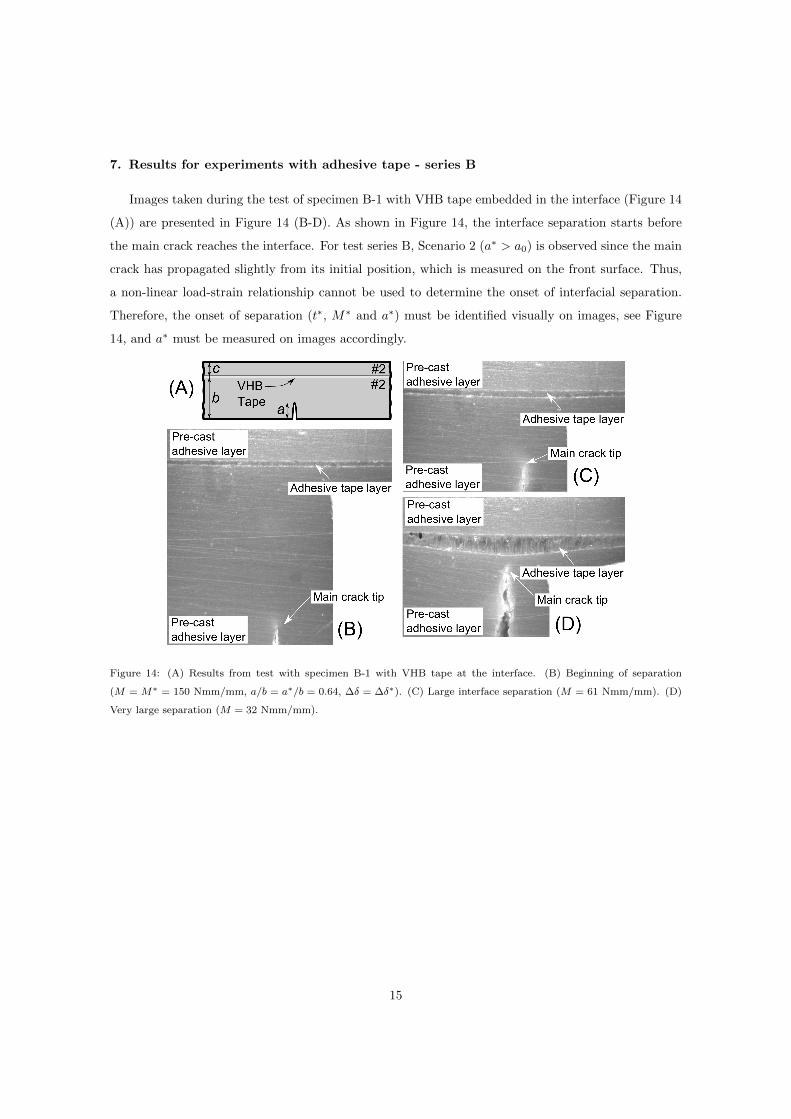
7. Results for experiments with adhesive tape - series B
Images taken during the test of specimen B-1 with VHB tape embedded in the interface (Figure 14
(A)) are presented in Figure 14 (B-D). As shown in Figure 14, the interface separation starts before
the main crack reaches the interface. For test series B, Scenario 2 (a∗ > a0) is observed since the main
crack has propagated slightly from its initial position, which is measured on the front surface. Thus,
a non-linear load-strain relationship cannot be used to determine the onset of interfacial separation.
Therefore, the onset of separation (t∗, M∗ and a∗) must be identified visually on images, see Figure
14, and a∗ must be measured on images accordingly.
Figure 14: (A) Results from test with specimen B-1 with VHB tape at the interface. (B) Beginning of separation
(M = M∗ = 150 Nmm/mm, a/b = a∗/b = 0.64, ∆δ = ∆δ∗). (C) Large interface separation (M = 61 Nmm/mm). (D)
Very large separation (M = 32 Nmm/mm).
15
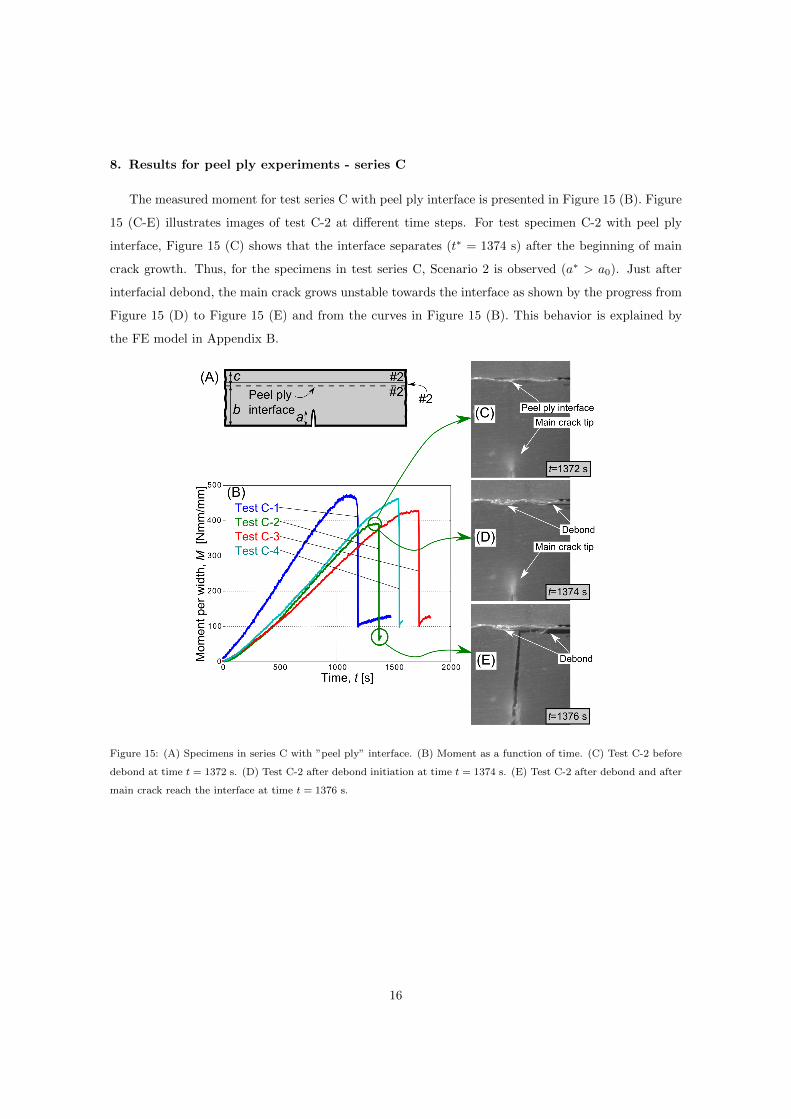
8. Results for peel ply experiments - series C
The measured moment for test series C with peel ply interface is presented in Figure 15 (B). Figure
15 (C-E) illustrates images of test C-2 at different time steps. For test specimen C-2 with peel ply
interface, Figure 15 (C) shows that the interface separates (t∗ = 1374 s) after the beginning of main
crack growth. Thus, for the specimens in test series C, Scenario 2 is observed (a∗ > a0). Just after
interfacial debond, the main crack grows unstable towards the interface as shown by the progress from
Figure 15 (D) to Figure 15 (E) and from the curves in Figure 15 (B). This behavior is explained by
the FE model in Appendix B.
Figure 15: (A) Specimens in series C with ”peel ply” interface. (B) Moment as a function of time. (C) Test C-2 before
debond at time t = 1372 s. (D) Test C-2 after debond initiation at time t = 1374 s. (E) Test C-2 after debond and after
main crack reach the interface at time t = 1376 s.
16
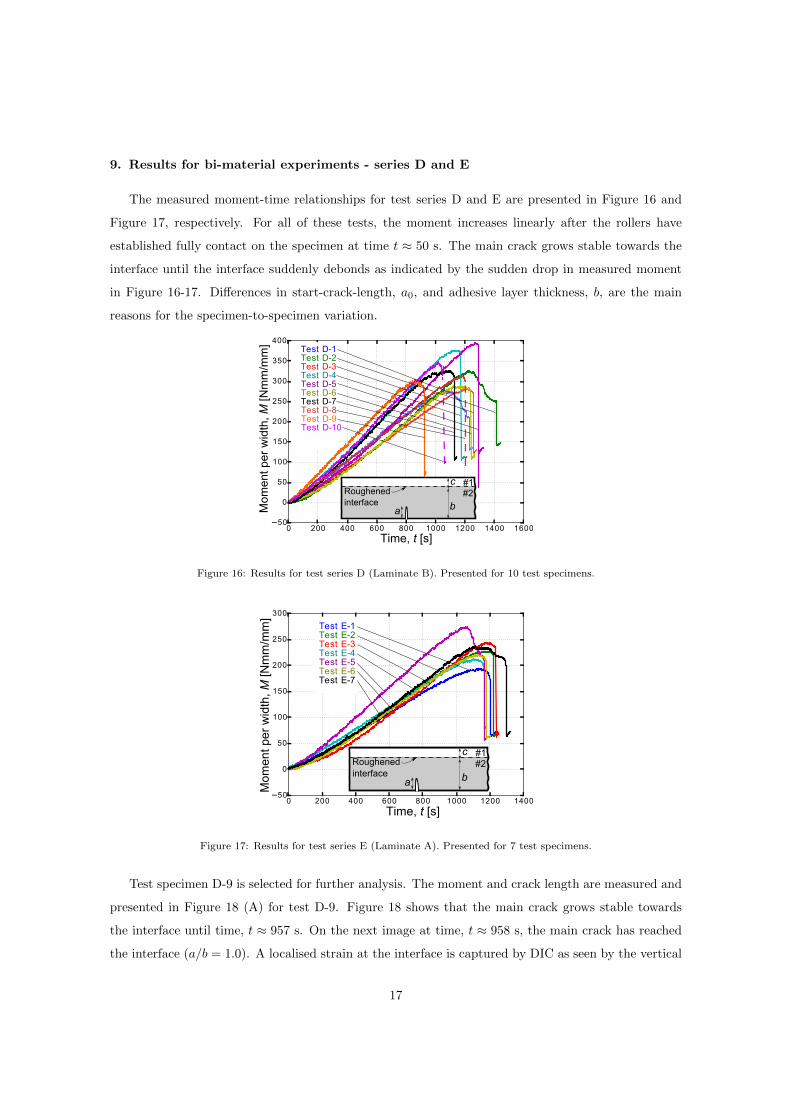
9. Results for bi-material experiments - series D and E
The measured moment-time relationships for test series D and E are presented in Figure 16 and
Figure 17, respectively. For all of these tests, the moment increases linearly after the rollers have
established fully contact on the specimen at time t ≈ 50 s. The main crack grows stable towards the
interface until the interface suddenly debonds as indicated by the sudden drop in measured moment
in Figure 16-17. Differences in start-crack-length, a0, and adhesive layer thickness, b, are the main
reasons for the specimen-to-specimen variation.
0 200 400 600 800 1000 1200 1400 160050
0
50
100
150
200
250
300
350
400
Time, t [s]
Mom
ent p
er w
idth
, M [N
mm
/mm
]
Roughenedinterface
#1#2
a
c
b
Test D-1Test D-2Test D-3Test D-4Test D-5Test D-6Test D-7Test D-8Test D-9Test D-10
Figure 16: Results for test series D (Laminate B). Presented for 10 test specimens.
0 200 400 600 800 1000 1200 140050
0
50
100
150
200
250
300
Time, t [s]
Mom
ent p
er w
idth
, M [N
mm
/mm
]
Roughenedinterface
#1#2
a
c
b
Test E-1Test E-2Test E-3Test E-4Test E-5Test E-6Test E-7
Figure 17: Results for test series E (Laminate A). Presented for 7 test specimens.
Test specimen D-9 is selected for further analysis. The moment and crack length are measured and
presented in Figure 18 (A) for test D-9. Figure 18 shows that the main crack grows stable towards
the interface until time, t ≈ 957 s. On the next image at time, t ≈ 958 s, the main crack has reached
the interface (a/b = 1.0). A localised strain at the interface is captured by DIC as seen by the vertical
17
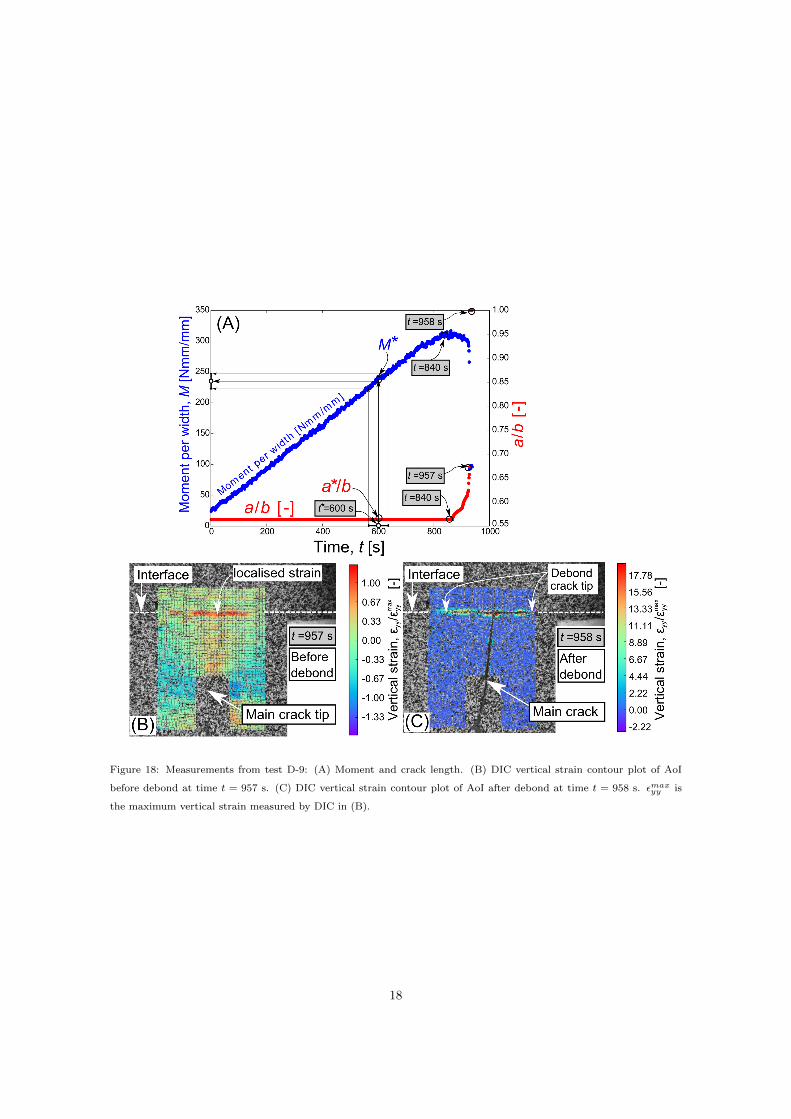
Figure 18: Measurements from test D-9: (A) Moment and crack length. (B) DIC vertical strain contour plot of AoI
before debond at time t = 957 s. (C) DIC vertical strain contour plot of AoI after debond at time t = 958 s. εmaxyy is
the maximum vertical strain measured by DIC in (B).
18

strain contour plot in Figure 18 (B) for t = 957 s for test D-9. This indicate that the interface crack
initiated before the main crack reached the interface. Thus, Scenario 1 is observed for the present
tests.
In order to determine the onset of interface separation, a displacement is measured by DIC over
the gauge length, lg = 0.1b. Thus, determining the displacement difference, ∆δ, across the interface
as shown in Figure 19.
0 200 400 600 800 10000.0
0.5
1.0
1.5
2.0
2.5
[-]
t=957 s
~1.4
t=840 s
Dis
plac
emen
t diff
eren
ce,
Δδ*
/Δ
δΔ
δ*
Time, t [s]
Verticalsymmetry line
lg
interfacecrack
#1#2
maincrack
+Δδ
t =600 s*
Figure 19: Results of test D-9 with DIC. The displacement difference, ∆δ, is normalised by the value of the displacement
difference at the onset of non-linearity, ∆δ∗. ∆δ is measured over a gauge length of lg = 0.1b. The onset of interface
separation begins at time t∗ = 600 ± 30 s whereas the main crack starts to propagate at time t = 840 s.
The result in Figure 19 is used to identify the time where the interface crack initiates more accu-
rately than what can be seen from the strain contours. A straight line is fitted to the first linear part
of the measured displacement difference, ∆δ/∆δ∗, and it is judged that the measurements deviate
from the fitted straight line at time t ≈ 600 s. Thus, time t∗ ≈ 600 ± 30 s is identified as the onset
of non-linearity in measured displacement difference and the time where the interface crack initiates
according to the approach presented in Figure 5.
A forward finite difference approximation of ∆δ versus t was used to determine the partial deriva-
tives, ∂∆δ/∂t and ∂2∆δ/∂2t in order to determine the point of non-linearity more accurately. It was
found that these results were comparable to the determined onset of non-linearity at time t∗ ≈ 600 s
in Figure 19 and therefore not presented in further details. However, exact determination of the time
of crack initiation is challenging [49, 50] and influenced by some degree of uncertainty as illustrated
by the error bar in Figure 19.
19
10. Determination of mode-I cohesive strength of interfaces
Two examples, one for Scenario 1 and one for Scenario 2, are given to demonstrate the procedure
for the determination of the cohesive strength of the interface, σi. Since the material systems are
confidential, the cohesive strength of the interface, σi, will be presented in normalised form. According
to the stress based criterion by Cook and Gordon [5] for a homogenous solid, the interface strength
should be less than a about 1/3 to 1/5 of the bulk material for the main crack to initiate a new crack
at the weaker interface. It is therefore relevant to normalise the cohesive strength of the interface by
the cohesive strength of the adhesive. Unfortunately, the cohesive strength of the adhesive has not
been measured. Therefore, σi is normalised with the macroscopic strength of the adhesive, σa, that
was measured by a uni-directional tensile test of a dog bone specimen.
10.1. Example: Determination of cohesive strength - Scenario 1
For the laminate-adhesive specimens (series D and E) with E1/E2 ≈ 12.0, Scenario 1 (a∗ = a0)
is observed. Thus, for test series D and E, DIC can be applied to determine the onset of interface
separation in order to determine the time of crack initiation at the interface, see the approach in Figure
5.
The approach to determine the cohesive strength of the interface for Scenario 1 (a∗ = a0) is
exemplified by test D-9. For test D-9 a displacement difference is measured by DIC as shown in Figure
19. The point of interfacial separation is identified at time t∗ = 600 s since this point is identified as
the onset of non-linear displacement difference, ∆δ∗, according to Figure 19. This time measurement
(t∗ = 600 s) is used in Figure 18 (A) to determine M∗ = 240 Nmm/mm and a∗/b = 0.57. These
parameters (M∗ = 240 Nmm/mm, a∗/b = 0.57) together with E1/E2 = 12.0 and c/b = 0.2 are used
to read off the value for σyy,ib2/M in Figure 7. From equation 1, the mode-I cohesive strength of the
interface can be determined to be σi/σa = 0.078 ± 0.004 for test D-9. The uncertainty is primarily a
result of the estimated precision in the value of M∗ corresponding to the range of the error bar for
t∗ = 600 ± 30 s in Figure 19.
10.2. Example: Determination of cohesive strength - Scenario 2
For the specimens in test series B and C, the moment at onset of separation, M∗, is measured just
before the interface debonds i.e. using visual inspection in accordance with Scenario 2 (a > a0) in the
approach in Figure 5. Thus, a∗/b is measured on the last image before the interface debonds.
An example with Scenario 2 (a∗ > a0) is given by test C-2 with peel ply interface. The results for
test C-2 is presented in Figure 13. Here, the moment just before debond was measured to M = 390
Nmm/mm and the crack length before onset of interface separation is measured to a/b = 0.78.
Inserting these values (M∗ = 390 Nmm/mm, a∗/b = 0.78) into equation 1 and using the results
20

for E1/E2 = 1.0 and c/b = 0.3 in Figure 7 gives the mode-I cohesive strength of the interface:
σi/σa = 0.163 ± 0.008 for test C-2. The uncertainty is primarily a result of the estimated accuracy in
the determination of the onset of interface separation.
11. Results for the mode-I cohesive strength of the interfaces
The mode-I cohesive strength results for test series B, C, D and E are presented for comparison
in Figure 20. It is clear that the cohesive strengths of the interface for the specimens in test series
B are smallest. The cohesive strengths of the interfaces for the specimens in test series C and D are
intermediate, whereas those in test series E are highest. For all specimens, the cohesive strength of
the interface is relatively small in comparison with the macroscopic strength of the adhesive, σa.
0.00
0.05
0.10
0.15
0.20
0.25
σC
ohes
ive
stre
ngth
,ˆ i/σ
a[-
]
laminate B laminate Apeel ply intf.VHB tapeTest series [-]
B C D EB C D E
Figure 20: Results for normalised cohesive interface strength for different types of test specimens where the crack at the
interface initiated ahead of the main crack. Error bars indicate the standard deviation. The number of specimens are:
B: 2 specimens, C: 4 specimens, D: 31 specimens, E: 22 specimens.
12. Discussions
Mohammed and Liechti [30] measured the cohesive strength of an aluminum-epoxy bi-material
interface to σi = 3 MPa. This value can be normalised with the bulk strength of the epoxy adhesive
of σa = 13.4 MPa (provided by Mohammed and Liechti [30]) to give σi/σa = 0.217. Although the
material systems are different, the measured average cohesive strength of the interfaces in test series
E of σi/σa = 0.195 in Figure 20 is close to the non-dimensional result by Mohammed and Liechti [30].
This close agreement leads confidence in the novel approach applied in the present paper. In order to
evaluate the accuracy of the novel approach, the measured cohesive strength of the specific interfaces
21
could be compared with other independent measurements obtained by another method, e.g. using the
J-integral approach on small DCB beam specimens in environmental scanning electron microscope,
where the end-opening displacement can be measured with high accuracy [29].
Normalisation of σi by σa is equivalent to the way Cook and Gordon [5] presented their modelling
results based on stress. They [5] suggested that the interface strength should be less than about 1/3 to
1/5 of the bulk material strength in order to ensure that a new crack initiates along the weaker interface
ahead of the main crack. Although the Cook and Gordon model was established for a homogenous
solid, the criterion is consistent with the experimental test results presented in Figure 20 since all
measured normalised cohesive strengths of the interfaces in Figure 20 are below 1/5. Since crack
penetration into the substrate is observed in test series A1, it is expected based on the Cook-Gordon
criterion that the cohesive strength of the interfaces for the specimens in test series A1 is σi/σa > 1/3.
In order to determine the cohesive strength of the interface accurately, it is found important to
identify the correct load and crack tip location at correct time t∗ corresponding to the onset of interface
separation. It can be seen in Figure 18 that the maximum moment for test D-9 is measured at time
t = 840 s, which is 1.4 times M∗ determined at time t∗ = 600 s. Thus, the use of maximum moment as
M∗, as proposed by Zhang and Lewandowski [14], would clearly overestimate the determined cohesive
strength of the interface, σi, since in the experiments the crack initiates before the moment reaches
the peak.
For test series C with peel ply interface and the bi-material tests, it is observed shortly after
interface crack initiation that the main crack starts to grow unstable towards the interface. The
observed instability of the main crack, shown in Figure 18, is attributed the initiation of a new crack
at the interface since the energy release rate of the main crack increase when the interface crack is
fully developed. This phenomenon is explained by FE simulations in Appendix B.
Possible improvements of the work in the present paper are discussed. One of the limitations of
the method is that the main crack should preferably be stationary in order to make the most accurate
prediction of the onset of separation i.e. enabling the use of DIC to identify crack initiation. A more
thorough numerical study could be made in order to determine the optimum combination of h/b, B/b,
and a0/b for the four-point SENB specimen. The shape of the notch could also be changed e.g. by
using an elliptical or circular shaped notch instead of the start-crack in the four-point SENB specimen.
Then, the risk of main crack propagation would be reduced.
It is demonstrated that the vertical normal stress, σyy, in front of the main crack can initiate
a new crack at the interface before the main crack reaches the interface, which is similar to the
experimental observations by Lee and Clegg [11]. This suggests that the interfacial strength is low
in comparison with both the adhesive and the substrate. This cracking mechanism (Figure 2 (C))
enables determination of the cohesive strength of the interface that can be used as input for cohesive
22
zone models to simulate crack deflection at interfaces in adhesive joints [9, 10]. Thus, experimental
tests and numerical simulations can be combined to solve the challenging problem of crack deflection
at interfaces.
Based on the literature presented in the introduction, especially the work by Parmigiani and Thou-
less [9], and the experiments in the present paper, it is judged that the cohesive strength of the interface
and the of substrate are important parameters in an accurate crack deflection criterion. However, ad-
ditional experiments with systematic varying cohesive strength of the interface/substrate is needed to
form such a crack deflection criterion.
At present, the initiation of a new crack at the interface cannot be modelled by the available energy
based models [6, 7]. Therefore, a criterion for crack initiation at the interface must be based on strength
[5, 14] or preferably CZM [9, 10]. Cohesive zone modelling of the competition between main crack
growth and initiation of an interface crack is a natural extension of the experimental studies presented
in this paper and it may be addressed by models similar to those by Parmigiani and Thouless [9] and
Brinckmann et al. [10]. This CZM modelling framework can subsequently be used for sub-modelling
of adhesive joints in large bonded structures, like a wind turbine blade, to predict crack deflection at
interfaces on a sub-component scale.
13. Conclusions
Based on a four-point SENB specimen design with stable crack growth, it was found possible to
study the cracking mechanisms during loading by DIC and in-situ observations. Model experiments
showed that the crack penetrated into the substrate for the specimen with roughened (strong) interface,
whereas for the specimen with smooth (weak) interface the crack deflected along the interface.
Observations by DIC, during four other experiments with different types of four-point SENB spe-
cimens, showed that a new crack initiated at the interface before the main crack reached the interface.
DIC was succesfully used to determine the onset of interface separation by measuring a displacement
difference across the interface. The initiation of the interface crack enabled determination of the cohe-
sive strength of the different material interfaces using a novel approach. The cohesive strength of the
interfaces was found to be low in comparison with the macroscopic strength of the adhesive.
Acknowledgements
First of all thanks to professor Michael D. Thouless, University of Michigan, for useful discussions
that helped develop the earlier approach [32] that was further refined and applied here. Acknowled-
gements to the LM Wind Power lab for help manufacturing the test specimens and to Fulbright for
supporting the research stay at the University of Michigan. Thanks to James Gorman, University
23

of Michigan for his help when preparing some of the Python scripts used for the DIC data analysis
and for his help when testing the specimens in the lab at the Department of Mechanical Engineering,
University of Michigan, MI, USA. This research was primarily supported by grant no. 4135-00010B
from Innovation Fund Denmark. This research was also supported by the Danish Centre for Composite
Structure and Materials for Wind Turbines (DCCSM), grant no. 0603-00301B, from Innovation Fund
Denmark.
Appendix A. DIC setup and settings
Appendix A.1. Field of view
The first step in design of the four-point SENB experiments with DIC is the selection of Field of
View (FOV), which together with the camera resolution (2448x2048) defines the displacement accuracy,
spatial resolution, and the scaling between pixels and microns (µm or mm) [51]. It is desired to have
as many pixels in the measurement area as possible [38], but this is limited by the need of keeping the
main crack tip and the interface in the FoV simultaneously. Based on initial experiments, it was found
that the scaling between pixels and microns should be approx. 3 µm/pixel (or slightly less).
Appendix A.2. Speckle pattern
A speckle pattern was applied to the front surface using an Iwata CM-B airbrush where the aim
was to achieve a 50/50 distribution of black/white [42] and build up a surface of multiple thin layers
[40]. The speckle pattern equipment (airbrush) had limitations since the smallest achievable speckle
size was approx. 5-10 microns. Furthermore, it was desired to have 3-7 pixels per speckle and at least
2-3 speckles in each subset in order to have a suitable trade-off between spatial resolution and noise
[52, 53, 54]. The 3 pixels speckle size minimum guideline was to avoid aliasing and the maximum
guideline of 7 pixels was to maximise spatial resolution [55]. The contrast, which was defined as the
difference in gray level counts between the bright and the dark areas of the speckle pattern, should be
maximised [56].
Appendix A.3. Speckle-, subset- and step-Sizes
The speckles, shown in Figure A.21, were measured in an optical microscope to be in the range of
∼8-30 microns. A subset size of about 20 pixels could be used as a good compromise between spatial
resolution and noise if speckle sizes of 3-5 pixels were achieved [57]. The average speckle size was
measured to ∼3-10 pixels and a larger subset size must therefore be used e.g. a subset size of 25-30
pixels. The guideline of 2-3 unique features in each subset should be followed. The subset size was
set relatively small since it was important to capture displacement gradients and it was less important
to reduce noise. A rule of thumb was not to set the step size greater than ∼ 1/4 of the subset size
24

Figure A.21: Speckle pattern near the start crack tip of test D-10 (optical microscope).
since smaller step sizes increased the solution time without adding independent measurements [51].
Therefore, the subset size was set to 25 pixels and the step size to 5 pixels. This gave approx. 100,000
measuring points on the sample. The spatial resolution was 25 pixels. The displacement resolution
was 0.02 pixels and the strain resolution was 1.9 · 10−4 m/m. These values were determined based on
25 still images taken before loading the specimen.
Appendix A.4. Light conditions and camera settings
Fiber optic lights from Cole-Palmer illuminated the specimens front surface as shown in Figure
9. Adequate lightning of the speckle pattern was important [39] and the light should be uniform,
bright, and diffuse to capture a good contrast image [41, 37]. Image contrast and noise depends on the
interaction of lightning and the speckle pattern [37] and it was a trade-off between light intensity and
reflections. For the experiments in this paper, reflections were primarily originating from too thick
layers of paint. Missing paint was a minor problem since the surfaces of the adhesive and glass-fiber
materials were non-reflective.
The selection of aperture level is a trade-off between gathering light and capturing image depth [35]
and typically the aperture is reduced to increase the depth of field [38, 37]. In the present experiments
the aperture size was set to a medium level of f/8 where the bounds for the lens was f/22 and f/1.8. At
large magnifications, rigid body movement should be minimised in order to achieve high precision DIC
results. Therefore, it was advantageous that the load- and support-span were small for the four-point
SENB specimen.
25
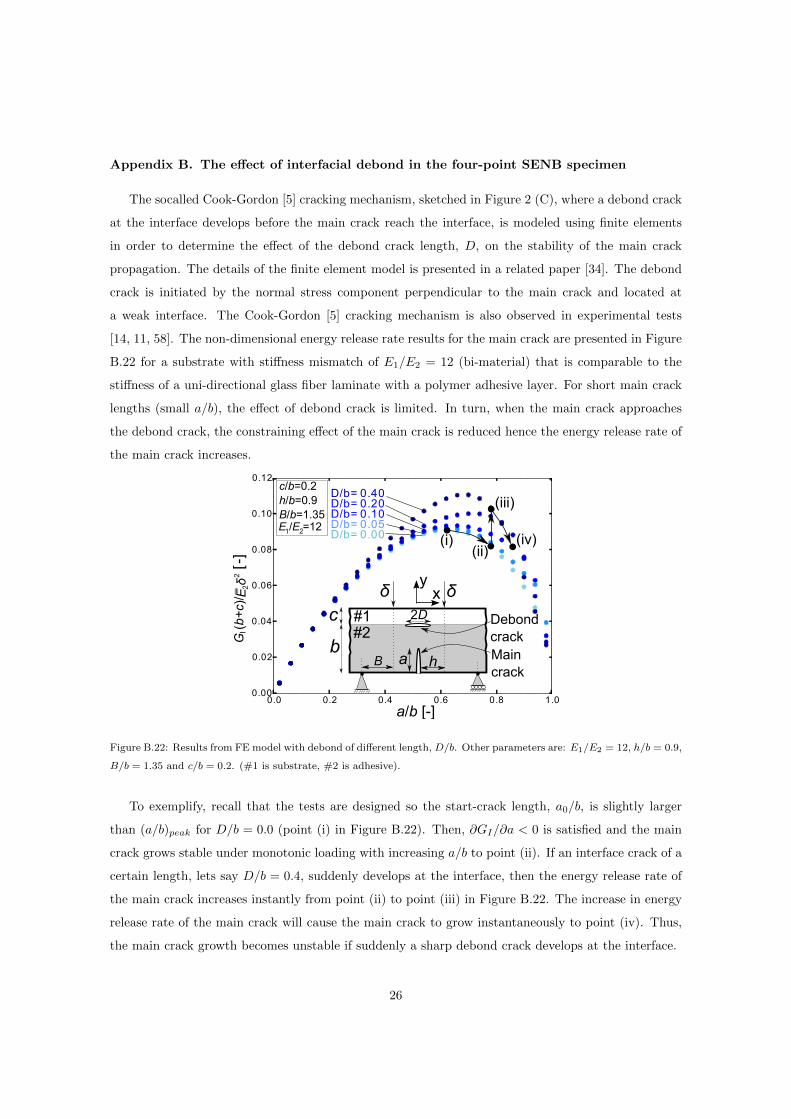
Appendix B. The effect of interfacial debond in the four-point SENB specimen
The socalled Cook-Gordon [5] cracking mechanism, sketched in Figure 2 (C), where a debond crack
at the interface develops before the main crack reach the interface, is modeled using finite elements
in order to determine the effect of the debond crack length, D, on the stability of the main crack
propagation. The details of the finite element model is presented in a related paper [34]. The debond
crack is initiated by the normal stress component perpendicular to the main crack and located at
a weak interface. The Cook-Gordon [5] cracking mechanism is also observed in experimental tests
[14, 11, 58]. The non-dimensional energy release rate results for the main crack are presented in Figure
B.22 for a substrate with stiffness mismatch of E1/E2 = 12 (bi-material) that is comparable to the
stiffness of a uni-directional glass fiber laminate with a polymer adhesive layer. For short main crack
lengths (small a/b), the effect of debond crack is limited. In turn, when the main crack approaches
the debond crack, the constraining effect of the main crack is reduced hence the energy release rate of
the main crack increases.
0.0 0.2 0.4 0.6 0.8 1.00.00
0.02
0.04
0.06
0.08
0.10
0.12
D/b= 0.00D/b= 0.05D/b= 0.10D/b= 0.20D/b= 0.40
c/b=0.2h/b=0.9B/b=1.35E /E =121 2
[-]
G (
b+c)
/ E δ
2
a/b [-]
2
(i)(ii)
(iii)
(iv)
ab
2Dc
B
xy
DebondcrackMaincrack
h
δδ
#1#2I
Figure B.22: Results from FE model with debond of different length, D/b. Other parameters are: E1/E2 = 12, h/b = 0.9,
B/b = 1.35 and c/b = 0.2. (#1 is substrate, #2 is adhesive).
To exemplify, recall that the tests are designed so the start-crack length, a0/b, is slightly larger
than (a/b)peak for D/b = 0.0 (point (i) in Figure B.22). Then, ∂GI/∂a < 0 is satisfied and the main
crack grows stable under monotonic loading with increasing a/b to point (ii). If an interface crack of a
certain length, lets say D/b = 0.4, suddenly develops at the interface, then the energy release rate of
the main crack increases instantly from point (ii) to point (iii) in Figure B.22. The increase in energy
release rate of the main crack will cause the main crack to grow instantaneously to point (iv). Thus,
the main crack growth becomes unstable if suddenly a sharp debond crack develops at the interface.
26
References
[1] B. F. Sørensen, J. W. Holmes, P. Brøndsted, K. Branner, Blade materials, testing methods and
structural design, in: W. Tong (Ed.), Wind Power Generation and Wind Turbine Design, 1st
Edition, Vol. 44, WIT Press, Boston, 2010, Ch. 13, pp. 417–460. doi:10.2495/978-1-84564-.
[2] S. Ataya, M. M. Z. Ahmed, Damages of wind turbine blade trailing edge: Forms, location, and
root causes, Engineering Failure Analysis 35 (2013) 480.
[3] W. J. Clegg, The fabrication and failure of laminar ceramic composites, Acta metall. mater.
40 (11) (1992) 3085.
[4] W. Lee, S. J. Howard, W. J. Clegg, Growth of interface defects and its effect on crack deflection
and toughening criteria, Acta. Mater. 44 (1996) 3905.
[5] J. Cook, J. E. Gordon, C. C. Evans, D. M. Marsh, A mechanism for the control of crack propa-
gation in all-brittle systems, Mathematical and Physical Sciences 282 (1391) (1964) 508–520.
[6] M. He, J. W. Hutchinson, Crack deflection at an interface between dissimilar elastic materials,
Int. J. Solid Structures 25 (9) (1989) 1053–1067.
[7] M. Y. He, A. G. Evans, Crack deflection at an interface between dissimilar elastic materials: Role
of residual stresses, Int. J. Solids Structures 31 (1994) 3443.
[8] M. D. Thouless, H. C. Cao, P. A. Mataga, Delamination from surface cracks in composite mate-
rials, Journal of Materials Science 24 (1989) 1406–1412.
[9] J. Parmigiani, M. Thouless, The roles of toughness and cohesive strength on crack de-
flection at interfaces, Journal of the Mechanics and Physics of Solids 54 (2) (2006) 266–287.
doi:10.1016/j.jmps.2005.09.002.
[10] S. Brinckmann, B. Volker, G. Dehm, Crack deflection in multi-layered four-point bending samples,
International Journal of Fracture 190 (1-2) (2014) 167–176. doi:10.1007/s10704-014-9981-1.
[11] W. Lee, W. J. Clegg, The deflection of cracks at interfaces, Key Engineering Materials 116-117
(1996) 1886–1889. doi:10.4028/www.scientific.net/KEM.132-136.1886.
[12] K. Kendall, Transition between cohesive and interfacial failure in a laminate, Proc. R. Soc. Lond.A.
344 (1975) 287–302. doi:10.1098/rspa.1983.0054.
[13] A. A. Griffith, The phenomena of rupture and flow in solids, Royal Society of London 221 (587)
(1920) 163.
27

[14] J. Zhang, J. J. Lewandowski, Delamination study using four-point bending of bilayers, Journal of
Materials Science 32 (14) (1997) 3851–3856.
[15] Z. Y. Wang, L. Wang, W. Guo, H. Deng, J. W. Tong, F. Aymerich, An investigation on
strain/stress distribution around the overlap end of laminated composite single-lap joints, Com-
posite Structures 89 (4) (2009) 589–595. doi:10.1016/j.compstruct.2008.11.002.
[16] T. Sadowski, M. Knec, Application of DIC technique for monitoring of deformation process of SPR
hybrid joints, Archives of Metallurgy and Materials 58 (1) (2013) 119–125. doi:10.2478/v10172-
012-0161-x.
[17] G. Crammond, S. W. Boyd, J. M. Dulieu-Barton, Evaluating the localised through-
thickness load transfer and damage initiation in a composite joint using digital image
correlation, Composites Part A: Applied Science and Manufacturing 61 (2014) 224–234.
doi:10.1016/j.compositesa.2014.03.002.
[18] M. P. Moutrille, K. Derrien, D. Baptiste, X. Balandraud, M. Grediac, Through-thickness strain
field measurement in a composite/aluminium adhesive joint, Composites Part A: Applied Science
and Manufacturing 40 (8) (2009) 985–996. doi:10.1016/j.compositesa.2008.04.018.
[19] R. Srilakshmi, M. Ramji, Experimental investigation of adhesively bonded patch repair of an
inclined center cracked panel using DIC, Journal of Reinforced Plastics and Composites 33 (12)
(2014) 1130–1147. doi:10.1177/0731684414525245.
[20] M. Kashfuddoja, M. Ramji, Assessment of local strain field in adhesive layer of an unsymmetri-
cally repaired CFRP panel using digital image correlation, International Journal of Adhesion and
Adhesives 57 (040) (2015) 57–69. doi:10.1016/j.ijadhadh.2014.10.005.
[21] J. Jefferson Andrew, V. Arumugam, D. J. Bull, H. N. Dhakal, Residual strength and damage
characterization of repaired glass/epoxy composite laminates using A.E. and D.I.C, Composite
Structures 152 (2016) 124–139. doi:10.1016/j.compstruct.2016.05.005.
[22] C. Liu, P. J. Rae, C. M. Cady, M. L. Lovato, Damage and fracture of high-explosive mock subject
to cyclic loading., Proceedings of the 2011 Annual Conference on Experimental and Applied
Mechanics. 3 (2011) 151.
[23] A. D. Wargo, S. Safavizadeh, R. Y. Kim, The use of four-point bending notched beam fatigue
tests to rank crack-mitigating interlayers, 8th RILEM International Symposium on Testing and
Characterization of Sustainable and Innovative Bituminous Materials. 11 (2016) 359.
28
[24] K. Allaer, I. De Baere, W. Van Paepegem, J. Degrieck, Direct fracture toughness determination
of a ductile epoxy polymer from digital image correlation measurements on a single edge notched
bending sample, Polymer Testing 42 (2015) 199–207. doi:10.1016/j.polymertesting.2015.01.014.
[25] B. F. Sørensen, Cohesive laws for assessment of materials failure: Theory, experimental methods
and application, Risø-R-1736 (EN), 2010.
[26] V. C. Li, R. J. Ward, A novel testing technique for post-peak tensile behavior of cementitious
materials, Fracture Toughness and Fracture Energy, Mihashi et al. (eds). (1989) 183.
[27] B. F. Sørensen, T. K. Jacobsen, Large-scale bridging in composites: R-curves and bridging laws,
Composites Part A: Applied Science and Manufacturing 29 (1998) 1443–1451. doi:10.1016/S1359-
835X(98)00025-6.
[28] T. Andersson, U. Stigh, The stress-elongation relation for an adhesive layer loaded in peel using
equilibrium of energetic forces, International Journal of Solids and Structures 41 (2) (2004) 413–
434. doi:10.1016/j.ijsolstr.2003.09.039.
[29] S. Goutianos, R. Arevalo, B. F. Sørensen, T. Peijs, Effect of Processing Conditions on Fracture Re-
sistance and Cohesive Laws of Binderfree All-Cellulose Composites, Applied Composite Materials
21 (6) (2014) 805–825. doi:10.1007/s10443-013-9381-0.
[30] I. Mohammed, K. M. Liechti, Cohesive zone modeling of crack nucleation at bimaterial corners,
J. Mech. Phys. Solids. 48 (2000) 735.
[31] R. K. Joki, F. Grytten, B. Hayman, B. F. Sørensen, Determination of a cohesive law
for delamination modelling - Accounting for variation in crack opening and stress state
across the test specimen width, Composites Science and Technology 128 (2016) 49–57.
doi:10.1016/j.compscitech.2016.01.026.
[32] J. B. Jørgensen, M. D. Thouless, B. F. Sørensen, C. Kildegaard, Determination of mode-I cohesive
strength for interfaces, IOP Conference Series: Materials Science and Engineering 139 (2016) 267–
274. doi:10.1088/1757-899X/139/1/012025.
[33] H. Tada, P. C. Paris, G. R. Irwin, The Stress Analysis of Cracks Handbook, 3rd Edition, Vol. 3,
ASME Press, New York, 2000.
[34] J. B. Jørgensen, B. F. Sørensen, C. Kildegaard, Design of four-point SENB specimens with stable
crack growth, To be published NA (NA) (2017) NA.
29

[35] M. A. Sutton, J. Orteu, H. W. Schreier, Image Correlation for Shape, Motion
and Deformation Measurements, Vol. 1, Springer, 2009. arXiv:arXiv:1011.1669v3,
doi:10.1017/CBO9781107415324.004.
[36] P. Reu, Stereo-rig design: Camera selection-part 2, Experimental Techniques 36 (6) (2012) 3–4.
doi:10.1111/j.1747-1567.2012.00872.x.
[37] P. Reu, Stereo-rig design: Lighting - Part 5, Experimental Techniques 37 (3) (2013) 1–2.
doi:10.1111/ext.12020.
[38] P. Reu, Stereo-rig design: Lens selection - Part 3, Experimental Techniques 37 (1) (2013) 1–3.
doi:10.1111/ext.12000.
[39] P. Reu, Speckles and their relationship to the digital camera, Experimental Techniques 38 (4)
(2014) 1–2. doi:10.1111/ext.12105.
[40] P. Reu, Points on Paint, Experimental Techniques 39 (4) (2015) 1–2. doi:10.1111/ext.12147.
[41] P. Reu, All about speckles: Contrast, Experimental Techniques 39 (1) (2015) 1–2.
doi:10.1111/ext.12126.
[42] P. Reu, All about speckles: Speckle density, Experimental Techniques 39 (3) (2015) 1–2.
doi:10.1111/ext.12161.
[43] P. Lava, D. Debruyne, Practical considerations in DIC measurements MatchID : new spin-off
company of KULeuven, in: Practical considerations in DIC measurements, Edinburgh, 2015, pp.
1–79.
[44] F. Pierron, Metrology and uncertainty quantification in DIC, Tech. rep., University of Southamp-
ton, Southampton (2015).
[45] C. Solutions, Vic-2D Reference Manual, Tech. rep., Correlated Solutions (2009).
[46] P. Reu, Hidden components of 3D-DIC: Triangulation and post-processing - Part 3, Experimental
Techniques 36 (4) (2012) 3–5. doi:10.1111/j.1747-1567.2012.00853.x.
[47] H. P. Langtangen, Python Scripting for Computational Science, 2nd Edition, Springer, 2008.
[48] H. P. Langtangen, A Primer on Scientific Programming with Python, 4th Edition, Springer, 2014.
[49] P. A. Vanniamparambil, U. Guclu, A. Kontsos, Identification of crack initiation in aluminum alloys
using acoustic emission, Experimental Mechanics 55 (5) (2015) 837–850. doi:10.1007/s11340-015-
9984-5.
30

[50] R. Jiang, F. Pierron, S. Octaviani, P. A. Reed, Characterisation of strain localisation processes
during fatigue crack initiation and early crack propagation by SEM-DIC in an advanced disc alloy,
Materials Science and Engineering A 699 (May) (2017) 128–144. doi:10.1016/j.msea.2017.05.091.
[51] P. Reu, Stereo-rig design: Creating the Stereo-Rig Layout - Part 1, Experimental Techniques
36 (5) (2012) 3–4. doi:10.1111/j.1747-1567.2012.00871.x.
[52] P. Reu, Virtual Strain Gage Size Study, Experimental Techniques 39 (5) (2015) 1–3.
doi:10.1111/ext.12172.
[53] P. Reu, All about speckles: Speckle size measurement, Experimental Techniques 38 (6) (2014)
1–2. doi:10.1111/ext.12110.
[54] G. Crammond, S. W. Boyd, J. M. Dulieu-Barton, Speckle pattern quality assessment for digital
image correlation, Optics and Lasers in Engineering 51 (12) (2013) 1368–1378.
[55] P. Reu, All about speckles: Aliasing, Experimental Techniques 38 (5) (2014) 1–3.
doi:10.1111/ext.12111.
[56] P. Reu, Hidden components of 3D-DIC: Interpolation and matching - Part 2, Experimental Techni-
ques 36 (3) (2012) 3–4. doi:10.1111/j.1747-1567.2012.00838.x.
[57] P. Reu, Hidden components of DIC: Calibration and shape function - Part 1, Experimental Techni-
ques 36 (2) (2012) 3–5. doi:10.1111/j.1747-1567.2012.00821.x.
[58] R. K. Bordia, B. Dalgleish, P. G. Charalambides, A. G. Evans, Cracking and Damage in a Notched
Unidirectional Fiber-Reinforced Brittle Matrix composite, J. Am. Ceram. Soc. 74 (11) (1991)
2776–80.
31

APPENDED PAPERP6
Determination of mode-I cohesive strengthof interfaces
Jeppe B. Jørgensen, Michael D. Thouless, Bent F. Sørensen and Casper Kilde-gaardIOP Conf. Series: Materials Science and Engineering, 139, 012025Published, 2016
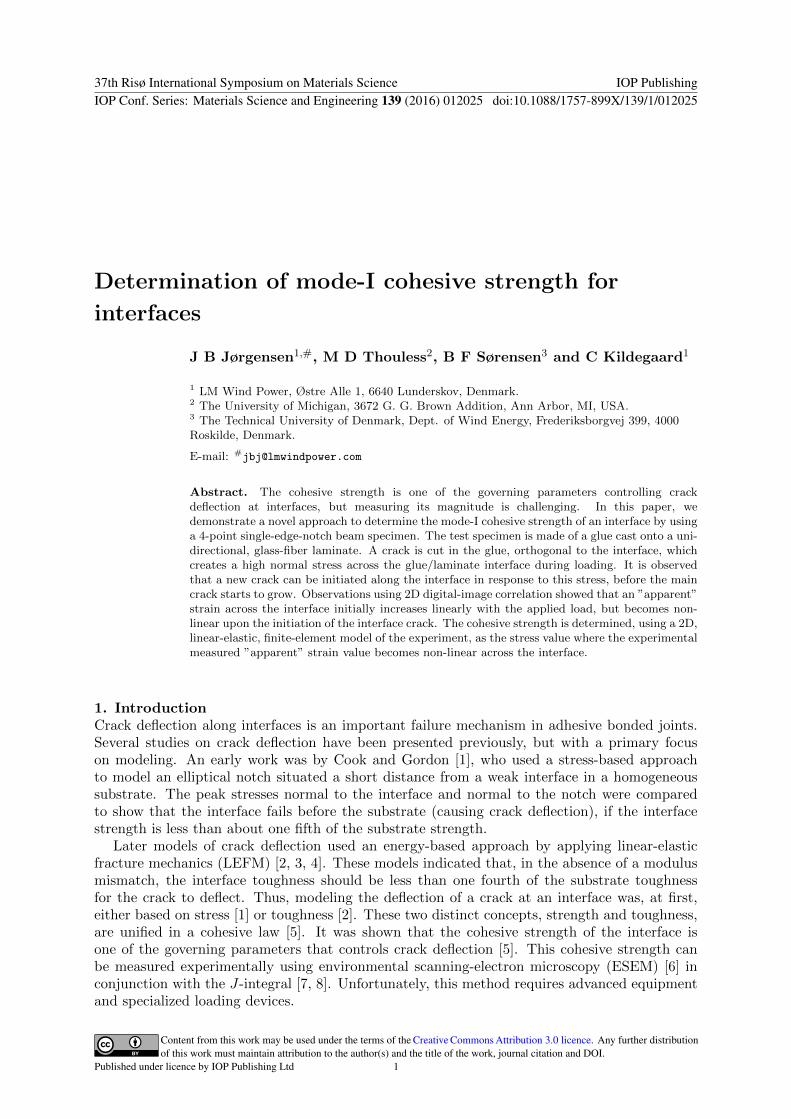
Determination of mode-I cohesive strength for
interfaces
J B Jørgensen1,#, M D Thouless2, B F Sørensen3 and C Kildegaard1
1 LM Wind Power, Østre Alle 1, 6640 Lunderskov, Denmark.2 The University of Michigan, 3672 G. G. Brown Addition, Ann Arbor, MI, USA.3 The Technical University of Denmark, Dept. of Wind Energy, Frederiksborgvej 399, 4000Roskilde, Denmark.
E-mail: #[email protected]
Abstract. The cohesive strength is one of the governing parameters controlling crackdeflection at interfaces, but measuring its magnitude is challenging. In this paper, wedemonstrate a novel approach to determine the mode-I cohesive strength of an interface by usinga 4-point single-edge-notch beam specimen. The test specimen is made of a glue cast onto a uni-directional, glass-fiber laminate. A crack is cut in the glue, orthogonal to the interface, whichcreates a high normal stress across the glue/laminate interface during loading. It is observedthat a new crack can be initiated along the interface in response to this stress, before the maincrack starts to grow. Observations using 2D digital-image correlation showed that an ”apparent”strain across the interface initially increases linearly with the applied load, but becomes non-linear upon the initiation of the interface crack. The cohesive strength is determined, using a 2D,linear-elastic, finite-element model of the experiment, as the stress value where the experimentalmeasured ”apparent” strain value becomes non-linear across the interface.
1. IntroductionCrack deflection along interfaces is an important failure mechanism in adhesive bonded joints.Several studies on crack deflection have been presented previously, but with a primary focuson modeling. An early work was by Cook and Gordon [1], who used a stress-based approachto model an elliptical notch situated a short distance from a weak interface in a homogeneoussubstrate. The peak stresses normal to the interface and normal to the notch were comparedto show that the interface fails before the substrate (causing crack deflection), if the interfacestrength is less than about one fifth of the substrate strength.
Later models of crack deflection used an energy-based approach by applying linear-elasticfracture mechanics (LEFM) [2, 3, 4]. These models indicated that, in the absence of a modulusmismatch, the interface toughness should be less than one fourth of the substrate toughnessfor the crack to deflect. Thus, modeling the deflection of a crack at an interface was, at first,either based on stress [1] or toughness [2]. These two distinct concepts, strength and toughness,are unified in a cohesive law [5]. It was shown that the cohesive strength of the interface isone of the governing parameters that controls crack deflection [5]. This cohesive strength canbe measured experimentally using environmental scanning-electron microscopy (ESEM) [6] inconjunction with the J-integral [7, 8]. Unfortunately, this method requires advanced equipmentand specialized loading devices.
37th Risø International Symposium on Materials Science IOP PublishingIOP Conf. Series: Materials Science and Engineering 139 (2016) 012025 doi:10.1088/1757-899X/139/1/012025
Content from this work may be used under the terms of the Creative Commons Attribution 3.0 licence. Any further distributionof this work must maintain attribution to the author(s) and the title of the work, journal citation and DOI.
Published under licence by IOP Publishing Ltd 1

Experimental studies of crack deflection at interfaces are very limited, and only a few havebeen found [9, 10]. Kendall [9] derived a deflection criterion for a Griffith crack, and used single-edge-notch-tension (SENT) specimens made from a brittle and transparent ethylene propylenerubber in which crack propagation could be monitored. Unfortunately, details and images of thecrack deflection process were not presented in that paper. A subsequent experiment [10] used awedge to load a single-edge-notch-beam (SENB) to show that an interface crack was initiatedbefore the main crack reached the interface. This competition between growth of the main crackand initiation of an interface crack is similar to the model proposed by Cook and Gordon [1].
In this paper, crack deflection at an interface is studied using a 4-point SENB specimen.The test specimen is manufactured of a brittle vinylester glue cast onto a uni-directional glass-fiber-reinforced polyester laminate. 2D digital-image-correlation (DIC) is used to measure thefull displacement field during loading of the specimen. It is found that a new crack initiates inthe interface prior to the main crack reaching the interface. This is similar to the experimentalobservations of Lee and Clegg [10], but we use this failure mode to develop a new approach tomeasure the cohesive strength of the interface.
2. ApproachA new approach is proposed in this paper for measuring the cohesive strength of the interface,σ. This approach is summarized in figure 1. The strength is measured using 2D DIC (figure1(a)), in combination with a linear-elastic finite-element (FE) model of the experiment (figure1(b)). During the test, measurements of an ”apparent” strain, εyy, acting normal to the interfaceallows the point at which the interface crack is initiated to be identified. εyy is obtained fromthe displacement difference between two points on either side of the interface divided by gaugelength, lg as shown on Figure 2.
Experimentaldetermination:- Non-linear strain, - Record crack length, a and moment, M
Finite elementsimulation:- Linear-elastic analysis- Determine stress, for interface at
σa, M
(a) (b)
εyy
d
σ yy
d
ε = yy ε yyd
Figure 1. Approach to obtain cohesive strength of theinterface.
zero-thicknessinterface glue
substratelg
Figure 2. Measuring an”apparent” strain, εyy.
The strain field at the interface increases linearly with load until the point at which theinterface crack initiates. The applied bending moment, Md and the crack length, a at thepoint when DIC indicates that the ”apparent” strain is no longer linear are identified. Linear-elastic materials and a zero-thickness interface are assumed hence the non-linearity in measured”apparent” strain is due to interface separation. Separation of interface is the first step in thecrack initiation process and this is the beginning of delamination. These conditions are then usedin a linear-elastic finite-element model of the experiment, assuming an orthotropic substrate andan isotropic glue, to calculate the normal stress at the interface. The maximum stress calculatedfrom this numerical analysis is taken to be the cohesive strength of the interface.
3. MethodsThe 4-point SENB specimen is illustrated in figure 3, and the dimensions are given in table 1.In this figure and table a0 is pre-crack length, a is the actual crack length, b is thickness of theglue, c is thickness of the laminate, w is width, and L is the length of the specimen.
37th Risø International Symposium on Materials Science IOP PublishingIOP Conf. Series: Materials Science and Engineering 139 (2016) 012025 doi:10.1088/1757-899X/139/1/012025
2
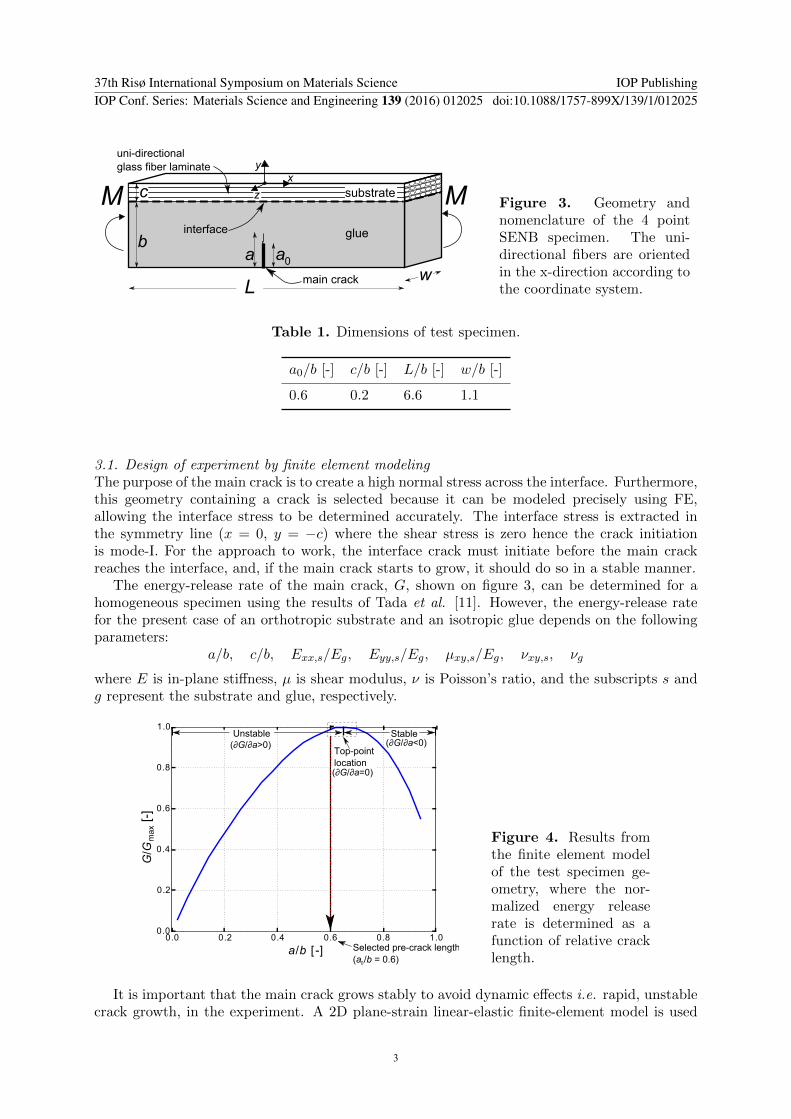
interface
uni-directional glass fiber laminate
ab
c
0a
xy
glue
M Msubstratez
main crackLw
Figure 3. Geometry andnomenclature of the 4 pointSENB specimen. The uni-directional fibers are orientedin the x-direction according tothe coordinate system.
Table 1. Dimensions of test specimen.
a0/b [-] c/b [-] L/b [-] w/b [-]
0.6 0.2 6.6 1.1
3.1. Design of experiment by finite element modelingThe purpose of the main crack is to create a high normal stress across the interface. Furthermore,this geometry containing a crack is selected because it can be modeled precisely using FE,allowing the interface stress to be determined accurately. The interface stress is extracted inthe symmetry line (x = 0, y = −c) where the shear stress is zero hence the crack initiationis mode-I. For the approach to work, the interface crack must initiate before the main crackreaches the interface, and, if the main crack starts to grow, it should do so in a stable manner.
The energy-release rate of the main crack, G, shown on figure 3, can be determined for ahomogeneous specimen using the results of Tada et al. [11]. However, the energy-release ratefor the present case of an orthotropic substrate and an isotropic glue depends on the followingparameters:
a/b, c/b, Exx,s/Eg, Eyy,s/Eg, µxy,s/Eg, νxy,s, νg
where E is in-plane stiffness, µ is shear modulus, ν is Poisson’s ratio, and the subscripts s andg represent the substrate and glue, respectively.
0.0 0.2 0.4 0.6 0.8 1.0
a/b [ -]
0.0
0.2
0.4
0.6
0.8
1.0
Selected pre-crack length(a /b = 0.6)0
Unstable Stable
max
[-]
G/G
(∂G/∂a>0) (∂G/∂a<0)Top-pointlocation(∂G/∂a=0)
Figure 4. Results fromthe finite element modelof the test specimen ge-ometry, where the nor-malized energy releaserate is determined as afunction of relative cracklength.
It is important that the main crack grows stably to avoid dynamic effects i.e. rapid, unstablecrack growth, in the experiment. A 2D plane-strain linear-elastic finite-element model is used
37th Risø International Symposium on Materials Science IOP PublishingIOP Conf. Series: Materials Science and Engineering 139 (2016) 012025 doi:10.1088/1757-899X/139/1/012025
3
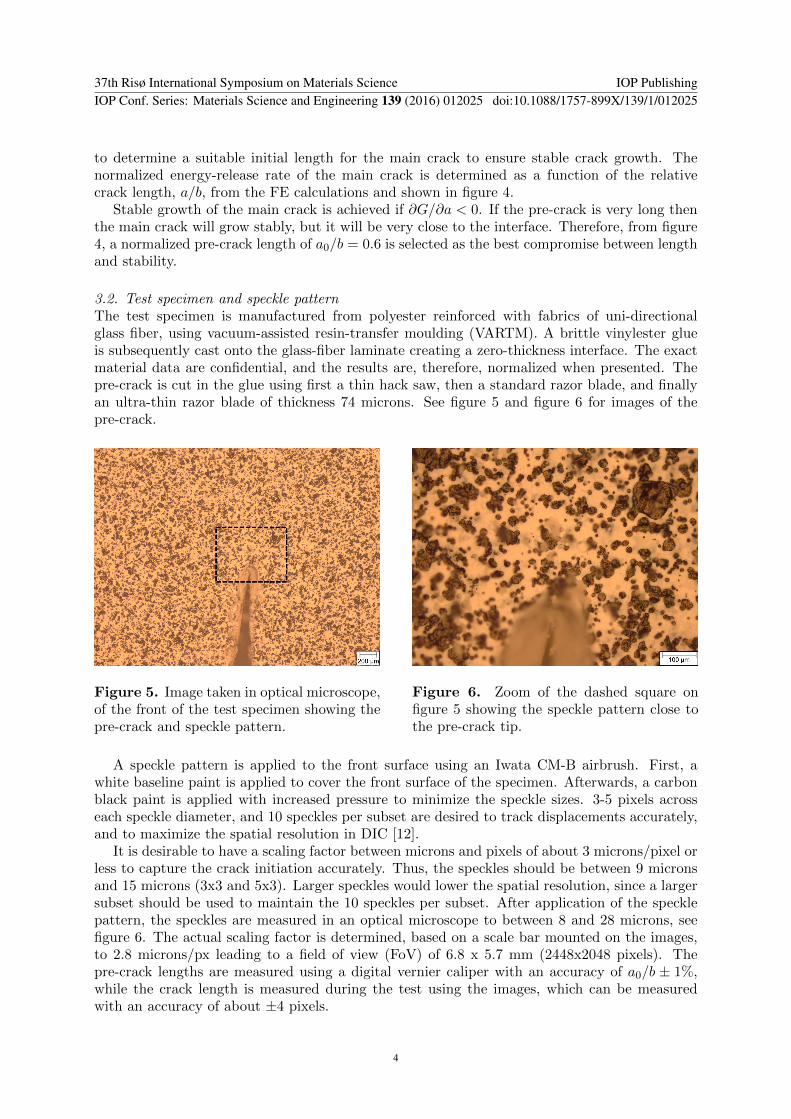
to determine a suitable initial length for the main crack to ensure stable crack growth. Thenormalized energy-release rate of the main crack is determined as a function of the relativecrack length, a/b, from the FE calculations and shown in figure 4.
Stable growth of the main crack is achieved if ∂G/∂a < 0. If the pre-crack is very long thenthe main crack will grow stably, but it will be very close to the interface. Therefore, from figure4, a normalized pre-crack length of a0/b = 0.6 is selected as the best compromise between lengthand stability.
3.2. Test specimen and speckle patternThe test specimen is manufactured from polyester reinforced with fabrics of uni-directionalglass fiber, using vacuum-assisted resin-transfer moulding (VARTM). A brittle vinylester glueis subsequently cast onto the glass-fiber laminate creating a zero-thickness interface. The exactmaterial data are confidential, and the results are, therefore, normalized when presented. Thepre-crack is cut in the glue using first a thin hack saw, then a standard razor blade, and finallyan ultra-thin razor blade of thickness 74 microns. See figure 5 and figure 6 for images of thepre-crack.
Figure 5. Image taken in optical microscope,of the front of the test specimen showing thepre-crack and speckle pattern.
Figure 6. Zoom of the dashed square onfigure 5 showing the speckle pattern close tothe pre-crack tip.
A speckle pattern is applied to the front surface using an Iwata CM-B airbrush. First, awhite baseline paint is applied to cover the front surface of the specimen. Afterwards, a carbonblack paint is applied with increased pressure to minimize the speckle sizes. 3-5 pixels acrosseach speckle diameter, and 10 speckles per subset are desired to track displacements accurately,and to maximize the spatial resolution in DIC [12].
It is desirable to have a scaling factor between microns and pixels of about 3 microns/pixel orless to capture the crack initiation accurately. Thus, the speckles should be between 9 micronsand 15 microns (3x3 and 5x3). Larger speckles would lower the spatial resolution, since a largersubset should be used to maintain the 10 speckles per subset. After application of the specklepattern, the speckles are measured in an optical microscope to between 8 and 28 microns, seefigure 6. The actual scaling factor is determined, based on a scale bar mounted on the images,to 2.8 microns/px leading to a field of view (FoV) of 6.8 x 5.7 mm (2448x2048 pixels). Thepre-crack lengths are measured using a digital vernier caliper with an accuracy of a0/b ± 1%,while the crack length is measured during the test using the images, which can be measuredwith an accuracy of about ±4 pixels.
37th Risø International Symposium on Materials Science IOP PublishingIOP Conf. Series: Materials Science and Engineering 139 (2016) 012025 doi:10.1088/1757-899X/139/1/012025
4
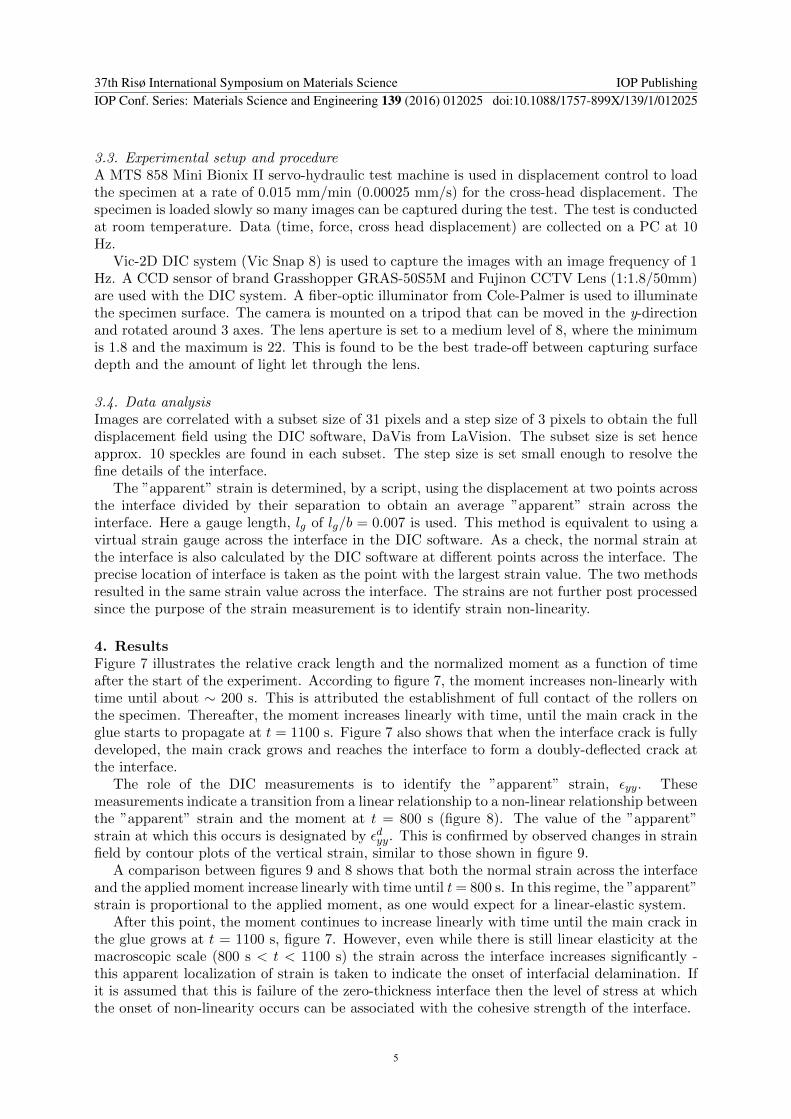
3.3. Experimental setup and procedureA MTS 858 Mini Bionix II servo-hydraulic test machine is used in displacement control to loadthe specimen at a rate of 0.015 mm/min (0.00025 mm/s) for the cross-head displacement. Thespecimen is loaded slowly so many images can be captured during the test. The test is conductedat room temperature. Data (time, force, cross head displacement) are collected on a PC at 10Hz.
Vic-2D DIC system (Vic Snap 8) is used to capture the images with an image frequency of 1Hz. A CCD sensor of brand Grasshopper GRAS-50S5M and Fujinon CCTV Lens (1:1.8/50mm)are used with the DIC system. A fiber-optic illuminator from Cole-Palmer is used to illuminatethe specimen surface. The camera is mounted on a tripod that can be moved in the y-directionand rotated around 3 axes. The lens aperture is set to a medium level of 8, where the minimumis 1.8 and the maximum is 22. This is found to be the best trade-off between capturing surfacedepth and the amount of light let through the lens.
3.4. Data analysisImages are correlated with a subset size of 31 pixels and a step size of 3 pixels to obtain the fulldisplacement field using the DIC software, DaVis from LaVision. The subset size is set henceapprox. 10 speckles are found in each subset. The step size is set small enough to resolve thefine details of the interface.
The ”apparent” strain is determined, by a script, using the displacement at two points acrossthe interface divided by their separation to obtain an average ”apparent” strain across theinterface. Here a gauge length, lg of lg/b = 0.007 is used. This method is equivalent to using avirtual strain gauge across the interface in the DIC software. As a check, the normal strain atthe interface is also calculated by the DIC software at different points across the interface. Theprecise location of interface is taken as the point with the largest strain value. The two methodsresulted in the same strain value across the interface. The strains are not further post processedsince the purpose of the strain measurement is to identify strain non-linearity.
4. ResultsFigure 7 illustrates the relative crack length and the normalized moment as a function of timeafter the start of the experiment. According to figure 7, the moment increases non-linearly withtime until about ∼ 200 s. This is attributed the establishment of full contact of the rollers onthe specimen. Thereafter, the moment increases linearly with time, until the main crack in theglue starts to propagate at t = 1100 s. Figure 7 also shows that when the interface crack is fullydeveloped, the main crack grows and reaches the interface to form a doubly-deflected crack atthe interface.
The role of the DIC measurements is to identify the ”apparent” strain, εyy. Thesemeasurements indicate a transition from a linear relationship to a non-linear relationship betweenthe ”apparent” strain and the moment at t = 800 s (figure 8). The value of the ”apparent”strain at which this occurs is designated by εdyy. This is confirmed by observed changes in strainfield by contour plots of the vertical strain, similar to those shown in figure 9.
A comparison between figures 9 and 8 shows that both the normal strain across the interfaceand the applied moment increase linearly with time until t= 800 s. In this regime, the ”apparent”strain is proportional to the applied moment, as one would expect for a linear-elastic system.
After this point, the moment continues to increase linearly with time until the main crack inthe glue grows at t = 1100 s, figure 7. However, even while there is still linear elasticity at themacroscopic scale (800 s < t < 1100 s) the strain across the interface increases significantly -this apparent localization of strain is taken to indicate the onset of interfacial delamination. Ifit is assumed that this is failure of the zero-thickness interface then the level of stress at whichthe onset of non-linearity occurs can be associated with the cohesive strength of the interface.
37th Risø International Symposium on Materials Science IOP PublishingIOP Conf. Series: Materials Science and Engineering 139 (2016) 012025 doi:10.1088/1757-899X/139/1/012025
5

0.55
0.60
0.65
0.70
0.75
0.80
0.85
0.90
0.95
1.00
a/b
[-]
0 200 400 600 800 1000 12000.2
0.0
0.2
0.4
0.6
0.8
1.0
1.2
1.4
1.6
M/M
[-]
1 mm
1 mma/b=1.0
a/b=0.6
t=1245 s
t=1100 s
Interface
Interface
Deflectedcrack
Initialcracktip
t=1245 s
t=1100 s
(y=-c)
(y=-c)
t=800 s
t=1100 s
d
M / M [ -]a/b [ -]
d
1400
Time, t [s]
Figure 7. Left: Graph showing normalized moment and relative crack length as a function ofelapsed time, t. The vertical blue dashed line indicates the time where the interface crack isfully developed. Right: DIC contour plot of the vertical y-displacement. The top contour plotis at time, t = 1100 s and the bottom contour plot is at time, t = 1245 s, just after the interfacecrack is fully developed. The red dashed line indicate the interface location.
0 200 400 600 800 1000 1200 14000.1
0.0
1.0
2.0
3.0
4.0
5.0
6.0
Str
ain
, yy
[-]
ε
Time, t [s]
t=1244 s
/ε yy
t=1100 s
d
t=800 s
~1.4
"App
aren
t"
Figure 8. DIC: Normalized ”apparent”strain, εyy/ε
dyy, shown as a function of time.
The ”apparent” strain, εyy is normalized bythe value of the ”apparent” strain at the onsetof non-linearity, εdyy. The interface is locatedat y = −c, according to figure 3.
1 mm t=1244 s
Interface(y=-c)
Initialcracktip
Presentcracktip
Interface crackinitiation
-6.0
-4.0
-2.0
0.0
2.0
4.0
6.0
Ve
rtic
al
Str
ain
,yy
[-]
ε/ε y
yd
Figure 9. DIC: Contour plot of the verticalstrain, normalized by the ”apparent” strainat the onset of non-linearity, εdyy, just beforethe main crack grows to the interface (t =1244 s). The initiation of the interface crackis clearly identified. The interface is locatedat y = −c according to figure 3.
37th Risø International Symposium on Materials Science IOP PublishingIOP Conf. Series: Materials Science and Engineering 139 (2016) 012025 doi:10.1088/1757-899X/139/1/012025
6
The cohesive strength of the interface is determined by using an finite-element model (Section3.1) to calculate the value of the normal stress across the interface at the conditions under whichthe onset of a non-linear strain were observed. It is estimated that the time of transition fromlinear to non-linear strain at the interface can be identified to an accuracy of ±50 s, the pre-crack length can be measured to an accuracy of a0/b±1%, and other uncertainties are indicatedby error bars in figure 7. As discussed earlier, the material properties that entered into thiscalculation are confidential information. However, the calculations result in a cohesive strengthfor the interface of:
σ/σg = 0.081 ± 0.007 (1)
Again, owing to the confidential nature of the system, the cohesive strength has been normalizedwith the macroscopic strength of the glue, σg, which was obtained by a uni-directional tensiletest of a dog bone specimen with a gauge length of 115 mm. It would be more appropriate tonormalize with the cohesive strength of the glue, but this is not known.
5. DiscussionThe cohesive strength can be determined with ESEM using a J-integral based approach [6]. Thisapproach requires manufacturing tiny specimens and using specialized and expensive equipment,such as a special fracture mechanics loading stage for ESEM. A benchmark of the new approachwith the ESEM and the J-integral based approach is proposed as a future study.
One of the advantages with the new approach presented in this paper is that there is no needto use advanced scanning-electron microscope equipment, since a standard 4 point bend rig witha DIC camera system can solve the task. During the last decade DIC has become a relativelyeasy, cheap, and efficient tool for measuring in-plane deformations, and it is available in mostlabs at universities [13]. The new approach is not limited to the 4-point SENB specimen, butit can be used with any other test specimen, provided that the interface crack initiation can becaptured by DIC and the interface stress can be accurately determined using a model (e.g. FEor analytical).
The cohesive strength at the interface is extracted in the symmetry line (x = 0, y = −c) ofthe SENB specimen where the shear stress is zero and therefore the crack initiation is mode-I.If the interface crack initiates at other locations along the interface, e.g. due to a defect, thecrack initiation will be mixed mode. This is also confirmed by the FE model.
It is beneficial that the interface crack initiates before the main crack starts to propagate sothat the growth of the main crack does not change the strain field. For an interface cohesive lawwith a high σ it may not be possible to initiate the interface crack, but maybe the test specimencould be optimized further in the future to enable this. Another design of the test specimento determine the cohesive strength could be a SENB geometry with an elliptical notch. Theadvantage of this geometry is that the stress concentration factor would be known, and it willbe harder for the main crack to start growing. This might simplify the analysis. An analysissimilar to that of Cook and Gordon [1] could then be used to determine the optimum distancefrom notch to interface.
6. ConclusionIt can be concluded that the mode-I cohesive strength can be determined using a 4-point SENBtest specimen in combination with 2D DIC measurements and linear-elastic finite elementmodeling. For the material system tested, a normalized cohesive strength is determined toσ/σg = 0.081 ± 0.007, meaning that the interface cohesive strength is about 0.08 of themacroscopic strength of the glue.
37th Risø International Symposium on Materials Science IOP PublishingIOP Conf. Series: Materials Science and Engineering 139 (2016) 012025 doi:10.1088/1757-899X/139/1/012025
7
AcknowledgmentsThanks to the LM Wind Power lab for help manufacturing the test specimens and to Fulbright forsupporting the research stay at the University of Michigan. Special thanks to James Gormanfor his help when conducting the experiments in the lab at the Department of MechanicalEngineering, University of Michigan, Ann Arbor, MI, USA. This research was supported by theDanish Centre for Composite Structure and Materials for Wind Turbines (DCCSM), grant no.09-067212, from the Danish Strategic Research Council (DSF).
References[1] Cook J and Gordon J E 1964 Proc. R. Soc. Lond. A. 10 508[2] He M Y and Hutchinson J W 1989 Int. J. Solids Structures 25 1053[3] Thouless M D, Cao H C and Mataga P A 1989 J. Matls. Sci. 24 1406[4] He M Y, Evans A G and Hutchinson J W 1994 Int. J. Solids Structures 31 3443[5] Parmigiani J P and Thouless M D 2006 J. Mech. Phys. Solids 54 266[6] Goutianos S, Arevalo R, Sørensen B F and Peijs T 2014 Appl. Compos. Mater. 21 805[7] Li V C and Ward R J 1989 Fracture Toughness and Fracture Energy, Mihashi et al. (eds). 183[8] Suo Z, Bao G and Fan B 1992 J. Mech. and Phys. Solids. 40 1[9] Kendall K 1975 Proc. R. Soc. Lond. A. 344 287
[10] Lee W and Clegg W J 1996 Key Engineering Materials 116 193[11] Tada H, Paris P C and Irwin G R 2000 The Stress Analysis of Cracks Handbook 3rd ed (New York: ASME
Press)[12] Crammond G, Boyd S W and Dulieu-Barton J M 2013 Optics and Lasers in Engineering 51 1368[13] Reedlun B, Daly S, Hector L, Zavattieri P and Shaw J 2013 Experimental Techniques 37 62
37th Risø International Symposium on Materials Science IOP PublishingIOP Conf. Series: Materials Science and Engineering 139 (2016) 012025 doi:10.1088/1757-899X/139/1/012025
8

268


Related Documents