Developing the analytic hierarchy Developing the analytic hierarchy process for evaluating alternative process for evaluating alternative early-in-life intervention programs early-in-life intervention programs Fourth National Justice Modelling Workshop Matthew Manning; Professor Ross Homel; Professor Christine Smith

Developing the analytic hierarchy process for evaluating alternative early-in-life intervention programs Fourth National Justice Modelling Workshop Matthew.
Dec 18, 2015
Welcome message from author
This document is posted to help you gain knowledge. Please leave a comment to let me know what you think about it! Share it to your friends and learn new things together.
Transcript
Developing the analytic hierarchy process for Developing the analytic hierarchy process for evaluating alternative early-in-life intervention evaluating alternative early-in-life intervention programsprograms
Fourth National Justice Modelling Workshop
Matthew Manning; Professor Ross Homel;Professor Christine Smith

The Analytic Hierarchy Process (AHP)The Analytic Hierarchy Process (AHP)
Policy decisions using unstructured protocols
Provide results from a study using a method (analytic hierarchy process – operations research) for making structured decisions with respect to early-in-life intervention programs
Measure relative utility values for salient adolescent outcomes resulting from early-in-life intervention programs
Calculate relative priority rankings for alternative early-in-life interventions with respect to their perceived enhancement of non health-related quality of life

Importance of early-in-life interventions on Importance of early-in-life interventions on
individual life trajectoriesindividual life trajectories Early childhood should not be considered a critical period Rather, the first point in a series of important life phases Early-in-life intervention aims to augment a child’s development Early childhood intervention programs (birth to five years) that
employ a risk-focused approach can make positive impacts on outcomes of children who are considered at-risk at an early age (Homel, 2005).
“…initial gains in intellectual and achievement scores, and longer-term outcomes reflecting more successful school experiences…reduction of behavioural problems and delinquency” (Brooks-Gunn, Fuligni, & Berlin, 2003, p.5-9).
Problems faced by policy-makersProblems faced by policy-makers
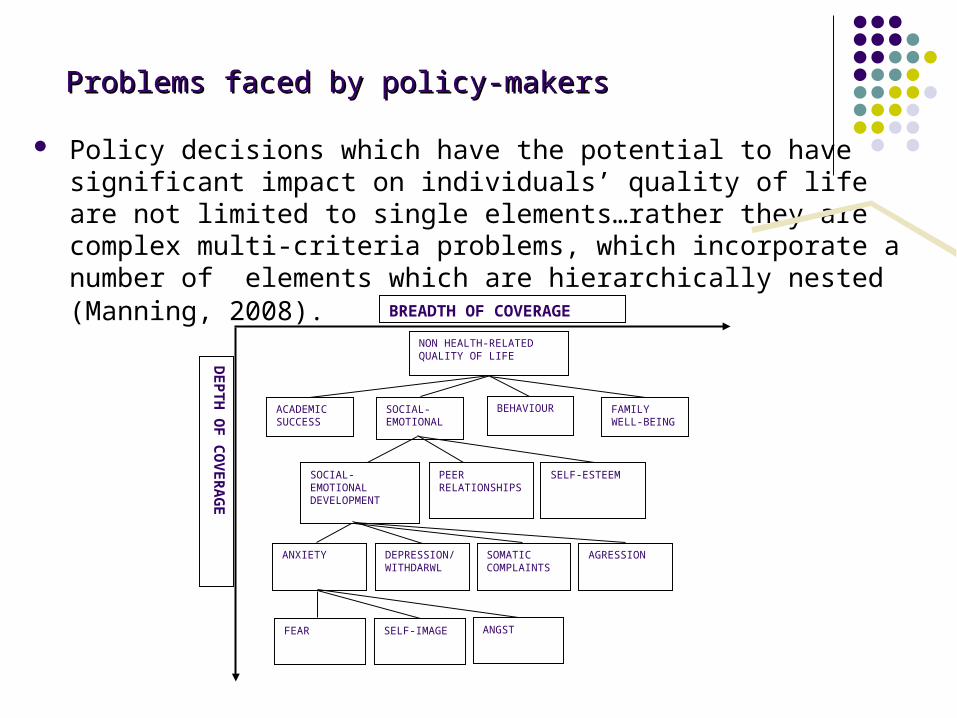
Policy decisions which have the potential to have significant impact on individuals’ quality of life are not limited to single elements…rather they are complex multi-criteria problems, which incorporate a number of elements which are hierarchically nested (Manning, 2008).
BREADTH OF COVERAGE
DE
PT
H O
F C
OV
ER
AG
E
NON HEALTH-RELATED QUALITY OF LIFE
ACADEMIC SUCCESS
SOCIAL-EMOTIONAL
BEHAVIOUR FAMILY WELL-BEING
SOCIAL-EMOTIONALDEVELOPMENT
PEERRELATIONSHIPS
SELF-ESTEEM
ANXIETY DEPRESSION/WITHDARWL
SOMATIC COMPLAINTS
AGRESSION
FEAR SELF-IMAGE ANGST

Decision problemDecision problem
Which early childhood intervention is the most preferred option with respect to its contribution to non health-related quality of life?
Funding issues – what programs and how much? Structured process for making complex multi-criteria decisions
incorporating all salient elements of a decision

The AHP process
Saaty’s (1977) analytic hierarchy approach provides a systematic procedure for representing the elements of a problem, rationally disaggregating the elements into smaller constituent parts, and introducing simple pair-wise comparison judgements for use in developing preference weights for priority ranking alternatives
AHP• Attaining preference/relative utility values - Decisions regarding
alternative early childhood intervention program options and their contribution to increasing non-health related quality of life during the adolescent life phase (goal).
• Through the use of a backward process - determine the actions that are needed to achieve the desired outcome (Alexander & Saaty, 1977b).
• Two assumptions are made in the formation of the hierarchy: (1) each element of a level in a hierarchy is related to other elements in adjacent levels, and (2) no relationship exists between elements on the same level (Cheng & Li, 2001a; Saaty, 1990b).
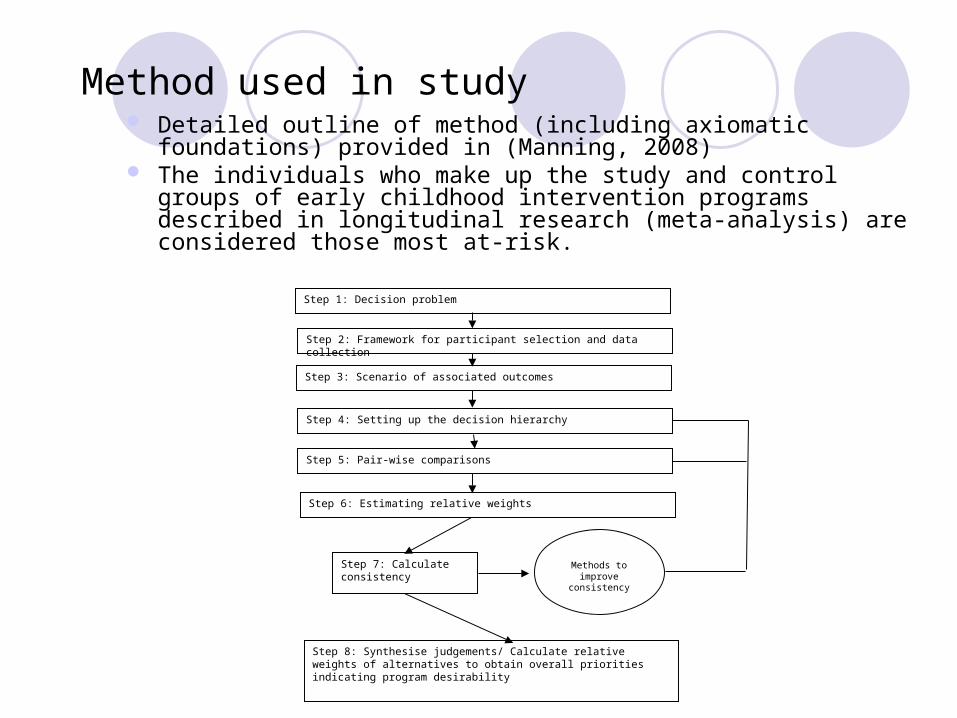
Method used in study Detailed outline of method (including axiomatic foundations)
provided in (Manning, 2008) The individuals who make up the study and control groups of
early childhood intervention programs described in longitudinal research (meta-analysis) are considered those most at-risk.
Step 1: Decision problem
Step 2: Framework for participant selection and data collection
Step 3: Scenario of associated outcomes
Step 4: Setting up the decision hierarchy
Step 5: Pair-wise comparisons
Step 6: Estimating relative weights
Step 7: Calculate consistency
Step 8: Synthesise judgements/ Calculate relative weights of alternatives to obtain overall priorities indicating program desirability
Methods to improve consistency

Decision Problem
Determine, among the alternatives available, the most preferred early childhood intervention program, that is considered, by a series of experts, to have the most potential to enhance non health-related quality of life outcomes (e.g. cognitive development, social-emotional development) during adolescence.

Survey Participants Participants (n = 25) Four distinct stakeholder groups:
1. Policy development group (n=5) (e.g. representatives of Queensland Department of Communities, Department of Child Safety, Queensland Health, Department of Education, Training and the Arts);
2. School level group (n=8) (e.g. school teachers and principals, co-ordinators of childcare centres, and co-ordinators of crèche and kindergartens);
3. Community agencies group (n=7) (e.g. management and senior staff of private community organisations involved in the delivery of community-based developmental intervention programs);
4. Academic group (n=5) (e.g. academic researchers – e.g.
developmental prevention and early education).

Data Collection
Two surveys: Survey 1 (policy development group and the academic
group) related to the strength of the various outcomes (educational success, cognitive development, social-emotional development, deviancy, social participation, criminal justice outcomes, and family wellbeing) with respect to their potential contribution to increased non-health-related quality of life during the adolescent life years.
Participants asked to express preferences among the intensities of the attributes by developing seven matrices that compare outcome levels of success (no effect, small effect, medium effect, high effect, and very high effect) in pairs with respect to each attribute.

Data Collection
Survey 2 (school-level group and the community agencies
group) aimed to determine perceived program standings (structured preschool program, home visitation, centre-based childcare/developmental day care, family support services, and parental education) in pairs with respect to the most desired attribute intensities derived from the first survey.

Scenario of associated outcomes
A meta-analysis was conducted of the longitudinal research on the impact of early childhood interventions on outcomes during the adolescent life phase. Additionally, a detailed analysis of the psychometric properties of outcome measures relating to individuals’ cognitive, social, and emotional development was performed.
HV
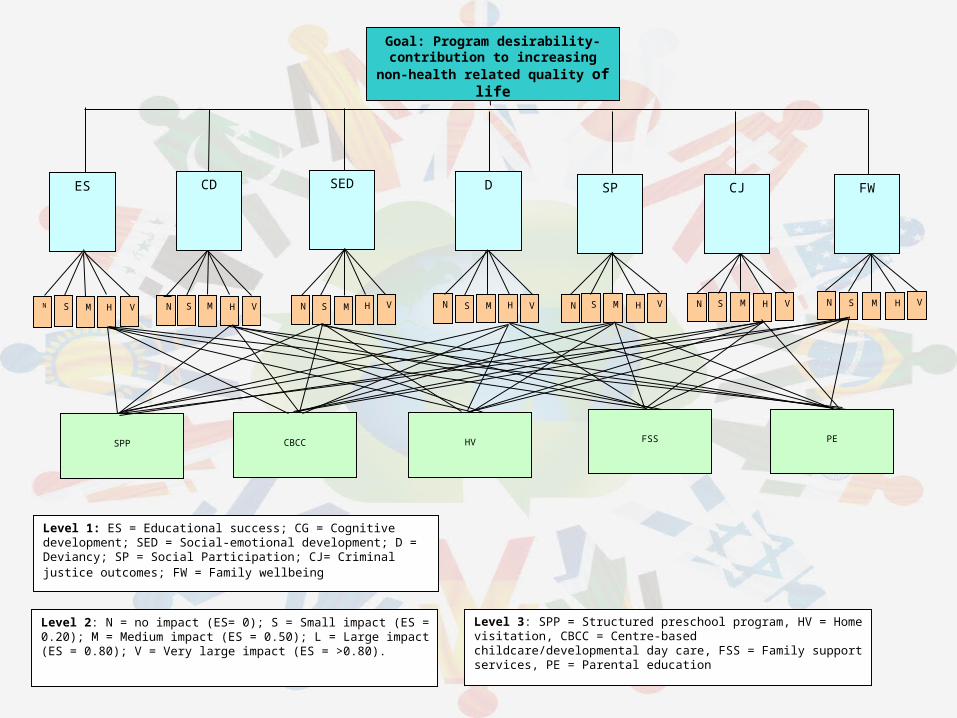
Level 3: SPP = Structured preschool program, HV = Home visitation, CBCC = Centre-based childcare/developmental day care, FSS = Family support services, PE = Parental education
CBCCSPP FSS PE
Level 1: ES = Educational success; CG = Cognitive development; SED = Social-emotional development; D = Deviancy; SP = Social Participation; CJ= Criminal justice outcomes; FW = Family wellbeing
ES
Level 2: N = no impact (ES= 0); S = Small impact (ES = 0.20); M = Medium impact (ES = 0.50); L = Large impact (ES = 0.80); V = Very large impact (ES = >0.80).
SN M H V
CD
N S M H V
SED D SP CJ
N S M H V N S M H V N S M H V N S M H V
FW
N S M H V
Goal: Program desirability- contribution to increasing non-health related quality
of life
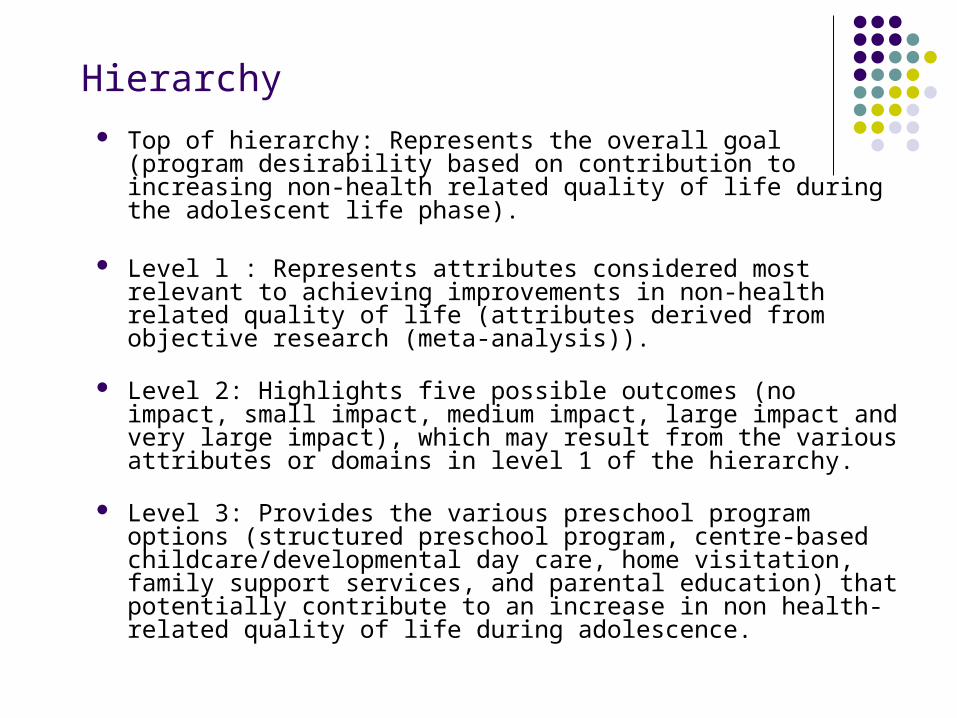
Hierarchy
Top of hierarchy: Represents the overall goal (program desirability based on contribution to increasing non-health related quality of life during the adolescent life phase).
Level l : Represents attributes considered most relevant to achieving improvements in non-health related quality of life (attributes derived from objective research (meta-analysis)).
Level 2: Highlights five possible outcomes (no impact, small impact, medium impact, large impact and very large impact), which may result from the various attributes or domains in level 1 of the hierarchy.
Level 3: Provides the various preschool program options (structured preschool program, centre-based childcare/developmental day care, home visitation, family support services, and parental education) that potentially contribute to an increase in non health-related quality of life during adolescence.

Matrix of outcome domains – Level 1
01.53145.1325.275.620.20
1753/126CJO
7/115/17/16/15/1SP
5/1514/13/14D
374135SED
2/1633/114CD
6/154/15/14/11ES
CJOSPDSEDCDESGoal
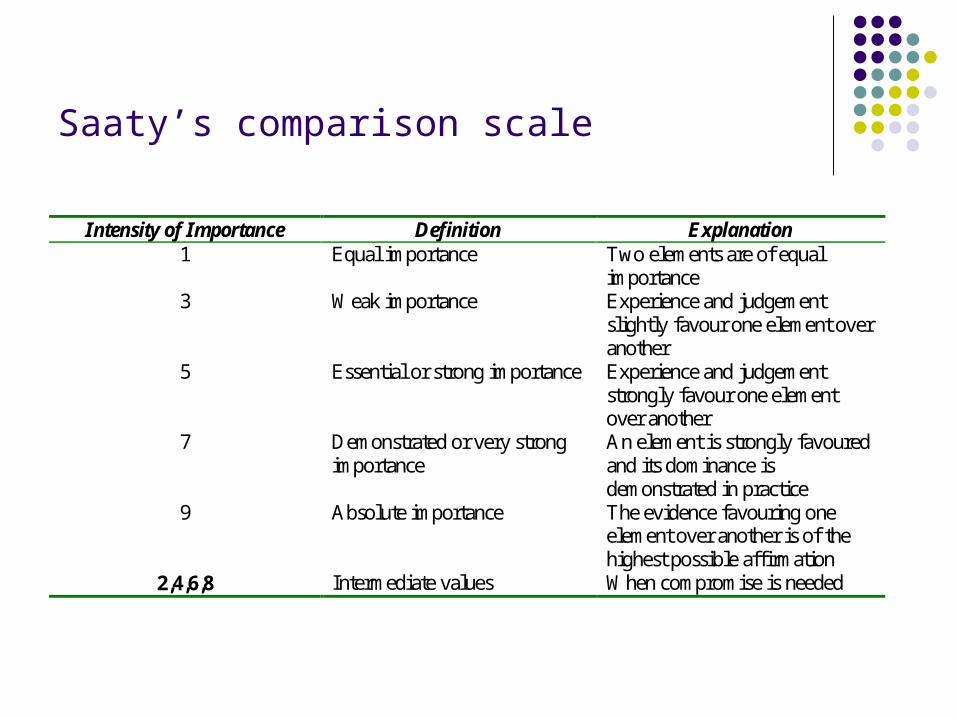
Saaty’s comparison scale
Intensity of Importance Definition Explanation 1 Equal importance Two elements are of equal
importance 3 Weak importance Experience and judgement
slightly favour one element over another
5 Essential or strong importance Experience and judgement strongly favour one element over another
7 Demonstrated or very strong importance
An element is strongly favoured and its dominance is demonstrated in practice
9 Absolute importance The evidence favouring one element over another is of the highest possible affirmation
2,4,6,8 Intermediate values When compromise is needed

Estimating relative weights
Estimating relative weights, calculating consistency of responses, synthesis of judgements, and calculating relative weights of alternatives to obtain overall priorities indicating program desirability were achieved by using method proposed by Saaty (1980).
We contribute to the AHP method by employing a well established method (meta-analysis) for summarising outcomes of longitudinal research. Results of the meta-analysis are then used to develop the hierarchy and also provide respondents with a summary of empirical research to assist them in making decisions that are objective in nature.
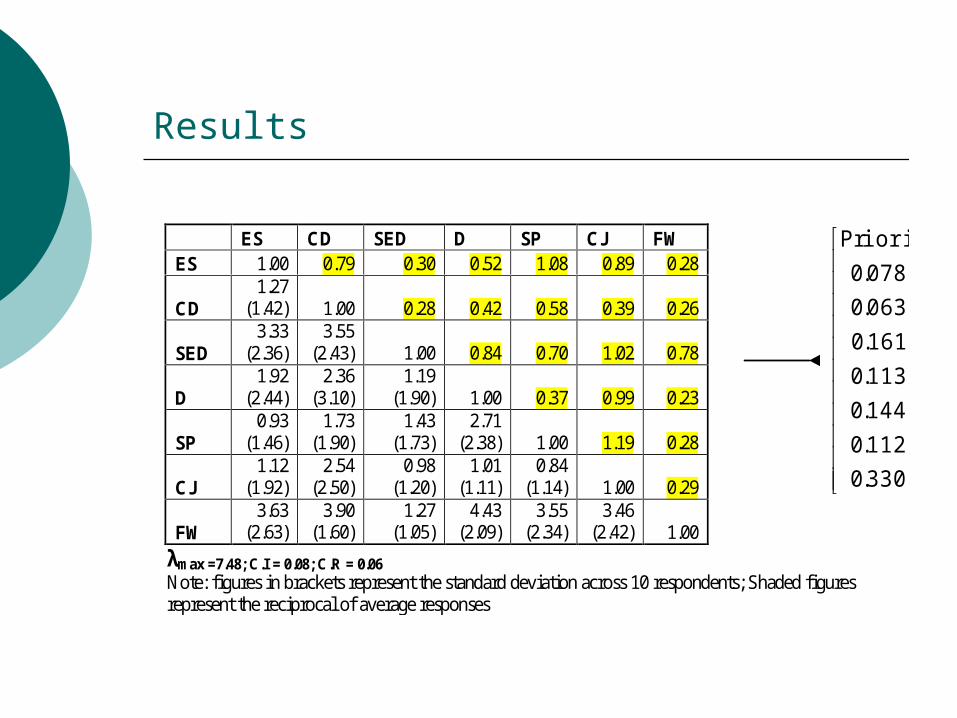
Results
330.0
112.0
144.0
113.0
161.0
063.0
078.0
iorityPr
λmax =7.48; C.I = 0.08; C.R = 0.06 Note: figures in brackets represent the standard deviation across 10 respondents; Shaded figures represent the reciprocal of average responses
ES CD SED D SP CJ FW ES 1.00 0.79 0.30 0.52 1.08 0.89 0.28
CD 1.27
(1.42) 1.00 0.28 0.42 0.58 0.39 0.26
SED 3.33
(2.36) 3.55
(2.43) 1.00 0.84 0.70 1.02 0.78
D 1.92
(2.44) 2.36
(3.10) 1.19
(1.90) 1.00 0.37 0.99 0.23
SP 0.93
(1.46) 1.73
(1.90) 1.43
(1.73) 2.71
(2.38) 1.00 1.19 0.28
CJ 1.12
(1.92) 2.54
(2.50) 0.98
(1.20) 1.01
(1.11) 0.84
(1.14) 1.00 0.29
FW 3.63
(2.63) 3.90
(1.60) 1.27
(1.05) 4.43
(2.09) 3.55
(2.34) 3.46
(2.42) 1.00

Results
0.0780.063
0.161
0.1130.144
0.112
0.330
0
0.05
0.1
0.15
0.2
0.25
0.3
0.35
Outcomepriority
percentage
ES CD SED D SP CJ FW
Adolescent outcomes

Results
0.407
0.498
0.349
0.296
0.374
0.298
0.266
0.087
0.142
0.153
0.095
0.136
0.094
0.112
0.131
0.078
0.091
0.121
0.113
0.088
0.115
0.162
0.109
0.216
0.256
0.175
0.261
0.292
0.213
0.173
0.191
0.232
0.202
0.259
0.215
0%
10%
20%
30%
40%
50%
60%
70%
80%
90%
100%T
ota
l p
erce
nta
ge
each
ou
tco
me
con
trib
ute
s to
pro
gra
m
alte
rnat
ive
SPP CBCC HV FSS PEAlternative early intervention programs
ES CD SED D SP CJ FW

Results
ES CD SED D SP CJ FW Overall ranking of alternatives
Outcome percentage
Alternative percentage

Limitations
Not all elements included into the hierarchy – Further research can construct more detailed hierarchies that incorporated the most relevant indicators of our seven outcome domains (ES, CD, SED, D, CJ, SP, and FW).
Small number of survey respondents Survey limited to constructing priority ranking and
relative utility values for early childhood interventions using a survey participant base limited to Brisbane, Australia.
Bias may be present due to the analyst being the administrator of the survey.
Related Documents