Workshop PifPro’15 in Kraków, October 5, 2015 Dr. Thomas Fehlmann October 5, 2015 © Euro Project Office AG, 2015 Page 1

Welcome message from author
This document is posted to help you gain knowledge. Please leave a comment to let me know what you think about it! Share it to your friends and learn new things together.
Transcript

Workshop PifPro’15 in Kraków, October 5, 2015
Dr. Thomas Fehlmann October 5, 2015
© Euro Project Office AG, 2015 Page 1

Dr. Thomas Fehlmann October 5, 2015
© Euro Project Office AG, 2015 Page 2
1981: Dr. Math. ETHZ
1982-89: Manager Software–Development
1990-95: Senior Consultant – Digital Equipment Corp.
1996-99: Sales Support Manager – Proposal Center
1999ff: Euro Project Office AG, ZürichAkao Price 2001 for original contributions to QFDMember of the Board of QFD Institute Germany – QFD ArchitectChair of SwiSMA, the Swiss Software Metrics Association
2000ff: Six Sigma Black Belt for GMC Software AGLean Six Sigma for Software DevelopmentQuality Function Deployment (QFD) and New Lanchester TheoryNet Promoter Score Associate
2012: Member of the DASMA Board
2013: Vice-President ISBSG

Eberhard Kranich studied Mathematics and Computer Science, with an emphasis on Mathematical Statistics, Mathematical Optimization, and on Theory of Polynomial Complexity of Algorithms. He worked at T-Systems International GmbH in Bonn until 2013, Germany, as a Six Sigma Black Belt and Quality Assurance Manager, mainly in the context of software development.
Dr. Thomas Fehlmann October 5, 2015
© Euro Project Office AG, 2015 Page 3

We will start explaining AHP, apply it for the sample Project X, and then show how this profile can be used for estimating cost based on history of similar projects.
Dr. Thomas Fehlmann October 5, 2015
© Euro Project Office AG, 2015 Page 4
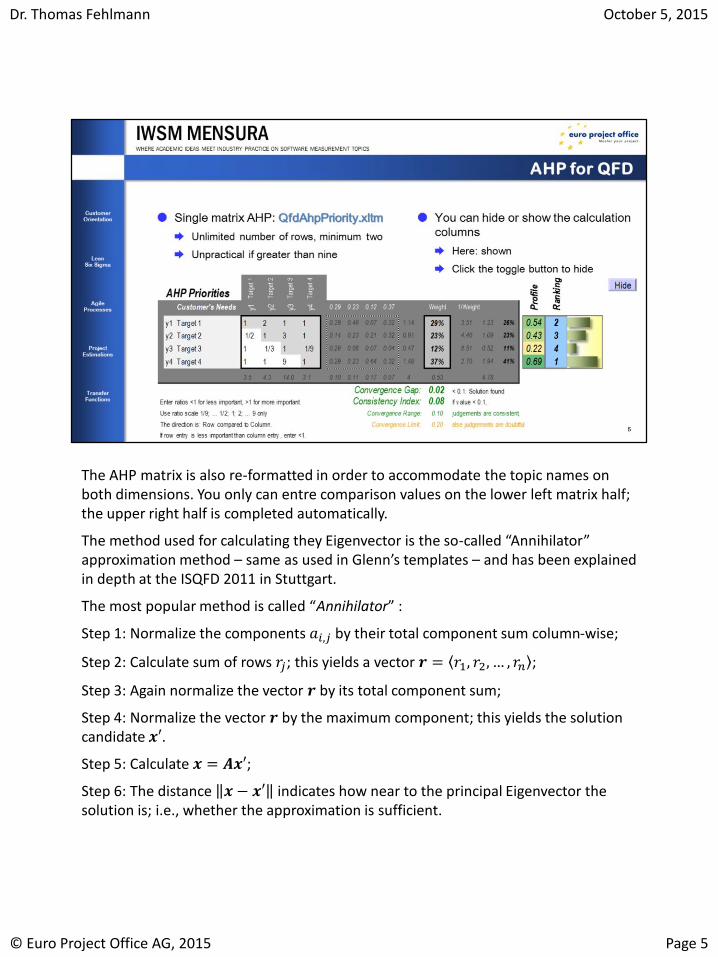
The AHP matrix is also re-formatted in order to accommodate the topic names on both dimensions. You only can entre comparison values on the lower left matrix half; the upper right half is completed automatically.
The method used for calculating they Eigenvector is the so-called “Annihilator” approximation method – same as used in Glenn’s templates – and has been explained in depth at the ISQFD 2011 in Stuttgart.
The most popular method is called “Annihilator” :
Step 1: Normalize the components 𝑎𝑖,𝑗 by their total component sum column-wise;
Step 2: Calculate sum of rows 𝑟𝑗; this yields a vector 𝒓 = 𝑟1, 𝑟2, … , 𝑟𝑛 ;
Step 3: Again normalize the vector 𝒓 by its total component sum;
Step 4: Normalize the vector 𝒓 by the maximum component; this yields the solution candidate 𝒙′.
Step 5: Calculate 𝒙 = 𝑨𝒙′;
Step 6: The distance 𝒙 − 𝒙′ indicates how near to the principal Eigenvector the solution is; i.e., whether the approximation is sufficient.
Dr. Thomas Fehlmann October 5, 2015
© Euro Project Office AG, 2015 Page 5

This view only shows the relevant part for the decision making.
Dr. Thomas Fehlmann October 5, 2015
© Euro Project Office AG, 2015 Page 6

There is also an AHP Hierarchy template, allowing to do model a two-level hierarchy such as the famous one showed earlier.
It requires defining the top level topics that each becomes a 2 × 2 AHP decision matrix or greater. The topics on the second level can then be compared by mapping their local profile weight onto a global profile.
Dr. Thomas Fehlmann October 5, 2015
© Euro Project Office AG, 2015 Page 7

When adding topics on the second level, you simply insert or delete rows in the AHP Summary table. You cannot add or delete the first or last row in a top level group; the restriction applies throughout the QFD tools.
Dr. Thomas Fehlmann October 5, 2015
© Euro Project Office AG, 2015 Page 8
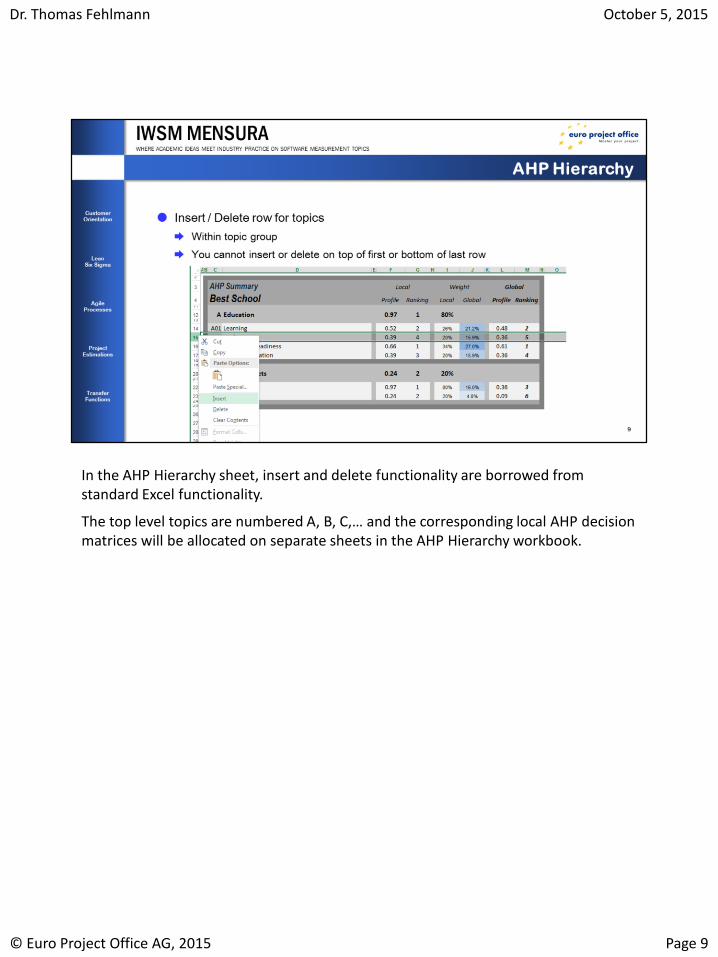
In the AHP Hierarchy sheet, insert and delete functionality are borrowed from standard Excel functionality.
The top level topics are numbered A, B, C,… and the corresponding local AHP decision matrices will be allocated on separate sheets in the AHP Hierarchy workbook.
Dr. Thomas Fehlmann October 5, 2015
© Euro Project Office AG, 2015 Page 9

The results on the second level allows identifying top priorities even for large sets of topic categories, thus identifying the critical few out of large sets of topics.
Dr. Thomas Fehlmann October 5, 2015
© Euro Project Office AG, 2015 Page 10

Top requirements can be selected by limiting the number to be added in further QFD deployments, here for instance to only three out of five topics.
The functionality clearly becomes more important when selecting the seven most important topics out of a few hundred, without having to do hundred times hundred comparisons.
AHP is often used to extract the 72 most important criteria form large customer voice data.
Dr. Thomas Fehlmann October 5, 2015
© Euro Project Office AG, 2015 Page 11

Santillo uses AHP for early and quick counts based on the ISO/IEC 19761 COSMIC standard (Santillo, 2011); thus, it seems very reasonable to use AHP also for measuring PIF. The result of measurement will not be absolute numbers, rather a profile as usual used when working with transfer functions. Beni et al. (Beni, et al., 2011) define four key groups or classes of PIF. These groups define the hierarchy; the resulting profile describes the impact on productivity for each of the PIF.
Each of the fours group splits into a number of subgroups; each subgroup is detailed by some terms and phrases. This structure enables the determination and assessment of those PIF, which are most relevant to a project under consideration.
Dr. Thomas Fehlmann October 5, 2015
© Euro Project Office AG, 2015 Page 12

The measurement subject is a project, in our case, an ICT project. Different projects, especially in different environments, will yield different profiles. The following example of a PIF measurement assesses on a technology-driven project, named “Project X”.
On the top level, we distinguish the relative weights of the four PIF groups Personal, Process, Process, and Technology.
Dr. Thomas Fehlmann October 5, 2015
© Euro Project Office AG, 2015 Page 13

All pairwise comparisons are subject to expert’s judgment only. They will differ for other projects. Since knowledge about technology is key to personal characteristics in the project X, it wins.
Dr. Thomas Fehlmann October 5, 2015
© Euro Project Office AG, 2015 Page 14

The project process relies to a high degree on requirements completeness –something that is hard to achieve in most ICT projects; however, for a technology-driven project it wins in weight against other process characteristics.
Dr. Thomas Fehlmann October 5, 2015
© Euro Project Office AG, 2015 Page 15
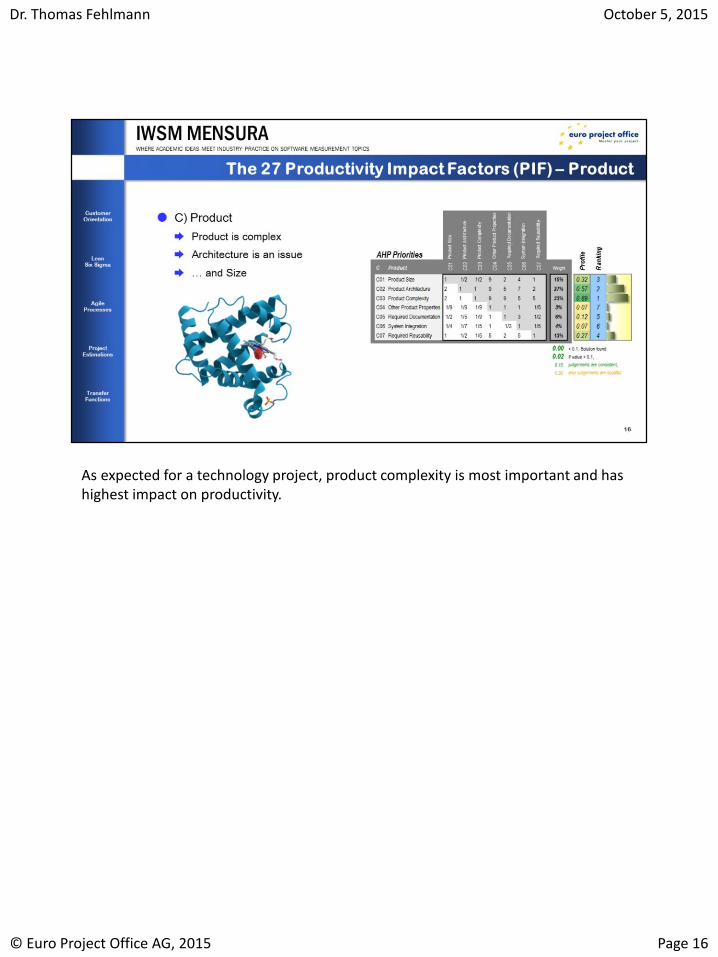
As expected for a technology project, product complexity is most important and has highest impact on productivity.
Dr. Thomas Fehlmann October 5, 2015
© Euro Project Office AG, 2015 Page 16

Ongoing change in technology affects productivity in our sample project X – it constitutes also the major risk.
Dr. Thomas Fehlmann October 5, 2015
© Euro Project Office AG, 2015 Page 17

Dr. Thomas Fehlmann October 5, 2015
© Euro Project Office AG, 2015 Page 18

Combining these AHP decision matrices yields a profile for the 27 PIF. It may not make sense to restrict them to five; all factors might add to cost when the PIF contribute to project estimation. However, it looks more readable when concentrating on the top five.
The overall winner is again D04: Technology Change, followed by D03: Technical Environment and A03: Technology Knowledge, the latter from the group of personal PIF.
This profile is specific to our technology-driven project X. Other ICT projects likely will have different PIF profiles and therefore different cost drivers. Doing such an AHP assessment is almost free when compared to other costs incurred when doing project estimation.
Dr. Thomas Fehlmann October 5, 2015
© Euro Project Office AG, 2015 Page 19

The 22 randomly chosen projects constitute an Estimation Stack. Since all projects contain enough effort types, namely five, the number of estimation items is 22*5=120 in total, giving enough flexibility to align a cost model to this estimation stack. As before, the input value for the getting the cost profile are the logarithms of the efforts in days; consequently, here it means 5.44=ln(231 Days).
After calibration, this estimation stack was able to predict its constituent projects with a convergence gap of only 0.09, based on the mapping from PIF to measured efforts as the transfer function. The cell matrix actually reflect the 𝑎-parameters indicating how strong the impact of each PIF is on each project. The numbers are scaled down to range 0 to 9 using an arbitrary scaling factor.
For more details, consult the authors’ IWSM paper 2012 “Quality of Estimations”.
Dr. Thomas Fehlmann October 5, 2015
© Euro Project Office AG, 2015 Page 20
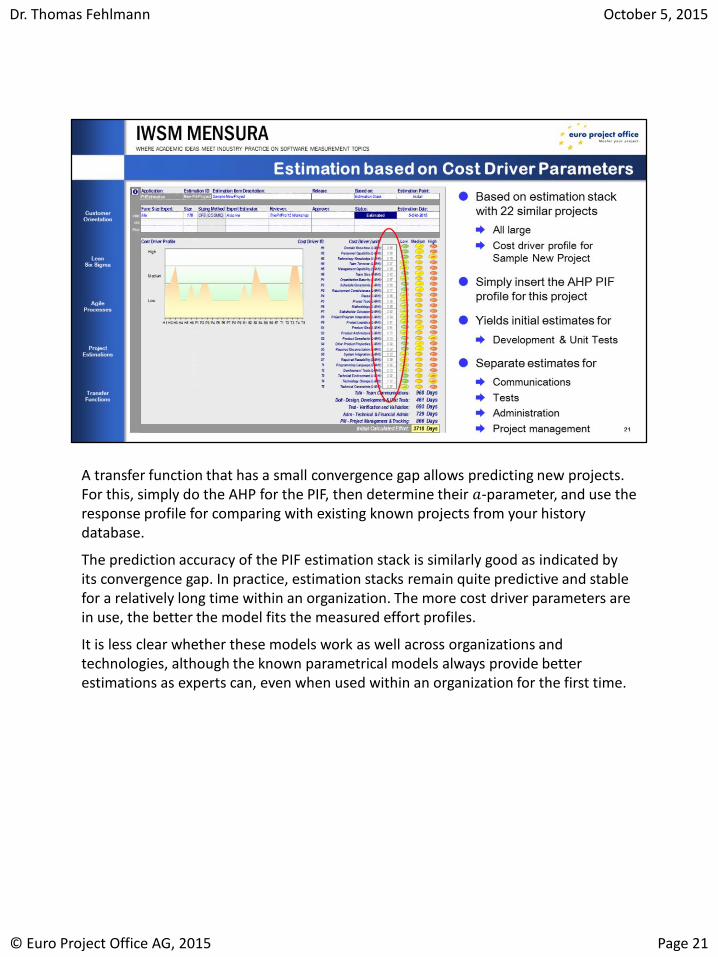
A transfer function that has a small convergence gap allows predicting new projects. For this, simply do the AHP for the PIF, then determine their 𝑎-parameter, and use the response profile for comparing with existing known projects from your history database.
The prediction accuracy of the PIF estimation stack is similarly good as indicated by its convergence gap. In practice, estimation stacks remain quite predictive and stable for a relatively long time within an organization. The more cost driver parameters are in use, the better the model fits the measured effort profiles.
It is less clear whether these models work as well across organizations and technologies, although the known parametrical models always provide better estimations as experts can, even when used within an organization for the first time.
Dr. Thomas Fehlmann October 5, 2015
© Euro Project Office AG, 2015 Page 21

Forget about the Project Delivery Rate (PDR) – use the PIF profile instead forbenchmarking and predicting projects.
The performance impact factors are bound to change – in 2011, the current focus on mobile services was not yet here, and security and privacy was considered less a threat as it is now.
Dr. Thomas Fehlmann October 5, 2015
© Euro Project Office AG, 2015 Page 22

The authors have published quite a bit on the subject – e.g., in QFD symposia, at SW metrics conferences like MetriKon or IWSM / Mensura; also at Lean Six Sigma Conference Glasgow, Strathclyde and in Zurich.
There is a book in in progress for print: "Managing Complexity“. A preprint is available from the authors.
Dr. Thomas Fehlmann October 5, 2015
© Euro Project Office AG, 2015 Page 23
Related Documents