1 12 Advances in Fish Passage Technology Martin Mallen-Cooper Developing Fishways for Nonsalmonid Fishes: A Case Study from the Murray River in Australia Abstract—In the last one hundred years there have been dramatic declines in the range and abundance of native freshwater fish in southeastern Aus- tralia. A major contributing factor to these declines has been the inhibi- tion or prevention of fish passage at more than 1,500 dams and weirs. Additionally, the few fishways that were built at these barriers were based on salmonid designs and were thus not suitable for the Australian fish fauna. To redress the situation, new fishways were designed and built based on laboratory tests with native species using an experimental vertical-slot fishway. The present study concerns the assessment of one of these fish- ways at Torrumbarry Weir on the Murray River. The wide size range (120– 600 mm) of fish ascending the fishway and the reduction in fish density below the weir after the fishway was operational, indicated the success of the fishway. The dominant portion of golden perch Macquaria ambigua (Percichthyidae) and silver perch Bidyanus bidyanus (Terapontidae) mi- grating upstream were immature fish. Field experiments defined diel movement patterns, ascent time, and movement through an experimen- tal tunnel, and demonstrated that the swimming ability of one species in situ was greater than estimates from laboratory experiments. This study emphasizes the significance of four important steps in developing fishways: 1) identifying the species and life stages (and sizes) that are migrating, 2) testing these fish in an experimental fishway, 3) de- signing and building the fishway, and 4) quantitatively assessing the fish- way. Fishways for nonsalmonid fishes have frequently failed because steps 1, 2, and 4 have been ignored. Key Words: vertical-slot, fishway, non-salmonid, Australia, diel, swimming speed.

Welcome message from author
This document is posted to help you gain knowledge. Please leave a comment to let me know what you think about it! Share it to your friends and learn new things together.
Transcript
1
12
Advances in Fish Passage Technology
Martin Mallen-Cooper
Developing Fishways forNonsalmonid Fishes: A Case Study
from the Murray River in Australia
Abstract—In the last one hundred years there have been dramatic declinesin the range and abundance of native freshwater fish in southeastern Aus-tralia. A major contributing factor to these declines has been the inhibi-tion or prevention of fish passage at more than 1,500 dams and weirs.Additionally, the few fishways that were built at these barriers were basedon salmonid designs and were thus not suitable for the Australian fishfauna.
To redress the situation, new fishways were designed and built basedon laboratory tests with native species using an experimental vertical-slotfishway. The present study concerns the assessment of one of these fish-ways at Torrumbarry Weir on the Murray River. The wide size range (120–600 mm) of fish ascending the fishway and the reduction in fish densitybelow the weir after the fishway was operational, indicated the success ofthe fishway. The dominant portion of golden perch Macquaria ambigua(Percichthyidae) and silver perch Bidyanus bidyanus (Terapontidae) mi-grating upstream were immature fish. Field experiments defined dielmovement patterns, ascent time, and movement through an experimen-tal tunnel, and demonstrated that the swimming ability of one species insitu was greater than estimates from laboratory experiments.
This study emphasizes the significance of four important steps indeveloping fishways: 1) identifying the species and life stages (and sizes)that are migrating, 2) testing these fish in an experimental fishway, 3) de-signing and building the fishway, and 4) quantitatively assessing the fish-way. Fishways for nonsalmonid fishes have frequently failed because steps1, 2, and 4 have been ignored.
Key Words: vertical-slot, fishway, non-salmonid, Australia, diel, swimmingspeed.
Martin
Following paper published in: Mallen-Cooper, M. (1999). Developing fishways for nonsalmonid fishes: a case study from the Murray River in Australia. pp. 173-195 in M. Odeh (ed.). Innovations in Fish Passage Technology. (American Fisheries Society: Bethesda, Maryland.)
2
Chapter 12 IntroductionOf the many impacts of river regulation on fish populations, one of themost striking is the disruption of migratory pathways. For many salmo-nid populations barriers to upstream migration of adult fish have beenmitigated with considerable success using fishways (Clay 1995). How-ever, apart from some designs for anadromous clupeids in North America(e.g., Richkus 1974) and France (Larinier 1990), fishways for nonsalmonidfishes have frequently failed (Petts 1984; Welcomme 1989).
In the Murray-Darling river system of southeastern Australia, theimpact of dams and weirs on fish migrations is often cited as one of themajor causes of the dramatic decline in the range and abundance of fresh-water fish (Lake 1971; Cadwallader 1978; Brumley 1987). The migratorynature of native fish in this river system has been known and utilized forharvest by indigenous people for tens of thousands of years (Dargin 1976).All of the 33 species in this drainage need free passage along streams tosome extent and 14 species are known to make large-scale movements(Mallen-Cooper 1989).
The need for fishways was recognized early in the development ofriver regulation in Australia (Stead 1914). In the Murray-Darling riversystem, 22 fishways were built from 1930 to 1989 (Mallen-Cooper 1989),although this is a small number in proportion to the over 1,500 dams andweirs estimated to be on the main streams of this system (New SouthWales Department of Land and Water Conservation, unpublished data).Unfortunately, the fishways were based on salmonid designs from theNorthern Hemisphere and were not suitable for the native fish fauna,which is entirely nonsalmonid (Mallen-Cooper and Harris 1990). Theslopes of these fishways, commonly between 1:8 and 1:5, were also steeperand thus more turbulent than those frequently used for salmon (Mallen-Cooper 1989).
Initial research on fishways in Australia focused on the passage offish within coastal fishways in eastern Australia (Kowarsky and Ross 1981;Beumer and Harrington 1982; Russell 1991). One report for the Murray-Darling river system summarized fish passage through one fishway(Langtry 1940, in Cadwallader 1977). Harris (1984) reported that the fish-ways in coastal southeastern Australia were poorly maintained and sug-gested that the designs were ineffective for native fish. These studies didnot assess the number of fish attempting to migrate nor did they manipu-late water velocities within these fishways to assess the swimming abilityof the fish.
Following advice from Eicher (1982), the suitability of a vertical-slotfishway was investigated using laboratory models (Mallen-Cooper 1992,1994). At least two native species, golden perch Macquaria ambigua(Percichthyidae) and silver perch Bidyanus bidyanus (Terapontidae) fromthe Murray-Darling river system could ascend this type of fishway if wa-ter velocities were less than typical velocities for salmonid designs.
Based on design criteria developed in the laboratory, eight new ver-tical-slot fishways were built. The first in the Murray-Darling river sys-tem was completed at Torrumbarry Weir on the Murray River in Febru-ary 1991. Previously, the weir had prevented fish from getting access toover 350 km of upstream river habitat. The fishway is the longest—at 131m—in Australia; it contains 38 pools and surmounts a 6.5 m high weir.
3
Mallen-CooperThe objectives of the present study were to assess the effectivenessof this new vertical-slot fishway, and to validate and refine the laboratorydata in the field. In so doing, it provides a case study for developing fish-ways for nonsalmonid fishes.
Methods
Study area
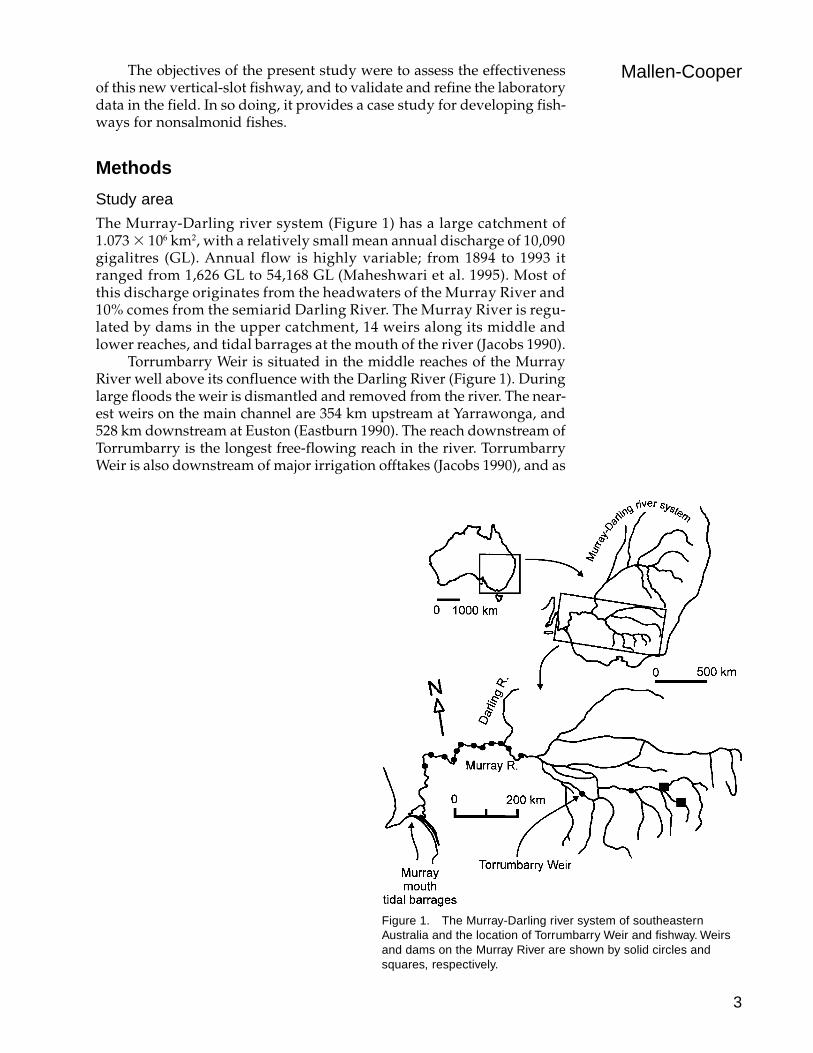
The Murray-Darling river system (Figure 1) has a large catchment of1.073 3 106 km2, with a relatively small mean annual discharge of 10,090gigalitres (GL). Annual flow is highly variable; from 1894 to 1993 itranged from 1,626 GL to 54,168 GL (Maheshwari et al. 1995). Most ofthis discharge originates from the headwaters of the Murray River and10% comes from the semiarid Darling River. The Murray River is regu-lated by dams in the upper catchment, 14 weirs along its middle andlower reaches, and tidal barrages at the mouth of the river (Jacobs 1990).
Torrumbarry Weir is situated in the middle reaches of the MurrayRiver well above its confluence with the Darling River (Figure 1). Duringlarge floods the weir is dismantled and removed from the river. The near-est weirs on the main channel are 354 km upstream at Yarrawonga, and528 km downstream at Euston (Eastburn 1990). The reach downstream ofTorrumbarry is the longest free-flowing reach in the river. TorrumbarryWeir is also downstream of major irrigation offtakes (Jacobs 1990), and as
Figure 1. The Murray-Darling river system of southeasternAustralia and the location of Torrumbarry Weir and fishway. Weirsand dams on the Murray River are shown by solid circles andsquares, respectively.
4
Chapter 12 such the streamflow downstream of the weir does not suffer the invertedseasonality of more regulated upstream sites. Instead, the river retainssome of its natural flow regime of high flows in spring and low flows inautumn, although total monthly flows are much reduced (Close 1990).
Description of fishway
Torrumbarry fishway is a pool-type fishway with vertical-slot baffles. Thefishway is 2 m wide and 1.1 m deep for most of its length, and its courseresembles an inverted “Z.” The pools are 3 m long by 2 m wide and thebaffles are similar to the “Seton Creek” single-slot design in Clay (1995),and details are provided by Mallen-Cooper (1993). The head differencebetween pools is 0.165 m providing a maximum water velocity of 1.8 m/s,which was derived directly from laboratory experiments (Mallen-Cooper1994). Turbulence, or energy dissipation, in the pools averages 105 W/m3,calculated as in White and Penino (1980) in units of power.
Torrumbarry Weir has a concrete apron on the downstream side,which is a barrier to fish movement at low tailwater levels. To alleviatethis problem, the fishway has two entrances: one at the downstream edgeof this apron to accommodate low tailwater levels and one adjacent to theweir to accommodate high tailwater levels when the apron is submerged.The lower pools of the fishway are also deeper (up to 1.83 m) to accom-modate some tailwater variation. The lower third of the fishway, on theconcrete apron, is connected to the higher entrance with a 22 m long, 1.5m wide channel with no baffles.
Fishway performance: distribution and passage of migratory fish
River sampling
To assess the effect of the fishway on the distribution of migratory fish,three sites were selected in the Murray River: 35 km above TorrumbarryWeir, immediately (,1 km) below Torrumbarry Weir, and 6 km belowTorrumbarry Weir. The most upstream site was chosen to be above theweir pool and in flowing water habitat comparable to the two down-stream sites. The site immediately below the weir was chosen to detectfish migrating upstream and accumulating below the weir. The mostdownstream site was chosen to avoid any local effect of the weir onfish moving upstream and so provide a comparison with the other twosites.
The three sites were sampled monthly between January 1990 andJune 1992, on separate and contiguous days. Six gill nets (two replicatesof 38, 62, and 100 mm stretched mesh) and two fyke nets (two replicatesof 20 mm square mesh) were used at each site. Each replicate of nets wasset on opposite sides of the river and within 200 m; the nets were evenlyspaced along each bank and the sequence of nets was random. Nets wereset for 14–17 h, from 2 h before dusk to at least 2 h after dawn. All cap-tured fish were identified and measured for fork length, or total lengthfor the two round-tailed fishes (Macquaria ambigua, Murray codMacullochella peelii peelii). Catch rates were standardized to 14 h by theproportional change in sampling time. Temperature, dissolved oxygen,and river flow were recorded at each site. The sampling regime provided
5
Mallen-Cooperstandardized catch rates between the three sites and an estimate of rela-tive fish density. The completion of the fishway in February 1991 pro-vided 13 monthly netting samples before, and 17 samples after, the fish-way became operational.
There were three hypotheses associated with this sampling:H1: Before installing the fishway and during migratory periods, there
will be higher relative densities of fish immediately below theweir compared to 6 km downstream.
H2: Before installing the fishway, there will be lower relative densi-ties of fish 35 km above the weir compared with the site 6 kmdownstream of the weir.
H3: After the fishway is operating there will be no difference in therelative fish density between the three sites.
To identify significant differences in relative fish density between thethree netting sites, a two-way analysis of variance (ANOVA) of log-trans-formed data using time (month) and site (35 km above, ,1 km below, and 6km below weir) as factors was used. To identify which site has the greatestrelative fish abundance (P , 0.05) for each species in each month, one-wayANOVAs were used followed by least significant difference (LSD) tests.
Monthly two-day sample of the fishway entrance
The fishway entrance was sampled to help identify fish that were migrat-ing upstream during the sampling with nets, provide a check on the se-lectivity of the nets, and identify fish that were not able to ascend thefishway. A single cone-trap was used at the entrance for two periods of 22h, concurrent with the monthly netting samples. Water flow through thefishway was reduced so that the head loss at the entrance baffle was low-ered from 165 mm to 80–100 mm. This enabled smaller fish to enter, po-tentially providing a more comprehensive sample of the migratory fishcommunity.
Daily sampling of fish reaching the top of the fishway
A cage, 2 m square and 1.1 m deep with a cone-trap, was installed at thetop of the fishway. Beginning in February 1991, permanent staff (Goulburn-Murray Water) at the weir monitored fish collected in the trap each week-day; the present study includes data up until June 1992.
I also collected independent samples of fish entering the fishwayand ascending the fishway on paired days when high numbers of fishwere migrating. One-tailed Kolmogorov–Smirnov tests for large sampleswere used to compare the size distribution of each species at the two loca-tions in the fishway.
Fishway performance: experimental manipulations of the fishway
General method
Four aspects of fish behavior (escapement from cone-traps, passage thougha tunnel, diel movement, and fallback) and three aspects of swimmingability (maximum water velocity negotiated, velocity negotiated in a chan-nel, and ascent time) were investigated by experimental manipulations ofthe fishway to assess its performance and validate the earlier laboratorydata. The experiments were done between January 1993 and March 1993.
6
Chapter 12 The general method was to dewater the fishway and remove all fish,set up an experimental condition (e.g., tunnel, diel period) in the fishwayand then run the experiment allowing fish to enter freely from the river.Cone-traps prevented fish from leaving the fishway once they had en-tered and the fish were not handled in any way until the end of eachexperiment, when all fish were identified, counted, and measured. Thefishway was dewatered to collect fish and all cone-trap exits were cov-ered with wire mesh before dewatering to prevent increased escapementfrom stressed fish. To reduce variances, statistical analysis within an ex-periment was limited to species with at least five individuals in each rep-licate.
This method was developed as preliminary experiments in the fish-way showed that to obtain realistic responses from fish they could not becaptured and transported to the fishway. For most species, screens alsocould not be used to accumulate fish below the fishway.
Escapement from cone-traps
Escapement of fish was tested for two types and locations of cone-traps:a) The cone-trap within the cage at the top of the fishway. The open-
ing of the cone was 300 mm wide 3 1,400 mm high and taperedover 1.3 m to a 100 mm wide by 350 mm high exit. The cage andcone-trap were covered with 25 mm square mesh but were lateradditionally covered with 20 3 15 mm “birdwire.” The cage wasset in the still water of the impoundment.
b) The cone-trap within the fishway. This had a 530 mm wide 3 900mm high opening tapering over one meter to a 180 mm wide 3330 mm high exit. This was covered in 20 3 15 mm “birdwire.” Asingle cone-trap and a double cone-trap using two cells of theishway were tested.
Fish were allowed to enter the fishway for 24 h and pass through thecone-trap being tested. Flat screens were then placed across the verticalslot, two pools below the cone-trap. Fish were cleared from these twopools using a two-pole dip-net that was the width of the channel. Oncecleared, the test period began. At the end of each period, fish were clearedfrom the same two pools, representing escaped fish, and from above thecone-trap, representing fish that did not escape.
The cone-trap in the cage was tested for escapement of fish over 20min, which was applicable to the ascent time trial; and over 22 h, whichwas applicable to the standard daily monitoring of the fishway. The singleand double cone-traps in the fishway were tested for periods of 5 h, corre-sponding to the shortest time period in the swimming ability experiments;and 23 h, longer than the maximum periods in the swimming ability andtunnel experiments.
Passage through a tunnel
To test the effect of tunnels on the passage of fish, three cells of the fish-way were covered with black plastic creating a 9-m-long tunnel with nodetectable light in the middle cell. Single cone-traps were placed one bafflebelow the tunnel, to capture fish that approached the tunnel but did notenter, and at the upper end of the tunnel. Fish entering the fishway wereexposed to the tunnel for 18.5 h, enabling fish species moving in different
7
Mallen-Cooperdiel periods to be sampled. The lower cone-trap was then covered withwire mesh and the fishway was run for an additional 1.5 h, enabling fishthat had just entered the fishway to attempt to negotiate the tunnel. Oth-erwise, these fish would be included in the sample of fish that were un-able to negotiate the tunnel.
As a control, the same procedure was done with no tunnel, that is,with cone-traps but no black plastic. These two treatments, tunnel and notunnel, were tested on consecutive days and randomized within the two-day block. The block was replicated three times and a paired t-test wasapplied to the log-transformed data.
Diel movement and fallback
The fishway entrance was monitored with a single cone-trap for threedays during five different periods of the day: dawn (2 h), morning (tillmidday), afternoon (after midday), dusk (2 h), and night. Light intensity(Lux) was measured with a light meter at the beginning and end of eachdiel period. Catch data were standardized for each species and for eachdiel period, to the daily proportion of fish per hour. That is, the number offish within a diel period was divided by the total number of fish for theday and by the number of hours in that period.
I also observed some bony herring Nematalosa erebi moving back downthe fishway at the end of daylight. To quantify this movement I trappedbony herring entering the fishway on three separate days; then at night Ichecked the number that had ascended the fishway and the number thathad moved back down the fishway.
Maximum water velocity negotiated
The maximum water velocity negotiated by fish ascending theTorrumbarry fishway was tested by changing the head loss (or step height)of water across one baffle within the fishway. Head loss is a major crite-rion used in designing fishways, and water velocity is directly related tohead loss by the following equation (Vennard and Street 1982):
V 5 Cd.(2g. Dh)0.5
where V 5 velocity (m/s)Cd 5 coefficient of discharge (1.0 [Clay 1995])g 5 acceleration due to gravity (9.8 m?s21?s22)Dh 5 head loss (m)
The head loss across a baffle was changed by adjusting the flow ofwater using a dewatering gate at the top of the fishway and by changingthe slot width (to a minimum of 130 mm) with plywood and a clamp.Head loss was measured to 62 mm with piezometer tubes.
Two cone-traps were placed above and below the test baffle and thewater velocity adjusted. This procedure could take 30 min, so the exit ofthe lowest cone-trap was covered with wire mesh to prevent fish enteringthe fishway while water velocities were low. Once the correct water ve-locity was achieved, the wire mesh was removed from the lowest cone-trap and fish could enter the fishway for 16–19 h. (In the laboratory ex-periments only 20 min was used but this proved insufficient in the field.)At the end of this period the wire mesh was replaced on the lowest cone-trap, and the fishway continued to run for 2 h, similar to the tunnel ex-periment.
8
Chapter 12 To accommodate the diel movement period of bony herring, the ex-periments were done during daylight, and the initial sampling period wasreduced to 3 h. This was followed by the same 2 h period with the lowestcone-trap covered.
Probit analysis was used to model the proportion of fish negotiatingeach water velocity tested. Low-velocity data points in which less than100% of fish negotiated the fishway baffle were excluded from the analy-sis, if 100% of fish had negotiated a higher velocity. The assumption hereis that if fish can negotiate a higher velocity then it is some factor otherthan swimming ability that results in fewer fish negotiating a lower ve-locity. To assess if reducing the slot width reduced fish movement, theminimum slot width (130 mm) was tested at a low water velocity, whereswimming ability was not limiting fish passage.
Water velocity negotiated in a channel
To assess the water velocities negotiated by fish within the 22 m long con-necting channel, a Marsh McBirney 201D current meter was used at onecross-section in the middle of the channel. Water velocity was measuredat three depths (surface, middle, bottom) at each of three points (left handedge, middle, right hand edge).
Ascent time
During a bony herring migration, I monitored ascent time during theday. After clearing the fishway of fish, the two downstream slots at thefishway entrance were blocked with flat screens for 1 h to attract bonyherring to the entrance. The screens were then lifted and the cage atthe top of the fishway was checked every 30 min for 6 h. Removal offish from the cage took 2.25 min, and a flat screen covered the end ofthe fishway during this period to prevent ascending fish escaping intothe impoundment. The 6-h procedure was repeated three times overthree days.
Results
Species composition and distribution in the river and fishway
A total of seven native species and four nonnative species were collected(Table 1). All species caught in the river used the fishway except for onenonnative species, goldfish. Redfin perch did not use the fishway duringstandard sampling, but high numbers of juvenile redfin perch entered thebase of the fishway during experiments in 1993.
Fish abundance above and below the weir and fish passage through thefishway
Golden perch, silver perch, bony herring, carp, and redfin perch showedvery significant differences in relative densities with time (P , 0.0001)and, excepting redfin perch, between sites within the same month (P ,0.0001). Relative fish density was lower in the upstream site (35 km above)compared to the downstream site (6 km below) on only one occasion (Janu-ary 1990) for one species (golden perch). The only other significant differ-
9
Mallen-Cooper
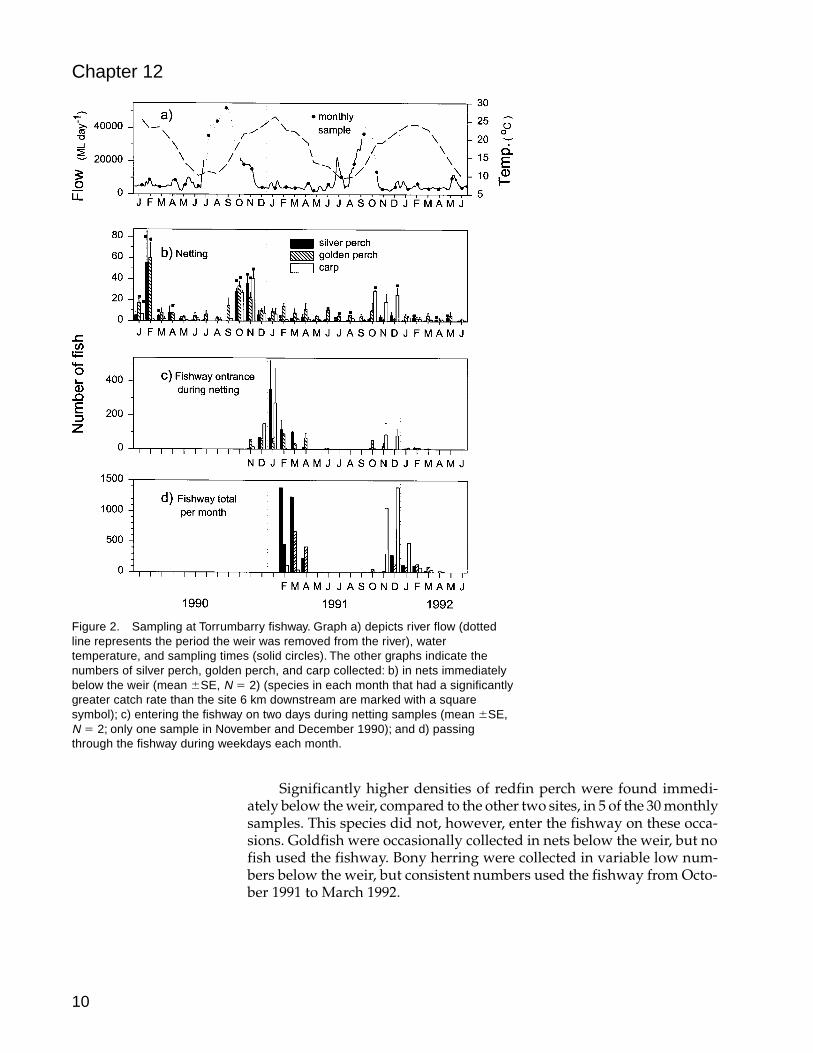
ences in catches of native fish involved higher catches less than 1 km be-low the weir, compared to 35 km above and 6 km below the weir. Figure2 displays catches in the downstream sites and the fishway for the threemost common species, combined with environmental data.
The fishway was completed and began operating in February 1991.The base of the fishway could be used for sampling from November1990. However, the cone-trap was moved by large carp, once in No-vember 1990 and again in December 1990, which left only one sampleeach for these two months. Subsequently, the cone-trap was held inplace with clamps.
High relative densities of silver perch, golden perch, and carp im-mediately below the weir were recorded in February, October, and No-vember of 1990, prior to completion of the fishway (Figure 2). There wereonly minor increases in the density of silver perch and golden perch be-low the weir after the fishway was operating. From December 1990 toApril 1991 the low densities of these two species and carp below the weircoincided with high numbers of these species using the fishway. Carp inDecember 1991 provide the only sample where there was a high densityof fish below the weir with fish using the fishway.
For silver perch and carp in November 1990 and for carp in October1991 there were high numbers below the weir with very low numbersentering the fishway. During these two monthly samples there were alsohigh flows which submerged the lower half the fishway.
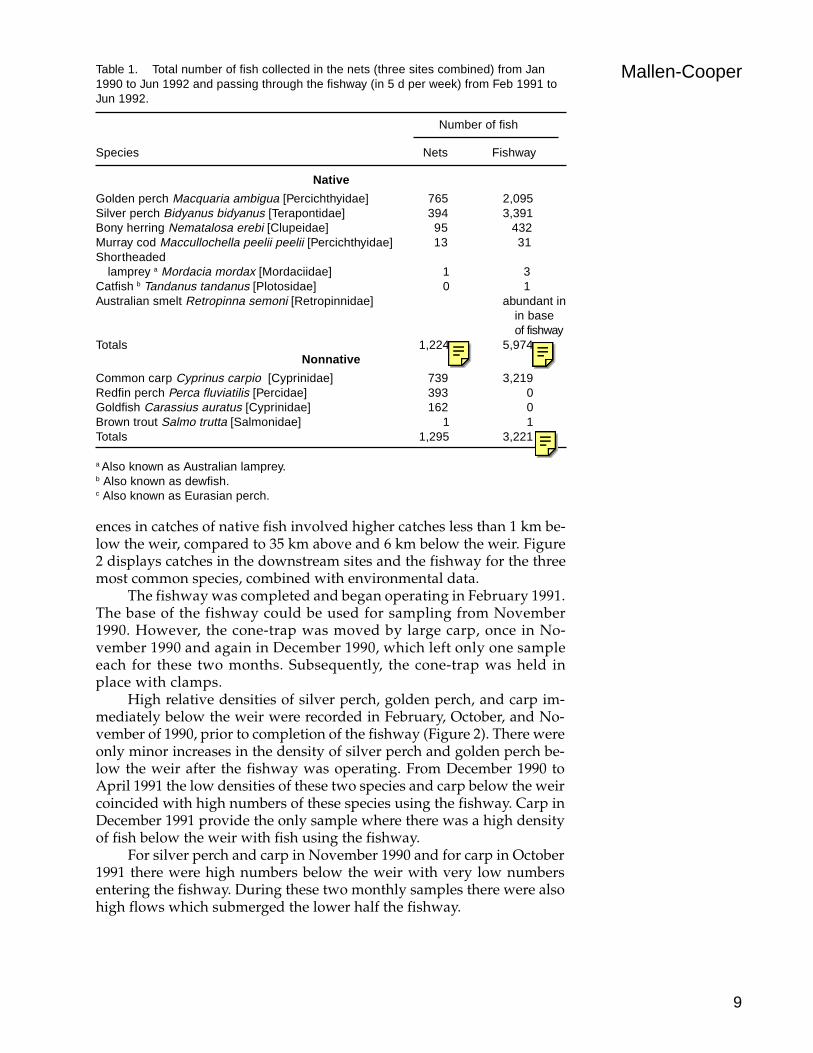
Table 1. Total number of fish collected in the nets (three sites combined) from Jan1990 to Jun 1992 and passing through the fishway (in 5 d per week) from Feb 1991 toJun 1992.
a Also known as Australian lamprey.b Also known as dewfish.c Also known as Eurasian perch.
Native
Golden perch Macquaria ambigua [Percichthyidae] 765 2,095Silver perch Bidyanus bidyanus [Terapontidae] 394 3,391Bony herring Nematalosa erebi [Clupeidae] 95 432Murray cod Maccullochella peelii peelii [Percichthyidae] 13 31Shortheaded
lamprey a Mordacia mordax [Mordaciidae] 1 3Catfish b Tandanus tandanus [Plotosidae] 0 1Australian smelt Retropinna semoni [Retropinnidae] abundant in
in baseof fishway
Totals 1,224 5,974Nonnative
Common carp Cyprinus carpio [Cyprinidae] 739 3,219Redfin perch Perca fluviatilis [Percidae] 393 0Goldfish Carassius auratus [Cyprinidae] 162 0Brown trout Salmo trutta [Salmonidae] 1 1Totals 1,295 3,221
Species Nets Fishway
Number of fish
Martin
1268 - correction to total
Martin
5953 - correction to total
Martin
3220 - correction to total
10
Chapter 12
Significantly higher densities of redfin perch were found immedi-ately below the weir, compared to the other two sites, in 5 of the 30 monthlysamples. This species did not, however, enter the fishway on these occa-sions. Goldfish were occasionally collected in nets below the weir, but nofish used the fishway. Bony herring were collected in variable low num-bers below the weir, but consistent numbers used the fishway from Octo-ber 1991 to March 1992.
Figure 2. Sampling at Torrumbarry fishway. Graph a) depicts river flow (dottedline represents the period the weir was removed from the river), watertemperature, and sampling times (solid circles). The other graphs indicate thenumbers of silver perch, golden perch, and carp collected: b) in nets immediatelybelow the weir (mean 6SE, N 5 2) (species in each month that had a significantlygreater catch rate than the site 6 km downstream are marked with a squaresymbol); c) entering the fishway on two days during netting samples (mean 6SE,N 5 2; only one sample in November and December 1990); and d) passingthrough the fishway during weekdays each month.
11
Mallen-CooperFish migration and river flow
Golden perch, silver perch, and carp migrated upstream during relativelylow flows and moderately high flows. For example, these species enteredthe fishway in high numbers in January 1991 (Figure 2c) when the flowwas 3,796 ML/d (exceeded 67% of the time on a flow duration curve forthe period of record, data from the Murray-Darling Basin Commission)and were accumulating below the weir in October 1990 when the flowwas 18,025 ML/d (exceeded 25% of the time).
Comparison of species and size of fish at the top and bottom of the fishway
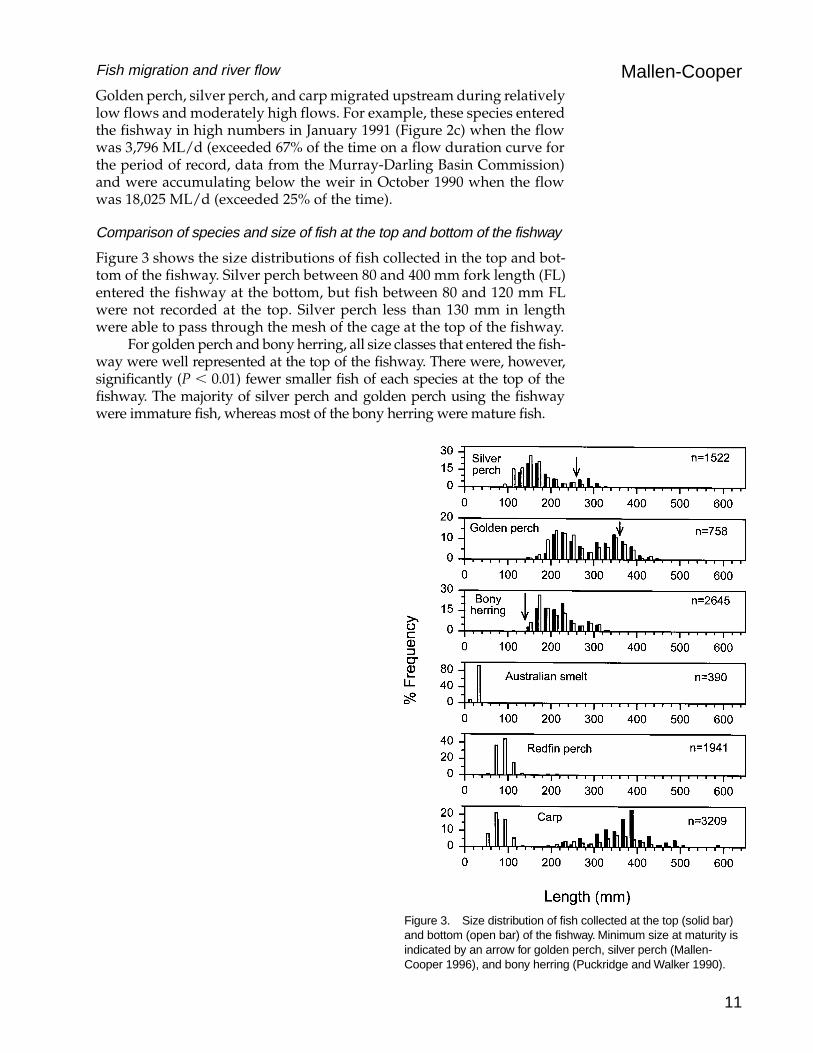
Figure 3 shows the size distributions of fish collected in the top and bot-tom of the fishway. Silver perch between 80 and 400 mm fork length (FL)entered the fishway at the bottom, but fish between 80 and 120 mm FLwere not recorded at the top. Silver perch less than 130 mm in lengthwere able to pass through the mesh of the cage at the top of the fishway.
For golden perch and bony herring, all size classes that entered the fish-way were well represented at the top of the fishway. There were, however,significantly (P , 0.01) fewer smaller fish of each species at the top of thefishway. The majority of silver perch and golden perch using the fishwaywere immature fish, whereas most of the bony herring were mature fish.
Figure 3. Size distribution of fish collected at the top (solid bar)and bottom (open bar) of the fishway. Minimum size at maturity isindicated by an arrow for golden perch, silver perch (Mallen-Cooper 1996), and bony herring (Puckridge and Walker 1990).
12
Chapter 12 Australian smelt were observed actively entering the fishway in highnumbers, but they could only ascend the first few pools of the fishway. Asample taken with a fine-meshed dip-net showed these fish were mostlyless than 40 mm FL (Figure 3). Redfin perch were mainly less than 140mm FL and were unable to ascend the fishway. Two major size classes ofcarp attempted to ascend the fishway; the large fish (220–520 mm FL)reached the top, but the small fish (40–120 mm FL) did not.
Fish behavior in the fishway
During escapement trials the most abundant species using the fishwaywas bony herring. Mean escapement rates of three replicate experimentsfor this species were between 0 and 2.5% (N 5 32 2 116) for all combina-tions of traps and time periods, except for the single cone-trap set for 24 hwhere the rate rose to 5%. A maximum of four fish escaped from the singlecone, one fish from the double cones over 23 h, and one fish from thecage. Results for golden perch and silver perch were unreplicated, but noescapement was recorded from the cage or cone-traps.
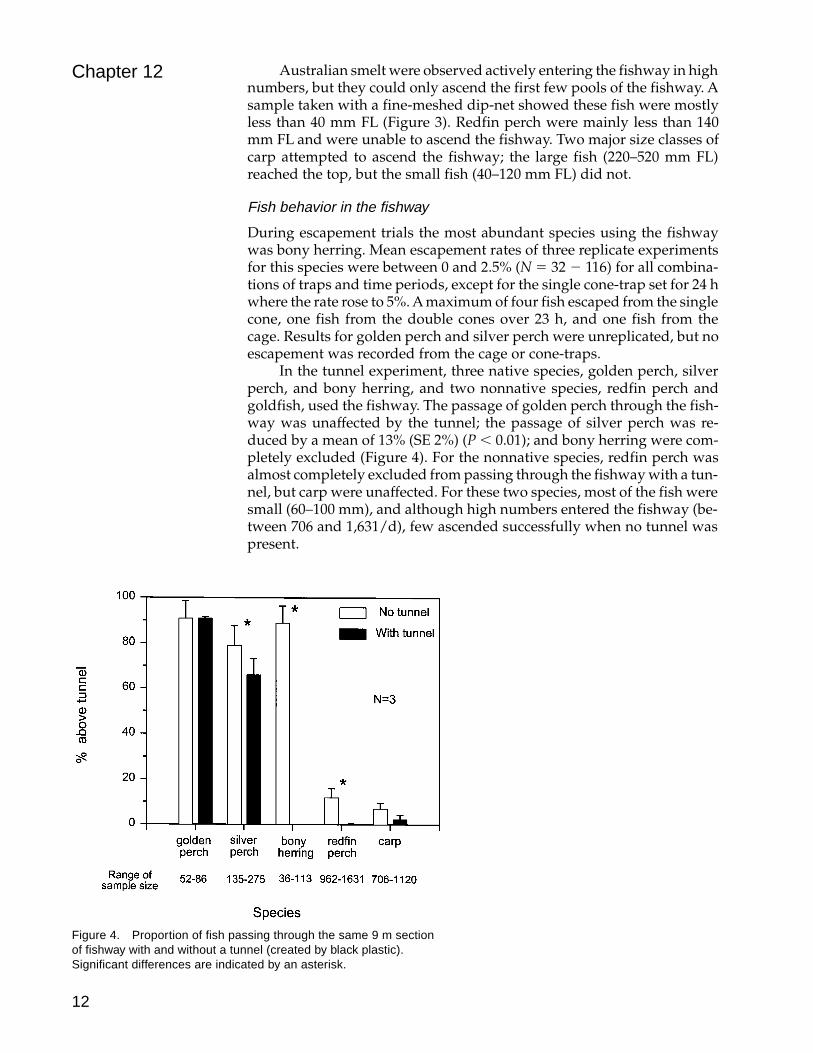
In the tunnel experiment, three native species, golden perch, silverperch, and bony herring, and two nonnative species, redfin perch andgoldfish, used the fishway. The passage of golden perch through the fish-way was unaffected by the tunnel; the passage of silver perch was re-duced by a mean of 13% (SE 2%) (P , 0.01); and bony herring were com-pletely excluded (Figure 4). For the nonnative species, redfin perch wasalmost completely excluded from passing through the fishway with a tun-nel, but carp were unaffected. For these two species, most of the fish weresmall (60–100 mm), and although high numbers entered the fishway (be-tween 706 and 1,631/d), few ascended successfully when no tunnel waspresent.
Figure 4. Proportion of fish passing through the same 9 m sectionof fishway with and without a tunnel (created by black plastic).Significant differences are indicated by an asterisk.
13
Mallen-Cooper
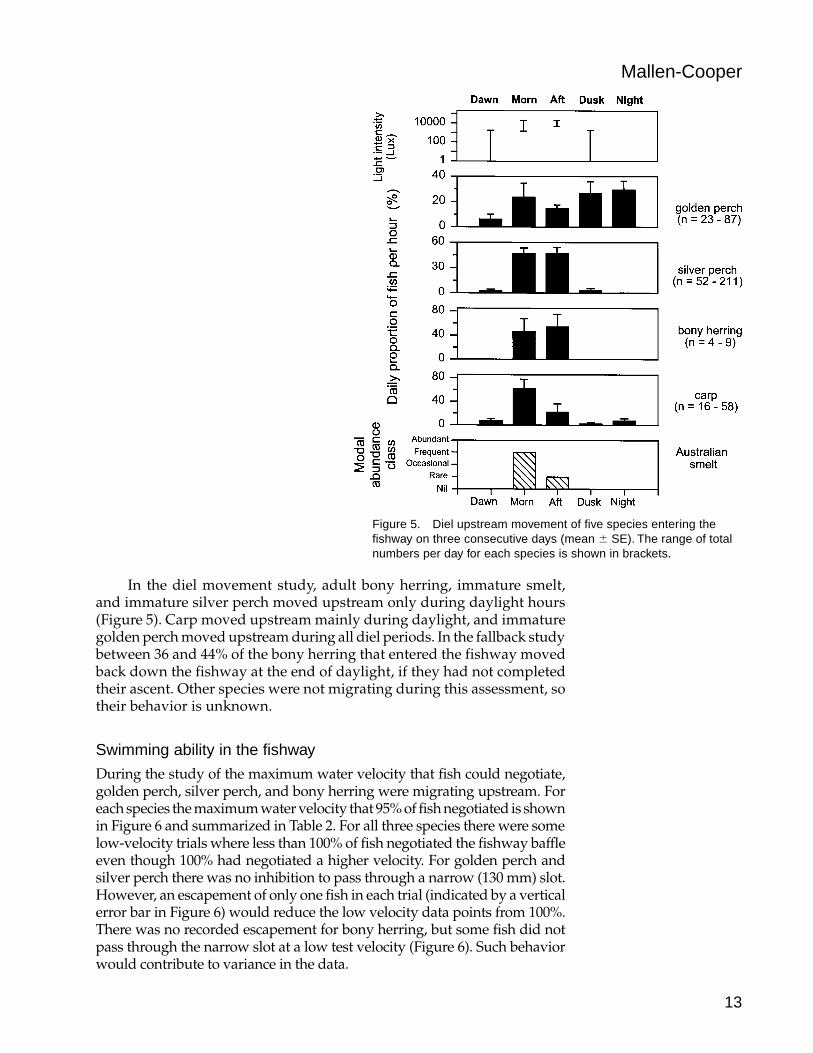
In the diel movement study, adult bony herring, immature smelt,and immature silver perch moved upstream only during daylight hours(Figure 5). Carp moved upstream mainly during daylight, and immaturegolden perch moved upstream during all diel periods. In the fallback studybetween 36 and 44% of the bony herring that entered the fishway movedback down the fishway at the end of daylight, if they had not completedtheir ascent. Other species were not migrating during this assessment, sotheir behavior is unknown.
Swimming ability in the fishway
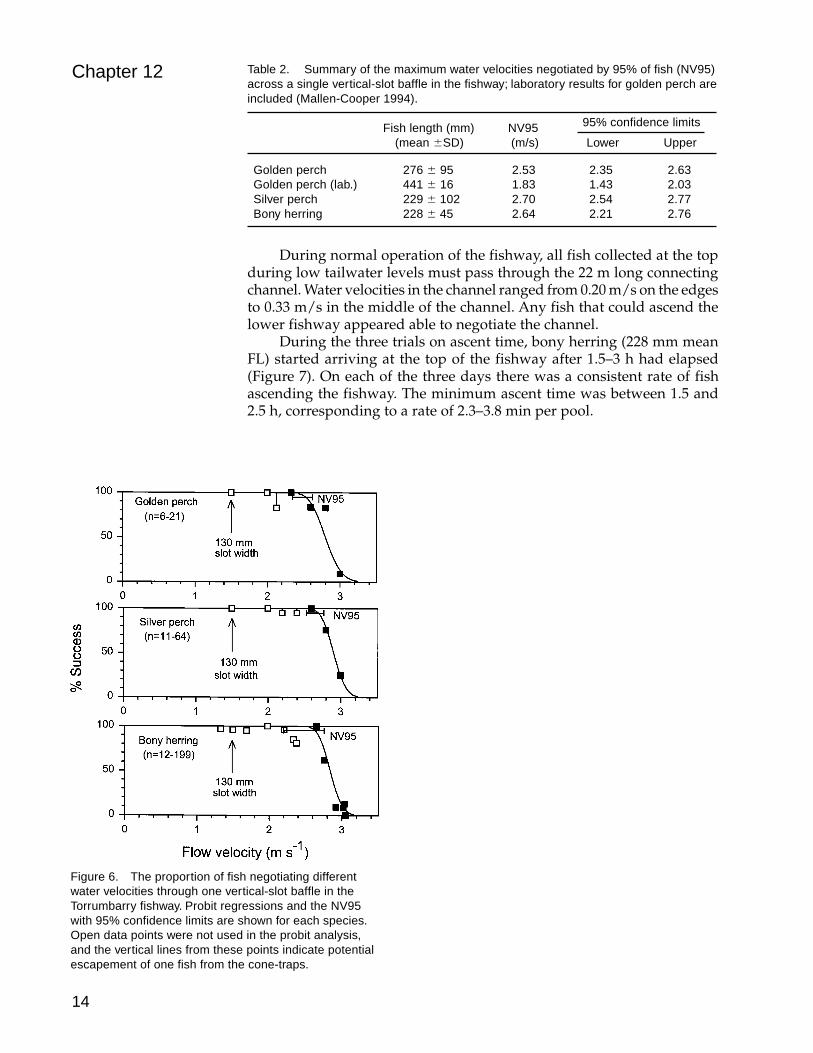
During the study of the maximum water velocity that fish could negotiate,golden perch, silver perch, and bony herring were migrating upstream. Foreach species the maximum water velocity that 95% of fish negotiated is shownin Figure 6 and summarized in Table 2. For all three species there were somelow-velocity trials where less than 100% of fish negotiated the fishway baffleeven though 100% had negotiated a higher velocity. For golden perch andsilver perch there was no inhibition to pass through a narrow (130 mm) slot.However, an escapement of only one fish in each trial (indicated by a verticalerror bar in Figure 6) would reduce the low velocity data points from 100%.There was no recorded escapement for bony herring, but some fish did notpass through the narrow slot at a low test velocity (Figure 6). Such behaviorwould contribute to variance in the data.
Figure 5. Diel upstream movement of five species entering thefishway on three consecutive days (mean 6 SE). The range of totalnumbers per day for each species is shown in brackets.
14
Chapter 12
During normal operation of the fishway, all fish collected at the topduring low tailwater levels must pass through the 22 m long connectingchannel. Water velocities in the channel ranged from 0.20 m/s on the edgesto 0.33 m/s in the middle of the channel. Any fish that could ascend thelower fishway appeared able to negotiate the channel.
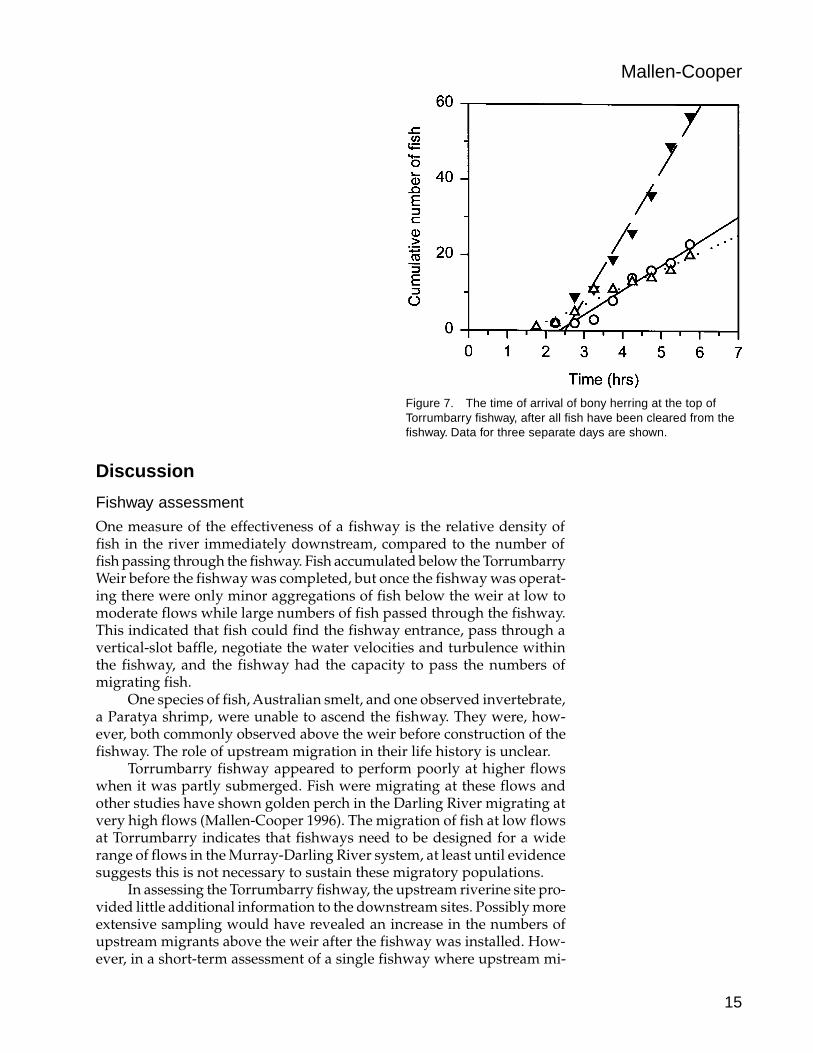
During the three trials on ascent time, bony herring (228 mm meanFL) started arriving at the top of the fishway after 1.5–3 h had elapsed(Figure 7). On each of the three days there was a consistent rate of fishascending the fishway. The minimum ascent time was between 1.5 and2.5 h, corresponding to a rate of 2.3–3.8 min per pool.
Figure 6. The proportion of fish negotiating differentwater velocities through one vertical-slot baffle in theTorrumbarry fishway. Probit regressions and the NV95with 95% confidence limits are shown for each species.Open data points were not used in the probit analysis,and the vertical lines from these points indicate potentialescapement of one fish from the cone-traps.
Golden perch 276 6 95 2.53 2.35 2.63Golden perch (lab.) 441 6 16 1.83 1.43 2.03Silver perch 229 6 102 2.70 2.54 2.77Bony herring 228 6 45 2.64 2.21 2.76
Table 2. Summary of the maximum water velocities negotiated by 95% of fish (NV95)across a single vertical-slot baffle in the fishway; laboratory results for golden perch areincluded (Mallen-Cooper 1994).
Fish length (mm) NV95(mean 6SD) (m/s) Lower Upper
95% confidence limits
15
Mallen-Cooper
Discussion
Fishway assessment
One measure of the effectiveness of a fishway is the relative density offish in the river immediately downstream, compared to the number offish passing through the fishway. Fish accumulated below the TorrumbarryWeir before the fishway was completed, but once the fishway was operat-ing there were only minor aggregations of fish below the weir at low tomoderate flows while large numbers of fish passed through the fishway.This indicated that fish could find the fishway entrance, pass through avertical-slot baffle, negotiate the water velocities and turbulence withinthe fishway, and the fishway had the capacity to pass the numbers ofmigrating fish.
One species of fish, Australian smelt, and one observed invertebrate,a Paratya shrimp, were unable to ascend the fishway. They were, how-ever, both commonly observed above the weir before construction of thefishway. The role of upstream migration in their life history is unclear.
Torrumbarry fishway appeared to perform poorly at higher flowswhen it was partly submerged. Fish were migrating at these flows andother studies have shown golden perch in the Darling River migrating atvery high flows (Mallen-Cooper 1996). The migration of fish at low flowsat Torrumbarry indicates that fishways need to be designed for a widerange of flows in the Murray-Darling River system, at least until evidencesuggests this is not necessary to sustain these migratory populations.
In assessing the Torrumbarry fishway, the upstream riverine site pro-vided little additional information to the downstream sites. Possibly moreextensive sampling would have revealed an increase in the numbers ofupstream migrants above the weir after the fishway was installed. How-ever, in a short-term assessment of a single fishway where upstream mi-
Figure 7. The time of arrival of bony herring at the top ofTorrumbarry fishway, after all fish have been cleared from thefishway. Data for three separate days are shown.
16
Chapter 12 gration is the focus, I suggest that using only localized sites downstreamis likely to be more efficient. Beyond immediate changes in fish distribu-tion, a greater test of a fishway’s effectiveness lies in the long-termsustainability of the migratory fish populations along the whole river, anda broader sampling strategy would be necessary.
Sampling the top and bottom of the fishway proved to be a usefultechnique in assessing the fishway’s efficiency. It identified that the ma-jority of size classes of native fish that entered the fishway could ascendthe full length, except for Australian smelt. The absence or restriction ofsome small size classes of golden perch, bony herring, and possibly silverperch, although statistically significant, may not be ecologically signifi-cant when the bulk of migrating immature and mature fish can ascendthe fishway. It could even be argued that this represents an effective com-promise in the design of the fishway. To pass the smaller fish the fishwaywould need to have lower water velocities and turbulence. This wouldresult in a longer, less steep, and more expensive fishway.
The compromise between fish passage and capital cost is faced for mostfishways for both nonsalmonid and salmonid fishes. The present data couldform the basis of a valuable performance criterion in the design and assess-ment of fishways. For example, “the fishway needs to be able to pass at least95% of the size range of each migratory life stage of each species.”
Redfin perch and small carp were unable to ascend the fishway. Un-fortunately, larger carp extensively used the fishway, and designing a fish-way that limits the spread of this nonnative species while allowing nativemigratory fish to pass, does not seem readily possible. On the plains ofthe Murray-Darling river system, most weirs are either submerged at sometime during floods or have gates lifted to pass floodwaters, and thus al-ready permit the spread of nonnative fish.
The number of fish passing through the Torrumbarry fishway mightbe considered high, but there is potential for much greater numbers. Upto 3,000 golden perch per day attempt unsuccessfully to ascend the nextfishway 512 km downstream, which is an old salmonid design (Mallen-Cooper 1996). An effective fishway at this downstream weir would verylikely increase the numbers of migratory fish at Torrumbarry.
Records of fish passage from the top of a fishway are widely used toindicate a fishway’s effectiveness (e.g., Jowett 1987 in New Zealand; Quirós1989 in South America; Pavlov 1989 in the former USSR; Travade 1990 inFrance; Lonnebjerg 1990 in Denmark; Bok 1990 in South Africa; Zhili et al.1990 in China; Katopodis et al. 1991 in Canada; Russell 1991 in Australia;Cada and Sale 1993 in the United States; and Sato et al. 1995 in Japan), butthere is a fundamental problem in defining an ecologically significant num-ber of fish. In the present study, estimates of fish passage would not haveidentified fish accumulating below the weir or small fish species or size classesof fish unable to ascend the fishway. The numbers of migrating fish atTorrumbarry are also greatly influenced by the effectiveness of the down-stream fishway. Therefore, to accurately assess the performance of a fishwayit would seem essential to have quantitative measures of the migratory fishcommunity as it approaches, enters, and ascends the fishway.
Assessment is an essential component of developing fishways for mi-gratory species where there is little knowledge of the behavior of these fishesin fishways. Assessment provides essential feedback to refine designs. InAustralia the lack of quantitative assessment allowed the construction of un-suitable fishways to continue for 70 years (Mallen-Cooper 1996).
17
Mallen-CooperFishway experiments
In attempting to validate the earlier laboratory experiments on swimmingability, the same techniques were unsuccessful in the field; it appearedthat if fish were handled in any way, they stopped migrating upstreamand some moved back downstream. Similar results have also been re-ported for other fishway experiments where fish are handled and trans-ported (Fisk 1959; Anonymous 1967; Nakamura et al. 1995). Another rea-son for the poor results of the laboratory techniques in the field may bethat the fish in the laboratory were ripe adult fish, and the fish in the fieldwere almost all immature subadult fish. The latter may not have the sameinclination to move upstream.
The in situ techniques developed for the field are similar to thoseused by Monk et al. (1989) and avoided handling fish until after the ex-periment. The disadvantages are an unknown sample size or species com-position in each trial and less information about the period of time fishnegotiated a particular treatment in the fishway. But the great advantageis that fish continue to migrate, or attempt to migrate, up the fishway.These field techniques may apply to other species and other river sys-tems, particularly where migration is opportunistic or facultative in con-trast to obligate, such as those of semelparous anadromous salmon.
An experimental fishway or baffle is particularly useful to initiallydetermine whether the design suits the behavior of the fish. The use of asingle baffle and pool to test swimming ability in situ is also an economi-cal method. To test swimming ability through many vertical-slot baffles,nine to eighteen pools are needed with an adjustable slope to maintainconsistent head losses between pools (Rajaratnam et al. 1986). Such long,full-scale models of fishways are possible in a large in situ laboratory likethe Fisheries-Engineering Research Laboratory on the Columbia River (e.g.,Collins and Elling 1960; Monk et al. 1989). The method used in the presentstudy can be adapted to short, full-scale in situ models of two or threepools, or it can be used at the downstream end of existing fishways bymodifying baffles. Both of these methods are relatively inexpensive.
The NV95 (the maximum velocity that 95% of fish can negotiate) forgolden perch was much greater in the field compared with the laboratorywhere fish were captured and transported. The fish in the field were muchsmaller in body size, however, and would be expected to have a poorerswimming ability.
The greater NV95 could be the result of the extra time given for fishto negotiate the test velocity (18–21 h compared with 20 min in the labora-tory experiments). However, considering bony herring needed only 2.3–3.8 min to pass through a single pool and baffle, and that larger goldenperch in the laboratory needed 20 min to do the same, it seems more likelythat the laboratory experiments underestimated the swimming ability ofgolden perch.
If the original laboratory results had been accurate, a higher watervelocity would likely have been recommended and the resulting fishwaywould have excluded many smaller fish. It was certainly fortunate thatthe laboratory data were conservative and hence the fishway allowed thepassage of the smaller fish. For golden perch and silver perch, these smallerfish are immature, and they compose the dominant portion of the popu-lation that is migrating upstream. This is in contrast to the suppositionthat mainly adults of golden perch and silver perch migrated upstream
18
Chapter 12 (Lake 1971; Llewellyn and MacDonald 1980; Reynolds 1983; Merrick andSchmida 1984; Battaglene 1991), which led to the choice of adult fish forthe earlier laboratory experiments. This highlights the importance of iden-tifying the migratory fish community first.
In the field experiments on swimming ability, silver perch and bonyherring were of similar size as the golden perch, and the NV95s were simi-lar. The high water velocities negotiated by these fish may imply that fu-ture fishways could be built with steeper slopes and therefore would becheaper to build. However, ascent time of fish and diel movement pat-terns of different species are also critical factors in the design of effectivefishways. For example, bony herring moved upstream only during day-light and needed 1.5–2.5 h to reach the top of the fishway. If these fish didnot make it to the top by the end of the day they returned back down thefishway, resulting in over one-third of the fish being unsuccessful eachday. Even though most bony herring are capable of negotiating 2.6 m/s,they need a significant period of time to negotiate a number of pools andslots with a maximum velocity of 1.8 m/s.
Diel movement patterns in migrating freshwater fish are common.North American clupeids (Talbot 1952; Richkus 1974) and salmonids(Clemens 1958; Brawn 1979; Blackett 1987; Andrew 1990) are known tomigrate upstream mainly during daylight, as do some cyprinids and acichlid in South Africa (Cambray 1990). Catostomids, percids, esocids(Schwalme et al. 1985; Pavlov 1989; Katopodis et al. 1991), and some cyp-rinids (Silva and Davies 1986) move upstream during specific diel peri-ods in addition to daylight.
Early observations of the diurnal movements of salmon led to con-cern that these fish might move back down a fishway at night (Andrewand Geen 1960). I am unaware of any published accounts where this pre-diction was fulfilled for salmonids. It is, however, an accurate predictionfor the behavior of bony herring in the Torrumbarry fishway and mayalso be true for the numerous other migratory nonsalmonid species thatmove upstream in specific diel periods. In designing fishways fornonsalmonid fishes, it would seem prudent to investigate diel movementpatterns.
In summarizing the field experiments, the velocity criteria of a fish-way should not be solely a function of the swimming ability of fish; dielmovement patterns, ascent time, and the length of the fishway shouldalso be considered. With this knowledge the Torrumbarry fishway hasnow been redesigned with large resting pools, like many salmonid fish-ways, to prevent fallback of fish.
The experiments on swimming ability also provide a guide to howfuture data might be interpreted for fishway design. The NV95, if accu-rate, would appear too high to use directly for fishway design. However,if the velocity criterion of 1.8 m/s were considered acceptable for the fishnegotiating the Torrumbarry fishway, then an NV95 (for one fishway baffle)reduced by approximately 30% might be appropriate for a 38-pool fish-way.
The inhibition and inability of some native species to pass through atunnel has implications for fishways for nonsalmonid fishes. Reluctanceof fish to enter or pass through tunnels in fishways has also been reportedfor Atlantic herring Clupea harengus (Clupeidae) in rivers draining intothe Black Sea (Pavlov 1989) and for some fish in Pakistan including the
19
Mallen-Cooperclupeid genus Hilsa (Ahmad et al. 1962). Interestingly, pool-type fishwaysfor clupeids in North America have been problematic (Collins 1951; Jack-son 1952; Talbot 1952; Monk et al. 1989). Monk et al. (1989) reports thatAmerican shad Alosa sapidissima do not pass through submerged orificesin fishways. It is possible that a reluctance of this species to pass throughtunnels might be the cause of this behavior. Successful fishways for thisspecies such as the Denil design, or the modified pool and weir designdeveloped by Monk et al. (1989) have a path through the fishway that iscontinuously open to the water surface with no tunnels. Avoiding tun-nels when developing fishways for nonsalmonid fishes would appear tobe an appropriate cautious measure.
This recommendation could also be applied to the design of roadculverts that need to pass nonsalmonid fishes. High water velocities canalso be a problem for fish passage in road culverts. The water velocities of0.20–0.33 m/s from the 20 m long connecting channel of the Torrumbarryfishway provide an initial guide for the species and size of fish migratingin the Murray River and possibly for other similar nonsalmonid fishes.
Developing fishways for nonsalmonid fishes
The success of the fishway at Torrumbarry indicates that a vertical-slotdesign with relatively low head losses between pools and low turbulencehas potential for a range of nonsalmonid fishes. The assessment of thefishway and the outcomes of extrapolating the laboratory data present acase study which identifies four steps that should be considered in devel-oping fishways for nonsalmonid fishes:
1. Identify the migratory fish community, and diel movementpatterns.
2. Test fish in an experimental fishway. (In situ experiments are rec-ommended, with no handling of fish until the end of each trial.)
3. Design and build the fishway in the following manner:• Extrapolate swimming speed data conservatively;• If the range of flows over which fish are migrating is unknown,
then design the fishway to operate over the widest possiblerange;
• Avoid tunnels;• Incorporate resting pools in long fishways, especially if fish ex-
hibit strong diel movements; and• Maintain flow and temperature regimes that stimulate fish mi-
gration. Although not considered in this paper, it would be re-miss to omit this aspect which has caused the failure of other-wise well-designed fishways (e.g., Baras et al. 1994)
4. Assess the fishway.• Use quantitative and relevant performance criteria.• Assess the migratory fish community that approaches, enters,
and ascends the fishway.• Do not depend solely on counts of fish passage.These steps are important in the development of successful fishways
for any species. The most common strategy with fishways for nonsalmonidfishes in the past has been to build the fishway and avoid steps 1, 2, and 4.With a more comprehensive approach we can be more optimistic aboutthe future of fishways for nonsalmonid fishes.
20
Chapter 12 AcknowledgmentsThe construction of Torrumbarry fishway was funded by the Murray-Darling Basin Commission (MDBC). This research was funded by theNatural Resources Management Strategy of MDBC (Project No. N002),NSW Fisheries, and the Cooperative Research Center for Freshwater Ecol-ogy. I am grateful to Fergus Hides-Pearson and Ivor Stuart for extensivetechnical assistance in the field, in addition to Stuart Curran, Simon Hartley,Tim Marsden, and Garry Thorncraft. I thank John Harris for supervisionof the work and for comments on the manuscript. I thank Terry Holt,Alan Williams, and Peter Klowss for monitoring the fishway and helpingwith the fieldwork. Dennis Reid and Geoff Gordon, from the FisheriesResearch Institute, provided valuable statistical advice. I would like tothank Brian Lawrence, Norm Mackay (MDBC), and Stuart Rowland (NSWFisheries) who supported the project and gave important advice. Lastly, Ithank Jane Mallen-Cooper for valuable editorial comments on the manu-script.
References
Ahmad, M., C. M. Ali, and S. Ahmad. 1962. Designing of fish ladders. WestPakistan Irrigation Research Institute, Lahore, Technical Report 362/HYD/1962, CITY??.
Andrew, F. J. 1990. The use of vertical-slot fishways in British Columbia, Canada.Pages 267–274 in S. Komura, editor. Proceedings of the internationalsymposium on fishways ’90 in Gifu. Publications Committee of theInternational Symposium on Fishways ’90, Gifu, Japan.
Andrew, F. J., and G. H. Geen. 1960. Sockeye and pink salmon production inrelation to proposed dams in the Fraser River system. Bulletin of theInternational Pacific Salmon Fisheries Commission 11.
Anonymous. 1967. Annual report (1966-67). Delta fish and wildlife protectionstudy report 6. Resources Agency of California, NEED CITY INCALIFORNIA.
Baras, E., H. Lambert, and J. Philipart. 1994. A comprehensive assessment of thefailure of Barbus barbus spawning migrations through a fish pass in thechannelized River Meuse (Belgium). Aquatic Living Resources 7:181–189.
Battaglene, S. C. 1991. The golden perch, Macquaria ambigua (Pisces:Percichthyidae) of Lake Keepit, New South Wales. Master’s thesis. Universityof New South Wales, Sydney.
Beumer, J. P., and D. J. Harrington. 1982. A preliminary study of movement offishes through a Victorian (Lerderderg River) fish-ladder. Proceedings of theRoyal Society of Victoria 94:121–132.
Blackett R. F. 1987. Development and performance of an Alaska steeppass fishwayfor sockeye salmon (Oncorhynchus nerka). Canadian Journal of Fisheries andAquatic Sciences 44:66–76.
Bok, A. H. 1990. The current status of fishways in South Africa and lessons to belearnt. Proceedings of a workshop on the rationale and procedures for theevaluation of the necessity for fishways in South African rivers. March1990:87–99 NEED PUBLISHER, AND PUBLISHER’S LOCATION.
Brawn, V. M. 1979. Efficiency of an estuarine fishway for the passage of salmon(Salmo salar L.), Sheet Harbour, Nova Scotia. Canada Fisheries and MarineService Report 1523.
Brumley, A. R. 1987. Past and present distributions of golden perch Macquariaambigua (Pisces: Percichthyidae) in Victoria, with reference to releases ofhatchery-produced fry. Proceedings of the Royal Society of Victoria 99:111–116.
21
Mallen-CooperCada, G. F., and M. J. Sale. 1993. Status of fish passage facilities at non-federalhydropower projects. Fisheries 18(7):4–12.
Cadwallader, P. L. 1977. J. O. Langtry’s 1949-50 Murray River investigations.Fisheries and Wildlife Paper 13, Victoria, COUNTRY??.
Cadwallader, P. L. 1978. Some causes of the decline in range and abundance ofnative fishes in the Murray-Darling River system. Proceedings of the RoyalSociety of Victoria 90:211–224.
Cambray, J. A. 1990. Adaptive significance of a longitudinal migration by juvenilefreshwater fish in the Gamtoos River system, South Africa. South AfricanJournal of Wildlife Research 20(4):148–156.
Clay, C. H. 1995. Design of fishways and other fish facilities, 2nd edition. Lewis,Boca Raton, Florida.
Clemens, W. A. 1958. The Fraser River salmon in relation to potential powerdevelopment. Pages 3–10 in P. A. Larkin, editor. The investigation of fish-power problems. NEED PUBLISHER AND CITY AND STATE OFPUBLISHER HERE.
Close, A. 1990. The impact of man on the natural flow regime. Pages 61–74 in N.Mackay and D. Eastburn, editors. The Murray. Murray-Darling BasinCommission, Canberra, COUNTRY??.
Collins, G. B. 1951. A fishway that shad ascend. U.S. Fish and Wildlife ServiceSpecial Scientific Report 65.
Collins, G. B., and C. H. Elling. 1960. Fishway research at the fisheries-engineeringresearch laboratory. U.S. Fish and Wildlife Service Circular 98.
Dargin, P. 1976. Aboriginal fisheries of the Darling-Barwon rivers. Development& Advisory Publications of New South Wales, Dubbo.
Eastburn, D. 1990. The River Murray - history at a glance. Murray-Darling BasinCommission. Canberra, ACT. DEFINE ‘ACT’
Eicher, G. J. 1982. A fish passage facility programme for New South Wales. NewSouth Wales State Fisheries. Fisheries Research Institute, Sydney.
Fisk, L. O. 1959. Experiments with a vertical baffle fishway. California Fish andGame 45:111–122.
Harris, J. H. 1984. A survey of fishways in streams of coastal south-easternAustralia. Australian Zoologist 21:219–233.
Jackson, G. B. 1952. Passage of shad at the Bonneville fishways. U.S. Fish andWildlife Service Special Scientific Report Fisheries 94.
Jacobs, T. A. 1990. River regulation. Pages 39–60 in N. Mackay and D. Eastburn,editors. The Murray. Murray-Darling Basin Commission, Canberra, Australia.
Jowett, I. G. 1987. Fish passage, control devices and spawning channels. Pages138–155 in P. R. Henriques, editor. Aquatic biology and hydroelectric powerdevelopment in New Zealand. Oxford University Press, Auckland, NewZealand.
Katopodis, C., A. J. Derksen, and B. L. Christensen. 1991. Assessment of twoDenil fishways for passage of freshwater species. Pages 306–324 in J. Coltand R. J. White, editors. Fisheries bioengineering symposium. AmericanFisheries Society, Symposium 10, Bethesda, Maryland.
Kowarsky, J., and A. H. Ross. 1981. Fish movement upstream through a centralQueensland (Fitzroy River) coastal fishway. Australian Journal of Marineand Freshwater Research 32:93–109.
Lake, J. S. 1971. Freshwater fishes and rivers of Australia. Nelson, Sydney,Australia.
Larinier, M. 1990. Experience in France: fish pass design criteria and downstreammigration problems. Pages 65–74 in S. Komura, editor. Proceedings of theinternational symposium on fishways ’90 in Gifu. Publications Committeeof the International Symposium on Fishways ’90, Gifu, Japan.
Llewellyn, L. C., and M. C. MacDonald. 1980. Family Percichthyidae. Pages 142–149 in R. M. McDowall, editor. Freshwater fishes of South-eastern Australia.Reed, Sydney, Australia.
22
Chapter 12 Lonnebjerg, N. 1990. Fishways in Denmark. Pages 253–259 in S. Komura, editor.Proceedings of the international symposium on fishways ’90 in Gifu.Publications Committee of the International Symposium on Fishways ’90,Gifu, Japan.
Maheshwari, B. L., K. F. Walker, and T. A. McMahon. 1995. Effects of regulationon the flow regime of the River Murray, Australia. Regulated Rivers 10:15–38.
Mallen-Cooper, M. 1989. Fish passage in the Murray-Darling Basin. Pages 123–136 in B. Lawrence, editor. Proceedings of the workshop on native fishmanagement. Murray-Darling Basin Commission, Canberra, COUNTRYNEEDED HERE.
Mallen-Cooper, M. 1992. The swimming ability of juvenile Australian bass,Macquaria novemaculeata (Steindachner) and juvenile barramundi, Latescalcarifer (Bloch), in an experimental vertical-slot fishway. Australian Journalof Marine and Freshwater Research 43:823–834.
Mallen-Cooper, M. 1993. Fishways in Australia; past problems, present successesand future opportunities. ANCOLD Bulletin 93:22–33. DEFINE ‘ANCOLD’.
Mallen-Cooper, M. 1994. Swimming ability of adult golden perch, Macquariaambigua (Percichthyidae), and adult silver perch, Bidyanus bidyanus(Teraponidae), in an experimental vertical-slot fishway. Australian Journalof Marine and Freshwater Research 45:191–198.
Mallen-Cooper, M. 1996. Fishways and freshwater fish migration in south-easternAustralia. Doctoral dissertation. University of Technology, Sydney, NewSouth Wales, Australia.
Mallen-Cooper, M., and J. H. Harris. 1990. Fishways in mainland south-easternAustralia. Pages 221–229 in S. Komura, editor. Proceedings of the internationalsymposium on fishways ’90 in Gifu. Publications Committee of theInternational Symposium on Fishways ’90, Gifu, Japan.
Merrick, J. R., and G. E. Schmida. 1984. Australian freshwater fishes: biology andmanagement. Griffin Press, Adelaide.
Monk, B., D. Weaver, C. Thompson, and F. Ossiander. 1989. Effects of flow andweir design on the passage behavior of American shad and salmonids in anexperimental fish ladder. North American Journal of Fisheries Management9:60–67.
Nakamura, S., M. Noda, H. Misawa, and Y. Nakahara. 1995. Temporarily installedlong, steep Denil fishway on the Ohkohchi-Sabo Dam in the Abe-Gawa River.Pages 155–162 in Proceedings of the international symposium on fishways’95 in Gifu. Publications Committee of the International Symposium onFishways ’95, Gifu, Japan.
Pavlov, D. S. 1989. Structures assisting the migrations of non-salmonid fish: USSR.FAO Fisheries Technical Paper 308.
Petts, G. E. 1984. Impounded rivers - perspectives for ecological management.Wiley, London.
Puckridge J. T., and K. F. Walker. 1990. Reproductive biology and larvaldevelopment of a gizzard shad, Nematalosa erebi (Günther) (Dorosomatinae:Teleostei), in the River Murray, South Australia. Australian Journal of Marineand Freshwater Research 41:695–712.
Quirós, R. 1989. Structures assisting the migrations of non-salmonid fish: LatinAmerica. COPESCAL Technical Paper 5. FAO, Rome. DEFINE ‘COPESCAL’.
Rajaratnam, N., G. Van der Vinne, and C. Katopodis. 1986. Hydraulics of vertical-slot fishways. Journal of Hydraulic Engineering 112:909–927.
Reynolds, L. F. 1983. Migration patterns of five fish species in the Murray-DarlingRiver system. Australian Journal of Marine and Freshwater Research 34:857–871.
Richkus, W. A. 1974. Factors influencing the seasonal and daily patterns of alewife(Alosa pseudoharengus) migration in a Rhode Island River. Journal of theFisheries Research Board of Canada 31:1485–1497.
23
Mallen-CooperRussell, D. J. 1991. Fish movements through a fishway on a tidal barrage in sub-tropical Queensland. Proceedings of the Royal Society of Queensland101:109–118.
Sato, R., M. Sugawara, K. Otsuka, and H. Aoyama. 1995. Study on upstreammigration of fish through a vertical slot fishway. Pages 317–321 in S. Komura,editor. Proceedings of the international symposium on fishways ’95 in Gifu.Publications Committee of the International Symposium on Fishways ’95,Gifu, Japan.
Schwalme, K., W. C. Mackay, and D. Lindner. 1985. Suitability of vertical slot andDenil fishways for passing north-temperate, nonsalmonid fish. CanadianJournal of Fisheries and Aquatic Sciences 42:1815–1822.
Silva, E. I. L., and R. W. Davies. 1986. Movements of some indigenous riverinefish in Sri Lanka. Hydrobiologia 137:265–270.
Stead, D. G. 1914. Notes on fisheries and fishery investigations in New SouthWales during 1913. Pages 103–115 in Report on the fisheries of New SouthWales, 1910-1913. Report to Legislative Assembly, New South Wales. NewSouth Wales Printing Office, Sydney.
Talbot, G. B. 1952. Passage of shad at the Bonneville fishways. U.S. Fish andWildlife Service Special Scientific Report Fisheries 94.
Travade, F. 1990. Monitoring techniques for fish passes recently used in France.Pages 119–126 in S. Komura, editor. Proceedings of the internationalsymposium on fishways ’90 in Gifu. Publications Committee of theInternational Symposium on Fishways ’90, Gifu, Japan.
Vennard, J. K., and R. L. Street. 1982. Elementary fluid mechanics, 6th edition.Wiley, New York.
Welcomme, R. L. 1989. Floodplain fisheries management. Pages 209–233 in J. A.Gore and G. E. Petts, editors. Alternatives in regulated river management.CRC Press, NEED CITY HERE, Florida.
White, D. K., and B. J. Pennino. 1980. Connecticut River fishways: model studies.Journal of the Hydraulics Division, ASCE 7(198):1219–1233.
Zhili, G., L. Qinhao, and A. Keming. 1990. Layout and performance of theYangtang fishway. Pages 283–287 in S. Komura, editor. Proceedings of theinternational symposium on fishways ’95 in Gifu. Publications Committeeof the International Symposium on Fishways ’95, Gifu, Japan.
Related Documents