Chemical and Process Engineering Research www.iiste.org ISSN 2224-7467 (Paper) ISSN 2225-0913 (Online) Vol.26, 2014 24 Developing Aspen-Plus Procedure on Flash Separation of Methanol-Water Mixture * Awajiogak A. Ujile a and Itong A Ujile b a Department of Chemical/Petrochemical Engineering, Rivers State University of Science and Technology, P M B 5080, Port Harcourt, Nigeria. Email: [email protected]; Tel: +2348033398876; * Corresponding author. b Department of Chemical Engineering, Texas A&M University, Kingsville, USA. Email: [email protected]; Tel: +1 (361)355-6187 Abstract A step-by–step procedure on the separation of methanol-water mixture has been developed. Application of ASPEN PLUS Software was utilized. Aspen Plus interface with Thermodynamics Package selection and an activity coefficient model are incorporated. UNIQUAC is used. Results obtained have shown a simple method that can be easily used by all chemical engineers at all levels. The developed method can be used for separation of other mixtures in the separation process industries. Keywords: UNIQUAC model, separation, simulation, computer package Introduction: Risk and uncertainty are facts of life in most business and public policy decisions. However, with the right tools one can better understand risks and identify ways to mitigate them. This is especially important when “experimenting” in the real world becomes too expensive, dangerous, or time consuming. In a short amount of time and for very little money one can run thousands of “what if” scenarios allowing us to make better decisions more quickly [Monte-Carlo Simulations, Woller, 1996]. An example is illustrating the use of Monte-Carlo Simulation to compute the value of the mathematical constant; Pi has been applied for Computing Pi Model. The sensitivity analysis and scenario analyses are quite useful to understand the uncertainty of the investment projects. But both approaches suffer from certain weakness. They do not consider the interactions between variables and also, they do not reflect on the profitability of the change in variables EzineArticles (2010). Simulation is one of the most widely used quantitative methods, because it is so flexible and can yield so many useful results. Here is just a sample of the applications where simulation is used, (Wharton University of Pennsylvania): • Choosing drilling projects for oil and natural gas • Evaluating environmental impacts of a new highway or industrial plant • Setting stock levels to meet fluctuating demand at retail stores • Forecasting sales and production requirements for a new drug • Planning aircraft sorties and ship movements in the military • Planning for retirement, given expenses and investment performance • Deciding on reservations and overbooking policies for an airline • Selecting projects with uncertain payoffs in capital budgeting Chemical engineers use flow sheets/process flow diagrams to analyze unit operations. There are varieties of computer programs or packages which can be utilized. Examples of process simulation packages are: Aspen plus, Hysys, ProII, ChemCAD, Design II, to mention but a few Peters, et al (2004). The benefits of simulation package application are (Process Engineering Associates, LLC) available online: • Accurate design information • Software-produced mass and energy balances and process flow diagrams • Multiple design cases at a fraction of the cost • Process optimization, finding the process' maximum performance point • Sensitivity analyses, determining the process' key control variables and degree of operating stability. The availability of this powerful software is a great asset to the experienced process engineer, but such sophisticated tools can be potentially dangerous in the hands of neophyte engineer. The bottom line in doing any process simulation is that you the engineer are still responsible for analyzing the results from the computer, Turton et al (2009). The work of Ujile and Amagbo (2013) on determination of plate efficiency of rectification column in refinery operations has shown that to gain high efficiency of separation in a distillation column requires increase in the number of trays within a given section by reducing the spacing between trays. However, optimization principle

Welcome message from author
This document is posted to help you gain knowledge. Please leave a comment to let me know what you think about it! Share it to your friends and learn new things together.
Transcript
Chemical and Process Engineering Research www.iiste.org
ISSN 2224-7467 (Paper) ISSN 2225-0913 (Online)
Vol.26, 2014
24
Developing Aspen-Plus Procedure on Flash Separation of
Methanol-Water Mixture
* Awajiogak A. Ujilea and Itong A Ujile
b
aDepartment of Chemical/Petrochemical Engineering, Rivers State University of Science and Technology, P M
B 5080, Port Harcourt, Nigeria. Email: [email protected];
Tel: +2348033398876; *Corresponding author.
bDepartment of Chemical Engineering, Texas A&M University, Kingsville, USA.
Email: [email protected]; Tel: +1 (361)355-6187
Abstract
A step-by–step procedure on the separation of methanol-water mixture has been developed. Application of
ASPEN PLUS Software was utilized. Aspen Plus interface with Thermodynamics Package selection and an
activity coefficient model are incorporated. UNIQUAC is used. Results obtained have shown a simple method
that can be easily used by all chemical engineers at all levels. The developed method can be used for separation
of other mixtures in the separation process industries.
Keywords: UNIQUAC model, separation, simulation, computer package
Introduction:
Risk and uncertainty are facts of life in most business and public policy decisions. However, with the right tools
one can better understand risks and identify ways to mitigate them. This is especially important when
“experimenting” in the real world becomes too expensive, dangerous, or time consuming. In a short amount of
time and for very little money one can run thousands of “what if” scenarios allowing us to make better decisions
more quickly [Monte-Carlo Simulations, Woller, 1996]. An example is illustrating the use of Monte-Carlo
Simulation to compute the value of the mathematical constant; Pi has been applied for Computing Pi Model.
The sensitivity analysis and scenario analyses are quite useful to understand the uncertainty of the investment
projects. But both approaches suffer from certain weakness. They do not consider the interactions between
variables and also, they do not reflect on the profitability of the change in variables EzineArticles (2010).
Simulation is one of the most widely used quantitative methods, because it is so flexible and can yield so many
useful results. Here is just a sample of the applications where simulation is used, (Wharton University of
Pennsylvania):
• Choosing drilling projects for oil and natural gas
• Evaluating environmental impacts of a new highway or industrial plant
• Setting stock levels to meet fluctuating demand at retail stores
• Forecasting sales and production requirements for a new drug
• Planning aircraft sorties and ship movements in the military
• Planning for retirement, given expenses and investment performance
• Deciding on reservations and overbooking policies for an airline
• Selecting projects with uncertain payoffs in capital budgeting
Chemical engineers use flow sheets/process flow diagrams to analyze unit operations. There are varieties of
computer programs or packages which can be utilized. Examples of process simulation packages are: Aspen
plus, Hysys, ProII, ChemCAD, Design II, to mention but a few Peters, et al (2004). The benefits of simulation
package application are (Process Engineering Associates, LLC) available online:
• Accurate design information
• Software-produced mass and energy balances and process flow diagrams
• Multiple design cases at a fraction of the cost
• Process optimization, finding the process' maximum performance point
• Sensitivity analyses, determining the process' key control variables and degree of operating stability.
The availability of this powerful software is a great asset to the experienced process engineer, but such
sophisticated tools can be potentially dangerous in the hands of neophyte engineer. The bottom line in doing any
process simulation is that you the engineer are still responsible for analyzing the results from the computer,
Turton et al (2009).
The work of Ujile and Amagbo (2013) on determination of plate efficiency of rectification column in refinery
operations has shown that to gain high efficiency of separation in a distillation column requires increase in the
number of trays within a given section by reducing the spacing between trays. However, optimization principle
Chemical and Process Engineering Research www.iiste.org
ISSN 2224-7467 (Paper) ISSN 2225-0913 (Online)
Vol.26, 2014
25
is required to obtain optimum results. They asserted this proposal to form the subject matter for further work on
the plant, which might require the application of process engineering system tools.
Chemical engineers’ knowledge of basic principles of one of these simulation programs is expedient to be able
to carry out further work on optimization problems in industrial separation processes. However, these programs
are similar; therefore basic knowledge of one of them would facilitate understanding the other programs.
This guide attempts to provide a step by step approach in modeling a flash separation of a methanol-water
system using Aspen Plus such that would be easy to understand by chemical engineers at all levels, and other
engineers or individuals that are involved in process design activities. The developed procedure enables the
process engineer to analyze results from the computer.
Methodology
The method adopted in this work involves the process system of methanol – water mixture at different
concentrations in a typical distillation (separation) unit.
Process Description
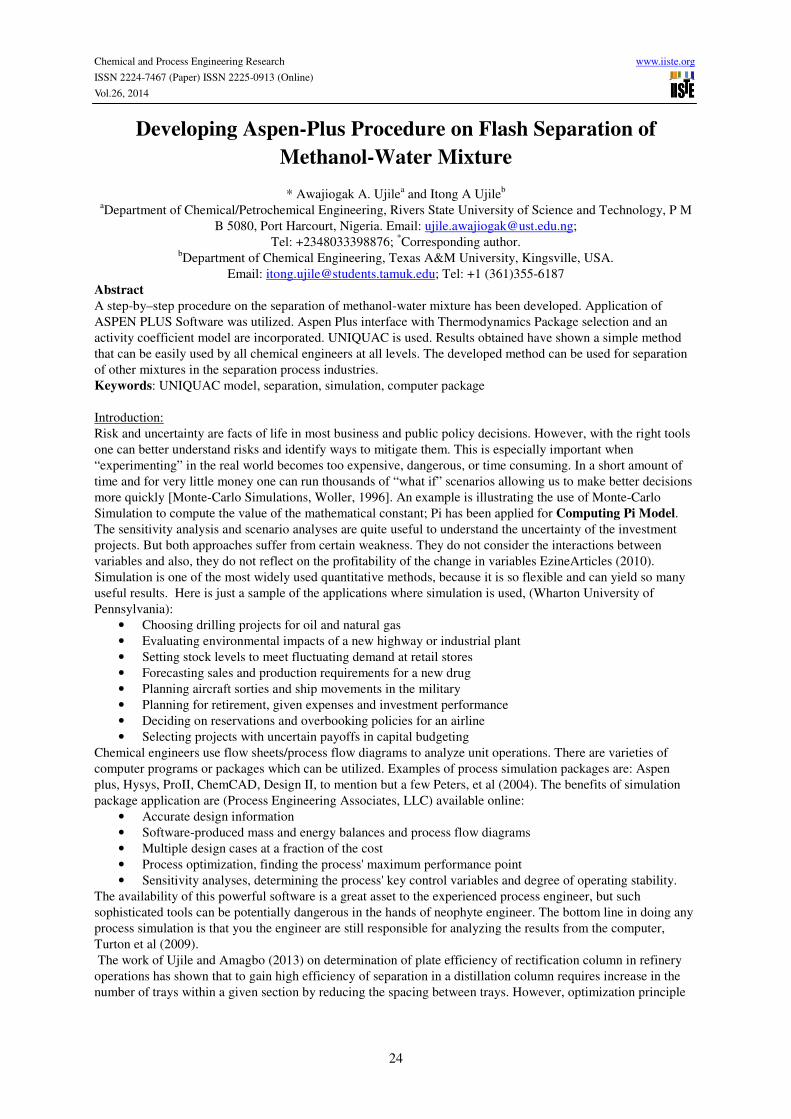
A mixture composed of methanol and water with mole fractions 0.1 and 0.9 is fed into a flash unit at 1000lbm/hr
at 27 oC and atmospheric pressure. Suppose the flash unit operates at 1atm and vaporizes 30% of the mixture,
determine the composition of the product streams using Aspen Plus.
START UP ASPEN PLUS: From the start menu, follow the sequence as shown in the illustration below,
(Figure 1).
Fig 1: Sequence for Start-up
Chemical and Process Engineering Research www.iiste.org
ISSN 2224-7467 (Paper) ISSN 2225-0913 (Online)
Vol.26, 2014
26
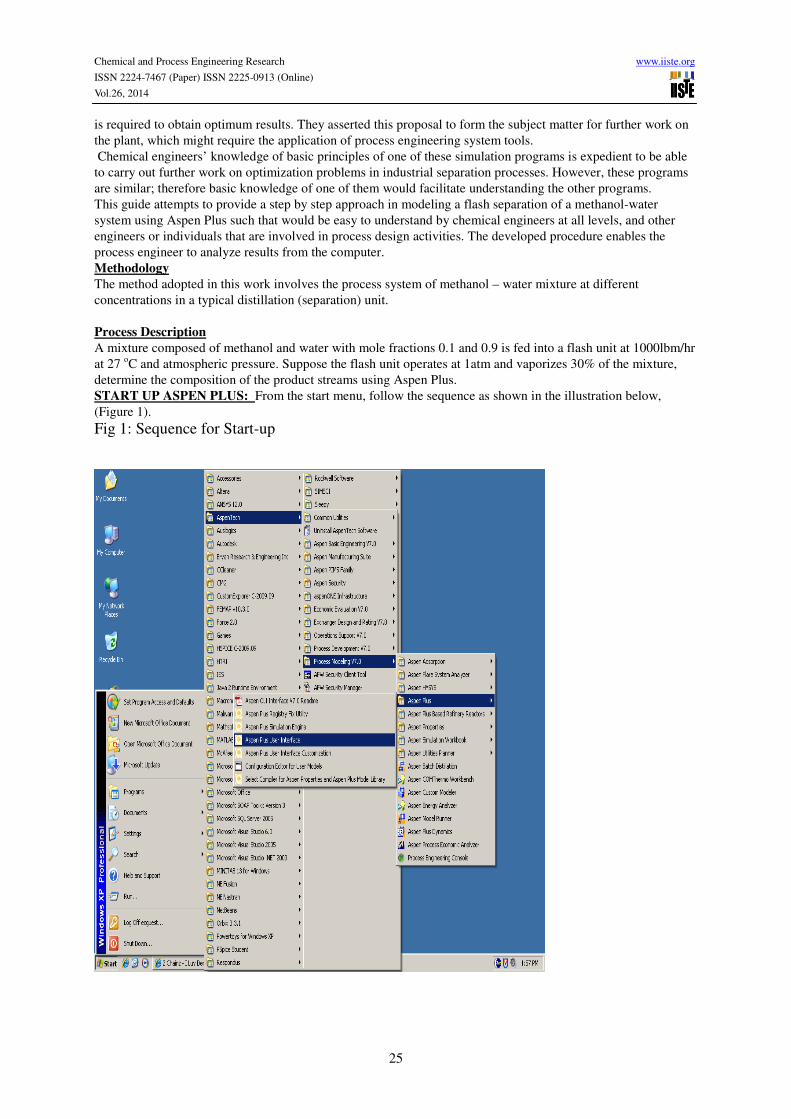
Select the radio button next to Blank Simulation and hit the OK button to display the GUI
(Fig. 2).
Fig.2: Selection process for Aspen-Plus
The GUI would be the environment where the process flow diagram is defined.
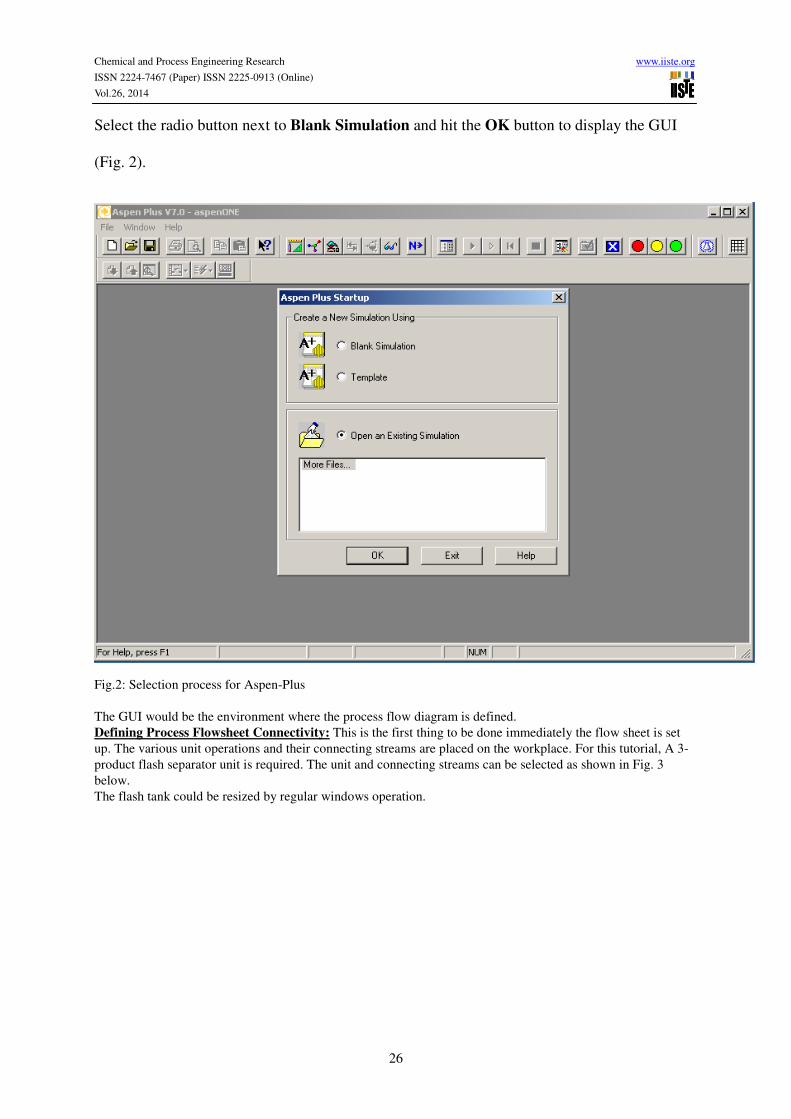
Defining Process Flowsheet Connectivity: This is the first thing to be done immediately the flow sheet is set
up. The various unit operations and their connecting streams are placed on the workplace. For this tutorial, A 3-
product flash separator unit is required. The unit and connecting streams can be selected as shown in Fig. 3
below.
The flash tank could be resized by regular windows operation.
Chemical and Process Engineering Research www.iiste.org
ISSN 2224-7467 (Paper) ISSN 2225-0913 (Online)
Vol.26, 2014
27
Fig. 3: Various unit operations and connecting streams
The red markers on the flash unit show where process streams can be connected.
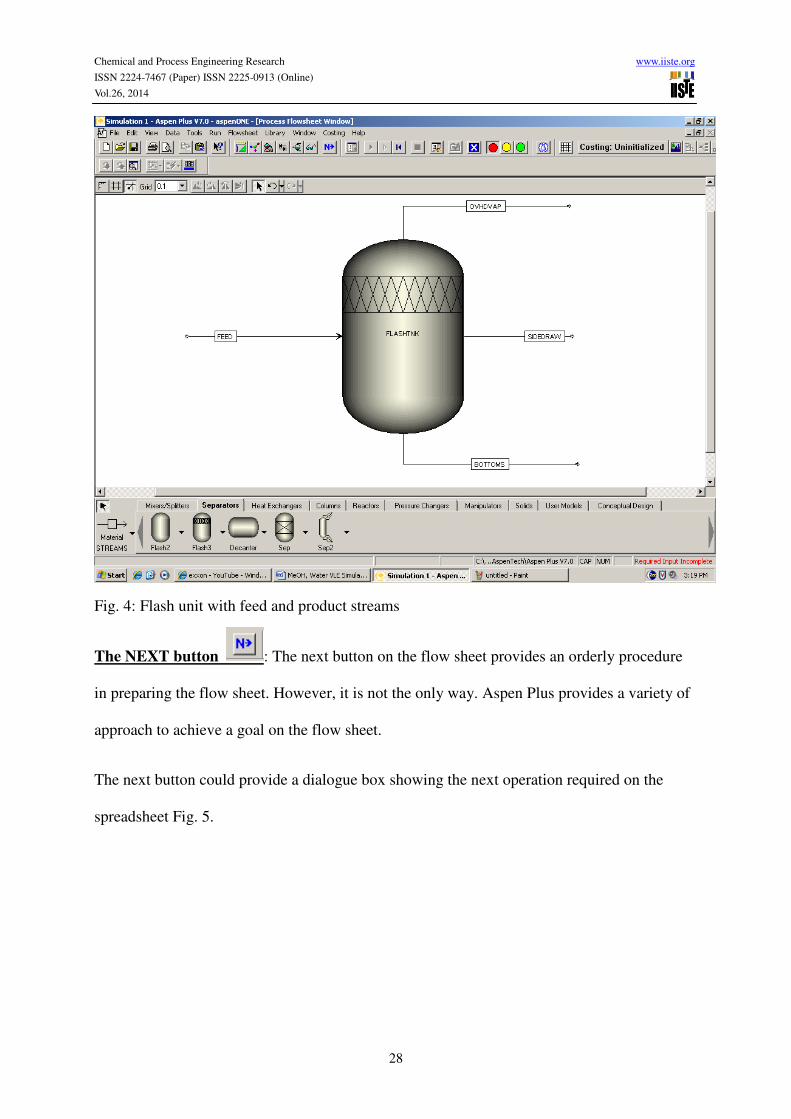
The figure below shows the flash unit with all feed and product streams (Fig. 4). For ease of operations, the
streams and flash unit can be renamed by right clicking and using the drop-down menu that appears.
Chemical and Process Engineering Research www.iiste.org
ISSN 2224-7467 (Paper) ISSN 2225-0913 (Online)
Vol.26, 2014
28
Fig. 4: Flash unit with feed and product streams
The NEXT button : The next button on the flow sheet provides an orderly procedure
in preparing the flow sheet. However, it is not the only way. Aspen Plus provides a variety of
approach to achieve a goal on the flow sheet.
The next button could provide a dialogue box showing the next operation required on the
spreadsheet Fig. 5.
Chemical and Process Engineering Research www.iiste.org
ISSN 2224-7467 (Paper) ISSN 2225-0913 (Online)
Vol.26, 2014
29
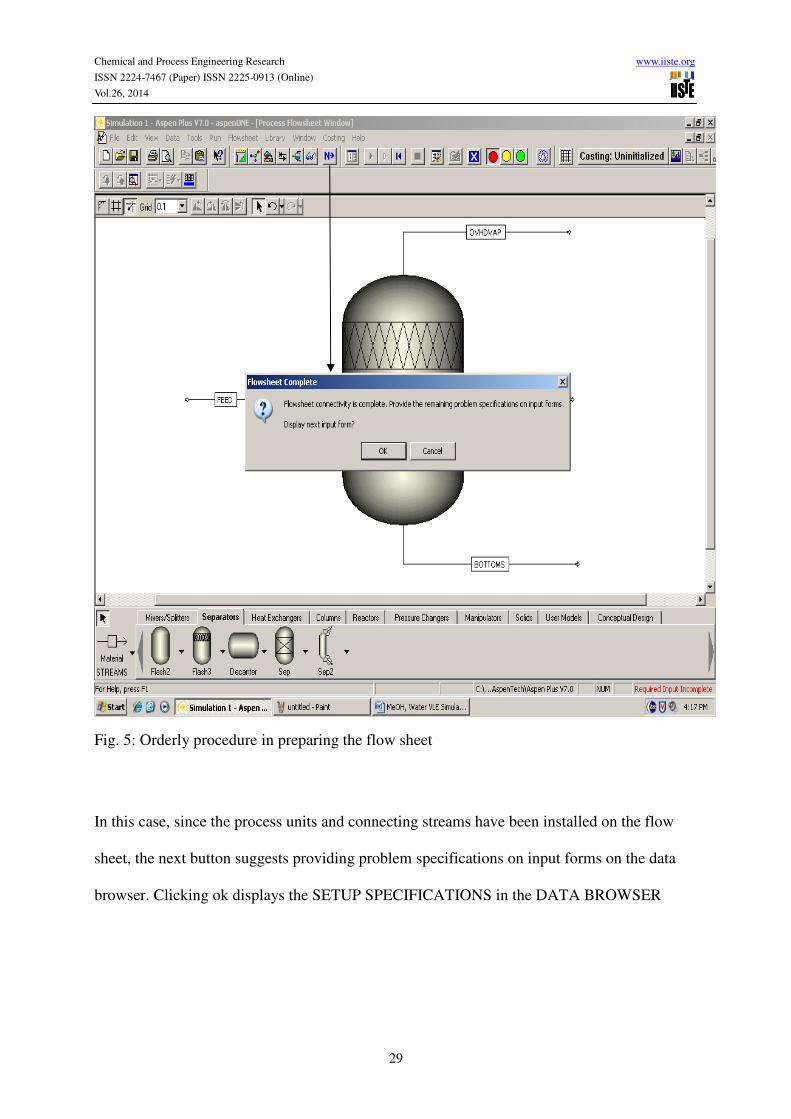
Fig. 5: Orderly procedure in preparing the flow sheet
In this case, since the process units and connecting streams have been installed on the flow
sheet, the next button suggests providing problem specifications on input forms on the data
browser. Clicking ok displays the SETUP SPECIFICATIONS in the DATA BROWSER
Chemical and Process Engineering Research www.iiste.org
ISSN 2224-7467 (Paper) ISSN 2225-0913 (Online)
Vol.26, 2014
30
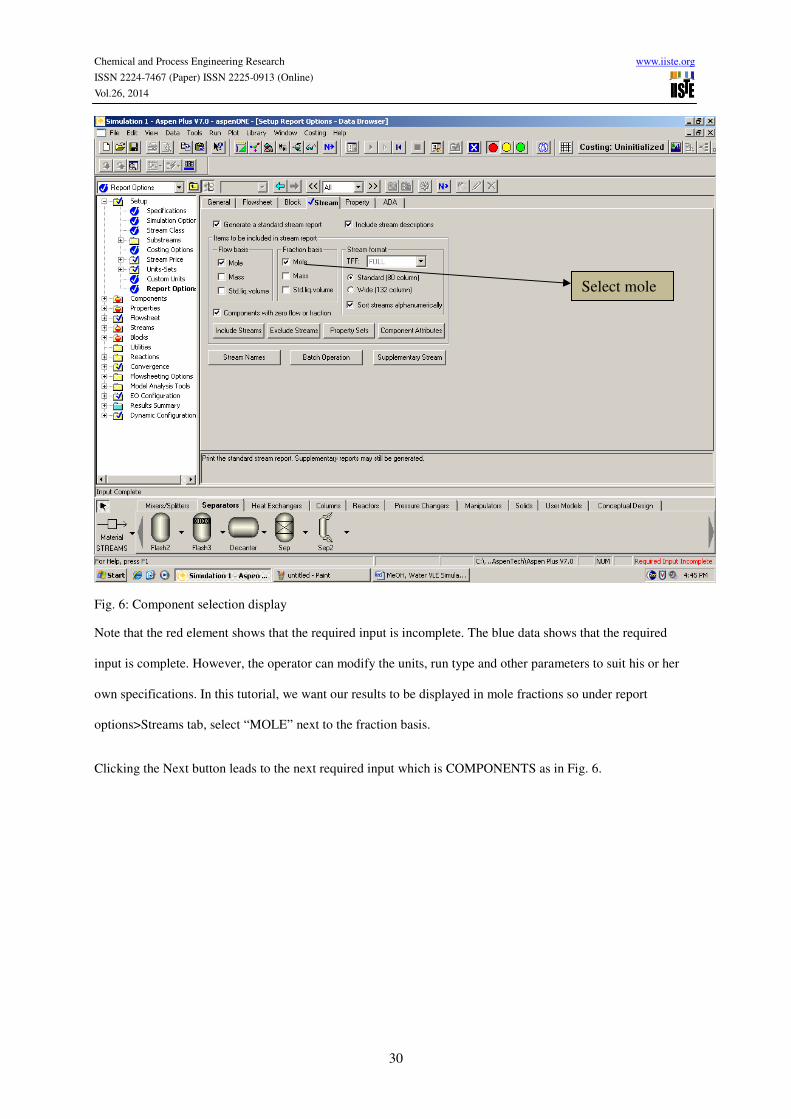
Fig. 6: Component selection display
Note that the red element shows that the required input is incomplete. The blue data shows that the required
input is complete. However, the operator can modify the units, run type and other parameters to suit his or her
own specifications. In this tutorial, we want our results to be displayed in mole fractions so under report
options>Streams tab, select “MOLE” next to the fraction basis.
Clicking the Next button leads to the next required input which is COMPONENTS as in Fig. 6.
Select mole
Chemical and Process Engineering Research www.iiste.org
ISSN 2224-7467 (Paper) ISSN 2225-0913 (Online)
Vol.26, 2014
31
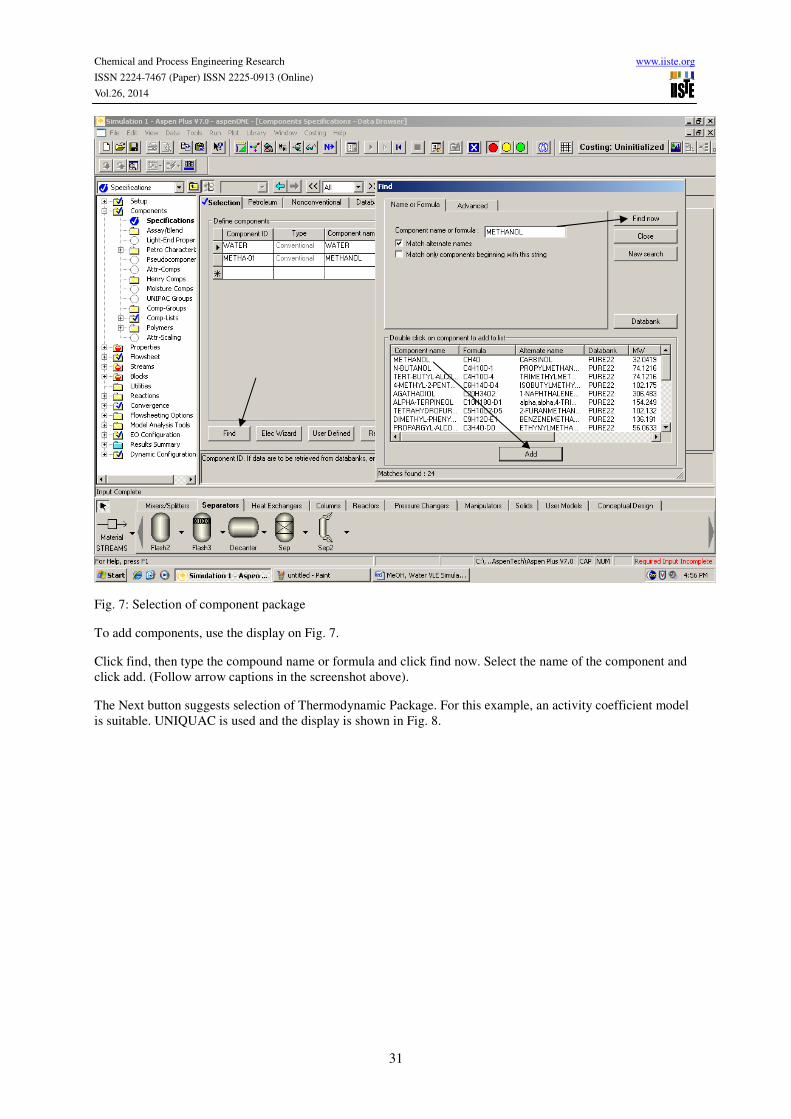
Fig. 7: Selection of component package
To add components, use the display on Fig. 7.
Click find, then type the compound name or formula and click find now. Select the name of the component and
click add. (Follow arrow captions in the screenshot above).
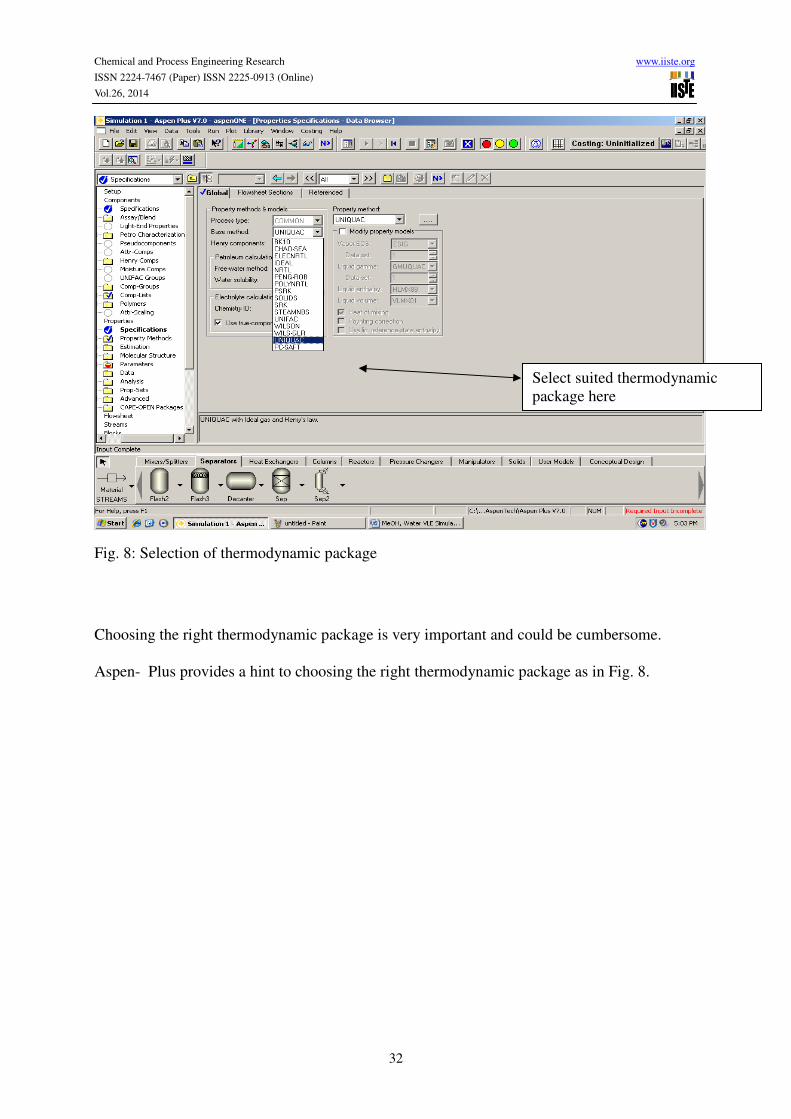
The Next button suggests selection of Thermodynamic Package. For this example, an activity coefficient model
is suitable. UNIQUAC is used and the display is shown in Fig. 8.
Chemical and Process Engineering Research www.iiste.org
ISSN 2224-7467 (Paper) ISSN 2225-0913 (Online)
Vol.26, 2014
32
Fig. 8: Selection of thermodynamic package
Choosing the right thermodynamic package is very important and could be cumbersome.
Aspen- Plus provides a hint to choosing the right thermodynamic package as in Fig. 8.
Select suited thermodynamic
package here
Chemical and Process Engineering Research www.iiste.org
ISSN 2224-7467 (Paper) ISSN 2225-0913 (Online)
Vol.26, 2014
33
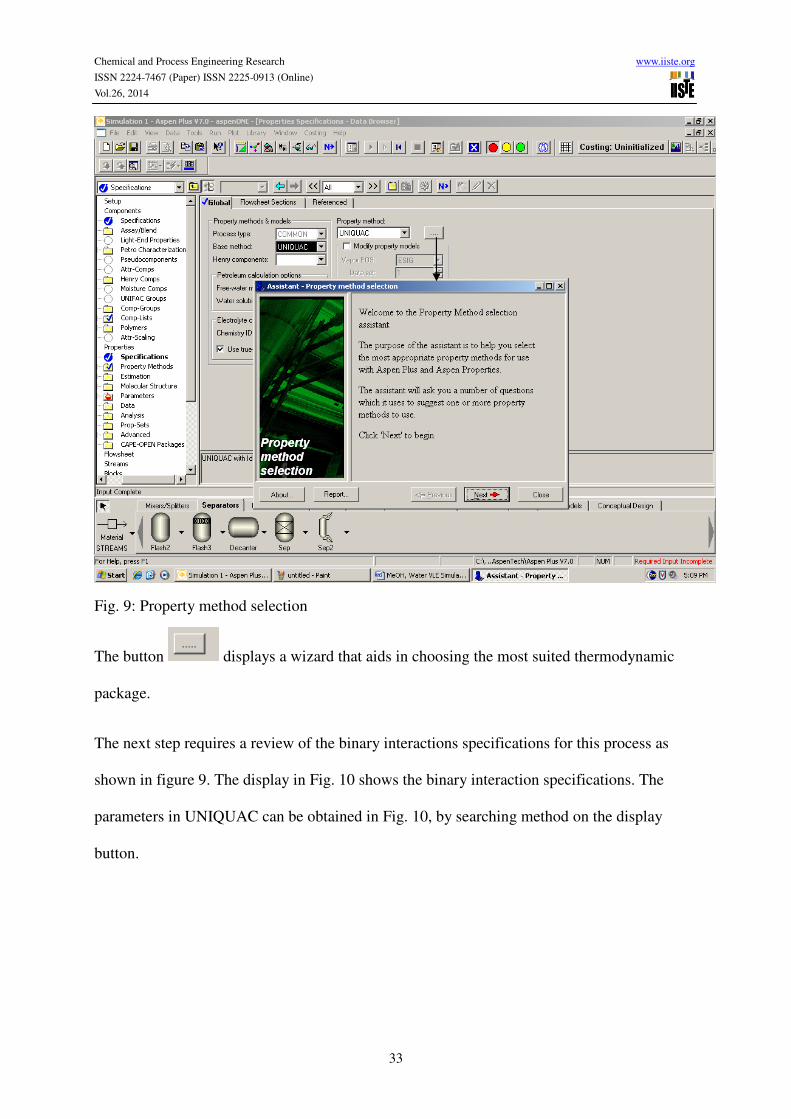
Fig. 9: Property method selection
The button displays a wizard that aids in choosing the most suited thermodynamic
package.
The next step requires a review of the binary interactions specifications for this process as
shown in figure 9. The display in Fig. 10 shows the binary interaction specifications. The
parameters in UNIQUAC can be obtained in Fig. 10, by searching method on the display
button.
Chemical and Process Engineering Research www.iiste.org
ISSN 2224-7467 (Paper) ISSN 2225-0913 (Online)
Vol.26, 2014
34
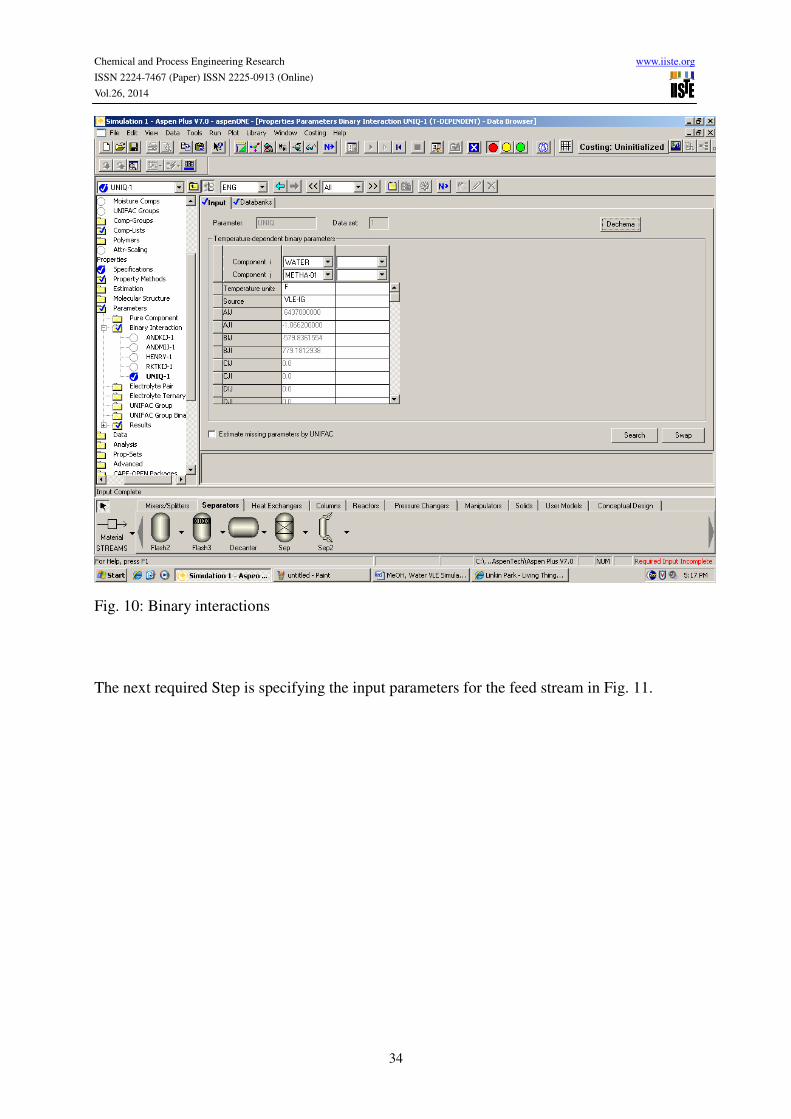
Fig. 10: Binary interactions
The next required Step is specifying the input parameters for the feed stream in Fig. 11.
Chemical and Process Engineering Research www.iiste.org
ISSN 2224-7467 (Paper) ISSN 2225-0913 (Online)
Vol.26, 2014
35
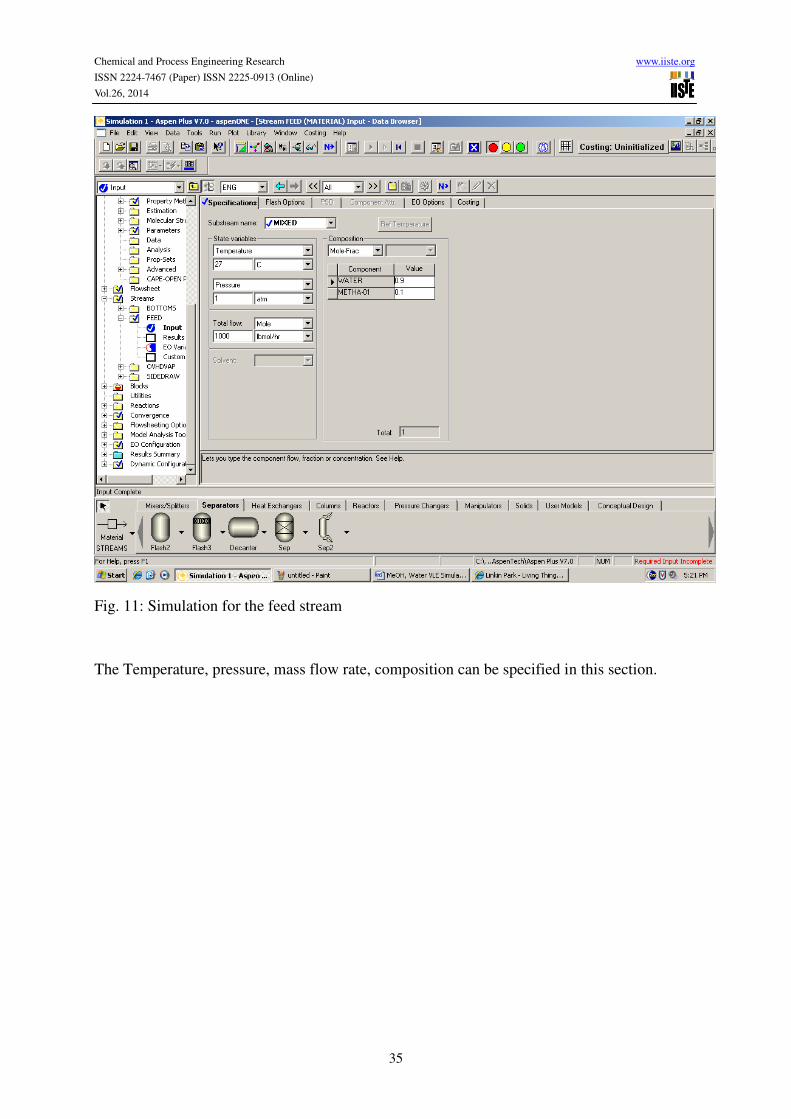
Fig. 11: Simulation for the feed stream
The Temperature, pressure, mass flow rate, composition can be specified in this section.
Chemical and Process Engineering Research www.iiste.org
ISSN 2224-7467 (Paper) ISSN 2225-0913 (Online)
Vol.26, 2014
36
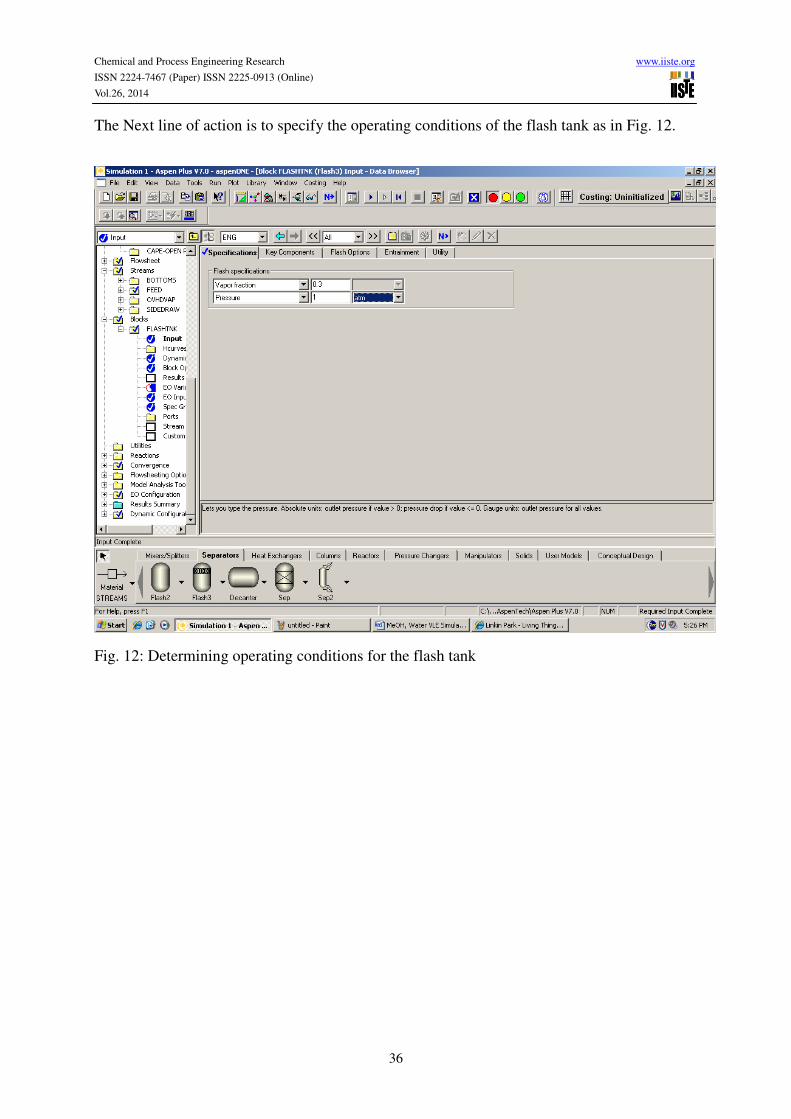
The Next line of action is to specify the operating conditions of the flash tank as in Fig. 12.
Fig. 12: Determining operating conditions for the flash tank
Chemical and Process Engineering Research www.iiste.org
ISSN 2224-7467 (Paper) ISSN 2225-0913 (Online)
Vol.26, 2014
37
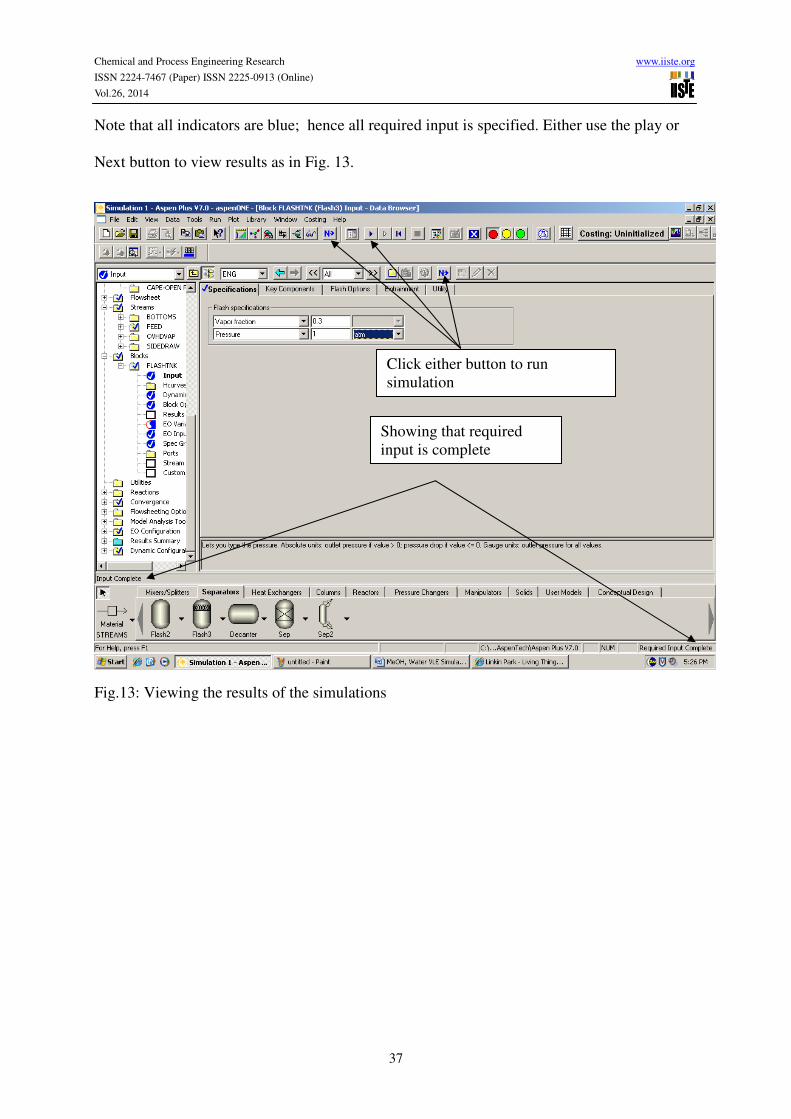
Note that all indicators are blue; hence all required input is specified. Either use the play or
Next button to view results as in Fig. 13.
Fig.13: Viewing the results of the simulations
Showing that required
input is complete
Click either button to run
simulation
Chemical and Process Engineering Research www.iiste.org
ISSN 2224-7467 (Paper) ISSN 2225-0913 (Online)
Vol.26, 2014
38
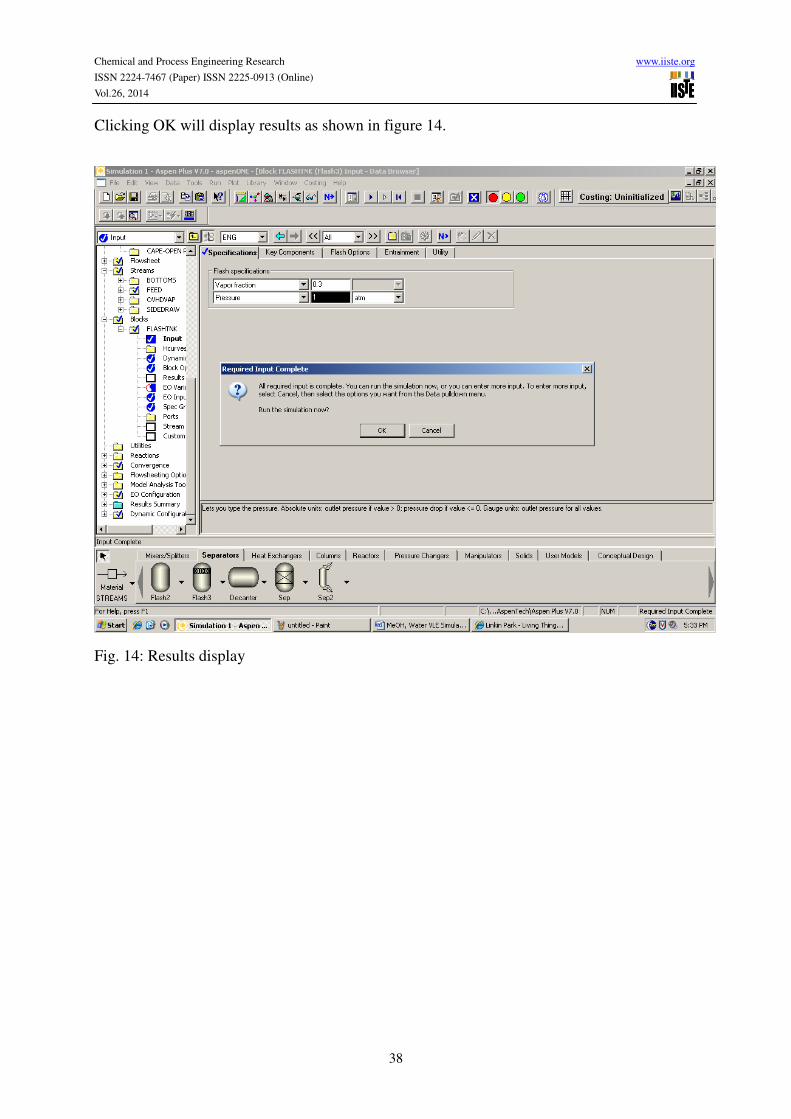
Clicking OK will display results as shown in figure 14.
Fig. 14: Results display
Chemical and Process Engineering Research www.iiste.org
ISSN 2224-7467 (Paper) ISSN 2225-0913 (Online)
Vol.26, 2014
39
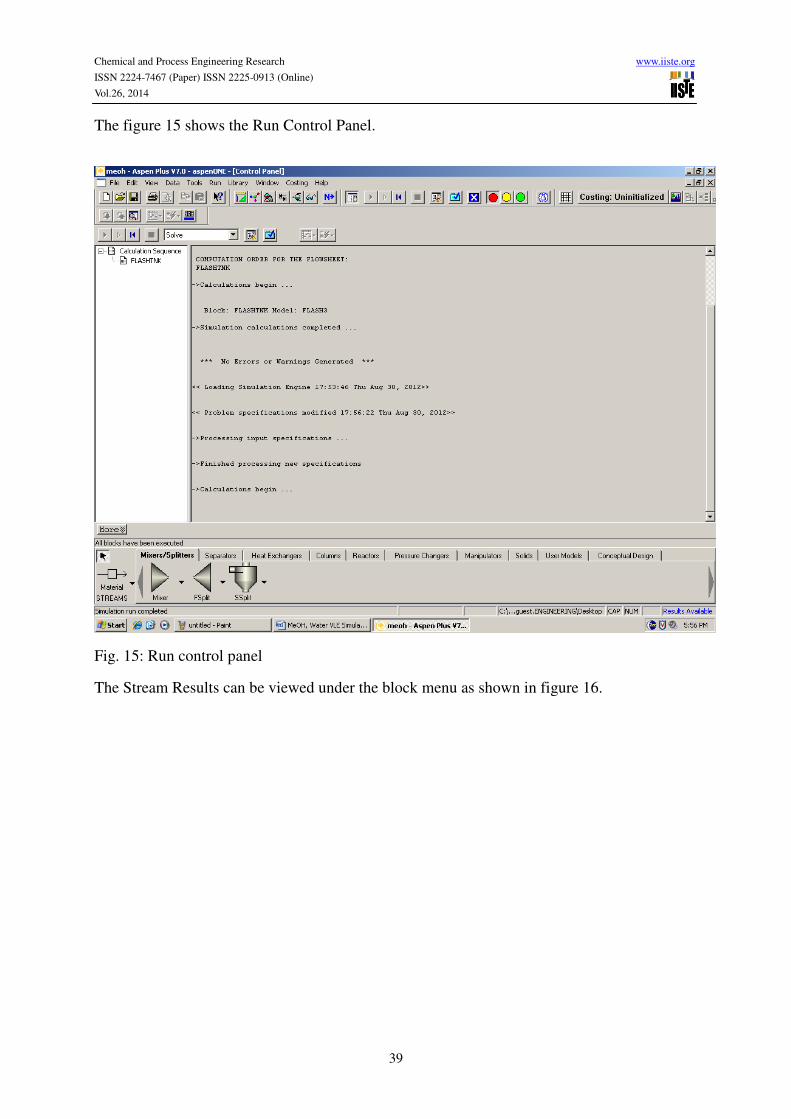
The figure 15 shows the Run Control Panel.
Fig. 15: Run control panel
The Stream Results can be viewed under the block menu as shown in figure 16.
Chemical and Process Engineering Research www.iiste.org
ISSN 2224-7467 (Paper) ISSN 2225-0913 (Online)
Vol.26, 2014
40
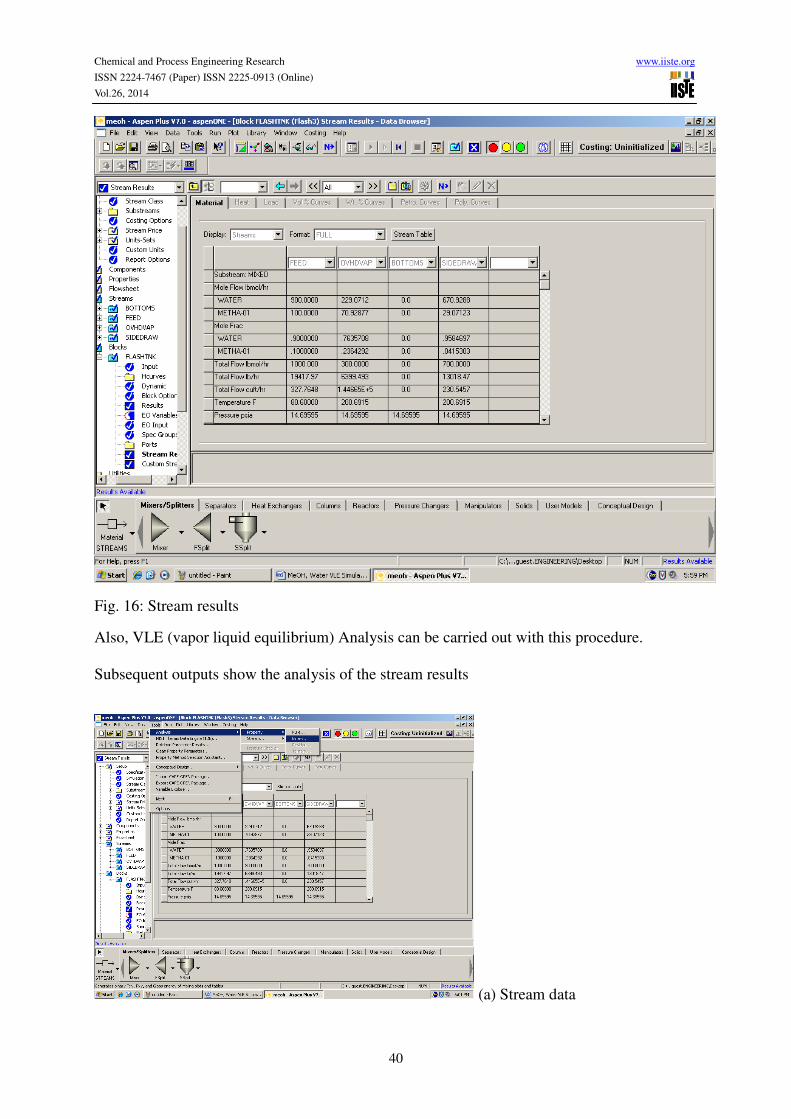
Fig. 16: Stream results
Also, VLE (vapor liquid equilibrium) Analysis can be carried out with this procedure.
Subsequent outputs show the analysis of the stream results
(a) Stream data
Chemical and Process Engineering Research www.iiste.org
ISSN 2224-7467 (Paper) ISSN 2225-0913 (Online)
Vol.26, 2014
41
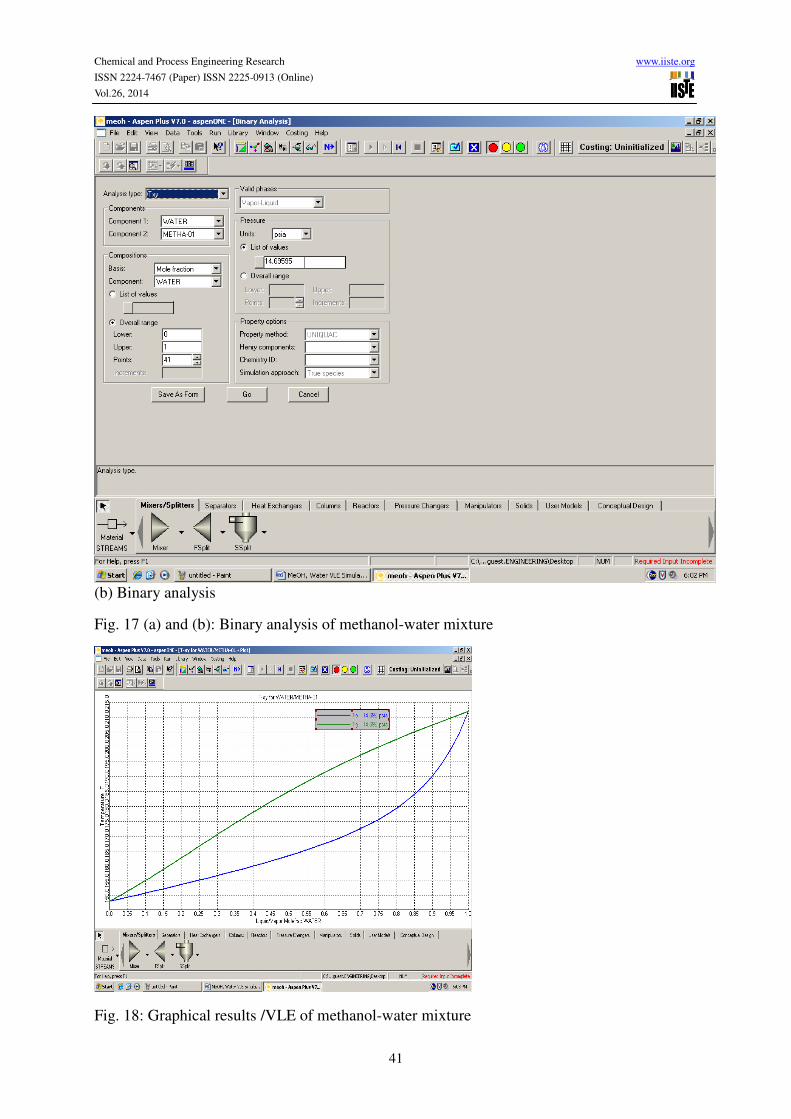
(b) Binary analysis
Fig. 17 (a) and (b): Binary analysis of methanol-water mixture
Fig. 18: Graphical results /VLE of methanol-water mixture
Chemical and Process Engineering Research www.iiste.org
ISSN 2224-7467 (Paper) ISSN 2225-0913 (Online)
Vol.26, 2014
42
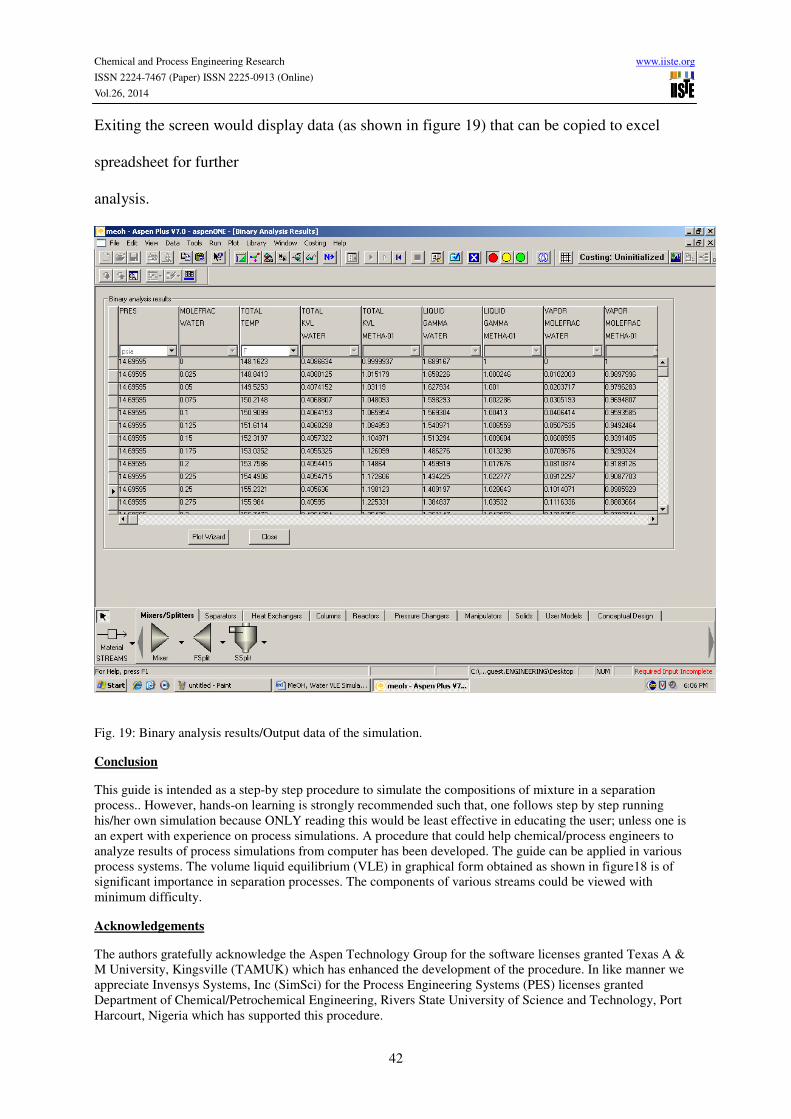
Exiting the screen would display data (as shown in figure 19) that can be copied to excel
spreadsheet for further
analysis.
Fig. 19: Binary analysis results/Output data of the simulation.
Conclusion
This guide is intended as a step-by step procedure to simulate the compositions of mixture in a separation
process.. However, hands-on learning is strongly recommended such that, one follows step by step running
his/her own simulation because ONLY reading this would be least effective in educating the user; unless one is
an expert with experience on process simulations. A procedure that could help chemical/process engineers to
analyze results of process simulations from computer has been developed. The guide can be applied in various
process systems. The volume liquid equilibrium (VLE) in graphical form obtained as shown in figure18 is of
significant importance in separation processes. The components of various streams could be viewed with
minimum difficulty.
Acknowledgements
The authors gratefully acknowledge the Aspen Technology Group for the software licenses granted Texas A &
M University, Kingsville (TAMUK) which has enhanced the development of the procedure. In like manner we
appreciate Invensys Systems, Inc (SimSci) for the Process Engineering Systems (PES) licenses granted
Department of Chemical/Petrochemical Engineering, Rivers State University of Science and Technology, Port
Harcourt, Nigeria which has supported this procedure.
Chemical and Process Engineering Research www.iiste.org
ISSN 2224-7467 (Paper) ISSN 2225-0913 (Online)
Vol.26, 2014
43
References
EzineArticles (2010): http://professional-edu.blogspot.com/2010/07/216-simulation-analysis.html Article
Source: http://EzineArticles.com/4763419 accessed on 15/06/2013
Peters, M. S., Timmerhaus, K. D. and West, R. E. (2004): Plant Design and Economics for Chemical Engineers,
Fifth Edition, The McGraw Hill Companies
Process Engineering Associates, LLC, Available online at: http://www.processengr.com / accessed on
27/08/2014
Turton, R., Bailie, R. C., Whiting, W. B. and Shaeiwitz, J. A (2009): Analysis, Synthesis, and Design of
Chemical Processes, Third Edition. Prentice Hall International Series
Ujile, A. and Amagbo, L. G. (2013): Determination of Plate Efficiency of Rectification Column in Refinery
Operations; International Journal of Engineering and Technology Volume 3 No. 8, August, 2013
Wharton University of Pennsylvania, Available online at: http://opim.wharton.upenn.edu/~sok/phillydistricts/
accessed on 15/06/2013
Woller, S (1996): The Basics of Monte Carlo Simulations, Available online at: http://www.Solver.com/Monte-
Carlo accessed on 14/06/2013
The IISTE is a pioneer in the Open-Access hosting service and academic event
management. The aim of the firm is Accelerating Global Knowledge Sharing.
More information about the firm can be found on the homepage:
http://www.iiste.org
CALL FOR JOURNAL PAPERS
There are more than 30 peer-reviewed academic journals hosted under the hosting
platform.
Prospective authors of journals can find the submission instruction on the
following page: http://www.iiste.org/journals/ All the journals articles are available
online to the readers all over the world without financial, legal, or technical barriers
other than those inseparable from gaining access to the internet itself. Paper version
of the journals is also available upon request of readers and authors.
MORE RESOURCES
Book publication information: http://www.iiste.org/book/
IISTE Knowledge Sharing Partners
EBSCO, Index Copernicus, Ulrich's Periodicals Directory, JournalTOCS, PKP Open
Archives Harvester, Bielefeld Academic Search Engine, Elektronische
Zeitschriftenbibliothek EZB, Open J-Gate, OCLC WorldCat, Universe Digtial
Library , NewJour, Google Scholar
Related Documents