Developing an Integrated Assessment Model for South Asia IAMs have proved useful in Europe for developing regional agreements on air pollution control. How can they help South Asia? • What can it be used for? • What questions can it answer? • What is the structure? • What are the different stages in the development?

Developing an Integrated Assessment Model for South Asia IAMs have proved useful in Europe for developing regional agreements on air pollution control.
Dec 28, 2015
Welcome message from author
This document is posted to help you gain knowledge. Please leave a comment to let me know what you think about it! Share it to your friends and learn new things together.
Transcript
Developing an Integrated Assessment Model for South Asia
IAMs have proved useful in Europe for developing regional agreements on air pollution control. How can they help South Asia?
• What can it be used for?
• What questions can it answer?
• What is the structure?
• What are the different stages in the development?
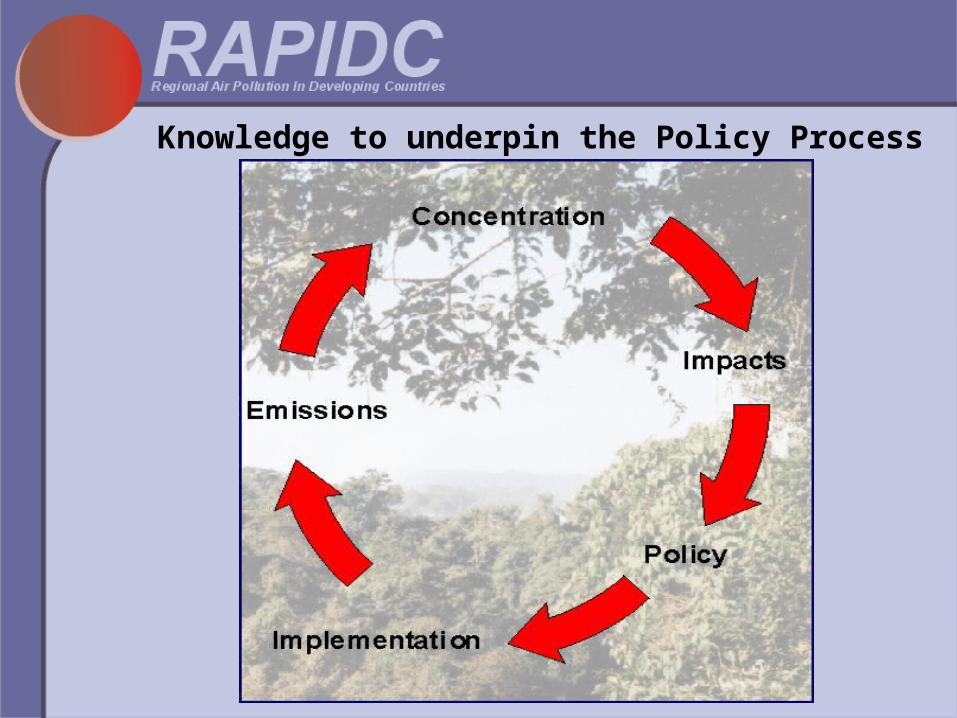
Knowledge to underpin the Policy Process
Developing an Integrated Assessment Model for South Asia
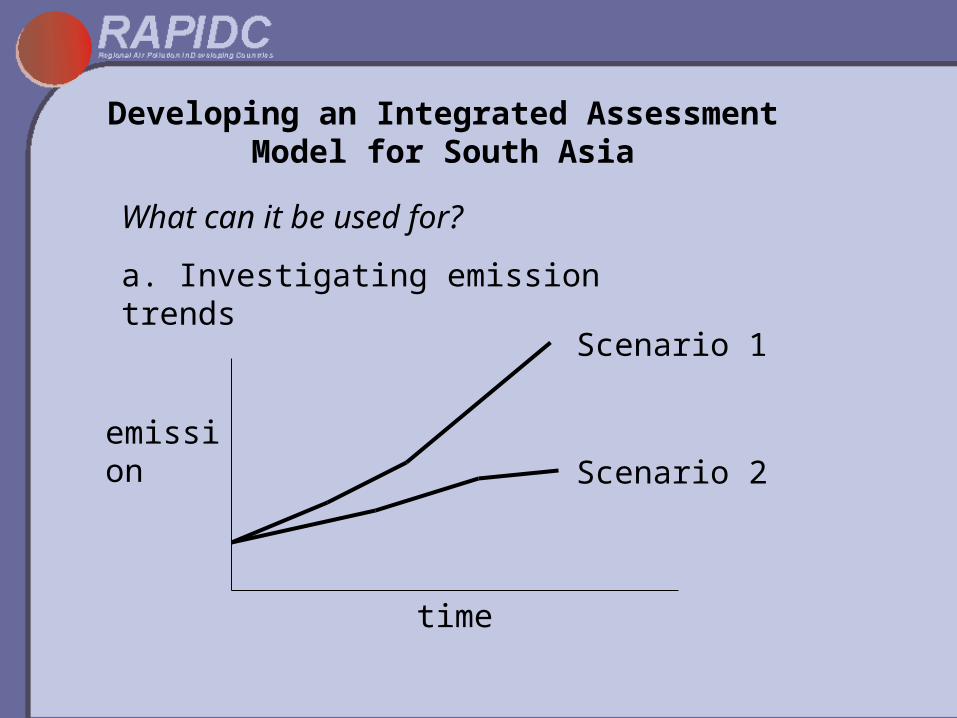
What can it be used for?
a. Investigating emission trends
time
emission
Scenario 1
Scenario 2
Developing an Integrated Assessment Model for South Asia
What can it be used for?
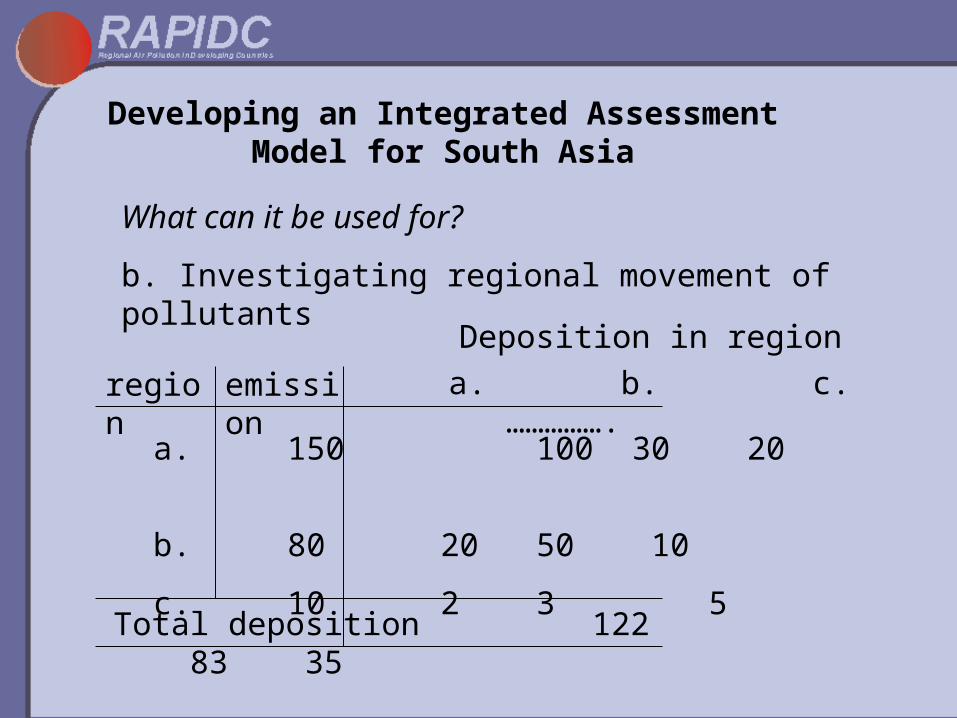
b. Investigating regional movement of pollutants
emissionregion
a. 150 100 30 20
b. 80 20 50 10
c. 10 2 3 5
Deposition in region
a. b. c. …………….
Total deposition 122 83 35

Developing an Integrated Assessment Model for South Asia
What can it be used for?
c. Assessing risks of impacts

Developing an Integrated Assessment Model for South Asia
What can it be used for?
d. Developing cost-effective strategies to limit air pollution
time
emission
Scenario 1
Strategy b.
Strategy a.
Developing an Integrated Assessment Model for South Asia
Phases in Model Development
Phase I: develop model structure using internationally available data – allow NIA familiarity with model (2003)
Phase II: develop national emission inventories and ecosystem impact data for use in the model and complete the transfer of MATCH model to Asia (2004-2006)
Phase III: further develop the model to include otherpollutants such as ozone, PM10 and PM2.5, and impacts such as crop yield losses, corrosion, visibility and health (2006-)
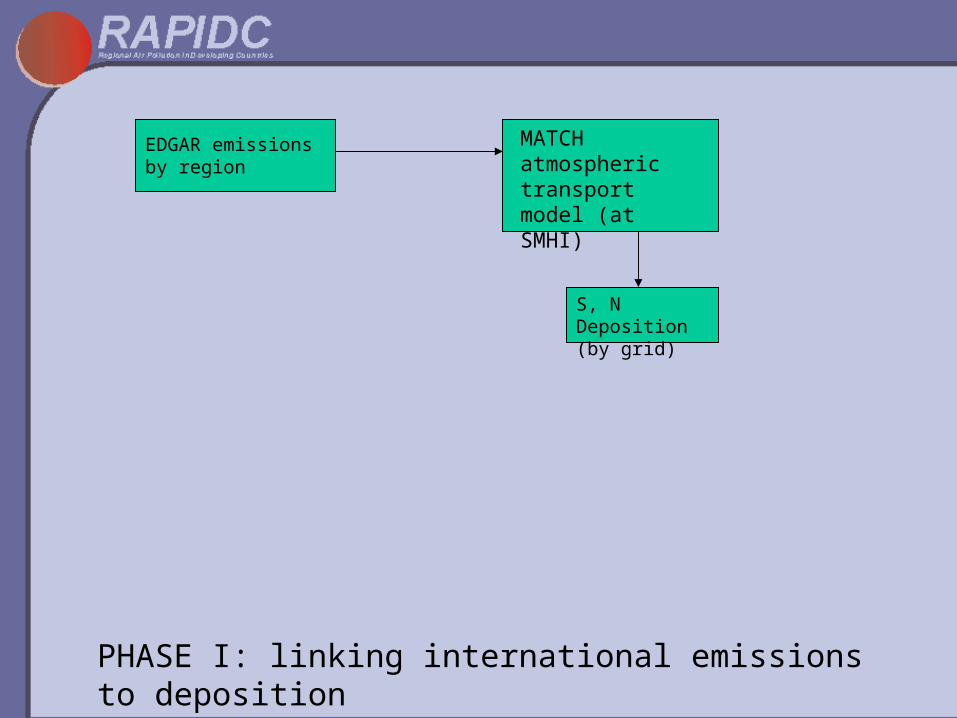
EDGAR emissions by region
MATCH atmospheric transport model (at SMHI)
S, N Deposition (by grid)
PHASE I: linking international emissions to deposition

EDGAR emissions of sulphur in S Asia
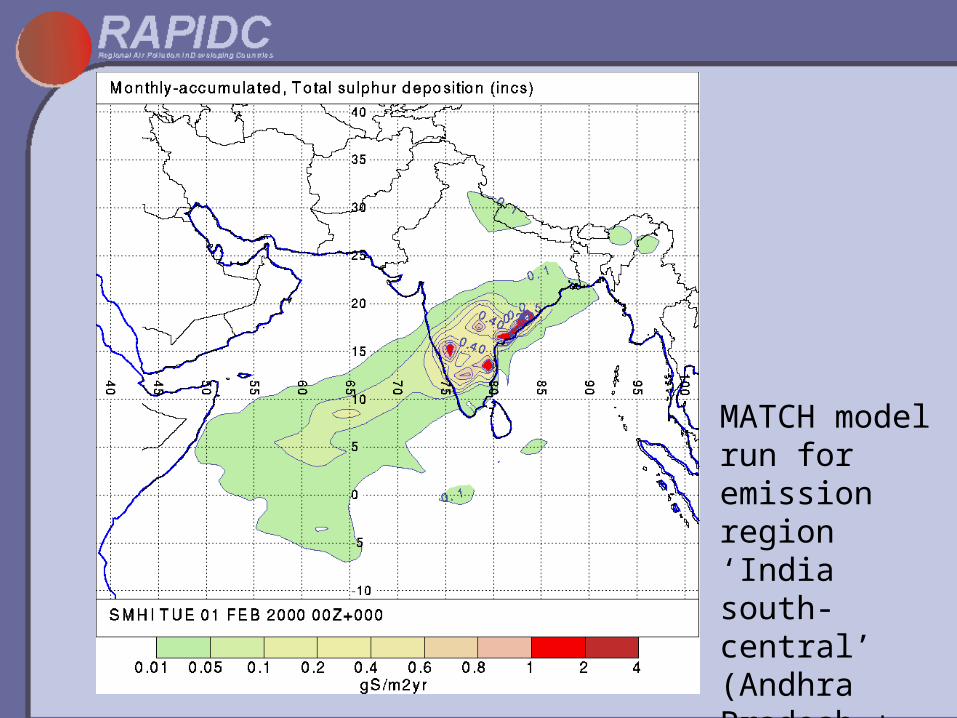
MATCH model run for emission region ‘India south-central’ (Andhra Pradesh + Karnataka + Goa)
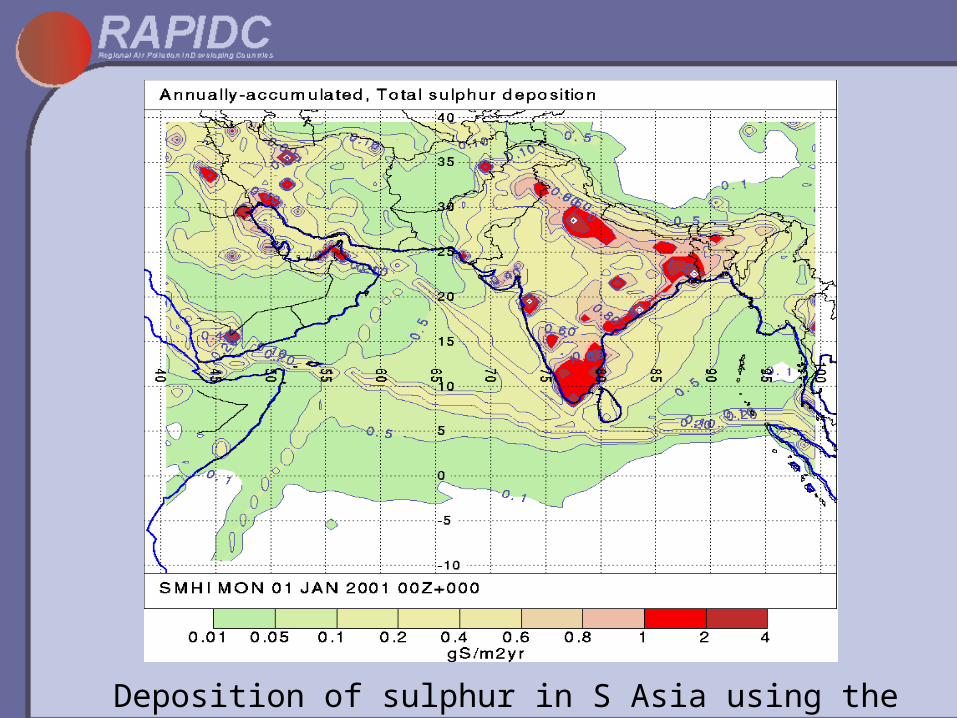
Deposition of sulphur in S Asia using the MATCH model
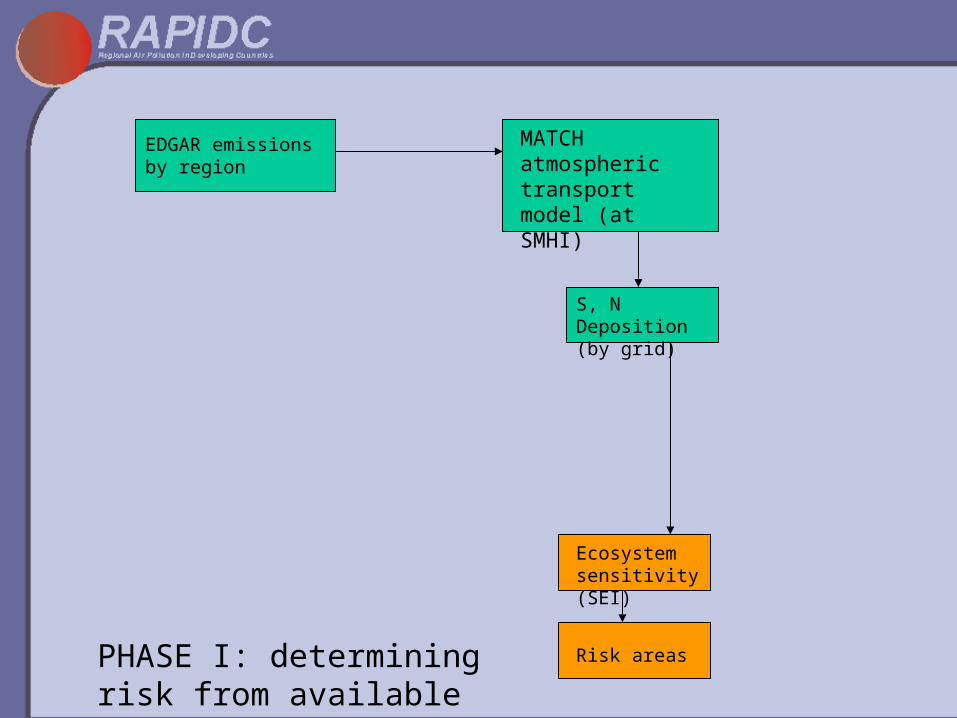
EDGAR emissions by region
MATCH atmospheric transport model (at SMHI)
Ecosystem sensitivity (SEI)
Risk areas
S, N Deposition (by grid)
PHASE I: determining risk from available maps
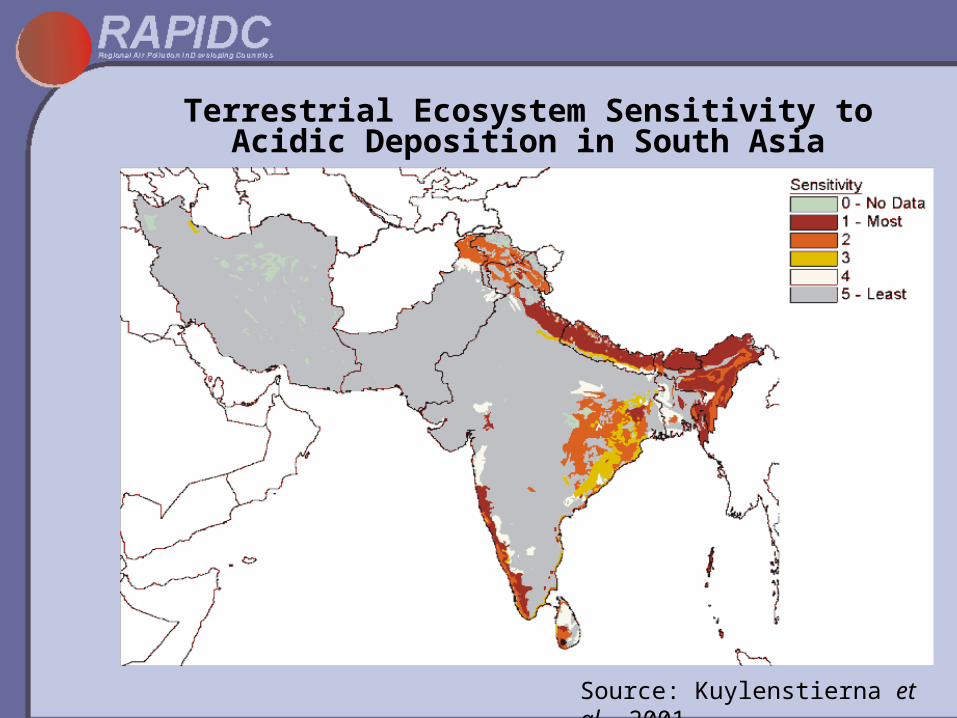
Terrestrial Ecosystem Sensitivity to Acidic Deposition in South Asia
Source: Kuylenstierna et al. 2001
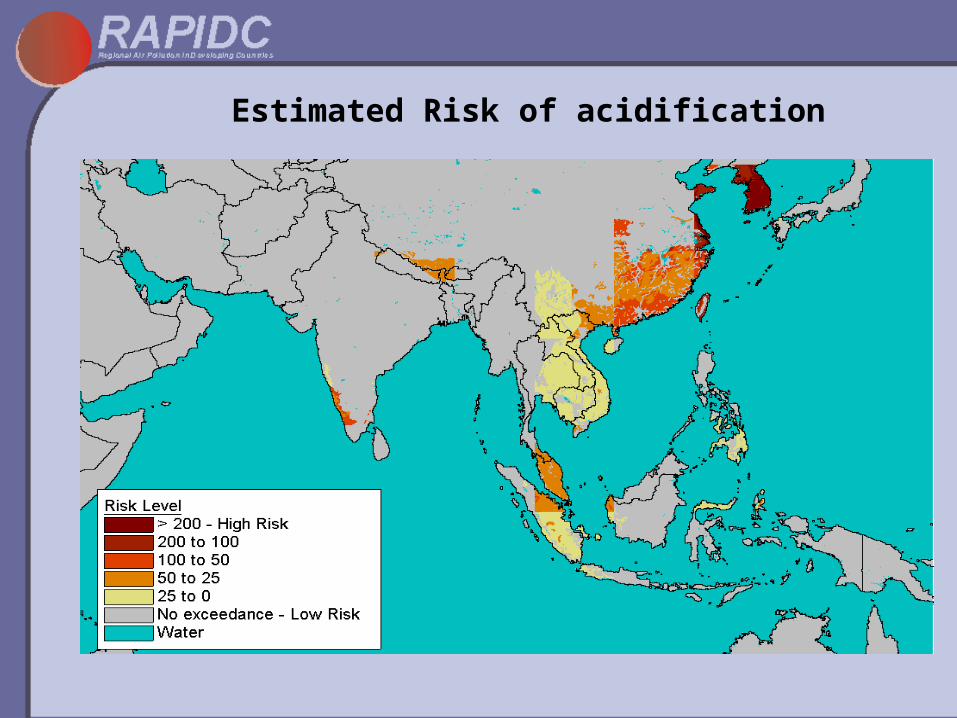
Estimated Risk of acidification
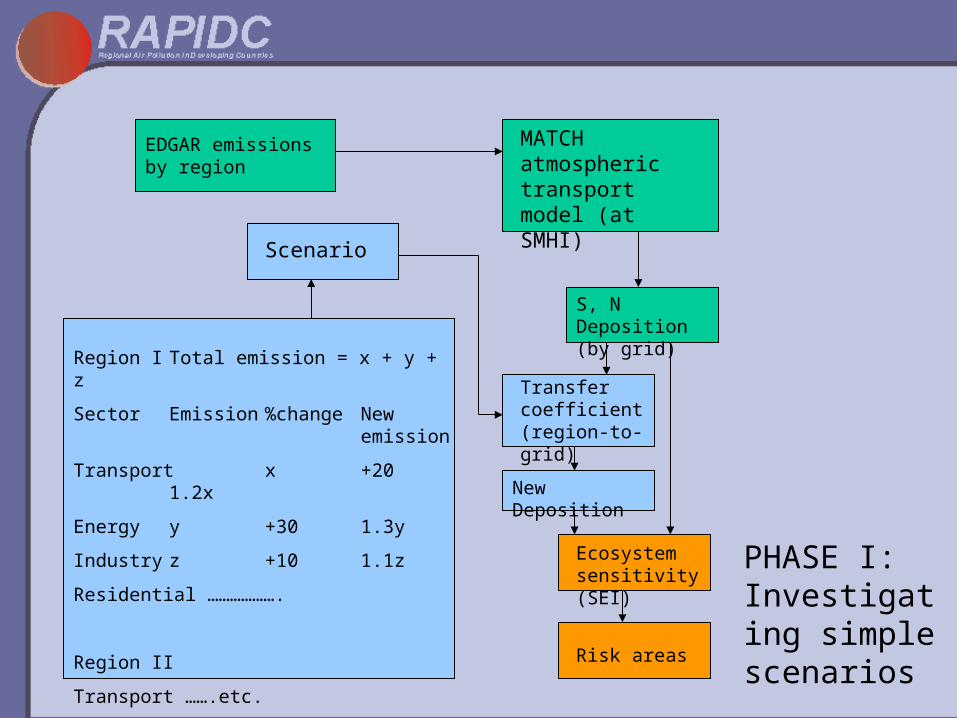
EDGAR emissions by region
Region I Total emission = x + y + z
Sector Emission %change New emission
Transport x +20 1.2x
Energy y +30 1.3y
Industry z +10 1.1z
Residential ……………….
Region II
Transport …….etc.
MATCH atmospheric transport model (at SMHI)
Transfer coefficient (region-to-grid)
Ecosystem sensitivity (SEI)
Risk areas
Scenario
New Deposition
S, N Deposition (by grid)
PHASE I: Investigating simple scenarios
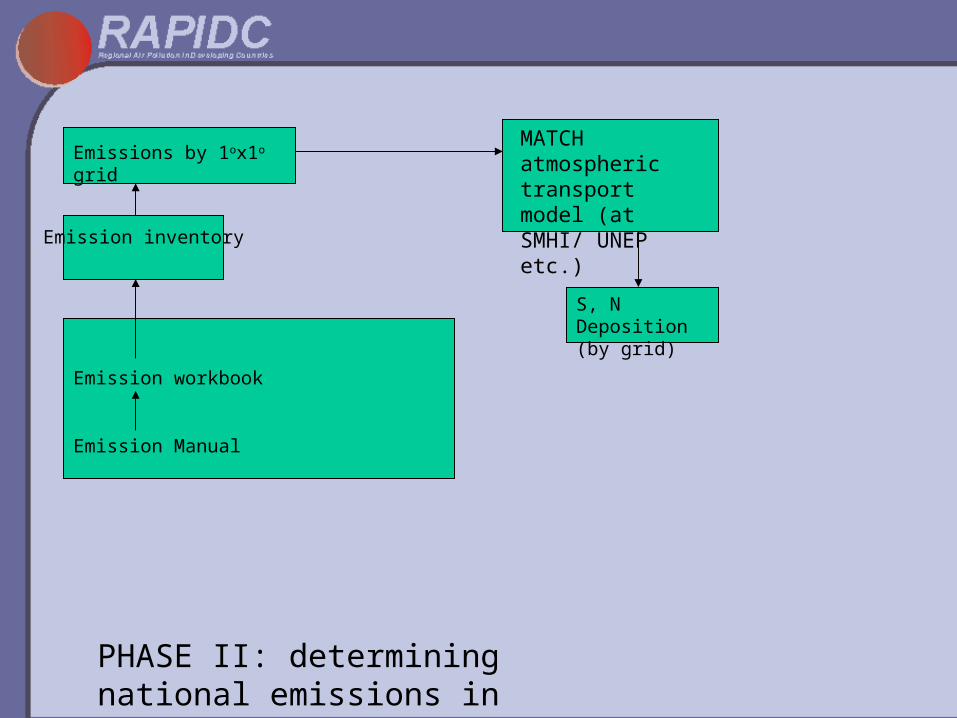
Emission workbook
Emission Manual
MATCH atmospheric transport model (at SMHI/ UNEP etc.)
Emission inventory
Emissions by 1ox1o grid
S, N Deposition (by grid)
PHASE II: determining national emissions in S Asia
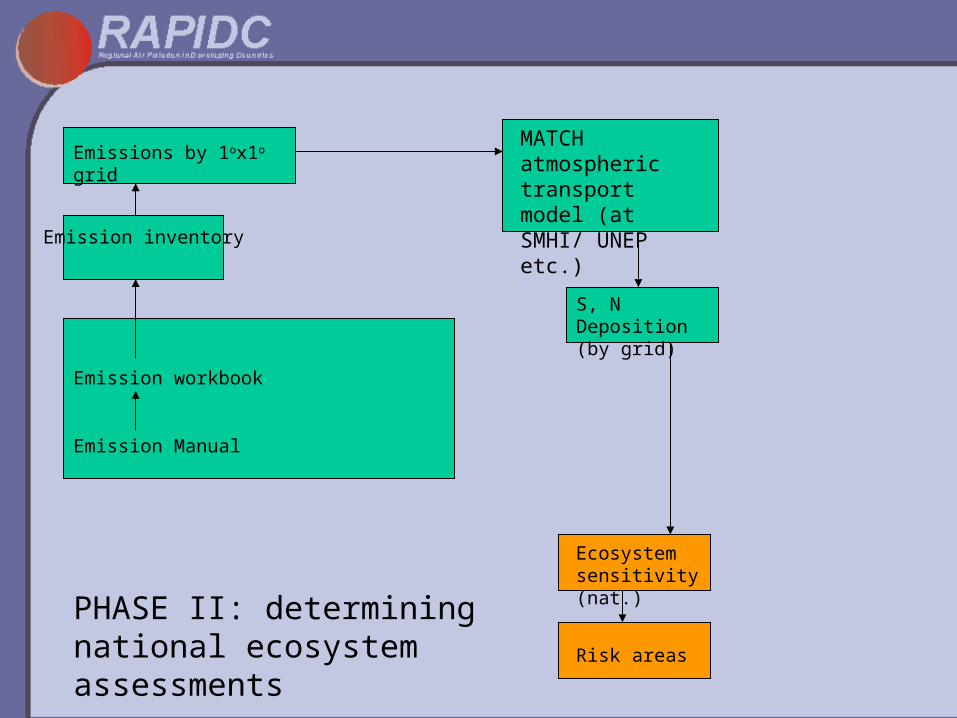
Emission workbook
Emission Manual
MATCH atmospheric transport model (at SMHI/ UNEP etc.)
Emission inventory
Emissions by 1ox1o grid
Ecosystem sensitivity (nat.)
Risk areas
S, N Deposition (by grid)
PHASE II: determining national ecosystem assessments
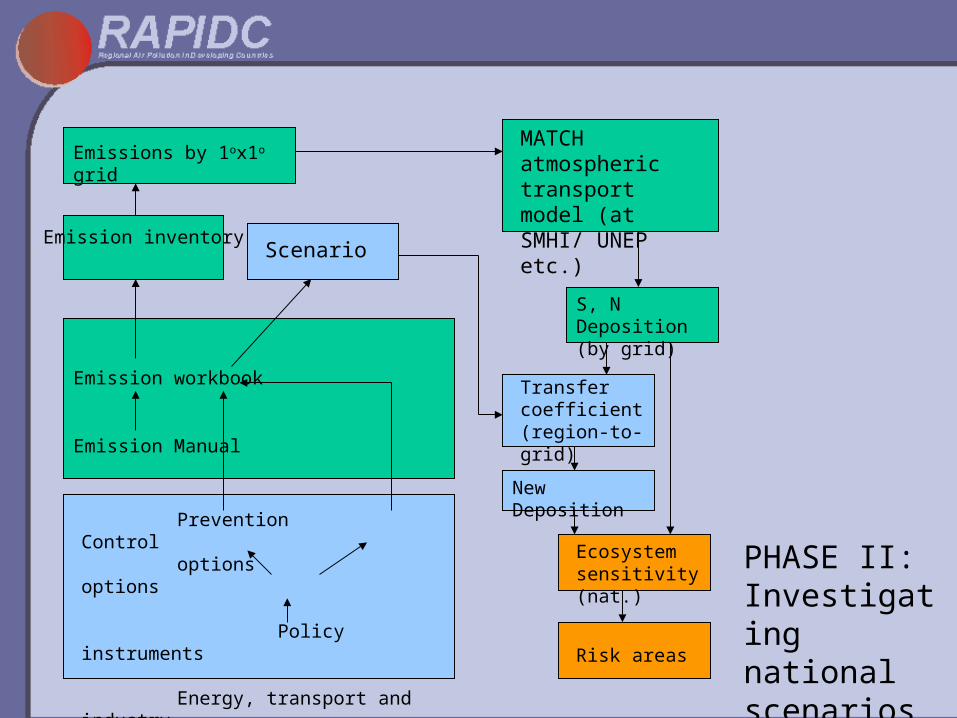
Emission workbook
Emission Manual
Ecosystem sensitivity (nat.)
Risk areas
ScenarioEmission inventory
Prevention Controloptions options
Policy instruments
Energy, transport and industryscenarios
Emissions by 1ox1o grid
New Deposition
Transfer coefficient (region-to-grid)
S, N Deposition (by grid)
MATCH atmospheric transport model (at SMHI/ UNEP etc.)
PHASE II: Investigating national scenarios
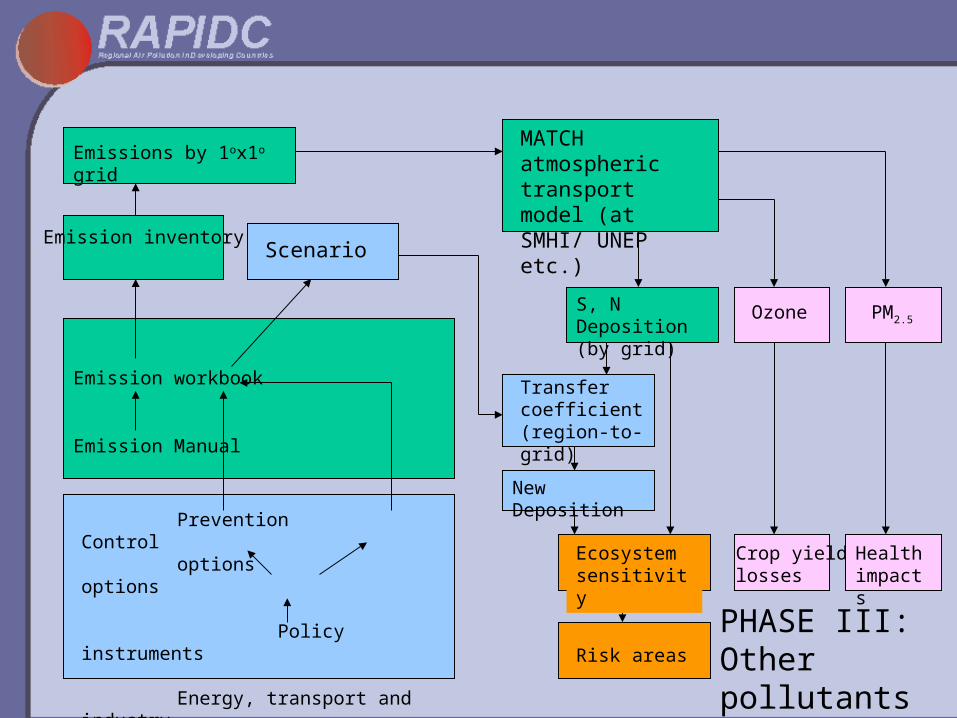
Emission workbook
Emission Manual
S, N Deposition (by grid)
Ecosystem sensitivity
Risk areas
ScenarioEmission inventory
Prevention Controloptions options
Policy instruments
Energy, transport and industryscenarios
Emissions by 1ox1o grid
Health impacts
Ozone PM2.5
Crop yield losses
New Deposition
Transfer coefficient (region-to-grid)
MATCH atmospheric transport model (at SMHI/ UNEP etc.)
PHASE III: Other pollutants and impacts
Related Documents