DEVELOPING AN EXPERT SYSTEM FOR GP IMPLEMENTATION RUBY PINEDA-HENSON Department of Industrial Engineering Holy Angel University-Angeles City, Philippines [email protected] ALVIN B. CULABA Department of Mechanical Engieering De La Salle University-Manila, Philippines [email protected]

DEVELOPING AN EXPERT SYSTEM FOR GP IMPLEMENTATION RUBY PINEDA-HENSON Department of Industrial Engineering Holy Angel University-Angeles City, Philippines.
Dec 26, 2015
Welcome message from author
This document is posted to help you gain knowledge. Please leave a comment to let me know what you think about it! Share it to your friends and learn new things together.
Transcript

DEVELOPING AN EXPERT SYSTEM FOR GP IMPLEMENTATION
RUBY PINEDA-HENSON
Department of Industrial Engineering
Holy Angel University-Angeles City, Philippines
ALVIN B. CULABA
Department of Mechanical Engieering
De La Salle University-Manila, Philippines [email protected]

OUTLINE OF PRESENTATIONINTRODUCTIONRATIONALE FOR GP MODELEXPERT SYSTEMS METHODOLOGYGP MODEL DEVELOPMENTAPPLICATION TO GP ANALYSIS OF
SEMICONDUCTOR ASSEMBLY/PACKAGING
CONCLUSION/ RECOMMENDATION

PRODUCTIVITY
IMPROVEMENT
FRAMEWORK FOR CONTINUOUS IMPROVEMENT
ENVIRONMENTAL PERFORMANCE
GREEN PRODUCTIVITY PARADIGM
FOUNDATION FOR
SUSTAINABLE DEVELOPMENT

RATIONALE FOR GP MODEL
LIFE CYCLE ASSESSMENT - THE TECHNICAL FRAMEWORK
ANALYTIC HIERARCHY PROCESS- MULTICRITERIA DECISION MAKING(MCDM) MODEL AND TOOL

LIFE CYCLE ASSESSMENT
Streamlined LCAProcess-Based Phased Approach Inventory Analysis Impact Assessment Improvement Assessment

IMPACT ANALYSIS IMPROVEMENT Analysis
INVENTORY ANALYSIS
PRODUCTS/ COPRODUCTS
EMISSIONS TO LAND
OTHER RELEASES
EMISSIONS TO WATER
Ancillary Materials
Energy
Raw Materials
EMISSIONS TO AIR
1
n
2
3
OPTION 1
OPTION 2
OPTION 3
OPTION 4
OPTION j
GREEN PRODUCTIVITY PERFORMANCE
IMPACT 5
IMPACT 1
IMPACT 2
IMPACT 3
IMPACT 4
IMPACT i
UNIT PROCESSESINPUTS OUTPUTS IMPACTS IMPROVEMENT TECHNIQUES
GREEN PRODUCTIVITY INDICATORS

ANALYTIC HIERARCHY PROCESS Pairwise ComparisonMechanism For Consistency CheckA Panel Of Experts May Be
Utilized Geometric Means Of Comparison
Ratings

EXPERT SYSTEMS TECHNOLOGY
The potential of expert system technology is explored to develop a software that emulates how human experts diagnose GP performance of manufacturing processes.

Expert systems (ES) are computer programs that use expert knowledge and heuristics or rules of thumb to solve problems in a specific domain.

Complex decision analysis may involve an intricate combination of facts and heuristic knowledge which is organized into three distinct components:
Knowledge BaseWorking MemoryInference Engine

GP DIAGNOSTIC SOFTWARE Front-end database system (Visual FoxPro) Windows shell program/interface CLIPS (C Language Integrated Production
System) expert systemThe shell program embeds the ES. The
Dynamic Data Exchange (DDE) feature of Windows operating environment is used to transmit data to and from the two program ends.

GP MODEL DEVELOPMENT
Sub-ModelsInventory AnalysisImpact AnalysisImprovement AnalysisGreen Productivity Assessment

Figure 2. Green Productivity ES Model Structure
InventoryAnalysis
-------------------------Input Data
Output Data
EnvironmentalImpact
Analysis-------------------------
ClassificationValuation
ProductivityImprovement
Analysis-------------------------
Classification Valuation
Green Productivity (GP) Assessment
-------------------------GP RatiosGP Indices
Knowledge Base
Multicriteria Decision Analysis (Analytic Hierarchy Process)
Input - Output Analysis

DIAGNOSTIC MODEL FEATURES
The inventory module prompts the user for inventory data on the manufacturing process.
The diagnostic module, through an embedded expert system program, performs impact classification on the inventory data.

EXAMPLE In impact classification, pseudo-rules which are asserted as
facts in the knowledge base links an input or output indicator substance found in the inventory to an impact category or classification. For example:
IF [process input deionized water] and [deionized water >0]
THEN [environmental impact water resource depletion]
IF [process output mold runners] and [mold runners >0]
THEN [environmental impact terrestrial ecotoxicity]

Table 1. Environmental Impact Factors for Semiconductor Assembly Packaging
Impact Factors IndicatorWater Resource Depletion (WRD) Cooling Water, Deionized WaterEnergy Resource Depletion (ERD) Electricity, Thermal EnergyHuman Toxicity in Air (HTA) SO2, NO2, CO,VOCs, Arsine, Phosphine
Metallic (Pb) vaporsHuman Toxicity in Water (HTW) Sulfuric acid, hydrochloric acid, phosphoric acid,
nitric acid, acetic acid, methanesulfonic acidHuman Toxicity in Land (HTL) Heavy metals: Pb, Al, Ni, Cd, Cr, As, SnAquatic Ecotoxicity (ETA) Isopropanol, acetone, N-butyl acetate,
trichloroethylene, xylene, petroleum distillates,halocarbons, Methylene chloride
Terrestrial Ecotoxicity (ETT) Plastics, epoxies, glues, flux, off-specificationproducts or rejects, molding compound, moldrunners, melamine, waste plastics, mold runners

Reads environmental impact and improvement priority weights from AHP calculations as well as green productivity performance ratios and indices.
Using an interface program between the database and the expert system, knowledge processing is performed on the passed parameters

The output consists of diagnostic advice on the result of inventory analysis, impact assessment, improvement assessment and green productivity assessment.

APPLICATION TO GP ANALYSIS OF SEMICONDUCTOR ASSEMBLY/PACKAGING

PRODUCTS/ COPRODUCTS
EMISSIONS TO LAND
OTHER RELEASES
EMISSIONS TO WATER
Ancillary Materials
Energy
Raw Materials
EMISSIONS TO AIR
1
n
2
3
MATERIAL -BASED
ENERGY -BASED
PROCESS -BASED
PRODUCT -BASED
MANAGEMENT -BASED
GREEN PRODUCTIVITY PERFORMANCE
HUMAN TOXICITY: Water
emission
WATER RESOURCE DEPLETION
ENERGY RESOURCEDEPLETION
HUMAN TOXICITY: Air emission
HUMAN TOXICITY:
Land emission
ECOTOXICITY: -Aquatic
ECOTOXICITY- Terrestrial
UNIT PROCESSES
INPUTS OUTPUTS IMPACTS IMPROVEMENT TECHNIQUES
PERFORMANCE INDICATORS
IMPACT ANALYSIS
IMPROVEMENT ANALYSIS
PROCESS INVENTORY ANALYSIS
Conceptual Framework for Green Productivity Analysis Applied to Semiconductor Assembly/Packaging

FIRST LEVEL ASSEMBLY
DIE PREPARATION
DIE ATTACH
FLUX CLEAN
MOLD/ POST MOLD
WASTEWATER TREATMENT
DEIONIZED WATER
PRODUCTION
SOLDER PLATE / POST
SOLDER CLEAN
FINAL TEST, MARK,PACK
Semiconductor product
DieLeadframe
Used Solvent
Reuse
Waste Water
Wafer
Ancillary Processes
DI Water
LEGEND Input/ ProductWaste/ emissionReuse/ Recycle
DI Water
Waste Water
Semiconductor Assembly/ Packaging Process Flowchart

PROCESSES
DIE PREPARATIONFIRST LEVEL ASSEMBLYDIE ATTACHFLUX CLEANINGMOLDING/POSTMOLD CURESOLDER/POST SOLDER CLEANTESTING

INVENTORY DATA
SCENARIO 1 : BASE PERIOD
SCENARIO 2 : PLC MODIFICATION IN THE MOLDING PROCESS

Input - Output AnalysisMassin = Massout (1)
Energyin = Energyout (2)
The total amount of a specific material m for i unit processes is: n
M = m (3) i=1
The total amount of specific energy e for i unit processes is:
n
E = e (4) i=1
The total amount of a specific waste or emission from a unit process (i) to medium (j ),where j = 1 to 3 corresponding to air, water or land and for n unit processes is:
EijEij = (5)
n
i 1
3
1j

SEVEN IMPACT CLASSIFICATION
WATER RESOURCE DEPLETION -WRDENERGY RESOURCE DEPLETION-ERDHUMAN TOXICITY ON AIR - HTAHUMAN TOXICITY ON WATER - HTWHUMAN TOXICITY ON LAND - HTLAQUATIC ECOTOXICITY - ETATERRESTRIAL ECOTOXICITY - ETT

IMPROVEMENT TECHNIQUES
MATERIAL-BASED (MBT)ENERGY-BASED (EBT)PROCESS OR EQUIPMENT-BASED (PET)PRODUCT-BASED (PBT)MANAGEMENT-BASED (MGMT)

GREEN PRODUCTIVITY OF SEMICONDUCTOR ASSEMBLY / PACKAGING
WaterResource Depletion
Level 1Goal : Green Productivity
Level 2Factors:Impact
Level 3Alternative /Schemes:Improvement Techniques
Energy Resource Depletion
EcotoxicityAquatic
HumanToxicityWater
Human ToxicityLand
Human ToxicityAir
EcotoxicityTerrestrial
Management Based
Product BasedProcess BasedEnergyBased
MaterialBased
Decision Hierarchy Structure for Green Productivity Analysis of Semiconductor Assembly/Packaging

• Aj = Wi Kij i = 1, 2, …n impact factors
• j = 1, 2, …m options
• where Wi = the relative weight of impact factor i with respect to the over-all goal
• Kij = relative weight of option j with respect to impact i
• Aj = priority weight of option j.

Table 2 Relative Weights of Options (Aj) to Improve Green Productivity Performance
of Semiconductor Assembly/Packaging
AggregateRESULTImpacts WRD ERD HTA HTL HTW ETA ETT
Relative weight of impacts, Wi 0.14 0.13 0.13 0.15 0.12 0.12 0.21
Options Relative weight of options with reference to impacts, Kij Aj
MBT 0.19 0.15 0.24 0.42 0.26 0.31 0.34 0.28
EBT 0.17 0.32 0.16 0.15 0.15 0.16 0.14 0.18
PET 0.38 0.30 0.27 0.24 0.25 0.22 0.24 0.27
PBT 0.12 0.10 0.13 0.12 0.13 0.14 0.11 0.12
MGMT 0.14 0.13 0.19 0.14 0.21 0.17 0.18 0.17

GREEN PRODUCTIVITY INDICATORS
BASED ON MATERIAL/ENERGY UTILIZATION:
Water Utilization Ratio (MUR) = kg product /kg water input

BASED ON ENERGY UTILIZATION:Energy Utilization Ratio (EUR) = kg product/kWh energy input

SPECIFIC WASTE OR EMISSION RATIOS
BASED ON WASTE MINIMIZATION:Waste Ratio or Emission Ratio (WR/ER) = kg waste or emission/kg total material
input

GREEN PRODUCTIVITY INDEX
GP INDEX OF “1” IS ASSIGNED TO THE BASE PERIOD AND GP INDEX FOR TEST SCENARIO IS DETERMINED

FOR TEST SCENARIO
FOR MATERIAL/ENERGY PRODUCTIVITY:
IF GP INDEX > 1 , GP IMPROVEMENT IF GP INDEX <1, GP DECLINE FOR WASTE OR EMISSION INDICES: IF GP INDEX > 1 , GP DECLINE IF GP INDEX < 1 , GP IMPROVEMENT
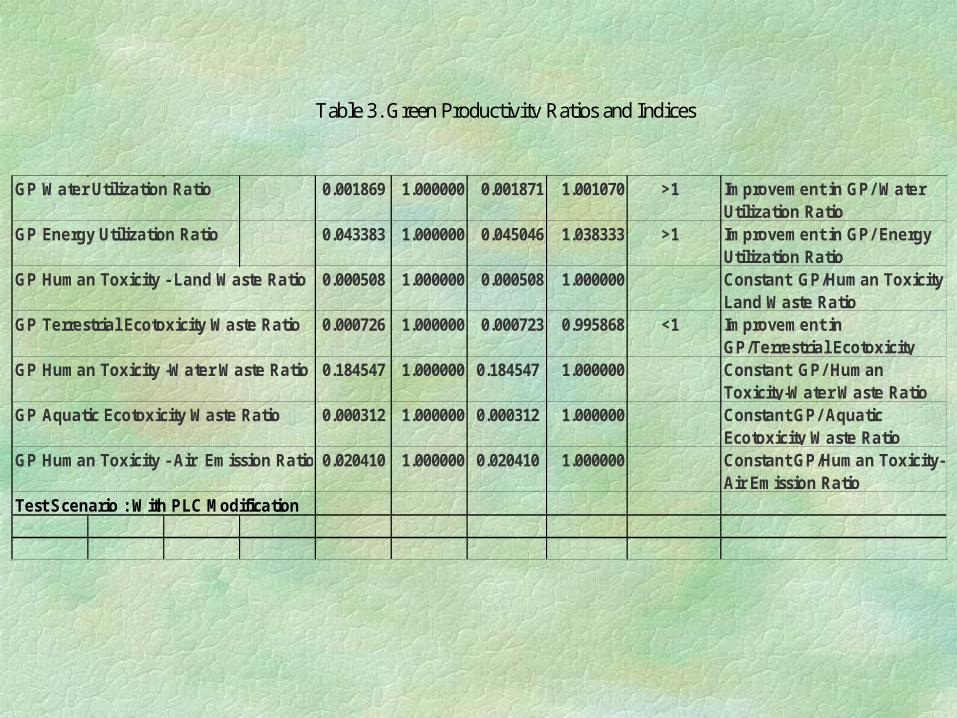
Table 3. Green Productivity Ratios and Indices
GP Water Utilization Ratio 0.001869 1.000000 0.001871 1.001070 >1 Improvement in GP/ Water Utilization Ratio
GP Energy Utilization Ratio 0.043383 1.000000 0.045046 1.038333 >1 Improvement in GP/ Energy Utilization Ratio
GP Human Toxicity - Land Waste Ratio 0.000508 1.000000 0.000508 1.000000 Constant GP/Human Toxicity-Land Waste Ratio
GP Terrestrial Ecotoxicity Waste Ratio 0.000726 1.000000 0.000723 0.995868 <1 Improvement in GP/Terrestrial Ecotoxicity
GP Human Toxicity -Water Waste Ratio 0.184547 1.000000 0.184547 1.000000 Constant GP/ Human Toxicity-Water Waste Ratio
GP Aquatic Ecotoxicity Waste Ratio 0.000312 1.000000 0.000312 1.000000 Constant GP/ Aquatic Ecotoxicity Waste Ratio
GP Human Toxicity - Air Emission Ratio 0.020410 1.000000 0.020410 1.000000 Constant GP/Human Toxicity-Air Emission Ratio
Test Scenario : With PLC Modification

CONCLUSION/RECOMMENDATION
The assessment methodology and computerized diagnostic prototype may be utilized as an internal management or self-assessment tool by companies in their continuous GP improvement strategies.
The application of expert systems technology is particularly appropriate to provide flexibility in testing assumptions and in preserving valuable human expertise on green productivity implementation in the manufacturing industry.

Enhancements may be made in future versions with more powerful analysis engine, sufficient database and comprehensive scope of GP analysis to include all life cycle stages.

ACKNOWLEDGEMENT
Asian Productivity Organization (APO) for the materials on Green Productivity
Semiconductor and Electronics Industries of the Philippines (SEIPI) and the Association of Electronics and Semiconductors for Safety and Environment Protection (AESSEP) for their favorable endorsement of the study to some member-semiconductor companies which provided the necessary data and information for this research.
Related Documents