1 DETERMINATION OF PBDEs IN HUMAN BREAST ADIPOSE TISSUES BY GAS CHROMATOGRAPHY COUPLED TO TRIPLE QUADRUPOLE MASS SPECTROMETRY C. M. Medina, E. Pitarch, F.J. López, F. Hernández* Research Institute for Pesticides and Water, University Jaume I, Castellón, Spain. Tel: 34-964-387366, Fax: 34-964-387368, E-mail: [email protected] Page 1 of 35 Analytical & Bioanalytical Chemistry

Welcome message from author
This document is posted to help you gain knowledge. Please leave a comment to let me know what you think about it! Share it to your friends and learn new things together.
Transcript

1
DETERMINATION OF PBDEs IN HUMAN BREAST ADIPOSE TISSUES BY
GAS CHROMATOGRAPHY COUPLED TO TRIPLE QUADRUPOLE MASS
SPECTROMETRY
C. M. Medina, E. Pitarch, F.J. López, F. Hernández*
Research Institute for Pesticides and Water, University Jaume I, Castellón, Spain.
Tel: 34-964-387366, Fax: 34-964-387368, E-mail: [email protected]
Page 1 of 35 Analytical & Bioanalytical Chemistry

2
ABSTRACT
The potential of gas chromatography / tandem mass spectrometry with triple quadrupole
analyzer for determination of 12 polybrominated diphenyl ethers in human breast
tissues has been investigated. After extraction with hexane, two purification procedures
-automated normal-phase HPLC and solid phase extraction – were assayed. Both
electron impact ionization, in selected reaction monitoring mode, and negative chemical
ionization, in selected ion recording mode, were tested for the optimum determination
of analytes. Isotopically labelled standards were added before extraction as surrogates:
[13C] BDE47, [13C] BDE99 and [13C] BDE153 for EI, and p,p’-DDE-D8 for NCI.
The method was validated in terms of accuracy, precision, limits of detection and limits
of quantification, using human breast tissue spiked at three levels in the range 1-50 ng/g
(5-250 ng/g for BDE 209). The analytical approach using SPE clean-up followed by
GC-MS (NCI) led to lower detection limits (0.006-2 ng/g) and allowed the
determination of the most problematic congener, BDE 209, whose poor sensitivity made
difficult its determination at low residue levels. Special attention was given to the
confirmation of the compounds detected in samples in order to avoid reporting false
positives. Two MS/MS transitions or three m/z ions were selected for each analyte
when using EI or NCI modes, respectively. In both cases, the transition/ion intensity
ratio was used as confirmation parameter. The developed methodology was applied to
the analysis of real human samples. Several BDEs (BDEs congeners 47, 100, 99, 154,
153 183 and 209) were detected in the range of 0.08-0.23 ng/g.
Page 2 of 35Analytical & Bioanalytical Chemistry

3
Keywords
Polybrominated diphenyl ethers, gas chromatography tandem mass spectrometry,
human breast adipose tissue, triple quadrupole analyzer, electron impact, negative
chemical ionization
Page 3 of 35 Analytical & Bioanalytical Chemistry

4
INTRODUCTION
Polybrominated diphenyl ethers (PBDEs) are structurally similar to polychlorinated
biphenyls (PCBs) and polybrominated biphenyls (PBBs). They have a large number of
congeners depending on the number and the position of the halogenated atoms on the
two-phenyl rings. The total number of possible congeners of PBDEs is 209, going from
mono to deca BDEs. These compounds have been widely used as reactive flame
retardants in different consumer products and electronics [1]. Toxicity studies show that
environmental concentrations of PBDEs can produce thyroid hormone disruption, affect
learning and memory functions in adults and induce developmental neurotoxic effects
[2-4]. Estrogenic effects of PBDEs have also been reported [5]. So, these compounds
are potentially negative for human health.
The resistance of PBDEs to degradation and their high lipid solubility are the cause of
their persistence and bioaccumulation in the environment and along the food chain.
PBDEs have been studied in different environmental samples like water, air particles,
soil, sediments, and sewage sludge samples [6]. The presence of BDEs in biotic samples
has been reported by several authors. These compounds have been detected in animal
tissues, including dolphin, seal and whale [7] and human biological samples as serum
[8, 9], maternal milk [10, 11] and adipose tissues [8, 12-14]. In many cases, the
concentrations of PBDEs were reported to be increasing over time.
Typically, tri- to hepta-BDEs have been detected in biological samples, including
human adipose tissues [15, 16]. Although BDE209 has been found in serum and in
human adipose samples, the concentrations reported are normally at ng/g or sub-ng/g
levels [9, 11], its determination being difficult due to the decomposition in lower
congeners and to its poor gastrointestinal adsorption [7]; thus, high sensitive methods
are required to search BDE209 in human samples. Several reviews about the analysis of
Page 4 of 35Analytical & Bioanalytical Chemistry

5
PBDEs in different types of samples have been published in the last five years [17-19].
Most recently, Covaci et. al. [6] have reviewed new developments in the analysis of
PBDEs.
The determination of PBDEs in fatty samples usually requires a first sample
pretreatment to dissolve the lipids in an appropriate solvent, followed by their
extraction, which can be carried out by LLE or SLE with apolar solvents [9], Soxhet
extraction [20], column extraction with a mixture of apolar solvents [21] or sonication
with appropriate solvent [22]. Alternative enhanced extraction techniques, such as
pressurized liquid extraction or microwave assisted extraction have also been used [23,
24]. The complexity of extracts requires further purification which can be made by gel
permeation chromatography [25, 26], Florisil or acidified silica gel column
chromatography [27-29], and automated normal-phase HPLC [30].
Nowadays, the most usual technique for the analysis of PBDEs is GC-MS. The
selection of characteristics of the GC-system (stationary phase, column length, injection
technique…) has a strong influence on the accuracy and precision of the analysis [31].
So, if chromatographic conditions are not correctly selected, low yields for nona- and
deca-BDEs and poor precision for congeners with more than five bromine atoms can be
obtained.
GC-MS methods using both EI [12, 20, 32] and NCI [25, 26, 33] have been proposed
for the determination of PBDEs. However, several potential chromatographic
interferences can hamper good quality data [6]. Thus, when working in EI-MS potential
interferences originate from chlorinated compounds, like PCBs. When using NCI-MS,
where only [Br]- ions are monitored, other brominated compounds might also interfere
with the PBDEs determination. High resolution mass spectrometry (HRMS) is a good
Page 5 of 35 Analytical & Bioanalytical Chemistry

6
option [34] to reach high sensitivity, selectivity and accuracy but at a considerable
higher cost.
Tandem mass spectrometry (MS/MS), using ion trap detectors (ITD) or triple
quadrupole (QqQ) analyzers, can be an interesting alternative to high resolution devices
due to the specificity of MS/MS, which allows an improvement in selectivity and also in
sensitivity [8, 30, 35]. Whereas ITD has been used for the trace analysis of PBDEs in
differents types of samples [8, 34], GC-MS/MS with QqQ analyzer has been rarely
explored for the analysis of PBDEs in human samples, where high sensitive techniques
are required. The use of QqQ in selected reaction monitoring (SRM) mode provides one
of the most sensitive and selective techniques for the analysis of organic contaminants
especially at low concentrations.
In the last years, GC-MS/MS with QqQ has been mainly applied to the determination of
pesticides in fruits and vegetables [36-38] and in food samples [39-41] as well as
several organic pollutants in environmental samples [35, 42], providing excellent
sensitivity, selectivity and gain on analysis time, and allowing the simultaneous
determination, and confirmation of quite different target analytes. Recently, our own
research group has also proved the efficiency of this technique for the reliable
determination of organic pollutants in water [35] and xenoestrogen compounds in
human breast tissues [30].
The aim of this work is the development of analytical methodology for the sensitive
determination and identification of PBDEs in human breast tissues based on the use of
GC-MS/MS with QqQ analyzer. The PBDEs congeners most frequently detected
((BDEs congeners 28, 47, 66, 71, 85, 99, 100, 138, 153, 154, 183 and 209) have been
included in the study. The application of two different clean-up procedures, based on
normal phase HPLC and SPE, and the use of EI and NCI modes are investigated.
Page 6 of 35Analytical & Bioanalytical Chemistry

7
EXPERIMENTAL
Reagents and chemicals
Polibrominated Diphenyl Ether Analytical Standard Mixture “Lake Michigan Study”,
containing one triBDE (BDE28), two tetraBDEs (BDE 47 and 66), three pentaBDEs
(BDE 85, 99 and 100) and three hexaBDEs (BDE 138, 153 and 154) (ca. 50 µg/mL in
isooctane) was purchased from Chiron (Trondheim, Norway). Individual standards of
BDE 71 (tetraBDE) and BDE 183 (heptaBDE) (50 µg/mL in isooctane each one) were
supplied by Chiron, whereas BDE 209 (decaBDE) (50 µg/mL in isooctane:toluene
(9:1) ) was provided by Accustandard (New Haven, USA).
A standard mixture solution containing these 12 BDEs at a concentration level around
2.5 µg/mL, (except BDE209, at 5 µg/mL) was prepared in hexane and stored at 4° C.
Working solutions were prepared by diluting this solution in hexane and stored at 4 ºC.
Two solutions of labeled compounds were used as surrogates. In EI experiments, a
mixture containing one tetraBDE ([13C] BDE47), one pentaBDE ([13C] BDE99) and one
hexaBDE ([13C] BDE153), all purchased from Wellington Laboratories (Guelph,
Ontario, Canada), was used. In NCI experiments, p,p’-DDE-D8, purchased from Dr.
Ehrenstofer (Augsburg, Germany), was used as surrogate. Working solutions of labeled
standards (ca. 500 ng/mL for BDEs and 1 µg/mL for DDE) were prepared by dilution of
the stock solutions with hexane and stored at 4 °C.
Ethyl acetate and n-hexane (ultra-trace quality) were purchased from Scharlab
(Barcelona, Spain). Anhydrous sodium sulfate of pesticide residue quality (Scharlab)
was dried for 18 hours at 300 ° C before use.
1 g Strata cartridges silica (Phenomenex, USA) were used for SPE.
Page 7 of 35 Analytical & Bioanalytical Chemistry
8
Sample material
Human breast tissues were obtained from women with breast cancer with the exception
of two samples that corresponded to healthy women. Samples were collected from the
Oncology Institute of Cancer, at Valencia (FIVO). After collecting the samples, they
were frozen at approximately -30° C until analysis. A pooled sample obtained by
mixing several breast tissue samples was used as a “blank” to optimize the analytical
procedure.
Equipment
LC Instrumentation. The LC system used for sample extracts clean-up was based on our
previous work [30]. It consisted on a LC Pump Master 305 (Gilson), two six-way high-
pressure valves VICI Valco (Europe Instruments, Schenkon, Switzerland), a sampler
injector valve Rheodyne (Cotati, CA) with 1.0 mL loop, a silica column Novapack 150
x 3.9 mm i.d., 4µm (Waters, Mildford, MA), and a fraction collector Gilson FC 203B.
Mobile phase used was hexane at a flow rate of 1 mL/min.
GC Instrumentation. A GC system (Agilent 6890N, Palo Alto, USA) equipped with an
autosampler (Agilent 7683) was coupled to a triple quadrupole (QqQ) mass
spectrometer, Quattro Micro GC (Micromass, Boston, USA), operating in EI and CI
modes. The GC separation was performed using a DB-1HT capillary column with a
length of 15 m x 0.25 mm i.d. and a film thickness of 0.1 µm (J&W Scientific, Folson,
CA, USA). The oven temperature was programmed as follows: 140 ºC (1 min); 10
ºC/min to 220 ºC; 20 ºC/min to 300 ºC, 40 ºC/min to 340 ºC (5 min) and the injector
temperature was 260 ºC. Splitless injections of 1 µL sample were carried out. Helium
99.999% (Carburos Metálicos, Valencia, Spain) was used as carrier gas at a flow of 1
Page 8 of 35Analytical & Bioanalytical Chemistry

9
mL/min. The interface temperature was set to 250 ºC and a solvent delay of 3 min was
selected.
Working in EI, the source temperature was set at 250 ºC and the system operated in
MS/MS (SRM) mode using argon 99.995% (Carburos Metálicos) as collision gas at a
pressure of 0.28 Pa in the collision cell. Dwell times/channel between 0.05 to 0.3 s was
chosen.
Working in NCI, the source temperature was set at 200ºC and the QqQ system operated
in SIR mode. Methane 99.9995% (Carburos Metálicos) was used as reagent gas with an
optimal flow of 60%.
The application manager Quanlynx was used to process the quantitative data obtained
from calibration standards and from samples.
Analytical procedure. Sample preparation and extraction
Samples were thawed at room temperature. Approximately 1 g of tissue sample was
spiked with 0.5 mL of surrogate labelled solution. The mixture was homogenized with
5-10 g of anhydrous sodium sulfate and extracted three times with 5 mL of n-hexane
each time, shaking in a vortex. After filtration, the extract was preconcentrated under a
gentle nitrogen stream at 40° C, and the final residue was adjusted to 10 mL with n-
hexane.
Clean-up procedures
Two clean-up procedures were investigated. The first one was based on previous work
carried out in our laboratory [30]. The sample hexanic extract was purified by injecting
1 mL into the HPLC system. The mobile phase was n-hexane, at a flow rate of 1
Page 9 of 35 Analytical & Bioanalytical Chemistry

10
mL/min. After 16 min, a pulse of 4 mL of modifier solvent (ethyl acetate) was
introduced. The fraction eluting between minutes 2 and 8 was collected and then it was
preconcentrated under a gentle nitrogen stream at 40 ° C to dryness, and redisolved in
0.5 mL of hexane.
The second procedure consisted into a SPE clean-up. 10 mL of the sample hexanic
extract were passed through the silica SPE cartridge previously conditioned by passing
6 mL of hexane. The first 3 mL were discarded and the rest -approximately 7 mL- were
collected together another additional fraction eluted by passing 3 mL of hexane. The
cleaned-up extract was preconcentrated to dryness under a gentle nitrogen stream at
40°C and re-dissolved in 0.5 mL hexane.
GC Analysis
The final extracts obtained after clean-up procedure were injected into the Quattro
Micro GC system working in (EI) MS/MS or in (NCI)MS mode under the experimental
conditions shown in Tables 1 and 2, respectively. Quantification of samples was carried
out by using calibration curves prepared with standards in solvent, using relative
responses to the corresponding labeled internal standards (IS) added as surrogates to the
samples. Three surrogates were used in EI experiments: [13C] BDE47 for tri- and tetra-
BDEs; [13C] BDE99 for penta-BDEs and [13C] BDE153 for hexa- and hepta-BDEs;
while in NCI analysis p,p’-DDE-D8 was used as surrogate for all congeners. The
selection of each IS was made according to its retention/elution behavior in the clean-up
procedure and to its gas chromatographic retention time.
Page 10 of 35Analytical & Bioanalytical Chemistry

11
Method validation
Validation of the method was performed evaluating the following parameters:
Linearity. The calibration curves were obtained by injecting reference standard
solutions in duplicate. The concentration range tested was 0.1-40 µg/L for all congeners
with the exception of BDE 209 (0.5-200 µg/L). Linearity was assumed when regression
coefficient was >0.99 with residuals lower than 30 %.
Accuracy. It was evaluated by means of recovery experiments, analyzing blank breast
tissue samples spiked at three levels: 1, 10 and 50 ng/g (5, 50 and 250 ng/g for
BDE209), (n=5 each level). Previously, the blank sample was analyzed (n=5) to
determine the analytes’ concentration.
Precision. Precision, expressed as repeatability of the method, was determined in terms
of relative standard deviation (R.S.D., in %) from recovery experiments at each
fortification level (n=5, each).
Limit of Quantification (LOQ). The LOQ was firstly established as the lowest
concentration that was validated following the overall analytical procedure with
satisfactory recovery (70-110%) and precision (<20%). However, in NCI analysis,
where the sensitivity was excellent, this value could be notably lowered leading to a
more realistic LOQ. In this case, LOQ was statistically estimated for a signal-to-noise
(S/N) = 10 from the chromatogram of samples spiked at the lowest fortification level
tested, i.e. 1 ng/g.
Limit of Detection (LOD). The LOD value was estimated, from the quantification
transition (EI) or ion (NCI), as the analyte concentration that produced a peak signal of
three times the background noise from the chromatogram at the lowest fortification
level tested. In the case of analytes showing higher sensitivity (congeners 28, 71, 47,
Page 11 of 35 Analytical & Bioanalytical Chemistry

12
and 100), making the measurement of the noise manually unfeasible, the LOD was
obtained using a software option for estimating the S/N ratio and referring/recounting
this value to a S/N value of three.
Limit of confirmation (LOC). The LOC was estimated in the same way than LOD but
considering the peak signal corresponding to the confirmation transition or ion.
Confirmation criteria. The Q/q ratio, defined as the ratio between the concentration
obtained from the quantification transition (EI mode) or ion (NCI mode) (Q) and from
the confirmation transition/ion (q), was used to confirm peak identity in samples. A safe
confirmation was assumed when the Q/q concentration ratio was found to be between
0.8 and 1.2, i.e. a maximum tolerance of ± 20% was accepted to confirm a finding as an
actual positive. Obviously, the agreement in the retention time in sample and reference
standard was also required to confirm a positive.
Page 12 of 35Analytical & Bioanalytical Chemistry

13
RESULTS AND DISCUSSION
GC-MS optimization
Optimization of GC-MS methods was performed by injecting hexanic standard
solutions. First experiments were carried out using a fused-silica HP-5MS capillary
column (30m x 0.35mm i.d. and 0.25 µm film thickness), but the results for BDE183
(hepta-brominated) and BDE209 (deca-brominated) were not satisfactory. This was
probably due to partial or total degradation, as it has been pointed out by several authors
[33, 43] who recommend the use of shorter columns with thinner film thickness. The
best results where obtained with a fused-silica capillary column of 15m x 0.25 mm i.d.
and 0.1 µm film thickness, and using a stationary phase of 100% methyl polisiloxane
(DB-1HT), which can stand temperatures higher than 300 ºC required to elute higher
brominated BDEs [44].
Using the selected column, the temperature program was optimized in order to achieve a
satisfactory resolution and peak shape for the twelve PBDEs studied. It was necessary to
set a high initial temperature (140 ºC) and final ramp (40 ºC/min) in order to avoid
degradation of higher brominated congeners. A final temperature of 340ºC, with a
holding time of 5 minutes, was required to elute BDE209.
GC-MS/MS method in EI ionization mode
Optimization of the MS/MS method was performed using triple quadrupole MS
operating in EI ionization mode. Full scan spectra for all PBDE congeners showed the
[M]+ and/or [M-Br2]+ isotopic clusters as majoritary ions, so they were selected as
precursor ions for every analyte. Different values of collision energy (between 10-60
eV) were tested to perform the subsequent fragmentation of selected precursor ions. The
final purpose was to develop a SRM method with at least two MS/MS transitions,
Page 13 of 35 Analytical & Bioanalytical Chemistry

14
normally the most sensitive ones, for each compound in order to have a reliable
confirmation of the identity of the analyte.
The dwell time parameter was also optimized between 0.05 and 0.3 s in order to obtain
a good chromatographic peak (with at least 10 points per peak) maintaining satisfactory
sensitivity for each compound.
Table 1 shows the precursor and product ions corresponding to the quantitative (Q) and
confirmative (q) transitions monitored in EI ionization mode. Optimum values of
collision energy were found to be normally around 20 eV for the low brominated
compounds, increasing for high brominated compounds until values as 50 eV.
Linearity of relative response of analytes was established by analyzing hexanic standard
solutions, in duplicate, in the ranges 0.4-8 µg/L and 2-40 µg/L. Regression coefficients
above 0.995 were obtained for all the compounds with residuals lower than 20 %.
GC-MS method in NCI mode
When working in NCI mode it was not feasible to developed a MS/MS method because
only the clusters from the mass fragments [Br]- and [HBr2]- were observed in the full
scan spectra. The molecular cluster was not observed or constituted a minor peak;
therefore, the unique transition feasible for the majority of compounds was the
fragmentation of [HBr2]- to give a bromine atom, with low sensitivity and poor
selectivity. As a consequence, a SIR method was optimized monitoring the three most
intense peaks of the mass spectra, which corresponded to m/z 79 ([79Br]-), m/z 81
([81Br]) and m/z 161 ([H79Br81Br]). The m/z 79 ion was used for quantification purposes
and the other two ions were used for confirmation. BDE209 showed a different
behavior, as its full scan spectra did not show the [H79Br81Br] fragment. For this
Page 14 of 35Analytical & Bioanalytical Chemistry

15
congener the three most intense peaks were: m/z 79 ([79Br]-) -used for quantification-
and m/z 487 [C6O79Br3
81Br2]- and m/z 81 ([81Br]-) -used for confirmation.
The NCI method was optimized injecting hexanic standard solutions. Different values
of source temperature (100-150 ºC), electron energy (30-100 eV), emission current
(100-500 µA) and methane flow (20-80%) were tested in order to improve the
sensitivity, the optimum values being 200 ºC, 50 eV, 400 µA and 60%, respectively.
As the ions monitored in SIR method are the same for isotopically labeled (13C)
congeners, it was necessary to select another compound as surrogate. Based on the
results obtained in our previous work [30], p,p’- DDE-D8 was selected for analysis
performed by NCI. The temperature program was slightly modified, decreasing the
initial temperature to 120 ºC, in order to elute adequately the new surrogate.
As a summary, Table 2 shows the quantitative (Q) and confirmative (q) m/z ions and
the dwell time value selected for every compound.
Linearity of relative response of analytes was tested analyzing hexanic standard
solutions, in duplicate, in the ranges 0.1-8 µg/L and 2-40 µg/L (2-40 µg/L and 10-200
µg/L for BDE209). Regression coefficients above 0.995 were obtained for all the
compounds, except for BDE209 that was 0.993.
Page 15 of 35 Analytical & Bioanalytical Chemistry

16
Clean-up optimization
First, we applied a clean-up procedure by automated normal-phase HPLC based on our
previous work on human adipose tissues analysis [30]. 1 mL hexanic extract (0.1 g
sample/mL) was injected into the LC-system, and every 1-mL fraction eluted with
hexane was analyzed in order to determine the presence and recovery of analytes. Data
obtained showed that all compounds and IS were collected in the fractions between
minutes 2 and 8.
Once optimized the GC-MS measurement, the application of this clean-up procedure led
to LODs around 5 ng/g. This value was considered too high for real samples;
consequently, a second clean-up based on the use of SPE silica cartridges was optimized
in order to improve sensitivity. 10 mL of a mixed hexanic standard solution of PBDEs,
100 ng/mL each, were loaded into the silica cartridge and every 1-mL fraction, eluted
with hexane, was analyzed by GC-MS. Data obtained showed that, after discarding the
first 3 mL, all analytes eluted in the next 10 mL. This procedure was subsequently
applied to hexanic sample extracts in order to evaluate the fat content in the analytes’
fraction, which was found to be approximately 30% of the total amount loaded into the
cartridge. According to our experience, this amount of fat can be injected into the GC-
MS without relevant damages neither in the chromatographic system or in the MS
detector.
Page 16 of 35Analytical & Bioanalytical Chemistry

17
Validation results
Sample used in the validation process consisted of a pool of several human adipose
tissue samples. This sample was previously analyzed (n=5), and any of the BDE
congeners studied in this work were detected. So it was used as a blank in subsequent
experiments.
Validation was carried out in terms of precision, accuracy, LOQs and LODs.
Considering that two transitions or several ions were monitored for a reliable
identification, both LOCs and Q/q ratios, were also evaluated. Labeled internal
standards were added at the initial stage of the procedures as quality control (i.e. used as
surrogates) in order to correct for possible losses along the overall procedure and/or
instrumental deviations.
EI(MS/MS)procedure
Precision and accuracy were estimated by analyzing five replicate blank samples spiked
at three concentration levels each: 1, 10 and 50 ng/g. Because of sensitivity differences,
validation at the lowest level (1 ng/g) was only performed by applying the SPE clean-up
procedure, while the LC clean-up procedure was applied to the other two levels (10 and
50 ng/g).
Recoveries were satisfactory, with average values between 70 and 120 % at the three
levels tested, with the only exception of two congeners (BDE71 and BDE138) at the
lowest level of fortification (recoveries around 60%). Precision was also satisfactory,
with R.S.D. lower than 10% in the majority of the cases. (Table 3)
Application of the HPLC automated clean-up did not allow us to reach enough
sensitivity to analyze real adipose tissue samples, where total PBDE levels found
usually ranged between 0.3 and 70 ng/g [16]. However, the alternative method of
Page 17 of 35 Analytical & Bioanalytical Chemistry

18
purification based on SPE led to a sensitivity about ten times higher, allowing the
detection of analytes in real samples.
LODs were calculated from the quantification transition (Q) and were around 1 ng/g
(SPE clean-up) or varied between 2-10 ng/g (HPLC clean-up). It can be pointed out that
LOCs (obtained in a similar way to LOD, but considering the confirmation (q)
transition) were quite similar to LODs, which means that confirmation of analytes was
feasible at the same level than their detection. LOQs were established as the lowest
level validated level (10 and 1 ng/g when using HPLC automated and SPE clean-ups,
respectively), except for BDE28, whose greater response allows to obtain lower LOQ
values (5 and 0.3 ng/g, respectively), which were estimated for an S/N=10. These values
were considered too high for quantification of real samples. In the particular case of
decabrominated BDE 209, the sensitivity was not sufficient for its determination at lows
levels, requiring the application of the NCI (MS) mode.
In relation to Q/q concentration ratios, data obtained were excellent at the three levels of
fortification, ranging between 0.84-1.14 (i.e. deviations bellow ±20%) and R.S.D.s were
lower than 10%, except for some of the higher brominated congeners, possibly due to
the lower sensitivity for these compounds.
Figure 1 shows the GC-MS/MS chromatograms for a blank sample fortified at the
lowest level validated, i. e. 0.1 ng/g (5 ng/g for BDE209), after application of the SPE
clean-up. As can be seen, BDE209 congener could not be detected at this low level.
NCI (MS) procedure
The use of NCI in the determination of halogenated compounds like PBDEs leads to an
increase in sensitivity respect to EI ionization, as several authors have reported [14, 17].
However, PBDEs MS spectra provides poor information with only two ions (Br- and
HBr2-), and determination of analytes in this mode may seem not sufficiently specific. It
Page 18 of 35Analytical & Bioanalytical Chemistry

19
must be pointed out that only a limited number of analytes containing one or more
bromine atoms can be present in human adipose tissues analyzed by GC and ionized in
NCI mode [45], so the selectivity for these compounds is relatively high.
Validation of the overall procedure was carried out in a similar way than for EI, using in
this case p,p´-DDE-D8 as surrogate. Recoveries for BDE209 were quite good (98, 106
and 109%) without the necessity of the expensive use of [13C]-labelled BDE 209 as
reported in the literature [6].
Overall data for accuracy and precision were satisfactory at the three fortification levels
tested, with recoveries between 70 and 110% and RSDs better than 15% for almost all
compounds. (Table 4)
In relation to LODs, the NCI method led to values around 20 times lower than for EI
mode, and ranged between 0.006-0.15 ng/g. These values are similar, and in some cases
suppose an improvement, to data recently published [6, 32, 46]. In the particular case of
BDE209, the LOD was found to be 0.5 ng/g. LOCs were quite similar to LODs, making
feasible the confirmation of analytes at the detection level. In relation to LOQs, it seems
quite evident that concentrations much lower than the lowest level validated (1 ng/g)
could be quantified in the light of the high sensitivity of the method. In this case, LOQ
values were estimated for S/N=10 from chromatograms of samples spiked at the lowest
level tested. Values obtained ranged between 0.02 and 0.5 for tri- to hepta-BDEs,
allowing the quantification of the concentrations typically found in human adipose
samples [15, 47].
Two set of values of Q/q concentration ratios were obtained: the first (Q/q1) was
calculated for the ions 79 [79Br]- and 161 [H79Br81Br]- (except for BDE 209, ions 79 and
487[C6O79Br3
81Br2]-), and the second (Q/q2) for the ions 79 and 81 [81Br]- for all
compounds, BDE209 included. Experimental Q/q ratios were satisfactory and ranged
Page 19 of 35 Analytical & Bioanalytical Chemistry

20
between 0.83-1.2, with the exception to BDE85 (1.3); so deviations were below ±20%
and their RSD were mostly lower than 10%.
In conclusion, the NCI method led to a considerable improvement in sensitivity, making
the detection of PBDEs at low levels feasible. As an illustrative example, Figure 2
shows the SIR chromatograms corresponding to blank sample fortified at 1 ng/g level (5
ng/g for BD209) after applying the SPE clean-up followed by NCI (MS) analysis.
Application to real samples
The SPE clean-up followed by GC-(NCI) MS procedure was applied to the analysis of
15 human breast adipose tissue samples. The BDE congeners 47, 100, 99, 154, 153, 183
and 209 were identified in several samples, which is in accordance with data found in
the literature [12, 46-48]. BDE 47, BDE99 and BDE153 were the most frequent
congeners detected, (13, 10 and 14 out of 15 samples analyzed, respectively). BDE 100
was detected in 5 samples, and BDE 154, BDE 183 and BDE209 only were found in 2
samples. Concentrations of the mono- to hexa-BDEs ranged between 0.08-0.23 ng/g,
these values being comparable to concentrations found in adipose tissues from Spanish
population that ranged between 0.001-3 ng/g [13] and <0.07-6 ng/g [28]. Hepta- and
deca-BDE could not be quantified because of their low concentrations, although they
were detected in 2 out of 15 samples analyzed.
Illustrative chromatograms for real samples analyzed are shown in Figure 3. This figure
illustrates the detection of several PBDEs at low levels. A reliable identification of
analytes in samples was feasible by means of the Q/q experimental ratios, which varied
between 0.84 and 1.2 in all findings
Page 20 of 35Analytical & Bioanalytical Chemistry

21
Moreover, in 12 of the samples analyzed one peak that did not correspond to any of the
target compounds was observed (retention time 7.99 min). In addition, in four of these
samples two additional peaks (at 8.94 and 14.59 min) were also present. We assumed
that these peaks corresponded to BDE congeners not included in the study, although
their identification was not feasible as reference standards were not available in our
laboratory. Looking at the retention times, an estimation of the number of bromine
atoms might be made. The peak at 7.99 min might correspond to a tri-congener,
whereas the other two peaks might be tetra- and nona-BDEs, respectively.
Page 21 of 35 Analytical & Bioanalytical Chemistry

22
CONCLUSIONS
Efficient and advanced analytical methodology has been developed for the
determination of 12 BDE congeners, including BDE209, in human breast adipose
tissues. The most difficult task of this work has been to determine BDE209, due to its
partial degradation, which requires special chromatographic conditions.
Firstly a rapid method, based on GC-(EI)MS/MS with QqQ analyzer, has been
developed for quantification and confirmation of all congeners studied, except
BDE209, in one single determination step with chromatographic runs around 19
minutes. This method was satisfactorily validated in samples spiked at 50 ng/g and 10
ng/g, which were subjected to automated normal phase HPLC clean-up, previously to
the GC-MS analysis. The fortification level could be lowered to 1 ng/g when applying a
SPE clean-up procedure with silica cartridges. Later, a GC-(NCI)MS method was
developed, which allowed a notable sensitivity improvement. It was validated at the
same levels, obtaining satisfactory results for all congeners studied, including BDE209.
The lowest LODs (0.006-0.5 ng/g) were obtained with this method, after performing the
purification step by SPE. The overall method proposed in this work (extraction with
hexane followed by SPE clean-up and analyses by GC-(NCI)/MS) was applied to the
analysis of real human breast tissue samples, leading to the finding of several BDEs at
low levels. The BDE209 congener, which has been rarely studied and detected in
human samples, was also found in several of the samples analyzed.
Page 22 of 35Analytical & Bioanalytical Chemistry

23
ACKNOWLEDGEMENT
The authors are very grateful to Dr. Carlos Vázquez from the Fundación Instituto
Valenciano de Oncologia (FIVO) for sample collection. Financial support was obtained
from Universitat Jaume I-Fundación Bancaixa (project P1-1B2005-08).
Page 23 of 35 Analytical & Bioanalytical Chemistry

24
REFERENCES
1. Rahman F, Langford KH, Srimshaw MD, Lester JN (2001) Sci Total Environ 275:1-
17
2. McDonald TA (2002) Chemosphere 46:745-755
3. Hallgren S, Darnerud PO (2002) Toxicology 177:227-243
4. Eriksson P, Jakobsson E, Fredriksson A (2001) Environ Health Perspect 109:903-
908.
5. Meerts IATM, Letcher RJ, Hoving S, Marsh G, Bergman Å, Lemmen JG, van der
Burg B, Brouwer A (2001) Environ Health Perspect 109:399-407
6. Covaci A, Voorspoels S, Ramos L, Neels H, Blust R (2007) J Chromatogr A 1153:
145-171
7. Hyötyläinen T, Hartonen K (2002) Trends Anal Chem 21:13-29
8. Gómara B, Herrero L, Bordajandi LR, González MJ (2006) Rapid Commun Mass
Spectrom 20:69-74
9. Cariou R, Antignac J-P, Marchand P, Berrebi A, Zalko D, Andre F, Le Bizec B
(2005) J Chromatogr A 1100:144-152
10. Kazda R, Hajšlová J, Poustka J, Ĉajka T (2004) Anal Chim Acta 520:237-243
11. Inoue K, Harada K, Takenaka K, Uehara S, Kono M, Shimizu T, Takasuga T,
Senthilkumar K, Yamashita F, Koizumi A (2006) Environ Health Perspect 114:1179-
1185
12. Li QQ, Loganath A, Ghong YS, Obbard JP (2005) J Chromatogr B 819:253-257
13. Fernandez MF, Araque P, Kiviranta H, Molina JMM, Rantakokko P, Laine O,
Vartiainen T, Olea N (2007) Chemosphere 66:377-383
Page 24 of 35Analytical & Bioanalytical Chemistry

25
14. She J, Petreas M, Winkler J, Visita P, McKinney M, Kopec D (2002) Chemosphere
46 :697-707
15. Hites RA (2004) Environ Sci Technol 38:945-956
16. Richardson S (2006) Anal Chem 78:4021-4046
17. Covaci A, Voorspoels S, de Boer J (2003) Environnent International 29:735-756
18. Eljarrat E, Barceló D (2004) Trends Anal Chem 23:727-736
19. D´Silva K, Fernandes A, Rose M (2004) Crit Rev Environ Sci Technol 34:141-207
20. Johnson-Restrepo B, Kannan K, Rapaport DP, Rodan BD (2005) Environ Sci
Technol 39:5177-5182
21. Lebeuf M, Gouteux B, Measures L, Trottier S (2004) Environ Sci Technol 38:2971-
2977
22. Jacobs MN, Covaci A, Gheorghe A, Schepens P (2004) J Agric Food Chem
52:1780-1788
23. Eljarrat E, de la Cal A, Raldua D, Duran C, Barceló D (2004) Environ Sci Technol
38:2603-2608
24. Bayen S, Lee HK, Obbard JPh (2004) J Chromatogr A 1035:291-294
25. Akutsu K, Obana H, Okihashi M, Kitagawa M, Nakazawa H, Matsuki Y, Makino T,
Oda H, Hori S (2001) Chemosphere 44:1325-1333
26. Saito K, Sjödin A, Sanadau CD, Davis MD, Nakazawa H, Matsuki Y, Patterson Jr
DG (2004) Chemosphere 57:373-381
27. Smeds A, Saukko P (2003) Chemosphere 53:1123-1130
Page 25 of 35 Analytical & Bioanalytical Chemistry

26
28. Meneses M, Wingfors H, Schuhmacher M, Domingo JL, Lindström G, Bavel BV
(1999) Chemosphere 39:2271-2278
29. Covaci A, de Boer J, Ryan JJ, Voorspoels S, Schepens P (2002) Environ Res
88:210-218
30. Hernández F, Portolés T, Pitarch E, López FJ, Beltrán J, Vázquez C (2005) Anal
Chem 77:7662-7672
31. Björklund J, Tollbäck P, Hiarne C, Dyremarck E, Östman C (2004) J Chromatogr A
1041:201-210
32. Covaci A, de Boer J, Ryan JJ, Voorspoels S, Schepens P (2004) Anal Chem 74:790-
798
33. de Boer J, Wester PG, van der Horst A, Leonards PEG (2003) Environ Pollut
122:63-74
34. Larrazábal D, Martínez MªA, Eljarrat E, Barceló D, Fabrellas B (2004) J Mass
Spectrom 39:1168-1175
35. Pitarch E, Medina C, Portolés T, López FJ, Hernández F (2007) Anal Chim Acta
583:246-258
36. Frenich AG, Rodríguez MJG, Arrebola FJ, Martínez Vidal JL (2005) Anal Chem
77:4640-4648
37. Lachenmeier DW, Nerlich U, Kuballa T (2006) J Chromatogr A 1108:116-120
38. Lachenmeier DW, Frank W, Kuballa T (2006) Rapid Commun Mass Spectrom 19:
108-112
Page 26 of 35Analytical & Bioanalytical Chemistry

27
39. Martínez Vidal JL, Liébanas FJA, Rodríguez MJG, Frenich AG, Moreno JLF (2006)
Rapid Commun Mass Spectrom 20:365-375
40. Frenich AG, Vidal JLM, Sicilia ADC, Rodríguez MJG, Bolaños PP (2006)
Analytica Chimica Acta 558:42-52
41. Leandro CC, Fussell RJ, Keely BJ (2005) J Chromatogr A 1085:207-212
42. Bucheli TD, Brändli RC (2006) J Chromatogr A 1110:156-164
43. Korytár P, Covaci A, de Boer J, Gelbin A, Brinkman UATh (2005) J Chromatogr A
1065:239-249
44. Korytár P, Covaci A, Leonards PEG, de Boer J, Brinkman UATh (2005) J
Chromatogr A 1100:200-207
45. Čajka T, Hajšlová J, Kazda R, Poustka J (2005) J Sep Sci 28:601-611
46. Naert C, Piette M, Bruneel N, van Peterghem C (2006) Arch Environ Contam
Toxicol 50:290-296
47. de Wit CA (2002) Chemosphere 46:583-624
48. Meironyté D, Bergman Ǻ, Norén K (2001) Arch Environ Contam Toxicol 40:564-
570
Page 27 of 35 Analytical & Bioanalytical Chemistry

28
FIGURE LEGENDS
Figure 1. GC-MS/MS (EI) chromatograms of adipose breast tissue fortified at 1 ng/g
with selected PBDEs (5 ng/g for BDE209) after application of the SPE clean-up
procedure.
Figure 2. GC-MS (NCI) SIR chromatograms of adipose breast tissue fortified at 1 ng/g
with selected PBDEs (5 ng/g for BDE209) after application of the SPE clean-up
procedure.
Figure 3. GC-MS (NCI) SIR chromatograms corresponding to the analysis of four
human breast adipose tissue samples. Chromatograms for the quantification ion (Q) and
for the two confirmation ions (q1 and q2) are shown in each sample.
Page 28 of 35Analytical & Bioanalytical Chemistry

Table 1. Experimental conditions of the optimized GC-EI(MS/MS) method
tR
(min)Window
(min)BDE Precursor
Ion (m/z)ProductIon (m/z) Q/qb
CollisionEnergy
(eV)
6.4 3-7 28248 [C12H7O
81Br]406 [C12H7O
79Br281Br]
139 [- CO81Br]246 [- 79Br81Br]
15 15
8.18.38.6
8.3
7-9
714766
47 a
486 [C12H6O79Br2
81Br2]326 [C12H6O
79Br81Br]
498 [13C12 H6O79Br2
81Br2]
326 [- 79Br81Br ]219 [- CO79Br]
338 [- 79Br81Br ]
1520
15
9.710.110.5
10.1
9-10.5
1009985
99 a
566 [C12H5O79Br2
81Br3]406 [C12H5O
79Br81Br2]
578 [13C12 H5O79Br2
81Br3]
406 [- 79Br81Br]297 [- CO81Br]
416 [- 81Br2 ]
2515
20
10.9
11.211.6
11.2
10.2-11.9
154
153138
153 a
644 [C12H4O79Br3
81Br3]484 [C12H4O
79Br281Br2]
644 [C12H4O79Br3
81Br3]484 [C12H4O
79Br281Br2]
656 [13C12 H4O79Br3
81Br3]
484 [- 79Br81Br]217 [- CO79Br2
81Br]
484 [- 79Br81Br]324 [- 79Br81Br]
496 [- 79Br81Br ]
1050
1030
20
12.1 11.7-13 183562 [C12H3O
79Br381Br2]
722 [C12H3O79Br4
81Br3]295 [- CO79Br2
81Br]562 [- 79Br81Br ]
5030
- 13-19 209800 [C12O
79Br481Br4]
960 [C12O79Br5
81Br5]640 [- 79Br81Br ]800 [- 79Br81Br ]
4525
a: labeled congeners used as surrogates.b : Q: quantification transition, q: confirmation transition.
Page 29 of 35 Analytical & Bioanalytical Chemistry

Table 2. Experimental conditions of the optimized GC-NCI(MS) method
tR
(min)Window
(min)BDE Quantification
Ion (m/z)Confirmation
Ion (m/z)Dwell(sec)
8.17.6
3-9
28
p,p’-DDE-D8a
79 [79Br]-
289 [C14D835Cl3]
-
161 [H79Br81Br]-
81 [81Br]-q1
q2 0.1
9.810.010.3
9-10.8714766
79 [79Br]- 161 [H79Br81Br]-
81 [81Br]-
q1
q2 0.1
11.511.812.3
10.8-12.61009985
79 [79Br]- 161 [H79Br81Br]-
81 [81Br]-
q1
q2 0.1
12.7
13.013.4
12.5-14
154
153138
79 [79Br]- 161 [H79Br81Br]-
81 [81Br]-q1
q20.1
14.0 13.5-15 18379 [79Br]- 161 [H79Br81Br]-
81 [81Br]-q1
q20.1
16.5 15-19 209 79 [79Br]- 487[C6O79Br3
81Br2]-
81 [81Br]-q1
q20.05
a: used as surrogate.
Page 30 of 35Analytical & Bioanalytical Chemistry

Table 3. Validation of the GC-EI-MS/MS method for analysis of BDEs in human breast tissue samples ( n=5, at each fortification level).
LC clean up SPE clean upFortification level Fortification level
50 ng/g 10 ng/g 1 ng/g
Compound Recovery (R.S.D.) Q/qa Recovery
(R.S.D.) Q/qa LOQ (ng/g)
LOC (ng/g)
LOD (ng/g)
Recovery (R.S.D.)
Q/qa LOQ (ng/g)
LOC (ng/g)
LOD (ng/g)
BDE28BDE71BDE47BDE66BDE100BDE99BDE85BDE154BDE153BDE138BDE183BDE209
86(8)95(4)99(4)100(5)94(8)91(11)110(6)113(18)92(11)102(16)100(7)
-
1.01(3)1.02(0)0.99(2)1.02(2)1.01(2)0.97(3)0.91(1)0.98(11)0.97(11)0.98(4)0.96(9)
-
89(3)96(9)93(7)91(6)100(5)92(4)117(9)94(17)
101(14)111(5)95(14)
-
1.07(3)1(7)
0.99(5)1(5)
1.06(6)1.03(7)0.88(9)0.86(14)1.15(8)1.02(13)1.08(8)
-
510101010101010101010-
355
10467
10101010-
233633558
10 b
10 b
-
72(5)64(6)71(2)77(15)72(6)75(12)82(9)72(10)92(12)61(7)77(15)
-
1(6)1.01(10)1.14(4)1.05(10)1.12(7)1.03(8)1.04(10)1.02(17)0.95(10)0.84(7)0.97(13)
-
0.31111111111-
0.30.60.51
0.30.411111-
0.10.30.20.60.30.40.80.71 b
1 b
1 b
-a: Average value calculated from Q/q concentration of five replicates at each level of fortification. b:LOD estimated for a S/N = 3 was coincident with the lowest level that was fully validated in spiked samples with satisfactory recovery and precision
Page 31 of 35 Analytical & Bioanalytical Chemistry
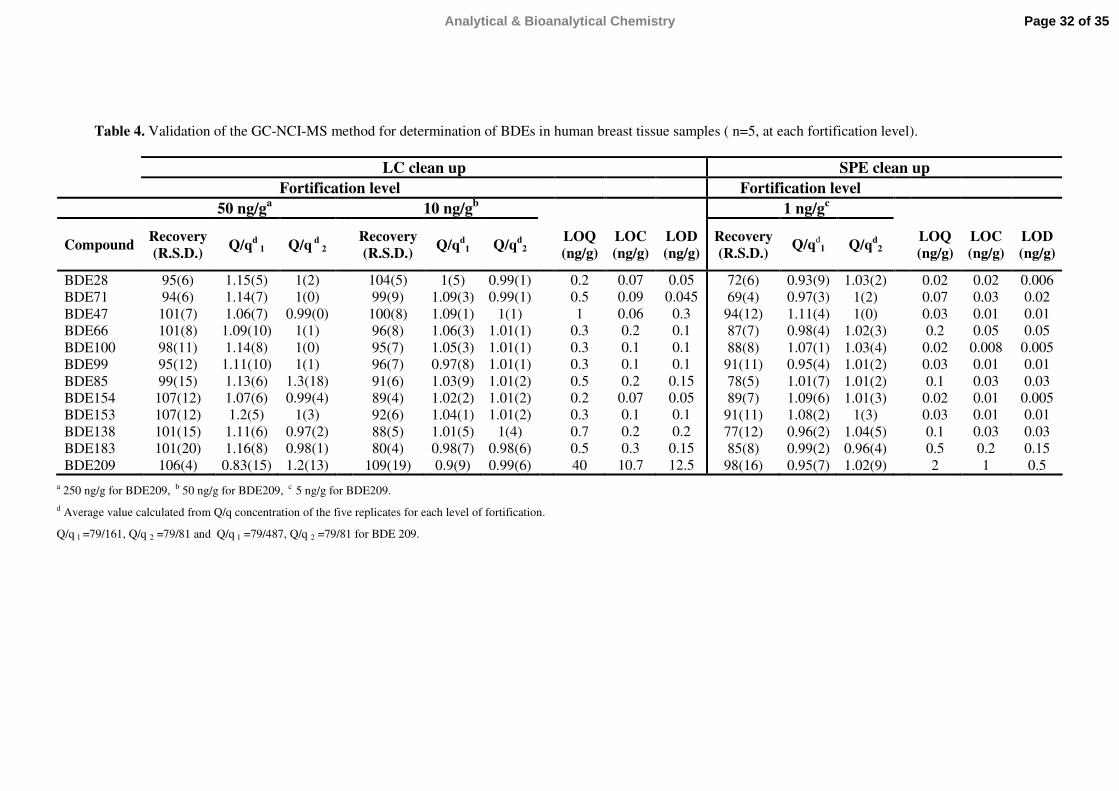
Table 4. Validation of the GC-NCI-MS method for determination of BDEs in human breast tissue samples ( n=5, at each fortification level).
LC clean up SPE clean upFortification level Fortification level
50 ng/ga 10 ng/gb 1 ng/gc
Compound Recovery(R.S.D.) Q/qd
1 Q/q d 2
Recovery(R.S.D.) Q/qd
1 Q/qd2
LOQ(ng/g)
LOC(ng/g)
LOD(ng/g)
Recovery (R.S.D.)
Q/qd1 Q/qd
2LOQ (ng/g)
LOC (ng/g)
LOD (ng/g)
BDE28BDE71BDE47BDE66BDE100BDE99BDE85BDE154BDE153BDE138BDE183BDE209
95(6)94(6)101(7)101(8)98(11)95(12)99(15)
107(12)107(12)101(15)101(20)106(4)
1.15(5)1.14(7)1.06(7)1.09(10)1.14(8)1.11(10)1.13(6)1.07(6)1.2(5)1.11(6)1.16(8)0.83(15)
1(2)1(0)
0.99(0)1(1)1(0)1(1)
1.3(18)0.99(4)
1(3)0.97(2)0.98(1)1.2(13)
104(5)99(9)100(8)96(8)95(7)96(7)91(6)89(4)92(6)88(5)80(4)
109(19)
1(5)1.09(3)1.09(1)1.06(3)1.05(3)0.97(8)1.03(9)1.02(2)1.04(1)1.01(5)0.98(7)0.9(9)
0.99(1)0.99(1)
1(1)1.01(1)1.01(1)1.01(1)1.01(2)1.01(2)1.01(2)
1(4)0.98(6)0.99(6)
0.20.51
0.30.30.30.50.20.30.70.540
0.070.090.060.20.10.10.2
0.070.10.20.3
10.7
0.050.0450.30.10.10.1
0.150.050.10.2
0.1512.5
72(6)69(4)94(12)87(7)88(8)91(11)78(5)89(7)91(11)77(12)85(8)98(16)
0.93(9)0.97(3)1.11(4)0.98(4)1.07(1)0.95(4)1.01(7)1.09(6)1.08(2)0.96(2)0.99(2)0.95(7)
1.03(2)1(2)1(0)
1.02(3)1.03(4)1.01(2)1.01(2)1.01(3)
1(3)1.04(5)0.96(4)1.02(9)
0.020.070.030.2
0.020.030.1
0.020.030.10.52
0.020.030.010.05
0.0080.010.030.010.010.030.21
0.0060.020.010.05
0.0050.010.03
0.0050.010.030.150.5
a 250 ng/g for BDE209, b 50 ng/g for BDE209, c 5 ng/g for BDE209.d Average value calculated from Q/q concentration of the five replicates for each level of fortification.
Q/q 1 =79/161, Q/q 2 =79/81 and Q/q 1 =79/487, Q/q 2 =79/81 for BDE 209.
Page 32 of 35Analytical & Bioanalytical Chemistry

Figure 1
N5 SPE
8.00 8.50 9.00Time0
100
%
0
100
%
2VAL0023 Sm (Mn, 2x1) 2: MRM of 3 Channels EI+325.87 > 218.98
473
2VAL0023 Sm (Mn, 2x1) 2: MRM of 3 Channels EI+485.87 > 326.06
457
BDE 71BDE 47
BDE 66
(Q)
(q)
N5 SPE
8.00 8.50 9.00Time0
100
%
0
100
%
2VAL0023 Sm (Mn, 2x1) 2: MRM of 3 Channels EI+325.87 > 218.98
473
2VAL0023 Sm (Mn, 2x1) 2: MRM of 3 Channels EI+485.87 > 326.06
457
BDE 71BDE 47
BDE 66
(Q)
(q)
N5 SPE
5.50 6.00 6.50 7.00Time0
100
%
0
100
%
2VAL0023 Sm (Mn, 2x1) 1: MRM of 2 Channels EI+248 > 138.95
741
2VAL0023 Sm (Mn, 2x1) 1: MRM of 2 Channels EI+405.95 > 246.01
296
BDE 28
(Q)
(q)
N5 SPE
5.50 6.00 6.50 7.00Time0
100
%
0
100
%
2VAL0023 Sm (Mn, 2x1) 1: MRM of 2 Channels EI+248 > 138.95
741
2VAL0023 Sm (Mn, 2x1) 1: MRM of 2 Channels EI+405.95 > 246.01
296
BDE 28
(Q)
(q)
N5 SPE
9.50 10.00 10.50Time0
100
%
0
100
%
2VAL0023 Sm (Mn, 2x1) 3: MRM of 3 Channels EI+565.68 > 405.89
580
2VAL0023 Sm (Mn, 2x1) 3: MRM of 3 Channels EI+405.82 > 296.8
309
BDE 99
BDE 85
BDE 100
(Q)
(q)
N5 SPE
9.50 10.00 10.50Time0
100
%
0
100
%
2VAL0023 Sm (Mn, 2x1) 3: MRM of 3 Channels EI+565.68 > 405.89
580
2VAL0023 Sm (Mn, 2x1) 3: MRM of 3 Channels EI+405.82 > 296.8
309
BDE 99
BDE 85
BDE 100
(Q)
(q)
N5 SPE
10.75 11.00 11.25 11.50 11.75Time0
100
%
0
100
%
0
100
%
2VAL0023 Sm (Mn, 2x1) 4: MRM of 4 Channels EI+643.45 > 483.64
320
2VAL0023 Sm (Mn, 2x1) 4: MRM of 4 Channels EI+483.89 > 323.84
206
2VAL0023 Sm (Mn, 2x1) 4: MRM of 4 Channels EI+483.88 > 217.07
187
BDE 154BDE 153
BDE 138
(Q)
(q)
(q)(q)
N5 SPE
10.75 11.00 11.25 11.50 11.75Time0
100
%
0
100
%
0
100
%
2VAL0023 Sm (Mn, 2x1) 4: MRM of 4 Channels EI+643.45 > 483.64
320
2VAL0023 Sm (Mn, 2x1) 4: MRM of 4 Channels EI+483.89 > 323.84
206
2VAL0023 Sm (Mn, 2x1) 4: MRM of 4 Channels EI+483.88 > 217.07
187
BDE 154BDE 153
BDE 138
(Q)
(q)
(q)(q)
N5 SPE
12.00 12.10 12.20 12.30 12.40Time0
100
%
0
100
%
2VAL0023 Sm (Mn, 2x1) 5: MRM of 2 Channels EI+561.68 > 294.92
140
2VAL0023 Sm (Mn, 2x1) 5: MRM of 2 Channels EI+721.36 > 562.14
141
BDE 183
(q)
(Q)
N5 SPE
12.00 12.10 12.20 12.30 12.40Time0
100
%
0
100
%
2VAL0023 Sm (Mn, 2x1) 5: MRM of 2 Channels EI+561.68 > 294.92
140
2VAL0023 Sm (Mn, 2x1) 5: MRM of 2 Channels EI+721.36 > 562.14
141
BDE 183
(q)
(Q)
N5 SPE
16.20 16.40 16.60 16.80Time0
100
%
0
100
%
2VAL0023 6: MRM of 2 Channels EI+799.71 > 640
124
2VAL0023 6: MRM of 2 Channels EI+959.2 > 799.71
95
BDE 209
N5 SPE
16.20 16.40 16.60 16.80Time0
100
%
0
100
%
2VAL0023 6: MRM of 2 Channels EI+799.71 > 640
124
2VAL0023 6: MRM of 2 Channels EI+959.2 > 799.71
95
BDE 209
Page 33 of 35 Analytical & Bioanalytical Chemistry

Figure 2
N3-SPE
7,40 7,60 7,80 8,00 8,20 8,40 8,60Time0
100
%
0
100
%
0
100
%
2VAL0124 Sm (Mn, 2x1) 1: SIR of 5 Channels CI-78,82
2,40e4
2VAL0124 Sm (Mn, 2x1) 1: SIR of 5 Channels CI-160,81
525
2VAL0124 Sm (Mn, 2x1) 1: SIR of 5 Channels CI-81,07
1,42e4
BDE 28
(Q)
(q1)
(q2)
N3-SPE
7,40 7,60 7,80 8,00 8,20 8,40 8,60Time0
100
%
0
100
%
0
100
%
2VAL0124 Sm (Mn, 2x1) 1: SIR of 5 Channels CI-78,82
2,40e4
2VAL0124 Sm (Mn, 2x1) 1: SIR of 5 Channels CI-160,81
525
2VAL0124 Sm (Mn, 2x1) 1: SIR of 5 Channels CI-81,07
1,42e4
BDE 28
(Q)
(q1)
(q2)
N3-SPE
11,00 11,25 11,50 11,75 12,00 12,25 12,50Time0
100
%
0
100
%
0
100
%
2VAL0124 Sm (Mn, 2x1) 3: SIR of 3 Channels CI-78,8
7,84e4
2VAL0124 Sm (Mn, 2x1) 3: SIR of 3 Channels CI-160,8
2,00e3
2VAL0124 Sm (Mn, 2x1) 3: SIR of 3 Channels CI-80,8
7,98e4
BDE 100BDE 99
BDE 85(Q)
(q1)
(q2)
N3-SPE
11,00 11,25 11,50 11,75 12,00 12,25 12,50Time0
100
%
0
100
%
0
100
%
2VAL0124 Sm (Mn, 2x1) 3: SIR of 3 Channels CI-78,8
7,84e4
2VAL0124 Sm (Mn, 2x1) 3: SIR of 3 Channels CI-160,8
2,00e3
2VAL0124 Sm (Mn, 2x1) 3: SIR of 3 Channels CI-80,8
7,98e4
BDE 100BDE 99
BDE 85(Q)
(q1)
(q2)
N3-SPE
13,60 13,80 14,00 14,20Time0
100
%
0
100
%
0
100
%
2VAL0124 Sm (Mn, 2x1) 5: SIR of 5 Channels CI-78,8
6,07e3
2VAL0124 Sm (Mn, 2x1) 5: SIR of 5 Channels CI-160,79
517
2VAL0124 Sm (Mn, 2x1) 5: SIR of 5 Channels CI-80,82
8,47e3
BDE 183
(Q)
(q1)
(q2)
N3-SPE
13,60 13,80 14,00 14,20Time0
100
%
0
100
%
0
100
%
2VAL0124 Sm (Mn, 2x1) 5: SIR of 5 Channels CI-78,8
6,07e3
2VAL0124 Sm (Mn, 2x1) 5: SIR of 5 Channels CI-160,79
517
2VAL0124 Sm (Mn, 2x1) 5: SIR of 5 Channels CI-80,82
8,47e3
BDE 183
(Q)
(q1)
(q2)
N3-SPE
9,60 9,80 10,00 10,20 10,40 10,60Time0
100
%
0
100
%
0
100
%
2VAL0124 Sm (Mn, 2x1) 2: SIR of 3 Channels CI-78,79
1,25e5
2VAL0124 Sm (Mn, 2x1) 2: SIR of 3 Channels CI-160,8
4,37e3
2VAL0124 Sm (Mn, 2x1) 2: SIR of 3 Channels CI-80,8
1,20e5
BDE 71
BDE 47
BDE 66(Q)
(q2)
(q1)
N3-SPE
9,60 9,80 10,00 10,20 10,40 10,60Time0
100
%
0
100
%
0
100
%
2VAL0124 Sm (Mn, 2x1) 2: SIR of 3 Channels CI-78,79
1,25e5
2VAL0124 Sm (Mn, 2x1) 2: SIR of 3 Channels CI-160,8
4,37e3
2VAL0124 Sm (Mn, 2x1) 2: SIR of 3 Channels CI-80,8
1,20e5
BDE 71
BDE 47
BDE 66(Q)
(q2)
(q1)
N3-SPE
12,60 12,80 13,00 13,20 13,40 13,60Time0
100
%
0
100
%
0
100
%
2VAL0124 Sm (Mn, 2x1) 4: SIR of 5 Channels CI-78,8
4,64e4
2VAL0124 Sm (Mn, 2x1) 4: SIR of 5 Channels CI-160,8
701
2VAL0124 Sm (Mn, 2x1) 4: SIR of 5 Channels CI-80,82
4,57e4
BDE 154BDE 153
BDE 138(Q)
(q1)
(q2)
N3-SPE
12,60 12,80 13,00 13,20 13,40 13,60Time0
100
%
0
100
%
0
100
%
2VAL0124 Sm (Mn, 2x1) 4: SIR of 5 Channels CI-78,8
4,64e4
2VAL0124 Sm (Mn, 2x1) 4: SIR of 5 Channels CI-160,8
701
2VAL0124 Sm (Mn, 2x1) 4: SIR of 5 Channels CI-80,82
4,57e4
BDE 154BDE 153
BDE 138(Q)
(q1)
(q2)
N3-SPE
16,20 16,40 16,60 16,80Time0
100
%
0
100
%
0
100
%
2VAL0124 Sm (Mn, 2x1) 6: SIR of 4 Channels CI-78,97
635
2VAL0124 Sm (Mn, 2x1) 6: SIR of 4 Channels CI-486,88
95,2
2VAL0124 Sm (Mn, 2x1) 6: SIR of 4 Channels CI-80,92
912
BDE 209
(Q)
(q1)
(q2)
N3-SPE
16,20 16,40 16,60 16,80Time0
100
%
0
100
%
0
100
%
2VAL0124 Sm (Mn, 2x1) 6: SIR of 4 Channels CI-78,97
635
2VAL0124 Sm (Mn, 2x1) 6: SIR of 4 Channels CI-486,88
95,2
2VAL0124 Sm (Mn, 2x1) 6: SIR of 4 Channels CI-80,92
912
BDE 209
(Q)
(q1)
(q2)
Page 34 of 35Analytical & Bioanalytical Chemistry

Figure 3
Mue113
9.00 9.20 9.40 9.60 9.80 10.00Time7
100
%
31
100
%
2
100
%
MUE193 Sm (Mn, 2x1) SIR of 7 Channels CI-79
4.46e4Area
9.53;2446
MUE193 Sm (Mn, 2x1) SIR of 7 Channels CI-161
1.04e4Area
9.53;412
MUE193 Sm (Mn, 2x1) SIR of 7 Channels CI-81
5.08e4Area
9.53;2662
BDE 47 (Q)
BDE 47 (q1)
BDE 47 (q2)
Q/q1= 1.04
Q/q2= 1.04
Sample 1Mue113
9.00 9.20 9.40 9.60 9.80 10.00Time7
100
%
31
100
%
2
100
%
MUE193 Sm (Mn, 2x1) SIR of 7 Channels CI-79
4.46e4Area
9.53;2446
MUE193 Sm (Mn, 2x1) SIR of 7 Channels CI-161
1.04e4Area
9.53;412
MUE193 Sm (Mn, 2x1) SIR of 7 Channels CI-81
5.08e4Area
9.53;2662
BDE 47 (Q)
BDE 47 (q1)
BDE 47 (q2)
Q/q1= 1.04
Q/q2= 1.04
Sample 1
10 ,80 1 1 ,00 1 1,20 11 ,40Tim e0
10 0
%
53
10 0
%
0
10 0
%
M UE 1 84 S m (M n , 2 x1 ) S IR of 7 Chann els C I-79
1 ,1 1e411,36
10,98
M UE 1 84 S m (M n , 2 x1 ) S IR of 7 Chann els C I-161
6 ,6 9e310,98
11,36
M UE 1 84 S m (M n , 2 x1 ) S IR of 7 Chann els C I-81
1 ,2 9e411,36
10,98
Sample 2
BDE 100 (Q)BDE 99
BDE 100 (q1)BDE 99
BDE 100 (q2)BDE 99
Q/q2=0.97Q/q2=0.99
Q/q1=1.1Q/q1=1.0
Mue22
11.75 12.00 12.25 12.50 12.75 13.00 13.25Time18
100
%
50
100
%
24
100
%
MUE183 Sm (Mn, 2x1) SIR of 7 Channels CI-79
1.69e3Area
12.24;90 12.67;62
MUE183 Sm (Mn, 2x1) SIR of 7 Channels CI-161
5.03e3Area
12.23;176
12.6724
MUE183 Sm (Mn, 2x1) SIR of 7 Channels CI-81
7.81e3Area
12.23;461
12.6784
BDE 154 (Q)BDE 153
BDE 154 (q1)BDE 153
BDE 154 (q2)BDE 153
Q/q1= 0.84Q/q1= 1.01
Q/q2= 0.97Q/q2= 1.2
Sample 3Mue22
11.75 12.00 12.25 12.50 12.75 13.00 13.25Time18
100
%
50
100
%
24
100
%
MUE183 Sm (Mn, 2x1) SIR of 7 Channels CI-79
1.69e3Area
12.24;90 12.67;62
MUE183 Sm (Mn, 2x1) SIR of 7 Channels CI-161
5.03e3Area
12.23;176
12.6724
MUE183 Sm (Mn, 2x1) SIR of 7 Channels CI-81
7.81e3Area
12.23;461
12.6784
BDE 154 (Q)BDE 153
BDE 154 (q1)BDE 153
BDE 154 (q2)BDE 153
Q/q1= 0.84Q/q1= 1.01
Q/q2= 0.97Q/q2= 1.2
Sample 3
Mue66
15.60 15.80 16.00 16.20 16.40 16.60 16.80Time46
100
%
3
100
%
23
100
%
MUE188 Sm (Mn, 2x1) SIR of 7 Channels CI-79
2.97e3Area
16.26;102
MUE188 Sm (Mn, 2x1) SIR of 7 Channels CI-486.883.37e3
Area
16.25;150
MUE188 Sm (Mn, 2x1) SIR of 7 Channels CI-81
5.07e3Area
16.26;122
BDE 209 (Q)
BDE 209 (q1)Q/q1= 0.91
Q/q2= 1.1
Sample 4
BDE 209 (q2)
Page 35 of 35 Analytical & Bioanalytical Chemistry
Related Documents