Determination of Fatty Acid Methyl Esters (FAMEs) in Olive Oil using Automated Sample Preparation Authors Enrique Longueira and Jose Pineda Laboratorio Químico Microbiológico, S.A. Murcia Spain Rebecca Veeneman Agilent Technologies, Inc. 2850 Centerville Road Wilmington, DE 19808 USA Application Note Food Testing Abstract There are different ways to analyze fatty acids (FAs) in oil. This application note shows how to analyze them after a base-catalyzed reaction and the advantages of preparing the samples with the Agilent 7696A Sample Prep WorkBench. Introduction The analysis of FAs is very common in olive oil industry and is usually done by gas chromatography. Due to their polar nature and their high boiling points, they generally show poor peak shapes and bad reproducibility. To avoid these problems, most methods use derivatization reactions to convert FAs to fatty acid methyl esters (FAMEs), which are easier to separate and exhibit better peak shapes. There are a large number of derivatization reactions. One of the most common is the base-catalyzed reaction, which uses hexane and potassium hydroxide (KOH) in methanol. This method is quick, simple, and provides good results although it does not work on free fatty acids.

Welcome message from author
This document is posted to help you gain knowledge. Please leave a comment to let me know what you think about it! Share it to your friends and learn new things together.
Transcript
Determination of Fatty Acid Methyl Esters(FAMEs) in Olive Oil using AutomatedSample Preparation
Authors
Enrique Longueira and Jose Pineda
Laboratorio Químico Microbiológico, S.A.
Murcia
Spain
Rebecca Veeneman
Agilent Technologies, Inc.
2850 Centerville Road
Wilmington, DE 19808
USA
Application Note
Food Testing
Abstract
There are different ways to analyze fatty acids (FAs) in oil. This application note
shows how to analyze them after a base-catalyzed reaction and the advantages of
preparing the samples with the Agilent 7696A Sample Prep WorkBench.
Introduction
The analysis of FAs is very common in olive oil industry and is usually done by gaschromatography. Due to their polar nature and their high boiling points, theygenerally show poor peak shapes and bad reproducibility. To avoid these problems,most methods use derivatization reactions to convert FAs to fatty acid methyl esters(FAMEs), which are easier to separate and exhibit better peak shapes.
There are a large number of derivatization reactions. One of the most common is thebase-catalyzed reaction, which uses hexane and potassium hydroxide (KOH) inmethanol. This method is quick, simple, and provides good results although it doesnot work on free fatty acids.
2
Experimental
MaterialsThe materials used were, n-heptane, (hexane could also havebeen used), methanol (GC grade), and potassium hydroxidefrom Baker. A solution of KOH 2N was prepared by adding11.2 g of KOH in 100 mL of methanol.
Heptane and water were used as wash solvents in the 7696ASample Prep WorkBench. The syringe that extracts KOHsolution had to be washed with both solvents, first with waterto wash away the potassium hydroxide, and then withheptane. The syringe that extracts the heptane was washedwith heptane alone.
InstrumentationThe usual method to analyze fatty acids in olive oil by basicderivatization uses 100 mg of sample, 10 mL of heptane and100 µL of potassium hydroxide in a 20-mL tube. In this study,the utility of the WorkBench was tested. Therefore, all thequantities had to be divided by 10, because this instrumentworks with 2-mL vials.
This base-catalyzed reaction happens in a single step within afew minutes.
The WorkBench was used to automatically prepare all thesamples injected into the GC/MS system.
The method used is as follows:
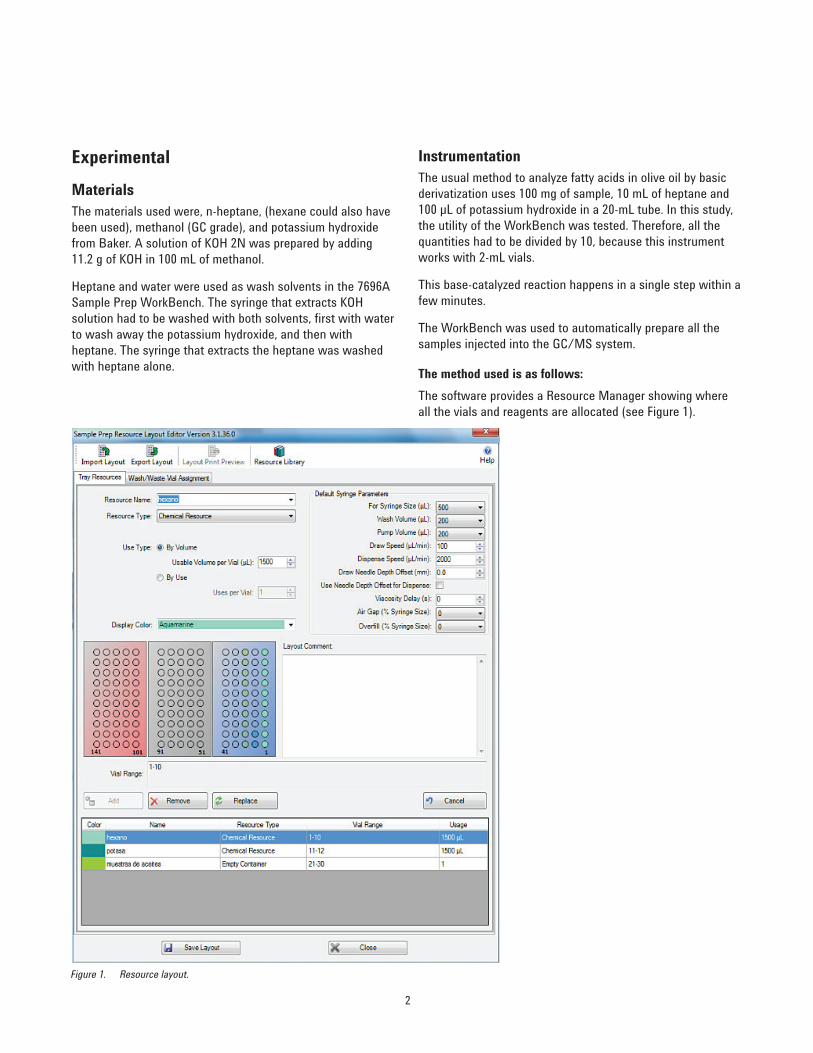
The software provides a Resource Manager showing whereall the vials and reagents are allocated (see Figure 1).
Figure 1. Resource layout.
3
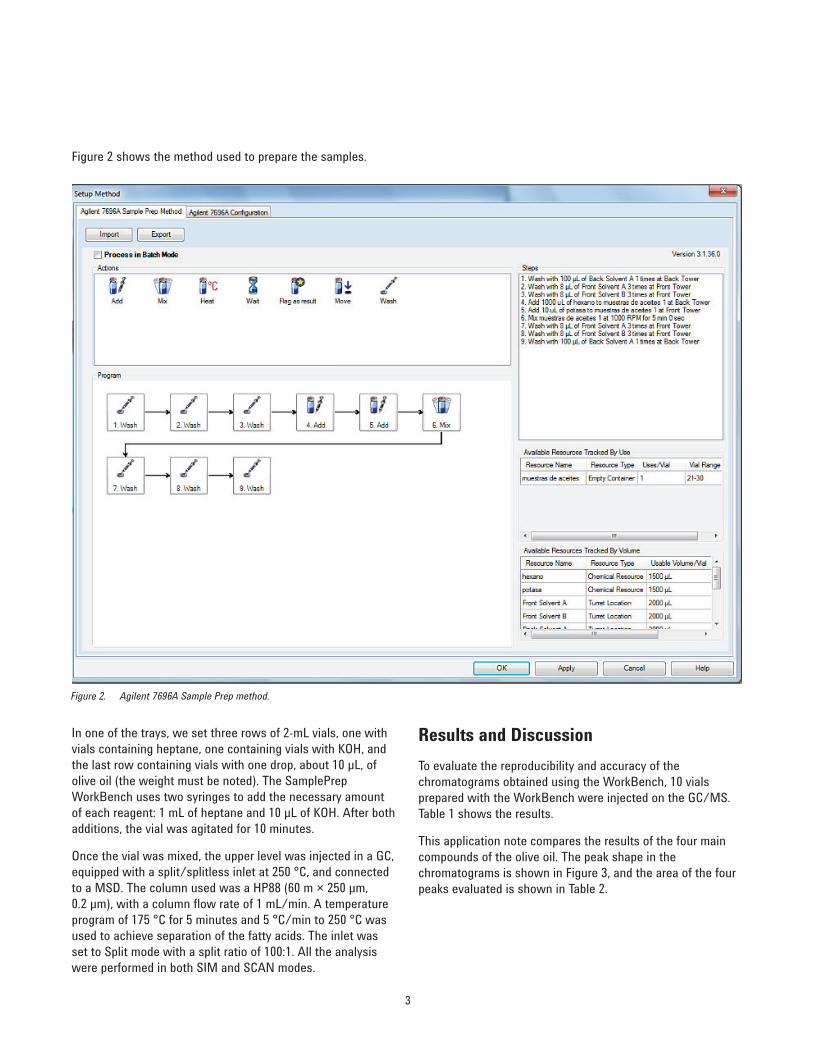
Figure 2 shows the method used to prepare the samples.
In one of the trays, we set three rows of 2-mL vials, one withvials containing heptane, one containing vials with KOH, andthe last row containing vials with one drop, about 10 µL, ofolive oil (the weight must be noted). The SamplePrepWorkBench uses two syringes to add the necessary amountof each reagent: 1 mL of heptane and 10 µL of KOH. After bothadditions, the vial was agitated for 10 minutes.
Once the vial was mixed, the upper level was injected in a GC,equipped with a split/splitless inlet at 250 °C, and connectedto a MSD. The column used was a HP88 (60 m × 250 µm,0.2 µm), with a column flow rate of 1 mL/min. A temperatureprogram of 175 °C for 5 minutes and 5 °C/min to 250 °C wasused to achieve separation of the fatty acids. The inlet wasset to Split mode with a split ratio of 100:1. All the analysiswere performed in both SIM and SCAN modes.
Results and Discussion
To evaluate the reproducibility and accuracy of thechromatograms obtained using the WorkBench, 10 vialsprepared with the WorkBench were injected on the GC/MS.Table 1 shows the results.
This application note compares the results of the four maincompounds of the olive oil. The peak shape in thechromatograms is shown in Figure 3, and the area of the fourpeaks evaluated is shown in Table 2.
Figure 2. Agilent 7696A Sample Prep method.
4
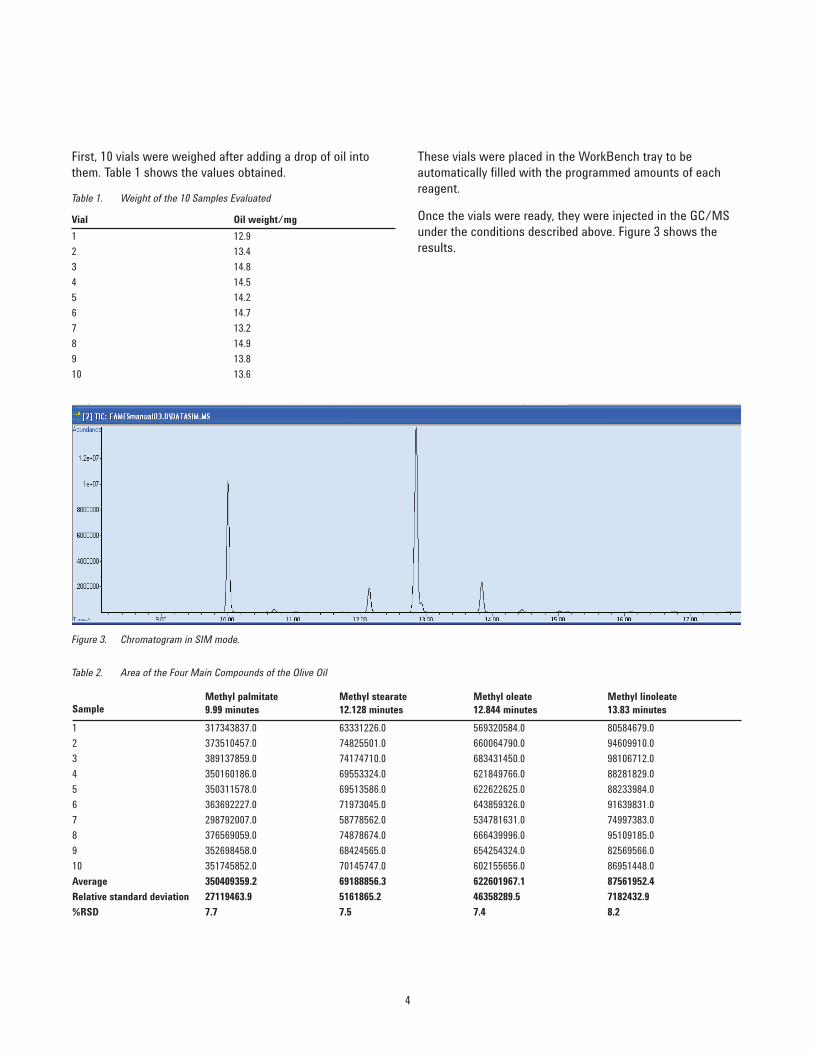
Figure 3. Chromatogram in SIM mode.
First, 10 vials were weighed after adding a drop of oil intothem. Table 1 shows the values obtained.
Table 1. Weight of the 10 Samples Evaluated
These vials were placed in the WorkBench tray to beautomatically filled with the programmed amounts of eachreagent.
Once the vials were ready, they were injected in the GC/MSunder the conditions described above. Figure 3 shows theresults.
Vial Oil weight/mg
1 12.9
2 13.4
3 14.8
4 14.5
5 14.2
6 14.7
7 13.2
8 14.9
9 13.8
10 13.6
SampleMethyl palmitate9.99 minutes
Methyl stearate12.128 minutes
Methyl oleate12.844 minutes
Methyl linoleate13.83 minutes
1 317343837.0 63331226.0 569320584.0 80584679.0
2 373510457.0 74825501.0 660064790.0 94609910.0
3 389137859.0 74174710.0 683431450.0 98106712.0
4 350160186.0 69553324.0 621849766.0 88281829.0
5 350311578.0 69513586.0 622622625.0 88233984.0
6 363692227.0 71973045.0 643859326.0 91639831.0
7 298792007.0 58778562.0 534781631.0 74997383.0
8 376569059.0 74878674.0 666439996.0 95109185.0
9 352698458.0 68424565.0 654254324.0 82569566.0
10 351745852.0 70145747.0 602155656.0 86951448.0
Average 350409359.2 69188856.3 622601967.1 87561952.4
Relative standard deviation 27119463.9 5161865.2 46358289.5 7182432.9
%RSD 7.7 7.5 7.4 8.2
Table 2. Area of the Four Main Compounds of the Olive Oil
5
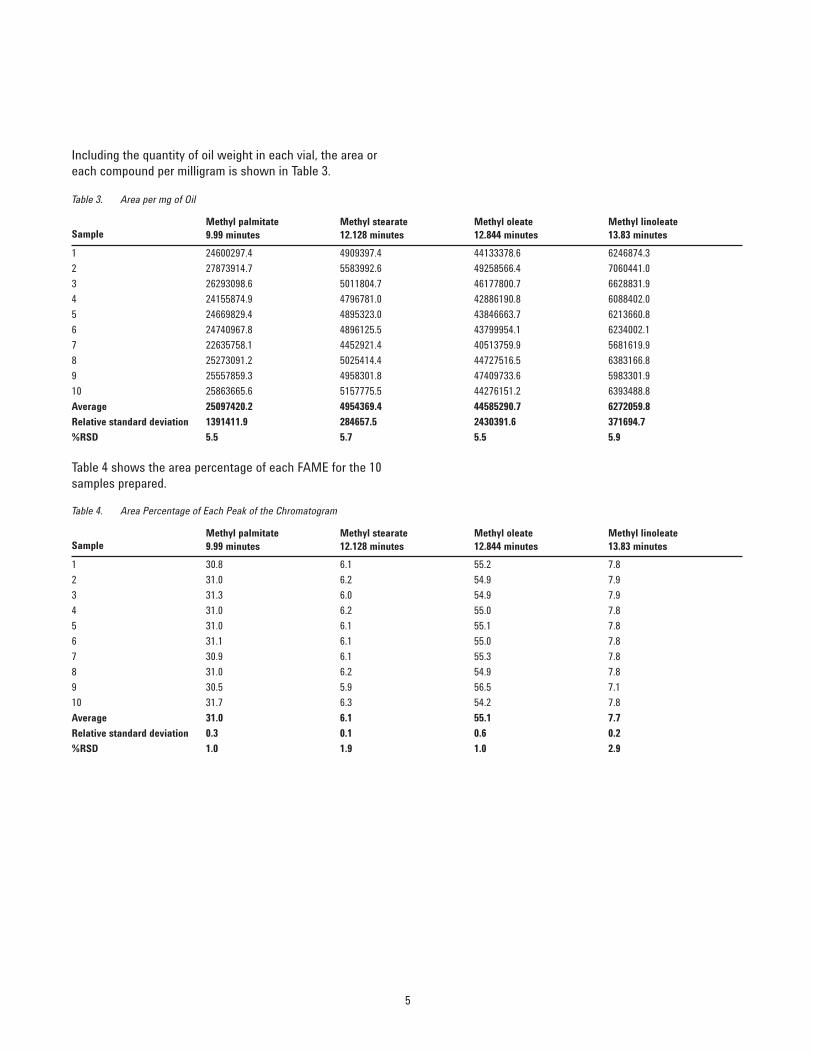
Including the quantity of oil weight in each vial, the area oreach compound per milligram is shown in Table 3.
Table 3. Area per mg of Oil
SampleMethyl palmitate 9.99 minutes
Methyl stearate12.128 minutes
Methyl oleate 12.844 minutes
Methyl linoleate 13.83 minutes
1 24600297.4 4909397.4 44133378.6 6246874.3
2 27873914.7 5583992.6 49258566.4 7060441.0
3 26293098.6 5011804.7 46177800.7 6628831.9
4 24155874.9 4796781.0 42886190.8 6088402.0
5 24669829.4 4895323.0 43846663.7 6213660.8
6 24740967.8 4896125.5 43799954.1 6234002.1
7 22635758.1 4452921.4 40513759.9 5681619.9
8 25273091.2 5025414.4 44727516.5 6383166.8
9 25557859.3 4958301.8 47409733.6 5983301.9
10 25863665.6 5157775.5 44276151.2 6393488.8
Average 25097420.2 4954369.4 44585290.7 6272059.8
Relative standard deviation 1391411.9 284657.5 2430391.6 371694.7
%RSD 5.5 5.7 5.5 5.9
Table 4 shows the area percentage of each FAME for the 10samples prepared.
Table 4. Area Percentage of Each Peak of the Chromatogram
SampleMethyl palmitate 9.99 minutes
Methyl stearate12.128 minutes
Methyl oleate 12.844 minutes
Methyl linoleate 13.83 minutes
1 30.8 6.1 55.2 7.8
2 31.0 6.2 54.9 7.9
3 31.3 6.0 54.9 7.9
4 31.0 6.2 55.0 7.8
5 31.0 6.1 55.1 7.8
6 31.1 6.1 55.0 7.8
7 30.9 6.1 55.3 7.8
8 31.0 6.2 54.9 7.8
9 30.5 5.9 56.5 7.1
10 31.7 6.3 54.2 7.8
Average 31.0 6.1 55.1 7.7
Relative standard deviation 0.3 0.1 0.6 0.2
%RSD 1.0 1.9 1.0 2.9
6
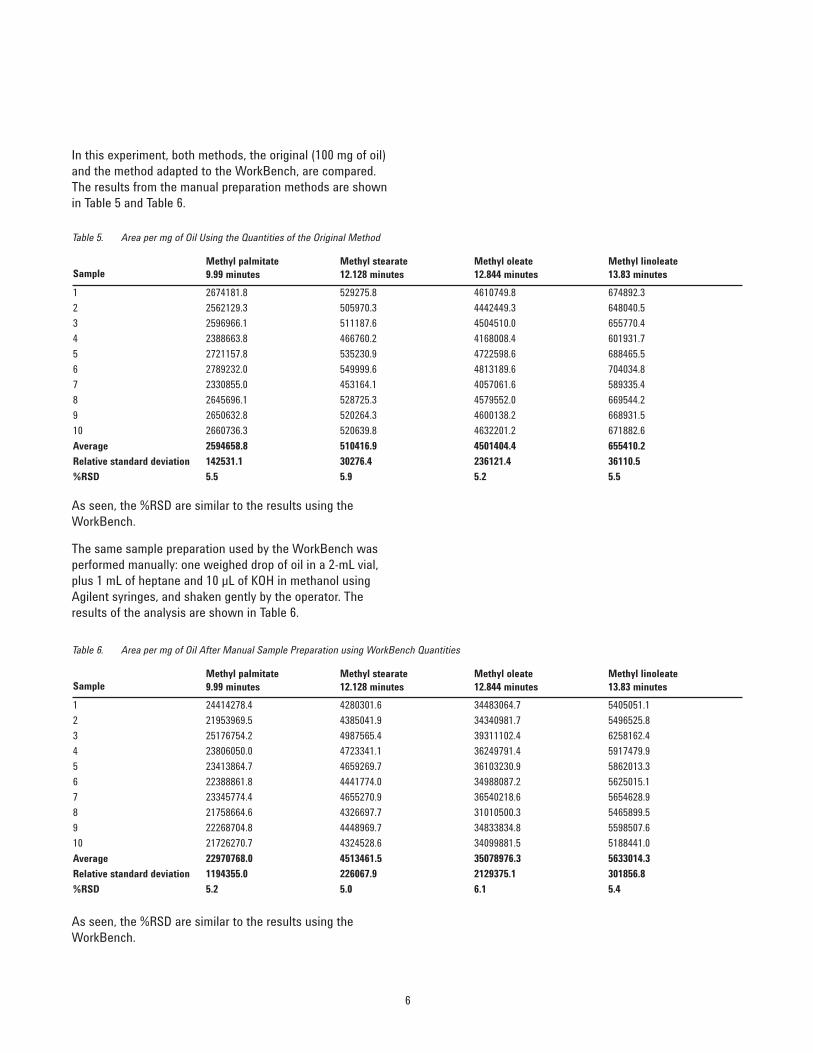
In this experiment, both methods, the original (100 mg of oil)and the method adapted to the WorkBench, are compared.The results from the manual preparation methods are shownin Table 5 and Table 6.
SampleMethyl palmitate9.99 minutes
Methyl stearate12.128 minutes
Methyl oleate12.844 minutes
Methyl linoleate13.83 minutes
1 2674181.8 529275.8 4610749.8 674892.3
2 2562129.3 505970.3 4442449.3 648040.5
3 2596966.1 511187.6 4504510.0 655770.4
4 2388663.8 466760.2 4168008.4 601931.7
5 2721157.8 535230.9 4722598.6 688465.5
6 2789232.0 549999.6 4813189.6 704034.8
7 2330855.0 453164.1 4057061.6 589335.4
8 2645696.1 528725.3 4579552.0 669544.2
9 2650632.8 520264.3 4600138.2 668931.5
10 2660736.3 520639.8 4632201.2 671882.6
Average 2594658.8 510416.9 4501404.4 655410.2
Relative standard deviation 142531.1 30276.4 236121.4 36110.5
%RSD 5.5 5.9 5.2 5.5
Table 5. Area per mg of Oil Using the Quantities of the Original Method
As seen, the %RSD are similar to the results using theWorkBench.
The same sample preparation used by the WorkBench wasperformed manually: one weighed drop of oil in a 2-mL vial,plus 1 mL of heptane and 10 µL of KOH in methanol usingAgilent syringes, and shaken gently by the operator. Theresults of the analysis are shown in Table 6.
SampleMethyl palmitate9.99 minutes
Methyl stearate12.128 minutes
Methyl oleate12.844 minutes
Methyl linoleate13.83 minutes
1 24414278.4 4280301.6 34483064.7 5405051.1
2 21953969.5 4385041.9 34340981.7 5496525.8
3 25176754.2 4987565.4 39311102.4 6258162.4
4 23806050.0 4723341.1 36249791.4 5917479.9
5 23413864.7 4659269.7 36103230.9 5862013.3
6 22388861.8 4441774.0 34988087.2 5625015.1
7 23345774.4 4655270.9 36540218.6 5654628.9
8 21758664.6 4326697.7 31010500.3 5465899.5
9 22268704.8 4448969.7 34833834.8 5598507.6
10 21726270.7 4324528.6 34099881.5 5188441.0
Average 22970768.0 4513461.5 35078976.3 5633014.3
Relative standard deviation 1194355.0 226067.9 2129375.1 301856.8
%RSD 5.2 5.0 6.1 5.4
Table 6. Area per mg of Oil After Manual Sample Preparation using WorkBench Quantities
As seen, the %RSD are similar to the results using theWorkBench.
7
Conclusions
The Agilent 7696A Sample Prep WorkBench is a verycomfortable, fast, easy and reliable tool to automate sometypical laboratory work such as sample preparation. Theresults detailed in this application note how thereproducibility of the analysis when performed with theWorkBench. The results obtained from the WorkBenchpreparation are very similar to those obtained with a manualpreparation both with original resource quantities andWorkBench-scale quantities.
For More Information
These data represent typical results. For more information onour products and services, visit our Web site atwww.agilent.com/chem.

www.agilent.com/chem
Agilent shall not be liable for errors contained herein or for incidental or consequentialdamages in connection with the furnishing, performance, or use of this material.
Information, descriptions, and specifications in this publication are subject to changewithout notice.
© Agilent Technologies, Inc., 2012Printed in the USAJuly 24, 20125991-0761EN
Related Documents