Bernadette Reiter, BSc Determination of eicosanoids in dOFM samples by HPLC-MS to achieve the university degree of MASTER'S THESIS Diplom-Ingenieurin Master's degree programme: Technical Chemistry submitted to Graz University of Technology Supervisor Univ.-Prof. Mag. Dr.rer.nat. Kevin Francesconi Institute of Chemistry University of Graz DI Dr. Anita Eberl JOANNEUM RESEARCH Forschungsgesellschaft mbH - HEALTH, Graz Graz, September 2015

Welcome message from author
This document is posted to help you gain knowledge. Please leave a comment to let me know what you think about it! Share it to your friends and learn new things together.
Transcript

Bernadette Reiter, BSc
Determination of eicosanoids in dOFM samples by HPLC-MS
to achieve the university degree of
MASTER'S THESIS
Diplom-Ingenieurin
Master's degree programme: Technical Chemistry
submitted to
Graz University of Technology
Supervisor
Univ.-Prof. Mag. Dr.rer.nat. Kevin Francesconi
Institute of Chemistry
University of Graz
DI Dr. Anita Eberl
JOANNEUM RESEARCH Forschungsgesellschaft mbH - HEALTH, Graz
Graz, September 2015

AFFIDAVIT
I declare that I have authored this thesis independently, that I have not used other
than the declared sources/resources, and that I have explicitly indicated all ma-
terial which has been quoted either literally or by content from the sources used.
The text document uploaded to TUGRAZonline is identical to the present master‘s
thesis dissertation.
Date Signature

DANKSAGUNG
Danksagung
An dieser Stelle möchte ich mich bei all jenen Personen bedanken, die durch ihre fachliche und
persönliche Unterstützung zum Gelingen meiner Diplomarbeit beigetragen haben.
Mein Dank gilt Herrn Univ.-Prof. Mag. Dr.rer.nat. Kevin Francesconi für das Übernehmen der
universitären Betreuung, kompetente Beratung und für dessen Hilfsbereitschaft, die er mir stets
entgegenbrachte.
Ebenso danke ich Frau DIin Dr.in Anita Eberl für ihre stetige Unterstützung, ohne ihre Bemühungen
wäre diese Arbeit nicht zustande gekommen. Weiterhin danke ich Herrn Mag. Dr. Christoph Magnes
für die Bereitstellung des spannenden Forschungsthemas. Bedanken möchte ich mich auch bei allen
anderen Mitarbeitern und meinen liebgewonnenen KollegInnen der Joanneum Research
Forschungsgesellschaft mbH für die Hilfsbereitschaft und gute Zusammenarbeit.
Ein ganz besonderer Dank gilt meiner Familie, meinen Eltern und Geschwistern, die mir mein
Studium ermöglicht haben. Sie haben mich immer wieder ermutigt und mich stets in all meinen
Entscheidungen unterstützt.
Abschließend möchte ich noch all meinen FreundInnen danken, die mir immer mit Rat und Tat zur
Seite gestanden haben und dank denen ich auf eine äußerst schöne Studienzeit zurückblicken kann.
Danke!

ABSTRACT
Abstract
Eicosanoids represent a large class of bioactive lipid mediators. As such they are involved in
numerous physiological processes where they play an important role especially in inflammation. The
usually very low in vivo concentrations of eicosanoids require highly sensitive analytical methods.
The aim of this thesis was to develop a multi-analyte HPLC-MS method for the quantification of
important eicosanoids in diluted interstitial fluid. It deals with the development, optimisation and
also critical evaluation of the whole analytical process, from sampling to measurement with the
focus on mass spectrometric detection. Additionally, a comparison of the developed high resolution
MS method with triple quadrupole MS was performed and discussed.
Analytes were extracted by solid phase extraction in 96-well-plate format. An HPLC method was
developed to separate 10 representatives of prostaglandins, thromboxanes,
hydroxyeicosapentaenoic and hydroxyeicosatetraenoic acids in a 16 min run prior to MS detection.
Because all eicosanoids contain a carboxyl-group, charged molecules were formed by electrospray
ionisation in negative mode. Analytes were qualified and quantified via fragmentation on a high
esolutio Q E a ti e™ M“. Method de elop e t as fo used o se siti it i p o e ent. The
resulting method enables qualification and quantification of eicosanoids in ng/ml or even pg/ml
range, depending on the analyte.
The developed high resolution MS method was then used to analyse interstitial fluid samples,
obtained via dermal open-flow microperfusion, from healthy as well as psoriatic skin. Most of the 10
analytes could be quantified or at least shown qualitatively to be present in the samples. Time-
concentration-profiles for each of the analytes were created and influencing factors on these
profiles discussed.

TABLE OF CONTENTS
Table of contents
1. Introduction ................................................................................................................................. 1
1.1. Eicosanoid-background information ............................................................................................ 1
1.2. Biological relevance ..................................................................................................................... 2
1.3. Pathways and classification systems ............................................................................................ 3
1.4. Analyte-specific information ........................................................................................................ 6
1.4.1. Prostaglandins .............................................................................................................................. 6
1.4.2. Thromboxanes ............................................................................................................................. 9
1.4.3. Leukotrienes ............................................................................................................................... 10
1.4.4. Hydroxyeicosatetraenoic acids .................................................................................................. 11
1.4.5. Hydroxyeicosapentaenoic acids ................................................................................................. 13
1.5. Skin: biology and functions ........................................................................................................ 14
1.6. Psoriasis ...................................................................................................................................... 16
1.6.1. Disease pattern .......................................................................................................................... 16
1.6.2. Eicosanoids in psoriasis .............................................................................................................. 17
1.7. Analytical methods ..................................................................................................................... 19
1.7.1. Sampling of dermal interstitial fluid: dermal open-flow microperfusion (dOFM) ..................... 20
1.7.2. MS detection .............................................................................................................................. 21
1.8. Objectives ................................................................................................................................... 23
2. Experimental .............................................................................................................................. 24
2.1. Chemicals ................................................................................................................................... 24
2.1.1. Standards ................................................................................................................................... 24
2.1.2. Reagents ..................................................................................................................................... 26
2.2. Equipment .................................................................................................................................. 27
2.3. Procedures ................................................................................................................................. 29
2.3.1. Sample collection ....................................................................................................................... 29
2.3.2. Preparation of standards ........................................................................................................... 29

TABLE OF CONTENTS
2.3.3. Preparation of samples .............................................................................................................. 30
2.3.4. Chromatographic separation ..................................................................................................... 34
2.3.5. Determination of eicosanoids by HPLC with TSQ Quantum™ Access MAX Triple Quadrupole
MS detection .............................................................................................................................. 35
2.3.6. Determination of eicosanoids by U-HPLC ith Q E a ti e™ M“ dete tio ............................... 36
3. Results & discussion ................................................................................................................... 37
3.1. Time-resolved eicosanoid levels in interstitial fluid of psoriatic and healthy subjects ............. 37
3.1.1. Challenges in dOFM sampling .................................................................................................... 41
3.1.2. Hemolytic effects ....................................................................................................................... 42
3.2. Recovery ..................................................................................................................................... 44
3.3. Accuracy & precision .................................................................................................................. 46
3.4. Chromatographic separation ..................................................................................................... 48
3.5. Co pa iso of Q E a ti e™ M“ ith t iple uad upole M“ ...................................................... 49
3.5.1. Scan mode: targeted MS² versus SRM ....................................................................................... 49
3.5.2. Sensitivity ................................................................................................................................... 56
3.6. Outlook ....................................................................................................................................... 58
4. Concluding comments ................................................................................................................ 59
5. References .................................................................................................................................. 60
6. Appendix .................................................................................................................................... 64

INTRODUCTION
1
1. Introduction
1.1. Eicosanoid-background information
Bioactive mediators have always been an interesting field of research. One important compound
class from these bioactive substances is the eicosanoids, also known as prostanoids. Their name
derives from the G eek o d ei os , which means 20
because of their important precursor molecule
arachidonic acid (AA), a C:20 fatty acid with four non-
conjugated unsaturated double-bonds (Figure 1).
Nowadays, eicosanoids are known to be involved in numerous important biological and physiological
processes (Buczynski et al., 2009) such as pain, regulation of blood pressure, blood coagulation,
muscle constriction, and, of course, inflammation. As such, they play an important role in diseases
like for instance arthritis, asthma, atherosclerosis and cancer (Harizi et al., 2008).
The effects of eicosanoids were firstly discovered in the 1930s by Lieb and Kurzrok (1930), who were
doing research on artificial insemination. They observed different pharmacological effects of uterine
tissue after interacting with seminal fluid: depending on whether the uterine tissue was taken from
sterile or from formerly pregnant women, it responded either by contraction or by relaxation. At
that time, they thought acetylcholine to be responsible for this reaction (Kurzrok & Lieb, 1930). In
subsequent related studies similar results were achieved (Goldblatt, 1933). Euler (1934) later was
able to extract and characterize the responsible active compound. He described the unsaturated
acidic lipid properties of the substance, which indicated a new active compound class. Because the
compound was originally identified from prostate extracts and believed to originate from the
prostate gland, Euler referred to them as p ostagla di s . Although it was later realized that the
extracts were originally produced by the vesicular glands (Bergström et al., 1963), the meanwhile
well-established name of prostaglandins remained unchanged.
Research on eicosanoids has come a long way since then; their involvement has been proven in a
vast number of biological processes, and over a hundred different types of eicosanoids have been
identified so far.
Figure 1: Structure of arachidonic acid

INTRODUCTION
2
1.2. Biological relevance
Eicosanoids can be counted as members of the lipid family of compounds. In contrast to fats, waxes
or phospholipids, eicosanoids are non-hydrolysable lipids. They possess various signalling functions,
which is probably one of their most important features. These bioactive lipids have great influence
on a vast number of physiological processes such as control of smooth muscle activity, platelet
aggregation, bronchoconstriction and inflammation (Marks, 1999). Eicosanoids interact with G-
protein-coupled transmembrane receptors, also referred to as 7-transmembrane domain receptors
(7TM receptors) due to their seven transmembrane helices (Voet & Voet, 2011). The 7TM receptors
represent a big group of membrane proteins that function as signal transduction sites. After sensing
extracellular messenger molecules they activate signal transduction pathways inside the cell which
ultimately lead to respective cellular responses (Trzaskowski et al., 2012).
Eicosanoids are also referred to as lipid mediators that have hormone-like biological principles of
operation. Unlike hormones, however, eicosanoids are not produced by glands but rather by many
different cell-types. They are not stored but formed ad hoc to trigger signalling cascades locally
already in very low concentrations in the respective area of formation. After formation, prostanoids
can affect either neighbouring cells (paracrine signalling) or the producing cell itself (autocrine
signalling). Either way, they have only a restricted radius of action, limited by fast (metabolic)
breakdown (Koolman & Röhm, 1998). Their inactivation happens within seconds either by double-
bond-reducing enzymes or via dehydrogenation of hydroxyl groups.

INTRODUCTION
3
1.3. Pathways and classification systems
Almost all types of mammalian tissue or cell possess the ability to produce eicosanoids. The essential
ω6–fatty acid arachidonic acid (AA; 20:4; 5,8,11,14), which has to be taken in through food, serves as
the most prevalent precursor of eicosanoid synthesis. It can also be formed out of the essential fatty
acids linoleic acid (18:2; 9,12) o α-linoleic acid (18:3; 9,12,15) enzymatically by different
desaturases, elongases and synthases. These synthetic pathways also lead to the formation of
dihomo-γ-linoleic acid (DGLA; 20:3, 8,11,14) and eicosapentaenoic acid (EPA; 20:5; 5,8,11,14,17),
t o ω –fatty acids, which can serve as eicosanoid precursors as well (Voet & Voet, 2011). ω6–
derived eicosanoids have more pro-inflammatory properties in contrast to ω3–derived eicosanoids,
which show anti-inflammatory activity (Schmitz & Ecker, 2008).
Arachidonic acid is stored at the Sn-2 position of glycerol-phospholipids in the phospholipid-bilayer
which builds up cell membranes. After stimulation AA is extracted by phospholipase A2 (= PLA2),
which accounts the rate-limiting step in the metabolism of arachidonic acid. Depending on the
enzyme-environment of the respective cell, AA can then undergo two different pathways leading to
the formation of different eicosanoid classes in further reaction steps (Marks, 1999), which are
shown in excerpts in Figure 2:
Cyclic pathway: leading to the formation of the highly unstable (due its containing a
peroxide group) precursor molecule PGH2 with the cyclopentane ring moiety, which is
characteristic for prostaglandins.
o Cyclooxygenases (COX): prostaglandins (PGs) and thromboxanes (TXs); these are
collectively also known as prostanoids
Linear pathway: leading to linear basic structures
o Lipoxygenases (LOX): hydroperoxyeicosatetraenoic acids (HPETEs), lipoxins (LXs),
leukotrienes (LTs)
o Cytochrome P-450 (CYP) dependent monooxygenases: hydroxyeicosatetraenoic
acids (HETEs)
o Non-enzymatic lipid oxidation: isoprostanes (IsoPs)
Parts of these pathways can be inhibited by drugs. Corticosteroids, for instance, lower PLA2 activity.
They inhibit AA-release from cell membranes and thus lead to inhibited formation of eicosanoids.
The effects of aspirin–intake can also be explained: acetylsalicylic acid inhibits COX–activity by
covalently binding to the active site of the enzyme which consequently lowers the production of

INTRODUCTION
4
prostaglandins (Voet & Voet, 2011). This leads to antipyretic (fever-reducing), analgesic (pain-
relieving) and anti-inflammatory effects.
Fig
ure
2:
Ara
chid
on
ic a
cid
– c
asc
ad
e (
Ma
soo
di
et
al.
, 2
01
0)
INTRODUCTION
5
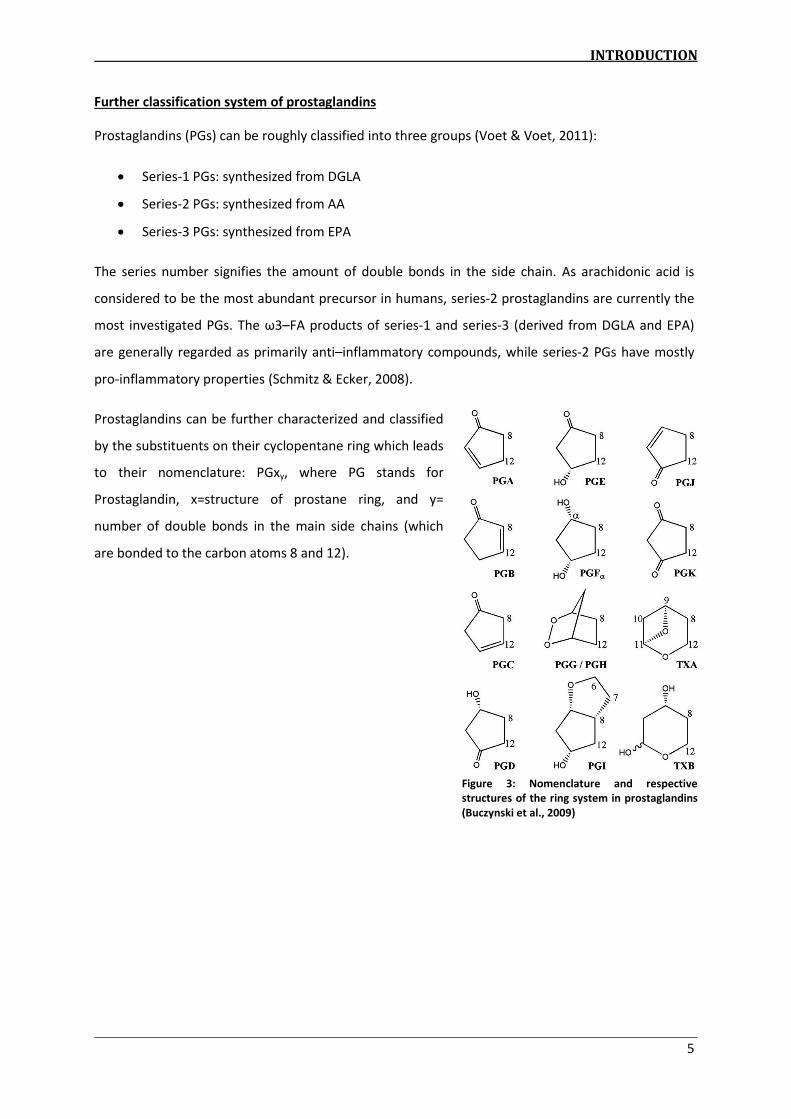
Figure 3: Nomenclature and respective
structures of the ring system in prostaglandins
(Buczynski et al., 2009)
Further classification system of prostaglandins
Prostaglandins (PGs) can be roughly classified into three groups (Voet & Voet, 2011):
Series-1 PGs: synthesized from DGLA
Series-2 PGs: synthesized from AA
Series-3 PGs: synthesized from EPA
The series number signifies the amount of double bonds in the side chain. As arachidonic acid is
considered to be the most abundant precursor in humans, series-2 prostaglandins are currently the
most investigated PGs. The ω –FA products of series-1 and series-3 (derived from DGLA and EPA)
are generally regarded as primarily anti–inflammatory compounds, while series-2 PGs have mostly
pro-inflammatory properties (Schmitz & Ecker, 2008).
Prostaglandins can be further characterized and classified
by the substituents on their cyclopentane ring which leads
to their nomenclature: PGxy, where PG stands for
Prostaglandin, x=structure of prostane ring, and y=
number of double bonds in the main side chains (which
are bonded to the carbon atoms 8 and 12).

INTRODUCTION
6
Figure 4: Structures of PGE2 parent and its
most abundant fragment ions for MS/MS
detection in negative ionization mode.1
1.4. Analyte-specific information
1.4.1. Prostaglandins
The prostaglandins are probably the best investigated eicosanoid class in terms of biochemistry,
mass spectrometry and pharmacology. They are unsaturated, hydroxylated carboxylic acids. Their
chemical structure includes a cyclopentane ring attached to two side chains; one of these has a
carboxyl group ending while the other terminates with a simple methyl group derived from
arachidonic acid. Due to the carboxylic acid group, ionisation in negative mode is preferred in ESI–
MS/MS analysis, yielding relatively stable carboxylate anions [M-H]- (Murphy et al., 2005)1.
Prostaglandins are generally synthesized by the COX-pathway and the respective synthase enzyme
present at the production site. In vivo, the four most abundant ubiquitously produced PGs are PGE2,
PGD2, PGI2 and PGF α. Usually one or two of these are produced dominantly depending on the
respective cell-type. Inflammatory responses result in a drastic change of PG production (Ricciotti &
FitzGerald, 2011). PG levels in uninflamed tissues are usually very low but in acute inflammation,
levels immediately increase, even before the intervention of immune cells or leukocytes.
PGE2
PGE2 shows numerous biological activities. It mediates many
biological functions such as regulation of blood pressure and
immune response. A wide range of pathological conditions can
be associated with disregulated PGE2 cata- or anabolism. PGE2
plays a prominent role specifically in inflammation. Many
classic signs of inflammation can be linked to PGE2. It mediates
increased arterial dilatation and microvascular permeability
which promotes higher blood pressure, redness and swelling
(Funk, 2001). Pain-sensation can be rooted back to an
interaction of PGE2 with peripheral sensory neurons and with
central sites within the brain and the spinal cord (Ricciotti &
FitzGerald, 2011). PGE2 is also regarded as an important regulator of cellular reactions in
homeostasis like proliferation and apoptosis of keratinocytes (Pilkington et al., 2014).
1 Structures of parent and its most abundant fragment ions of the prostaglandin, thromboxane & leukotriene
analytes in section 1.4 were obtained from The LIPID MAPS Lipidomics Gateway; Available at:
http://www.lipidmaps.org/ [Accessed June 11, 2015]

INTRODUCTION
7
PGD2
PGD2 is a structural isomer of PGE2 showing the same
fragment ions in MS/MS analysis. It is often further
metabolized to, for instance, PGF α or PGs of the J series like
PGJ2. It is mainly synthesized in peripheral tissue and the
central nervous system. PGD2 has inflammatory and
homeostatic properties, but is presumed to possess anti-
inflammatory mediating properties as well. It is involved in
regulating processes of sleep, pain perception and other
central nervous system activities in the brain (Eguchi et al.,
1999). In peripheral tissue, PGD2 is mainly synthesized by
mast cells, but other leukocytes are involved as well. It is also
proven that mast cells produce PGD2 as the predominant PG
within allergic reactions. Studies show that PGD2 levels are
also increased during an allergic asthma attack (Ricciotti &
FitzGerald, 2011) inter alia causing bronchoconstriction.
PGF α
PGF α i te a ts ith a so alled FP e eptor, which is
typical for eicosanoid receptors coupled to a G-protein
regulating intracellular free calcium concentration
(Ricciotti & FitzGerald, 2011). In the female
reproductive system, PGF α plays a fundamental role in
luteal regression, ovulation, smooth muscle contraction
of the uterus (Saito et al., 2003) and consequently in the
initiation of parturition (Veitch et al., 2002). In vitro and
in vivo studies (Sugimoto et al., 1997) have shown that
acute inflammation is induced after administration of
PGF α. After giving NSAIDs (nonsteroidal anti–
inflammatory agents) biosynthesis of PGF α was
inhibited.
Figure 5: Structures of PGD2 parent and its
most abundant fragment ions for MS/MS
detection in negative ionization mode.1
Figure 6: Structures of PGF2α parent and its most
abundant fragment ions for MS/MS detection in
negative ionization mode1

INTRODUCTION
8
6-keto- PGF α
6–keto-PGF α is the biologically inactive product of non-
enzymatic PGI2 hydrolysis. PGI2 operates very locally and
has a short half-life. Therefore, most analytical methods are
designed to measure the decomposition product 6-keto-
PGF α instead of PGI2 (Ricciotti & FitzGerald, 2011). PGI2 is
known for its vasodilatory effects and is considered to be
the most significant prostanoid responsible for regulation
of cardiovascular homeostasis. It inhibits adhesion of
leukocytes, proliferation of vascular smooth muscle cells
(VSMC) and aggregation of platelets (Noda et al., 2007). In
VSMC, PGI2 further counteracts mitosis and consequently
acts as an inhibitor against DNA synthesis (Libby et al.,
1988). Despite its cardiovascular effects, PGI2 also plays a
vital part in mediating pain and edema formation in acute inflammation processes. It is synthesized
fast as a consequence of tissue injury, and occurs at relatively high concentrations in inflamed areas
(Bombardieri et al., 1981).
Figure 7: Structures of 6-keto-PGF α parent and
abundant fragment ions for MS/MS detection
in negative ionization mode.1

INTRODUCTION
9
1.4.2. Thromboxanes
Thromboxanes are, as well as prostaglandins, synthesized by the COX–pathway and are also
secondary products of PGH2. PGH2 is metabolized by rearrangement of a peroxide group into the
highly unstable precursor TXA2. In aqueous solutions, TXA2 has a half-life of ~ 30 s at 37 °C (Hamberg
et al., 1975). A characteristic structural feature of thromboxane is a 6-member ring-system which is
connected between C-12 and C-8 atom of the structural precursor arachidonic acid.
TXB2
The cyclic endoperoxide group present in TXA2 is easily and
non-enzymatically metabolized into the more stable TXB2.
Thus TXB2 is usually the analyte of choice in analytical
method development aiming for thromboxane related
information. The biologically active TXA2 serves as a very
important inducer of platelet aggregation and
vasoconstriction (Murphy et al., 2005). It is predominantly
produced by blood platelets, but can also be synthesized by
other types of cells like macrophages. TXA2 interacts with
the TP e epto (Ricciotti & FitzGerald, 2011) and
consequently mediates different pathophysiological and
physiological responses like contraction and proliferation of
smooth muscles, aggregation and adhesion of platelets, or
activation of inflammatory response in the endothelium.
Figure 8: Structures of TXB2 parent and
abundant fragment ions for MS/MS detection
in negative ionization mode.1

INTRODUCTION
10
Figure 9: Structures of LTB4 parent and abundant
fragment ions for MS/MS detection in negative
ionization mode.1
1.4.3. Leukotrienes
Leukotrienes are products of the 5-LOX-pathway. Their chemical structure characteristically contains
three conjugated double bonds. Different substituents are positioned allylic to these double bonds.
LTs (except for LTA2) can roughly be separated into two groups (Murphy et al., 2005): sulfidopeptide
LTs (also known as Cys-LTs) binding a substituent over a sulfur atom which is linked allylicly to the
main chain; and the dihydroxy LTs whose conjugated triene group is positioned between two
allylicly-bound hydroxyl groups.
LTB4
The light sensitive LTB4 is widely known to be the most
important activator of leukocytes and has potent
chemoattractant properties. It promotes a number of
leukocyte functions including chemotaxis, adhesion of
leucocytes to endothelial cells, the activation of
granulocytes, monocytes, macrophages, eosinophils and
T cells as well as the activation of natural killer cells. In
the respiratory system LTB4 is often linked with
bronchial asthma and the constriction of lung
parenchymal (Yokomizo et al., 2001). It is also involved
into pathophysiological processes like melanocyte
pigmentation of the skin (Yokomizo et al., 2001). In
allergic skin inflammation neutrophil-derived LTB4
promotes itching and scratching (Oyoshi et al., 2012).
INTRODUCTION
11
1.4.4. Hydroxyeicosatetraenoic acids
The chemical structure of HETEs is characterized by four double bonds and one hydroxyl-group
substituted somewhere along the main chain. HETEs are mainly produced by the LOX pathway of AA
metabolism. Arachidonic acid is thereby converted by the regio- and stereo-specific LOX enzyme into
hydroperoxyeicosatetraenoic acid (HPETE). This enzyme reaction produces mainly the respective S-
enantiomer, but sometimes also R-enantiomers (Marks, 1999). HPETEs are rapidly reduced in cells to
become the respective monohydroxy compounds (HETE). HPETEs can also be converted into HETEs
via nonspecific lipid oxidation leading to racemic compounds. A further, very important pathway to
synthesize HETEs out of arachidonic acid involves cytochrome P-450-dependent monooxygenases
which, in contrast to LOX-derived HETE production, does not form hydroperoxides as intermediates.
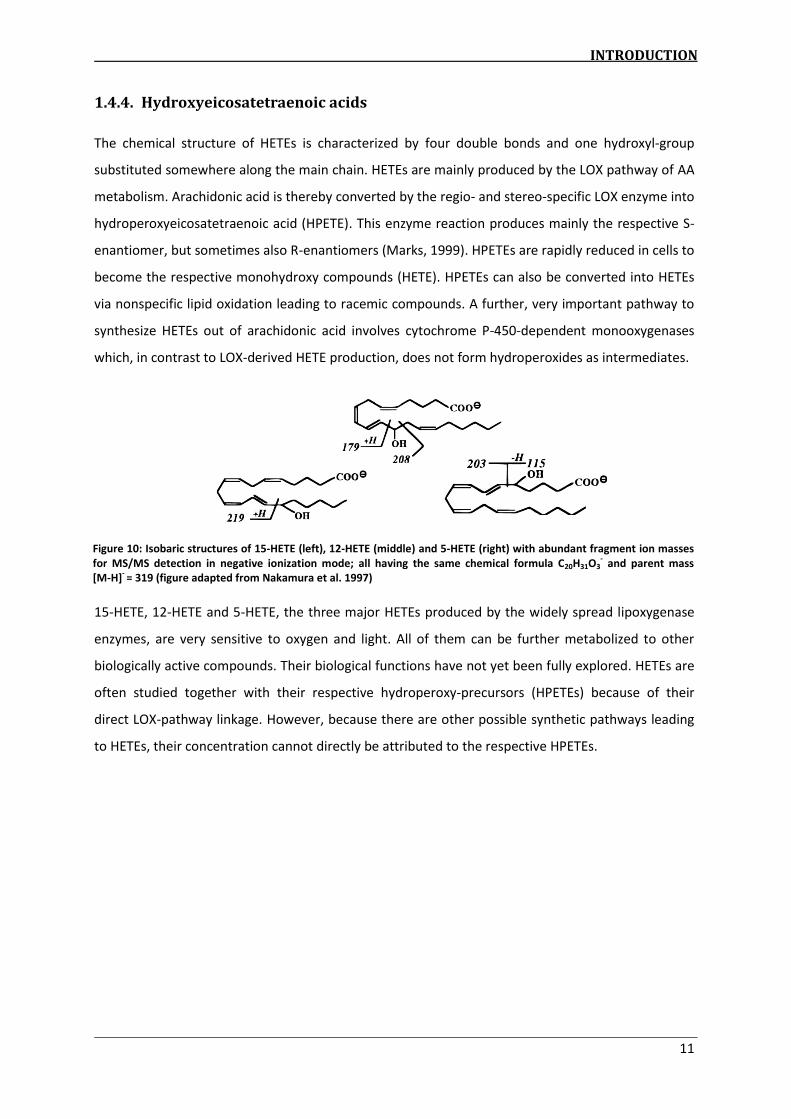
15-HETE, 12-HETE and 5-HETE, the three major HETEs produced by the widely spread lipoxygenase
enzymes, are very sensitive to oxygen and light. All of them can be further metabolized to other
biologically active compounds. Their biological functions have not yet been fully explored. HETEs are
often studied together with their respective hydroperoxy-precursors (HPETEs) because of their
direct LOX-pathway linkage. However, because there are other possible synthetic pathways leading
to HETEs, their concentration cannot directly be attributed to the respective HPETEs.
Figure 10: Isobaric structures of 15-HETE (left), 12-HETE (middle) and 5-HETE (right) with abundant fragment ion masses
for MS/MS detection in negative ionization mode; all having the same chemical formula C20H31O3- and parent mass
[M-H]- = 319 (figure adapted from Nakamura et al. 1997)

INTRODUCTION
12
15-HETE
15-HETE is the predominant HETE produced by human cells (Moreno, 2009). It can serve as a
precursor for lipoxins and can be produced by for instance the respiratory epithelium, leukocytes,
and reticulocytes. 15-HETE is implicated in metastasis, cell proliferation, cell-adhesion and
-accumulation. It is therefore assumed that 15-HETE is involved in the development of different
types of cancer like in colon, lymph nodes and many other tissues (Schneider & Pozzi, 2011).
Contrary to those properties, 15-HETE activates nuclear transcription factors which are integrated in
epithelial differentiation; a possible explanation of anti-proliferative action in terms of prostate
cancer cells2. 15-HETE further takes part in carcinogenesis, asthma, atherogenesis, asthma, cell
differentiation and inflammation. It can also counteract 12-HETE derived cell infiltration. 15-HETE
further acts conversely to 12-HETE in terms of carcinogenesis (Kendall & Nicolaou, 2013); while
12-HETE shows tumor-promoting activity, 15-HETE operates against proliferation.
12-HETE
12-HETE possesses chemotactic properties that influence cells of the human immune system
(leucocytes, neutrophils, eosinophils) and tumor cells. It stimulates tumor cell adhesion to
endothelial and subendothelial cells, for instance. 12-HETE can also function as a modulator of
membrane properties and is able to excite for example melatonin synthesis. 12-HETE can deactivate
the enzyme prostacyclinsynthase, and thus is possibly able to counteract synthesis of pro-
inflammatory PGs. At the same time it has been shown to attract inflammatory cells like neutrophils
and macrophages, and thus act pro inflammatory to the skin (Kendall & Nicolaou, 2013). It is
believed that the usually scarce 12(R)-HETE enantiomer form is involved in skin diseases, especially
in psoriasis. In fact, 12–HETE has already been detected in large amounts in psoriatic skin (Marks,
1999).
2 Christie, W.W., 2014. Hydroxyeicosatetraenoic acids and related compounds - Chemistry and Biology, pp.1–8.
Available at: http://lipidlibrary.aocs.org/Lipids/eic_hete/file.pdf [Accessed June 9, 2015]
INTRODUCTION
13
5-HETE
5-HETE serves as a potent precursor for lipoxins and leukotrienes. Although its metabolites show
more biological activity than 5-HETE itself, it possesses biological functions as well. 5-HETE is often
found in leucocytes3. It is known for increasing vascular permeability as well as recruiting and
activating inflammatory cells, two potent steps in tumorigenesis. It stimulates cancer proliferation
comparable to certain leukotrienes, and can be found in brain tumor tissue in elevated amounts
(Schneider & Pozzi, 2011).
1.4.5. Hydroxyeicosapentaenoic acids
HEPEs are products of the LOX pathway and are derived from eicosapentaenoic acid (EPA) instead of
AA. Their characteristic structure consequently contains five double bonds and one hydroxyl-group
substituted along the main chain. Eicosanoids derived from ω –fatty acid are generally counted as
anti-inflammatory mediators. Higher dietary intake of those fatty acids are beneficial in many
inflammatory disorders (Kubota et al., 2014). This effect may result from different mechanisms
(Schmitz & Ecker, 2008), either by serving as an alternative compound for forming less potent
products instead of pro-inflammatory AA-derived eicosanoids, or by being transformed into active
anti-inflammatory mediators.
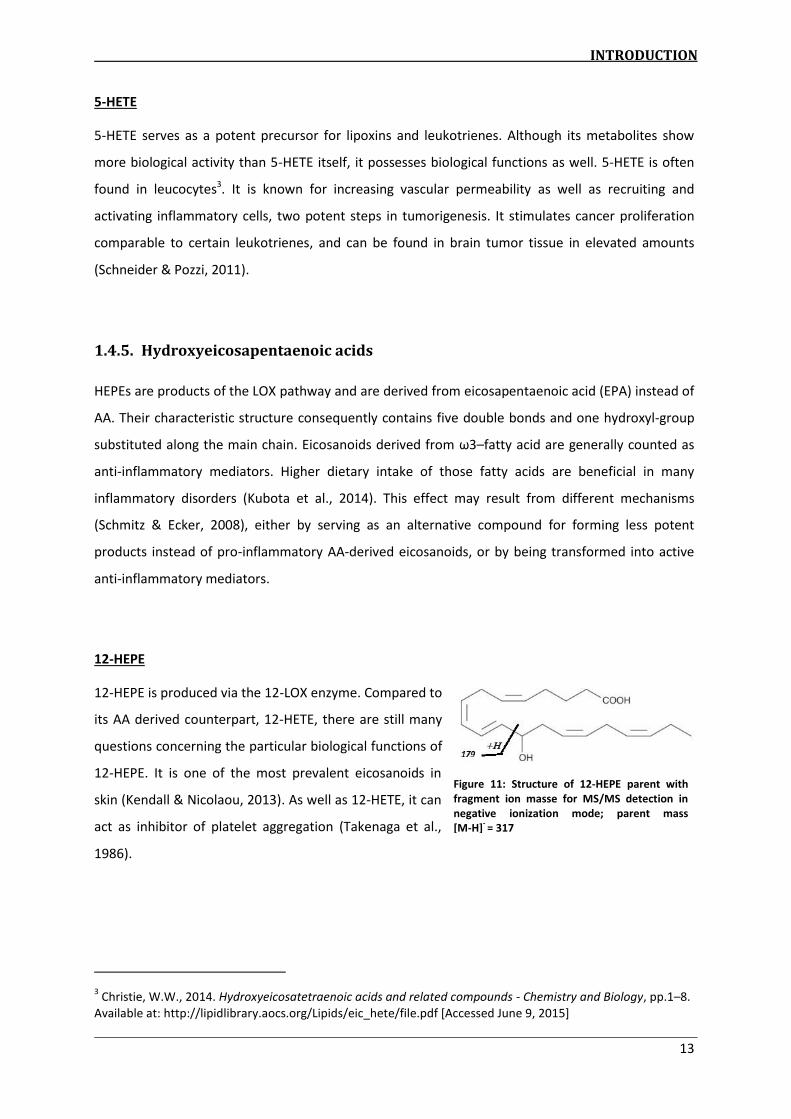
12-HEPE
12-HEPE is produced via the 12-LOX enzyme. Compared to
its AA derived counterpart, 12-HETE, there are still many
questions concerning the particular biological functions of
12-HEPE. It is one of the most prevalent eicosanoids in
skin (Kendall & Nicolaou, 2013). As well as 12-HETE, it can
act as inhibitor of platelet aggregation (Takenaga et al.,
1986).
3 Christie, W.W., 2014. Hydroxyeicosatetraenoic acids and related compounds - Chemistry and Biology, pp.1–8.
Available at: http://lipidlibrary.aocs.org/Lipids/eic_hete/file.pdf [Accessed June 9, 2015]
Figure 11: Structure of 12-HEPE parent with
fragment ion masse for MS/MS detection in
negative ionization mode; parent mass
[M-H]- = 317
INTRODUCTION
14
1.5. Skin: biology and functions
The skin is the largest organ of the human body and possesses numerous important functions. One
of its most important tasks is serving as an effective barrier against physical, chemical or microbial
assaults of all kinds like mechanical injury, UV-radiation, allergens, and bacteria. It also plays a crucial
role in the immune system, sensation of pain, touch or temperature, and also in water-loss- and
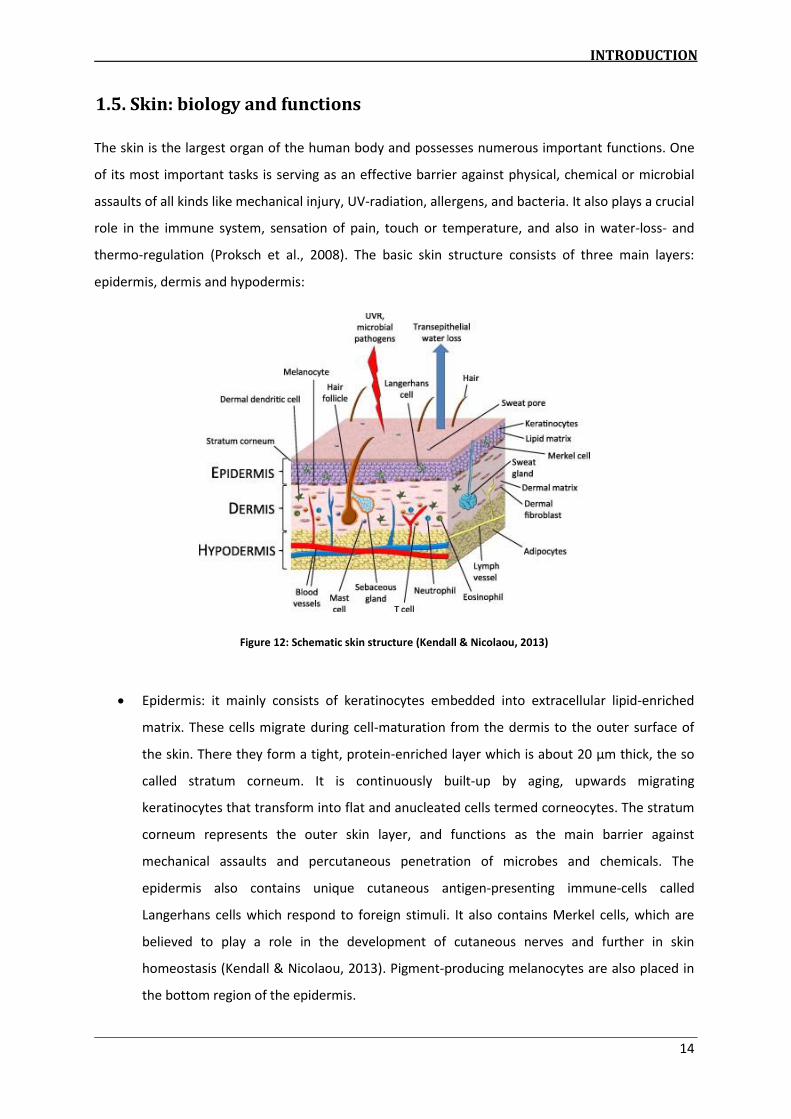
thermo-regulation (Proksch et al., 2008). The basic skin structure consists of three main layers:
epidermis, dermis and hypodermis:
Figure 12: Schematic skin structure (Kendall & Nicolaou, 2013)
Epidermis: it mainly consists of keratinocytes embedded into extracellular lipid-enriched
matrix. These cells migrate during cell-maturation from the dermis to the outer surface of
the skin. There they form a tight, protein-enriched layer which is about 20 µm thick, the so
called stratum corneum. It is continuously built-up by aging, upwards migrating
keratinocytes that transform into flat and anucleated cells termed corneocytes. The stratum
corneum represents the outer skin layer, and functions as the main barrier against
mechanical assaults and percutaneous penetration of microbes and chemicals. The
epidermis also contains unique cutaneous antigen-presenting immune-cells called
Langerhans cells which respond to foreign stimuli. It also contains Merkel cells, which are
believed to play a role in the development of cutaneous nerves and further in skin
homeostasis (Kendall & Nicolaou, 2013). Pigment-producing melanocytes are also placed in
the bottom region of the epidermis.

INTRODUCTION
15
Dermis: the dermis is separated from the epidermis through a basal membrane. It contains
sweat glands, hair follicles, sensory nerves and smaller blood vessels. The dermal matrix
consists of collagen, elastic fibres, fibroblasts and numerous immune cells. Important
immune cells like neutrophils, macrophages/monocytes, B cells, T cells, eosinophils,
dendritic and mast cells undergo routine surveillance processes in the dermis. During
inflammation, resident and other immune cells also infiltrate the cutaneous tissue triggered
by inflammatory mediator stimulation (e.g.: cytokines, bioactive lipids) (Kendall & Nicolaou,
2013) consequently leading to a notably increased population of cutaneous immune cells.
Hypodermis: below the epidermis and dermis lays the hypodermis, also known as reticular
dermis or subcutaneous tissue. Adipocytes form adipose tissue in which blood and lymph
vessels are embedded. These vessels allow migration and constant flux of (immune) cells out
of and into the skin, depending on the respective demands of the cutaneous immune and
inflammatory system. The main function of adipose tissue is to serve as a lipid reserve for
energy generation. But the adipocytes range of duty also involves the production of
important bioactive lipid mediators consequently influencing other cutaneous cells (Kendall
& Nicolaou, 2013).
INTRODUCTION
16
1.6. Psoriasis
Psoriasis is one of the most prevalent skin diseases (=dermatoses) in humans, affecting
120-180 million people worldwide (Pietrzak et al., 2010). Despite the widespread occurrence of
psoriasis, its etiology is still not completely understood (Kendall & Nicolaou, 2013). Its prevalence is
believed to be mainly influenced by genetic, environmental, immunological, infectious, biochemical
and physiological factors, but can also be related to alcohol and drugs. Psoriasis can be described as
a multifactorial immunometabolic disease, which involves inflammation of the skin.
1.6.1. Disease pattern
Psoriasis can be described as an organ-specific autoimmune disease triggered by activation of the
ellula i u e s ste . A autoi u e disease is defi ed as a li i al s d o e aused the
activation of T cells or B cells, or both, in the absence of an ongoing infection or other discernible
ause (Davidson & Diamond, 2001). Hence psoriasis can be related to other immune-mediated
diseases like rheumatoid arthritis, multiple sclerosis or diabetes. It can accompany a broad variety of
multi-organ abnormalities and dysfunctions (Pietrzak et al., 2010). Patients suffering from psoriasis
have been reported to show increased risk of other diseases like hypertension, diabetes, obesity,
dyslipidemia, atherosclerosis, cerebral stroke, cardiovascular disease, osteoporosis, depression and
also cancer.
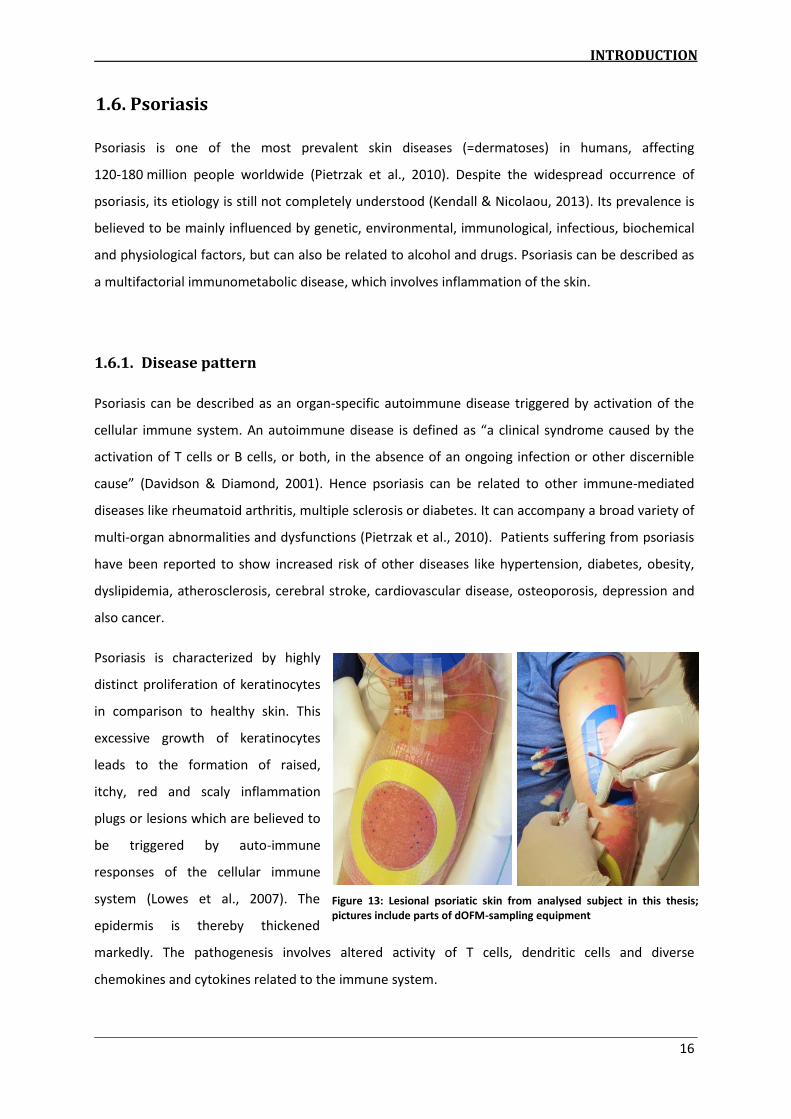
Psoriasis is characterized by highly
distinct proliferation of keratinocytes
in comparison to healthy skin. This
excessive growth of keratinocytes
leads to the formation of raised,
itchy, red and scaly inflammation
plugs or lesions which are believed to
be triggered by auto-immune
responses of the cellular immune
system (Lowes et al., 2007). The
epidermis is thereby thickened
markedly. The pathogenesis involves altered activity of T cells, dendritic cells and diverse
chemokines and cytokines related to the immune system.
Figure 13: Lesional psoriatic skin from analysed subject in this thesis;
pictures include parts of dOFM-sampling equipment
INTRODUCTION
17
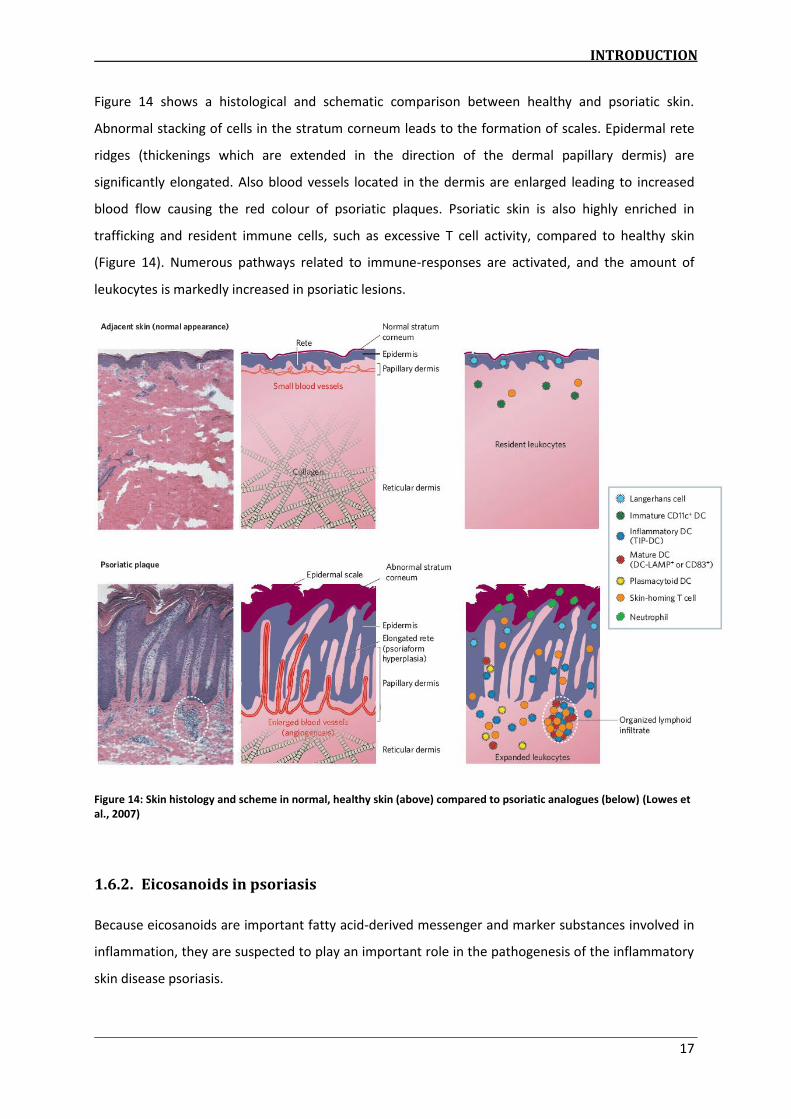
Figure 14 shows a histological and schematic comparison between healthy and psoriatic skin.
Abnormal stacking of cells in the stratum corneum leads to the formation of scales. Epidermal rete
ridges (thickenings which are extended in the direction of the dermal papillary dermis) are
significantly elongated. Also blood vessels located in the dermis are enlarged leading to increased
blood flow causing the red colour of psoriatic plaques. Psoriatic skin is also highly enriched in
trafficking and resident immune cells, such as excessive T cell activity, compared to healthy skin
(Figure 14). Numerous pathways related to immune-responses are activated, and the amount of
leukocytes is markedly increased in psoriatic lesions.
Figure 14: Skin histology and scheme in normal, healthy skin (above) compared to psoriatic analogues (below) (Lowes et
al., 2007)
1.6.2. Eicosanoids in psoriasis
Because eicosanoids are important fatty acid-derived messenger and marker substances involved in
inflammation, they are suspected to play an important role in the pathogenesis of the inflammatory
skin disease psoriasis.

INTRODUCTION
18
Among other symptoms, psoriatic patients demonstrate altered lipid metabolism, which represents
one of the key metabolic pathways in skin pathology. Hence the composition of fatty acids in
psoriatic skin differs from that in healthy skin. Altered lipid metabolism consequently leads to
changes in eicosanoid synthesis. One crucial factor in eicosanoid-regulation is the release of
polyunsaturated fatty acids from cell membranes, a process carried out enzymatically by PLA2.
Different types of the AA-releasing PLA2 are altered and partly up-regulated in psoriasis (Kendall &
Nicolaou, 2013). Levels of AA-derived HETEs and also, to a lesser extent, PGE2 and PGF α have
already been reported to be increased in psoriatic skin (Hammarström et al., 1975).
12-HETE, generally a very prominent eicosanoid in skin, is believed to be one of the eicosanoids most
affected by psoriasis. Owing to its chemotactic properties, 12-HETE is suspected to attract immune
cells like neutrophils and hence promote the development of an inflammatory milieu. These
neutrophils are suspected to synthesize LTs and general eicosanoic 5-LOX products. The leukotrienes
such as LTB4 play an important role in psoriatic pathogenesis. LTB4 stimulates neutrophil activity
such as aggregation, chemokinesis and degranulation by receptor binding. LTB4 is further able to
stimulate changes of the dermis and epidermal hyperproliferation. Products of the 5-LOX pathway
like LTB4, its precursor 5-HETE and also cys-LTs like LTC4 and LTD4 have already been shown multiple
times to be elevated in psoriatic patients (Ikai, 1999) in various sample types, e.g. from epidermis,
scales to suction blister fluid sampled from psoriatic lesions, and many others.
15-HETE is one of the predominant LOX-products in normal dermis where it inhibits chemotactic and
pro-inflammatory enzyme activities like those of 5-LOX and 12-LOX. 15-HETE can counteract 12-HETE
(Ikai, 1999). Studies have already shown lower 15-HETE content of psoriatic compared to normal
skin; simultaneously, 12-HETE showed an opposite trend by increased levels in psoriatic skin
(Kragballe & Voorhees, 1987).
The roles of other eicosanoids in psoriasis are still not clarified. For instance PGE2 can cause
vasodilation and increased blood flow in the already enlarged blood vessels of psoriatic dermis while
at the same time it can act as an anti-inflammatory agent due to its potential immunosuppressive
properties (e.g.: inhibition of lymphocytes and monocytes). Therefore, in psoriasis the role of PGE2 in
psoriasis is still controversial (Ikai, 1999).
INTRODUCTION
19
1.7. Analytical methods
The fast growing interest in the resolution of lipid mediator pathways has created an urgent need for
efficient analytical qualification and quantification methods of eicosanoids. These should be highly
sensitive, selective, accurate and time efficient.
Because eicosanoids are so widely distributed, they are studied in various types of sample-matrices:
blood, serum, plasma, urine, suction blister fluid, exhaled breath condensate, different kinds of
tissues and many more. To purify the analyte and minimise interfering matrix components, various
clean-up procedures can be used. Protein precipitation (PP), liquid-liquid-extraction (LE) or
immunoaffinity chromatography (IA) are sometimes used as a clean-up step prior to eicosanoid
measurement (Martin-Venegas et al., 2014), sample preparation is mostly done with solid phase
extraction (SPE). It is relatively simple and shows a broad field of application with sufficiently high
extraction efficiency.
Currently used measurement approaches for eicosanoids are briefly described here.
Radioimmunoassays and enzyme-linked immunosorbent assays are commonly used (D. Wang &
DuBois, 2007), but these methodologies possess several drawbacks: they measure only one
substance at a time, they show cross-reactivity, are only available for particular analytes, and
sometimes lack selectivity. Gas chromatography (GC) with mass spectrometry (MS) or tandem mass
spectrometry (MS/MS) is also used (Hughes et al., 1988). Derivatisation is necessary for GC-analysis
to form volatile species; this additional sample preparation step and the GC-separation are limited to
thermally stable analytes and their corresponding derivatives.
Although the above methods are still commonly used and have particular applications, state of the
art methods for measuring eicosanoids are based on high performance liquid chromatography
(HPLC) combined with MS or MS/MS detection (Massey & Nicolaou, 2013). Only the most relevant
key data common for most analytical approaches concerning eicosanoids are discussed in this
paragraph; a more detailed description and discussion of these methods can be found later on in the
introduction section: Quantification is mostly performed using deuterated analytes as internal
standards. In order to improve selectivity, the various acidic/lipoid eicosanoids extracted by SPE are
separated chromatographically, mostly on reversed-phased C-18 columns, prior to measurement.
Analytes are usually ionised in negative ionisation mode, which is preferred due to the carboxyl
group in eicosanoids. Identification and detection is often performed by fragmentation with MS/MS
devices; the superior speed of triple quadrupole mass spectrometers enables fast detection of
various eicosanoids, usually at very low concentrations (in pg/ml range).
INTRODUCTION
20
1.7.1. Sampling of dermal interstitial fluid: dermal open-flow microperfusion
(dOFM)
Dermal interstitial fluid, which was analysed in this thesis, was sampled by dermal open-flow
microperfusion (dOFM). dOFM is a novel, minimally invasive sampling technique that allows
continuous and membrane-free access to the interstitial fluid of the dermis (Bodenlenz et al., 2013).
The technique was developed for in vivo dermatological drug testing and pharmacodynamic/
pharmacokinetic studies.
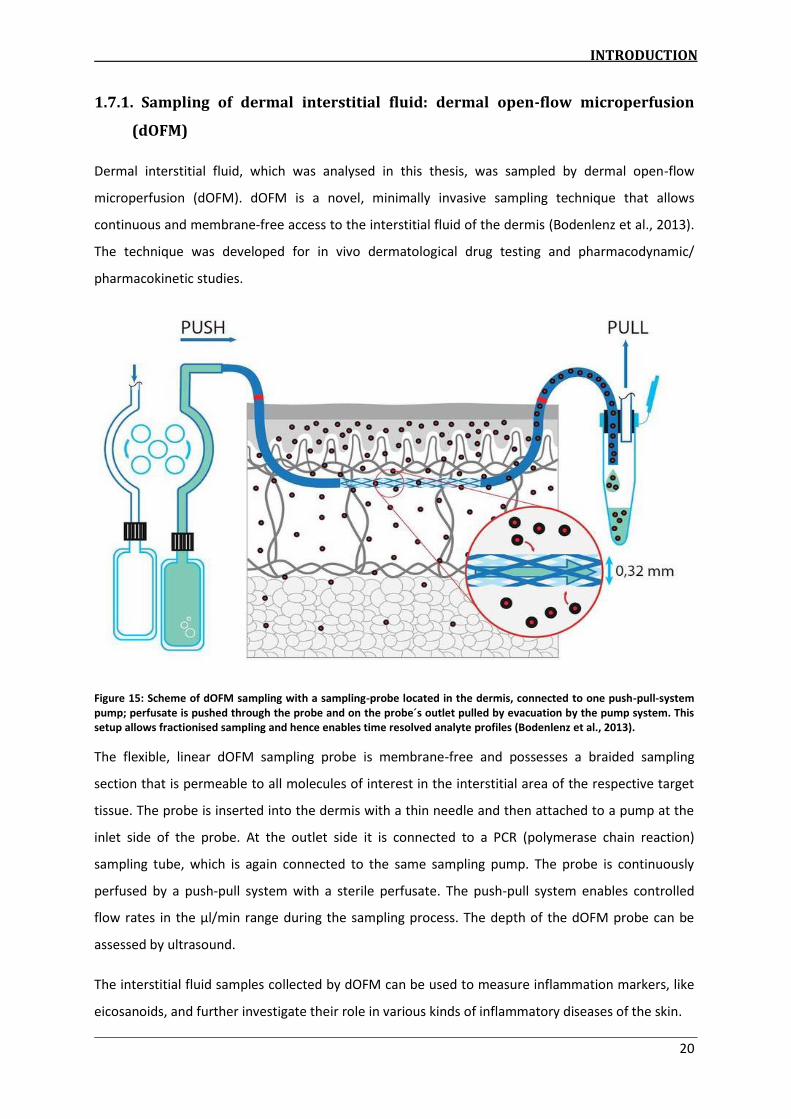
Figure 15: Scheme of dOFM sampling with a sampling-probe located in the dermis, connected to one push-pull-system
pump; perfusate is pushed through the probe and on the probe´s outlet pulled by evacuation by the pump system. This
setup allows fractionised sampling and hence enables time resolved analyte profiles (Bodenlenz et al., 2013).
The flexible, linear dOFM sampling probe is membrane-free and possesses a braided sampling
section that is permeable to all molecules of interest in the interstitial area of the respective target
tissue. The probe is inserted into the dermis with a thin needle and then attached to a pump at the
inlet side of the probe. At the outlet side it is connected to a PCR (polymerase chain reaction)
sampling tube, which is again connected to the same sampling pump. The probe is continuously
perfused by a push-pull system with a sterile perfusate. The push-pull system enables controlled
flow rates in the µl/min range during the sampling process. The depth of the dOFM probe can be
assessed by ultrasound.
The interstitial fluid samples collected by dOFM can be used to measure inflammation markers, like
eicosanoids, and further investigate their role in various kinds of inflammatory diseases of the skin.
INTRODUCTION
21
1.7.2. MS detection
This section briefly describes the basic setup and functions of the two different types of mass
spe t o ete s i Q E a ti e™ M“ a d ii t iple uad upole M“. Fu the dis ussio and comparison
of these two detectors concerning the measurement of eicosanoids can be found in section 3.5.
Q E a ti e™ M“
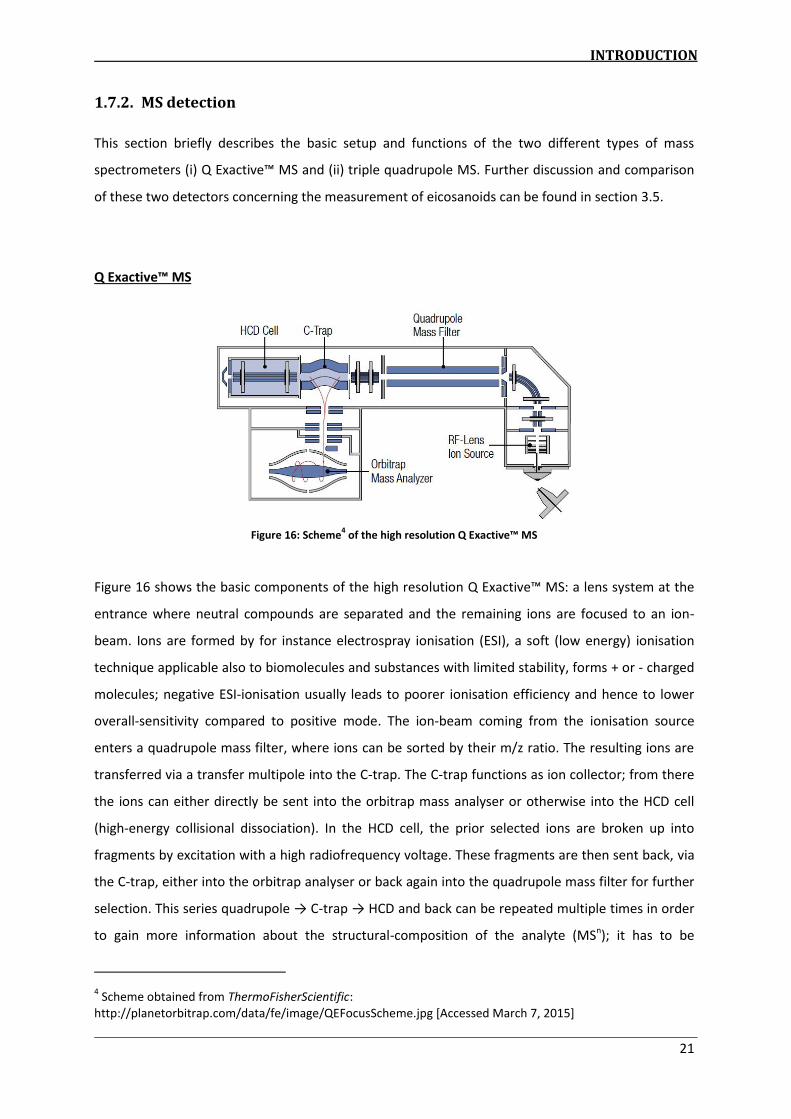
Figure 16: Scheme4 of the high esolutio Q E a ti e™ M“
Figure 16 shows the basic components of the high resolution Q E a ti e™ M“: a le s s ste at the
entrance where neutral compounds are separated and the remaining ions are focused to an ion-
beam. Ions are formed by for instance electrospray ionisation (ESI), a soft (low energy) ionisation
technique applicable also to biomolecules and substances with limited stability, forms + or - charged
molecules; negative ESI-ionisation usually leads to poorer ionisation efficiency and hence to lower
overall-sensitivity compared to positive mode. The ion-beam coming from the ionisation source
enters a quadrupole mass filter, where ions can be sorted by their m/z ratio. The resulting ions are
transferred via a transfer multipole into the C-trap. The C-trap functions as ion collector; from there
the ions can either directly be sent into the orbitrap mass analyser or otherwise into the HCD cell
(high-energy collisional dissociation). In the HCD cell, the prior selected ions are broken up into
fragments by excitation with a high radiofrequency voltage. These fragments are then sent back, via
the C-trap, either into the orbitrap analyser or back again into the quadrupole mass filter for further
selection. This se ies uad upole → C-t ap → HCD a d a k a e repeated multiple times in order
to gain more information about the structural-composition of the analyte (MSn); it has to be
4 Scheme obtained from ThermoFisherScientific:
http://planetorbitrap.com/data/fe/image/QEFocusScheme.jpg [Accessed March 7, 2015]

INTRODUCTION
22
considered that every additional lo e s o e all sig al-intensity, due to ion-loss, and thus lowers
sensitivity. Eventually fragments and ions are sent into the electrostatic field of the orbitap mass
analyser, where they move along the axis of an inner electrode due to simultaneous centrifugal
forces and electrostatic attraction. The ions circulate around the electrode in a manner dependent
on their m/z value, and they induce different frequency signals which are then detected. This design
is highly selective and responsible for the high resolving power of the orbitrap mass analysers.
Compared with most other detectors they are able to distinguish ions with extremely small mass
differences leading to very clean mass traces with minimal background (Gross, 2013).
Triple quadrupole MS
A quadrupole mass analyser consists of four parallel electrode rods. An electric field is created by
supplying them with alternating AC/DC voltage (always two opposing rods having the same polarity).
Hence the normally straight movement of passing ions can be influenced: they oscillate between the
quadrupoles due to alternating electrostatic attraction and repulsion. The degree of influence is
determined by the mass-to-charge ratio of the respective ion. Hence separation of charged
molecules is possible.
Figure 17: Scheme of a triple quadrupole mass analyser (Balgoma et al., 2013)
Figure 17 shows the main components of a triple quadrupole mass analyser. The ions originating
from the source are focused by a lens-system into the first quadrupole (Q1), where they can be
separated and sent into the second one (Q2). This second quadrupole contains an inert gas and
functions as a collision cell; the ions selected by Q1 collide with the inert gas leading to
fragmentation. These fragments can then be further separated in a third mass analyser (Q3), which
is connected to a detection system. A major advantage of this MS system is its speed - numerous
m/z values can be scanned in a very short time, which makes quadrupoles perfectly suitable for
multi-analyte eicosanoid-analysis.

INTRODUCTION
23
1.8. Objectives
The aim of this thesis was the development of a multi-analyte method for qualitative and
quantitative determination of eicosanoids in human dermal interstitial fluid. The method should be
applicable to the small sample volumes (~60 µl) available from sampling with dermal open flow
microperfusion (dOFM). With this method, eicosanoid levels in dermal interstitial fluid from healthy
and psoriatic skin will be measured to assess the potential use of eicosanoids as inflammation
markers.
The analytical approach, aimed at the measurement of 10 representatives of the eicosanoid class,
involved (i) sample preparation based on SPE; (ii) separation based on RP-HPLC; and (iii) the
development of a highly sensitive mass spectrometric detection method. In addition, the HR-MS
detection was compared to triple quadrupole MS detection.
EXPERIMENTAL
24
2. Experimental
2.1. Chemicals
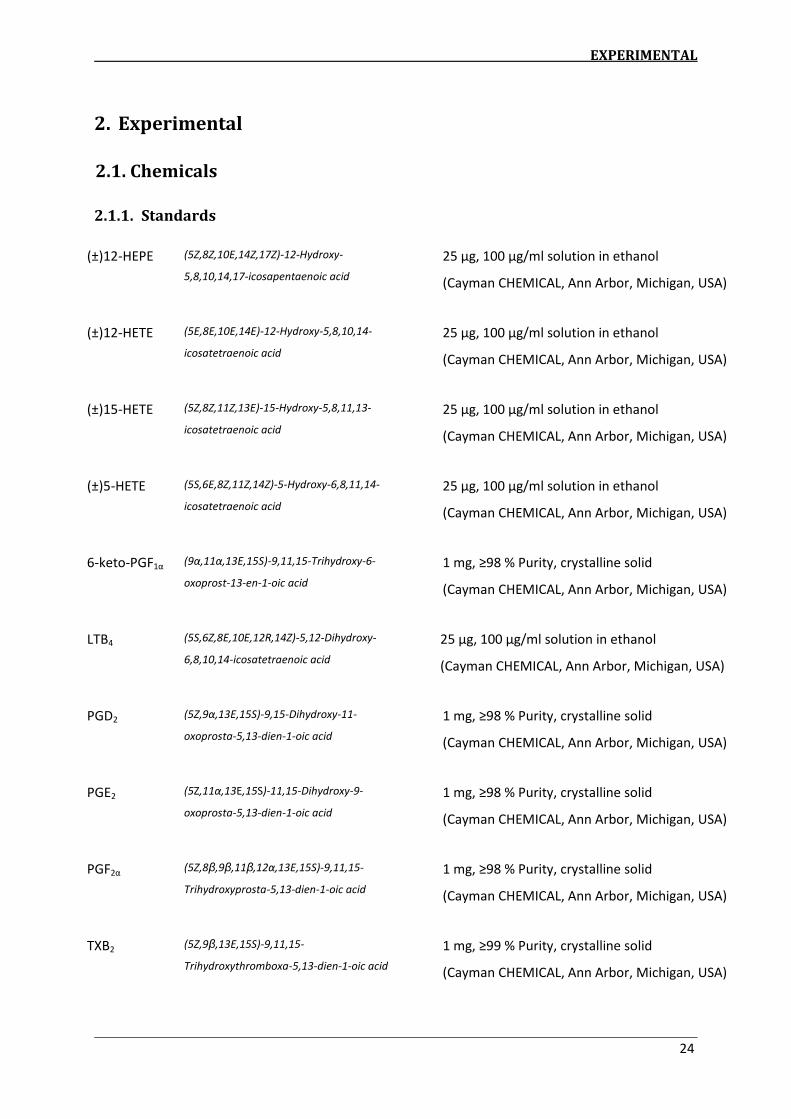
2.1.1. Standards
(±)12-HEPE (5Z,8Z,10E,14Z,17Z)-12-Hydroxy-
5,8,10,14,17-icosapentaenoic acid
25 µg, 100 µg/ml solution in ethanol
(Cayman CHEMICAL, Ann Arbor, Michigan, USA)
(±)12-HETE (5E,8E,10E,14E)-12-Hydroxy-5,8,10,14-
icosatetraenoic acid
25 µg, 100 µg/ml solution in ethanol
(Cayman CHEMICAL, Ann Arbor, Michigan, USA)
(±)15-HETE (5Z,8Z,11Z,13E)-15-Hydroxy-5,8,11,13-
icosatetraenoic acid
25 µg, 100 µg/ml solution in ethanol
(Cayman CHEMICAL, Ann Arbor, Michigan, USA)
(±)5-HETE (5S,6E,8Z,11Z,14Z)-5-Hydroxy-6,8,11,14-
icosatetraenoic acid
25 µg, 100 µg/ml solution in ethanol
(Cayman CHEMICAL, Ann Arbor, Michigan, USA)
6-keto-PGF α α, α, E, 5S -9,11,15-Trihydroxy-6-
oxoprost-13-en-1-oic acid
1 mg, ≥ % Purity, crystalline solid
(Cayman CHEMICAL, Ann Arbor, Michigan, USA)
LTB4 (5S,6Z,8E,10E,12R,14Z)-5,12-Dihydroxy-
6,8,10,14-icosatetraenoic acid
25 µg, 100 µg/ml solution in ethanol
(Cayman CHEMICAL, Ann Arbor, Michigan, USA)
PGD2 5), α, E, 5S -9,15-Dihydroxy-11-
oxoprosta-5,13-dien-1-oic acid
1 mg, ≥ % Purity, crystalline solid
(Cayman CHEMICAL, Ann Arbor, Michigan, USA)
PGE2 (5Z, α, E,15S)-11,15-Dihydroxy-9-
oxoprosta-5,13-dien-1-oic acid
1 mg, ≥ % Purity, crystalline solid
(Cayman CHEMICAL, Ann Arbor, Michigan, USA)
PGF α (5Z,8β,9β,11β, α, E, 5S -9,11,15-
Trihydroxyprosta-5,13-dien-1-oic acid
1 mg, ≥ % Purity, crystalline solid
(Cayman CHEMICAL, Ann Arbor, Michigan, USA)
TXB2 (5Z,9β,13E,15S)-9,11,15-
Trihydroxythromboxa-5,13-dien-1-oic acid
1 mg, ≥ % Purity, crystalline solid
(Cayman CHEMICAL, Ann Arbor, Michigan, USA)

EXPERIMENTAL
25
Internal standards
12(S)-HETE-d8 (5Z,8Z,10E,12S,14Z)-12-Hydroxy(5,6,8,9,11,12,14,15-
2H8)-5,8,10,14-icosatetraenoic acid
25 µg, 100 µg/ml solution in acetonitrile
(Cayman CHEMICAL, Ann Arbor, Michigan, USA)
15(S)-HETE-d8 (5Z,8Z,11Z,13E,15S)-15-Hydroxy(5,6,8,9,11,12,14,15-
2H8)-5,8,11,13-icosatetraenoic acid
25 µg, 100 µg/ml solution in acetonitrile
(Cayman CHEMICAL, Ann Arbor, Michigan, USA)
5(S)-HETE-d8 (5S,6E,8Z,11Z,14Z)-5-Hydroxy(5,6,8,9,11,12,14,15-
2H8)-6,8,11,14-icosatetraenoic acid
25 µg, 100 µg/ml solution in acetonitrile
(Cayman CHEMICAL, Ann Arbor, Michigan, USA)
6-keto-PGF α-d4 α, α, E, 5S -9,11,15-Trihydroxy-6-oxo(3,3,4,4-
2H4)prosta-13-en-1-oic acid
25 µg, 100 µg/ml solution in methyl acetate
(Cayman CHEMICAL, Ann Arbor, Michigan, USA)
LTB4-d4 (6Z,8E,10E,14Z)-5,12-Dihydroxy(6,7,14,15-2H4)-
6,8,10,14-icosatetraenoic acid
25 µg, 100 µg/ml solution in acetonitrile
(Cayman CHEMICAL, Ann Arbor, Michigan, USA)
PGD2-d4 5), α, E, 5S -9,15-Dihydroxy-11-oxo(3,3,4,4-
2H4)prosta-5,13-dien-1-oic acid
25 µg, 100 µg/ml solution in methyl acetate
(Cayman CHEMICAL, Ann Arbor, Michigan, USA)
PGE2-d4 5), α, E, 5S -11,15-Dihydroxy-9-oxo(3,3,4,4-
2H4)prosta-5,13-dien-1-oic acid
50 µg, 500 µg/ml solution in methyl acetate
(Cayman CHEMICAL, Ann Arbor, Michigan, USA)
PGF α-d4 5), α, α, E, 5S -9,11,15-Trihydroxy(3,3,4,4-
2H4)prosta-5,13-dien-1-oic acid
50 µg, 500 µg/ml solution in methyl acetate
(Cayman CHEMICAL, Ann Arbor, Michigan, USA)
TXB2-d4 5), α, α, E, 5R -9,11,15-Trihydroxy(2,2,3,3-
2H4)thromboxa-5,13-dien-1-oic acid
25 µg, 100 µg/ml solution in methyl acetate
(Cayman CHEMICAL, Ann Arbor, Michigan, USA)

EXPERIMENTAL
26
2.1.2. Reagents
2-Propanol LC-MS CHROMASOLV®
(Sigma Aldrich, St. Louis, USA)
Acetonitrile CHROMASOLV® g adie t g ade, fo HPLC, ≥ . %
(Sigma Aldrich, St. Louis, USA)
Ammonia puriss. p.a., reag. ISO, reag. Ph. Eur., ~25 % NH3 basis
(Sigma Aldrich, St. Louis, USA)
Ethanol pu iss. p.a., a solute, ≥ . %
(Sigma Aldrich, St. Louis, USA)
Formic acid puriss., p. a., 98.0-100 %
(Sigma Aldrich, St. Louis, USA)
Human serum albumin Albunorm, 20 %
(Octapharma, Vienna, AUT)
Methanol CHROMASOLV®, fo HPLC, ≥ . %
(Sigma Aldrich, St. Louis, USA)
Water . MΩ* , Milli-Q® Academic water purification system
(Millipore GmbH, Vienna, AUT)
Phosphoric acid for HPLC, 85-90 %
(Fluka, Buchs, CHE)
Physiological saline Elo-Mel isoton, infusion solution,
(Fresenius Kabi, Graz, AUT)

EXPERIMENTAL
27
2.2. Equipment
Centrifuge Centrifuge 5415 D (Eppendorf, Hamburg, DEU )
Vortexer Reax top (Heidolph, Schwabach, DEU)
Microplate evaporator MiniVap with with 96 needle head (Porvair Sciences, Wales, UK)
96-Wellplate vortexer “ig atu e™ Pulsi g Vo te Mi e (VWR, Vienna, AUT)
µl pipettes Reference (Eppendorf, Hamburg, DEU)
Ultrasonic bath RK 100 (Bandelin, Berlin, DEU)
Consumables
HPLC vials Verex vial, 9 mm screw, 2 ml, amber (Phenomenex, California, USA)
Vial caps Verex cap, 9 mm, PTFE/silicone septa, blk (Phenomenex, California, USA)
Vial inserts Vial insert, 250 µL, pulled point glass (Agilent Technologies, Waldbronn, Ger)
0.5 ml protein lobind tubes Protein LoBind tubes, 0.5 ml, PCR clean (Eppendorf, Hamburg, DEU)
0.2 ml PCR tubes 0.2 ml PCR tube, flat cap (VWR, Vienna, AUT)
SPE collection plates 96-well sample collection plate, 800 µL (Waters, Massachusetts, USA)
Sealing mats Sealing mats 96-well deepwell plates, 1.2 ml (Eppendorf, Hamburg, DEU)
Solid phase extraction
Solid phase extraction of the weakly acidic analytes was performed with Oasis MAX 96-well µElution
plates, 2 mg Sorbent per Well, 30 µm particle size (Waters, Massachusetts, USA) on an extraction
plate manifold for OASIS 96-well-plates (Waters, Massachusetts, USA) equipped with a type
N811K18 diaphragm pump (Neuberger, Freiburg, Germany) with a possible operating pressure range
from 0.24–2 bar.

EXPERIMENTAL
28
HPLC column
Atlantis® T3, 3 μm, 2.1 x 150 mm (Waters, Massachusetts, USA)
HPLC – MS/MS system
HPLC: Ultimate 3000 (Thermo Scientific, Rockford, USA)
ESI-MS: TSQ Quantum Access MAX (Thermo Scientific, Rockford, USA)
U-HPLC/high resolution MS system
U-HPLC: UHPLC+ Focused (Thermo Scientific, Rockford, USA)
HR-ESI-MS: Q E a ti e™ (Thermo Scientific, Rockford, USA)
Evaluation software
Xcalibur 2.2 SP1.48 (Thermo Scientific, Rockford, USA)
EXPERIMENTAL
29
2.3. Procedures
2.3.1. Sample collection
Diluted interstitial fluid investigated in this thesis was sampled by dOFM5. Samples were collected
from one healthy subject “et ; p o es: -6 arm, 7-12 leg) and from one subject suffering
from psoriasis “et ; p o es: -3 non-lesional skin from leg, 4-12 lesional skin from arm).
Physiological saline with 1 % human serum albumin (HSA) was taken as perfusate. Both sets were
sampled hourly (nominal sample volume 60 µl) over a 12 h period with an applied flow rate of
1 µl/min. Samples were immediately stored at -80 °C. The sampling procedure of Set 12 included
two additional steps: the sampling vials were flushed with Ar prior to sampling and the samples
overlaid with Ar prior to freezing in order to minimise loss of oxygen-sensitive analytes.
2.3.2. Preparation of standards
After handling, prior to re-storing, all of the stocks and prepared solutions were overlaid with N2 or,
later, Ar, due to limited oxygen stability of some of the analytes. All prepared standard solutions
were stored at -80 °C.
A-stocks
A-stocks of the five analytes 5-HETE, 15-HETE, 12-HETE, 12-HEPE, LTB4 and of all nine internal
standards 12(S)-HETE-d8, 15(S)-HETE-d8, 5(S)-HETE-d8, 6-keto-PGF α-d4, LTB4-d4, PGD2-d4, PGE2-d4,
PGF α-d4, TXB2-d4) were the solutions in their original containers with their respective concentrations
(see 2.1.1). A-stocks of the five analytes 6-keto-PGF α, PGD2, PGE2, PGF α and TXB2 were prepared by
directly dissolving each substance in ethanol and transferring the solution to a 10 ml volumetric
flask, which was filled with ethanol to reach a respective concentration of 100 µg/ml. The stocks
were aliquoted into amber glass HPLC vials, overlaid with N2, sealed and stored at -80 °C.
5 Sampling of dermal interstitial fluid was carried out by the Biomedical Engineering and Monitoring group of
HEALTH – Institute for Biomedicine and Health Sciences, Joanneum Research Forschungsgesellschaft m.b.H.,
Graz, Austria.
EXPERIMENTAL
30
B-stocks
B-stocks of all 10 analytes and 9 internal standards were prepared by dilution in ethanol of the
respective A-stock amounts to reach a concentration of 10 µg/ml:
B-stocks of 6-keto-PGF α-d4 and PGE2-d4: 10 µl A-stock (500 µg/ml) were diluted in
490 µl ethanol in an amber glass HPLC vial and vortexed. The solutions were
aliquoted into HPLC vials with glass insert, overlaid with Ar, sealed and stored at
-80 °C.
B-stocks of the remaining eight analytes and nine internal standards: 10 µl A-stock
(100 µg/ml) were diluted in 90 µl ethanol in an amber glass HPLC vial with glass
insert and vortexed. The solutions were overlaid with Ar, sealed and stored at
-80 °C.
Calibration standard solutions
For quantification, calibration standards were prepared in water according to Table A 1 (see
Appendix).
Internal standard solution
For quantification of the 10 analytes in dOFM samples, a 10 ng/ml internal standard mix was
prepared: in an amber glass HPLC vial 10 µl of each of the nine internal standard B-stock solutions
(10 µg/ml) were added to 910 µl ethanol. The mixture (= internal standard C-stock with 100 ng/ml)
was sealed and vortexed. An aliquot (150 µl) of the internal standard C-stock (100 ng/ml) was
further diluted in water (1350 µl) in an amber glass HPLC vial (= internal standard mix for sample
preparation with 10 ng/ml).
2.3.3. Preparation of samples
Preparation of dOFM samples
Samples had to be pooled in order to get enough sample volume for triple determinations. Thus
after thawing to room temperature, the samples from the psoriatic and the healthy subjects (three
probes each, complete 1-12 h) were vortexed, shortly centrifuged and then pooled as follows:
samples from the same sampling time of three different probes were pooled resulting in 12 time-
resolved sample-pools per subject. These 24 samples were then further treated following the
standard extraction procedure and then measured via HPLC–M“/M“ o the Q E a ti e™ M“.

EXPERIMENTAL
31
SPE MAX
conditioning: 200 µl MeOH
equilibration: 200 µl water
loading: SPE-mixture
wash 1: 200 µl NH4OH (5 % aq. solution)
wash 2: 200 µl MeOH (100 %)
elution: 2 x 50 µl formic acid (2 % in ACN:MeOH
(60:40))
reconditioning: 200 µl MeOH
reequilibration: 200 µl water
Standard extraction procedure
After several preliminary experiments, the following extraction procedure was adopted as the
sta da d e t a tio p o edu e . Samples were prepared in replicate (n=3). 40 µl of sample6 or 20 µl
of calibration solution were transferred to a 0.2 ml PCR tube, and 20 µl of internal standard mix
(10 ng/ml) and 20 µl of H3PO4 (4 % aq. solution) were added. The resulting solutio , te ed SPE–
mixture , was vortexed and briefly centrifuged by pulse function.
Solid phase extraction was performed with mixed-mode anion
exchange 96-well µElution Plates from Waters (Figure 18). The
SPE-cartridges were conditioned with 200 µl of methanol and
then 200 µl of water. Afterwards the SPE-mixture was loaded
quantitatively onto the SPE cartridge and washed with 200 µl of
NH4OH (5 % aq. solution) and 200 µl of methanol. Analytes were
then eluted into a 96-well-collection plate with 2 x 50 µl of
acetonitrile:methanol (60:40, v:v) containing 2 % of formic acid.
The cartridges were reconditioned with 200 µl of methanol and
200 µl of water.
The extracts were then dried under a N2 stream at room
temperature with a microplate evaporator. Afterwards they were
re-dissolved in 40 µl of mobile phase A (H2O:ACN:formic acid,
63:37:0.02, v:v:v), overlaid with Ar and shaken at RT with a
vortex mixer (45 min, 2000 rpm) prior to HPLC–MS/MS analysis.
6 Investigated extraction volume of dOFM-samples was 40 µl due to their very low analyte concentration; 20 µl
of sample were extracted to determine the hemolytic impact, method recovery, accuracy and inter–day
precision.
Figure 18: Mixed-mode anion exchange
(=MAX) SPE–protocol

EXPERIMENTAL
32
Determination of hemolytic impact
A further centrifugation step was introduced into the sample
preparation procedure to evaluate the influence of hemolytic
effects on the results. One sample pool was prepared out of
the probe samples from a former dOFM–sampling set
(set 09; 1-6 h samples from probe 5), which were selected
based on their very reddish colour. Samples were pooled in a
0.5 ml protein lobind tube, vortexed and divided into two
aliquots. Aliquot 1 was centrifuged (10 min, 13000 rpm) prior
to extraction and the supernatant was transferred to a 0.2 ml
PCR tube. The supernatant of aliquot 1 and all of aliquot 2
were extracted separately (3 times per aliquot, n=3) in the
same batch by the standard extraction procedure and
measured by HPLC–M“/M“ o the Q E a ti e™ M“.
Determination of inter-day precision
Precision represents the repeatability of an experiment. The inter-day precision in this thesis was
defined as the relative standard deviation (RSD) of the measured concentrations of an analyte-
spiked dOFM sample (worked-up in triplicate and measured, each on two separate days). For the
mathematical definition of inter-day precision see Appendix (Table A 16).
For determination of inter-day precision of the analytical method, two dOFM-sample-pools spiked
with different amounts of analyte solution were prepared and worked up on two different days.
Solution 1 (10.0 ng/ml): sample pool (set 09; 7-12 h samples from probe 5) was prepared in
a 0.5 ml protein lobind tube. After vortexing the sample, 20 µl of calibration solution (10A C-
stock in water, 100 ng/ml) were added to 180 µl of sample pool in a 2.0 ml amber glass HPLC
vial with glass insert, and the solution was vortexed again.
Solution 2 (1.00 ng/ml): sample pool (set 11; 7-12 h samples from probe 12) was prepared in
a 0.5 ml µl protein lobind tube. After vortexing, 20 µl of calibration solution (10A 10.0,
10.0 ng/ml) were added to 180 µl of sample pool in a 2.0 ml amber glass HPLC vial with glass
insert, and the solution was vortexed again.
Both solutions were worked up in triplicate and measured on two different days by HPLC–MS² on
the Q Exacti e™ M“ to determine the variation range of the analytical method.
Figure 19: Scheme of sample-pooling for the
determination of hemolytic impact
EXPERIMENTAL
33
Determination of accuracy
In quantitative research of biomarkers in endogenous samples like dermal interstitial fluid (where no
certified reference material is available) accuracy is usually determined by spiking a matrix-blank
also efe ed to as su ogate at i ) with a known amount of analyte (Shaik et al., 2014); the
resulting spike-concentration is defi ed as t ue o e t atio which is then compared with the
measured concentration (Y. Wang et al., 2014). For the mathematical definition of accuracy see
Appendix (Table A 16).
The accuracy of this analytical method for eicosanoids was determined by a spiked perfusate
solution (10 ng/ml). Thus, 20 µl of calibration solution (10A C-stock in water, 100 ng/ml) were added
to 180 µl of dOFM–perfusate (physiological saline, 1 % HSA) in a 2.0 ml amber glass HPLC vial with
glass insert, and the solution was vortexed. The solution was worked up in quadruplicate and
measured by HPLC-M“/M“ o the Q E a ti e™ M“.
Determination of recovery
To determine the recovery of the solid phase extraction, two solutions were prepared:
Internal standard solution (5 ng/ml): internal standard C-stock (100 ng/ml) was diluted in
mobile phase A (H2O:ACN:formic acid, 63:37:0.02, v:v:v) in a 2.0 ml amber glass HPLC vial to
a concentration of 5 ng/ml. This solution was not further extracted prior to measurement.
Internal standard solution (10 ng/ml): internal standard C-stock (100 ng/ml) was diluted in
dOFM–perfusate (physiological saline, 1 % HSA) in a 2.0 ml amber glass HPLC vial to a
concentration of 10 ng/ml. This solution was extracted in triplicate using the standard
extraction procedure except for one difference in the SPE-mix composition: instead of
internal standard mix (20 µl, 10 ng/ml), water (20 µl) was added to the sample (20 µl) and
4 % aq. H3PO4 (20 µl) solution.
Both solutions were then measured by HPLC–M“/M“ o the Q E a ti e™ M“, and the resulting areas
were compared for recovery determination.
EXPERIMENTAL
34
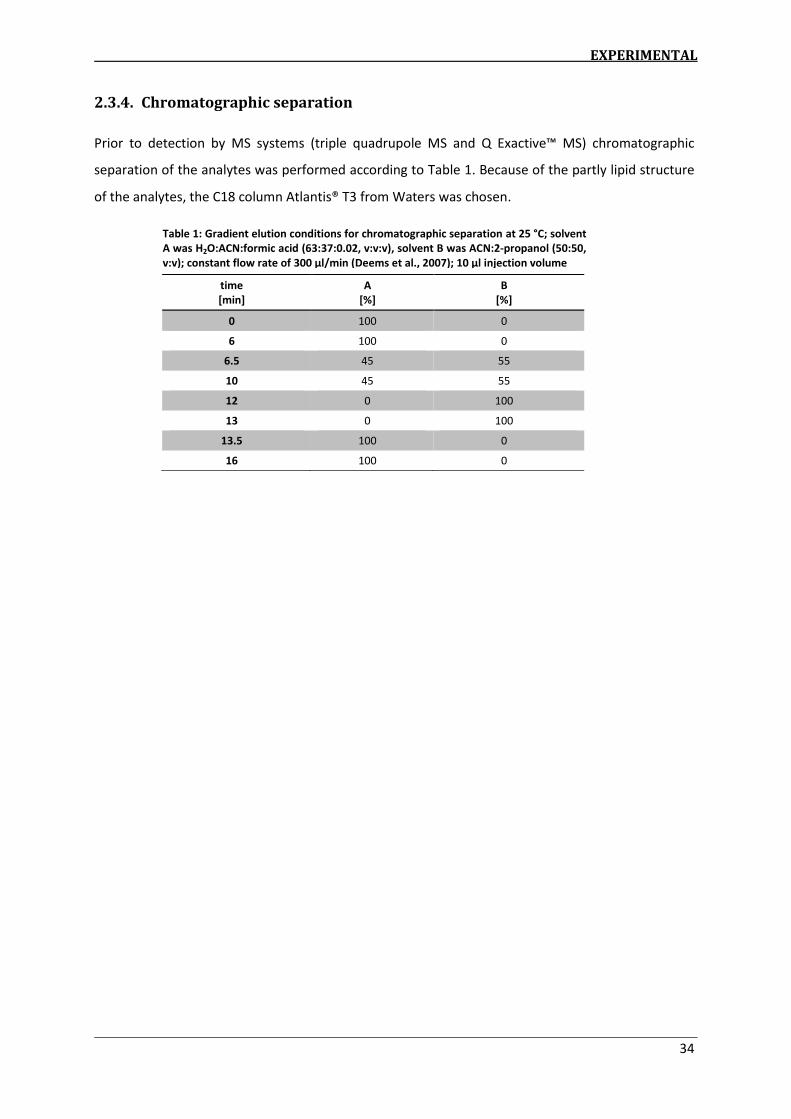
Table 1: Gradient elution conditions for chromatographic separation at 25 °C; solvent
A was H2O:ACN:formic acid (63:37:0.02, v:v:v), solvent B was ACN:2-propanol (50:50,
v:v); constant flow rate of 300 µl/min (Deems et al., 2007); 10 µl injection volume
2.3.4. Chromatographic separation
Prior to detection by MS systems (triple quadrupole MS and Q E a ti e™ M“ h o atog aphi
separation of the analytes was performed according to Table 1. Because of the partly lipid structure
of the analytes, the C18 column Atlantis® T3 from Waters was chosen.
time
[min]
A
[%]
B
[%]
0 100 0
6 100 0
6.5 45 55
10 45 55
12 0 100
13 0 100
13.5 100 0
16 100 0

EXPERIMENTAL
35
2.3.5. Determination of eicosanoids by HPLC with TSQ Quantum™ Access MAX
Triple Quadrupole MS detection
After HPLC separation, identification and quantification was performed on a TSQ Quantum™ Access
MAX Triple Quadrupole (referred to hereafter as TSQ). In this section, only the main features of the
TSQ instrument method are mentioned; for complete method settings see Appendix (Table A 6).
Analytes were ionised by an ESI (electrospray ionisation) source with an integrated regular flow
needle operated in negative ion mode. Detection of the 10 analytes was carried out by single
reaction monitoring (SRM). SRM-transitions used for identification are listed in Table 2. The
respective MS instrument method was divided into six scan segments based on the retention times
of the analytes (and their respective internal standard). To optimise sensitivity, no parallel full MS
scan was performed.
Table 2: SRM-transitions used for identification and quantification; ESI was operated in negative mode.
Analytes and internal standards were tuned with a 1 µg/ml solution of each analyte to determine
optimal fragment mass, collision energy, tube lens and skimmer offset settings. Optimal spray
settings were determined with a 1 µg/ml PGF2α solution in solvent A (see Table A 5) prior to
measurement.
Mixed analyte standard solutions, diluted in mobile phase A in concentrations ranging from
0.50-100 ng/ml, were measured directly for comparison of sensitivity to the Q E a ti e™ M“
measurements.
analyte parent
[M-H]-
fragment
1
fragment
2
internal
standard
parent
[M-H]-
fragment
1
fragment
2
6-keto-PGF α 369 163 245 6-keto-PGF α-d4 373 167 249
TXB2 369 195 169 TXB2-d4 373 173 199
PGF α 353 193 247 PGF α-d4 357 197 251
PGE2 351 189 271 PGE2-d4 355 193 275
PGD2 351 189 271 PGD2-d4 355 193 275
LTB4 335 195 - LTB4-d4 339 197 -
12-HEPE 317 179 - 12(S)-HETE-d8 used as internal standard
15-HETE 319 219 175 15(S)-HETE-d8 327 226 182
12-HETE 319 179 135 12(S)-HETE-d8 327 184 140
5-HETE 319 115 - 5(S)-HETE-d8 327 116 -

EXPERIMENTAL
36
2.3.6. Determination of eicosanoids by U-HPLC with Q Exactive™ MS detection
Identification and quantification of eicosanoids was achieved by combining U-HPLC with a high
resolution Q ExactiveTM mass spectrometer. In this section, only the main features of the Q
E a ti e™ M“ instrument method are mentioned; further information on exact instrument settings
(Table A 2), inclusion list settings (Table A 3), and exact parent and fragment masses (Table A 4) can
be found in the Appendix.
The selected scan mode was targeted MS² in combination with an inclusion list, containing exact
analyte and internal standard parent masses (isolation window was set to ± 0.4 m/z) including
respective retention time windows and normalized collision energies. The same transitions for
identification and absolute quantification were used as in TSQ–analysis (section 2.3.5).
Analytes and internal standards were tuned with a 1 µg/ml solution of each analyte to determine
optimal collision energy and fragment mass settings. Analytes were ionised in negative mode by an
ESI source with an integrated regular flow needle, installed at the MS inlet. Optimal spray settings
were determined with a 1 µg/ml PGF α solution in solvent A prior to measurement.
Only the Q E a ti e™ M“ method was used to measure eicosanoids in dOFM samples. External
calibration with internal standard normalization was carried out with mixed analyte standard
solutions diluted in mobile phase A in concentrations ranging from 0.01-100 ng/ml.
RESULTS & DISCUSSION
37
3. Results & discussion
3.1. Time-resolved eicosanoid levels in interstitial fluid of psoriatic
and healthy subjects
During the thesis an analytical method was developed to measure 10 representatives of the
eicosanoid class. The method was implemented and optimised on a high resolution Q E a ti e™ a d
then additionally adapted to a triple quadrupole MS for qualitative comparison of the two detector
types. The optimised ethod o the Q E a ti e™ M“ as used to determine eicosanoid levels in
interstitial fluid of the skin, sampled by minimally invasive dermal open flow microperfusion (dOFM).
As eicosanoids are important markers for inflammation in various physiological processes and
diseases, samples were taken from dermis of healthy and psoriatic lesional skin. Samples were
prepared in triplicate in one batch for statistical purposes (see section 2.3.). As dOFM sampling
enables time-resolved concentration profiling, analyte trends corresponding to sampling time could
be observed. In this section, examples of the measured eicosanoid levels, more specifically their
time-concentration-curves are listed and discussed; for all original data see Appendix, Table A 7 and
Table A 8. It can be summarised that many analytes showed higher concentration levels in interstitial
fluid of psoriatic skin compared to healthy samples, which supports the view that eicosanoids can be
used to monitor states of inflammation. However, in most cases, and contrary to expectations, the
concentration differences did not occur in a multiple range.
Moreover, a statement has to be made concerning the statistical significance of these results: only
one healthy and one psoriatic subject have been analysed owing to a lack of sampling-slots and
subject availability. Outcomes are likely to vary considerably from subject to subject. Further
problems arise in terms of sampling and sample preparation, the analytical implications of which will
be discussed in sections 3.1.1. & 3.1.2.
A general observation was made: the 9 h sample of Set12 appeared to be out of line throughout all
10 measured eicosanoids, and some of these seemed to be more affected than others in terms of
their respective time-concentration-profiles. This may be reasoned by possible complications during
sampling - perhaps this sample was not immediately frozen like the others leading to further
enzymatic reactions and changes in eicosanoid production. Analyte concentrations could also have
been increased by argon-overlaying steps during sample-handling prior to extraction: for example,
higher gas-flow leads to more solvent evaporation resulting in pseudo-higher analyte concentrations
in the sample. For these reasons, the 9 h sample was regarded as an outlier and will not be discussed
further during the following sections.
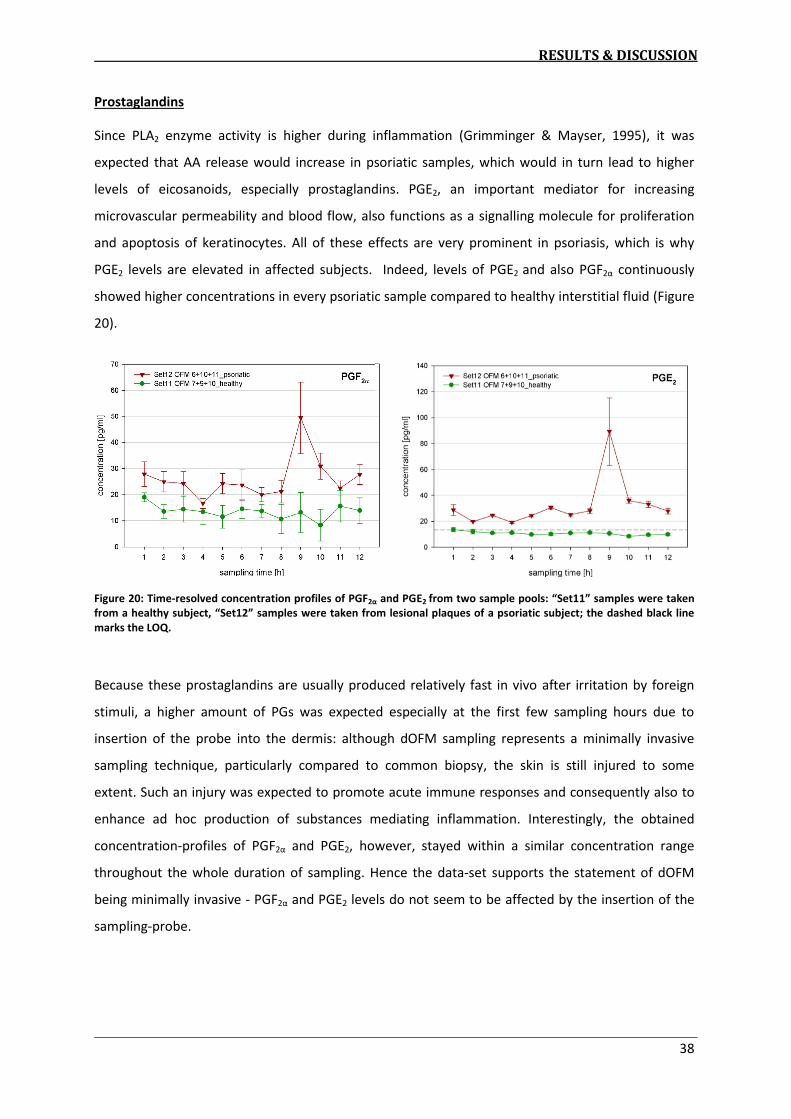
RESULTS & DISCUSSION
38
Prostaglandins
Since PLA2 enzyme activity is higher during inflammation (Grimminger & Mayser, 1995), it was
expected that AA release would increase in psoriatic samples, which would in turn lead to higher
levels of eicosanoids, especially prostaglandins. PGE2, an important mediator for increasing
microvascular permeability and blood flow, also functions as a signalling molecule for proliferation
and apoptosis of keratinocytes. All of these effects are very prominent in psoriasis, which is why
PGE2 levels are elevated in affected subjects. Indeed, levels of PGE2 and also PGF α continuously
showed higher concentrations in every psoriatic sample compared to healthy interstitial fluid (Figure
20).
Figure 20: Time-resolved concentration profiles of PGF α and PGE2 from two sample pools: “et sa ples were taken
from a health su je t, “et sa ples were taken from lesional plaques of a psoriatic subject; the dashed black line
marks the LOQ.
Because these prostaglandins are usually produced relatively fast in vivo after irritation by foreign
stimuli, a higher amount of PGs was expected especially at the first few sampling hours due to
insertion of the probe into the dermis: although dOFM sampling represents a minimally invasive
sampling technique, particularly compared to common biopsy, the skin is still injured to some
extent. Such an injury was expected to promote acute immune responses and consequently also to
enhance ad hoc production of substances mediating inflammation. Interestingly, the obtained
concentration-profiles of PGF α and PGE2, however, stayed within a similar concentration range
throughout the whole duration of sampling. Hence the data-set supports the statement of dOFM
being minimally invasive - PGF α and PGE2 levels do not seem to be affected by the insertion of the
sampling-probe.

RESULTS & DISCUSSION
39
Thromboxanes
The biologically inactive TXB2 is the chemically
stable metabolite of TXA2 (Murphy et al., 2005).
In contrast to the PG results, TXB2 production
actually seemed to increase in response to the
sampling procedure (Figure 21). This result
supports the assumption that probe insertion
into the dermis immediately promotes
production of inflammatory mediators like TXA2,
responsible for symptoms like blood
coagulation. As TXA2 is predominantly produced
by blood platelets, a different interpretation
could also be made: the first few samples could
have been subject to in vitro hemolysis. Rupturing of red blood cells (erythrocytes) would lead to
highly increased amounts of TXA2 and TXB2 in the sample, resulting in higher concentrations in the
interstitial fluid. Hemolysis could also explain higher TXB2 levels in the 6 h sample of Set12. For more
detailed discussion see section 3.1.2.
Hydroxyeicosapentaenoic acids
12-HEPE was present well above the limits of
quantification (Figure 22); it could reliably be
quantified in the sub ng/ml range with excellent
precision. The results indicated that the levels of
12-HEPE also increased in response to the
insertion of the sampling-probe, although the
effect was considerably more marked for the
psoriasis samples. According to these results
one may assume that an injury induced by
probe-insertion is more traumatizing for
psoriatic than healthy skin in terms of 12-HEPE
production. Further investigations have to be
made in order to gain more insight into the
actual biological response of 12-HEPE.
Figure 22: Time-resolved concentration profiles of 12-HEPE
from two sample pools: “et sa ples e e take f o a health su je t, “et sa ples e e take f o lesio al plaques of a psoriatic subject; the dashed black line marks the
LOQ.
Figure 21: Time-resolved concentration profiles of TXB2 from
two sa ple pools: “et sa ples e e take f o a health su je t, “et sa ples e e take f o lesio al plaques of a psoriatic subject; the dashed black line marks
the LOQ.

RESULTS & DISCUSSION
40
Figure 23a+b+c: Time-resolved concentration profiles of
15-HETE (a), 12-HETE (b) and 5-HETE (c) from two sample
pools: “et sa ples e e take f o a healthy subject,
“et sa ples f o lesio al pla ues of a pso iati
subject; the dashed black line marks the LOQ.
Hydroxyeicosatetraenoic acids
15-HETE, 12-HETE and 5-HETE were all
quantifiable with good precision (Figure 23). The
obtained profiles of 15-HETE and 5-HETE showed
no large differences in concentration between
psoriatic and healthy interstitial fluid samples.
15-HETE seems to slightly respond to the probe-
insertion, whereas 5-HETE does not seem to be
affected at all. However, the amount of
12-HETE increased in response to the insertion of
the sampling-probe; the effect was considerably
more marked for the psoriasis samples.
Interestingly, the obtained concentration-profile
of 12-HETE (Figure 23b) shows a similar trend as
the related EPA derived 12-HEPE (Figure 22). This
similarity reflects the strong affinity of these two
compounds due to their common pathway. In
contrast to 15- and 5-HETE, 12-HETE was more
concentrated in almost every psoriatic sample
compared to healthy skin. Highly elevated levels
of 12-HETE in psoriasis have been often reported
(Hammarström et al., 1975); according to
stereochemical analysis, the 12(R)-HETE
enantiomer, possessing higher chemotactic
properties than 12(S)-HETE, is elevated in psoriatic
lesions (Woollard, 1986).
Leukotrienes
LTB4, as representative of the leukotriene group, was not quantifiable by the developed analytical
method in either the healthy or psoriatic sample-set. Improvement in the measurement of LTB4 thus
serves as a subject of further method development. Based on the existing data, no statement can be
made concerning the biological concentration levels and differences of LTB4 in dermal interstitial
fluid samples of psoriatic and healthy dermis.

RESULTS & DISCUSSION
41
3.1.1. Challenges in dOFM sampling
Dermal open-flow microperfusion is a sampling technique that gives the possibility of monitoring
analytes in vivo directly at the dermal target tissue. Sampling by dOFM is optimised for application
in pharmacological and pharmacokinetic in vivo investigations (Bodenlenz et al., 2013). It has several
advantages in comparison to sampling via common dermal microdialysis: utilisation of membrane-
free macroscopically fenestrated probes leads to a wider range of accessible analytes in terms of
analyte size and lipophilic properties; and a wearable multi-channel pump enables simultaneous
sampling from multiple probes over longer periods of time.
But in terms of measuring endogenous analytes, especially eicosanoids, in dermal interstitial fluid by
HPLC-MS, there are still some challenges to be further investigated or optimised. Starting with the
differing probe depth - the sampling probe is usually inserted manually into the dermis of the skin by
a physician. Although probe depth is measured by ultrasound after the sampling period, the
thickness of the different layers of the skin can vary a lot between subjects, especially if diseases are
involved. Analyte concentrations can vary hugely depending on the exact sampling position of
respective probes. In psoriatic sampling during this study, for example, exact probe insertion into the
dermis appeared much more difficult in comparison to healthy subjects due to the distinctive
thickened stratum corneum. Because the epidermis in psoriatic skin is thicker and irregularly
distributed compared to healthy epidermis, probes can easily be misplaced in superior layers rather
than in the dermis, where analyte levels can be totally different. Many eicosanoids analysed in this
thesis for instance have been reported to have higher abundance in the epidermis than in the
dermis (Kendall et al., 2015), making it difficult to compare analyte levels from probes within one
subject let alone from different subjects.
A further challenge for the development of an analytical method for dOFM samples was the very low
sample volume per probe and period (~60 µl per hour). In addition, these interstitial fluid samples
are highly diluted with perfusate. The occurrence of probe-clogging by precipitated proteins, tissue
components or blood clots leads to reduced sample flow and consequently decreased analyte
amount. During method development, it was decided to pool samples in order to increase the
amount of analytes and consequently the sensitivity of the analytical method.
Another point which has to be optimised is the flushing-step of the probes prior to sampling. In
dOFM sampling, the probes are flushed with perfusate after insertion in order to establish equal
pumping conditions and to flush interfering compounds like blood platelets out of the probes to get
clear, perfusate-diluted interstitial fluid. Usually four pumps, each connected to three probes, are
installed. Every pump is set to flush-mode right after probe-connection and set-up. But inserting the
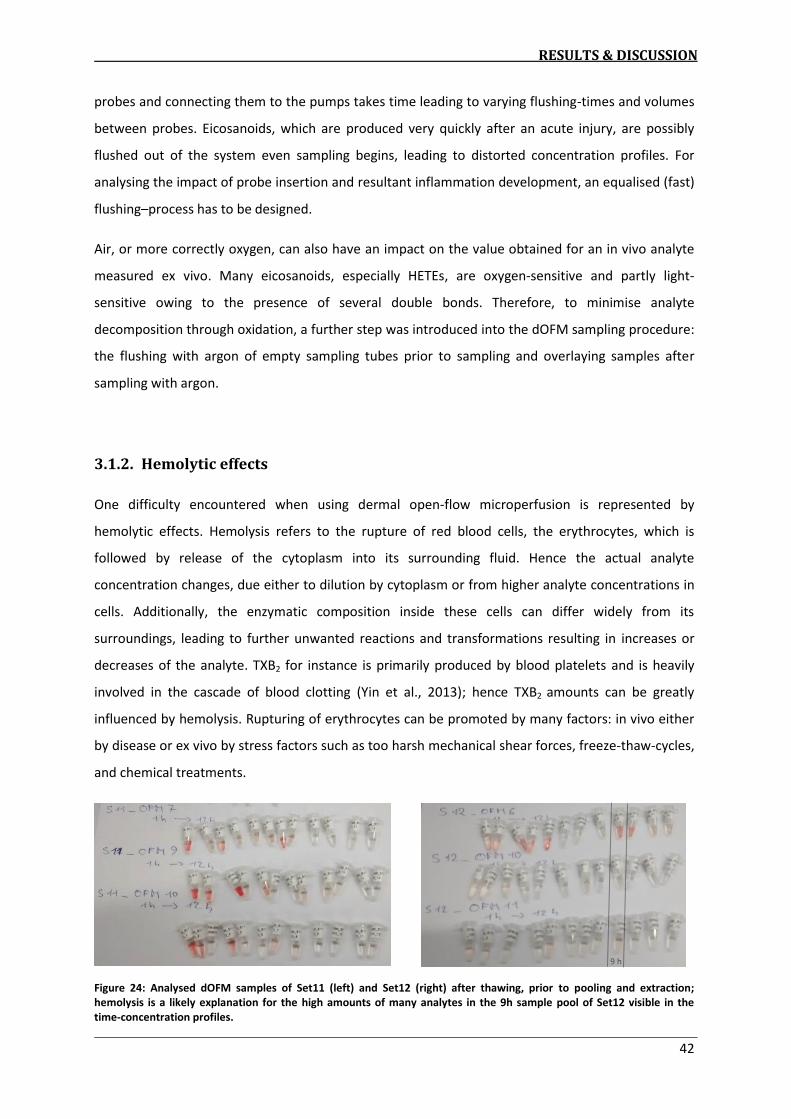
RESULTS & DISCUSSION
42
probes and connecting them to the pumps takes time leading to varying flushing-times and volumes
between probes. Eicosanoids, which are produced very quickly after an acute injury, are possibly
flushed out of the system even sampling begins, leading to distorted concentration profiles. For
analysing the impact of probe insertion and resultant inflammation development, an equalised (fast)
flushing–process has to be designed.
Air, or more correctly oxygen, can also have an impact on the value obtained for an in vivo analyte
measured ex vivo. Many eicosanoids, especially HETEs, are oxygen-sensitive and partly light-
sensitive owing to the presence of several double bonds. Therefore, to minimise analyte
decomposition through oxidation, a further step was introduced into the dOFM sampling procedure:
the flushing with argon of empty sampling tubes prior to sampling and overlaying samples after
sampling with argon.
3.1.2. Hemolytic effects
One difficulty encountered when using dermal open-flow microperfusion is represented by
hemolytic effects. Hemolysis refers to the rupture of red blood cells, the erythrocytes, which is
followed by release of the cytoplasm into its surrounding fluid. Hence the actual analyte
concentration changes, due either to dilution by cytoplasm or from higher analyte concentrations in
cells. Additionally, the enzymatic composition inside these cells can differ widely from its
surroundings, leading to further unwanted reactions and transformations resulting in increases or
decreases of the analyte. TXB2 for instance is primarily produced by blood platelets and is heavily
involved in the cascade of blood clotting (Yin et al., 2013); hence TXB2 amounts can be greatly
influenced by hemolysis. Rupturing of erythrocytes can be promoted by many factors: in vivo either
by disease or ex vivo by stress factors such as too harsh mechanical shear forces, freeze-thaw-cycles,
and chemical treatments.
Figure 24: Analysed dOFM samples of Set11 (left) and Set12 (right) after thawing, prior to pooling and extraction;
hemolysis is a likely explanation for the high amounts of many analytes in the 9h sample pool of Set12 visible in the
time-concentration profiles.
9 h

RESULTS & DISCUSSION
43
Hemolysis leads to release of hemoglobin, an important iron-containing protein responsible for
oxygen transport. Its cofactor heme is responsible for the red colour. Hemoglobin and its
degradation products like bilirubin can already be detected visually. Hemolysis is thereby often
measured via spectrometric measurements; for instance its absorbance at 410 nm can be used as an
index for hemolysis (Nakamura et al., 1997). But spectrometric analysis is unsuitable for dOFM
samples due to very small sample volume. Although theoretically dOFM sampling excludes sampling
of erythrocytes and should give clear diluted interstitial fluid samples, it often occurs that blood
platelets are sampled as well. These usually accumulate at the bottom of the sampling tube during
the one hour sampling period, visible as a red dot overlayed with clear interstitial fluid. It is also
possible that the whole sample appears to have a homogenous red colour as a clear sign of
hemolysis. Usually only the first few sampling hours are affected, although later samples can also
show this effect; due to factors like subject movement, small changes in interior flow rate and pump
pressure, or clogging of the sample probe consequently leading to increasing shearforces.
Usually after samples were collected, they were overlayed with argon and stored at -80 °C. After
thawing, samples were mixed by vortexing in order to avoid inhomogenous distribution in the
sample caused by for instance adhesion to the wall of the tube. To test, whether the hemolytic
impact could be decreased after thawing, a further centrifugation step was introduced into the
sample preparation prior to extraction, and compared to o al sa ple p epa atio (for exact
procedure see 2.3.3). Blood platelets were thereby anticipated to be separated, due to higher
density, leaving the supernatant free of blood platelets. Despite centrifugation there was no visible
pellet and the fluid was still red. The results of the corresponding HPLC-MS/MS measurement after
extraction exhibited no significant concentration difference for most analytes (for data see Table A
9). Hence, a further centrifugation step was not incorporated into the sample preparation. The
erythrocytes are probably already ruptured by freezing and thawing. For further investigations it is
therefore suggested to centrifuge and separate the supernatant from intact blood platelets directly
after sampling in order to achieve clear interstitial dOFM samples.

RESULTS & DISCUSSION
44
Table 3: SPE-recovery of deuterated analytes
(n=3); for data and calculation see Table A 10
& Table A 16
3.2. Recovery
In eicosanoid-analysis there are several possibilities for sample-clean-up like liquid-liquid extraction,
solid phase extraction, immunoaffinity chromatography (IAC) or protein precipitation (PP). Each of
the clean-up methods comes with different advantages and drawbacks; the decision of which
method to use should consider various factors such as ease-of-use, cost, specificity and sensitivity.
PP, for example, usually provides high extraction efficiencies (Martin-Venegas et al., 2014) but, as
eicosanoids can bind unspecifically to proteins and co-precipitate, it is not suitable for samples with
very low concentrations of analyte.
For sample preparation, solid phase extraction with SPE MAX mixed mode ion exchange material
obtained from Waters was chosen. These extraction cartridges feature reversed-phase and anion
exchange retention mechanisms enabling them to extract a broad range of eicosanoids, which
possess both acidic as well as lipid character. SPE is therefore very suitable for the development of
multi-analyte analytical methods. The SPE MAX cartridges are available inter alia in a 96-well-plate
µElution format enabling them to extract analytes efficiently from very small sample volumes like
dOFM samples. By using 96-well-plates, time-efficient parallel workup of several different samples is
possible7.
Table 3 shows the results from the recovery experiment.
These results were comparable to other current analytical
methods for eicosanoids (Massey & Nicolaou, 2013). In the
SPE procedure, samples were first mixed with internal
standard and then acidified in order to disrupt protein
binding and improve flow through the SPE-device. After
conditioning and equilibration of the SPE-material, samples
were loaded onto the medium, and suctioned carefully
through it. This step must be performed slowly to avoid
major analyte loss due to insufficient anionic exchange and
binding of the analytes. Washing with aq. NH4OH promotes
charging of the acidic analytes leading to better binding to the stationary phase, while at the same
time other neutral and basic compounds are washed out. The following wash-step with MeOH leads
to elution of non-polar components bound by reversed-phase interactions. Although some
eicosanoid groups with higher lipid-character may be partly eluted by this step, the separation of the
7 Waters Corporation, 2015. Sample preparation. pp.23–78.
Available at: http://www.waters.com/webassets/cms/library/docs/lcSP.pdf [Accessed July 31, 2014]
analyte
recovery
[%]
RSD
[%]
6-keto-PGF α-d4 103.2 4.5
TXB2-d4 85.1 2.4
PGF α-d4 87.1 3.8
PGE2-d4 88.9 4.8
PGD2-d4 71.6 8.9
LTB4-d4 37.7 1.5
15(S)-HETE-d8 30.2 1.5
12(S)-HETE-d8 36.7 2.1
5(S)-HETE-d8 37.6 2.8

RESULTS & DISCUSSION
45
target analytes from MS–interfering compounds was prioritised. Afterwards, a solution of formic
acid diluted in ACN/MeOH was used to elute the target eicosanoids. Subsequently, solvent–
evaporation was done with N2, not air, in order to minimise analyte loss through oxidation of
sensitive analytes. Oxidation in air and also decomposition by light while sample processing could be
reasons for the relatively low recovery of the HETEs and LTB4.

RESULTS & DISCUSSION
46
Table 4: Results of accuracy determination (n=4);
for data & calculation see Table A 11 & Table A 16
3.3. Accuracy & precision
The accuracy represents the correspondence between a
measured sample-concentration and its true
concentration. As already stated in section 2.3.3, the
accuracy in quantitative research of biomarkers in
endogenous samples is determined by spiking a matrix-
blank (Shaik et al., 2014); the resulting spike-
concentration is defined as t ue o e t atio . This
solution was prepared by spiking a perfusate-blank
sample to get a reference concentration of 10 ng/ml.
Accuracy, especially for the five main analytes (four
PGs and TXB2) that were prioritised throughout the
development and optimisation processes of method development, were quite acceptable (Table 4).
These eicosanoids are also the first eluting analytes during the chromatographic separation. LTB4
also showed good results similar to those for the five main analytes; measured values for all six
analytes were within 3 % of the spiked (true) concentration.
The remaining representatives of other eicosanoid groups, 12-HEPE and the three HETEs, showed
poorer accuracy with values ranging from 62.8 % to 128 % of the spiked concentrations, even though
deuterated internal standards for each compound (except for 12-HEPE, which was quantified by
related 12(S)-HETE-d8) were added directly before sample-workup. Because their chemical
structures are equivalent, except for partial replacement of hydrogen with deuterium, these internal
standards have chemical properties and behaviour equal to those of the naturally occurring
analytes. Hence, uncertainties in the analytical method resulting from variations in sample
extraction and measurement should be compensated for and not affect the concentration results.
A possible explanation for the poor accuracy values for the three HETEs is carryover effects and
increasing background. During later-phase method development, it became clear that for these less
polar analytes, repeated use of the same SPE-cartridge-slots led to background-noise and carryover
signals, which were both absent in new SPE-cartridges. This effect was not observed for the more
polar analytes. For the accuracy (and precision) experiments, both performed in earlier stages of
method development, SPE clean-up was performed with already used SPE-material (whereas
extraction of psoriatic and healthy samples from section 3.1. was performed with new and unused
SPE-cartridges, and no background problems occurred). Thus, measured concentrations for HETEs
are high as a result of contamination. This effect was also apparent for the precision experiments,
analyte
accuracy
[%]
RSD
[%]
6-keto-PGF α 100.4 2.6
TXB2 101.0 2.6
PGF α 102.6 2.1
PGE2 100.7 1.5
PGD2 98.3 1.2
LTB4 99.7 2.3
12-HEPE 62.8 1.2
15-HETE 121.7 1.5
12-HETE 128.0 1.5
5-HETE 125.5 4.3

RESULTS & DISCUSSION
47
Table 5: Results of inter-day precision determination (3-fold workup per
o e t atio & da → =6 ; fo data & al ulatio see Table A 12 &
Table A 16. The measured recovery of the HETEs is high as a result of
carry over effects and resultant high (uncorrected) background
which showed similar trends of high HETE values (Table 5). These carryover and high background
problems for HETEs must be addressed by further optimisation of the SPE-procedure in future
development of the method.
Precision data was obtained by
measuring two dOFM sample-pools,
each spiked with either 1 ng/ml or
10 ng/ml of the analytes; the two
samples were extracted in triplicate
and measured on two different days;
the inter-day precision was defined as
the relative standard deviation of the
respective measured concentrations.
Results show that the five main
analytes (except PGD2) and LTB4
eluting first from the HPLC column
again show better precision compared to the others (Table 5). The PGD2 peak of the resulting
chromatogram has often to be integrated manually due to insufficient automatic processing of the
software (as a consequence of slight retention time shifts), which could be an explanation for the
high value of PGD2. In addition, the raw data shows that the PGD2-concentrations of the 1 ng/ml
sample were considerably lower on day 2 compared to day 1 (Table A 12); a possible cause is analyte
degradation due to too long handling at room temperature during sample workup; PGD2 exhibits low
stability at temperatures >4 °C (Maddipati & Zhou, 2011). According to current studies, general
accuracy and precision can be improved by handling samples and stock-solutions on ice (Kamlage et
al., 2014; Martin-Venegas et al., 2014). Thereby risk of primarily thermal but also enzymatic changes
in analyte concentrations can be minimised.
Precision can be influenced by variation during sample processing, so called random errors, prior to
the addition of internal standard; for example pipetting-errors or slightly different degrees of solvent
evaporation due to inert-gas overlay. Generally, the lower the measured concentration range, the
less precise was the measurement.
analyte [ng/ml]
(10 ng/ml)
RSD [%]
(10 ng/ml) [ng/ml]
(1 ng/ml)
RSD [%]
(1 ng/ml)
6-keto-PGF α 10.5 2.1 1.01 1.5
TXB2 9.80 1.7 0.963 3.1
PGF α 10.4 1.6 0.994 3.3
PGE2 10.1 2.0 0.946 4.3
PGD2 7.98 7.1 0.612 30.8
LTB4 10.7 3.1 1.06 3.1
12-HEPE 6.06 6.3 1.43 15.5
15-HETE 13.7 6.6 4.96 5.0
12-HETE 15.6 4.5 5.10 6.2
5-HETE 14.0 5.6 4.86 5.1

RESULTS & DISCUSSION
48
3.4. Chromatographic separation
The extracted samples were separated by high performance liquid chromatography prior to mass
spectrometric detection. For the separation of eicosanoids, which possess both lipid as well as acidic
character, an Atlantis T3 column from Waters was chosen. Its proprietary silica-based C18 reversed-
phase stationary material is optimised for separating a wide range of neutral, hydrophobic and also
polar compounds8; thus it was suitable for development of a multi-analyte analytical method.
Eicosanoids were well resolved by using gradient elution (Figure 25).
Figure 25: U–HPLC/targeted MS² of an extracted 100 ng/ml calibration solution; solvent A was H2O:ACN:formic acid
(63:37:0.2, v:v:v), solvent B was ACN:2-propanol (50:50, v:v); the chromatogram shows the separation of the 10
analytes; the elution conditions are based on those reported by Deems et al (2007).
The polar PGs elute first with the partly aqueous mobile phase, followed by LTB4 and eventually
12-HEPE and the three HETEs which elute at pure organic conditions due to their higher hydrophobic
character. Clear chromatographic separation was especially important for compounds with the same
molecular mass and MS-fragmentation pattern like PGE2 and its structural isomer PGD2. The
resulting chromatogram showed adequate separation (improving method selectivity) of the 10
eicosanoid analytes along with sharp peak shapes (improving sensitivity). Chromatographic
separation was not optimised further: sharper peaks would also require faster detectors to give
improved method sensitivity otherwise signal-output is lost. Given that scan time is kept the same,
the total amount of scans per peak decreases with narrower peak width which results in poor peak
shape; this effect is accompanied by an increasing risk of intensity loss (cf. section 3.5) and hence
reduced sensitivity.
8 Waters Corporation, 2007. ATLANTIS T3 AND ACQUITY UPLC HSS T3 COLUMNS. pp.1-6.
Available at: http://www.waters.com/webassets/cms/library/docs/720001887en.pdf [Accessed July 20, 2014].

RESULTS & DISCUSSION
49
3.5. Comparison of Q Exactive™ MS with triple quadrupole MS
Most reported methods for measuring eicosanoids use triple quadrupole mass analysers to detect
the analytes because of their enhanced detection speed. Therefore the method developed for the
Q E a ti e™ M“ was adapted for use with an HPLC/TSQ Quantum™ Access MAX Triple Quadrupole
MS system in order to compare these two detector types.
3.5.1. Scan mode: targeted MS² versus SRM
Q Exacti e™ M“
The Q E a ti e™ M“ offe s a ious diffe e t s a t pes a d o i atio s f o hi h the targeted
MS² mode was selected for this study. Depending on an inclusion list, where retention time range,
polarity and parent mass of the respective analytes have to be provided, the MS selects the
respective parent ions in the quadrupole mass filter and transfers them to the HCD cell (via the C-
trap) for fragmentation. All fragments are then sent back into the C-trap which is filled until sending
them into the orbitrap, where all fragment ions are detected with high resolution of the fragment
io s → a full M“ s a of the f ag e ts i a p io sele ted /z a ge is e o ded . This scan type was
chosen because detection can be focused on the parent ion of choice during the already known
retention time ranges while MS interfering compounds causing background noise are split off right
at the first mass filtering step. The retention time windows were circumscribed as narrow as possible
during method development in order to enhance the number of scans per analyte and its internal
standard to obtain maximal signal intensity. This step was critical during method development: the
narrower the retention time window was set in the inclusion list, the higher was the risk of partial or
even complete loss of analyte signals due to slight retention time shifts. Such shifts can be caused by
small changes in mobile phase composition, formic acid evaporation out of solvent A for instance.
Hence the decision was made to let retention time windows of some analytes overlap partially, even
though overlapping leads to only half the number of scans per analyte per overlapping section (or
even fewer, depending on the number of overlapping analytes and internal standards).
Scan time generally was a highly limiting factor during method development; short scan times raise
the number of total scans and make it possible to detect substances, even at trace levels, which are
only briefly eluted, but this is accompanied by a loss of signal intensity because smaller numbers of
ions are detected. Vice versa, if scan times are chosen too wide, higher intensity but lesser scan-
signals are produced, resulting in poor peak shape. Also signals of very low concentrated substances,
which elute only in a short time span, can be lost due to growing background-noise. Scan time is

RESULTS & DISCUSSION
50
influenced and increased by several instrument settings: (i) resolution: the higher it is, the longer the
scan; (ii) AGC target (automatic gain control): gives the limiting amount of ions in the C-trap before
directly sending them into the orbitrap; the higher the setting, the longer it takes till the limit is
reached, hence the longer the scan; (iii) maximal inject time: after this time ion injection from the C-
trap into the orbitrap is triggered, regardless of whether the AGC target was reached or not. During
method development the optimal settings for all these factors were found in order to balance the
scan duration/amount and signal intensity.
In order to push sensitivity for most analytes, not only signals from one but two characteristic
fragments were summed by the evaluation software in order to further increase the respective
signal intensity. Ultimately the developed method combining HPLC–separation and high resolution
Q E a ti e™ M“ produced good quality chromatograms (Figure 26).

RESULTS & DISCUSSION
51
Figure 26a: U–HPLC/targeted MS² fragment chromatograms of a 5 g/ l a al te solutio dete ted ith a Q E a ti e™ MS; shown are the total ion current (TIC) and the five first eluting analytes; exact instrumental settings are listed in
Table A 2 and Table A 3.
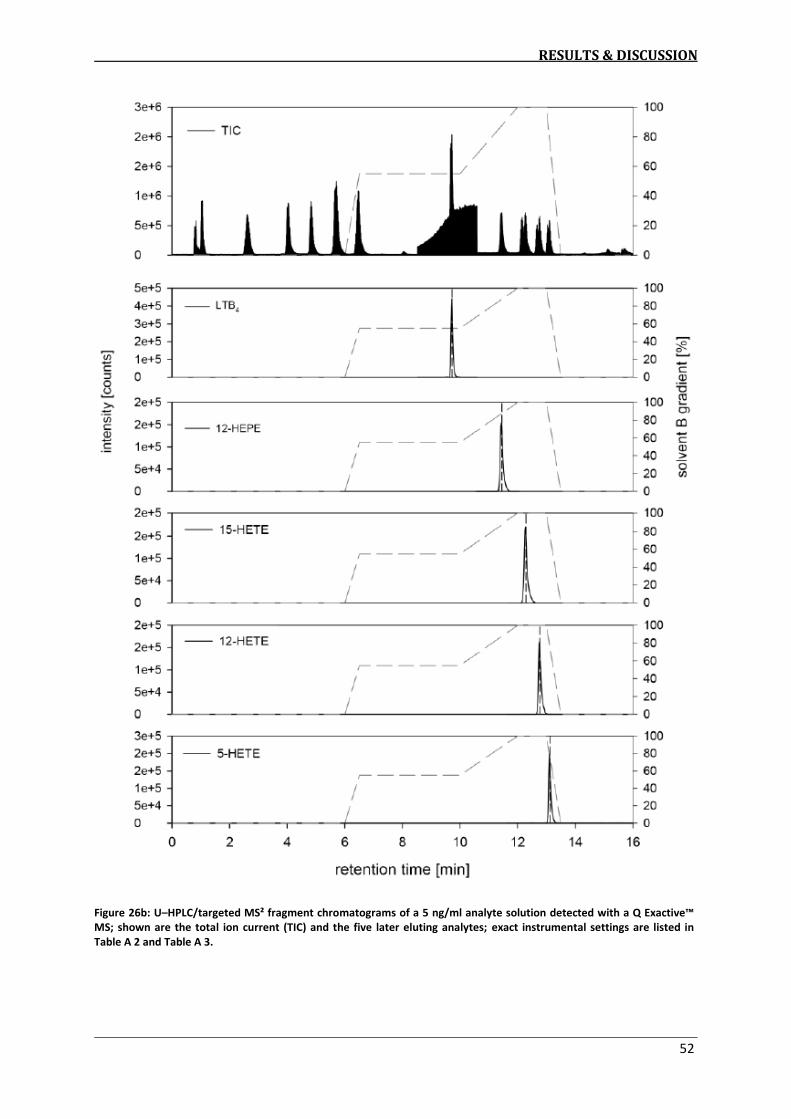
RESULTS & DISCUSSION
52
Figure 26b: U–HPLC/targeted MS² fragment chromatograms of a 5 g/ l a al te solutio dete ted ith a Q E a ti e™ MS; shown are the total ion current (TIC) and the five later eluting analytes; exact instrumental settings are listed in
Table A 2 and Table A 3.

RESULTS & DISCUSSION
53
Triple quadrupole MS
A major advantage of this MS system is its speed. Numerous m/z values can be scanned in very short
time, which makes them perfectly applicable for sensitivity- and speed-requiring multi-analyte
eicosanoid-analysis. These very short scan times are also the reason why tandem MS systems are
mostly preferred in mass spectrometric eicosanoid analysis (Balgoma et al., 2013). Literature
research also indicated that most studies in this field do not use triple quadrupoles from Thermo
Fisher Scientific, but rather from AP SCIEX or Waters. Hence it was suspected that triple quadrupole
MS instruments from Thermo Scientific lack sensitivity. To test this assumption and to determine
sensitivity of triple quadrupole detection, the method developed for the Q E a ti e™ M“ as
transferred and adjusted to a SRM-method (single reaction monitoring: parent ions are selected in
Q1, fragmented in Q2 and via selection in Q3 only preselected fragments are detected in the end,
hence making detection fast and sensitive) on a TSQ Quantum™ Access MAX Triple Quadrupole MS.
The method was partitioned into 6 scan-segments according to the respective retention times of the
analytes and internal standards. During these segments only the given fragments are scanned - no
full scan over a certain m/z range as ade o pa ed to the Q E a ti e™ M“ ethod , and hence
dete tio as e pe ted to e eed the Q E a ti e™ M“ ethod i te s of speed a d se siti it . The
respective instrumental settings are listed in Table A 5 and Table A 6. Figure 27 shows the results of
a 5 ng/ml analyte solution measured with the TSQ–method.

RESULTS & DISCUSSION
54
Figure 27a: HPLC/SRM triple quadrupole MS fragment chromatograms of a 5 ng/ml analyte solution; shown are the total
ion current (TIC) and the five first eluting analytes; exact instrumental settings are listed in Table A 5 and Table A 6.

RESULTS & DISCUSSION
55
Figure 27b: HPLC/SRM triple quadrupole MS fragment chromatograms of a 5 ng/ml analyte solution; shown are the total
ion current (TIC) and the five later eluting analytes; exact instrumental settings are listed in Table A 2 and Table A 3.
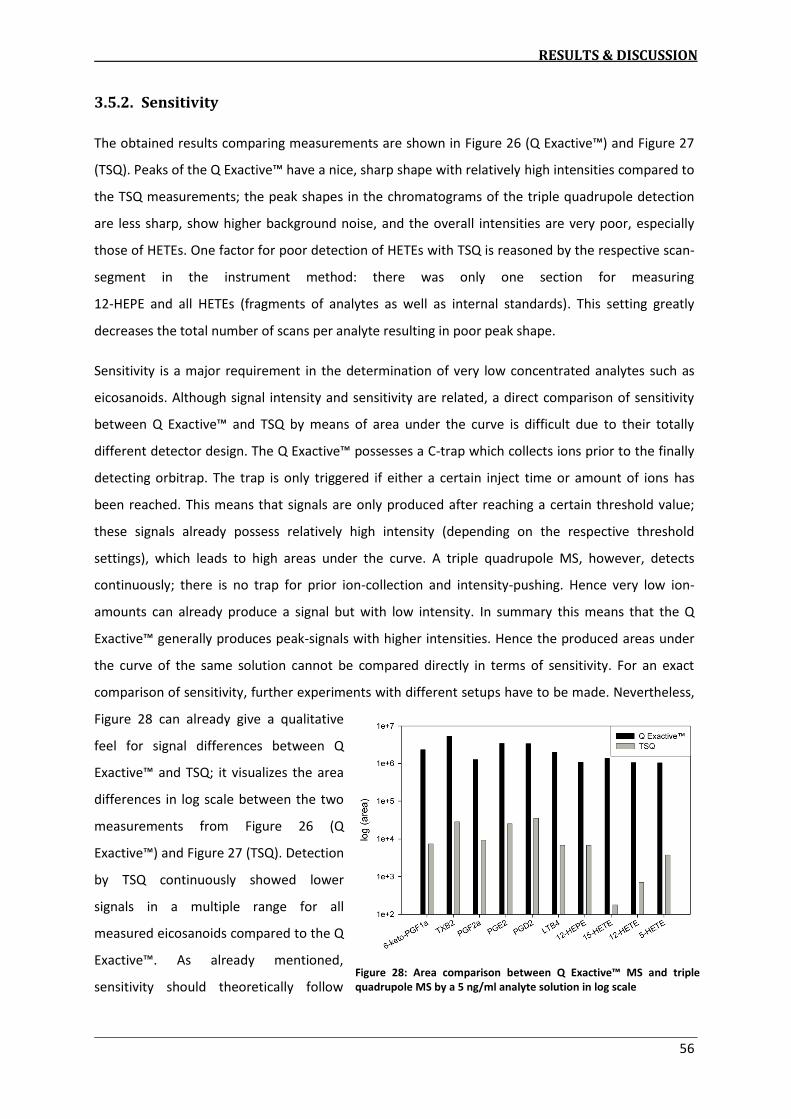
RESULTS & DISCUSSION
56
3.5.2. Sensitivity
The obtained results comparing measurements are shown in Figure 26 Q E a ti e™ a d Figure 27
T“Q . Peaks of the Q E a ti e™ ha e a i e, sha p shape ith elati el high intensities compared to
the TSQ measurements; the peak shapes in the chromatograms of the triple quadrupole detection
are less sharp, show higher background noise, and the overall intensities are very poor, especially
those of HETEs. One factor for poor detection of HETEs with TSQ is reasoned by the respective scan-
segment in the instrument method: there was only one section for measuring
12-HEPE and all HETEs (fragments of analytes as well as internal standards). This setting greatly
decreases the total number of scans per analyte resulting in poor peak shape.
Sensitivity is a major requirement in the determination of very low concentrated analytes such as
eicosanoids. Although signal intensity and sensitivity are related, a direct comparison of sensitivity
et ee Q E a ti e™ a d T“Q ea s of a ea u de the u e is diffi ult due to thei totall
diffe e t dete to desig . The Q E a ti e™ possesses a C-trap which collects ions prior to the finally
detecting orbitrap. The trap is only triggered if either a certain inject time or amount of ions has
been reached. This means that signals are only produced after reaching a certain threshold value;
these signals already possess relatively high intensity (depending on the respective threshold
settings), which leads to high areas under the curve. A triple quadrupole MS, however, detects
continuously; there is no trap for prior ion-collection and intensity-pushing. Hence very low ion-
amounts can already produce a signal but with low intensity. In summary this means that the Q
E a ti e™ ge e all p odu es peak-signals with higher intensities. Hence the produced areas under
the curve of the same solution cannot be compared directly in terms of sensitivity. For an exact
comparison of sensitivity, further experiments with different setups have to be made. Nevertheless,
Figure 28 can already give a qualitative
feel for signal differences between Q
E a ti e™ and TSQ; it visualizes the area
differences in log scale between the two
measurements from Figure 26 (Q
E a ti e™ a d Figure 27 (TSQ). Detection
by TSQ continuously showed lower
signals in a multiple range for all
measured eicosanoids compared to the Q
E a ti e™. As already mentioned,
sensitivity should theoretically follow Figure 28: A ea o pa iso et ee Q E a ti e™ M“ a d t iple quadrupole MS by a 5 ng/ml analyte solution in log scale

RESULTS & DISCUSSION
57
quite an opposite trend; detection with the TSQ should exhibit better sensitivity because of faster
detection due to only scanning specific fragments instead of a wider m/z range, as performed by the
high resolution Q E a ti e™ MS. But a likely major reason for such a large difference in the
sensitivities is the age of the utilised i st u e ts; hile the Q E a ti e™ was a relatively new device,
the TSQ Quantum™ Access MAX Triple Quadrupole was several years older and its performance
compromised by numerous previous routine analyses. Newer, state of the art triple quadrupole
detectors possess speed and sensitivity properties far superior to the TSQ, with LOQs in the pg-range
(Y. Wang et al., 2014). Thus new triple quadrupole mass spectrometers might be expected to
outperform the Q Exactive in terms of sensitivity for the determination of eicosanoids.

RESULTS & DISCUSSION
58
3.6. Outlook
The developed analytical method for qualification and quantification of eicosanoids was optimised
for measuring diluted interstitial fluid sampled by dermal open-flow microperfusion (dOFM). A
combination of high performance liquid chromatography and high resolution mass spectrometry
ith a Q E a ti e™ M“ dete tio as used for the measurements. The obtained results look
promising but there is still considerable room for improvement. Some of the factors open for
optimisation include the sampling process, sample handling, extraction and last but not least sample
measurement. In this section one promising possibility, which has not been mentioned before, is
shortly presented, namely derivatisation.
Due to low eicosanoid concentrations, especially in highly diluted interstitial fluid, the current
developed method struggles in terms of sensitivity, especially for analysis of PGD2, LTB4 and HETEs.
Addition of further analytes into this method is limited by the s a speed of the Q E a ti e™ MS,
and also by the low ionisation efficiency when ESI is used in negative mode. Sensitivity could be
increased by forming a cationic derivative and operating the ESI in positive ion mode. The
derivatising agent, called N-(4-aminomethylphenyl)pyridinium (AMPP) (Bollinger et al., 2010), reacts
with the carboxyl terminus of the eicosanoid leading to an AMPP-eicosanoid derivative linked via an
amide bond.
CH3CN,
HCON(Me)2,
H2O
EDC, HOBt,
AMPP AMPP Amide
Figure 29: Derivatisation reaction of AMPP with carboxyl-group of eicosanoids (Bollinger et al., 2010)
The cationic derivatives can be detected in positive instead of negative ionisation mode, thereby
benefitting from better ionisation efficiency and sensitivity. The derivatisation itself is also simply
performed; the derivatisation mixture is just added and mixed with the extracted dry sample,
incubated for 30 min at 60 °C and the resulting solution can be measured directly without any
further purification (Liu et al., 2013). Introduction of derivatisation into the existing analytical
method would probably significantly enhance the sensitivity of the method for the current 10
analytes.

CONCLUDING COMMENTS
59
4. Concluding comments
This thesis describes the development and evaluation of an analytical method to determine 10
representatives of prostaglandins, thromboxanes, hydroxyeicosapentaenoic and
hydroxyeicosatetraenoic acids, collectively known as eicosanoids. Through combination of solid
phase extraction, high performance liquid chromatography and high resolution mass spectrometry it
was possible to successfully qualify and quantify these eicosanoids in the ng/ml or even pg/ml range.
Nevertheless, accuracy and repeatability in such low concentration ranges have to be optimised
further, specifically for highly sensitive hydroxyeicosatetraenoic acids.
As eicosanoids are vital markers in inflammation, the developed multi-analyte method was used to
create time-concentration profiles of eicosanoids in diluted interstitial fluid from human dermis.
Samples from one healthy subject and one suffering from psoriasis were obtained via dermal open-
flow microperfusion in order to compare their eicosanoid levels. Most of the analytes were
successfully quantified in psoriatic and at least detected in healthy samples. However the analytical
method lacked sensitivity for measuring in vivo concentrations of PGD2 and LTB4 in the sampled
interstitial fluid.
Further optimisation of the existing sampling procedure and analytical method especially in terms of
sensitivity is necessary in order to qualify and quantify all 10 selected eicosanoids in diluted dermal
interstitial fluid. It is suggested as well to add further eicosanoids to the analytical panel to gain
better knowledge of in vivo pathways during inflammation.
Also, further sampling has to be done in order to elucidate and consolidate differences of
concentration levels and trends from eicosanoids. Only then will it be possible to give a clear
statement concerning differences of in vivo concentrations and pathways of eicosanoids between
health and sickness.

REFERENCES
60
5. References
Balgoma, D., Checa, A., Sar, D. G., Snowden, S., & Wheelock, C. E. (2013). Quantitative metabolic
profiling of lipid mediators. Molecular Nutrition & Food Research, 57(8), 1359–1377.
Bergström, S., Ryhage, R., Samuelsson, B., & Sjövall, J. (1963). Prostaglandins and Related Factors.
The Journal of Biological Chemistry, 238(11), 3555–3564.
Bodenlenz, M., Aigner, B., Dragatin, C., Liebenberger, L., Zahiragic, S., Höfferer, C., Sinner, F. et. al.
(2013). Clinical applicability of dOFM devices for dermal sampling. Skin Research and
Technology, 0, 1–10.
Bollinger, J. G., Thompson, W., Lai, Y., Oslund, R. C., Hallstrand, T. S., Sadilek, M., Gelb, M. H. et. al. (2010). Improved sensitivity mass spectrometric detection of eicosanoids by charge reversal
derivatization. Analytical Chemistry, 82(16), 6790–6796.
Bombardieri, S., Ciabattoni, G., Munno, D. I., Pasero, G., Pinca, E., & Pugliese, F. (1981). The synovial
prostaglandin system in chronic inflammatory arthritis: differential effects of steroidal and
nonsteroidal anti-inflammatory drugs. British Journal of Pharmacology, 73, 893–901.
Buczynski, M. W., Dumlao, D. S., & Dennis, E. A. (2009). Thematic Review Series: Proteomics. An
integrated omics analysis of eicosanoid biology. Journal of Lipid Research, 50(6), 1015–38.
Davidson, A., & Diamond, B. (2001). Autoimmune Diseases. The New England Journal of Medicine,
345, 340–350.
Deems, R., Buczynski, M. W., Bowers-Gentry, R., Harkewicz, R., & Dennis, E. A. (2007). Detection and
quantitation of eicosanoids via high performance liquid chromatography-electrospray
ionization-mass spectrometry. Methods in Enzymology, 432, 59–82.
Eguchi, N., Minami, T., Shirafuji, N., Kanaoka, Y., Tanaka, T., Nagata, A., Hayaishi, O. et. al. (1999).
Lack of tactile pain ( allodynia ) in lipocalin-type prostaglandin D synthase-deficient mice.
Proceedings of the National Academy of Sciences of the United States of America., 96, 726–730.
Fu k, C. D. . P ostagla di s a d Leukot ie es : Ad a es i Ei osa oid Biolog . Science, 294,
1871–1876.
Goldblatt, M. W. (1933). A depressor substance in seminal fluid. J. Soc. Chem. Ind., 52, 1056–1057.
Grimminger, F., & Mayser, P. (1995). Lipid mediators, free fatty acids and psoriasis. Prostaglandins, Leukotrienes and Essential Fatty Acids, 52(1), 1–15.
Gross, J. H. (2013). Massenspektrometrie - Ein Lehrbuch. Berlin Heidelberg: Springer.
Hamberg, M., Svensson, J., & Samuelsson, B. (1975). Thromboxanes: a new group of biologically
active compounds derived from prostaglandin endoperoxides. Proceedings of the National
Academy of Sciences, 72(8), 2994–2998.
REFERENCES
61
Hammarström, S., Hamberg, M., Samuelsson, B., Duell, E. A., Stawiski, M., & Voorhees, J. J. (1975).
Increased concentrations of nonesterified arachidonic acid , 12L-hydroxy-5,8,10,14-
ei osatet ae oi a id, p ostagla di E , a d p ostagla di F α i epide is of pso iasis. Proceedings of the National Academy of Sciences of the United States of America, 72(12), 5130–5134.
Harizi, H., Corcuff, J.-B., & Gualde, N. (2008). Arachidonic-acid-derived eicosanoids: roles in biology
and immunopathology. Trends in Molecular Medicine, 14(10), 461–469.
Hughes, H., Nowlin, J., Gaskelli, S. J., & Parr, V. C. (1988). Selected Reaction Monitoring During Gas
Chromatography / Mass Spectrometry of Eicosanoids. Biomedical and Environmental Mass Spectrometry, 16, 409–413.
Ikai, K. (1999). Psoriasis and the arachidonic acid cascade. Journal of Dermatological Science, 21(3),
135–146.
Kamlage, B., Maldonado, S. G., Bethan, B., Peter, E., Schmitz, O., Liebenberg, V., & Schatz, P. (2014).
Quality markers addressing preanalytical variations of blood and plasma processing identified
by broad and targeted metabolite profiling. Clinical Chemistry, 60(2), 399–412.
Kendall, A. C., & Nicolaou, A. (2013). Bioactive lipid mediators in skin inflammation and immunity.
Progress in Lipid Research, 52(1), 141–164.
Kendall, A. C., Pilkington, S. M., Massey, K. a, Sassano, G., Rhodes, L. E., & Nicolaou, A. (2015).
Distribution of Bioactive Lipid Mediators in Human Skin. The Journal of Investigative Dermatology, 135(6), 1510–1520.
Koolman, J., & Röhm, K.-H. (1998). Taschenatlas der Biochemie. Stuttgart: Thieme.
Kragballe, K., & Voorhees, J. J. (1987). Eicosanoids in Psoriasis – 15-HETE on the Stage.
Dermatologica, 174, 109–213.
Kubota, T., Arita, M., Isobe, Y., Iwamoto, R., Goto, T., Yoshioka, T., Arai, H. et. al. (2014).
Ei osape tae oi a id is o e ted ia ω-3 epoxygenation to the anti-inflammatory metabolite
12-hydroxy-17,18-epoxyeicosatetraenoic acid. FASEB Journal, 28(2), 586–593.
Kurzrok, R., & Lieb, C. C. (1930). Biochemical Studies of Human Semen. II. The Action of Semen on
the Human Uterus. Experimental Biology and Medicine, 28(3), 268–272.
Li , P., Wa e , “. J. C., & F ied a , G. B. . I te leuki : a Mitoge for Human Vascular Smooth Muscle Cells That Induces the Release of Growth-inhibitory Prostanoids. Journal of
Clinical Investigation, 81, 487–498.
Liu, X., Moon, S. H., Mancuso, D. J., Jenkins, C. M., Guan, S., Sims, H. F., & Gross, R. W. (2013).
Oxidized fatty acid analysis by charge-switch derivatization, selected reaction monitoring, and
accurate mass quantitation. Analytical Biochemistry, 442(1), 40–50.
Lowes, M. a, Bowcock, A. M., & Krueger, J. G. (2007). Pathogenesis and therapy of psoriasis. Nature,
445(7130), 866–873.
Maddipati, K. R., & Zhou, S.-L. (2011). Stability and analysis of eicosanoids and docosanoids in tissue
culture media. Prostaglandins & Other Lipid Mediators, 94, 59–72.
REFERENCES
62
Marks, F. (1999). Prostaglandins, Leukotrienes and Other Eicosanoids. (G. Fürstenberger, Ed.).
Weinheim: Wiley-VCH.
Martin-Venegas, R., Jáuregui, O., & Moreno, J. J. (2014). Liquid chromatography-tandem mass
spectrometry analysis of eicosanoids and related compounds in cell models. Journal of
Chromatography. B, Analytical Technologies in the Biomedical and Life Sciences, 964, 41–49.
Masoodi, M., Eiden, M., Koulman, A., Spaner, D., & Volmer, D. A. et. al. (2010). Comprehensive
lipidomics analysis of bioactive lipids in complex regulatory networks. Analytical Chemistry,
82(19), 8176–8185.
Massey, K. A, & Nicolaou, A. (2013). Lipidomics of oxidized polyunsaturated fatty acids. Free Radical Biology & Medicine, 59, 45–55.
Moreno, J. J. (2009). New aspects of the role of hydroxyeicosatetraenoic acids in cell growth and
cancer development. Biochemical Pharmacology, 77(1), 1–10.
Murphy, R. C., Barkley, R. M., Zemski Berry, K., Hankin, J., Harrison, K., Johnson, C., Zarini, S. et. al.
(2005). Electrospray ionization and tandem mass spectrometry of eicosanoids. Analytical
Biochemistry, 346(1), 1–42.
Nakamura, T., Bratton, D. L., & Murphy, R. C. (1997). Analysis of Epoxyeicosatrienoic and
Monohydroxyeicosatetraenoic Acids Esterified to Phospholipids in Human Red Blood Cells by
Electrospray Tandem Mass Spectrometry. Journal of Mass Spectrometry, 32, 888–896.
Noda, M., Kariura, Y., Pannasch, U., Nishikawa, K., Wang, L., Seike, T., Wada, K. et. al. (2007). Neuroprotective role of bradykinin because of the attenuation of pro-inflammatory cytokine
release from activated microglia. Journal of Neurochemistry, 101(2), 397–410.
ÖNORM-DIN-32645. (2011). ÖNORM DIN 32645 - Chemische Analytik - Nachweis-, Erfassungs- und
Bestimmungsgrenze unter Wiederholbedingungen. ÖNORM, 2011-0401, 1–28.
Oyoshi, M. K., He, R., Li, Y., Mondal, S., Yoon, J., Miller, L. S., Geha, R. S. et. al. (2012). Leukotriene
B4-driven neutrophil recruitment to the skin is essential for allergic skin inflammation.
Immunity, 37(4), 747–758.
Pietrzak, A., Michalak-Stoma, A., Chodorowska, G., & Szepietowski, J. C. (2010). Lipid disturbances in
psoriasis: an update. Mediators of Inflammation, 2010, 1-13.
Pilkington, S. M., Rhodes, L. E., Al-Aasswad, N. M. I., Massey, K. A., & Nicolaou, A. (2014). Impact of EPA ingestion on COX- and LOX-mediated eicosanoid synthesis in skin with and without a pro-
inflammatory UVR challenge - Report of a randomised controlled study in humans. Molecular
Nutrition and Food Research, 58(3), 580–590.
Proksch, E., Brandner, J. M., & Jensen, J. M. (2008). The skin: An indispensable barrier. Experimental
Dermatology, 17(12), 1063–1072.
Ricciotti, E., & FitzGerald, G. A. (2011). Prostaglandins and inflammation. Arteriosclerosis,
Thrombosis, and Vascular Biology, 31(5), 986–1000.
Saito, O., Guan, Y., Qi, Z., Davis, L. S., Ko, M., Sugimoto, Y., Breyer, M. D. et. al. (2003). Expression of
the prostaglandin F receptor ( FP ) gene along the mouse genitourinary tract. American Journal
of Physiology - Renal Physiology, 284(6), 1164–1170.

REFERENCES
63
Schmitz, G., & Ecker, J. (2008). The opposing effects of n-3 and n-6 fatty acids. Progress in Lipid
Research, 47(2), 147–155.
Schneider, C., & Pozzi, A. (2011). Cyclooxygenases and lipoxygenases in cancer. Cancer Metastasis
Reviews, 30, 277–294.
Shaik, J. S. B., Miller, T. M., Graham, S. H., Manole, M. D., & Poloyac, S. M. (2014). Rapid and
simultaneous quantitation of prostanoids by UPLC-MS/MS in rat brain. Journal of
Chromatography. B, Analytical Technologies in the Biomedical and Life Sciences, 945-946, 207–216.
Sugimoto, Y., Yamasaki, A., Segi, E., Tsuboi, K., Aze, Y., Nishimura, T., Narumiya, S. et. al. (1997). Failure of parturition in mice lacking the prostaglandin F receptor. Science (New York, N.Y.),
277(5326), 681–683.
Takenaga, M., Hirai, A., Terano, T., Tamura, Y., Kitagawa, H., & Yoshida, S. (1986). Comparison of the
in vitro effect of eicosapentaenoic acid (EPA)-derived lipoxygenase metabolites on human
platelet function with those of arachidonic acid. Thrombosis Research, 41(3), 373–384.
Trzaskowski, B., Latek, D., Yuan, S., Ghoshdastider, U., Debinski, A., & Filipek, S. (2012). Action of
Molecular Switches in GPCRs - Theoretical and Experimental Studies. Current Medicinal
Chemistry, 2(19), 1090–1109.
Veitch, C., Brown, L., Sernia, C., & Gemmell, R. T. (2002). Role of PGF 2a and oxytocin in parturition in
the brushtail possum (Trichosurus vulpecula ). Reproduction, 123, 429–434.
Voet, D., & Voet, J. G. (2011). Biochemistry (4th ed.). Hoboken, NJ: Wiley.
Wang, D., & DuBois, R. N. (2007). Measurement of eicosanoids in cancer tissues. Methods in
Enzymology, 433, 27–50.
Wang, Y., Armando, A. M., Quehenberger, O., Yan, C., & Dennis, E. A. (2014). Comprehensive ultra-
performance liquid chromatographic separation and mass spectrometric analysis of eicosanoid
metabolites in human samples. Journal of Chromatography. A, 1359, 60–69.
Woollard, P. M. (1986). Stereochemical difference between 12-hydroxy-5,8,10,14-eicosatetraenoic
acid in platelets and psoriatic lesions. Biochemical and Biophysical Research Communications,
136(1), 169–176.
Yin, P., Peter, A., Franken, H., Zhao, X., Neukamm, S. S., Rosenbaum, L., Lehmann, R. et. al. (2013). Preanalytical aspects and sample quality assessment in metabolomics studies of human blood.
Clinical Chemistry, 59(5), 833–845.
Yokomizo, T., Izumi, T., & Shimizu, T. (2001). Leukotriene B4: metabolism and signal transduction.
Archives of Biochemistry and Biophysics, 385(2), 231–241.

APPENDIX
64
6. Appendix
Table A 1: Preparation of calibration standards
10A C-stock in Milli-Q (100 ng/ml) 900 µl water
in HPLC vial without glas insert 10 µl B-stock PGE2
10 µl B-stock PGD2
10 µl B-stock TXB2
10 µl B-stock 6k-PGF α
10 µl B-stock PGF2
10 µl B-stock 12-HEPE
10 µl B-stock 15-HETE
10 µl B-stock 12-HETE
10 µl B-stock 5-HETE
10 µl B-stock LTB4
10A 50.0 (50.0 ng/ml) 100 µl water
in HPLC vial with glas insert 100 µl 10A C-stock
10A 10.0 (10.0 ng/ml) 180 µl water
in HPLC vial with glas insert 20 µl 10A C-stock
10A 5.00 (5.00 ng/ml) 180 µl water
in HPLC vial with glas insert 20 µl 10A 50.00
10A 1.00 (1.00 ng/ml) 180 µl water
in HPLC vial with glas insert 20 µl 10A 10.00
10A 0.50 (0.50 ng/ml) 180 µl water
in HPLC vial with glas insert 20 µl 10A 5.00
10A 0.10 (0.10 ng/ml) 180 µl water
in HPLC vial with glas insert 20 µl 10A 1.00
10A 0.05 (0.05 ng/ml) 180 µl water
in HPLC vial with glas insert 20 µl 10A 0.50
10A 0.02 (0.02 ng/ml) 160 µl water
in HPLC vial with glas insert 40 µl 10A 0.10
10A 0.01 (0.01 ng/ml) 180 µl water
in HPLC vial with glas insert 20 µl 10A 0.10

APPENDIX
65
Table A 2: I st u e tal setti gs fo Q E a ti e™ M“ dete tio
ESI-Settings
targeted MS² settings
Spray voltage [V] negative 3750 Scan type targeted MS²
Capillary temperature [°C] 320
Runtime [min] 15.99
Sheath gas pressure [arbitrary units] 30
Polarity negative
Auxiliary gas pressure [arbitrary units] 13
Default charge state 1
Spare gas [arbitrary units] 0
Inclusion MS² on
Probe Heater Temp. [°C] 30
MS² microscans 1
S-Lens RF Level 60
Resolution 35000
AGC target 2E+05
max inject time [ms] 200
MSX count 1
Isolation window [m/z] 0.8
Table A 3: I lusio list setti gs fo Q E a ti e™ M“ dete tio ; general settings: negative polarity, species = –H, CS = 1 [z]
mass
[m/z]
formula
[M]
start
[min]
end
[min]
NCE comment
369.22826 C20H34O6 0.00 3.50 38% 6-keto-PGF α
373.25337 C20H30D4O6 0.00 3.50 38% 6-keto-PGF α-d4
369.22826 C20H34O6 3.51 4.75 20% TXB2
373.25337 C20H30D4O6 3.51 4.75 20% TXB2-d4
353.23335 C20H34O5 4.47 5.55 39% PGF α
357.25845 C20H30D4O5 4.47 5.55 39% PGF α -d4
351.21770 C20H32O5 5.25 8.50 18% PGE2 / PGD2
355.24280 C20H28D4O5 5.25 8.50 18% PGE2-d4 / PGD2-d4
335.22278 C20H32O4 8.51 10.60 20% LTB4
339.24789 C20H28D4O4 8.51 10.60 20% LTB4-d4
317.21222 C20H30O3 10.51 12.07 20% 12-HEPE
319.22787 C20H32O3 11.60 end 22% 15-HETE / 12-HETE / 5-HETE
327.27808 C20H24D8O3 11.60 end 22% 15-HETE-d8 / 12-HETE-d8 / 5-HETE-d8
Table A 4: E a t pa e t a d f ag e t asses used fo ide tifi atio a d ua tifi atio fo Q E a ti e™ M“
Analyte parent
[M-H]-
fragment
1
fragment
2
internal
standard
parent
[M-H]-
fragment
1
fragment
2
6-keto-PGF α 369.22826 163.11139 245.19110 6-keto-PGF α-d4 373.25337 167.13625 249.21664
TXB2 369.22826 195.10168 169.08559 TXB2-d4 373.25337 173.11120 199.12726
PGF α 353.23335 193.12240 247.20644 PGF α-d4 357.25845 197.14758 251.23122
PGE2 351.21770 189.12850 271.20621 PGE2-d4 355.24280 193.15240 275.23215
PGD2 351.21770 189.12850 271.20621 PGD2-d4 355.24280 193.15240 275.23215
LTB4 335.22278 195.10198 - LTB4-d4 339.24789 197.11395 -
12-HEPE 317.21222 179.10672 - 12(S)-HETE-d8 used as internal Standard
15-HETE 319.22787 219.13840 175.14806 15(S)-HETE-d8 327.27808 226.18243 182.19183
12-HETE 319.22787 179.10668 135.11624 12(S)-HETE-d8 327.27808 184.13814 140.14266
5-HETE 319.22787 115.03851 - 5(S)-HETE-d8 327.27808 116.04482 -
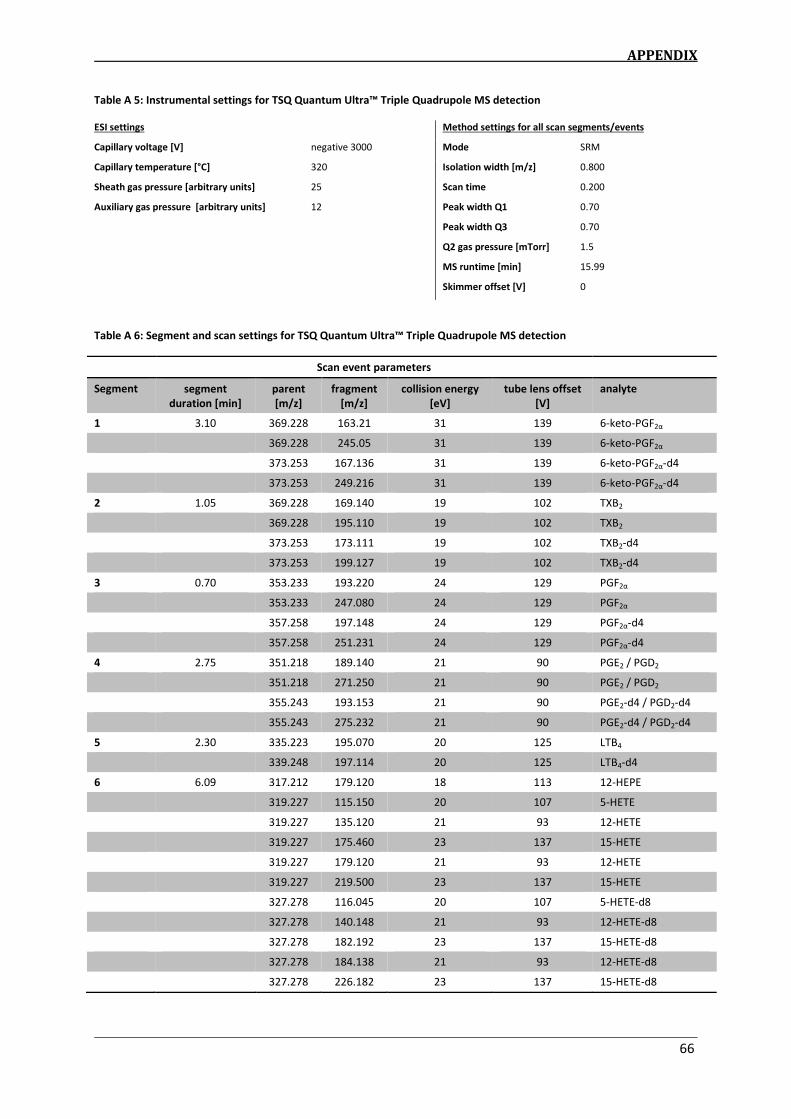
APPENDIX
66
Table A 5: I st u e tal setti gs fo T“Q Qua tu Ult a™ T iple Quad upole M“ dete tio
ESI settings Method settings for all scan segments/events
Capillary voltage [V] negative 3000 Mode SRM
Capillary temperature [°C] 320 Isolation width [m/z] 0.800
Sheath gas pressure [arbitrary units] 25 Scan time 0.200
Auxiliary gas pressure [arbitrary units] 12 Peak width Q1 0.70
Peak width Q3 0.70
Q2 gas pressure [mTorr] 1.5
MS runtime [min] 15.99
Skimmer offset [V] 0
Table A 6: Seg e t a d s a setti gs fo T“Q Qua tu Ult a™ T iple Quad upole M“ dete tio
Scan event parameters
Segment segment
duration [min]
parent
[m/z]
fragment
[m/z]
collision energy
[eV]
tube lens offset
[V]
analyte
1 3.10 369.228 163.21 31 139 6-keto-PGF α
369.228 245.05 31 139 6-keto-PGF α
373.253 167.136 31 139 6-keto-PGF α-d4
373.253 249.216 31 139 6-keto-PGF α-d4
2 1.05 369.228 169.140 19 102 TXB2
369.228 195.110 19 102 TXB2
373.253 173.111 19 102 TXB2-d4
373.253 199.127 19 102 TXB2-d4
3 0.70 353.233 193.220 24 129 PGF α
353.233 247.080 24 129 PGF α
357.258 197.148 24 129 PGF α-d4
357.258 251.231 24 129 PGF α-d4
4 2.75 351.218 189.140 21 90 PGE2 / PGD2
351.218 271.250 21 90 PGE2 / PGD2
355.243 193.153 21 90 PGE2-d4 / PGD2-d4
355.243 275.232 21 90 PGE2-d4 / PGD2-d4
5 2.30 335.223 195.070 20 125 LTB4
339.248 197.114 20 125 LTB4-d4
6 6.09 317.212 179.120 18 113 12-HEPE
319.227 115.150 20 107 5-HETE
319.227 135.120 21 93 12-HETE
319.227 175.460 23 137 15-HETE
319.227 179.120 21 93 12-HETE
319.227 219.500 23 137 15-HETE
327.278 116.045 20 107 5-HETE-d8
327.278 140.148 21 93 12-HETE-d8
327.278 182.192 23 137 15-HETE-d8
327.278 184.138 21 93 12-HETE-d8
327.278 226.182 23 137 15-HETE-d8
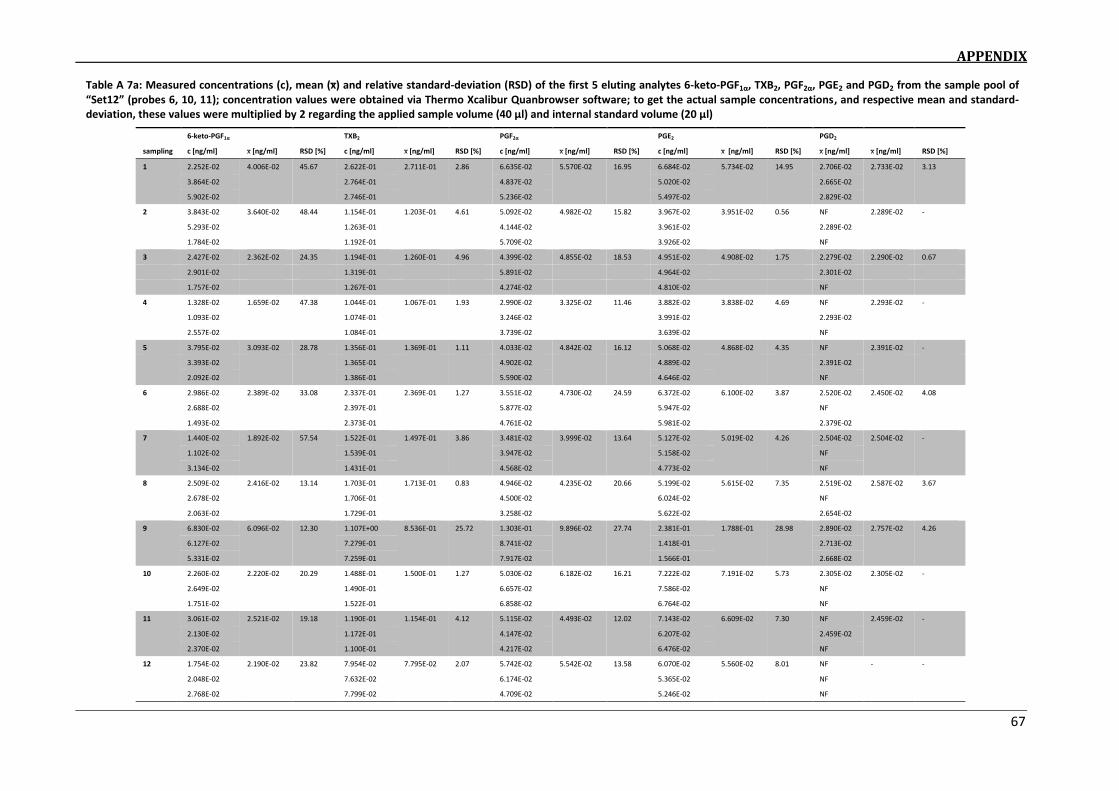
APPENDIX
67
Table A 7a: Measu ed o e t atio s , ea a d relative standard-deviation (RSD) of the first 5 eluting analytes 6-keto-PGF α, TXB2, PGF α, PGE2 and PGD2 from the sample pool of
“et p o es 6, 10, 11); concentration values were obtained via Thermo Xcalibur Quanbrowser software; to get the actual sample concentrations, and respective mean and standard-
deviation, these values were multiplied by 2 regarding the applied sample volume (40 µl) and internal standard volume (20 µl)
6-keto-PGF α TXB2 PGF α PGE2 PGD2
sampling c [ng/ml] [ng/ml] RSD [%] c [ng/ml] [ng/ml] RSD [%] c [ng/ml] [ng/ml] RSD [%] c [ng/ml] [ng/ml] RSD [%] [ng/ml] [ng/ml] RSD [%]
1 2.252E-02 4.006E-02 45.67 2.622E-01 2.711E-01 2.86 6.635E-02 5.570E-02 16.95 6.684E-02 5.734E-02 14.95 2.706E-02 2.733E-02 3.13
3.864E-02 2.764E-01 4.837E-02 5.020E-02 2.665E-02
5.902E-02 2.746E-01 5.236E-02 5.497E-02 2.829E-02
2 3.843E-02 3.640E-02 48.44 1.154E-01 1.203E-01 4.61 5.092E-02 4.982E-02 15.82 3.967E-02 3.951E-02 0.56 NF 2.289E-02 -
5.293E-02 1.263E-01 4.144E-02 3.961E-02 2.289E-02
1.784E-02 1.192E-01 5.709E-02 3.926E-02 NF
3 2.427E-02 2.362E-02 24.35 1.194E-01 1.260E-01 4.96 4.399E-02 4.855E-02 18.53 4.951E-02 4.908E-02 1.75 2.279E-02 2.290E-02 0.67
2.901E-02 1.319E-01 5.891E-02 4.964E-02 2.301E-02
1.757E-02 1.267E-01 4.274E-02 4.810E-02 NF
4 1.328E-02 1.659E-02 47.38 1.044E-01 1.067E-01 1.93 2.990E-02 3.325E-02 11.46 3.882E-02 3.838E-02 4.69 NF 2.293E-02 -
1.093E-02 1.074E-01 3.246E-02 3.991E-02 2.293E-02
2.557E-02 1.084E-01 3.739E-02 3.639E-02 NF
5 3.795E-02 3.093E-02 28.78 1.356E-01 1.369E-01 1.11 4.033E-02 4.842E-02 16.12 5.068E-02 4.868E-02 4.35 NF 2.391E-02 -
3.393E-02 1.365E-01 4.902E-02 4.889E-02 2.391E-02
2.092E-02 1.386E-01 5.590E-02 4.646E-02 NF
6 2.986E-02 2.389E-02 33.08 2.337E-01 2.369E-01 1.27 3.551E-02 4.730E-02 24.59 6.372E-02 6.100E-02 3.87 2.520E-02 2.450E-02 4.08
2.688E-02 2.397E-01 5.877E-02 5.947E-02 NF
1.493E-02 2.373E-01 4.761E-02 5.981E-02 2.379E-02
7 1.440E-02 1.892E-02 57.54 1.522E-01 1.497E-01 3.86 3.481E-02 3.999E-02 13.64 5.127E-02 5.019E-02 4.26 2.504E-02 2.504E-02 -
1.102E-02 1.539E-01 3.947E-02 5.158E-02 NF
3.134E-02 1.431E-01 4.568E-02 4.773E-02 NF
8 2.509E-02 2.416E-02 13.14 1.703E-01 1.713E-01 0.83 4.946E-02 4.235E-02 20.66 5.199E-02 5.615E-02 7.35 2.519E-02 2.587E-02 3.67
2.678E-02 1.706E-01 4.500E-02 6.024E-02 NF
2.063E-02 1.729E-01 3.258E-02 5.622E-02 2.654E-02
9 6.830E-02 6.096E-02 12.30 1.107E+00 8.536E-01 25.72 1.303E-01 9.896E-02 27.74 2.381E-01 1.788E-01 28.98 2.890E-02 2.757E-02 4.26
6.127E-02 7.279E-01 8.741E-02 1.418E-01 2.713E-02
5.331E-02 7.259E-01 7.917E-02 1.566E-01 2.668E-02
10 2.260E-02 2.220E-02 20.29 1.488E-01 1.500E-01 1.27 5.030E-02 6.182E-02 16.21 7.222E-02 7.191E-02 5.73 2.305E-02 2.305E-02 -
2.649E-02 1.490E-01 6.657E-02 7.586E-02 NF
1.751E-02 1.522E-01 6.858E-02 6.764E-02 NF
11 3.061E-02 2.521E-02 19.18 1.190E-01 1.154E-01 4.12 5.115E-02 4.493E-02 12.02 7.143E-02 6.609E-02 7.30 NF 2.459E-02 -
2.130E-02 1.172E-01 4.147E-02 6.207E-02 2.459E-02
2.370E-02 1.100E-01 4.217E-02 6.476E-02 NF
12 1.754E-02 2.190E-02 23.82 7.954E-02 7.795E-02 2.07 5.742E-02 5.542E-02 13.58 6.070E-02 5.560E-02 8.01 NF - -
2.048E-02 7.632E-02 6.174E-02 5.365E-02 NF
2.768E-02 7.799E-02 4.709E-02 5.246E-02 NF

APPENDIX
68
Table A 7b: Measu ed o e t atio s , ea a d relative standard-deviation (RSD) of the last 5 eluting analytes LTB4, 12-HEPE, 15-HETE, 12-HETE and 5-HETE from the sample pool of
“et (probes 6, 10, 11); concentration values were obtained via Thermo Xcalibur Quanbrowser software; to get the actual sample concentrations, and respective mean and standard-
deviation, these values were multiplied by 2 regarding the applied sample volume (40 µl) and internal standard volume (20 µl)
LTB4 12-HEPE
15-HETE
12-HETE
5-HETE
sampling c [ng/ml] [ng/ml] RSD [%] c [ng/ml] [ng/ml] RSD [%] c [ng/ml] ng/ml] RSD [%] c [ng/ml] [ng/ml] RSD [%] c [ng/ml] [ng/ml] RSD [%]
1 NF 1.495E-01 0.14 1.472E+00 1.475E+00 0.83 4.750E+00 4.762E+00 0.79 1.696E+01 1.717E+01 1.15 4.642E+00 4.674E+00 0.60
1.494E-01 1.489E+00 4.732E+00 1.736E+01 4.687E+00
1.497E-01 1.465E+00 4.805E+00 1.719E+01 4.693E+00
2 NF 1.546E-01 - 1.282E+00 1.269E+00 0.88 4.549E+00 4.555E+00 0.13 9.978E+00 9.916E+00 0.60 4.583E+00 4.623E+00 0.82
NF 1.261E+00 4.558E+00 9.910E+00 4.628E+00
1.546E-01 1.264E+00 4.560E+00 9.859E+00 4.659E+00
3 NF 1.492E-01 - 1.195E+00 1.203E+00 1.10 4.565E+00 4.623E+00 2.48 7.906E+00 8.048E+00 3.05 4.725E+00 4.761E+00 1.78
NF 1.195E+00 4.549E+00 7.906E+00 4.701E+00
1.492E-01 1.218E+00 4.755E+00 8.331E+00 4.858E+00
4 NF 1.492E-01 0.52 1.154E+00 1.159E+00 0.41 4.430E+00 4.422E+00 0.61 6.394E+00 6.396E+00 0.93 4.718E+00 4.684E+00 1.19
1.497E-01 1.162E+00 4.444E+00 6.337E+00 4.714E+00
1.486E-01 1.162E+00 4.391E+00 6.457E+00 4.620E+00
5 NF 1.491E-01 0.08 1.141E+00 1.141E+00 0.06 4.415E+00 4.418E+00 0.21 5.959E+00 5.901E+00 1.40 4.626E+00 4.636E+00 0.45
1.492E-01 1.141E+00 4.410E+00 5.807E+00 4.660E+00
1.490E-01 1.142E+00 4.428E+00 5.938E+00 4.622E+00
6 1.553E-01 1.563E-01 0.84 1.133E+00 1.132E+00 0.22 4.350E+00 4.383E+00 1.09 5.770E+00 5.859E+00 1.52 4.611E+00 4.629E+00 0.89
1.572E-01 1.129E+00 4.360E+00 5.859E+00 4.600E+00
NF 1.133E+00 4.437E+00 5.947E+00 4.676E+00
7 NF 1.489E-01 - 1.128E+00 1.124E+00 0.32 4.373E+00 4.363E+00 0.18 5.263E+00 5.307E+00 1.86 4.722E+00 4.696E+00 0.72
NF 1.121E+00 4.360E+00 5.239E+00 4.657E+00
1.489E-01 1.124E+00 4.358E+00 5.421E+00 4.707E+00
8 1.487E-01 1.487E-01 - 1.113E+00 1.111E+00 0.39 4.305E+00 4.302E+00 0.10 5.012E+00 5.013E+00 0.87 4.724E+00 4.719E+00 1.32
NF 1.114E+00 4.297E+00 5.057E+00 4.654E+00
NF 1.106E+00 4.304E+00 4.969E+00 4.778E+00
9 NF 1.500E-01 1.13 1.207E+00 1.169E+00 2.77 5.494E+00 4.940E+00 9.72 9.235E+00 7.692E+00 17.39 6.001E+00 5.205E+00 13.25
1.512E-01 1.152E+00 4.642E+00 6.948E+00 4.816E+00
1.488E-01 1.149E+00 4.684E+00 6.891E+00 4.797E+00
10 1.487E-01 1.487E-01 - 1.120E+00 1.118E+00 0.11 4.430E+00 4.421E+00 0.83 5.296E+00 5.275E+00 1.21 4.723E+00 4.716E+00 1.30
NF 1.117E+00 4.381E+00 5.204E+00 4.651E+00
NF 1.118E+00 4.453E+00 5.326E+00 4.773E+00
11 NF - - 1.109E+00 1.111E+00 0.22 4.341E+00 4.318E+00 0.86 4.970E+00 4.963E+00 1.23 4.665E+00 4.654E+00 0.49
NF 1.114E+00 4.338E+00 5.020E+00 4.669E+00
NF 1.110E+00 4.275E+00 4.898E+00 4.628E+00
12 NF 1.513E-01 0.22 1.113E+00 1.107E+00 0.49 4.390E+00 4.357E+00 0.66 4.769E+00 4.744E+00 1.03 4.611E+00 4.675E+00 1.20
1.510E-01 1.106E+00 4.343E+00 4.688E+00 4.707E+00
1.515E-01 1.102E+00 4.337E+00 4.775E+00 4.708E+00

APPENDIX
69
Table A 8a: Measured concentrations (c), mean ( a d relative standard-deviation (RSD) of the first 5 eluting analytes 6-keto-PGF α, TXB2, PGF α, PGE2 and PGD2 from the sample pool of
“et p o es 7, 9, 10); concentration values were obtained via Thermo Xcalibur Quanbrowser software; to get the actual sample concentrations, and respective mean and standard-
deviation, these values were multiplied by 2 regarding the applied sample volume (40 µl) and internal standard volume (20 µl)
6-keto-PGF α TXB2 PGF α PGE2 PGD2
sampling c [ng/ml] [ng/ml] RSD [%] c [ng/ml] [ng/ml] RSD [%] c [ng/ml] [ng/ml] RSD [%] c [ng/ml] [ng/ml] RSD [%] c [ng/ml] [ng/ml] RSD [%]
1 3.199E-02 2.027E-02 51.01 2.464E-01 2.421E-01 1.54 3.760E-02 3.800E-02 9.01 3.036E-02 2.718E-02 11.46 2.320E-02 2.344E-02 2.98
1.635E-02 2.394E-01 4.160E-02 2.704E-02 2.289E-02
1.246E-02 2.406E-01 3.479E-02 2.413E-02 2.422E-02
2 1.583E-02 1.565E-02 6.69 1.155E-01 1.197E-01 3.50 3.320E-02 2.716E-02 19.31 2.249E-02 2.406E-02 15.17 2.301E-02 2.301E-02 -
1.452E-02 1.239E-01 2.456E-02 2.146E-02 NF
1.659E-02 1.199E-01 2.373E-02 2.823E-02 NF
3 1.303E-03 1.012E-02 77.37 1.024E-01 1.035E-01 0.97 1.817E-02 2.881E-02 34.56 2.208E-02 2.190E-02 3.57 2.402E-02 2.322E-02 3.00
1.626E-02 1.038E-01 3.037E-02 2.259E-02 2.288E-02
1.280E-02 1.043E-01 3.789E-02 2.105E-02 2.276E-02
4 6.294E-03 5.091E-03 28.31 5.696E-02 5.454E-02 7.10 2.646E-02 2.691E-02 36.76 2.221E-02 2.225E-02 5.10 NF - -
5.485E-03 5.007E-02 3.701E-02 2.113E-02 NF
3.493E-03 5.658E-02 1.725E-02 2.340E-02 NF
5 7.924E-03 1.298E-02 44.81 3.381E-02 3.229E-02 4.22 1.667E-02 2.304E-02 37.36 1.929E-02 1.969E-02 3.11 NF 2.278E-02 -
1.933E-02 3.118E-02 3.283E-02 2.039E-02 2.278E-02
1.167E-02 3.187E-02 1.962E-02 1.938E-02 NF
6 3.272E-03 2.984E-03 265.82 4.115E-02 3.800E-02 13.18 3.323E-02 2.912E-02 25.29 2.279E-02 2.033E-02 10.50 NF 2.278E-02 0.02
-5.089E-03 3.222E-02 2.062E-02 1.916E-02 2.278E-02
1.077E-02 4.062E-02 3.351E-02 1.903E-02 2.279E-02
7 1.282E-02 8.502E-03 84.97 3.720E-02 4.000E-02 9.43 2.463E-02 2.740E-02 18.97 2.207E-02 2.184E-02 3.61 2.289E-02 2.289E-02 -
1.252E-02 3.852E-02 2.418E-02 2.248E-02 NF
1.619E-04 4.429E-02 3.340E-02 2.096E-02 NF
8 9.468E-03 4.162E-03 180.26 9.672E-02 9.074E-02 9.32 2.086E-02 1.557E-02 48.06 2.391E-02 2.235E-02 9.87 NF - -
-1.143E-03 8.476E-02 1.028E-02 2.079E-02 NF
NF NF NF NF NF
9 4.213E-03 8.453E-03 45.86 5.034E-02 5.393E-02 8.93 4.323E-02 2.630E-02 58.27 2.233E-02 2.131E-02 5.68 NF - -
1.182E-02 5.941E-02 1.336E-02 1.997E-02 NF
9.330E-03 5.206E-02 2.232E-02 2.161E-02 NF
10 -4.278E-04 1.242E-03 374.25 2.883E-02 3.301E-02 13.36 1.850E-02 1.667E-02 72.78 1.503E-02 1.681E-02 11.55 NF 2.295E-02 -
-2.340E-03 3.257E-02 2.778E-02 1.888E-02 2.295E-02
6.493E-03 3.762E-02 3.725E-03 1.653E-02 NF
11 1.294E-02 4.693E-03 227.75 4.857E-02 4.745E-02 4.16 2.422E-02 3.114E-02 38.89 2.038E-02 1.904E-02 6.84 NF 2.282E-02 -
-7.382E-03 4.862E-02 4.513E-02 1.898E-02 NF
8.520E-03 4.517E-02 2.408E-02 1.777E-02 2.282E-02
12 -4.309E-03 1.001E-03 511.72 2.957E-02 3.214E-02 7.77 1.948E-02 2.780E-02 35.28 2.148E-02 1.978E-02 8.86 2.272E-02 2.284E-02 0.76
1.402E-03 3.229E-02 2.531E-02 1.798E-02 NF
5.908E-03 3.456E-02 3.862E-02 1.989E-02 2.296E-02

APPENDIX
70
Table A 8b: Measu ed o e t atio s , ea a d relative standard-deviation (RSD) of the last 5 eluting analytes LTB4, 12-HEPE, 15-HETE, 12-HETE and 5-HETE from the sample pool
of “et p o es 7, 9, 10); concentration values were obtained via Thermo Xcalibur Quanbrowser software; to get the actual sample concentrations, and respective mean and
standard-deviation, these values were multiplied by 2 regarding the applied sample volume (40 µl) and internal standard volume (20 µl)
LTB4 12-HEPE
15-HETE
12-HETE
5-HETE
sampling c [ng/ml] [ng/ml] RSD [%] c [ng/ml] [ng/ml] RSD [%] c [ng/ml] [ng/ml] RSD [%] c [ng/ml] [ng/ml] RSD [%] c [ng/ml] [ng/ml] RSD [%]
1 1.649E-01 1.602E-01 2.53 1.139E+00 1.140E+00 0.15 5.315E+00 5.314E+00 0.35 6.654E+00 6.722E+00 1.84 4.731E+00 4.753E+00 0.95
1.577E-01 1.142E+00 5.295E+00 6.647E+00 4.723E+00
1.579E-01 1.140E+00 5.332E+00 6.864E+00 4.805E+00
2 NF 1.517E-01 0.51 1.091E+00 1.093E+00 0.24 4.543E+00 4.603E+00 1.14 4.827E+00 4.980E+00 2.92 4.726E+00 4.778E+00 2.49
1.511E-01 1.096E+00 4.640E+00 5.116E+00 4.914E+00
1.522E-01 1.092E+00 4.626E+00 4.997E+00 4.693E+00
3 1.494E-01 1.507E-01 1.63 1.101E+00 1.098E+00 0.38 4.762E+00 4.718E+00 1.13 5.140E+00 5.133E+00 0.97 4.803E+00 4.751E+00 1.01
1.491E-01 1.094E+00 4.734E+00 5.178E+00 4.708E+00
1.535E-01 1.100E+00 4.659E+00 5.080E+00 4.742E+00
4 NF 1.490E-01 - 1.089E+00 1.087E+00 0.12 4.430E+00 4.366E+00 1.27 4.530E+00 4.522E+00 0.65 4.716E+00 4.652E+00 1.23
NF 1.086E+00 4.332E+00 4.547E+00 4.607E+00
1.490E-01 1.087E+00 4.335E+00 4.490E+00 4.632E+00
5 1.488E-01 1.500E-01 1.34 1.087E+00 1.090E+00 0.23 4.215E+00 4.257E+00 1.08 4.309E+00 4.332E+00 0.56 4.530E+00 4.613E+00 1.56
1.524E-01 1.092E+00 4.306E+00 4.330E+00 4.654E+00
1.490E-01 1.091E+00 4.249E+00 4.357E+00 4.655E+00
6 1.499E-01 1.495E-01 0.31 1.085E+00 1.086E+00 0.07 4.242E+00 4.214E+00 0.61 4.354E+00 4.316E+00 1.33 4.729E+00 4.682E+00 1.43
NF 1.086E+00 4.207E+00 4.250E+00 4.605E+00
1.492E-01 1.086E+00 4.192E+00 4.346E+00 4.710E+00
7 NF - - 1.090E+00 1.089E+00 0.11 4.275E+00 4.335E+00 2.23 4.390E+00 4.445E+00 3.73 4.780E+00 4.878E+00 3.70
NF 1.091E+00 4.283E+00 4.314E+00 4.768E+00
NF 1.088E+00 4.447E+00 4.632E+00 5.087E+00
8 1.489E-01 1.494E-01 0.51 1.092E+00 1.088E+00 0.45 4.287E+00 4.272E+00 0.49 5.132E+00 5.062E+00 1.96 4.852E+00 4.771E+00 2.39
1.500E-01 1.085E+00 4.257E+00 4.992E+00 4.690E+00
NF NF NF NF NF
9 NF 1.586E-01 - 1.090E+00 1.090E+00 0.04 4.187E+00 4.203E+00 0.43 4.650E+00 4.669E+00 0.70 4.657E+00 4.676E+00 0.81
1.586E-01 1.090E+00 4.198E+00 4.707E+00 4.720E+00
NF 1.089E+00 4.223E+00 4.651E+00 4.652E+00
10 NF 1.489E-01 - 1.086E+00 1.087E+00 0.07 4.146E+00 4.165E+00 1.09 4.338E+00 4.361E+00 0.48 4.736E+00 4.699E+00 1.71
1.489E-01 1.088E+00 4.132E+00 4.366E+00 4.607E+00
NF 1.087E+00 4.216E+00 4.379E+00 4.754E+00
11 1.527E-01 1.541E-01 0.78 1.089E+00 1.087E+00 0.19 4.181E+00 4.184E+00 0.24 4.238E+00 4.243E+00 0.69 4.801E+00 4.770E+00 2.45
1.548E-01 1.085E+00 4.195E+00 4.274E+00 4.869E+00
1.548E-01 1.087E+00 4.176E+00 4.216E+00 4.641E+00
12 NF - - 1.084E+00 1.084E+00 0.03 4.168E+00 4.152E+00 0.46 4.168E+00 4.169E+00 0.46 4.722E+00 4.701E+00 0.55
NF 1.084E+00 4.131E+00 4.150E+00 4.672E+00
NF NF 4.157E+00 4.188E+00 4.708E+00

APPENDIX
71
Table A 9: Hemolytic impact on one sample pool has been divided into 2 aliquots; pool 1 was extracted directly (n=3),
pool 2 was centrifuged and then extracted (n=3)
direct
[pg/ml]
RSD
direct
[%]
centrifuged
[pg/ml]
RSD
centrifuged
[%]
difference
[pg/ml]
RSD
difference
[%]
6-keto-PGF α 1.126E+01 3.5 1.054E+01 37.3 7.141E-01 6.3
TXB2 9.379E+02 1.4 9.466E+02 1.3 -8.697E+00 -0.9
PGF α 2.926E+01 29.3 3.015E+01 18.1 -8.918E-01 -3.0
PGE2 4.497E+01 9.7 4.572E+01 8.6 -7.434E-01 -1.7
PGD2 2.076E+01 3.2 2.139E+01 7.0 -6.265E-01 -3.0
LTB4 - - - - - -
12-HEPE 6.248E+02 1.0 6.237E+02 1.0 1.088E+00 0.2
15-HETE 3.134E+03 1.0 3.106E+03 0.6 2.772E+01 0.9
12-HETE 1.156E+04 2.0 1.160E+04 1.6 -3.582E+01 -0.3
5-HETE 2.703E+03 1.9 2.631E+03 1.0 7.277E+01 2.7
Table A 10: Recovery of analytes after SPE; for calculation see Table A 16
areaIS ex areaIS dir recovery [%] [%] RSD [%]
1186731 1185729 100.1
103.2
4.5
6-keto- PGF α-d4 1187325 1173136 101.2
1229002 1134249 108.4
2189550 2629386 83.3
85.1
2.4
TXB2-d4 2153968 2553766 84.3
2204939 2511808 87.8
643011 758958 84.7
87.1
3.8
PGF α -d4 618486 726650 85.1
656883 717432 91.6
1242305 1440285 86.3
88.9
4.8
PGE2-d4 1221551 1420936 86.0
1319313 1397861 94.4
297594 475708 62.6
71.6
8.9
PGD2-d4 328190 456218 71.9
353953 440185 80.4
547038 1480735 36.9
37.7
1.5
LTB4-d4 532347 1451755 36.7
546043 1385368 39.4
443230 1525413 29.1
30.2
1.5
15(S)-HETE-d8 441297 1482704 29.8
459678 1441084 31.9
362817 1030770 35.2
36.7
2.1
12(S)-HETE-d8 367530 1028830 35.7
381980 976686 39.1
445259 1242589 35.8
37.6
2.8
5(S)-HETE-d8 439049 1216488 36.1
468121 1146777 40.8

APPENDIX
72
Table A 11: Accuracy data and results; obtained at 10 ng/ml actual concentration; for calculation see Table A 16
Table A 12a: Inter -day precision data and results obtained at 1 ng/ml actual concentration; standard deviation
resembles the method-precision; for calculation see Table A 16
Table A 12b: Inter-day precision data and results obtained at 10 ng/ml actual concentration; standard deviation
resembles the method-precision; for calculation see Table A 16
6k-PGF α TXB2 PGF α PGE2 PGD2 LTB4 12-HEPE 15-HETE 12-HETE 5-HETE
measured
conc.
[ng/ml]
9.79 9.78 10.16 10.18 9.83 10.21 6.37 12.39 12.63 13.14
10.30 10.35 10.49 9.85 9.66 10.08 6.19 12.09 13.00 12.26
10.22 10.27 10.37 10.11 9.86 9.94 6.15 12.05 12.75 12.20
9.83 10.02 10.02 10.13 9.96 9.67 6.39 12.15 12.81 12.59
accuracy
[%] 100.4 101.0 102.6 100.7 98.3 99.7 62.8 121.7 128.0 125.5
RSD
[%] 2.6 2.6 2.1 1.5 1.2 2.3 1.2 1.5 1.5 4.3
6k-PGF α TXB2 PGF α PGE2 PGD2 LTB4 12-HEPE 15-HETE 12-HETE 5-HETE
measured
conc. day 1
[ng/ml]
1.03 0.99 1.01 0.99 0.77 1.05 1.56 4.74 4.83 4.65
1.02 1.00 1.02 0.97 0.79 1.08 1.55 4.74 4.88 4.64
1.02 0.96 1.03 0.97 0.80 1.06 1.76 4.75 4.76 4.65
measured
conc. day 2
[ng/ml]
1.00 0.95 0.95 0.95 0.44 1.08 1.26 5.19 5.38 5.10
1.03 0.96 0.98 0.92 0.45 1.10 1.28 5.28 5.52 5.20
0.99 0.92 0.97 0.88 0.43 1.00 1.19 5.08 5.21 4.91
[ng/ml]
1.01 0.96 0.99 0.95 0.61 1.06 1.43 4.96 5.10 4.86
RSD
[%] 1.5 3.1 3.3 4.3 30.8 3.1 15.5 5.0 6.2 5.1
6k-PGF α TXB2 PGF α PGE2 PGD2 LTB4 12-HEPE 15-HETE 12-HETE 5-HETE
measured
conc. day 1
[ng/ml]
10.61 9.72 10.65 9.86 8.32 10.21 5.51 12.84 14.48 13.11
10.21 9.73 10.41 9.87 8.61 10.39 5.71 12.47 15.13 13.09
10.51 9.84 10.53 9.95 8.52 10.91 6.13 13.32 15.55 13.99
measured
conc. day 2
[ng/ml]
10.58 10.04 10.33 10.29 7.62 11.08 6.52 14.54 16.42 14.95
10.88 9.91 10.46 10.20 7.40 10.80 6.34 14.52 15.83 14.54
10.45 9.57 10.16 10.26 7.41 10.71 6.15 14.24 16.11 14.55
[ng/ml]
10.54 9.80 10.42 10.07 7.98 10.68 6.06 13.65 15.59 14.04
RSD
[%] 2.1 1.7 1.6 2.0 7.1 3.1 6.3 6.6 4.5 5.6

APPENDIX
73
Table A 13: Limit of detection and limit of
quantification of the developed analytical
method; for calculation see Table A 16
Table A 15: Raw data of SPE extracted calibration solutions with respective concentration levels
Table A 14: Linear equations of calibration curves with weighing
factor 1/x including coefficient of determination; obtained by
Xcalibur analysis software
LOD
[pg/ml]
LOQ
[pg/ml]
6-keto-PGF α 4.4 13
TXB2 4.4 13
PGF α 6.3 19
PGE2 4.4 13
PGD2 6.3 19
LTB4 217 650
12-HEPE 35.2 106
15-HETE 491 1484
12-HETE 491 1484
5-HETE 491 1484
analyte
linear equation
6-keto-PGF α Y = 0.00746682+0.178438*X R^2 = 0.9996
TXB2 Y = -0.000859495+0.11226*X R^2 = 0.9999
PGF α Y = 0.00455703+0.170042*X R^2 = 0.9994
PGE2 Y = -0.00133101+0.10717*X R^2 = 0.9996
PGD2 Y = -0.00290348+0.132503*X R^2 = 0.9996
LTB4 Y = -0.0264739+0.179697*X R^2 = 0.9954
12-HEPE Y = -0.322654+0.298295*X R^2 = 0.9789
15-HETE Y = -0.368779+0.10844*X R^2 = 0.9863
12-HETE Y = -0.483272+0.14636*X R^2 = 0.9876
5-HETE Y = -0.373168+0.128995*X R^2 = 0.9616
cal. level
[ng/ml]
area ratio analyte/internal standard [ ]
6-keto-PGF α TXB2 PGF α PGE2 PGD2 LTB4 12-HEPE 15-HETE 12-HETE 5-HETE
0.01 9.548E-03 4.840E-04 6.757E-03 3.218E-04 - - - - - -
0.02 1.076E-02 1.446E-03 - 6.660E-04 7.253E-04 - - - - -
0.05 1.403E-02 4.502E-03 1.305E-02 3.930E-03 3.176E-03 - - - - -
0.1 2.440E-02 8.784E-03 2.141E-02 7.871E-03 9.025E-03 1.013E-02 - - - -
0.50 1.009E-01 5.594E-02 8.676E-02 4.730E-02 6.296E-02 5.401E-02 - - - -
0.75 1.526E-01 8.585E-02 1.271E-01 7.504E-02 9.304E-02 8.105E-02 2.506E-02 - - -
1 1.881E-01 1.048E-01 1.612E-01 9.885E-02 1.216E-01 9.482E-02 9.619E-02 - - -
5 9.461E-01 5.540E-01 8.134E-01 5.064E-01 6.271E-01 7.630E-01 9.225E-01 2.188E-01 3.859E-01 4.536E-01
7.5 1.383E+00 8.346E-01 1.261E+00 7.853E-01 9.783E-01 1.069E+00 1.083E+00 4.051E-01 5.689E-01 5.789E-01
10 1.825E+00 1.116E+00 1.626E+00 1.042E+00 1.258E+00 1.539E+00 1.608E+00 6.298E-01 7.479E-01 6.934E-01
25 4.352E+00 2.807E+00 4.043E+00 2.592E+00 3.302E+00 4.237E+00 5.220E+00 2.310E+00 2.939E+00 2.661E+00
50 9.189E+00 5.666E+00 8.627E+00 5.474E+00 6.809E+00 9.659E+00 1.588E+01 5.877E+00 7.910E+00 6.063E+00
75 1.322E+01 8.283E+00 1.270E+01 7.988E+00 1.001E+01 1.315E+01 2.360E+01 6.771E+00 9.534E+00 7.295E+00
100 1.775E+01 1.133E+01 1.732E+01 1.082E+01 1.312E+01 1.844E+01 3.047E+01 1.076E+01 1.442E+01 1.479E+01
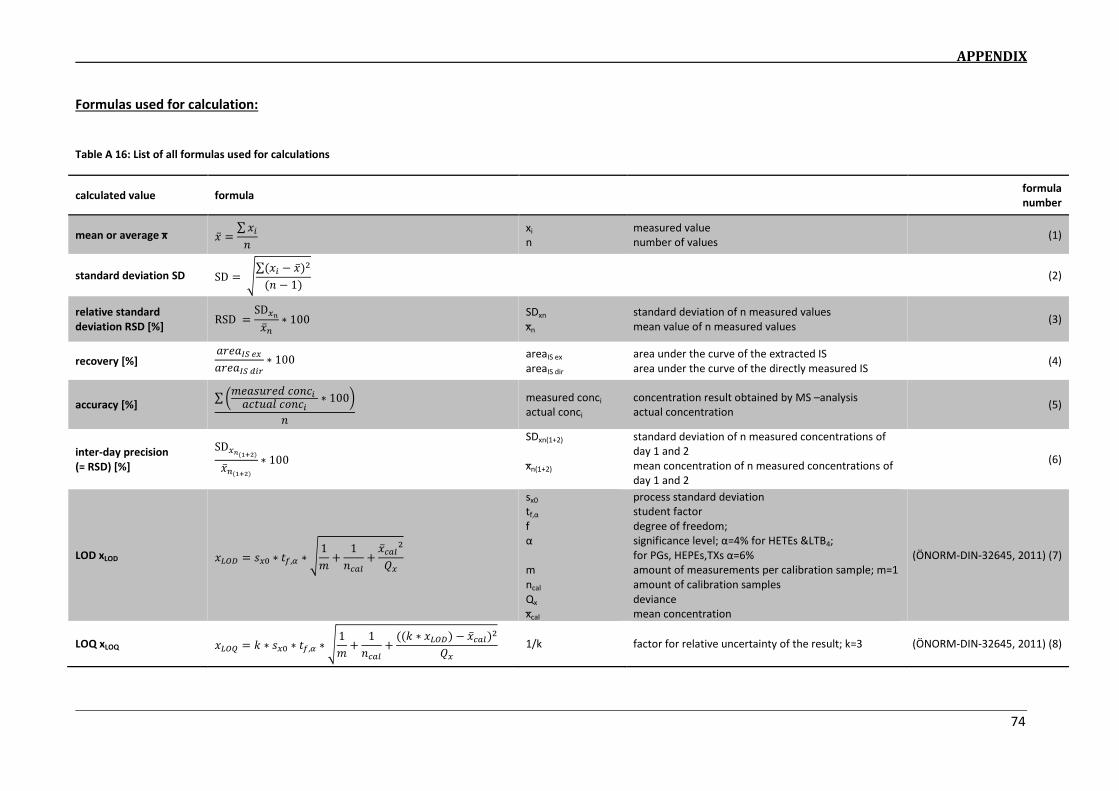
APPENDIX
74
Formulas used for calculation:
Table A 16: List of all formulas used for calculations
calculated value formula formula
number
ea o a e age = ∑
xi
n
measured value
number of values (1)
standard deviation SD SD = √∑ − 2−
(2)
relative standard
deviation RSD [%] RSD = SD ∗
SDxn
n
standard deviation of n measured values
mean value of n measured values (3)
recovery [%] ∗
areaIS ex
areaIS dir
area under the curve of the extracted IS
area under the curve of the directly measured IS (4)
accuracy [%] ∑ ( ∗ )
measured conci
actual conci
concentration result obtained by MS –analysis
actual concentration (5)
inter-day precision
(= RSD) [%]
SD + + ∗
SDxn(1+2)
n(1+2)
standard deviation of n measured concentrations of
day 1 and 2
mean concentration of n measured concentrations of
day 1 and 2
(6)
LOD xLOD = 0 ∗ , ∗ √ + + 2
sx0
tf,α
f
α
m
ncal
Qx
cal
process standard deviation
student factor
degree of freedom;
significance level; α= % fo HETEs <B4;
fo PGs, HEPEs,TXs α=6%
amount of measurements per calibration sample; m=1
amount of calibration samples
deviance
mean concentration
(ÖNORM-DIN-32645, 2011) (7)
LOQ xLOQ = ∗ 0 ∗ , ∗ √ + + ∗ − 2 1/k factor for relative uncertainty of the result; k=3 (ÖNORM-DIN-32645, 2011) (8)

APPENDIX
75
Figure A 1: Mass spectrum of 6-keto-PGF α in a 5 ng/ml analyte solution; obtained via targeted MS² in negative mode on
a Q E a ti e™ M“
Figure A 2: Mass spectrum of spectrum of TXB2 in a 5 ng/ml analyte solution; obtained via targeted MS² in negative
mode on a Q E a ti e™ M“

APPENDIX
76
Figure A 3: Mass spectrum of PGF α in a 5 ng/ml analyte solution; obtained via targeted MS² in negative mode on a
Q E a ti e™ M“
Figure A 4: Mass spectrum of PGE2 in a 5 ng/ml analyte solution; obtained via targeted MS² in negative mode on a
Q E a ti e™ M“

APPENDIX
77
Figure A 5: Mass spectrum of PGD2 in a 5 ng/ml analyte solution; obtained via targeted MS² in negative mode on a
Q E a ti e™ M“
Figure A 6: Mass spectrum of LTB4 in a 5 ng/ml analyte solution; obtained via targeted MS² in negative mode on a
Q E a ti e™ M“
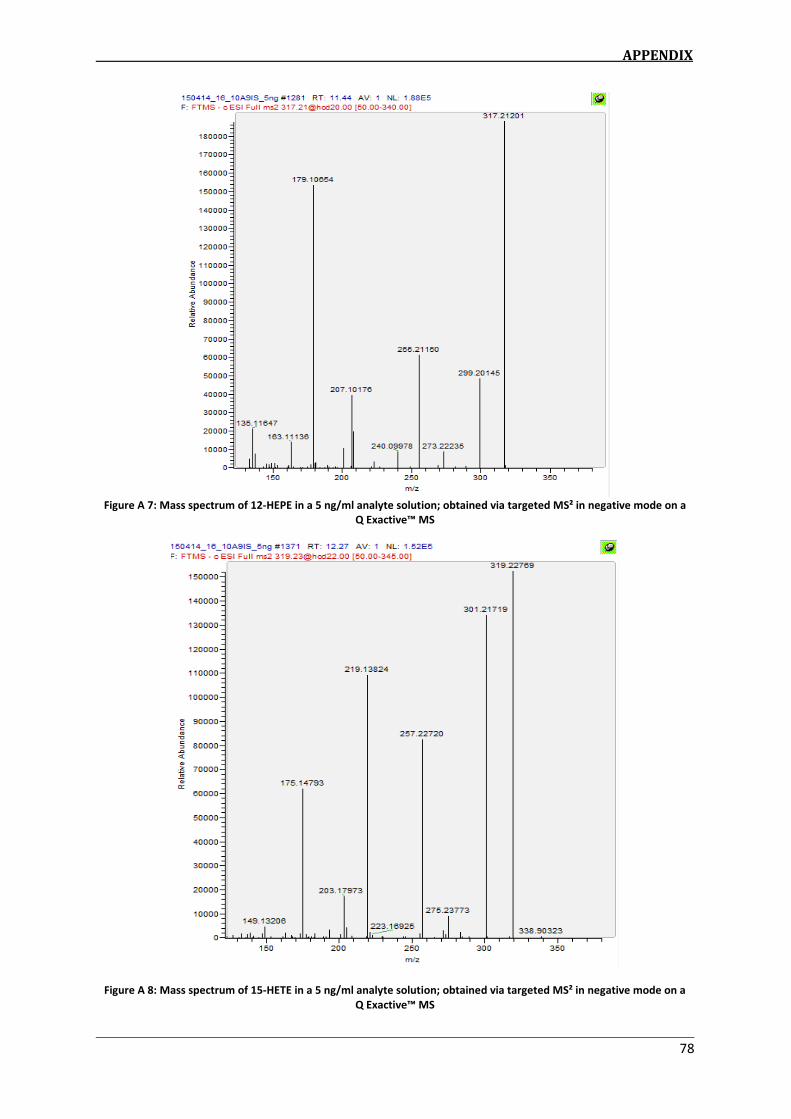
APPENDIX
78
Figure A 7: Mass spectrum of 12-HEPE in a 5 ng/ml analyte solution; obtained via targeted MS² in negative mode on a
Q E a ti e™ M“
Figure A 8: Mass spectrum of 15-HETE in a 5 ng/ml analyte solution; obtained via targeted MS² in negative mode on a
Q E a ti e™ M“

APPENDIX
79
Figure A 9: Mass spectrum of 12-HETE in a 5 ng/ml analyte solution; obtained via targeted MS² in negative mode on a
Q E a ti e™ M“
Figure A 10: Mass spectrum of 5-HETE in a 5 ng/ml analyte solution; obtained via targeted MS² in negative mode on a
Q E a ti e™ M“
Related Documents


