Early View Original article Patterns of systemic and local inflammation in patients with asthma hospitalised with influenza Akhilesh Jha, Jake Dunning, Tanushree Tunstall, Ryan S. Thwaites, Long T. Hoang, Onn Min Kon, Maria C. Zambon, Trevor T. Hansel, Peter J. Openshaw Please cite this article as: Jha A, Dunning J, Tunstall T, et al. Patterns of systemic and local inflammation in patients with asthma hospitalised with influenza. Eur Respir J 2019; in press (https://doi.org/10.1183/13993003.00949-2019). This manuscript has recently been accepted for publication in the European Respiratory Journal . It is published here in its accepted form prior to copyediting and typesetting by our production team. After these production processes are complete and the authors have approved the resulting proofs, the article will move to the latest issue of the ERJ online. Copyright ©ERS 2019

Welcome message from author
This document is posted to help you gain knowledge. Please leave a comment to let me know what you think about it! Share it to your friends and learn new things together.
Transcript
Early View
Original article
Patterns of systemic and local inflammation in
patients with asthma hospitalised with influenza
Akhilesh Jha, Jake Dunning, Tanushree Tunstall, Ryan S. Thwaites, Long T. Hoang, Onn Min Kon,
Maria C. Zambon, Trevor T. Hansel, Peter J. Openshaw
Please cite this article as: Jha A, Dunning J, Tunstall T, et al. Patterns of systemic and local
inflammation in patients with asthma hospitalised with influenza. Eur Respir J 2019; in press
(https://doi.org/10.1183/13993003.00949-2019).
This manuscript has recently been accepted for publication in the European Respiratory Journal. It is
published here in its accepted form prior to copyediting and typesetting by our production team. After
these production processes are complete and the authors have approved the resulting proofs, the article
will move to the latest issue of the ERJ online.
Copyright ©ERS 2019
Patterns of systemic and local inflammation in patients with asthma
hospitalised with influenza
Akhilesh Jha PhD1,2, Jake Dunning PhD1,3, Tanushree Tunstall MSc1, Ryan S.
Thwaites PhD1, Long T. Hoang PhD1, The MOSAIC Investigators4, Onn Min Kon
MD1, Maria C. Zambon FMedSci3, Trevor T. Hansel FRCPath1, Peter J. Openshaw
FMedSci*1
1National Heart and Lung Institute, Imperial College London, St. Mary’s Campus,
London, United Kingdom, W2 1PG; 2Department of Medicine, University of
Cambridge, Cambridge, United Kingdom, CB2 0QQ, 3Public Health England
(formerly Health Protection Agency), 61 Colindale Avenue, London NW9 5HT, UK.
4See acknowledgments for MOSAIC consortium details.
*Correspondence and requests for materials should be addressed to Peter J
Openshaw FRCP PhD FRSB FMedSci, National Heart & Lung Institute, Imperial
College London (St. Mary's Campus), Norfolk Place, Paddington, London W2 1PG,
UK, +44 (0)20 7594 3854, [email protected].
Take Home Message
Patients with asthma hospitalised with influenza are commonly female and lack
classical type 2 nasal mucosal inflammation. Compared to others hospitalised with
influenza, they have a good prognosis with enhanced type 1 interferon production
and reduced systemic inflammation.

Abstract
Background
Patients with asthma are at risk of hospitalisation with influenza, but the reasons for
this predisposition are unknown.
Study setting
A prospective observational study of adults with PCR-confirmed influenza in 11 UK
hospitals, measuring nasal, nasopharyngeal and systemic immune mediators and
whole-blood gene expression.
Results
Of 133 admissions, 40 (30%) had previous asthma; these were more often female
(70% vs 38.7%, OR 3.69, 95% CI 1.67 to 8.18, P = 0.0012), required less
mechanical ventilation (15% vs 37.6%, χ2 6.78, P=0.0338) and had shorter hospital
stays (mean 8.3 vs 15.3 d, P=0.0333) than those without. In patients without asthma,
severe outcomes were more frequent in those given corticosteroids (OR=2.63, 95%
CI=1.02-6.96, P=0.0466) or presenting >4 days after disease onset (OR 5.49, 95%
CI 2.28–14.03, P=0.0002). Influenza vaccination in at-risk groups (including asthma)
were lower than intended by national policy and the early use of antiviral medications
were less than optimal. Mucosal immune responses were equivalent between
groups. Those with asthma had higher serum IFN-α but lower serum TNF, IL-5, IL-6,
CXCL8, CXCL9, IL-10, IL-17 and CCL2 levels (all P<0.05); both groups had similar
serum IL-13, total IgE, periostin and blood eosinophil gene expression levels.
Asthma diagnosis was unrelated to viral load, IFN-α, IFN-γ, IL-5 or IL-13 levels.

Conclusions
Asthma is common in those hospitalised with influenza, but may not represent
classical Type 2-driven disease. Those admitted with influenza tend to be female
with mild serum inflammatory responses, increased serum IFN-α levels and good
clinical outcomes.
Keywords: Influenza; asthma; pathogenesis; mucosal immunity; viral lung disease
Abbreviations
AHR Airway Hyperreactivity
COPD Chronic Obstructive Pulmonary Disease
CPAP Continuous Positive Airways Pressure
DOI Day of Illness
ECMO Extracorporeal Membrane Oxygenation
ILCs Innate Lymphoid Cells
MOSAIC Mechanisms of Severe Acute Influenza Consortium
NPA Nasopharyngeal Aspirates
TSLP Thymic Stromal Lymphopoietin

Introduction
Influenza viruses cause a continuous threat to global health, mutating and spreading
in both human and animal populations. The Influenza Clinical Information Network
(FLU-CIN) reported that asthma was the commonest pre-existing risk factor for
hospitalization, being present in 25.3% of 1,520 patients admitted with influenza A
infection[1]. This apparent increased risk is reported in other studies which
paradoxically also show that individuals with asthma experience less severe
outcomes and are discharged earlier from hospital than those without asthma[2, 3].
There have been many studies of immune responses to influenza infection[4, 5], but
none has focussed on characterizing the effect of asthma in the host responses to
natural influenza.
The Mechanisms of Severe Acute Influenza Consortium (MOSAIC) recruited patients
with clinical influenza presenting to hospitals in London and Liverpool (UK) during
the winters of 2009/10 and 2010/11, periods of intense influenza activity. We
previously reported enrichment for a host genetic variant of the interferon-inducible
transmembrane protein 3 (IFITM3) allele SNP rs12252-C in hospitalized patients[6]
and that circulating influenza viruses evolved and change in character over time[7]
and the progression of whole-blood transcriptional signatures and mediator levels
from interferon-induced to neutrophil-associated patterns in severe disease[8], but
have not yet described the clinical details of the study population.
We now provide detailed clinicopathological analysis of the MOSAIC cohort,
segregating patients with and without asthma and confirmed influenza and focusing
on measures of nasal mucosal and systemic inflammation as potential causes of
enhanced disease. Some of the results of this study have been previously reported
in the form of an abstract[9].
Methods
Study design and cohort
Adult patients presenting with influenza-like symptoms were recruited between
December 2009 to March 2011 from 3 hospitals in Liverpool and the Wirral
(Northwest England) and 6 hospitals in London. A detailed medical history, including
the presence of a diagnosis of asthma, along with a record of prescribed medications
on admission was obtained from case notes by specialized data collectors based on
Department of Health guidelines and continued for the first 14 days of admission[10].
Three patients who were coded as having both asthma and COPD were allocated to
the non-asthma group in order to avoid potential confounding (one patient had
radiological evidence of emphysema; the second patient had clinical COPD and
bronchiectasis secondary to crack-cocaine use and the third patient was clinically
coded as having an exacerbation of COPD rather than asthma). The severity of
respiratory illness was graded from 1-3 as previously described[8]. In addition, a
panel of 36 healthy volunteers (with characteristics described elsewhere[8]) free of
comorbidities or influenza-like symptoms were recruited to the study and nasal and
blood samples were obtained at a single time point.
Sample Collection
Nasopharyngeal aspirates (NPA) and flocked nasopharyngeal swabs were taken as
soon as possible, generally within 72 hours of admission. Influenza virus infection
status was assigned on the basis of results of influenza A/B RT-PCRs performed by
laboratories serving the respective hospitals, with confirmation of these results by

RT-PCR for influenza A, H1N1/2009 and influenza B at the West of Scotland
Specialist Virology Centre. Antibody responses to A/Engl/195/2009(H1N1v) were
detected by use of microneutralization assays according to standard methods as
previously described[11] at the Centre for Infections, Health Protection Agency
(London, UK). Serum samples were tested at an initial dilution of 1:10 and a final
dilution of 1:5120.
All other samples were collected within 24 hours of admission to the hospital. Blood
collection and NPA sampling was performed as previously described[8].
Nasosorption was used to sample mucosal lining fluid from the nose as detailed
previously[12]. Additionally, whole blood was collected for microarray RNA profiling
(Tempus blood RNA tube, Applied Biosystems/Ambion). Research samples were
collected within 24 hours of admission and, where possible, at 48 hours and in
convalescence (at least 4 weeks after presentation).
Sample Processing
Samples were processed using the ultrasensitive Meso Scale Discovery (MSD)
platform (Meso Scale Discovery, Gaithersburg, USA), based on electro-
chemiluminescence quantitative patterned arrays to detect 28 cytokines and
chemokines: IFN-α2α, IFN-β, IFN-γ, IL-29, TNF-α, GMCSF, IL-1β, IL-2, IL-4, IL-5, IL-
6, IL-10, IL-12p70, IL-13, IL-15, IL-17, CCL2, CCL3, CCL4, CCL11, CCL13, CCL17,
CCL22, CCL26, CXCL8, CXCL9, CXCL10 and CXCL11. Microarray gene expression
profiling was performed using HT12 V4 BeadChip arrays (Illumina), containing
>47,000 probes. Detailed methodology is available elsewhere[8].
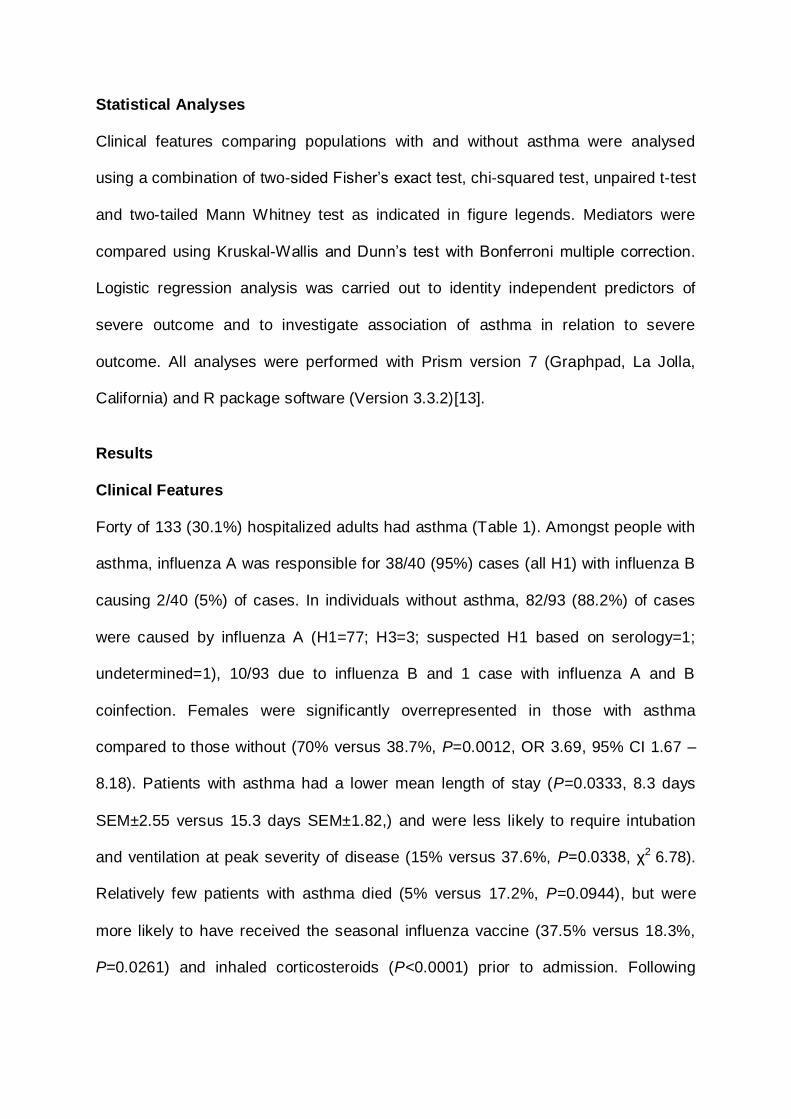
Statistical Analyses
Clinical features comparing populations with and without asthma were analysed
using a combination of two-sided Fisher’s exact test, chi-squared test, unpaired t-test
and two-tailed Mann Whitney test as indicated in figure legends. Mediators were
compared using Kruskal-Wallis and Dunn’s test with Bonferroni multiple correction.
Logistic regression analysis was carried out to identity independent predictors of
severe outcome and to investigate association of asthma in relation to severe
outcome. All analyses were performed with Prism version 7 (Graphpad, La Jolla,
California) and R package software (Version 3.3.2)[13].
Results
Clinical Features
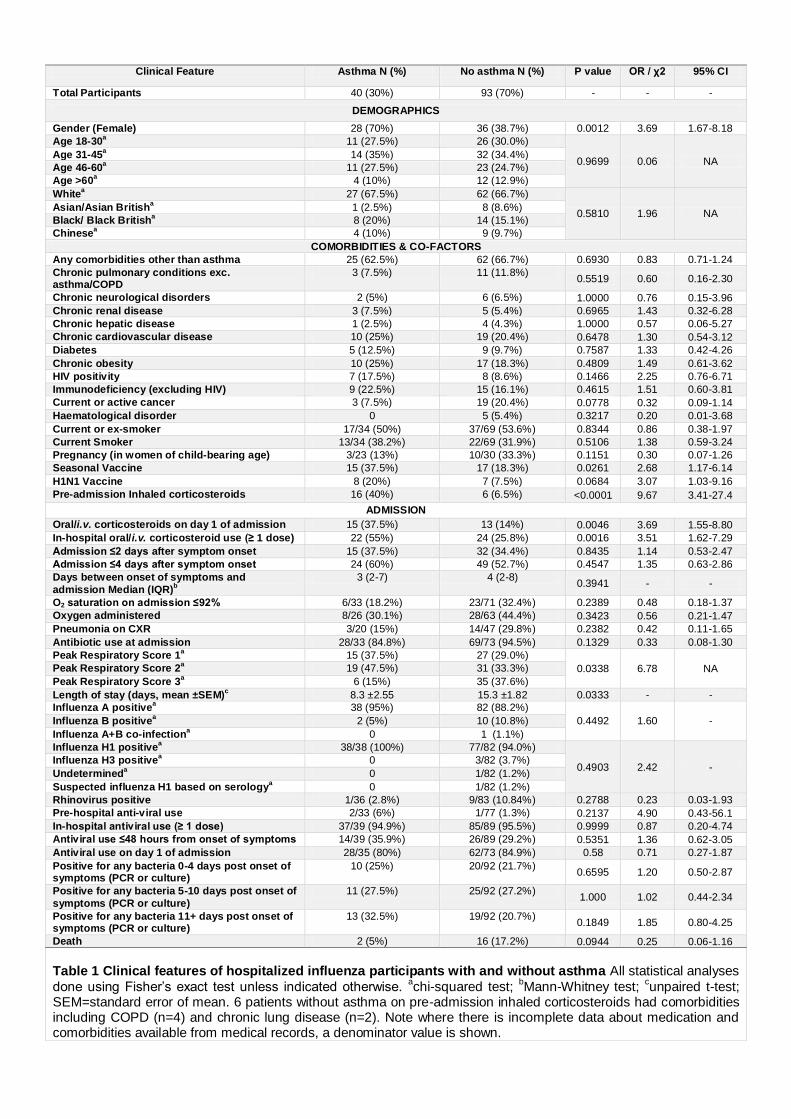
Forty of 133 (30.1%) hospitalized adults had asthma (Table 1). Amongst people with
asthma, influenza A was responsible for 38/40 (95%) cases (all H1) with influenza B
causing 2/40 (5%) of cases. In individuals without asthma, 82/93 (88.2%) of cases
were caused by influenza A (H1=77; H3=3; suspected H1 based on serology=1;
undetermined=1), 10/93 due to influenza B and 1 case with influenza A and B
coinfection. Females were significantly overrepresented in those with asthma
compared to those without (70% versus 38.7%, P=0.0012, OR 3.69, 95% CI 1.67 –
8.18). Patients with asthma had a lower mean length of stay (P=0.0333, 8.3 days
SEM±2.55 versus 15.3 days SEM±1.82,) and were less likely to require intubation
and ventilation at peak severity of disease (15% versus 37.6%, P=0.0338, χ2 6.78).
Relatively few patients with asthma died (5% versus 17.2%, P=0.0944), but were
more likely to have received the seasonal influenza vaccine (37.5% versus 18.3%,
P=0.0261) and inhaled corticosteroids (P<0.0001) prior to admission. Following

admission, people with asthma were more likely to have received at least one dose
of oral or i.v. corticosteroids during their inpatient stay (55% vs 25.8%, P=0.0016).
To determine predictors of a severe outcome (invasive ventilation or death), multiple
regression modelling identified presentation to hospital >4 days after symptom onset
and administration of in-hospital systemic steroids as factors associated with a worse
outcome (Table E1). When patients with and without a severe outcome were
assessed separately, presentation to hospital >4 days after symptom onset
(P=0.0002, OR 5.49, 95% CI 2.28 – 14.03) and administration of in-hospital systemic
corticosteroids (P=0.0466, OR = 2.6250, 95% CI = 1.02 –6.96) remained associated
with a severe outcome in people without asthma, but not in those with asthma (data
not shown). There was no significant difference between individuals with and without
asthma in nasopharyngeal influenza viral load within 24 hours of admission and
kinetics based on day of sampling after self-reported onset of influenza-symptoms
(Fig. 1a). There was also no difference in H1N1 geometric mean titres as measured
by microneutralization assay (Fig. 1b).
Systemic and Mucosal Immune Response
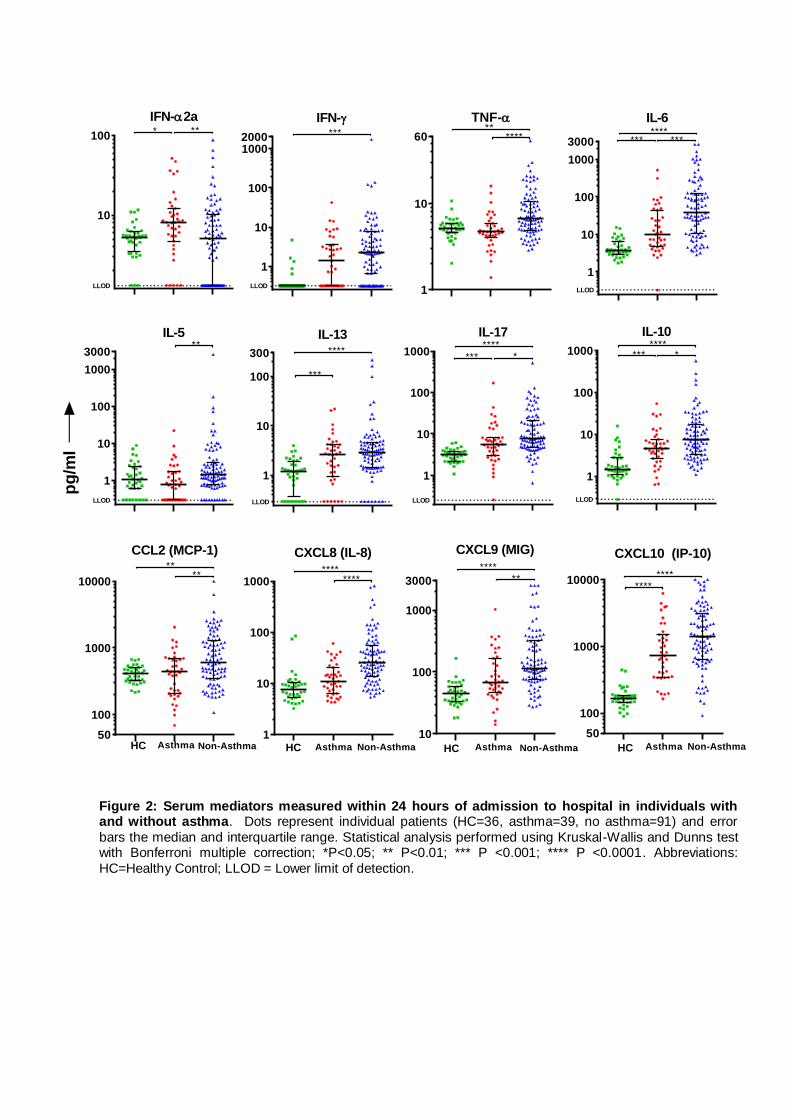
All hospitalized patients with influenza had equivalent or greater systemic and
mucosal inflammation relative to non-hospitalized healthy controls (Fig. 2 and 3, Fig
E1 and Tables E2-E4). During the first 24 hours of hospital admission, people with
asthma had reduced systemic inflammation compared to those without as
demonstrated by significantly lower serum levels of TNF-α (P<0.0001), IL-6
(P=0.0005), CXCL8 (P<0.0001), CXCL9 (P=0.0031), IL-10 (P=0.0411), IL-17
(P=0.0197) and CCL2 (P=0.0038); However, individuals with asthma had

significantly higher levels of serum IFN-α2a (P=0.0099; Fig. 1 and Table E2).
Interestingly, those with asthma had lower levels of serum IL-5 (P=0.0010) but
comparable levels of IL-13 (P=0.3131). There were no significant differences in white
blood cell count, neutrophils, lymphocytes or CRP between groups (figure E1).
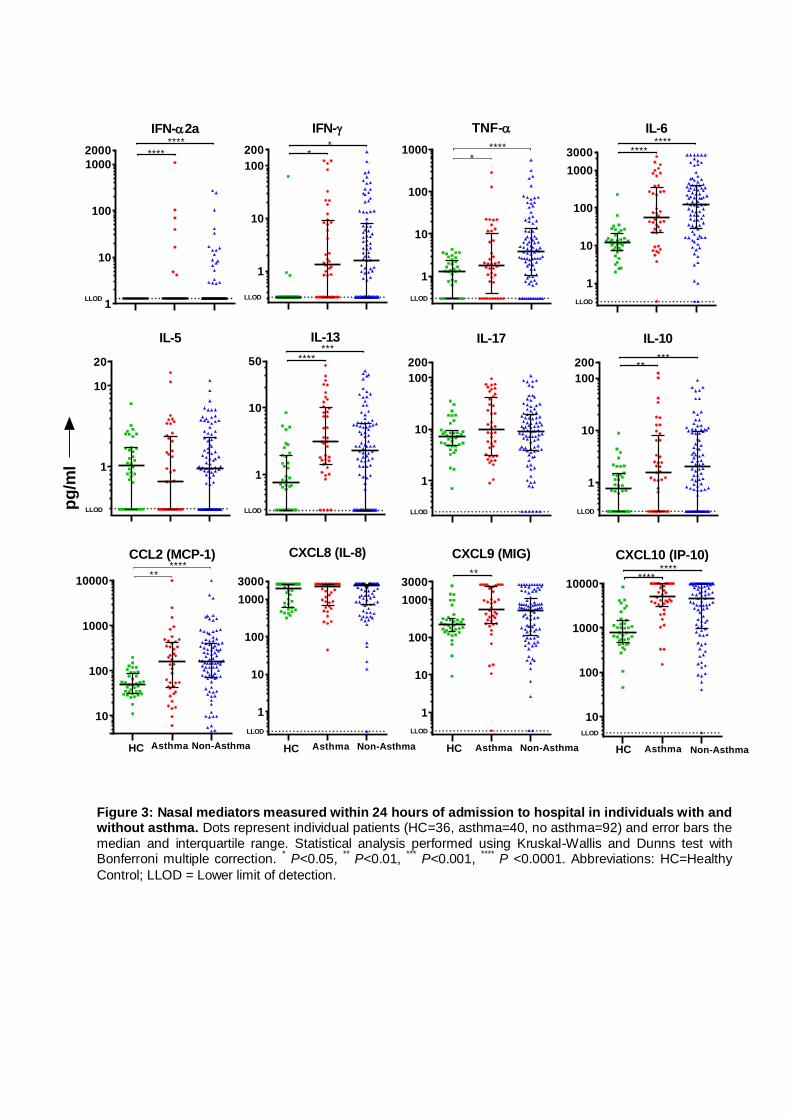
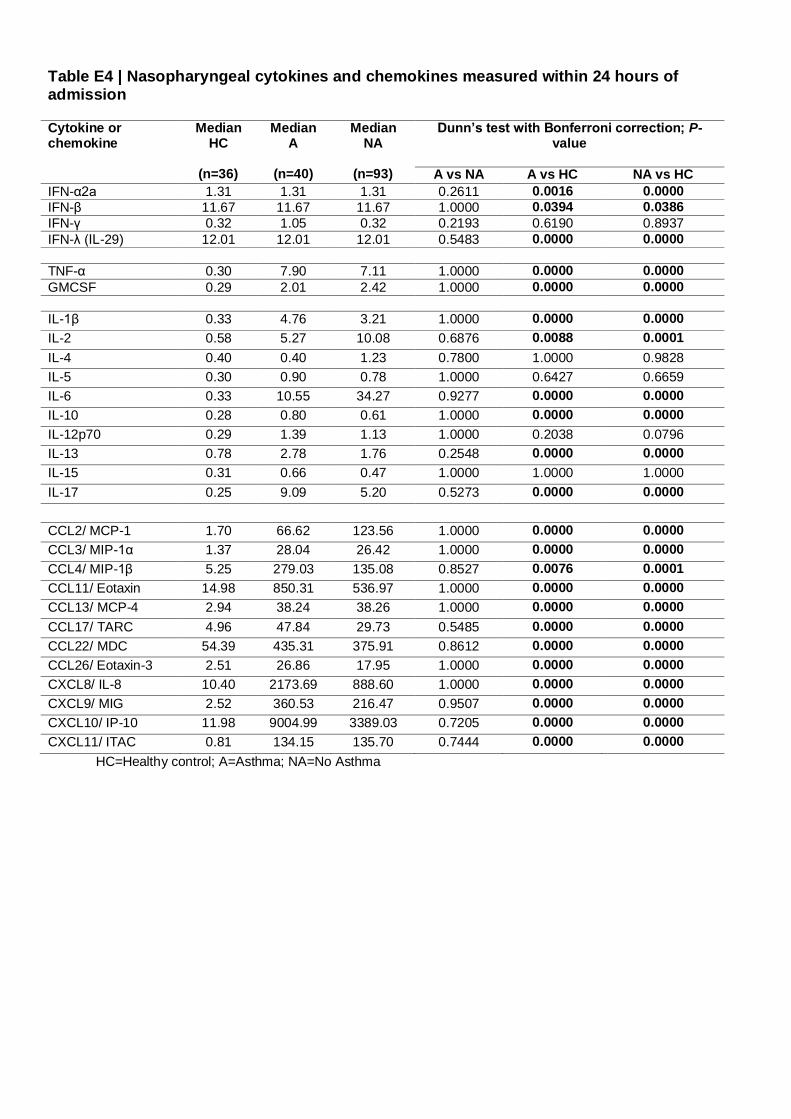
There were no significant differences in 28 nasal or nasopharyngeal cytokine and
chemokine levels measured within 24 hours of admission between individuals with
and without asthma (Fig. 2, Tables E3 and E4). In particular, there was comparable
mucosal induction of anti-viral mediators IFN-α2a, IFN-β, IFN-γ, IFN-λ and CXCL10
as well as the type 2 mediators IL-5 and IL-13.
Samples from subjects were collected within 24 hours and again at 48-72 after
admission (if possible). To compare the kinetics of the host immune response to
infection between patients with and without asthma, mediator levels were assessed
based on day of illness (DOI), i.e. the interval between subject-reported onset of
influenza-like symptoms and date of sampling (Figs. E2-4). This analysis showed
that those without asthma had evidence of greater systemic inflammation with
significantly higher serum levels of TNF-α (days 3-12), IL-6 (days 4-11), IL-5 (days
11-19), IL-17 (days 4-7), IL-10 (days 4-8), CCL2 (days 3-5), CXCL8 (days 2-13),
CXCL9 (days 5-12) and CXL10 (days 5-11). In the nasal mucosa, people without
asthma had higher TNF-α levels (days 8-10) whilst all other mediators demonstrated
similar kinetics.
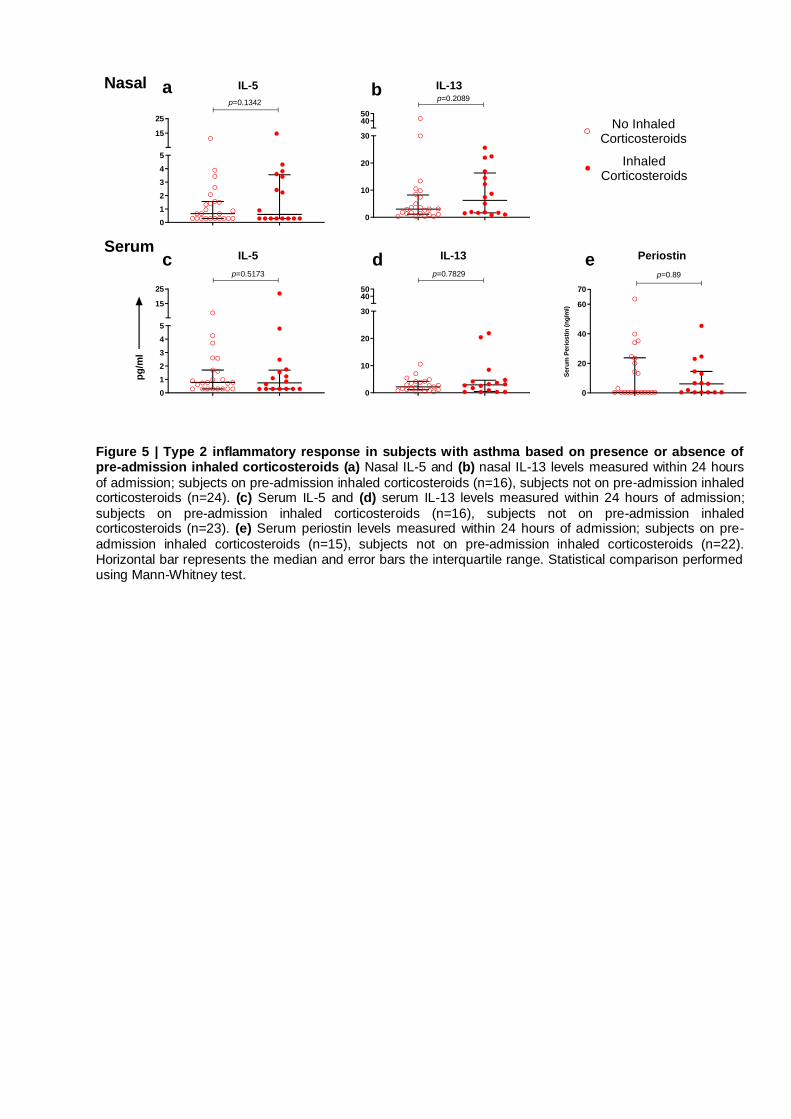
Total IgE (a marker of atopy) and periostin (a marker of IL-4/13 activation) were
measured in serum, with no significant differences seen between those with and
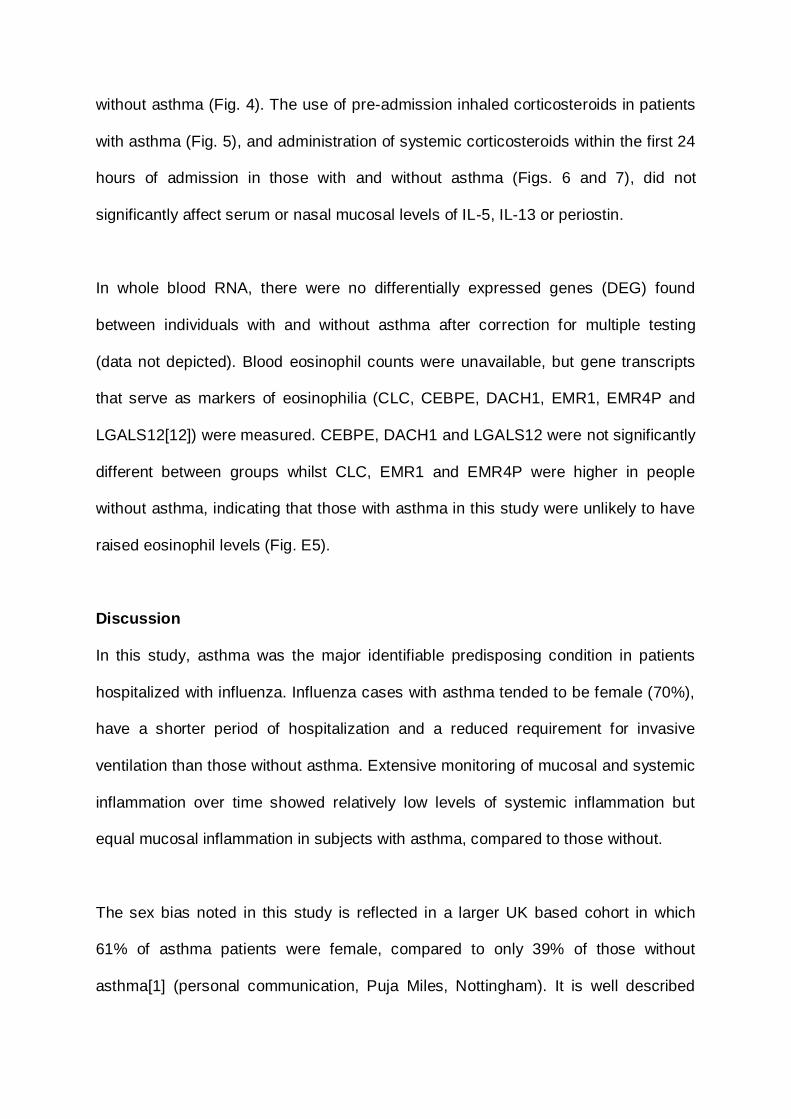
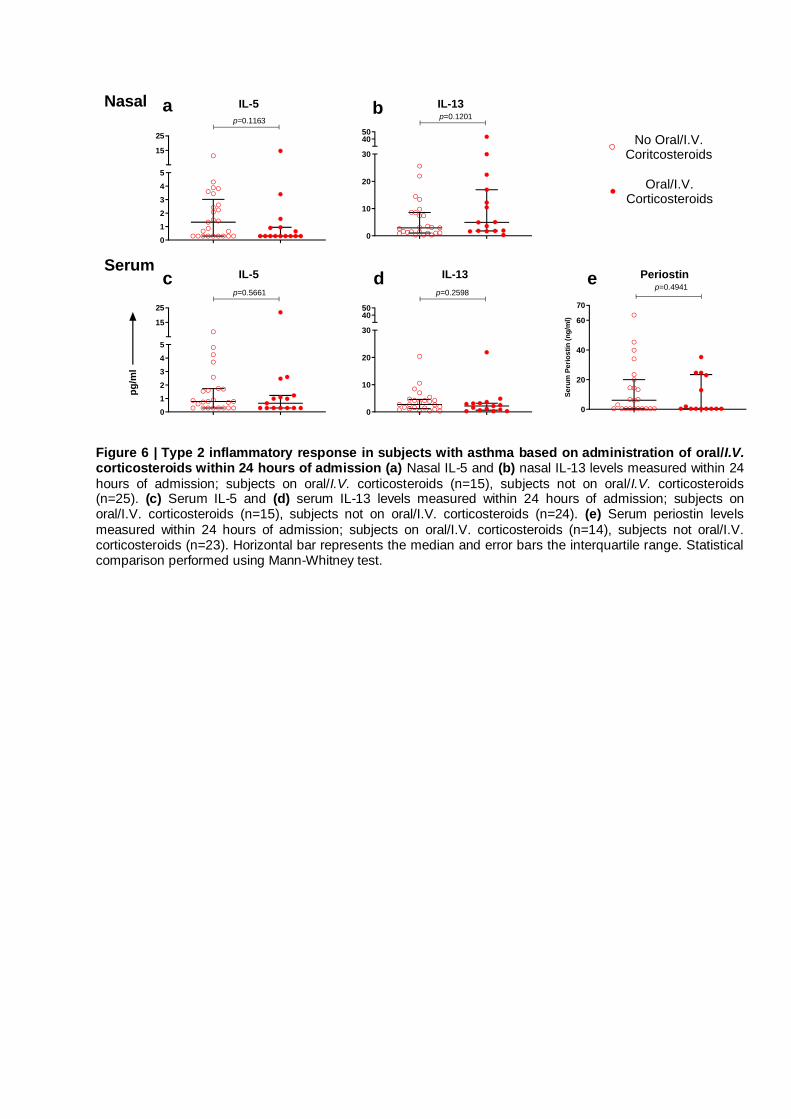
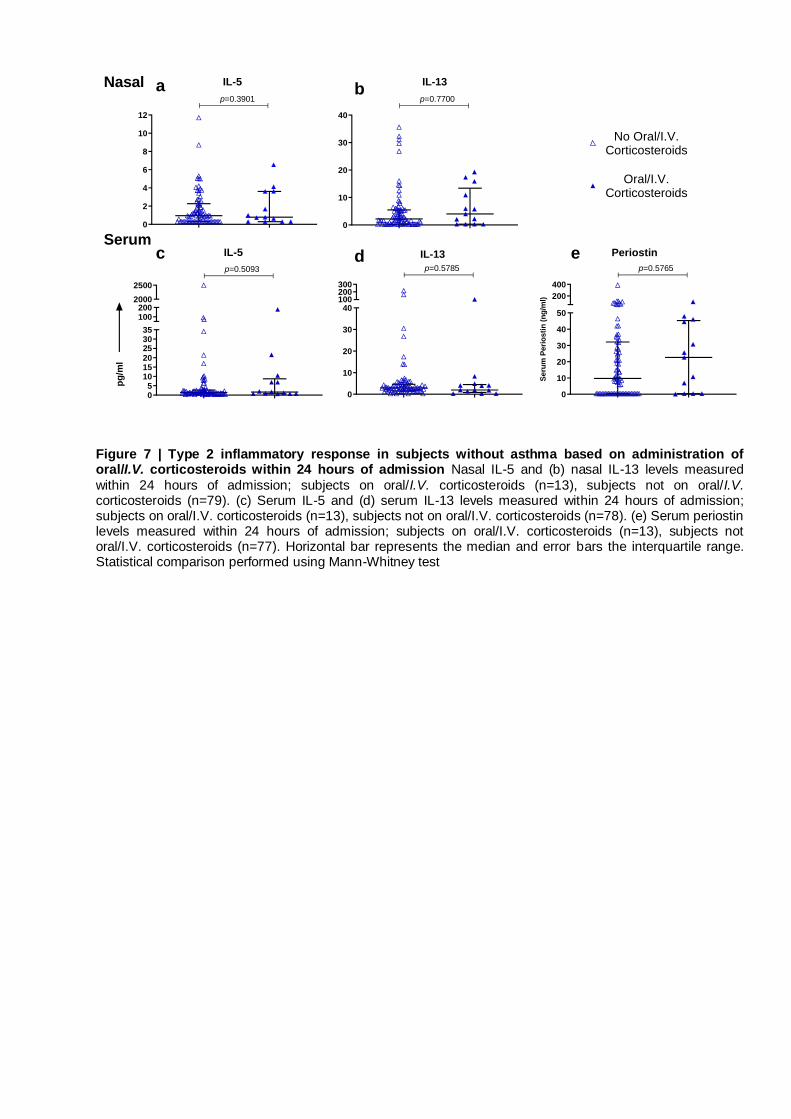
without asthma (Fig. 4). The use of pre-admission inhaled corticosteroids in patients
with asthma (Fig. 5), and administration of systemic corticosteroids within the first 24
hours of admission in those with and without asthma (Figs. 6 and 7), did not
significantly affect serum or nasal mucosal levels of IL-5, IL-13 or periostin.
In whole blood RNA, there were no differentially expressed genes (DEG) found
between individuals with and without asthma after correction for multiple testing
(data not depicted). Blood eosinophil counts were unavailable, but gene transcripts
that serve as markers of eosinophilia (CLC, CEBPE, DACH1, EMR1, EMR4P and
LGALS12[12]) were measured. CEBPE, DACH1 and LGALS12 were not significantly
different between groups whilst CLC, EMR1 and EMR4P were higher in people
without asthma, indicating that those with asthma in this study were unlikely to have
raised eosinophil levels (Fig. E5).
Discussion
In this study, asthma was the major identifiable predisposing condition in patients
hospitalized with influenza. Influenza cases with asthma tended to be female (70%),
have a shorter period of hospitalization and a reduced requirement for invasive
ventilation than those without asthma. Extensive monitoring of mucosal and systemic
inflammation over time showed relatively low levels of systemic inflammation but
equal mucosal inflammation in subjects with asthma, compared to those without.
The sex bias noted in this study is reflected in a larger UK based cohort in which
61% of asthma patients were female, compared to only 39% of those without
asthma[1] (personal communication, Puja Miles, Nottingham). It is well described

that middle-aged women have a propensity to present with non-atopic asthma[14],
highlighting that non-allergic triggers (such as infection) are likely to be key
determinants of asthma exacerbations in this subgroup. A range of subtypes of
asthma have been extensively characterized[15]. Many individuals with asthma have
increased type 2 inflammation associated with mast cell and eosinophil infiltration of
the airways[16]. Such patients with allergic asthma typically have elevated plasma
IL-5 and IL-13, identifying them as suitable for biologic therapies that target these
cytokines[17, 18]. In addition, IL-5 and IL-13 are elevated in nasosorption samples
from individuals with allergic asthma (even when stable before exacerbation)
compared with healthy non-atopic controls[19], as well as nasal periostin, IgE and IL-
13 in severe asthma[20]. In this study, there was a remarkable lack of elevation in
serum or nasal type 2 mediators (IL-5 and IL-13) and no significant rise in total
serum IgE, periostin and blood eosinophil-specific gene expression in individuals
with asthma relative to those without asthma. These findings raise the possibility that
individuals with asthma who are at risk of severe influenza may be of a specific
disease endotype: females with minimal type 2 inflammation and a lack of raised
total IgE. This endophenotype is sometimes described as ‘intrinsic’ asthma (a
classification ascribed to Francis M. Rackemann[21]), who noted that intrinsic
asthma generally affects older individuals with frequent virally-induced
exacerbations[22]. However, important caveats to this interpretation are that we do
not know about other features that predispose to atopy namelythe presence of
allergic rhinitis or atopic dermatitis symptoms and skin prick or specific IgE
responses to allergens. Additionally, the pre-existing or convalescent status of type-2
inflammatory mediators in both groups are unknown and could therefore have been
confounded by the presence of influenza infection.
Serosurveys show that the first wave of the 2009 pandemic influenza A H1N1
infected one in three children in the UK[11], only a small minority suffering severe
disease. The role of type 2 cytokines in the pathogenesis of influenza remains
unclear. Although T-helper 2 cells (Th2) are major producers of IL-5 and IL-13[23],
other cells may also contribute. For example, infection of airway epithelial cells can
induce the secretion of epithelial-derived cytokines such as IL-25, Thymic stromal
lymphopoietin (TSLP) and IL-33, which interact with innate lymphoid cells (ILCs) to
induce the release of type-2 cytokines[24, 25]. TSLP induces Type 2 cytokine
production even in naive CD4+ cells and indirectly affects dendritic cell (DC)
function; it may have protective anti-viral effects in mice[26]. Influenza infection can
enhance production of alveolar macrophage derived IL-33, resulting in increased IL-
13 release by ILCs and airway hyperreactivity in mice[27]7. IL-33 may also have an
important role in epithelial injury repair after influenza infection[28][29].
Interferon deficiency has been described in cultured cells from asthma volunteers
following ex-vivo HRV infection[30–32], whereas robust IFN-γ and IFN-λ responses
have been found in-vivo during exacerbations in children with asthma[33, 34]. A
recent study of the effects of fluticasone on bronchial biopsy explants from patients
with and without asthma infected ex vivo with influenza did not demonstrate any
difference in epithelial cell infection rates between groups. Whilst there was a
reduction in the secretion of innate immune mediators (including IFN-γ, CXCL10,
MCP-1 and IL-6), type-1 IFNs were undetectable[35]. Our current study had the
advantages of in vivo direct sampling of the blood and airway mucosa, showing
increased serum levels of IFN-α2a in patients with asthma but comparable levels of
interferons (α, β, γ, λ) and related chemokines (CXCL10 and CXCL11) in mucosal
fluids. Indeed, of all the serum proteins measured the only mediator that was
increased in patients with asthma compared to those without asthma was IFN-α2a.
This suggests that patients with asthma do not have impaired anti-viral immunity in
response to pandemic H1N1 influenza and the combination of enhanced serum IFN-
α2a with a relative lack of proinflammatory mediators may have played a protective
role amongst those with asthma leading to a milder course of disease.
We found that the use of in-hospital systemic corticosteroids was associated with
poor outcome in those without asthma, but not in those with asthma. A meta-analysis
of unselected patients with influenza-related complications found that systemic
corticosteroid use is associated with worse outcomes[36]. More recently, a placebo-
controlled randomized clinical trial in primary care confirmed the lack of any
beneficial effect of oral corticosteroids for acute lower respiratory tract symptoms in
patients without asthma[37]. We found that the use of in-hospital systemic
corticosteroids was associated with poor outcome in those without asthma, but not in
those with asthma. However, the fact that corticosteroid use is more prevalent in
patients who have increased influenza-related complications may have contributed
to this association.
Multivariate logistic regression analysis indicated that presentation to hospital ≥4
days after symptom onset was associated with worse outcome amongst patients
without asthma. Individuals with asthma have an abnormal respiratory epithelium
with airway hyperreactivity (AHR) and may present to hospital primarily due to
enhanced mucosal responses and bronchospasm. We speculate that the increased
number of asthma patients being hospitalized with exacerbations may partly be due
to early onset of respiratory symptoms caused by inflammation in the conducting
airways. By contrast, people without asthma may present with respiratory failure
caused by inflammation in the distal gas-exchanging parts of the lung.
A slower decline in viral load has been associated with increased severity of
influenza infection and immunodysregulation[38]. We found that viral load measured
within 24 hours of admission, subsequent clearance of virus, or serological
responses to H1N1 was not significantly different between patients with and without
asthma. This is consistent with our conclusions that different systemic immune
responses between clinical groups are not due to an inability to control viral
replication, but rather to differences in host response. Antiviral medication
(oseltamivir and zanamivir) is recommended for those with risk factors for influenza
complications, including asthma[39]. Antivirals were very rarely given prior to hospital
admission in our patients (asthma n=2, non-asthma n=1), so cannot explain
differences in immune responses measured on admission. They were not
administered in 20% of asthma patients in the first 24 hours of admission for whom
prescribing data was available, but most did receive at least one dose during the
course of their admission. Other studies show that administration of antivirals early
during illness and prior to admission significantly reduces hospital admission
rates[40], and that antivirals within 48 hours of symptom onset reduces mortality in
hospitalized patients[41]. Our study found that 14/39 (35.9%) asthma patients and
26/89 (29.2%) patients without asthma received antivirals within 48 hours of
symptom onset. This may have been due to patients presenting later in their illness
or a lack of awareness or resources available in primary care. Whilst more

individuals with asthma received the seasonal influenza vaccine compared to those
without asthma, vaccination rates were low compared to national norms.
Immunization with H1N1 vaccine was especially rare, but it is notable that some of
our cases did appear to have been appropriately vaccinated and yet developed
severe influenza.
Influenza vaccination coverage in European countries varies widely and use of
antivirals is patchy, highlighting the need for more effective education programmes
for both the general population and healthcare providers in early case recognition,
and consideration of early empirical antiviral therapy to reduce influenza-attributable
healthcare utilization among patients with asthma[42]. The development of more
internationally coordinated registries that accurately collate vaccination status along
with medical and socio-demographic details to assess the impact of public health
interventions over time may also be warranted [42].
Our study has important limitations. It was designed to investigate all patients
admitted with influenza rather than to address the issue of the effects of pre-existing
asthma on the course of influenza. Asthma diagnosis was based on a review of
clinical notes and patient-reported diagnosis of asthma and we lack spirometric data
or information about baseline severity and nature of symptoms (e.g. persistent vs.
intermittent asthma). We do not have blood eosinophil counts, exhaled breath nitric
oxide or sputum cell counts. Only 40% of asthma patients were on inhaled
corticosteroids. However, national guidance at the time of recruitment did not require
its use in those with mild asthma[43]. Additionally, clinical studies recruiting those
with confirmed asthma commonly have only half of participants taking inhaled
corticosteroids[19]. In future studies, prospective endophenotyping of asthma
patients, coupled with the measurement of mucosal and systemic immune
parameters might further enhance understanding of mechanisms of disease during
viral exacerbations[44]. Large cohort studies with well-characterized subjects such
as the Severe Asthma Research Programme (SARP)[45] and Unbiased BIOmarkers
in PREDiction of respiratory disease outcomes (U-BIOPRED)[46] have the potential
to identify how underlying endophenotypes influence susceptibility to infection and
predict treatment response. Despite its limitations, we wish to report our findings in
relation to asthma because of the unique nature of the MOSAIC study and the
likelihood that an opportunity to study a pandemic in this way may not arise again.
In summary, our study suggests that patients with asthma hospitalized with influenza
are predominantly female and have a good prognosis, with reduced systemic
inflammation but comparable mucosal responses to individuals without asthma.
Notably, serum total IgE levels and nasal IL-5 and IL-13 levels were not statistically
different between patients with and without asthma. Our study highlights the value of
assessing the airway mucosal and systemic host immune response to influenza,
suggesting investigation of prospective targeted therapeutic and preventative
strategies in well-characterized asthma patients with intrinsic disease.
Study Approval
The study was approved by the NHS National Research Ethics Service, Outer West
London REC (09/H0709/52, 09/MRE00/67) and is registered on
https://clinicaltrials.gov with trial number NCT00965354. Written informed consent
was obtained from patients or their legally authorised representatives as well as
healthy controls.
Author Contributions
A.J., J.D., O.M.K., M.C.Z., T.T.H. and P.J.O. contributed to the conception, design,
analysis of data, and intellectual content. J.D. conducted experimental work, was
involved with clinical study design and supervised sampling. A.J. and T.T. performed
the statistical analysis and prepared figures. L.T.H. performed transcriptomic
analysis. R.S.T. performed assay measurements and analysis. P.J.O. was study
Principal Investigator. A.J., J.D. T.T.H and P.J.O. wrote the manuscript. All authors
gave final approval. The views expressed are those of the authors and not
necessarily those of the NHS, NIHR, Public Health England or the Department of
Health.
Acknowledgements
We are grateful to the MOSAIC administrative team (Mary Cross, Lindsey-Anne
Cumming, Matthew Minns, Tom Ford, Barbara Cerutti, Denise Gardner and Zoe
Williams) and thank the patients and their families, healthy volunteers, and staff at
participating National Health Service (NHS) hospitals (Alder Hey Children’s Hospital;
Brighton & Sussex University Hospitals NHS Trust; Central Manchester University
Hospitals NHS Foundation Trust; Chelsea and Westminster Hospital NHS
Foundation Trust; Imperial College Healthcare NHS Trust; Liverpool Women's NHS
Foundation Trust; Royal Liverpool and Broadgreen University Hospitals NHS Trust;
Royal Brompton and Harefield NHS Foundation Trust; University Hospitals Coventry
and Warwickshire NHS Trust).

MOSAIC Investigators: Chelsea and Westminster NHS Foundation Trust: B.G.
Gazzard. Francis Crick Institute, Mill Hill Laboratory: A. Hay, J. McCauley, A.
O’Garra. Imperial College London, UK: P. Aylin, D. Ashby, W.S. Barclay, S.J.
Brett, W.O. Cookson, M.J. Cox, J. Dunning, L.N. Drumright, R.A. Elderfield, L.
Garcia-Alvarez, M.J. Griffiths, M.S. Habibi, T.T. Hansel, J.A. Herberg, A.H. Holmes,
S.L. Johnston, O.M. Kon, M. Levin, M.F. Moffatt, S. Nadel, P.J. Openshaw, J.O.
Warner. Liverpool School of Tropical Medicine, UK: S.J. Aston, S.B. Gordon.
Manchester Collaborative Centre for Inflammation Research (MCCIR): T.
Hussell. Public Health England (formerly Health Protection Agency), UK: J.
Dunning, C. Thompson, M.C. Zambon. The Roslin Institute, University of
Edinburgh: D.A. Hume. University College London, UK: A. Hayward. UCL
Institute of Child Health: R.L. Smyth; University of Edinburgh, UK: J.K. Baillie, P.
Simmonds University of Liverpool, UK: P.S. McNamara; M.G. Semple; University
of Nottingham, UK: J.S. Nguyen-Van-Tam; University of Oxford, UK: L-P. Ho, A.
J. McMichael Wellcome Trust Sanger Institute, UK: P. Kellam West of Scotland
Specialist Virology Centre, Glasgow, UK: W.E. Adamson, W.F. Carman.
Funding
MOSAIC (Mechanisms of Severe Influenza Consortium) was supported by the MRC
(UK) and Wellcome Trust (090382/Z/09/Z). The study was also supported by the
National Institute of Healthcare Research (NIHR) Biomedical Research Centres
(BRCs) in London and Liverpool and by the National Institute for Health Research
Health Protection Research Unit (NIHR HPRU) in Respiratory Infections at Imperial
College London in partnership with Public Health England (PHE). P.J.O. was

supported by EU FP7 PREPARE project 602525. The views expressed are those of
the author(s) and not necessarily those of the NHS, the NIHR, the Department of
Health, Public Health England or the EU. The funders had no role in study design,
data collection and analysis, decision to publish, or preparation of the manuscript.
Conflict of interest statement
AJ holds a Clinical Lectureship at the University of Cambridge which is supported
jointly by the University of Cambridge Experimental Medicine Training Initiative (EMI)
programme in partnership with GlaxoSmithKline (EMI-GSK) and Cambridge
University Hospitals NHS Foundation Trust and the funding received from this
programme is not relevant to the content of this manuscript. TTH and Imperial
Innovations are involved in setting up a medical device company called Mucosal
Diagnostics (MD) that is an Imperial College spin-off company. PJO reports personal
fees from Consultancy, grants from MRC, grants from EU Grant, grants from NIHR
Biomedical Research Centre, grants from MRC/GSK, grants from Wellcome Trust,
grants from NIHR (HPRU), grants from NIHR Senior Investigator, personal fees from
European Respiratory Society, grants from MRC Global Challenge Research Fund,
non-financial support from AbbVie, outside the submitted work; and Past President
and Trustee of British Society for Immunology; Vice-Chair and Member, NERVTAG
(New and Emerging Respiratory Virus Threats Advisory Group; Department of
Health). The remaining authors declare that no relevant conflict of interest exists.

References
1. Myles P, Nguyen-Van-Tam JS, Semple MG, Brett SJ, Bannister B, Read RC,
Taylor BL, McMenamin J, Enstone JE, Nicholson KG, Openshaw PJ, Lim WS, Influenza Clinical Information Network FLU-CIN. Differences between asthmatics and nonasthmatics hospitalised with influenza A infection. The
European respiratory journal 2013; 41: 824–831.
2. van Kerkhove MD, Vandemaele K a H, Shinde V, Jaramillo-Gutierrez G,
Koukounari A, Donnelly C a., Carlino LO, Owen R, Paterson B, Pelletier L, Vachon J, Gonzalez C, Hongjie Y, Zijian F, Chuang SK, Au A, Buda S, Krause G, Haas W, Bonmarin I, Taniguichi K, Nakajima K, Shobayashi T, Takayama Y,
Sunagawa T, Heraud JM, Orelle A, Palacios E, van der Sande M a B, Wielders CCHL, et al. Risk factors for severe outcomes following 2009 influenza a (H1N1) infection: A global pooled analysis. PLoS Medicine 2011; 8.
3. Denholm JT, Gordon CL, Johnson PD, Hewagama SS, Stuart RL, Aboltins C, Jeremiah C, Knox J, Lane GP, Tramontana AR, Slavin M a, Schulz TR,
Richards M, Birch CJ, Cheng AC. Hospitalised adult patients with pandemic (H1N1) 2009 influenza in Melbourne, Australia. The Medical journal of Australia
2010; 192: 84–86.
4. Oshansky CM, Gartland AJ, Wong S-S, Jeevan T, Wang D, Roddam PL, Caniza M a, Hertz T, Devincenzo JP, Webby RJ, Thomas PG. Mucosal immune
responses predict clinical outcomes during influenza infection independently of age and viral load. American journal of respiratory and critical care medicine
2014; 189: 449–462.
5. Gao R, Bhatnagar J, Blau DM, Greer P, Rollin DC, Denison AM, Deleon-Carnes M, Shieh W-J, Sambhara S, Tumpey TM, Patel M, Liu L, Paddock C, Drew C,
Shu Y, Katz JM, Zaki SR. Cytokine and chemokine profiles in lung tissues from fatal cases of 2009 pandemic influenza A (H1N1): role of the host immune response in pathogenesis. The American journal of pathology 2013; 183: 1258–
1268.
6. Everitt AR, Clare S, Pertel T, John SP, Wash RS, Smith SE, Chin CR, Feeley
EM, Sims JS, Adams DJ, Wise HM, Kane L, Goulding D, Digard P, Anttila V, Baillie JK, Walsh TS, Hume D a., Palotie A, Xue Y, Colonna V, Tyler-Smith C, Dunning J, Gordon SB, GenISIS Investigators, MOSAIC Investigators, Smyth
RL, Openshaw PJ, Dougan G, Brass AL, et al. IFITM3 restricts the morbidity and mortality associated with influenza. Nature 2012; 484: 519–523.
7. Elderfield RA, Watson SJ, Godlee A, Adamson WE, Thompson CI, Dunning J, Fernandez-Alonso M, Blumenkrantz D, Hussell T, Zambon M, Openshaw P, Kellam P, Barclay WS. Accumulation of Human-Adapting Mutations during
Circulation of A(H1N1)pdm09 Influenza Virus in Humans in the United Kingdom. Journal of Virology 2014; 88: 13269–13283.
8. Dunning J, Blankley S, Hoang LT, Cox M, Graham CM, James PL, Bloom CI, Chaussabel D, Banchereau J, Brett SJ, Moffatt MF, O’Garra A, Openshaw PJM.

Progression of whole-blood transcriptional signatures from interferon-induced to neutrophil-associated patterns in severe influenza. Nature Immunology 2018;
19: 625.
9. Jha A, Dunning J, Tunstall T, Hansel T, Openshaw P. Asthma patients hospitalized with influenza lack mucosal and systemic type 2 inflammation. 5.3 Allergy and Immunology London: European Respiratory Society; 2016. p.
OA4955.
10. Nguyen-Van-Tam JS, Openshaw PJM, Hashim A, Gadd EM, Lim WS, Semple MG, Read RC, Taylor BL, Brett SJ, McMenamin J, Enstone JE, Armstrong C,
Nicholson KG. Risk factors for hospitalisation and poor outcome with pandemic A/H1N1 influenza: United Kingdom first wave (May-September 2009). Thorax
2010; 65: 645–651.
11. Miller E, Hoschler K, Hardelid P, Stanford E, Andrews N, Zambon M. Incidence of 2009 pandemic infl uenza A H1N1 infection in England : a cross-sectional serological study. The Lancet Elsevier Ltd; 2010; 375: 1100–1108.
12. Leaker BR, Malkov VA, Mogg R, Ruddy MK, Nicholson GC, Tan AJ, Tribouley
C, Chen G, De Lepeleire I, Calder NA, Chung H, Lavender P, Carayannopoulos LN, Hansel TT. The nasal mucosal late allergic reaction to grass pollen involves type 2 inflammation (IL-5 and IL-13), the inflammasome (IL-1β), and complement. Mucosal Immunology Nature Publishing Group; 2016; : 1–13.
13. R Core Team. R: A Language and Environment for Statistical Computing.
Vienna, Austria: R Foundation for Statistical Computing; 2013.
14. Leynaert B, Sunyer J, Garcia-Esteban R, Svanes C, Jarvis D, Cerveri I, Dratva
J, Gislason T, Heinrich J, Janson C, Kuenzli N, de Marco R, Omenaas E, Raherison C, Gomez Real F, Wjst M, Zemp E, Zureik M, Burney PGJ, Anto JM, Neukirch F. Gender differences in prevalence, diagnosis and incidence of allergic and non-allergic asthma: a population-based cohort. Thorax 2012; 67:
625–631.
15. Wenzel SE. Asthma phenotypes: the evolution from clinical to molecular approaches. Nature Medicine Nature Publishing Group; 2012; 18: 716–725.
16. Lambrecht BN, Hammad H, Fahy JV. The Cytokines of Asthma. Immunity 2019;
50: 975–991.
17. Pelaia G, Vatrella A, Maselli R. The potential of biologics for the treatment of asthma. Nature Reviews Drug Discovery Nature Publishing Group; 2012; 11:
958–972.
18. Hambly N, Nair P. Monoclonal antibodies for the treatment of refractory asthma. Current opinion in pulmonary medicine 2014; 20: 87–94.
19. Hansel TT, Tunstall T, Trujillo-Torralbo M-B, Shamji B, Del-Rosario A, Dhariwal J, Kirk PDW, Stumpf MPH, Koopmann J, Telcian A, Aniscenko J, Gogsadze L,
Bakhsoliani E, Stanciu L, Bartlett N, Edwards M, Walton R, Mallia P, Hunt TM, Hunt TL, Hunt DG, Westwick J, Edwards M, Kon OM, Jackson DJ, Johnston SL.
A Comprehensive Evaluation of Nasal and Bronchial Cytokines and Chemokines Following Experimental Rhinovirus Infection in Allergic Asthma:
Increased Interferons (IFN-γ and IFN-λ) and Type 2 Inflammation (IL-5 and IL-13). EBioMedicine The Authors; 2017; 19: 128–138.
20. Cai F, Abreu F, Ding HT, Choy D, Bremer M, Staton T, Erickson R, Peng K, Wang JS, Au-Yeung A, Hansel TT, Bjermer L, Holweg C, Yen K, Matthews JG, Scheerens H. Nasal Biomarkers Characterization In Lebrikizumab Bronchoscopy Study (CLAVIER). Journal of Allergy and Clinical Immunology
Elsevier; 2018; 141: AB118.
21. Rackemann FM. Intrinsic asthma. Journal of Allergy Elsevier; 1940; 11: 147–
162.
22. Peters SP. Asthma Phenotypes: Nonallergic (Intrinsic) Asthma. The Journal of Allergy and Clinical Immunology: In Practice Elsevier Inc; 2014; 2: 650–652.
23. Bao K, Reinhardt RL. The differential expression of IL-4 and IL-13 and its impact on type-2 immunity. Cytokine NIH Public Access; 2015; 75: 25–37.
24. Chen K, Kolls JK. T cell-mediated host immune defenses in the lung. Annual review of immunology 2013; 31: 605–633.
25. Kumar RK, Foster PS, Rosenberg HF. Respiratory viral infection, epithelial cytokines, and innate lymphoid cells in asthma exacerbations. Journal of leukocyte biology Wiley-Blackwell; 2014; 96: 391–396.
26. Yadava K, Sichelstiel A, Luescher IF, Nicod LP, Harris NL, Marsland BJ. TSLP promotes influenza-specific CD8+ T-cell responses by augmenting local inflammatory dendritic cell function. Mucosal Immunology Nature Publishing
Group; 2013; 6: 83–92.
27. Chang Y-J, Kim HY, Albacker LA, Baumgarth N, McKenzie ANJ, Smith DE, DeKruyff RH, Umetsu DT. Innate lymphoid cells mediate influenza-induced airway hyper-reactivity independently of adaptive immunity. Nature Immunology
Nature Publishing Group; 2011; 12: 631–638.
28. Rostan O, Arshad MI, Piquet-Pellorce C, Robert-Gangneux F, Gangneux J-P,
Samson M. Crucial and Diverse Role of the Interleukin-33/ST2 Axis in Infectious Diseases. Andrews-Polymenis HL, editor. Infection and Immunity 2015; 83:
1738–1748.
29. Guo XJ, Thomas PG. New fronts emerge in the influenza cytokine storm. Seminars in immunopathology NIH Public Access; 2017; 39: 541–550.
30. Wark PAB, Johnston SL, Bucchieri F, Powell R, Puddicombe S, Laza-Stanca V, Holgate ST, Davies DE. Asthmatic bronchial epithelial cells have a deficient innate immune response to infection with rhinovirus. The Journal of Experimental Medicine 2005; 201: 937–947.
31. Contoli M, Message SD, Laza-Stanca V, Edwards MR, Wark P a B, Bartlett NW, Kebadze T, Mallia P, Stanciu L a, Parker HL, Slater L, Lewis-Antes A, Kon OM,
Holgate ST, Davies DE, Kotenko S V, Papi A, Johnston SL. Role of deficient type III interferon-lambda production in asthma exacerbations. Nature medicine
2006; 12: 1023–1026.
32. Edwards MR, Regamey N, Vareille M, Kieninger E, Gupta A, Shoemark A,
Saglani S, Sykes A, Macintyre J, Davies J, Bossley C, Bush A, Johnston SL. Impaired innate interferon induction in severe therapy resistant atopic asthmatic children. Mucosal Immunology Nature Publishing Group; 2013; 6: 797–806.
33. Lewis TC, Henderson TA, Carpenter AR, Ramirez IA, McHenry CL, Goldsmith AM, Ren X, Mentz GB, Mukherjee B, Robins TG, Joiner T a, Mohammad LS,
Nguyen ER, Burns MA, Burke DT, Hershenson MB. Nasal cytokine responses to natural colds in asthmatic children. Clinical and experimental allergy : journal of the British Society for Allergy and Clinical Immunology 2012; 42: 1734–1744.
34. Miller EK, Hernandez JZ, Wimmenauer V, Shepherd BE, Hijano D, Libster R, Serra ME, Bhat N, Batalle JP, Mohamed Y, Reynaldi A, Rodriguez A, Otello M,
Pisapia N, Bugna J, Bellabarba M, Kraft D, Coviello S, Ferolla FM, Chen A, London SJ, Siberry GK, Williams J V., Polack FP. A mechanistic role for type III IFN-λ 1 in asthma exacerbations mediated by human rhinoviruses. American
Journal of Respiratory and Critical Care Medicine 2012; 185: 508–516.
35. Nicholas B, Dudley S, Tariq K, Howarth P, Lunn K, Pink S, Sterk PJ, Adcock IM,
Monk P, Djukanović R, U-BIOPRED study group. Susceptibility to influenza virus infection of bronchial biopsies in asthma. The Journal of allergy and clinical immunology 2017; 140: 309-312.e4.
36. Rodrigo C, Leonardi-Bee J, Nguyen-Van-Tam JS, Lim WS. Effect of Corticosteroid Therapy on Influenza-Related Mortality: A Systematic Review and Meta-analysis. Journal of Infectious Diseases 2015; 212: 183–194.
37. Hay AD, Little P, Harnden A, Thompson M, Wang K, Kendrick D, Orton E,
Brookes ST, Young GJ, May M, Hollinghurst S, Carroll FE, Downing H, Timmins D, Lafond N, El-Gohary M, Moore M. Effect of Oral Prednisolone on Symptom Duration and Severity in Nonasthmatic Adults With Acute Lower Respiratory Tract Infection. JAMA World Health Organization,; 2017; 318: 721.
38. To KKW, Hung IFN, Li IWS, Lee K-L, Koo C-K, Yan W-W, Liu R, Ho K-Y, Chu
K-H, Watt C-L, Luk W-K, Lai K-Y, Chow F-L, Mok T, Buckley T, Chan JFW, Wong SSY, Zheng B, Chen H, Lau CCY, Tse H, Cheng VCC, Chan K-H, Yuen K. Delayed Clearance of Viral Load and Marked Cytokine Activation in Severe Cases of Pandemic H1N1 2009 Influenza Virus Infection. Clinical Infectious Diseases 2010; 50: 850–859.
39. NICE. National Institute for Health and Care Excellence. Amantadine, oseltamivir and zanamivir for the treatment of influenza. London: 2009. [Internet]. 2009 [cited 2019 Apr 29].Available from:
https://www.nice.org.uk/guidance/ta168/resources/amantadine-oseltamivir-and-zanamivir-for-the-treatment-of-influenza-pdf-82598381928133.
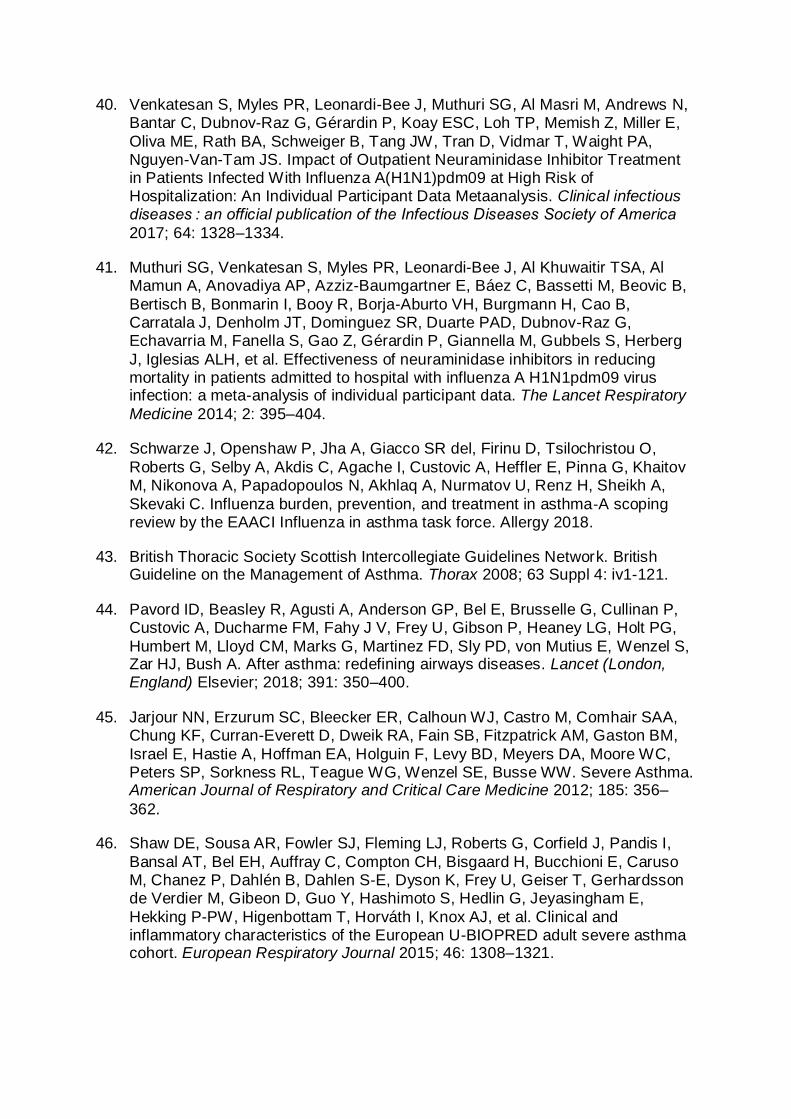
40. Venkatesan S, Myles PR, Leonardi-Bee J, Muthuri SG, Al Masri M, Andrews N, Bantar C, Dubnov-Raz G, Gérardin P, Koay ESC, Loh TP, Memish Z, Miller E,
Oliva ME, Rath BA, Schweiger B, Tang JW, Tran D, Vidmar T, Waight PA, Nguyen-Van-Tam JS. Impact of Outpatient Neuraminidase Inhibitor Treatment in Patients Infected With Influenza A(H1N1)pdm09 at High Risk of Hospitalization: An Individual Participant Data Metaanalysis. Clinical infectious diseases : an official publication of the Infectious Diseases Society of America
2017; 64: 1328–1334.
41. Muthuri SG, Venkatesan S, Myles PR, Leonardi-Bee J, Al Khuwaitir TSA, Al Mamun A, Anovadiya AP, Azziz-Baumgartner E, Báez C, Bassetti M, Beovic B,
Bertisch B, Bonmarin I, Booy R, Borja-Aburto VH, Burgmann H, Cao B, Carratala J, Denholm JT, Dominguez SR, Duarte PAD, Dubnov-Raz G, Echavarria M, Fanella S, Gao Z, Gérardin P, Giannella M, Gubbels S, Herberg
J, Iglesias ALH, et al. Effectiveness of neuraminidase inhibitors in reducing mortality in patients admitted to hospital with influenza A H1N1pdm09 virus infection: a meta-analysis of individual participant data. The Lancet Respiratory
Medicine 2014; 2: 395–404.
42. Schwarze J, Openshaw P, Jha A, Giacco SR del, Firinu D, Tsilochristou O,
Roberts G, Selby A, Akdis C, Agache I, Custovic A, Heffler E, Pinna G, Khaitov M, Nikonova A, Papadopoulos N, Akhlaq A, Nurmatov U, Renz H, Sheikh A,
Skevaki C. Influenza burden, prevention, and treatment in asthma‐A scoping review by the EAACI Influenza in asthma task force. Allergy 2018.
43. British Thoracic Society Scottish Intercollegiate Guidelines Network. British Guideline on the Management of Asthma. Thorax 2008; 63 Suppl 4: iv1-121.
44. Pavord ID, Beasley R, Agusti A, Anderson GP, Bel E, Brusselle G, Cullinan P, Custovic A, Ducharme FM, Fahy J V, Frey U, Gibson P, Heaney LG, Holt PG,
Humbert M, Lloyd CM, Marks G, Martinez FD, Sly PD, von Mutius E, Wenzel S, Zar HJ, Bush A. After asthma: redefining airways diseases. Lancet (London, England) Elsevier; 2018; 391: 350–400.
45. Jarjour NN, Erzurum SC, Bleecker ER, Calhoun WJ, Castro M, Comhair SAA, Chung KF, Curran-Everett D, Dweik RA, Fain SB, Fitzpatrick AM, Gaston BM,
Israel E, Hastie A, Hoffman EA, Holguin F, Levy BD, Meyers DA, Moore WC, Peters SP, Sorkness RL, Teague WG, Wenzel SE, Busse WW. Severe Asthma. American Journal of Respiratory and Critical Care Medicine 2012; 185: 356–
362.
46. Shaw DE, Sousa AR, Fowler SJ, Fleming LJ, Roberts G, Corfield J, Pandis I,
Bansal AT, Bel EH, Auffray C, Compton CH, Bisgaard H, Bucchioni E, Caruso M, Chanez P, Dahlén B, Dahlen S-E, Dyson K, Frey U, Geiser T, Gerhardsson de Verdier M, Gibeon D, Guo Y, Hashimoto S, Hedlin G, Jeyasingham E,
Hekking P-PW, Higenbottam T, Horváth I, Knox AJ, et al. Clinical and inflammatory characteristics of the European U-BIOPRED adult severe asthma cohort. European Respiratory Journal 2015; 46: 1308–1321.
Clinical Feature Asthma N (%) No asthma N (%) P value OR / χ2 95% CI
Total Participants 40 (30%) 93 (70%) - - -
DEMOGRAPHICS
Gender (Female) 28 (70%) 36 (38.7%) 0.0012 3.69 1.67-8.18
Age 18-30a 11 (27.5%) 26 (30.0%)
0.9699 0.06 NA Age 31-45
a 14 (35%) 32 (34.4%)
Age 46-60a
11 (27.5%) 23 (24.7%)
Age >60a
4 (10%) 12 (12.9%)
Whitea
27 (67.5%) 62 (66.7%)
0.5810 1.96 NA Asian/Asian British
a 1 (2.5%) 8 (8.6%)
Black/ Black Britisha
8 (20%) 14 (15.1%)
Chinesea
4 (10%) 9 (9.7%)
COMORBIDITIES & CO-FACTORS
Any comorbidities other than asthma 25 (62.5%) 62 (66.7%) 0.6930 0.83 0.71-1.24
Chronic pulmonary conditions exc. asthma/COPD
3 (7.5%) 11 (11.8%) 0.5519 0.60 0.16-2.30
Chronic neurological disorders 2 (5%) 6 (6.5%) 1.0000 0.76 0.15-3.96
Chronic renal disease 3 (7.5%) 5 (5.4%) 0.6965 1.43 0.32-6.28
Chronic hepatic disease 1 (2.5%) 4 (4.3%) 1.0000 0.57 0.06-5.27
Chronic cardiovascular disease 10 (25%) 19 (20.4%) 0.6478 1.30 0.54-3.12
Diabetes 5 (12.5%) 9 (9.7%) 0.7587 1.33 0.42-4.26
Chronic obesity 10 (25%) 17 (18.3%) 0.4809 1.49 0.61-3.62
HIV positivity 7 (17.5%) 8 (8.6%) 0.1466 2.25 0.76-6.71
Immunodeficiency (excluding HIV) 9 (22.5%) 15 (16.1%) 0.4615 1.51 0.60-3.81
Current or active cancer 3 (7.5%) 19 (20.4%) 0.0778 0.32 0.09-1.14
Haematological disorder 0 5 (5.4%) 0.3217 0.20 0.01-3.68
Current or ex-smoker 17/34 (50%) 37/69 (53.6%) 0.8344 0.86 0.38-1.97
Current Smoker 13/34 (38.2%) 22/69 (31.9%) 0.5106 1.38 0.59-3.24
Pregnancy (in women of child-bearing age) 3/23 (13%) 10/30 (33.3%) 0.1151 0.30 0.07-1.26
Seasonal Vaccine 15 (37.5%) 17 (18.3%) 0.0261 2.68 1.17-6.14
H1N1 Vaccine 8 (20%) 7 (7.5%) 0.0684 3.07 1.03-9.16
Pre-admission Inhaled corticosteroids 16 (40%) 6 (6.5%) <0.0001 9.67 3.41-27.4
ADMISSION
Oral/i.v. corticosteroids on day 1 of admission 15 (37.5%) 13 (14%) 0.0046 3.69 1.55-8.80
In-hospital oral/i.v. corticosteroid use (≥ 1 dose) 22 (55%) 24 (25.8%) 0.0016 3.51 1.62-7.29
Admission ≤2 days after symptom onset 15 (37.5%) 32 (34.4%) 0.8435 1.14 0.53-2.47
Admission ≤4 days after symptom onset 24 (60%) 49 (52.7%) 0.4547 1.35 0.63-2.86
Days between onset of symptoms and
admission Median (IQR)b
3 (2-7) 4 (2-8) 0.3941 - -
O2 saturation on admission ≤92% 6/33 (18.2%) 23/71 (32.4%) 0.2389 0.48 0.18-1.37
Oxygen administered 8/26 (30.1%) 28/63 (44.4%) 0.3423 0.56 0.21-1.47
Pneumonia on CXR 3/20 (15%) 14/47 (29.8%) 0.2382 0.42 0.11-1.65
Antibiotic use at admission 28/33 (84.8%) 69/73 (94.5%) 0.1329 0.33 0.08-1.30
Peak Respiratory Score 1a
15 (37.5%) 27 (29.0%)
0.0338 6.78 NA Peak Respiratory Score 2a
19 (47.5%) 31 (33.3%)
Peak Respiratory Score 3a
6 (15%) 35 (37.6%)
Length of stay (days, mean ±SEM)c
8.3 ±2.55 15.3 ±1.82 0.0333 - -
Influenza A positivea
38 (95%) 82 (88.2%)
0.4492 1.60 - Influenza B positivea
2 (5%) 10 (10.8%)
Influenza A+B co-infectiona
0 1 (1.1%)
Influenza H1 positivea
38/38 (100%) 77/82 (94.0%)
0.4903 2.42 - Influenza H3 positive
a 0 3/82 (3.7%)
Undetermineda
0 1/82 (1.2%)
Suspected influenza H1 based on serologya
0 1/82 (1.2%)
Rhinovirus positive 1/36 (2.8%) 9/83 (10.84%) 0.2788 0.23 0.03-1.93
Pre-hospital anti-viral use 2/33 (6%) 1/77 (1.3%) 0.2137 4.90 0.43-56.1
In-hospital antiviral use (≥ 1 dose) 37/39 (94.9%) 85/89 (95.5%) 0.9999 0.87 0.20-4.74
Antiviral use ≤48 hours from onset of symptoms 14/39 (35.9%) 26/89 (29.2%) 0.5351 1.36 0.62-3.05
Antiviral use on day 1 of admission 28/35 (80%) 62/73 (84.9%) 0.58 0.71 0.27-1.87
Positive for any bacteria 0-4 days post onset of symptoms (PCR or culture)
10 (25%) 20/92 (21.7%) 0.6595 1.20 0.50-2.87
Positive for any bacteria 5-10 days post onset of
symptoms (PCR or culture)
11 (27.5%) 25/92 (27.2%) 1.000 1.02 0.44-2.34
Positive for any bacteria 11+ days post onset of symptoms (PCR or culture)
13 (32.5%) 19/92 (20.7%) 0.1849 1.85 0.80-4.25
Death 2 (5%) 16 (17.2%) 0.0944 0.25 0.06-1.16
Table 1 Clinical features of hospitalized influenza participants with and without asthma All statistical analyses
done using Fisher’s exact test unless indicated otherwise. achi-squared test;
bMann-Whitney test;
cunpaired t-test;
SEM=standard error of mean. 6 patients without asthma on pre-admission inhaled corticosteroids had comorbidities including COPD (n=4) and chronic lung disease (n=2). Note where there is incomplete data about medication and comorbidities available from medical records, a denominator value is shown.

Figure 1 | Nasopharangeal influenza viral load and serological response to H1N1 in subjects with and without asthma. (a) Viral load kinetics based on number of days elapsed between subject-reported symptom onset
and time of sampling. Dots represent individual samples with up to 2 samples collected per subject; red dots represent asthma (n=37), blue dots represent no asthma (n=88). First sample collected within 24 hours of admission and second sample between 48-72 hours of admission to a MOSAIC hospital. Locally weighted scatterplot smoothing (LOESS) fits plotted in red for asthma samples and blue for non-asthma samples. Solid line represent LOESS fit and dashed lines 95% CI (b) H1N1 geometric mean titre as measured by microneutralization assay. Horizontal line represents the geometric mean and error bars the 95% CI. Statistical analysis performed using unpaired t-test.
a b
10
100
IFN-2a***
LLOD
1
10
100
1000
IFN-***2000
LLOD1
10
TNF-
******
60
1
10
100
1000
IL-6
**********
LLOD
3000
1
10
100
1000
IL-5**
LLOD
3000
1
10
100
IL-13
***
****
LLOD
300
1
10
100
1000
IL-17
****
****
LLOD
1
10
100
1000
IL-10
********
LLOD
pg
/ml
100
1000
10000
CCL2 (MCP-1)
****
50HC Asthma Non-Asthma
1
10
100
1000
CXCL8 (IL-8)
********
HC Asthma Non-Asthma
10
100
1000
CXCL9 (MIG)
******
3000
HC Asthma Non-Asthma
100
1000
10000
CXCL10 (IP-10)
********
50
HC Asthma Non-Asthma
Serum:T1
Figure 2: Serum mediators measured within 24 hours of admission to hospital in individuals with and without asthma. Dots represent individual patients (HC=36, asthma=39, no asthma=91) and error
bars the median and interquartile range. Statistical analysis performed using Kruskal-Wallis and Dunns test with Bonferroni multiple correction; *P<0.05; ** P<0.01; *** P <0.001; **** P <0.0001. Abbreviations:
HC=Healthy Control; LLOD = Lower limit of detection.
1
10
100
1000
IFN-2a
********
2000
LLOD
1
10
100
IFN-
**
200
LLOD
1
10
100
1000
TNF-
*****
LLOD
1
10
100
1000
IL-6
********
LLOD
3000
1
10
IL-5
20
LLOD
1
10
IL-13
*******
LLOD
50
1
10
100
IL-17
LLOD
200
1
10
100
IL-10
*****
LLOD
200
1
10
100
1000
CXCL9 (MIG)
**
LLOD
3000
HC Asthma Non-Asthma
1
10
100
1000
CXCL8 (IL-8)
3000
LLOD
HC Asthma Non-Asthma
10
100
1000
10000
CCL2 (MCP-1)
******
HC Asthma Non-Asthma
10
100
1000
10000
CXCL10 (IP-10)
********
LLOD
HC Asthma Non-Asthma
SAM:T1p
g/m
l
Figure 3: Nasal mediators measured within 24 hours of admission to hospital in individuals with and without asthma. Dots represent individual patients (HC=36, asthma=40, no asthma=92) and error bars the
median and interquartile range. Statistical analysis performed using Kruskal-Wallis and Dunns test with Bonferroni multiple correction.
* P<0.05,
** P<0.01,
*** P<0.001,
**** P <0.0001. Abbreviations: HC=Healthy
Control; LLOD = Lower limit of detection.

Figure 4 | Serum levels of Total IgE and periostin in subjects with and without asthma (a) Total serum IgE and (b) serum periostin levels measured within 24 hours of admission in individual subjects, asthma
(n=37), no asthma (n=92). Horizontal bar represents the median and error bars the interquartile range. Statistical analysis performed using Mann-Whitney test.
A s th m a N o A s th m a
0
2 5 0
5 0 0
7 5 0
1 0 0 0
1 2 5 0
1 5 0 0
To
tal
Se
ru
m I
gE
(IU
/mL
)
A s th m a N o A s th m a
0
2 0
4 0
6 0
8 0
1 0 0
4 0 0
Se
ru
m P
erio
stin
(n
g/m
l)
P = 0 .0 7 3 9 P = 0 .0 8 5 7a b
0
1
2
3
4
5
15
p=0.1342
25
0
10
20
30
4050
p=0.2089
0
1
2
3
4
5
15
p=0.5173
25
0
10
20
30
4050
p=0.7829
0
20
40
60
70
p=0.89
Seru
m P
eri
osti
n (
ng
/ml)
No InhaledCorticosteroids
InhaledCorticosteroids
IL-5 IL-13
IL-5 IL-13 Periostin
pg
/ml
Nasal
Serum
a b
c d e
Figure 5 | Type 2 inflammatory response in subjects with asthma based on presence or absence of pre-admission inhaled corticosteroids (a) Nasal IL-5 and (b) nasal IL-13 levels measured within 24 hours
of admission; subjects on pre-admission inhaled corticosteroids (n=16), subjects not on pre-admission inhaled corticosteroids (n=24). (c) Serum IL-5 and (d) serum IL-13 levels measured within 24 hours of admission;
subjects on pre-admission inhaled corticosteroids (n=16), subjects not on pre-admission inhaled corticosteroids (n=23). (e) Serum periostin levels measured within 24 hours of admission; subjects on pre-
admission inhaled corticosteroids (n=15), subjects not on pre-admission inhaled corticosteroids (n=22). Horizontal bar represents the median and error bars the interquartile range. Statistical comparison performed using Mann-Whitney test.
0
1
2
3
4
5
15
25
p=0.1163
0
10
20
30
4050
p=0.1201
0
1
2
3
4
5
15
25
p=0.5661
0
10
20
30
4050
p=0.2598
0
20
40
60
Seru
m P
eri
osti
n (
ng
/ml)
70
p=0.4941
IL-5 IL-13
IL-5 IL-13 Periostin
pg
/ml
No Oral/I.V.Coritcosteroids
Oral/I.V.Corticosteroids
Nasal
Serum
a b
c d e
Figure 6 | Type 2 inflammatory response in subjects with asthma based on administration of oral/I.V. corticosteroids within 24 hours of admission (a) Nasal IL-5 and (b) nasal IL-13 levels measured within 24
hours of admission; subjects on oral/I.V. corticosteroids (n=15), subjects not on oral/I.V. corticosteroids (n=25). (c) Serum IL-5 and (d) serum IL-13 levels measured within 24 hours of admission; subjects on oral/I.V. corticosteroids (n=15), subjects not on oral/I.V. corticosteroids (n=24). (e) Serum periostin levels
measured within 24 hours of admission; subjects on oral/I.V. corticosteroids (n=14), subjects not oral/I.V. corticosteroids (n=23). Horizontal bar represents the median and error bars the interquartile range. Statistical comparison performed using Mann-Whitney test.
0
2
4
6
8
10
12
p=0.3901
0
10
20
30
40
p=0.7700
05
101520
3035
100200
2000
2500
25
p=0.5093
0
10
20
30
40100200300
p=0.5785
0
10
20
30
40
50
200
400
Seru
m P
eri
osti
n (
ng
/ml)
p=0.5765
No Oral/I.V.Corticosteroids
Oral/I.V.Corticosteroids
pg
/ml
IL-5 IL-13
IL-5 IL-13 Periostin
Nasal
Serum
a b
c d e
Figure 7 | Type 2 inflammatory response in subjects without asthma based on administration of oral/I.V. corticosteroids within 24 hours of admission Nasal IL-5 and (b) nasal IL-13 levels measured
within 24 hours of admission; subjects on oral/I.V. corticosteroids (n=13), subjects not on oral/I.V. corticosteroids (n=79). (c) Serum IL-5 and (d) serum IL-13 levels measured within 24 hours of admission; subjects on oral/I.V. corticosteroids (n=13), subjects not on oral/I.V. corticosteroids (n=78). (e) Serum periostin levels measured within 24 hours of admission; subjects on oral/I.V. corticosteroids (n=13), subjects not oral/I.V. corticosteroids (n=77). Horizontal bar represents the median and error bars the interquartile range. Statistical comparison performed using Mann-Whitney test

Patterns of systemic and local inflammation in patients with asthma hospitalised with
influenza
Akhilesh Jha, Jake Dunning, Tanushree Tunstall, Ryan S. Thwaites, Long T. Hoang, The
MOSAIC Investigators, Onn Min Kon, Maria C. Zambon, Trevor T. Hansel, Peter J.
Openshaw
Supplemental Information
Table E1 | Multivariate logistic regression model of covariates associated with severe outcome
Table E2 | Serum cytokines and chemokines measured within 24 hours of admission
Table E3 | Nasal cytokines and chemokines measured within 24 hours of admission
Table E4 | Nasopharyngeal cytokines and chemokines measured within 24 hours of admission
Figure E1 | Serum level of CRP measured within 24 hours of admission
Figure E2 | Scatterplots of serum mediators differentiated by day of illness (DOI)
Figure E3 | Scatterplots of nasal mediators differentiated by day of illness (DOI)
Figure E4 | Scatterplots of nasopharyngeal mediators differentiated by day of illness (DOI)
Figure E5 | Expression of eosinophil associated genes in subjects with and without asthma

n=133
Table E1 | Multivariate logistic regression model of covariates associated with severe
outcome
Outcome: Death or respiratory failure requiring invasive ventilation
P-value Adjusted OR 95% CI
Asthma Present 0.0521 0.2947 0.0790 - 0.9537
Gender (female as reference) 0.2862 1.6550 0.6611 - 4.2674
Age (18-30 years as reference)
Age 31-40 0.8939 1.0944 0.2847 - 4.1500
Age 41-50 0.6043 1.3669 0.4215 - 4.5728
Age >50 0.0818 3.1190 0.8890 - 11.7696
Admission >4 days 0.0001 5.9084 2.4540 - 15.4449
Seasonal flu vaccination 0.1342 0.4002 0.1120 - 1.2664
Inhaled corticosteroid use 0.2068 0.3573 0.0621 - 1.6321
Oral/I.V. corticosteroids 0.0154 3.4629 1.3036 - 9.9038

HC=Healthy control; A=Asthma; NA=No Asthma
Table E2 | Serum cytokines and chemokines measured within 24 hours of admission
Cytokine or chemokine
Median HC
(n=36)
Median A
(n=40)
Median NA
(n=93)
Dunn’s test with Bonferroni correction; P-value
A vs NA A vs HC NA vs HC IFN-α2α 5.31 8.08 5.07 0.0099 0.0452 1.000
IFN-β 11.67 11.67 11.67 1.000 0.0042 0.0021
IFN-γ 0.32 1.38 2.32 0.1256 0.0806 0.0001
IFN –λ/IL-29 26.84 12.01 12.01 1.0000 0.3816 0.1327
TNF-α 5.17 4.67 6.64 0.0000 0.5235 0.0015 GMCSF 1.06 0.29 0.76 0.4591 0.8004 1.0000
IL-1β 0.78 0.33 0.33 0.2631 1.0000 0.3032 IL-2 4.70 5.09 6.23 0.0906 1.0000 0.2109 IL-4 1.66 0.90 1.02 1.0000 0.0038 0.0011 IL-5 1.06 0.77 1.42 0.0010 0.2020 0.1791 IL-6 3.78 9.98 38.81 0.0005 0.0004 0.0000 IL-10 1.48 4.59 7.49 0.0411 0.0001 0.0000 IL-12p70 3.99 1.75 1.98 0.8897 0.0145 0.0177 IL-13 1.22 2.64 2.91 0.3131 0.0004 0.0000 IL-15 1.63 3.71 4.81 0.1809 0.0000 0.0000 IL-17 3.20 5.56 7.58 0.0197 0.0003 0.0000
CCL2/ MCP-1 415.82 435.19 595.56 0.0038 1.0000 0.0027 CCL3/ MIP-1α 10.99 13.49 13.69 1.0000 0.0725 0.0166 CCL4/ MIP-1β 165.28 125.66 133.52 0.7915 0.0179 0.0291 CCL11/ Eotaxin 1250.70 547.81 621.48 1.0000 0.0002 0.0000 CCL13/ MCP-4 640.96 357.80 394.07 0.8654 0.0017 0.0016 CCL17/ TARC 412.83 263.25 240.04 1.0000 0.0020 0.0007 CCL22/ MDC 4010.90 1381.39 1739.56 0.5969 0.0000 0.0000 CCL26/ Eotaxin-3 2.51 15.75 18.36 0.8089 0.0000 0.0000 CXCL8/ IL-8 7.61 10.99 25.78 0.0000 0.0643 0.0000 CXCL9/ MIG 44.64 68.72 114.22 0.0031 0.0016 0.0000 CXCL10/ IP-10 167.09 721.01 1409.26 0.0546 0.0000 0.0000 CXCL11/ ITAC 60.98 187.57 277.71 0.2949 0.0000 0.0000

HC=Healthy control; A=Asthma; NA=No Asthma
Table E3 | Nasal cytokines and chemokines measured within 24 hours of admission
Cytokine or chemokine
Median HC
(n=36)
Median A
(n=40)
Median NA
(n=93)
Dunn’s test with Bonferroni correction; P-value
A vs NA A vs HC NA vs HC
IFN-α2a 1.31 1.31 1.31 1.0000 0.0000 0.0000
IFN-β 66.05 41.02 49.52 0.7356 0.0604 0.1247
IFN-γ 0.32 1.36 1.60 1.0000 0.0496 0.0495
IFN-λ (IL-29) 12.01 12.01 12.01 1.0000 0.0000 0.0000
TNF-α 1.31 1.83 3.86 0.0674 0.0312 0.0000
GMCSF 1.17 1.63 1.58 0.7172 0.1926 0.0208
IL-1β 31.11 28.03 25.36 1.0000 0.9505 1.0000
IL-2 1.93 2.47 3.49 0.7123 1.0000 0.8696
IL-4 0.40 0.40 0.40 0.2432 0.0000 0.0000
IL-5 1.04 0.65 0.95 0.7025 0.2192 0.4762
IL-6 12.26 54.78 125.68 0.4013 0.0000 0.0000
IL-10 0.78 1.58 1.99 1.0000 0.0041 0.0001
IL-12p70 1.51 1.12 1.45 0.3472 0.3515 1.0000
IL-13 0.76 3.09 2.33 0.1510 0.0000 0.0002
IL-15 1.17 2.26 1.94 0.6601 0.0103 0.0235
IL-17 7.06 9.67 9.01 0.5367 0.2055 0.5915
CCL2/ MCP-1 49.16 160.36 161.93 0.7861 0.0014 0.0000
CCL3/ MIP-1α 8.65 28.61 29.41 1.0000 0.0000 0.0000
CCL4/ MIP-1β 23.33 92.86 135.37 0.6431 0.0005 0.0000
CCL11/ Eotaxin 138.53 253.14 229.45 0.3149 0.0000 0.0000
CCL13/ MCP-4 12.35 13.00 12.88 1.0000 0.4939 0.3527
CCL17/ TARC 4.96 17.67 14.37 0.3462 0.0543 0.2938
CCL22/ MDC 115.93 157.02 158.61 1.0000 0.3130 0.1788
CCL26/ Eotaxin-3 30.91 44.17 38.45 1.0000 0.4245 0.2513
CXCL8/ IL-8 1880.12 2177.42 2326.43 1.0000 1.0000 1.0000
CXCL9/ MIG 212.28 561.13 525.16 0.1771 0.0037 0.0625
CXCL10/ IP-10 773.80 5215.96 4619.65 0.2013 0.0000 0.0000
CXCL11/ ITAC 11.65 126.69 64.50 0.1026 0.0000 0.0010
HC=Healthy control; A=Asthma; NA=No Asthma
Table E4 | Nasopharyngeal cytokines and chemokines measured within 24 hours of admission Cytokine or chemokine
Median HC
(n=36)
Median A
(n=40)
Median NA
(n=93)
Dunn’s test with Bonferroni correction; P-value
A vs NA A vs HC NA vs HC
IFN-α2a 1.31 1.31 1.31 0.2611 0.0016 0.0000
IFN-β 11.67 11.67 11.67 1.0000 0.0394 0.0386
IFN-γ 0.32 1.05 0.32 0.2193 0.6190 0.8937
IFN-λ (IL-29) 12.01 12.01 12.01 0.5483 0.0000 0.0000
TNF-α 0.30 7.90 7.11 1.0000 0.0000 0.0000
GMCSF 0.29 2.01 2.42 1.0000 0.0000 0.0000
IL-1β 0.33 4.76 3.21 1.0000 0.0000 0.0000
IL-2 0.58 5.27 10.08 0.6876 0.0088 0.0001
IL-4 0.40 0.40 1.23 0.7800 1.0000 0.9828
IL-5 0.30 0.90 0.78 1.0000 0.6427 0.6659
IL-6 0.33 10.55 34.27 0.9277 0.0000 0.0000
IL-10 0.28 0.80 0.61 1.0000 0.0000 0.0000
IL-12p70 0.29 1.39 1.13 1.0000 0.2038 0.0796
IL-13 0.78 2.78 1.76 0.2548 0.0000 0.0000
IL-15 0.31 0.66 0.47 1.0000 1.0000 1.0000
IL-17 0.25 9.09 5.20 0.5273 0.0000 0.0000
CCL2/ MCP-1 1.70 66.62 123.56 1.0000 0.0000 0.0000
CCL3/ MIP-1α 1.37 28.04 26.42 1.0000 0.0000 0.0000
CCL4/ MIP-1β 5.25 279.03 135.08 0.8527 0.0076 0.0001
CCL11/ Eotaxin 14.98 850.31 536.97 1.0000 0.0000 0.0000
CCL13/ MCP-4 2.94 38.24 38.26 1.0000 0.0000 0.0000
CCL17/ TARC 4.96 47.84 29.73 0.5485 0.0000 0.0000
CCL22/ MDC 54.39 435.31 375.91 0.8612 0.0000 0.0000
CCL26/ Eotaxin-3 2.51 26.86 17.95 1.0000 0.0000 0.0000
CXCL8/ IL-8 10.40 2173.69 888.60 1.0000 0.0000 0.0000
CXCL9/ MIG 2.52 360.53 216.47 0.9507 0.0000 0.0000
CXCL10/ IP-10 11.98 9004.99 3389.03 0.7205 0.0000 0.0000
CXCL11/ ITAC 0.81 134.15 135.70 0.7444 0.0000 0.0000

Asthma No-Asthma
-10
0
10
20
30
40
50
Wh
ite c
ell
co
un
t
(10
9/L
)P = 0.1015
Asthma No-Asthma
0
10
20
30
40
50
Neu
tro
ph
ils
(10
9/L
)
P = 0.2010
Asthma No-Asthma
0
2
4
6
8
10
12
Lym
ph
ocyte
co
un
t
(10
9/L
)
P = 0.0683
Asthma No-Asthma
0
100
200
300
400
500
CR
P(m
g/L
)
P = 0.0630
a b
c d
Figure E1 | Serum white cell count differential and CRP levels in subjects with and without asthma
Measured within 24 hours of admission in individual subjects: (a) white cell count (asthma n=37, no asthma n=84), (b) neutrophils (asthma n=36 , no asthma n=82), (c) lymphocytes (asthma n=33, no asthma n=79) and CRP (asthma n=37, no asthma n =90) Horizontal bar represents the median and error bars the interquartile range. Statistical analysis performed using Mann-Whitney test.

Figure E2 | Scatterplots of serum mediators differentiated by day of illness (DOI)
Dots represent individual samples up to two samples collected per subject. Red dots represent asthma (n=64), blue dots represent no asthma (n=155). First sample collected within 24 hours of admission and second sample between 48-72 hours of admission. DOI represents number of days elapsed between subject-reported symptom onset and time of sampling. Locally weighted scatterplot smoothing (LOESS) fits plotted in red for asthma samples and blue for non-asthma samples. Solid line represent LOESS fit and dashed lines the 95% CI.

Figure E3 | Scatterplots of nasal mediators differentiated by day of illness (DOI)
Dots represent individual samples with up to two samples collected per subject. Red dots represent asthma (n=65), blue dots represent no asthma (n=153). First sample collected within 24 hours of admission and second sample between 48-72 hours of admission. DOI represents number of days elapsed between subject-reported symptom onset and time of sampling. Locally weighted scatterplot smoothing (LOESS) fits plotted in red for asthma samples and blue for non-asthma samples. Solid line represent LOESS fit and dashed lines the 95% CI
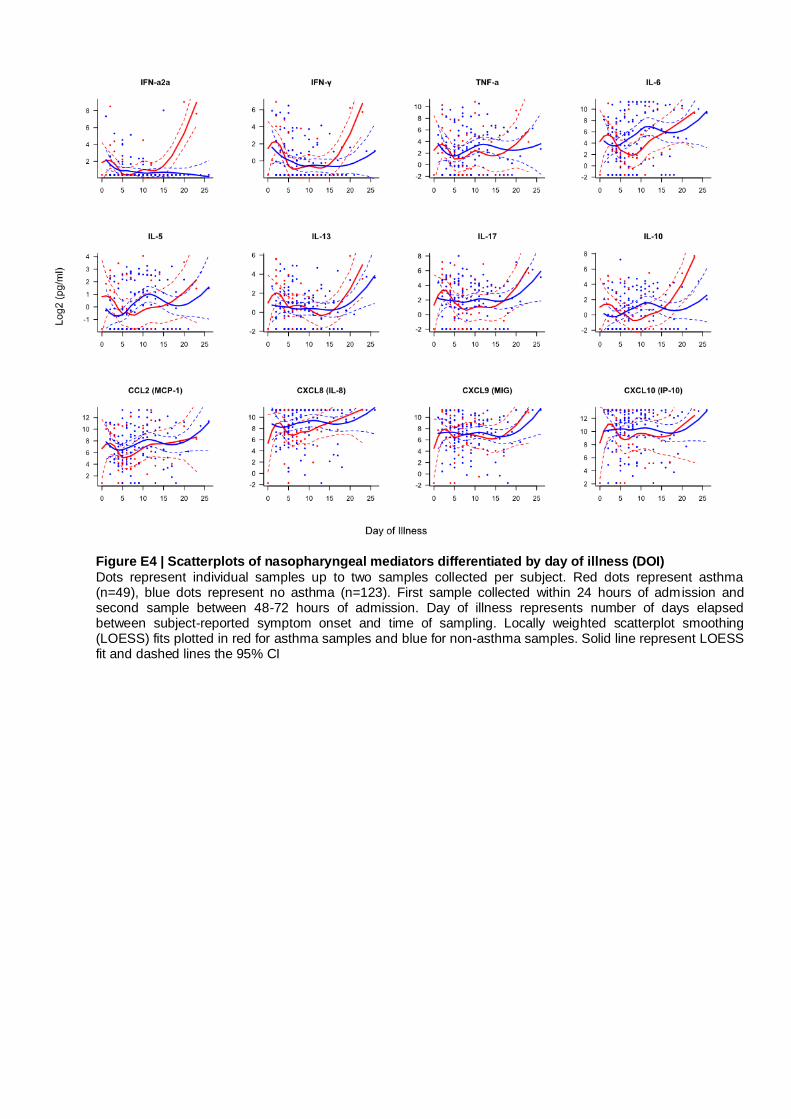
Figure E4 | Scatterplots of nasopharyngeal mediators differentiated by day of illness (DOI)
Dots represent individual samples up to two samples collected per subject. Red dots represent asthma (n=49), blue dots represent no asthma (n=123). First sample collected within 24 hours of admission and second sample between 48-72 hours of admission. Day of illness represents number of days elapsed between subject-reported symptom onset and time of sampling. Locally weighted scatterplot smoothing (LOESS) fits plotted in red for asthma samples and blue for non-asthma samples. Solid line represent LOESS fit and dashed lines the 95% CI

Figure E5 | Expression of eosinophil associated genes in subjects with and without asthma Whole
blood samples were collected within 24 hours of admission for gene expression. RNA was extracted and analysed using Illumina microarray and the data normalized. Dots represent individual patients (asthma=33, no asthma=74) with horizontal bar representing the mean and error bars the 95% CI. Statistical analysis performed using unpaired t-test
A s th m a N o A s th m a
0
2
4
6
8
1 0
C E B P E
No
rm
ali
se
d I
nte
ns
ity
Sig
na
l
P -v a lu e 0 .8 0 2 8
A s th m a N o A s th m a
0
2
4
6
8
1 0
D A C H 1
No
rm
ali
se
d I
nte
ns
ity
Sig
na
l
P -v a lu e 0 .7 7 0 7
A s th m a N o A s th m a
2
4
6
8
L G A L S 1 2
No
rm
ali
se
d I
nte
ns
ity
Sig
na
l
P -v a lu e 0 .9 2 4 0
A s th m a N o A s th m a
0
2
4
6
8
1 0
1 2
1 4
C L C
No
rm
ali
se
d I
nte
ns
ity
Sig
na
l
P -v a lu e 0 .0 0 6 2
A s th m a N o A s th m a
0
2
4
6
8
1 0
E M R 1
No
rm
ali
se
d I
nte
ns
ity
Sig
na
l
P -v a lu e 0 .0 1 2 4
A s th m a N o A s th m a
2
4
6
8
E M R 4 P
No
rm
ali
se
d I
nte
ns
ity
Sig
na
l
P -v a lu e 0 .0 9 4 5
Related Documents