KWAME NKRUMAH UNIVERSITY OF SCIENCE AND TECHNOLOGY, KUMASI COLLEGE OF SCIENCE DEPARTMENT OF CHEMISTRY DETERMINATION OF ARSENIC CONCENTRATION AND OTHER PHYSICOCHEMICAL PARAMETERS IN GROUNDWATER AT OBUASI A PROJECT SUBMITTED TO THE DEPARTMENT OF CHEMISTRY, COLLEGE OF SCIENCE: KNUST-KUMASI IN PARTIAL FULFULMENT OF THE REQUIREMENTS FOR THE AWARD OF BSc. DEGREE IN CHEMISTRY BY: OSEI ATTA ISAAC SUPERVISOR: MR. JOSEPH APAU MAY, 2014

Welcome message from author
This document is posted to help you gain knowledge. Please leave a comment to let me know what you think about it! Share it to your friends and learn new things together.
Transcript

KWAME NKRUMAH UNIVERSITY OF SCIENCE AND TECHNOLOGY,
KUMASI
COLLEGE OF SCIENCE
DEPARTMENT OF CHEMISTRY
DETERMINATION OF ARSENIC CONCENTRATION AND OTHERPHYSICOCHEMICAL PARAMETERS IN GROUNDWATER AT OBUASI
A PROJECT SUBMITTED TO THE DEPARTMENT OF CHEMISTRY, COLLEGEOF SCIENCE: KNUST-KUMASI IN PARTIAL FULFULMENT OF THEREQUIREMENTS FOR THE AWARD OF BSc. DEGREE IN CHEMISTRY
BY:
OSEI ATTA ISAAC
SUPERVISOR: MR. JOSEPH APAU
MAY, 2014
KWAME NKRUMAH UNIVERSITY OF SCIENCE AND TECHNOLOGY,
KUMASI
COLLEGE OF SCIENCE
DEPARTMENT OF CHEMISTRY
DETERMINATION OF ARSENIC CONCENTRATION AND OTHERPHYSICOCHEMICAL PARAMETERS IN GROUNDWATER AT OBUASI
A PROJECT SUBMITTED TO THE DEPARTMENT OF CHEMISTRY, COLLEGEOF SCIENCE: KNUST-KUMASI IN PARTIAL FULFULMENT OF THEREQUIREMENTS FOR THE AWARD OF BSc. DEGREE IN CHEMISTRY
BY:
DANSO NINA
OSEI ATTA ISAAC
OKLU KOMLA NOVISI

SUPERVISOR: MR. JOSEPH APAU
MAY, 2014

DECLARATIONWe hereby solemnly declare that this work is based on the
study undertaken by us. It represents the genuine records of
the task we set ourselves to accomplish. To the best of our
knowledge, no part of it has been previously presented for
award in any institution of higher learning.
………………………….. ……………………………..
Danso Nina Date
………………………….. ……………………………..
Osei Atta Isaac Date
………………………….. ……………………………..
Oklu Komla Novisi Date
………………………….. ……………………………..
Mr. Joseph Apau Date
i

(Supervisor)
ii

ACKNOWLEDGEMENTWe thank the Almighty God for how far He has brought us and
for the grace and strength to go through this project
successfully.
We say a big ‘Thank you’ to everyone who supported us in one
way or the other to accomplish this project. Our immense
gratitude however goes to Mr. Theophilus Nicholas Bruce
(Environmental Department, AGA-Obuasi), Mr. Charles Amoako
(Director of Testing Division, GSA), John and Malik
(Metallic laboratory, GSA) and finally Steven Bandoh and
Henry Jumpah (Chemistry Department, KNUST).
Our sincere appreciation goes to Mr. Joseph Apau, our
supervisor for his guidance and for spending time off his
busy schedule to attend to our project.
God bless you all.
iii

DEDICATIONWe dedicate this project to God Almighty and also to our
families especially, Mr. and Mrs. Danso, Mr. Timothy Oklu
and Mrs. Christiana Oklu, and then finally Mr. Anane
Thompson, for their love, support and encouragement
throughout all these years.
iv

SUPERVISOR’S APPROVAL“DETERMINATION OF ARSENIC CONCENTRATION AND OTHER
PHYSICOCHEMICAL PARAMETERS IN GROUNDWATER AT OBUASI”
I do hereby promulgate that, Danso Nina, Osei Atta Isaac and
Oklu Komla Novisi have been the genuine writers of this
project work and have written it all by themselves. I
supervised this research. I duly approve of their work.
Supervisor’s Name Mr. Joseph Apau
Signature ..…………………….
Date ....……………………
v

ABREVIATIONS
OEPA – (Ohio Environmental Protection Agency)
DEQ – (Department of Environmental Quality, Wyoming)
WHO – (World Health Organisation)
RPD – (Relative Percentage Difference)
EPA – (Environmental Protection Agency)
vi
ABSTRACT
Arsenic is widely distributed in nature. Arsenic toxicity is
a global health problem affecting many millions of
people.Obuasi, considering its geology has arsenopyrites
occurring there naturally hence it is important to know the
background Arsenic concentrations especially in groundwater.
Ten borehole samples were selected for the study. Arsenic
concentrations together with some physico-chemical water
parameters were determined. The results obtained are as
follows: pH, 3.80 – 5.67; Total Dissolved Solids (TDS),
21.94 – 320.45mg/l; Temperature, 26.80 – 29.00˚C;
Conductivity, 31.91 – 459.15µS/cm; Turbidity, 0.21 –
2.58NTU; Total Hardness, 2.79 – 132.06mg/l; Alkalinity, 10 –
140mg/l; F-, 1.663 – 5.152mg/l; Cl-, 10.039 – 85.279mg/l;
NO3-, 3.754 – 59.414mg/l; SO42-, 3.692 – 21.709mg/l; Na,
1.243 – 54.176mg/l; K, 0.203 – 12.045mg/l; Ca, 0.858 –
11.701mg/l; Mg, 25.561 – 72.038mg/l, As, 0.12055 –
2.4367µg/l. Two methods were used to determine the
background arsenic concentrations, the DEQ and the OEPA
vii

methods. The estimated arsenic concentrations obtained from
the methods were 0.533875µg/l and 0.550425µg/l respectively.
viii

CHAPTER ONE
1.0 INTRODUCTION
1.1 ArsenicThe semi-metal Arsenic is a naturally occurring element
found in small quantities practically everywhere, in soil,
water, and air. Arsenic appears in three allotropic forms:
yellow, black and grey; the stable form is a silver-gray,
brittle crystalline solid. It tarnishes rapidly in air, and
at high temperatures burns forming a white cloud of arsenic
trioxide. Arsenic is a member of group Va of the periodic
table, which combines readily with many elements. The
metallic form is brittle, tarnishes and when heated it
rapidly oxidizes to arsenic trioxide, which has a garlic
odor. The non metallic form is less reactive but will
dissolve when heated with strong oxidizing acids and alkalis
(Lenntech, 2014).There are series of arsenic compounds and
these have different properties (Smedley & Kinniburgh,
2002). Arsenic occurs in natural watersmainly as arsenite
[As(III)], arsenate [As(V)], monomethylarsonic acid (MMA,
1
oxidation stateV), or dimethylarsinic acid (DMA, oxidation
state V). (Shraimet al., 2002; Hung et al., 2004).
In nature arsenic occurs in air,soil, water, rocks, plants,
and animals. Natural activities suchas volcanic eruption,
rocks erosion and forest fires, can release arsenic to the
environment.Anthropogenic activities such as farming,
mining, uses of fossil fuels, pulp and paper production,
cement manufacturing and others, contribute as additional
sources of arsenic in the environment.
The major sources of arsenic in natural waters include
arsenic minerals, together with aoncewidespread use of
arsenic in pigments, insecticides and herbicides. About 70%
of all arsenicuses are in pesticides.Many studies document
the adverse health effects in humans exposed to inorganic
arsenic compounds (Panagiotaras et al., 2012).
1.2 Applications of ArsenicArsenic and its compounds are in wood preservatives, glass
manufacture, electronics, catalysts, alloys, feed additives
and veterinary chemicals. It also finds its use in the
semiconductor gallium arsenade, which has the ability to2

convert electric current to laser light. Arsine gas AsH3,
has become an important dopant gas in the microchip
industry, although it requires strict guidelines regarding
its use because it is extremely toxic (Lenntech B. V, 1998-
2014).
1.3 Toxicity of ArsenicArsenic toxicity is a global health problem affecting many
millions of people. Contamination is caused by arsenic from
natural geological sources leaching into aquifers,
contaminating drinking water and may also occur from mining
and other industrial processes. Arsenic is present as a
contaminant in many traditional remedies. Arsenic is a well
documented human carcinogen affecting numerous
organs.Absorption occurs predominantly from ingestion from
the small intestine, though minimal absorption occurs from
skin contact and inhalation. Arsenic exerts its toxicity by
inactivating up to 200 enzymes, especially those involved in
cellular energy pathways and DNA synthesis and repair
(Ratnaike R. 2003).
3

Among the arsenic species that are present in natural
waters, inorganicarsenicals [As(III) and As(V)] are
considered as the most toxic species followed by MMA andDMA
(Hughes, 2002; Shraimet al., 2003). Inorganic arsenic
compounds, e.g. arsenic trioxide (As2O3), are reactive and
may have veryharmful effects on the body
(Smedley&Kinniburgh, 2002).Inorganic arsenicals have been
classified as group-Icarcinogens and were included in the
US-EPA “list of priority pollutants” (Shraim et al,2008 ).
Acute or immediate symptoms of a toxic level of exposure to
arsenic may include Vomiting, Abdominal pain, Diarrhea, Dark
urine (termed black water urine), Dehydration, Cardiac
problems, Hemolysis (destruction of red blood cells),
Vertigo, Delirium, Shock, Death. Long-term exposures to
arsenic lower than toxic levels can lead to skin changes
(darkening or discoloration, redness, swelling and
hyperkeratosis (skin bumps that resemble corns or warts).
Whitish lines (Mees' lines) may appear in the fingernails.
Both sensory and motor nerve defects can develop.
Additionally, liver and kidney function may be affected
4
(Davis C.P. 2013) .Due to the toxicity of inorganic
arsenicals, many countries have lowered theirarsenic
drinking water guidelines to less than or equal to 10 μg/L
[e.g. Australia, WHO, andUSEPA] (Shraimet al., 2000). There are
no evidence based treatment regimens to treat chronic
arsenic poisoning but antioxidants have been advocated,
though benefit is not proven. The focus of management is to
reduce arsenic ingestion from drinking water and there is
increasing emphasis on using alternative supplies of water
(Ratnaike R. 2003).In natural conditions there is a much
higher probabilityof elevated arsenic concentrations in
groundwater than in surface water (Smedley&Kinniburgh,
2002).
1.4 Arsenic in ObuasiThe area around the Obuasi mining operation is known for its
naturally high level of arsenic inbedrock and soil, which
originates from minerals such as arsenopyrite (FeAsS).
Arsenic seeps naturally intothe water of the area. Moreover,
long-time mining activity has caused large amounts ofarsenic
to be released, adding to the current pollution. Obuasi ore5

occasionally contains very largeamounts of arsenic
(Ahmad&Carboo, 2000). The crushing and grinding of ore, as
well as the processing and exposure of oreto water result in
sharply increased amounts of arsenic in water. For decades
therehas been information available about very high arsenic
pollution levels at Obuasi (Amase, S.K. 1975; Amonoo-Neizer,
et al, 1996; Smedley, P.L. 1996).The Anglogold Ashanti
company is aware of concerns raised by local residents and
NGO’s in respect to elevated levels of arsenic in and around
Obuasi. One of the main significant areas of concern is the
safe disposal of the tailings. When the host rock is crushed
to release the gold, arsenic together with the base metals
may be released into the tailings or waste residues. As a
short term remediation step, a lined storage dam has been
constructed where tailings are moved, stored and gradually
disposed off, by blending. This controls arsenic
contamination by their mining activities but yet still, high
levels of arsenic are recorded. It is unclear whether all
existing arsenic levels are naturally occurring or due to
mining activities (AGA, 2006).
6
1.5 PROBLEM STATEMENTArsenic is widely distributed in nature (Smedley et al.,
1996). Various surveys have been conducted which have served
to quantify levels of arsenic in different environments and
have provided an understanding of the natural and the
anthropogenic sources of arsenic concentration in drinking
water (Smedley and Kinniburgh, 2002). The main source of
arsenic exposure for the general population is ingestion of
surface and groundwater sources (Smedley et al., 1996).
Concentrations of arsenic in groundwater reach up to 64µgl-
1. The main sources are mine pollution and by natural
deposits like arsenopyrites(FeAsS) (Smedley, et al,
1996).Obuasi, considering its geography has arsenopyrites
occurring there naturally. Therefore, it is unknown as to
how much arsenic occurs in their groundwater naturally and
it is however not clear whether a groundwater source has
been polluted from mining activities or by natural deposits
(AGA, 2006). This can be solved by estimating a background
concentration of the Arsenic in groundwater at Obuasi.7

1.6 JUSTIFICATIONBackground concentration is the amount of naturally
occurring chemical substances derived from natural processes
in the environment as close as possible to natural
conditions, exclusive of specific anthropogenic activities
or sources. The source of these naturally occurring chemical
substances is typically from processes such as erosion and
dissolution of mineral deposits and they are found in
groundwater at varying concentration (EPA, 2008). Therefore,
background analyses are essential for distinguishing between
groundwater that has been impacted by natural processes and
groundwater that has been impacted by anthropogenic
activities. It will also help environmental agencies set up
remediation levels.
8

1.7 OBJECTIVESThe main objective of this project is to determine the
background concentration of arsenic in groundwater atObuasi
by taking samplesfrom areas that have not been affected by
mining activities. The specific objectives of this research
are:
To identify areas of Obuasi Township that has not been
affected by mining activities by using the groundwater
flow.
To collect groundwater samples from boreholes of these
areas.
To determine some physico-chemical properties of the
water samples.
To determine the levels of arsenic of the water
samples.
To estimate the background concentration of arsenic
from the results.
9

CHAPTER TWO
2.0 LITERATURE REVIEW
2.1 Mining operation in ObuasiLarge-scale commercial extraction of gold at Obuasi started
at the end of the 19th century. Thecompany Ashanti
Goldfields Corporation Limited was a very important economic
player in the Britishcolony of the Gold Coast, and later,
after 1957, in the independent country of Ghana. Today the
goldmining is continued by AGA (GPFG, 2012).
Currently the gold production at Obuasi is based on
underground mines that operate down to 1,500 mbelow ground.
The ore consists of two main types, one which is made up of
quartz veins containingfree gold and another one with
sulphide minerals such as arsenopyrite in which the gold is
bound sothat the ore requires special treatment. In the
early 1990s, an arsenic precipitation plant was installed at
the Pompora Treatment Plant (PTP) in Obuasi for the
commercial recovery of arsenic from the roaster flue gases.
10

The arsenic trioxide was precipitated, recovered, placed in
bags, and initially sold into Europe for commercial
applications (arsenic trioxide is used for preserving wood
and as a pesticide). However, the market for arsenic
declined and this ultimately led to the cessation of sales
in the mid-1990s. With no markets, or alternative disposal
methods, bags of arsenic were accumulated on site at Obuasi,
creating a large stockpile of approximately 10,000 tons of
unusable product. The PTP roaster facility was shut down in
2000 and arsenic generation ceased.
In the interim, the Biox treatment process was introduced at
the SansuSulphide Treatment Plant (STP). During this
process, arsenic trioxide is converted to arsenic pentoxide
(and other more stable compounds) and deposited onto the
tailings dams. It appears, however, that over the years, the
Pompora stream has been polluted by arsenic from Obuasi as a
result of inadequate storage of the stockpiled bags. This
issue was identified as a significant concern during the
AngloGold due diligence study, prior to the business
combination with Ashanti. Subsequently, AngloGold Ashanti
11

has set about addressing the problem.As a short-term
remediation step, a lined storage dam has been constructed
at the old heap leach site, at the south end of the mine
adjacent to the new STP plant. This is a secure area where,
with all the appropriate personnel protective equipment and
handling facilities, it will no longer pose an uncontrolled
hazard. The bagged arsenic is being moved to this new
facility where it will be stored and gradually disposed of
by blending it into the Biox process circuit (at a pre-
determined rate) where it will be chemically stabilised.
From the STP it will be deposited as a component of the
tailings residue onto the Sansu Tailings Storage Facility.
At current production rates, it will take approximately six
years to dispose off in this fashion. One of the
alternatives to disposing off the arsenic trioxide into a
lined hazardous waste land-fill facility, which will require
indefinite management, is to convert the arsenic into a more
stable complex and dispose of it onto the conventional
tailings storage facility. This approach continues to be
evaluated.
12

The Ghanaian Environmental Protection Agency (EPA) has given
its permission for the arsenic to be moved to the new
holding pond where it will be stored until the EPA is
satisfied that the Biox treatment process is a reliable
method of disposal (AGA, 2004).
2.2 Water Sources in ObuasiGroundwater is the major source of water supply for
communities in and around the Obuasi municipality. The
occurrence of groundwater depends on the geology and areas
where the rocks are highly weathered, fractured or inter-
bedded with quartz veins. The groundwater flow is mostly
restricted to joints, fractures or other openings within the
crystalline rock formations and borehole yields are
therefore often limited. In someareas, the regolith provides
potential for increased groundwater storage. The bedrock is
not inherently permeable but secondary permeability or
porosity has developed because of fracturing and weathering.
In general, two types of aquifers are identified: weathered
rock aquifers and fractured rock aquifers that can be
categorized as confined or semi confined.Apart from the13

natural drainage line, the municipality also has rivers and
streams that drain the area: Pompo,Akapori, Kwabrafo, Nyam,
Kwaw, Enewopeanom, NkesuandGyimi. Others include Wheaseamo,
Konka, and Nyankuma streams (Ewusi et al, 2012).
2.3 Arsenic mobility in aquifersThe conditions that favour arsenic dissolution (becoming
dissolved in the water) and mobilization (movement with the
groundwater to boreholes) depend on certain circumstances.
If the arsenic is not soluble, it will precipitate and
remain in the solid phase of the groundwater system as part
of the soil. If there is a binding site on the soil surface
that is available, and the arsenic is in a form that binds
strongly, it will also leave the water phase and attach to
the soil. So for most types of arsenic, they’ll just stay
put. The deciding factor is probably some process that
converts those stable, insoluble or stuck-on-surfaces forms
of arsenic to a form that is soluble in the water (Macrae,
2014).
Two categories of processes largely control arsenic mobility
in aquifers: (1) adsorptionand desorption reactions and (2)14

solid-phaseprecipitation and dissolution reactions.
Arsenicadsorption and desorption reactions are influenced by
changes in pH, occurrence of redox(reduction/oxidation)
reactions, presence ofcompeting anions, and solid-phase
structuralchanges at the atomic level. Solid-phase
precipitation and dissolution reactions are controlled by
solution chemistry, including pH,redox state, and chemical
composition (Hinkle et al., 1999).Most of the arsenic found
in groundwater is either inorganic As(III) mainly as
uncharged arsenious acid, or inorganic As(V) in the form of
arsenic acid minus one or two of its protons (so with a
charge of –1 or –2). That’s the case at neutral pH.The
charge on As(V) allows it to bind to sites on the surface of
soil particles, removing it from the water. As the pH is
raised, the compounds will tend to become more and more
negatively charged as the arsenic and arsenious acid lose
H+groups. So the charge of these arsenic compounds depends
on the pH. You might (rightly) guess that as the pH goes up,
the charge on the arsenic compounds becomes more negative
and they should be better at binding to positively charged
15
sites on the soil surface. The trouble is that the soil
binding sites are also affected by the pH. As the pH goes up
and the water becomes more basic, OH- groups from the water
also associate with the adsorption or ion exchange sites on
the soil, neutralizing them. Once they have been
neutralized, they are not attractive to the arsenic
compounds. The solubility of metals in water is also
affected by pH, so if you get to a pH that dissolves the
mineral phase, that will result in the release of anything
bound to it. So instead of decreasing in concentration, the
arsenic concentration in high pH water can actually go up.
There is a general trend between pH and arsenic
concentration in groundwater. As the pH increases, the
arsenic concentration tends to go up (Macrae, 2014).Under
reducing conditions, the most stable soluble form of
inorganic arsenic is arsenious acid (As(III)). Under
oxidizing conditions, most of the arsenic will be in the
As(V) form, arsenic acid, because it is more stable under
oxidizing conditions. Again, the mobility of arsenic may
depend on its charge, so at neutral pH, arsenious acid is
16

more mobile than the dissociated forms of arsenic acid. That
means arsenic will probably be more mobile under reducing
conditions because more of the arsenic will be present as
arseniousacid.Just as the pH of the system affects binding
sites on soil particles, the redox potential also affects
the binding sites. Many of the binding sites for arsenic are
made of oxidized iron, aluminum or manganese species that
form a coating on the soil particles or on the rock surface.
Sometimes, the metals on the soil surface can also be
reduced, releasing them into solution. That means the
binding sites are no longer available on the surface and the
arsenic that used to be bound is released into solution.That
makes two independent factors that are likely to increase
the mobility of arsenic under reducing conditions; reduction
of As(V) to As(III), which is more mobile and reduction of
binding sites, releasing bound arsenic (Macrae, 2014).
2.4 Background ConcentrationsNaturally-occurring background concentrations are the
concentrations of metals in the environmentthat existed
before any human activities (e.g., waste management, mining,17

industrial activities) mayhave affected those
concentrations. Naturally-occurring background
concentrations of metals mayvary regionally and locally
based on the soil and bedrock present (DEQ, 2000).
2.5 Locations for background groundwater samplingChemicals can be transported with groundwater over long
distances down gradientof their sources; groundwater flow
direction is therefore a primaryconsideration when selecting
locations for background groundwater sampling,or evaluating
existing well networks. Areas up gradient of a site
orpotential contaminant source typically are considered the
best locations for
background groundwater monitoring wells. However, side-
gradient or evendown gradient locations also may be suitable
for background wells. Chemicalcharacteristics of groundwater
can vary significantly with depth. Therefore,
samplingdepths, aquifer thickness, and chemical properties
should be considered whenevaluating background conditions
(Naval Facilities Engineering Command, 2004).
18

The appropriate locations to sample for site-specific
background are those that match, as closely aspossible, the
same conditions that the onsite data represent but that are
unaffected by humanactivities. This means that the sampling
locations should be as close in distance to your site
aspossible, and not influenced by site or other
anthropogenic sources (DEQ, 2000).
2.6 Arsenic DeterminationTotal arsenic in the environment samples is measured most
often by Atomic Absorption Spectrophotometer (AAS), mainly
coupled to Hydride Generation (HG-AAS) and electro-thermal-
AAS (ET-AAS). Other methods employed include Atomic
Fluorescence Spectrometry (AFS), Atomic Emission
Spectrometry (AES), generally with ICP (ICP-AES) have been
successfully coupled to HPLC for arsenic speciation,
Inductively Coupled Plasma-Mass Spectrometry (ICP-MS), X-ray
Spectrometry, Neutron-Activation Analysis (NAA) and
Capillary Electrophoresis (CE).
19
2.7 Determination of Background Concentration
2.7.1 The DEQ MethodThe background concentration is calculated based on the 90th
percentile of thedata set. Note that this is not a tolerance
interval approach, but a direct estimate of the actual
datapercentile. There are two basic approaches to this
calculation. If the background data set containsnine or
fewer samples, then background concentrationlevels are
established usinga non-parametric method. If the background
data set has 10 or moresamples then background concentration
levels are calculated using either aparametric or non-
parametric approach. Typically a parametric approach is used
if the backgrounddata set is lognormally or normally
distributed based on criteria described below. If
thebackground data set is not lognormally or normally
distributed based on these distributional testcriteria, then
a non-parametric method is used (DEQ, 2000).
2.7.1.1 Non-Parametric Estimating TechniquesFor background sample data sets with nine or fewer samples,
for data sets with more than 50
20

percent non-detect values, or for data sets where the
distribution is neither normal nor log-normal,non-parametric
methods should be used to estimate the background level. The
background concentration used for comparison with the
cleanup level is the 90th percentilevalue from the
background data set. Note that if you have 9 or fewer
samples, the 90th percentileshould be set at the maximum
value of the data set. Note that for a data set containing
between 5and 9 samples, the maximum value of the data set
will represent a value that is less than or equalto the 90th
percentile of the data set and therefore is biased low.
The responsible party can eliminate this low bias by
collecting additional samples. For example, the maximum
value of 9 samples is more likely to be higher than the
maximum value of 5 samplessimply due to random chance.To do
the calculation by hand, arrange the background data set in
order of lowest to highestconcentration. Assign the lowest
value a rank of 1, the second lowest value a rank of 2,
andcontinue until all concentrations have been ranked. The
largest concentration will have a rank of“n”, where “n” is
21
the total number of data points in the data set. If two
samples have the sameconcentration, list those
concentrations consecutively and assign each a rank. If the
data setincludes non-detect results (censored data), those
results should be ranked before the lowestdetected
concentrations.
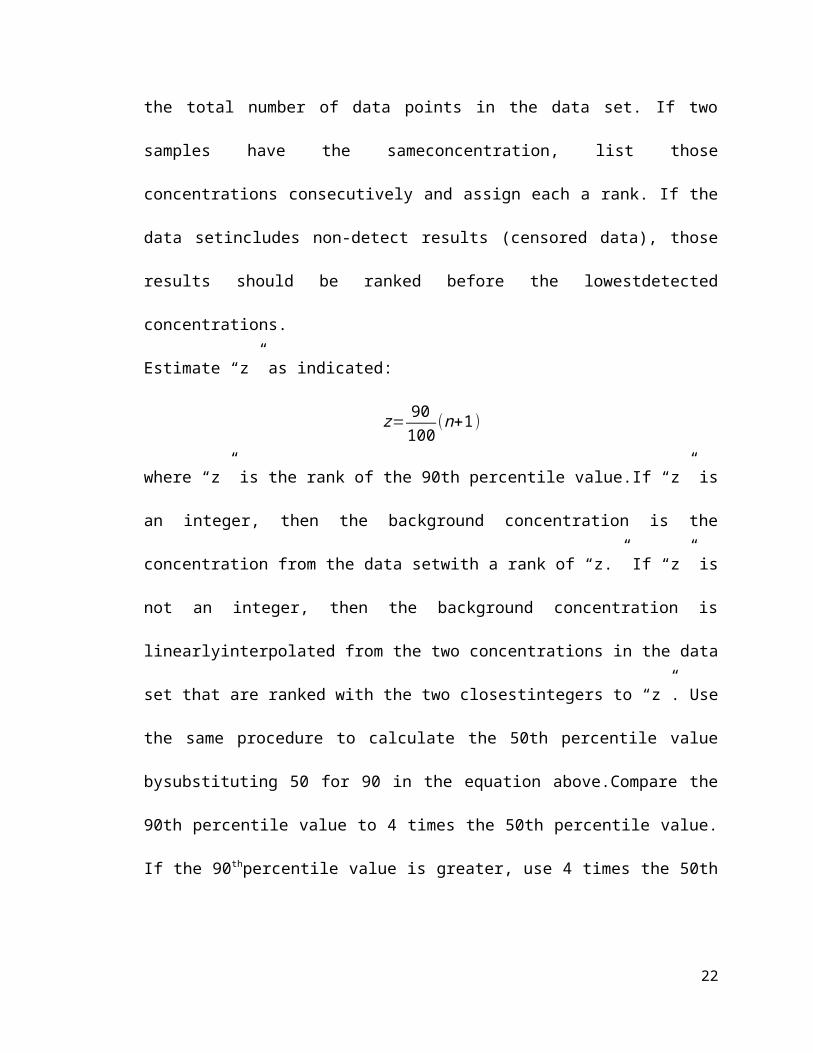
Estimate “z” as indicated:
z= 90100
(n+1)
where “z” is the rank of the 90th percentile value.If “z” is
an integer, then the background concentration is the
concentration from the data setwith a rank of “z.” If “z” is
not an integer, then the background concentration is
linearlyinterpolated from the two concentrations in the data
set that are ranked with the two closestintegers to “z”. Use
the same procedure to calculate the 50th percentile value
bysubstituting 50 for 90 in the equation above.Compare the
90th percentile value to 4 times the 50th percentile value.
If the 90thpercentile value is greater, use 4 times the 50th
22

percentile value as the background level;otherwise, use the
90th percentile value as the background level (DEQ, 2000).
2.7.1.2 Parametric Estimating TechniquesFor background sample data sets with 10 or more samples,
normal or lognormal distribution, and
not greater than 50 percent non-detect results, parametric
(statistical) methods should be used to
estimate the background level. The procedures for
determining if the data set meets the criteria foruse of a
parametric method and a default parametric method for
estimation of site background aredescribedas follows.
Establish the distribution of each data set. Whether a data
set is normally or lognormally
distributed will determine how subsequent statistical tests
and/or calculations are conducted.
The responsible party should assume the data is lognormally
distributed and test this distribution first. Ifa lognormal
distribution is rejected, then a normal distribution should
be tested. This is becausethe lognormal distribution is most
commonly associated with environmental data sets. If the23

points fall on an approximately straight line, the
distribution is judged to be normally distributed. For
lognormal data, the data are transformed first using the
natural logarithm of the data. If the log-transformed points
fall on a relatively straight line, the distribution is
judged to be lognormally distributed and all further
statistical analyses should be done using the log-
transformed data. If the data are neither normally nor
lognormally distributed, use a non-parametric method to
estimate the background concentration.
Identify the site-specific background concentration by
calculating the 50th and 90thpercentile value from the
distribution (not the sample data set). Compare the
90thpercentile value to 4 times the 50th percentile value.
If the 90th percentile value is greater,use 4 times the 50th
percentile value as the background level; otherwise, use the
90thpercentile value as the background level. The 50th and
90th percentile of a normallydistributed data set can be
calculated using the following formula:
X50 = x, and
24

X90= x + 1.28 x S
where:
X50 is the rank of the 50th percentile value
X90 is the 90th percentile value
x is the sample mean
S is the sample standard deviation (DEQ, 2000).
2.7.1.3 Evaluation of distribution of dataPrepare a normal probability plot by following these steps:
1. Calculate the natural logarithm of each data point.
2. Rank the data.
3. Calculate the percentile associated with each rank using
the formula:p = (x-0.375)/(n+0.25)
where:
n = total number of data points
p = percentile
x = rank
4. Calculate the normal score associated with each
percentile using the Excel™ function
NORMINV(x,0,1)
where:25

x = the percentile
0 = the mean of the standard normal distribution
1 = the standard deviation of the standard normal
distribution.
5. Plot Normal Score (x axis) versus Logarithm of Data (y
axis).
6. Inspect the plot visually.
A measure of how the data fit a straight line can be
quantified byperforming a linear regression of Normal Score
versus Data and calculating the linearregression correlation
coefficient. This can be done using the linear regression
routine inExcel™.Generally, a correlation coefficient of
greater than 0.90 is sufficient to assume thedata fits the
tested distribution (DEQ, 2000).
2.7.2 The OEPA MethodAnother method developed by the (Ohio EPA, 2009) can be
used. It states that, the determination of background levels
employs a method commonly associated with a graphical
technique for the detection of outliers from a population26

(i.e., box plot). This methodology also can be used for the
selection of a reasonably-protective estimation of an upper-
bound value of a data set. Specifically, background
concentration levels are to be calculated as the upper
cutoff value of the data set defined as the upper quartile +
1.5 (interquartile range).
The upper cutoff value is to be calculated using the
following equation:
U = Q3 + k(Q3 - Q1)
Where, Q1 is the lower quartile, Q3 is the upper quartile,
(Q3 - Q1) is the interquartile range, and the multiplicative
constant k is one of two factorsfor determining the upper
cutoff value.The common range for k is between 1.5 and 3.0.
For the “standard” boxplot, k equals 1.5 hence for this
purpose (selection of a background concentration), a value
of 1.5 is recommended for k. Many software applications have
functions that can be used to identify the quartile values
of a data set an example is Microsoft Excel’s® QUARTILE. The
upper cutoff value is to be used as the background
27
concentration level and it should be compared to samples
taken on-site on a point by point basis. No reduction of
site data, such as developing an average concentration term,
should be considered. Any site concentration exceeding the
background level (upper cutoff level) should be considered
evidence of contamination.
2.8 Some Physical water parametersPhysical parameters of pollution include but not limited to
pH, temperature, colour, turbidity, electrical conductivity,
light permeability, suspended matter and dissolved matter.
2.8.1 Electrical ConductivityThe electrical conductance of water is a measure of the
ability of the water to conduct electricity. It is also an
indirect measure of the presence of ions, such as nitrate,
sulfate, phosphate, sodium, magnesium, calcium, and iron.
These substances conduct electricity because they are
negatively or positively charged when dissolved in water.
The concentration of dissolved solids, or the conductivity,
is affected by the bedrock and soil in the watershed. It is
28

also affected by human influences. For example, agricultural
runoff can raise conductivity because of the presence of
phosphate andnitrate. It is important to measure the
conductivity of water because aquatic organisms require a
relatively constant concentration of the major dissolved
ions in the water.
Levels too high or too low may limit survival, growth or
reproduction. Electrical conductivity is affected by
temperature, it is thus important to report temperature data
along with conductivity values. In unpolluted waters,
conductance increases by 2 to 3% per °C. The international
standard temperature to which conductivity measurements are
corrected is 25°C. This measurement is expressed in
microsiemens per centimeter (uS/cm) at 25 degrees Celsius.
Conductivity values can be used to estimate the total
concentration of dissolved solids (commonly referred to as
total dissolved solids, or TDS). The desired level of
conductivity in drinking water according to the WHO (2004a)
is 1,000 uS/cm and that of the Ghana EPA, (1997) is 750
uS/cm (Gyawu-Asante, 2012)
29
2.8.2 Total Dissolved Solids (TDS)Total dissolved solids refers to the residue remaining in a
weighed dish after the sample has been passed through a
standard fiber glass filter and dried to constant mass at
103 to 105 degrees
Celsius. Many dissolved substances are undesirable in
water (Putz J, 2003). Dissolved minerals, gases and
organic constituents may produce aesthetically displeasing
colour, taste and odour.
Some dissolved organic chemicals may deplete the dissolved
oxygen in the receiving waters and some may be inert to
biological oxidation, yet others have been identified as
carcinogens. Water with higher dissolved solids content
often has a laxative and sometimes the reverse effect upon
people whose bodies are not adjusted to them (Akorli,
2012).As far as health aspects are concerned, there is no
evidence of adverse physiological reactions atTDS levels
greater than 1000 mg/L (World Health Organization, 1993).
The guideline value for TDS in drinking water is 1000 mg/L
30

(Ghana Standards Board, 1998; World Health Organisation,
2007).
2.8.3 TurbidityThe turbidity of water is the reduction of transparency due
to the presence of particulate matter such as clay or silt,
finely divided organic matter, plankton or other microscopic
organisms. Turbidity is commonly used as an indicator for
the general condition of the drinking water. Particles in
drinking water (suspended solids) are aesthetically
objectionable, and can serve as shields for pathogenic
microorganisms. Moreover, many toxic chemicals such as
pesticides and heavy metals are selectively adsorbed on
suspended particulate matter.The efficiency of disinfection
may be reduced in the presence of high suspended solids and
the disinfectant is unable to contact the target organism
because of a physical barrier or chemical reactions with
suspended solids, consequently decreasing the available
disinfectant concentration. More chlorine is required to
effectively disinfect turbid water. Turbidity above five
NTU may be noticeable and consequently objectionable to31
consumers (Akorli, 2012). The guideline value for turbidity
is five (5) Nephelometric turbidity units (Ghana Standards
Board, 1998; World Health Organisation, 2007).
2.8.4 pHpH is the term indicating the hydrogen ion (positively
charged hydrogen atom) concentration of a solution, a
measure of the solution’s acidity. It is a measure of the
acidic or alkaline content of water. The pH level of
drinking water reflects how acidic it is. pH is measured on
a scale that runs from 0 to 14. Seven (7) is neutral,
meaning there is a balance between acidity and alkalinity. A
measurement below 7 means acid is present and a measurement
above 7 is basic (or alkaline). It is classified as a
secondary drinking water contaminant whose impact is
considered aesthetic.
However, the WHO, (2004a) and the EPA, (1997) recommend that
public water systems maintain pH levels of between 6.5 and
8.5, a good guide for individual well owners. Water with a
low pH is acidic, naturally soft and corrosive. Acidic water
can leach metals from pipes and fixtures, such as copper,32

lead and zinc. It can also damage metal pipes and cause
aesthetic problems, such as a metallic or sour taste,
laundry staining or blue-green stains in sinks and drains.
Water with a low pH may contain metals in addition to
copper, lead and zinc. Drinking water with a pH level above
8.5 indicates high levels of alkalinity. High alkalinity may
not pose a health risk, but can cause aesthetic problems,
such as an alkaline taste to the water; scale build-up in
plumbing; and lowered efficiency of electric water heaters
(Gyawu-Asante, 2012).
2.8.5 TemperatureTemperature has both direct and indirect effects on aquatic
ecosystems. Variations in water temperature occur both
seasonally and daily. Maximum daily temperatures usually
occur in the afternoon; minimum temperatures are recorded in
the early morning hours. Variations in daily temperature are
attributed to radiation into and out of the water. Short-
term variations are greatest in unshaded, shallow streams
and less in deep-water streams and near the source of
spring-fed streams. In large rivers or streams away from33
their source, the water temperature nearly equals the mean
monthly air temperature. Temperature is a critical water
quality parameter, since it directlyinfluences the amount of
dissolved oxygen that is available to aquatic organisms.
Water temperature is a major factor in determining which
species are present in the stream. Different species have
different temperature requirements and optimal temperatures
may change for fish and invertebrate life stages. As the
temperature of water changes, chemical and physical
properties of the stream are affected. Specific conductivity
and pH are temperature dependent. Increase in temperature of
water also increases the velocity of salt ions and, in turn,
the conductivity of the water. Changes in chemical nature of
the stream can have significant impacts on biological
processes. Temperature of water for drinking and domestic
use should not exceed 30°C (EPA, 1997).
2.9 Some Chemical ParametersChemical parameters of pollution include but not limited to
total hardness, total alkalinity, phosphate content, and
different heavy metal ions present in water.34
2.9.1 AlkalinityAlkalinity is a measure of the presence of bicarbonate,
carbonate or hydroxide constituents. Concentrations less
than 100 ppm are desirable for domestic water supplies. The
recommended range for drinking water is 300 to 400
mg(CaCO3)/L. A minimum level of alkalinity is desirable
because it is considered a “buffer” that prevents large
variations in pH. Alkalinity is not detrimental to humans.
Moderately alkaline water (less than 350 mg(CaCO3)/L), in
combination with hardness, forms a layer of calcium or
magnesium carbonate that tends to inhibit corrosion of metal
piping. Many public water utilities employ this practice to
reduce pipe corrosion and to increase the useful life of the
water distribution.High alkalinity (above 500 mg(CaCO3)/L)
is usually associated with high pH values, hardness and high
dissolved solids and has adverse effects on plumbing
systems,especially on hot water systems (water heaters,
boilers, heat exchangers, etc.) where excessive, scale
reduces the transfer of heat to the water, thereby resulting
in greater power consumption and increased costs. Water with
35
low alkalinity (less than 75 mg(CaCO3)/L), especially some
surface waters and rainfall, is subject to changes in pH due
to dissolved gasses that may be corrosive to metallic
fittings due to the presence of bicarbonate (HCO3-),
carbonate (CO32-) or hydroxide (OH-). Most of the natural
alkalinity in water is due to HCO3-produced by the action of
groundwater on limestone or chalk.
CaCO3 + H2O + CO2 → Ca(HCO3)2.
Alkalinity is usually divided into caustic alkalinity above
pH 8.2 and total alkalinity above pH 4.5. Alkalinity can
exist down to pH of 4.5 because of the fact that HCO3-is not
completely neutralised until this pH is reached. The amount
of alkalinity present is expressed in terms of CaCO3 (Gyawu-
Asante, 2012).
2.9.2 Total HardnessThe hardness of water is caused by dissolved polyvalent
metallic ions principally calcium and to a lesser extent
magnesium. Public acceptability of the degree of hardness
of water may vary considerably from one community to another
depending on local conditions and in someinstances; hardness36

in excess of 500 mg/L is tolerable. Hard water may assist
in strengthening bones and teeth because of its high calcium
concentration. It may also decrease the risk of heart
diseases. Drinking water hardness must be above 8.4 mg/L.
Depending on the interaction with other factors such as pH
and alkalinity, water with hardness above approximately 200
mg/L may cause scale deposition in the distribution system
and may result in excessive soap consumption and subsequent
“scum” formation (Akorli, 2012). The guideline value for
total hardness is 500 mg/L (Ghana Standards Board, 1998;
World Health Organisation, 2007).
2.9.3 ChlorideChloride is one of the major inorganic anions in drinking
water. In potable water, the salty taste is produced by the
chloride concentrations and it is variable and dependent on
the chemical composition. There is no known evidence that
chlorides constitute any humanhealth hazards. For this
reason, chlorides are generally limited to 250 mg/L in
supplies intended for public use. In many areas of the
world where water supplies are scarce, sources containing as37

much as 2000 mg/L are used for domestic purposes without the
development of adverse effects, once the human system
becomes adapted to the water. However, high chloride
contentmay harm metallic pipes and structures (Akorli,
2012). The guideline value of chloride in drinking water
is 250 mg/L, based on taste considerations (Ghana Standards
Board, 1998; World Health Organisation, 2007).
2.9.4 SulphateThe ingestion of water containing high concentrations of
sulphate can have a laxative effect, which is enhanced when
the sulphate is consumed in combination with magnesium
(World Health Organisation, 1984). The major physiological
effects resulting from the ingestion of large quantities of
sulphate are catharsis, dehydration, and gastrointestinal
irritation. Water containing magnesium sulphate at levels
above 600 mg/L acts as a purgative in adult humans.
The presence of sulphate in drinking water can also result
in a noticeable taste. The human body only absorbs small
amounts of sulphates, but these amounts are sufficient to
stimulate peristalsis by binding magnesium and sodium to38
water in the intestine. Sulphate may also contribute to
the corrosion of distribution systems (Akorli, 2012).The
World Health Organisation(2007) guideline value for sulphate
in drinking water is 400 mg/L but the Ghana standards set it
at 250 mg/L (Ghana Standards Board, 1998).
2.9.5 CalciumCalcium is a major constituent of various types of rock. It
is one of the most common constituents present in natural
waters ranging from zero to several hundred milligrams per
liter depending on the source and treatment of the water.
Calcium is largely responsible for water hardness, and may
negatively influence toxicity of other compounds. Elements
such as copper, lead and zinc are much more toxic in soft
water. Calcium carbonate has a positive effect on lead
water pipes, because it forms a protective lead (II)
carbonate coating. This prevents lead from dissolving in
drinking water, and thereby prevents it from entering the
human body. Calcium phosphate is a supporting substance and
it causes bone and tooth growth, together with vitamin D.
Bones decalcifies (osteoporosis) and fractures become more39

likely if a body is not getting enough calcium. Since a
guideline value is proposed for total hardness, no guideline
value is proposed for calcium concentration in drinking
water (Akorli, 2012).
2.9.6 MagnesiumMagnesium is a common constituent in natural water.
Magnesium salts are important contributors to the hardness
of water which break down when heated, forming scale in
boilers. Chemical softening, reverse osmosis,
electrodialysis, or ion exchange reduces the magnesiumand
associated hardness to acceptable levels. Magnesium ion is
important for the regulation of muscle contractions and the
transmission of nerve impulses, and it activates energy-
producing enzymes. Nervousness, lack of concentration,
dizziness, and headaches or migraines may result from
magnesium deficiency. Since a guideline value is proposed
for total hardness, no guideline value is proposed for
magnesium concentration in drinking water (Akorli, 2012).
40
2.9.7 NitrateNitrate may be naturally occurring, although its presence in
drinking water is more often associated with contamination
by excessive use of fertilizers (both inorganic and
organic), in addition to inappropriate farming practices and
sewage. The high nitrate level in drinking water is also
associated with the simultaneous presence of bacterial
contamination (World Health Organisation, 1996).The primary
health hazard from drinking water with nitrate-nitrogen
occurs when nitrate is transformed to nitrite in the
digestive system. The nitrite oxidizes iron in the
haemoglobin of the red blood cells to form methaemoglobin,
which lacks the oxygen-carrying capacity of haemoglobin.
This creates the condition known as methaemoglobinaemia
(sometimes referred to as "blue baby syndrome"), in which
blood lacks the ability to carry sufficient oxygen to the
individual body cells causing the veins and skin to appear
blue (World Health Organisation, 1996). Most humans over
one year of age have the ability to rapidly convert
methaemoglobinback to oxyhaemoglobin. However, in infants
41

under six months of age, the enzyme systems for reducing
methaemoglobin to oxyhaemoglobin are incompletely developed
and methaemoglobinaemiacan occur. This also may happen in
older individuals who have genetically impaired enzyme
systems for metabolizing methaemoglobin (Akorli, 2012). The
guideline valueof nitrate-nitrogen is 50 mg/L and that of
nitrite-nitrogen is 1.0 mg/L (World Health Organisation,
2007).
2.9.8 FlourideFluoride is not a generic term for fluorine. Fluorine is an
element and a highly reactivepale yellow gas, but fluoride
is a negative ion [technically called ionic fluoride]
andcombines with a positive ion called a cation, by sharing
a electron, that generallyproduces a very stable molecule
(Thomas G. Reeves). Traces of fluorides are present in many
waters; higher concentrations are oftenassociated with
underground sources. In seawater, a total fluoride
concentration of 1.3mg/litre has been reported (Slooff et
al., 1988). In areas rich in fluoride-containingminerals,
well water may contain up to about 10 mg of fluoride per42

litre. The highestnatural level reported is 2800 mg/litre.
Fluorides may also enter a river as a result ofindustrial
discharges (Slooff et al., 1988). In groundwater, fluoride
concentrationsvary with the type of rock the water flows
through but do not usually exceed 10mg/litre (US EPA,
1985a).
2.9.9 SodiumThe sodium ion is ubiquitous in water. It is washed out from
rocks and soils, ending up in oceans, where it may remain
for about 50×106 years. Drinking water usually contains
about 50 mg/L sodium. This value is clearly higher for
mineral water. In soluble form sodium always occurs as Na+
ions (World Health Organisation, 1997).
Sodium compounds naturally end up in water. Seas, rivers and
lakes contain significant amounts of sodium. Concentrations
however are much lower, depending on geological conditions
and wastewater contamination. Sodium compounds serve many
different industrial purposes, and may also end up in water43

from industries. They are applied in metallurgy, and as a
cooling agent in nuclear reactors. About 60% of sodium is
utilized in chemical industries, where it is converted to
chlorine gas, sodium hydroxide or sodium carbonate, and
about 20% of sodium is utilized in food industries as a
preservative or a flavouring agent. Sodium hydroxide may be
applied to prevent clogging of sewer pipes, and sodium
carbonate is applied in water purification to neutralize
acids. Sodium hydrogen carbonate is a constituent of backing
powder, and is applied in textile and leather industries and
in soap and cleanser production. In sanitary cleanser the
element is present as sodium hypo chlorite (Lenntech B.V,
1998- 2014).
2.9.10 PotassiumPotassium occurs in various minerals, from which it may be
dissolved through weathering processes. Examples are
feldspars (orthoclase and microcline), which are however not
very significant for potassium compounds production, and
chlorine minerals carnalite and sylvite, which are most
favourable for production purposes. Some clay minerals44

contain potassium. It ends up in seawater through natural
processes, where it mainly settles in sediments. Elementary
potassium is extracted from potassium chloride, but does not
serve many purposes because of its extensive reactive power.
It is applied in alloys and in organic synthesis. A number
of potassium compounds, mainly potassium nitrate, are
popular synthetic fertilizers.95% of commercially applied
potassium is added to synthetic fertilizers. Potassium salts
and mixtures of magnesium and calcium compounds are also
applied regularly. Potassium is an dietary requirement for
nearly any organism but a number of bacteria, because it
plays an important role in nerve functions (Lenntech B.V,
1998- 2014).
45

46
CHAPTER THREE
3.0 METHODOLOGY
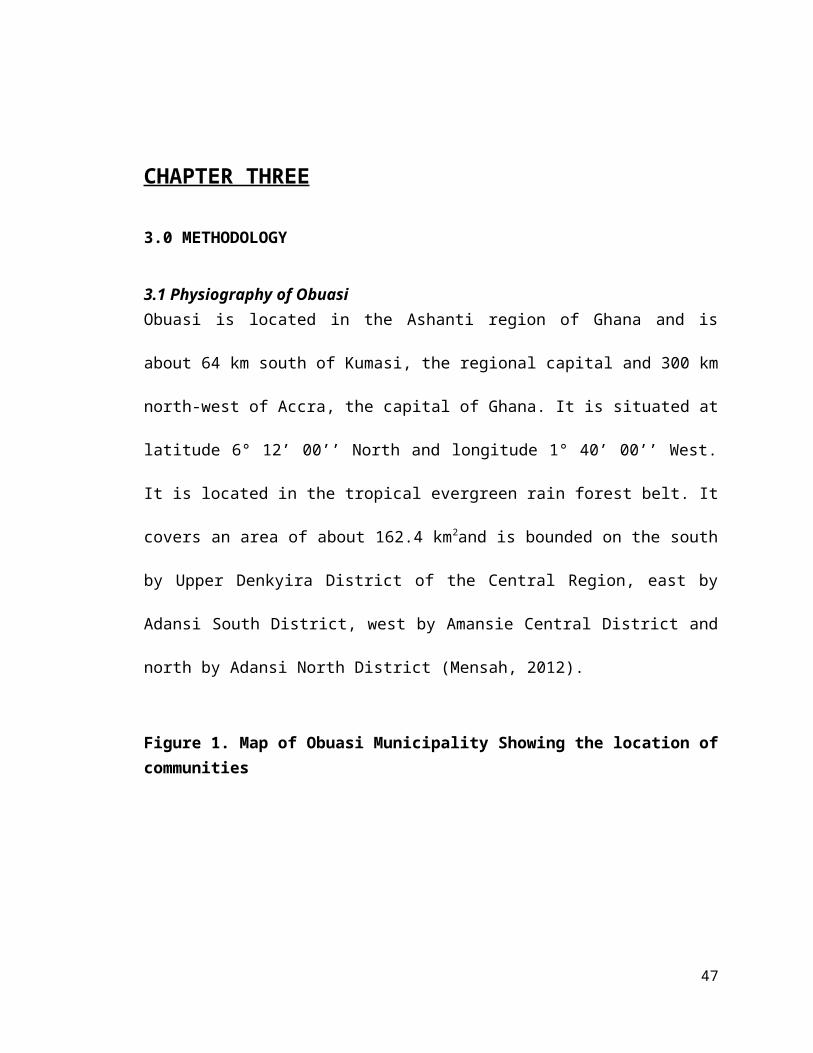
3.1 Physiography of ObuasiObuasi is located in the Ashanti region of Ghana and is
about 64 km south of Kumasi, the regional capital and 300 km
north-west of Accra, the capital of Ghana. It is situated at
latitude 6° 12’ 00’’ North and longitude 1° 40’ 00’’ West.
It is located in the tropical evergreen rain forest belt. It
covers an area of about 162.4 km2and is bounded on the south
by Upper Denkyira District of the Central Region, east by
Adansi South District, west by Amansie Central District and
north by Adansi North District (Mensah, 2012).
Figure 1. Map of Obuasi Municipality Showing the location ofcommunities
47
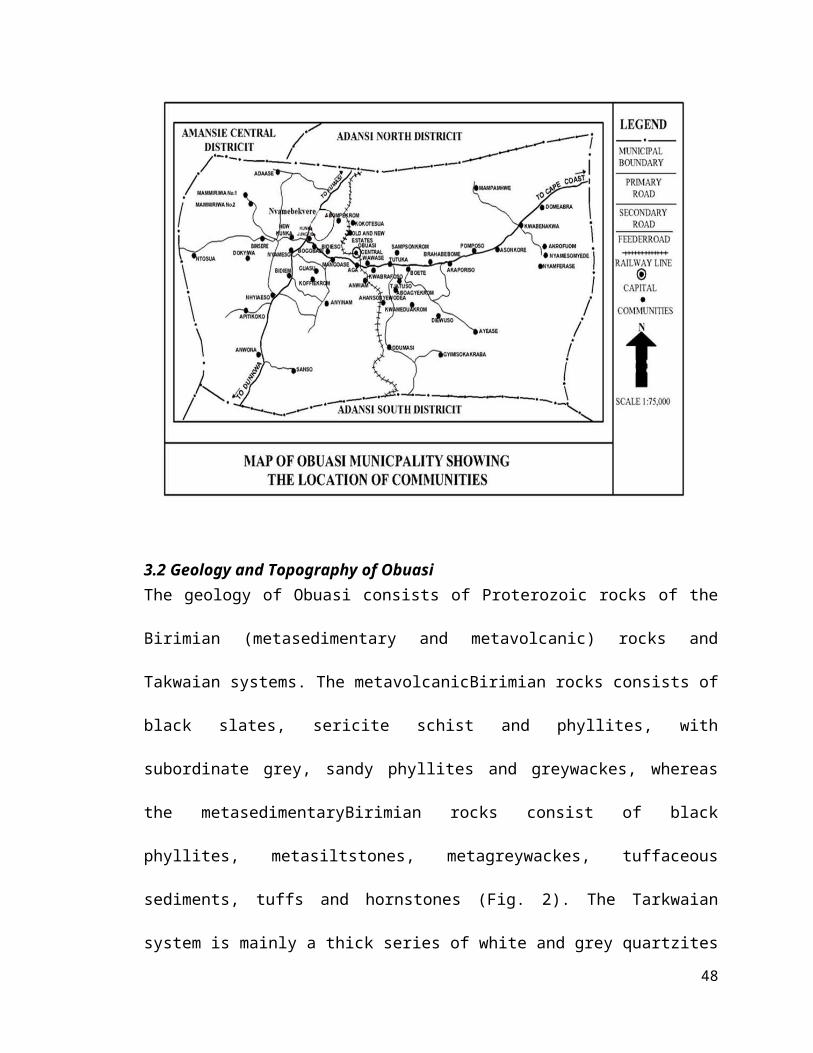
3.2 Geology and Topography of ObuasiThe geology of Obuasi consists of Proterozoic rocks of the
Birimian (metasedimentary and metavolcanic) rocks and
Takwaian systems. The metavolcanicBirimian rocks consists of
black slates, sericite schist and phyllites, with
subordinate grey, sandy phyllites and greywackes, whereas
the metasedimentaryBirimian rocks consist of black
phyllites, metasiltstones, metagreywackes, tuffaceous
sediments, tuffs and hornstones (Fig. 2). The Tarkwaian
system is mainly a thick series of white and grey quartzites
48

with a few intercalated bands of bluish and pink mudstone
and phyllite containing chlorite, magnetite, etc., (Ewusi et
al, 2012).
The topography of Obuasi and its environs varies from gently
undulating to hilly. Thereare moderately high-elevated lands
with lowlands and valleys between them. The highlands trend
in differentdirections; they have flat and plateau tops and
are generally amorphous in their shapes (Bempah et al,
2013).
3.3 Sampling locationsSampling locations were carefully chosen in order to acquire
values that represent background levels. This was done by
choosing areas that were not directly affected by the mining
sites and tailing dams. Also groundwater flow was an
important consideration in the selection of the sample
locations. A terrain map of Obuasi, showing its contours
gave us foresight on the direction of the flow of
groundwater. Groundwater flows downhill, and thus the sample
locations were selected side-gradient and up-gradient to the
direction of groundwater flow, also proximity to the49
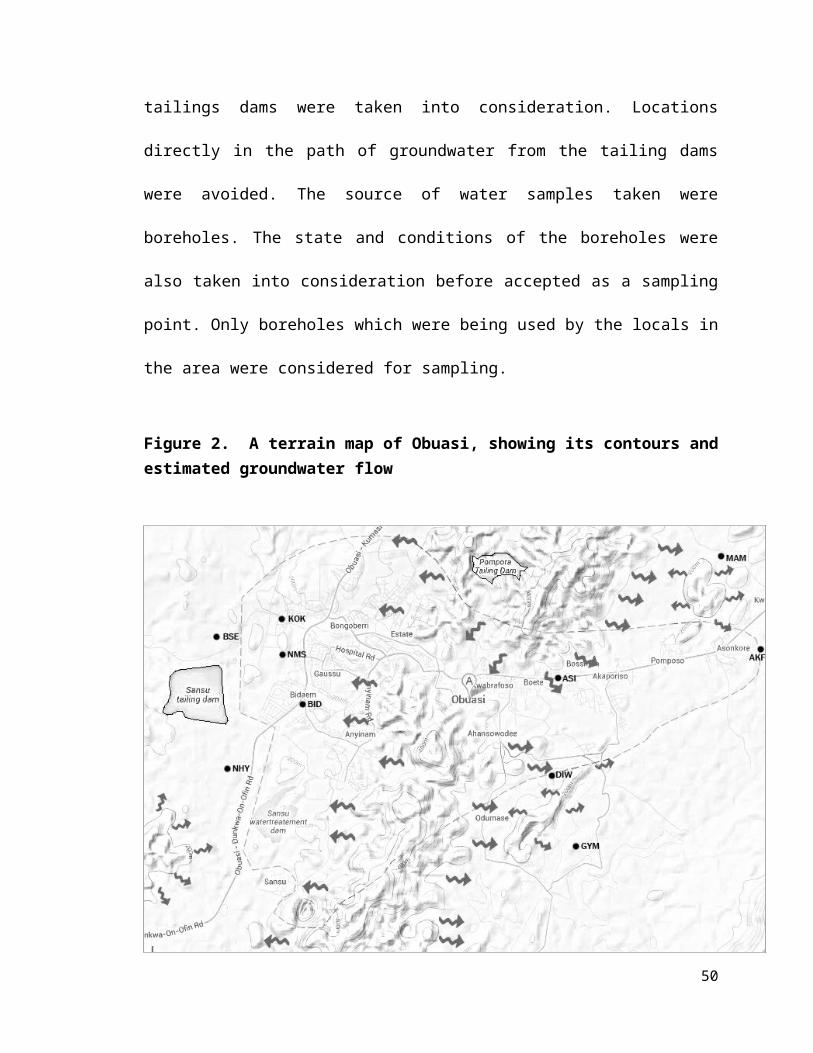
tailings dams were taken into consideration. Locations
directly in the path of groundwater from the tailing dams
were avoided. The source of water samples taken were
boreholes. The state and conditions of the boreholes were
also taken into consideration before accepted as a sampling
point. Only boreholes which were being used by the locals in
the area were considered for sampling.
Figure 2. A terrain map of Obuasi, showing its contours andestimated groundwater flow
50

3.4 SamplingTwo rounds of sampling were performed. One in December, 2013
and the other inFebruary, 2014. 10 samples were taken for
each round of sampling as well as a duplicate sample and a
field blank making 12 samples per round. A total of 24
samples were taken during the study. To obtain reliable
results, sampling procedures which eliminate or minimize
potential contaminants were adopted. This was done by
washing the sample containers with a detergent and rinsing
thoroughly with distilled water. The containers were then
soaked in 10% Nitric acid and then rinsed again with
distilled water. The samples to be tested for Arsenic were
preserved with 3ml of 6M Nitric acid per 1 litre of sample.
The samples to be tested for ions, alkalinity and hardness
were stored by keeping them around 4°C. Temperature, pH,
conductivity, Total dissolved solids and turbidity were
measured on site. The borehole samples together with the
duplicates (a different borehole was duplicated each round)
and the field blank were given a code which was clearly51

labeled on the containers. The table below shows each
sampling point and their respective code.
Table 1.Sample locations and designated codesSAMPLE LOCATION DESIGNATED CODE
Mampamhwe MAM
Diewuoso DIW
Gyimiso GYM
Akrofuom AKF
Asikafroanmmantem
(Tutuka)
ASI
Nhyiaeso NHY
Bidiem BID
Nyameso NMS
Binsere BSE
Konka KOK
3.5 APPARATUS- SOLAAR AA Series Spectrometer
- HANNA Turbidimeter HI98713
- EUTECH Instrument PCD650
52

- Beaker
- Conical flasks
- Burette
- Pipette
- Measuring cylinder
- Volumetric flasks
- Ion chromatograph
3.6 CHEMICALS- Nitric acid
- Arsenic standard
- Sodium hydroxide
- Hydrochloric acid
- Sodium borohydride
- Methyl orange
- Sulphuric acid
- EDTA
- Calcium carbonate
- Ammonium chloride
- Erichrome Black T
53

3.7 Determination of Physical ParameterspH, Conductivity, Total Dissolved Solids (TDS), Turbidity
and Temperature were measured on field using a multi-
parameter handheld meter, EUTECH Instrument PCD650.
Turbidity was also measured on field using a HANNA
Turbidimeter HI98713.
3.7.1 pH
3.7.1.1 CalibrationThe instrument was calibrated for pH using the NIST buffer
group (4.01, 6.86, 9.18 and 12.45 standard buffer
solutions). A four-point calibration was used. The first
point of calibration was 6.86 followed by 4.01, 9.18 and
finally 12.45. The meter automatically recognizes and
calibrates these standard pH buffer values when the
electrode is dipped into the solution. Distilled water was
used to rinse the electrode before and after each buffer
solution.
54

3.7.1.2 MeasurementA portion of the water sample was placed in a beaker on
site. The electrode was placed in the beaker and the value
of pH was recorded after it stabilized. The electrode was
rinsed with distilled water before and after each
measurement.
3.7.2 Conductivity
3.7.2.1 Calibration84.0 uS, 1.413 mS, 12.88 mS and 111.8 mSstandard buffer
solutions were used in calibrating the instrument. On the
instrument, the 1.413 mSstandard solution was selected.The
probe was dipped into the calibration standard and stirred
gently to create a homogeneous solution. Time was allowed
for the reading to stabilize. The cell constant value was
adjusted to the correct cell constant value of the standard.
The instrument was then set to calibration mode where the
55
calibration was done automatically by the instrument. The
electrode was rinsed with deionised water and placed in the
other standard buffer solutions for automatic calibration by
the instrument.
3.7.2.2 MeasurementA portion of the water sample was placed in a beaker on
site. The electrode was placed in the beaker and the value
of conductivity was recorded after it stabilized. The
electrode was rinsed with distilled water before and after
each measurement.
3.7.3 TDS
3.7.3.1 Calibration and DeterminationThe probe was dipped into the calibration standard and
stirred gently to create a homogeneous solution. Time was
allowed for the reading to stabilize. The TDS cell constant
value was adjusted to the correct cell constant value of the
standard. The instrument was then set to calibration mode
where the calibration was done automatically by the
instrument. The electrode was rinsed with distilled water
56

and placed in the other standard buffer solutions for
automatic calibration by the instrument.
3.7.3.2 MeasurementA portion of the water sample was placed in a beaker on
site. The electrode was placed in the beaker and the value
of TDS was recorded after it stabilized. The electrode was
rinsed with distilled water before and after each
measurement.
3.7.4 Temperature DeterminationA portion of the water sample was placed in a beaker on
site. The temperature probe of the instrument was placed in
the beaker and the temperature value in °C was recorded
after it stabilized. The probe was rinsed with distilled
water before and after each measurement.
3.7.5 Turbidity
3.7.5.1 CalibrationThe instrument was calibrated using 0.1, 15, 100 and 750 FNU
standards. About 10ml of the first standard was placed in
the sample cell and the compartment was covered. The57
instrument auto-calibrated itself after the readings
stabilized. The sample cell content was discarded and rinsed
with distilled water and the process repeated for the
remaining standard solutions.
3.7.5.2 MeasurementA portion of the water sample was placed in the cell and
well covered. The cell was placed in the cell compartment
and covered. The value of turbidity in FNU was then recorded
after it stabilized. The cell content was discarded and
rinsed with distilled water before and after each
measurement.
3.8Determination of Chemical ParametersThe chemical parameters were done in the lab. Total
alkalinity was done by acid-base titration whiles Total
hardness was done by titration with EDTA.
3.8.1 Total Alkalinity50ml of the water sample was pipetted into a clean 250ml
Erlenmeyer flask and about five drops of methyl orange
58
indicator was added. This was titrated with 0.10N H2SO4
until the colour changed from yellow to orange. The titre
value was recorded. The procedure was repeated about two
more times for all water samples. The total alkalinity was
determined based on the following formula:
Total alkalinity (mg CaCO3/L) =
mlofacidaddedxnormalityofacidx50,000mlofsample
3.8.2 Total HardnessA 0.01M EDTA solution was prepared by dissolving 3.725g of
EDTA disodium salt in deionized water, transferring into a
1L volumetric flask and topping up to the mark with
deionized water.
A standard calcium solution was prepared by weighing 1g of
dried calcium carbonate and transferring into a 500ml
conical flask. 21mL of 1M HCL was added slowly and the
content of the flask was then swirled until all the
carbonate dissolved. 200ml of distilled water was added and
boiled to expel the carbon dioxide. The whole solution was
59

left to cool.A 2M sodium hydroxide solution was prepared by
dissolving 8g of NaOH in 100ml of distilled water.
3.8.2.1 Standardization of EDTA solution20ml of the calcium standard was pipetted into a 250ml
conical flask and then diluted to 100ml with deionized
water. 4ml of an NH4Cl buffer solution of pH 10 was added
together with 6 drops of Erichrome Black T (EBT) indicator.
The resulting solution was titrated with the EDTA solution
until the colour of the solution changed from violet to
blue.1ml of the EDTA solution equivalent to calcium
carbonate in mg
E (CaCO3) = volumeofcalciumstandardx1mg(CaCO3)
titrevalue
3.8.2.2 Determination of Total Hardness50ml of the water sample was pipetted into a 250ml conical
flask. 4ml of the buffer solution and 6 drops of the EBT
indicator were added to the sample. The solution was the
titrated against the EDTA solution to a distinct blue
60

endpoint. The total hardness was then determined using the
following formula:
Total Hardness as CaCO3 content (mg/l) =
titrevaluexE (CaCO3 )x1000samplevolume
In order to correct for any error attributable to the
deionized water and the indicator colour transition, a blank
titration was done and the volume of EDTA required for the
titration of the blank was subtracted from all other
titration volumes.
3.8.3 Determination of IonsThe determination of ions was done with an ion
chromatograph. The samples were filtered into beakers and
injected into the loop of the instrument. A chromatogram was
plotted by the instrument and compared with the calibration
curves of the ions to determine the concentrations of ions
in the samples.
61

3.8.4 Determination of ArsenicThe Arsenic content of the samples were determined with an
Atomic Absorption Spectrometer with the Hydride Generation
system (HG-AAS). The AAS used was the SOLAAR AA Series
Spectrometer coupled with the VP100 Hydride generation
system from Thermo Scientific Corporation.
3.8.4.1 Digestion of samplesThe digestion was done with 100ml volumetric flasks
prewashed with 10% Nitric acid. It was done by preparing 10%
Nitric acid solutions of the samples. About 30ml of the
samples were filtered into the volumetric flasks with the
help of funnels and filter papers which were all prewashed
with 10% Nitric acid. 10ml of concentrated Nitric acid was
added and topped up to the 100ml mark with the samples.
3.8.4.2 Preparation of Standard Arsenic solutionsThe standards were prepared from a 1,000ppm stock by serial
dilution. The serial dilutions were done by preparing a
100,000ppb solution of Arsenic and from this a 10,000ppb
solution then to a 1,000ppb and then finally a 100ppb
solution. 5ppb, 10ppb and 15ppb standard Arsenic solutions
62

were prepared from the resulting solution. The solutions
were prepared in 10% Nitric acid.
3.8.4.3 Preparing Spiked Samples for recoveryIn order to check for accuracy of the measurement, two
samples were spiked with 2ppb standard arsenic solution. The
recovery of the instrument was calculated by the following
formula:
Recovery =Spikedvalue−Samplevaluestandardvalue
x100
3.8.4.4 Calibration and MeasurementThe instrument was calibrated with the 5ppb, 10ppb and 15ppb
standard arsenic solutions. The field blank sample was run
with the instrument and used to correct the actual arsenic
concentrations in the samples by subtracting the blank value
from the values of the samples. This was done automatically
by the instrument. The rest of the samples were run with the
instrument and the results printed out.
63

3.9 Precision of the Methods UsedThe precision of the method was checked by finding the
relative percent difference. The relative percent difference
was found by using the following formula.
RPD=(X¿¿1−X2)X100
(X1+X2 )÷2¿
64

CHAPTER FOUR
4.0 RESULTS AND DISCUSSION
4.1 RESULTS
Table2. Physical Parameters of water samples collectedSource Ph TDS(ppm) Temperature(˚C
)
Conductivity(µs/
cm)
Turbidity(NT
U)
MAM 4.25 21.94 27.25 31.91 0.59
DIW 5.67 320.45 27.50 459.15 0.54
GYM 4.08 90.01 28.10 128.6 0.27
AKF 3.80 310.35 27.95 446.05 0.32
ASI 3.95 119.5 29.00 171.2 0.58
NHY 5.35 120.52 27.15 168.7 0.78
BID 5.27 51.53 26.95 73.56 2.58
NMS 5.13 54.39 27.35 77.68 1.65
BSE 4.42 36.03 26.80 34.01 2.01
KOK 4.65 72.14 28.05 102.88 0.21
NIN 6.01 3.940 29.10 5.69 0.19
65

Table 3. Total Hardness of water samples collected
SOURCE
TOTAL HARDNESS( mg/l)
MONTH 1 MONTH 2 AVERAGE
NMS 2.70 2.88 2.79
NHY 70.48 70.88 70.68
MAM 29.55 29.97 29.76
GYM 18.1 18.7 18.6
KOK 33.40 33.56 33.48
BID 7.42 7.46 7.44
ASI 14.90 14.86 14.88
AKF 16.54 16.94 16.74
BSE 5.55 5.61 5.58
DIW 132.0 132.12 132.06
66
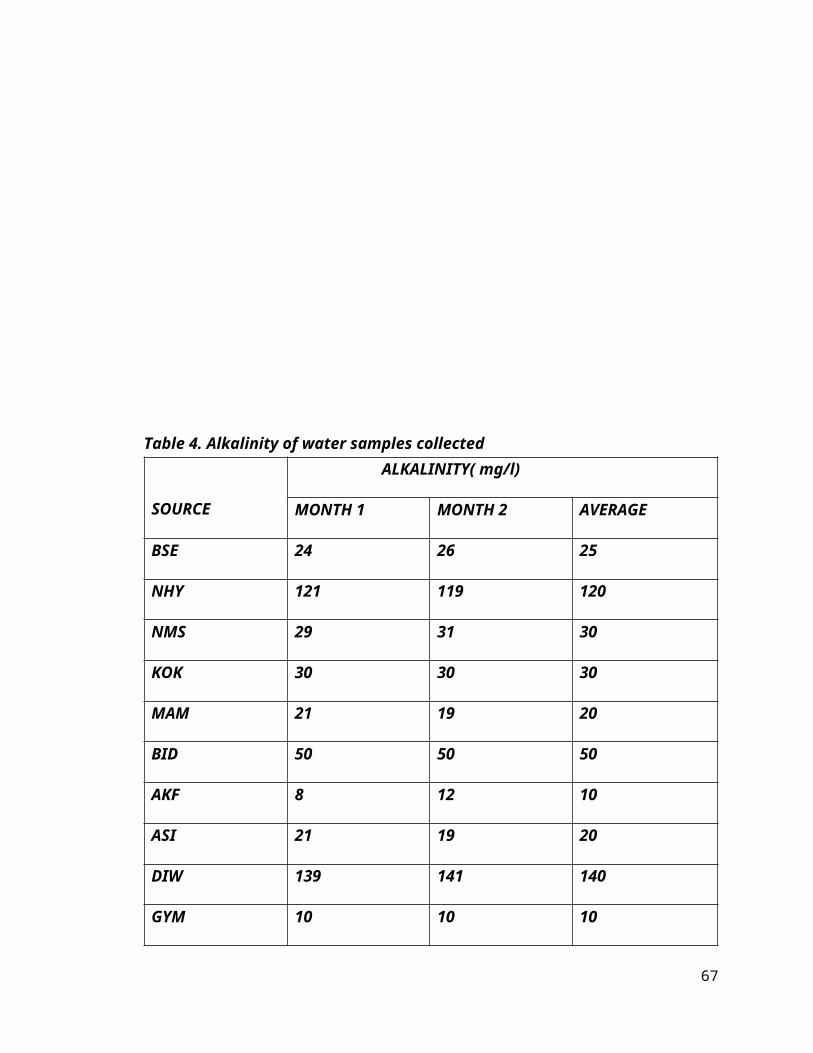
Table 4. Alkalinity of water samples collected
SOURCE
ALKALINITY( mg/l)
MONTH 1 MONTH 2 AVERAGE
BSE 24 26 25
NHY 121 119 120
NMS 29 31 30
KOK 30 30 30
MAM 21 19 20
BID 50 50 50
AKF 8 12 10
ASI 21 19 20
DIW 139 141 140
GYM 10 10 10
67

68

Table 5. Concentration of cations in water samples collected
SOURCE
Na ( K Ca Mg
Month
1
Month
2
Averag
e
Month
1
Month
2
Averag
e
Month
1
Month
2
Averag
e
Month
1
Month
2
Averag
e
ASI 26.914 26.900 26.907 0.701 0.835 0.768 1.815 1.855 1.835 32.961 32.973 32.967
BID 4.871 4.907 4.889 0.255 0.247 0.251 3.498 3.590 3.544 36.254 36.330 36.292
BSE 2.675 2.681 2.678 0.450 0.448 0.449 0.830 0.886 0.858 25.548 25.574 25.561
KOK 14.600 14.658 14.629 0.359 0.379 0.369 3.245 3.265 3.255 47.700 47.744 47.722
NMS 8.222 8.234 8.228 0.500 0.606 0.553 3.870 3.888 3.879 42.745 42.699 42.722
MAM 1.199 1.287 1.243 0.199 0.207 0.203 1.156 1.154 1.155 31.594 31.618 31.606
GYM 14.559 14.647 14.603 3.977 3.981 3.979 2.480 2.504 2.492 41.850 41.836 41.843
DIW 35.200 35.090 35.145 6.000 5.998 5.999 11.703 11.699 11.701 64.410 64.428 64.419
NHY 24.190 24.196 24.193 0.899 0.915 0.907 6.810 6.802 6.806 51.100 51.106 51.103
AKF 53.998 54.354 54.176 12.091 11.999 12.045 5.557 5.591 5.574 71.999 72.077 72.038
69
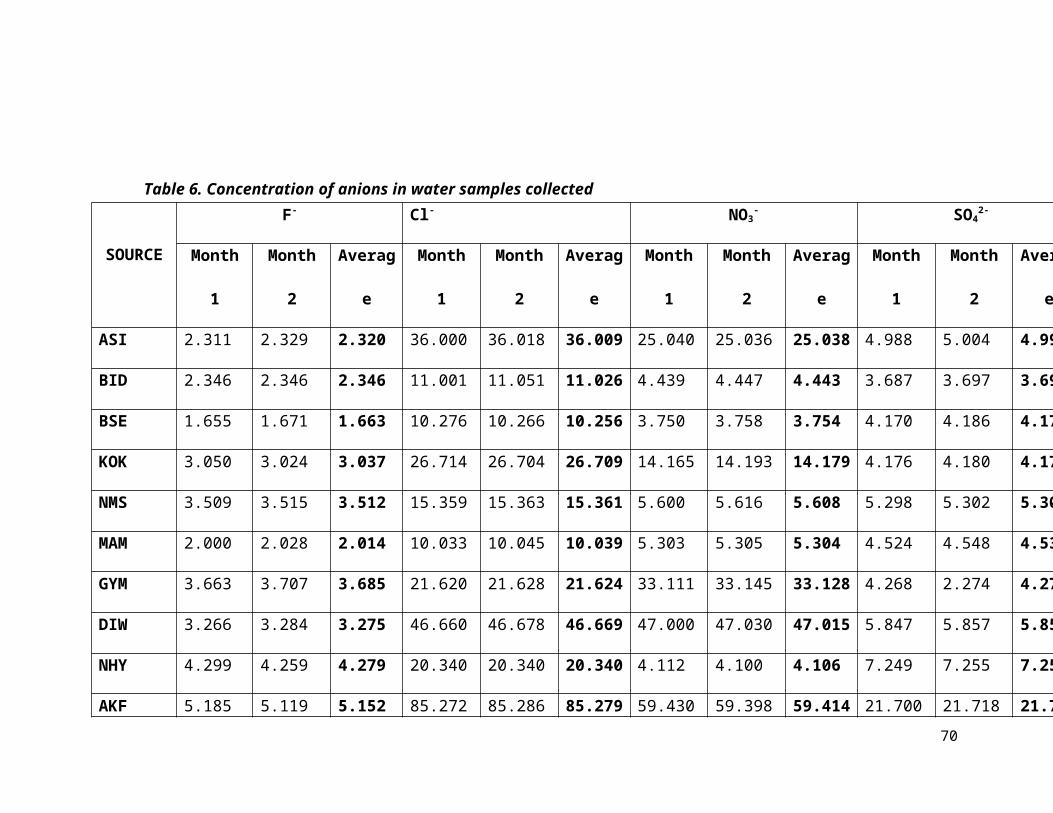
Table 6. Concentration of anions in water samples collected
SOURCE
F- Cl- NO3- SO4
2-
Month
1
Month
2
Averag
e
Month
1
Month
2
Averag
e
Month
1
Month
2
Averag
e
Month
1
Month
2
Averag
e
ASI 2.311 2.329 2.320 36.000 36.018 36.009 25.040 25.036 25.038 4.988 5.004 4.996
BID 2.346 2.346 2.346 11.001 11.051 11.026 4.439 4.447 4.443 3.687 3.697 3.692
BSE 1.655 1.671 1.663 10.276 10.266 10.256 3.750 3.758 3.754 4.170 4.186 4.178
KOK 3.050 3.024 3.037 26.714 26.704 26.709 14.165 14.193 14.179 4.176 4.180 4.178
NMS 3.509 3.515 3.512 15.359 15.363 15.361 5.600 5.616 5.608 5.298 5.302 5.300
MAM 2.000 2.028 2.014 10.033 10.045 10.039 5.303 5.305 5.304 4.524 4.548 4.536
GYM 3.663 3.707 3.685 21.620 21.628 21.624 33.111 33.145 33.128 4.268 2.274 4.271
DIW 3.266 3.284 3.275 46.660 46.678 46.669 47.000 47.030 47.015 5.847 5.857 5.852
NHY 4.299 4.259 4.279 20.340 20.340 20.340 4.112 4.100 4.106 7.249 7.255 7.252
AKF 5.185 5.119 5.152 85.272 85.286 85.279 59.430 59.398 59.414 21.700 21.718 21.70970

71
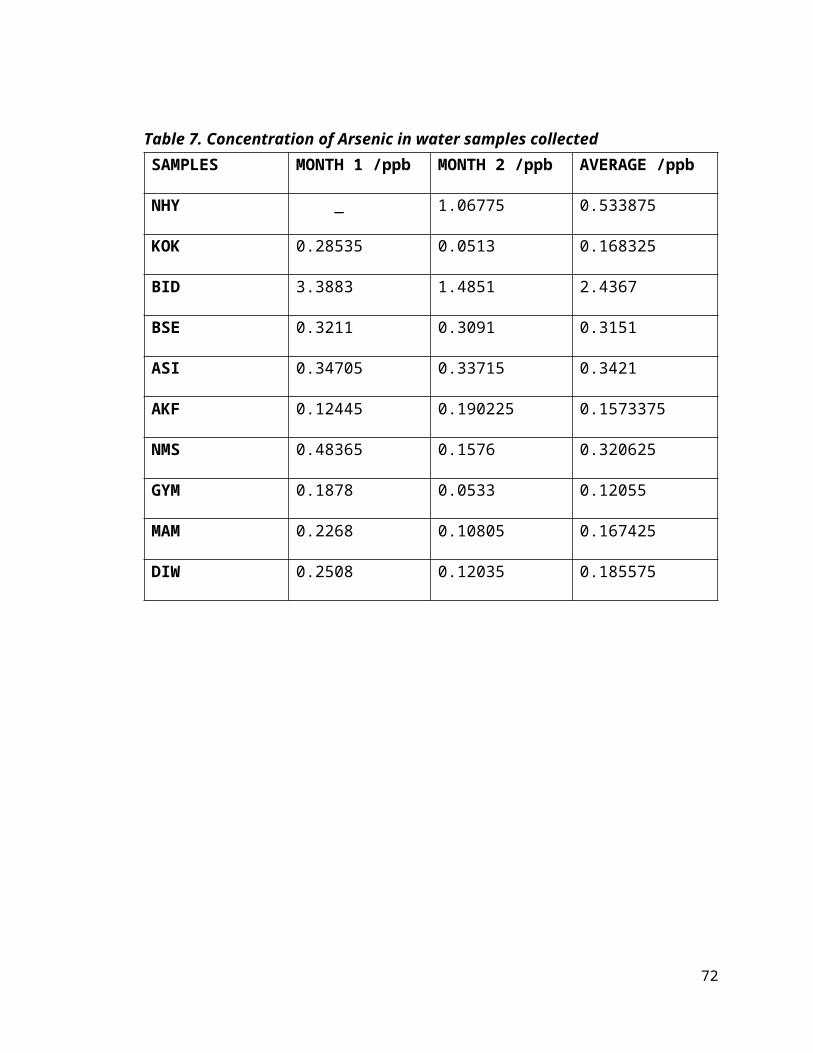
Table 7. Concentration of Arsenic in water samples collectedSAMPLES MONTH 1 /ppb MONTH 2 /ppb AVERAGE /ppb
NHY _ 1.06775 0.533875
KOK 0.28535 0.0513 0.168325
BID 3.3883 1.4851 2.4367
BSE 0.3211 0.3091 0.3151
ASI 0.34705 0.33715 0.3421
AKF 0.12445 0.190225 0.1573375
NMS 0.48365 0.1576 0.320625
GYM 0.1878 0.0533 0.12055
MAM 0.2268 0.10805 0.167425
DIW 0.2508 0.12035 0.185575
72

Table 8. Plotted values in distribution determinationRank Cumulative
Probabilit
y
Normal Score Log Value Sorted
Value
1 0.05555555
6
-1.593218818 -2.11569067 0.12055
2 0.14444444
4
-1.060562244 -1.8493621 0.1573375
3 0.23333333
3
-0.727913291 -1.78721979 0.167425
4 0.32222222
2
-0.461493694 -1.78185864 0.168325
5 0.41111111
1
-0.224687715 -1.68429617 0.185575
6 0.5 0 -1.15486523 0.3151
7 0.58888888
9
0.224687715 -1.13748306 0.320625
73
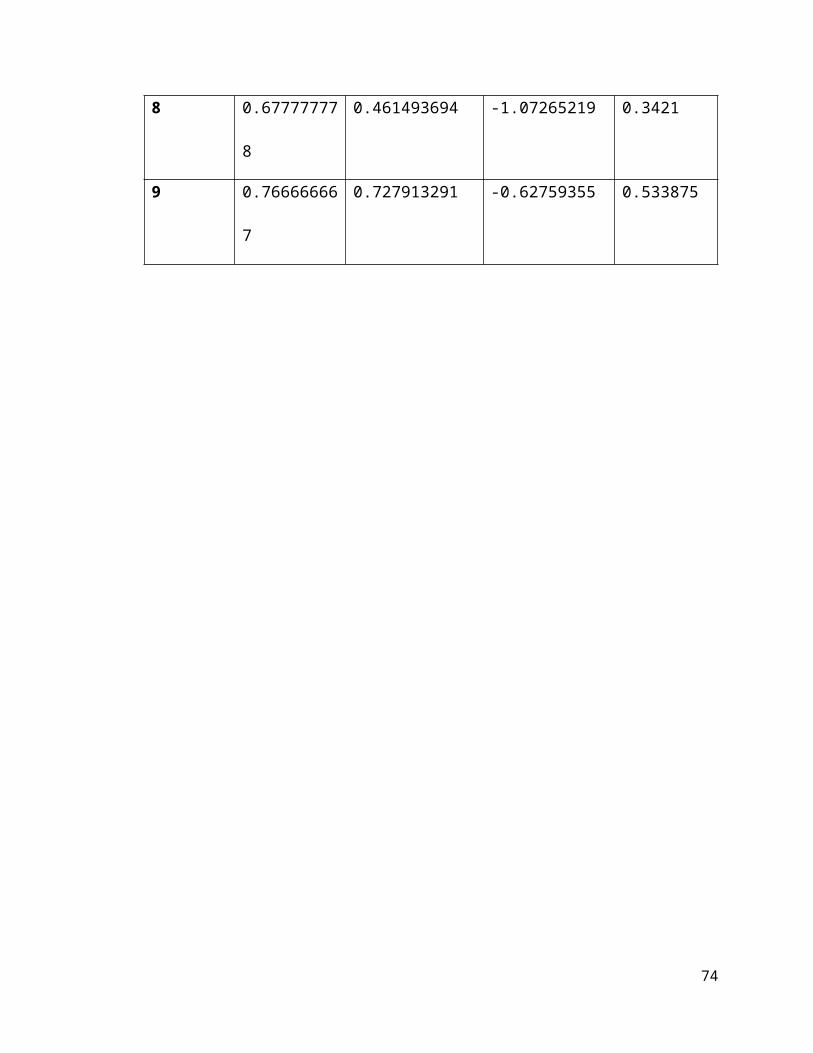
8 0.67777777
8
0.461493694 -1.07265219 0.3421
9 0.76666666
7
0.727913291 -0.62759355 0.533875
74
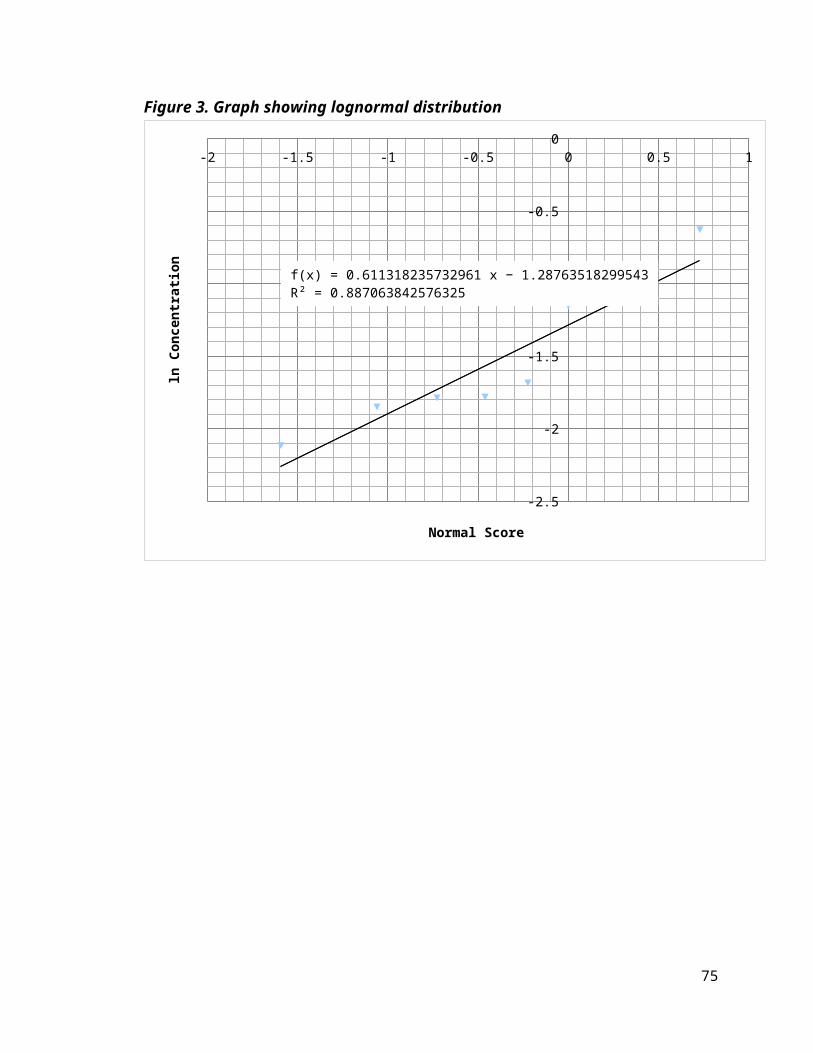
Figure 3. Graph showing lognormal distribution
-2 -1.5 -1 -0.5 0 0.5 1
-2.5
-2
-1.5
-1
-0.5
0
f(x) = 0.611318235732961 x − 1.28763518299543R² = 0.887063842576325
Normal Score
ln Concentration
75
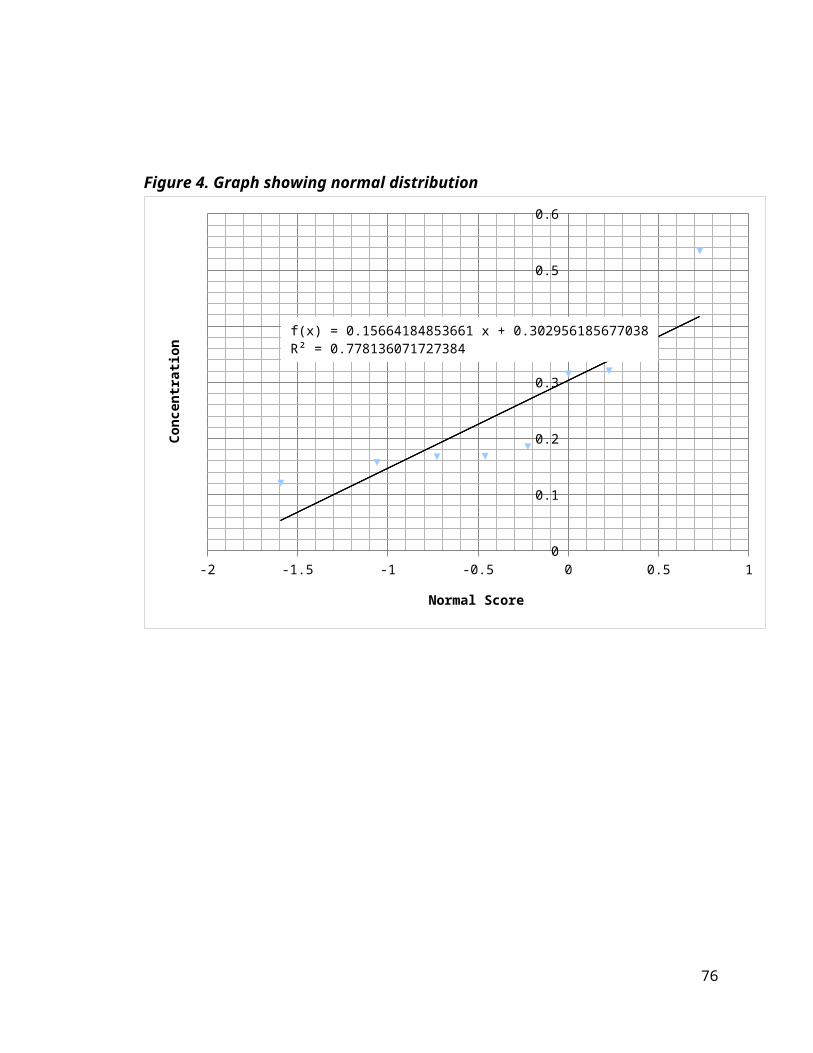
Figure 4. Graph showing normal distribution
-2 -1.5 -1 -0.5 0 0.5 10
0.1
0.2
0.3
0.4
0.5
0.6
f(x) = 0.15664184853661 x + 0.302956185677038R² = 0.778136071727384
Normal Score
Concentration
76

Table 9. RPD for Duplicate of month 1 BID=IEM
Parameter BID IEM RPD %
Total Hardness
(mg/l)
7.42 7.23 2.59
Alkalinity
(mg/l)
50 51 1.98
Na 4.871 5.167 5.90
K 0.255 0.306 18.18
Ca 3.498 3.262 6.98
Mg 36.252 34.825 4.02
F- 2.346 2.842 19.12
Cl- 11.001 10.222 7.34
NO3- 4.439 5.043 12.74
SO4- 3.687 3.900 5.61
As (ppb) 3.3883 2.80555 18.82
77

Table 10. RPD for Duplicate of month 2NMS=IEM
Parameter NMS IEM RPD %
Total Hardness
(mg/l)
2.88 3.23 11.46
Alkalinity
(mg/l)
31 33 6.25
Na 8.234 8.909 7.87
K 0.606 0.650 7.01
Ca 3.888 4.284 9.69
Mg 42.699 43.833 2.62
78

F- 3.515 4.168 17.00
Cl- 15.363 16.220 5.43
NO3- 5.616 5.730 2.01
SO4- 5.302 6.138 14.62
As (ppb) 0.1576 0.1840 15.46
4.2 DISCUSSIONThe average concentrations of Arsenic in the selected
boreholes are given in Table 7. The values of Arsenic
obtained ranged from 0.12055 – 2.43670µg/l which were all
below the World Health Organization (WHO) guideline value of
79

10µg/l. The low concentrations obtained indicate that the
borehole locations are good representations of background
conditions. Arsenic is usually present in natural waters at
a concentration of less than 1 - 2µg/l, however, in waters,
particularly groundwaters, where there are sulphide mineral
deposits and sedimentrary deposits derived from volcanic
rocks, like in Obuasi, the concentrations can be
significantly higher. From the samples collected, the
relatively higher concentration was from sample BID.This
value was however, rejected from the data set because when
subjected to the Dixon’s Q test for outliers, the Q value
exceeded the critical value for P=0.05. The calculated Q
value was 0.82155 and the critical value for P=0.05 for a
sample size of 10 was 0.464.The method used in the
determination of the Arsenic concentration was also accurate
since it gave a recovery of94.6% for the spiked sample, DIW
and 90.2% for the spiked sample KOK.
The values of the physical parameters are given in Table 2.
The temperature ranged from 26.8 – 29 °C. According to the
(EPA, 1997), temperature of water for drinking and domestic80

use should not exceed 30°C. From the samples the highest
temperature value of 29°C was recorded from ASI. The high
temperature even though within a safe range might enhance
the growth of microorganisms and may increase problems
related to taste, odour, colour and corrosion. The pH values
ranged from 3.80 – 5.67. The WHO, (2004a) and the EPA,
(1997) recommend that public water systems maintain pH
levels of between 6.5 and 8.5. It can be seen that all the
selected boreholes have very acidic water as none of them
were within the safe range. The TDS values ranged from 36.03
– 320.45mg/l, which are far below the WHO guideline value of
1000 mg/l. However, high values of TDS can affect the taste,
colour and odour of the water. The results show that the
water from the boreholes is considered to be palatable. The
values for conductivity ranged from 31.91 – 459.15µS/cm
which are below the guideline values for conductivity of the
WHO, 1,000µS/cm and that of the Ghana EPA, 750 µS/cm. Pure
water doesn’t conduct electricity, any impurities like
salts, in the water enables it to conduct electricity. When
salts are dissolved in water, they separate into ions.
81
Therefore, the higher the conductivity, the more likely the
water has high concentrations of ions. The turbidity values
also ranged from 0.21 – 2.58NTU which are below the WHO
guideline value of 5NTU. This reflects the clear nature of
the water samples collected. According to the WHO, to ensure
effectiveness of disinfection, turbidity should be no more
than 1NTU and preferably much lower. From the results,
samples BID,NMS and BSE had values of 2.58, 1.65 and 2.01
respectively which show that effectiveness of disinfection
will be reduced.
The total hardness values are given in table 3. The values
ranged from 2.79 – 132.06mg/l which are safe below the WHO
guideline of 500mg/l. The results indicate that the water
from the boreholes are soft and hence have low buffering
capacity. The values for alkalinity are also given in Table
4. They ranged from 10 – 140mg/l which are safe below the
WHO permissible level of 200mg/l.
The values for the cations are given in Table 5. Sodium ion
concentrations ranged from 1.243 – 54.176mg/l. According to
82

(Copenhagen, 1979), drinking water usually contains about 50
mg/L sodium.The WHO also states that at room temperature the
average taste threshold for sodium is about 200mg/l.
Potassium ion concentration ranged from 0.203 – 12.045mg/l.
Calcium ion concentrations ranged from 0.858 – 11.701mg/l.
The WHO states that the calcium ion range is 100 – 300mg/l
depending on the associated anion. Magnesium ion
concentrations ranged from 25.561 – 72.038mg/l. The
magnesium ion and calcium ion concentrations contribute to
the values of the total hardness.
The values for the anions are given in Table 6. Fluoride
concentrations ranged from 1.663 – 5.855mg/l. According to
the WHO, fluorides in groundwater concentrations vary with
the type of rock through which the water flows but do not
usually exceed 10mg/l. The values obtained are therefore
within the safe range. Chloride concentrations ranged from
10.039 –85.279mg/l. The WHO range is 200 – 300mg/l for
sodium, potassium and calcium chlorides. Concentrations in
excess of 250mg/l are increasingly likely to be detected by
taste. The values obtained are therefore, in the safe range.83
Nitrate concentrations ranged from 3.754 – 59.414mg/l.The
WHO guideline value for nitrate is 50mg/l. All the samples
were below this value except AKF which exceeded it with a
value of 59.414mg/l. Sulphate concentrations ranged from
3.692 – 21.709mg/l. According to the WHO, Taste impairment
varies with the nature of the associated cation; taste
thresholds have been found to range from 250 mg/l for sodium
sulphate to 1000 mg/l for calcium sulphate. It is generally
considered that taste impairment is minimal at levels below
250 mg/l. It indicates that the values obtained are far
below the taste impairment value.
In determination of the background concentration from the
data set using the DEQ method, a test of distribution of the
data was performed by plotting probability graphs by
plotting values or the natural logs of the values against
the normal score from table 8. The data neither showed a
normal or a lognormal distribution as can be seen from
figures 3 and 4 respectively. According to the DEQ method,
if the data does not show distribution, and also if the data
has nine or fewer samples, then the non-parametric method84
should be used. With the non-parametric method, the
background concentration used for comparison is the 90th
percentile value. The rank of the 90thpercentile value was
found to be 9; this corresponds to a value of 0.533875µg/l
which is also the highest value. The rank of the 50th
percentile value was also found to be 5; this corresponds to
a value of 0.185575µg/l. The 50th percentile value
multiplied by 4 gives a value of 0.7423µg/l; since the 90th
percentile value of 0.533875µg/l is not greater than this
value, background concentration of arsenic is set at the
90th percentile value, 0.533875µg/l.
In determination of the background concentration from the
data set using the OEPA method, the upper cutoff value of
the data is to be used as the background concentration
level. To calculate this, the lower (Q1) and upper (Q3)
quartiles of the data have to be determined. From the values
obtained, Q1 was found to be 0.167425µg/l and Q3 was found
to be 0.320625µg/l. These values were obtained by using
Microsoft Excel’s® QUARTILE function. The lower and upper
85

quartiles were then used to calculate the upper cutoff value
which was 0.550425µg/l.
Therefore, it can be estimated that the background
concentration of arsenic in groundwater from boreholes in
Obuasi is 0.533875µg/l for the DEQ method and 0.550425µg/l
for the OEPA method. This means that when the concentration
of arsenic from a borehole from Obuasi is found to be
greater than these values, then that borehole has been
contaminated. But when the concentration is found below
these values, then that borehole, even though it records a
level of arsenic, has not been contaminated but contains the
normal background level of arsenic. This will be very useful
to the stakeholders who are concerned about the levels of
arsenic in groundwater in the sense that it will serve as a
remediation levels. This means that when there is a
contamination, whoever is responsible for the remediation
now has an idea of what level of arsenic concentration at
which he can cease the cleanup. This goes to save cost of
remediation to the environmental protection agencies and the
other stakeholders responsible for remediation of86

contaminations. It will also give a fair idea of locations
of new boreholes. For example when preliminary tests of the
water source show arsenic levels below the background
concentration, that location is fit for use but when the
arsenic level is above the background concentration, then
further tests can be done to find the cause of the
contamination and whether the location can be used.
In terms of quality control, the accuracy of the
determination of the concentration of arsenic was checked by
finding the recovery of spiked samples. The method for the
arsenic determination was accurate since they were all
greater than 90%. The precision of the method was also
checked by finding the relative percent difference of the
duplicate samples (IEM) taken for both months and their
respective samples. From tables9 and 10, it can be seen that
since the relative percent differences were very low for
both months, the methods used were very precise. The methods
for the determination of the background arsenic
concentrations were also precise since the relative percent
87

difference between the two values was 3.05% which is very
low.
CHAPTER 5
5.0 CONCLUSION AND RECOMMENDATION
5.1 CONCLUSIONIn this study, the concentrations of the investigated
physicochemical parameters in the borehole samples were
within WHO guide line values except for pH, even though it
does not have a direct impact on consumers. The estimated
background arsenic concentrations from the DEQ and OEPA
methods are 0.533875µg/l and 0.550425µg/l respectively.
88
5.2 RECOMMENDATIONThere should be periodic monitoring and assessment of the
quality of the borehole water from the studied communities
by the authorities in charge of it. It is also recommended
that the background concentration of soil samples in Obuasi
should also be determined.
REFERENCESAhmad K, Carboo D. (2000) ‘Speciation of As (III) and As (V) in some Ghanaian gold tailings by a simple distillation method’, Water, Air, Soil Pollution, 122, pp. 317-326.
Akorli M.E. (2012) Assessment Of The Quality Of Packaged Drinking Water Sold In Kumasi Metropolis, In The Ashanti Region Of Ghana. Unpublished MSc thesis. The Department Of Theoretical And Applied Biology, Kwame Nkrumah University Of Science And Technology, Kumasi
89
Amasa S.K. (1975) ‘Arsenic pollution at Obuasi goldmine, town, and surrounding countryside’, Environ. Health Perspect., 12, pp. 131-135.
Anglogold Ashanti (2004), County report, Obuasi, Ghana, Availableat: http://www.anglogold.com/subwebs/informationforinvestors/reporttosociety04/pdf/environment.pdf [Accessed 28 February 2014]
Anglogold Ashanti (2006), County report, Obuasi, Ghana, Available at: http://www.anglogold.com/subwebs/InformationForInvestors/ReportToSociety06/files/Obuasi.pdf [Accessed 10 February 2014].
Davis C.P. (2013), Arsenic Poisoning Available at: http://www.medicinenet.com/arsenic_poisoning/page3.htm [Accessed 10 February 2014].
Environmental Protection Agency (1997). General Environmental Quality Standards. Environmental Protection Agency, Ghana. Pp.8
Environmental Protection Agency (2008), Determination of background concentrations Available at: http://www.epa.sa.gov.au/xstd_files/Site%20contamination/Guideline/background_concentrations_27Nov08.pdf [Accessed 10 February 2014].
Ghana Standards Board (1998). Water quality requirements for drinking water, part 1: GS 175
Gyawu-Asante F.N. (2012) Physico-Chemical Quality Of Water Sources In The Gold Mining Areas Of Bibiani. Unpublished MSc thesis. The Department of Theoretical and Applied Biology,Kwame Nkrumah University of Science and Technology
Hinkle S.R., and Polette D.J. (1999), ‘Arsenic in Ground Water of the Willamette Basin, Oregon’ U. S. Geological Survey, Water-Resources Investigations Report 98-4205, Washington, D.C.
Hughes M.F. (2002), ‘Arsenic toxicity and potential mechanisms ofaction’ Toxicology Letters, 133, pp. 1-16.
90

Hung D.Q, Nekrassova O, Compton R.G. (2004) ‘Analytical methods for inorganic arsenic in water’, Talanta, 64(2), pp. 269-277.
Lenntech (2014), Water treatment solutions, Available at: http://www.lenntech.com/periodic/elements/as.htm [Accessed 10 February 2014]
MacRae J. (2014), How Does Arsenic Get into the Groundwater? Available at: http://www.civil.umaine.edu/macrae/arsenic_gw.htm [Accessed 28 February 2014]
Naval Facilities Engineering Command (2004), Guidance For EnvironmentalBackground Analysis, Available at: http://www.navfac.navy.mil/content/dam/navfac/Specialty%20Centers/Engineering%20and%20Expeditionary%20Warfare%20Center/Environmental/Restoration/er_pdfs/gpr/navfacesc-ev-ug-2059-env-bkgrd-gw-200404.pdf [Accessed 1 March 2014]
Ohio Environmental Protection Agency (2009), Use of Background for Remedial Response Sites, Available at: http://epa.ohio.gov/portals/30/rules/Use%20of%20Background%20for%20RR%20Sites.pdf [Accessed 1 March 2014]
Panagiotaras D, Panagopoulos G, Papoulis D and Avramidis A. (2012) ‘Arsenic Geochemistry in Groundwater System, Geochemistry -Earth's System Processes’, Dr. DionisiosPanagiotaras(Ed.), ISBN: 978-953-51-0586-2,InTech, Available at: http://www.intechopen.com/books/geochemistry-earth-s-system-processes/arsenic-geochemistry-in-groundwater-system [Accessed 10 February 2014].
Putz J. (2003), Chemical analysis of drinking water for India-Canada Environment Available at: www.docstoc.com/docs/.../Chemical-analysis-of-drinking-water. (accessed 2011 January 23rd).
Ratnaike R. (2003), ‘Acute and chronic arsenic toxicity’ Postgraduate Medical Journal, 79(933), pp. 391–396
Reeves T.G (2001) The Fluoride Ion Available at: http://www.colorado.gov/cs/Satellite?blobcol=urldata&blobheadername1=Content-
91

Disposition&blobheadername2=Content-Type&blobheadervalue1=inline%3B+filename%3D%22CWF+fl-145.pdf%22&blobheadervalue2=application%2Fpdf&blobkey=id&blobtable=MungoBlobs&blobwhere=1251892609217&ssbinary=true [Accessed 1 March 2014]
Shraim A, Abu-Yousef I.A, Kanan S.M, Abdo N, Olszowy H, Petry S, Jack N.G. (2008), ‘Quantification of Total Arsenic in Groundwaterby HG-AAS Using Low Acid Concentration and L-Cysteine’ J. Int. Environmental Application & Science, 3(4), pp. 215-223
Shraim A, Cui X, Li S, Ng JC, Wang J, Jin Y, et al. (2003) ‘Arsenic speciation in the urine and hair of individuals exposed to airborne arsenic through coal-burning in Guizhou, PR China’. Toxicology Letters, 137(1-2), pp. 35–48.
Shraim A, Sekaran C.N, Anuradha C.D, Hirano S. (2002), ‘Speciation ofarsenic in tube-well water samples collected from West Bengal, India, by high-performance liquid chromatography-inductively coupled plasma mass spectrometry’ Applied Organometallic Chemistry, 16, pp. 202-209
Slooff W et al., eds. (1988) Basisdocumentfluoriden. Bilthoven, Netherlands, National Institute of Public Health and Environmental Protection (Report No. 758474005).
Smedley P.L. (1996) ‘Arsenic in rural groundwater in Ghana’, J. Afr. Earth Sci., 22, pp. 459-470.
Smedley P.L. and Kinniburgh D.G. (2002) ‘A review of the source, behaviour and distribution of arsenic in natural waters’, Applied Geochemistry, 17 ,pp. 517-568.
The Government Pension Fund Global (2012), Recommendation to exclude AngloGold Ashanti Limited from the investment universe of the Government Pension Fund Global, Available at: http://www.regjeringen.no/pages/2588965/AGA_eng.pdf [Accessed 28 February 2014]
US EPA (1985a) Drinking water criteria document on fluoride. Washington, DC, US Environmental Protection Agency, Office of Drinking Water (TR-823-5).
92

World Health Organisation (1993). Guidelines for Drinking Water Quality. (3); 2nd Edition, Surveillance and control of community supplies. Geneva, Switzerland.
World Health Organisation (1997) Sodium, chlorides and conductivity in drinking water Available at: http://www.who.int/water_sanitation_health/dwq/chemicals/sodium.pdf [Accessed 1 March 2014]
World Health Organisation (2004a). WHO Guidelines for drinking water quality, 3rd. ed. Volume 1.World Health Organisation – Geneva.
World Health Organisation (2007). Chemical safety of drinking water: Assessing priorities for risk management. WHO, Geneva, Switzerland.
World Health Organisation (2011). WHO Guidelines for drinking water quality, 4th. ed. World Health Organisation – Geneva.
Wyoming Department of Environmental Quality (2000), Establishing Site-Specific Background Metals Concentrations in Soil, Available at: http://deq.state.wy.us/volremedi/downloads/Current%20Fact%20Sheets/FS_24.pdf [Accessed 1 March 2014]
93

TABLE OF CONTENTDECLARATION.....................................................iACKNOWLEDGEMENT................................................ii
DEDICATION....................................................iiiSUPERVISOR’S APPROVAL..........................................iv
ABREVIATIONS....................................................vABSTRACT.......................................................vi
CHAPTER ONE.....................................................11.0 INTRODUCTION................................................1
1.1 Arsenic........................................................11.2 Applications of Arsenic.............................................2
1.3 Toxicity of Arsenic................................................21.4 Arsenic in Obuasi................................................3
1.5 PROBLEM STATEMENT...........................................41.6 JUSTIFICATION...............................................5
1.7 OBJECTIVES..................................................5CHAPTER TWO.....................................................6
2.0 LITERATURE REVIEW...........................................62.1 Mining operation in Obuasi.........................................6
2.2 Water Sources in Obuasi...........................................82.3 Arsenic mobility in aquifers.........................................9
2.4 Background Concentrations........................................112.5 Locations for background groundwater sampling........................11
2.6 Arsenic Determination............................................122.7 Determination of Background Concentration...........................12
2.7.1 The DEQ Method...............................................122.7.1.1 Non-Parametric Estimating Techniques.............................13
2.7.1.2 Parametric Estimating Techniques................................14
2.7.1.3 Evaluation of distribution of data.................................152.7.2 The OEPA Method..............................................17
2.8 Some Physical water parameters....................................182.8.1 Electrical Conductivity...........................................18
2.8.2 Total Dissolved Solids (TDS).......................................192.8.3 Turbidity....................................................19
2.8.4 pH.........................................................202.8.5 Temperature.................................................21
2.9 Some Chemical Parameters........................................212.9.1 Alkalinity....................................................22
2.9.2 Total Hardness................................................232.9.3 Chloride.....................................................23
2.9.4 Sulphate....................................................242.9.5 Calcium.....................................................24
2.9.6 Magnesium..................................................252.9.7 Nitrate......................................................25
2.9.8 Flouride.....................................................262.9.9 Sodium.....................................................27
2.9.10 Potassium..................................................27CHAPTER THREE..................................................30
3.0 METHODOLOGY................................................303.1 Physiography of Obuasi...........................................30
3.2 Geology and Topography of Obuasi..................................313.3 Sampling locations..............................................31
3.4 Sampling.....................................................323.5 APPARATUS....................................................34
3.6 CHEMICALS....................................................343.7 Determination of Physical Parameters................................35
3.7.1 pH.........................................................35

3.7.1.1 Calibration.................................................353.7.1.2 Measurement...............................................35
3.7.2 Conductivity..................................................363.7.2.1 Calibration.................................................36
3.7.2.2 Measurement...............................................363.7.3 TDS........................................................36
3.7.3.1 Calibration and Determination...................................363.7.3.2 Measurement...............................................37
3.7.4 Temperature Determination......................................373.7.5 Turbidity....................................................37
3.7.5.1 Calibration.................................................373.7.5.2 Measurement...............................................37
3.8 Determination of Chemical Parameters...............................383.8.1 Total Alkalinity................................................38
3.8.2 Total Hardness................................................383.8.2.1 Standardization of EDTA solution.................................39
3.8.2.2 Determination of Total Hardness.................................393.8.3 Determination of Ions...........................................39
3.8.4 Determination of Arsenic.........................................403.8.4.1 Digestion of samples..........................................40
3.8.4.2 Preparation of Standard Arsenic solutions...........................403.8.4.3 Preparing Spiked Samples for recovery.............................40
3.8.4.4 Calibration and Measurement...................................413.9 Precision of the Methods Used..............................41
CHAPTER FOUR....................................................424.0 RESULTS AND DISCUSSION.........................................42
4.1 RESULTS......................................................424.2 DISCUSSION.................................................53
CHAPTER 5......................................................58

5.0 CONCLUSION AND RECOMMENDATION..............................585.1 CONCLUSION.................................................58
5.2 RECOMMENDATION.............................................58REFERENCES.....................................................59
TABLES
Table 1.Sample locations and designated codes...........................33
Table2. Physical Parameters of water samples collected......................42Table 3. Total Hardness of water samples collected..........................43
Table 4. Alkalinity of water samples collected..............................44Table 5. Concentration of cations in water samples collected...................45
Table 6. Concentration of anions in water samples collected...................46Table 7. Concentration of Arsenic in water samples collected...................47
Table 8. Plotted values in distribution determination.........................48Table 9. RPD for Duplicate of month 1...................................51
Table 10. RPD for Duplicate of month 2..................................52FIGURES
Figure 1. Map of Obuasi Municipality Showing the location of communities........30Figure 2. A terrain map of Obuasi, showing its contours and estimated groundwater flow............................................................32Figure 3. Graph showing lognormal distribution............................49
Figure 4. Graph showing normal distribution..............................50
Related Documents