Determination of 30 elements in colorectal biopsies by sector field inductively coupled plasma mass spectrometry: method development and preliminary baseline levels Beatrice Bocca 1 , Antonella Lamazza 2 , Anna Pino 1 , Ercole De Masi 3 , Maura Iacomino 3 , Daniela Mattei 1 , Siavash Rahimi 3 , Enrico Fiori 2 , Alberto Schillaci 2 , Alessandro Alimonti 1 * and Giovanni Forte 1 1 Istituto Superiore di Sanita `, Department of Environment and Primary Prevention, Viale Regina Elena 299, 00161 Rome, Italy 2 Hospital ‘Umberto I’, Viale del Policlinico 155, 00161 Rome, Italy 3 Hospital ‘San Carlo’, IDI IRCCS, Via Aurelia 275, 00165 Rome, Italy Received 22 February 2007; Revised 28 March 2007; Accepted 28 March 2007 An analytical procedure applicable to restricted sample sizes was developed and applied to the analysis of 30 chemical elements in colorectal biopsies of healthy patients. Acidic microwave digestion processed £10 mg of tissue at 80-C in 15-mL polystyrene liners. The digests were diluted to a volume of 2 mL with high-purity water and directly analyzed by sector field inductively coupled plasma mass spectrometry without further specimen handling. A careful selection of isotopes and instrumental resolution permitted the quantification in a single analytical sequence both of the elements present at parts per trillion and of those at parts per million. The accuracy calculated on BCR 184 ranged from 93.3–110%, the recoveries of the biopsy material was in the range 95.2–105%, the precision was <10%, and the blank levels were much below those expected in biopsy samples. The metal concentrations (on a dry-weight basis) in colorectal normal tissue showed a large range of variation: Ag, Au, Be, Bi, Co, Li, Sb, Tl, V, W and Zr were below 50 ng g S1 ; As, Ba, Cd, Cr, Cs, Hg, Mo, Ni, Pb, Se and Sn were distributed from 100 to 500 ng g S1 ; Al, Cu, Fe, Mn, Sr and Zn were from a few mgg S1 to 100 mgg S1 ; and Ca and Mg were at a level of 1000 mgg S1 . These data represent the first attempt to achieve an elemental profile in the colorectal mucosa of healthy patients as baseline level measurements for studies focused on the imbalance of chemical elements in diseased mucosa. Copyright # 2007 John Wiley & Sons, Ltd. Assessment of the elemental profile in human tissues is essential to extending knowledge on the healthy and the diseased states. From this point of view, colon-rectal mucosa has been rarely and not fully characterized. In general, studies on elemental concentration involved only one (e.g., Se or Mg) 1,2 or a few analytes such as Cu, Cd, Cr, Se, Ni and Zn. 3–9 Information about other elements such as Al, Ba, Ca, Co, Hg, Mg, Mn, Pb, and Fe is rather sparse. 10–12 An imbalance in the normal homeostasis of essential elements and tissue accumulation of potential toxic metals might, however, be associated with the risk of developing diseases such as colorectal cancer. 13–17 This paucity of information on elemental profiles can be traced back to the difficulties inherent in the multi-elemental analysis of biological tissues. First, the amount of the biological sample is often limited – for example, only a few milligrams of sample are available from human tissue biopsies. Secondly, the analytes of interest often occur at trace (ng g 1 ) or ultratrace (from pg g 1 to fg g 1 ) concentration level. In addition, tissue matrix contains high amounts of interferents which can affect the final analytical results. The biological matrix can be mineralized by use of conventional hot plates and furnaces but these procedures take time to complete the digestion and cause possible contamination and loss of analytes. Microwave (MW) digestion in PTFE closed vessels has advantages over conventional methods because it reduces external contami- nation and achieves total recovery of elements. 18 Never- theless, treatment by a high-pressure MW system is not ideal when samples are of small sizes, such as human biopsies, because of the large volume of the vessels (100 mL). Further, the method does not facilitate routine sample preparation RAPID COMMUNICATIONS IN MASS SPECTROMETRY Rapid Commun. Mass Spectrom. 2007; 21: 1776–1782 Published online in Wiley InterScience (www.interscience.wiley.com) DOI: 10.1002/rcm.3016 *Correspondence to: A. Alimonti, Istituto Superiore di Sanita `, Department of Environment and Primary Prevention, Viale Regina Elena 299, 00161 Rome, Italy. E-mail: [email protected] Contract/grant sponsor: LILT, Lega Italiana per la Lotta contro i Tumori (Italian League against Cancer); contract/grant number: ISS/N3A (2006-08). Copyright # 2007 John Wiley & Sons, Ltd.

Welcome message from author
This document is posted to help you gain knowledge. Please leave a comment to let me know what you think about it! Share it to your friends and learn new things together.
Transcript
RAPID COMMUNICATIONS IN MASS SPECTROMETRY
Rapid Commun. Mass Spectrom. 2007; 21: 1776–1782
) DOI: 10.1002/rcm.3016
Published online in Wiley InterScience (www.interscience.wiley.comDetermination of 30 elements in colorectal biopsies
by sector field inductively coupled plasma mass
spectrometry: method development and preliminary
baseline levels
Beatrice Bocca1, Antonella Lamazza2, Anna Pino1, Ercole De Masi3, Maura Iacomino3,
Daniela Mattei1, Siavash Rahimi3, Enrico Fiori2, Alberto Schillaci2, Alessandro Alimonti1*
and Giovanni Forte1
1Istituto Superiore di Sanita, Department of Environment and Primary Prevention, Viale Regina Elena 299, 00161 Rome, Italy2Hospital ‘Umberto I’, Viale del Policlinico 155, 00161 Rome, Italy3Hospital ‘San Carlo’, IDI IRCCS, Via Aurelia 275, 00165 Rome, Italy
Received 22 February 2007; Revised 28 March 2007; Accepted 28 March 2007
*CorrespoDepartmeRegina EE-mail: aContract/Tumori (IISS/N3A
An analytical procedure applicable to restricted sample sizes was developed and applied to the
analysis of 30 chemical elements in colorectal biopsies of healthy patients. Acidic microwave
digestion processed £10mg of tissue at 80-C in 15-mL polystyrene liners. The digests were diluted
to a volume of 2mL with high-purity water and directly analyzed by sector field inductively coupled
plasma mass spectrometry without further specimen handling. A careful selection of isotopes and
instrumental resolution permitted the quantification in a single analytical sequence both of the
elements present at parts per trillion and of those at parts permillion. The accuracy calculated on BCR
184 ranged from 93.3–110%, the recoveries of the biopsy material was in the range 95.2–105%, the
precision was <10%, and the blank levels were much below those expected in biopsy samples. The
metal concentrations (on a dry-weight basis) in colorectal normal tissue showed a large range of
variation: Ag, Au, Be, Bi, Co, Li, Sb, Tl, V, W and Zr were below 50ng gS1; As, Ba, Cd, Cr, Cs, Hg, Mo,
Ni, Pb, Se and Sn were distributed from 100 to 500ng gS1; Al, Cu, Fe, Mn, Sr and Zn were from a
few mg gS1 to 100mg gS1; and Ca andMg were at a level of 1000mg gS1. These data represent the first
attempt to achieve an elemental profile in the colorectal mucosa of healthy patients as baseline level
measurements for studies focused on the imbalance of chemical elements in diseased mucosa.
Copyright # 2007 John Wiley & Sons, Ltd.
Assessment of the elemental profile in human tissues is
essential to extending knowledge on the healthy and the
diseased states. From this point of view, colon-rectal mucosa
has been rarely and not fully characterized. In general,
studies on elemental concentration involved only one (e.g.,
Se or Mg)1,2 or a few analytes such as Cu, Cd, Cr, Se, Ni and
Zn.3–9 Information about other elements such as Al, Ba, Ca,
Co, Hg, Mg, Mn, Pb, and Fe is rather sparse.10–12 An
imbalance in the normal homeostasis of essential elements
and tissue accumulation of potential toxic metals might,
however, be associated with the risk of developing diseases
such as colorectal cancer.13–17
This paucity of information on elemental profiles can be
traced back to the difficulties inherent in the multi-elemental
analysis of biological tissues. First, the amount of the
ndence to: A. Alimonti, Istituto Superiore di Sanita,nt of Environment and Primary Prevention, Vialelena 299, 00161 Rome, [email protected] sponsor: LILT, Lega Italiana per la Lotta contro italian League against Cancer); contract/grant number:(2006-08).
biological sample is often limited – for example, only a
few milligrams of sample are available from human tissue
biopsies. Secondly, the analytes of interest often occur at
trace (ng g�1) or ultratrace (from pg g�1 to fg g�1)
concentration level. In addition, tissue matrix contains high
amounts of interferents which can affect the final analytical
results.
The biological matrix can be mineralized by use of
conventional hot plates and furnaces but these procedures
take time to complete the digestion and cause possible
contamination and loss of analytes. Microwave (MW)
digestion in PTFE closed vessels has advantages over
conventional methods because it reduces external contami-
nation and achieves total recovery of elements.18 Never-
theless, treatment by a high-pressure MW system is not ideal
when samples are of small sizes, such as human biopsies,
because of the large volume of the vessels (100mL). Further,
the method does not facilitate routine sample preparation
Copyright # 2007 John Wiley & Sons, Ltd.
Table 1. Operating conditions for digestion and SF-ICP-MS
analysis of biopsies
Digestion
Sample weight 2.0–10 mgReagent added 0.5mL HNO3
MW program (step) Temperature (8C) Time (min)
1 25–70 152 70 153 70–80 104 80 90Samples processed up to 80Final volume 2 mL
Analysis
Geometry Double focusing reverseNier-Johnson
RF power 1.2 kWArgon flows (L min�1) Plasma, 14.0; auxiliary, 0.9;
nebulizer, 0.85Nebulization Meinhard-type glass, water-cooled
Scott spray chamberInterface Pt sampler and skimmer conesMeasurements Electric scan, 2 runs and 2 passes
for each resolution
Determination of 30 elements in colorectal biopsies 1777
because the MW rotor can handle only a maximum of
12 vessels; finally, the PTFE bomb method requires tedious
and time-consuming operations such as transfers between
containers and repeated cleaning cycles to avoid memory
effects from the walls.
Different analytical methods have been used for the
elemental analysis of tissues: neutron activation analysis,
electrothermal atomic absorption spectrometry, X-ray fluor-
escence spectrometry, etc.11,19,20 As a rule, these techniques
have high detection limits, require large sample amounts and
have to analyze each element separately in a time-consuming
process. More recently, inductively coupled plasma optical
emission spectrometry (ICP-OES) and ICP-mass spectrom-
etry (ICP-MS) have been used successfully for tissue analysis
because of their multi-elemental capabilities and their good
sensitivity.18,21–24 Sector field (SF) ICP-MS is now the method
of choice because it attains very low detection limits, up to
fg mL�1, and allows us to quantify both essential and toxic
metals in one analytical sequence so reducing sample usage
and, thus, the required sample amount.
The goal of this studywas tomeasure the concentrations of
trace (Ag, As, Au, Bi, Co, Li, Sb, Tl, V, W and Zr), minor (Al,
Ba, Cd, Cr, Cs, Hg, Mo, Mn, Ni, Pb, Se and Sn) and major
(such as Ca, Cu, Fe,Mg, Sr and Zn) elements in small samples
of tissue (�10mg) as colonic biopsies. The entire analytical
procedure was designed, from the sample collection to the
final instrumental measurement, to lower sample consump-
tion, to minimize metal contamination or loss risk, and to
carry out the analyses of all the elements in a single
SF-ICP-MS run. The method was then applied to the
investigation of baseline metal levels in healthy human
biopsies to be used for comparisons with possible abnormal
levels in colorectal cancer tissues or polyps.
EXPERIMENTAL
Reagents and instrumentationHigh-purity water from an EASY-pure apparatus (PBI,
Milan, Italy) and ultrapure HNO3 (Carlo Erba, Milan, Italy)
were used throughout the study. Screw-capped polystyrene
liners, 15mL Falcon1 (Becton Dickinson Labware, Franklin
Lakes, NJ, USA), were used for sample collection, storage,
digestion and analysis. The liners were specifically cleaned
by soaking in 10% (v/v) HNO3 for 24 h and then washed
thoroughly with high-purity water. Single-element standard
solutions (SPEX, Edison, NJ, USA) at concentrations of
1mgmL�1 were used to prepare multi-element calibrants
and internal standards (ISs).
For MW digestions, a Milestone Ethos 900-Mega II oven
(FKV Milestone, Milan, Italy) loading a MultiPREP 80 rotor
(FKV Milestone), with a capacity of 79 liners plus one
containing the temperature sensor, was used. The SF-ICP-MS
system was a ThermoFinnigan Element II model (Bremen,
Germany) equipped with a concentric glass nebulizer,
water-cooled spray chamber, and torch with guard electrode
device. The instrumental settings are summarized in Table 1.
The low (LR, 300m/Dm), medium (MR, 4000m/Dm) and
high resolution (HR, 10 000m/Dm) settings were selected
appropriately as a function of the isotope (i.e. abundance
and type of interference) and the amount of analyte expected
Copyright # 2007 John Wiley & Sons, Ltd.
in the matrix (see Table 2). Three different ISs were used: in
LR mode, 115In for Ag, Au, Ba, Be, Cd, Cs, Li, Mo, Sb, Sn, Sr,
and Zr, and 195Pt for Bi, Hg, Pb, Tl and W; in the MR mode,45Sc for Al, Co, Cr, Cu, Mn, Ni and V; in HR mode, 115In for
As, Ca, Fe, Mg, Se and Zn. All the ISs were at a concentration
of 1 ng mL�1 in the analytical solutions. For metal
quantification the standard addition approach on at least
five concentration levels was used. Limits of quantification
(LoQs) were calculated as 10 times the standard deviation
(SD) of 10 readings of biopsy digests. The certified reference
material BCR 184 (bovine muscle) purchased from the
Institute for Reference Materials and Measurements (IRMM,
Geel, Belgium) was used for the accuracy control. For
elements not certified in BCR 184, recovery tests were
performed by analyzing 10 biopsy samples fortified with
known amounts of the elements. The precision was
expressed as the relative SD of 10 replicated measurements
of a pooled biopsy sample.
Sample collection and treatmentColorectal biopsy samples were provided by S. Carlo
Hospital (Rome, Italy) and Umberto I Polyclinic (Rome,
Italy) from 10 healthy individuals aged 58.3� 14.9 years
(7 males and 3 females) during a prevention campaign for
colorectal cancer. Informed consent to the study was
obtained, prior to enrolment, from the patients or their
parents. Sample collection was performed with the per-
mission of the ethics committee of the institutions.
Amounts of tissue ranging from 2.0 to 10mgwere sampled
by stainless steel biopsy forceps, previously tested for metal
contamination. Tissues were then weighed in 15-mL
polystyrene liners and stored at� 208C. The tissues were
dried at 1058C overnight, with water content ranging
between 59 and 84%. Then 0.5mL of ultrapure HNO3 was
Rapid Commun. Mass Spectrom. 2007; 21: 1776–1782
DOI: 10.1002/rcm
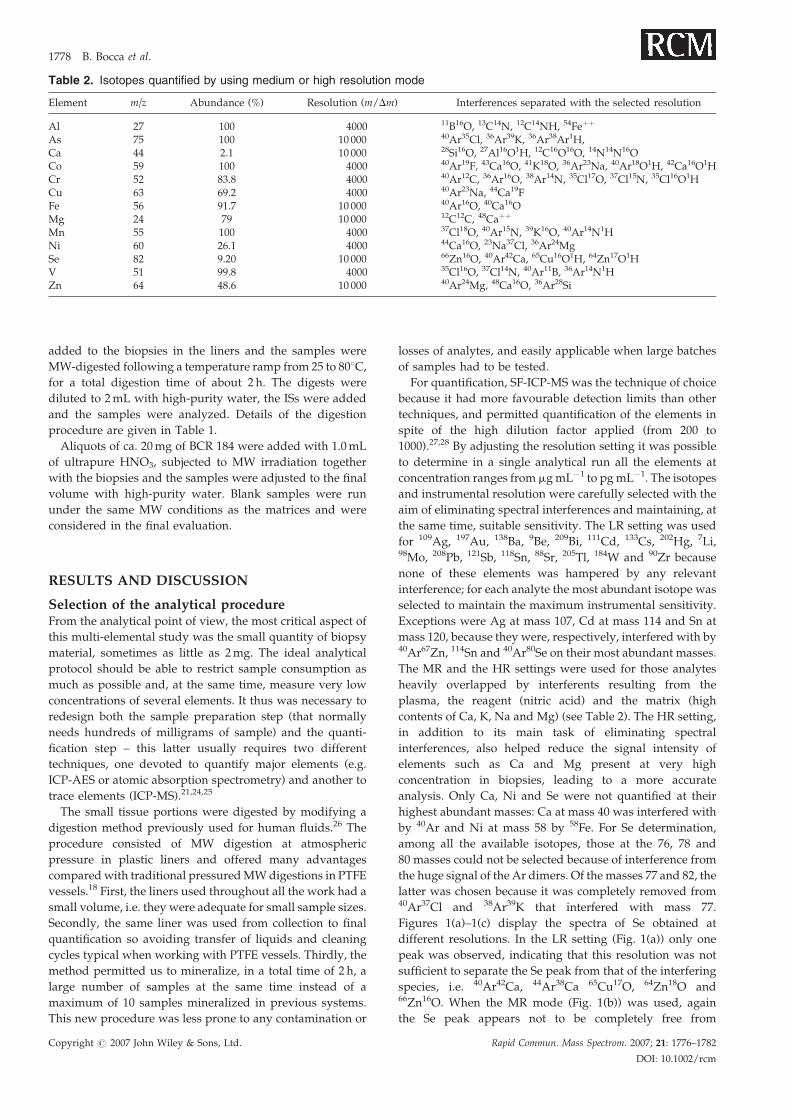
Table 2. Isotopes quantified by using medium or high resolution mode
Element m/z Abundance (%) Resolution (m/Dm) Interferences separated with the selected resolution
Al 27 100 4000 11B16O, 13C14N, 12C14NH, 54Feþþ
As 75 100 10 000 40Ar35Cl, 36Ar39K, 36Ar38Ar1H,Ca 44 2.1 10 000 28Si16O, 27Al16O1H, 12C16O16O, 14N14N16OCo 59 100 4000 40Ar19F, 43Ca16O, 41K18O, 36Ar23Na, 40Ar18O1H, 42Ca16O1HCr 52 83.8 4000 40Ar12C, 36Ar16O, 38Ar14N, 35Cl17O, 37Cl15N, 35Cl16O1HCu 63 69.2 4000 40Ar23Na, 44Ca19FFe 56 91.7 10 000 40Ar16O, 40Ca16OMg 24 79 10 000 12C12C, 48Caþþ
Mn 55 100 4000 37Cl18O, 40Ar15N, 39K16O, 40Ar14N1HNi 60 26.1 4000 44Ca16O, 23Na37Cl, 36Ar24MgSe 82 9.20 10 000 66Zn16O, 40Ar42Ca, 65Cu16O1H, 64Zn17O1HV 51 99.8 4000 35Cl16O, 37Cl14N, 40Ar11B, 36Ar14N1HZn 64 48.6 10 000 40Ar24Mg, 48Ca16O, 36Ar28Si
1778 B. Bocca et al.
added to the biopsies in the liners and the samples were
MW-digested following a temperature ramp from 25 to 808C,for a total digestion time of about 2 h. The digests were
diluted to 2mL with high-purity water, the ISs were added
and the samples were analyzed. Details of the digestion
procedure are given in Table 1.
Aliquots of ca. 20mg of BCR 184 were added with 1.0mL
of ultrapure HNO3, subjected to MW irradiation together
with the biopsies and the samples were adjusted to the final
volume with high-purity water. Blank samples were run
under the same MW conditions as the matrices and were
considered in the final evaluation.
RESULTS AND DISCUSSION
Selection of the analytical procedureFrom the analytical point of view, the most critical aspect of
this multi-elemental study was the small quantity of biopsy
material, sometimes as little as 2mg. The ideal analytical
protocol should be able to restrict sample consumption as
much as possible and, at the same time, measure very low
concentrations of several elements. It thus was necessary to
redesign both the sample preparation step (that normally
needs hundreds of milligrams of sample) and the quanti-
fication step – this latter usually requires two different
techniques, one devoted to quantify major elements (e.g.
ICP-AES or atomic absorption spectrometry) and another to
trace elements (ICP-MS).21,24,25
The small tissue portions were digested by modifying a
digestion method previously used for human fluids.26 The
procedure consisted of MW digestion at atmospheric
pressure in plastic liners and offered many advantages
comparedwith traditional pressuredMWdigestions in PTFE
vessels.18 First, the liners used throughout all the work had a
small volume, i.e. they were adequate for small sample sizes.
Secondly, the same liner was used from collection to final
quantification so avoiding transfer of liquids and cleaning
cycles typical when working with PTFE vessels. Thirdly, the
method permitted us to mineralize, in a total time of 2 h, a
large number of samples at the same time instead of a
maximum of 10 samples mineralized in previous systems.
This new procedure was less prone to any contamination or
Copyright # 2007 John Wiley & Sons, Ltd.
losses of analytes, and easily applicable when large batches
of samples had to be tested.
For quantification, SF-ICP-MS was the technique of choice
because it had more favourable detection limits than other
techniques, and permitted quantification of the elements in
spite of the high dilution factor applied (from 200 to
1000).27,28 By adjusting the resolution setting it was possible
to determine in a single analytical run all the elements at
concentration ranges from mgmL�1 to pgmL�1. The isotopes
and instrumental resolution were carefully selected with the
aim of eliminating spectral interferences and maintaining, at
the same time, suitable sensitivity. The LR setting was used
for 109Ag, 197Au, 138Ba, 9Be, 209Bi, 111Cd, 133Cs, 202Hg, 7Li,98Mo, 208Pb, 121Sb, 118Sn, 88Sr, 205Tl, 184W and 90Zr because
none of these elements was hampered by any relevant
interference; for each analyte the most abundant isotope was
selected to maintain the maximum instrumental sensitivity.
Exceptions were Ag at mass 107, Cd at mass 114 and Sn at
mass 120, because they were, respectively, interfered with by40Ar67Zn, 114Sn and 40Ar80Se on their most abundant masses.
The MR and the HR settings were used for those analytes
heavily overlapped by interferents resulting from the
plasma, the reagent (nitric acid) and the matrix (high
contents of Ca, K, Na and Mg) (see Table 2). The HR setting,
in addition to its main task of eliminating spectral
interferences, also helped reduce the signal intensity of
elements such as Ca and Mg present at very high
concentration in biopsies, leading to a more accurate
analysis. Only Ca, Ni and Se were not quantified at their
highest abundant masses: Ca at mass 40 was interfered with
by 40Ar and Ni at mass 58 by 58Fe. For Se determination,
among all the available isotopes, those at the 76, 78 and
80 masses could not be selected because of interference from
the huge signal of the Ar dimers. Of the masses 77 and 82, the
latter was chosen because it was completely removed from40Ar37Cl and 38Ar39K that interfered with mass 77.
Figures 1(a)–1(c) display the spectra of Se obtained at
different resolutions. In the LR setting (Fig. 1(a)) only one
peak was observed, indicating that this resolution was not
sufficient to separate the Se peak from that of the interfering
species, i.e. 40Ar42Ca, 44Ar38Ca 65Cu17O, 64Zn18O and66Zn16O. When the MR mode (Fig. 1(b)) was used, again
the Se peak appears not to be completely free from
Rapid Commun. Mass Spectrom. 2007; 21: 1776–1782
DOI: 10.1002/rcm
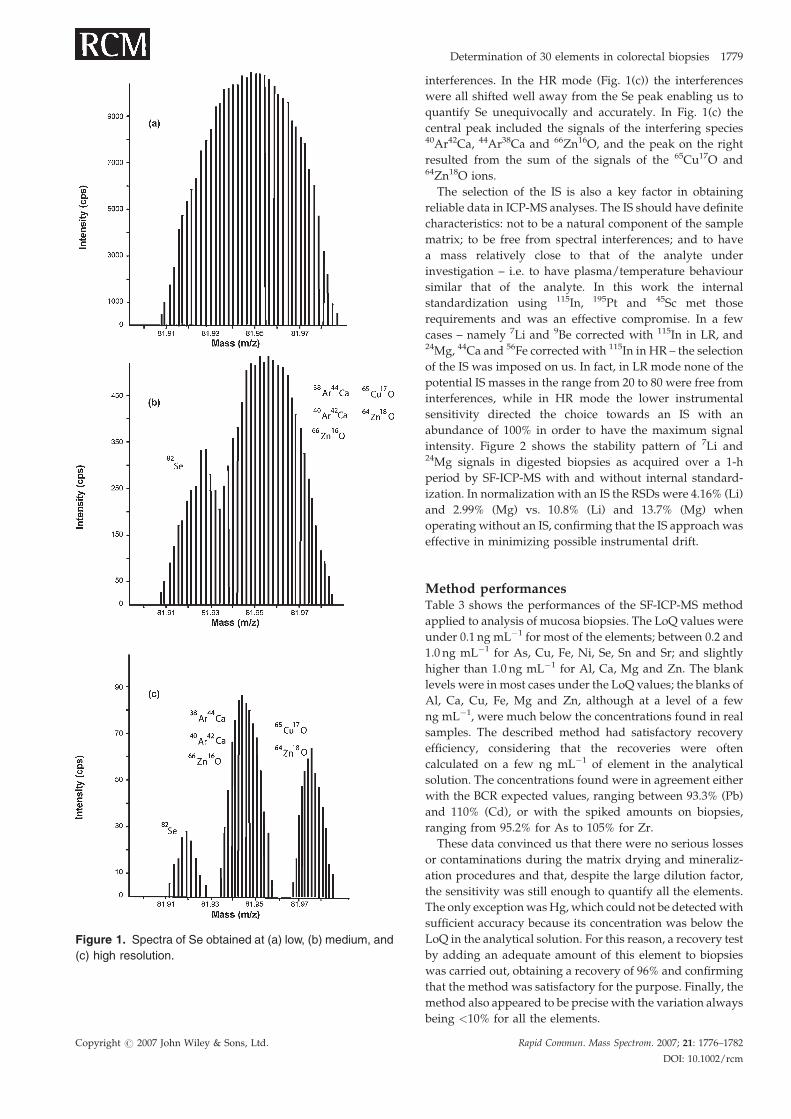
Figure 1. Spectra of Se obtained at (a) low, (b) medium, and
(c) high resolution.
Copyright # 2007 John Wiley & Sons, Ltd.
Determination of 30 elements in colorectal biopsies 1779
interferences. In the HR mode (Fig. 1(c)) the interferences
were all shifted well away from the Se peak enabling us to
quantify Se unequivocally and accurately. In Fig. 1(c) the
central peak included the signals of the interfering species40Ar42Ca, 44Ar38Ca and 66Zn16O, and the peak on the right
resulted from the sum of the signals of the 65Cu17O and64Zn18O ions.
The selection of the IS is also a key factor in obtaining
reliable data in ICP-MS analyses. The IS should have definite
characteristics: not to be a natural component of the sample
matrix; to be free from spectral interferences; and to have
a mass relatively close to that of the analyte under
investigation – i.e. to have plasma/temperature behaviour
similar that of the analyte. In this work the internal
standardization using 115In, 195Pt and 45Sc met those
requirements and was an effective compromise. In a few
cases – namely 7Li and 9Be corrected with 115In in LR, and24Mg, 44Ca and 56Fe corrected with 115In in HR – the selection
of the IS was imposed on us. In fact, in LR mode none of the
potential IS masses in the range from 20 to 80 were free from
interferences, while in HR mode the lower instrumental
sensitivity directed the choice towards an IS with an
abundance of 100% in order to have the maximum signal
intensity. Figure 2 shows the stability pattern of 7Li and24Mg signals in digested biopsies as acquired over a 1-h
period by SF-ICP-MS with and without internal standard-
ization. In normalization with an IS the RSDs were 4.16% (Li)
and 2.99% (Mg) vs. 10.8% (Li) and 13.7% (Mg) when
operating without an IS, confirming that the IS approach was
effective in minimizing possible instrumental drift.
Method performancesTable 3 shows the performances of the SF-ICP-MS method
applied to analysis of mucosa biopsies. The LoQ values were
under 0.1 ng mL�1 for most of the elements; between 0.2 and
1.0 ng mL�1 for As, Cu, Fe, Ni, Se, Sn and Sr; and slightly
higher than 1.0 ng mL�1 for Al, Ca, Mg and Zn. The blank
levels were in most cases under the LoQ values; the blanks of
Al, Ca, Cu, Fe, Mg and Zn, although at a level of a few
ng mL�1, were much below the concentrations found in real
samples. The described method had satisfactory recovery
efficiency, considering that the recoveries were often
calculated on a few ng mL�1 of element in the analytical
solution. The concentrations found were in agreement either
with the BCR expected values, ranging between 93.3% (Pb)
and 110% (Cd), or with the spiked amounts on biopsies,
ranging from 95.2% for As to 105% for Zr.
These data convinced us that there were no serious losses
or contaminations during the matrix drying and mineraliz-
ation procedures and that, despite the large dilution factor,
the sensitivity was still enough to quantify all the elements.
The only exceptionwasHg,which could not be detectedwith
sufficient accuracy because its concentration was below the
LoQ in the analytical solution. For this reason, a recovery test
by adding an adequate amount of this element to biopsies
was carried out, obtaining a recovery of 96% and confirming
that the method was satisfactory for the purpose. Finally, the
method also appeared to be precise with the variation always
being <10% for all the elements.
Rapid Commun. Mass Spectrom. 2007; 21: 1776–1782
DOI: 10.1002/rcm
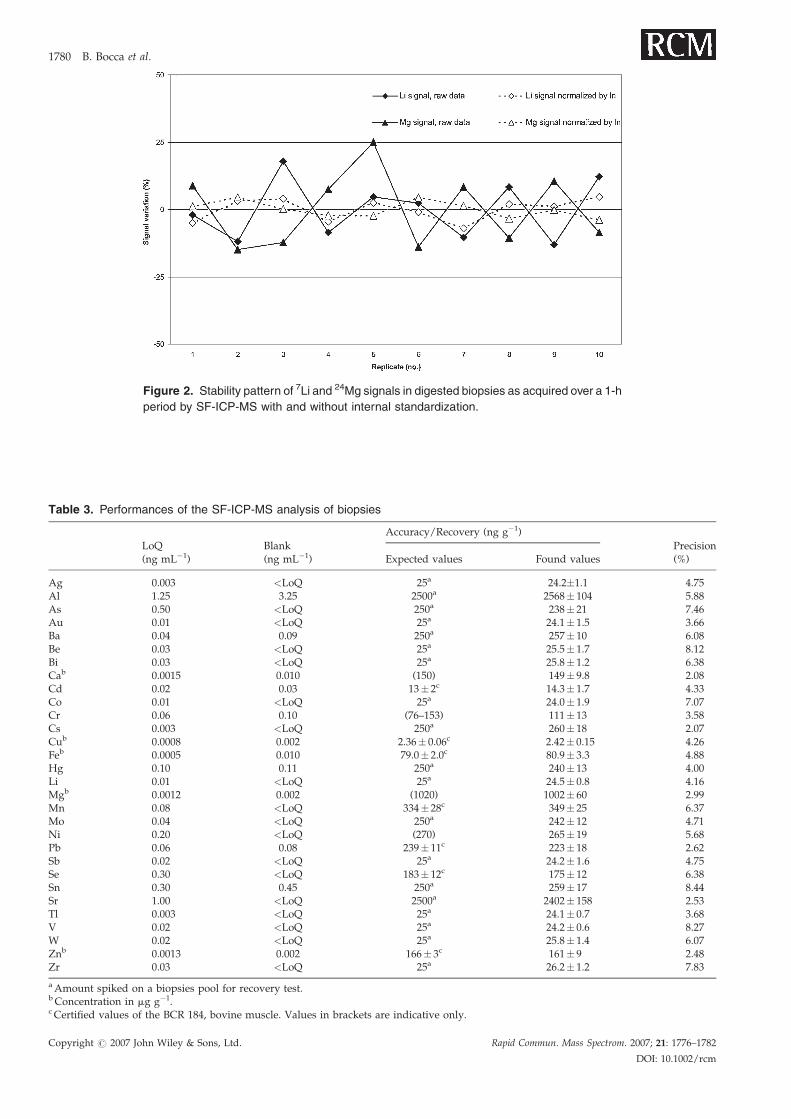
Figure 2. Stability pattern of 7Li and 24Mg signals in digested biopsies as acquired over a 1-h
period by SF-ICP-MS with and without internal standardization.
Table 3. Performances of the SF-ICP-MS analysis of biopsies
LoQ(ng mL�1)
Blank(ng mL�1)
Accuracy/Recovery (ng g�1)
Precision(%)Expected values Found values
Ag 0.003 <LoQ 25a 24.2�1.1 4.75Al 1.25 3.25 2500a 2568� 104 5.88As 0.50 <LoQ 250a 238� 21 7.46Au 0.01 <LoQ 25a 24.1� 1.5 3.66Ba 0.04 0.09 250a 257� 10 6.08Be 0.03 <LoQ 25a 25.5� 1.7 8.12Bi 0.03 <LoQ 25a 25.8� 1.2 6.38Cab 0.0015 0.010 (150) 149� 9.8 2.08Cd 0.02 0.03 13� 2c 14.3� 1.7 4.33Co 0.01 <LoQ 25a 24.0� 1.9 7.07Cr 0.06 0.10 (76–153) 111� 13 3.58Cs 0.003 <LoQ 250a 260� 18 2.07Cub 0.0008 0.002 2.36� 0.06c 2.42� 0.15 4.26Feb 0.0005 0.010 79.0� 2.0c 80.9� 3.3 4.88Hg 0.10 0.11 250a 240� 13 4.00Li 0.01 <LoQ 25a 24.5� 0.8 4.16Mgb 0.0012 0.002 (1020) 1002� 60 2.99Mn 0.08 <LoQ 334� 28c 349� 25 6.37Mo 0.04 <LoQ 250a 242� 12 4.71Ni 0.20 <LoQ (270) 265� 19 5.68Pb 0.06 0.08 239� 11c 223� 18 2.62Sb 0.02 <LoQ 25a 24.2� 1.6 4.75Se 0.30 <LoQ 183� 12c 175� 12 6.38Sn 0.30 0.45 250a 259� 17 8.44Sr 1.00 <LoQ 2500a 2402� 158 2.53Tl 0.003 <LoQ 25a 24.1� 0.7 3.68V 0.02 <LoQ 25a 24.2� 0.6 8.27W 0.02 <LoQ 25a 25.8� 1.4 6.07Znb 0.0013 0.002 166� 3c 161� 9 2.48Zr 0.03 <LoQ 25a 26.2� 1.2 7.83
aAmount spiked on a biopsies pool for recovery test.b Concentration in mg g�1.c Certified values of the BCR 184, bovine muscle. Values in brackets are indicative only.
Copyright # 2007 John Wiley & Sons, Ltd. Rapid Commun. Mass Spectrom. 2007; 21: 1776–1782
DOI: 10.1002/rcm
1780 B. Bocca et al.
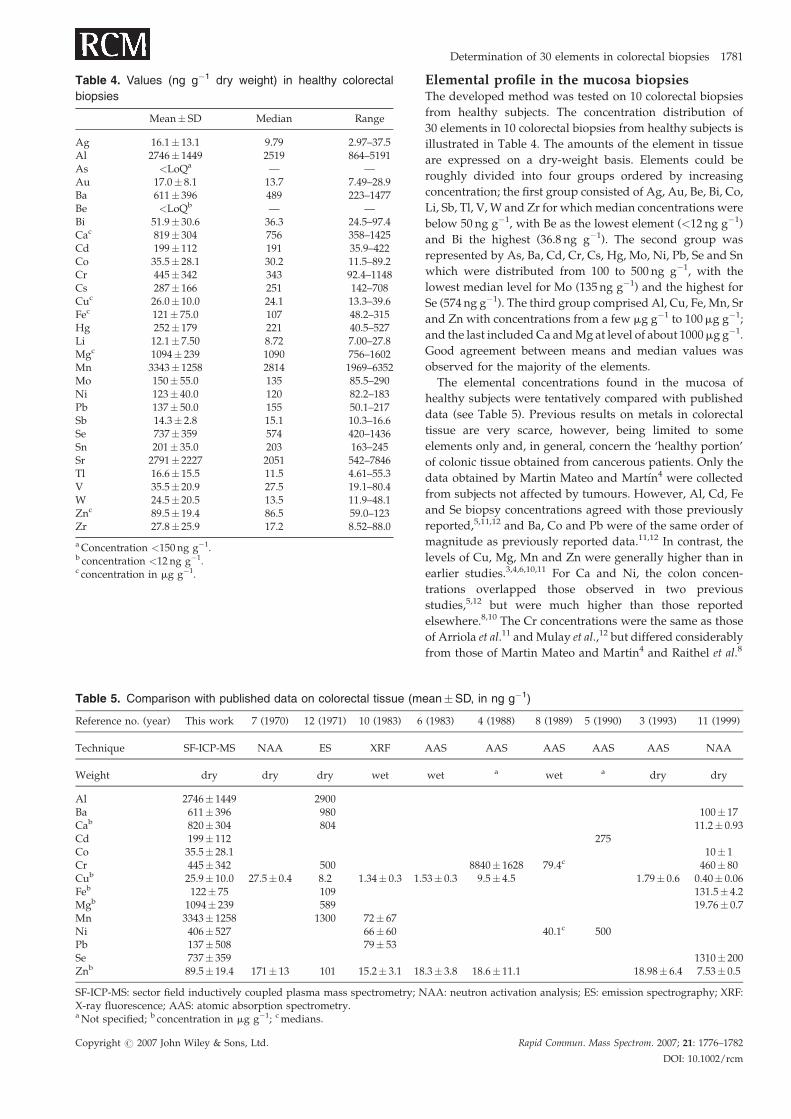
Table 4. Values (ng g�1 dry weight) in healthy colorectal
biopsies
Mean� SD Median Range
Ag 16.1� 13.1 9.79 2.97–37.5Al 2746� 1449 2519 864–5191As <LoQa — —Au 17.0� 8.1 13.7 7.49–28.9Ba 611� 396 489 223–1477Be <LoQb — —Bi 51.9� 30.6 36.3 24.5–97.4Cac 819� 304 756 358–1425Cd 199� 112 191 35.9–422Co 35.5� 28.1 30.2 11.5–89.2Cr 445� 342 343 92.4–1148Cs 287� 166 251 142–708Cuc 26.0� 10.0 24.1 13.3–39.6Fec 121� 75.0 107 48.2–315Hg 252� 179 221 40.5–527Li 12.1� 7.50 8.72 7.00–27.8Mgc 1094� 239 1090 756–1602Mn 3343� 1258 2814 1969–6352Mo 150� 55.0 135 85.5–290Ni 123� 40.0 120 82.2–183Pb 137� 50.0 155 50.1–217Sb 14.3� 2.8 15.1 10.3–16.6Se 737� 359 574 420–1436Sn 201� 35.0 203 163–245Sr 2791� 2227 2051 542–7846Tl 16.6� 15.5 11.5 4.61–55.3V 35.5� 20.9 27.5 19.1–80.4W 24.5� 20.5 13.5 11.9–48.1Znc 89.5� 19.4 86.5 59.0–123Zr 27.8� 25.9 17.2 8.52–88.0
aConcentration <150 ng g�1.b concentration <12 ng g�1.c concentration in mg g�1.
Table 5. Comparison with published data on colorectal tissue (m
Reference no. (year) This work 7 (1970) 12 (1971) 10 (1983) 6
Technique SF-ICP-MS NAA ES XRF
Weight dry dry dry wet
Al 2746� 1449 2900Ba 611� 396 980Cab 820� 304 804Cd 199� 112Co 35.5� 28.1Cr 445� 342 500Cub 25.9� 10.0 27.5� 0.4 8.2 1.34� 0.3 1.Feb 122� 75 109Mgb 1094� 239 589Mn 3343� 1258 1300 72� 67Ni 406� 527 66� 60Pb 137� 508 79� 53Se 737� 359Znb 89.5� 19.4 171� 13 101 15.2� 3.1 18
SF-ICP-MS: sector field inductively coupled plasma mass spectrometry; NX-ray fluorescence; AAS: atomic absorption spectrometry.aNot specified; b concentration in mg g�1; cmedians.
Copyright # 2007 John Wiley & Sons, Ltd.
Determination of 30 elements in colorectal biopsies 1781
Elemental profile in the mucosa biopsiesThe developed method was tested on 10 colorectal biopsies
from healthy subjects. The concentration distribution of
30 elements in 10 colorectal biopsies from healthy subjects is
illustrated in Table 4. The amounts of the element in tissue
are expressed on a dry-weight basis. Elements could be
roughly divided into four groups ordered by increasing
concentration; the first group consisted of Ag, Au, Be, Bi, Co,
Li, Sb, Tl, V, W and Zr for whichmedian concentrations were
below 50 ng g�1, with Be as the lowest element (<12 ng g�1)
and Bi the highest (36.8 ng g�1). The second group was
represented by As, Ba, Cd, Cr, Cs, Hg, Mo, Ni, Pb, Se and Sn
which were distributed from 100 to 500 ng g�1, with the
lowest median level for Mo (135 ng g�1) and the highest for
Se (574 ng g�1). The third group comprised Al, Cu, Fe, Mn, Sr
and Zn with concentrations from a few mg g�1 to 100mg g�1;
and the last included Ca andMg at level of about 1000mg g�1.
Good agreement between means and median values was
observed for the majority of the elements.
The elemental concentrations found in the mucosa of
healthy subjects were tentatively compared with published
data (see Table 5). Previous results on metals in colorectal
tissue are very scarce, however, being limited to some
elements only and, in general, concern the ‘healthy portion’
of colonic tissue obtained from cancerous patients. Only the
data obtained by Martin Mateo and Martın4 were collected
from subjects not affected by tumours. However, Al, Cd, Fe
and Se biopsy concentrations agreed with those previously
reported,5,11,12 and Ba, Co and Pb were of the same order of
magnitude as previously reported data.11,12 In contrast, the
levels of Cu, Mg, Mn and Zn were generally higher than in
earlier studies.3,4,6,10,11 For Ca and Ni, the colon concen-
trations overlapped those observed in two previous
studies,5,12 but were much higher than those reported
elsewhere.8,10 The Cr concentrations were the same as those
of Arriola et al.11 andMulay et al.,12 but differed considerably
from those of Martin Mateo and Martin4 and Raithel et al.8
ean�SD, in ng g�1)
(1983) 4 (1988) 8 (1989) 5 (1990) 3 (1993) 11 (1999)
AAS AAS AAS AAS AAS NAA
wet a wet a dry dry
100� 1711.2� 0.93
27510� 1
8840� 1628 79.4c 460� 8053� 0.3 9.5� 4.5 1.79� 0.6 0.40� 0.06
131.5� 4.219.76� 0.7
40.1c 500
1310� 200.3� 3.8 18.6� 11.1 18.98� 6.4 7.53� 0.5
AA: neutron activation analysis; ES: emission spectrography; XRF:
Rapid Commun. Mass Spectrom. 2007; 21: 1776–1782
DOI: 10.1002/rcm
1782 B. Bocca et al.
CONCLUSIONS
The ideal protocol for the quantification of elements in
human biopsies should be applicable to very limited sample
sizes, process many samples in the shortest possible time,
and be almost contamination free.
The analytical procedure developed in this study has the
advantages of greatly reducing sample consumption
(2–10mg of tissue) and processing time (80 samples in
2 h), and maintaining very low blank levels. The SF-ICP-MS
quantification allowed us to accurately and precisely
quantify micro (at parts per trillion) and macro (at several
parts per million) concentrations of elements in human
biopsies in a single sequence by utilizing three different
resolution settings. The elemental distribution obtained in
healthy colorectal biopsies was as follows: Ag, Au, Be, Bi, Co,
Li, Sb, Tl, V,W andZr below 50ng g�1; As, Ba, Cd, Cr, Cs, Hg,
Mo, Ni, Pb, Se and Sn from 100 to 500 ng g�1; Al, Cu, Fe, Mn,
Sr and Zn from a few mg g�1 to 100mg g�1; and Ca andMg at
a level of 1000mg g�1. These preliminary results provide
unique information on a wide elemental profile in healthy
colonic biopsies, and they could provide a very useful
baseline for comparisons with possible abnormal levels of
metals in colorectal cancer tissues or polyps.
AcknowledgementsThis work was financially supported by the LILT, Lega
Italiana per la Lotta contro i Tumori (Italian League against
Cancer), as a part of project no. ISS/N3A (2006-08).
REFERENCES
1. Marchante-Gayon JM, Sanchez-Urıa JE, Sanz-Medel A.J. Trace Elements Med. Biol. 1996; 10: 229.
2. Pasternak K, Przyszlak W. Magnesium Res. 1999; 12: 139.3. Gupta AK, Shukla VK, Vaidya MP, Roy SK, Gupta S. J. Surg.
Oncol. 1993; 52: 172.4. MartinMateoMC,Martın G.Clin. Physiol. Biochem. 1988; 6: 321.5. Martin Mateo MC. Clin. Physiol. Biochem. 1990; 8: 261.
Copyright # 2007 John Wiley & Sons, Ltd.
6. Margalioth EJ, Schenker JG, ChevionM. Cancer 1983; 52: 868.DOI: 10.1002/1097-0142(19830901)52:5<868::AID-CNCR2820520521>3.0.CO;2-K.
7. Danielsen A, Steinnes E. J. Nucl. Med 1970; 11: 260.8. Raithel HJ, Henning F, Schaller KH. J. Environ. Pathol. Tox-
icol. Oncol. 1989; 9: 115.9. Kucharzewski M, Braziewicz J, Majewska U, Gozdz S. Biol.
Trace Elem. Res. 2003; 92: 1.10. Gregoriadis GC, Apostolidis NS, Romanos AN, Paradellis
TP. Cancer 1983; 52: 508. DOI: 10.1002/1097-0142(19830801)52:3<508::AID-CNCR2820520322>3.0.CO;2-8.
11. Arriola H, Longoria L, Quintero A, Guzman D. Biol. TraceElem. Res. 1999; 71–72: 563.
12. Mulay IL, Roy R, Knox BE, Suhr NH, Delaney WE. J. Nat.Cancer Inst. 1971; 47: 1.
13. Senesse P, Meance S, Cottet V, Faivre J, Boutron-Ruault MC.Nutr. Cancer 2004; 49: 66. DOI: 10.1207/s15327914nc4901_9.
14. Weinberg ED. Biometals 1994; 7: 211. DOI: 10.1007/BF00149550.
15. Nelson RL. Nutr. Rev. 2001; 59: 140.16. Yang CY, Chiu HF. Int. J. Cancer 1998; 77: 528. DOI: 10.1002/
(SICI)1097-0215(19980812)77:4<528::AID-IJC9>3.0.CO;2-W.17. Connelly-Frost A, Poole C, Satia JA, Kupper LL,Millikan RC,
Sandler RS. Cancer Epidemiol. Biomarkers Prev. 2006; 15: 486.DOI: 10.1158/1055-9965.EPI-05-0759.
18. Krachler M, Radner H, Irgolic KJ. Fresenius J. Anal. Chem.1996; 355: 120. DOI: 10.1007/s0021663550120.
19. Nicholson JRP, Savory MG, Savory J, Wills MR. Clin. Chem.1989; 35: 488.
20. Varga I, Szebeni A, Szoboszlai N, Kovacs B. Anal. Bioanal.Chem. 2005; 383: 476. DOI: 10.1007/s00216-005-0010-0.
21. Carrilho ENVM, Gonzalez MH, Nogueira ARA, Cruz GN,Nobrega JA. J. Agric. Food Chem. 2002; 50: 4164. DOI: 10.1021/jf011605x.
22. Rahil-Khazen R, Bolann BJ, Ulvik RJ. Biometals 2002; 15: 87.DOI: 10.1023/A:1013197120350.
23. Rahil-Khazen R, Bolann BJ, Myking , Ulvik RJ. J. Trace Elem.Med. Biol. 2002; 16: 15. DOI:10.1016/S0946-672X(02)80004-9.
24. Vanhoe H. J. Trace Elem. Electrolytes Health Dis. 1993; 7:131.
25. Niazi SB, Littlejohn D, Halls DJ. Analyst 1993; 118: 821. DOI:10.1039/AN9931800821.
26. Bocca B, Alimonti A, Petrucci F, Violante N, Sancesario G,Forte G, Senofonte O. Spectrochim. Acta B 2004; 59: 559. DOI:10.1016/j.sab.2004.02.007.
27. Rodushkin I, Odman F, Olofsson R, AxelssonMD. J. Anal. At.Spectrom. 2000; 15: 937. DOI: 10.1039/b003561k.
28. Begerow J, Turfeld M, Dunemann L. J. Anal. At. Spectrom.2000; 15: 347. DOI: 10.1039/a909056h.
Rapid Commun. Mass Spectrom. 2007; 21: 1776–1782
DOI: 10.1002/rcm
Related Documents