Detection of unamplified genomic DNA by a PNA-based microstructured optical fiber (MOF) Bragg-grating optofluidic system Alessandro Bertucci a , Alex Manicardi a , Alessandro Candiani b , Sara Giannetti b , Annamaria Cucinotta b , Giuseppe Spoto c , Maria Konstantaki d , Stavros Pissadakis d , Stefano Selleri b,n , Roberto Corradini a,nn a Dipartimento di Chimica, Università di Parma, Parco Area delle Scienze 17/A, 43124 Parma, Italy b Dipartimento di Ingegneria dell’Informazione, Università di Parma, Parco Area delle Scienze 17/A, 43124 Parma, Italy c Dipartimento di Chimica, Università di Catania, Via Andrea Doria 6, 95125 Catania, Italy d Foundation for Research and Technology Hellas (FORTH), Institute of Electronic Structure and Laser (IESL), P.O. Box 1385, Heraklion 71110, Greece article info Article history: Received 12 June 2014 Accepted 16 July 2014 Available online 25 July 2014 Keywords: Biophotonics Photonic crystal fibers DNA detection Peptide nucleic acids Optofluidics abstract Microstructured optical fibers containing microchannels and Bragg grating inscribed were internally functionalized with a peptide nucleic acid (PNA) probe specific for a gene tract of the genetically modified Roundup Ready soy. These fibers were used as an optofluidic device for the detection of DNA by measuring the shift in the wavelength of the reflected IR light. Enhancement of optical read-out was obtained using streptavidin coated gold-nanoparticles interacting with the genomic DNA captured in the fiber channels (0%, 0.1%, 1% and 10% RR-Soy), enabling to achieve statistically significant, label-free, and amplification-free detection of target DNA in low concentrations, low percentages, and very low sample volumes. Computer simulations of the fiber optics based on the finite element method (FEM) were consistent with the formation of a layer of organic material with an average thickness of 39 nm for the highest percentage (10% RR soy) analysed. & 2014 Elsevier B.V. All rights reserved. 1. Introduction Biophotonics and optofluidic devices represent a highly attrac- tive and promising fields of interest integrating information and communication technologies (ICTs) with biological systems and bioprobes (Fan and White, 2011). In particular, hybrid optical fibers bearing specific probes for DNA detection are advanced tools in which the sensing element can be integrated in a microfluidic device for the generation of optical signals (Russell, 2003). Label- free DNA detection can be achieved using this approach (Passaro et al., 2008), but PCR-free detection should be an ultimate goal for rapid and point-of care diagnostics (Spoto and Corradini, 2012). In such a context, microstructured optical fibers (MOFs), also known as photonic crystal fibers (PCFs), have the unique feature of presenting a cross-section defined by air-hole arrays, allowing to perform internal functionalization (Corradini and Selleri, 2012; Coscelli et al., 2010; Candiani et al., 2012). These air-holes can also be used as channels for microfluidics, allowing to perform infiltration of samples and thus to obtain the modulation of the spectrum of transmitted light induced by the binding of analytes on the modified internal surfaces. Sensing performed in these fibers exploits the evanescent tails of the guided mode field: the larger the fraction of the field that propagates as the evanescent wave, the stronger the interaction with samples placed in the holes or adsorbed onto the surface of MOFs capillaries. Bragg or long period gratings inscribed in standard fibers and MOFs are efficient interrogation elements, since the wavelength of the reflected light depends on the effective refractive index (n eff ), providing sensitivity together with simplicity of fabrication and standardised signal read-out techniques operating in the near IR region (Wang et al., 2009; Guo et al., 2014). These Bragg grating containing MOFs can simultaneously serve as microfluidic plat- forms and optical read-out elements, allowing detection in nano- liter sample volumes. However, for these systems, detection of specific bioanalytes in ultra-low concentration in real samples has still to be demonstrated. Among the possible probes for modification of the inner capillary surface of MOFs, peptide nucleic acids (PNA) (Nielsen and Egholm, 2004), oligonucleotide (ON) mimics with a polyamide backbone, are highly performing, since they show strong and highly selective DNA hybridization and great long-term chemical Contents lists available at ScienceDirect journal homepage: www.elsevier.com/locate/bios Biosensors and Bioelectronics http://dx.doi.org/10.1016/j.bios.2014.07.047 0956-5663/& 2014 Elsevier B.V. All rights reserved. n Corresponding author. nn Corresponding author. Tel.: þ39 0521 905410; fax: þ39 0521 905472. E-mail addresses: [email protected] (S. Selleri), [email protected] (R. Corradini). Biosensors and Bioelectronics 63 (2015) 248–254

Welcome message from author
This document is posted to help you gain knowledge. Please leave a comment to let me know what you think about it! Share it to your friends and learn new things together.
Transcript
Biosensors and Bioelectronics 63 (2015) 248–254
Contents lists available at ScienceDirect
Biosensors and Bioelectronics
http://d0956-56
n Corrnn CorE-m
roberto
journal homepage: www.elsevier.com/locate/bios
Detection of unamplified genomic DNA by a PNA-basedmicrostructured optical fiber (MOF) Bragg-grating optofluidic system
Alessandro Bertucci a, Alex Manicardi a, Alessandro Candiani b, Sara Giannetti b,Annamaria Cucinotta b, Giuseppe Spoto c, Maria Konstantaki d, Stavros Pissadakis d,Stefano Selleri b,n, Roberto Corradini a,nn
a Dipartimento di Chimica, Università di Parma, Parco Area delle Scienze 17/A, 43124 Parma, Italyb Dipartimento di Ingegneria dell’Informazione, Università di Parma, Parco Area delle Scienze 17/A, 43124 Parma, Italyc Dipartimento di Chimica, Università di Catania, Via Andrea Doria 6, 95125 Catania, Italyd Foundation for Research and Technology Hellas (FORTH), Institute of Electronic Structure and Laser (IESL), P.O. Box 1385, Heraklion 71 110, Greece
a r t i c l e i n f o
Article history:Received 12 June 2014Accepted 16 July 2014Available online 25 July 2014
Keywords:BiophotonicsPhotonic crystal fibersDNA detectionPeptide nucleic acidsOptofluidics
x.doi.org/10.1016/j.bios.2014.07.04763/& 2014 Elsevier B.V. All rights reserved.
esponding author.responding author. Tel.: þ39 0521 905410; faail addresses: [email protected] (S. [email protected] (R. Corradini).
a b s t r a c t
Microstructured optical fibers containing microchannels and Bragg grating inscribed were internallyfunctionalized with a peptide nucleic acid (PNA) probe specific for a gene tract of the geneticallymodified Roundup Ready soy. These fibers were used as an optofluidic device for the detection of DNA bymeasuring the shift in the wavelength of the reflected IR light. Enhancement of optical read-out wasobtained using streptavidin coated gold-nanoparticles interacting with the genomic DNA captured in thefiber channels (0%, 0.1%, 1% and 10% RR-Soy), enabling to achieve statistically significant, label-free, andamplification-free detection of target DNA in low concentrations, low percentages, and very low samplevolumes. Computer simulations of the fiber optics based on the finite element method (FEM) wereconsistent with the formation of a layer of organic material with an average thickness of 39 nm for thehighest percentage (10% RR soy) analysed.
& 2014 Elsevier B.V. All rights reserved.
1. Introduction
Biophotonics and optofluidic devices represent a highly attrac-tive and promising fields of interest integrating information andcommunication technologies (ICTs) with biological systems andbioprobes (Fan and White, 2011). In particular, hybrid optical fibersbearing specific probes for DNA detection are advanced tools inwhich the sensing element can be integrated in a microfluidicdevice for the generation of optical signals (Russell, 2003). Label-free DNA detection can be achieved using this approach (Passaroet al., 2008), but PCR-free detection should be an ultimate goal forrapid and point-of care diagnostics (Spoto and Corradini, 2012).
In such a context, microstructured optical fibers (MOFs), alsoknown as photonic crystal fibers (PCFs), have the unique feature ofpresenting a cross-section defined by air-hole arrays, allowing toperform internal functionalization (Corradini and Selleri, 2012;Coscelli et al., 2010; Candiani et al., 2012). These air-holes can alsobe used as channels for microfluidics, allowing to perform
x: þ39 0521 905472.i),
infiltration of samples and thus to obtain the modulation of thespectrum of transmitted light induced by the binding of analyteson the modified internal surfaces. Sensing performed in thesefibers exploits the evanescent tails of the guided mode field: thelarger the fraction of the field that propagates as the evanescentwave, the stronger the interaction with samples placed in theholes or adsorbed onto the surface of MOFs capillaries. Bragg orlong period gratings inscribed in standard fibers and MOFs areefficient interrogation elements, since the wavelength of thereflected light depends on the effective refractive index (neff),providing sensitivity together with simplicity of fabrication andstandardised signal read-out techniques operating in the near IRregion (Wang et al., 2009; Guo et al., 2014). These Bragg gratingcontaining MOFs can simultaneously serve as microfluidic plat-forms and optical read-out elements, allowing detection in nano-liter sample volumes. However, for these systems, detection ofspecific bioanalytes in ultra-low concentration in real samples hasstill to be demonstrated.
Among the possible probes for modification of the innercapillary surface of MOFs, peptide nucleic acids (PNA) (Nielsenand Egholm, 2004), oligonucleotide (ON) mimics with a polyamidebackbone, are highly performing, since they show strong andhighly selective DNA hybridization and great long-term chemical
A. Bertucci et al. / Biosensors and Bioelectronics 63 (2015) 248–254 249
and biological stability (Demidov et al., 1994), thus allowing toperform measurements also in the presence of complex biologicalmatrices. For all these reasons, they are well suited for the specificdetection of DNA target sequences (Nielsen, 2001; Kara et al.,2002; Demidov, 2003; Liu et al., 2005a, 2005b; Ren et al., 2004;Gaylord et al., 2005; Germini et al., 2005; Zhang and Appella,2007, 2010; Zhang et al., 2008, 2010; Degefa and Kwak, 2008; Fanget al., 2008; Soleymani et al., 2009; Fang and Kelley, 2009; Hüskenet al., 2010; Sforza et al., 2011).
Using PNA and nanoparticle enhancement allowed to greatlyincrease sensitivity in genosensing (Pokorski et al., 2005; D’Agataet al., 2008); this strategy, in combination with plasmonic devices,made the direct detection of unamplified genomic DNA feasible byextremely simplifying the detection protocols (D’Agata et al., 2010,2011).
In previous works, the potential use of PNA modified PCF-basedsensors was explored (Coscelli et al., 2010; Candiani et al., 2013). In thiswork, we show that Bragg grating PCFs after internal modificationwith peptide nucleic acid (PNA) probes can be used to performnanoparticle-enhanced detection of a specific trait in unamplifiedgenomic DNA using very small amount of sample and optical read-outin the infrared region. The detection system was tested on DNAextracted from complex matrices (soy flour), directly diluted andanalysed, using very small sample volumes and no amplification steps.
2. Materials and methods
All reagents were obtained from commercial suppliers andused without any further purification. Hydrocloric acid 37%,
A B
C 1.8
1
1.2
1.4
1.6
Ref
lect
ed P
ower
/ 10
-4 W
0.4
0.6
0.8
0
0.2
1536 1538 1540 1542λ
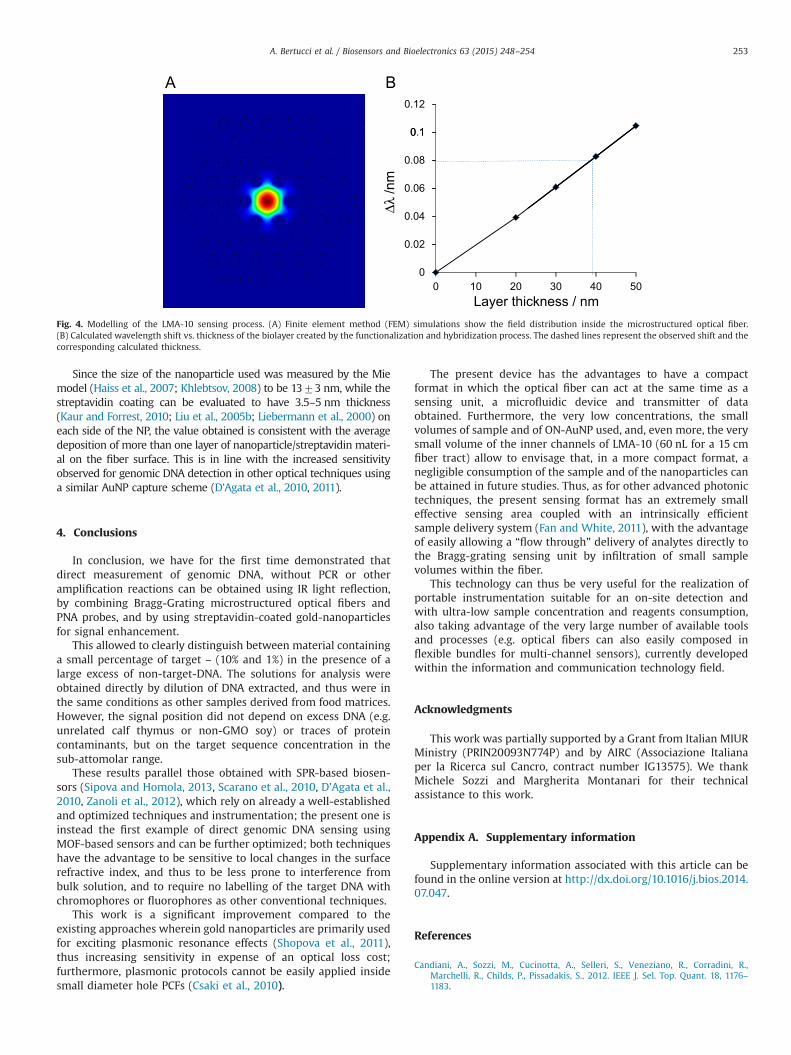
Fig. 1. LMA-10 fiber structure and Bragg-grating reflection. (A) SEM image of the LMA-1(B) Magnification of one channel hole. (C) Spectrum of the reflected light of a LMA-10 P
sodium hydrogen carbonate and sodium chloride were purchasedfrom VWR (Italy). Methanol, ethanol, acetonitrile, sodium dode-cylsulfate, succinic anhydride, N,N-dimethylformamide (DMF),N,N'-diispropylcarbodiimide (DIC), N,N-diisopropylethylamine (DI-PEA), N-hydroxysuccinimide (NHS), (3-aminopropyl)triethoxysilane(APTES), tris(hydroxymethyl)aminomethane (Tris), trifluoroaceticacid (TFA), tetrachloroauric(III) acid, ethylenediaminetetraaceticacid (EDTA) and calf thymus DNA were purchased from Sigma-Aldrich (Italy). Ethanolamine, trisodium citrate and Rink amideresin were obtained from Merck (Italy). Sodium hydroxide inpellets was purchased from Carlo erba (Italy).
Fmoc-C(Bhoc)-OH, Fmoc-G(Bhoc)-OH, Fmoc-A(Bhoc)-OH,Fmoc-T-OH, Fmoc-AEEA-OH were all purchased from ASM (Ger-many) and link Technologies (UK). HBTU was purchased fromMatrix Innovation (Canada). Wild-type streptavidin was purchasedfrom Invitrogen (Italy). Biotinylated and fluorescently labelledoligonucleotides were purchased from Thermo Fisher Scientific.Ultra-pure water (Milli-Q Element, Millipore) was used for all theexperiments.
The sequence of the PNA (Fig. 2) was chosen on the basis ofprevious results using microarrays and SPRI devices (Germiniet al., 2005; D’Agata et al., 2010); the synthesis was carried outusing the above mentioned reagents and the characterization wasconsistent with that previously reported: the PNA was purifiedwith RP-HPLC. HPLC–ESI-MS was used to identify the product. PNA1: H-AEEA-AEEA-AAACCCTTAATCCCA-NH2 calcd. 853.6 (MH5)5þ
711.5 (MH6)6þ , 610.0 (MH7)7þ , 533.8 (MH8)8þ; found m/z 853.7,711.4, 609.9, 533.7.
1544 1546 1548 1550/ nm
0 fiber used in the present study, showing the hexagonal geometry of the channels.CF with Bragg grating inscribed.
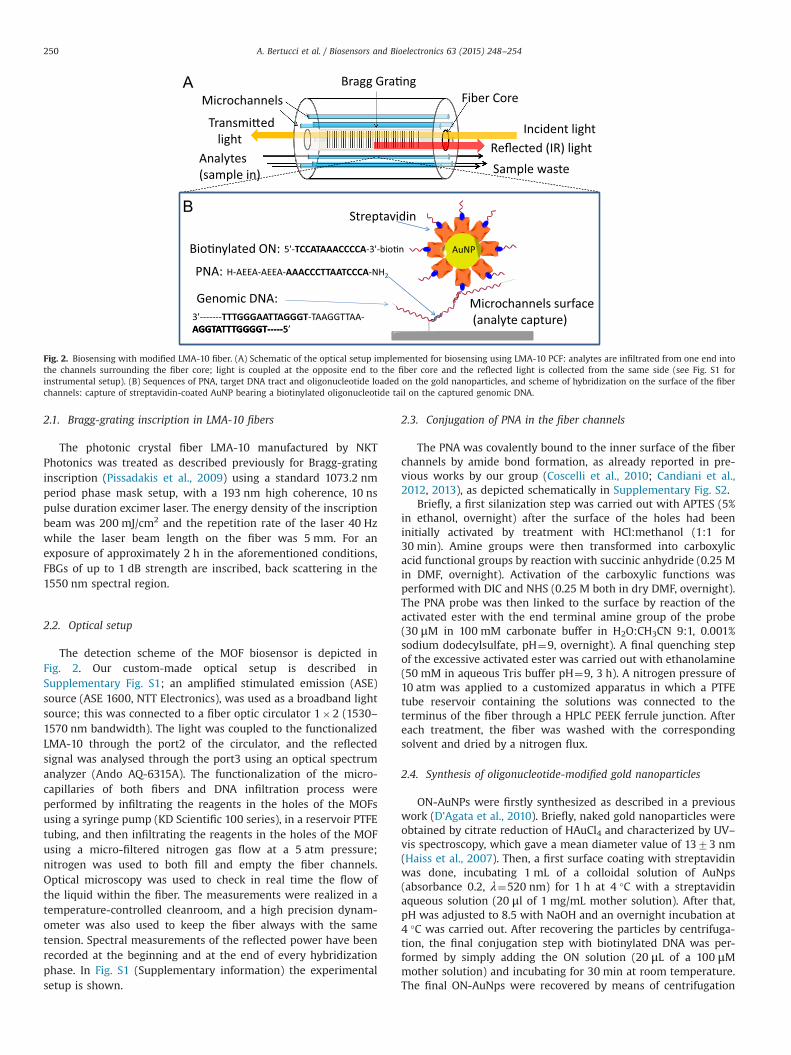
Fig. 2. Biosensing with modified LMA-10 fiber. (A) Schematic of the optical setup implemented for biosensing using LMA-10 PCF: analytes are infiltrated from one end intothe channels surrounding the fiber core; light is coupled at the opposite end to the fiber core and the reflected light is collected from the same side (see Fig. S1 forinstrumental setup). (B) Sequences of PNA, target DNA tract and oligonucleotide loaded on the gold nanoparticles, and scheme of hybridization on the surface of the fiberchannels: capture of streptavidin-coated AuNP bearing a biotinylated oligonucleotide tail on the captured genomic DNA.
A. Bertucci et al. / Biosensors and Bioelectronics 63 (2015) 248–254250
2.1. Bragg-grating inscription in LMA-10 fibers
The photonic crystal fiber LMA-10 manufactured by NKTPhotonics was treated as described previously for Bragg-gratinginscription (Pissadakis et al., 2009) using a standard 1073.2 nmperiod phase mask setup, with a 193 nm high coherence, 10 nspulse duration excimer laser. The energy density of the inscriptionbeam was 200 mJ/cm2 and the repetition rate of the laser 40 Hzwhile the laser beam length on the fiber was 5 mm. For anexposure of approximately 2 h in the aforementioned conditions,FBGs of up to 1 dB strength are inscribed, back scattering in the1550 nm spectral region.
2.2. Optical setup
The detection scheme of the MOF biosensor is depicted inFig. 2. Our custom-made optical setup is described inSupplementary Fig. S1; an amplified stimulated emission (ASE)source (ASE 1600, NTT Electronics), was used as a broadband lightsource; this was connected to a fiber optic circulator 1�2 (1530–1570 nm bandwidth). The light was coupled to the functionalizedLMA-10 through the port2 of the circulator, and the reflectedsignal was analysed through the port3 using an optical spectrumanalyzer (Ando AQ-6315A). The functionalization of the micro-capillaries of both fibers and DNA infiltration process wereperformed by infiltrating the reagents in the holes of the MOFsusing a syringe pump (KD Scientific 100 series), in a reservoir PTFEtubing, and then infiltrating the reagents in the holes of the MOFusing a micro-filtered nitrogen gas flow at a 5 atm pressure;nitrogen was used to both fill and empty the fiber channels.Optical microscopy was used to check in real time the flow ofthe liquid within the fiber. The measurements were realized in atemperature-controlled cleanroom, and a high precision dynam-ometer was also used to keep the fiber always with the sametension. Spectral measurements of the reflected power have beenrecorded at the beginning and at the end of every hybridizationphase. In Fig. S1 (Supplementary information) the experimentalsetup is shown.
2.3. Conjugation of PNA in the fiber channels
The PNA was covalently bound to the inner surface of the fiberchannels by amide bond formation, as already reported in pre-vious works by our group (Coscelli et al., 2010; Candiani et al.,2012, 2013), as depicted schematically in Supplementary Fig. S2.
Briefly, a first silanization step was carried out with APTES (5%in ethanol, overnight) after the surface of the holes had beeninitially activated by treatment with HCl:methanol (1:1 for30 min). Amine groups were then transformed into carboxylicacid functional groups by reaction with succinic anhydride (0.25 Min DMF, overnight). Activation of the carboxylic functions wasperformed with DIC and NHS (0.25 M both in dry DMF, overnight).The PNA probe was then linked to the surface by reaction of theactivated ester with the end terminal amine group of the probe(30 μM in 100 mM carbonate buffer in H2O:CH3CN 9:1, 0.001%sodium dodecylsulfate, pH¼9, overnight). A final quenching stepof the excessive activated ester was carried out with ethanolamine(50 mM in aqueous Tris buffer pH¼9, 3 h). A nitrogen pressure of10 atm was applied to a customized apparatus in which a PTFEtube reservoir containing the solutions was connected to theterminus of the fiber through a HPLC PEEK ferrule junction. Aftereach treatment, the fiber was washed with the correspondingsolvent and dried by a nitrogen flux.
2.4. Synthesis of oligonucleotide-modified gold nanoparticles
ON-AuNPs were firstly synthesized as described in a previouswork (D’Agata et al., 2010). Briefly, naked gold nanoparticles wereobtained by citrate reduction of HAuCl4 and characterized by UV–vis spectroscopy, which gave a mean diameter value of 1373 nm(Haiss et al., 2007). Then, a first surface coating with streptavidinwas done, incubating 1 mL of a colloidal solution of AuNps(absorbance 0.2, λ¼520 nm) for 1 h at 4 °C with a streptavidinaqueous solution (20 μl of 1 mg/mL mother solution). After that,pH was adjusted to 8.5 with NaOH and an overnight incubation at4 °C was carried out. After recovering the particles by centrifuga-tion, the final conjugation step with biotinylated DNA was per-formed by simply adding the ON solution (20 μL of a 100 μMmother solution) and incubating for 30 min at room temperature.The final ON-AuNps were recovered by means of centrifugation
A. Bertucci et al. / Biosensors and Bioelectronics 63 (2015) 248–254 251
and resuspended in PBS buffer. The concentration of the finalmodified gold nanoparticles was evaluated by UV–vis spectro-scopy and working solutions of 0.3 nM concentration were ob-tained by dilution.
2.5. DNA extraction and detection
Samples were treated according to the following protocol (Fig.S1B). Genomic DNA was extracted from each Roundup Ready GMOcertified reference material, by using the IonForce kit (Generon,Italy), according to the manufacturer's protocol. Samples of400 mg of soy flour were always used as the starting material.The concentration of the total DNA in the final extracted sampleswas quantified using a Pico200 Picodrop Spectrophotometer(Picodrop Limited, Hinxton, UK) according to the manufacturer'sprocedure. For the following optical analysis, all the samples werediluted to a final concentration of 30 ng/mL in PBS buffer; genomicDNA was then fragmented by sonication for 2 min and by vortex-ing for 1 min. Immediately before the optical analysis, all sampleswere heated up to 95 °C for 5 min in order to separate the twoDNA strands; strand re-association was prevented by ice coolingthe samples for 1 min before their introduction into the opticalapparatus. About 100 μL of sample were transferred into a PTFEtube reservoir coupled to the optical fiber and a flux of nitrogenwas used to inject the sample into the MOF at a constant rate,ensuring a continuous renewal of the solution in contact with themodified surface of the channels.
The DNA solution was then allowed to flow through the fiberfor 50 min, then the fiber was emptied under a nitrogen flux. Afteroptical data had been collected, a 0.3 nM solution (10 μL) ofoligonucleotide-modified gold nanoparticles (ON-AuNPs) bearinga sequence complementary to the target (Fig. 2) was injected intothe fiber under the same conditions, and the measurement wasperformed in the same way.
ANOVA test was used to check out statically significant differ-ence (α¼5%) among the mean shift values obtained for eachsample (0%, 0.1%, 1%, and 10%). Hartley test was first done to assesshomoscedasticity among the four levels (q¼4, n¼3, α ¼0.05),giving a negative response (p4α). ANOVA test was thus per-formed giving a positive response (poα). Bonferroni test wascarried out for each couple of mean values ( 0–0.1%, 0–1%, 0–10%,0.1–1%, 1–10%, and 0.1–10%). Every mean value was found sig-nificantly different from each other (α¼0.05, see Tables S1 and S2for details), except 0–0.1% and 0.1–1%.
2.6. Finite element method simulations
In order to accurately investigate the modulation of thereflected signal with respect to the growth of the bio-layer intothe fiber channels, a full-vector modal solver has been applied,based on finite element method (FEM) magnetic field modulation.The symmetry of the fiber section was considered, and thus onequarter of the optical fiber was modeled; after drawing the fibermodel, the materials have been defined with their relative refrac-tive indices (Fig. S3a, Supplementary information). The wholedomain was then divided into triangles, which are ideal to rendersuch cross-sections: specifically, the fiber cross-section was di-vided into 125998 triangles (Fig. S3b, Supplementary information),with increasing density in the most sensitive areas, such as intothe microcapillaries of the fiber, and decreasing the density inremote areas, where the field tends not to propagate. This divisioncorresponds to a number of nodes equal to 252,683, in which theequations of the FEM have been resolved.
The effective refractive index neff, which is directly proportionalto the reflected Bragg wavelength as described in Eq. (1), has beenevaluated for the reference fiber, and for different bio-layer
thickness of the hybridized fiber. The fiber LMA-10 used is entirelymade of silica, but the effective refractive index neff, is the result ofthe hybrid nature of the microstructure within the fibers, whichcontains silica and air; the refractive index of the silica material asa function of the working wavelength, is reported in the literature.However, this value, can slightly vary depending on the manufac-turing process; thus, in our calculation, the actual refractive indexof the fiber material was calculated by FEM solver, by a backwardprocess, by exploiting the Bragg formula (1) and Sellmeier equa-tions, and adjusting the material refractive index (nmat) in order toobtain an neff value calculated corresponding to the experimentalone; a value of nmat of 1.451 was obtained for by this approach.Starting from this value, the effect of coating with a bio-layerhaving a refractive index of 1.502, corresponding to organicmaterial deposited on the functionalized nanoparticle and cap-tured on the capillary channels within the fiber (Mudraboyina andSabarinathan, 2011), was simulated using layers of 20, 30, 40, and50 nm.
3. Results and discussion
3.1. MOF sensor preparation and optical setup
The fiber used for the inscription was the commercially avail-able, silica glass, photonic crystal fiber LMA-10 (Fig. 1A). It has a�10 μm core while the cladding region is formed by 60 holes of2.85 μm diameter (Fig. 1B) and an inter hole distance of 6.4 μm.For the inscription of the grating, a standard 1073.2 nm periodphase mask setup was used (Pissadakis et al., 2009), with a 193 nmhigh coherence, 10 ns pulse duration excimer laser. Under theseconditions a Bragg grating pitch of 536.6 nm was obtained, withFBGs back scattering in the 1550 nm spectral region (Fig. 1C).
The reflected wavelength, called the Bragg wavelength, isdefined by the relationship
λ Λ= n2 (1)B eff
where neff is the effective refractive index at the location of thegrating, and Λ is the Bragg grating period. The dependence of λBon neff allows detecting the capture event by exploiting even ultra-low wavelength shifts of this band, in the IR spectral range, due tovariation of the total refractive index.
Using a Bragg grating as an optical interrogator is particularlyconvenient for sensor development, since it allows having both thesource and the detector for the reflected light at the same end ofthe fiber, leaving the opposite end available for sample infiltrationinto the micro-channels either by pressure or by suction. Ourcustom-made optical setup is depicted in Fig. 2A and described indetail in the SI.
Using this configuration, the PNA was covalently bound to theinner surface of the optical fiber channels (Fig. 2 B) by silanizationwith (3-aminopropyl)trietoxysilane (APTES), followed by introduc-tion of a succinyl moiety and then linking the pending carboxylategroup to the N-terminal of the PNA probe through a spacer unit(Fig. S2, Supplementary information).
3.2. Nanoparticle-enhanced detection of genomic DNA
Having prepared the PNA-modified-MOF, we tested the possi-bility to obtain reproducible wavelength shifts using non-ampli-fied genomic DNA. Thus, a PNA sequence complementary to aspecific tract of Roundup Ready (RR) soy was used. The RR-soy waschosen as a DNA model for its relevance in food-analysis andbecause samples of certified DNA content of the target sequenceare available and unambiguous for this substrate (genomic DNA
(iii)(i,ii)
0.12
0.06
0λsh
ift/ n
m
-0.060 0.1 1 10
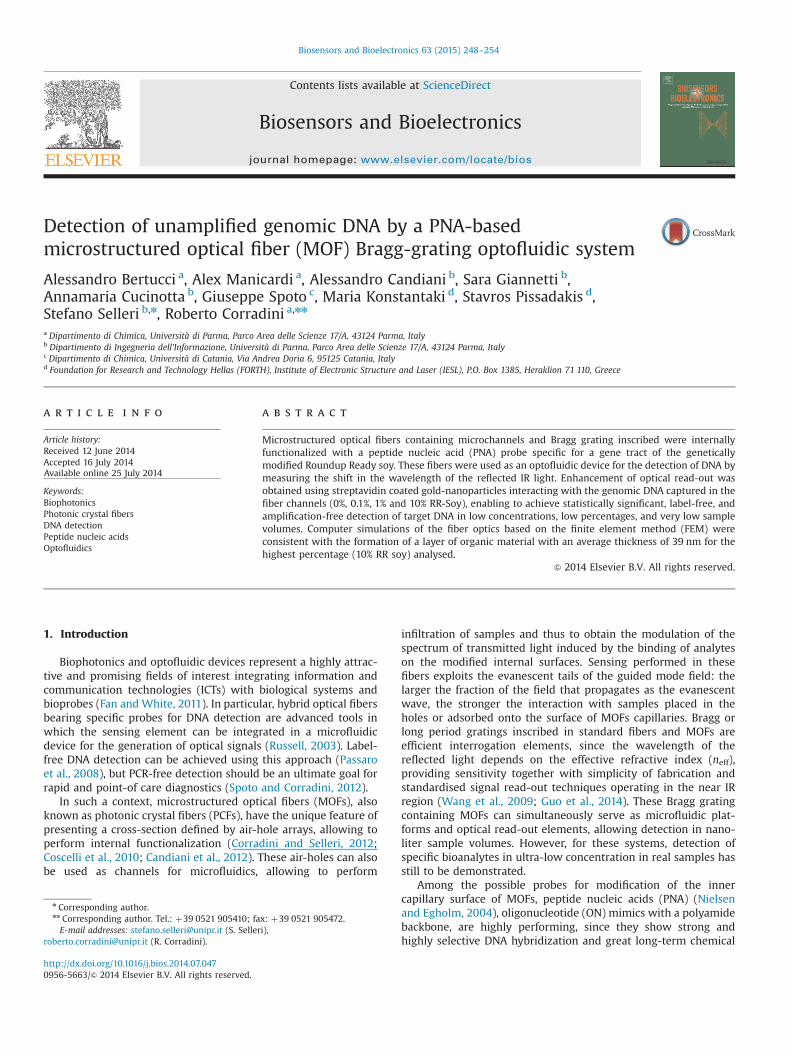
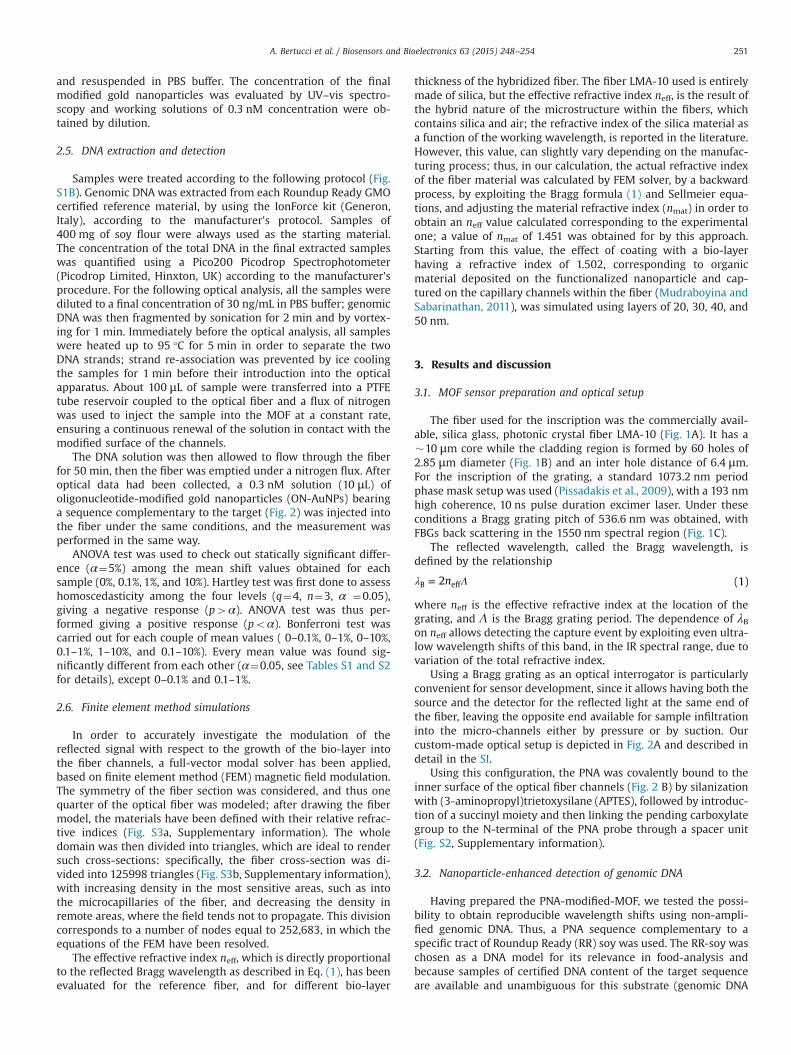
% Target (RR) DNAFig. 3. Nanoparticle-enhanced shift in reflection wavelength. (A) Wavelength shiftin the reflection mode obtained for the LMA10-PNA fibers (i) before (black line), (ii)after DNA (red line), and (iii) after ON-AuNPs infiltration (blue line), using 10% GMODNA sample, leading to an average shift of 0.08 nm (RSD 27%). (B) Optical shiftsobtained using DNA at the same concentration but with different GMO% (verticalbars represent7standard deviation). ANOVA evaluation (Table S2) showed sig-nificant differences between each pair of percentage levels, except 0–0.1% and 0.1–1%. (For interpretation of the references to color in this figure legend, the reader isreferred to the web version of this article.)
A. Bertucci et al. / Biosensors and Bioelectronics 63 (2015) 248–254252
from GMO soy flour), and have previously been used to test SPRbiosensing devices (D’Agata et al., 2010). The DNA was extractedfrom reference flour material (GMO material content certified byInstitute for Reference Materials and Measurements, IRMM) con-taining 0%, 1%, and 10% of transgenic soybean flour, using acommercial kit and standard procedures. The concentration ofeach DNA sample was measured with a Pico200 Picodrop Spectro-photometer and, from the extracted DNA solution, samples con-taining the same concentration of 30 ng/mL were produced bydilution. The DNA was thermally denatured at 95 °C and rapidlycooled (1–2 min) in an ice bath, in order to prevent dsDNA re-annealing, which competes with hybridization with the PNAprobe. The frozen samples were melted just before their use andthe corresponding solutions were passed through the fiber holesfor 50 min (total volume of sample used: 100 μL, corresponding to3 ng of DNA). The fibers were subsequently emptied and driedwith a nitrogen flux, since it has been shown that the sensitivity ofgrating sensors is around three times higher when measurementsare made in air rather than in liquids (Mudraboyina andSabarinathan, 2011), and their optical properties were recorded,using the same setup. The position of the reflection band gener-ated by the Bragg grating was at first monitored after infiltration ofDNA but no significant shift was observed (Fig. 3A, Student's t,n¼4, α¼0.05).
Nanoparticles and sub-wavelength structured materials canlead to strong improvement in the detection limits, and to greatlysimplify sensing devices and protocols based on DNA and DNA-likeprobes (Mirkin et al., 1996; Elghanian et al., 1997; Rosi and Mirkin,2005; Ghosh and Pal, 2007; Liu and Lu, 2003; Merkoçi, 2010,Zanoli et al., 2012), especially in those in which the response isdepending on events take place on nanometer or sub-nanometerscales on the sensor surface. Accordingly, a major change in therefractive index can be obtained by gold nanoparticles (NP)targeting the DNA captured by PNA probes, as shown in otheroptical techniques (Kim et al., 2010; Pokorski et al., 2005; D'Agataet al., 2008, 2011). Thus, streptavidin-coated gold nanoparticleswere prepared, and loaded with biotinylated oligonucleotidecomplementary to the DNA region flanking the PNA targetsequence (Fig. 2B). A solution of these ON-AuNPs was infiltratedin the LMA-10 fibers after the DNA solutions (Fig. 2B), the fiber wasemptied, and the position of the Bragg-grating band was mon-itored and compared to that observed for the empty fiber.
After data collection, fibers were washed with PBS, at pH¼7 torestore initial conditions. Each fiber, after emptying, was reused forsubsequent measurements. Quadruplicate measurements wereperformed by alternating the solutions with different targetcontent, in order to avoid systematic errors, and significanceanalysis was carried out (Fig. 3B, Table 1). In this case, a significantshift of the Bragg reflection band was observed in the case of 10%RR content (Fig. 3A), whereas a weaker shift was recorded in thecase of 1% RR flour, and notably, no statistically significant shiftwas observed for the sample containing no RR flour (Fig. 3 and SI).ANOVA test (Table S2) proved a statistically significant differenceamong the mean values for 0%, 1% and 10% samples, since Fcalc¼24.91 resulted bigger than Ftab¼3.49 (Tables S1 and S2). This is avery interesting result in view of the low quantity of total DNAused (3 ng in total), which corresponds to few thousands (about2500) copies, according to the calculations previously reported(D’Agata et al., 2010), of which only small percentages contain thetarget sequence. No significant shift was observed for the 0.1% RRsoy sample (Fig. 3B, Tables S1 and S2). According to these data, theminimal concentration of the unamplified target DNA significantlydetected in our experiments is that of the 1% sample, i.e. 0.3 ng/mL(corresponding to an estimated 410 zM concentration according toD’Agata et al., 2010).
Finally, an unrelated DNA (calf thymus DNA) was used to testfor eventual effects of unspecific binding; also in this case nosignificant shift was observed (Table S1).
3.3. Finite element method simulation
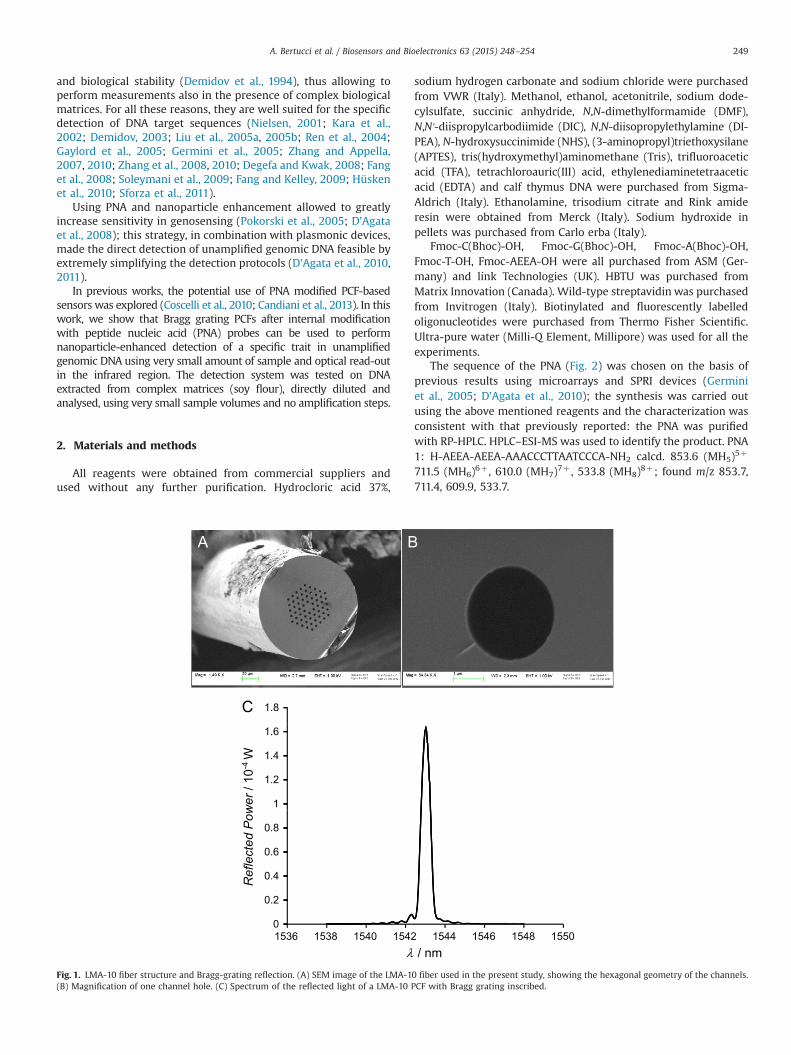
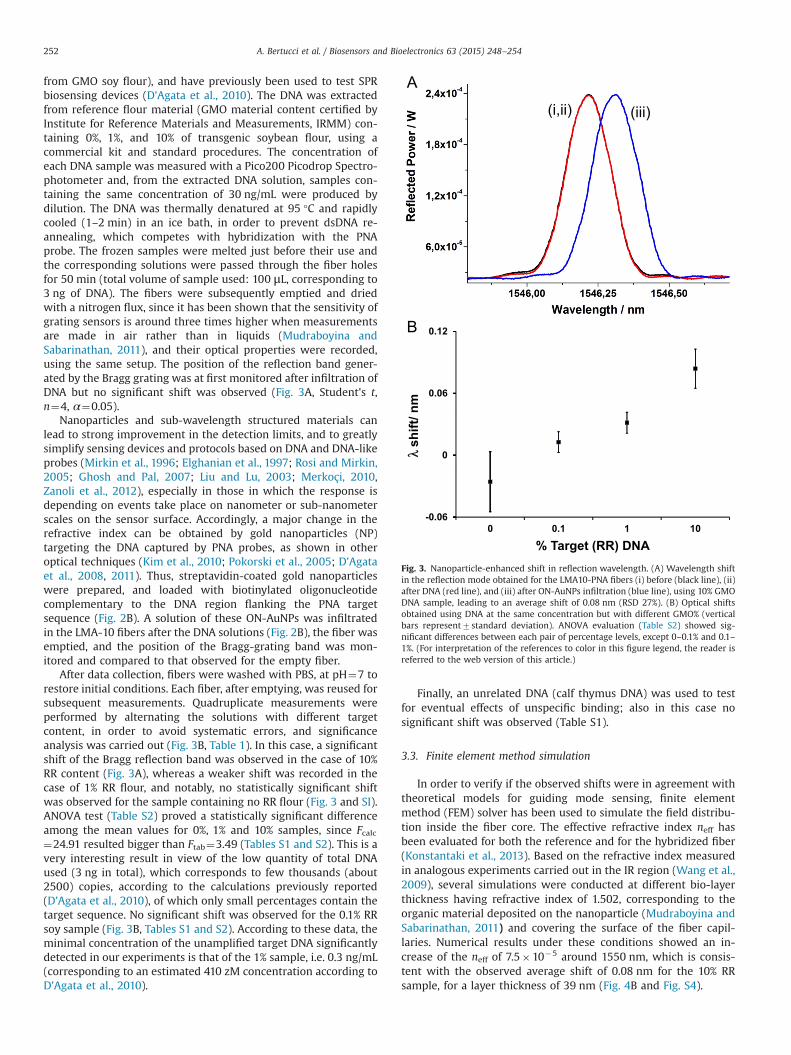
In order to verify if the observed shifts were in agreement withtheoretical models for guiding mode sensing, finite elementmethod (FEM) solver has been used to simulate the field distribu-tion inside the fiber core. The effective refractive index neff hasbeen evaluated for both the reference and for the hybridized fiber(Konstantaki et al., 2013). Based on the refractive index measuredin analogous experiments carried out in the IR region (Wang et al.,2009), several simulations were conducted at different bio-layerthickness having refractive index of 1.502, corresponding to theorganic material deposited on the nanoparticle (Mudraboyina andSabarinathan, 2011) and covering the surface of the fiber capil-laries. Numerical results under these conditions showed an in-crease of the neff of 7.5�10�5 around 1550 nm, which is consis-tent with the observed average shift of 0.08 nm for the 10% RRsample, for a layer thickness of 39 nm (Fig. 4B and Fig. S4).
0 1
0.12
0.06
0.08
0.1
Δλ /n
m
0
0.02
0.04
0 10 20 30 40 50Layer thickness / nm
Fig. 4. Modelling of the LMA-10 sensing process. (A) Finite element method (FEM) simulations show the field distribution inside the microstructured optical fiber.(B) Calculated wavelength shift vs. thickness of the biolayer created by the functionalization and hybridization process. The dashed lines represent the observed shift and thecorresponding calculated thickness.
A. Bertucci et al. / Biosensors and Bioelectronics 63 (2015) 248–254 253
Since the size of the nanoparticle used was measured by the Miemodel (Haiss et al., 2007; Khlebtsov, 2008) to be 1373 nm, while thestreptavidin coating can be evaluated to have 3.5–5 nm thickness(Kaur and Forrest, 2010; Liu et al., 2005b; Liebermann et al., 2000) oneach side of the NP, the value obtained is consistent with the averagedeposition of more than one layer of nanoparticle/streptavidin materi-al on the fiber surface. This is in line with the increased sensitivityobserved for genomic DNA detection in other optical techniques usinga similar AuNP capture scheme (D’Agata et al., 2010, 2011).
4. Conclusions
In conclusion, we have for the first time demonstrated thatdirect measurement of genomic DNA, without PCR or otheramplification reactions can be obtained using IR light reflection,by combining Bragg-Grating microstructured optical fibers andPNA probes, and by using streptavidin-coated gold-nanoparticlesfor signal enhancement.
This allowed to clearly distinguish between material containinga small percentage of target – (10% and 1%) in the presence of alarge excess of non-target-DNA. The solutions for analysis wereobtained directly by dilution of DNA extracted, and thus were inthe same conditions as other samples derived from food matrices.However, the signal position did not depend on excess DNA (e.g.unrelated calf thymus or non-GMO soy) or traces of proteincontaminants, but on the target sequence concentration in thesub-attomolar range.
These results parallel those obtained with SPR-based biosen-sors (Sipova and Homola, 2013, Scarano et al., 2010, D’Agata et al.,2010, Zanoli et al., 2012), which rely on already a well-establishedand optimized techniques and instrumentation; the present one isinstead the first example of direct genomic DNA sensing usingMOF-based sensors and can be further optimized; both techniqueshave the advantage to be sensitive to local changes in the surfacerefractive index, and thus to be less prone to interference frombulk solution, and to require no labelling of the target DNA withchromophores or fluorophores as other conventional techniques.
This work is a significant improvement compared to theexisting approaches wherein gold nanoparticles are primarily usedfor exciting plasmonic resonance effects (Shopova et al., 2011),thus increasing sensitivity in expense of an optical loss cost;furthermore, plasmonic protocols cannot be easily applied insidesmall diameter hole PCFs (Csaki et al., 2010).
The present device has the advantages to have a compactformat in which the optical fiber can act at the same time as asensing unit, a microfluidic device and transmitter of dataobtained. Furthermore, the very low concentrations, the smallvolumes of sample and of ON-AuNP used, and, even more, the verysmall volume of the inner channels of LMA-10 (60 nL for a 15 cmfiber tract) allow to envisage that, in a more compact format, anegligible consumption of the sample and of the nanoparticles canbe attained in future studies. Thus, as for other advanced photonictechniques, the present sensing format has an extremely smalleffective sensing area coupled with an intrinsically efficientsample delivery system (Fan and White, 2011), with the advantageof easily allowing a “flow through” delivery of analytes directly tothe Bragg-grating sensing unit by infiltration of small samplevolumes within the fiber.
This technology can thus be very useful for the realization ofportable instrumentation suitable for an on-site detection andwith ultra-low sample concentration and reagents consumption,also taking advantage of the very large number of available toolsand processes (e.g. optical fibers can also easily composed inflexible bundles for multi-channel sensors), currently developedwithin the information and communication technology field.
Acknowledgments
This work was partially supported by a Grant from Italian MIURMinistry (PRIN20093N774P) and by AIRC (Associazione Italianaper la Ricerca sul Cancro, contract number IG13575). We thankMichele Sozzi and Margherita Montanari for their technicalassistance to this work.
Appendix A. Supplementary information
Supplementary information associated with this article can befound in the online version at http://dx.doi.org/10.1016/j.bios.2014.07.047.
References
Candiani, A., Sozzi, M., Cucinotta, A., Selleri, S., Veneziano, R., Corradini, R.,Marchelli, R., Childs, P., Pissadakis, S., 2012. IEEE J. Sel. Top. Quant. 18, 1176–1183.
A. Bertucci et al. / Biosensors and Bioelectronics 63 (2015) 248–254254
Candiani, A., Bertucci, A., Giannetti, S., Konstantaki, M., Manicardi, A., Pissadakis, S.,Cucinotta, A., Corradini, R., Selleri, S., 2013. J. Biomed. Opt. 18 (Article Number:057004).
Corradini, R., Selleri, S., 2012. In: Prisco, M., Cutolo, A., Cusano, A. (Eds.), PhotonicCrystal Fibers for Physical, Chemical and Biological Sensing. Bentham Publisher,Sharjah, pp. 216–231 (Chapter 13).
Coscelli, E., Sozzi, M., Poli, F., Passaro, D., Cucinotta, A., Selleri, S., Corradini, R.,Marchelli, R., 2010. IEEE J. Sel. Top. Quant. 16, 967–972.
Csaki, A., Jahn, F., Latka, I., Henkel, T., Malsch, D., Schneider, T., Schröder, K.,Schuster, K., Schwuchow, A., Spittel, R., Zopf, D., Fritzsche, W., 2010. Small 6,2584–2589.
D’Agata, R., Corradini, R., Grasso, G., Marchelli, R., Spoto, G., 2008. ChemBioChem 9,2067–2070.
D’Agata, R., Corradini, R., Ferretti, C., Zanoli, L., Gatti, M., Marchelli, R., Spoto, G.,2010. Biosens. Bioelectron. 25, 2095–2100.
D’Agata, R., Breveglieri, G., Zanoli, L.M., Borgatti, M., Spoto, G., Gambari, R., 2011.Anal. Chem. 83, 8711–8717.
Degefa, T.H., Kwak, J., 2008. J. Electroanal. Chem. 612, 37–41.Demidov, V.V., 2003. Trends Biotechnol. 21, 4–7.Demidov, V.A., Potaman, V.N., Frank-Kamenetskii, M.D., Egholm, M., Buchardt, O.,
Sonnichsen, S.H., Nielsen, P.E., 1994. Biochem. Pharm. 48, 1310–1313.Elghanian, R., Storhoff, J.J., Mucic, R.C., Letsinger, R.L., Mirkin, C.A., 1997. Science
277, 1078–1081.Fan, X., White, I.M., 2011. Nat. Photonics 5, 591–597.Fang, B., Jiao, S., Li, M., Qu, Y., Jiang, X., 2008. Biosens. Bioelectron. 23, 1175–1179.Fang, Z., Kelley, S.O., 2009. Anal. Chem. 81, 612–617.Gaylord, B.S., Massie, M.R., Feinstein, S.C., Bazan, G.C., 2005. Proc. Natl. Acad. Sci.
USA 102, 34–39.Germini, A., Rossi, S., Zanetti, A., Corradini, R., Fogher, C., Marchelli, R., 2005. J. Agric.
Food Chem. 53, 3958–3962.Ghosh, S.K., Pal, T., 2007. Chem. Rev. 107, 4797–4862.Guo, T., Liu, F., Liu, Y., Chen, N.K., Guan, B.O., Albert, J., 2014. Biosens. Bioelectron. 55,
452–458.Haiss, W., Thanh, N.T.K., Aveyard, J., Fernig, D.G., 2007. Anal. Chem. 79, 4215–4221.Hüsken, N., Gębala, M., Schuhmann, W., Metzler-Nolte, N., 2010. ChemBioChem 11,
1754–1761.Kara, P., Kerman, K., Ozkan, D., Meric, B., Erdem, A., Nielsen, P.E., Ozsoz, M., 2002.
Bioelectrochemistry 58, 119–126.Kaur, K., Forrest, J.A., 2010. Langmuir 28, 2736–2744.Khlebtsov, N.G., 2008. Anal. Chem. 80, 6620–6625.Kim, S.K., Cho, H., Jeong, J., Kwon, J.N., Jung, Y., Chung, B.H., 2010. Chem. Commun.
46, 3315–3317.
Konstantaki, M., Childs, P., Sozzi, M., Pissadakis, S., 2013. Laser Photonic Rev. 7, 439–443.
Liebermann, T., Knoll, W., Sluka, P., Hermann, R., 2000. Colloids Surf. A 169, 337–350.
Liu, J., Lu, Y., 2003. J. Am. Chem. Soc. 125, 6642–6643.Liu, J., Tian, S., Nielsen, P.E., Knoll, W., 2005a. Chem. Commun., 2969–2971.Liu, J., Tian, S., Tiefenauer, L., Nielsen, P.E., Knoll, W., 2005b. Anal. Chem. 77, 2756–
2761.Merkoçi, A., 2010. Biosens. Bioelectron. 26, 1164–1177.Mirkin, C.A., Letsinger, R.L., Mucic, R.C., Storhoff, J.J., 1996. Nature 382, 607–609.Mudraboyina, A.K., Sabarinathan, J., 2011. Sensors 11, 11295–11304.Nielsen, P.E., 2001. Anal. Biotechnol. 12, 16–20.Nielsen, P.E., Egholm, M. (Eds.), 2004. Peptide Nucleic Acids: Protocols and
Applications, Second edition Horizon Press, Wymondham, Norfolk, UK.Passaro, D., Foroni, M., Poli, F., Cucinotta, A., Selleri, S., Lægsgaard, J., Bjarklev, A.O.,
2008. IEEE Sens. J. 8, 1280–1286.Pissadakis, S., Livitziis, M., Tsibidis, G.D., 2009. J. Eur. Opt. Soc. Rap. Public 4, 09049.Pokorski, J.K., Nam, J.M., Vega, R.A., Mirkin, C.A., Appella, D.H., 2005. Chem.
Commun., 2101–2103.Ren, B., Zhou, J.M., Komiyama, M., 2004. Nucleic Acids Res. 32, e42.Rosi, N.L., Mirkin, C.A., 2005. Chem. Rev. 105, 1547–1562.Russell, P., 2003. Science 299, 358–362.Scarano, S., Mascini, M., Turner, A.P.F., Minunni, M., 2010. Biosens. Bioelectron. 25,
957–966.Sforza, S., Corradini, R., Tedeschi, T., Marchelli, R., 2011. Chem. Soc. Rev. 40, 221–
232.Sipova, H., Homola, J., 2013. Anal. Chim. Acta 773, 9–23.Shopova, S.I., Rajmangal, R., Holler, S., Arnold, S., 2011. Appl. Phys. Lett. 98, 243104.Soleymani, L., Fang, Z., Sargent, E.H., Kelley, S.O., 2009. Nat. Nanotechnol. 4, 844–
848.Spoto, G., Corradini, R. (Eds.), 2012. Detection of Non-amplified Genomic DNA.
Springer, Dordrecht.Wang, Z., Heflin, J.R., van Cott, K., Stolen, R.H., Ramachandran, S., Ghalmi, S., 2009.
Sens. Actuators B 139, 618–623.Zanoli, L.M., D’Agata, R., Spoto, G., 2012. Anal. Bioanal. Chem. 402, 1759–1771.Zhang, G.J., Zhang, G., Chua, J.H., Chee, R.E., Wong, E.H., Agarwal, A., Buddharaju, K.
D., Singh, N., Gao, Z., Balasubramanian, N., 2008. Nano Lett. 8, 1066–1070.Zhang, G.J., Zhang, L., Huang, M.J., Luo, Z.H.H., Tay, G.K.I., Lim, E.J.A., Kang, T.G., Chen,
Y., 2010. Sens. Actuators B—Chem. 146, 138–144.Zhang, N., Appella, D.H., 2007. J. Am. Chem. Soc. 129, 8424–8425.Zhang, N., Appella, D.H., 2010. J. Infect Dis. 201, S42–S45.
Related Documents