UNIVERSITY OF CALIFORNIA SAN DIEGO Design and Rapid Prototyping of Portable Ophthalmic Measurement Instruments for Frequent Self-monitoring of Eye Conditions A thesis submitted in partial satisfaction of the requirements for the degree Master of Science in Engineering Sciences (Mechanical Engineering) by Buu Kim Truong Committee in charge: Professor Frank E. Talke, Chair Professor James Friend Professor Vlado A. Lubarda 2020

Welcome message from author
This document is posted to help you gain knowledge. Please leave a comment to let me know what you think about it! Share it to your friends and learn new things together.
Transcript
i
UNIVERSITY OF CALIFORNIA SAN DIEGO
Design and Rapid Prototyping of Portable Ophthalmic Measurement Instruments for
Frequent Self-monitoring of Eye Conditions
A thesis submitted in partial satisfaction of the
requirements for the degree Master of Science
in
Engineering Sciences (Mechanical Engineering)
by
Buu Kim Truong
Committee in charge:
Professor Frank E. Talke, Chair
Professor James Friend
Professor Vlado A. Lubarda
2020

ii
Copyright
Buu Kim Truong, 2020
All rights reserved.

iii
SIGNATURE
The thesis of Buu Kim Truong is approved, and it is acceptable in quality and form for
publication on microfilm and electronically:
___________________________________________________________________
___________________________________________________________________
___________________________________________________________________
Chair
University of California San Diego
2020

iv
DEDICATION
To my mother and sister for their unwavering support

v
TABLE OF CONTENT
SIGNATURE ............................................................................................................................ iii
DEDICATION .......................................................................................................................... iv
TABLE OF CONTENTS .......................................................................................................... v
LIST OF ACRONYMS ............................................................................................................ viii
LIST OF FIGURES .................................................................................................................. ix
LIST OF TABLES .................................................................................................................... xv
ACKNOWLEDGMENTS ........................................................................................................ xvi
ABSTRACT OF THESIS ......................................................................................................... xviii
Chapter 1 Introduction ....................................................................................................... 1
1.1 Human Eye........................................................................................................ 1
1.1.1 Structure of the Eye .............................................................................. 1
1.1.2 Optics of the Eye ................................................................................... 2
1.2 Four Standard Ophthalmic Diagnostic Instruments .......................................... 8
1.2.1 Slit Lamp Biomicroscope ..................................................................... 9
1.2.2 Visual Acuity Screener ......................................................................... 10
1.2.3 Funduscope ........................................................................................... 11
1.2.4 Tonometer ............................................................................................. 14
1.3 Current Standard of Eye Care ........................................................................... 15
1.4 Need for Portable Instruments .......................................................................... 16
1.5 State of the Art and Commercially Available Portable Ophthalmic Devices ... 18
1.5.1 Handheld Slit Lamp .............................................................................. 18
1.5.2 Visual Acuity Smartphone Attachment ................................................ 20
1.5.3 Portable Funduscope ............................................................................. 21
1.5.4 Portable Intraocular Pressure Sensor .................................................... 24
1.5.5 Summary ............................................................................................... 25
1.6 Thesis Objective................................................................................................ 25
1.7 Organization of Thesis ...................................................................................... 26
Chapter 2 Design and Fabrication of Self-imaging Slit Lamp .......................................... 27
2.1 Design Parameters and Requirements .............................................................. 27
2.2 Proposed Design of a Portable Self-imaging Slit Lamp ................................... 27
2.3 Köhler Principle of Illumination ....................................................................... 29
vi
2.4 Optical Principle of Self-imaging ..................................................................... 30
2.5 Optical Configuration and Calculation ............................................................. 33
2.6 Fabrication of Self-Imaging Slit Lamp Smartphone Adaptor ........................... 40
2.6.1 Device Overview .................................................................................. 40
2.6.2 Light Source .......................................................................................... 42
2.6.3 Optical Configuration and Calibration Experiment .............................. 46
2.6.4 Slit Aperture and Ambient Illumination ............................................... 55
2.6.5 Electrical Circuits.................................................................................. 61
2.6.6 Programming Logic ............................................................................. 63
2.6.7 Housing Design and Attachment Mechanism Using 3D Printing ........ 64
2.6.8 Quality Assurance and Testing Result ................................................. 67
2.7 Fabrication of Auto Sweeping Self-Imaging Slit Lamp Goggle ...................... 68
2.7.1 Device Overview .................................................................................. 68
2.7.2 Auto Sweeping Optical Calculation...................................................... 70
2.7.3 Electrical Circuits.................................................................................. 73
2.7.4 Programming Logic .............................................................................. 77
2.7.5 Housing Design ..................................................................................... 79
2.7.6 Testing Result ....................................................................................... 81
Chapter 3 Design and Fabrication of Self-screening Visual Acuity Screener .................. 82
3.1 Principle of Snellen's Chart ............................................................................... 82
3.2 Design Parameters and Requirements .............................................................. 83
3.3 LCD Displays Snellen's Optotype .................................................................... 84
3.4 Optical Configuration and Calculation for Single-lens Screener ..................... 86
3.5 Single-lens Visual Acuity Screening Prototype ................................................ 89
3.6 Optical Configuration and Calculation for Dual-lens Screener ........................ 91
3.7 Dual-lens Visual Acuity Screening Prototype .................................................. 96
Chapter 4 Design and Fabrication of 2-in-1 Goggle ......................................................... 99
4.1 Device Overview .............................................................................................. 99
4.2 Electrical Circuits.............................................................................................. 101
4.3 Programming Logic .......................................................................................... 103
4.4 Housing Design ................................................................................................. 105
4.5 Testing Result ................................................................................................... 107
Chapter 5 Conclusion and Future Direction ...................................................................... 109

vii
5.1 Conclusion ........................................................................................................ 109
5.2 Future Direction ................................................................................................ 110
References ................................................................................................................................. 112

viii
LIST OF ACRONYMS
MAR minimum angle of resolution
PCB printed circuit board
VA visual acuity
NIIOS Netherland Institute of Innovative Ocular Surgery
CMRR Center for Memory and Recording Research
SMD surface-mount device
MCPCB metal core printed circuit board
SLA stereolithography apparatus

ix
LIST OF FIGURES
Figure 1.1: Structural Schematic of the Human Eye ................................................................ 2
Figure 1.2: The eye accommodated state to see a close by object, and the eye relaxed state to see
a faraway object. P is the principal point. Qnear and Qfar are points representing the object
location. Snear and Sfar are distances between point Q and P ....................................................... 3
Figure 1.3: Diagram of optical axes, cardinal points, and key optical elements to describes the
human eye imaging system ........................................................................................................ 4
Figure 1.4: The relaxed vision mode of the Exact Gullstrand Eye #1 model. rc denotes refractive
surface radius of curvature, and n denotes the value of the refractive index ............................. 5
Figure 1.5: Illustration of the point-spread function for the diffraction-limit system: a) the point
target, b) two unresolved dots, c) two resolvable dots ............................................................... 7
Figure 1.6: Diagram illustrates the physical separation of the photoreceptors that defined the
minimum angle of resolution to be 1 minute of arc ................................................................... 8
Figure 1.7: The slit lamp SL 105 by Carl Zeiss company, and a schematic breakdown of the slit
lamp three main components: stereomicroscope, slit lamp illumination unit, and mechanics
module [13]. ............................................................................................................................... 9
Figure 1.8: a) illustration of a slit lamp examination, and b) an example of a slit image [13] . 10
Figure 1.9: The tumbling E Snellen eye chart [21] ................................................................... 11
Figure 1.10: Image of a health fundus of the eye...................................................................... 11
Figure 1.11: a) illustration of a direct ophthalmoscope, and b) schematic of the optical system of
a conventional direct ophthalmoscope, where the physician can directly view the patient’s retinal
structure through the device [18] ............................................................................................... 12
Figure 1.12: a) A binocular indirect ophthalmoscope, and b) schematic of the optical system of a
conventional binocular indirect ophthalmoscope, with ray tracing of the illumination beam path,
and the observation path [18] ..................................................................................................... 13
Figure 1.13: The Goldman tonometer, and a diagram of the applanation tonometer [17] ....... 14
Figure 1.14: a) diagram of a rebound tonometer, and b) diagram of a pneumatic tonometer .. 15
Figure 1.15: Eidolon 510L portable slit lamp smartphone adaptor [24] ................................... 18
Figure 1.16: Illustration of the HSL-005 portable slit lamp smartphone attachment [5] .......... 19
Figure 1.17: SA Photonics Hybrid device [7] ........................................................................... 19

x
Figure 1.18: EyeQue Insight visual acuity screener smartphone attachment [2] ..................... 20
Figure 1.19: D-Eye Ophthalmoscope [28] ................................................................................ 21
Figure 1.20: The PEEK Retina ophthalmoscope smartphone adaptor [19] .............................. 22
Figure 1.21: oDocs Nun ophthalmoscope [29] ......................................................................... 22
Figure 1.22: Funduscope with off pupil illumination [20]........................................................ 23
Figure 1.23: Off pupil illumination design [20] ........................................................................ 24
Figure 1.24: Stitching multiple fundus images into one [20] ................................................... 24
Figure 1.25: FDA cleared the Icare HOME rebound self-tonometer [31] ................................ 24
Figure 2.1: Proposed portable self-imaging slit lamp consists of two main components: a) slit
generating unit, where (yellow color) ray tracing path indicates the path of the slit beam, and b)
self-imaging unit ........................................................................................................................ 28
Figure 2.2: Köhler Principle of Illumination diagram, where L indicates the light source, K is
the collector lens, A is the slit aperture, O is the objective lens, and S defines the location of the
corneal eye surface ..................................................................................................................... 29
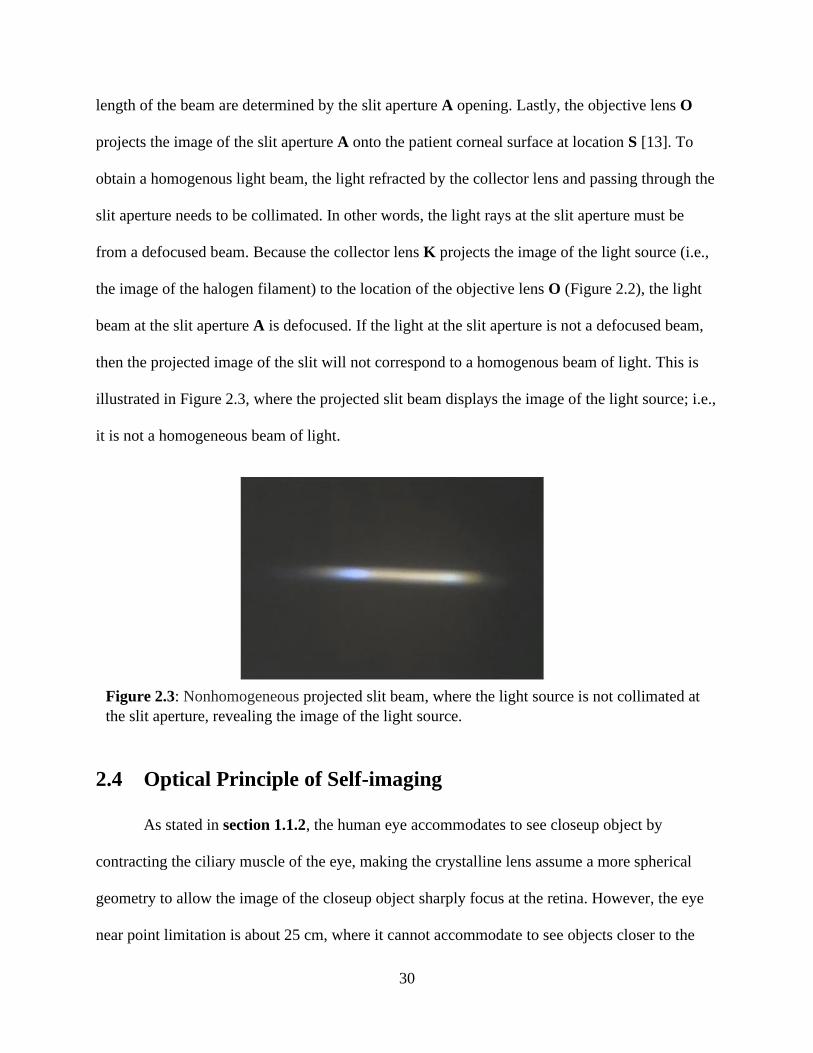
Figure 2.3: Nonhomogeneous projected slit beam, where the light source is not collimated at the
slit aperture, revealing the image of the light source ................................................................. 30
Figure 2.4: Self-imaging diagram. The positive meniscus lens with 50:50 beam splitter coating
has (i.e., 2-way mirror) two functionalities ................................................................................ 31
Figure 2.5: Illustration of a beam splitter plate, where the incident beam is at 45° with respect to
the plate, leading to a 90° deflection of the outgoing reflected beam, and a parallel transmitted
beam ........................................................................................................................................... 32
Figure 2.6: Ray diagram of a concave mirror, where the object distance from the mirror is less
than the focal length of the mirror. f is the focal point of the concave mirror, and c is the center
of curvature at two times the focal distance............................................................................... 32
Figure 2.7: Optical diagram illustrating the path for forming the virtual image of the eye by the
2-way mirror, which allows the user to see his or her eye at a distance less than the near point of
the eye ........................................................................................................................................ 33
Figure 2.8: Diagram of the self-imaging unit optical configuration. a) Diagram illustrating the
overall four optical paths interacting with the eye. b) Optical diagram defining the parameters
and optical distance that the slit beam needed to travel to reach the eye ................................... 36
Figure 2.9: Optical diagram of projecting an image of the slit onto the eye’s cornea. soi is the
image distance from the back-principal plane (H2), where ho2 is the distance from the back-
principal plane to the back-vertex point..................................................................................... 37
xi
Figure 2.10: Optical diagram defining parameters and the path for light source image formation
at the objective lens O, with the goal of generating defocused light rays at the slit aperture .... 38
Figure 2.11: Law of reflection diagram, where i is the angle of incident ray from the normal
axis, and the r is the angle of reflected ray from the normal axis. The angle of the incident ray is
equaled to the angel of reflected ray off the mirror reflecting surface ...................................... 39
Figure 2.12: Diagram defining the slit deflection angle of the mirror, where i is the incident
angle of the slit from the normal axis (dashed line), γ is the deflection angle of the mirror, and δ
is the deflection angle of the slit beam to the eye ...................................................................... 40
Figure 2.13: Diagram of the self-imaging slit lamp smartphone adaptor with the slit lamp unit
(a), and the smartphone aligning case (b) .................................................................................. 41
Figure 2.14: Comparison between conventional incandescent slit lamp light bulb with a super
bright 5mm light-emitting diode [3] .......................................................................................... 42
Figure 2.15: Kelvin color temperature scale chart [34] ............................................................ 43
Figure 2.16: Diagram of the Cree Xlamp high intensity LED mounted onto a Sinkpad MCPCB,
where a) the bare SMD LED (XPL-HI-U4-3000K), b) the metal core printed circuit board
MCPCB (SNKPD-XP10-MCPCB), and c) LED reflowed to the MCPCB with wires connected
for power input [9] ..................................................................................................................... 44
Figure 2.17: LED exponential relationship between forward voltage and current [9] ............ . 46
Figure 2.18: Lens selection experiment cage system for the optical slit system of the self-
imaging slit lamp........................................................................................................................ 47
Figure 2.19: Comparison between the conventional benchtop slit lamp and the self-imaging slit
lamp optical system. a) setup of the optical system at the correct projected distance to the subject
eye, b) process of capturing the slit imaging using a smartphone attachment to the conventional
slit lamp eyepiece, and c) slit image showing two slit beams with comparable quality............ 48
Figure 2.20: Illustration of the CAD model for the 3D printed optical slit casing ................... 49
Figure 2.21: Characterization of the slit beam output from the 3D printed optical slit case, where
the slit projected distance is 70 mm ........................................................................................... 50
Figure 2.22: Calibration experiment for the optical slit casing. The experiment aims to collect
four data points to characterize the relationship between object distance (slit aperture to the
objective lens) and the image distance ....................................................................................... 52
Figure 2.23: Plot of experimental data and (cubic and exponential fit) approximating functions,
in comparison with the theoretical curve of projected slit (image) distance ............................. 53
Figure 2.24: Determine the projected slit beam (image) distance of an optical slit case with the
slit aperture to an objective lens (object) distance at 15.5 mm .................................................. 55
xii
Figure 2.25: Image of the slit aperture from a conventional slit lamp biomicroscope ............. 55
Figure 2.26: Comparison of slit images captured under different ambient lighting environment.
a) slit image captured in dark ambient lighting, where the slit beam is the only light source for
the camera, and b) slit image captured in bright dark ambient lighting environment ............... 57
Figure 2.27: A 3D printed slit aperture that enabling the output of sharp slit beam and ambient
illumination, where a) the CAD model of a three parts slit aperture with the width of the slit
cutout at 100 μm, b) photograph of an SLA 3D printed slit aperture in a stackable lens tube, and
c) demonstration of the projected slit beam along with the ambient illumination ..................... 57
Figure 2.28: Adjustable slit optical cage system with the same optics and separation distances of
the self-imaging slit lamp optics system, (a), and the separation spacing between each element is
carefully measured to ensure accuracy, (b) ................................................................................ 59
Figure 2.29: Improved slit aperture design, featuring a 30° symmetric beveled edge to minimum
light distortion on the edges for output slit beam ...................................................................... 59
Figure 2.30: Comparison of slit beam output from old slit aperture without beveled edges (a) and
updated slit aperture with symmetric beveled edges (b) ............................................................ 60
Figure 2.31: Soldered circuit board of the self-imaging slit lamp smartphone adaptor ............ 61
Figure 2.32: Electrical schematic of the self-imaging slit lamp smartphone adaptor ............... 62
Figure 2.33: The programming flowchart of the self-imaging slit lamp smartphone adaptor .. 63
Figure 2.34: The completely assembled self-imaging slit lamp smartphone device, consisting of
a smartphone aligning case, and a slit lamp unit ....................................................................... 64
Figure 2.35: CAD model of the self-imaging slit lamp smartphone adaptor: slit lamp unit and
smartphone aligning case ........................................................................................................... 65
Figure 2.36: Formlabs Form 2 SLA 3D printer, showing the printing overview ..................... 66
Figure 2.37: Demonstration of the self-imaging slit lamp smartphone adaptor, along with the slit
images of the left and right eye .................................................................................................. 67
Figure 2.38: The diagram of the slit lamp goggle, outlining the slit auto sweeping feature .... 69
Figure 2.39: Illustration of the auto sweeping with important parameters ............................... 70
Figure 2.40: Relationship between the angle of the sweep mirror (α1) and the angle of the
deflected slit beam (θ1) with respect to the law of reflection normal axis ................................. 71
Figure 2.41: Diagram of the relationship between the angle of the sweep mirror (α2) and the
angle of the deflected slit beam (θ2) with respect to the law of reflection normal axis ............. 72

xiii
Figure 2.42: Auto sweeping experimental setup. Using a laser pointer as the light source, the
laser dot is projected onto the eye at angle α1 and α2 to evaluate the calculated angles ............ 73
Figure 2.43: Slit lamp goggle electrical schematic ................................................................... 74
Figure 2.44: Completely soldered slit lamp goggle circuit with two main protoboards: (a) the
power regulator board, and (b) the control board ...................................................................... 75
Figure 2.45: The electrical schematic of the slit lamp goggle PCB .......................................... 76
Figure 2.46: Slit lamp goggle PCB layout and board renders .................................................. 77
Figure 2.47: Slit lamp google programming flowchart............................................................. 78
Figure 2.48: CAD model of the slit lamp goggle ...................................................................... 79
Figure 2.49: CAD model of part breakdown for the slit lamp goggle ...................................... 80
Figure 2.50: The auto sweeping mount to align the sweep mirror with the optical slit ............ 80
Figure 2.51: Fully assembled slit lamp goggle ......................................................................... 81
Figure 2.52: Self-imaging slit lamp examination with the slit lamp goggle ............................. 81
Figure 3.1: Size of the visual acuity optotype E that determines a 20/20 vision of the Snellen’s
chart, where the gap size of the letter is 1 minute of arc ........................................................... 83
Figure 3.2: Proposed design of the self-screening visual acuity screener ................................ 83
Figure 3.3: TFT LCD screen specifications for displaying Snellen characters ........................ 84
Figure 3.4: Diagram illustrating the determination of the visual acuity testing distance, where h
is the letter height, g is the gap size, dN is the testing distance, N̅ is the nodal point length, α is the
visual acuity angle, and d is the distance from the eye to the Snellen optotype ........................ 85
Figure 3.5: Diagram illustrating the projection of the Snellen E optotype on the LCD screen at a
greater distance using a position converging lens ...................................................................... 87
Figure 3.6: Image distance and image height versus object distance for a positive lens .......... 88
Figure 3.7: Single-lens visual acuity prototype: a) the diagram of the prototype, b) the CAD
model of the device, and c) the completely built unit of the visual screener ............................. 90
Figure 3.8: Image distance and image height versus object distance for a negative lens ......... 91
Figure 3.9: Diagram illustrating the dual-lens configuration of the visual acuity screener. A
negative lens is responsible for shrinking the size of the Snellen optotypes, and a positive lens is
responsible for projecting an image of the letter 6 m away from the eye .................................. 92

xiv
Figure 3.10: Total testing distance, d, versus object distance for positive lens, dpo ................. 93
Figure 3.11: Plot comparing distances of a dual-lens configuration to find the optimal locations
for the negative and positive lens ............................................................................................... 94
Figure 3.12: The dual-lens visual acuity screening goggle, where the Snellen character is
displayed using the screen of the smartphone............................................................................ 96
Figure 3.13: An Android smartphone application for visual acuity examination. The user can
increase the size of optotypes by pressing the positive shape button and decrease the size by
pressing the negative button....................................................................................................... 97
Figure 4.1: Illustration of 2-in-1 goggle, which is a combination of single-lens visual acuity
screener and the self-imaging slit lamp smartphone adaptor ..................................................... 99
Figure 4.2: Diagram of the 2-in-1 goggle, outlining the visual acuity screener (a), and the slit
lamp unit within the goggle (b) .................................................................................................. 100
Figure 4.3: The control interface of the 2-in-1 goggle .............................................................. 101
Figure 4.4: Electrical schematic of the 2-in-1 goggle ............................................................... 102
Figure 4.5: Completed circuit of the 2-in-1 device on a breadboard ........................................ 103
Figure 4.6: The programming flowchart of the 2-in-1 goggle, outline the slit lamp exam
sequence and the visual acuity sequence ................................................................................... 103
Figure 4.7: Illustration of the visual acuity examination sequence ........................................... 104
Figure 4.8: The CAD model of the 2-in-1 goggle ..................................................................... 105
Figure 4.9: CAD model of part breakdown for the 2-in-1 goggle ............................................ 106
Figure 4.10: Fully assembled 2-in-1 goggle ............................................................................. 106
Figure 4.11: Testing the 2-in-1 goggle functionality ................................................................ 107
Figure 4.12: 2-in-1 goggle featured in the NIIOS newsletter ................................................... 108

xv
LIST OF TABLES
Table 1.1: : Geometric and optical parameters of the Exact Gullstrand Eye #1 model relaxed
vision and accommodated vision [18] ....................................................................................... 6
Table 2.1: Technical specifications of the Cree Xlamp high intensity LED (XPL-HI-U4-3000K),
and the Sinkpad MCPCB (SNKPD-XP10-MCPCB) ................................................................. 45
Table 2.2: Resulting data from the lens selection experiment, showing the configurations that
generated a narrow and sharp slit lamp at the ideal soi distance ................................................ 48
Table 3.1: Visual acuity dual-lens configuration comparison to achieve a testing distance of 6 m
using various dual-lens configurations ...................................................................................... 95
Table 3.2: List of calculated Snellen letter height correlated with each visual acuity fractions,
according to dual-lens configuration, and, given the pixel size of the smartphone S8, the height is
converted to pixel count to display the optotype onto the smartphone screen .......................... 98
xvi
ACKNOWLEDGMENTS
I want to begin this acknowledgment by expressing my deepest gratitude to Professor
Frank Talke, Dr. Alex Phan, Dr. Gerrit Melles, and Phuong Truong for the opportunity to work
on such an innovative project. Additionally, I would like to thank the lab members and faculty
members at the Center for Memory and Recording Research (CMRR) for their unconditional
support throughout my academic and research journey. I am deeply grateful for their patience
and guidance as I learned to grow into the person I am today.
Without Professor Frank Talke, my academic advisor, guidance, and encouragement, I
would not have been able to contribute to the project as I have. I would like to express my
sincere appreciation to Professor Talke. He has inspired me and shown me how to become a
better engineer and researcher. His enthusiasm for science and appreciation for solving complex
engineering challenges have helped me overcome many technical problems that I thought were
impossible to resolve. I have learned so much and become a more competent engineer because of
Professor Talke’s mentorship.
Of great importance to the project and my academic career is Dr. Alex Phan, my co-
researcher and mentor. He has been the guiding force behind all of my breakthroughs in the
project. Dr. Phan's ability to analyze challenging problems and apply unconventional solutions
has opened many avenues to advance the progress of the project to a new height. With Dr.Phan's
mentorship, I have become a more reliable and capable engineer. Thank you so much for guiding
me through my treacherous journey to become a better engineer.
I would like to express my appreciation to Dr. Gerrit Melles and the medical staff at the
NIIOS eye clinic for the opportunity to be a part of this ophthalmic project. Dr.Melles's
unwavering support enabled me to achieve success and overcome the challenges facing this

xvii
research. His insightful expertise in the field of ophthalmology gave me valuable feedback to
advance the quality of each succeeding device. Special thanks to the NIIOS staff for performing
clinical trials using the developed ophthalmic instruments to provide critical data on how the
prototypes can be improved.
Moreover, I would like to thank Phuong, my co-research, and mentor. She has shown me
the path on how to be a resourceful and reliable researcher. Her diligent work ethic inspired me
and everyone around her to perform and contribute to the advancement of the project at our
maximum capacity. More than this, Phuong has helped me grow into a well-rounded person.
Thank you very much for guiding me to become a better version of myself, both professionally
and personally.
Last but not least, Ben Suen, Nick Williams, Ella Stimson, Marina Krijgsman, and Robin
Persoons are significant contributors to my success and the success of this project. Without this
team of engineers with diverse backgrounds, many of the unique challenges in building medical
devices would not be resolved in this project. Thank you very much for working day and night
on this project with me.
xviii
ABSTRACT OF THE THESIS
Design and Rapid Prototyping of Portable Ophthalmic Measurement Instruments for
Frequent Self-monitoring of Eye Conditions
by
Buu Kim Truong
Master of Science in Engineering Sciences (Mechanical Engineering)
University of California San Diego, 2020
Professor Frank E Talke, Chair
Over half of the visits to an ophthalmologist are routine eye checkups or post-operation
follow-ups. Such in-person visits are necessary to monitor the condition of the patient’s eyes, so
the physician can provide appropriate on-time treatment to mitigate damage to a patient’s vision.
At each visit, the patient receives a set of routine eye examinations using standard ophthalmic
instruments. These large machines are expensive, need to be stored in a controlled environment,
and require a trained technician to operate them to conduct the exam. Because of these factors, a
visit to an eye clinic can be expensive and time-consuming for a patient. In the case where the
xix
patient cannot physically visit the office, the ophthalmologist may call the patient and receive a
verbal description of the patient’s eye condition, which often leads to misdiagnosis and costly
late treatment. The problems associated with patients being unable to receive appropriate eye
examination is made worse by the present COVID-19 pandemic, where everyone must stay at
home and comply with the so-called social distancing policy to minimize the spread of the virus.
Patients are unable to visit the eye clinic to receive their eye checkups, forcing ophthalmologists
to rely on the patient’s verbal description for medical treatment.
To address the growing need for at-home eye monitoring, portable internet-enabled
patient point-of-care ophthalmic instruments need to be designed to enable patients to self-
examine their eyes in the comfort of their homes. The results from such screening are then
forwarded to an ophthalmologist for off-site evaluation. Also, with these internet-enabled
ophthalmic devices, patients can remotely connect with the physician to discuss their screening
results via the internet. These devices aim to be low-cost, easy-to-use, reliable, and portable.
They will replace the complicated to operate and costly to maintain conventional ophthalmic
instruments such as the slit lamp, the visual acuity screener, the funduscope, and the tonometer.
The main objective of this master’s thesis is to develop portable internet-enabled
ophthalmic instruments that enable users to perform self-monitoring of their eyes. These
instruments are a self-imaging slit lamp, a self-screening visual acuity screener, and a compact 2-
in-1 goggle tester, capable of performing slit lamp examination and visual acuity screening. The
self-imaging slit lamp instrument can automate the slit lamp screening process of the anterior
segment of the eye. Slit images are captured and stored via an attached smartphone. Unlike the
traditional visual acuity exam, the self-screening visual acuity screener enables the user to

xx
perform the test on himself or herself without the need for a test operator to facilitate the
screening process.
Moreover, the 2-in-1 goggle allows the user to perform a self-imaging slit lamp exam and
receive self-screening visual acuity results from a single compact device. Ophthalmologists are
given access to the examination results through secure cloud storage, and they can communicate
with patients via the attached smartphone in these devices. Preliminary prototyping of these
portable self-examining ophthalmic instruments has demonstrated promising results.
1
Chapter 1 Introduction
1.1 Human Eye
The human eye is a complex visual system that enables the colorful world to be
visualized. It accomplishes this task by focusing light rays reflected off an object via the cornea
and the crystalline lens onto the retina, where the light energy is converted into electrical signals
by photoreceptors (rods and cones). Then, the signals are transmitted to the cerebral visual cortex
via the optic nerve to be interpreted as an upright image [18]. Moreover, the eye is the only organ
that can be examined internally in a noninvasive manner through the pupil. Looking into the eye,
the observer can determine the health condition of the eye. The structure of the eye and its
optical characteristics must be fully understood before one can develop a device to examine the
subject.
1.1.1 Structure of the Eye
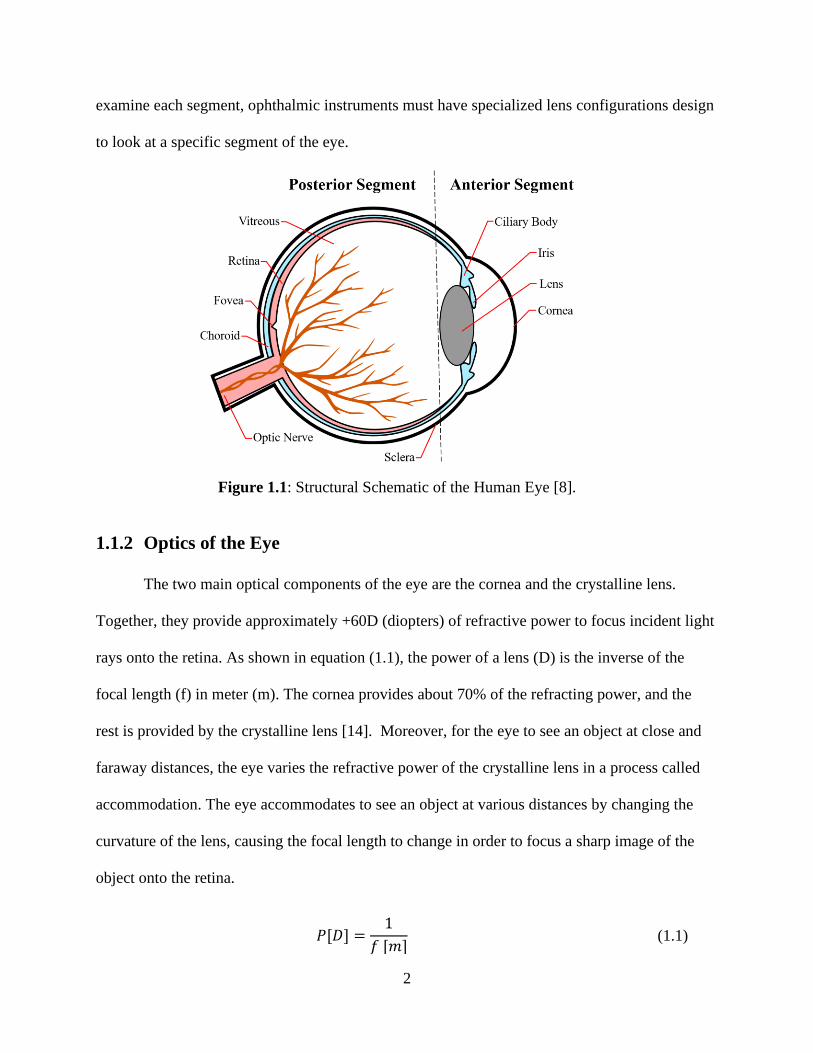
The human eye is separated into the two main segments: the anterior segment and the
posterior segment, as shown in Figure 1.1. The anterior segment further breaks down into the
anterior chamber and posterior chamber. The different tissues of the anterior segment are the
cornea, the aqueous humor, the crystalline lens, the iris, and the ciliary body, which are
responsible for refracting light into the eye. On the other hand, the posterior segment, which is
responsible for processing incoming light into a visual stimulus for the brain, is composed of the
sclera, the choroid, the retina, the fovea, the optic nerve, and the vitreous humor [8]. Damage or
degeneration of any tissues listed above can lead to irreversible blindness in the long run; thus, it
is essential to frequently monitor the eye to determine and treat any damage promptly. To
2
examine each segment, ophthalmic instruments must have specialized lens configurations design
to look at a specific segment of the eye.
1.1.2 Optics of the Eye
The two main optical components of the eye are the cornea and the crystalline lens.
Together, they provide approximately +60D (diopters) of refractive power to focus incident light
rays onto the retina. As shown in equation (1.1), the power of a lens (D) is the inverse of the
focal length (f) in meter (m). The cornea provides about 70% of the refracting power, and the
rest is provided by the crystalline lens [14]. Moreover, for the eye to see an object at close and
faraway distances, the eye varies the refractive power of the crystalline lens in a process called
accommodation. The eye accommodates to see an object at various distances by changing the
curvature of the lens, causing the focal length to change in order to focus a sharp image of the
object onto the retina.
𝑃[𝐷] =1
𝑓 [𝑚] (1.1)
Figure 1.1: Structural Schematic of the Human Eye [8].
3
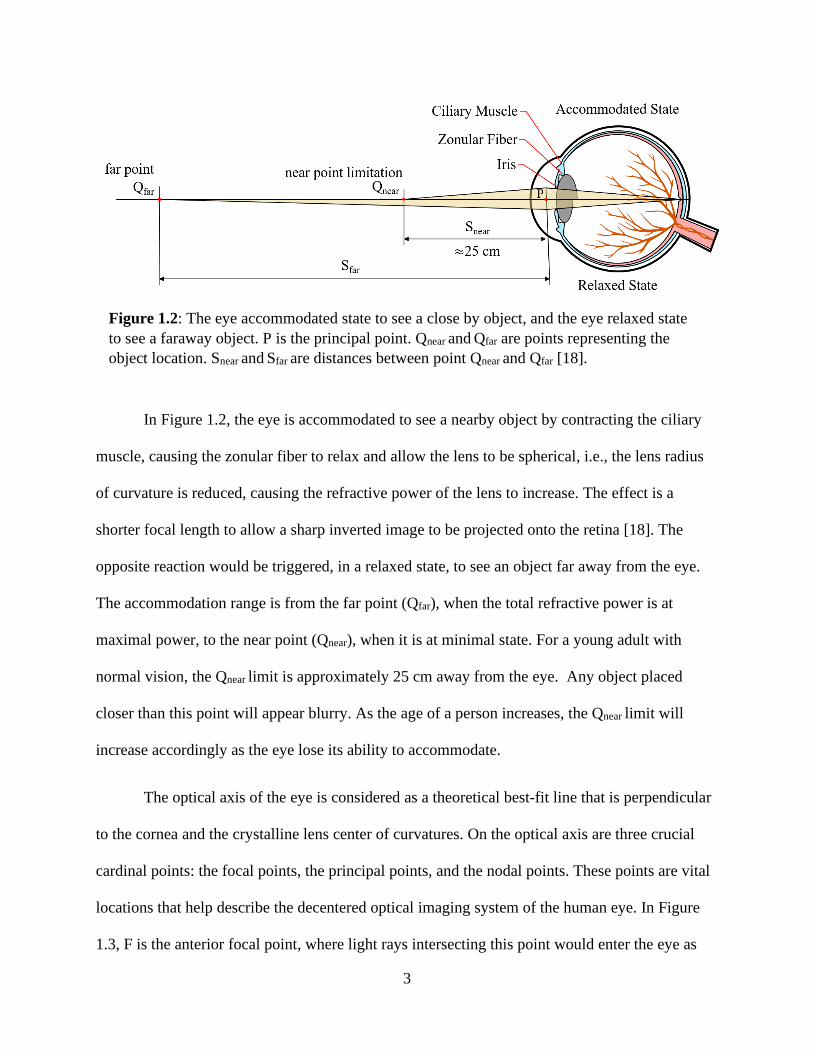
In Figure 1.2, the eye is accommodated to see a nearby object by contracting the ciliary
muscle, causing the zonular fiber to relax and allow the lens to be spherical, i.e., the lens radius
of curvature is reduced, causing the refractive power of the lens to increase. The effect is a
shorter focal length to allow a sharp inverted image to be projected onto the retina [18]. The
opposite reaction would be triggered, in a relaxed state, to see an object far away from the eye.
The accommodation range is from the far point (Qfar), when the total refractive power is at
maximal power, to the near point (Qnear), when it is at minimal state. For a young adult with
normal vision, the Qnear limit is approximately 25 cm away from the eye. Any object placed
closer than this point will appear blurry. As the age of a person increases, the Qnear limit will
increase accordingly as the eye lose its ability to accommodate.
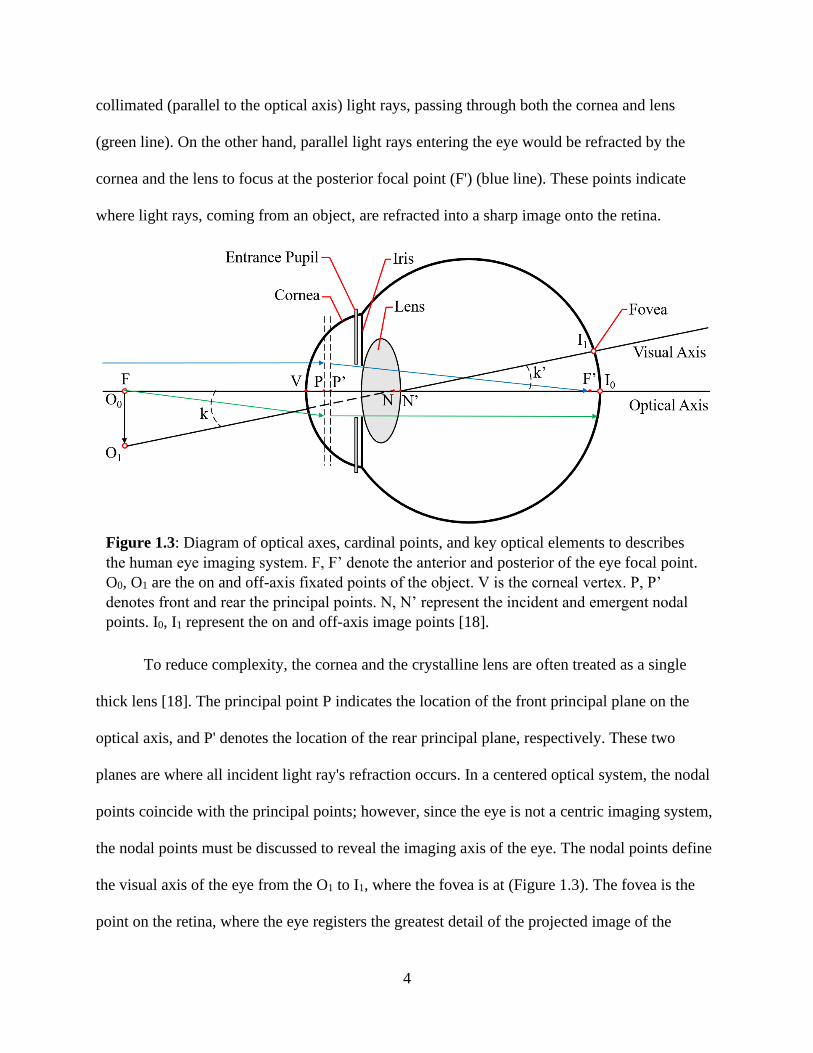
The optical axis of the eye is considered as a theoretical best-fit line that is perpendicular
to the cornea and the crystalline lens center of curvatures. On the optical axis are three crucial
cardinal points: the focal points, the principal points, and the nodal points. These points are vital
locations that help describe the decentered optical imaging system of the human eye. In Figure
1.3, F is the anterior focal point, where light rays intersecting this point would enter the eye as
Figure 1.2: The eye accommodated state to see a close by object, and the eye relaxed state
to see a faraway object. P is the principal point. Qnear and Qfar are points representing the
object location. Snear and Sfar are distances between point Qnear
and Qfar [18].
4
collimated (parallel to the optical axis) light rays, passing through both the cornea and lens
(green line). On the other hand, parallel light rays entering the eye would be refracted by the
cornea and the lens to focus at the posterior focal point (F') (blue line). These points indicate
where light rays, coming from an object, are refracted into a sharp image onto the retina.
To reduce complexity, the cornea and the crystalline lens are often treated as a single
thick lens [18]. The principal point P indicates the location of the front principal plane on the
optical axis, and P' denotes the location of the rear principal plane, respectively. These two
planes are where all incident light ray's refraction occurs. In a centered optical system, the nodal
points coincide with the principal points; however, since the eye is not a centric imaging system,
the nodal points must be discussed to reveal the imaging axis of the eye. The nodal points define
the visual axis of the eye from the O1 to I1, where the fovea is at (Figure 1.3). The fovea is the
point on the retina, where the eye registers the greatest detail of the projected image of the
Figure 1.3: Diagram of optical axes, cardinal points, and key optical elements to describes
the human eye imaging system. F, F’ denote the anterior and posterior of the eye focal point.
O0, O1 are the on and off-axis fixated points of the object. V is the corneal vertex. P, P’
denotes front and rear the principal points. N, N’ represent the incident and emergent nodal
points. I0, I1 represent the on and off-axis image points [18].
5
object. Light rays that intersect at the incident nodal point N are parallel to the emergent rays
crossing N' point, which means the angle between the incident ray and the optical axis (k) is
equal to the angle between the emergent rays and the optical axis (k’). This nodal ray is said to
have unity angular magnification [18].
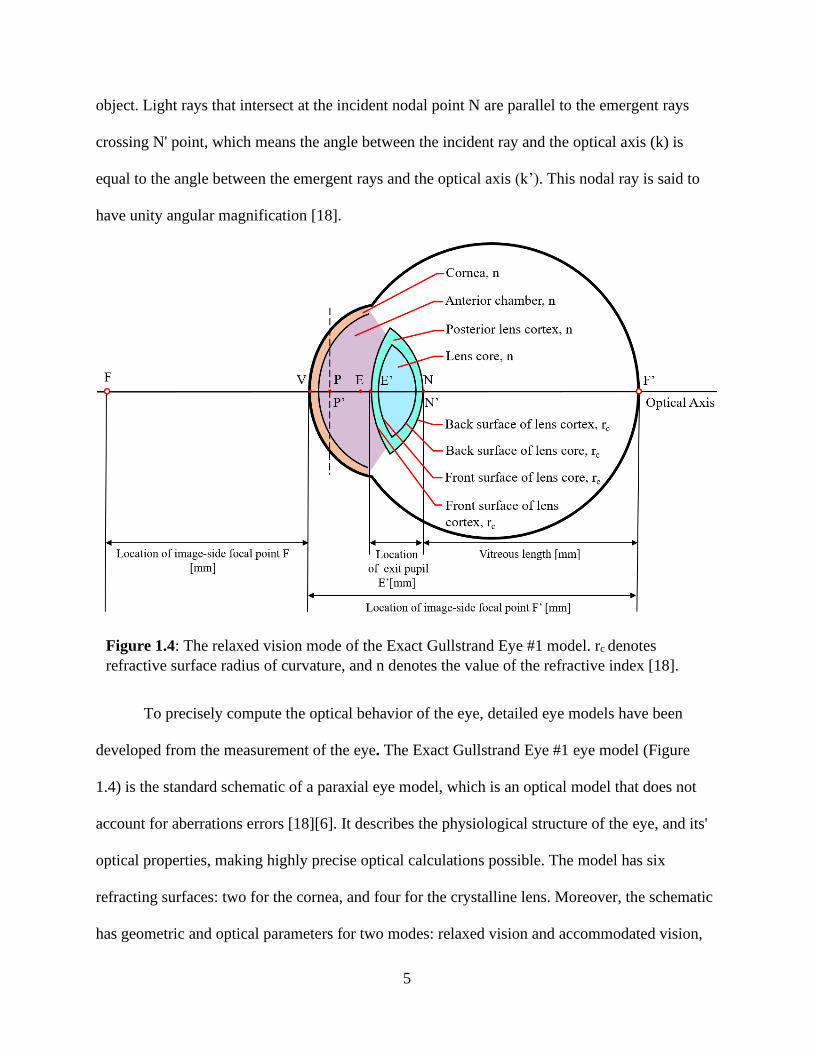
To precisely compute the optical behavior of the eye, detailed eye models have been
developed from the measurement of the eye. The Exact Gullstrand Eye #1 eye model (Figure
1.4) is the standard schematic of a paraxial eye model, which is an optical model that does not
account for aberrations errors [18][6]. It describes the physiological structure of the eye, and its'
optical properties, making highly precise optical calculations possible. The model has six
refracting surfaces: two for the cornea, and four for the crystalline lens. Moreover, the schematic
has geometric and optical parameters for two modes: relaxed vision and accommodated vision,
Figure 1.4: The relaxed vision mode of the Exact Gullstrand Eye #1 model. rc denotes
refractive surface radius of curvature, and n denotes the value of the refractive index [18].
6
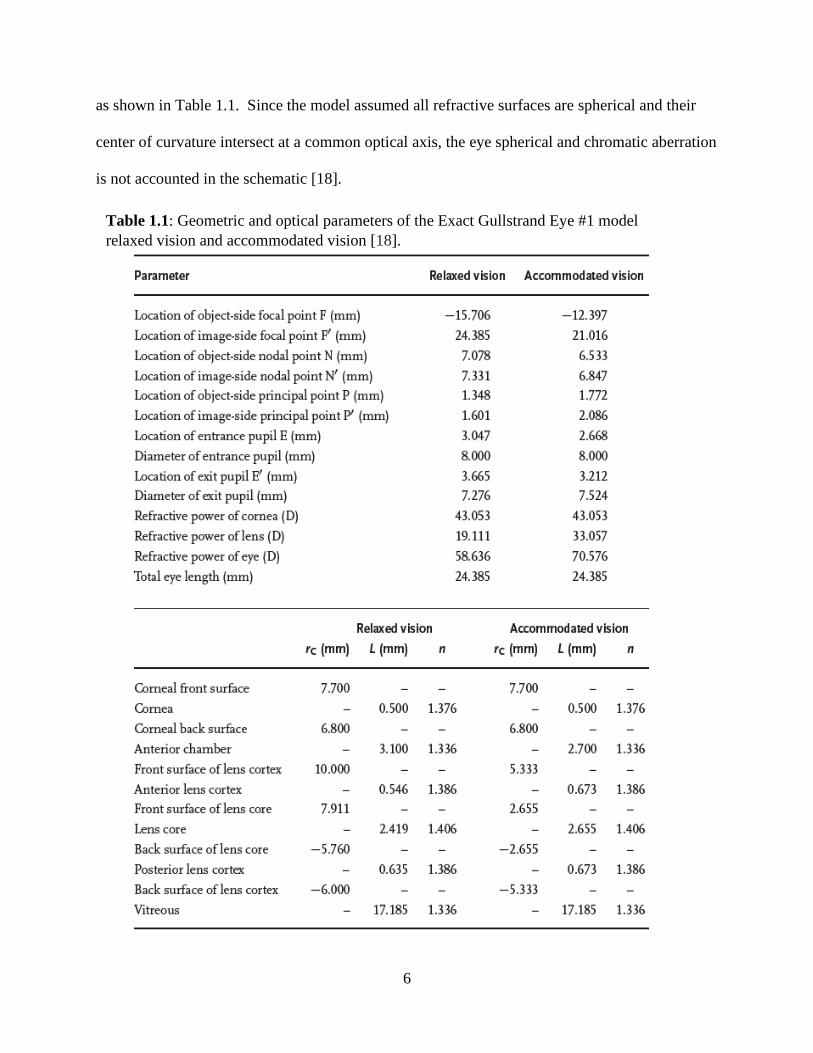
as shown in Table 1.1. Since the model assumed all refractive surfaces are spherical and their
center of curvature intersect at a common optical axis, the eye spherical and chromatic aberration
is not accounted in the schematic [18].
Table 1.1: Geometric and optical parameters of the Exact Gullstrand Eye #1 model
relaxed vision and accommodated vision [18].
7
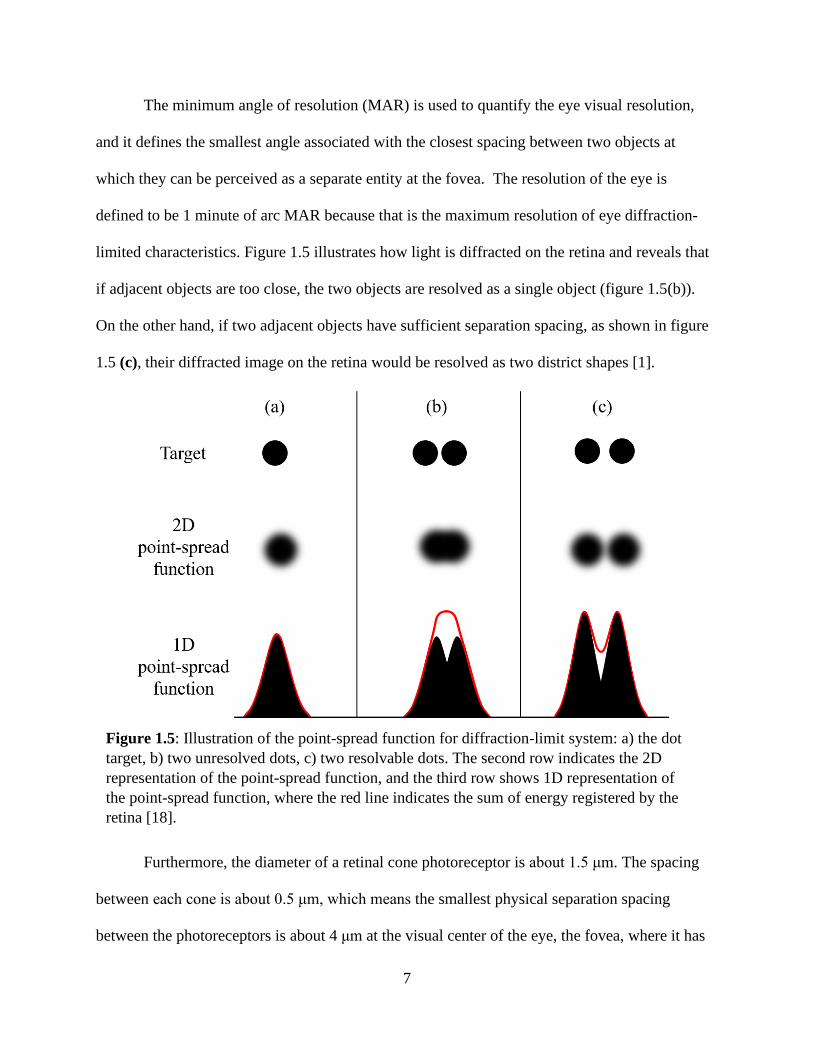
The minimum angle of resolution (MAR) is used to quantify the eye visual resolution,
and it defines the smallest angle associated with the closest spacing between two objects at
which they can be perceived as a separate entity at the fovea. The resolution of the eye is
defined to be 1 minute of arc MAR because that is the maximum resolution of eye diffraction-
limited characteristics. Figure 1.5 illustrates how light is diffracted on the retina and reveals that
if adjacent objects are too close, the two objects are resolved as a single object (figure 1.5(b)).
On the other hand, if two adjacent objects have sufficient separation spacing, as shown in figure
1.5 (c), their diffracted image on the retina would be resolved as two district shapes [1].
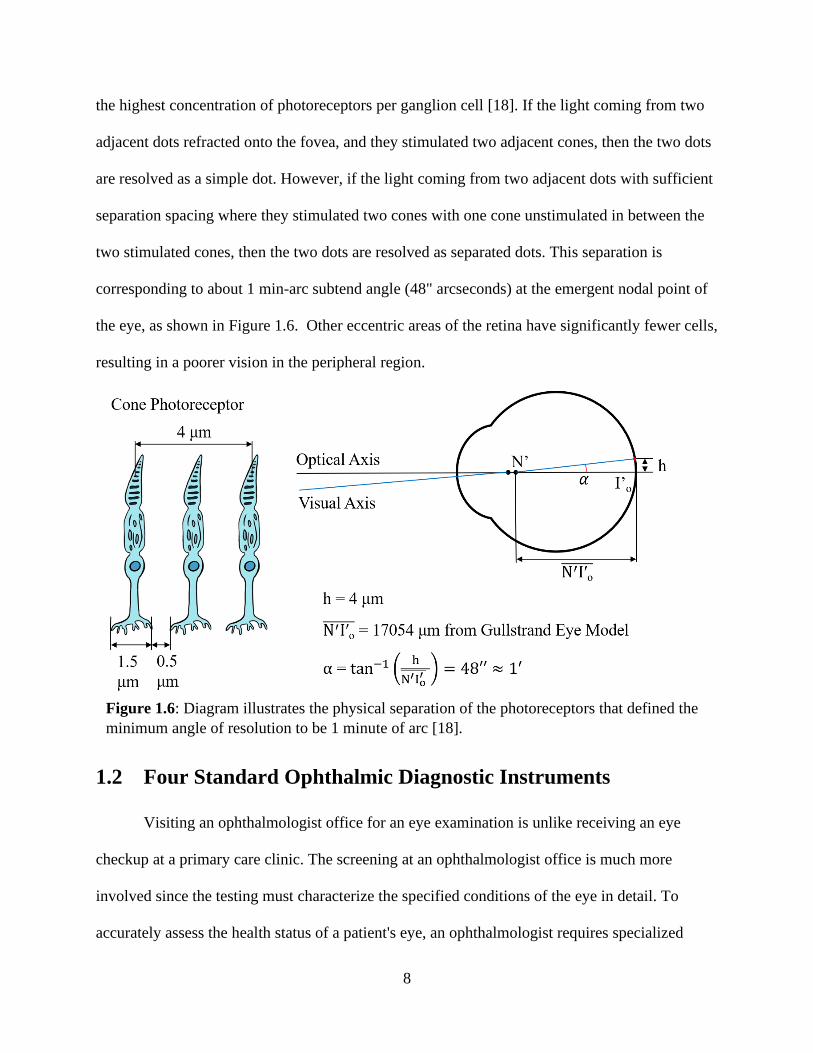
Furthermore, the diameter of a retinal cone photoreceptor is about 1.5 μm. The spacing
between each cone is about 0.5 μm, which means the smallest physical separation spacing
between the photoreceptors is about 4 μm at the visual center of the eye, the fovea, where it has
Figure 1.5: Illustration of the point-spread function for diffraction-limit system: a) the dot
target, b) two unresolved dots, c) two resolvable dots. The second row indicates the 2D
representation of the point-spread function, and the third row shows 1D representation of
the point-spread function, where the red line indicates the sum of energy registered by the
retina [18].
8
the highest concentration of photoreceptors per ganglion cell [18]. If the light coming from two
adjacent dots refracted onto the fovea, and they stimulated two adjacent cones, then the two dots
are resolved as a simple dot. However, if the light coming from two adjacent dots with sufficient
separation spacing where they stimulated two cones with one cone unstimulated in between the
two stimulated cones, then the two dots are resolved as separated dots. This separation is
corresponding to about 1 min-arc subtend angle (48" arcseconds) at the emergent nodal point of
the eye, as shown in Figure 1.6. Other eccentric areas of the retina have significantly fewer cells,
resulting in a poorer vision in the peripheral region.
1.2 Four Standard Ophthalmic Diagnostic Instruments
Visiting an ophthalmologist office for an eye examination is unlike receiving an eye
checkup at a primary care clinic. The screening at an ophthalmologist office is much more
involved since the testing must characterize the specified conditions of the eye in detail. To
accurately assess the health status of a patient's eye, an ophthalmologist requires specialized
Figure 1.6: Diagram illustrates the physical separation of the photoreceptors that defined the
minimum angle of resolution to be 1 minute of arc [18].
9
equipment to examine the eye. The four standard instruments that enable the physician to
evaluate the detail of the eye are the slit lamp biomicroscope, the visual acuity screener, the
funduscope, and the tonometer.
1.2.1 Slit Lamp Biomicroscope
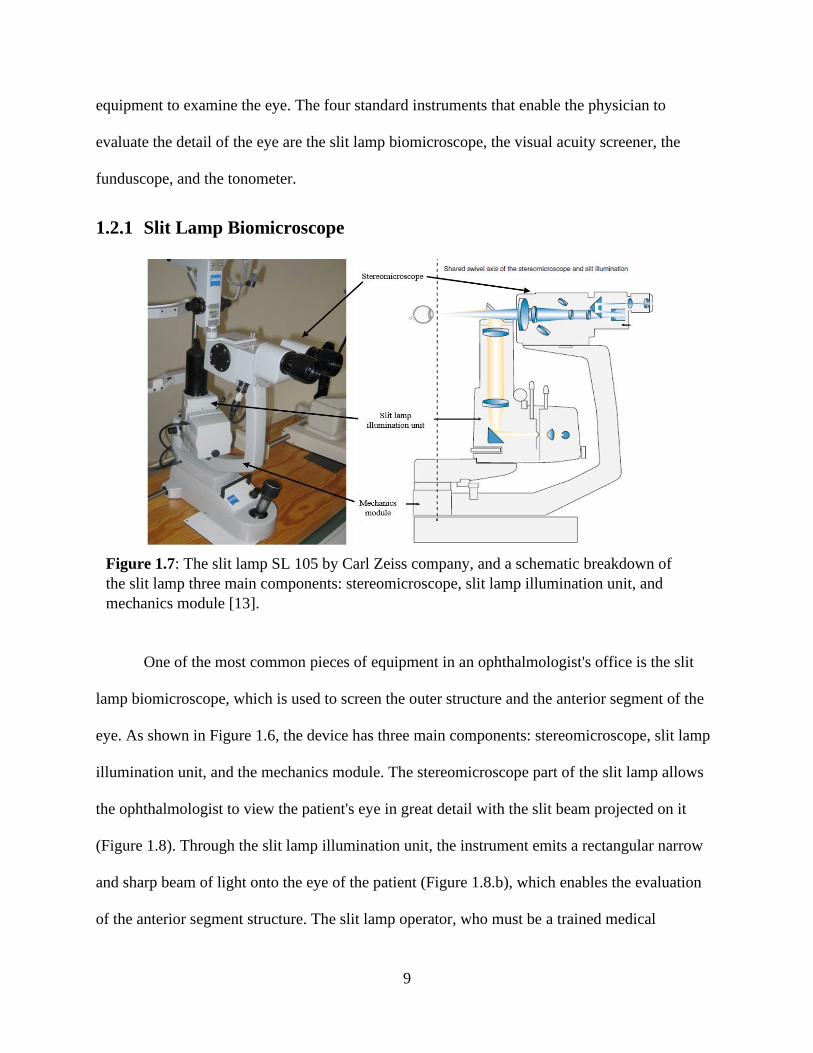
One of the most common pieces of equipment in an ophthalmologist's office is the slit
lamp biomicroscope, which is used to screen the outer structure and the anterior segment of the
eye. As shown in Figure 1.6, the device has three main components: stereomicroscope, slit lamp
illumination unit, and the mechanics module. The stereomicroscope part of the slit lamp allows
the ophthalmologist to view the patient's eye in great detail with the slit beam projected on it
(Figure 1.8). Through the slit lamp illumination unit, the instrument emits a rectangular narrow
and sharp beam of light onto the eye of the patient (Figure 1.8.b), which enables the evaluation
of the anterior segment structure. The slit lamp operator, who must be a trained medical
Figure 1.7: The slit lamp SL 105 by Carl Zeiss company, and a schematic breakdown of
the slit lamp three main components: stereomicroscope, slit lamp illumination unit, and
mechanics module [13].

10
professional, can manipulate the slit lamp using the mechanic module to position the slit beam at
various regions of the eye to examine a particular area of interest such as the cornea structure,
crystalline lens clarity, iris shape, and blood vessels on the ciliary body. As shown in Figure
1.8.a, the slit lamp biomicroscope is a tabletop instrument that requires the patient to sit across
the physician to receive the slit lamp screening.
1.2.2 Visual Acuity Screener
The visual acuity exam is a test that determines a person's vision sharpness by measuring
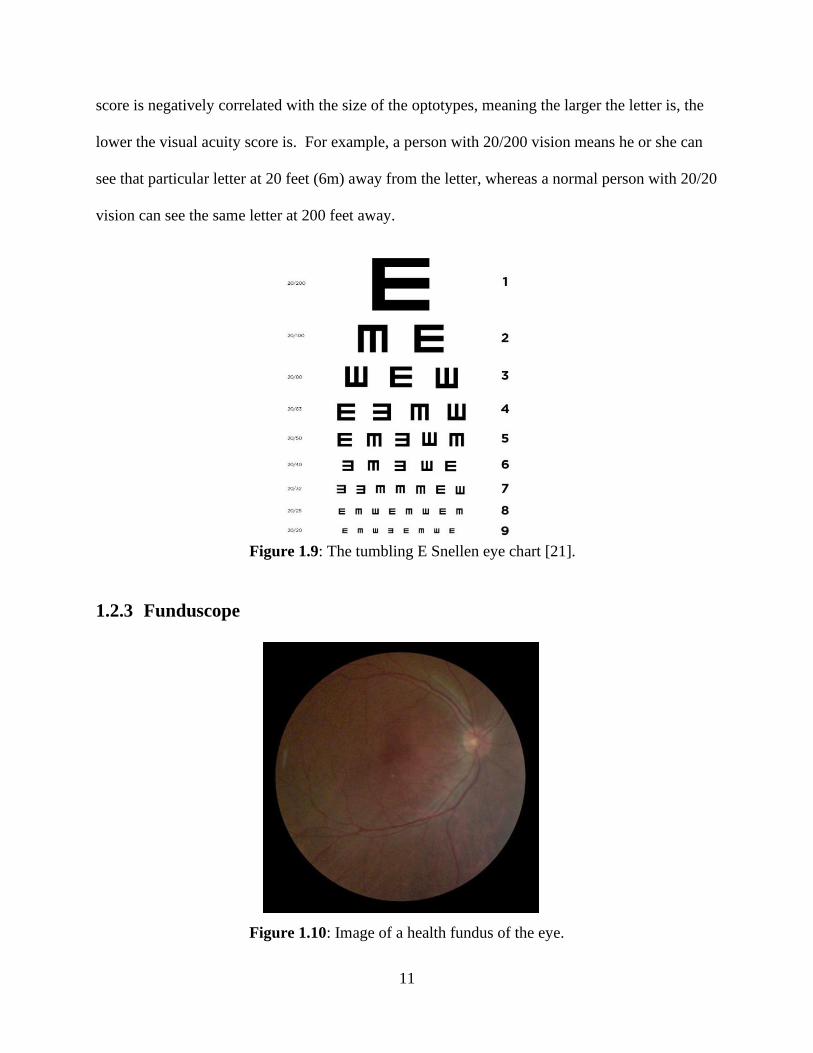
how he or she can see an image or letter at a fixed distance away from an image. The Snellen
chart is a standardized list of characters, optotypes, that are used in the visual acuity test (Figure
1.9). The chart has nine levels from top to bottom, with the largest letter indicating the worst
vision level of 20/200. In the US, the exam requires the patient to stand 20 feet (6 m) away from
the Snellen chart and read out the smallest row of letters to determine his or her visual acuity
level. The visual acuity score associated with each row is commonly quantified with the Snellen
fraction and is given in unit of feet in the US, and meter in other parts of the world. A person
with normal vision would have a visual acuity score of 1, which is a 20/20 Snellen fraction. The
Figure 1.8: a) illustration of a slit lamp examination, and b) an example of a slit image [13].
11
score is negatively correlated with the size of the optotypes, meaning the larger the letter is, the
lower the visual acuity score is. For example, a person with 20/200 vision means he or she can
see that particular letter at 20 feet (6m) away from the letter, whereas a normal person with 20/20
vision can see the same letter at 200 feet away.
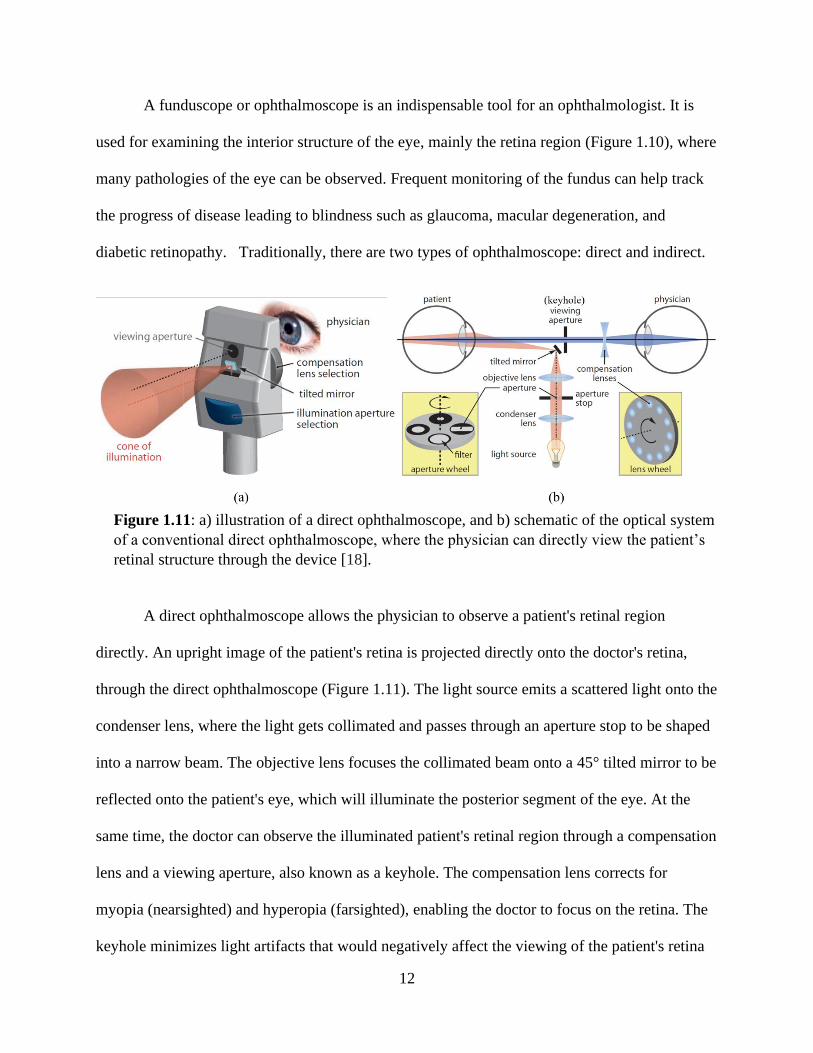
1.2.3 Funduscope
Figure 1.9: The tumbling E Snellen eye chart [21].
Figure 1.10: Image of a health fundus of the eye.
12
A funduscope or ophthalmoscope is an indispensable tool for an ophthalmologist. It is
used for examining the interior structure of the eye, mainly the retina region (Figure 1.10), where
many pathologies of the eye can be observed. Frequent monitoring of the fundus can help track
the progress of disease leading to blindness such as glaucoma, macular degeneration, and
diabetic retinopathy. Traditionally, there are two types of ophthalmoscope: direct and indirect.
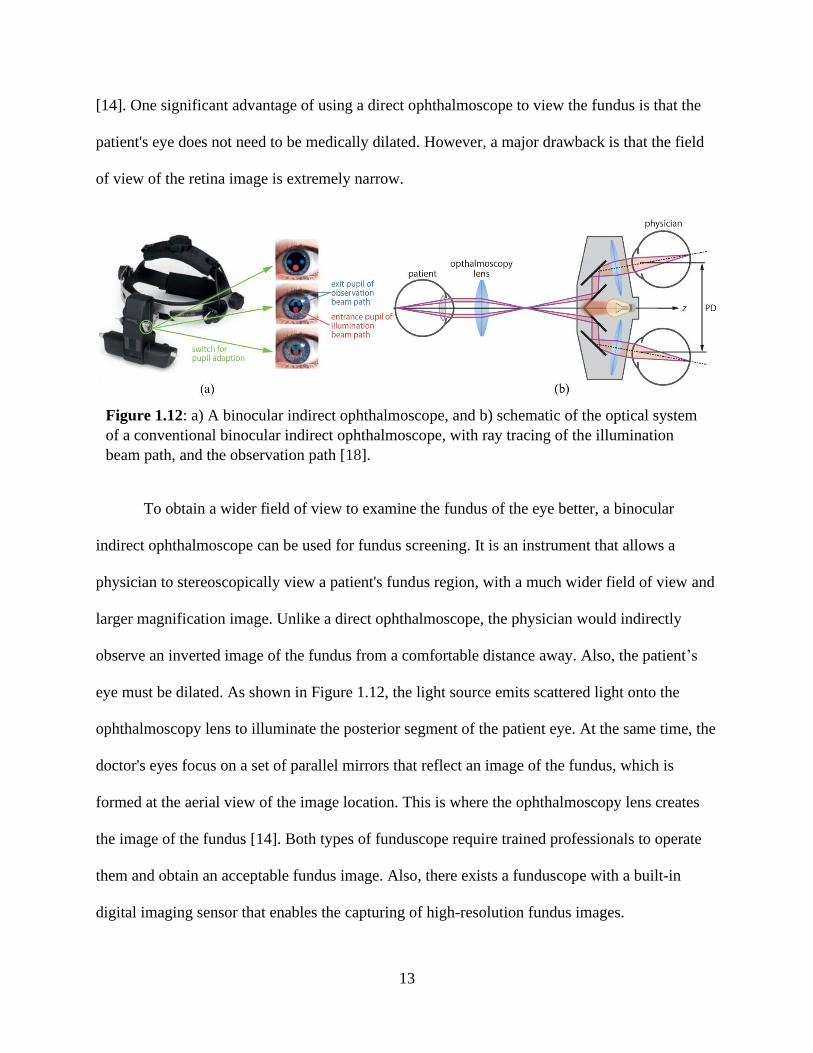
A direct ophthalmoscope allows the physician to observe a patient's retinal region
directly. An upright image of the patient's retina is projected directly onto the doctor's retina,
through the direct ophthalmoscope (Figure 1.11). The light source emits a scattered light onto the
condenser lens, where the light gets collimated and passes through an aperture stop to be shaped
into a narrow beam. The objective lens focuses the collimated beam onto a 45° tilted mirror to be
reflected onto the patient's eye, which will illuminate the posterior segment of the eye. At the
same time, the doctor can observe the illuminated patient's retinal region through a compensation
lens and a viewing aperture, also known as a keyhole. The compensation lens corrects for
myopia (nearsighted) and hyperopia (farsighted), enabling the doctor to focus on the retina. The
keyhole minimizes light artifacts that would negatively affect the viewing of the patient's retina
Figure 1.11: a) illustration of a direct ophthalmoscope, and b) schematic of the optical system
of a conventional direct ophthalmoscope, where the physician can directly view the patient’s
retinal structure through the device [18].
13
[14]. One significant advantage of using a direct ophthalmoscope to view the fundus is that the
patient's eye does not need to be medically dilated. However, a major drawback is that the field
of view of the retina image is extremely narrow.
To obtain a wider field of view to examine the fundus of the eye better, a binocular
indirect ophthalmoscope can be used for fundus screening. It is an instrument that allows a
physician to stereoscopically view a patient's fundus region, with a much wider field of view and
larger magnification image. Unlike a direct ophthalmoscope, the physician would indirectly
observe an inverted image of the fundus from a comfortable distance away. Also, the patient’s
eye must be dilated. As shown in Figure 1.12, the light source emits scattered light onto the
ophthalmoscopy lens to illuminate the posterior segment of the patient eye. At the same time, the
doctor's eyes focus on a set of parallel mirrors that reflect an image of the fundus, which is
formed at the aerial view of the image location. This is where the ophthalmoscopy lens creates
the image of the fundus [14]. Both types of funduscope require trained professionals to operate
them and obtain an acceptable fundus image. Also, there exists a funduscope with a built-in
digital imaging sensor that enables the capturing of high-resolution fundus images.
Figure 1.12: a) A binocular indirect ophthalmoscope, and b) schematic of the optical system
of a conventional binocular indirect ophthalmoscope, with ray tracing of the illumination
beam path, and the observation path [18].
14
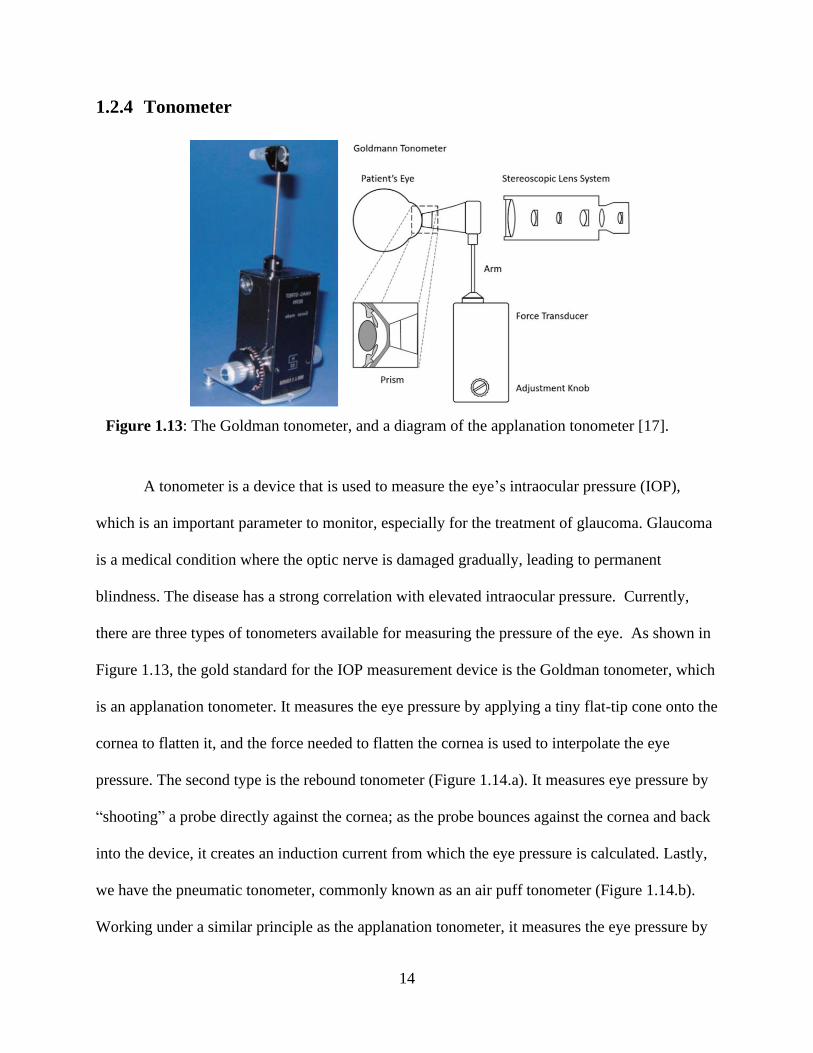
1.2.4 Tonometer
A tonometer is a device that is used to measure the eye’s intraocular pressure (IOP),
which is an important parameter to monitor, especially for the treatment of glaucoma. Glaucoma
is a medical condition where the optic nerve is damaged gradually, leading to permanent
blindness. The disease has a strong correlation with elevated intraocular pressure. Currently,
there are three types of tonometers available for measuring the pressure of the eye. As shown in
Figure 1.13, the gold standard for the IOP measurement device is the Goldman tonometer, which
is an applanation tonometer. It measures the eye pressure by applying a tiny flat-tip cone onto the
cornea to flatten it, and the force needed to flatten the cornea is used to interpolate the eye
pressure. The second type is the rebound tonometer (Figure 1.14.a). It measures eye pressure by
“shooting” a probe directly against the cornea; as the probe bounces against the cornea and back
into the device, it creates an induction current from which the eye pressure is calculated. Lastly,
we have the pneumatic tonometer, commonly known as an air puff tonometer (Figure 1.14.b).
Working under a similar principle as the applanation tonometer, it measures the eye pressure by
Figure 1.13: The Goldman tonometer, and a diagram of the applanation tonometer [17].

15
shooting a jet of air to flatten the cornea, and the force needed to flatten the cornea is detected via
an electro-optical system, which then is used to calculate the pressure.
1.3 Current Standard of Eye Care
In today's standard ophthalmic care, a patient who has undergone an ocular treatment
must receive routine follow-up examination for an extended period, ranging from a few weeks to
months, depending on the operation [11]. More than half of the in-person visits are routine
checkups [35]. The goal of the post-operation routine checkup is to monitor for any signs of
complication and track the recovery process of the patient. For instance, cataract surgery, a
common ophthalmic procedure that replaces a patients’ cloudy native crystalline lens, requires
multiple visits post-surgery to monitor patient healing. These visits can require patients to return
to the clinic for up to one month routinely.
Since cataract surgery has a very high success rate, the health benefit of such a practice is
not clear, but the financial burden added to the healthcare system is very real. As of 2009,
Finland had terminated their practice of requiring post-surgery checkups. To gauge the potential
benefit or damage caused by this change in policy to the health of the patient with cataract
surgery, a study conducted by the Oulu University Hospital department of ophthalmology
retrospectively concluded that the one-month ophthalmic checkup after cataract surgery has no
Figure 1.14: a) diagram of a rebound tonometer, and b) diagram of a pneumatic tonometer.
16
positive contribution to the patient health. However, 5-10% of patients with ocular complications
should receive the checkup [11]. Therefore, an in-person visit may not be necessary for most
patients; however, some eye examination is vital to ensure that the small population of the
patients with ocular complications can receive appropriate treatment as soon as possible.
The practice of follow-up exams is still desirable because there is always a minimal
chance that a patient would develop an ocular complication [26]. The doctor wants to identify the
problem as soon as possible and treat it. Therefore, it is still advantageous to see every patient
rather than to miss someone with a complication that may lead to irreversible damage to the
patient’s vision if treatment was not administered on time.
Incorporating the portable internet-enabled ophthalmic instruments to patient post-
surgical monitoring can help address challenges in current eye care. Patients with the device can
perform self-examinations at home and send the results directly to the physician to assess the
health of their eyes. The device would reduce the need for in-person visits while ensuring that
patients are appropriately monitored.
1.4 Need for Portable Instruments
Slit lamp screening, fundus imaging, visual acuity screening, and intraocular pressure
(IOP) measuring are generally completed in a clinical setting and by professional personnel.
Traditionally, comprehensive eye examinations are performed at an eye clinic. This can be costly
for the patient in terms of time and money [25] [30]. The main attributes of the high cost are the
cost of the ophthalmic examination instruments themselves, the cost of maintaining a controlled
environment to store the devices, and the cost of employing professional personnel to operate the
machines [22].
17
Over the last decade, the smartphone has become a powerful microcomputer and a
ubiquitous item. With such computational capability and connectivity, the smartphone allows
ophthalmic instruments to be minimized by becoming its brain. Numerous portable ophthalmic
devices have been developed and marketed to enable ophthalmologists to perform eye screening
in any setting and sending the result to the appropriate specialist for in-depth evaluation [15].
Using portable screening tools allows savings in terms of opportunity cost and monetary
value for both physicians and patients. For example, when an ophthalmologist needs to perform
follow-up exams for one hundred patients at a hospital or a long-term care facility, the doctor
needs to schedule one hundred-time spot, one for each patient to visit the ophthalmologist's
office to receive the exam. Using telemedicine, the doctor can simply send a trained-medical
technician with the portable ophthalmic instrument to the facility, where he or she performs and
collects examination results for all one hundred patients. The results are then transmitted to the
ophthalmologist's office electronically, where the physician can review and provide real-time
consultation to the patient via videoconferencing as needed.
Internet-enabled point of care devices can transform the way doctors interact with their
patients. Patients who need to receive an examination from a specialist do not need to meet the
specialist in person to receive the exam. The patient can receive a remote exam, and the results
are forwarded to the specialist. This procedure is an effective way to reduce cost and time for
both patients and physicians while maintaining or improving the high standard eye care service
with the traditional visit to the clinic of a specialist. In comparison to in-person consultation, the
real-time remote consultation, as describes above, is as effective as face-to-face consultations
[32].
18
In the event that visiting a patient is not possible, like in the current state of the COVID-
19 pandemic, the patients would receive a portable internet-enabled ophthalmic instrument for a
remote eye examination. So, the patients can perform a self-examination and get the right
treatment based on the screening results. This thesis will discuss the development of ophthalmic
internet-enabled instrument devices with the goal of exploring telemedicine for the eye. We will
examine smartphone-based ophthalmic devices such as the slit lamp, the visual acuity testing
tools, and novel methods to improve portable ophthalmic measuring tools for self-examination.
1.5 State of the Art and Commercially Available Portable
Ophthalmic Devices
1.5.1 Handheld Slit Lamp
Eidolon Handheld Slit Lamp 510L
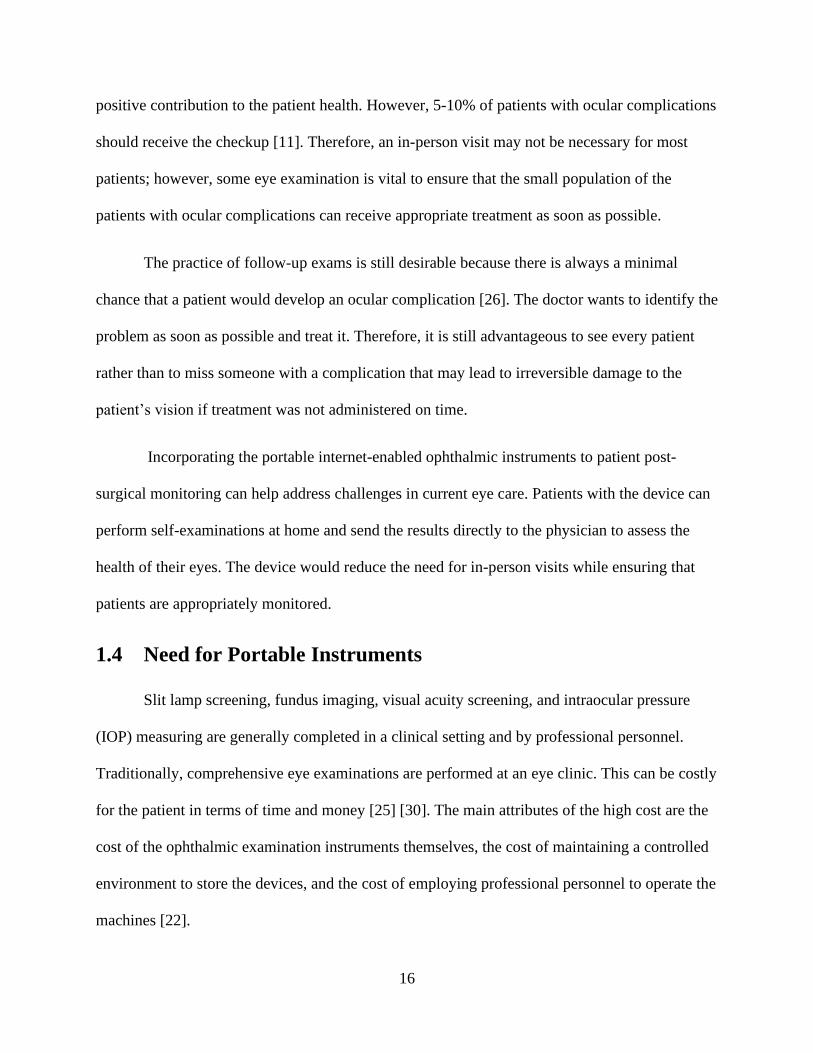
The Eidolon 510L slit lamp is a portable pen-shaped slit lamp with an adjustable slit
beam and an articulated arm attached to a 20D lens, providing 5x magnification. The lens can be
attached to a smartphone, enabling it to capture and record slit images (Figure 1.15). The
articulated arm allows the slit to be positioned at various angles for optimal examination. It also
Figure 1.15: Eidolon 510L portable slit lamp smartphone adaptor [24].
19
has a cobalt blue filter for corneal abrasion and epithelial defects examination using fluorescent
dye [24].
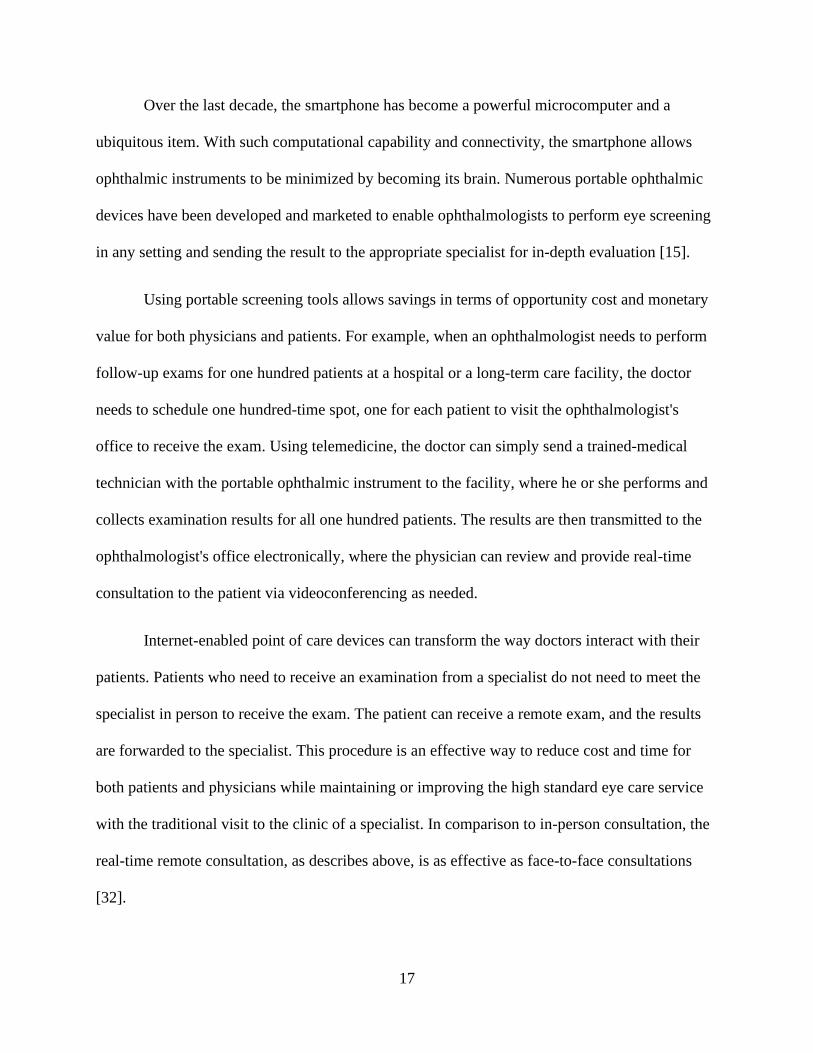
Han Heiss HSL-005 Portable Slit Lamp
As shown in Figure 1.16, the HSL-005 portable slit lamp is a rechargeable slit lamp with
an adjustable slit beam of 0 to 12mm width and length of 12 mm. It has 6x magnification and a
cobalt blue filter. The device can be used individually or in conjunction with a smartphone via a
magnetic attachment mechanism. Also, this slit lamp has two illumination color temperatures
[5].
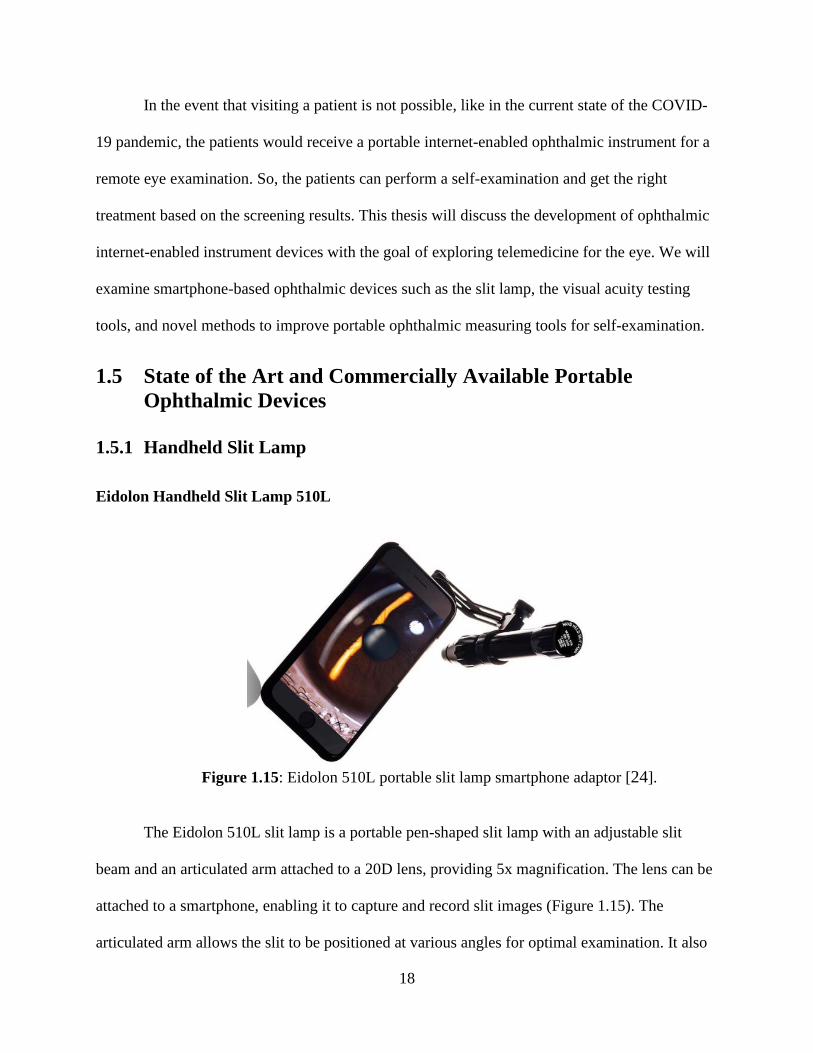
SA Photonics Hybrid Slit-Lamp and Ophthalmoscope
Figure 1.16: Illustration of the HSL-005 portable slit lamp smartphone attachment [5].
Figure 1.17: SA Photonics Hybrid device [7].
20
The SA Photonic hybrid device is a combination of multiple ophthalmic instruments into
one compact device, as illustrated in Figure 1.17. This hybrid goggle has a stereo slit lamp with
variable illumination mode and patterns. The slit can pan backward and forward to capture stereo
slit lamp exam images at various positions on the cornea. The second tool is the near IR
pupillography that measures the reaction of the pupil. Lastly, the device has an ophthalmoscope
feature for capturing retinal images. This goggle is intended for military applications and can be
used in combat situations [7] [12].
1.5.2 Visual Acuity Smartphone Attachment
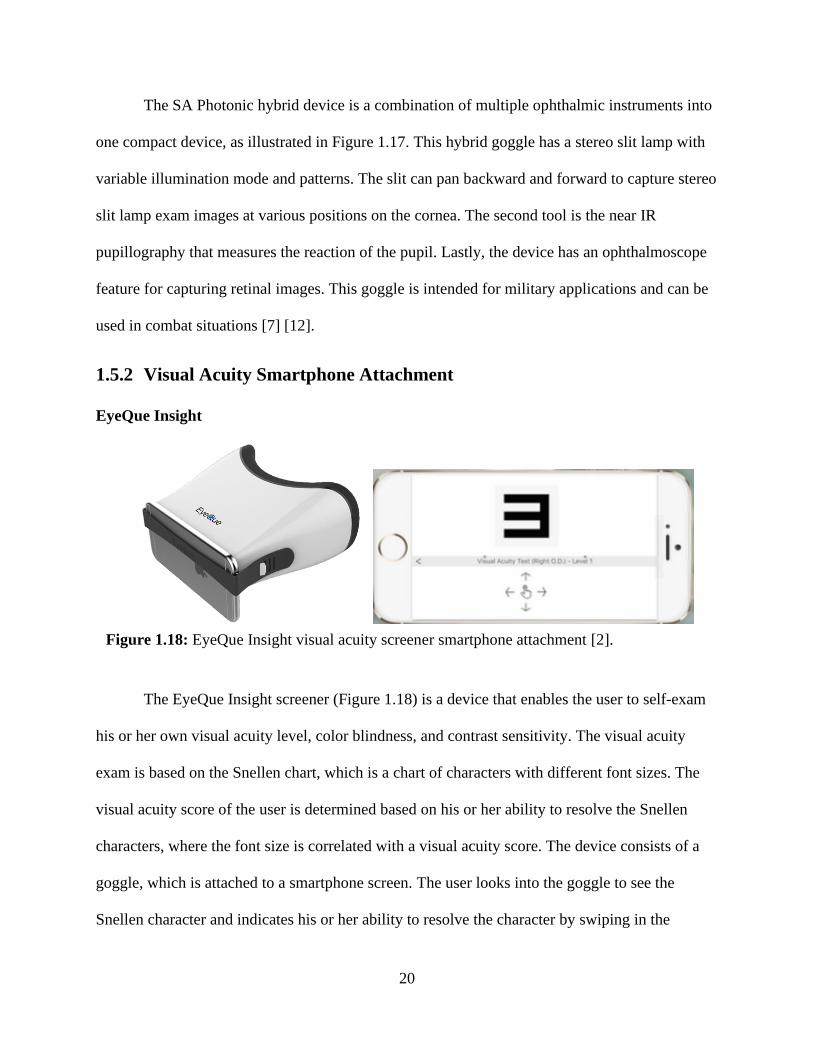
EyeQue Insight
The EyeQue Insight screener (Figure 1.18) is a device that enables the user to self-exam
his or her own visual acuity level, color blindness, and contrast sensitivity. The visual acuity
exam is based on the Snellen chart, which is a chart of characters with different font sizes. The
visual acuity score of the user is determined based on his or her ability to resolve the Snellen
characters, where the font size is correlated with a visual acuity score. The device consists of a
goggle, which is attached to a smartphone screen. The user looks into the goggle to see the
Snellen character and indicates his or her ability to resolve the character by swiping in the
Figure 1.18: EyeQue Insight visual acuity screener smartphone attachment [2].
21
direction of the character orientation, on the bottom half of the smartphone touchscreen. The
device requires some practice to acquire repeatable and reliable testing results [2].
1.5.3 Portable Funduscope
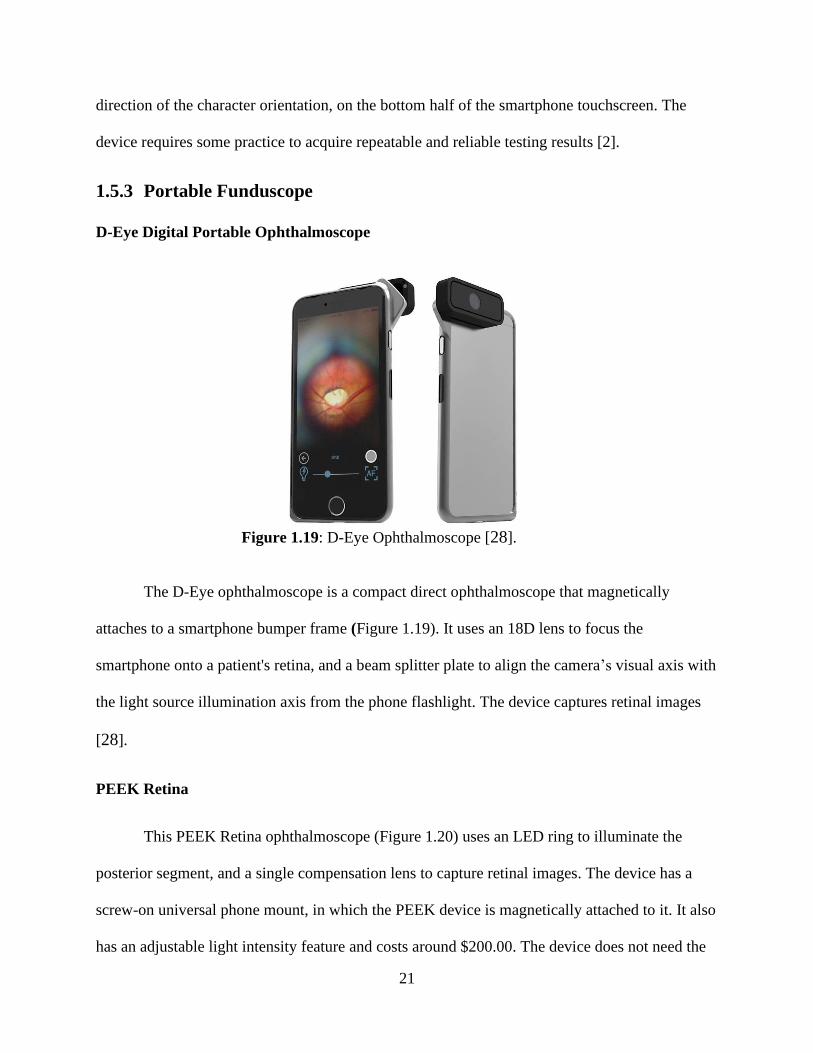
D-Eye Digital Portable Ophthalmoscope
The D-Eye ophthalmoscope is a compact direct ophthalmoscope that magnetically
attaches to a smartphone bumper frame (Figure 1.19). It uses an 18D lens to focus the
smartphone onto a patient's retina, and a beam splitter plate to align the camera’s visual axis with
the light source illumination axis from the phone flashlight. The device captures retinal images
[28].
PEEK Retina
This PEEK Retina ophthalmoscope (Figure 1.20) uses an LED ring to illuminate the
posterior segment, and a single compensation lens to capture retinal images. The device has a
screw-on universal phone mount, in which the PEEK device is magnetically attached to it. It also
has an adjustable light intensity feature and costs around $200.00. The device does not need the
Figure 1.19: D-Eye Ophthalmoscope [28].
22
eye of the user to be dilated; however, the captured fundus images have a very narrow field of
view, and it requires a trained technician to operate the ophthalmoscope [19].
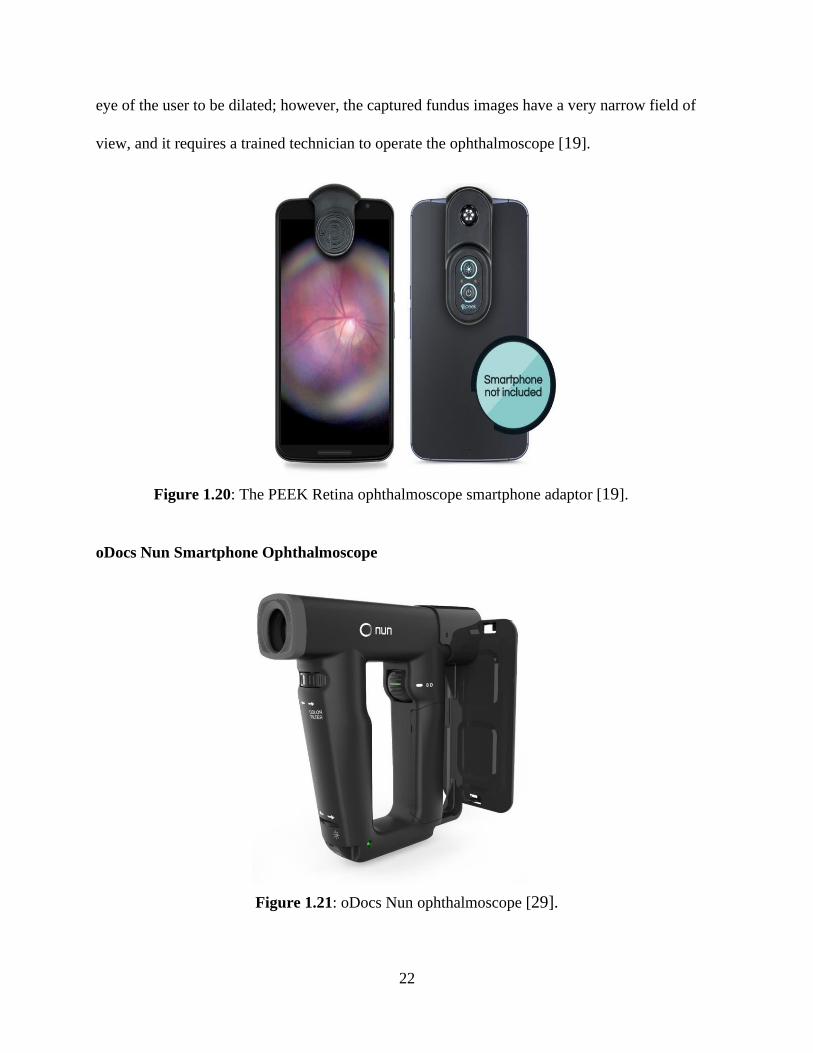
oDocs Nun Smartphone Ophthalmoscope
Figure 1.20: The PEEK Retina ophthalmoscope smartphone adaptor [19].
Figure 1.21: oDocs Nun ophthalmoscope [29].

23
Comparing with a traditional direct ophthalmoscope, the oDocs Nun captures images
with an 8x wider field of view. As shown in Figure 1.21, the device has three color filters, an
illuminator brightness control, and a manual focusing wheel of -20D to +20D to minimize
refraction error. It captures arguably better retinal images and costs around $1,120.00. The
device is intended to be used with a smartphone, where the camera of the smartphone is used to
photograph the fundus image.[29].
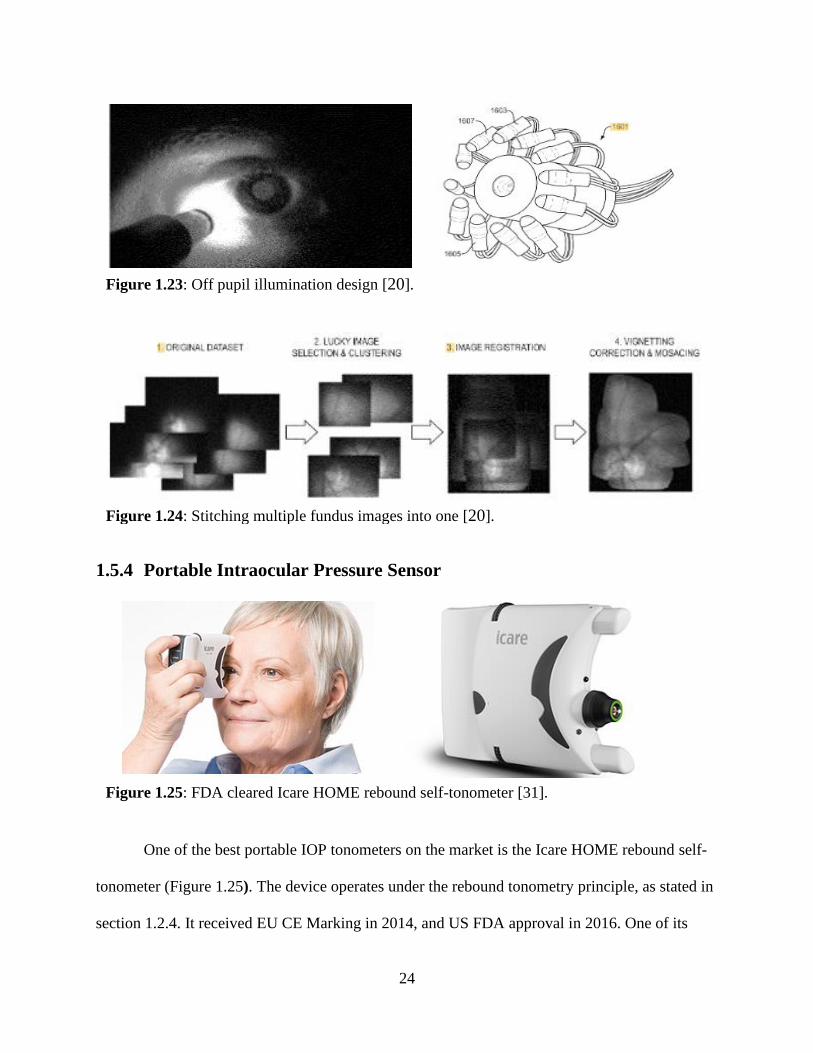
Methods and Apparatus for Retinal Imaging
In Figure 1.22, this proposed funduscope illuminates the posterior segment from the side
of the eye, away from the optically clear pupil entrance. This illumination method minimizes the
problem of pupil contraction due to the bright light, which will allow the camera to capture a
large area of the fundus, as shown in Figure 1.23. Multiple light sources are shown to illuminate
the fundus region without causing the pupil to contract. To get a retinal image with a wider field
of view without dilating the eye, one can use multiple fundus images and stitch the images
together, using software, to form a more informative fundus image (Figure 1.24) [20].
Figure 1.22: Funduscope with off pupil illumination [20].
24
1.5.4 Portable Intraocular Pressure Sensor
One of the best portable IOP tonometers on the market is the Icare HOME rebound self-
tonometer (Figure 1.25). The device operates under the rebound tonometry principle, as stated in
section 1.2.4. It received EU CE Marking in 2014, and US FDA approval in 2016. One of its
Figure 1.23: Off pupil illumination design [20].
Figure 1.24: Stitching multiple fundus images into one [20].
Figure 1.25: FDA cleared Icare HOME rebound self-tonometer [31].
25
major selling points is that this tonometer does not require specialized training to administer the
IOP measuring exam. This enables the patient to perform frequent self-monitoring of the
intraocular pressure. The resulting measurement is comparable to the measurement obtained
using the Goldmann applanation tonometer (GAT) [31].
1.5.5 Summary
In this chapter, we have discussed the underlying principle of the human eye and the
guiding principle behind ophthalmic instruments such as the slit lamp, the funduscope
(ophthalmoscope), and the visual acuity screener. We surveyed several portable slit lamps that
use a smartphone as the main image capturing and restoring method: the Eidolon 510L handheld
slit lamp and the Han Heiss HSL-005 portable slit lamp. On the funduscope side, there are the D-
Eye digital handheld ophthalmoscope, the PEEK Retina, and the oDocs Nun. These devices use
the principle of a direct ophthalmoscope. For the visual acuity screener, the EyeQue Insight is an
excellent instrument for the exam. Lastly, we discussed the SA Photonics Hybrid device, a
proposed funduscope that illuminates the posterior segment from the side of the eye, and the
Icare HOME self-tonometer. Except for the EyeQue visual acuity screen and the Icare self-
tonometer, all of these portable ophthalmic instruments require a second person who is a trained
medical technician to perform the examination on the patient.
1.6 Thesis Objective
The objective of this thesis is to develop novel ophthalmic devices that are portable, low-
cost, and capable of performing self-examining. These ophthalmic instruments are the self-
imaging slit lamp, the self-screening visual acuity screener, and a 2-in-1 device capable of
performing both exams. Ideally, in the comfort of the home, a user can apply these devices to
26
self-capture crucial evaluation parameters of his or her eye, and the results are forward to
ophthalmologists via a smartphone. With these novel instruments, a patient would not need to
visit an eye clinic to receive quality eye examinations.
1.7 Organization of Thesis
Chapter 1 provides the background of the eye physiology and optical characteristic. It
also gives an overview of the objectives of the thesis. The crucial ophthalmic instruments and
standard practice of eye care with the implementation of the remote examination are discussed.
An overview of the state of the art in portable ophthalmic tools is also presented.
Chapter 2 discussed the development steps of a portable self-imaging slit lamp
smartphone attachment and self-imaging slit lamp goggle. The design parameters and guiding
principles of the device are discussed in detail. A comparison of the slit lamp images captured
with these internet-connected prototypes is made with the result obtained from a conventional
slit lamp.
Chapter 3 is a discussion of the design and fabrication of a self-screening visual acuity
screener. In this chapter, the principle of operation and design parameters are explained. The
rapid prototyping process of both single-lens and dual-lens configurations are shown along with
testing result to validate the functionality of the devices.
Chapter 4 reports on the feasibility of combining two self-examining ophthalmic
instruments to create a 2-in-1 goggle capable of performing: slit lamp screening and visual acuity
screening. The screening result obtained with the device is shown and evaluated.
Chapter 5 concludes the thesis with a summary and provides direction for the future of
the project.
27
Chapter 2 Design and Fabrication of Self-imaging Slit
Lamp
2.1 Design Parameters and Requirements
The main objective of this project is to develop a novel slit lamp that is capable of
obtaining comparable examination results as a conventional biomicroscope slit lamp, where the
patient collects screening results at his or her convenience. As such, the design requirements of
the proposed portable self-imaging slit lamp are that it needs to be compact, durable, reliable,
cost-effective, accurate, self-imaging capable, and user-friendly. The overall profile of the device
must exhibit a small form factor as it is must be easily stored and accessible by the patient. Since
the device is most likely to be kept in the patient home, not an optimal environment as an
ophthalmologist clinic, it must be low-cost to manufacture and well-build in terms of its
structural integrity. Most importantly, the proposed self-imaging slit lamp must be easy-to-use,
i.e., the patient must be able to self-capture high-resolution slit images reliably with minimum
instruction.
2.2 Proposed Design of a Portable Self-imaging Slit Lamp
As shown in Figure 2.1, the proposed portable self-imaging slit lamp has two main
components: the slit generating unit (Figure 2.1.a) and the self-imaging unit (Figure 2.1.b). The
slit generating unit is responsible for outputting a sharp slit beam onto the patient's eye using the
Köhler principle of illumination similar to a traditional benchtop slit lamp. The unit consists of
the light source and its electrical circuit to power it, along with the optical elements to convert
scattered light rays into a homogenously focused slit at the patient's corneal surface. The self-
imaging unit is responsible for enabling the patient to self-capture slit imaging of his or her
28
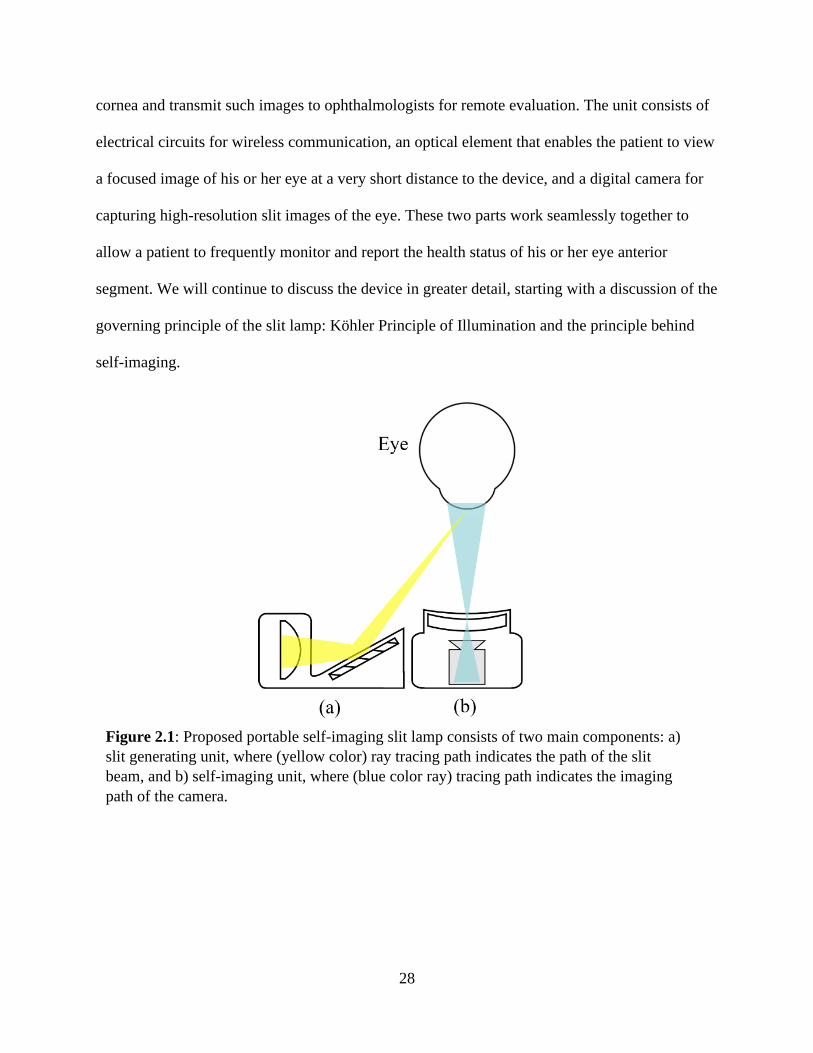
cornea and transmit such images to ophthalmologists for remote evaluation. The unit consists of
electrical circuits for wireless communication, an optical element that enables the patient to view
a focused image of his or her eye at a very short distance to the device, and a digital camera for
capturing high-resolution slit images of the eye. These two parts work seamlessly together to
allow a patient to frequently monitor and report the health status of his or her eye anterior
segment. We will continue to discuss the device in greater detail, starting with a discussion of the
governing principle of the slit lamp: Köhler Principle of Illumination and the principle behind
self-imaging.
Figure 2.1: Proposed portable self-imaging slit lamp consists of two main components: a)
slit generating unit, where (yellow color) ray tracing path indicates the path of the slit
beam, and b) self-imaging unit, where (blue color ray) tracing path indicates the imaging
path of the camera.
29
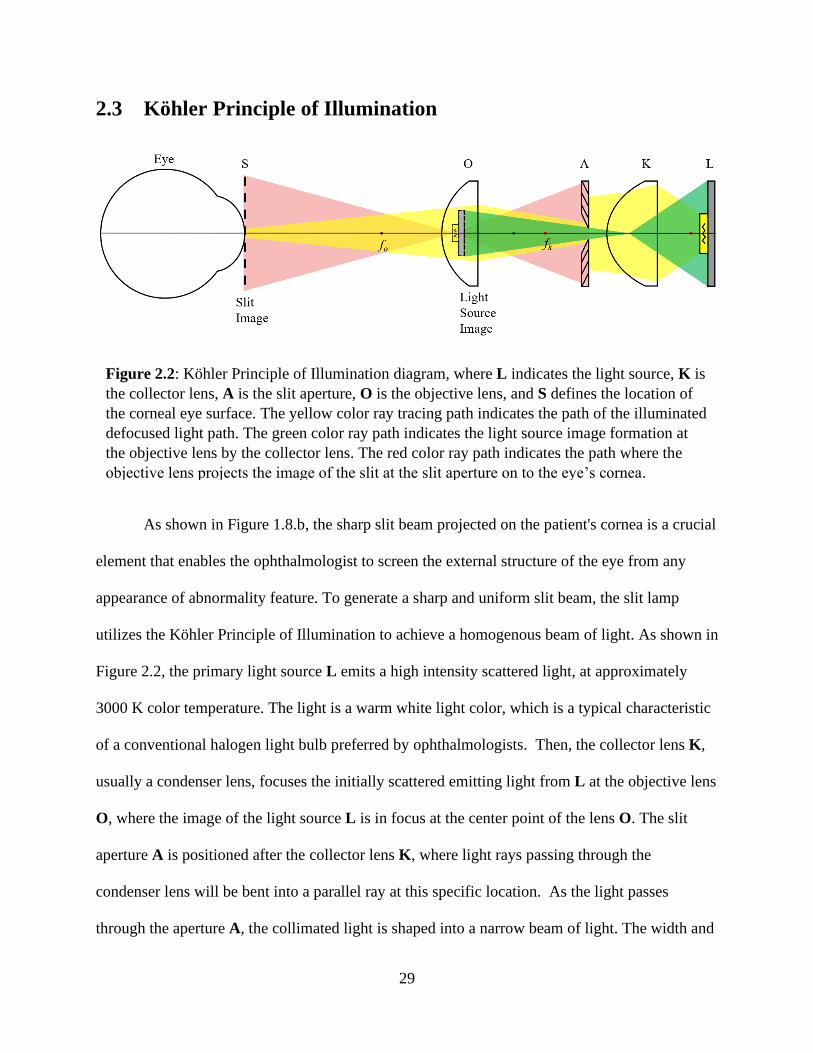
2.3 Köhler Principle of Illumination
As shown in Figure 1.8.b, the sharp slit beam projected on the patient's cornea is a crucial
element that enables the ophthalmologist to screen the external structure of the eye from any
appearance of abnormality feature. To generate a sharp and uniform slit beam, the slit lamp
utilizes the Köhler Principle of Illumination to achieve a homogenous beam of light. As shown in
Figure 2.2, the primary light source L emits a high intensity scattered light, at approximately
3000 K color temperature. The light is a warm white light color, which is a typical characteristic
of a conventional halogen light bulb preferred by ophthalmologists. Then, the collector lens K,
usually a condenser lens, focuses the initially scattered emitting light from L at the objective lens
O, where the image of the light source L is in focus at the center point of the lens O. The slit
aperture A is positioned after the collector lens K, where light rays passing through the
condenser lens will be bent into a parallel ray at this specific location. As the light passes
through the aperture A, the collimated light is shaped into a narrow beam of light. The width and
Figure 2.2: Köhler Principle of Illumination diagram, where L indicates the light source, K is
the collector lens, A is the slit aperture, O is the objective lens, and S defines the location of
the corneal eye surface. The yellow color ray tracing path indicates the path of the illuminated
defocused light path. The green color ray path indicates the light source image formation at
the objective lens by the collector lens. The red color ray path indicates the path where the
objective lens projects the image of the slit at the slit aperture on to the eye’s cornea.
30
length of the beam are determined by the slit aperture A opening. Lastly, the objective lens O
projects the image of the slit aperture A onto the patient corneal surface at location S [13]. To
obtain a homogenous light beam, the light refracted by the collector lens and passing through the
slit aperture needs to be collimated. In other words, the light rays at the slit aperture must be
from a defocused beam. Because the collector lens K projects the image of the light source (i.e.,
the image of the halogen filament) to the location of the objective lens O (Figure 2.2), the light
beam at the slit aperture A is defocused. If the light at the slit aperture is not a defocused beam,
then the projected image of the slit will not correspond to a homogenous beam of light. This is
illustrated in Figure 2.3, where the projected slit beam displays the image of the light source; i.e.,
it is not a homogeneous beam of light.
2.4 Optical Principle of Self-imaging
As stated in section 1.1.2, the human eye accommodates to see closeup object by
contracting the ciliary muscle of the eye, making the crystalline lens assume a more spherical
geometry to allow the image of the closeup object sharply focus at the retina. However, the eye
near point limitation is about 25 cm, where it cannot accommodate to see objects closer to the
Figure 2.3: Nonhomogeneous projected slit beam, where the light source is not collimated at
the slit aperture, revealing the image of the light source.
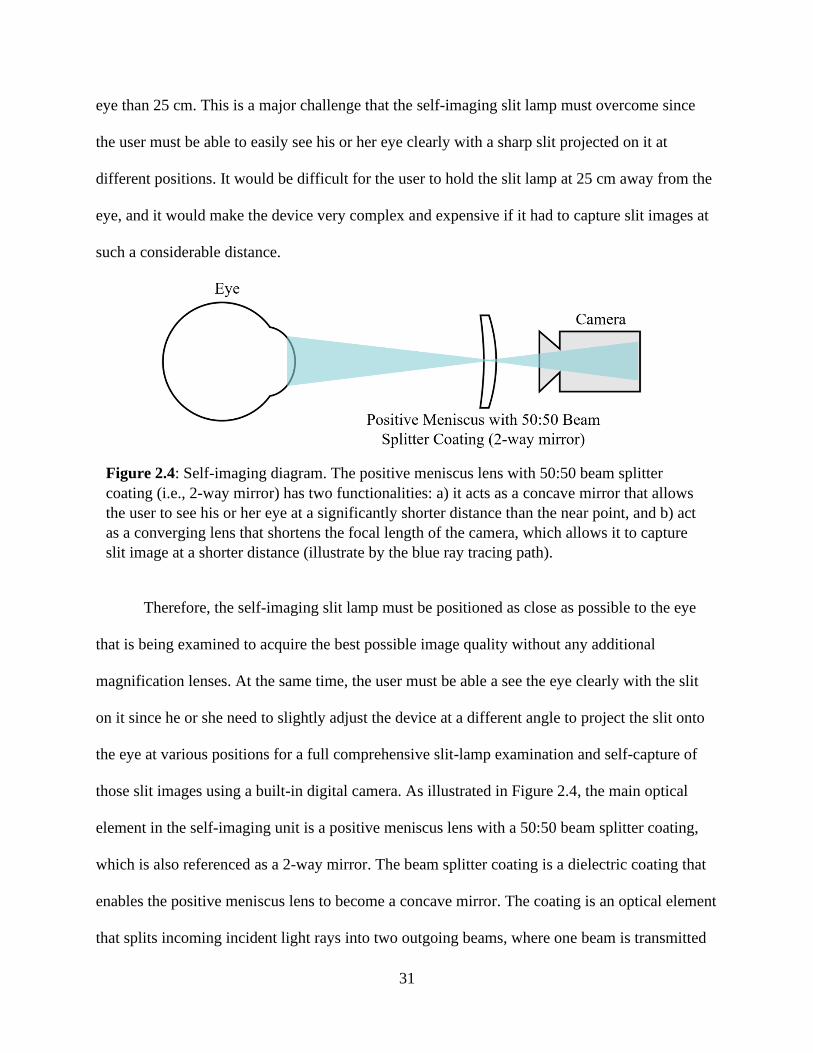
31
eye than 25 cm. This is a major challenge that the self-imaging slit lamp must overcome since
the user must be able to easily see his or her eye clearly with a sharp slit projected on it at
different positions. It would be difficult for the user to hold the slit lamp at 25 cm away from the
eye, and it would make the device very complex and expensive if it had to capture slit images at
such a considerable distance.
Therefore, the self-imaging slit lamp must be positioned as close as possible to the eye
that is being examined to acquire the best possible image quality without any additional
magnification lenses. At the same time, the user must be able a see the eye clearly with the slit
on it since he or she need to slightly adjust the device at a different angle to project the slit onto
the eye at various positions for a full comprehensive slit-lamp examination and self-capture of
those slit images using a built-in digital camera. As illustrated in Figure 2.4, the main optical
element in the self-imaging unit is a positive meniscus lens with a 50:50 beam splitter coating,
which is also referenced as a 2-way mirror. The beam splitter coating is a dielectric coating that
enables the positive meniscus lens to become a concave mirror. The coating is an optical element
that splits incoming incident light rays into two outgoing beams, where one beam is transmitted
Figure 2.4: Self-imaging diagram. The positive meniscus lens with 50:50 beam splitter
coating (i.e., 2-way mirror) has two functionalities: a) it acts as a concave mirror that allows
the user to see his or her eye at a significantly shorter distance than the near point, and b) act
as a converging lens that shortens the focal length of the camera, which allows it to capture
slit image at a shorter distance (illustrate by the blue ray tracing path).
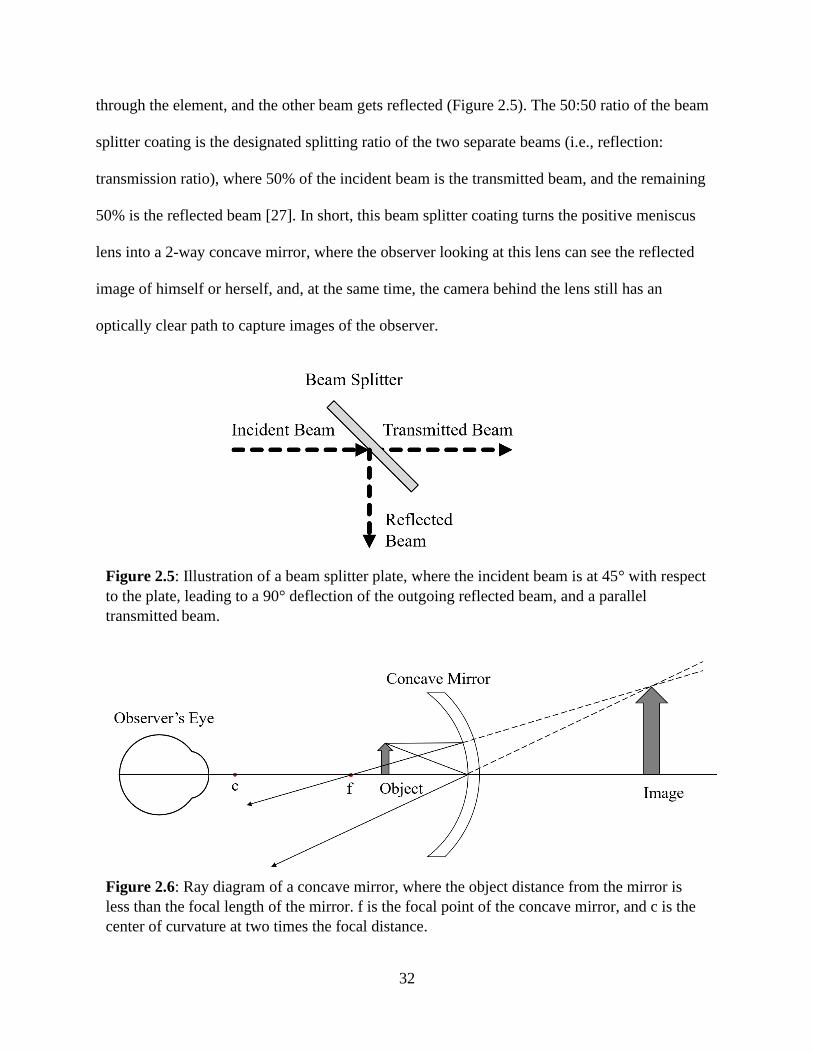
32
through the element, and the other beam gets reflected (Figure 2.5). The 50:50 ratio of the beam
splitter coating is the designated splitting ratio of the two separate beams (i.e., reflection:
transmission ratio), where 50% of the incident beam is the transmitted beam, and the remaining
50% is the reflected beam [27]. In short, this beam splitter coating turns the positive meniscus
lens into a 2-way concave mirror, where the observer looking at this lens can see the reflected
image of himself or herself, and, at the same time, the camera behind the lens still has an
optically clear path to capture images of the observer.
Figure 2.5: Illustration of a beam splitter plate, where the incident beam is at 45° with respect
to the plate, leading to a 90° deflection of the outgoing reflected beam, and a parallel
transmitted beam.
Figure 2.6: Ray diagram of a concave mirror, where the object distance from the mirror is
less than the focal length of the mirror. f is the focal point of the concave mirror, and c is the
center of curvature at two times the focal distance.
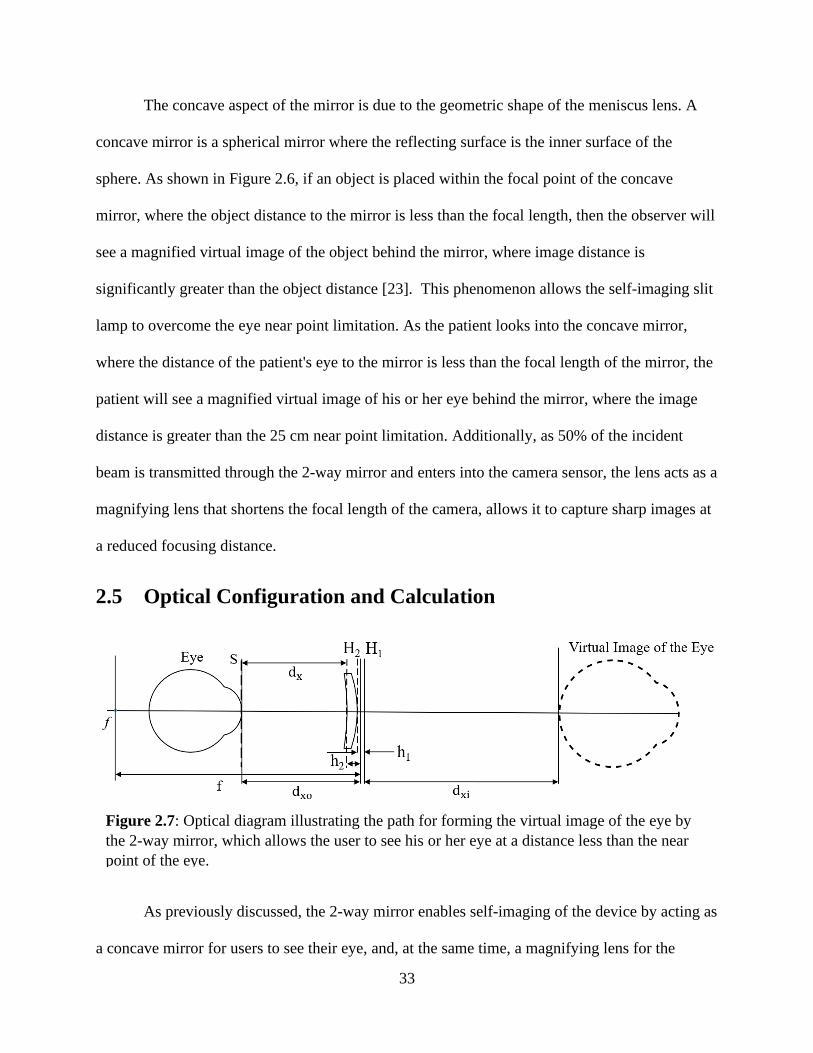
33
The concave aspect of the mirror is due to the geometric shape of the meniscus lens. A
concave mirror is a spherical mirror where the reflecting surface is the inner surface of the
sphere. As shown in Figure 2.6, if an object is placed within the focal point of the concave
mirror, where the object distance to the mirror is less than the focal length, then the observer will
see a magnified virtual image of the object behind the mirror, where image distance is
significantly greater than the object distance [23]. This phenomenon allows the self-imaging slit
lamp to overcome the eye near point limitation. As the patient looks into the concave mirror,
where the distance of the patient's eye to the mirror is less than the focal length of the mirror, the
patient will see a magnified virtual image of his or her eye behind the mirror, where the image
distance is greater than the 25 cm near point limitation. Additionally, as 50% of the incident
beam is transmitted through the 2-way mirror and enters into the camera sensor, the lens acts as a
magnifying lens that shortens the focal length of the camera, allows it to capture sharp images at
a reduced focusing distance.
2.5 Optical Configuration and Calculation
As previously discussed, the 2-way mirror enables self-imaging of the device by acting as
a concave mirror for users to see their eye, and, at the same time, a magnifying lens for the
Figure 2.7: Optical diagram illustrating the path for forming the virtual image of the eye by
the 2-way mirror, which allows the user to see his or her eye at a distance less than the near
point of the eye.

34
camera to capture high-resolution slit image (Figure 2.8.a). To accomplish this task, the 2-ways
mirror must be placed at a precise location on the eye optical axis. Figure 2.7 indicates the
optical position of the 2-way mirror to generate a magnified virtual image of the eye for the user
to sharply focus on, using the principle as described in Figure 2.6. The position of the 2-way
mirror is computationally determined using the Lens Maker's equation (2.1) for the thick lens,
and the Gaussian lens formula (2.4) [16].
1
f= (n − 1) [
1
R1−
1
R2+
(n − 1)D
n ∗ R1 ∗ R2] (2.1)
The effective focal distance, f, of the 2-way mirror can be calculated using the equation (2.1),
given n is the refractive index, R1 is the curvature of the lens front surface, R2 is the curvature of
the lens backside, and D is the thickness of the lens. Here, f is the distance from the focal point, f,
to the principal plane, H2, from the backside of the lens. H1 is the principal plane from the front
side of the lens. Therefore, the principal distance h1 and h2 must be calculated to determine the
location of the focal point, f, to the lens. As shown in Figure 2.7, the front-principal distance h1 is
the distance from the front vertex (dash line) to the front principal plane H1, which is computed
using equation (2.2). Similarly, the back-principal distance h2 is the distance from the back vertex
(dash line) to the back- principal plane H2 and can be calculated with equation (2.3).
h1 = −f(n − 1)D
nR2 (2.2)
h2 = −f(n − 1)D
nR1 (2.3)
From here, equation (2.4) of the Gaussian lens formula is used to derived equation (2.5).
35
1
f=
1
dxo+
1
dxi (2.4)
dxo =f ∗ dxi
dxi − f (2.5)
So, the distance of the eye to the back-principal plane of the 2-way mirror, dxo, can be obtained
using equation (2.5), given the virtual image of the eye, dxi, is 25 cm. If the sum of dxi and dxo is
greater than the eye near point distance of 25 cm, the user will be able to see a sharp image of his
or her eye when looking directly at the 2-way mirror. Equation (2.6) computes the absolute
distance from the eye to the 2-way mirror, dx.
dx = dxo − h2 (2.6)
On the other hand, the camera placement does not require any mathematical computation
because the camera internal autofocusing system can accommodate and focus onto the eye
through the 2-way mirror as it is optically clear and shorten the camera focal distance, enabling
the camera to focus onto the object at a closer distance than without the 2-way mirror. Thus, the
camera is placed as close to the 2-way mirror back vertex as possible on the eye optical axis.
To generate a slit using the Köhler Principle of Illumination, a minimum of two optical
elements is required: a collector lens (K) and an objective lens (O). As explained, the purpose of
the collector lens is to refract the light rays passing through the slit aperture as a defocused beam
by focusing the scattered light rays generated from the light source to form an image of the light
source at the objective lens. The purpose of the objective lens is to focus the image of a
homogenous slit beam at the slit aperture onto the patient's eye, as illustrated in Figure 2.2.
To determine the optimal locations on the eye optical axis to place the objective lens, O,
the slit aperture, A, the collector lens, K, and the light source, L, the distance of each component

36
associated with the eye must be computationally determined to maintain optical precision of the
slit. The slit beam is deflected by the mirror onto the eye, as illustrated in Figure 2.8.a, where the
yellow-ray highlighted indicates the light source traveling the path to the eye, and the (red)
dashed line reveals the image formation path of the slit aperture on the eye.
As shown in Figure 2.9, the closest element to the eye is the objective lens (O), and the
distance from the eye to the O lens, soi, is calculated using equation (2.7), which is the sum of
distance s1oi and s2oi.
𝑠𝑜𝑖 = 𝑠1𝑜𝑖 + 𝑠2𝑜𝑖 (2.7)
The relationship between these two distances to the overall system of the self-imaging slit lamp
is illustrated in Figure 2.8.b, where s2oi is the distance from the O lens to the deflecting point of
the mirror, and s1oi is the distance from the deflecting point of the mirror to the cornea of the eye.
The s2oi and dy parameters are physical distances obtained from the CAD model (3D rendering)
of the self-imaging slit lamp device because the 2-way mirror, the deflecting mirror, and the O
Figure 2.8: Diagram of the self-imaging unit optical configuration. a) Diagram illustrating the
overall four optical paths interacting with the eye: yellow path is the light source path, red
outline path is the path of slit imaging path, and the blue path is camera imaging path. The slit
beam is deflected onto the eye, be the slit deflecting mirror. b) Optical diagram defining the
parameters and optical distance that the slit beam needed to travel to reach the eye, which is
indicated by a red line.

37
lens are placed as close as possible to each other to minimize the overall device footprint. The
slit deflecting mirror is a thin square mirror with the diagonal dimension equals to the diameter
of the O lens. Given dx from equation (2.6) and distance dy, the slit deflecting angle at the eye, δ,
can be computed with equation (2.8) in the unit of radians. Then, length s1oi is determined using
equation (2.9).
After determining the slit image distance soi, from equation (2.7), the objective lens is
placed soi away from the eye, as shown in the figure. 2.9. The next step is to determine the
distance that the slit aperture (A) needs to be apart from the O lens, doo, so that the image of the
slit aperture is sharply projected onto the cornea at the location (S). As shown in Figure 2.9, the
slit aperture (A) is considered to be the object in this optical setup. Using the same thick lens
𝛿 = tan−1(𝑑𝑦
𝑑𝑥) (2.8)
𝑠1𝑜𝑖 =sin−1(𝛿)
𝑑𝑥 (2.9)
Figure 2.9: Optical diagram of projecting an image of the slit onto the eye’s cornea. soi is the
image distance from the back-principal plane (H2), where ho2 is the distance from the back-
principal plane to the back-vertex point. Vertex point is the intersection point of the principal
axis and the center of curvature of the lens. ho1 is the distance from the front-principal plane
(H1) to the front-vertex point. soo is the object distance form H1. fo is the focal point of the
objective lens. doo is the distance from the back-vertex to the object.
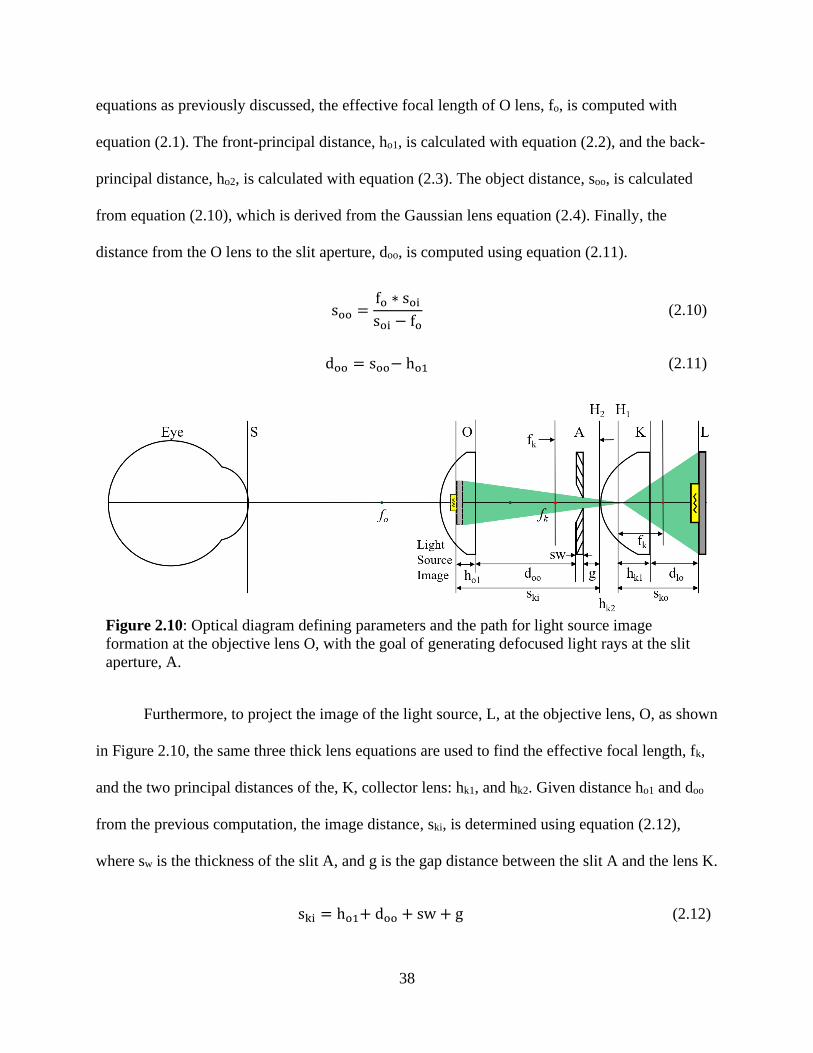
38
equations as previously discussed, the effective focal length of O lens, fo, is computed with
equation (2.1). The front-principal distance, ho1, is calculated with equation (2.2), and the back-
principal distance, ho2, is calculated with equation (2.3). The object distance, soo, is calculated
from equation (2.10), which is derived from the Gaussian lens equation (2.4). Finally, the
distance from the O lens to the slit aperture, doo, is computed using equation (2.11).
soo =fo ∗ soi
soi − fo (2.10)
doo = soo− ho1 (2.11)
Furthermore, to project the image of the light source, L, at the objective lens, O, as shown
in Figure 2.10, the same three thick lens equations are used to find the effective focal length, fk,
and the two principal distances of the, K, collector lens: hk1, and hk2. Given distance ho1 and doo
from the previous computation, the image distance, ski, is determined using equation (2.12),
where sw is the thickness of the slit A, and g is the gap distance between the slit A and the lens K.
ski = ho1+ doo + sw + g (2.12)
Figure 2.10: Optical diagram defining parameters and the path for light source image
formation at the objective lens O, with the goal of generating defocused light rays at the slit
aperture, A.
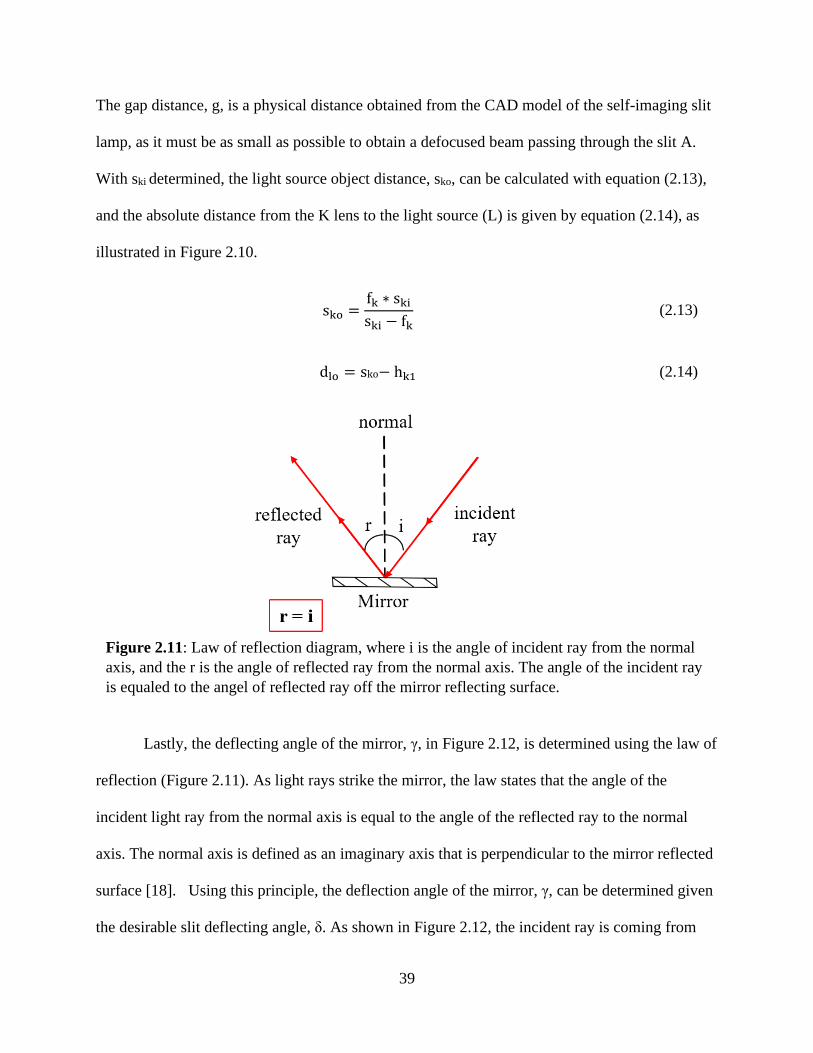
39
The gap distance, g, is a physical distance obtained from the CAD model of the self-imaging slit
lamp, as it must be as small as possible to obtain a defocused beam passing through the slit A.
With ski determined, the light source object distance, sko, can be calculated with equation (2.13),
and the absolute distance from the K lens to the light source (L) is given by equation (2.14), as
illustrated in Figure 2.10.
sko =fk ∗ ski
ski − fk (2.13)
dlo = sko− hk1 (2.14)
Lastly, the deflecting angle of the mirror, γ, in Figure 2.12, is determined using the law of
reflection (Figure 2.11). As light rays strike the mirror, the law states that the angle of the
incident light ray from the normal axis is equal to the angle of the reflected ray to the normal
axis. The normal axis is defined as an imaginary axis that is perpendicular to the mirror reflected
surface [18]. Using this principle, the deflection angle of the mirror, γ, can be determined given
the desirable slit deflecting angle, δ. As shown in Figure 2.12, the incident ray is coming from
Figure 2.11: Law of reflection diagram, where i is the angle of incident ray from the normal
axis, and the r is the angle of reflected ray from the normal axis. The angle of the incident ray
is equaled to the angel of reflected ray off the mirror reflecting surface.
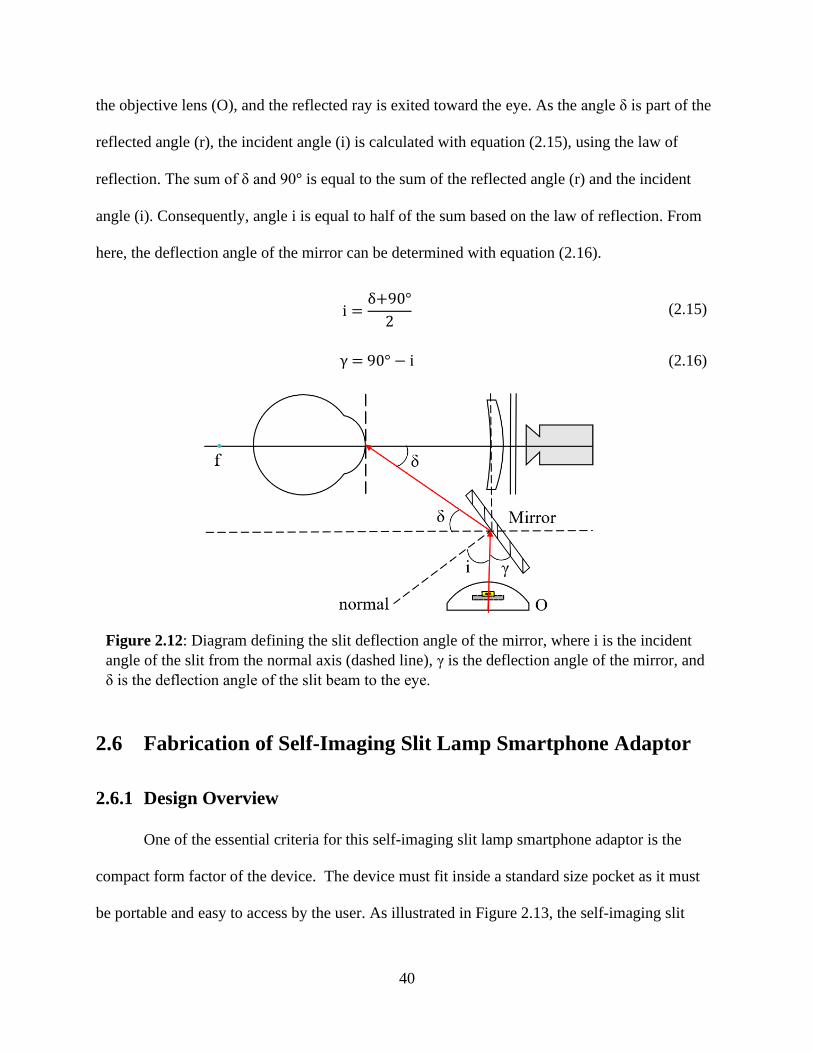
40
the objective lens (O), and the reflected ray is exited toward the eye. As the angle δ is part of the
reflected angle (r), the incident angle (i) is calculated with equation (2.15), using the law of
reflection. The sum of δ and 90° is equal to the sum of the reflected angle (r) and the incident
angle (i). Consequently, angle i is equal to half of the sum based on the law of reflection. From
here, the deflection angle of the mirror can be determined with equation (2.16).
i =δ+90°
2 (2.15)
γ = 90° − i (2.16)
2.6 Fabrication of Self-Imaging Slit Lamp Smartphone Adaptor
2.6.1 Design Overview
One of the essential criteria for this self-imaging slit lamp smartphone adaptor is the
compact form factor of the device. The device must fit inside a standard size pocket as it must
be portable and easy to access by the user. As illustrated in Figure 2.13, the self-imaging slit
Figure 2.12: Diagram defining the slit deflection angle of the mirror, where i is the incident
angle of the slit from the normal axis (dashed line), γ is the deflection angle of the mirror, and
δ is the deflection angle of the slit beam to the eye.
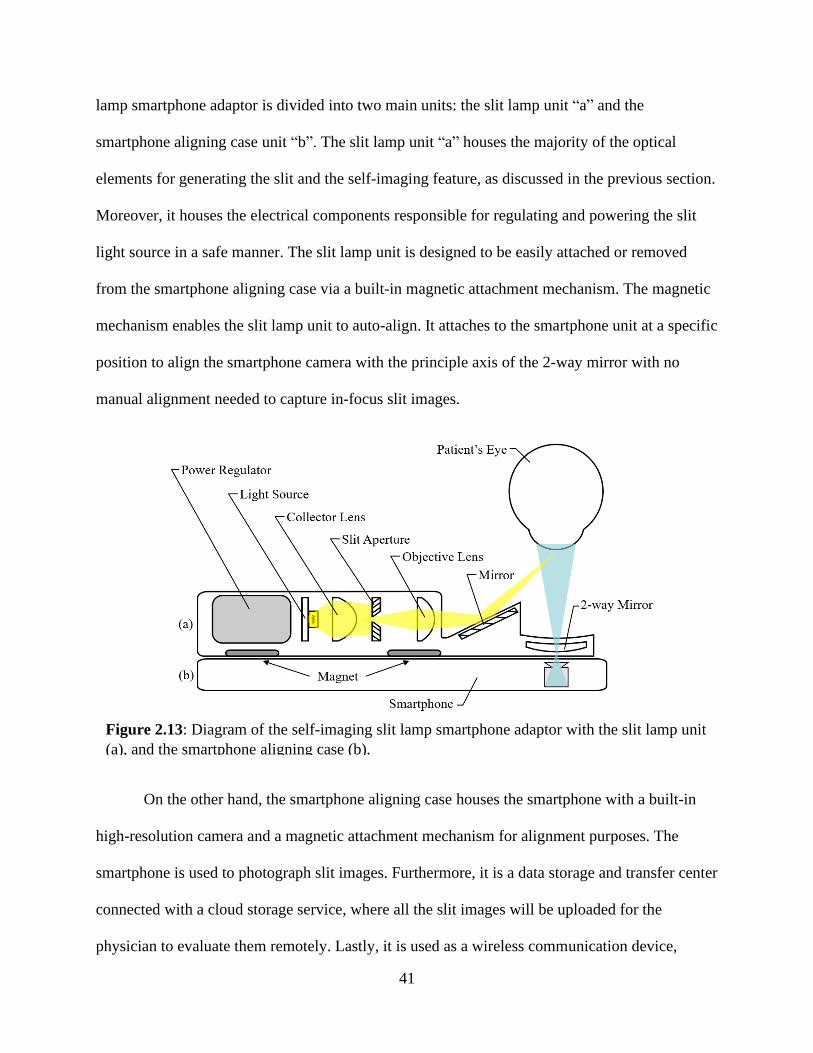
41
lamp smartphone adaptor is divided into two main units: the slit lamp unit “a” and the
smartphone aligning case unit “b”. The slit lamp unit “a” houses the majority of the optical
elements for generating the slit and the self-imaging feature, as discussed in the previous section.
Moreover, it houses the electrical components responsible for regulating and powering the slit
light source in a safe manner. The slit lamp unit is designed to be easily attached or removed
from the smartphone aligning case via a built-in magnetic attachment mechanism. The magnetic
mechanism enables the slit lamp unit to auto-align. It attaches to the smartphone unit at a specific
position to align the smartphone camera with the principle axis of the 2-way mirror with no
manual alignment needed to capture in-focus slit images.
On the other hand, the smartphone aligning case houses the smartphone with a built-in
high-resolution camera and a magnetic attachment mechanism for alignment purposes. The
smartphone is used to photograph slit images. Furthermore, it is a data storage and transfer center
connected with a cloud storage service, where all the slit images will be uploaded for the
physician to evaluate them remotely. Lastly, it is used as a wireless communication device,
Figure 2.13: Diagram of the self-imaging slit lamp smartphone adaptor with the slit lamp unit
(a), and the smartphone aligning case (b).
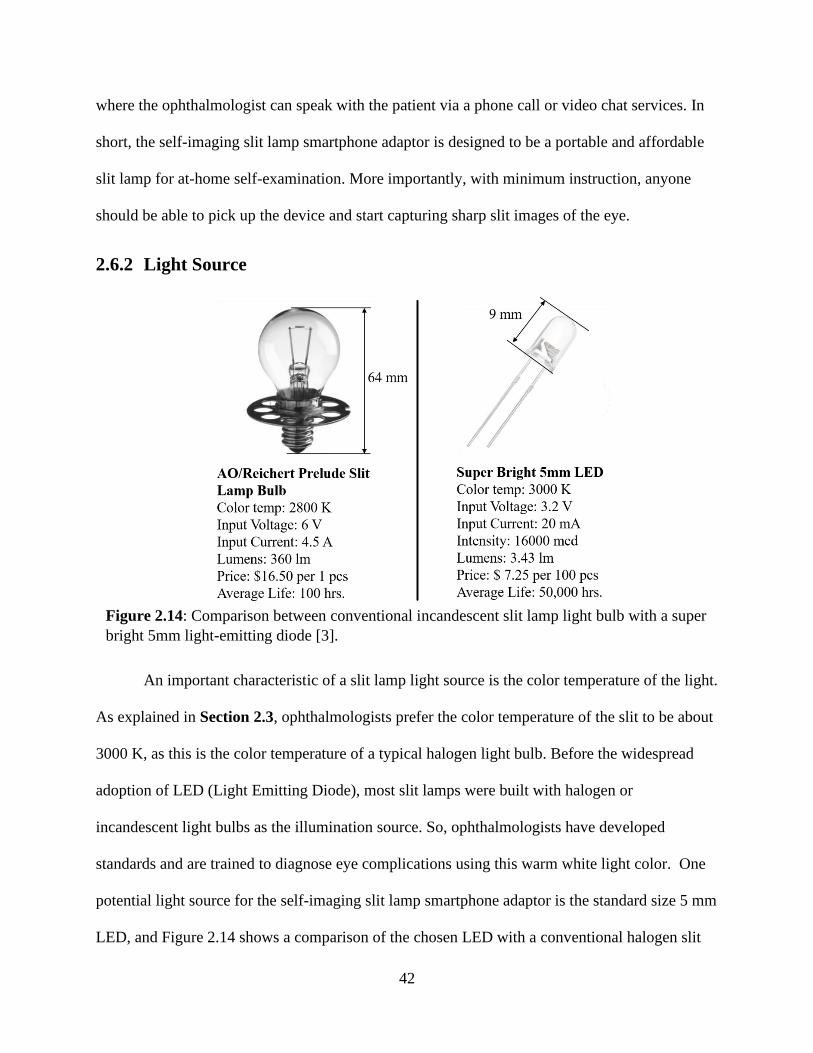
42
where the ophthalmologist can speak with the patient via a phone call or video chat services. In
short, the self-imaging slit lamp smartphone adaptor is designed to be a portable and affordable
slit lamp for at-home self-examination. More importantly, with minimum instruction, anyone
should be able to pick up the device and start capturing sharp slit images of the eye.
2.6.2 Light Source
An important characteristic of a slit lamp light source is the color temperature of the light.
As explained in Section 2.3, ophthalmologists prefer the color temperature of the slit to be about
3000 K, as this is the color temperature of a typical halogen light bulb. Before the widespread
adoption of LED (Light Emitting Diode), most slit lamps were built with halogen or
incandescent light bulbs as the illumination source. So, ophthalmologists have developed
standards and are trained to diagnose eye complications using this warm white light color. One
potential light source for the self-imaging slit lamp smartphone adaptor is the standard size 5 mm
LED, and Figure 2.14 shows a comparison of the chosen LED with a conventional halogen slit
Figure 2.14: Comparison between conventional incandescent slit lamp light bulb with a super
bright 5mm light-emitting diode [3].
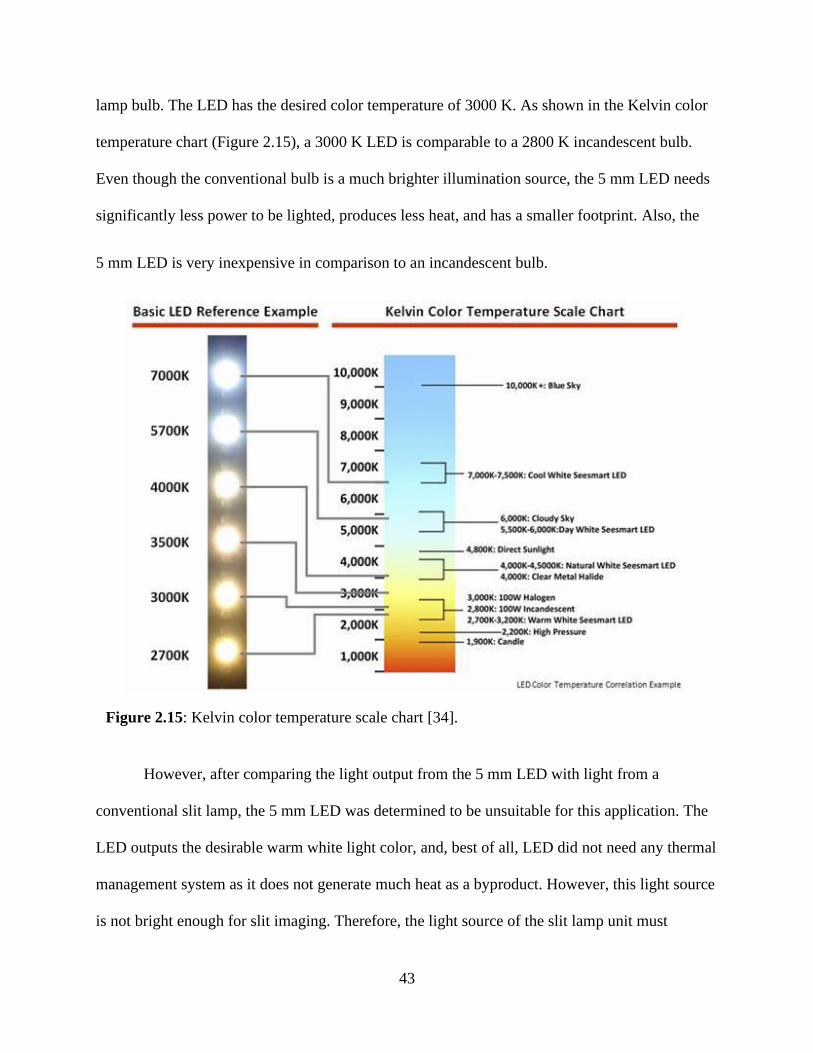
43
lamp bulb. The LED has the desired color temperature of 3000 K. As shown in the Kelvin color
temperature chart (Figure 2.15), a 3000 K LED is comparable to a 2800 K incandescent bulb.
Even though the conventional bulb is a much brighter illumination source, the 5 mm LED needs
significantly less power to be lighted, produces less heat, and has a smaller footprint. Also, the
5 mm LED is very inexpensive in comparison to an incandescent bulb.
However, after comparing the light output from the 5 mm LED with light from a
conventional slit lamp, the 5 mm LED was determined to be unsuitable for this application. The
LED outputs the desirable warm white light color, and, best of all, LED did not need any thermal
management system as it does not generate much heat as a byproduct. However, this light source
is not bright enough for slit imaging. Therefore, the light source of the slit lamp unit must
Figure 2.15: Kelvin color temperature scale chart [34].

44
generate a much higher intensity with the color temperature characteristic of a halogen light
bulb, and it must have a small form factor as it still needs to fit in a compact housing.
With a high intensity LED, another crucial requirement is that the LED operating
temperature must be manageable with a small thermal dissipation system. After researching and
testing numerous LEDs, the Cree Xlamp high intensity LED (XPL-HI-U4-3000K), as shown in
Figure 2.16, meets all the listed requirements and was selected to replace the 5 mm LED as the
light source. Looking at the specifications in Table 2.1, the Cree LED is a small surface-mount
device (SMD) LED with the maximum luminous intensity matching the conventional
incandescent light bulb in Figure 2.14, at 360 lumens (lm). The LED needs to be mounted onto a
sinkpad metal core printed circuit board (MCPCB) so that it can be connected with wires to
power (Figure 2.16.c). In addition to acting as a connection pad for the LED, the MCPCB acts as
a heat sink and redirects the heat generated by the LED away from it. An additional heat sink
can be added to the MCPCB to improve the thermal management system to regular the junction
temperature of the LED.
Figure 2.16: Diagram of the Cree Xlamp high intensity LED mounted onto a Sinkpad
MCPCB, where a) the bare SMD LED (XPL-HI-U4-3000K), b) the metal core printed circuit
board MCPCB (SNKPD-XP10-MCPCB), and c) LED reflowed to the MCPCB with wires
connected for power input [9].

45
The typical operating voltage is 2.95V at 1.05A, with the junction temperature at 85°C,
which is manageable for a compact device. With the MCPCB added, the overall dimension of
the LED of 10 mm in diameter is still small enough to fit into a compact slit lamp. Moreover, the
LED outputs the desirable 3000K color temperature with a high color rendering index (CRI) of
80+, and the cost per unit of LED with the MCPCB is about $7.00. Since the LED is a diode, it is
a non-linear device. As is evidenced in Figure 2.17, the plot shows that the forward voltage has
an exponential relationship with the forward current, i.e., a small incremental increase in voltage
results in a sizeable current uptake. Consequently, the LED needs to be controlled by current
rather than voltage, since a high input current will significantly heat-up the LED and destroy it in
a short period. So, a power regulator is needed to control the current flow into the Cree LED.
Table 2.1: Technical specifications of the Cree Xlamp high intensity LED (XPL-HI-U4-
3000K), and the Sinkpad MCPCB (SNKPD-XP10-MCPCB).
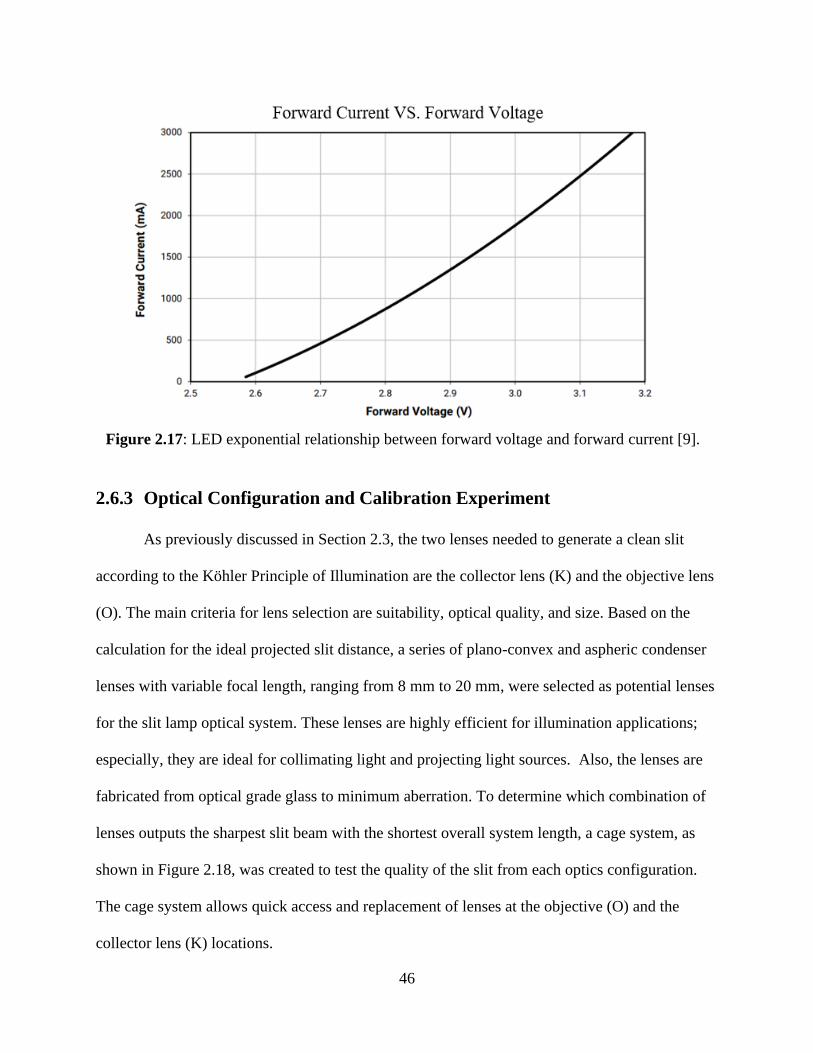
46
2.6.3 Optical Configuration and Calibration Experiment
As previously discussed in Section 2.3, the two lenses needed to generate a clean slit
according to the Köhler Principle of Illumination are the collector lens (K) and the objective lens
(O). The main criteria for lens selection are suitability, optical quality, and size. Based on the
calculation for the ideal projected slit distance, a series of plano-convex and aspheric condenser
lenses with variable focal length, ranging from 8 mm to 20 mm, were selected as potential lenses
for the slit lamp optical system. These lenses are highly efficient for illumination applications;
especially, they are ideal for collimating light and projecting light sources. Also, the lenses are
fabricated from optical grade glass to minimum aberration. To determine which combination of
lenses outputs the sharpest slit beam with the shortest overall system length, a cage system, as
shown in Figure 2.18, was created to test the quality of the slit from each optics configuration.
The cage system allows quick access and replacement of lenses at the objective (O) and the
collector lens (K) locations.
Figure 2.17: LED exponential relationship between forward voltage and forward current [9].
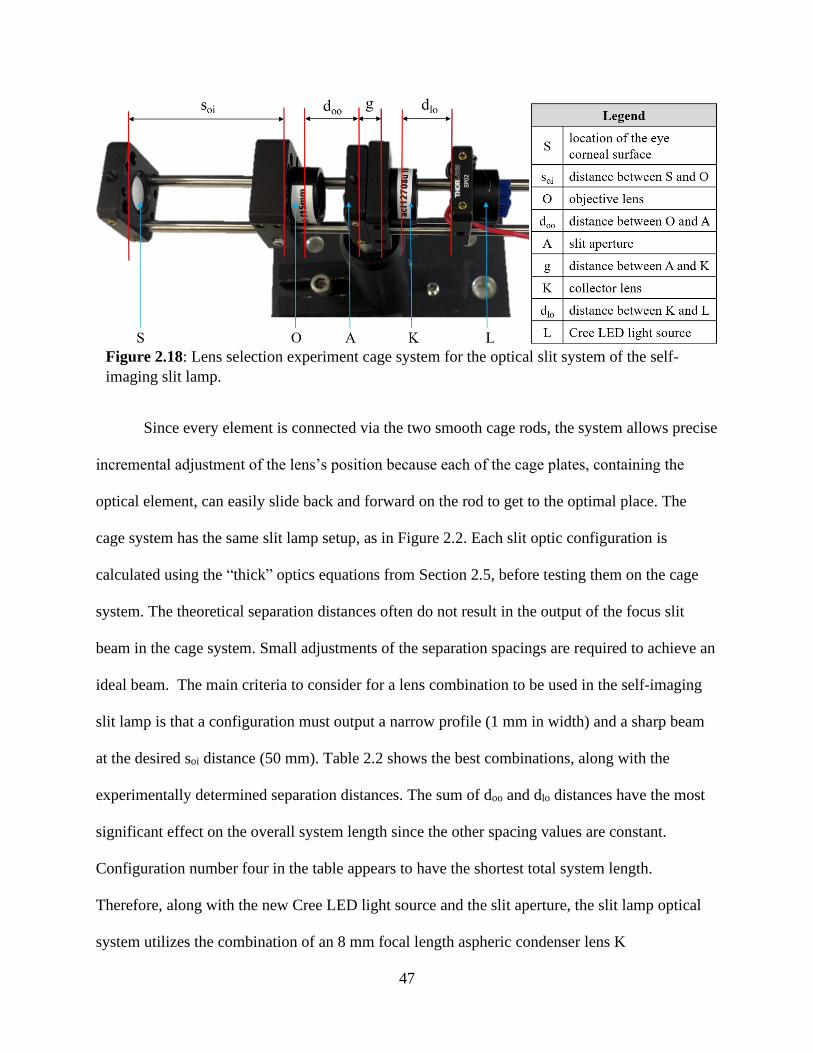
47
Since every element is connected via the two smooth cage rods, the system allows precise
incremental adjustment of the lens’s position because each of the cage plates, containing the
optical element, can easily slide back and forward on the rod to get to the optimal place. The
cage system has the same slit lamp setup, as in Figure 2.2. Each slit optic configuration is
calculated using the “thick” optics equations from Section 2.5, before testing them on the cage
system. The theoretical separation distances often do not result in the output of the focus slit
beam in the cage system. Small adjustments of the separation spacings are required to achieve an
ideal beam. The main criteria to consider for a lens combination to be used in the self-imaging
slit lamp is that a configuration must output a narrow profile (1 mm in width) and a sharp beam
at the desired soi distance (50 mm). Table 2.2 shows the best combinations, along with the
experimentally determined separation distances. The sum of doo and dlo distances have the most
significant effect on the overall system length since the other spacing values are constant.
Configuration number four in the table appears to have the shortest total system length.
Therefore, along with the new Cree LED light source and the slit aperture, the slit lamp optical
system utilizes the combination of an 8 mm focal length aspheric condenser lens K
Figure 2.18: Lens selection experiment cage system for the optical slit system of the self-
imaging slit lamp.

48
(ACL12708U) and a 15 mm focal length plano-convex lens (LA1540-A) as the collector lens
and objective lens respectively.
A benchmark comparison is needed to ensure that the slit generated from the optics setup
is as sharp as the slit coming from a conventional benchtop slit lamp. To do this, the slit system
of the self-imaging slit lamp smartphone adaptor is transferred from the cage system into the
Table 2.2: Resulting data from the lens selection experiment, showing the configurations
that generated a narrow and sharp slit lamp at the ideal soi distance.
Figure 2.19: Comparison between the conventional benchtop slit lamp and the self-imaging
slit lamp optical system. a) setup of the optical system at the correct projected distance to the
subject eye, b) process of capturing the slit imaging using a smartphone attachment to the
conventional slit lamp eyepiece, and c) slit image showing two slit beams with comparable
quality, one generated by the self-imaging slit lamp system and the other generated by the
benchtop slit lamp.
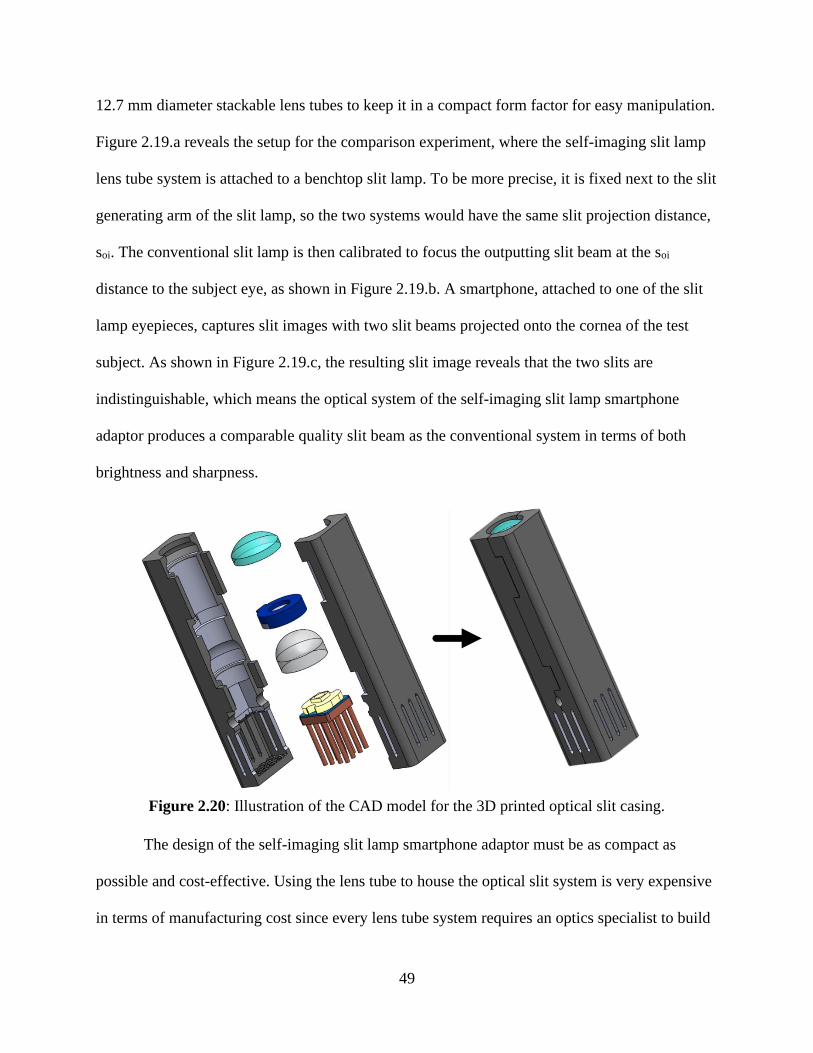
49
12.7 mm diameter stackable lens tubes to keep it in a compact form factor for easy manipulation.
Figure 2.19.a reveals the setup for the comparison experiment, where the self-imaging slit lamp
lens tube system is attached to a benchtop slit lamp. To be more precise, it is fixed next to the slit
generating arm of the slit lamp, so the two systems would have the same slit projection distance,
soi. The conventional slit lamp is then calibrated to focus the outputting slit beam at the soi
distance to the subject eye, as shown in Figure 2.19.b. A smartphone, attached to one of the slit
lamp eyepieces, captures slit images with two slit beams projected onto the cornea of the test
subject. As shown in Figure 2.19.c, the resulting slit image reveals that the two slits are
indistinguishable, which means the optical system of the self-imaging slit lamp smartphone
adaptor produces a comparable quality slit beam as the conventional system in terms of both
brightness and sharpness.
The design of the self-imaging slit lamp smartphone adaptor must be as compact as
possible and cost-effective. Using the lens tube to house the optical slit system is very expensive
in terms of manufacturing cost since every lens tube system requires an optics specialist to build
Figure 2.20: Illustration of the CAD model for the 3D printed optical slit casing.
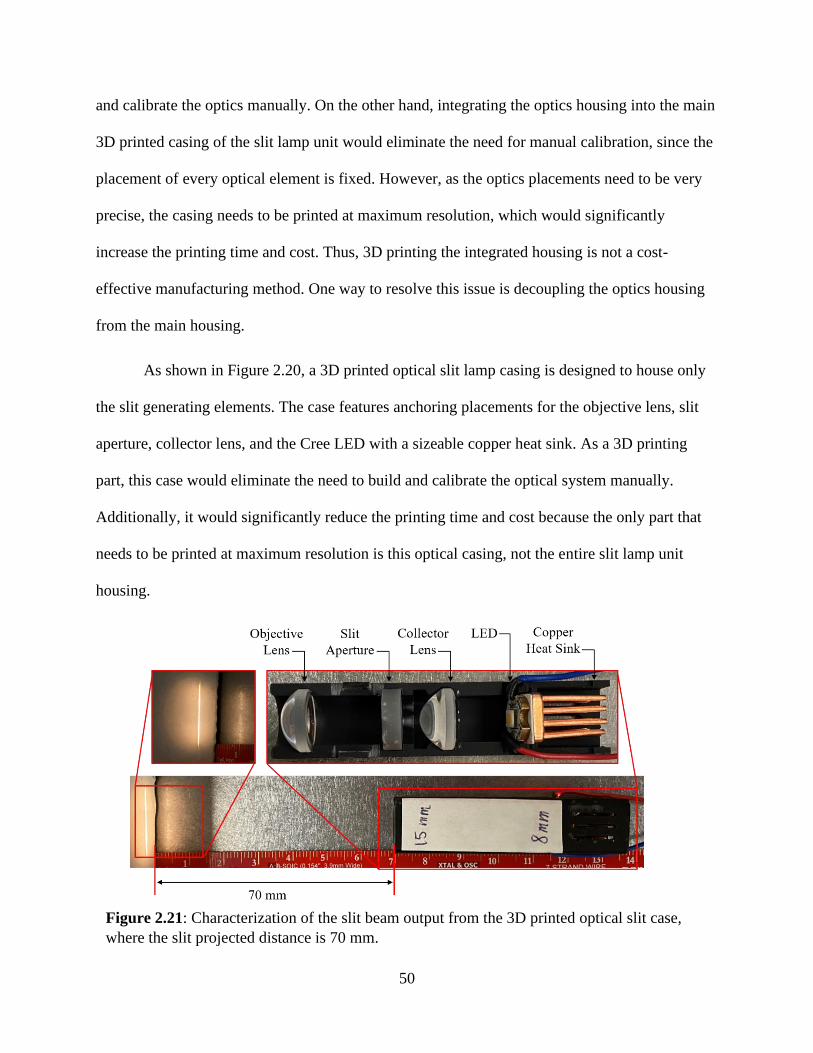
50
and calibrate the optics manually. On the other hand, integrating the optics housing into the main
3D printed casing of the slit lamp unit would eliminate the need for manual calibration, since the
placement of every optical element is fixed. However, as the optics placements need to be very
precise, the casing needs to be printed at maximum resolution, which would significantly
increase the printing time and cost. Thus, 3D printing the integrated housing is not a cost-
effective manufacturing method. One way to resolve this issue is decoupling the optics housing
from the main housing.
As shown in Figure 2.20, a 3D printed optical slit lamp casing is designed to house only
the slit generating elements. The case features anchoring placements for the objective lens, slit
aperture, collector lens, and the Cree LED with a sizeable copper heat sink. As a 3D printing
part, this case would eliminate the need to build and calibrate the optical system manually.
Additionally, it would significantly reduce the printing time and cost because the only part that
needs to be printed at maximum resolution is this optical casing, not the entire slit lamp unit
housing.
Figure 2.21: Characterization of the slit beam output from the 3D printed optical slit case,
where the slit projected distance is 70 mm.

51
The optical slit case was printed using the Form 2 SLA printer and assembled, as shown
in Figure 2.21. The element separation distances in the 3D printed case are based on the
configuration number four in Table 2.2, where the slit projected length, soi, is 50 mm. However,
Figure 2.21 reveals that the slit distance of the casing is 70 mm. The disparity between the value
from the experimental setup, 50 mm, and the value obtained from the case is most likely due to
the thick lens property of the lenses used in the system. Additionally, measurement error in the
lens selection experiment may contribute to this disparity.
An experiment was conducted to investigate this problem. A series of four optical slit
cases with each having a different object distance, ranging from 14 mm to 18 mm, was used to
collect the image distance of optical housing, as illustrated in Figure 2.22. The object distance,
doo, is the length between the slit aperture and the objective lens, as shown in Figure 2.18, and
the image distance, soi, is the length between the objective lens to the location where the slit
beam is in sharp focus. Each case is assembled with the same optical elements, and the slit beam
generated from each case is focused onto a perpendicular white platform, where the image
distance is measured with a ruler (Figure 2.22). At the end of this experiment, four sets of data
points were collected to characterize the relationship between doo and soi. The plot in Figure 2.23
reveals the relationship between image distance and object distance. In particular, it shows the
disparity between the theoretical relationship (red curve) and the experimentally determined
relationship (blue curve) of the two parameters.
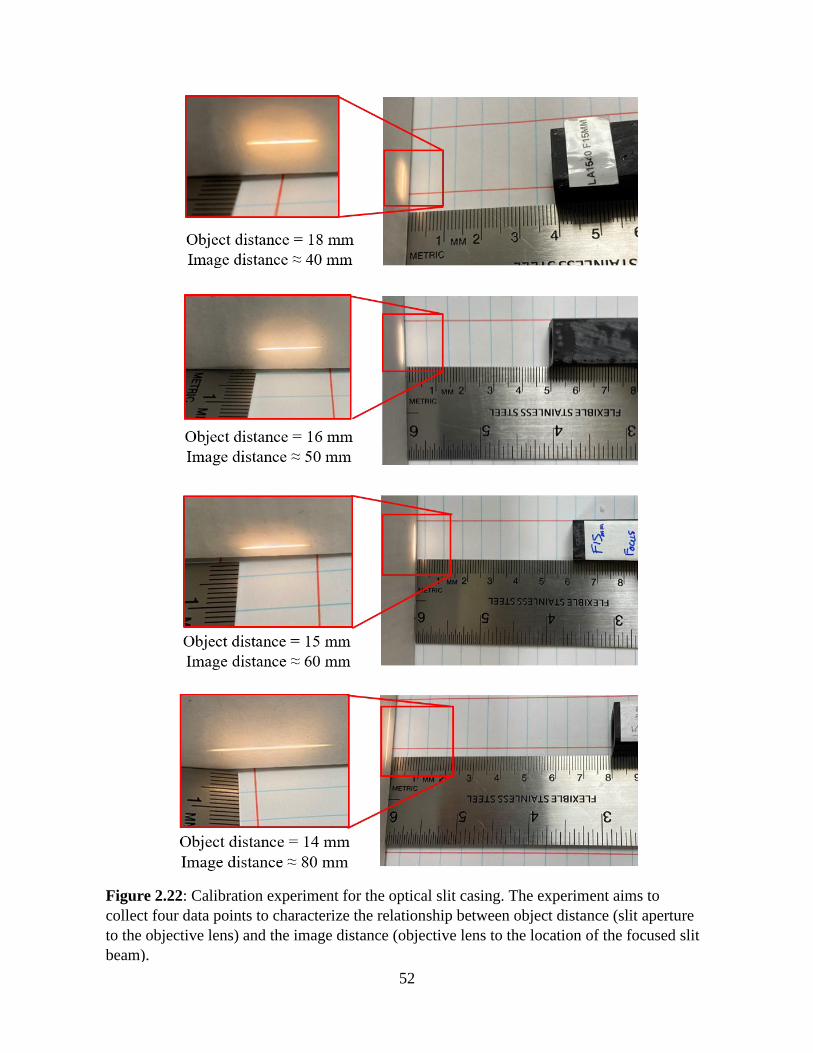
52
Figure 2.22: Calibration experiment for the optical slit casing. The experiment aims to
collect four data points to characterize the relationship between object distance (slit aperture
to the objective lens) and the image distance (objective lens to the location of the focused slit
beam).
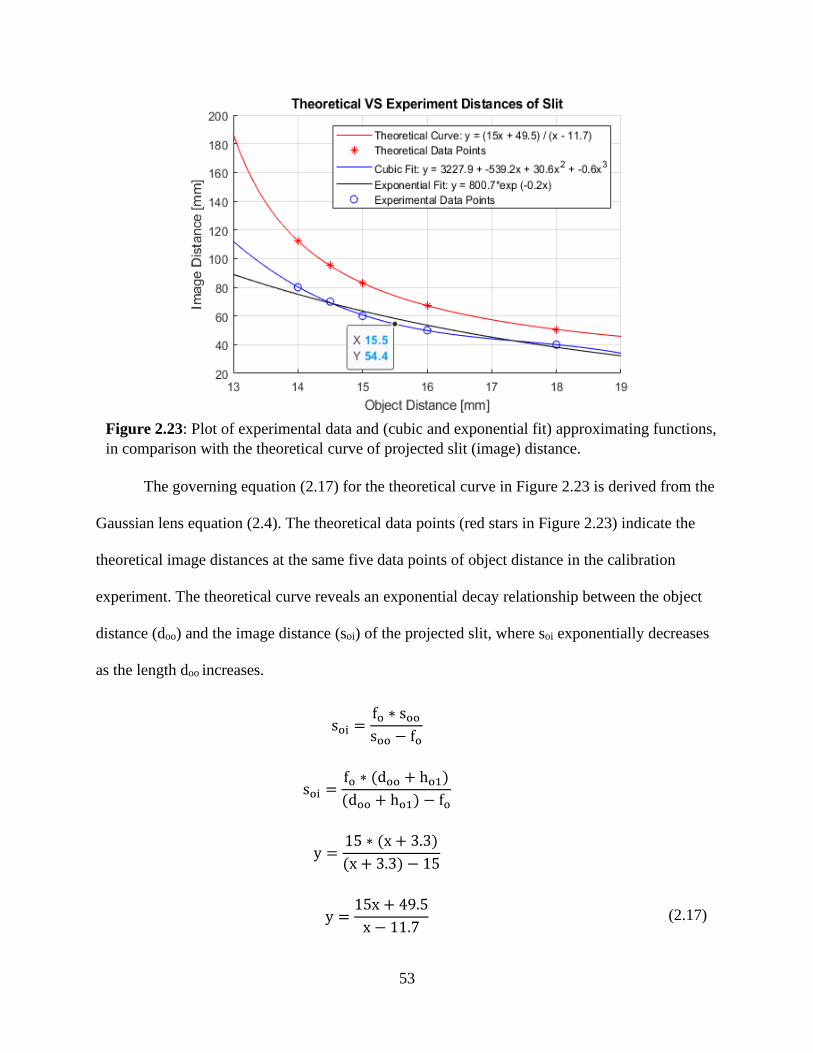
53
The governing equation (2.17) for the theoretical curve in Figure 2.23 is derived from the
Gaussian lens equation (2.4). The theoretical data points (red stars in Figure 2.23) indicate the
theoretical image distances at the same five data points of object distance in the calibration
experiment. The theoretical curve reveals an exponential decay relationship between the object
distance (doo) and the image distance (soi) of the projected slit, where soi exponentially decreases
as the length doo increases.
soi =fo ∗ soo
soo − fo
soi =fo ∗ (doo + ho1)
(doo + ho1) − fo
y =15 ∗ (x + 3.3)
(x + 3.3) − 15
y =15x + 49.5
x − 11.7 (2.17)
Figure 2.23: Plot of experimental data and (cubic and exponential fit) approximating functions,
in comparison with the theoretical curve of projected slit (image) distance.
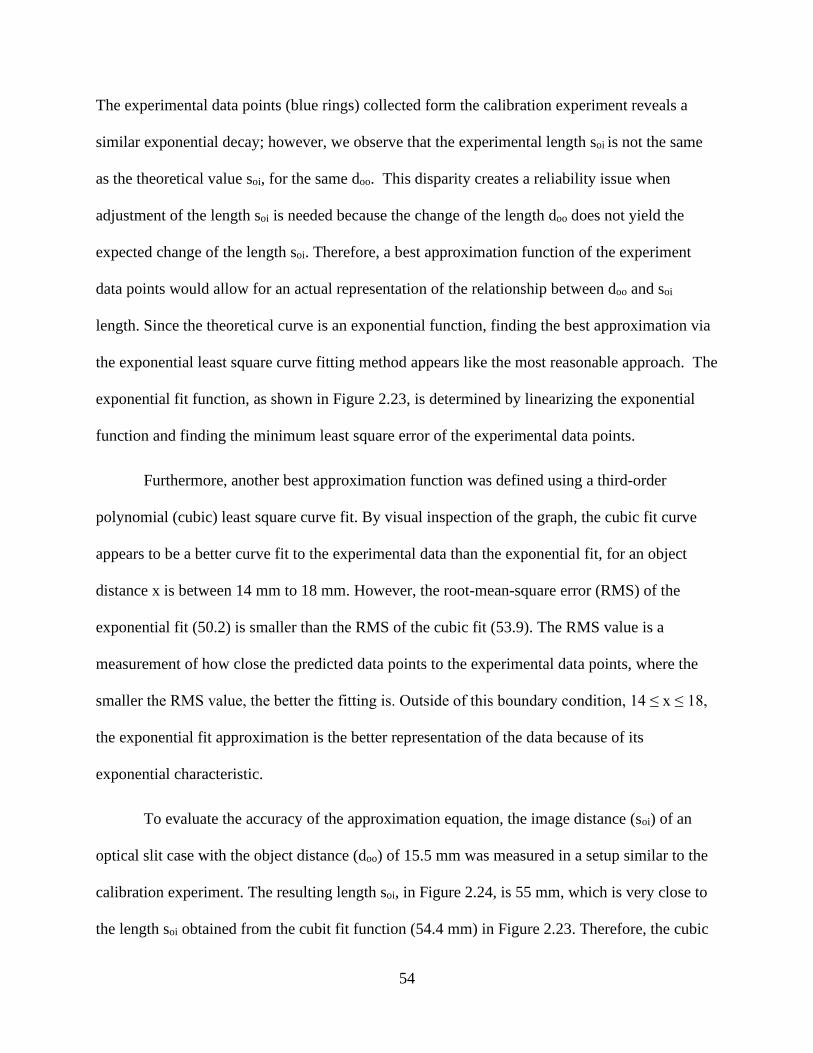
54
The experimental data points (blue rings) collected form the calibration experiment reveals a
similar exponential decay; however, we observe that the experimental length soi is not the same
as the theoretical value soi, for the same doo. This disparity creates a reliability issue when
adjustment of the length soi is needed because the change of the length doo does not yield the
expected change of the length soi. Therefore, a best approximation function of the experiment
data points would allow for an actual representation of the relationship between doo and soi
length. Since the theoretical curve is an exponential function, finding the best approximation via
the exponential least square curve fitting method appears like the most reasonable approach. The
exponential fit function, as shown in Figure 2.23, is determined by linearizing the exponential
function and finding the minimum least square error of the experimental data points.
Furthermore, another best approximation function was defined using a third-order
polynomial (cubic) least square curve fit. By visual inspection of the graph, the cubic fit curve
appears to be a better curve fit to the experimental data than the exponential fit, for an object
distance x is between 14 mm to 18 mm. However, the root-mean-square error (RMS) of the
exponential fit (50.2) is smaller than the RMS of the cubic fit (53.9). The RMS value is a
measurement of how close the predicted data points to the experimental data points, where the
smaller the RMS value, the better the fitting is. Outside of this boundary condition, 14 ≤ x ≤ 18,
the exponential fit approximation is the better representation of the data because of its
exponential characteristic.
To evaluate the accuracy of the approximation equation, the image distance (soi) of an
optical slit case with the object distance (doo) of 15.5 mm was measured in a setup similar to the
calibration experiment. The resulting length soi, in Figure 2.24, is 55 mm, which is very close to
the length soi obtained from the cubit fit function (54.4 mm) in Figure 2.23. Therefore, the cubic
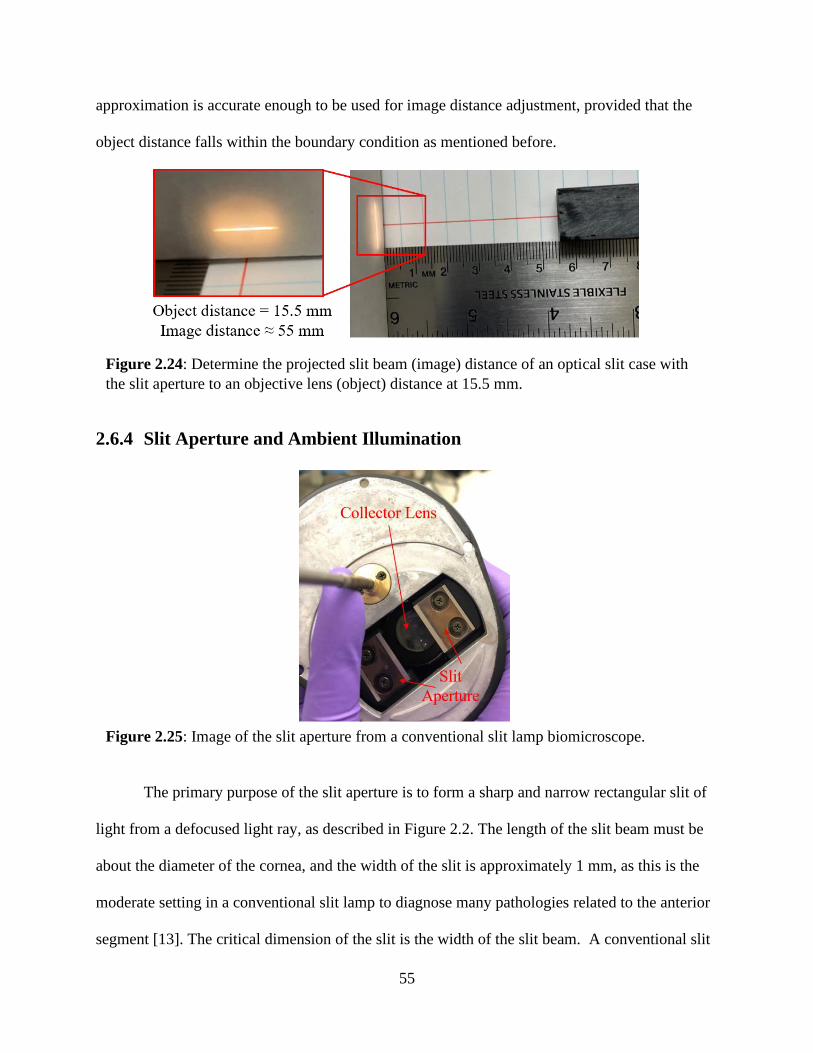
55
approximation is accurate enough to be used for image distance adjustment, provided that the
object distance falls within the boundary condition as mentioned before.
2.6.4 Slit Aperture and Ambient Illumination
The primary purpose of the slit aperture is to form a sharp and narrow rectangular slit of
light from a defocused light ray, as described in Figure 2.2. The length of the slit beam must be
about the diameter of the cornea, and the width of the slit is approximately 1 mm, as this is the
moderate setting in a conventional slit lamp to diagnose many pathologies related to the anterior
segment [13]. The critical dimension of the slit is the width of the slit beam. A conventional slit
Figure 2.24: Determine the projected slit beam (image) distance of an optical slit case with
the slit aperture to an objective lens (object) distance at 15.5 mm.
Figure 2.25: Image of the slit aperture from a conventional slit lamp biomicroscope.
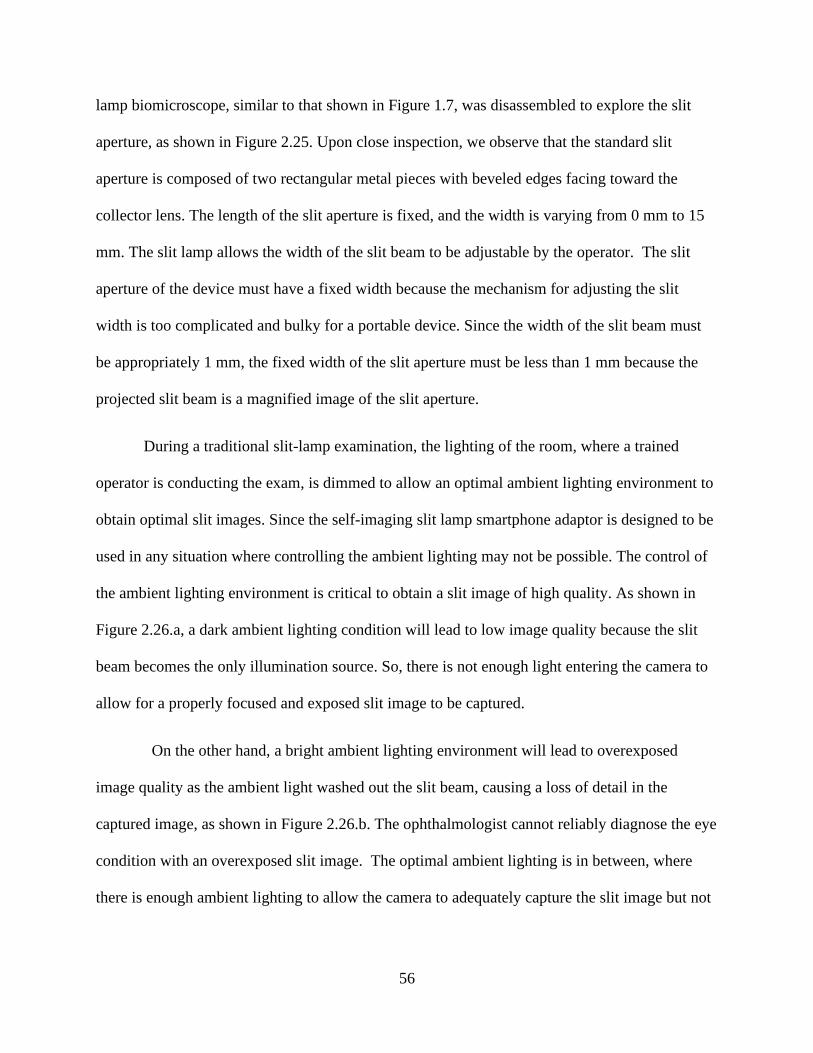
56
lamp biomicroscope, similar to that shown in Figure 1.7, was disassembled to explore the slit
aperture, as shown in Figure 2.25. Upon close inspection, we observe that the standard slit
aperture is composed of two rectangular metal pieces with beveled edges facing toward the
collector lens. The length of the slit aperture is fixed, and the width is varying from 0 mm to 15
mm. The slit lamp allows the width of the slit beam to be adjustable by the operator. The slit
aperture of the device must have a fixed width because the mechanism for adjusting the slit
width is too complicated and bulky for a portable device. Since the width of the slit beam must
be appropriately 1 mm, the fixed width of the slit aperture must be less than 1 mm because the
projected slit beam is a magnified image of the slit aperture.
During a traditional slit-lamp examination, the lighting of the room, where a trained
operator is conducting the exam, is dimmed to allow an optimal ambient lighting environment to
obtain optimal slit images. Since the self-imaging slit lamp smartphone adaptor is designed to be
used in any situation where controlling the ambient lighting may not be possible. The control of
the ambient lighting environment is critical to obtain a slit image of high quality. As shown in
Figure 2.26.a, a dark ambient lighting condition will lead to low image quality because the slit
beam becomes the only illumination source. So, there is not enough light entering the camera to
allow for a properly focused and exposed slit image to be captured.
On the other hand, a bright ambient lighting environment will lead to overexposed
image quality as the ambient light washed out the slit beam, causing a loss of detail in the
captured image, as shown in Figure 2.26.b. The ophthalmologist cannot reliably diagnose the eye
condition with an overexposed slit image. The optimal ambient lighting is in between, where
there is enough ambient lighting to allow the camera to adequately capture the slit image but not
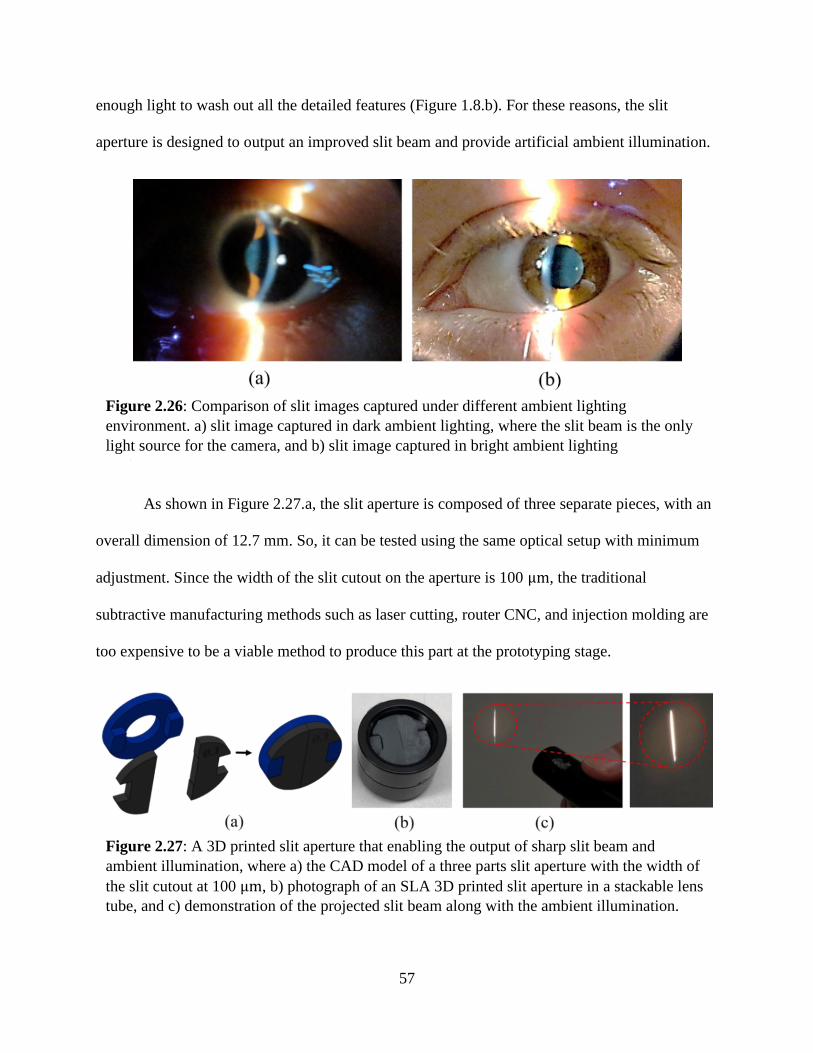
57
enough light to wash out all the detailed features (Figure 1.8.b). For these reasons, the slit
aperture is designed to output an improved slit beam and provide artificial ambient illumination.
As shown in Figure 2.27.a, the slit aperture is composed of three separate pieces, with an
overall dimension of 12.7 mm. So, it can be tested using the same optical setup with minimum
adjustment. Since the width of the slit cutout on the aperture is 100 μm, the traditional
subtractive manufacturing methods such as laser cutting, router CNC, and injection molding are
too expensive to be a viable method to produce this part at the prototyping stage.
Figure 2.26: Comparison of slit images captured under different ambient lighting
environment. a) slit image captured in dark ambient lighting, where the slit beam is the only
light source for the camera, and b) slit image captured in bright ambient lighting
environment.
Figure 2.27: A 3D printed slit aperture that enabling the output of sharp slit beam and
ambient illumination, where a) the CAD model of a three parts slit aperture with the width of
the slit cutout at 100 μm, b) photograph of an SLA 3D printed slit aperture in a stackable lens
tube, and c) demonstration of the projected slit beam along with the ambient illumination.
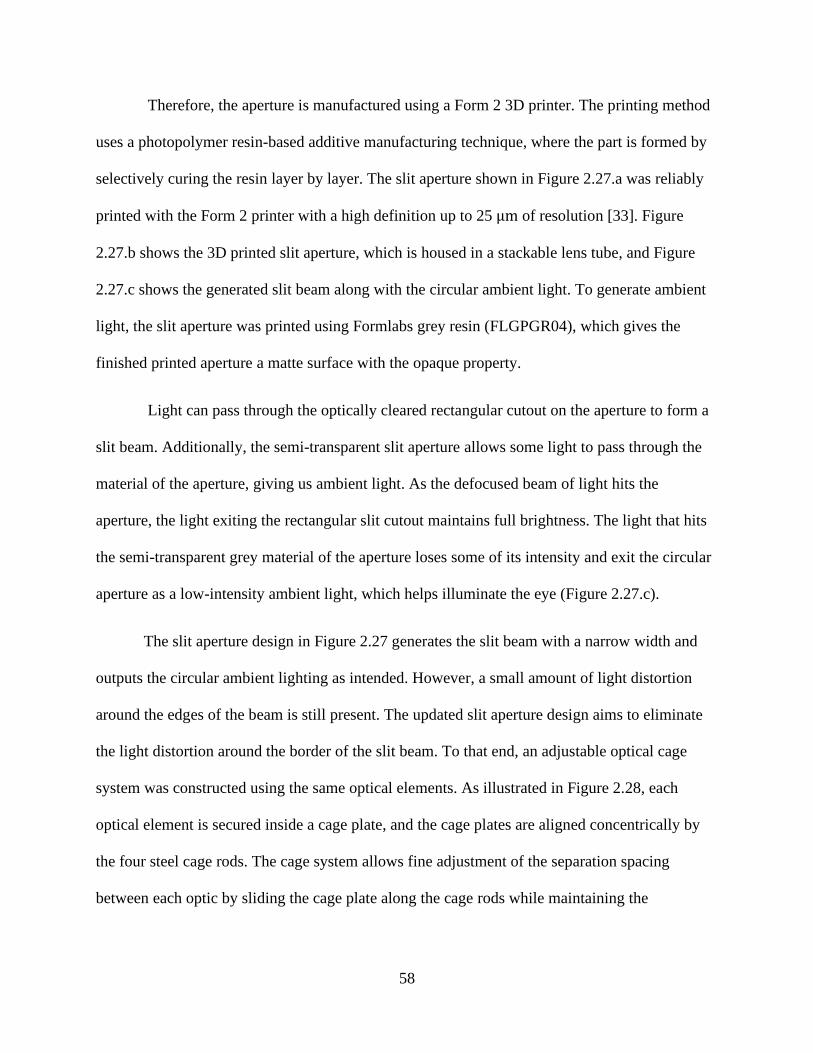
58
Therefore, the aperture is manufactured using a Form 2 3D printer. The printing method
uses a photopolymer resin-based additive manufacturing technique, where the part is formed by
selectively curing the resin layer by layer. The slit aperture shown in Figure 2.27.a was reliably
printed with the Form 2 printer with a high definition up to 25 μm of resolution [33]. Figure
2.27.b shows the 3D printed slit aperture, which is housed in a stackable lens tube, and Figure
2.27.c shows the generated slit beam along with the circular ambient light. To generate ambient
light, the slit aperture was printed using Formlabs grey resin (FLGPGR04), which gives the
finished printed aperture a matte surface with the opaque property.
Light can pass through the optically cleared rectangular cutout on the aperture to form a
slit beam. Additionally, the semi-transparent slit aperture allows some light to pass through the
material of the aperture, giving us ambient light. As the defocused beam of light hits the
aperture, the light exiting the rectangular slit cutout maintains full brightness. The light that hits
the semi-transparent grey material of the aperture loses some of its intensity and exit the circular
aperture as a low-intensity ambient light, which helps illuminate the eye (Figure 2.27.c).
The slit aperture design in Figure 2.27 generates the slit beam with a narrow width and
outputs the circular ambient lighting as intended. However, a small amount of light distortion
around the edges of the beam is still present. The updated slit aperture design aims to eliminate
the light distortion around the border of the slit beam. To that end, an adjustable optical cage
system was constructed using the same optical elements. As illustrated in Figure 2.28, each
optical element is secured inside a cage plate, and the cage plates are aligned concentrically by
the four steel cage rods. The cage system allows fine adjustment of the separation spacing
between each optic by sliding the cage plate along the cage rods while maintaining the
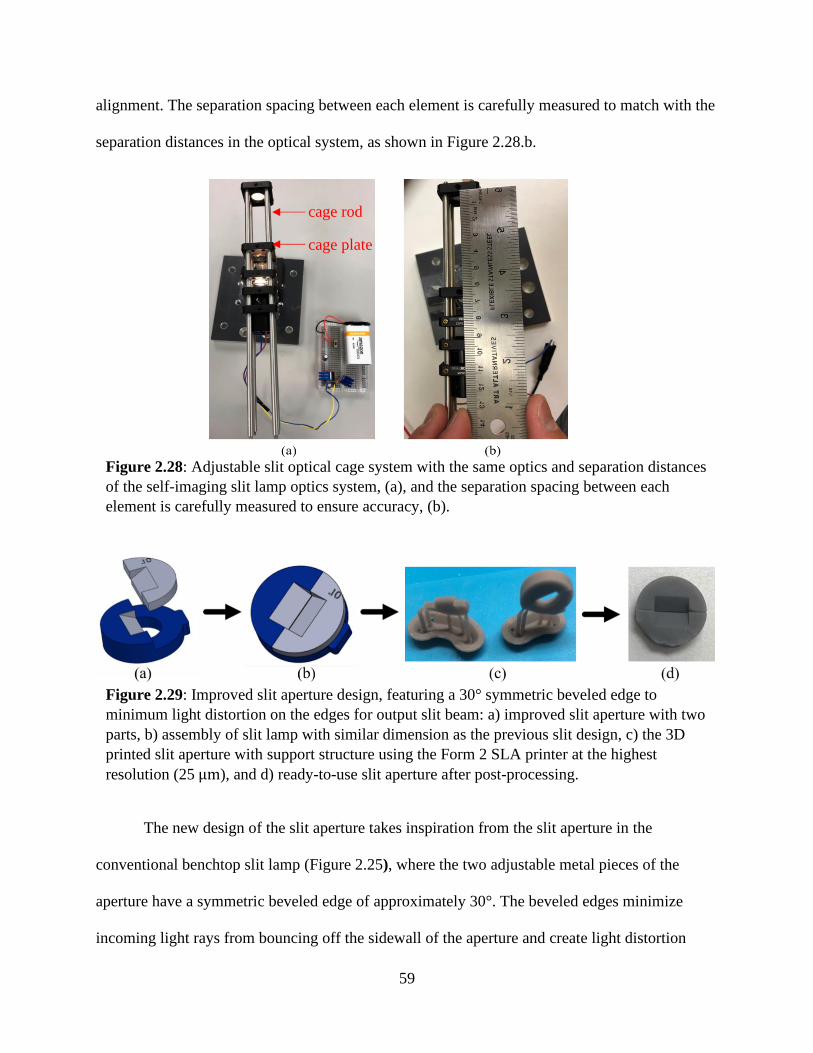
59
alignment. The separation spacing between each element is carefully measured to match with the
separation distances in the optical system, as shown in Figure 2.28.b.
The new design of the slit aperture takes inspiration from the slit aperture in the
conventional benchtop slit lamp (Figure 2.25), where the two adjustable metal pieces of the
aperture have a symmetric beveled edge of approximately 30°. The beveled edges minimize
incoming light rays from bouncing off the sidewall of the aperture and create light distortion
Figure 2.28: Adjustable slit optical cage system with the same optics and separation distances
of the self-imaging slit lamp optics system, (a), and the separation spacing between each
element is carefully measured to ensure accuracy, (b).
cage rod
cage plate
Figure 2.29: Improved slit aperture design, featuring a 30° symmetric beveled edge to
minimum light distortion on the edges for output slit beam: a) improved slit aperture with two
parts, b) assembly of slit lamp with similar dimension as the previous slit design, c) the 3D
printed slit aperture with support structure using the Form 2 SLA printer at the highest
resolution (25 μm), and d) ready-to-use slit aperture after post-processing.
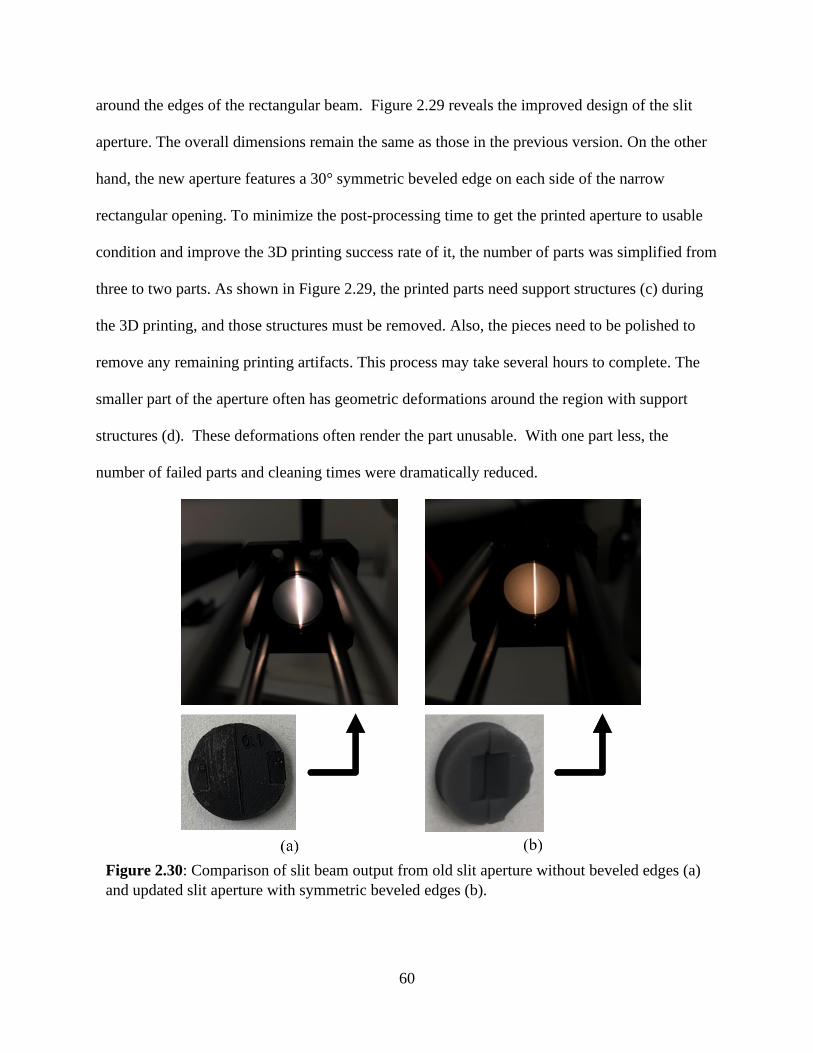
60
around the edges of the rectangular beam. Figure 2.29 reveals the improved design of the slit
aperture. The overall dimensions remain the same as those in the previous version. On the other
hand, the new aperture features a 30° symmetric beveled edge on each side of the narrow
rectangular opening. To minimize the post-processing time to get the printed aperture to usable
condition and improve the 3D printing success rate of it, the number of parts was simplified from
three to two parts. As shown in Figure 2.29, the printed parts need support structures (c) during
the 3D printing, and those structures must be removed. Also, the pieces need to be polished to
remove any remaining printing artifacts. This process may take several hours to complete. The
smaller part of the aperture often has geometric deformations around the region with support
structures (d). These deformations often render the part unusable. With one part less, the
number of failed parts and cleaning times were dramatically reduced.
Figure 2.30: Comparison of slit beam output from old slit aperture without beveled edges (a)
and updated slit aperture with symmetric beveled edges (b).
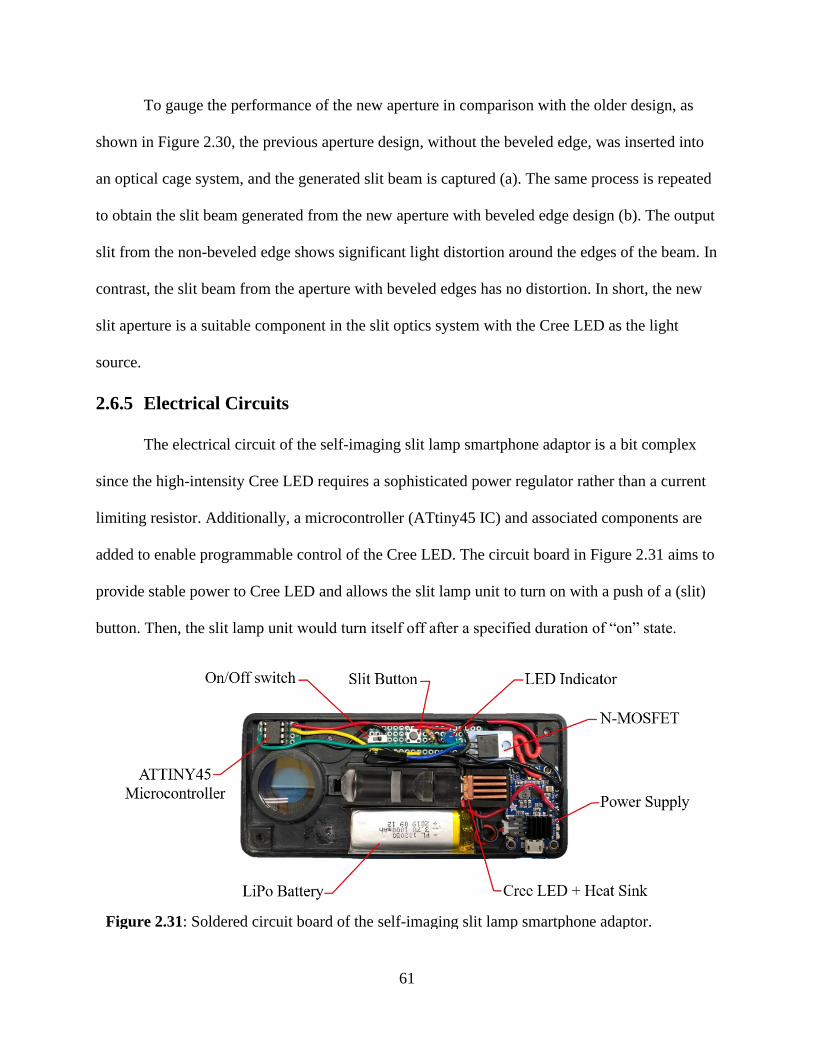
61
To gauge the performance of the new aperture in comparison with the older design, as
shown in Figure 2.30, the previous aperture design, without the beveled edge, was inserted into
an optical cage system, and the generated slit beam is captured (a). The same process is repeated
to obtain the slit beam generated from the new aperture with beveled edge design (b). The output
slit from the non-beveled edge shows significant light distortion around the edges of the beam. In
contrast, the slit beam from the aperture with beveled edges has no distortion. In short, the new
slit aperture is a suitable component in the slit optics system with the Cree LED as the light
source.
2.6.5 Electrical Circuits
The electrical circuit of the self-imaging slit lamp smartphone adaptor is a bit complex
since the high-intensity Cree LED requires a sophisticated power regulator rather than a current
limiting resistor. Additionally, a microcontroller (ATtiny45 IC) and associated components are
added to enable programmable control of the Cree LED. The circuit board in Figure 2.31 aims to
provide stable power to Cree LED and allows the slit lamp unit to turn on with a push of a (slit)
button. Then, the slit lamp unit would turn itself off after a specified duration of “on” state.
Figure 2.31: Soldered circuit board of the self-imaging slit lamp smartphone adaptor.
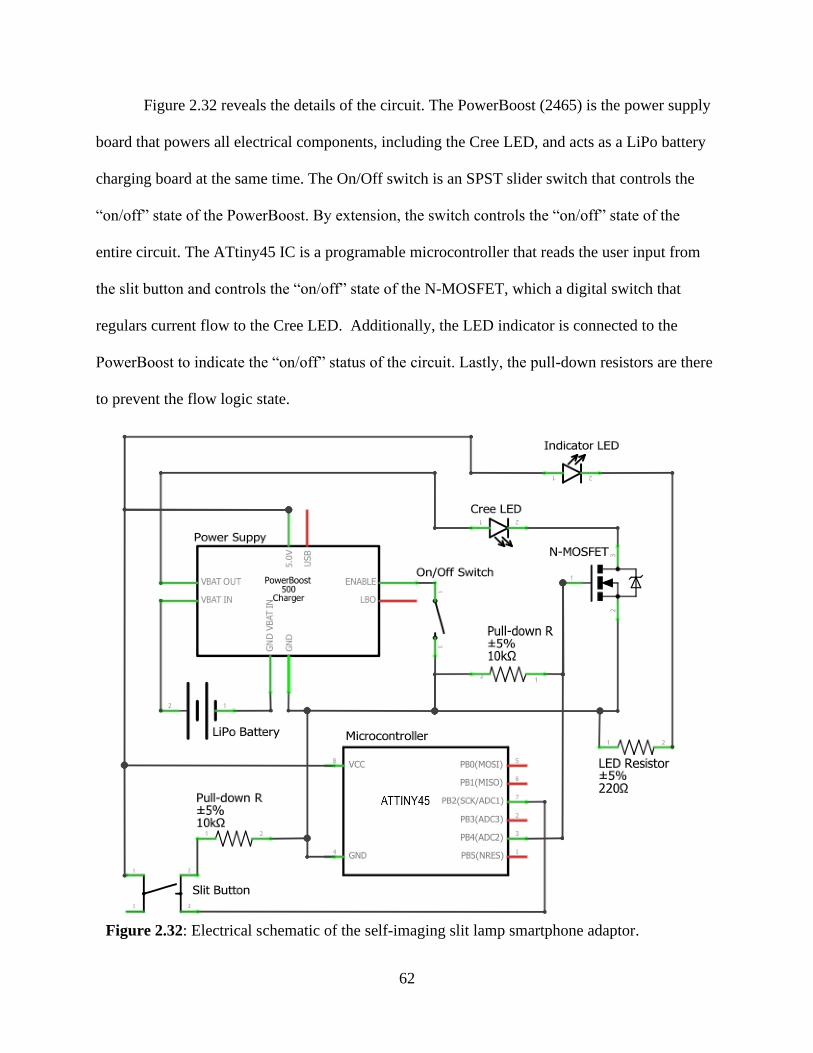
62
Figure 2.32 reveals the details of the circuit. The PowerBoost (2465) is the power supply
board that powers all electrical components, including the Cree LED, and acts as a LiPo battery
charging board at the same time. The On/Off switch is an SPST slider switch that controls the
“on/off” state of the PowerBoost. By extension, the switch controls the “on/off” state of the
entire circuit. The ATtiny45 IC is a programable microcontroller that reads the user input from
the slit button and controls the “on/off” state of the N-MOSFET, which a digital switch that
regulars current flow to the Cree LED. Additionally, the LED indicator is connected to the
PowerBoost to indicate the “on/off” status of the circuit. Lastly, the pull-down resistors are there
to prevent the flow logic state.
Figure 2.32: Electrical schematic of the self-imaging slit lamp smartphone adaptor.
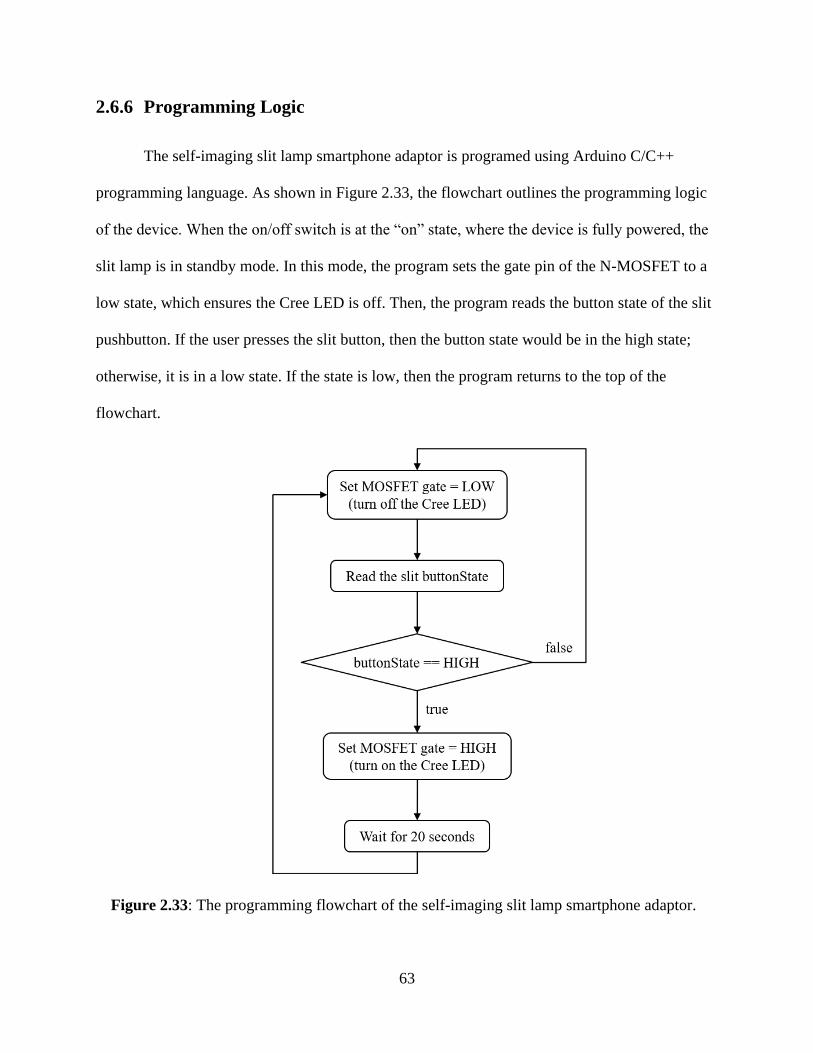
63
2.6.6 Programming Logic
The self-imaging slit lamp smartphone adaptor is programed using Arduino C/C++
programming language. As shown in Figure 2.33, the flowchart outlines the programming logic
of the device. When the on/off switch is at the “on” state, where the device is fully powered, the
slit lamp is in standby mode. In this mode, the program sets the gate pin of the N-MOSFET to a
low state, which ensures the Cree LED is off. Then, the program reads the button state of the slit
pushbutton. If the user presses the slit button, then the button state would be in the high state;
otherwise, it is in a low state. If the state is low, then the program returns to the top of the
flowchart.
Figure 2.33: The programming flowchart of the self-imaging slit lamp smartphone adaptor.
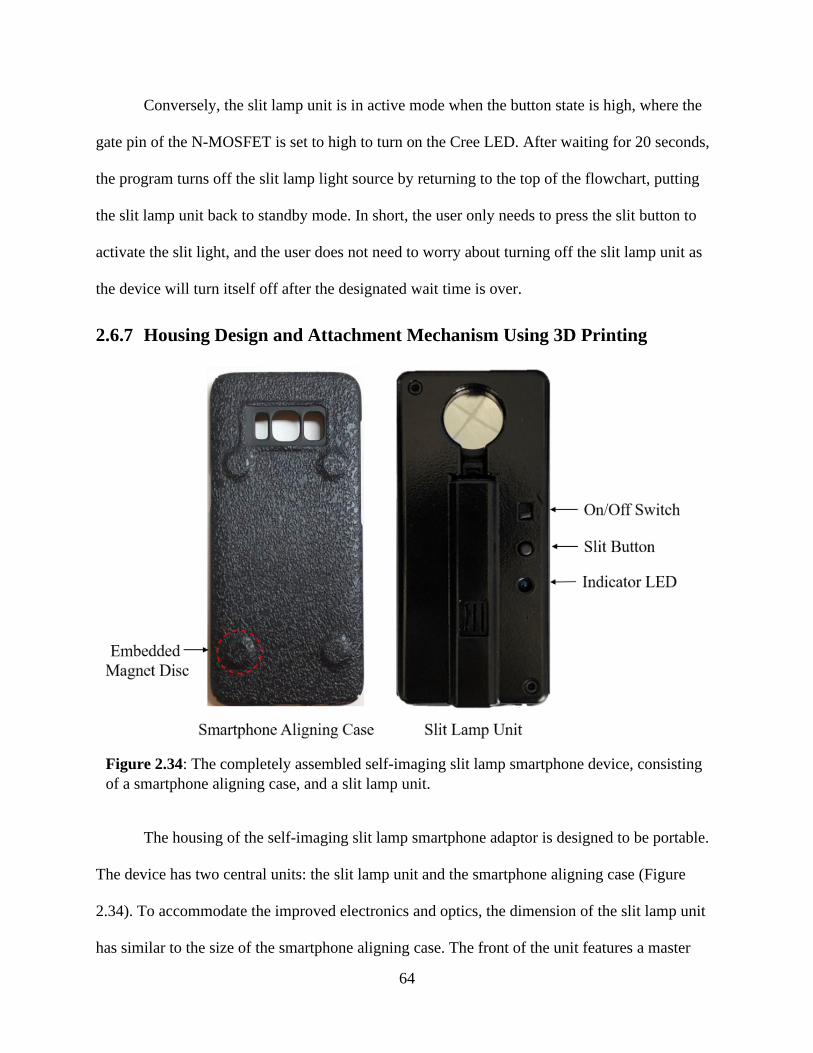
64
Conversely, the slit lamp unit is in active mode when the button state is high, where the
gate pin of the N-MOSFET is set to high to turn on the Cree LED. After waiting for 20 seconds,
the program turns off the slit lamp light source by returning to the top of the flowchart, putting
the slit lamp unit back to standby mode. In short, the user only needs to press the slit button to
activate the slit light, and the user does not need to worry about turning off the slit lamp unit as
the device will turn itself off after the designated wait time is over.
2.6.7 Housing Design and Attachment Mechanism Using 3D Printing
The housing of the self-imaging slit lamp smartphone adaptor is designed to be portable.
The device has two central units: the slit lamp unit and the smartphone aligning case (Figure
2.34). To accommodate the improved electronics and optics, the dimension of the slit lamp unit
has similar to the size of the smartphone aligning case. The front of the unit features a master
Figure 2.34: The completely assembled self-imaging slit lamp smartphone device, consisting
of a smartphone aligning case, and a slit lamp unit.
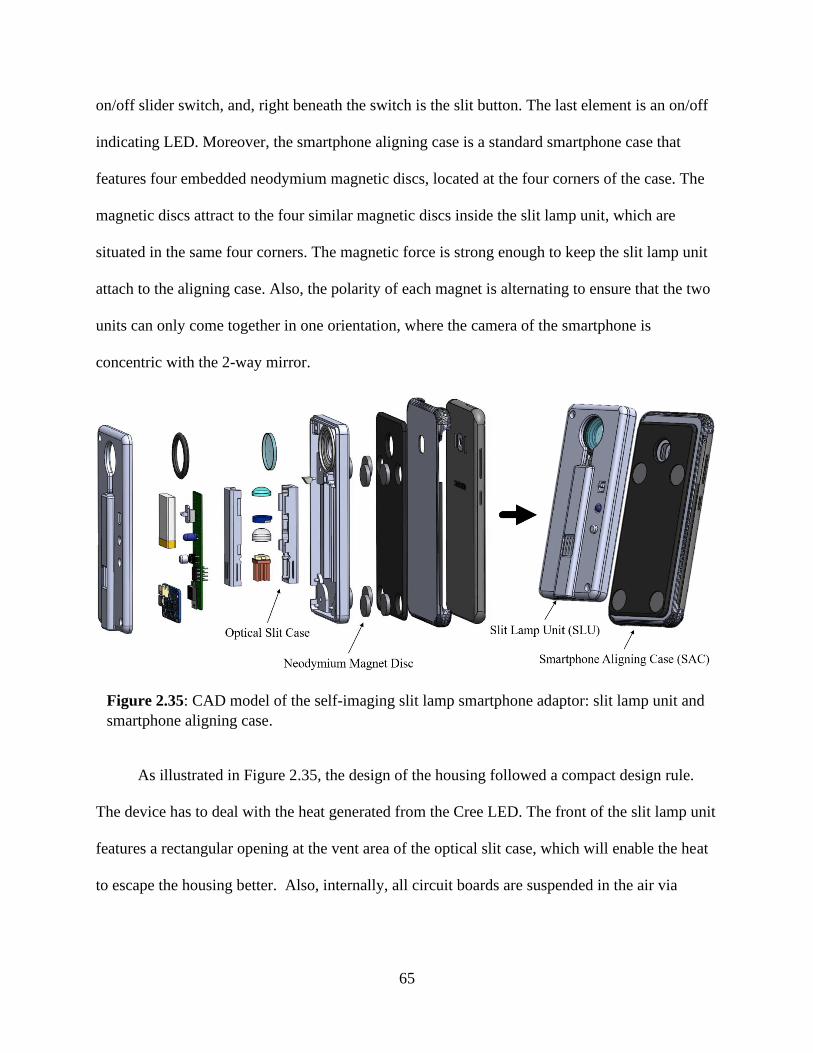
65
on/off slider switch, and, right beneath the switch is the slit button. The last element is an on/off
indicating LED. Moreover, the smartphone aligning case is a standard smartphone case that
features four embedded neodymium magnetic discs, located at the four corners of the case. The
magnetic discs attract to the four similar magnetic discs inside the slit lamp unit, which are
situated in the same four corners. The magnetic force is strong enough to keep the slit lamp unit
attach to the aligning case. Also, the polarity of each magnet is alternating to ensure that the two
units can only come together in one orientation, where the camera of the smartphone is
concentric with the 2-way mirror.
As illustrated in Figure 2.35, the design of the housing followed a compact design rule.
The device has to deal with the heat generated from the Cree LED. The front of the slit lamp unit
features a rectangular opening at the vent area of the optical slit case, which will enable the heat
to escape the housing better. Also, internally, all circuit boards are suspended in the air via
Figure 2.35: CAD model of the self-imaging slit lamp smartphone adaptor: slit lamp unit and
smartphone aligning case.
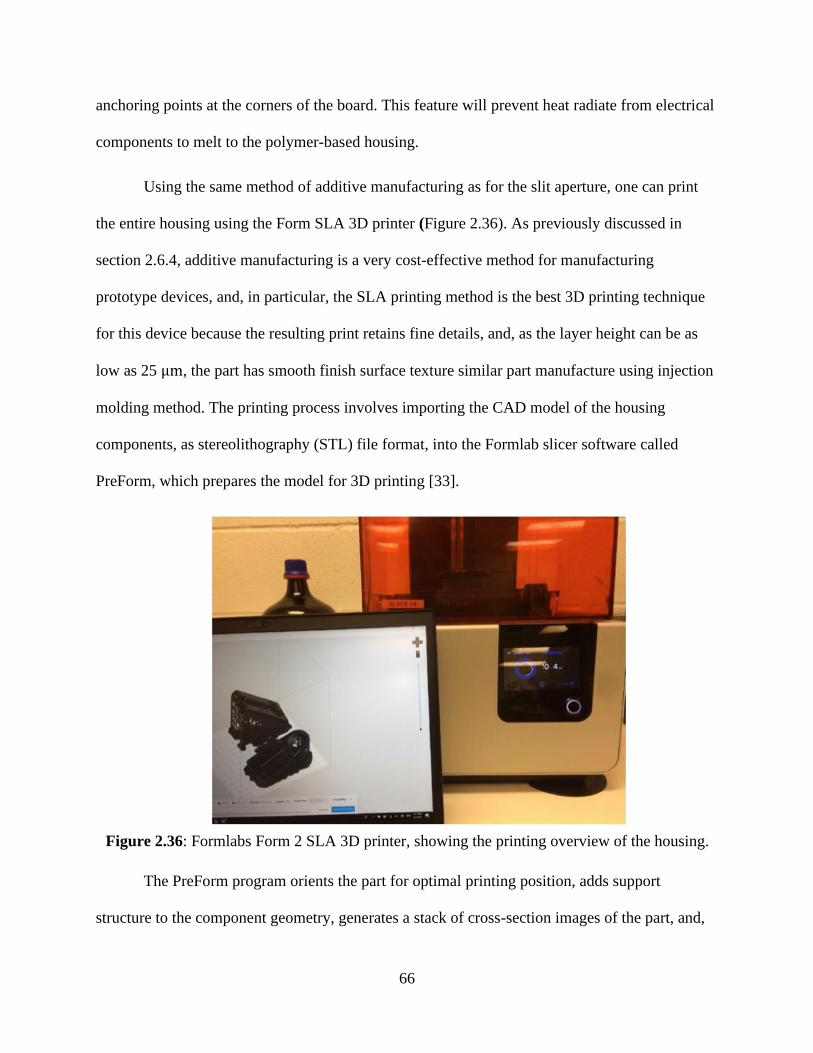
66
anchoring points at the corners of the board. This feature will prevent heat radiate from electrical
components to melt to the polymer-based housing.
Using the same method of additive manufacturing as for the slit aperture, one can print
the entire housing using the Form SLA 3D printer (Figure 2.36). As previously discussed in
section 2.6.4, additive manufacturing is a very cost-effective method for manufacturing
prototype devices, and, in particular, the SLA printing method is the best 3D printing technique
for this device because the resulting print retains fine details, and, as the layer height can be as
low as 25 μm, the part has smooth finish surface texture similar part manufacture using injection
molding method. The printing process involves importing the CAD model of the housing
components, as stereolithography (STL) file format, into the Formlab slicer software called
PreForm, which prepares the model for 3D printing [33].
The PreForm program orients the part for optimal printing position, adds support
structure to the component geometry, generates a stack of cross-section images of the part, and,
Figure 2.36: Formlabs Form 2 SLA 3D printer, showing the printing overview of the housing.

67
finally, send the stack of images to the Form 2 printer for printing. Since the printer generates the
geometry of the part layer by layer, the UV laser inside the printer traces a cross-section image of
the part onto the bottom of the resin tank. The UV laser solidifies the UV sensitive photopolymer
resin into a thin layer of polymer in the shape of the cross-section image. The first solidified
layer adheres to the build plate, and the subsequent layer sticks onto the previous layer. The
layer-by-layer printing process repeats until the part is completely printed. After a part is 3D
printed, the parts must be washed in isopropyl alcohol to remove uncured resin and exposed
again to under UV light for a short time to cure and stiffen the parts to increase their durability.
Lastly, the support structures are manually removed and polished to smooth out any support
structure artifacts.
2.6.8 Quality Assurance and Testing Result
To assess the performance of the self-imaging slit lamp smartphone adaptor, a self-
imaging slit lamp exam is conducted using the device and a Samsung S8 smartphone, as
illustrated in Figure 2.37. The device has the same “ease of use” level as the first version, where
the user simply looks into the 2-way mirror and adjust the device until the image of the user's eye
Figure 2.37: Demonstration of the self-imaging slit lamp smartphone adaptor, along with the
slit images of the left and right eye.

68
is in focus. Then, the user can capture sharply focused slit images by pressing on the volume
button of the smartphone. Lastly, the device turns itself automatically off. In Figure 2.37, typical
slit images are shown. The slit is sharply focused on the cornea of the subject. In the slit image of
the left eye, the crystalline lens is clearly visible in the center of the slit.
With the quality of the self-imaging slit lamp smartphone adaptor confirmed, the unit was
sent to NIIOS (Netherland Institute of Innovative Ocular Surgery) for a clinical trial with Dr.
Melles, a prominent ophthalmologist. A selected group of patients at the clinic would perform
slit lamp self-examinations in the presence of an ophthalmologist at the clinic. The resulting slit
images and their feedback are collected for evaluation. The resulting feedback was positive
regarding the user-friendliness and slit image quality. Also, the feedback suggested areas where
the device can be further improved to streamline the self-imaging process. A complete slit lamp
exam requires the acquisition of a number of slit images, illustrating a full sweep of the slit beam
from one side of the eye to the other side. To position the slit beam at different locations of the
cornea, the user must orient the device at a slightly different angle to shift the beam position.
This process of turning the device is difficult for a patient to perform, especially for elderly
patients. An improved device is desirable to solve this problem. We will describe an improved
device that allows for the improved acquisition of slit images in the next section using auto-
sweep.
2.7 Fabrication of Auto Sweeping Self-Imaging Slit Lamp Goggle
2.7.1 Device Overview
With the completion of the clinical test for the self-imaging slit lamp smartphone adaptor,
a new device was needed to improve self-imaging. The goal of the new portable slit lamp was to
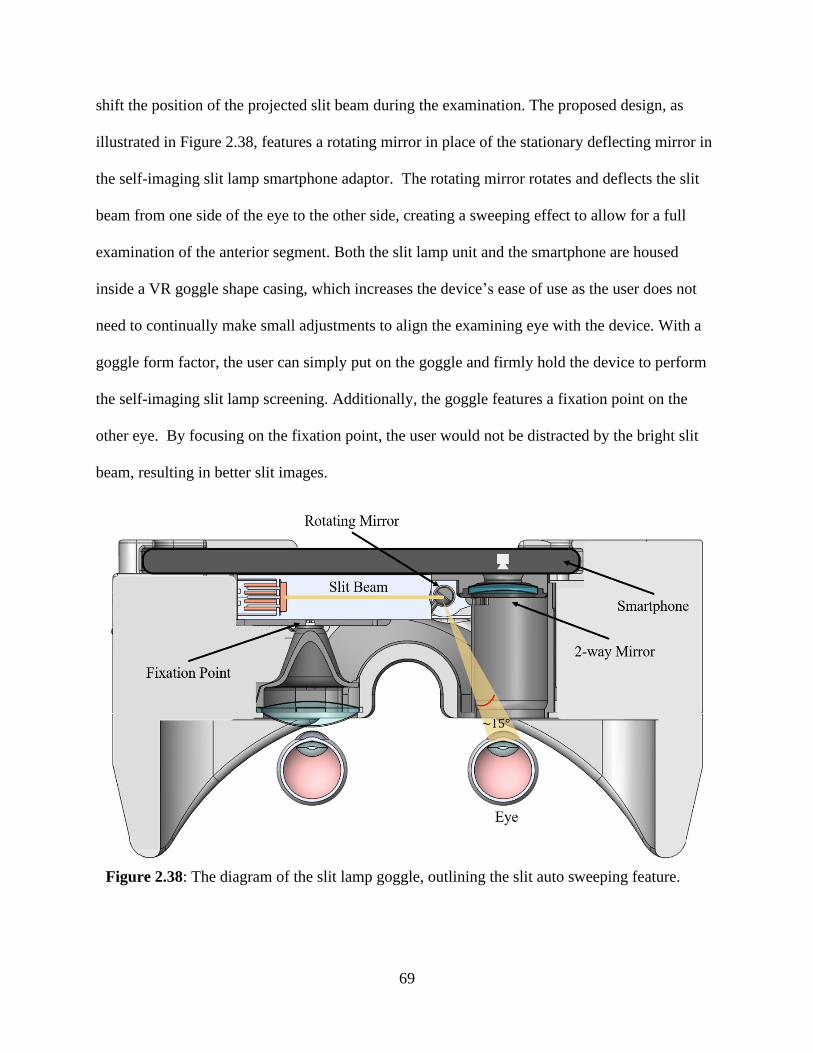
69
shift the position of the projected slit beam during the examination. The proposed design, as
illustrated in Figure 2.38, features a rotating mirror in place of the stationary deflecting mirror in
the self-imaging slit lamp smartphone adaptor. The rotating mirror rotates and deflects the slit
beam from one side of the eye to the other side, creating a sweeping effect to allow for a full
examination of the anterior segment. Both the slit lamp unit and the smartphone are housed
inside a VR goggle shape casing, which increases the device’s ease of use as the user does not
need to continually make small adjustments to align the examining eye with the device. With a
goggle form factor, the user can simply put on the goggle and firmly hold the device to perform
the self-imaging slit lamp screening. Additionally, the goggle features a fixation point on the
other eye. By focusing on the fixation point, the user would not be distracted by the bright slit
beam, resulting in better slit images.
Figure 2.38: The diagram of the slit lamp goggle, outlining the slit auto sweeping feature.
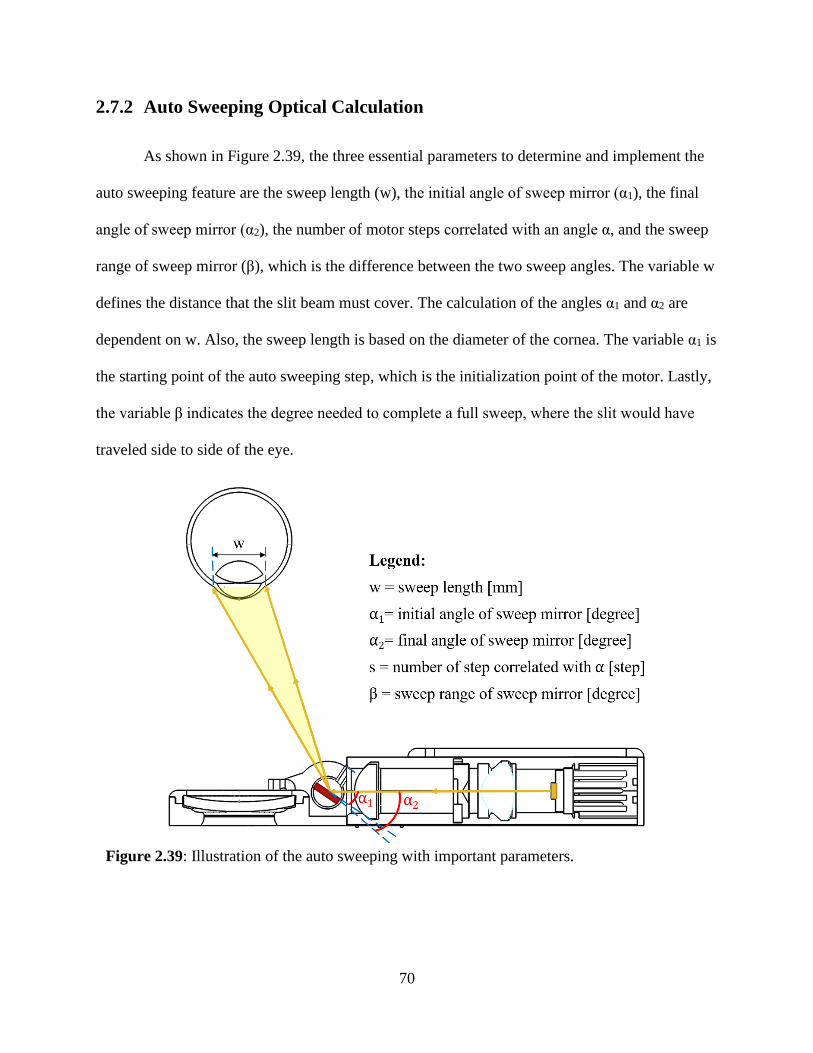
70
2.7.2 Auto Sweeping Optical Calculation
As shown in Figure 2.39, the three essential parameters to determine and implement the
auto sweeping feature are the sweep length (w), the initial angle of sweep mirror (α1), the final
angle of sweep mirror (α2), the number of motor steps correlated with an angle α, and the sweep
range of sweep mirror (β), which is the difference between the two sweep angles. The variable w
defines the distance that the slit beam must cover. The calculation of the angles α1 and α2 are
dependent on w. Also, the sweep length is based on the diameter of the cornea. The variable α1 is
the starting point of the auto sweeping step, which is the initialization point of the motor. Lastly,
the variable β indicates the degree needed to complete a full sweep, where the slit would have
traveled side to side of the eye.
Figure 2.39: Illustration of the auto sweeping with important parameters.
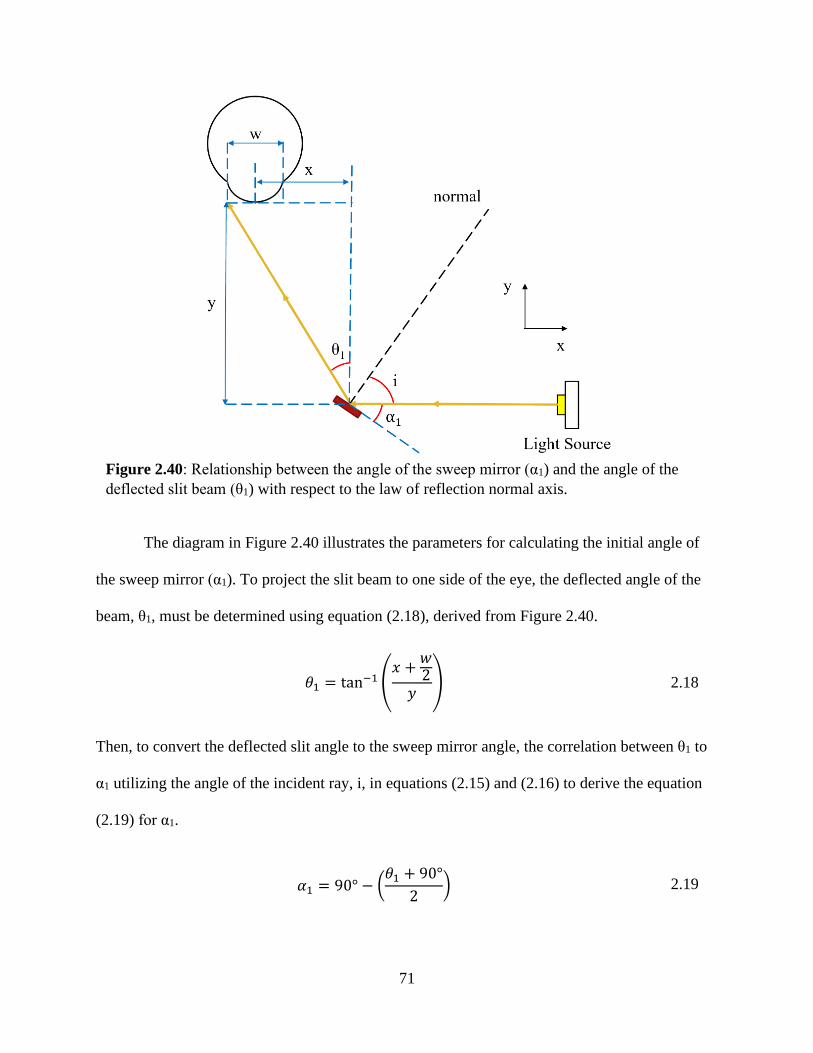
71
The diagram in Figure 2.40 illustrates the parameters for calculating the initial angle of
the sweep mirror (α1). To project the slit beam to one side of the eye, the deflected angle of the
beam, θ1, must be determined using equation (2.18), derived from Figure 2.40.
𝜃1 = tan−1 (𝑥 +
𝑤2
𝑦) 2.18
Then, to convert the deflected slit angle to the sweep mirror angle, the correlation between θ1 to
α1 utilizing the angle of the incident ray, i, in equations (2.15) and (2.16) to derive the equation
(2.19) for α1.
𝛼1 = 90° − (𝜃1 + 90°
2) 2.19
Figure 2.40: Relationship between the angle of the sweep mirror (α1) and the angle of the
deflected slit beam (θ1) with respect to the law of reflection normal axis.
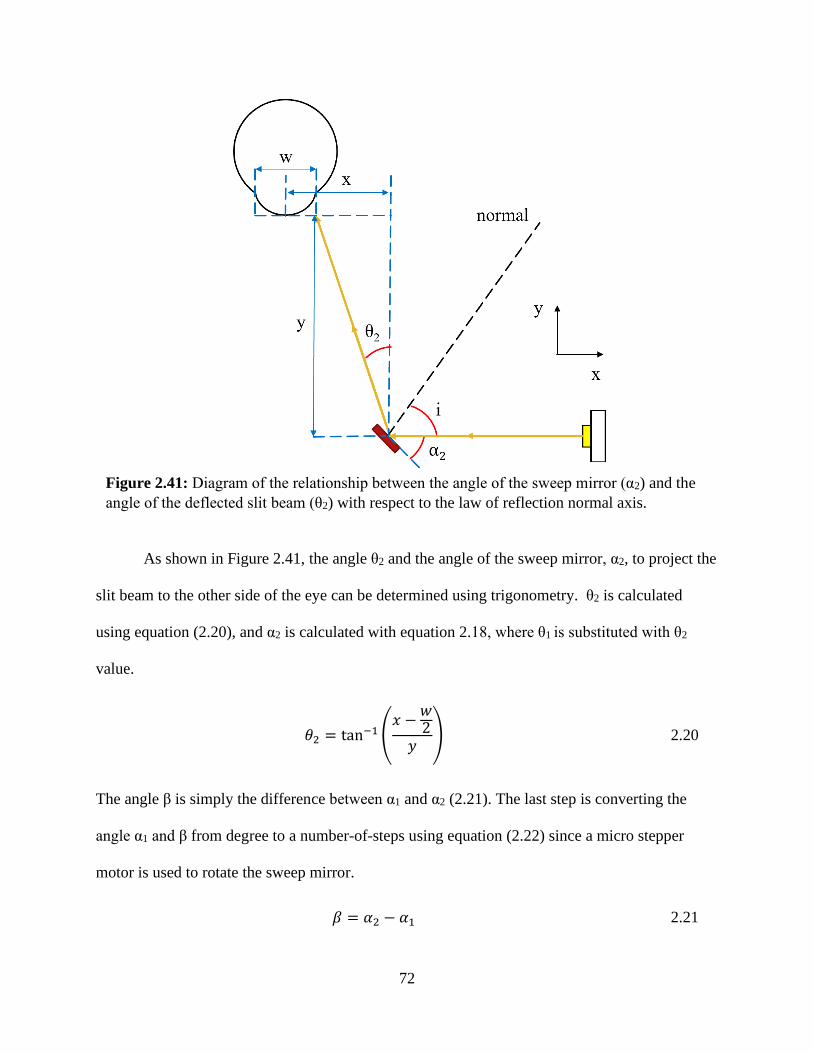
72
As shown in Figure 2.41, the angle θ2 and the angle of the sweep mirror, α2, to project the
slit beam to the other side of the eye can be determined using trigonometry. θ2 is calculated
using equation (2.20), and α2 is calculated with equation 2.18, where θ1 is substituted with θ2
value.
𝜃2 = tan−1 (𝑥 −
𝑤2
𝑦) 2.20
The angle β is simply the difference between α1 and α2 (2.21). The last step is converting the
angle α1 and β from degree to a number-of-steps using equation (2.22) since a micro stepper
motor is used to rotate the sweep mirror.
𝛽 = 𝛼2 − 𝛼1 2.21
Figure 2.41: Diagram of the relationship between the angle of the sweep mirror (α2) and the
angle of the deflected slit beam (θ2) with respect to the law of reflection normal axis.
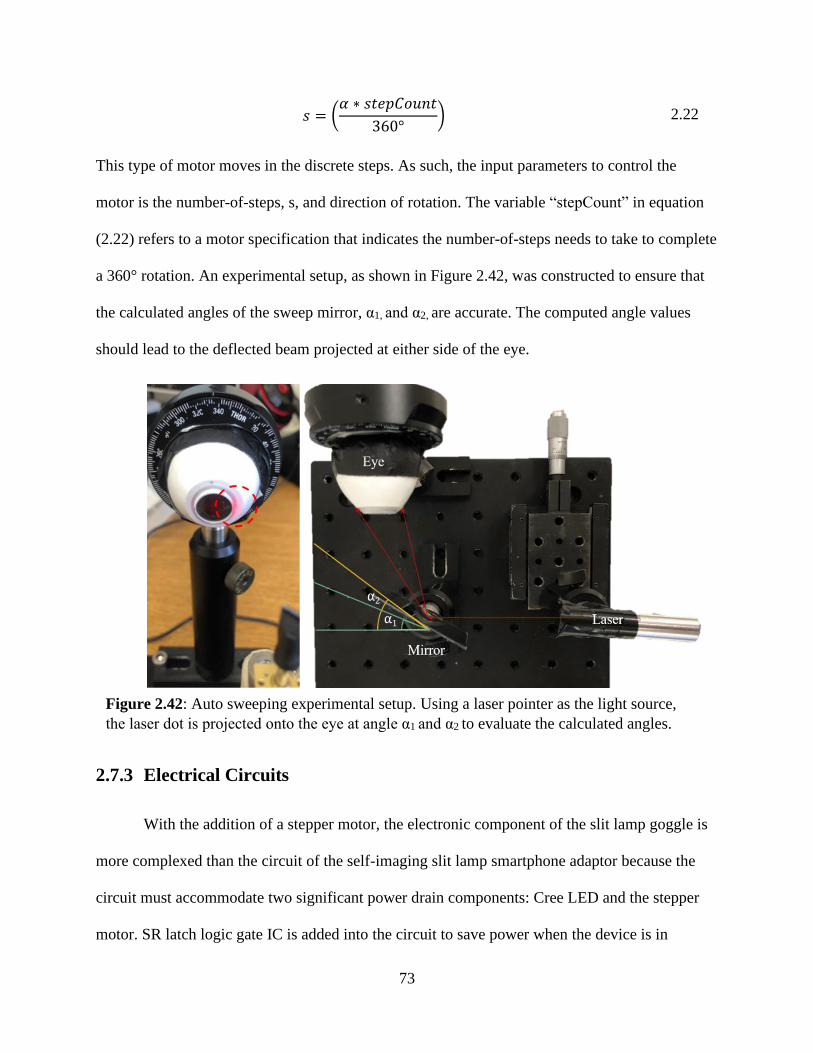
73
𝑠 = (𝛼 ∗ 𝑠𝑡𝑒𝑝𝐶𝑜𝑢𝑛𝑡
360°) 2.22
This type of motor moves in the discrete steps. As such, the input parameters to control the
motor is the number-of-steps, s, and direction of rotation. The variable “stepCount” in equation
(2.22) refers to a motor specification that indicates the number-of-steps needs to take to complete
a 360° rotation. An experimental setup, as shown in Figure 2.42, was constructed to ensure that
the calculated angles of the sweep mirror, α1, and α2, are accurate. The computed angle values
should lead to the deflected beam projected at either side of the eye.
2.7.3 Electrical Circuits
With the addition of a stepper motor, the electronic component of the slit lamp goggle is
more complexed than the circuit of the self-imaging slit lamp smartphone adaptor because the
circuit must accommodate two significant power drain components: Cree LED and the stepper
motor. SR latch logic gate IC is added into the circuit to save power when the device is in
Figure 2.42: Auto sweeping experimental setup. Using a laser pointer as the light source,
the laser dot is projected onto the eye at angle α1 and α2 to evaluate the calculated angles.

74
standby mode. During standby mode, the SR latch chip is the only electronic part that draws
power directly from the power source (battery). Using a significantly small amount of energy,
this chip keeps the entire circuit off and turns it on when the user presses the slit button, initiating
the slit lamp examination. As illustrated in Figure 2.43, both the Cree LED and the motor draw
power from the PowerBoost board, which is the same power supply PCB as in the self-imaging
slit lamp smartphone adaptor. However, a constant current regulator board is added in between
the PowerBoost, and the Cree LED to maintain a continuous current of 700 mA flowing to the
LED. This regulator will prevent potential current fluctuation from impacting the LED
performance as the motor tends to draw substantial power when running.
Additionally, a potentiometer dial and an N-MOSFET chip are added into the system to
allow for brightness control of the Cree LED. On the motor side, a stepper motor driver (A4988)
is added in conjunction with a microcontroller (Arduino Nano) to control the motor. Also, a limit
Figure 2.43: Slit lamp goggle electrical schematic.
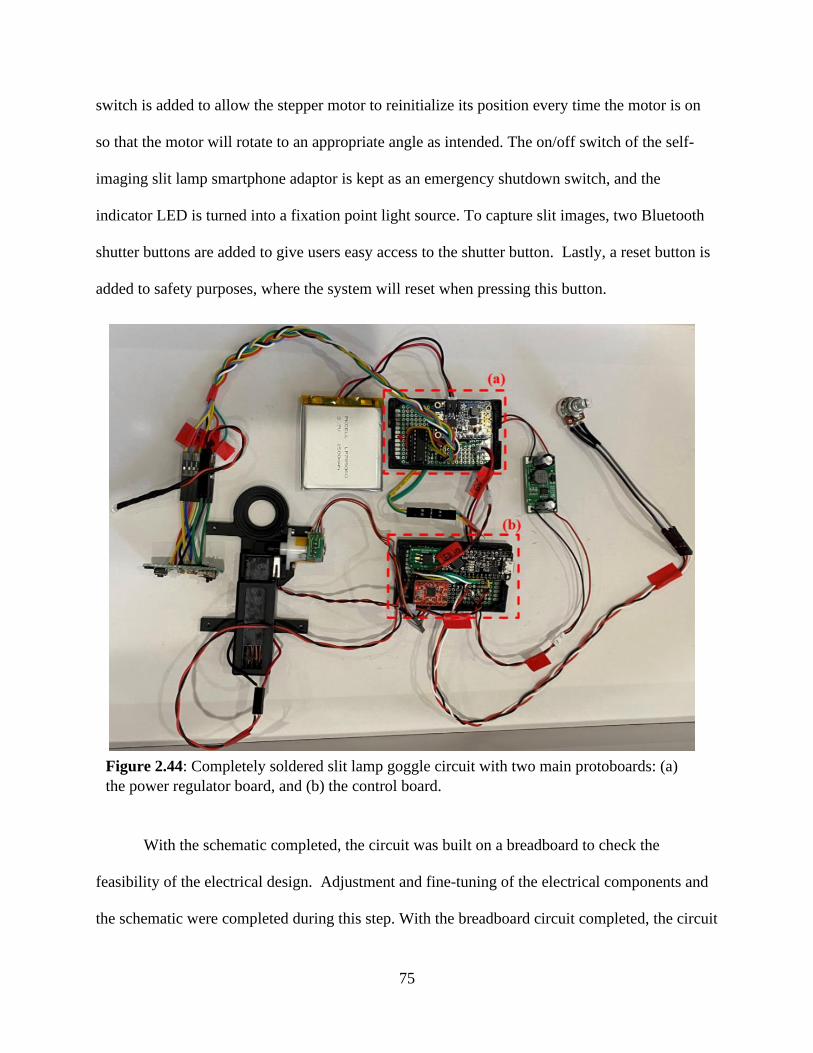
75
switch is added to allow the stepper motor to reinitialize its position every time the motor is on
so that the motor will rotate to an appropriate angle as intended. The on/off switch of the self-
imaging slit lamp smartphone adaptor is kept as an emergency shutdown switch, and the
indicator LED is turned into a fixation point light source. To capture slit images, two Bluetooth
shutter buttons are added to give users easy access to the shutter button. Lastly, a reset button is
added to safety purposes, where the system will reset when pressing this button.
With the schematic completed, the circuit was built on a breadboard to check the
feasibility of the electrical design. Adjustment and fine-tuning of the electrical components and
the schematic were completed during this step. With the breadboard circuit completed, the circuit
Figure 2.44: Completely soldered slit lamp goggle circuit with two main protoboards: (a)
the power regulator board, and (b) the control board.
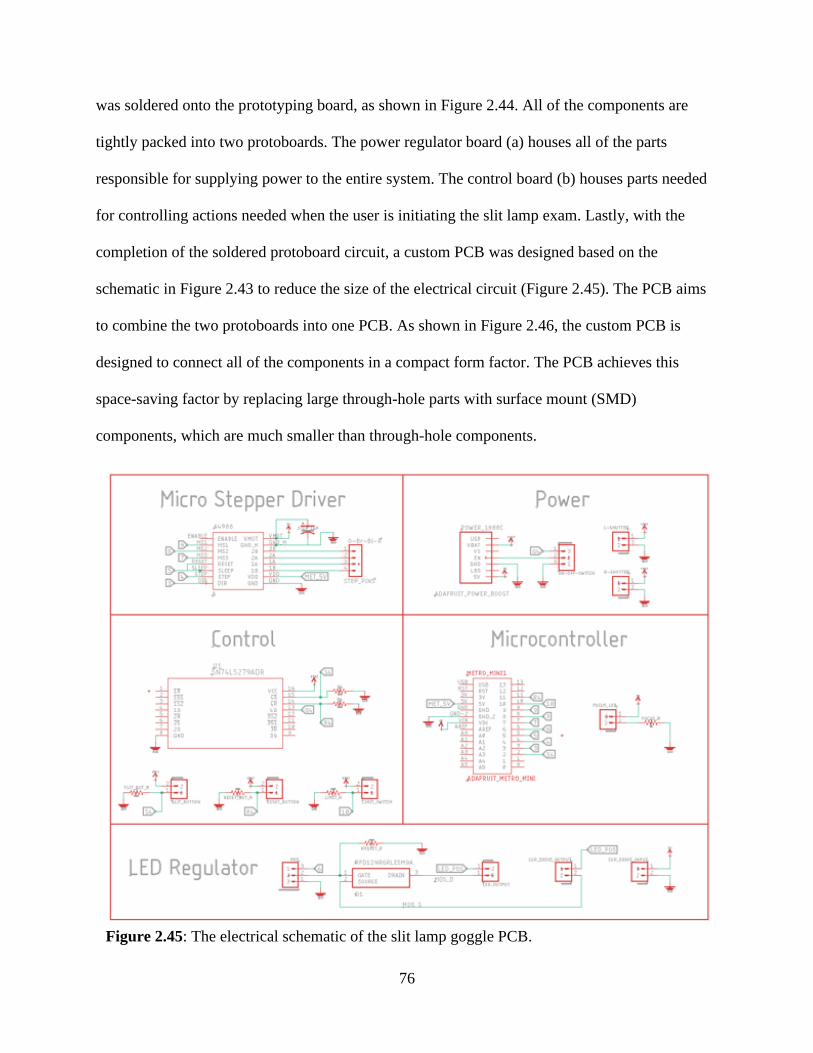
76
was soldered onto the prototyping board, as shown in Figure 2.44. All of the components are
tightly packed into two protoboards. The power regulator board (a) houses all of the parts
responsible for supplying power to the entire system. The control board (b) houses parts needed
for controlling actions needed when the user is initiating the slit lamp exam. Lastly, with the
completion of the soldered protoboard circuit, a custom PCB was designed based on the
schematic in Figure 2.43 to reduce the size of the electrical circuit (Figure 2.45). The PCB aims
to combine the two protoboards into one PCB. As shown in Figure 2.46, the custom PCB is
designed to connect all of the components in a compact form factor. The PCB achieves this
space-saving factor by replacing large through-hole parts with surface mount (SMD)
components, which are much smaller than through-hole components.
Figure 2.45: The electrical schematic of the slit lamp goggle PCB.
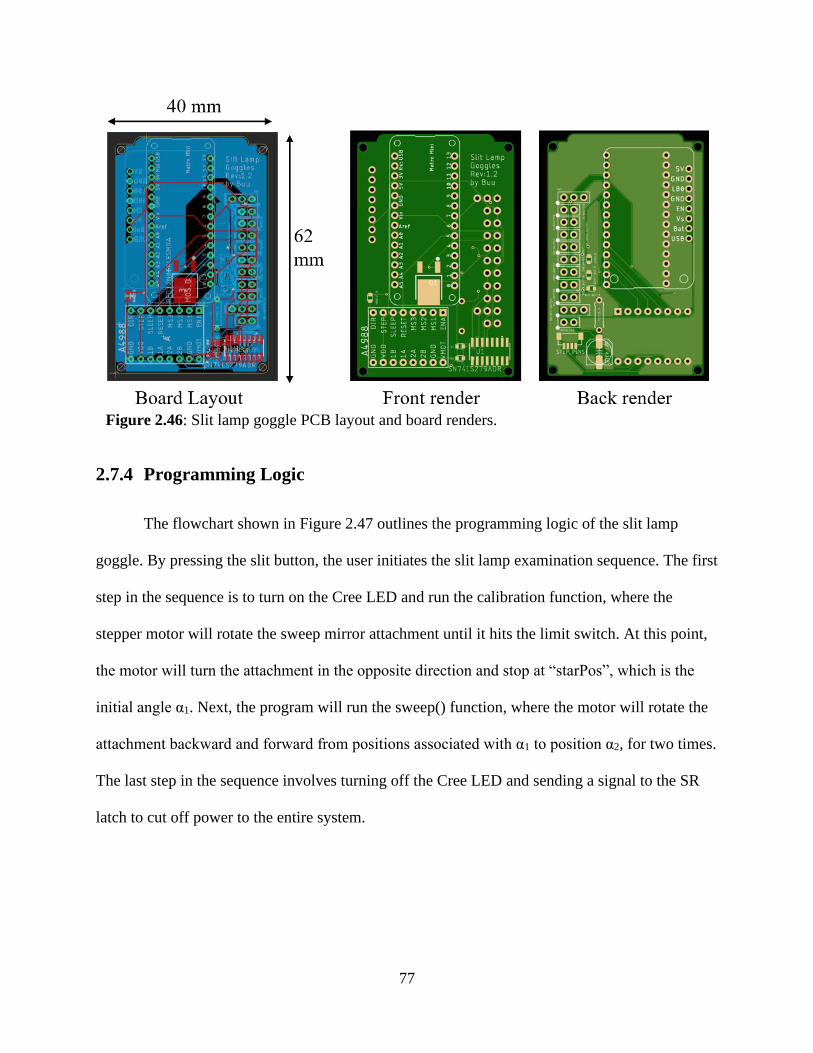
77
2.7.4 Programming Logic
The flowchart shown in Figure 2.47 outlines the programming logic of the slit lamp
goggle. By pressing the slit button, the user initiates the slit lamp examination sequence. The first
step in the sequence is to turn on the Cree LED and run the calibration function, where the
stepper motor will rotate the sweep mirror attachment until it hits the limit switch. At this point,
the motor will turn the attachment in the opposite direction and stop at “starPos”, which is the
initial angle α1. Next, the program will run the sweep() function, where the motor will rotate the
attachment backward and forward from positions associated with α1 to position α2, for two times.
The last step in the sequence involves turning off the Cree LED and sending a signal to the SR
latch to cut off power to the entire system.
Figure 2.46: Slit lamp goggle PCB layout and board renders.
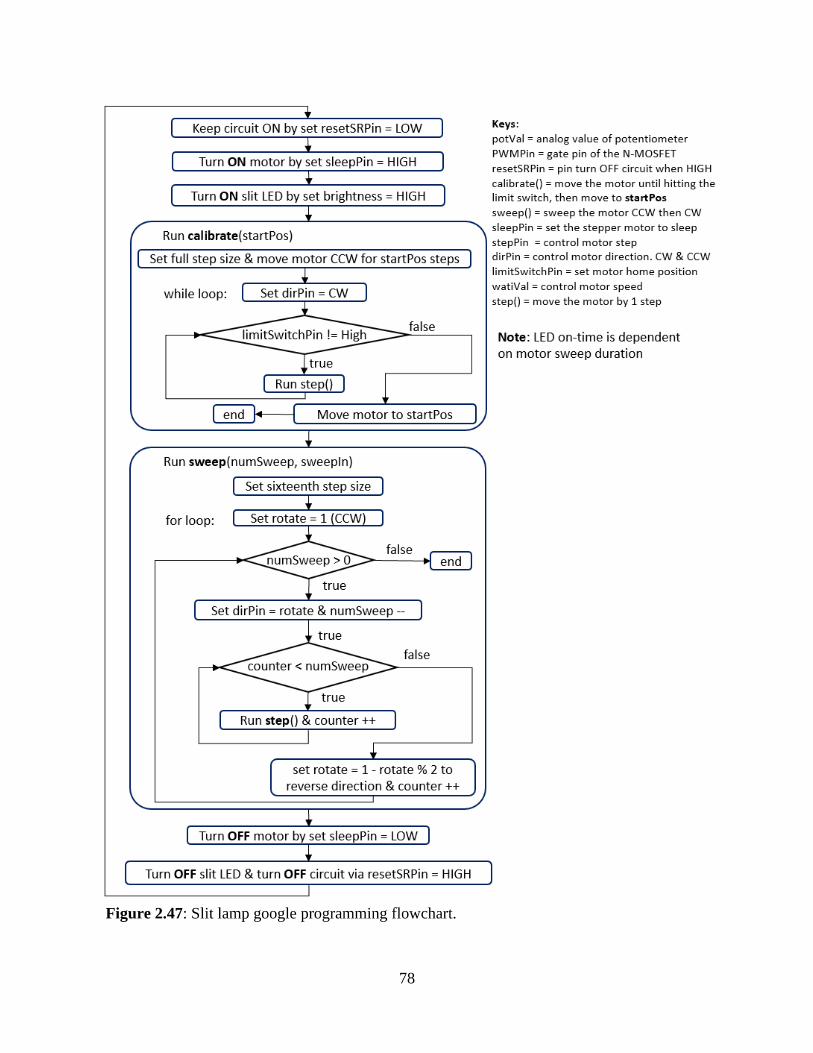
78
Figure 2.47: Slit lamp google programming flowchart.
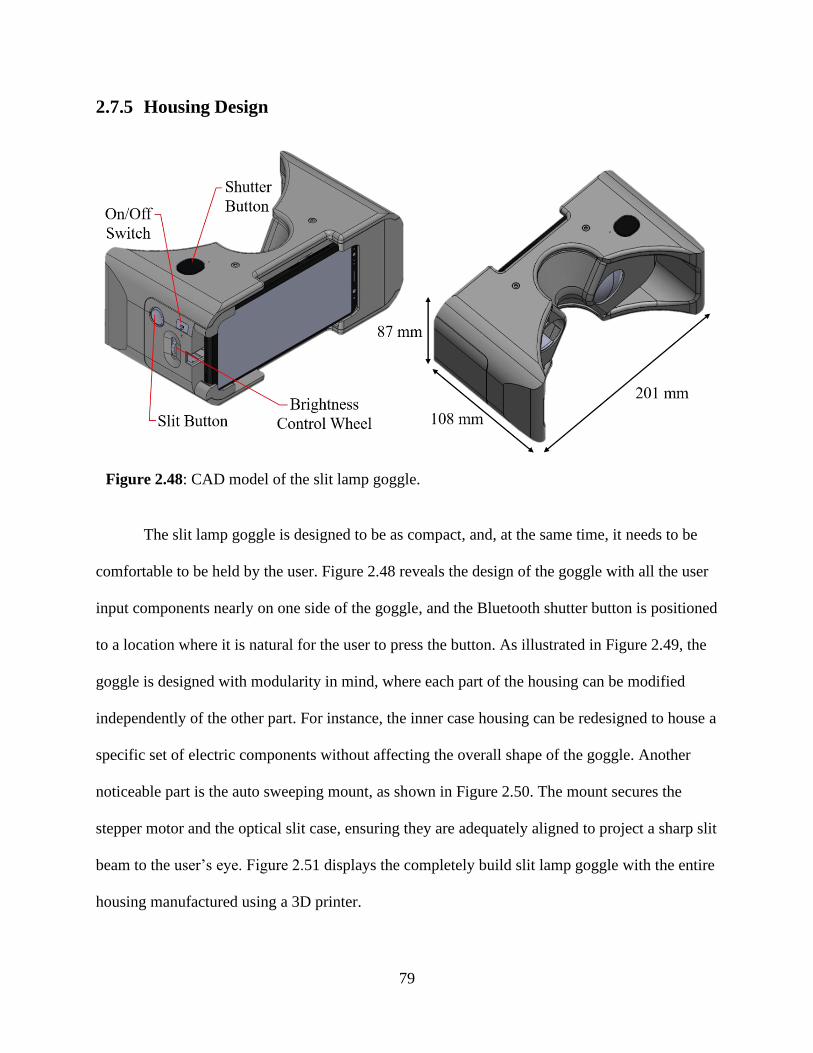
79
2.7.5 Housing Design
The slit lamp goggle is designed to be as compact, and, at the same time, it needs to be
comfortable to be held by the user. Figure 2.48 reveals the design of the goggle with all the user
input components nearly on one side of the goggle, and the Bluetooth shutter button is positioned
to a location where it is natural for the user to press the button. As illustrated in Figure 2.49, the
goggle is designed with modularity in mind, where each part of the housing can be modified
independently of the other part. For instance, the inner case housing can be redesigned to house a
specific set of electric components without affecting the overall shape of the goggle. Another
noticeable part is the auto sweeping mount, as shown in Figure 2.50. The mount secures the
stepper motor and the optical slit case, ensuring they are adequately aligned to project a sharp slit
beam to the user’s eye. Figure 2.51 displays the completely build slit lamp goggle with the entire
housing manufactured using a 3D printer.
Figure 2.48: CAD model of the slit lamp goggle.
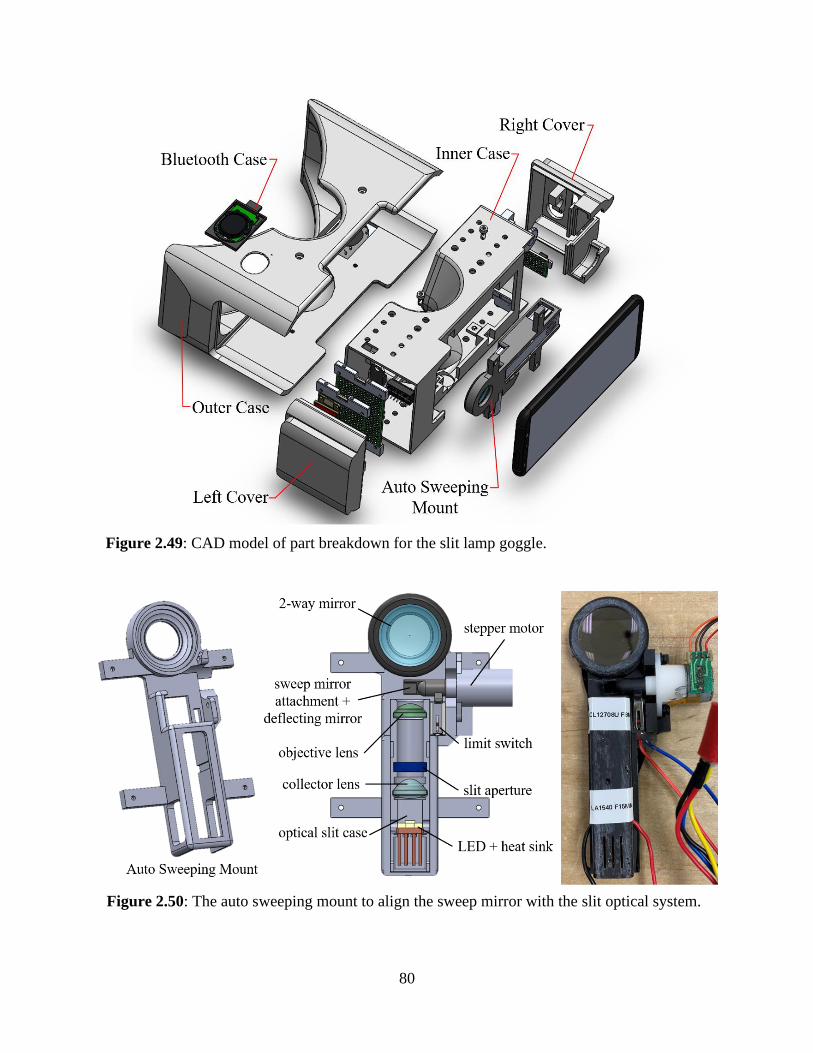
80
Figure 2.49: CAD model of part breakdown for the slit lamp goggle.
Figure 2.50: The auto sweeping mount to align the sweep mirror with the slit optical system.
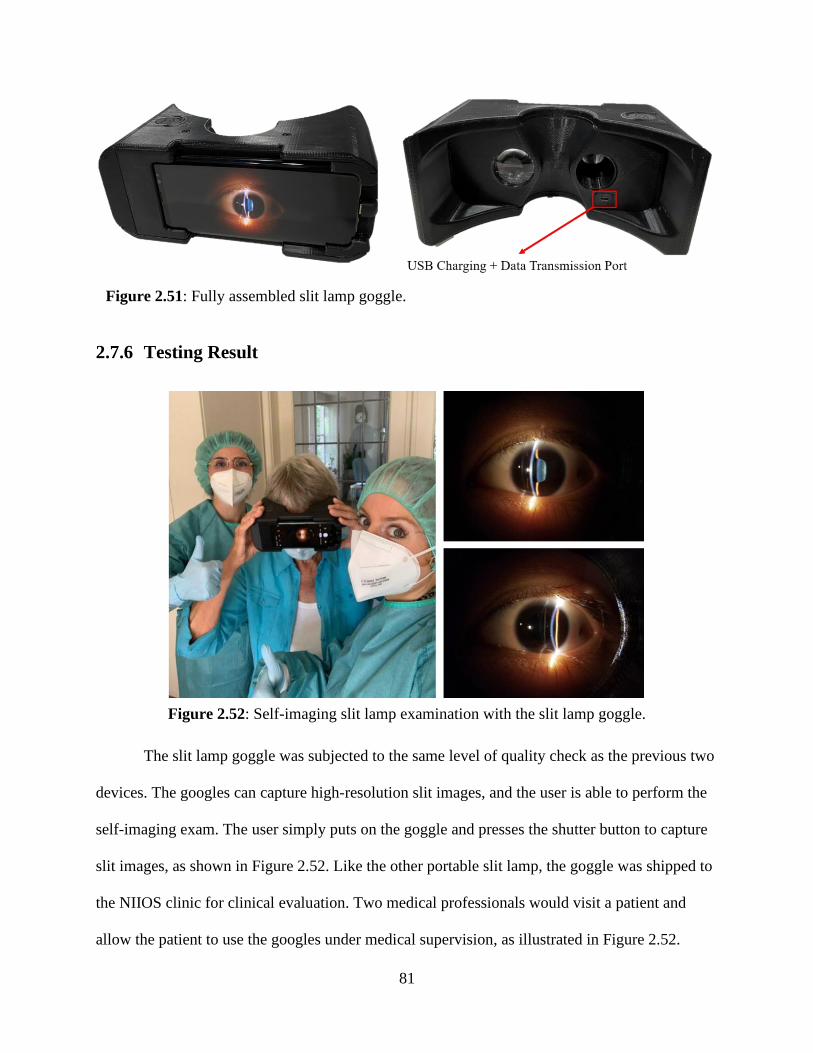
81
2.7.6 Testing Result
The slit lamp goggle was subjected to the same level of quality check as the previous two
devices. The googles can capture high-resolution slit images, and the user is able to perform the
self-imaging exam. The user simply puts on the goggle and presses the shutter button to capture
slit images, as shown in Figure 2.52. Like the other portable slit lamp, the goggle was shipped to
the NIIOS clinic for clinical evaluation. Two medical professionals would visit a patient and
allow the patient to use the googles under medical supervision, as illustrated in Figure 2.52.
Figure 2.51: Fully assembled slit lamp goggle.
Figure 2.52: Self-imaging slit lamp examination with the slit lamp goggle.
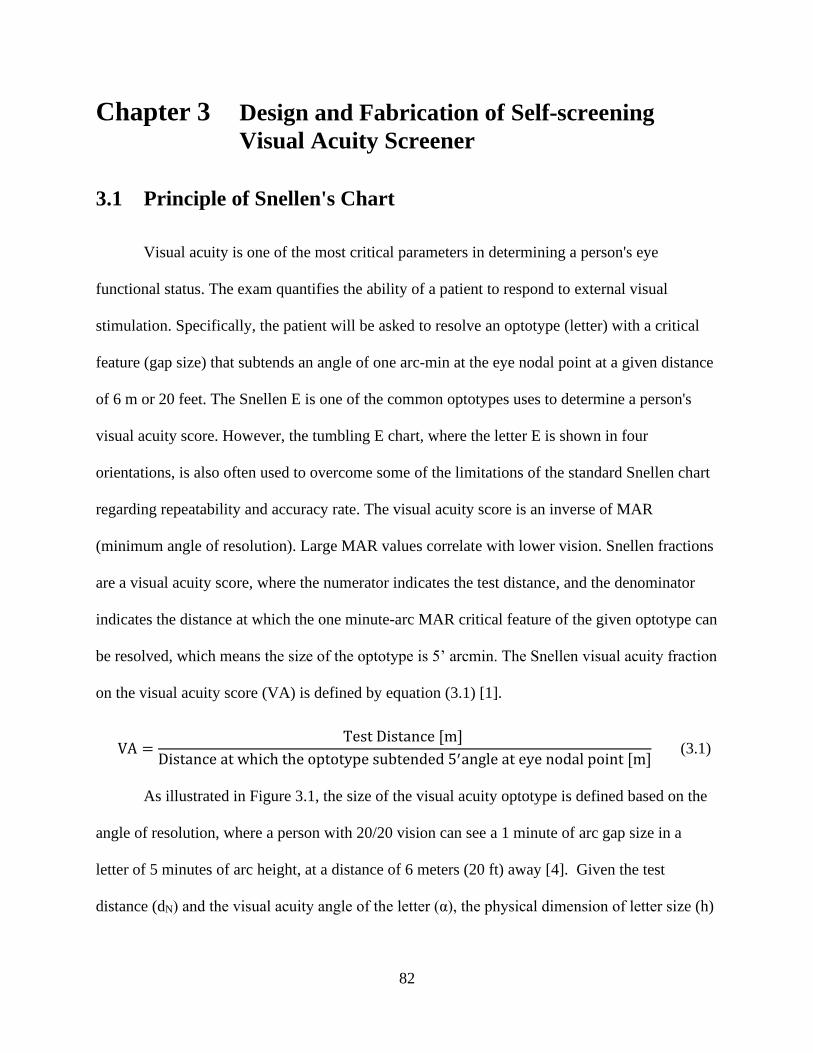
82
Chapter 3 Design and Fabrication of Self-screening
Visual Acuity Screener
3.1 Principle of Snellen's Chart
Visual acuity is one of the most critical parameters in determining a person's eye
functional status. The exam quantifies the ability of a patient to respond to external visual
stimulation. Specifically, the patient will be asked to resolve an optotype (letter) with a critical
feature (gap size) that subtends an angle of one arc-min at the eye nodal point at a given distance
of 6 m or 20 feet. The Snellen E is one of the common optotypes uses to determine a person's
visual acuity score. However, the tumbling E chart, where the letter E is shown in four
orientations, is also often used to overcome some of the limitations of the standard Snellen chart
regarding repeatability and accuracy rate. The visual acuity score is an inverse of MAR
(minimum angle of resolution). Large MAR values correlate with lower vision. Snellen fractions
are a visual acuity score, where the numerator indicates the test distance, and the denominator
indicates the distance at which the one minute-arc MAR critical feature of the given optotype can
be resolved, which means the size of the optotype is 5’ arcmin. The Snellen visual acuity fraction
on the visual acuity score (VA) is defined by equation (3.1) [1].
VA =Test Distance [m]
Distance at which the optotype subtended 5′angle at eye nodal point [m] (3.1)
As illustrated in Figure 3.1, the size of the visual acuity optotype is defined based on the
angle of resolution, where a person with 20/20 vision can see a 1 minute of arc gap size in a
letter of 5 minutes of arc height, at a distance of 6 meters (20 ft) away [4]. Given the test
distance (dN) and the visual acuity angle of the letter (α), the physical dimension of letter size (h)
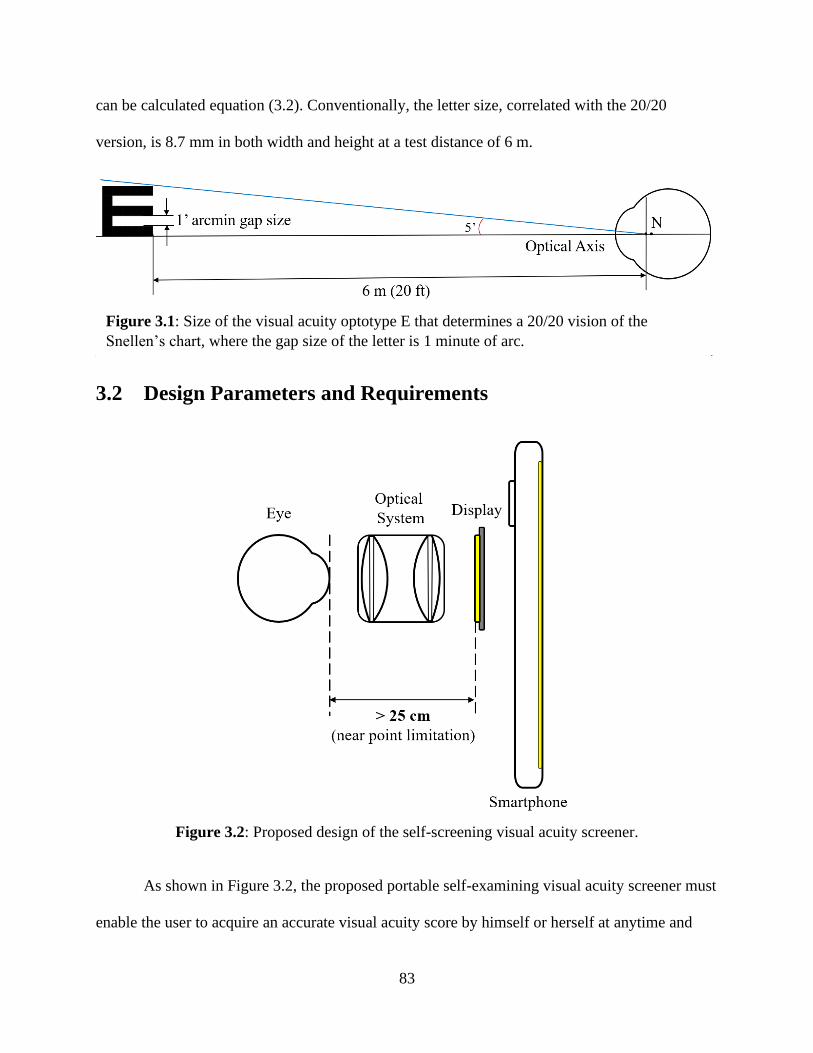
83
can be calculated equation (3.2). Conventionally, the letter size, correlated with the 20/20
version, is 8.7 mm in both width and height at a test distance of 6 m.
3.2 Design Parameters and Requirements
As shown in Figure 3.2, the proposed portable self-examining visual acuity screener must
enable the user to acquire an accurate visual acuity score by himself or herself at anytime and
Figure 3.1: Size of the visual acuity optotype E that determines a 20/20 vision of the
Snellen’s chart, where the gap size of the letter is 1 minute of arc.
Figure 3.2: Proposed design of the self-screening visual acuity screener.
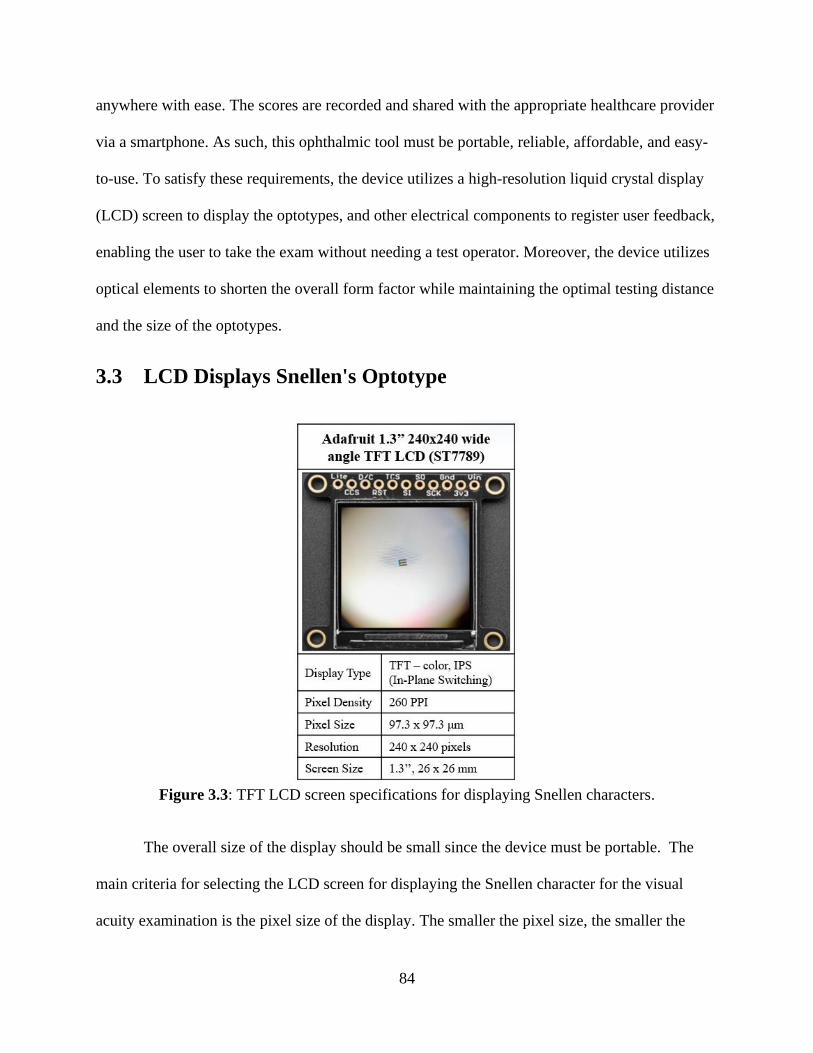
84
anywhere with ease. The scores are recorded and shared with the appropriate healthcare provider
via a smartphone. As such, this ophthalmic tool must be portable, reliable, affordable, and easy-
to-use. To satisfy these requirements, the device utilizes a high-resolution liquid crystal display
(LCD) screen to display the optotypes, and other electrical components to register user feedback,
enabling the user to take the exam without needing a test operator. Moreover, the device utilizes
optical elements to shorten the overall form factor while maintaining the optimal testing distance
and the size of the optotypes.
3.3 LCD Displays Snellen's Optotype
The overall size of the display should be small since the device must be portable. The
main criteria for selecting the LCD screen for displaying the Snellen character for the visual
acuity examination is the pixel size of the display. The smaller the pixel size, the smaller the
Figure 3.3: TFT LCD screen specifications for displaying Snellen characters.
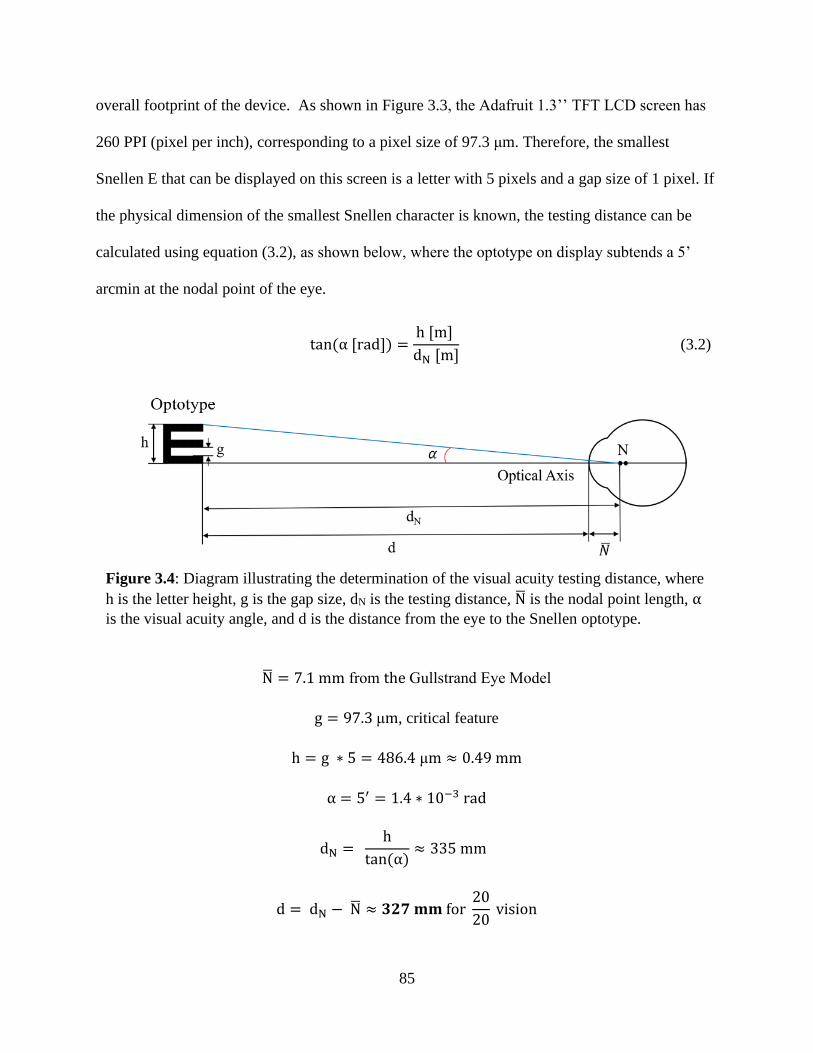
85
overall footprint of the device. As shown in Figure 3.3, the Adafruit 1.3’’ TFT LCD screen has
260 PPI (pixel per inch), corresponding to a pixel size of 97.3 μm. Therefore, the smallest
Snellen E that can be displayed on this screen is a letter with 5 pixels and a gap size of 1 pixel. If
the physical dimension of the smallest Snellen character is known, the testing distance can be
calculated using equation (3.2), as shown below, where the optotype on display subtends a 5’
arcmin at the nodal point of the eye.
tan(α [rad]) =h [m]
dN [m] (3.2)
N̅ = 7.1 mm from the Gullstrand Eye Model
g = 97.3 μm, critical feature
h = g ∗ 5 = 486.4 μm ≈ 0.49 mm
α = 5′ = 1.4 ∗ 10−3 rad
dN = h
tan(α)≈ 335 mm
d = dN − N̅ ≈ 𝟑𝟐𝟕 𝐦𝐦 for 20
20 vision
Figure 3.4: Diagram illustrating the determination of the visual acuity testing distance, where
h is the letter height, g is the gap size, dN is the testing distance, N̅ is the nodal point length, α
is the visual acuity angle, and d is the distance from the eye to the Snellen optotype.

86
The length of the nodal point N̅ is obtained for the Gullstrand Eye Model (Table1.1).
Given the pixel size of the screen, the height of the smallest letter is simply five times the pixel
size, so the gap size (g) of the letter is equal to the size of one pixel (97.3 μm). Looking at
Figure 3.4, the testing distance, dN, is determined based on the letter height, h, and the visual
acuity angle, α, using equation (3.2). Subtracting the known distance of the nodal point to the
cornea, N̅, from the length dN gives the length where the LCD screen can be placed from the eye
to perform the visual acuity test. In other words, if a patient can distinguish the smallest Snellen
E character of five pixels height displays on the Adafruit LCD screen at 327 mm away from his
or her eye, then the patient has a 20/20 (6/6) visual acuity score.
3.4 Optical Configuration and Calculation for Single-lens Screener
Holding a device at exactly 327 mm away from the eye to perform the visual acuity exam
is not practical. So, optical elements can be used to shorten the physical testing distance of the
device, where the LCD screen can be physically placed as close as possible to the eye, and the
optotypes are projected far away from the eye at the correct testing distance. Another reason for
using lenses to project the image of the optotype far away from the eye is to overcome the near
point limit of the eye. That is to say, the human eye has a region where it cannot accommodate
to focus on an object within this region. The near point defines the farthest distance from the eye
where an object within this range will appear blurry, i.e., at closed proximity, the eye cannot
focus the image of the object onto the retina. For normal vision, the closest point at which an
object can be placed and still form a sharp image on the retina is about 25 cm from the eye [10].
The near point limitation of a person increases as the person grows older.

87
As illustrated in Figure 3.5, a positive converging lens is used to project a visual image of
a Snellen E letter further away from the eye. This increases the testing distance, dN, and shortens
the physical length of the device, d, which overcomes the eye near point limitation. The focal
length of the lens is the distance from the focal point, f, to the principal plane of the lens. As
long as the object distance, do, is shorter than the focal length of the lens, then a larger upright
visual image of the object will appear on the same side as the object with the image distance, di,
longer than the object distance. Furthermore, as do approaches the focal length, the image
distance will increase exponentially, as shown in Figure 3.6.
Figure 3.5: Diagram illustrating the projection of the Snellen E optotype on the LCD screen
at a greater distance using a position converging lens, where f is the focal point of the lens, do
is the distance of the object (LCD screen) to the principal plane of the positive lens, di is the
distance of the image to the principal plane, ho is the height of the object, and hi is the height
of the image.
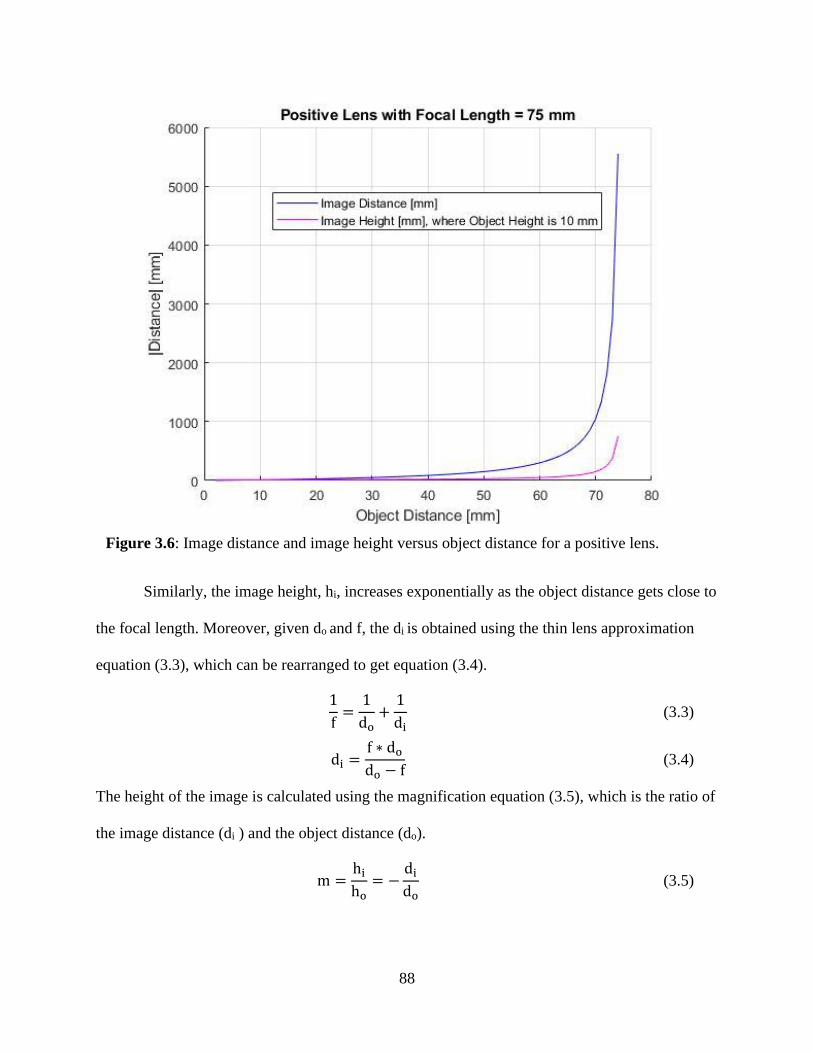
88
Similarly, the image height, hi, increases exponentially as the object distance gets close to
the focal length. Moreover, given do and f, the di is obtained using the thin lens approximation
equation (3.3), which can be rearranged to get equation (3.4).
1
f=
1
do+
1
di (3.3)
di =f ∗ do
do − f (3.4)
The height of the image is calculated using the magnification equation (3.5), which is the ratio of
the image distance (di ) and the object distance (do).
m =hi
ho= −
di
do (3.5)
Figure 3.6: Image distance and image height versus object distance for a positive lens.
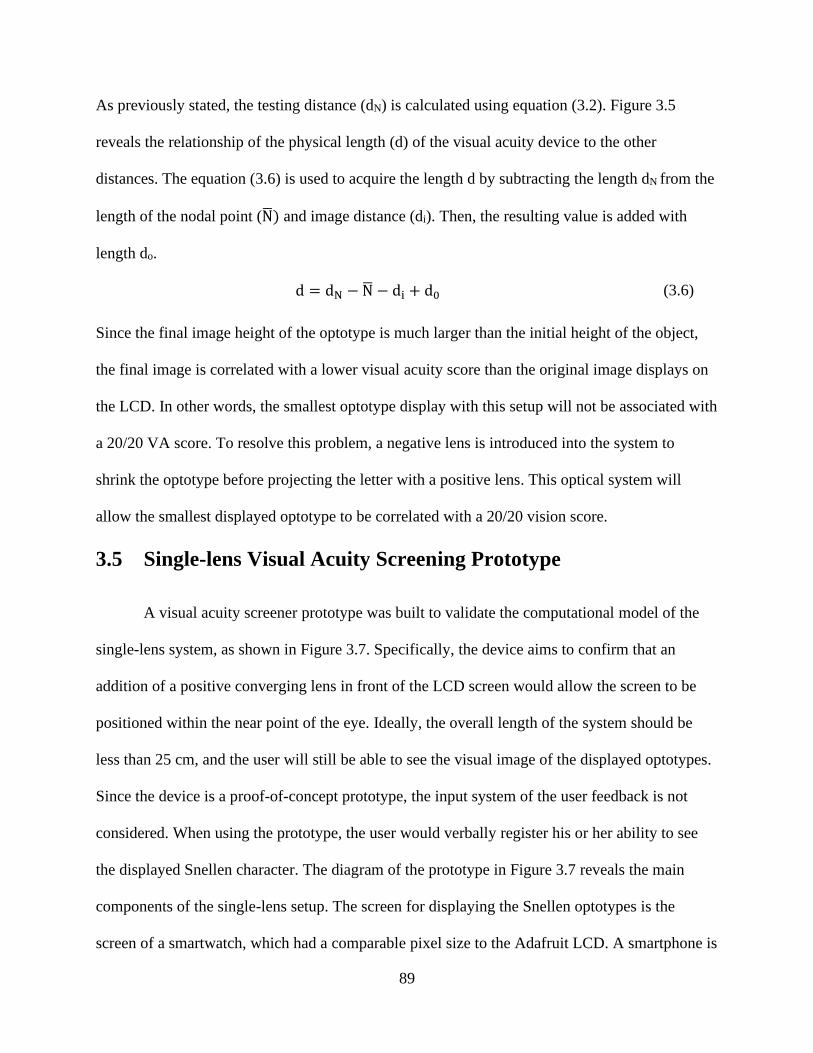
89
As previously stated, the testing distance (dN) is calculated using equation (3.2). Figure 3.5
reveals the relationship of the physical length (d) of the visual acuity device to the other
distances. The equation (3.6) is used to acquire the length d by subtracting the length dN from the
length of the nodal point (N̅) and image distance (di). Then, the resulting value is added with
length do.
d = dN − N̅ − di + d0 (3.6)
Since the final image height of the optotype is much larger than the initial height of the object,
the final image is correlated with a lower visual acuity score than the original image displays on
the LCD. In other words, the smallest optotype display with this setup will not be associated with
a 20/20 VA score. To resolve this problem, a negative lens is introduced into the system to
shrink the optotype before projecting the letter with a positive lens. This optical system will
allow the smallest displayed optotype to be correlated with a 20/20 vision score.
3.5 Single-lens Visual Acuity Screening Prototype
A visual acuity screener prototype was built to validate the computational model of the
single-lens system, as shown in Figure 3.7. Specifically, the device aims to confirm that an
addition of a positive converging lens in front of the LCD screen would allow the screen to be
positioned within the near point of the eye. Ideally, the overall length of the system should be
less than 25 cm, and the user will still be able to see the visual image of the displayed optotypes.
Since the device is a proof-of-concept prototype, the input system of the user feedback is not
considered. When using the prototype, the user would verbally register his or her ability to see
the displayed Snellen character. The diagram of the prototype in Figure 3.7 reveals the main
components of the single-lens setup. The screen for displaying the Snellen optotypes is the
screen of a smartwatch, which had a comparable pixel size to the Adafruit LCD. A smartphone is

90
used to send the images of the optotypes to be displayed on the smartwatch. Using a smartwatch
instead of the Adafruit LCD saved substantial development time as the smartwatch is a plug-and-
play device. In contrast, the Adafruit display requires many supporting electrical components and
extensive programming. Also, the beam splitter is added to redirect the image path to the
biconvex lens toward the user’s eye. The overall length of the prototype is 50 mm. Testing
results of the device confirmed the single-lens setup calculations that the user can see the
displayed optotypes when the screen is placed within the near point limitation.
Figure 3.7: Single-lens visual acuity prototype: a) the diagram of the prototype, b) the CAD
model of the device, and c) the completely built unit of the visual screener.
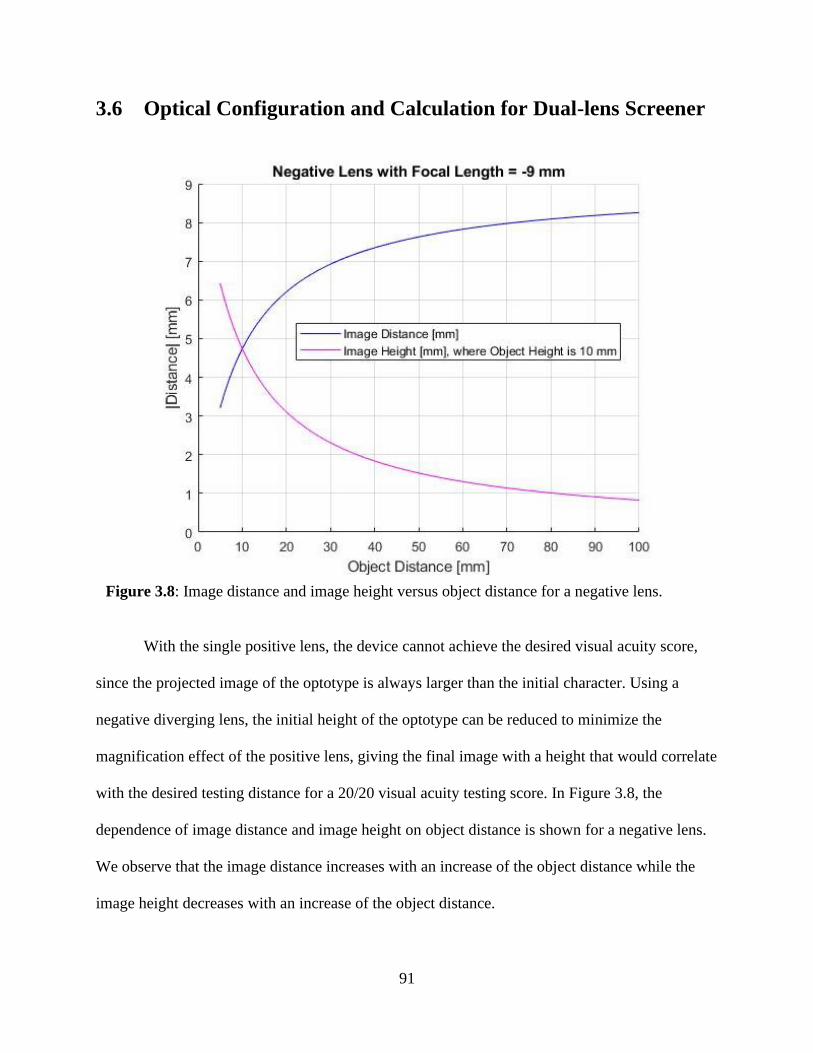
91
3.6 Optical Configuration and Calculation for Dual-lens Screener
With the single positive lens, the device cannot achieve the desired visual acuity score,
since the projected image of the optotype is always larger than the initial character. Using a
negative diverging lens, the initial height of the optotype can be reduced to minimize the
magnification effect of the positive lens, giving the final image with a height that would correlate
with the desired testing distance for a 20/20 visual acuity testing score. In Figure 3.8, the
dependence of image distance and image height on object distance is shown for a negative lens.
We observe that the image distance increases with an increase of the object distance while the
image height decreases with an increase of the object distance.
Figure 3.8: Image distance and image height versus object distance for a negative lens.
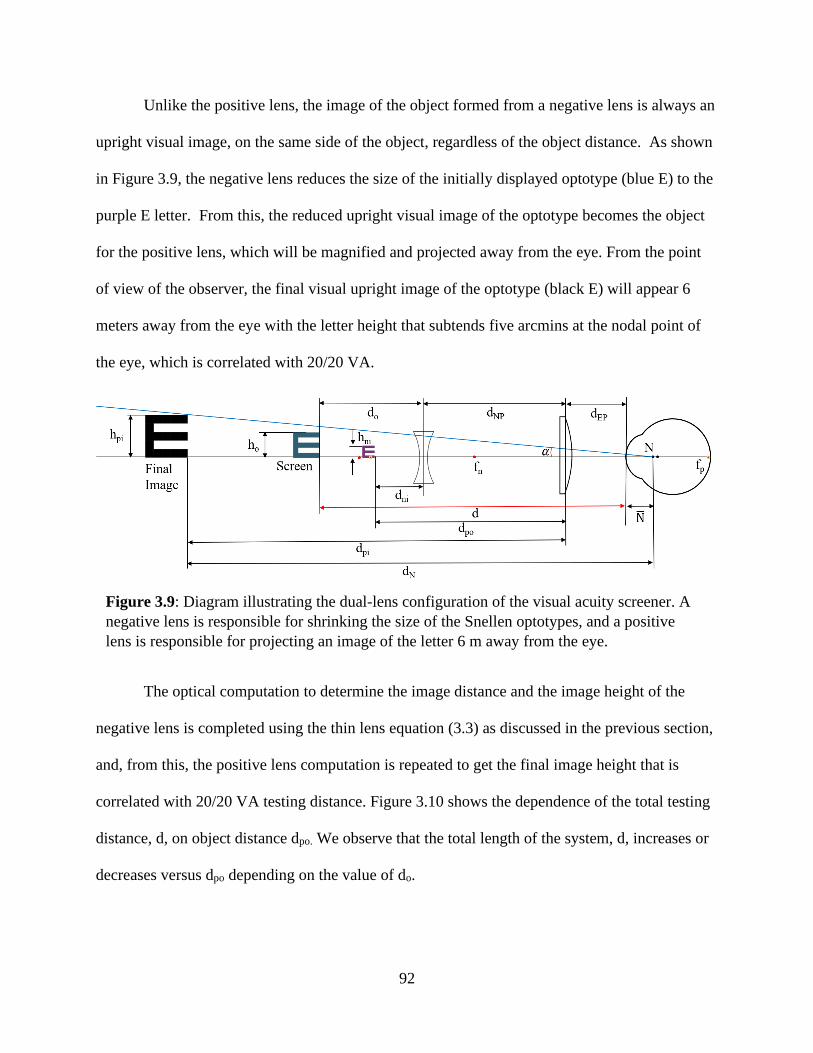
92
Unlike the positive lens, the image of the object formed from a negative lens is always an
upright visual image, on the same side of the object, regardless of the object distance. As shown
in Figure 3.9, the negative lens reduces the size of the initially displayed optotype (blue E) to the
purple E letter. From this, the reduced upright visual image of the optotype becomes the object
for the positive lens, which will be magnified and projected away from the eye. From the point
of view of the observer, the final visual upright image of the optotype (black E) will appear 6
meters away from the eye with the letter height that subtends five arcmins at the nodal point of
the eye, which is correlated with 20/20 VA.
The optical computation to determine the image distance and the image height of the
negative lens is completed using the thin lens equation (3.3) as discussed in the previous section,
and, from this, the positive lens computation is repeated to get the final image height that is
correlated with 20/20 VA testing distance. Figure 3.10 shows the dependence of the total testing
distance, d, on object distance dpo. We observe that the total length of the system, d, increases or
decreases versus dpo depending on the value of do.
Figure 3.9: Diagram illustrating the dual-lens configuration of the visual acuity screener. A
negative lens is responsible for shrinking the size of the Snellen optotypes, and a positive
lens is responsible for projecting an image of the letter 6 m away from the eye.
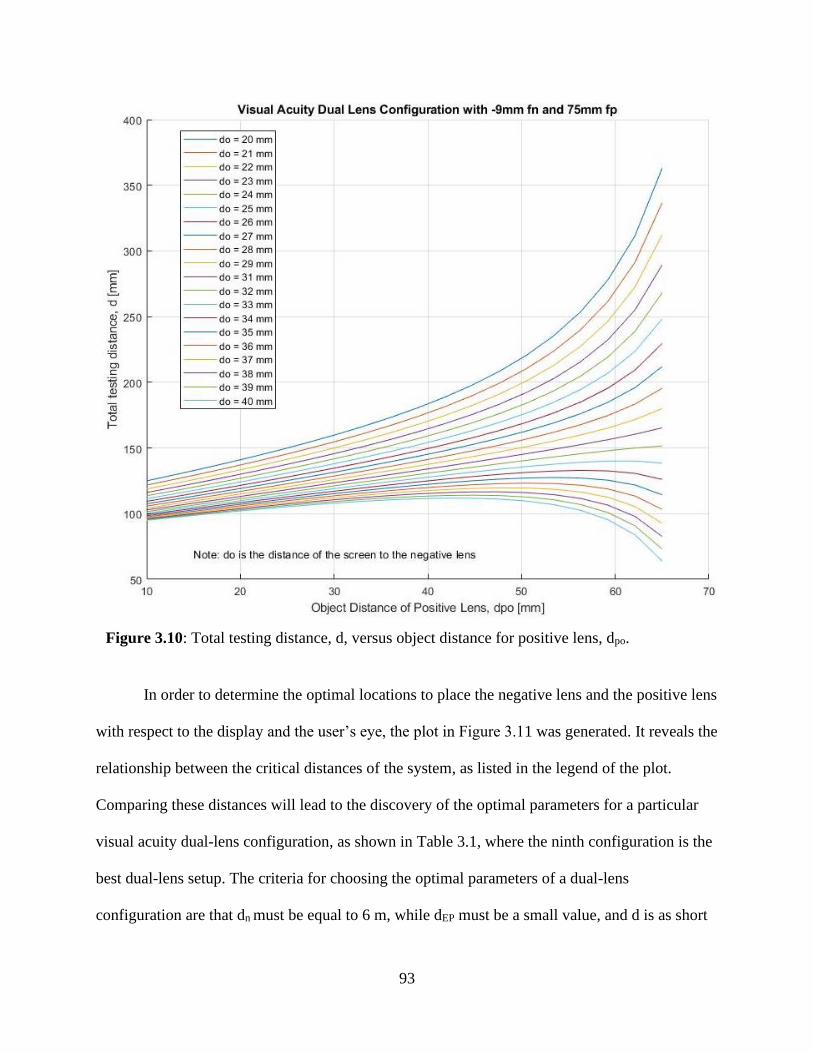
93
In order to determine the optimal locations to place the negative lens and the positive lens
with respect to the display and the user’s eye, the plot in Figure 3.11 was generated. It reveals the
relationship between the critical distances of the system, as listed in the legend of the plot.
Comparing these distances will lead to the discovery of the optimal parameters for a particular
visual acuity dual-lens configuration, as shown in Table 3.1, where the ninth configuration is the
best dual-lens setup. The criteria for choosing the optimal parameters of a dual-lens
configuration are that dn must be equal to 6 m, while dEP must be a small value, and d is as short
Figure 3.10: Total testing distance, d, versus object distance for positive lens, dpo.
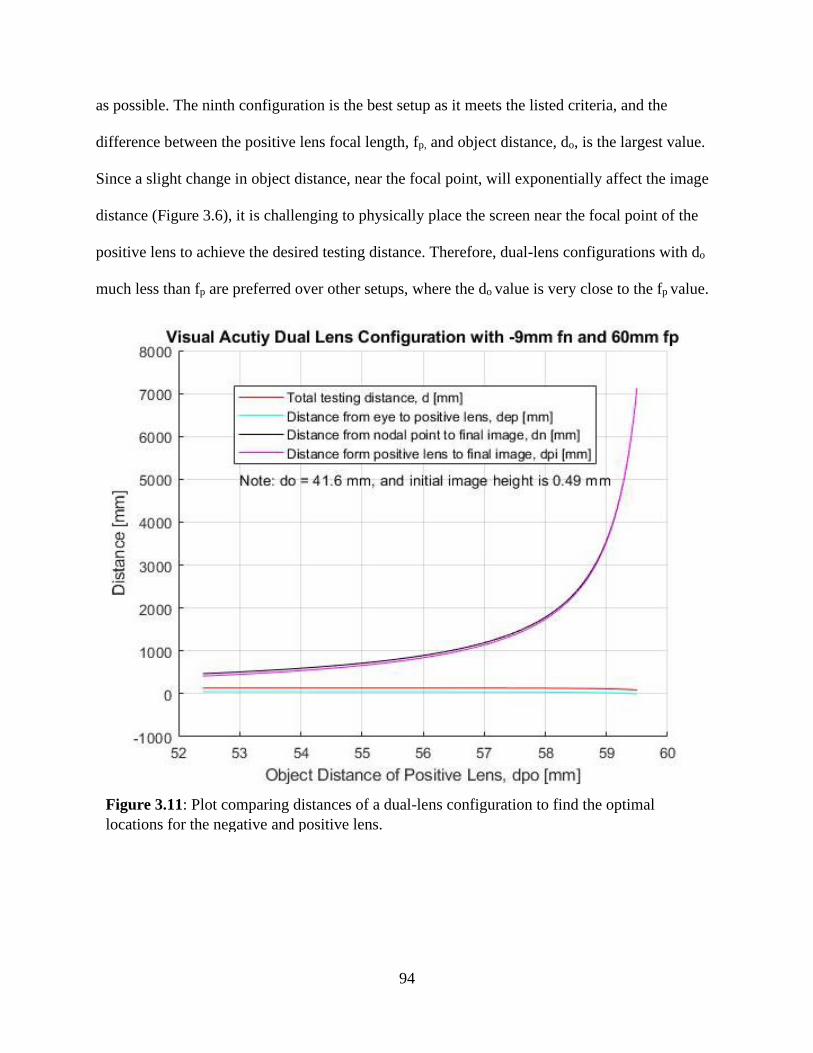
94
as possible. The ninth configuration is the best setup as it meets the listed criteria, and the
difference between the positive lens focal length, fp, and object distance, do, is the largest value.
Since a slight change in object distance, near the focal point, will exponentially affect the image
distance (Figure 3.6), it is challenging to physically place the screen near the focal point of the
positive lens to achieve the desired testing distance. Therefore, dual-lens configurations with do
much less than fp are preferred over other setups, where the do value is very close to the fp value.
Figure 3.11: Plot comparing distances of a dual-lens configuration to find the optimal
locations for the negative and positive lens.

95
Table 3.1: Visual acuity dual-lens configuration comparison to achieve a testing distance of 6 m
using various dual-lens configurations.
# fn fp dpo do dNP dEP d dN Note
1 -9 mm 50 mm 49 mm 51. 7 mm 42 mm 4 mm 97 mm 5000 mm Can’t
project
to 6 m
2 -9 mm 60 mm 59 mm 41.6 mm 52 mm 4 mm 97 mm 6000 mm
3 -9 mm 70 mm 69 mm 34.4 mm 62 mm 9 mm 105 mm 6000 mm
4 -9 mm 80 mm 79 mm 29 mm 72 mm 15 mm 116 mm 6000 mm
5 -9 mm 90 mm 89 mm 24.8 mm 82 mm 21 mm 128 mm 6000 mm
6 -9 mm 100 mm 98 mm 21.5 mm 92 mm 15 mm 129 mm 6000 mm
7 -9 mm 110 mm 108 mm 18.8 mm 102 mm 9 mm 130 mm 6000 mm
8 -9 mm 120 mm 118 mm 16.5 mm 112 mm 15 mm 144 mm 6000 mm
9 -9 mm 150 mm 146 mm 11.5 mm 141 mm 15 mm 168 mm 6000 mm Best
10 -9 mm 200 mm 193 mm 6.5 mm 190 mm 15 mm 212 mm 6000 mm
Similar to the examination results obtained from the traditional visual acuity exam using
a standard Snellen chart, the proposed visual acuity dual-lens screening setup can theoretically
produce comparable screening results. The dual-lens visual acuity configuration, as discussed,
allows the device to be compact and be placed very close to the patient’s eye while maintaining
the standard 6 meters testing distance. However, the calculated configuration still needs to be
experimentally validated.
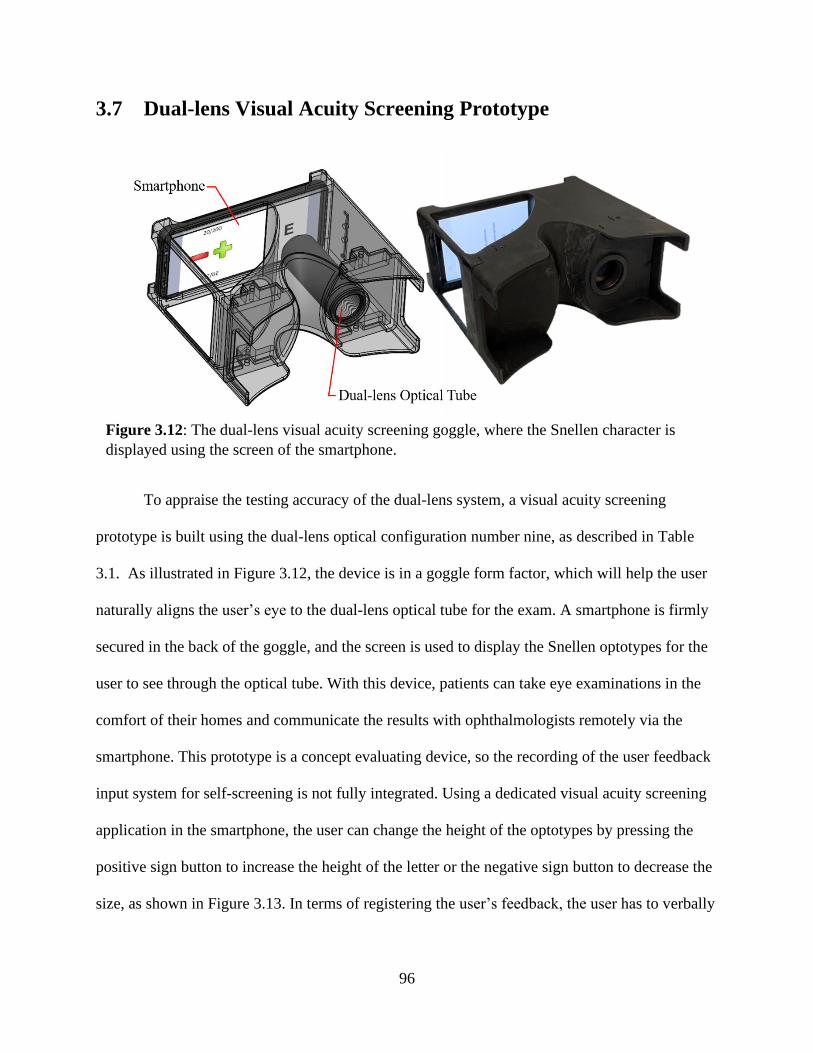
96
3.7 Dual-lens Visual Acuity Screening Prototype
To appraise the testing accuracy of the dual-lens system, a visual acuity screening
prototype is built using the dual-lens optical configuration number nine, as described in Table
3.1. As illustrated in Figure 3.12, the device is in a goggle form factor, which will help the user
naturally aligns the user’s eye to the dual-lens optical tube for the exam. A smartphone is firmly
secured in the back of the goggle, and the screen is used to display the Snellen optotypes for the
user to see through the optical tube. With this device, patients can take eye examinations in the
comfort of their homes and communicate the results with ophthalmologists remotely via the
smartphone. This prototype is a concept evaluating device, so the recording of the user feedback
input system for self-screening is not fully integrated. Using a dedicated visual acuity screening
application in the smartphone, the user can change the height of the optotypes by pressing the
positive sign button to increase the height of the letter or the negative sign button to decrease the
size, as shown in Figure 3.13. In terms of registering the user’s feedback, the user has to verbally
Figure 3.12: The dual-lens visual acuity screening goggle, where the Snellen character is
displayed using the screen of the smartphone.
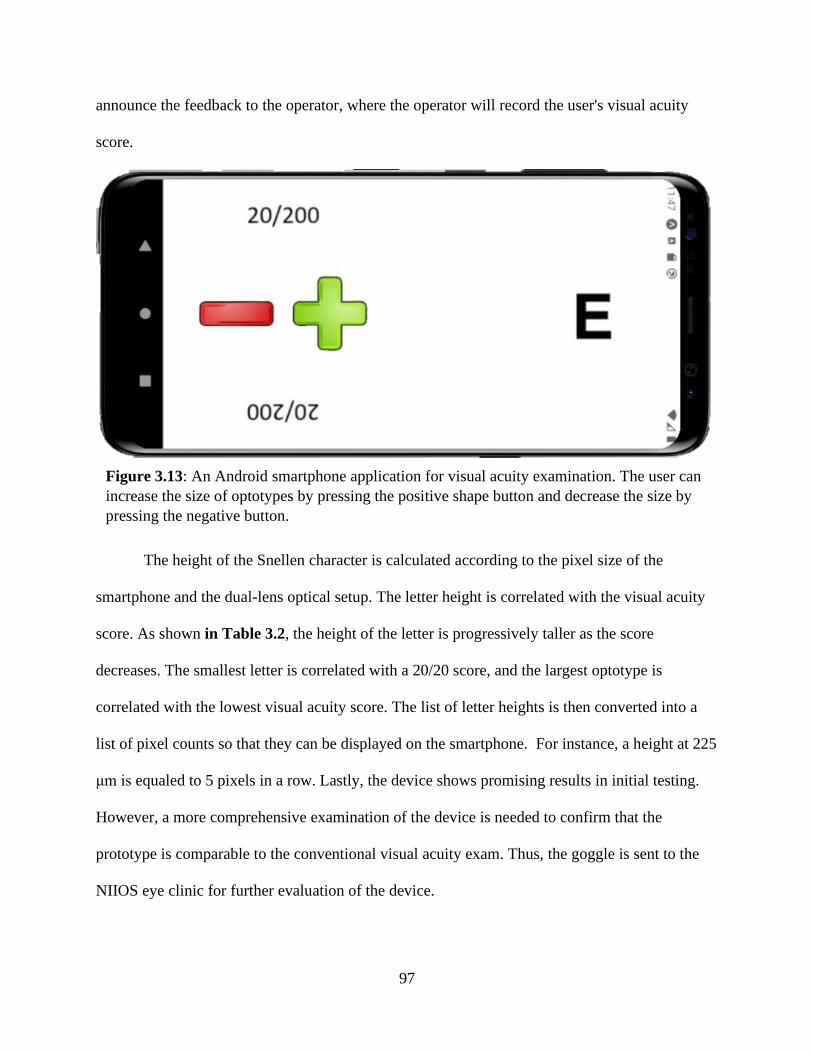
97
announce the feedback to the operator, where the operator will record the user's visual acuity
score.
The height of the Snellen character is calculated according to the pixel size of the
smartphone and the dual-lens optical setup. The letter height is correlated with the visual acuity
score. As shown in Table 3.2, the height of the letter is progressively taller as the score
decreases. The smallest letter is correlated with a 20/20 score, and the largest optotype is
correlated with the lowest visual acuity score. The list of letter heights is then converted into a
list of pixel counts so that they can be displayed on the smartphone. For instance, a height at 225
μm is equaled to 5 pixels in a row. Lastly, the device shows promising results in initial testing.
However, a more comprehensive examination of the device is needed to confirm that the
prototype is comparable to the conventional visual acuity exam. Thus, the goggle is sent to the
NIIOS eye clinic for further evaluation of the device.
Figure 3.13: An Android smartphone application for visual acuity examination. The user can
increase the size of optotypes by pressing the positive shape button and decrease the size by
pressing the negative button.

98
Table 3.2: List of calculated Snellen letter height correlated with each visual acuity fractions,
according to dual-lens configuration, and, given the pixel size of the smartphone S8, the
height is converted to pixel count to display the optotype onto the smartphone screen.
Based on the Samsung S8 smartphone screen with 45 um pixel size
Level Visual Acuity
Fraction Score Letter Height Unit Letter Width Unit
Pixel
Count
1 20/20 1.0 225 μm 225 μm 5
2 20/25 0.8 281 μm 281 μm 6
3 20/32 0.6 360 μm 360 μm 8
4 20/40 0.5 450 μm 450 μm 10
5 20/50 0.4 563 μm 563 μm 13
6 20/80 0.3 900 μm 900 μm 20
7 20/100 0.2 1125 μm 1125 μm 25
8 20/200 0.1 2250 μm 2250 μm 50
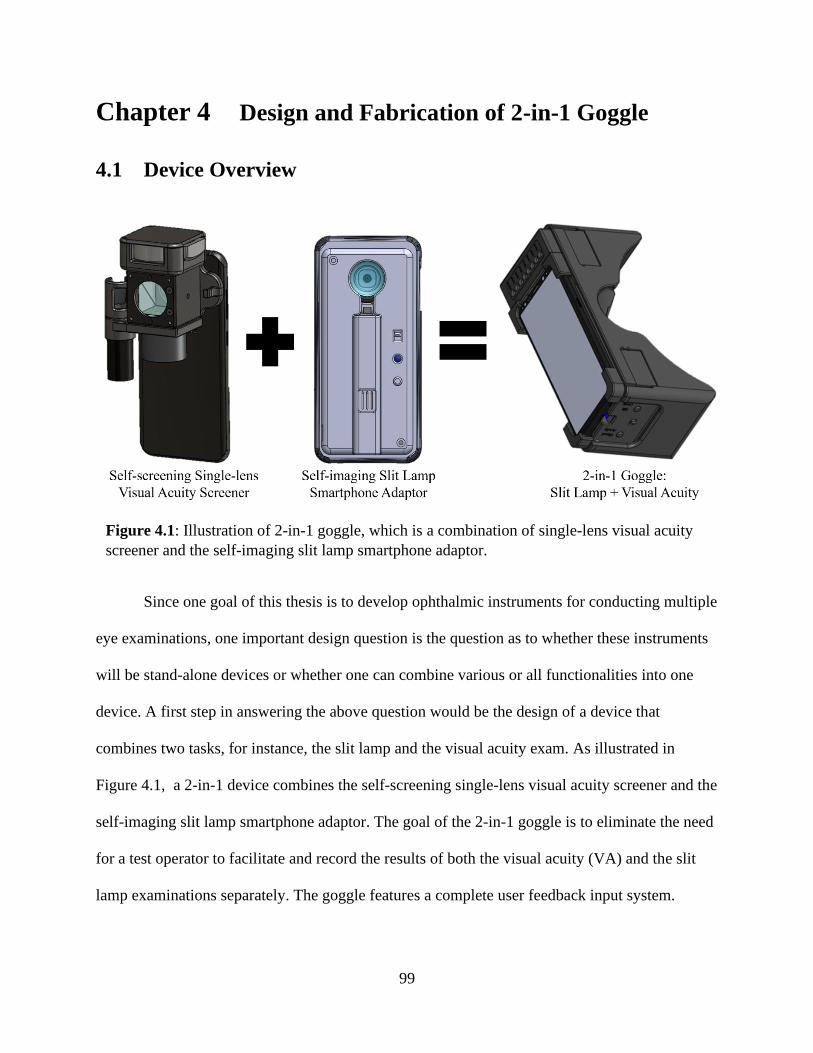
99
Chapter 4 Design and Fabrication of 2-in-1 Goggle
4.1 Device Overview
Since one goal of this thesis is to develop ophthalmic instruments for conducting multiple
eye examinations, one important design question is the question as to whether these instruments
will be stand-alone devices or whether one can combine various or all functionalities into one
device. A first step in answering the above question would be the design of a device that
combines two tasks, for instance, the slit lamp and the visual acuity exam. As illustrated in
Figure 4.1, a 2-in-1 device combines the self-screening single-lens visual acuity screener and the
self-imaging slit lamp smartphone adaptor. The goal of the 2-in-1 goggle is to eliminate the need
for a test operator to facilitate and record the results of both the visual acuity (VA) and the slit
lamp examinations separately. The goggle features a complete user feedback input system.
Figure 4.1: Illustration of 2-in-1 goggle, which is a combination of single-lens visual acuity
screener and the self-imaging slit lamp smartphone adaptor.
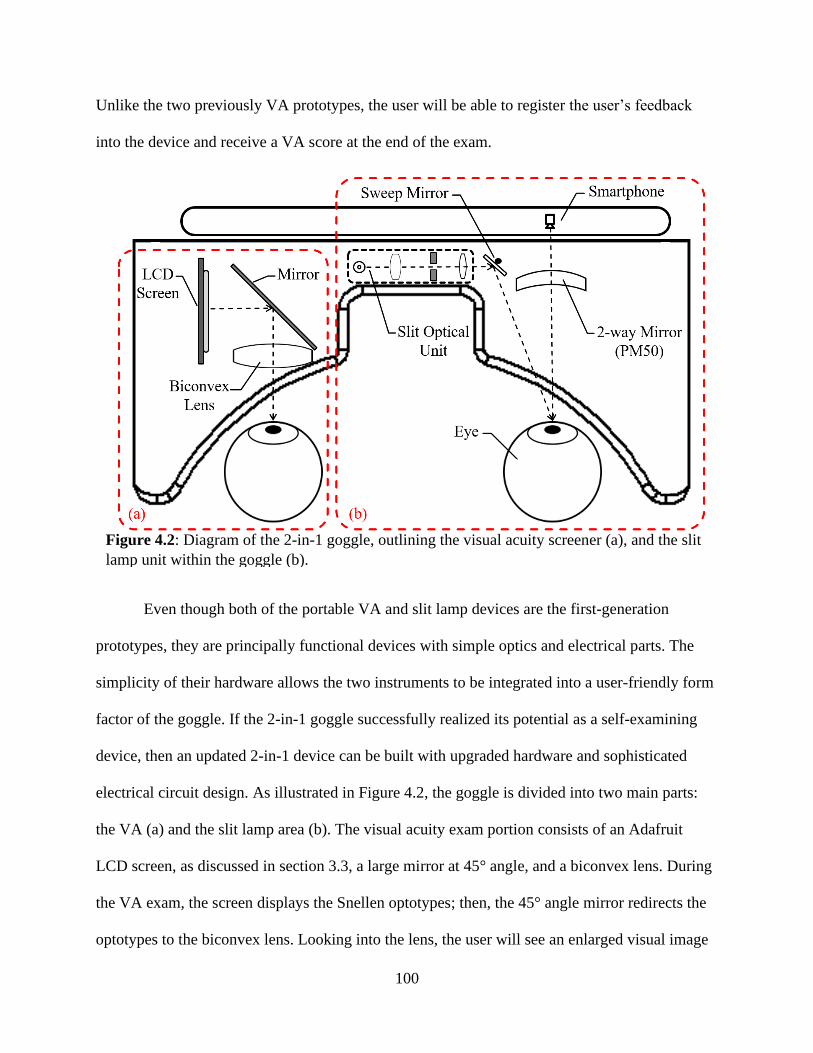
100
Unlike the two previously VA prototypes, the user will be able to register the user’s feedback
into the device and receive a VA score at the end of the exam.
Even though both of the portable VA and slit lamp devices are the first-generation
prototypes, they are principally functional devices with simple optics and electrical parts. The
simplicity of their hardware allows the two instruments to be integrated into a user-friendly form
factor of the goggle. If the 2-in-1 goggle successfully realized its potential as a self-examining
device, then an updated 2-in-1 device can be built with upgraded hardware and sophisticated
electrical circuit design. As illustrated in Figure 4.2, the goggle is divided into two main parts:
the VA (a) and the slit lamp area (b). The visual acuity exam portion consists of an Adafruit
LCD screen, as discussed in section 3.3, a large mirror at 45° angle, and a biconvex lens. During
the VA exam, the screen displays the Snellen optotypes; then, the 45° angle mirror redirects the
optotypes to the biconvex lens. Looking into the lens, the user will see an enlarged visual image
Figure 4.2: Diagram of the 2-in-1 goggle, outlining the visual acuity screener (a), and the slit
lamp unit within the goggle (b).

101
of the optotypes projected away from the eye, at a distance greater than the near point of the eye.
Similar to the auto sweeping slit lamp goggle (Section 2.8), the slit lamp portion of the 2-in-1
goggle (b) features a rotating mirror to automatically sweep the slit beam from one side of the
eye to the other side, while slit images are captured with the smartphone camera. Moreover, the
user can see his or her eye with the 2-way mirror when slit lamp examining mode.
4.2 Electrical Circuits
The electrical circuit of the 2-in-1 goggle combines the electrical components of the VA
device with the slit lamp circuit into a uniform circuit. As shown in Figure 4.3, the device has an
intuitive control interface of two buttons: one to activate the VA exam, and the other to start the
slit lamp test. In the middle of the two buttons is an on/off switch to power off the device when it
is not in use for an extended period. Also, the goggle features two membrane buttons (Figure
4.5) for the user to indicate the orientation of the Snellen E characters during the visual acuity
exam. A more detailed description of the usage of the two VA (left/right) buttons will be
provided in a later section.
Figure 4.3: The control interface of the 2-in-1 goggle.
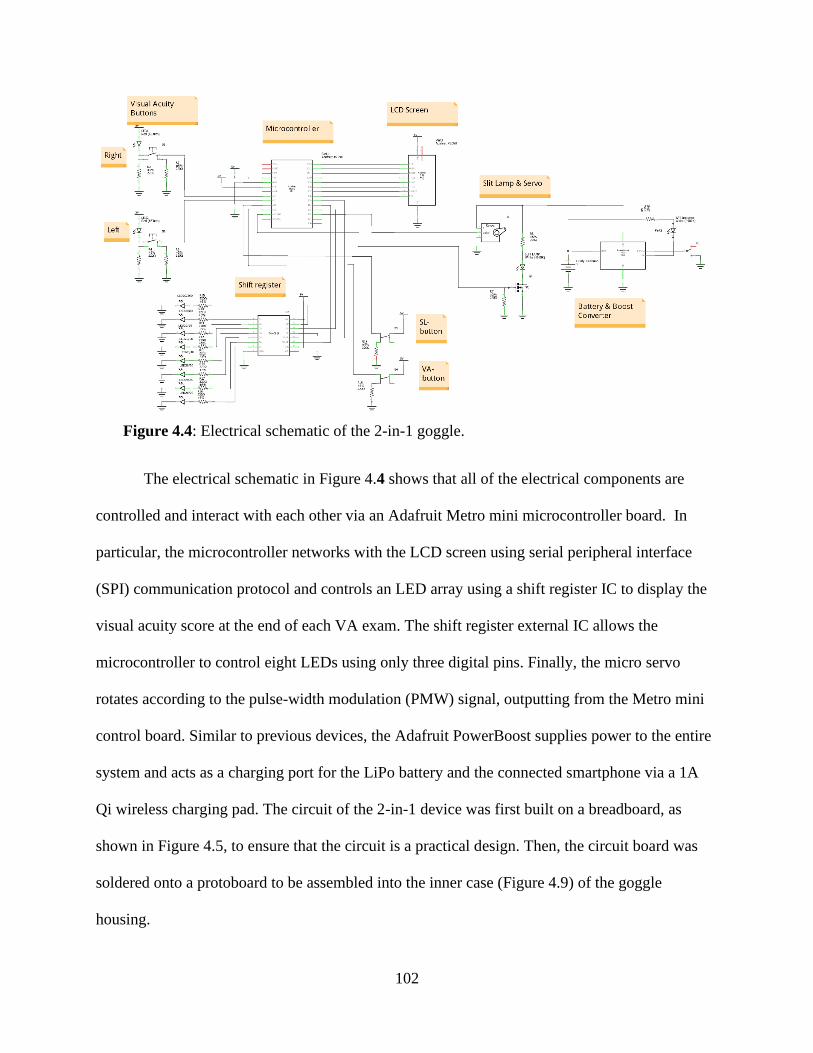
102
The electrical schematic in Figure 4.4 shows that all of the electrical components are
controlled and interact with each other via an Adafruit Metro mini microcontroller board. In
particular, the microcontroller networks with the LCD screen using serial peripheral interface
(SPI) communication protocol and controls an LED array using a shift register IC to display the
visual acuity score at the end of each VA exam. The shift register external IC allows the
microcontroller to control eight LEDs using only three digital pins. Finally, the micro servo
rotates according to the pulse-width modulation (PMW) signal, outputting from the Metro mini
control board. Similar to previous devices, the Adafruit PowerBoost supplies power to the entire
system and acts as a charging port for the LiPo battery and the connected smartphone via a 1A
Qi wireless charging pad. The circuit of the 2-in-1 device was first built on a breadboard, as
shown in Figure 4.5, to ensure that the circuit is a practical design. Then, the circuit board was
soldered onto a protoboard to be assembled into the inner case (Figure 4.9) of the goggle
housing.
Figure 4.4: Electrical schematic of the 2-in-1 goggle.
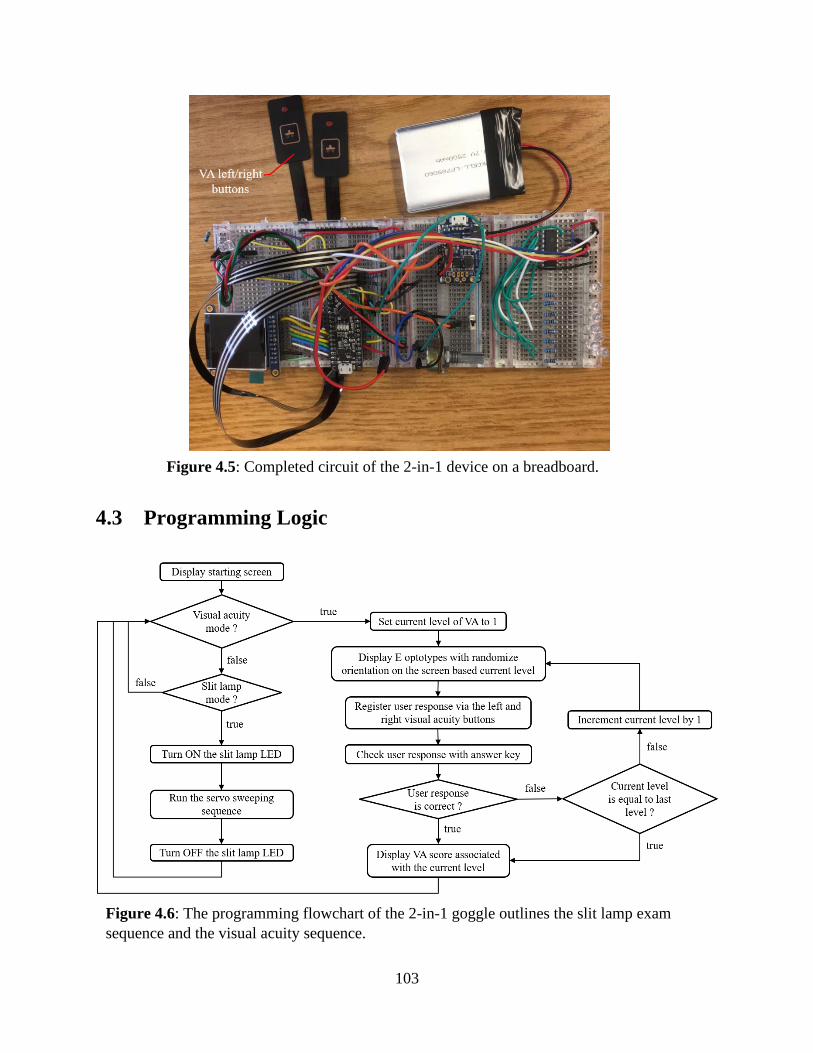
103
4.3 Programming Logic
Figure 4.5: Completed circuit of the 2-in-1 device on a breadboard.
Figure 4.6: The programming flowchart of the 2-in-1 goggle outlines the slit lamp exam
sequence and the visual acuity sequence.
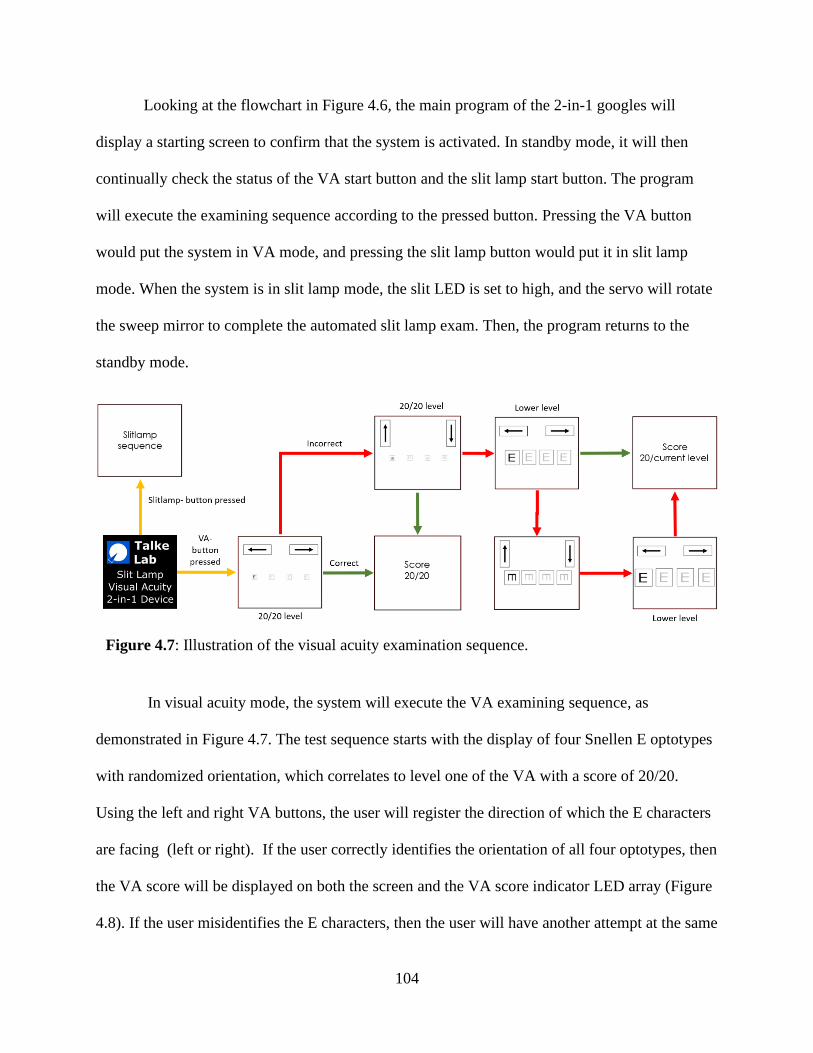
104
Looking at the flowchart in Figure 4.6, the main program of the 2-in-1 googles will
display a starting screen to confirm that the system is activated. In standby mode, it will then
continually check the status of the VA start button and the slit lamp start button. The program
will execute the examining sequence according to the pressed button. Pressing the VA button
would put the system in VA mode, and pressing the slit lamp button would put it in slit lamp
mode. When the system is in slit lamp mode, the slit LED is set to high, and the servo will rotate
the sweep mirror to complete the automated slit lamp exam. Then, the program returns to the
standby mode.
In visual acuity mode, the system will execute the VA examining sequence, as
demonstrated in Figure 4.7. The test sequence starts with the display of four Snellen E optotypes
with randomized orientation, which correlates to level one of the VA with a score of 20/20.
Using the left and right VA buttons, the user will register the direction of which the E characters
are facing (left or right). If the user correctly identifies the orientation of all four optotypes, then
the VA score will be displayed on both the screen and the VA score indicator LED array (Figure
4.8). If the user misidentifies the E characters, then the user will have another attempt at the same
Figure 4.7: Illustration of the visual acuity examination sequence.
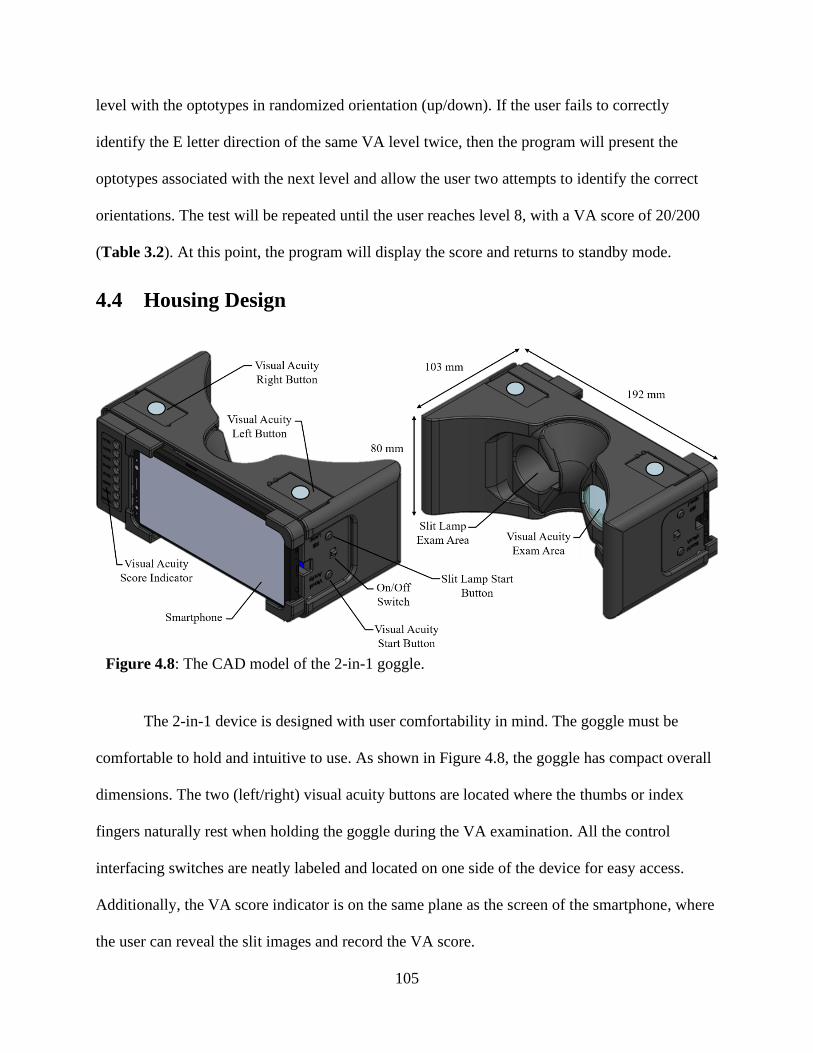
105
level with the optotypes in randomized orientation (up/down). If the user fails to correctly
identify the E letter direction of the same VA level twice, then the program will present the
optotypes associated with the next level and allow the user two attempts to identify the correct
orientations. The test will be repeated until the user reaches level 8, with a VA score of 20/200
(Table 3.2). At this point, the program will display the score and returns to standby mode.
4.4 Housing Design
The 2-in-1 device is designed with user comfortability in mind. The goggle must be
comfortable to hold and intuitive to use. As shown in Figure 4.8, the goggle has compact overall
dimensions. The two (left/right) visual acuity buttons are located where the thumbs or index
fingers naturally rest when holding the goggle during the VA examination. All the control
interfacing switches are neatly labeled and located on one side of the device for easy access.
Additionally, the VA score indicator is on the same plane as the screen of the smartphone, where
the user can reveal the slit images and record the VA score.
Figure 4.8: The CAD model of the 2-in-1 goggle.
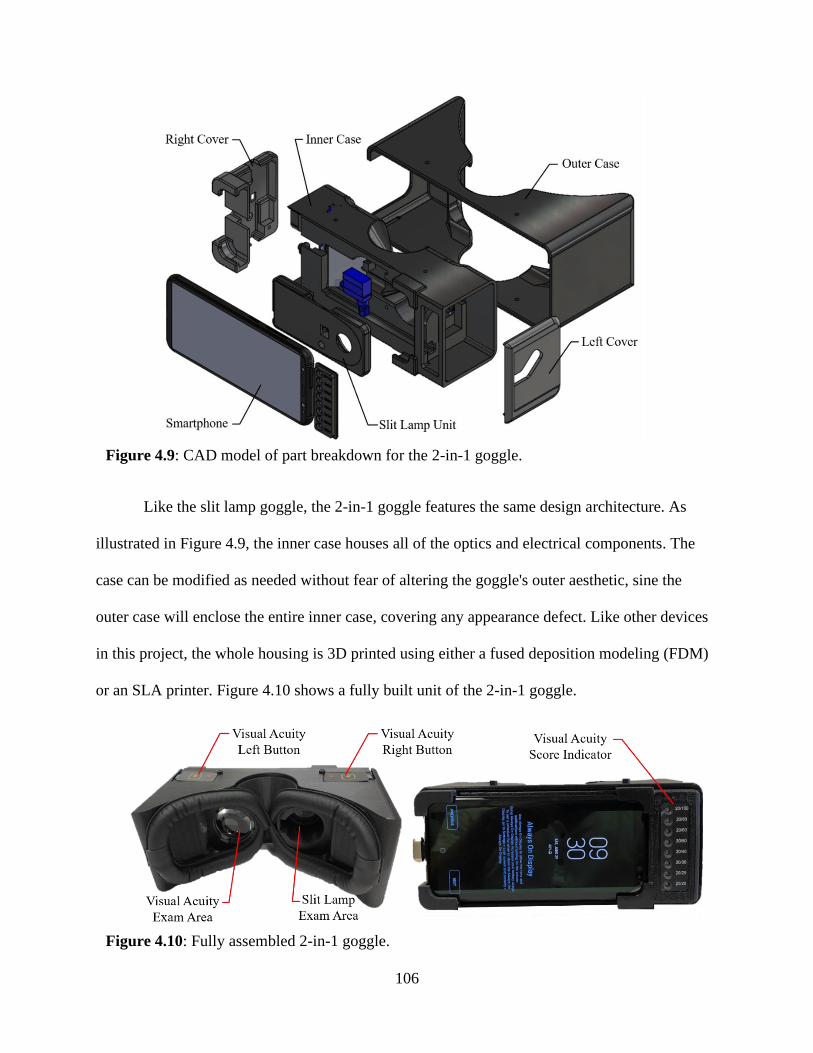
106
Like the slit lamp goggle, the 2-in-1 goggle features the same design architecture. As
illustrated in Figure 4.9, the inner case houses all of the optics and electrical components. The
case can be modified as needed without fear of altering the goggle's outer aesthetic, sine the
outer case will enclose the entire inner case, covering any appearance defect. Like other devices
in this project, the whole housing is 3D printed using either a fused deposition modeling (FDM)
or an SLA printer. Figure 4.10 shows a fully built unit of the 2-in-1 goggle.
Figure 4.9: CAD model of part breakdown for the 2-in-1 goggle.
Figure 4.10: Fully assembled 2-in-1 goggle.
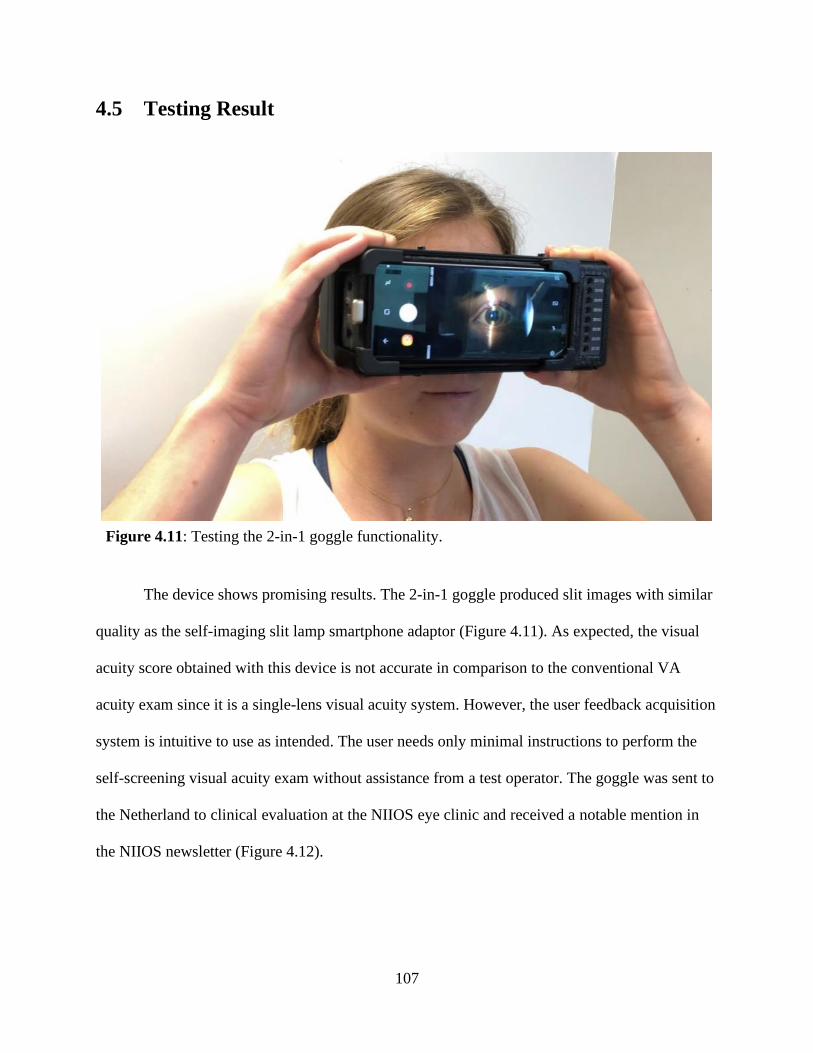
107
4.5 Testing Result
The device shows promising results. The 2-in-1 goggle produced slit images with similar
quality as the self-imaging slit lamp smartphone adaptor (Figure 4.11). As expected, the visual
acuity score obtained with this device is not accurate in comparison to the conventional VA
acuity exam since it is a single-lens visual acuity system. However, the user feedback acquisition
system is intuitive to use as intended. The user needs only minimal instructions to perform the
self-screening visual acuity exam without assistance from a test operator. The goggle was sent to
the Netherland to clinical evaluation at the NIIOS eye clinic and received a notable mention in
the NIIOS newsletter (Figure 4.12).
Figure 4.11: Testing the 2-in-1 goggle functionality.
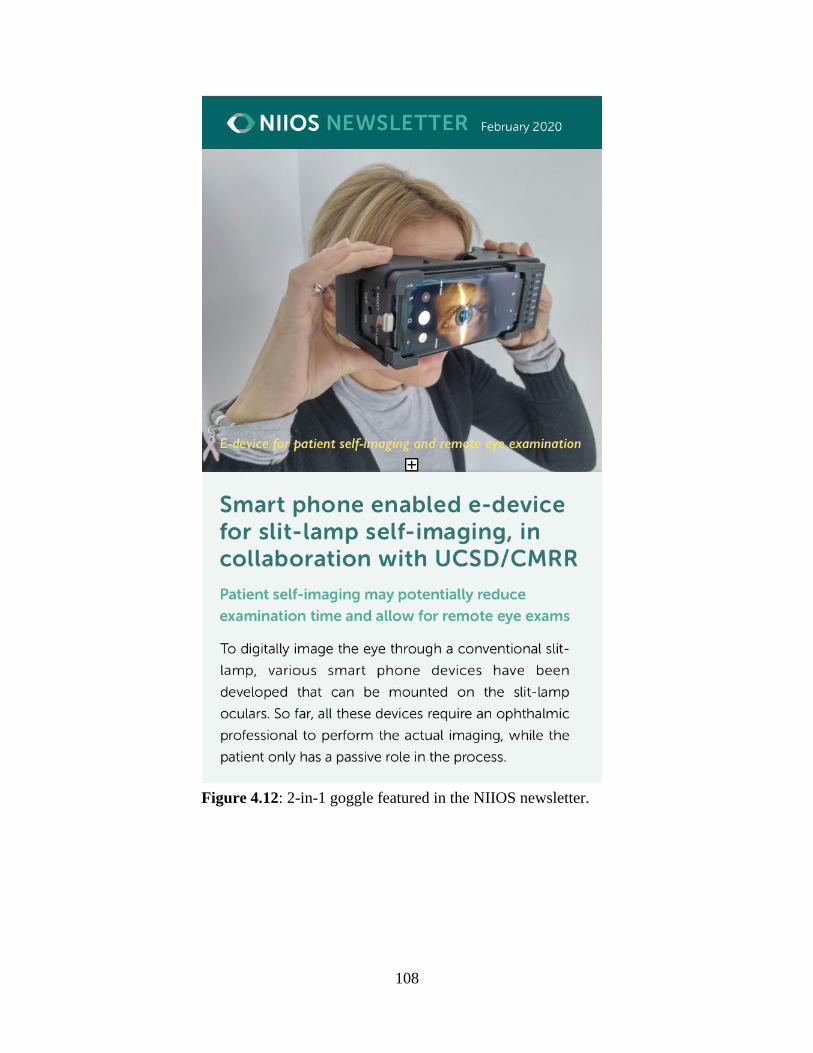
108
Figure 4.12: 2-in-1 goggle featured in the NIIOS newsletter.
109
Chapter 5 Conclusion and Future Direction
5.1 Conclusion
In this thesis, the miniaturization of two standard ophthalmic instruments with the
addition of self-examination features was investigated. Those instruments are the slit lamp, and
the visual acuity screener. The motivation for the project is primarily based on the need to reduce
unnecessary visits to an eye clinic for a routine checkup with the ophthalmologist. These visits
can be time-consuming and expensive. With the proposed miniaturized ophthalmic tools, the
patient can receive the same eye examinations at home, and the results can be remotely sent to
the physician for analysis.
The first device to be miniaturized was the conventional slit lamp biomicroscope. The
self-imaging slit lamp smartphone adaptor successfully shrank the traditional benchtop slit lamp
down to a pocket-size device that allows the user (patient) to photograph slit images of his or her
eye. The self-imaging slit lamp goggle completely automated the self-imaging process, allowing
the user to obtain high-resolution slit images with minimal effort.
Second, proof-of-concept visual acuity screeners were built to show that a self-examining
visual acuity screening is possible with a portable device. The first prototype was built with a
single-lens configuration to overcome the near point limitation of the eye. The second prototype
was built with a dual-lens setup, where the self-screening results acquired with this device are
comparable to a conventional visual acuity exam with a standard Snellen chart.
Lastly, a 2-in-1 goggle was constructed to demonstrate that the self-imaging slit lamp and
the self-screening visual acuity screener can be combined into a single functional device. The
110
goggle showcased the full testing procedure to acquire visual score and slit images with the
assistance of trained medical personnel who present are required to conduct these exams with
conventional instruments.
The self-examining ophthalmic instruments presented in this research allow patients to
receive eye care in the comfort of their own home, thereby increasing the accessibility to eye
care while maintaining the quality of care in the field of ophthalmology. Patients who are unable
to visit an eye clinic can now receive quality eye care at home, and ophthalmologists can have
more time and resources to treat patients with urgent needs.
5.2 Future Direction
The future direction of the project involves the development of a proof-of-concept self-
imaging funduscope, a proof-of-concept IOP measurement device, and further refinement of the
developed ophthalmic instruments to improve its testing accuracy and ease-of-use. Additionally,
the building of a combination device such as the 2-in-1 slit lamp and visual acuity goggle is a
crucial part of the project's future development.
As fundus imaging is a vital monitoring feature of the eye condition, having a self-
imaging funduscope that can capture fundus images without the need for eye dilation or a second
person to operate the device is ideal for improving the quality of at-home examination. A proof-
of-concept self-imaging funduscope needs to be studied to determine the feasibility of such a
device.
The miniaturization of a conventional tonometer with self-examining features is
necessary to enable full eye examination at home. IOP measurement is an important data point to
evaluate the eye condition of a patient. Without this result, some patients might still need to visit

111
an eye clinic for a routine checkup. Thus, a proof-of-concept tonometer needs to be built to
evaluate methods for self-monitoring IOP level.
Lastly, building improved versions of devices such as the self-imaging slit lamp and the
self-screening visual acuity screener is necessary to ensure that screening results obtained from
these devices are as accurate as results obtained using the traditional methods. With the ultimate
goal of creating a portable 4-in-1 self-examining device, combining reliable self-examining
devices into a 2-in-1 instrument or a 3-in-1 device is the natural next step after successfully
building a functional self-imaging slit lamp, a self-screening visual acuity screener, a self-
imaging funduscope, and a self-measuring tonometer.
Overall, the need for portable ophthalmic instruments for self-screening at home will
continue to grow as the elderly population increase over time, and as more people work at home,
especially in the recent pandemic crisis. The ability to receive eye care at home is important and
will improve the quality of life for many people.

112
References
[1] "Acuity." The Retina and Its Disorders, by Joseph C. Besharse and Dean Bok, Elsevier
Academic Press, 2011, pp. 1–6.
[2] "EyeQue Insight." Shop, 2019, store.eyeque.com/eyeque-insight.html.
[3] “AO/Reichert Prelude Slit Lamp Bulb.” Lite Source Inc, 2020,
www.litesourceinc.com/ao-reichert-prelude-slit-lamp-bulb.html.
[4] “Optical Instruments: The Optics of an Eye.” Optics, 2020,
scientificsentence.net/Equations/optics/index.php?key=yes&Integer=eye.
[5] “Portable Slit Lamp HSL-005.” Mercoframes, 2019,
www.mercoframes.com/p/hansheiss/HSL005#secCont
[6] Atchison, David A, and Larry N Thibos. “Optical Models of the Human Eye.” Clinical
and Experimental Optometry, vol. 99, no. 2, 2016, pp. 99–106., doi:10.1111/cxo.12352.
[7] Browne, Michael. "Adapting SmartPhones for Ocular Diagnosis." 2017 Defense Medical
Research and Development Highlight - Adapting SmartPhones for Ocular Diagnosis ,
Defense Medical Research and Development Program, Congressionally Directed
Medical Research Programs, 23 Aug. 2017,
cdmrp.army.mil/dmrdp/research_highlights/17browne_highlight.
[8] Chuang, Katherine & Fields, Mark & Del Priore, Lucian. (2017). Potential of Gene
Editing and Induced Pluripotent Stem Cells (iPSCs) in Treatment of Retinal Diseases.
The Yale Journal of Biology and Medicine. 90. 635-642.
[9] Cree. “Cree® XLamp® XP-L LEDs.” PRODUCT FAMILY DATA SHEET, 2020,
www.cree.com/led-components/media/documents/ds-XPL.pdf.
[10] D'arcy, Peter G. “Visual Acuity.” Peter D'Arcy Optometrist, 17 Oct. 2018,
www.peterdarcy.com.au/visual-acuity/.
[11] Eloranta, Hannakaisa, and Aura Falck. "Is an Ophthalmic Checkup Needed after
Uneventful Cataract Surgery? A Large Retrospective Comparative Cohort Study of
Finnish Patients." Acta Ophthalmologica, vol. 95, no. 7, 2017, pp. 665–670.,
doi:10.1111/aos.13373.
[12] Fink, Wolfgang, and Mark Tarbell. Smartphone-Based Handheld Ophthalmic
Examination Devices. 7 June 2018
[13] Gellrich, Marcus-Matthias. "History of the slit lamp." The Slit Lamp. Springer, Berlin,
Heidelberg, 2014. 189-210
113
[14] George T. Timberlake and Michael Kennedy. "The Direct Ophthalmoscope How it
Works and How to Use It." In: University of Kansas Medical Center (2005), p. 35.
[15] Hacisoftaoglu, Recep Emre, and Mahmut Karakaya. "Field of view of portable
ophthalmoscopes for smartphones." Smart Biomedical and Physiological Sensor
Technology XV. Vol. 11020. International Society for Optics and Photonics, 2019
[16] Hecht, Eugene. Optics. 4th ed., Addison-Wesley, 2002.
[17] James, Bruce, and Larry Benjamin. Ophthalmology: Investigation and Examination
Techniques. Butterwoth Heinemann/Elsevier, 2007.
[18] Kaschke, Michael, Karl-Heinz Donnerhacke, and Michael Stefan Rill. Optical Devices in
Ophthalmology and Optometry: Technology, Design Principles, and Clinical
Applications. Wiley-Vch Verlag GmbH & Co., 2014.
[19] Keane, Pearse A, and Srinivas R Sadda. "Retinal Imaging in the Twenty-First Century:
State of the Art and Future Directions." Science Direct, 3 Oct. 2014.
[20] Lawson, Matthew Everett, Ramesh Raskar, Jason Boggess, and Siddharth Khullar.
Methods and Apparatus for Retinal Imaging. 23 June 2015.
[21] Lens, Contact. "What Is the 'Tumbling E' Eye Chart?" What Is the "Tumbling E" Eye
Chart, 12 Jan. 2018, www.blog.contactlensking.com/Tumbling-E-Eye-Chart.php.
[22] Li, Helen K. “Telemedicine and Ophthalmology.” Survey of Ophthalmology, vol. 44, no.
1, 1999, pp. 61–72., doi:10.1016/s0039-6257(99)00059-4.
[23] Ling, Samuel J., Jeff Sanny, and William Moebs. University Physics Volume 3.
OpenStax, Rice University, 2016.
[24] May, Kristopher. "A roundup of 8 recent diagnostic devices: technology is changing
rapidly and improving the way we practice. Some of these devices may change our
patient care, and some are just cool." Review of Optometry, 15 Apr. 2006, p.
31+. Academic OneFile, Accessed 13 June 2019.
[25] Medical Advisory Secretariat. “Routine eye examinations for persons 20-64 years of age:
an evidence-based analysis.” Ontario health technology assessment series vol. 6,15
(2006): 1-81.
[26] Melles, Gerrit R. J. “Posterior Lamellar Keratoplasty.” Cornea, vol. 25, no. 8, 2006, pp.
879–881., doi:10.1097/01.ico.0000243962.60392.4f.
[27] Paschotta, Rüdiger. "Beam Splitters." RP Photonics Encyclopedia - Beam Splitters,
Optical Power Splitter, Beamsplitter, Thin-Film Polarizer, Non-Polarizing Beam Splitter
114
Cubes, Important Properties, RP Photonics, 14 Mar. 2020, www.rp-
photonics.com/beam_splitters.html.
[28] Russo, Andrea, Francesco Morescalchi, Ciro Costagliola, Luisa Delcassi, and Francesco
Semraro. "A Novel Device to Exploit the Smartphone Camera for Fundus Photography."
Journal of Ophthalmology, vol. 2015, 2015, pp. 1–5., doi:10.1155/2015/823139.
[29] Schong. "ODocs Nun - Wide Field Smartphone Ophthalmoscope." ODocs Eye Care,
2019, www.odocs-tech.com/odocs-nun/.
[30] Soroka, M. “Comparison of examination fees and availability of routine vision care by
optometrists and ophthalmologists.” Public health reports (Washington, D.C. : 1974) vol.
106,4 (1991): 455-9.
[31] Takagi, Daisuke, Akira Sawada, and Tetsuya Yamamoto. "Evaluation of a New Rebound
Self-Tonometer, Icare HOME." Journal of Glaucoma, vol. 26, no. 7, 2017, pp. 613–618.,
doi:10.1097/ijg.0000000000000674.
[32] Tan, Irene J, Lucy P Dobson, Stephen Bartnik, Josephine Muir, and Angus W Turner.
"Real-Time Teleophthalmology versus Face-to-Face Consultation: A Systematic
Review." Journal of Telemedicine and Telecare, vol. 23, no. 7, 2016, pp. 629–638.,
doi:10.1177/1357633x16660640
[33] Varotsis, Alkaios Bournias. "Introduction to SLA 3D Printing." 3D Hubs, 2020,
www.3dhubs.com/knowledge-base/introduction-sla-3d-printing/.
[34] Willing, Rich Brilliant. "Understanding Color Temperature of LED Lighting." Rich
Brilliant Willing, 29 May 2013, richbrilliantwilling.com/blogs/light-reading/7988231-
understanding-color-temperature-of-led-lighting.
[35] Wilson, Fernando A., Jim P. Stimpson, and Yang Wang. “Inconsistencies Exist in
National Estimates of Eye Care Services Utilization in the United States.” Journal of
Ophthalmology, vol. 2015, 2015, pp. 1–4., doi:10.1155/2015/435606.
Related Documents