Dissertations and Theses Spring 2012 Design and Optimization of a Deflagration to Detonation Design and Optimization of a Deflagration to Detonation Transition (DDT) Section Transition (DDT) Section Francisco X. Romo Embry-Riddle Aeronautical University - Daytona Beach Follow this and additional works at: https://commons.erau.edu/edt Part of the Aerospace Engineering Commons Scholarly Commons Citation Scholarly Commons Citation Romo, Francisco X., "Design and Optimization of a Deflagration to Detonation Transition (DDT) Section" (2012). Dissertations and Theses. 124. https://commons.erau.edu/edt/124 This Thesis - Open Access is brought to you for free and open access by Scholarly Commons. It has been accepted for inclusion in Dissertations and Theses by an authorized administrator of Scholarly Commons. For more information, please contact [email protected].

Welcome message from author
This document is posted to help you gain knowledge. Please leave a comment to let me know what you think about it! Share it to your friends and learn new things together.
Transcript
Dissertations and Theses
Spring 2012
Design and Optimization of a Deflagration to Detonation Design and Optimization of a Deflagration to Detonation
Transition (DDT) Section Transition (DDT) Section
Francisco X. Romo Embry-Riddle Aeronautical University - Daytona Beach
Follow this and additional works at: https://commons.erau.edu/edt
Part of the Aerospace Engineering Commons
Scholarly Commons Citation Scholarly Commons Citation Romo, Francisco X., "Design and Optimization of a Deflagration to Detonation Transition (DDT) Section" (2012). Dissertations and Theses. 124. https://commons.erau.edu/edt/124
This Thesis - Open Access is brought to you for free and open access by Scholarly Commons. It has been accepted for inclusion in Dissertations and Theses by an authorized administrator of Scholarly Commons. For more information, please contact [email protected].
Design and Optimization of a Deflagration to Detonation Transition
(DDT) Section
Francisco X. Romo
A Thesis submitted to the Graduate Studies Office in Partial Fulfillment of the Requirements for the Degree of Master of Science
in Aerospace Engineering
Embry-Riddle Aeronautical University
Daytona Beach, Florida
Spring 2012

iii
Table of Contents
Acknowledgements..................................................................................................................... iv
Abstract ........................................................................................................................................ v
List of Tables .............................................................................................................................. vi
List of Figures .............................................................................................................................vii
Nomenclature ............................................................................................................................. ix
1. Introduction .............................................................................................................................. 1
1.1 Problem statement ........................................................................................................... 1
1.2 Combustion and Detonation............................................................................................. 3
1.3 Detonation Initiation – Direct and DDT ............................................................................ 8
1.4 Pulsed Detonation Engine (PDE)................................................................................... 10
1.5 Literature survey ............................................................................................................ 12
2. Test equipment and methodology ......................................................................................... 15
2.1 Methodology................................................................................................................... 15
2.2 Equipment layout ........................................................................................................... 19
2.3 Equipment description.................................................................................................... 23
2.3.1 Electrical equipment description .................................................................................. 23
2.3.2 Hardware description ................................................................................................... 27
2.3.3 Control system description ........................................................................................... 31
3. Results and analysis ............................................................................................................. 37
3.1 Data processing methodology ....................................................................................... 37
3.2 Numerical results ........................................................................................................... 39
3.3 Regression model .......................................................................................................... 41
3.4 Analysis .......................................................................................................................... 43
3.5 Oxygen testing results.................................................................................................... 53
3.6 Testing observations ...................................................................................................... 55
4. Conclusions and recommendations ...................................................................................... 59
References ..................................................................................................................................... 60

iv
Acknowledgements
I would like to dedicate this work to my Wife and Family, who supported me throughout my
journey at Embry-Riddle. Without them none of this would have been possible.
I would like to express my sincere gratitude to Dr. Magdy Attia. His knowledge and mentorship
skills tremendously helped me through my career at Embry-Riddle. I would like to recognize
committee members Dr. Eric Perrell and Dr. William Engblom, for their time and support with this
paper.
I would also like to thank my colleagues from the Gas Turbine Lab Jeff Vizcaino and Walter
‘Boomer’ Olliff for their help with this project. Derek Noce also deserves recognition for his help.
This work was supported by an internal student research grant provided by Embry-Riddle
Aeronautical University.
vi
Abstract
Throughout the previous century, hydrocarbon-fueled engines have used and optimized the
‘traditional’ combustion process called deflagration (subsonic combustion). An alternative form of
combustion, detonation (supersonic combustion), can increase the thermal efficiency of the
process by anywhere from 20 - 50%. Even though several authors have studied detonation
waves since the 1890’s and a plethora of papers and books have been published, it was not until
2008 that the first detonation-powered flight took place. It lasted for 10 seconds at 100 ft. altitude.
Achieving detonation presents its own challenges: some fuels are not prone to detonate, severe
vibrations caused by the cyclic nature of the engine and its intense noise are some of the key
areas that need further research. Also, to directly achieve detonation either a high-energy, bulky,
ignition system is required, or the combustion chamber must be fairly long (5 ft. or more in some
cases). In the latter method, a subsonic flame front accelerates within the combustion chamber
until it reaches supersonic speeds, thus detonation is attained. This is called deflagration-to-
detonation transition (DDT).
Previous papers and experiments have shown that obstacles, such as discs with an orifice,
located inside the combustion chamber can shorten the distance required to achieve detonation.
This paper describes a hands-on implementation of a DDT device. Different disc geometries
inside the chamber alter the wave characteristics at the exit of the tube. Although detonation was
reached only when using pure oxygen, testing identified an obstacle configuration for LPG and air
mixtures that increased pressure and wave speed significantly when compared to baseline or
other obstacle configurations. Mixtures of LPG and air were accelerated to Mach 0.96 in the
downstream frame of reference, which would indicate a transition to detonation was close.
Reasons for not achieving detonation may include poor fuel and oxidizer mixing, and/or the need
for a longer DDT section.
vi
List of Tables
Table 1 - Cell size vs. fuel mixtures ................................................................................................. 8
Table 2 - Tube characteristics........................................................................................................ 28
Table 3 - Flange characteristics ..................................................................................................... 28
Table 4 - LPG composition ............................................................................................................ 31
Table 5 - Best performance runs ................................................................................................... 39
Table 6 - Pressure regression model results ................................................................................. 42
Table 7 - Ideal cartridge parameters.............................................................................................. 51
vii
List of Figures
Figure 1 - Rayleigh lines and Rankine-Hugoniot curve ................................................................... 5
Figure 2 - ZND 1D model detonation wave ..................................................................................... 7
Figure 3 - 2D Detonation wave propagation pattern ....................................................................... 7
Figure 4 - Shchelkin spiral .............................................................................................................. 9
Figure 5 - Shchelkin spiral degradation after testing ...................................................................... 9
Figure 6 - Brayton and Humphrey cycles P-V and T-s diagrams ................................................. 10
Figure 7 - Thermal Efficiency vs. Compression Ratio ................................................................... 12
Figure 8 - Proposed detonation test tube (not to scale)................................................................. 16
Figure 9 - Test configurations (abbreviated) .................................................................................. 18
Figure 10 - Injector configuration comparison ............................................................................... 20
Figure 11 - Injection section top view............................................................................................. 20
Figure 12 - Injection section tangential ports and spark plug ........................................................ 21
Figure 13 - Center section with cartridge, end-view ...................................................................... 21
Figure 14 - Equipment block diagram ............................................................................................ 22
Figure 15 - Complete test setup..................................................................................................... 23
Figure 16 - DAQ with quick-disconnect harness............................................................................ 25
Figure 17 - Modified spark plug ..................................................................................................... 27
Figure 18 - Cartridges and discs .................................................................................................... 30
Figure 19 - Injector valves block .................................................................................................... 30
Figure 20 - Labview graphical user interface (GUI) ....................................................................... 32
Figure 21 - DAQ output control lines, simplified ............................................................................ 34
Figure 22 - Labview program ......................................................................................................... 35
Figure 23 - Labview routine flowchart ............................................................................................ 36
Figure 24 - Matlab sample output graphs ...................................................................................... 38
Figure 25 - Best performance plots................................................................................................ 40
Figure 26 - Average pressure histogram ....................................................................................... 43
Figure 27 - Average speed histogram............................................................................................ 44
viii
Figure 28 - Average TR histogram.................................................................................................. 45
Figure 29 - Average pressure vs. BR vs. L .................................................................................... 46
Figure 30 - Average pressure vs. BR vs. d .................................................................................... 47
Figure 31 - Average pressure vs. L vs. disc spacing ..................................................................... 47
Figure 32 - Average speed vs. BR vs. L ........................................................................................ 48
Figure 33 - Average speed vs. BR vs. number of discs................................................................. 48
Figure 34 - Average speed vs. L vs. disc spacing ......................................................................... 49
Figure 35 - Rise time vs. BR vs. L ................................................................................................. 49
Figure 36 - Rise time vs. BR vs. number of discs .......................................................................... 50
Figure 37 - Rise time vs. L vs. disc spacing................................................................................... 50
Figure 38 - Oxygen testing results ................................................................................................. 54
Figure 39 - Discs after oxygen testing (bent) ................................................................................. 57
ix
Nomenclature
DDT Deflagration to Detonation Transition
PDE Pulse detonation engine
DAQ Digital acquisition system
GUI Graphical user interface
LPG Liquefied petroleum gas
d Number of discs in cartridge
s Disc spacing, inches
λ Lambda – Detonation cell height
v Specific volume
q Heat
η Efficiency
γ Specific heats ratio
m Mass
m Mass flux – mass flow by area
π Compression ratio
BR Blockage ratio – blocked area by total area
P Pressure
T Temperature
ρ Density
M Mach number
Φ Equivalence ratio
L Inverse of Φ
TR Signal rise time
1
1. Introduction
Pulse-detonation engines (or PDE) have received increased attention in the past decade due to
their potential for higher overall thermal efficiency. A PDE has fewer moving parts than a gas
turbine or internal combustion engine, making it also attractive from a reliability and mechanical
standpoint. PDE’s operate in a similar intermittent-manner as pulse-jet engines, but with a
different combustion process: detonation. Entropy is maximized during deflagration [1] (i.e.
‘normal’ combustion), thus making it the least efficient way of burning fuel. Detonation is an
alternate, supersonic type of combustion which in addition to (chemically) releasing heat, also
increases the burning gas pressure. To date, no PDE has been put into production. Most of the
existing PDE prototypes (from Caltech, University of Texas, and USAF) focus on thrust
production.
The author previously performed testing of a privately-funded Pulse Detonation Engine prototype
at Embry-Riddle’s Gas Turbine Lab. This prototype differs because it claims to employ detonation
to spin a shaft rather than producing thrust. Almost every motor and engine, whether used for
transportation, industrial or power generation, has a rotating axle as the de-facto power transfer
mechanism. The observations and experiences learned from testing the aforementioned
prototype finally helped the development of this paper.
1.1 Problem statement
From a theoretical standpoint, detonation has been shown to be more thermally efficient than low-
speed, normal deflagration. In an oil-dependent world, it shouldn’t be a surprise to hear that
detonation is receiving renewed interest from the scientific community. Yet a practical detonation
device, industrial or commercial, seems to be a few years (if not decades) away. Previous
research has been focused on using highly detonable fuels, such as hydrogen, or pure oxygen
instead of air. These two conditions effectively limit detonation to laboratory-only situations.

2
Although the first detonation models were developed over a century ago, between 1899 and 1905
by Chapman and Jouguet, detonation still remains an unpractical, theoretical concept described
in combustion books. The problem lies in achieving detonation in a practical, controlled,
consistent and repeatable manner. To achieve detonation, either direct detonation or deflagration
to detonation transition (DDT) methods have been used.
Direct detonation entails releasing sufficient energy into a combustible mixture so that a
detonation wave is directly formed. Energy levels vary up to millions of Joules, depending on the
fuel and oxidizer being used. The methods used to deliver such energy are numerous, including
plasma or corona-type electrical discharges, lasers, and perhaps the most obvious: explosives.
Any of these methods remain clearly impractical outside research facilities.
DDT on the other hand, employs a much less drastic approach. Using a conventional consumer-
grade ignition system, the resulting flame accelerates inside a chamber with obstacles until it
transitions into detonation speeds. The main drawback with this approach is that the required
distance for the wave to reach the CJ velocity (the supersonic speed at which detonation is
stable) can be substantial. Depending on the fuel and oxidizer used, this distance can vary from a
few inches to several feet.
Several authors have previously studied the effects of obstacles inside detonation tubes and their
effects on DDT length [8] [10] [11]. All studies have used specific geometries, either by using
Shchelkin spirals (coil springs) or fixed discs with a small orifice located inside the tube. Wire-
wound spirals cannot withstand the high pressures and temperatures of detonation, and previous
experiments showed they tend to disintegrate after a few cycles [8]. Most studies have been
performed using small diameter tubes (less than 2 inches) with spirals inside them. This severely
limits the mass flow through the device, thus limiting the amount of thrust and/or power generated
by detonation. Other studies [10] [11] have used highly detonable mixtures (such as hydrogen
3
and pure oxygen) with discs inside the tube. However, the use of pure oxygen limits the
implementation and operation of such devices to laboratory conditions.
This paper explores the experimental results aimed to achieve detonation by DDT in a 4-inch ID,
6-foot long tube. In order to keep the experiment conditions as practical as possible, pure oxygen
will be avoided, if only used to verify theoretical results. Therefore, consumer-grade LPG and air
will be used. The selection of a 4-inch tube was made in order to allow one full detonation cell to
pass through (see the following section), and to increase mass flow which would increase thrust
and/or power on a PDE. Obstacles used inside the tube will be assembled using discs with
different size orifices, limited by the length of the tube. The ideal disc stack will achieve the fastest
flame speed within the tube.
The findings from this project will help develop easier, economical and more effective methods for
building the next Pulse Detonation Engine prototypes. It will also provide a better understanding
of detonation requirements regarding overall device dimensions as well as ignition systems.
However, in order to better understand the nature and difficulty of detonation, a quick review of
some combustion basics is warranted.
1.2 Combustion and Detonation
Combustion can be either subsonic (deflagration) or supersonic (detonation). During deflagration,
heat is released due to the chemical reaction between fuel and oxidizer: a slight expansion
lowers the final pressure of the gas (unless the reaction is carried out in a closed chamber) [2].
Gas downstream the flame front moves away from the flame. Deflagration can be modeled as an
isobaric heat addition process.
Detonation is the combustion of a fuel and oxidizer mixture, where the combustion wave travels
at supersonic speeds relative to the upstream gas mixture [2]. Unlike deflagration, detonation
compresses the gas due to the supersonic wave. During detonation, downstream gas follows the
4
flame front. Although simplified, a conservative assumption is that detonation can be modeled as
an isochoric (constant volume) process.
Previous studies have shown that for unsteady combustion, total entropy gain is lower for
detonation. However, when the same analysis is applied to a steady-state process, detonation is
shown to have a greater entropy gain than deflagration. Therefore, detonation has potential when
used on pulsed, unsteady, cyclical devices [1].
Chapman and Jouguet (CJ) independently developed the basic thermodynamic model behind
detonation. The CJ model describes the interaction between Rayleigh and Rankine-Hugoniot
curves, defining the physically possible states that a thermodynamic process is bound to. The CJ
model shows that detonation reaches equilibrium speed as the combustion wave reaches the
speed of sound in the local wave frame of reference. From here, pressure and density can be
easily calculated.
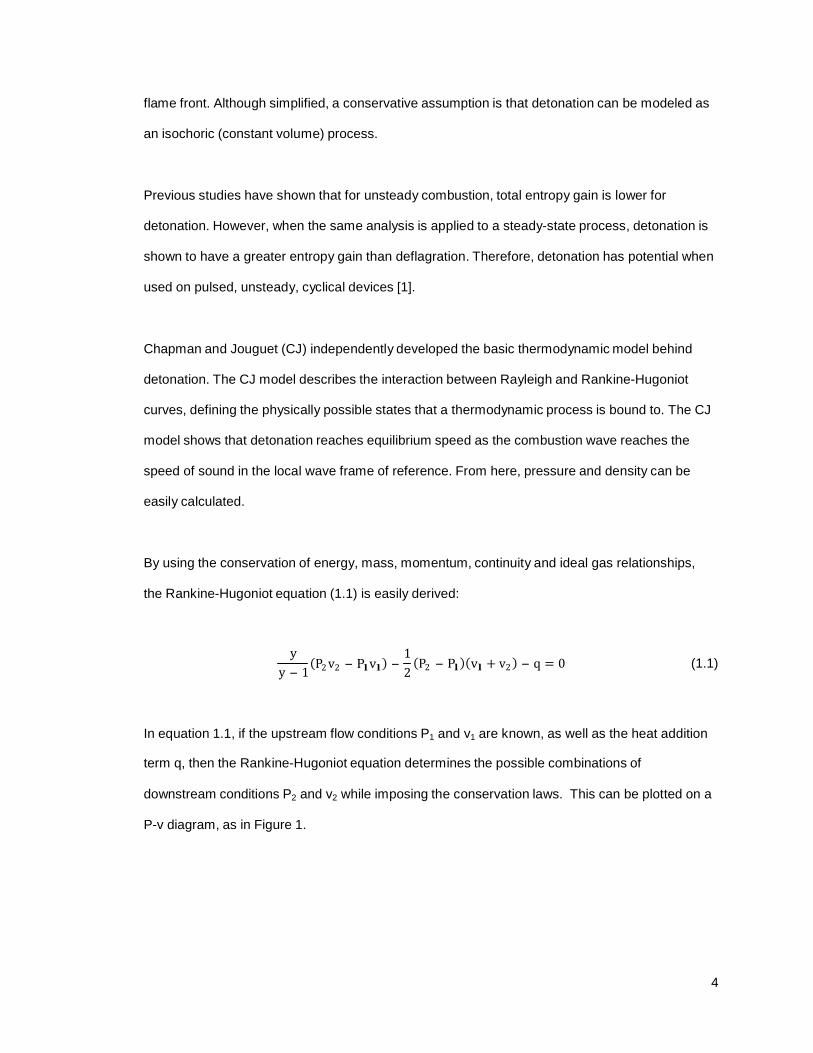
By using the conservation of energy, mass, momentum, continuity and ideal gas relationships,
the Rankine-Hugoniot equation (1.1) is easily derived:
y
y - 1 (P2 v2 - Pl vl ) -
1 2
(P2 - Pl )(vl + v2 ) - q = 0 (1.1)
In equation 1.1, if the upstream flow conditions P1 and v1 are known, as well as the heat addition
term q, then the Rankine-Hugoniot equation determines the possible combinations of
downstream conditions P2 and v2 while imposing the conservation laws. This can be plotted on a
P-v diagram, as in Figure 1.
5
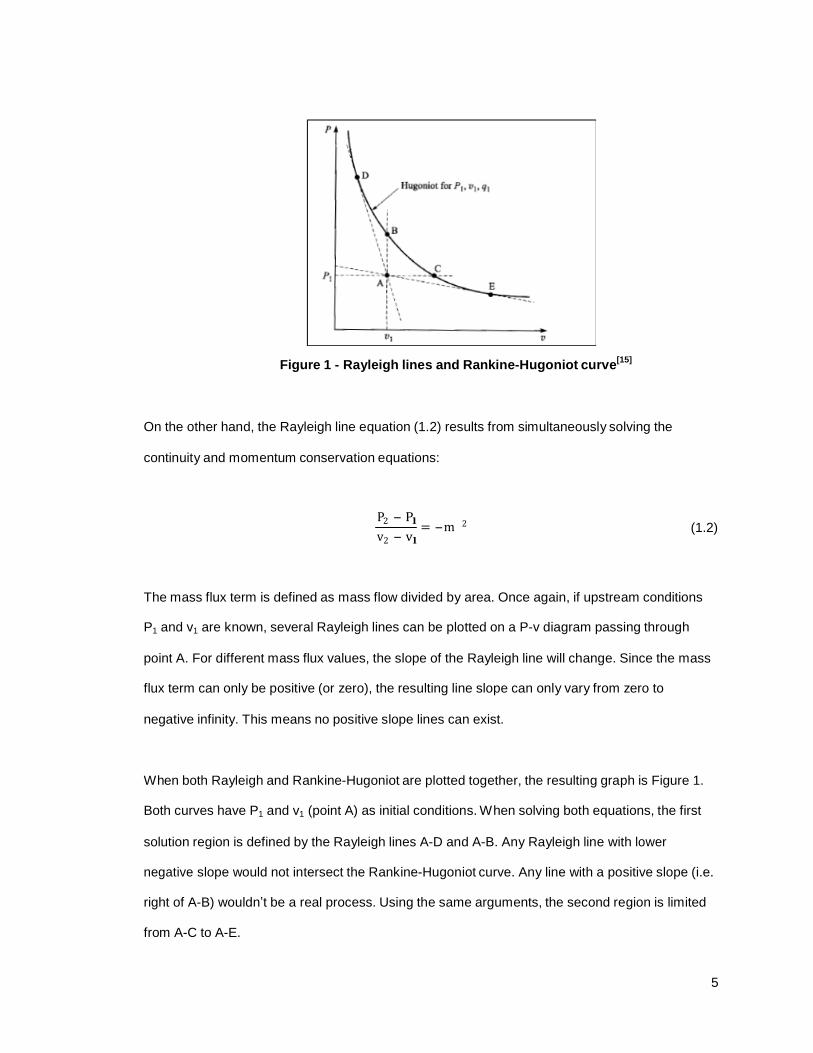
Figure 1 - Rayleigh lines and Rankine-Hugoniot curve[15]
On the other hand, the Rayleigh line equation (1.2) results from simultaneously solving the
continuity and momentum conservation equations:
P2 - Pl
v2 - vl
= -m 2 (1.2)
The mass flux term is defined as mass flow divided by area. Once again, if upstream conditions
P1 and v1 are known, several Rayleigh lines can be plotted on a P-v diagram passing through
point A. For different mass flux values, the slope of the Rayleigh line will change. Since the mass
flux term can only be positive (or zero), the resulting line slope can only vary from zero to
negative infinity. This means no positive slope lines can exist.
When both Rayleigh and Rankine-Hugoniot are plotted together, the resulting graph is Figure 1.
Both curves have P1 and v1 (point A) as initial conditions. When solving both equations, the first
solution region is defined by the Rayleigh lines A-D and A-B. Any Rayleigh line with lower
negative slope would not intersect the Rankine-Hugoniot curve. Any line with a positive slope (i.e.
right of A-B) wouldn’t be a real process. Using the same arguments, the second region is limited
from A-C to A-E.
6
This divides the Rankine-Hugoniot curve into 5 sections. To the left of point D, a subsonic ‘strong
detonation’ area is defined. From D to B, a supersonic ‘weak detonation’ area is defined. The
section B-C is not a real process. From C to E, a subsonic ‘weak deflagration’ region is defined.
Below E, a supersonic ‘strong deflagration’ zone exists. The strong detonation and strong
deflagration areas are mathematically possible, but such phenomena rarely exist [15].
Typical values for detonation wave velocities are Mach 5-10. For comparison, air-hydrocarbon
mixtures deflagrations rarely exceed 1 m/s [2] [15].
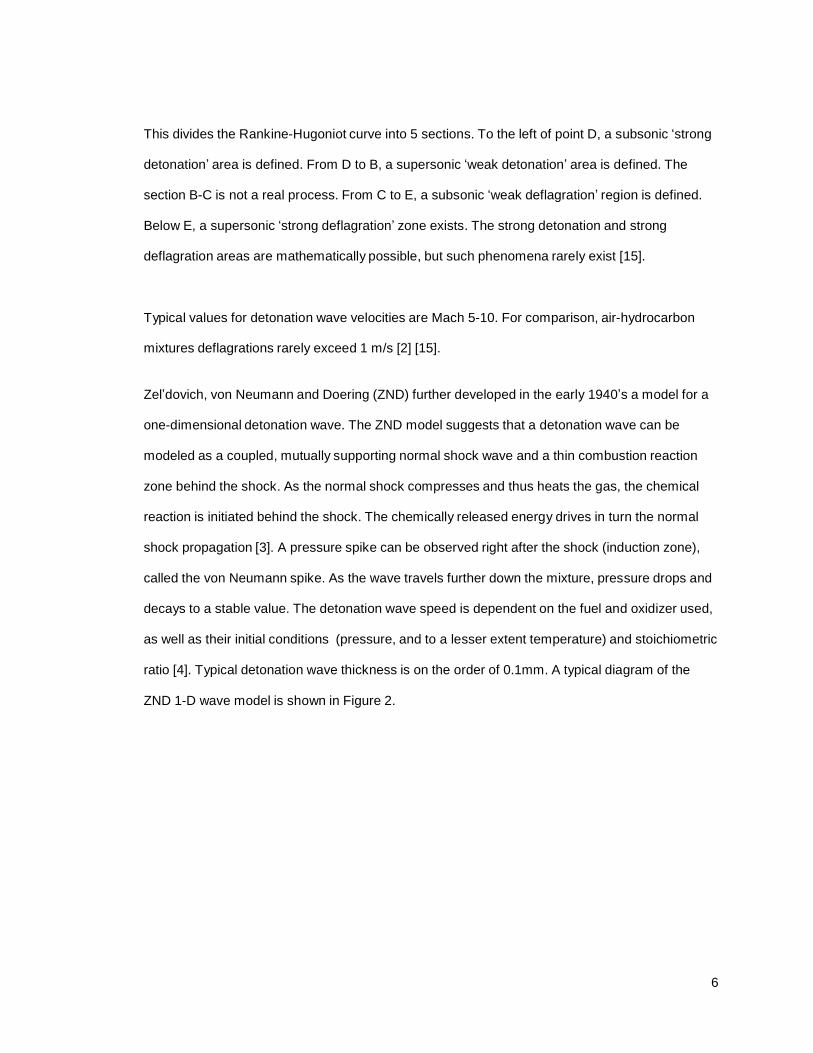
Zel’dovich, von Neumann and Doering (ZND) further developed in the early 1940’s a model for a
one-dimensional detonation wave. The ZND model suggests that a detonation wave can be
modeled as a coupled, mutually supporting normal shock wave and a thin combustion reaction
zone behind the shock. As the normal shock compresses and thus heats the gas, the chemical
reaction is initiated behind the shock. The chemically released energy drives in turn the normal
shock propagation [3]. A pressure spike can be observed right after the shock (induction zone),
called the von Neumann spike. As the wave travels further down the mixture, pressure drops and
decays to a stable value. The detonation wave speed is dependent on the fuel and oxidizer used,
as well as their initial conditions (pressure, and to a lesser extent temperature) and stoichiometric
ratio [4]. Typical detonation wave thickness is on the order of 0.1mm. A typical diagram of the
ZND 1-D wave model is shown in Figure 2.
7
Figure 2 - ZND 1D model detonation wave
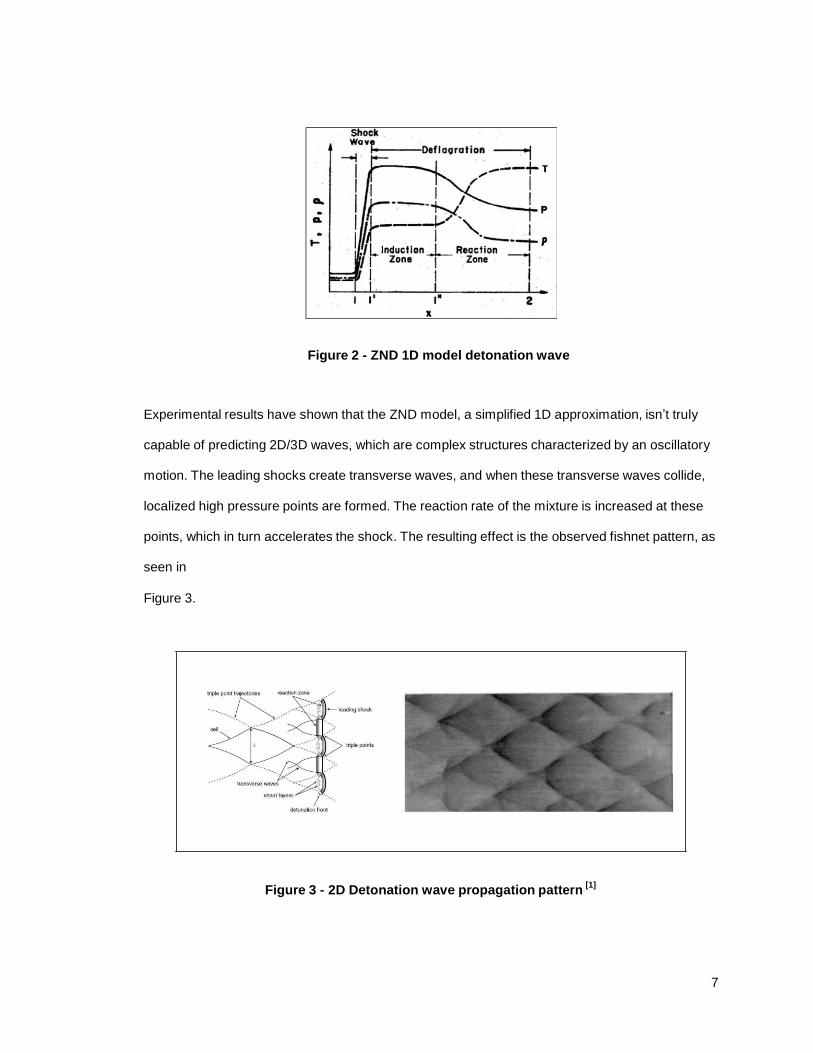
Experimental results have shown that the ZND model, a simplified 1D approximation, isn’t truly
capable of predicting 2D/3D waves, which are complex structures characterized by an oscillatory
motion. The leading shocks create transverse waves, and when these transverse waves collide,
localized high pressure points are formed. The reaction rate of the mixture is increased at these
points, which in turn accelerates the shock. The resulting effect is the observed fishnet pattern, as
seen in
Figure 3.
Figure 3 - 2D Detonation wave propagation pattern [1]
8
An important wave parameter is the cell width, λ, seen in
Figure 3. The cell size is dependent on the fuel and oxidizer used, stoichiometric ratio, initial
pressure and temperature. To ensure detonation propagation, any detonation tube must be large
enough to accommodate at least one complete detonation cell.
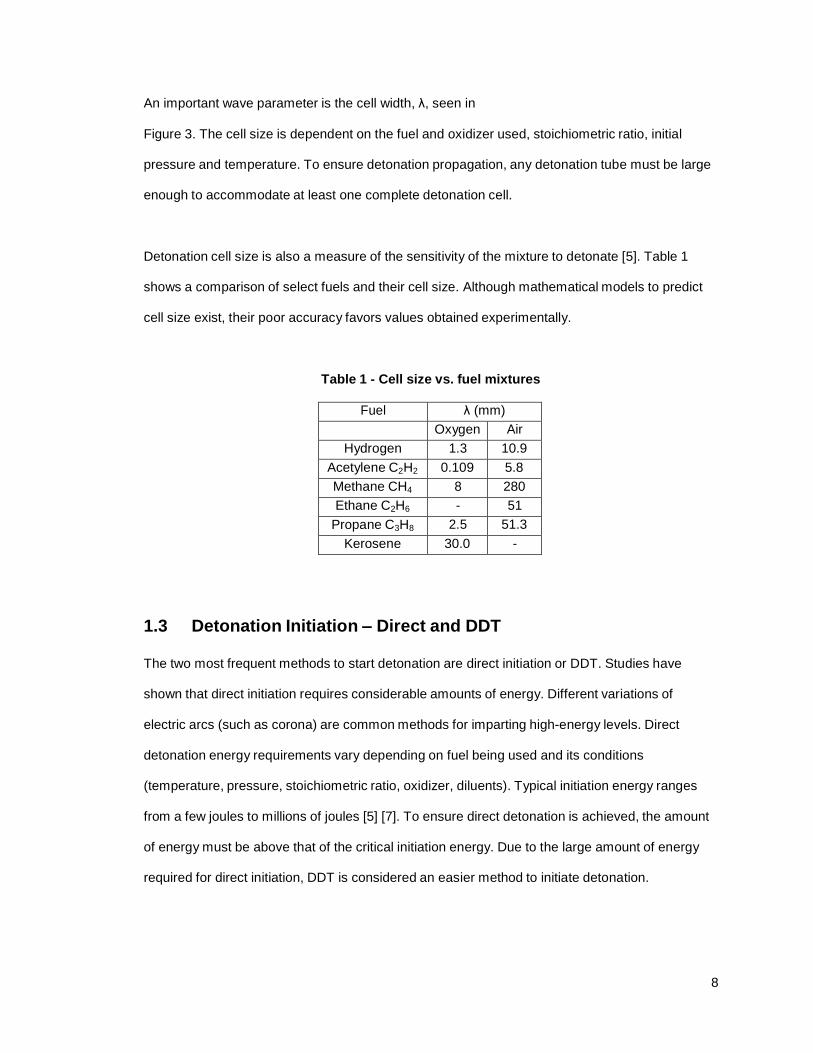
Detonation cell size is also a measure of the sensitivity of the mixture to detonate [5]. Table 1
shows a comparison of select fuels and their cell size. Although mathematical models to predict
cell size exist, their poor accuracy favors values obtained experimentally.
Table 1 - Cell size vs. fuel mixtures
Fuel λ (mm)
Oxygen Air
Hydrogen 1.3 10.9
Acetylene C2H2 0.109 5.8
Methane CH4 8 280
Ethane C2H6 - 51
Propane C3H8 2.5 51.3
Kerosene 30.0 -
1.3 Detonation Initiation – Direct and DDT
The two most frequent methods to start detonation are direct initiation or DDT. Studies have
shown that direct initiation requires considerable amounts of energy. Different variations of
electric arcs (such as corona) are common methods for imparting high-energy levels. Direct
detonation energy requirements vary depending on fuel being used and its conditions
(temperature, pressure, stoichiometric ratio, oxidizer, diluents). Typical initiation energy ranges
from a few joules to millions of joules [5] [7]. To ensure direct detonation is achieved, the amount
of energy must be above that of the critical initiation energy. Due to the large amount of energy
required for direct initiation, DDT is considered an easier method to initiate detonation.
9
DDT starts with a low-energy spark, which initiates deflagration in the gas mixture. As the flame
travels through the combustion chamber, heat, pressure, and turbulence accelerate the flame
until it reaches the speed of sound in the flame frame of reference, thus transitioning into a
detonation wave. Obstacles placed inside the chamber can help accelerate the flame in a shorter
distance. The Shchelkin spiral is perhaps the most common method used to partially block the
chamber and induce DDT. The most important parameter for the spiral is the blockage ratio
(BR), as shown in Figure 4. A similar definition for BR is used for obstacles such as discs with an
orifice. Previous studies have shown that the spiral can be worn down after only a few
detonations [8]: see Figure 5. For DDT to occur, the chamber (or detonation tube) must be long
enough to ensure deflagration has sufficient distance to transition into detonation.
Figure 4 - Shchelkin spiral [8]
Figure 5 - Shchelkin spiral degradation after testing [8]
An interesting study showing different regimes for flame acceleration using discs was presented
by Lee et al. in 1984 [19]. In their experiment, flame acceleration was measured in different tubes
ranging from 11 to 17 meters long. They identified four different regimes for flame acceleration:
10
quenching, choking, quasi-detonation and CJ. In quenching, the flame initially accelerates and
then self-extinguishes after passing through a certain number of discs. In choking, the wall friction
and heat addition balance out, thus the flame reaches an equilibrium speed below the local sonic
conditions. The discs effectively ‘choke’ the flame speed. In quasi-detonation, detonation is the
propagation mode of the flame, but the momentum loss of the gas due to the obstacles and
friction losses prevents it from reaching the CJ conditions. It was found that in the quasi-
detonation and choking regimes, wave speed was very similar (around ~1000m/s in both cases).
Finally, when detonation is achieved and the obstacles do not interfere with the wave
propagation, CJ velocities are reached.
1.4 Pulsed Detonation Engine (PDE)
Ultimately, PDEs will use detonation and extract work from the burning gases. PDE prototypes
have an unsteady nature: after detonation takes place, burnt gases must be expelled and fresh
mixture fed to the chamber before a new detonation cycle can take place. Therefore, engine total
output power will be proportional to its operating frequency. Mechanical and flow considerations
currently limit the frequency at which prototype PDEs can operate. Let’s compare PDE efficiency
with a gas turbine engine by considering Figure 6.
Figure 6 - Brayton and Humphrey cycles P-V and T-s diagrams[3]
Traditional gas turbines operate on the Brayton cycle (0-1-4-5-0). A PDE engine can be modeled
by the Humphrey cycle (0-1-2-3-0), where combustion (1-2) is an isochoric heat addition process.
11
T
T
The T-s diagram in Figure 6 shows that during detonation (1-2), final entropy is lower and
pressure is higher for the Humphrey cycle (points 2 vs. 4). Due to the additional pressure, the
expansion process (2-3) can achieve a larger temperature drop, which results in additional work
performed by the gas. It should not be surprising that cycle efficiency for a PDE could be much
higher than an equivalent engine operating on the Brayton cycle. Assuming ideal gas, the
efficiency for both cycles are given by the following equations [2]:
TO ton = 1 -
l
(1.3)
Th O
l
T2 y - 1
Tl
(1.4)
Htaph e = 1 -
l
* y
T2 - 1 Tl
Comparing equations 1.3 and 1.4, the Humphrey cycle has an additional term which is always less
than unity. The additional term makes the efficiency dependent not only on the temperature ratio
across the compression process, but also on specific heats and temperature ratio across the
combustion process. Since the additional term is less than unity, an engine based on the
Humphrey cycle will have a greater efficiency than a Brayton one, provided compression (hence
temperature) ratios are similar.
When comparing the CJ and isochoric model gas final conditions, one can observe that CJ
conditions are even higher than that of an isochoric process (Humphrey). A more accurate
thermodynamic cycle for an ideal PDE is the Fickett-Jacobs (FJ) cycle [6] [1]. The basics of FJ
are a cylinder and piston forming a closed system. The system is considered adiabatic, and the
mass inside the cylinder is also fixed. Detonation occurs within the cylinder and its contents are
brought back to initial conditions. The FJ cycle efficiency also depends on gamma, so a specific
fuel and initial conditions are needed. A more in-depth explanation of the FJ cycle is given in [1].
Figure 7 shows a comparison made between all three cycles, for stoichiometric propane-air
mixtures at 300K and 1 bar initial conditions. All calculations are assumed to be ideal cases, no
12
losses, with isentropic compression and expansion. It is now clear to see the tremendous benefits
of detonation when applied to a PDE.
Perhaps the most obvious difference is that even without compression (i.e. π = 1), the efficiency
of the FJ cycle can exceed 30% where it would be zero for Brayton. As compression ratio
increases, the difference is reduced, yet still being significant.
Figure 7 - Thermal Efficiency vs. Compression Ratio
[1]
1.5 Literature survey
Detonation experiments have been well documented throughout the 20th
century. With the theory
set by the CJ model around 1900, newer ideas began to develop during the early and mid-20th
century. Due to the nature of detonation, it shouldn’t be a surprise that most developments
happened during times of war. Russians, Germans and Americans greatly contributed to what we
know about detonation today.
Against popular belief, the German V-1 missile used during World War II had a pulse jet engine
operating with deflagration, not detonation. The heavily used V-2, unlike the V-1, switched to
liquid fuels instead.
13
In a similar way as with the CJ model, independently developed by Chapman and Jouguet, the
ZND model is named after Zeldovich (Russian), von Neumann (Hungarian-American) and Doring
(German), who each independently developed a one dimensional model to physically explain the
thermodynamics behind the CJ theory. They published their works in 1940, 1943 and 1960
respectively.
Earlier experiments by Kayushin [16], tried to explore the effects of wire mesh placed inside a tube
on flame speed. Although using hydrogen and oxygen –perhaps the most easily detonable
mixture– the author found, by using Schlieren devices, that immediately after the wire mesh flame
speed seemed to accelerate. Grids were characterized by a non-dimensional number, relating the
number of elements in a grid and the diameter of its elements. Kayushin also experimented with
what he called diaphragms: essentially similar to a disc with an orifice. He found that as BR
increased, the flame speed after the obstacles increased, initially exceeding CJ speeds, settling
to CJ speeds. Hydrogen and oxygen mixtures have a cell size of around 1.3mm. His experiments
were carried out in a tube only 17.5 cm long.
Perhaps the most renowned device known to obtain detonation is the Shchelkin spiral, named
after (Russian) Kirill Ivanovich Shchelkin. His earlier works (circa 1949) included studies about
wall surface roughness and its effect on the velocity of flames. He published his findings about
using a spiral as an obstacle and how it accelerated the flame velocity within the tube. The BR
parameter is again mentioned as one of the most important spiral characteristics [8].
A recent study using discs as obstacles was performed by Chapin [18]. Discs with orifices were
mounted inside a tube to help shorten the DDT length. Hydrogen-air and ethylene-air mixtures
were used in the study. Experiments were carried out in a 2” diameter, 40” long clear
polycarbonate tube and a high-speed camera. Detonation was achieved within the tube length.
Chapin concluded that BR, length of DDT section and spacing between obstacles all affected the
required distance for detonation. Consumer-grade LPG and air mixtures were not tested.
14
Throughout the last decade, the University of Texas at Arlington has conducted several
experiments and published numerous papers. A description of most experiments and their results
can be found in Panicker’s Ph.D. dissertation [17]. Testing was performed using propane and
oxygen mixtures. Several setups have been tested, including 0.75” ID and 1” ID tubes, Shchelkin
spirals, rotary valves, water-cooled assemblies, converging-diverging nozzles, liquid-fuel
injectors, and also a turbocharger turbine on an attempt to extract power from the gas. Albeit
detonation was present on all setups, they didn’t achieve it in a consistent manner. In one of their
latest papers [18], they even conclude that a clean-tube configuration had the best detonation
success-rate over multiple firings.
Caltech’s Explosion Dynamics Laboratory hosts a very useful detonation database on their
website. They host data from over 130 different publications containing experimental detonation
data. The website shows the data based on different parameters such as cell size, tube diameter,
and critical energy, among others. It is interesting to note that for the proposed fuel (propane) and
air mixture, λ lies between 50 and 130mm, with the smallest size corresponding to a
stoichiometric mixture. The critical energy to achieve direct detonation lies in the 200 kJ range. If
direct detonation were to occur inside an engine at, say 20 times per second, the required
initiation energy would equal approximately 4MJ/s, which means four megawatts for the ignition
system alone. It should become clear to the reader why direct detonation methods can be
impractical, to say the least.
Throughout the published papers, it would seem that researchers have avoided the use of
LPG/propane and air, perhaps due to its relatively larger cell size. Although this mixture lies
somewhere in the low-end of detonation sensitivity, it may be the most easily obtainable fuel for a
commercial application. The experiments described in this paper are, for practicality reasons,
restricted to LPG and air mixtures.
15
2. Test equipment and methodology
2.1 Methodology
This project focuses on a larger diameter (~4 inch ID) detonation tube, using readily available LPG
(liquefied petroleum gas) and air mixtures. The tube is split into three sections. The center tube
section allows the installation of a ‘cartridge’ consisting of discs with an orifice. The discs are
secured on threaded rods, allowing the cartridge to be easily installed and removed from the
tube. Testing was performed with several cartridge configurations in order to determine an
optimal geometry, where the final flame speed is maximized in the available tube length. Figure 8
shows a diagram of the detonation test tube.
In order to detect detonation, high speed pressure sensors were used. The easiest way to detect
detonation waves is by measuring their speed. Since the distance between two adjacent pressure
sensors is known, the wave speed can be calculated by measuring the time it takes for the
pressure spike(s) to travel between sensors. From CJ theory (see section 1.2), a theoretical
detonation wave velocity can be calculated and compared with the measurements.
Initial testing was ‘dry’ – i.e. without fuel. The proper operation of the gas injectors, igniter and
pressure sensors was verified. After checking for fuel and/or air leaks, the initial fuel tests were
performed. For safety reasons, the initial fuel tests were carried out progressively by filling the
tube with stoichiometric mixture from 10% up to 120% (tube total volume) in 10% increments.
This ensured early detection of any possible flaws in the mechanical and/or electro-mechanical
parts. All tests were performed by initially purging the tube with at least 80% (total volume) pure
oxidizer.
16
Figure 8 - Proposed detonation test tube (not to scale)
Fuel testing was initially performed on an empty tube, to determine a baseline case. This
configuration should achieve deflagration speeds near the spark plug, with flow accelerating
towards the open-end of the tube due to heat addition (gas expansion) and friction.
Once a disc cartridge was installed, different equivalence ratios for the air/fuel mixture were
tested, ranging from lean to rich until the mixture failed to ignite using the available ignition
system. All equivalence ratios were tested with different fill rates (80%, 100% and 120%).
Cartridges with different disc spacing and BR were tested using the same procedure. Up to a
maximum of 14 discs were installed on a single cartridge, with a corresponding minimum disc

17
spacing of 3 inches. Discs with a BR of 30, 45, 60 and 75 (as defined in Figure 4) with spacing of
3, 4.5 and 6 inches were tested. Full and half-cartridges (half the discs) were also tested. Figure 9
shows the different test configurations using a tree diagram; only one branch is fully expanded
with equivalence ratio (l) and fill rates due to space limitations.
L
Overall, 479 firings were recorded using LPG and air mixtures, and an additional 3 using pure
oxygen. After all data was collected, the results were analyzed and discussed.
18
Figure 9 - Test configurations (abbreviated)
19
2.2 Equipment layout
The DDT tube was built with a modular design in mind: it is comprised of three sections. The first
section contains the mixture injection ports together with an ignition spark plug. The use of
standard flanges between sections allows quick and easy cartridge changes inside the center
section. The third section contains sensors to measure pressure and wave speed, as shown in
Figure 8.
The initial section held the fuel and oxidizer injection pipes and spark plug. In order to minimize
injection time, pressurized LPG and oxidizer were used. This ensured the detonation tube was
purged and filled in a relatively short time, keeping losses through the tube’s open-end to a
minimum. Injection was controlled by electrically operated solenoid valves and high-pressure
check valves. The solenoids were controlled and timed by the Data Acquisition Board (DAQ).
The injector pipes were welded in a tangential pattern. This geometry helps maximize turbulence
(hence mixing of fuel and oxidizer) and maintain gas velocity inside the tube. Three different
tangential configurations were considered. In the first two cases both pipes were as close as
possible to each other (around 45° from each other) , with oxidizer being injected ahead of fuel
and vice versa. The third case had opposing, staggered pipes. From CFD analysis, it was
observed that the opposing pipes configuration maintained higher gas velocity and provided a
more homogeneous mixture. Figure 10 contains a snapshot of the analysis showing fuel mass
fraction after injection has taken place. A high pressure check valve was mounted at the end of
each injection pipe to prevent any backflow or flame travelling back into the supply lines. The
initial section also held the spark plug. The ignition system comprised an automotive-grade
ignition module and matching coil connected to the spark plug. A modified spark plug was used to
ignite the mixture in the chamber (see equipment description). The ignition system was also
controlled by the DAQ. The injector valves and ignition system were both powered by a 13.8 VDC
power supply. Figure 11 shows a top view of the injection section with check valves and spark
plug installed. Figure 12 shows the injection ports and spark plug.
20
Figure 10 - Injector configuration comparison
Figure 11 - Injection section top view
21
Figure 12 - Injection section tangential ports and spark plug
The center section was mounted to a stand, hence supporting the ignition and measurement
sections. The disc cartridges were mounted by sliding them into the center section, and secured
with radial bolts at the cartridge ends, Figure 13.
Figure 13 - Center section with cartridge, end-view
The last section of the tube held equally-spaced pressure sensors (<1 µs rise time) connected to
a signal conditioning unit, which ultimately sent a voltage to a digital acquisition system capable
22
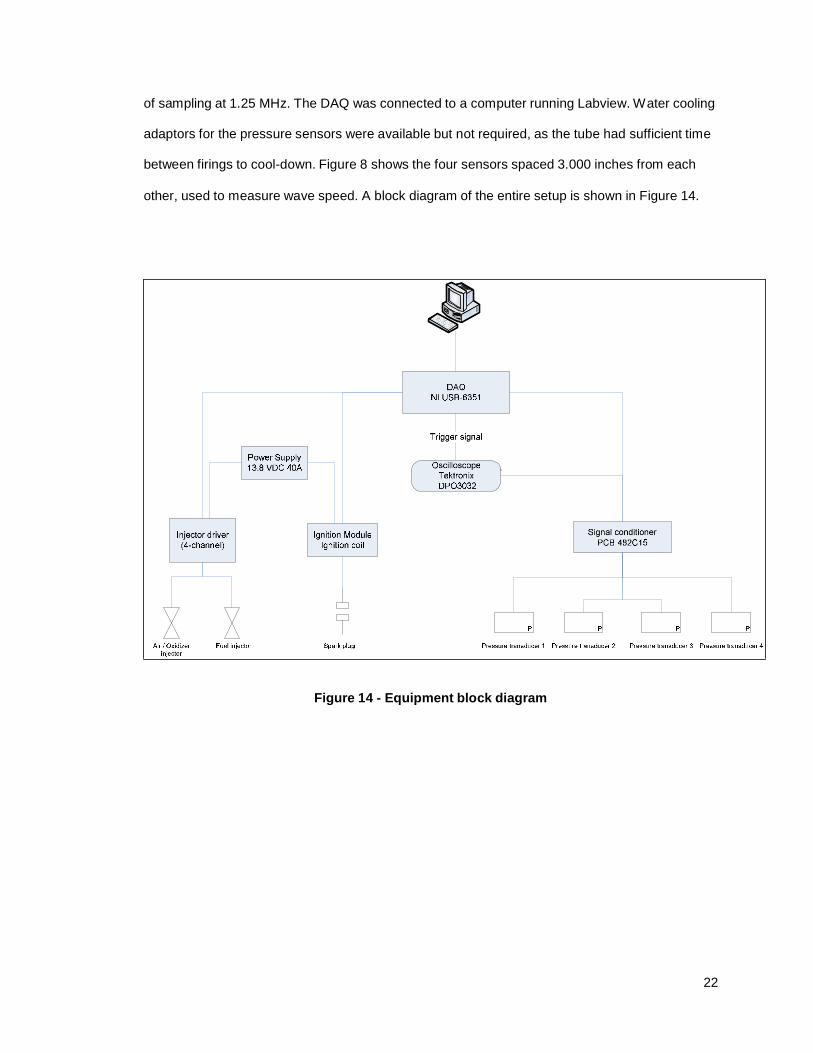
of sampling at 1.25 MHz. The DAQ was connected to a computer running Labview. Water cooling
adaptors for the pressure sensors were available but not required, as the tube had sufficient time
between firings to cool-down. Figure 8 shows the four sensors spaced 3.000 inches from each
other, used to measure wave speed. A block diagram of the entire setup is shown in Figure 14.
Figure 14 - Equipment block diagram
23
2.3 Equipment description
Several aspects of the entire setup were considered. The most important being safety, as the tube
should be able to withstand the pressure of detonation. To evaluate the mechanical requirements
of the tube, the worst case scenario was calculated. Using NASA’s online Chemical Equilibrium
Analysis (CEA) program, the following scenario was considered: for detonation using pure oxygen
and propane from atmospheric starting conditions, the wave Mach number is 7.63. The pressure
ratio is 31.22, which translates to 459 psia. The tube, flanges, gaskets and check valves were
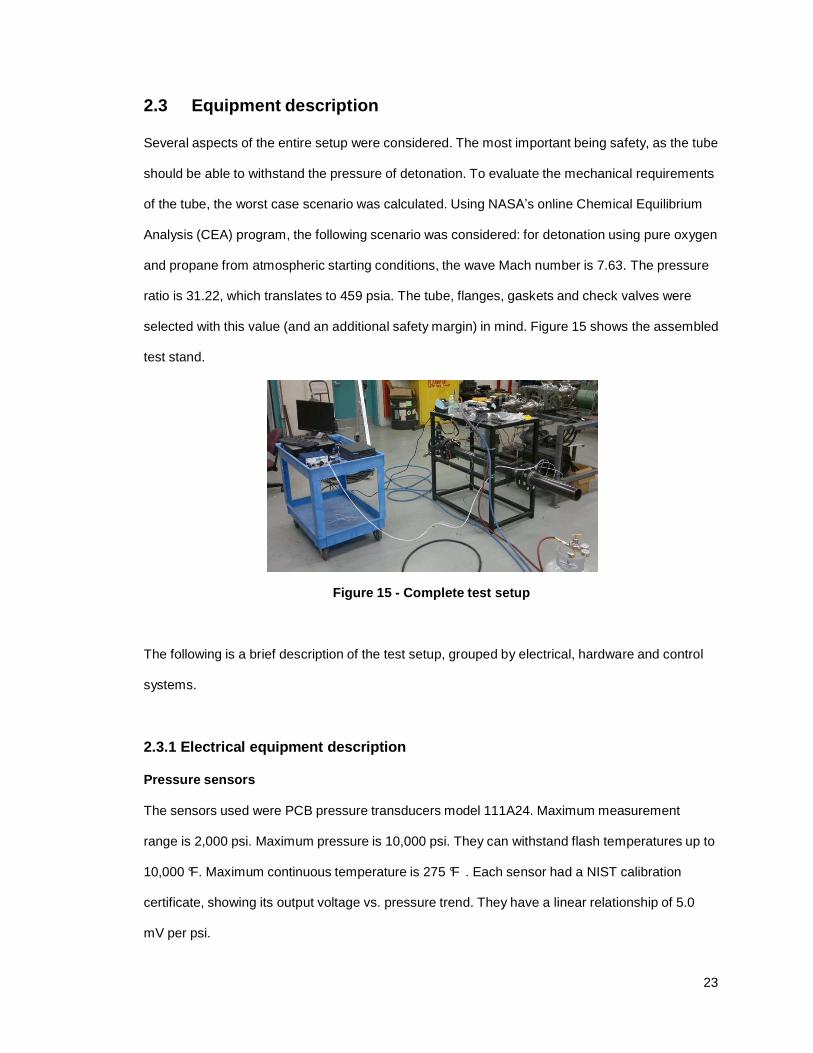
selected with this value (and an additional safety margin) in mind. Figure 15 shows the assembled
test stand.
Figure 15 - Complete test setup
The following is a brief description of the test setup, grouped by electrical, hardware and control
systems.
2.3.1 Electrical equipment description
Pressure sensors
The sensors used were PCB pressure transducers model 111A24. Maximum measurement
range is 2,000 psi. Maximum pressure is 10,000 psi. They can withstand flash temperatures up to
10,000 °F. Maximum continuous temperature is 275 °F . Each sensor had a NIST calibration
certificate, showing its output voltage vs. pressure trend. They have a linear relationship of 5.0
mV per psi.
24
The sensors use a fairly complicated mounting scheme, requiring a custom multiple-section
mounting boss. This mount was machined and later welded to the final section of the tube. A soft-
metal (brass) sealing washer was used between the sensor and the mounting boss. The sensor
chassis is not electrically-isolated. The sensors require a constant current source, making them
insensitive to any resistance and / or voltage drop in the cables. The signal output is AC-coupled.
Signal conditioner
The signal conditioner is a PCB 482C15 unit. It supports up to 4-channels (sensors) with
individually adjustable gains. The signal conditioner provides a constant current source as
required by the sensors. The conditioner included a NIST calibration certificate. The default
current is set to 4 mA. The conditioner output is also AC-coupled.
Data Acquisition Board (DAQ)
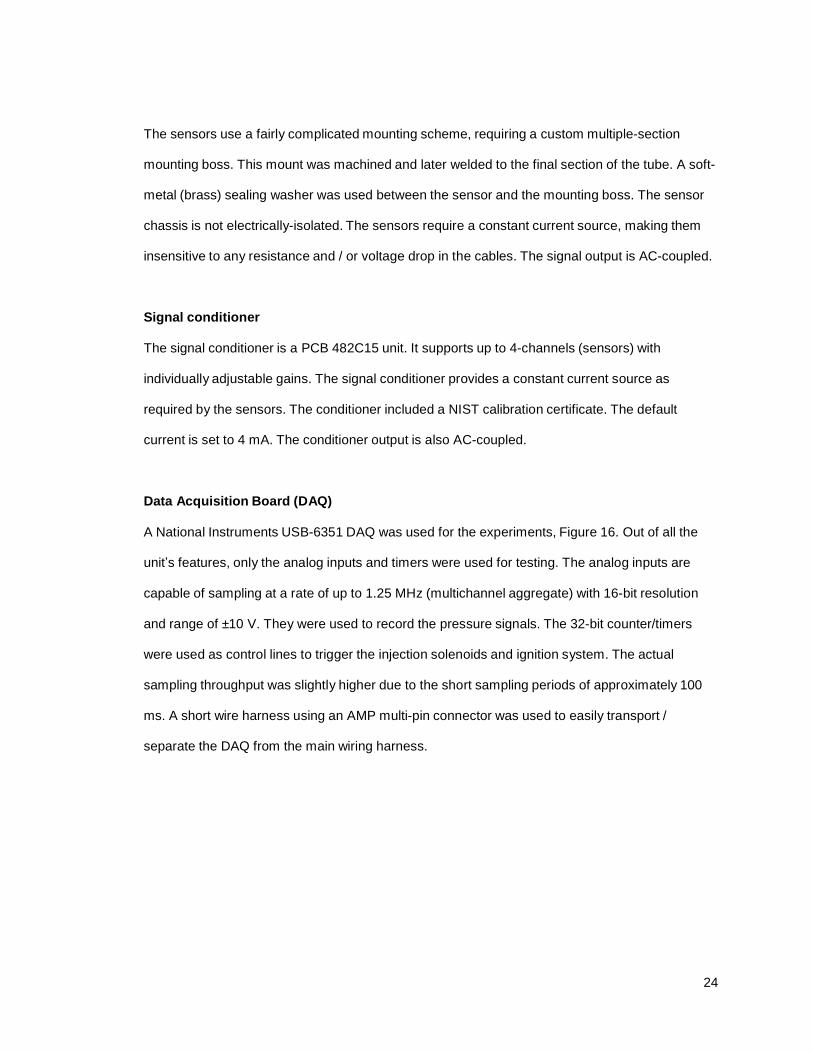
A National Instruments USB-6351 DAQ was used for the experiments, Figure 16. Out of all the
unit’s features, only the analog inputs and timers were used for testing. The analog inputs are
capable of sampling at a rate of up to 1.25 MHz (multichannel aggregate) with 16-bit resolution
and range of ±10 V. They were used to record the pressure signals. The 32-bit counter/timers
were used as control lines to trigger the injection solenoids and ignition system. The actual
sampling throughput was slightly higher due to the short sampling periods of approximately 100
ms. A short wire harness using an AMP multi-pin connector was used to easily transport /
separate the DAQ from the main wiring harness.
25
Figure 16 - DAQ with quick-disconnect harness
Power supply
An adjustable 3-15 VDC 40 A B&K Precision 1692 switching power supply was used to power the
igniter, coil, and the injector driver box. The unit has a fixed-voltage mode (at 13.8 VDC), used for
testing. A digital display on the unit’s front panel shows the output voltage and instant current
draw.
Injector valves
The injector valves are manufactured by AFS, model Gs-series. They are ‘peak-and-hold’ type
valves. In order for them to have a fast response (opening/closing time), a high current must be
initially applied. Once the valve is open, a lower ‘hold’ current is sufficient to keep them open.
This avoids overheating the units. The manufacturer published mass flow vs. time curves were
obtained by using an AFS injector driver box. Therefore, to be able to properly correlate injector
opening time with mass flow, an AFS injector driver box was used.
Injector driver
The injector driver box is an AFS 8-channel unit. It was powered by 13.8 VDC from the power
supply. It automatically provided the peak-and-hold output needed to trigger the injectors, based
on logic-level input signals from the DAQ.

26
Oscilloscope
A Tektronix DPO3032, 300MHz 2-channel oscilloscope was used to compare and verify the
DAQ-acquired data. This unit is capable of sampling up to 2.5 GS/s, with an analog bandwidth of
300 MHz. The scope-supplied 10x probes were used during testing. The unit’s trigger line was
connected to the DAQ igniter signal.
Wiring
Special care was taken to minimize electrical noise as much as possible. Grounding techniques
were in accordance with the DAQ manual, which extensively warns about ground loops. Shielded
wiring was used whenever possible, especially for the signal and control lines from and to the
DAQ. All cable shields were connected to ground on one end only. In order to avoid any
asymmetrical signal delays due to capacitance, inductance, or other wiring-induced effect, equal-
length cables were used from the DAQ to the signal conditioner and to the pressure sensors. For
safety reasons, wire length was sufficient to allow the DAQ and computer to be located in a
separate room.
The cable running from the pressure-sensors to the signal conditioner was a low noise, PCB-
brand shielded coaxial cable. The required BNC connectors were pre-installed on the cable. From
the conditioner to the DAQ, individually-shielded twisted-pair BELDEN-brand stranded cable was
used. Similar cable was used for the signal lines from the DAQ to igniter and injector driver box.
Oversized 3x10 AWG cable was used to connect the power supply to the igniter and injector
driver box. Two lines carried the required 13.8 VDC to both devices, while the third line was used
to ground the tube and its stand directly.
Ignition coil and igniter
The ignition module and coil were BOSCH units, fitted to several European cars. They were
powered by the 13.8VDC power supply, using heavy wire as described before. The ignition
27
module is of the ‘dumb’ type: i.e. coil charge time was directly controlled by the DAQ. A wire-
wound noise suppression cable was used to connect the coil to the spark plug.
Spark plug
The spark plug used for all experiments is a modified NGK JR10B unit, normally used on sport-
bike engines, Figure 17. The ground electrode was removed to maximize its gap, thus exposing a
larger amount of fuel/air mixture to the spark. This also increases the amount of energy released
to the gas, provided the coil remains capable of creating a high enough voltage for the arc to
occur. The spark plug temperature range is among the lowest manufactured by NGK. This means
that heat conduction from the spark plug tip to the spark plug body is higher compared to a
regular plug. A cooler plug prevents it from becoming an auto-ignition hotspot.
Figure 17 - Modified spark plug
2.3.2 Hardware description
Tube
The tube was of seamless construction, nominal size 4 inches, schedule 80, conforming to ASTM
A106 Grade B (material properties) and ASME B31.1 pressure piping standards. The tube
manufacturer is Zeleziarne Podbrezova (Slovak Republic - http://www.zelpo.sk). The tube
characteristics are shown in Table 2.
28
Table 2 - Tube characteristics
Nom. ID, inches 4.0 Outer diameter, inches 4.500
Wall thickness, min., inches 0.295 Wall thickness, nominal, inches 0.337
Working pressure PSI (ambient T) 2,300 Yield strength, min, PSI 35,000
Burst pressure PSI (ambient T) 9,000 Tensile strength, min, PSI 60,000
Flanges
The flanges were socket-weld, class 300, conforming to ASTM A105 (material properties) and
ASME B16.5 flange and fittings standard. The strength characteristics are presented in Table 3.
Table 3 - Flange characteristics
Tensile strength, min, PSI 70,000
Yield strength, min, PSI 36,000
ASME B16.5 lists the working pressure for this flange as 740 psi at temperatures below 38°C,
dropping to 635 psi at 200°C. No burst pressures ar e specified. The flanges have the lowest
pressure rating in the whole assembly. A TIG machine was used to weld the flanges to the tube
sections with the appropriate filler rod.
Bolts and nuts
Bolts were selected in accordance with ASTM A193 standards for class 300 flanges, which
specify grade 5 bolts. Nuts were selected in accordance with the corresponding ASTM A194
standard. Flange bolts were torqued down to 257 ft-lbs, also in accordance with standard
practices.
29
Flange gasket
The gasket had a stainless steel wire wound spiral with pure graphite filler construction. It’s able
to withstand up to 850 °F. The gasket outer dimensi ons allowed it to self-center once located
between two flanges.
Injection pipe and check valves
Tangentially-mounted pipes were used to inject the gas into the main tube. Each pipe was 1.25”
OD x 0.5” ID x 6” long. Material is drawn-over-mandrel C 1020 steel. Tensile and yield strengths
are 80,000 and 70,000 psi, better than the main tube and flanges. Each injection pipe had a
check valve installed. Parker valves 8M-C8L-1-B capable of withstanding 3000psi backpressure
were used. They open with only 1psi forward-pressure. The valve fluorocarbon seal is rated for
up to 400°F continuous service.
DDT cartridge
Obstacle discs were laser-cut from 1018 mild steel plate in two thicknesses (½ and ¼ inch thick)
and with blockage ratios of 30, 45, 60 and 75 as defined in Figure 4. The discs had a sliding fit
with the tube center section. The thicker discs were used at the ends of the cartridge for securing
the cartridge to the tube. Six radially-mounted ¼-inch grade 9 bolts were used on each end disc
to fasten the cartridge to the tube. The thinner discs were used to assemble the rest (center) of
the cartridge. Discs were mounted to high-strength grade B16 threaded rods using grade 8 nuts.
The one-piece disc cartridge was able to withstand the effects of combustion much better
compared to previous studies using wire-spirals.
30
Figure 18 - Cartridges and discs
Injector valves block
The injector valves were mounted to a block of aluminum bolted on top of the test stand. The
aluminum block was previously machined so the proper ports required to mount the injectors
were ready. Fuel and oxidizer supply lines were connected to the valve inlet ports, Figure 19
Figure 19 - Injector valves block
31
Test stand
The test stand was also fabricated for this project. Square-section tubing was cut, MIG-welded
and then prepped and painted before securing all the equipment to it.
LPG/air supply
A commercial LPG gas tank was procured for testing. Since LPG composition varies depending
on the origin, the manufacturer MSDS specifies a range of its composition. Table 4 shows the
specified gas composition. In order to control gas pressure (for both oxidizer and LPG), an
adjustable single-stage pressure regulator was used on each line feeding the injector valve block.
A flame arrestor valve was used at the exit of the LPG pressure regulator for extra safety.
Pressurized air was used from the test facility off-site compressor.
Table 4 - LPG composition
Component Percentage
Propane 87.5-100
Ethane 0-7.0
Propylene 0-5.0
Butanes 0-2.5
Ethyl Mercaptan 0-50 ppm
2.3.3 Control system description
The entire system is controlled by the DAQ. The written Labview software is a fully customizable
code allowing the user to select and/or change all experiment parameters such as L, injector duty
cycle, sampling period, pre and post injection delays, fill rate and others. The required constants
are coded in the Labview routine, but they can be easily changed if needed. Constants include
injector mass flow vs. inlet pressure vs. opening time equations, tube geometry (volume) and
density and stoichiometric ratios for fuel and oxidizer.
32
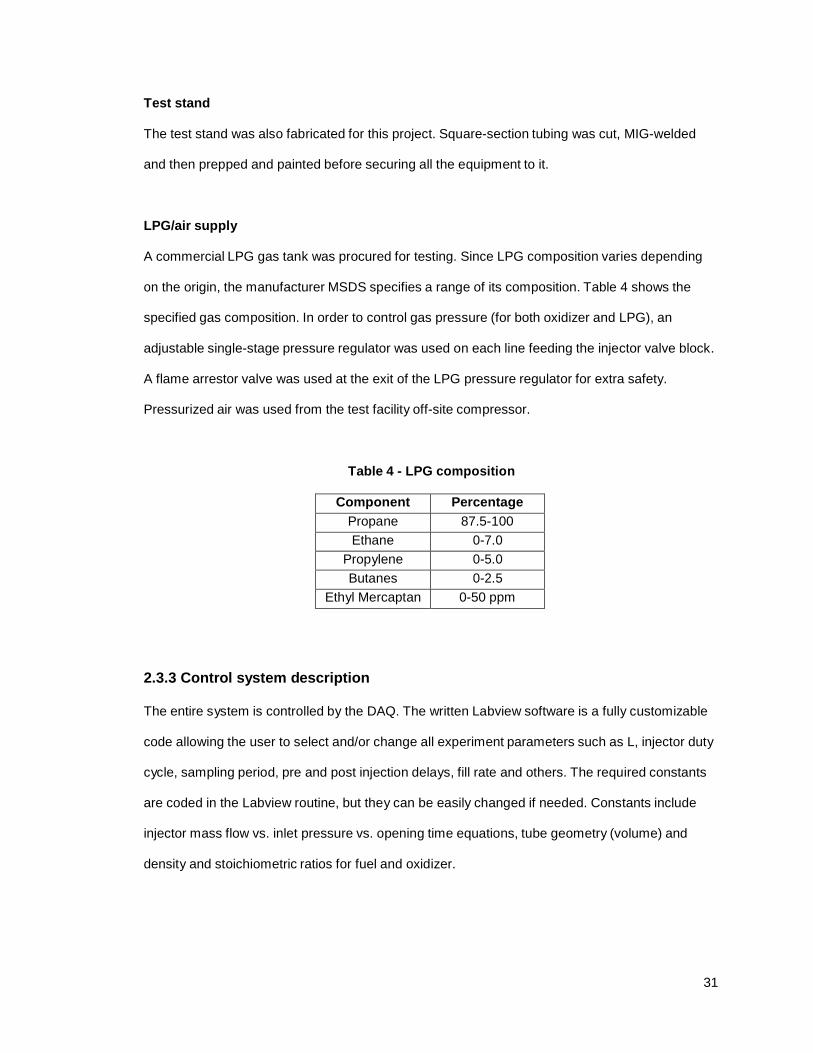
Figure 20 - Labview graphical user interface (GUI)
For each run, specific parameters were selected using the program GUI. These include purge and
fill percentage, L (inverse of equivalence ratio), pre- and post-injection delays, fuel valve injection
period, igniter charge time and DAQ sampling frequency and period. Two ON/OFF buttons allow
the user to independently control either igniter, fuel valve or both for troubleshooting or to carry out
extended purge runs. Figure 20 shows the graphical interface.
When the program is executed, the DAQ triggers the different devices with the appropriate timing
to achieve the desired L, mixing delay, and sampling period. The code has three separate
subroutines; all of them run in parallel once the program starts. The first subroutine calculates the
injection parameters and triggers the injection valves accordingly. The second subroutine controls
the ignition system. The final subroutine contains the sampling code.

33
The first subroutine calculates timing for the injection valves. Based on the user inputs, the code
starts by calculating the total mass of fuel and oxidizer to be injected to achieve the desired fill
rate and L. Oxidizer total mass includes purging and fuel-mixing mass. Based on the oxidizer
pressure line input, the required oxidizer mass is translated to an equivalent injection period. The
fuel mass injected per fuel injection period (a user input) is calculated as well. The total fuel mass
is divided by the mass injected per fuel injection, and the resultant is the number of pulses that
the fuel injector must be triggered for. To calculate timing between each fuel injection pulse (low-
time), the code divides the oxidizer valve time (minus purge time) by number of fuel pulses. The
resultant specifies the total time pert fuel injection cycle (including high and low-time). Finally,
timing for the initial fuel pulse is established so that both fuel and oxidizer valves close
simultaneously after total mass has been injected.
After the pre-injection delay has elapsed, the oxidizer valve is opened for the calculated amount
of time. The oxidizer valve initially purges the tube, yet remains open after purging for additional
oxidizer to be mixed with fuel. After the purge period elapses, the fuel valve is pulsed with the
previously calculated frequency and duty cycle. By closing both valves together, a lean-mixture
gas pocket close to the spark plug is avoided.
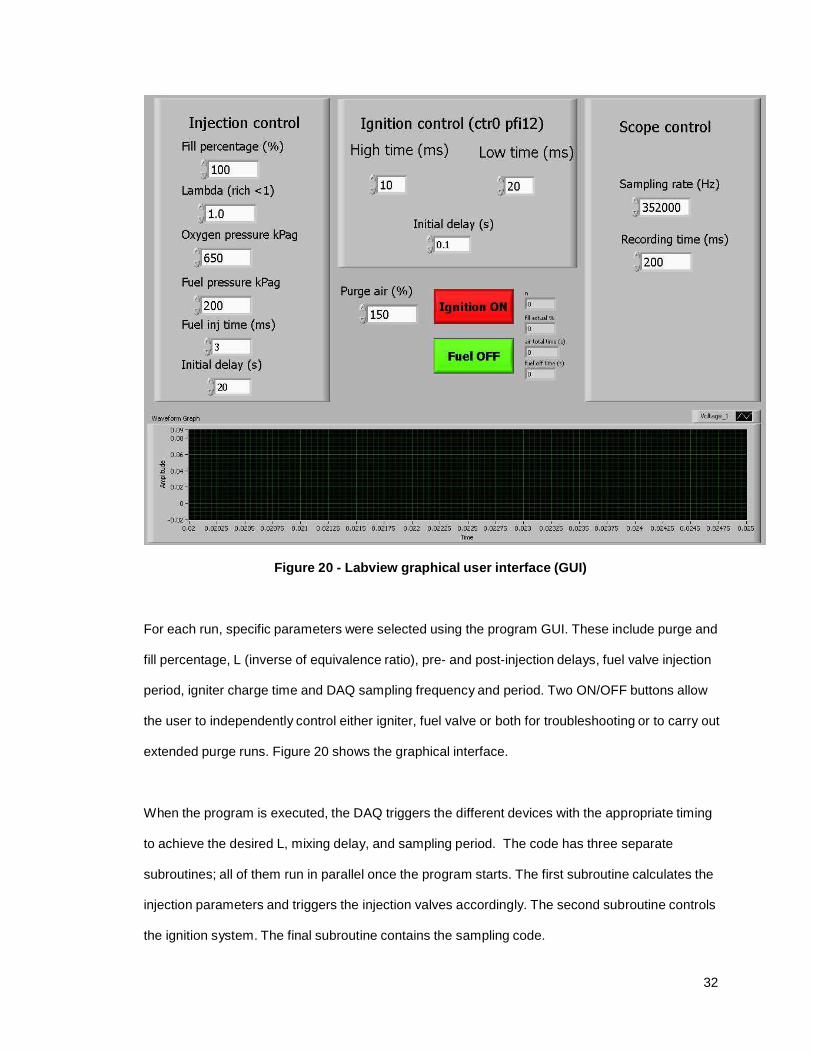
The second subroutine controls the ignition system. Once the required fuel and oxidizer mass are
injected, the DAQ waits for a specified amount of time (to promote mixing) before triggering the
ignition system. The coil is charged for a specific period (usually 10 ms) in order to saturate its
core, thus maximizing the discharge energy. Once the signal drops, the magnetic field collapses
and the stored energy is discharged into the spark plug. Figure 21 shows a simplified sequence
of the DAQ output lines, where the red line represents the oxidizer valve signal, pink the LPG
valve signal, and blue the igniter output.
34
Figure 21 - DAQ output control lines, simplified
The last subroutine contains the code for sampling. The external oscilloscope and this subroutine
are triggered with the rising edge of the coil signal. Once triggered, sampling occurs for the
specified period and frequency. The computer records the data to the hard drive and plots it on
the screen. The oscilloscope also samples for the specified time, and the screen output is saved
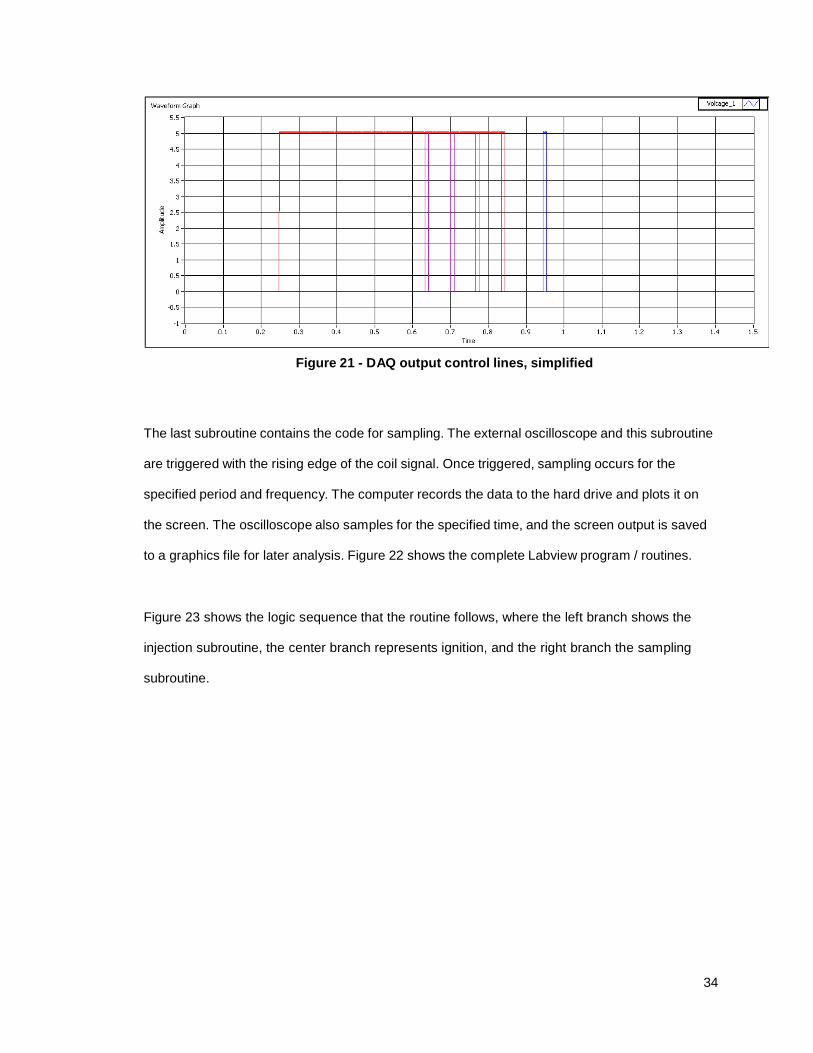
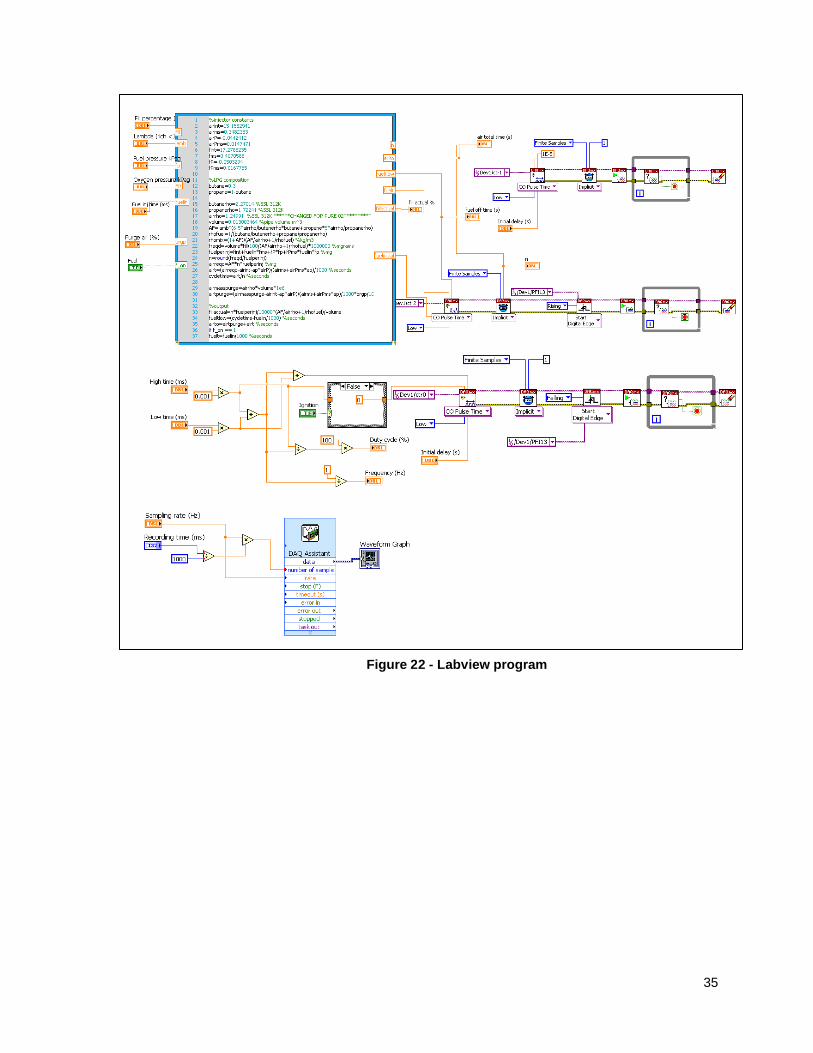
to a graphics file for later analysis. Figure 22 shows the complete Labview program / routines.
Figure 23 shows the logic sequence that the routine follows, where the left branch shows the
injection subroutine, the center branch represents ignition, and the right branch the sampling
subroutine.
35
Figure 22 - Labview program
36
Figure 23 - Labview routine flowchart
37
3. Results and analysis
3.1 Data processing methodology
The tube was fired over 600 times: 482 of them being recorded. The recorded pressure signals
represent over 280 MB of raw data. This required a significant amount of time to analyze. The last
three recordings correspond to oxygen tests, which deserve further special attention. Data was
processed using MATLAB. Two separate programs were written to analyze the data. The first
code calculates basic signal parameters and plots the data for each run. The second code
gathers all the calculated parameters from all runs and then plots overall results.
The first code uses a subroutine from National Instruments to read Labview data into Matlab. The
code then calculates the time difference between each sensor signal, the wave speed for each
sensor pair and its average, the signal rise-time, and each channel’s maximum pressure. Finally,
it plots and displays the calculated values on the figure. The appendix contains all 482 graphs.
Figure 24 shows a sample output from the first code.
Due to the nature of the ignition system, electrical noise is generated (and recorded) during the
ignition coil charge and discharge. For each recorded dataset, the initial 14 ms corresponding to
ignition system noise are deleted. The code then calculates pressure from the voltage data. The
next step is to locate the maximum pressure point for each channel. The code zooms-in to 0.5 ms
before and 1 ms after the earliest maximum pressure point. For each channel, the script then
locates the point where pressure starts to rise. The criteria for locating the rise point is to search
for either the first sample with a value of at least 25% of the channel’s maximum pressure value,
or the first sample to exceed a pre-established pressure level. The time difference between the
rise point and maximum pressure location is calculated and displayed as TR for each channel on
the graph. This indicator is closely related to the pressure spike local first derivative. It is a
numerical indicator of the pressure spike shape. To calculate wave speed, the code uses the time
38
7
4
4
Pre
ssure
(p
sig
)
Pre
ssure
(p
sig
)
difference between the (previously located) rise points. A speed average is finally calculated and
displayed along with the other parameters on the graph.
100
90
Sens or 1
Sens or 2
Sens or 3
12 Speed: (m /s )
1-2: 865.2
2-3: 865.2
3-4: 924.9
Sens or 1
Sens or 2
Sens or 3
Speed: (m /s )
1-2: Inf
2-3: Inf
3-4: Inf
80 Sens or 4
70
60
50
Avg: 885.1 T
R 1(us ): 8.5
TR
2(us ): 22.
T 3(us ): 11. R
T 4(us ): 11. R
Max P1: 93.6
Max P2: 93.1
Max P3: 91.2
Max P4: 95.3
10 Sens or 4
8
6
Avg: Inf T
R 1(us ): 497.2
TR
2(us ): 565.3 T 3(us ): 747.2
R
T 4(us ): 704.5 R
Max P1: 11.1
Max P2: 11.2
Max P3: 11.1
Max P4: 10.7
40
4 30
20
2
10
0
33.4 33.6 33.8 34 34.2 34.4 34.6
Time (ms)
0
43.2 43.4 43.6 43.8 44 44.2 44.4
Time (ms)
Figure 24 - Matlab sample output graphs
Once all 482 datasets were analyzed, the second code gathered the calculated data from each
run. It then plotted distribution graphs for average maximum pressure, speed and rise time
values. It also produced 3-D contour maps for pressure, speed and rise time.
Visual inspection of the plots revealed two very distinctive groups. One group had a low rise time
showing an abrupt pressure spike (Figure 24 – left), while a second group showed high rise times
and a gradual, oscillating pressure increase (Figure 24 – right). A sharp spike can be associated
with supersonic flow, while a gradual pressure increase corresponds to a subsonic perturbation.
The base line configuration (empty tube) pressure change, if any, was too small to be detected
from the sensors background noise: a flat line was recorded by all four sensors.
39
3.2 Numerical results
This initial analysis identifies those runs with the best performance: maximum speed, pressure
and lowest TR. Table 5 presents the top three samples for each category.
Table 5 - Best performance runs
Maximum speed
Cartridge config Speed avg
(m/s)
TR avg
(µs)
P avg
(psig)
d
s
BR
L
Fill %
24 904.4 12.1 94.3 14 3 45 1.4 120
24 885.1 13.5 93.3 14 3 45 1.4 120
24 875.5 11.4 86.0 14 3 45 1.4 100
Maximum pressure
Cartridge config Speed avg
(m/s)
TR avg
(µs)
P avg
(psig)
d
s
BR
L
Fill %
24 904.4 12.1 94.3 14 3 45 1.4 120
24 885.1 13.5 93.3 14 3 45 1.4 120
21 725.3 266.3 91.5 7 6 60 1.3 150
Lowest TR
Cartridge config Speed avg
(m/s)
TR avg
(µs)
P avg
(psig)
d
s
BR
L
Fill %
23 759.7 9.2 61.8 14 2 60 1.6 120
15 797.3 9.9 80.5 14 3 60 1.6 120
23 759.3 9.9 62.1 14 2 60 1.2 120
The highest speed and pressure were both obtained on the same run using cartridge 24: 14 discs
with BR of 45, spacing of 3 inches and L equal 1.4. For the best (lowest) TR, a slightly different
combination is required: 14 discs at either 2 or 3 inches spacing, but with BR of 60. Equivalence
ratio (L) does not appear to be closer to a single value, as the top two observations had L=1.6
and the third L=1.2. For pressure and speed, L=1.4 seems to be the optimum. Lean mixtures are
known to have faster flame speeds, and the experiment results match accordingly. Higher fill
volumes seem to support better performance overall. The pressure plot for best pressure and
speed is shown in Figure 25 – left. The pressure plot for best TR is in Figure 25 – right.
40
)
g i s p (
e r u s s e r P
Pre
ssure
(p
sig
)
70
Sens or 1
Sens or 2
Speed: (m /s )
1-2: 745.1
2-3: 745.1
100 Sens or 1
Sens or 2
Speed: (m /s )
1-2: 894.1
2-3: 894.1
60 Sens or 3
Sens or 4
50
40
30
3-4: 788.9
Avg: 759.7 T
R 1(us ): 11.4
TR
2(us ): 8.5 T 3(us ): 8.5
R
T 4(us ): 8.5 R
Max P1: 68.7
Max P2: 58.6
Max P3: 63.3
Max P4: 56.7
Sens or 3
80 Sens or 4
60
40
3-4: 924.9
Avg: 904.4 T
R 1(us ): 5.7
TR
2(us ): 22.7 T 3(us ): 8.5
R
T 4(us ): 11.4 R
Max P1: 94.0
Max P2: 93.7
Max P3: 93.5
Max P4: 95.9
20
20
10
0 0
-10
29 29.2 29.4 29.6 29.8 30 30.2 30.4
Time (ms)
-20 32.4 32.6 32.8 33 33.2 33.4 33.6 33.8
Time (ms)
Figure 25 - Best performance plots
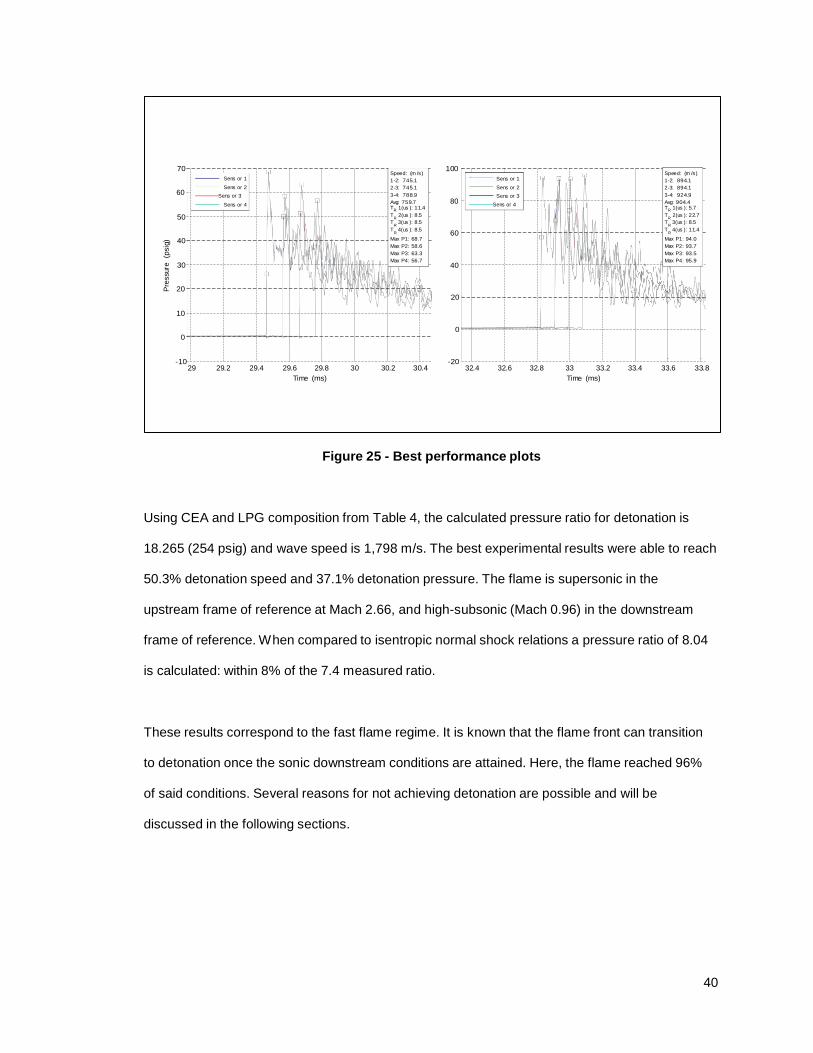
Using CEA and LPG composition from Table 4, the calculated pressure ratio for detonation is
18.265 (254 psig) and wave speed is 1,798 m/s. The best experimental results were able to reach
50.3% detonation speed and 37.1% detonation pressure. The flame is supersonic in the
upstream frame of reference at Mach 2.66, and high-subsonic (Mach 0.96) in the downstream
frame of reference. When compared to isentropic normal shock relations a pressure ratio of 8.04
is calculated: within 8% of the 7.4 measured ratio.
These results correspond to the fast flame regime. It is known that the flame front can transition
to detonation once the sonic downstream conditions are attained. Here, the flame reached 96%
of said conditions. Several reasons for not achieving detonation are possible and will be
discussed in the following sections.
41
3.3 Regression model
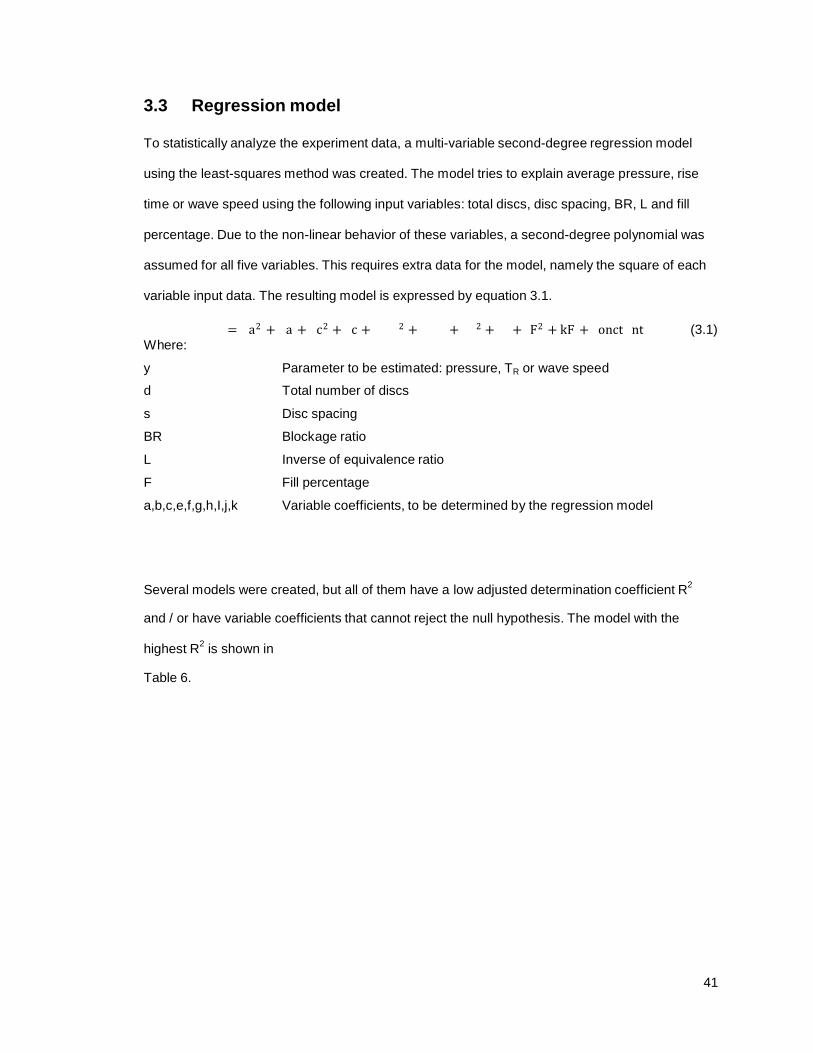
To statistically analyze the experiment data, a multi-variable second-degree regression model
using the least-squares method was created. The model tries to explain average pressure, rise
time or wave speed using the following input variables: total discs, disc spacing, BR, L and fill
percentage. Due to the non-linear behavior of these variables, a second-degree polynomial was
assumed for all five variables. This requires extra data for the model, namely the square of each
variable input data. The resulting model is expressed by equation 3.1.
= a2 + a + c2 + c + 2 + + 2 + + F2 + kF + onct nt (3.1) Where:
y Parameter to be estimated: pressure, TR or wave speed
d Total number of discs
s Disc spacing
BR Blockage ratio
L Inverse of equivalence ratio
F Fill percentage
a,b,c,e,f,g,h,I,j,k Variable coefficients, to be determined by the regression model
Several models were created, but all of them have a low adjusted determination coefficient R2
and / or have variable coefficients that cannot reject the null hypothesis. The model with the
highest R2
is shown in
Table 6.
42
Table 6 - Pressure regression model results
Average Pressure
Regression Statistics
Multiple R 0.765
R Square 0.586
Adjusted R
Square 0.577
Standard Error 13.280
Observations 479
ANOVA
df SS MS F Significance F
Regression 10 116625.578 11662.558 66.125 0.000
Residual 468 82541.925 176.372
Total 478 199167.503
Coefficients Standard
t Stat P-value Lower 95% Upper 95% Error
Constant -238.733 23.012 -10.374 0.000% -283.952 -193.513
d 4.157 1.195 3.479 0.055% 1.809 6.505
d2
-0.036 0.066 -0.539 59.031% -0.166 0.095
s 1.419 2.743 0.517 60.520% -3.971 6.809
s2
0.217 0.331 0.657 51.143% -0.433 0.868
BR 0.257 0.231 1.113 26.614% -0.197 0.710
BR2
0.000 0.002 -0.026 97.926% -0.005 0.004
L 230.829 29.323 7.872 0.000% 173.207 288.451
L2
-86.339 10.013 -8.622 0.000% -106.016 -66.663
F 1.170 0.258 4.537 0.001% 0.663 1.676
F2
-0.004 0.001 -3.165 0.165% -0.007 -0.002
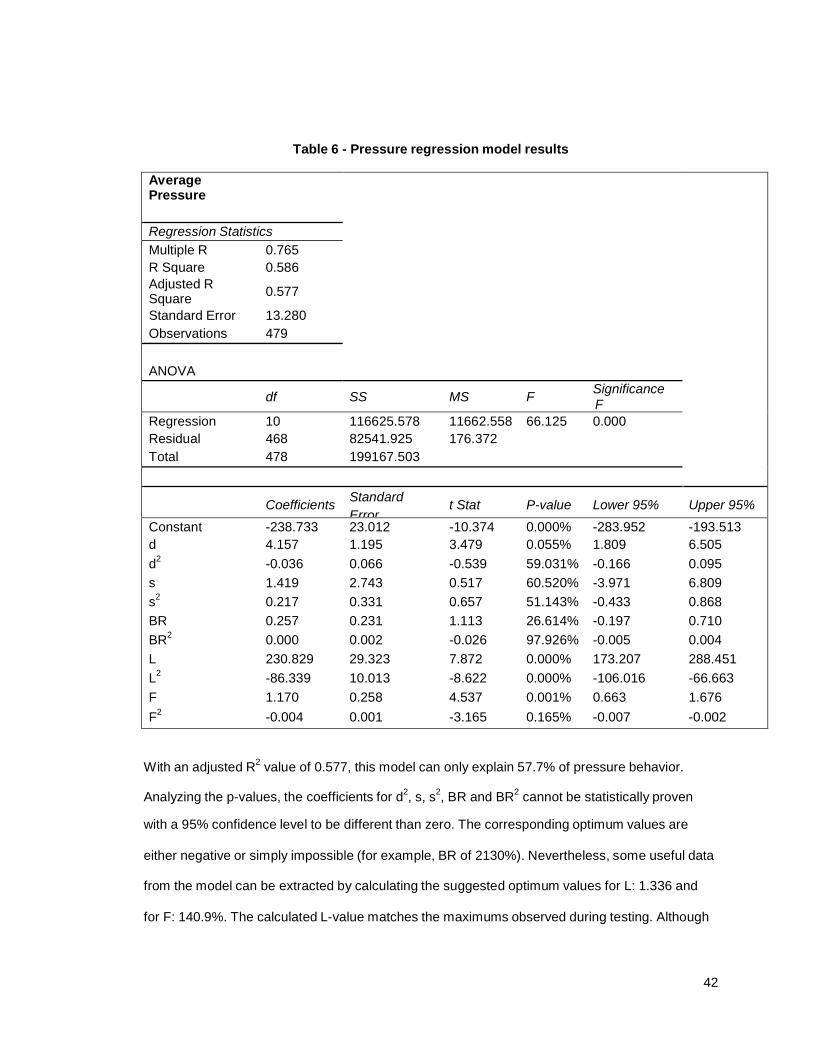
With an adjusted R2
value of 0.577, this model can only explain 57.7% of pressure behavior.
Analyzing the p-values, the coefficients for d2, s, s
2, BR and BR
2 cannot be statistically proven
with a 95% confidence level to be different than zero. The corresponding optimum values are
either negative or simply impossible (for example, BR of 2130%). Nevertheless, some useful data
from the model can be extracted by calculating the suggested optimum values for L: 1.336 and
for F: 140.9%. The calculated L-value matches the maximums observed during testing. Although
43
Perc
enta
ge o
f observ
ations
Num
ber
of
observ
ations
fill rates of 140% weren’t tested, better performance was attained at higher fill rates, which agrees
qualitatively with the regression model.
Due to the low R2
value, model predictions or extrapolations cannot be considered accurate. This
mathematical model expresses the irregularity of collected data. Even though testing conditions
were kept as constant as possible, pressure and speed values have a high degree of variability
that is unaccounted for.
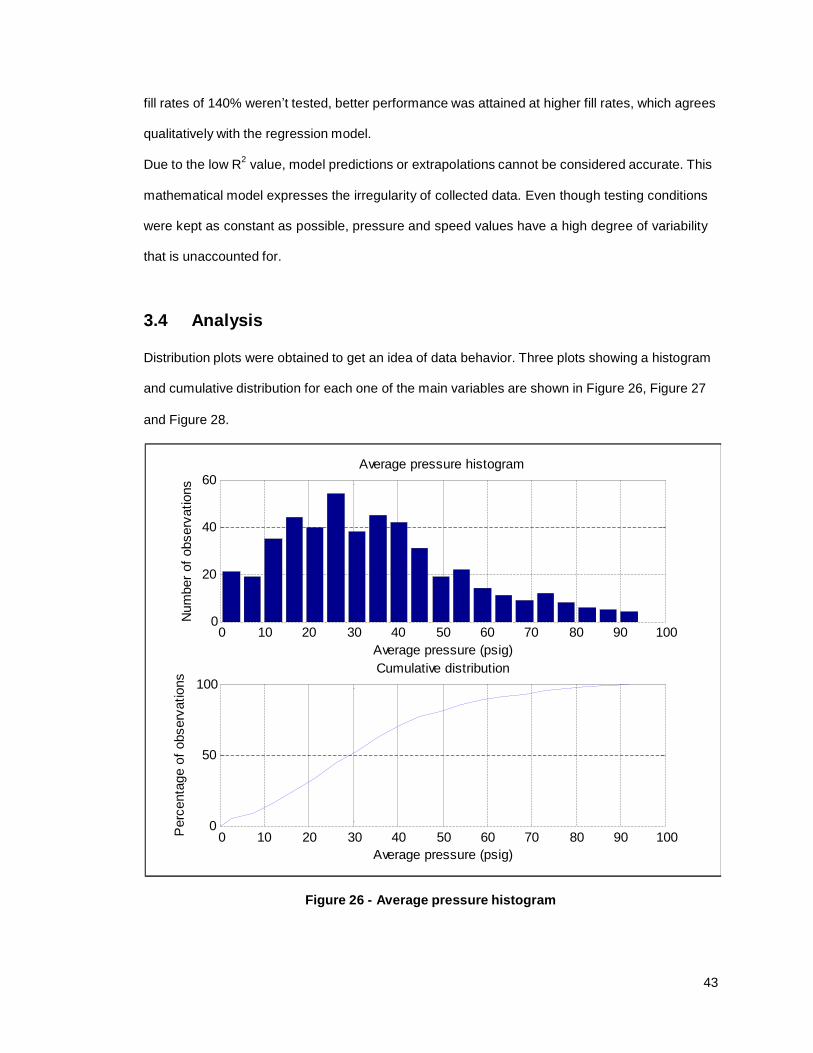
3.4 Analysis
Distribution plots were obtained to get an idea of data behavior. Three plots showing a histogram
and cumulative distribution for each one of the main variables are shown in Figure 26, Figure 27
and Figure 28.
Average pressure histogram
60
40
20
0
100
0 10 20 30 40 50 60 70 80 90 100
Average pressure (psig)
Cumulative distribution
50
0 0 10 20 30 40 50 60 70 80 90 100
Average pressure (psig)
Figure 26 - Average pressure histogram
44
Perc
enta
ge o
f observ
ations
Num
ber
of
observ
ations
The average pressure histogram shows a slightly right-skewed distribution. Mean value is 34.41
psig and median is 31.60 psig. The cumulative plot shows a smooth curve, in accordance with the
distribution histogram. Changes to the cartridge configuration will affect average pressure
gradually. As long as the cartridge configuration is near the ‘sweet spot’, slight cartridge
deviations will not change pressure significantly.
200 Average speed histogram
150
100
50
0
100
0 100 200 300 400 500 600 700 800 900
Average speed (m/s)
Cumulative distribution
50
0 0 100 200 300 400 500 600 700 800 900
Average speed (m/s)
Figure 27 - Average speed histogram
The average speed histogram shows a different pattern than the pressure histogram. Average
speed calculations are set to zero if a valid rise point cannot be detected or if they happen at the
same location. This occurred on slow deflagrations that don’t have a clear, sharp pressure spike.
Therefore, a significant number of observations (~40%) fall within the first bin of speeds between
zero and ~30 m/s. A clear gap exists between samples for which a valid average speed cannot
45
Perc
enta
ge
of
observ
ations
Num
ber
of
observ
ations
be calculated and the rest. The remaining 60% show a bell-shaped distribution, with a slight right-
hand skewness. Median speed is 570.9 m/s; mean speed is 405.7 m/s. Looking at the bell-
shaped distribution section, the right skewness (as in the pressure histogram) allows some
flexibility regarding deviations from the ideal cartridge configuration.
100 Rise time histogram
50
0
100
0 200 400 600 800 1000 1200
Rise time (us)
Cumulative distribution
50
0 0 200 400 600 800 1000 1200
Rise time (us)
Figure 28 - Average TR histogram
The rise time histogram shows two groups, one centered on the origin and another around 550
µs. Mean value is 326.2 µs, and median is 315.3 µs. The (ideal) first bin has 100 observations,
while the second bin drops sharply to 30 events. The cumulative distribution show that roughly
20% of all samples fall into the first bin. The higher TR group represents slow-deflagrations.
Unlike the previous two distributions, the cartridge needs to be close to the ideal configuration in

46
order to obtain a low TR value. The function becomes relatively insensitive between 100 and 400
µs, just below the point where most deflagrations start to occur.
After analyzing the histograms, contour plots can be used to determine what the optimum
configuration(s) is (are). The following figures show different relationships between the main
variables, by plotting pressure, speed or rise time vs. two other variables, holding everything else
constant.
Figure 29 - Average pressure vs. BR vs. L

47
Avera
ge p
ressure
(psig
)
Figure 30 - Average pressure vs. BR vs. d
Avg pressure vs. L vs. disc spacing - All data 70
d=14 s=3
d=14 s=2
60 d=10 s=4.5 d=7 s=6
d=8 s=3
50 d=5 s=4.5
d=5 s=6
40
30
20
10 0.9 1 1.1 1.2 1.3 1.4 1.5 1.6 1.7 1.8
L
Figure 31 - Average pressure vs. L vs. disc spacing
48
Figure 32 - Average speed vs. BR vs. L
Figure 33 - Average speed vs. BR vs. number of discs
49
Avg
speed
(m
/s)
800
700
600
500
Avg speed vs. L vs. disc spacing - All data
d=14 s=3
d=14 s=2
d=10 s=4.5
d=7 s=6
d=8 s=3
d=5 s=4.5
d=5 s=6
400
300
200
100
0 0.9 1 1.1 1.2 1.3 1.4 1.5 1.6 1.7 1.8
L
Figure 34 - Average speed vs. L vs. disc spacing
Figure 35 - Rise time vs. BR vs. L
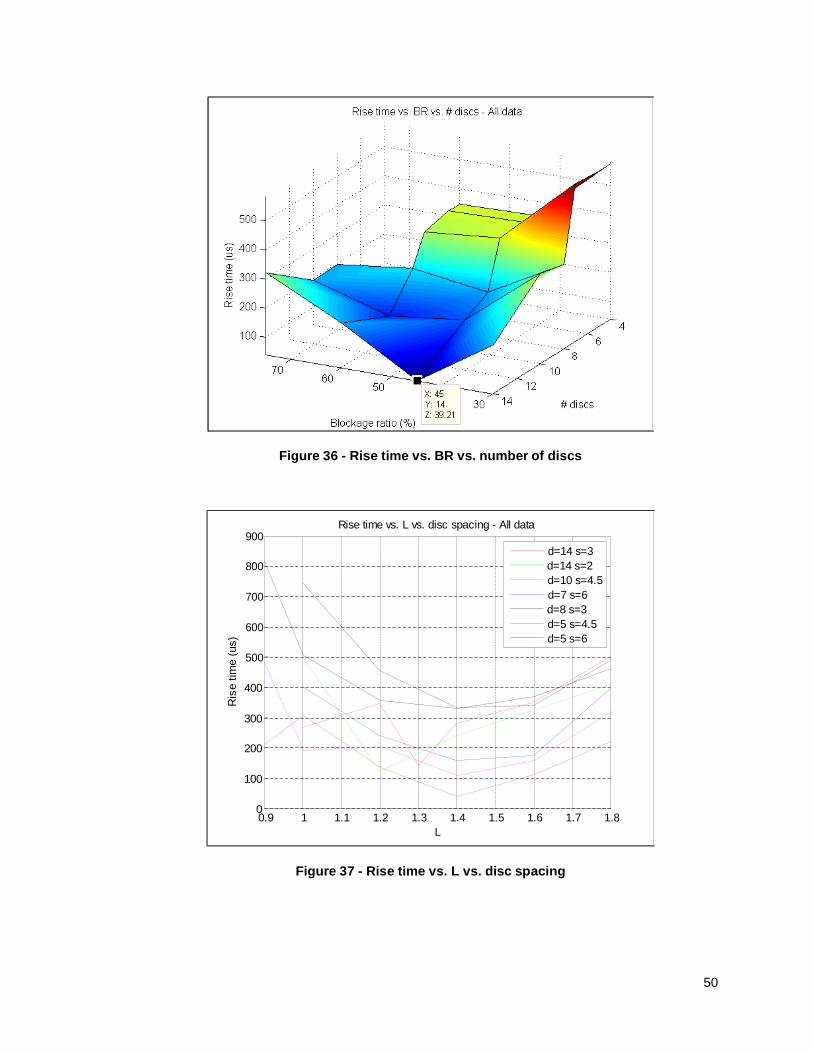
50
Ris
e tim
e (
us)
Figure 36 - Rise time vs. BR vs. number of discs
900
800
700
600
500
Rise time vs. L vs. disc spacing - All data
d=14 s=3
d=14 s=2
d=10 s=4.5
d=7 s=6
d=8 s=3
d=5 s=4.5
d=5 s=6
400
300
200
100
0 0.9 1 1.1 1.2 1.3 1.4 1.5 1.6 1.7 1.8
L
Figure 37 - Rise time vs. L vs. disc spacing
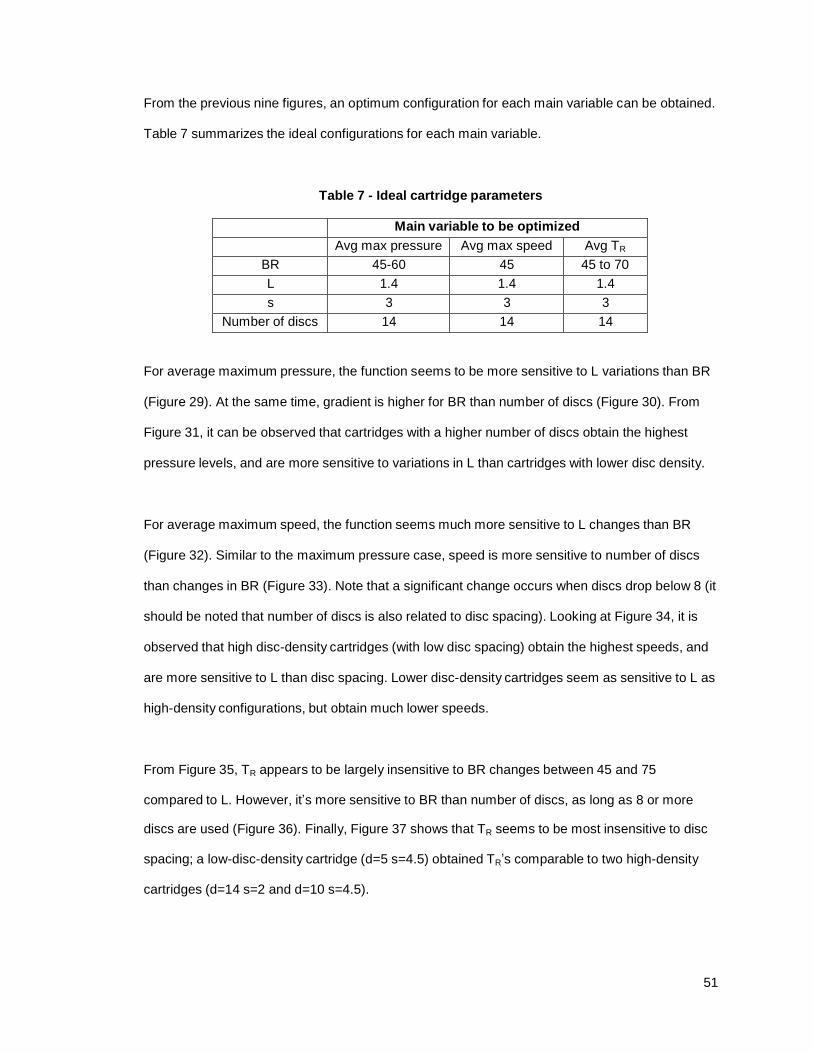
51
From the previous nine figures, an optimum configuration for each main variable can be obtained.
Table 7 summarizes the ideal configurations for each main variable.
Table 7 - Ideal cartridge parameters
Main variable to be optimized
Avg max pressure Avg max speed Avg TR
BR 45-60 45 45 to 70
L 1.4 1.4 1.4
s 3 3 3
Number of discs 14 14 14
For average maximum pressure, the function seems to be more sensitive to L variations than BR
(Figure 29). At the same time, gradient is higher for BR than number of discs (Figure 30). From
Figure 31, it can be observed that cartridges with a higher number of discs obtain the highest
pressure levels, and are more sensitive to variations in L than cartridges with lower disc density.
For average maximum speed, the function seems much more sensitive to L changes than BR
(Figure 32). Similar to the maximum pressure case, speed is more sensitive to number of discs
than changes in BR (Figure 33). Note that a significant change occurs when discs drop below 8 (it
should be noted that number of discs is also related to disc spacing). Looking at Figure 34, it is
observed that high disc-density cartridges (with low disc spacing) obtain the highest speeds, and
are more sensitive to L than disc spacing. Lower disc-density cartridges seem as sensitive to L as
high-density configurations, but obtain much lower speeds.
From Figure 35, TR appears to be largely insensitive to BR changes between 45 and 75
compared to L. However, it’s more sensitive to BR than number of discs, as long as 8 or more
discs are used (Figure 36). Finally, Figure 37 shows that TR seems to be most insensitive to disc
spacing; a low-disc-density cartridge (d=5 s=4.5) obtained TR’s comparable to two high-density
cartridges (d=14 s=2 and d=10 s=4.5).
52
Although detonation was not achieved, there appears to be an optimum cartridge configuration
able to obtain better readings when compared to other configurations. For average pressure and
speed, the configuration can be considered the same. Rise time shows a slight variation
regarding the ideal BR, although the other three parameters L, s and number of discs are
consistent with the previous numerical results.
Overall, it can be said that in order of importance, the most significant parameter is gas mixture
composition L, followed by BR, number of discs, and finally disc spacing. As long as all
parameters are close to their optimum, small deviations in pressure, speed and rise time will
occur. If one or more parameter deviate significantly, pressure, speed and / or TR performance
will be severely degraded. For this paper, the ideal cartridge must have BR 60, using 8 or more
discs with 3-inch spacing.
Reasons for not achieving detonation can be several, including incorrect cartridge configuration,
incomplete fuel/oxidizer mixing, or a longer DDT section is required.
Analyzing the cartridge configuration, the unrestricted core diameter for a disc with the highest
BR of 75 is 47.6 mm. For propane, λ is close to 51 mm [9]. Although it’s possible that BR 70 discs
were restricting the propagation of a complete detonation cell, tests with lower BR’s showed
better speed and pressure characteristics. At BR 60, the unrestricted core diameter is 61.0 mm,
enough for detonation to propagate. The same argument is valid for discs with an even larger
core diameter (i.e. lower BR).
The second reason involves the injection procedure. In order to achieve the appropriate
equivalence ratio, fuel injection was pulsed into the tube while the oxidizer injector was held open.
This creates alternating fuel-rich and lean pockets, where gas speed and turbulence is expected
to help complete mixing. CFD-results show that with the given tube geometry and mass flow,
53
mixing should not be a concern. A risky alternative would be pre-mixing. Any connection
mechanism between the main tube and pre-mixing chamber will need to be flame-proof.
The third reason is perhaps the most reasonable: the maximum obtained speed falls short of that
required to transition within the tube length and cartridge configuration. With the modular design
of the test setup, the center tube section could be easily replaced or a second DDT section added
to verify this allegation.
3.5 Oxygen testing results
After testing all cartridges with fuel/air mixtures, pure oxygen was used to verify the equipment
capabilities. Pressure levels were over 10 times higher when detonation was finally achieved,
confirmed by the corresponding wave speed. Figure 38 shows the results for oxygen testing. On
the right, the graphs correspond to a cartridge with BR 30, 6-inch disc spacing, 4 discs total.
Results for an empty tube are shown on the left. The top figures were recorded by the DAQ while
the bottom figures were recorded with an oscilloscope.
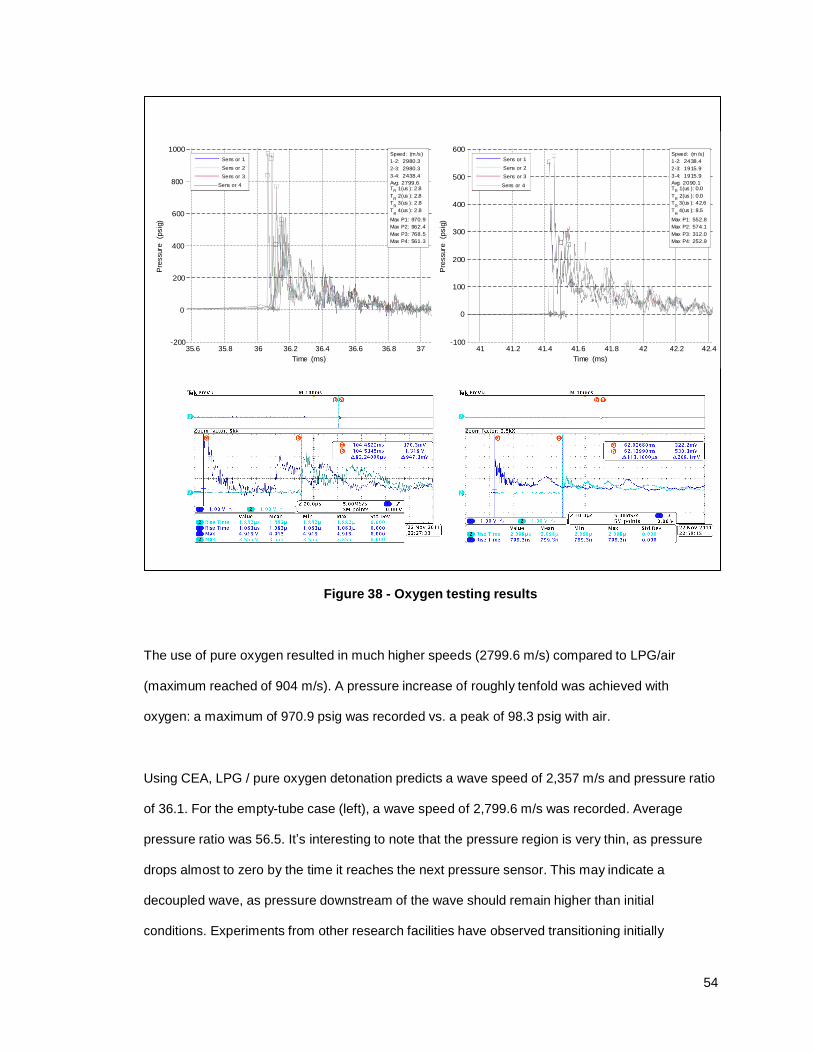
54
Pre
ssure
(p
sig
)
Pre
ssure
(p
sig
)
1000 Sens or 1
Sens or 2
Sens or 3
Speed: (m /s )
1-2: 2980.3
2-3: 2980.3
3-4: 2438.4
600
500
Sens or 1
Sens or 2
Sens or 3
Speed: (m /s )
1-2: 2438.4
2-3: 1915.9
3-4: 1915.9
800 Sens or 4
600
400
Avg: 2799.6 T
R 1(us ): 2.8
TR
2(us ): 2.8 T 3(us ): 2.8
R
T 4(us ): 2.8 R
Max P1: 970.9
Max P2: 962.4
Max P3: 768.5
Max P4: 561.3
400
300
200
Sens or 4
Avg: 2090.1 T
R 1(us ): 0.0
TR
2(us ): 0.0 T 3(us ): 42.6
R
T 4(us ): 8.5 R
Max P1: 552.8
Max P2: 574.1
Max P3: 312.0
Max P4: 252.9
200
100
0
0
-200
35.6 35.8 36 36.2 36.4 36.6 36.8 37
Time (ms)
-100 41 41.2 41.4 41.6 41.8 42 42.2 42.4
Time (ms)
Figure 38 - Oxygen testing results
The use of pure oxygen resulted in much higher speeds (2799.6 m/s) compared to LPG/air
(maximum reached of 904 m/s). A pressure increase of roughly tenfold was achieved with
oxygen: a maximum of 970.9 psig was recorded vs. a peak of 98.3 psig with air.
Using CEA, LPG / pure oxygen detonation predicts a wave speed of 2,357 m/s and pressure ratio
of 36.1. For the empty-tube case (left), a wave speed of 2,799.6 m/s was recorded. Average
pressure ratio was 56.5. It’s interesting to note that the pressure region is very thin, as pressure
drops almost to zero by the time it reaches the next pressure sensor. This may indicate a
decoupled wave, as pressure downstream of the wave should remain higher than initial
conditions. Experiments from other research facilities have observed transitioning initially
55
produces over-driven waves before reaching CJ conditions. An over-driven wave is not
considered to be stable, so additional equipment is required to determine its behavior. Current
equipment does not allow for additional measurements up- or downstream of the tube, which
would help determine if the wave was stabilizing towards CJ conditions.
For the obstacle case (right), wave speed (2,090 m/s) was closer to CJ conditions (2,357 m/s).
Pressure ratio was also closer at 29.77 (CJ 36.1). Deviations from CJ-values are small (11%
lower speed and 17% lower pressure ratio), which would indicate a slightly under-driven wave
was established. The variations are comparable to other detonation studies. Downstream of the
wave, pressure levels of around 100 psig were recorded. Short rise times were also present; both
are typical characteristics of detonation waves.
DAQ verification
To verify the DAQ measurement capabilities, a comparison with an oscilloscope was made. For
the empty tube case, the oscilloscope shows a time difference between channels 1 and 4 of
82.24000µs. Using this value, a speed of 2779.7 m/s is calculated. The value obtained using the
DAQ / Matlab routine is 0.7% higher. Using the same procedure for the empty tube case, the
DAQ value is found to be within 3% of the oscilloscope value. The oscilloscope has a higher
accuracy due to its sampling rate of 5 MHz per channel (vs. 352 KHz per channel for the DAQ).
Although the DAQ is sampling at its maximum frequency, the values obtained are very close to
those obtained by the higher-accuracy oscilloscope. Slower flames accuracy (LPG / air) shouldn’t
be a concern either.
3.6 Testing observations
Signal clipping / signal conditioner output impedance
While testing with oxygen, the signal conditioner output voltage was found to be ‘clipping’ at
roughly 5 volts (1,000 psi). Clipping means the pressure measurement reaches hardware limits.
Further testing showed the pressure sensor output presented no signs of clipping, while clipping
56
existed at the signal conditioner output. Wave speed is calculated based on the time difference
between pressure rise points (and not the peak values), so speed calculation is not affected.
PCB was contacted for advice, and the conditioner was sent back for diagnosis. PCB didn’t find
any problems with the unit. They did notice the signal would clip when connected to a 50 ohm
output impedance load. Some discrepancy exists as to the proper conditioner output impedance.
The conditioner manual specifies 50-ohms output impedance, while emails from PCB suggested
a high-impedance load should be used. The issue was never fully cleared by PCB. The test setup
used a 50 ohm resistor in parallel with the DAQ (with an internal impedance greater than 1 Gohm
– i.e. negligible) to comply with the unit’s manual specs. For this application, an impedance
mismatch would result in pressure scaling being off. The recorded peak pressure values should
be considered accordingly. Another undesirable result of impedance mismatch would be the
introduction of a delay in the pressure signal. If any delay was introduced, it would be applied
equally to all channels. This would effectively cancel out any influence on wave speed calculation.
As PCB was never completely clear regarding the output impedance of the signal conditioner, a
comparison test with a known calibrated pressure sensor should be carried out. For the present
study, an off-scale pressure reading will not affect the speed calculations. However, validated
pressure data would allow verification beyond that of flame speed. A comparison of pressure ratio
and isentropic normal shock characteristics would be the prime candidate. It was noted during
testing that pressure values seemed to match normal shock characteristics.
If scaling is confirmed to be accurate without the 50-ohm impedance-matching resistor, an AC-
coupled digitizer or multiple-channel oscilloscope should be used. Since the DAQ is DC-coupled,
the resistor kept the conditioner signal not only within the DAQ voltage limits (+/- 10V), but it also
stabilized the output signal at zero volts with respect to ground. The signal conditioner output
voltage drifts considerably without a resistor.

57
A different measurement option would be to monitor the pressure sensor output directly. This
would bypass the signal conditioner signal circuitry. The conditioner would then only operate as a
power supply for the sensors. The signal conditioner gain feature would be lost. For this scenario,
AC-coupled equipment would be a must.
Air-fuel ratio accuracy
When stoichiometric conditions were called for, the resulting mixture appeared to be ‘rich’, based
on excessive gas smell and ignitability issues. Although a gas analyzer (or oxygen sensor) was
not available during testing, troubleshooting showed that once the oxidizer injector opened, line
pressure dropped. This indicates mass flow was restricted. Attempts were made to increase or
keep pressure constant, but were unsuccessful. Bigger oxidizer lines may help with this issue, as
the off-site air compressor should be able to deliver the required mass flow. For this reason, the
mixture parameter L should be treated accordingly. Nevertheless, it remains an effective tool to
alter the actual equivalence ratio.
Oxygen cartridge deformation
Oxygen-testing showed much higher pressures than LPG / air mixtures. After obstacle-testing
with oxygen, discs were found to be bent. Discs with BR 30 were the only ones tested with
oxygen. Figure 39 shows the discs after removal. Further testing with oxygen will require thicker
discs, similar to the cartridge end-discs.
Figure 39 - Discs after oxygen testing (bent)
58
Others
During initial fuel tests (at 10% fill volume), a blue-colored swirling flame was clearly
observed inside the tube. At higher fill levels flame magnitude and speed didn’t allow for
visual identification. Most experiments were recorded with a camera at 24 frames per second.
At such slow rate, only a single bright frame was obtained. High-speed cameras would allow
identification and measurement of flame propagation (luminescence) characteristics.
The interaction of the chemically reactive gas with the threaded rods supporting the discs is
unknown. Although testing with only 1 disc and all three rods mounted inside the tube
showed no improvement versus any other case, the effect of the rods on the combusting gas
inside the tube should be considered. CFD may be the only available tool to account for the
threaded rods effects.
No significant difference was found between installing half-cartridges at the ignition or
exhaust end. One of the studies from the University of Arlington at Texas (mentioned in
section 1.5) tested whether ignition location was significant to pressure and speed levels.
They concluded that no significant evidence was found when changing ignition location. The
equivalent effect of reversing the half-cartridge inside the tube is that of moving the ignition
within the tube. Therefore, the experiment results match those of the previous paper.
59
4. Conclusions and recommendations
The experiments were able to achieve the fast flame regimes for LPG and air mixtures. Although
LPG and oxygen mixtures were the only ones able to achieve detonation, pure oxygen limits the
practicality of any device. Continuous efforts should be made towards achieving detonation with
ordinary-fuel and air mixtures.
It is interesting to note that for oxygen mixtures, obstacles hampered wave pressure and speed,
while for air mixtures they greatly increased pressure and speed. This can be interpreted as
supporting evidence that a DDT section depends on the gas mixture being ignited.
All three main variables: peak pressure, maximum speed, and rise time are found to be sensitive
to cartridge configuration, as long as the proper equivalence ratio mixture is supplied.
Statistical evidence suggests the ideal cartridge configuration depends on whether high pressure,
speed or the sharpest pressure spike is desired, see Table 7. A sharper spike was obtained by
using a slightly higher BR.
Future testing should include different fuels and DDT mechanisms. Extending the test section and
mixing different BR discs on a single cartridge could be tested with minimal effort.
The present work not only identifies the most favorable obstacle configuration for the test tube, but
also presents a platform upon which future testing can be performed. Other research facilities
have revealed their intent to explore different geometries such as toroidal or helical DDT sections.
Different flame acceleration devices should be explored while keeping in mind the usefulness and
practicality of them.
60
References
1. Wintenberger, E., “Application of Steady and Unsteady Detonation Waves to Propulsion”,
California Institute of Technology, Pasadena, CA, 2004
2. Coleman, M.L., “Overview of pulse detonation propulsion technology”, Chemical Propulsion
Information Agency, The John Hopkins University, Baltimore, MD, April 2001
3. Bussing, T., Papas, G., “An introduction to Pulse Detonation Engines”, 32nd
Aerospace
Sciences Meeting and Exhibit, AIAA 94-0623
4. Ciccarelli, G., Dubocage, P., “Flame acceleration in fuel-air mixtures at elevated initial
temperatures”, 38th
AIAA/ASME/SAE/ASEE Joint Propulsion Conference and Exhibit, 2002
5. Lee, J., “Initiation of Gaseous Detonation”, Annual Reviews Phys. Chem. Vol. 75, 1977, pp.
75-104
6. Wintenberger, E., Shepherd, J.E., “Thermodynamic Cycle Analysis for Propagating
Detonations”, Graduate Aeronautical Laboratories, California Institute of Technology, 2005
7. Kaneshige, M., Shepherd, J.E., “Detonation Database”, Graduate Aeronautical Laboratories,
California Institute of Technology, Pasadena, CA, Rev. 1999
8. New, D., Lu, F., Tsai, H.M., “Experimental Investigations on DDT Enhancements by
Shchelkin Spirals in a PDE”, Aerodynamics Research Center, University of Texas at
Arlington, [PowerPoint Presentation], URL:
http://arc.uta.edu/publications/pr_files/SchelkinSpiral.pdf [retrieved 26 February 2011]
61
9. Glossary on Explosion Dynamics”, Explosion Dynamics Laboratory, California Institute of
Technology, Pasadena, CA, URL:
http://www.galcit.caltech.edu/EDL/projects/JetA/Glossary.html [retrieved 26 February 2011]
10. Silvestrini, M., Genova, B., et al. “Flame acceleration and DDT run-up distance for smooth
and obstacles filled tubes” Journal of Loss Prevention in the Process Industries 21. 2008
11. Dick Ng, H., Lee, John H.S., “Comments on explosion problems for hydrogen safety” Journal
of Loss Prevention in the Process Industries 21. 2008
12. Katta, V., Tucker, C., et al. “Initiation of Detonation in a Large Tube” 19th
International
Colloquium on the Dynamics of Explosions and reactive systems. July 2003, Japan.
13. Bellini, R., Lu, F., “Exergy Analysis of a Pulse Detonation Power Device”, Journal of
Propulsion and Power, Vol. 26, No. 4 2010
14. Scragg, R., “Detonation cycle gas turbine engine system having intermittent fuel and air
delivery”, US Patent 6,000,214, Dec 1999
15. Turns, Stephen R. “An introduction to Combustion” 2nd
edition. McGraw-Hill, 2000.
16. Kayushin, L. P. “The influence of external friction and heat exchange on the motion of an
ignition surface and a shock-discontinuity in a chemically reactive medium” Gas Dynamics
and Physics of Combustion. Translated from Russian for the National Science Foundation,
Washington D.C. Jerusalem 1962.
17. Panicker, Phillip K. “The development and testing of pulsed detonation engine ground
demonstrators” The University of Texas at Arlington. 2008

62
18. Chapin, David. “A study of deflagration to detonation transition in a pulsed detonation engine”
Georgia Institute of Technology. 2005
19. Lee, J.H., Knystautas R., Chan C.K., “Turbulent flame propagation in obstacle-filled tubes”
Twentieth symposium on Combustion. 1984
20. Panicker Phillip K., Lu, Frank K., Wilson, Donald R. “Practical methods for reducing the
deflagration-to-detonation transition length for pulse detonation engines”, Aerodynamics
Research Center, University of Texas at Arlington, URL:
http://arc.uta.edu/publications/cp_files/ISAIF9-6C-2.pdf [retrieved 15 February 2011]
63
Appendix
Figure 1 - 01 S3D12+2 BR75_20percL1
Figure 2 - 01 S3D12+2 BR75_40percL1
Figure 3 - 01 S3D12+2 BR75_60percL1
Figure 4 - 01 S3D12+2 BR75_80percL1
51.6 51.8 52 52.2 52.4 52.6 52.80
10
20
30
40
50
60
70
Time (ms)
Pre
ssur
e (
psig
)
Speed: (m/s)1-2: 1072.92-3: 670.63-4: 705.9Avg: 816.4T
R 1(us): 497.2
TR 2(us): 585.2
TR 3(us): 483.0
TR 4(us): 548.3
Max P1: 50.2Max P2: 54.6Max P3: 53.1Max P4: 61.1
Sensor 1
Sensor 2
Sensor 3
Sensor 4
Figure 5 - 01 S3D12+2 BR75_100percL1
Figure 6 - 01 S3D12+2 BR75_120percL1
30.8 31 31.2 31.4 31.6 31.8 32 32.20.2
0.4
0.6
0.8
1
1.2
1.4
1.6
Time (ms)
Pre
ssur
e (
psi
g)
Speed: (m/s)1-2: Inf2-3: Inf3-4: InfAvg: InfT
R 1(us): 329.5
TR 2(us): 497.2
TR 3(us): 622.2
TR 4(us): 886.4
Max P1: 1.5Max P2: 1.4Max P3: 1.2Max P4: 1.1
Sensor 1
Sensor 2
Sensor 3
Sensor 4
29.6 29.8 30 30.2 30.4 30.6 30.8-2
0
2
4
6
8
10
12
Time (ms)
Pre
ssur
e (
psi
g)
Speed: (m/s)1-2: 425.82-3: 425.83-4: 447.0Avg: 432.8T
R 1(us): 741.5
TR 2(us): 36.9
TR 3(us): 22.7
TR 4(us): 34.1
Max P1: 10.9Max P2: 11.2Max P3: 9.9Max P4: 11.7
Sensor 1
Sensor 2
Sensor 3
Sensor 4
37.6 37.8 38 38.2 38.4 38.6 38.8 39-5
0
5
10
15
20
25
30
Time (ms)
Pre
ssur
e (
psi
g)
Speed: (m/s)1-2: 558.82-3: 547.43-4: 536.4Avg: 547.5T
R 1(us): 14.2
TR 2(us): 22.7
TR 3(us): 34.1
TR 4(us): 19.9
Max P1: 28.7Max P2: 24.4Max P3: 27.2Max P4: 26.2
Sensor 1
Sensor 2
Sensor 3
Sensor 4
45.8 46 46.2 46.4 46.6 46.8 47-5
0
5
10
15
20
25
30
35
40
Time (ms)
Pre
ssur
e (
psi
g)
Speed: (m/s)1-2: 623.82-3: 623.83-4: 638.6Avg: 628.7T
R 1(us): 11.4
TR 2(us): 480.1
TR 3(us): 392.0
TR 4(us): 500.0
Max P1: 33.3Max P2: 38.4Max P3: 35.9Max P4: 33.9
Sensor 1
Sensor 2
Sensor 3
Sensor 4
56.8 57 57.2 57.4 57.6 57.8 580
5
10
15
20
25
30
35
40
45
50
Time (ms)
Pre
ssur
e (
psi
g)
Speed: (m/s)1-2: 1577.82-3: 1031.63-4: 812.8Avg: 1140.7T
R 1(us): 414.8
TR 2(us): 536.9
TR 3(us): 559.7
TR 4(us): 193.2
Max P1: 40.8Max P2: 41.9Max P3: 43.3Max P4: 45.5
Sensor 1
Sensor 2
Sensor 3
Sensor 4
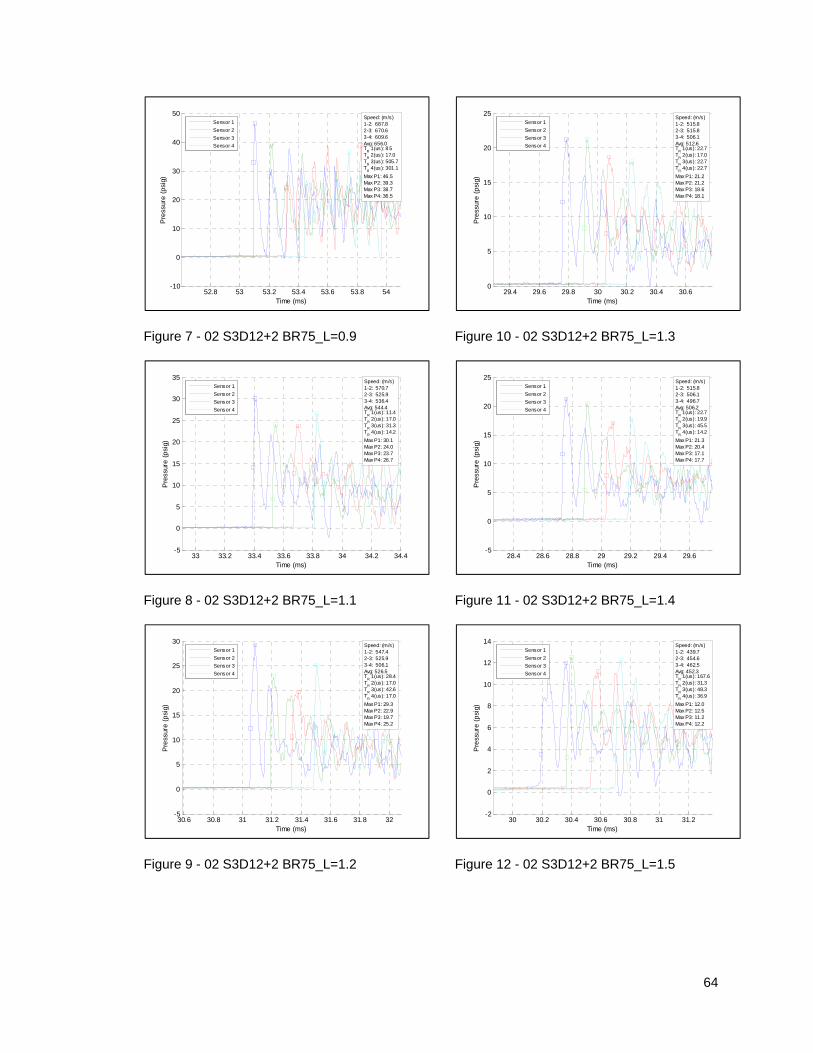
64
Figure 7 - 02 S3D12+2 BR75_L=0.9
Figure 8 - 02 S3D12+2 BR75_L=1.1
Figure 9 - 02 S3D12+2 BR75_L=1.2
Figure 10 - 02 S3D12+2 BR75_L=1.3
Figure 11 - 02 S3D12+2 BR75_L=1.4
Figure 12 - 02 S3D12+2 BR75_L=1.5
52.8 53 53.2 53.4 53.6 53.8 54-10
0
10
20
30
40
50
Time (ms)
Pre
ssur
e (
psi
g)
Speed: (m/s)1-2: 687.82-3: 670.63-4: 609.6Avg: 656.0T
R 1(us): 8.5
TR 2(us): 17.0
TR 3(us): 505.7
TR 4(us): 301.1
Max P1: 46.5Max P2: 39.3Max P3: 38.7Max P4: 36.5
Sensor 1
Sensor 2
Sensor 3
Sensor 4
33 33.2 33.4 33.6 33.8 34 34.2 34.4-5
0
5
10
15
20
25
30
35
Time (ms)
Pre
ssur
e (
psi
g)
Speed: (m/s)1-2: 570.72-3: 525.93-4: 536.4Avg: 544.4T
R 1(us): 11.4
TR 2(us): 17.0
TR 3(us): 31.3
TR 4(us): 14.2
Max P1: 30.1Max P2: 24.0Max P3: 23.7Max P4: 26.7
Sensor 1
Sensor 2
Sensor 3
Sensor 4
30.6 30.8 31 31.2 31.4 31.6 31.8 32-5
0
5
10
15
20
25
30
Time (ms)
Pre
ssur
e (
psi
g)
Speed: (m/s)1-2: 547.42-3: 525.93-4: 506.1Avg: 526.5T
R 1(us): 28.4
TR 2(us): 17.0
TR 3(us): 42.6
TR 4(us): 17.0
Max P1: 29.3Max P2: 22.9Max P3: 19.7Max P4: 25.2
Sensor 1
Sensor 2
Sensor 3
Sensor 4
29.4 29.6 29.8 30 30.2 30.4 30.60
5
10
15
20
25
Time (ms)
Pre
ssur
e (
psi
g)
Speed: (m/s)1-2: 515.82-3: 515.83-4: 506.1Avg: 512.6T
R 1(us): 22.7
TR 2(us): 17.0
TR 3(us): 22.7
TR 4(us): 22.7
Max P1: 21.2Max P2: 21.2Max P3: 18.6Max P4: 18.1
Sensor 1
Sensor 2
Sensor 3
Sensor 4
28.4 28.6 28.8 29 29.2 29.4 29.6-5
0
5
10
15
20
25
Time (ms)
Pre
ssur
e (
psi
g)
Speed: (m/s)1-2: 515.82-3: 506.13-4: 496.7Avg: 506.2T
R 1(us): 22.7
TR 2(us): 19.9
TR 3(us): 45.5
TR 4(us): 14.2
Max P1: 21.3Max P2: 20.4Max P3: 17.1Max P4: 17.7
Sensor 1
Sensor 2
Sensor 3
Sensor 4
30 30.2 30.4 30.6 30.8 31 31.2-2
0
2
4
6
8
10
12
14
Time (ms)
Pre
ssur
e (
psi
g)
Speed: (m/s)1-2: 439.72-3: 454.63-4: 462.5Avg: 452.3T
R 1(us): 167.6
TR 2(us): 31.3
TR 3(us): 48.3
TR 4(us): 36.9
Max P1: 12.0Max P2: 12.5Max P3: 11.2Max P4: 12.2
Sensor 1
Sensor 2
Sensor 3
Sensor 4
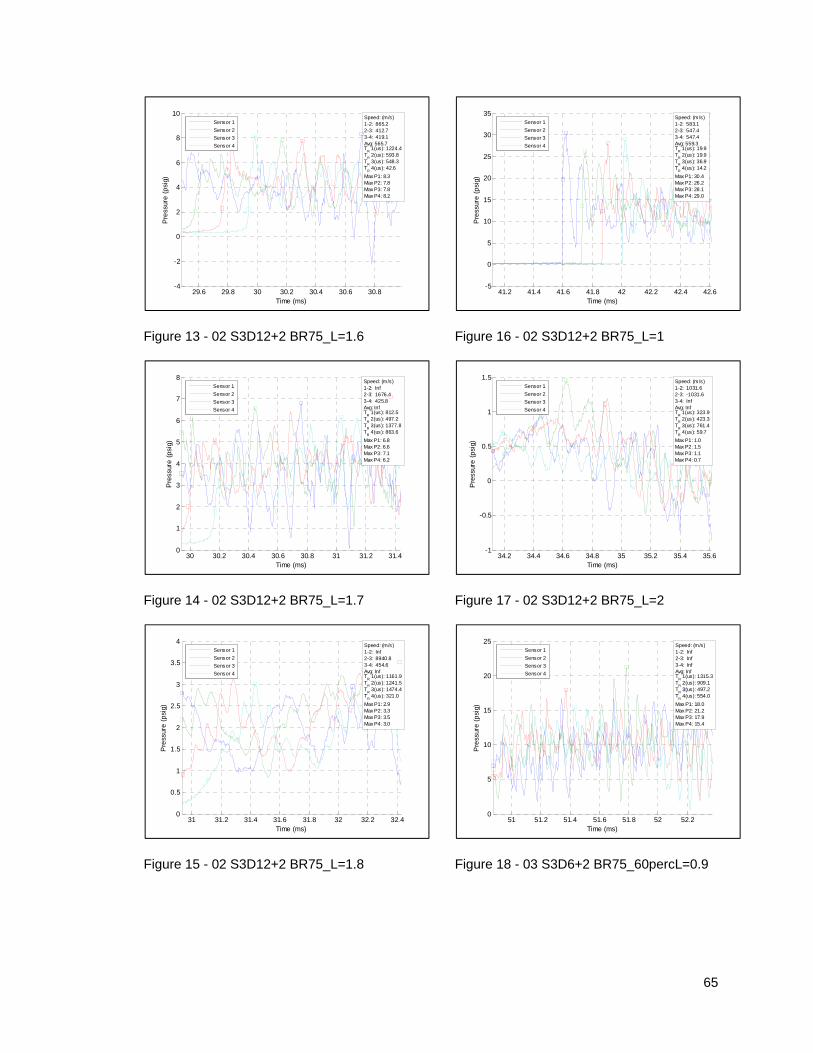
65
Figure 13 - 02 S3D12+2 BR75_L=1.6
Figure 14 - 02 S3D12+2 BR75_L=1.7
Figure 15 - 02 S3D12+2 BR75_L=1.8
Figure 16 - 02 S3D12+2 BR75_L=1
Figure 17 - 02 S3D12+2 BR75_L=2
Figure 18 - 03 S3D6+2 BR75_60percL=0.9
29.6 29.8 30 30.2 30.4 30.6 30.8-4
-2
0
2
4
6
8
10
Time (ms)
Pre
ssur
e (
psi
g)
Speed: (m/s)1-2: 865.22-3: 412.73-4: 419.1Avg: 565.7T
R 1(us): 1224.4
TR 2(us): 593.8
TR 3(us): 548.3
TR 4(us): 42.6
Max P1: 8.3Max P2: 7.8Max P3: 7.8Max P4: 8.2
Sensor 1
Sensor 2
Sensor 3
Sensor 4
30 30.2 30.4 30.6 30.8 31 31.2 31.40
1
2
3
4
5
6
7
8
Time (ms)
Pre
ssur
e (
psi
g)
Speed: (m/s)1-2: Inf2-3: 1676.43-4: 425.8Avg: InfT
R 1(us): 812.5
TR 2(us): 497.2
TR 3(us): 1377.8
TR 4(us): 863.6
Max P1: 6.8Max P2: 6.6Max P3: 7.1Max P4: 6.2
Sensor 1
Sensor 2
Sensor 3
Sensor 4
31 31.2 31.4 31.6 31.8 32 32.2 32.40
0.5
1
1.5
2
2.5
3
3.5
4
Time (ms)
Pre
ssur
e (
psi
g)
Speed: (m/s)1-2: Inf2-3: 8940.83-4: 454.6Avg: InfT
R 1(us): 1161.9
TR 2(us): 1241.5
TR 3(us): 1474.4
TR 4(us): 321.0
Max P1: 2.9Max P2: 3.3Max P3: 3.5Max P4: 3.0
Sensor 1
Sensor 2
Sensor 3
Sensor 4
41.2 41.4 41.6 41.8 42 42.2 42.4 42.6-5
0
5
10
15
20
25
30
35
Time (ms)
Pre
ssur
e (
psi
g)
Speed: (m/s)1-2: 583.12-3: 547.43-4: 547.4Avg: 559.3T
R 1(us): 19.9
TR 2(us): 19.9
TR 3(us): 36.9
TR 4(us): 14.2
Max P1: 30.4Max P2: 26.2Max P3: 28.1Max P4: 29.0
Sensor 1
Sensor 2
Sensor 3
Sensor 4
34.2 34.4 34.6 34.8 35 35.2 35.4 35.6-1
-0.5
0
0.5
1
1.5
Time (ms)
Pre
ssur
e (
psi
g)
Speed: (m/s)1-2: 1031.62-3: -1031.63-4: InfAvg: InfT
R 1(us): 323.9
TR 2(us): 423.3
TR 3(us): 761.4
TR 4(us): 59.7
Max P1: 1.0Max P2: 1.5Max P3: 1.1Max P4: 0.7
Sensor 1
Sensor 2
Sensor 3
Sensor 4
51 51.2 51.4 51.6 51.8 52 52.20
5
10
15
20
25
Time (ms)
Pre
ssur
e (
psi
g)
Speed: (m/s)1-2: Inf2-3: Inf3-4: InfAvg: InfT
R 1(us): 1315.3
TR 2(us): 909.1
TR 3(us): 497.2
TR 4(us): 554.0
Max P1: 18.0Max P2: 21.2Max P3: 17.9Max P4: 15.4
Sensor 1
Sensor 2
Sensor 3
Sensor 4
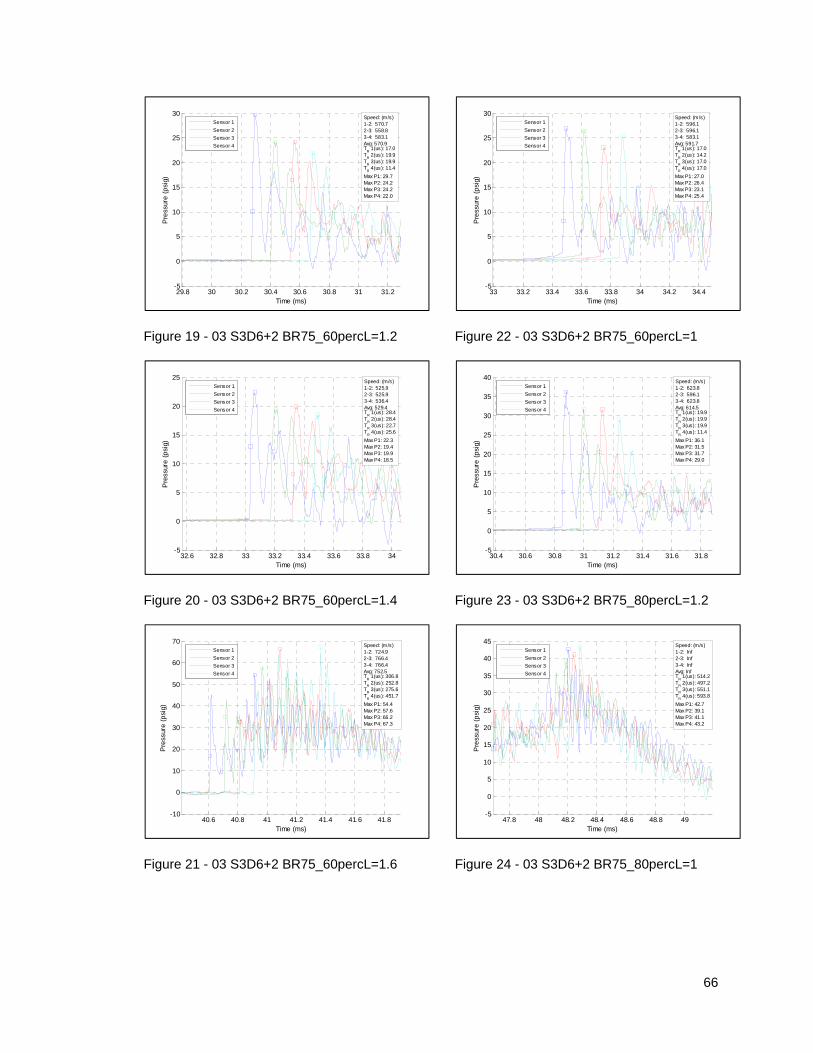
66
Figure 19 - 03 S3D6+2 BR75_60percL=1.2
Figure 20 - 03 S3D6+2 BR75_60percL=1.4
Figure 21 - 03 S3D6+2 BR75_60percL=1.6
Figure 22 - 03 S3D6+2 BR75_60percL=1
Figure 23 - 03 S3D6+2 BR75_80percL=1.2
Figure 24 - 03 S3D6+2 BR75_80percL=1
29.8 30 30.2 30.4 30.6 30.8 31 31.2-5
0
5
10
15
20
25
30
Time (ms)
Pre
ssur
e (
psi
g)
Speed: (m/s)1-2: 570.72-3: 558.83-4: 583.1Avg: 570.9T
R 1(us): 17.0
TR 2(us): 19.9
TR 3(us): 19.9
TR 4(us): 11.4
Max P1: 29.7Max P2: 24.2Max P3: 24.2Max P4: 22.0
Sensor 1
Sensor 2
Sensor 3
Sensor 4
32.6 32.8 33 33.2 33.4 33.6 33.8 34-5
0
5
10
15
20
25
Time (ms)
Pre
ssur
e (
psi
g)
Speed: (m/s)1-2: 525.92-3: 525.93-4: 536.4Avg: 529.4T
R 1(us): 28.4
TR 2(us): 28.4
TR 3(us): 22.7
TR 4(us): 25.6
Max P1: 22.3Max P2: 19.4Max P3: 19.9Max P4: 18.5
Sensor 1
Sensor 2
Sensor 3
Sensor 4
40.6 40.8 41 41.2 41.4 41.6 41.8-10
0
10
20
30
40
50
60
70
Time (ms)
Pre
ssur
e (
psi
g)
Speed: (m/s)1-2: 724.92-3: 766.43-4: 766.4Avg: 752.5T
R 1(us): 306.8
TR 2(us): 252.8
TR 3(us): 275.6
TR 4(us): 451.7
Max P1: 54.4Max P2: 57.6Max P3: 66.2Max P4: 67.3
Sensor 1
Sensor 2
Sensor 3
Sensor 4
33 33.2 33.4 33.6 33.8 34 34.2 34.4-5
0
5
10
15
20
25
30
Time (ms)
Pre
ssur
e (
psi
g)
Speed: (m/s)1-2: 596.12-3: 596.13-4: 583.1Avg: 591.7T
R 1(us): 17.0
TR 2(us): 14.2
TR 3(us): 17.0
TR 4(us): 17.0
Max P1: 27.0Max P2: 26.4Max P3: 23.1Max P4: 25.4
Sensor 1
Sensor 2
Sensor 3
Sensor 4
30.4 30.6 30.8 31 31.2 31.4 31.6 31.8-5
0
5
10
15
20
25
30
35
40
Time (ms)
Pre
ssur
e (
psi
g)
Speed: (m/s)1-2: 623.82-3: 596.13-4: 623.8Avg: 614.5T
R 1(us): 19.9
TR 2(us): 19.9
TR 3(us): 19.9
TR 4(us): 11.4
Max P1: 36.1Max P2: 31.5Max P3: 31.7Max P4: 29.0
Sensor 1
Sensor 2
Sensor 3
Sensor 4
47.8 48 48.2 48.4 48.6 48.8 49-5
0
5
10
15
20
25
30
35
40
45
Time (ms)
Pre
ssur
e (
psi
g)
Speed: (m/s)1-2: Inf2-3: Inf3-4: InfAvg: InfT
R 1(us): 514.2
TR 2(us): 497.2
TR 3(us): 551.1
TR 4(us): 593.8
Max P1: 42.7Max P2: 39.1Max P3: 41.1Max P4: 43.2
Sensor 1
Sensor 2
Sensor 3
Sensor 4
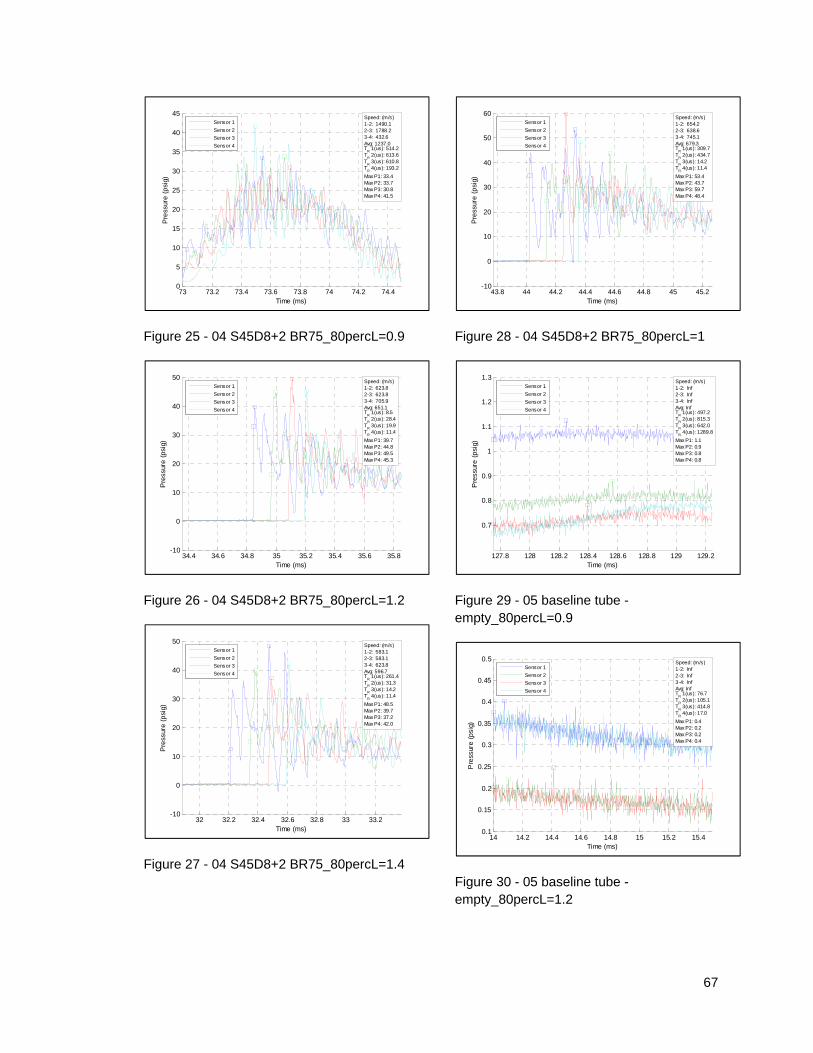
67
Figure 25 - 04 S45D8+2 BR75_80percL=0.9
Figure 26 - 04 S45D8+2 BR75_80percL=1.2
Figure 27 - 04 S45D8+2 BR75_80percL=1.4
Figure 28 - 04 S45D8+2 BR75_80percL=1
Figure 29 - 05 baseline tube - empty_80percL=0.9
Figure 30 - 05 baseline tube - empty_80percL=1.2
73 73.2 73.4 73.6 73.8 74 74.2 74.40
5
10
15
20
25
30
35
40
45
Time (ms)
Pre
ssur
e (
psi
g)
Speed: (m/s)1-2: 1490.12-3: 1788.23-4: 432.6Avg: 1237.0T
R 1(us): 514.2
TR 2(us): 613.6
TR 3(us): 610.8
TR 4(us): 193.2
Max P1: 33.4Max P2: 33.7Max P3: 30.8Max P4: 41.5
Sensor 1
Sensor 2
Sensor 3
Sensor 4
34.4 34.6 34.8 35 35.2 35.4 35.6 35.8-10
0
10
20
30
40
50
Time (ms)
Pre
ssur
e (
psi
g)
Speed: (m/s)1-2: 623.82-3: 623.83-4: 705.9Avg: 651.1T
R 1(us): 8.5
TR 2(us): 28.4
TR 3(us): 19.9
TR 4(us): 11.4
Max P1: 39.7Max P2: 44.8Max P3: 49.5Max P4: 45.3
Sensor 1
Sensor 2
Sensor 3
Sensor 4
32 32.2 32.4 32.6 32.8 33 33.2-10
0
10
20
30
40
50
Time (ms)
Pre
ssur
e (
psi
g)
Speed: (m/s)1-2: 583.12-3: 583.13-4: 623.8Avg: 596.7T
R 1(us): 261.4
TR 2(us): 31.3
TR 3(us): 14.2
TR 4(us): 11.4
Max P1: 48.5Max P2: 39.7Max P3: 37.2Max P4: 42.0
Sensor 1
Sensor 2
Sensor 3
Sensor 4
43.8 44 44.2 44.4 44.6 44.8 45 45.2-10
0
10
20
30
40
50
60
Time (ms)
Pre
ssur
e (
psi
g)
Speed: (m/s)1-2: 654.22-3: 638.63-4: 745.1Avg: 679.3T
R 1(us): 309.7
TR 2(us): 434.7
TR 3(us): 14.2
TR 4(us): 11.4
Max P1: 53.4Max P2: 43.7Max P3: 59.7Max P4: 48.4
Sensor 1
Sensor 2
Sensor 3
Sensor 4
127.8 128 128.2 128.4 128.6 128.8 129 129.2
0.7
0.8
0.9
1
1.1
1.2
1.3
Time (ms)
Pre
ssur
e (
psi
g)
Speed: (m/s)1-2: Inf2-3: Inf3-4: InfAvg: InfT
R 1(us): 497.2
TR 2(us): 815.3
TR 3(us): 642.0
TR 4(us): 1289.8
Max P1: 1.1Max P2: 0.9Max P3: 0.8Max P4: 0.8
Sensor 1
Sensor 2
Sensor 3
Sensor 4
14 14.2 14.4 14.6 14.8 15 15.2 15.40.1
0.15
0.2
0.25
0.3
0.35
0.4
0.45
0.5
Time (ms)
Pre
ssur
e (
psi
g)
Speed: (m/s)1-2: Inf2-3: Inf3-4: InfAvg: InfT
R 1(us): 76.7
TR 2(us): 105.1
TR 3(us): 414.8
TR 4(us): 17.0
Max P1: 0.4Max P2: 0.2Max P3: 0.2Max P4: 0.4
Sensor 1
Sensor 2
Sensor 3
Sensor 4
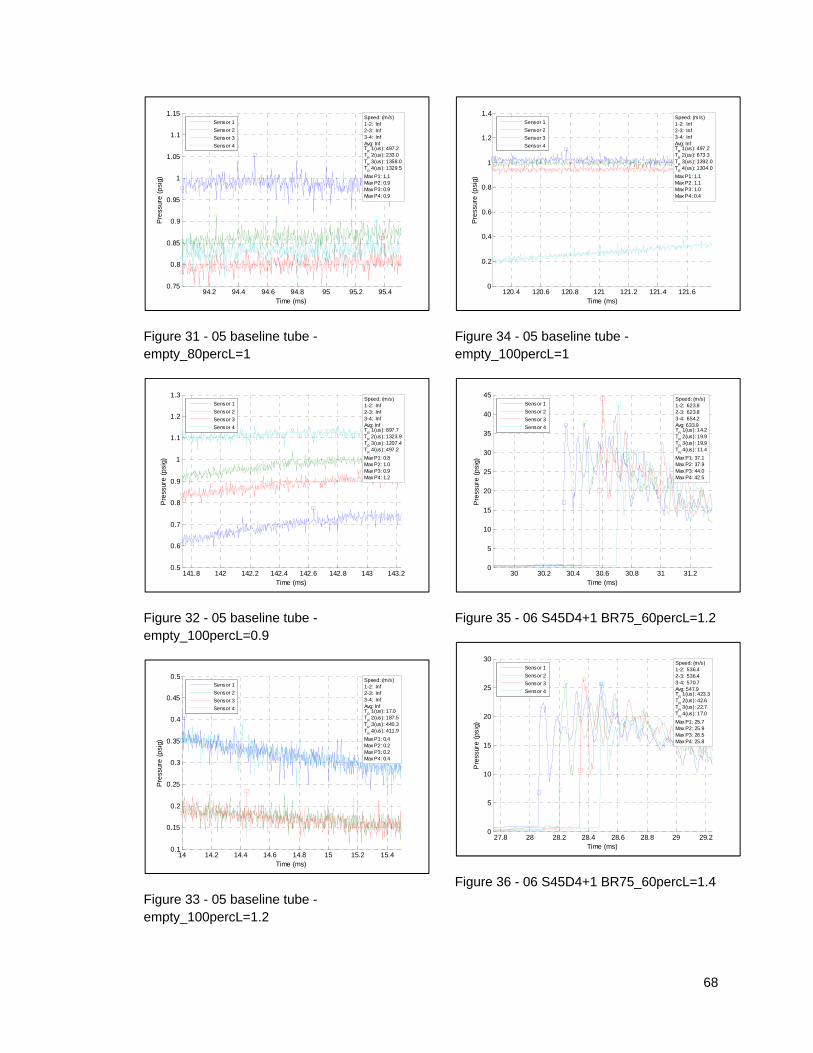
68
Figure 31 - 05 baseline tube - empty_80percL=1
Figure 32 - 05 baseline tube - empty_100percL=0.9
Figure 33 - 05 baseline tube - empty_100percL=1.2
Figure 34 - 05 baseline tube - empty_100percL=1
Figure 35 - 06 S45D4+1 BR75_60percL=1.2
Figure 36 - 06 S45D4+1 BR75_60percL=1.4
94.2 94.4 94.6 94.8 95 95.2 95.40.75
0.8
0.85
0.9
0.95
1
1.05
1.1
1.15
Time (ms)
Pre
ssur
e (
psi
g)
Speed: (m/s)1-2: Inf2-3: Inf3-4: InfAvg: InfT
R 1(us): 497.2
TR 2(us): 233.0
TR 3(us): 1358.0
TR 4(us): 1329.5
Max P1: 1.1Max P2: 0.9Max P3: 0.9Max P4: 0.9
Sensor 1
Sensor 2
Sensor 3
Sensor 4
141.8 142 142.2 142.4 142.6 142.8 143 143.20.5
0.6
0.7
0.8
0.9
1
1.1
1.2
1.3
Time (ms)
Pre
ssur
e (
psi
g)
Speed: (m/s)1-2: Inf2-3: Inf3-4: InfAvg: InfT
R 1(us): 897.7
TR 2(us): 1323.9
TR 3(us): 1207.4
TR 4(us): 497.2
Max P1: 0.8Max P2: 1.0Max P3: 0.9Max P4: 1.2
Sensor 1
Sensor 2
Sensor 3
Sensor 4
14 14.2 14.4 14.6 14.8 15 15.2 15.40.1
0.15
0.2
0.25
0.3
0.35
0.4
0.45
0.5
Time (ms)
Pre
ssur
e (
psi
g)
Speed: (m/s)1-2: Inf2-3: Inf3-4: InfAvg: InfT
R 1(us): 17.0
TR 2(us): 187.5
TR 3(us): 440.3
TR 4(us): 411.9
Max P1: 0.4Max P2: 0.2Max P3: 0.2Max P4: 0.4
Sensor 1
Sensor 2
Sensor 3
Sensor 4
120.4 120.6 120.8 121 121.2 121.4 121.60
0.2
0.4
0.6
0.8
1
1.2
1.4
Time (ms)
Pre
ssur
e (
psi
g)
Speed: (m/s)1-2: Inf2-3: Inf3-4: InfAvg: InfT
R 1(us): 497.2
TR 2(us): 673.3
TR 3(us): 1392.0
TR 4(us): 1304.0
Max P1: 1.1Max P2: 1.1Max P3: 1.0Max P4: 0.4
Sensor 1
Sensor 2
Sensor 3
Sensor 4
30 30.2 30.4 30.6 30.8 31 31.20
5
10
15
20
25
30
35
40
45
Time (ms)
Pre
ssur
e (
psi
g)
Speed: (m/s)1-2: 623.82-3: 623.83-4: 654.2Avg: 633.9T
R 1(us): 14.2
TR 2(us): 19.9
TR 3(us): 19.9
TR 4(us): 11.4
Max P1: 37.1Max P2: 37.9Max P3: 44.0Max P4: 42.5
Sensor 1
Sensor 2
Sensor 3
Sensor 4
27.8 28 28.2 28.4 28.6 28.8 29 29.20
5
10
15
20
25
30
Time (ms)
Pre
ssur
e (
psi
g)
Speed: (m/s)1-2: 536.42-3: 536.43-4: 570.7Avg: 547.9T
R 1(us): 423.3
TR 2(us): 42.6
TR 3(us): 22.7
TR 4(us): 17.0
Max P1: 25.7Max P2: 25.9Max P3: 26.5Max P4: 25.8
Sensor 1
Sensor 2
Sensor 3
Sensor 4

69
Figure 37 - 06 S45D4+1 BR75_60percL=1.6
Figure 38 - 06 S45D4+1 BR75_60percL=1.8
Figure 39 - 06 S45D4+1 BR75_60percL=1
Figure 40 - 06 S45D4+1 BR75_80percL=1.2
Figure 4106 S45D4+1 BR75_80percL=1.3 delay 1.0 -
Figure 42 - 06 S45D4+1 BR75_80percL=1.4
29.6 29.8 30 30.2 30.4 30.6 30.8 310
5
10
15
20
25
Time (ms)
Pre
ssur
e (
psi
g)
Speed: (m/s)1-2: 487.72-3: 515.83-4: 525.9Avg: 509.8T
R 1(us): 454.5
TR 2(us): 485.8
TR 3(us): 31.3
TR 4(us): 25.6
Max P1: 19.5Max P2: 18.5Max P3: 20.9Max P4: 20.8
Sensor 1
Sensor 2
Sensor 3
Sensor 4
35 35.2 35.4 35.6 35.8 36 36.24
5
6
7
8
9
10
11
12
13
14
Time (ms)
Pre
ssur
e (
psi
g)
Speed: (m/s)1-2: Inf2-3: Inf3-4: InfAvg: InfT
R 1(us): 497.2
TR 2(us): 639.2
TR 3(us): 798.3
TR 4(us): 892.0
Max P1: 13.5Max P2: 13.3Max P3: 13.5Max P4: 12.6
Sensor 1
Sensor 2
Sensor 3
Sensor 4
37.2 37.4 37.6 37.8 38 38.2 38.40
5
10
15
20
25
30
35
40
Time (ms)
Pre
ssur
e (
psi
g)
Speed: (m/s)1-2: 638.62-3: 638.63-4: 654.2Avg: 643.8T
R 1(us): 304.0
TR 2(us): 19.9
TR 3(us): 19.9
TR 4(us): 14.2
Max P1: 36.7Max P2: 36.7Max P3: 36.3Max P4: 34.4
Sensor 1
Sensor 2
Sensor 3
Sensor 4
30.4 30.6 30.8 31 31.2 31.4 31.60
5
10
15
20
25
30
35
40
45
50
Time (ms)
Pre
ssur
e (
psi
g)
Speed: (m/s)1-2: 583.12-3: 623.83-4: 670.6Avg: 625.8T
R 1(us): 485.8
TR 2(us): 281.3
TR 3(us): 19.9
TR 4(us): 11.4
Max P1: 48.1Max P2: 40.2Max P3: 45.4Max P4: 46.2
Sensor 1
Sensor 2
Sensor 3
Sensor 4
39 39.2 39.4 39.6 39.8 40 40.2 40.4-5
0
5
10
15
20
25
30
35
40
Time (ms)
Pre
ssur
e (
psi
g)
Speed: (m/s)1-2: 583.12-3: 596.13-4: 623.8Avg: 601.0T
R 1(us): 360.8
TR 2(us): 19.9
TR 3(us): 19.9
TR 4(us): 11.4
Max P1: 35.7Max P2: 36.8Max P3: 35.7Max P4: 35.4
Sensor 1
Sensor 2
Sensor 3
Sensor 4
28.2 28.4 28.6 28.8 29 29.2 29.4-10
0
10
20
30
40
50
Time (ms)
Pre
ssur
e (
psi
g)
Speed: (m/s)1-2: 623.82-3: 654.23-4: 670.6Avg: 649.5T
R 1(us): 318.2
TR 2(us): 17.0
TR 3(us): 17.0
TR 4(us): 11.4
Max P1: 41.0Max P2: 46.5Max P3: 44.4Max P4: 44.8
Sensor 1
Sensor 2
Sensor 3
Sensor 4

70
Figure 43 - 06 S45D4+1 BR75_80percL=1.6
Figure 44 - 06 S45D4+1 BR75_80percL=1.8
Figure 45 - 06 S45D4+1 BR75_80percL=2
Figure 46 - 06 S45D4+1 BR75_120percL=1.2
Figure 47 - 06 S45D4+1 BR75_120percL=1.3
Figure 48 - 06 S45D4+1 BR75_120percL=1.4
29 29.2 29.4 29.6 29.8 30 30.20
5
10
15
20
25
30
35
Time (ms)
Pre
ssur
e (
psi
g)
Speed: (m/s)1-2: 558.82-3: 583.13-4: 596.1Avg: 579.3T
R 1(us): 338.1
TR 2(us): 17.0
TR 3(us): 19.9
TR 4(us): 22.7
Max P1: 32.8Max P2: 31.3Max P3: 29.7Max P4: 30.2
Sensor 1
Sensor 2
Sensor 3
Sensor 4
29.4 29.6 29.8 30 30.2 30.4 30.6 30.80
5
10
15
20
25
Time (ms)
Pre
ssur
e (
psi
g)
Speed: (m/s)1-2: 496.72-3: 506.13-4: 547.4Avg: 516.7T
R 1(us): 585.2
TR 2(us): 352.3
TR 3(us): 31.3
TR 4(us): 31.3
Max P1: 22.5Max P2: 22.4Max P3: 22.9Max P4: 23.6
Sensor 1
Sensor 2
Sensor 3
Sensor 4
33.4 33.6 33.8 34 34.2 34.4 34.62
4
6
8
10
12
14
16
18
Time (ms)
Pre
ssur
e (
psi
g)
Speed: (m/s)1-2: Inf2-3: 1219.23-4: InfAvg: InfT
R 1(us): 497.2
TR 2(us): 596.6
TR 3(us): 863.6
TR 4(us): 798.3
Max P1: 16.6Max P2: 15.9Max P3: 16.5Max P4: 15.3
Sensor 1
Sensor 2
Sensor 3
Sensor 4
33.6 33.8 34 34.2 34.4 34.6 34.80
10
20
30
40
50
60
70
Time (ms)
Pre
ssur
e (
psi
g)
Speed: (m/s)1-2: 609.62-3: 623.83-4: 654.2Avg: 629.2T
R 1(us): 286.9
TR 2(us): 400.6
TR 3(us): 352.3
TR 4(us): 309.7
Max P1: 63.8Max P2: 53.7Max P3: 49.8Max P4: 46.6
Sensor 1
Sensor 2
Sensor 3
Sensor 4
43 43.2 43.4 43.6 43.8 44 44.2 44.4-10
0
10
20
30
40
50
Time (ms)
Pre
ssur
e (
psi
g)
Speed: (m/s)1-2: 558.82-3: 609.63-4: 638.6Avg: 602.3T
R 1(us): 329.5
TR 2(us): 122.2
TR 3(us): 19.9
TR 4(us): 14.2
Max P1: 44.4Max P2: 40.3Max P3: 47.0Max P4: 41.3
Sensor 1
Sensor 2
Sensor 3
Sensor 4
28.6 28.8 29 29.2 29.4 29.6 29.8 30-10
0
10
20
30
40
50
60
Time (ms)
Pre
ssur
e (
psi
g)
Speed: (m/s)1-2: 654.22-3: 654.23-4: 687.8Avg: 665.4T
R 1(us): 460.2
TR 2(us): 14.2
TR 3(us): 17.0
TR 4(us): 11.4
Max P1: 53.8Max P2: 43.2Max P3: 55.1Max P4: 50.0
Sensor 1
Sensor 2
Sensor 3
Sensor 4
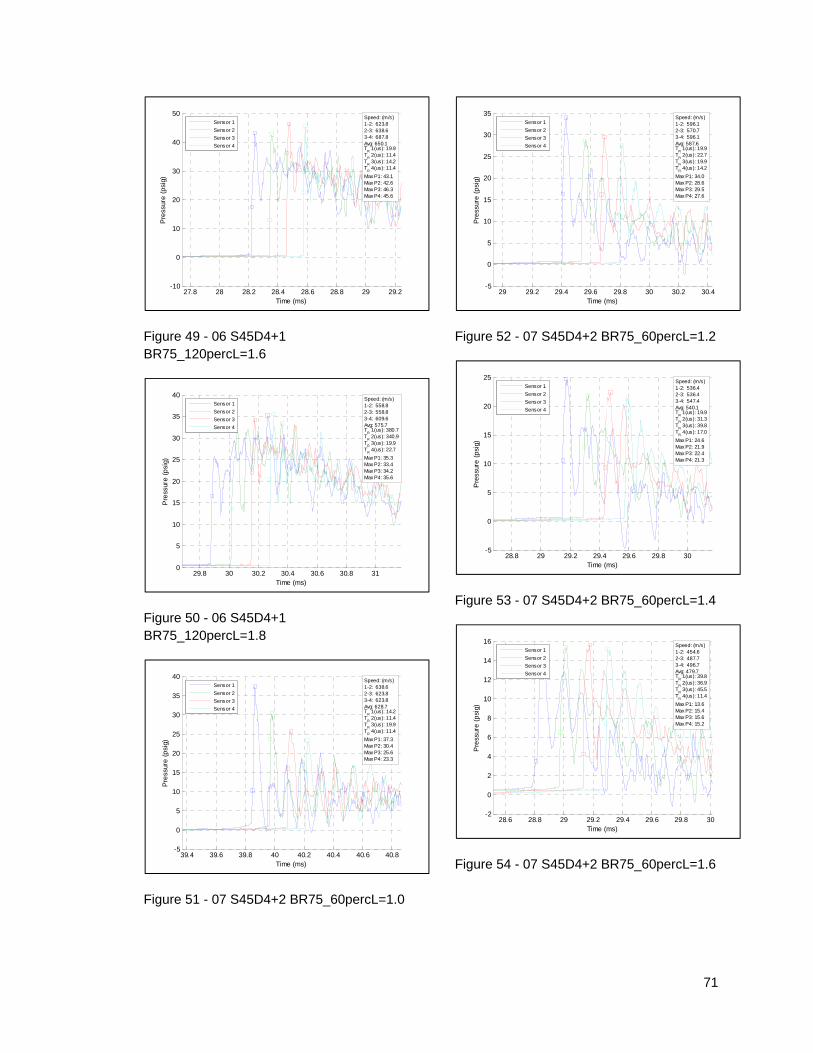
71
Figure 49 - 06 S45D4+1 BR75_120percL=1.6
Figure 50 - 06 S45D4+1 BR75_120percL=1.8
Figure 51 - 07 S45D4+2 BR75_60percL=1.0
Figure 52 - 07 S45D4+2 BR75_60percL=1.2
Figure 53 - 07 S45D4+2 BR75_60percL=1.4
Figure 54 - 07 S45D4+2 BR75_60percL=1.6
27.8 28 28.2 28.4 28.6 28.8 29 29.2-10
0
10
20
30
40
50
Time (ms)
Pre
ssur
e (
psi
g)
Speed: (m/s)1-2: 623.82-3: 638.63-4: 687.8Avg: 650.1T
R 1(us): 19.9
TR 2(us): 11.4
TR 3(us): 14.2
TR 4(us): 11.4
Max P1: 43.1Max P2: 42.6Max P3: 46.3Max P4: 45.6
Sensor 1
Sensor 2
Sensor 3
Sensor 4
29.8 30 30.2 30.4 30.6 30.8 310
5
10
15
20
25
30
35
40
Time (ms)
Pre
ssur
e (
psi
g)
Speed: (m/s)1-2: 558.82-3: 558.83-4: 609.6Avg: 575.7T
R 1(us): 380.7
TR 2(us): 340.9
TR 3(us): 19.9
TR 4(us): 22.7
Max P1: 35.3Max P2: 33.4Max P3: 34.2Max P4: 35.6
Sensor 1
Sensor 2
Sensor 3
Sensor 4
39.4 39.6 39.8 40 40.2 40.4 40.6 40.8-5
0
5
10
15
20
25
30
35
40
Time (ms)
Pre
ssur
e (
psi
g)
Speed: (m/s)1-2: 638.62-3: 623.83-4: 623.8Avg: 628.7T
R 1(us): 14.2
TR 2(us): 11.4
TR 3(us): 19.9
TR 4(us): 11.4
Max P1: 37.3Max P2: 30.4Max P3: 25.6Max P4: 23.3
Sensor 1
Sensor 2
Sensor 3
Sensor 4
29 29.2 29.4 29.6 29.8 30 30.2 30.4-5
0
5
10
15
20
25
30
35
Time (ms)
Pre
ssur
e (
psi
g)
Speed: (m/s)1-2: 596.12-3: 570.73-4: 596.1Avg: 587.6T
R 1(us): 19.9
TR 2(us): 22.7
TR 3(us): 19.9
TR 4(us): 14.2
Max P1: 34.0Max P2: 28.6Max P3: 29.5Max P4: 27.6
Sensor 1
Sensor 2
Sensor 3
Sensor 4
28.8 29 29.2 29.4 29.6 29.8 30-5
0
5
10
15
20
25
Time (ms)
Pre
ssur
e (
psi
g)
Speed: (m/s)1-2: 536.42-3: 536.43-4: 547.4Avg: 540.1T
R 1(us): 19.9
TR 2(us): 31.3
TR 3(us): 39.8
TR 4(us): 17.0
Max P1: 24.6Max P2: 21.9Max P3: 22.4Max P4: 21.3
Sensor 1
Sensor 2
Sensor 3
Sensor 4
28.6 28.8 29 29.2 29.4 29.6 29.8 30-2
0
2
4
6
8
10
12
14
16
Time (ms)
Pre
ssur
e (
psi
g)
Speed: (m/s)1-2: 454.62-3: 487.73-4: 496.7Avg: 479.7T
R 1(us): 39.8
TR 2(us): 36.9
TR 3(us): 45.5
TR 4(us): 11.4
Max P1: 13.6Max P2: 15.4Max P3: 15.6Max P4: 15.2
Sensor 1
Sensor 2
Sensor 3
Sensor 4
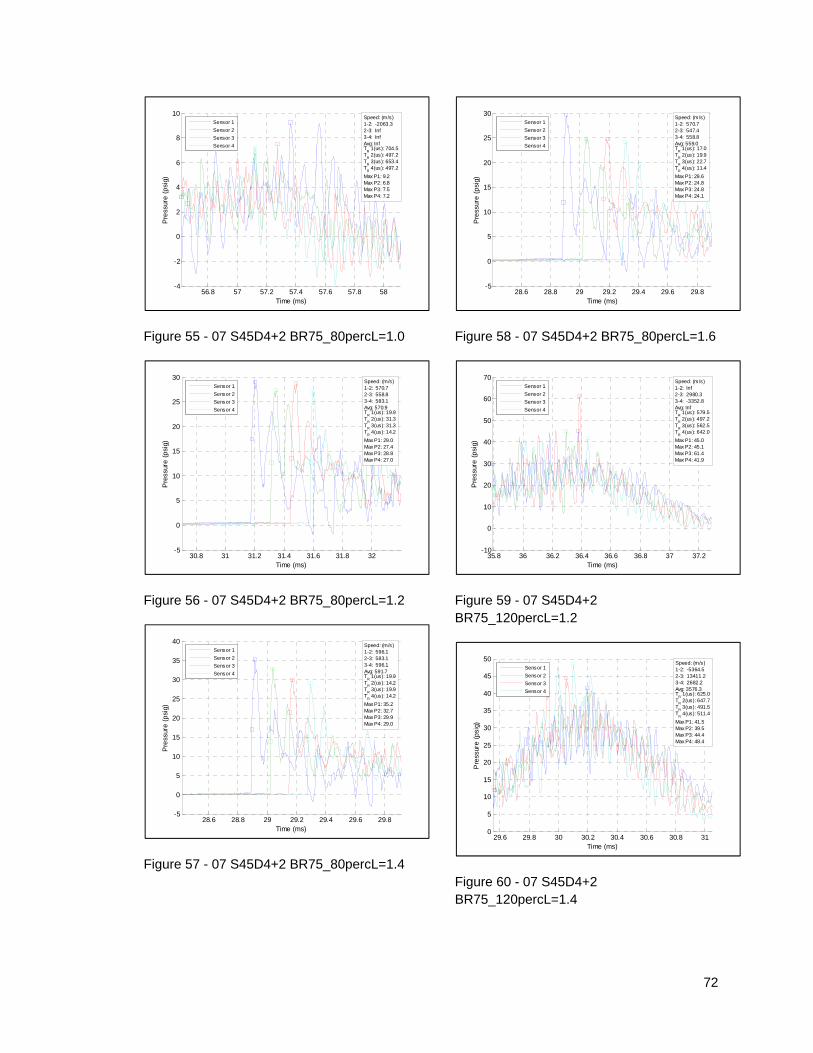
72
Figure 55 - 07 S45D4+2 BR75_80percL=1.0
Figure 56 - 07 S45D4+2 BR75_80percL=1.2
Figure 57 - 07 S45D4+2 BR75_80percL=1.4
Figure 58 - 07 S45D4+2 BR75_80percL=1.6
Figure 59 - 07 S45D4+2 BR75_120percL=1.2
Figure 60 - 07 S45D4+2 BR75_120percL=1.4
56.8 57 57.2 57.4 57.6 57.8 58-4
-2
0
2
4
6
8
10
Time (ms)
Pre
ssur
e (
psi
g)
Speed: (m/s)1-2: -2063.32-3: Inf3-4: InfAvg: InfT
R 1(us): 704.5
TR 2(us): 497.2
TR 3(us): 653.4
TR 4(us): 497.2
Max P1: 9.2Max P2: 6.8Max P3: 7.5Max P4: 7.2
Sensor 1
Sensor 2
Sensor 3
Sensor 4
30.8 31 31.2 31.4 31.6 31.8 32-5
0
5
10
15
20
25
30
Time (ms)
Pre
ssur
e (
psi
g)
Speed: (m/s)1-2: 570.72-3: 558.83-4: 583.1Avg: 570.9T
R 1(us): 19.9
TR 2(us): 31.3
TR 3(us): 31.3
TR 4(us): 14.2
Max P1: 29.0Max P2: 27.4Max P3: 28.8Max P4: 27.0
Sensor 1
Sensor 2
Sensor 3
Sensor 4
28.6 28.8 29 29.2 29.4 29.6 29.8-5
0
5
10
15
20
25
30
35
40
Time (ms)
Pre
ssur
e (
psi
g)
Speed: (m/s)1-2: 596.12-3: 583.13-4: 596.1Avg: 591.7T
R 1(us): 19.9
TR 2(us): 14.2
TR 3(us): 19.9
TR 4(us): 14.2
Max P1: 35.2Max P2: 32.7Max P3: 29.9Max P4: 29.0
Sensor 1
Sensor 2
Sensor 3
Sensor 4
28.6 28.8 29 29.2 29.4 29.6 29.8-5
0
5
10
15
20
25
30
Time (ms)
Pre
ssur
e (
psi
g)
Speed: (m/s)1-2: 570.72-3: 547.43-4: 558.8Avg: 559.0T
R 1(us): 17.0
TR 2(us): 19.9
TR 3(us): 22.7
TR 4(us): 11.4
Max P1: 29.6Max P2: 24.8Max P3: 24.8Max P4: 24.1
Sensor 1
Sensor 2
Sensor 3
Sensor 4
35.8 36 36.2 36.4 36.6 36.8 37 37.2-10
0
10
20
30
40
50
60
70
Time (ms)
Pre
ssur
e (
psi
g)
Speed: (m/s)1-2: Inf2-3: 2980.33-4: -3352.8Avg: InfT
R 1(us): 579.5
TR 2(us): 497.2
TR 3(us): 562.5
TR 4(us): 642.0
Max P1: 45.0Max P2: 45.1Max P3: 61.4Max P4: 41.9
Sensor 1
Sensor 2
Sensor 3
Sensor 4
29.6 29.8 30 30.2 30.4 30.6 30.8 310
5
10
15
20
25
30
35
40
45
50
Time (ms)
Pre
ssur
e (
psi
g)
Speed: (m/s)1-2: -5364.52-3: 13411.23-4: 2682.2Avg: 3576.3T
R 1(us): 625.0
TR 2(us): 647.7
TR 3(us): 491.5
TR 4(us): 511.4
Max P1: 41.5Max P2: 39.5Max P3: 44.4Max P4: 48.4
Sensor 1
Sensor 2
Sensor 3
Sensor 4
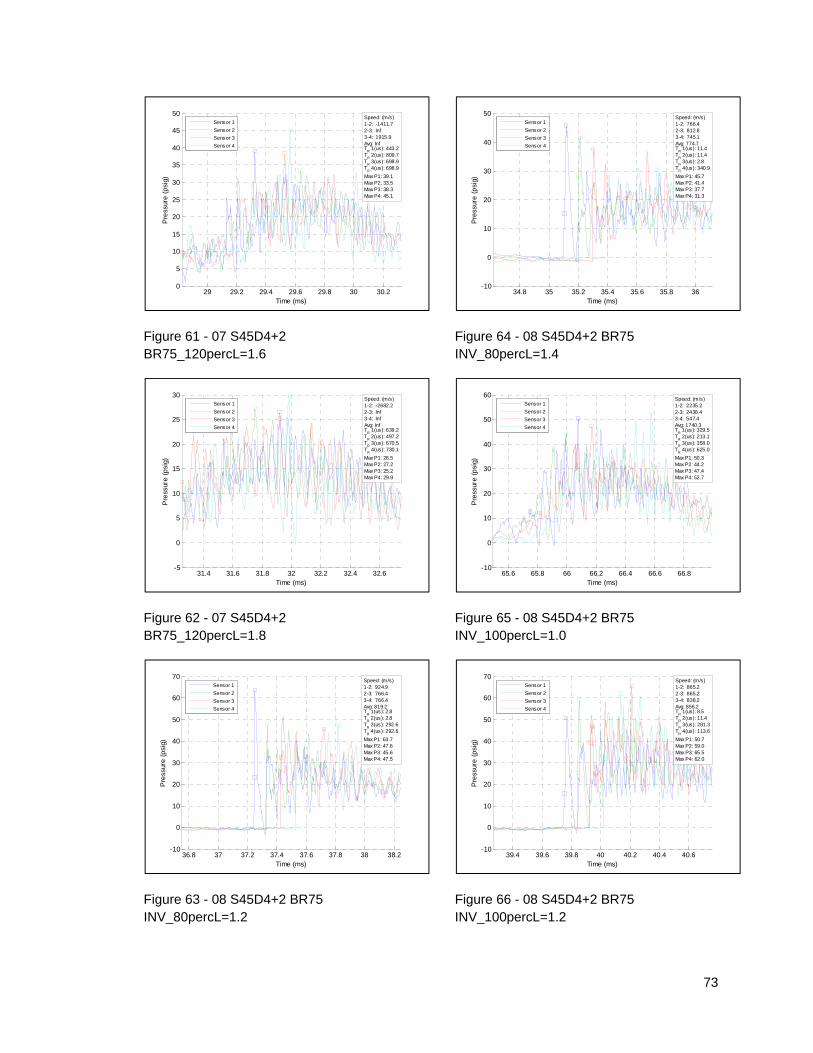
73
Figure 61 - 07 S45D4+2 BR75_120percL=1.6
Figure 62 - 07 S45D4+2 BR75_120percL=1.8
Figure 63 - 08 S45D4+2 BR75 INV_80percL=1.2
Figure 64 - 08 S45D4+2 BR75 INV_80percL=1.4
Figure 65 - 08 S45D4+2 BR75 INV_100percL=1.0
Figure 66 - 08 S45D4+2 BR75 INV_100percL=1.2
29 29.2 29.4 29.6 29.8 30 30.20
5
10
15
20
25
30
35
40
45
50
Time (ms)
Pre
ssur
e (
psi
g)
Speed: (m/s)1-2: -1411.72-3: Inf3-4: 1915.9Avg: InfT
R 1(us): 443.2
TR 2(us): 809.7
TR 3(us): 698.9
TR 4(us): 698.9
Max P1: 39.1Max P2: 33.5Max P3: 38.3Max P4: 45.1
Sensor 1
Sensor 2
Sensor 3
Sensor 4
31.4 31.6 31.8 32 32.2 32.4 32.6-5
0
5
10
15
20
25
30
Time (ms)
Pre
ssur
e (
psi
g)
Speed: (m/s)1-2: -2682.22-3: Inf3-4: InfAvg: InfT
R 1(us): 639.2
TR 2(us): 497.2
TR 3(us): 670.5
TR 4(us): 730.1
Max P1: 26.5Max P2: 27.2Max P3: 25.2Max P4: 29.9
Sensor 1
Sensor 2
Sensor 3
Sensor 4
36.8 37 37.2 37.4 37.6 37.8 38 38.2-10
0
10
20
30
40
50
60
70
Time (ms)
Pre
ssur
e (
psi
g)
Speed: (m/s)1-2: 924.92-3: 766.43-4: 766.4Avg: 819.2T
R 1(us): 2.8
TR 2(us): 2.8
TR 3(us): 292.6
TR 4(us): 292.6
Max P1: 63.7Max P2: 47.6Max P3: 45.6Max P4: 47.5
Sensor 1
Sensor 2
Sensor 3
Sensor 4
34.8 35 35.2 35.4 35.6 35.8 36-10
0
10
20
30
40
50
Time (ms)
Pre
ssur
e (
psi
g)
Speed: (m/s)1-2: 766.42-3: 812.83-4: 745.1Avg: 774.7T
R 1(us): 11.4
TR 2(us): 11.4
TR 3(us): 2.8
TR 4(us): 340.9
Max P1: 45.7Max P2: 41.4Max P3: 37.7Max P4: 31.3
Sensor 1
Sensor 2
Sensor 3
Sensor 4
65.6 65.8 66 66.2 66.4 66.6 66.8-10
0
10
20
30
40
50
60
Time (ms)
Pre
ssur
e (
psi
g)
Speed: (m/s)1-2: 2235.22-3: 2438.43-4: 547.4Avg: 1740.3T
R 1(us): 329.5
TR 2(us): 213.1
TR 3(us): 358.0
TR 4(us): 625.0
Max P1: 50.3Max P2: 44.2Max P3: 47.4Max P4: 52.7
Sensor 1
Sensor 2
Sensor 3
Sensor 4
39.4 39.6 39.8 40 40.2 40.4 40.6-10
0
10
20
30
40
50
60
70
Time (ms)
Pre
ssur
e (
psi
g)
Speed: (m/s)1-2: 865.22-3: 865.23-4: 838.2Avg: 856.2T
R 1(us): 8.5
TR 2(us): 11.4
TR 3(us): 281.3
TR 4(us): 113.6
Max P1: 50.7Max P2: 59.0Max P3: 65.5Max P4: 62.0
Sensor 1
Sensor 2
Sensor 3
Sensor 4
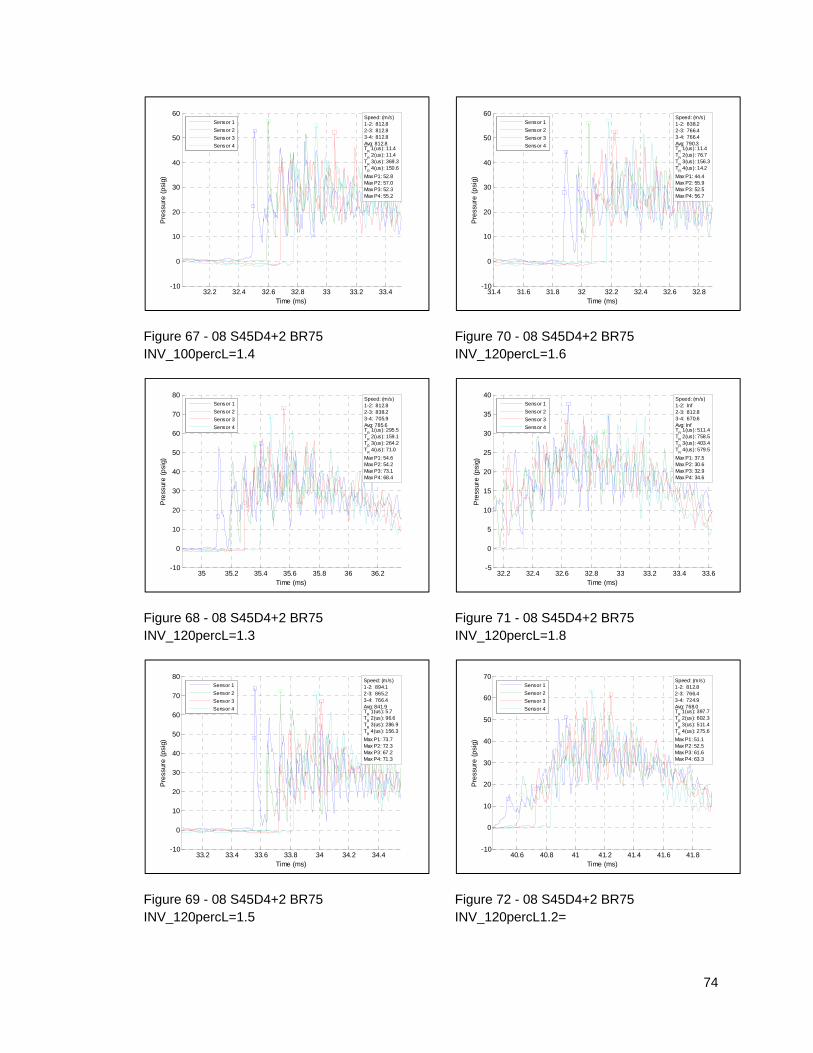
74
Figure 67 - 08 S45D4+2 BR75 INV_100percL=1.4
Figure 68 - 08 S45D4+2 BR75 INV_120percL=1.3
Figure 69 - 08 S45D4+2 BR75 INV_120percL=1.5
Figure 70 - 08 S45D4+2 BR75 INV_120percL=1.6
Figure 71 - 08 S45D4+2 BR75 INV_120percL=1.8
Figure 72 - 08 S45D4+2 BR75 INV_120percL1.2=
32.2 32.4 32.6 32.8 33 33.2 33.4-10
0
10
20
30
40
50
60
Time (ms)
Pre
ssur
e (
psi
g)
Speed: (m/s)1-2: 812.82-3: 812.83-4: 812.8Avg: 812.8T
R 1(us): 11.4
TR 2(us): 11.4
TR 3(us): 369.3
TR 4(us): 150.6
Max P1: 52.8Max P2: 57.0Max P3: 52.3Max P4: 55.2
Sensor 1
Sensor 2
Sensor 3
Sensor 4
35 35.2 35.4 35.6 35.8 36 36.2-10
0
10
20
30
40
50
60
70
80
Time (ms)
Pre
ssur
e (
psi
g)
Speed: (m/s)1-2: 812.82-3: 838.23-4: 705.9Avg: 785.6T
R 1(us): 295.5
TR 2(us): 159.1
TR 3(us): 264.2
TR 4(us): 71.0
Max P1: 54.6Max P2: 54.2Max P3: 73.1Max P4: 68.4
Sensor 1
Sensor 2
Sensor 3
Sensor 4
33.2 33.4 33.6 33.8 34 34.2 34.4-10
0
10
20
30
40
50
60
70
80
Time (ms)
Pre
ssur
e (
psi
g)
Speed: (m/s)1-2: 894.12-3: 865.23-4: 766.4Avg: 841.9T
R 1(us): 5.7
TR 2(us): 96.6
TR 3(us): 286.9
TR 4(us): 156.3
Max P1: 73.7Max P2: 72.3Max P3: 67.2Max P4: 71.3
Sensor 1
Sensor 2
Sensor 3
Sensor 4
31.4 31.6 31.8 32 32.2 32.4 32.6 32.8-10
0
10
20
30
40
50
60
Time (ms)
Pre
ssur
e (
psi
g)
Speed: (m/s)1-2: 838.22-3: 766.43-4: 766.4Avg: 790.3T
R 1(us): 11.4
TR 2(us): 76.7
TR 3(us): 156.3
TR 4(us): 14.2
Max P1: 44.4Max P2: 55.9Max P3: 52.5Max P4: 56.7
Sensor 1
Sensor 2
Sensor 3
Sensor 4
32.2 32.4 32.6 32.8 33 33.2 33.4 33.6-5
0
5
10
15
20
25
30
35
40
Time (ms)
Pre
ssur
e (
psi
g)
Speed: (m/s)1-2: Inf2-3: 812.83-4: 670.6Avg: InfT
R 1(us): 511.4
TR 2(us): 758.5
TR 3(us): 403.4
TR 4(us): 579.5
Max P1: 37.5Max P2: 30.6Max P3: 32.9Max P4: 34.6
Sensor 1
Sensor 2
Sensor 3
Sensor 4
40.6 40.8 41 41.2 41.4 41.6 41.8-10
0
10
20
30
40
50
60
70
Time (ms)
Pre
ssur
e (
psi
g)
Speed: (m/s)1-2: 812.82-3: 766.43-4: 724.9Avg: 768.0T
R 1(us): 397.7
TR 2(us): 602.3
TR 3(us): 511.4
TR 4(us): 275.6
Max P1: 51.1Max P2: 52.5Max P3: 61.6Max P4: 63.3
Sensor 1
Sensor 2
Sensor 3
Sensor 4
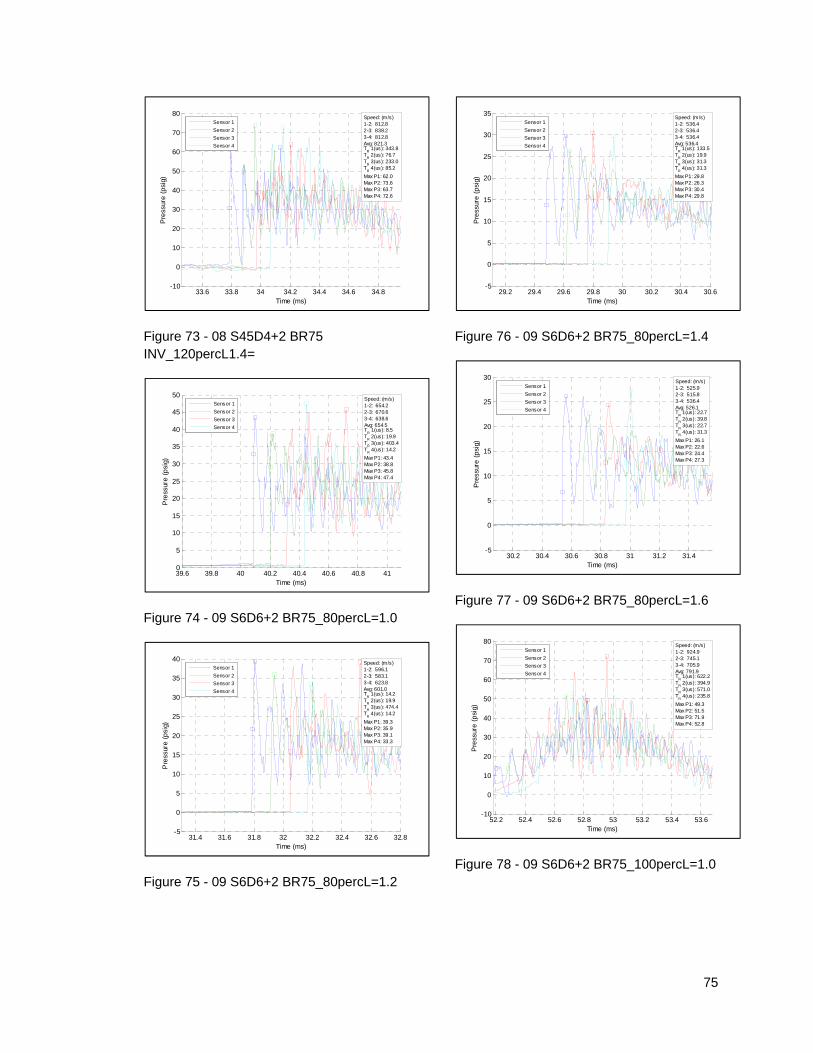
75
Figure 73 - 08 S45D4+2 BR75 INV_120percL1.4=
Figure 74 - 09 S6D6+2 BR75_80percL=1.0
Figure 75 - 09 S6D6+2 BR75_80percL=1.2
Figure 76 - 09 S6D6+2 BR75_80percL=1.4
Figure 77 - 09 S6D6+2 BR75_80percL=1.6
Figure 78 - 09 S6D6+2 BR75_100percL=1.0
33.6 33.8 34 34.2 34.4 34.6 34.8-10
0
10
20
30
40
50
60
70
80
Time (ms)
Pre
ssur
e (
psi
g)
Speed: (m/s)1-2: 812.82-3: 838.23-4: 812.8Avg: 821.3T
R 1(us): 343.8
TR 2(us): 76.7
TR 3(us): 233.0
TR 4(us): 85.2
Max P1: 62.0Max P2: 73.6Max P3: 63.7Max P4: 72.6
Sensor 1
Sensor 2
Sensor 3
Sensor 4
39.6 39.8 40 40.2 40.4 40.6 40.8 410
5
10
15
20
25
30
35
40
45
50
Time (ms)
Pre
ssur
e (
psi
g)
Speed: (m/s)1-2: 654.22-3: 670.63-4: 638.6Avg: 654.5T
R 1(us): 8.5
TR 2(us): 19.9
TR 3(us): 403.4
TR 4(us): 14.2
Max P1: 43.4Max P2: 38.8Max P3: 45.8Max P4: 47.4
Sensor 1
Sensor 2
Sensor 3
Sensor 4
31.4 31.6 31.8 32 32.2 32.4 32.6 32.8-5
0
5
10
15
20
25
30
35
40
Time (ms)
Pre
ssur
e (
psi
g)
Speed: (m/s)1-2: 596.12-3: 583.13-4: 623.8Avg: 601.0T
R 1(us): 14.2
TR 2(us): 19.9
TR 3(us): 474.4
TR 4(us): 14.2
Max P1: 39.3Max P2: 35.9Max P3: 39.1Max P4: 33.3
Sensor 1
Sensor 2
Sensor 3
Sensor 4
29.2 29.4 29.6 29.8 30 30.2 30.4 30.6-5
0
5
10
15
20
25
30
35
Time (ms)
Pre
ssur
e (
psi
g)
Speed: (m/s)1-2: 536.42-3: 536.43-4: 536.4Avg: 536.4T
R 1(us): 133.5
TR 2(us): 19.9
TR 3(us): 31.3
TR 4(us): 31.3
Max P1: 29.8Max P2: 26.3Max P3: 30.4Max P4: 29.8
Sensor 1
Sensor 2
Sensor 3
Sensor 4
30.2 30.4 30.6 30.8 31 31.2 31.4-5
0
5
10
15
20
25
30
Time (ms)
Pre
ssur
e (
psi
g)
Speed: (m/s)1-2: 525.92-3: 515.83-4: 536.4Avg: 526.1T
R 1(us): 22.7
TR 2(us): 39.8
TR 3(us): 22.7
TR 4(us): 31.3
Max P1: 26.1Max P2: 22.6Max P3: 24.4Max P4: 27.3
Sensor 1
Sensor 2
Sensor 3
Sensor 4
52.2 52.4 52.6 52.8 53 53.2 53.4 53.6-10
0
10
20
30
40
50
60
70
80
Time (ms)
Pre
ssur
e (
psi
g)
Speed: (m/s)1-2: 924.92-3: 745.13-4: 705.9Avg: 791.9T
R 1(us): 622.2
TR 2(us): 394.9
TR 3(us): 571.0
TR 4(us): 235.8
Max P1: 49.3Max P2: 51.5Max P3: 71.9Max P4: 52.8
Sensor 1
Sensor 2
Sensor 3
Sensor 4
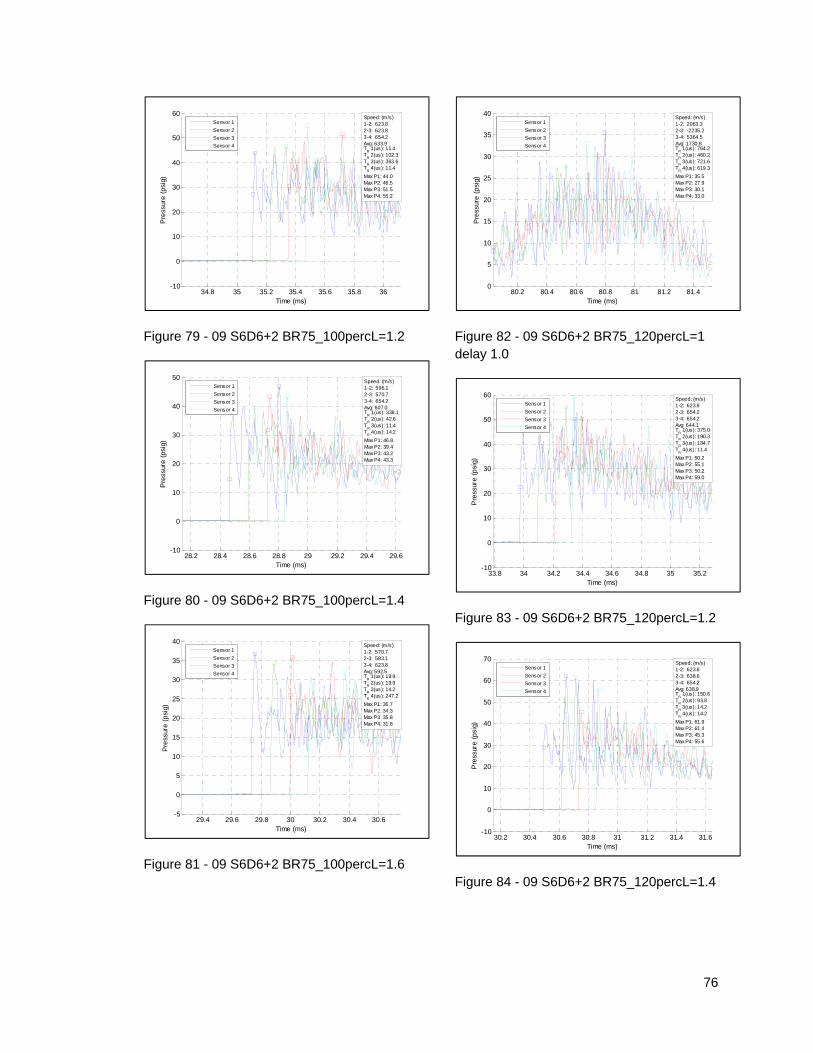
76
Figure 79 - 09 S6D6+2 BR75_100percL=1.2
Figure 80 - 09 S6D6+2 BR75_100percL=1.4
Figure 81 - 09 S6D6+2 BR75_100percL=1.6
Figure 82 - 09 S6D6+2 BR75_120percL=1 delay 1.0
Figure 83 - 09 S6D6+2 BR75_120percL=1.2
Figure 84 - 09 S6D6+2 BR75_120percL=1.4
34.8 35 35.2 35.4 35.6 35.8 36-10
0
10
20
30
40
50
60
Time (ms)
Pre
ssur
e (
psi
g)
Speed: (m/s)1-2: 623.82-3: 623.83-4: 654.2Avg: 633.9T
R 1(us): 11.4
TR 2(us): 102.3
TR 3(us): 363.6
TR 4(us): 11.4
Max P1: 44.0Max P2: 46.5Max P3: 51.5Max P4: 55.2
Sensor 1
Sensor 2
Sensor 3
Sensor 4
28.2 28.4 28.6 28.8 29 29.2 29.4 29.6-10
0
10
20
30
40
50
Time (ms)
Pre
ssur
e (
psi
g)
Speed: (m/s)1-2: 596.12-3: 570.73-4: 654.2Avg: 607.0T
R 1(us): 338.1
TR 2(us): 42.6
TR 3(us): 11.4
TR 4(us): 14.2
Max P1: 46.8Max P2: 39.4Max P3: 43.2Max P4: 43.3
Sensor 1
Sensor 2
Sensor 3
Sensor 4
29.4 29.6 29.8 30 30.2 30.4 30.6-5
0
5
10
15
20
25
30
35
40
Time (ms)
Pre
ssur
e (
psi
g)
Speed: (m/s)1-2: 570.72-3: 583.13-4: 623.8Avg: 592.5T
R 1(us): 19.9
TR 2(us): 19.9
TR 3(us): 14.2
TR 4(us): 247.2
Max P1: 36.7Max P2: 34.3Max P3: 35.8Max P4: 31.8
Sensor 1
Sensor 2
Sensor 3
Sensor 4
80.2 80.4 80.6 80.8 81 81.2 81.40
5
10
15
20
25
30
35
40
Time (ms)
Pre
ssur
e (
psi
g)
Speed: (m/s)1-2: 2063.32-3: -2235.23-4: 5364.5Avg: 1730.8T
R 1(us): 764.2
TR 2(us): 460.2
TR 3(us): 721.6
TR 4(us): 619.3
Max P1: 35.5Max P2: 27.9Max P3: 30.1Max P4: 33.0
Sensor 1
Sensor 2
Sensor 3
Sensor 4
33.8 34 34.2 34.4 34.6 34.8 35 35.2-10
0
10
20
30
40
50
60
Time (ms)
Pre
ssur
e (
psi
g)
Speed: (m/s)1-2: 623.82-3: 654.23-4: 654.2Avg: 644.1T
R 1(us): 375.0
TR 2(us): 190.3
TR 3(us): 184.7
TR 4(us): 11.4
Max P1: 50.2Max P2: 55.1Max P3: 50.2Max P4: 59.0
Sensor 1
Sensor 2
Sensor 3
Sensor 4
30.2 30.4 30.6 30.8 31 31.2 31.4 31.6-10
0
10
20
30
40
50
60
70
Time (ms)
Pre
ssur
e (
psi
g)
Speed: (m/s)1-2: 623.82-3: 638.63-4: 654.2Avg: 638.9T
R 1(us): 150.6
TR 2(us): 93.8
TR 3(us): 14.2
TR 4(us): 14.2
Max P1: 61.9Max P2: 61.4Max P3: 45.3Max P4: 55.6
Sensor 1
Sensor 2
Sensor 3
Sensor 4
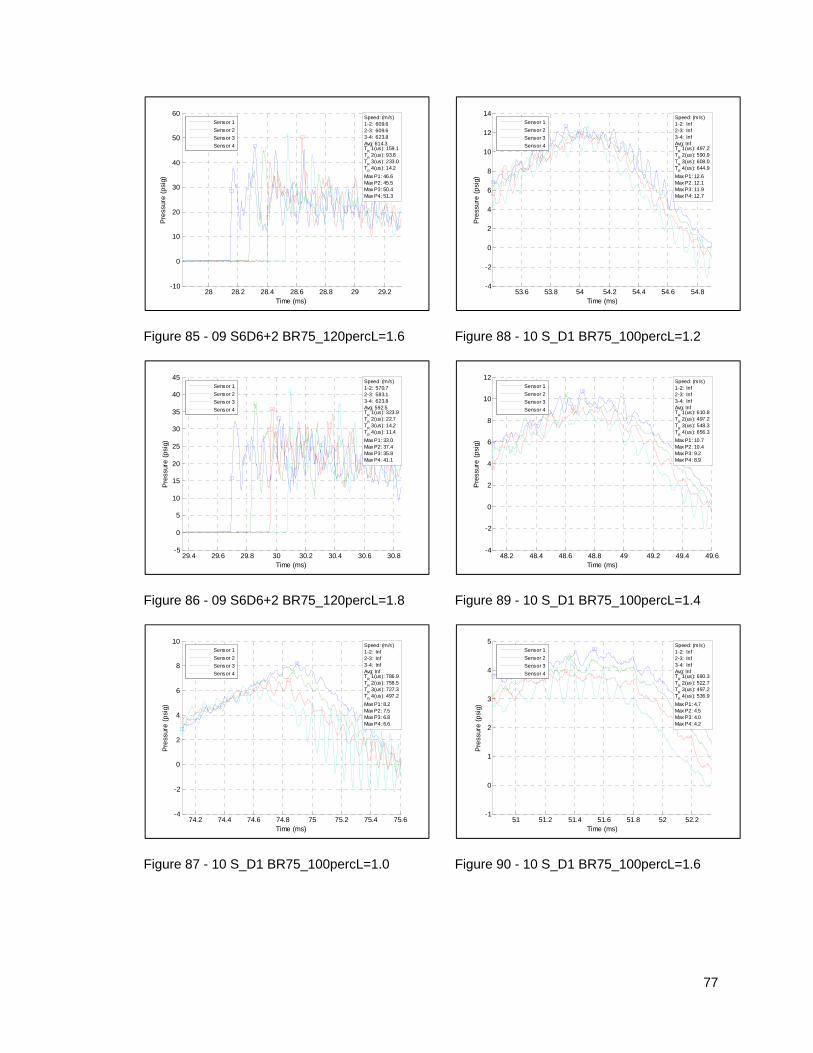
77
Figure 85 - 09 S6D6+2 BR75_120percL=1.6
Figure 86 - 09 S6D6+2 BR75_120percL=1.8
Figure 87 - 10 S_D1 BR75_100percL=1.0
Figure 88 - 10 S_D1 BR75_100percL=1.2
Figure 89 - 10 S_D1 BR75_100percL=1.4
Figure 90 - 10 S_D1 BR75_100percL=1.6
28 28.2 28.4 28.6 28.8 29 29.2-10
0
10
20
30
40
50
60
Time (ms)
Pre
ssur
e (
psi
g)
Speed: (m/s)1-2: 609.62-3: 609.63-4: 623.8Avg: 614.3T
R 1(us): 159.1
TR 2(us): 93.8
TR 3(us): 233.0
TR 4(us): 14.2
Max P1: 46.6Max P2: 45.5Max P3: 50.4Max P4: 51.3
Sensor 1
Sensor 2
Sensor 3
Sensor 4
29.4 29.6 29.8 30 30.2 30.4 30.6 30.8-5
0
5
10
15
20
25
30
35
40
45
Time (ms)
Pre
ssur
e (
psi
g)
Speed: (m/s)1-2: 570.72-3: 583.13-4: 623.8Avg: 592.5T
R 1(us): 323.9
TR 2(us): 22.7
TR 3(us): 14.2
TR 4(us): 11.4
Max P1: 33.0Max P2: 37.4Max P3: 35.8Max P4: 41.1
Sensor 1
Sensor 2
Sensor 3
Sensor 4
74.2 74.4 74.6 74.8 75 75.2 75.4 75.6-4
-2
0
2
4
6
8
10
Time (ms)
Pre
ssur
e (
psi
g)
Speed: (m/s)1-2: Inf2-3: Inf3-4: InfAvg: InfT
R 1(us): 786.9
TR 2(us): 758.5
TR 3(us): 727.3
TR 4(us): 497.2
Max P1: 8.2Max P2: 7.5Max P3: 6.8Max P4: 6.6
Sensor 1
Sensor 2
Sensor 3
Sensor 4
53.6 53.8 54 54.2 54.4 54.6 54.8-4
-2
0
2
4
6
8
10
12
14
Time (ms)
Pre
ssur
e (
psi
g)
Speed: (m/s)1-2: Inf2-3: Inf3-4: InfAvg: InfT
R 1(us): 497.2
TR 2(us): 590.9
TR 3(us): 608.0
TR 4(us): 644.9
Max P1: 12.6Max P2: 12.1Max P3: 11.9Max P4: 12.7
Sensor 1
Sensor 2
Sensor 3
Sensor 4
48.2 48.4 48.6 48.8 49 49.2 49.4 49.6-4
-2
0
2
4
6
8
10
12
Time (ms)
Pre
ssur
e (
psi
g)
Speed: (m/s)1-2: Inf2-3: Inf3-4: InfAvg: InfT
R 1(us): 610.8
TR 2(us): 497.2
TR 3(us): 548.3
TR 4(us): 656.3
Max P1: 10.7Max P2: 10.4Max P3: 9.2Max P4: 8.9
Sensor 1
Sensor 2
Sensor 3
Sensor 4
51 51.2 51.4 51.6 51.8 52 52.2-1
0
1
2
3
4
5
Time (ms)
Pre
ssur
e (
psi
g)
Speed: (m/s)1-2: Inf2-3: Inf3-4: InfAvg: InfT
R 1(us): 690.3
TR 2(us): 522.7
TR 3(us): 497.2
TR 4(us): 536.9
Max P1: 4.7Max P2: 4.5Max P3: 4.0Max P4: 4.2
Sensor 1
Sensor 2
Sensor 3
Sensor 4
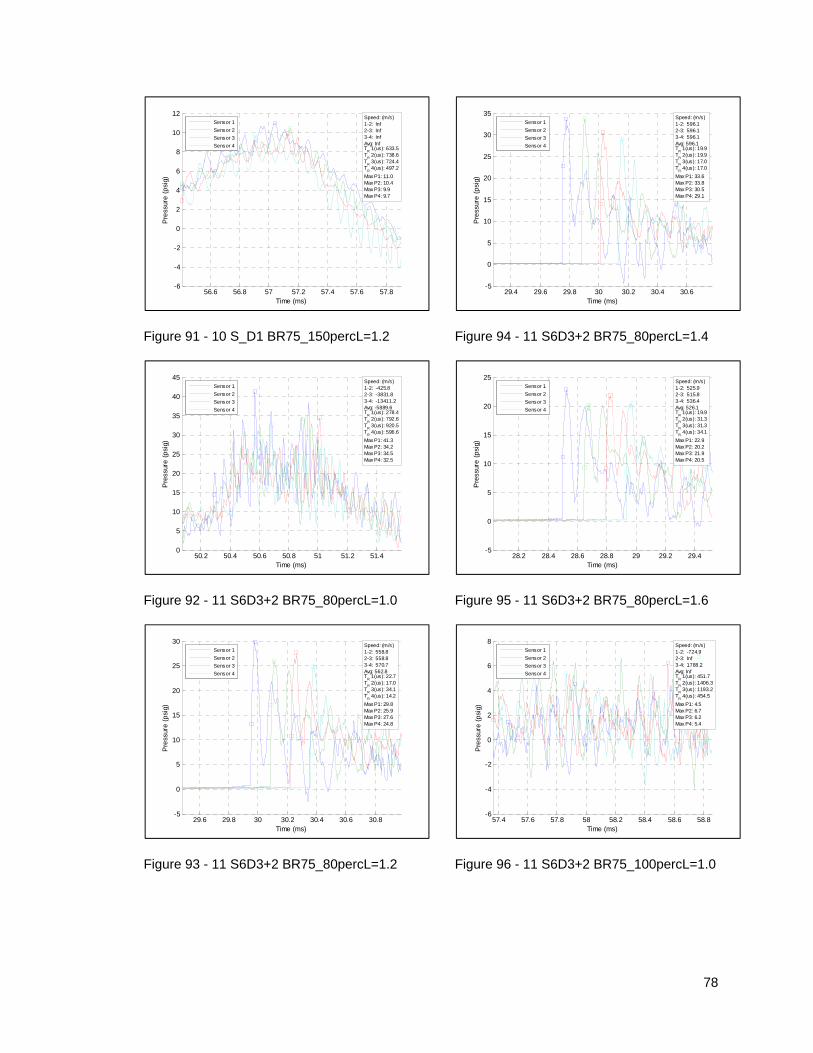
78
Figure 91 - 10 S_D1 BR75_150percL=1.2
Figure 92 - 11 S6D3+2 BR75_80percL=1.0
Figure 93 - 11 S6D3+2 BR75_80percL=1.2
Figure 94 - 11 S6D3+2 BR75_80percL=1.4
Figure 95 - 11 S6D3+2 BR75_80percL=1.6
Figure 96 - 11 S6D3+2 BR75_100percL=1.0
56.6 56.8 57 57.2 57.4 57.6 57.8-6
-4
-2
0
2
4
6
8
10
12
Time (ms)
Pre
ssur
e (
psi
g)
Speed: (m/s)1-2: Inf2-3: Inf3-4: InfAvg: InfT
R 1(us): 633.5
TR 2(us): 738.6
TR 3(us): 724.4
TR 4(us): 497.2
Max P1: 11.0Max P2: 10.4Max P3: 9.9Max P4: 9.7
Sensor 1
Sensor 2
Sensor 3
Sensor 4
50.2 50.4 50.6 50.8 51 51.2 51.40
5
10
15
20
25
30
35
40
45
Time (ms)
Pre
ssur
e (
psi
g)
Speed: (m/s)1-2: -425.82-3: -3831.83-4: -13411.2Avg: -5889.6T
R 1(us): 278.4
TR 2(us): 792.6
TR 3(us): 920.5
TR 4(us): 596.6
Max P1: 41.3Max P2: 34.2Max P3: 34.5Max P4: 32.5
Sensor 1
Sensor 2
Sensor 3
Sensor 4
29.6 29.8 30 30.2 30.4 30.6 30.8-5
0
5
10
15
20
25
30
Time (ms)
Pre
ssur
e (
psi
g)
Speed: (m/s)1-2: 558.82-3: 558.83-4: 570.7Avg: 562.8T
R 1(us): 22.7
TR 2(us): 17.0
TR 3(us): 34.1
TR 4(us): 14.2
Max P1: 29.8Max P2: 25.9Max P3: 27.6Max P4: 24.8
Sensor 1
Sensor 2
Sensor 3
Sensor 4
29.4 29.6 29.8 30 30.2 30.4 30.6-5
0
5
10
15
20
25
30
35
Time (ms)
Pre
ssur
e (
psi
g)
Speed: (m/s)1-2: 596.12-3: 596.13-4: 596.1Avg: 596.1T
R 1(us): 19.9
TR 2(us): 19.9
TR 3(us): 17.0
TR 4(us): 17.0
Max P1: 33.6Max P2: 33.8Max P3: 30.5Max P4: 29.1
Sensor 1
Sensor 2
Sensor 3
Sensor 4
28.2 28.4 28.6 28.8 29 29.2 29.4-5
0
5
10
15
20
25
Time (ms)
Pre
ssur
e (
psi
g)
Speed: (m/s)1-2: 525.92-3: 515.83-4: 536.4Avg: 526.1T
R 1(us): 19.9
TR 2(us): 31.3
TR 3(us): 31.3
TR 4(us): 34.1
Max P1: 22.9Max P2: 20.2Max P3: 21.9Max P4: 20.5
Sensor 1
Sensor 2
Sensor 3
Sensor 4
57.4 57.6 57.8 58 58.2 58.4 58.6 58.8-6
-4
-2
0
2
4
6
8
Time (ms)
Pre
ssur
e (
psi
g)
Speed: (m/s)1-2: -724.92-3: Inf3-4: 1788.2Avg: InfT
R 1(us): 451.7
TR 2(us): 1406.3
TR 3(us): 1193.2
TR 4(us): 454.5
Max P1: 4.5Max P2: 6.7Max P3: 6.2Max P4: 5.4
Sensor 1
Sensor 2
Sensor 3
Sensor 4
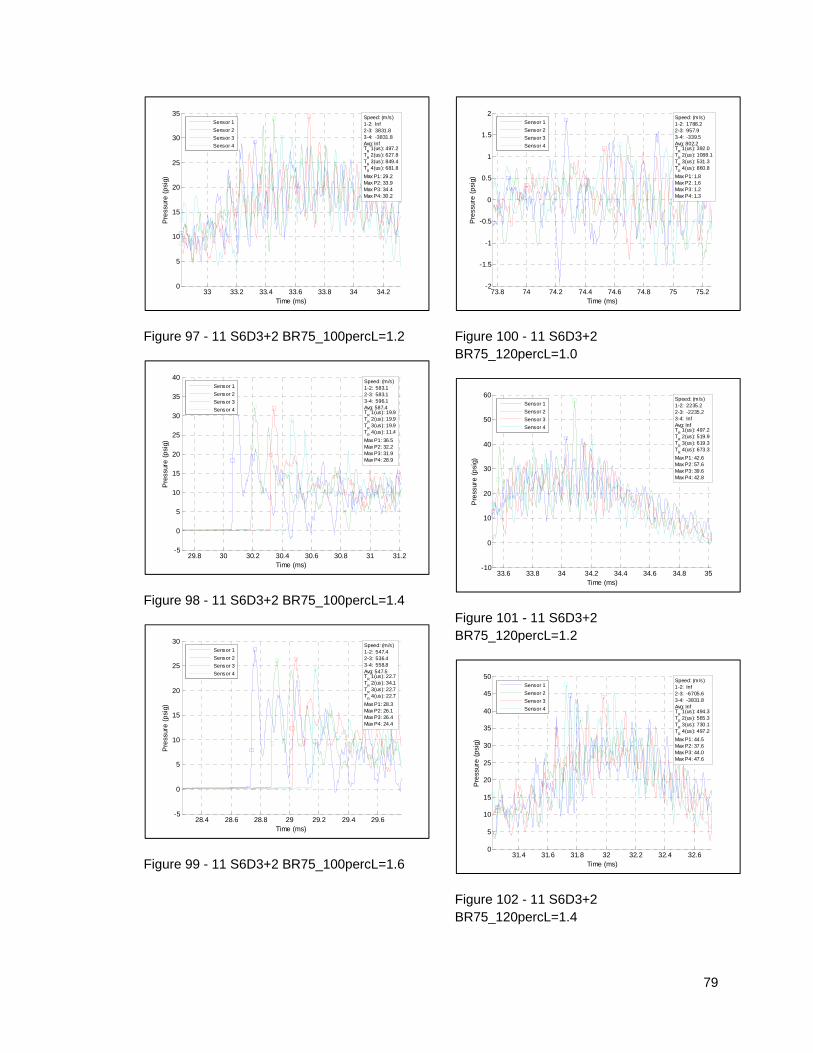
79
Figure 97 - 11 S6D3+2 BR75_100percL=1.2
Figure 98 - 11 S6D3+2 BR75_100percL=1.4
Figure 99 - 11 S6D3+2 BR75_100percL=1.6
Figure 100 - 11 S6D3+2 BR75_120percL=1.0
Figure 101 - 11 S6D3+2 BR75_120percL=1.2
Figure 102 - 11 S6D3+2 BR75_120percL=1.4
33 33.2 33.4 33.6 33.8 34 34.20
5
10
15
20
25
30
35
Time (ms)
Pre
ssur
e (
psi
g)
Speed: (m/s)1-2: Inf2-3: 3831.83-4: -3831.8Avg: InfT
R 1(us): 497.2
TR 2(us): 627.8
TR 3(us): 849.4
TR 4(us): 681.8
Max P1: 29.2Max P2: 33.9Max P3: 34.4Max P4: 30.2
Sensor 1
Sensor 2
Sensor 3
Sensor 4
29.8 30 30.2 30.4 30.6 30.8 31 31.2-5
0
5
10
15
20
25
30
35
40
Time (ms)
Pre
ssur
e (
psi
g)
Speed: (m/s)1-2: 583.12-3: 583.13-4: 596.1Avg: 587.4T
R 1(us): 19.9
TR 2(us): 19.9
TR 3(us): 19.9
TR 4(us): 11.4
Max P1: 36.5Max P2: 32.2Max P3: 31.9Max P4: 28.9
Sensor 1
Sensor 2
Sensor 3
Sensor 4
28.4 28.6 28.8 29 29.2 29.4 29.6-5
0
5
10
15
20
25
30
Time (ms)
Pre
ssur
e (
psi
g)
Speed: (m/s)1-2: 547.42-3: 536.43-4: 558.8Avg: 547.5T
R 1(us): 22.7
TR 2(us): 34.1
TR 3(us): 22.7
TR 4(us): 22.7
Max P1: 28.3Max P2: 26.1Max P3: 26.4Max P4: 24.4
Sensor 1
Sensor 2
Sensor 3
Sensor 4
73.8 74 74.2 74.4 74.6 74.8 75 75.2-2
-1.5
-1
-0.5
0
0.5
1
1.5
2
Time (ms)
Pre
ssur
e (
psi
g)
Speed: (m/s)1-2: 1788.22-3: 957.93-4: -339.5Avg: 802.2T
R 1(us): 392.0
TR 2(us): 1088.1
TR 3(us): 531.3
TR 4(us): 860.8
Max P1: 1.8Max P2: 1.6Max P3: 1.2Max P4: 1.3
Sensor 1
Sensor 2
Sensor 3
Sensor 4
33.6 33.8 34 34.2 34.4 34.6 34.8 35-10
0
10
20
30
40
50
60
Time (ms)
Pre
ssur
e (
psi
g)
Speed: (m/s)1-2: 2235.22-3: -2235.23-4: InfAvg: InfT
R 1(us): 497.2
TR 2(us): 519.9
TR 3(us): 619.3
TR 4(us): 673.3
Max P1: 42.6Max P2: 57.6Max P3: 39.6Max P4: 42.8
Sensor 1
Sensor 2
Sensor 3
Sensor 4
31.4 31.6 31.8 32 32.2 32.4 32.60
5
10
15
20
25
30
35
40
45
50
Time (ms)
Pre
ssur
e (
psi
g)
Speed: (m/s)1-2: Inf2-3: -6705.63-4: -3831.8Avg: InfT
R 1(us): 494.3
TR 2(us): 565.3
TR 3(us): 730.1
TR 4(us): 497.2
Max P1: 44.5Max P2: 37.6Max P3: 44.0Max P4: 47.6
Sensor 1
Sensor 2
Sensor 3
Sensor 4

80
Figure 103 -11 S6D3+2 BR75_120percL=1.6
Figure 104 - 12 S3D6+1 BR60_80percL=1.0
Figure 105 -12 S3D6+1 BR60_80percL=1.2
Figure 106 - 12 S3D6+1 BR60_80percL=1.4
Figure 107 - 12 S3D6+1 BR60_80percL=1.6
Figure 108 - 12 S3D6+1 BR60_80percL=1.8
28.2 28.4 28.6 28.8 29 29.2 29.4 29.6-5
0
5
10
15
20
25
30
35
Time (ms)
Pre
ssur
e (
psi
g)
Speed: (m/s)1-2: 558.82-3: 583.13-4: 583.1Avg: 575.0T
R 1(us): 31.3
TR 2(us): 17.0
TR 3(us): 22.7
TR 4(us): 14.2
Max P1: 34.2Max P2: 31.4Max P3: 29.2Max P4: 28.3
Sensor 1
Sensor 2
Sensor 3
Sensor 4
43.2 43.4 43.6 43.8 44 44.2 44.4 44.64
6
8
10
12
14
16
18
20
Time (ms)
Pre
ssur
e (
psi
g)
Speed: (m/s)1-2: Inf2-3: Inf3-4: InfAvg: InfT
R 1(us): 497.2
TR 2(us): 656.3
TR 3(us): 650.6
TR 4(us): 852.3
Max P1: 17.7Max P2: 18.0Max P3: 19.1Max P4: 18.2
Sensor 1
Sensor 2
Sensor 3
Sensor 4
32.4 32.6 32.8 33 33.2 33.4 33.6 33.80
5
10
15
20
25
30
35
40
45
Time (ms)
Pre
ssur
e (
psi
g)
Speed: (m/s)1-2: 623.82-3: 670.63-4: 654.2Avg: 649.5T
R 1(us): 19.9
TR 2(us): 14.2
TR 3(us): 17.0
TR 4(us): 14.2
Max P1: 40.6Max P2: 43.7Max P3: 41.9Max P4: 41.7
Sensor 1
Sensor 2
Sensor 3
Sensor 4
28.8 29 29.2 29.4 29.6 29.8 30 30.2-10
0
10
20
30
40
50
Time (ms)
Pre
ssur
e (
psi
g)
Speed: (m/s)1-2: 638.62-3: 670.63-4: 687.8Avg: 665.6T
R 1(us): 14.2
TR 2(us): 14.2
TR 3(us): 14.2
TR 4(us): 11.4
Max P1: 43.4Max P2: 44.3Max P3: 47.1Max P4: 45.3
Sensor 1
Sensor 2
Sensor 3
Sensor 4
28.6 28.8 29 29.2 29.4 29.6 29.8 300
5
10
15
20
25
30
35
40
Time (ms)
Pre
ssur
e (
psi
g)
Speed: (m/s)1-2: 609.62-3: 623.83-4: 654.2Avg: 629.2T
R 1(us): 19.9
TR 2(us): 19.9
TR 3(us): 14.2
TR 4(us): 14.2
Max P1: 34.2Max P2: 38.0Max P3: 38.5Max P4: 37.4
Sensor 1
Sensor 2
Sensor 3
Sensor 4
30.2 30.4 30.6 30.8 31 31.2 31.40
5
10
15
20
25
Time (ms)
Pre
ssur
e (
psi
g)
Speed: (m/s)1-2: 1411.72-3: 496.73-4: 506.1Avg: 804.8T
R 1(us): 488.6
TR 2(us): 511.4
TR 3(us): 664.8
TR 4(us): 156.3
Max P1: 21.1Max P2: 20.4Max P3: 21.4Max P4: 19.0
Sensor 1
Sensor 2
Sensor 3
Sensor 4

81
Figure 109 - 12 S3D6+1 BR60_80percL=1
Figure 110 - 12 S3D6+1 BR60_100percL=1.0
Figure 111 - 12 S3D6+1 BR60_100percL=1.2
Figure 112 - 12 S3D6+1 BR60_100percL=1.4
Figure 113 - 12 S3D6+1 BR60_100percL=1.6
Figure 114 - 12 S3D6+1 BR60_100percL=1.8
43.2 43.4 43.6 43.8 44 44.2 44.4 44.64
6
8
10
12
14
16
18
20
Time (ms)
Pre
ssur
e (
psi
g)
Speed: (m/s)1-2: Inf2-3: Inf3-4: InfAvg: InfT
R 1(us): 497.2
TR 2(us): 656.3
TR 3(us): 650.6
TR 4(us): 852.3
Max P1: 17.7Max P2: 18.0Max P3: 19.1Max P4: 18.2
Sensor 1
Sensor 2
Sensor 3
Sensor 4
77.6 77.8 78 78.2 78.4 78.6 78.80.05
0.1
0.15
0.2
0.25
0.3
0.35
0.4
Time (ms)
Pre
ssur
e (
psi
g)
Speed: (m/s)1-2: Inf2-3: Inf3-4: InfAvg: InfT
R 1(us): 1275.6
TR 2(us): 497.2
TR 3(us): 440.3
TR 4(us): 215.9
Max P1: 0.3Max P2: 0.3Max P3: 0.2Max P4: 0.2
Sensor 1
Sensor 2
Sensor 3
Sensor 4
38.4 38.6 38.8 39 39.2 39.4 39.6 39.80
5
10
15
20
25
30
35
40
Time (ms)
Pre
ssur
e (
psi
g)
Speed: (m/s)1-2: 623.82-3: 479.03-4: 525.9Avg: 542.9T
R 1(us): 468.8
TR 2(us): 108.0
TR 3(us): 62.5
TR 4(us): 22.7
Max P1: 36.4Max P2: 32.0Max P3: 33.1Max P4: 34.6
Sensor 1
Sensor 2
Sensor 3
Sensor 4
31 31.2 31.4 31.6 31.8 32 32.2-10
0
10
20
30
40
50
60
Time (ms)
Pre
ssur
e (
psi
g)
Speed: (m/s)1-2: 670.62-3: 705.93-4: 687.8Avg: 688.1T
R 1(us): 17.0
TR 2(us): 11.4
TR 3(us): 14.2
TR 4(us): 11.4
Max P1: 48.0Max P2: 50.3Max P3: 48.1Max P4: 47.7
Sensor 1
Sensor 2
Sensor 3
Sensor 4
29 29.2 29.4 29.6 29.8 30 30.20
10
20
30
40
50
60
Time (ms)
Pre
ssur
e (
psi
g)
Speed: (m/s)1-2: 654.22-3: 687.83-4: 687.8Avg: 676.6T
R 1(us): 11.4
TR 2(us): 17.0
TR 3(us): 14.2
TR 4(us): 11.4
Max P1: 45.7Max P2: 51.3Max P3: 48.2Max P4: 46.5
Sensor 1
Sensor 2
Sensor 3
Sensor 4
29.6 29.8 30 30.2 30.4 30.6 30.8 310
5
10
15
20
25
30
35
Time (ms)
Pre
ssur
e (
psi
g)
Speed: (m/s)1-2: 536.42-3: 570.73-4: 623.8Avg: 577.0T
R 1(us): 423.3
TR 2(us): 31.3
TR 3(us): 19.9
TR 4(us): 17.0
Max P1: 30.0Max P2: 29.0Max P3: 33.2Max P4: 32.6
Sensor 1
Sensor 2
Sensor 3
Sensor 4
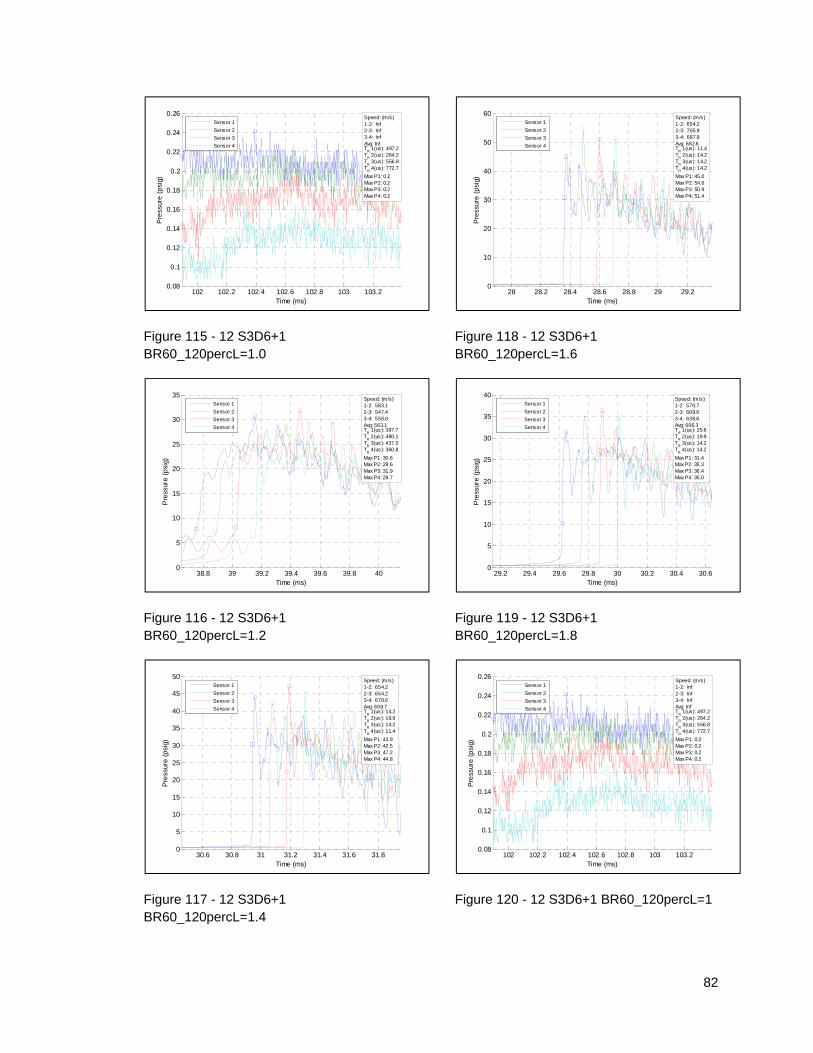
82
Figure 115 - 12 S3D6+1 BR60_120percL=1.0
Figure 116 - 12 S3D6+1 BR60_120percL=1.2
Figure 117 - 12 S3D6+1 BR60_120percL=1.4
Figure 118 - 12 S3D6+1 BR60_120percL=1.6
Figure 119 - 12 S3D6+1 BR60_120percL=1.8
Figure 120 - 12 S3D6+1 BR60_120percL=1
102 102.2 102.4 102.6 102.8 103 103.20.08
0.1
0.12
0.14
0.16
0.18
0.2
0.22
0.24
0.26
Time (ms)
Pre
ssur
e (
psi
g)
Speed: (m/s)1-2: Inf2-3: Inf3-4: InfAvg: InfT
R 1(us): 497.2
TR 2(us): 264.2
TR 3(us): 556.8
TR 4(us): 772.7
Max P1: 0.2Max P2: 0.2Max P3: 0.2Max P4: 0.2
Sensor 1
Sensor 2
Sensor 3
Sensor 4
38.8 39 39.2 39.4 39.6 39.8 400
5
10
15
20
25
30
35
Time (ms)
Pre
ssur
e (
psi
g)
Speed: (m/s)1-2: 583.12-3: 547.43-4: 558.8Avg: 563.1T
R 1(us): 397.7
TR 2(us): 480.1
TR 3(us): 437.5
TR 4(us): 360.8
Max P1: 30.6Max P2: 28.6Max P3: 31.9Max P4: 29.7
Sensor 1
Sensor 2
Sensor 3
Sensor 4
30.6 30.8 31 31.2 31.4 31.6 31.80
5
10
15
20
25
30
35
40
45
50
Time (ms)
Pre
ssur
e (
psi
g)
Speed: (m/s)1-2: 654.22-3: 654.23-4: 670.6Avg: 659.7T
R 1(us): 14.2
TR 2(us): 19.9
TR 3(us): 14.2
TR 4(us): 11.4
Max P1: 43.9Max P2: 42.5Max P3: 47.2Max P4: 44.8
Sensor 1
Sensor 2
Sensor 3
Sensor 4
28 28.2 28.4 28.6 28.8 29 29.20
10
20
30
40
50
60
Time (ms)
Pre
ssur
e (
psi
g)
Speed: (m/s)1-2: 654.22-3: 705.93-4: 687.8Avg: 682.6T
R 1(us): 11.4
TR 2(us): 14.2
TR 3(us): 14.2
TR 4(us): 14.2
Max P1: 45.0Max P2: 54.6Max P3: 50.9Max P4: 51.4
Sensor 1
Sensor 2
Sensor 3
Sensor 4
29.2 29.4 29.6 29.8 30 30.2 30.4 30.60
5
10
15
20
25
30
35
40
Time (ms)
Pre
ssur
e (
psi
g)
Speed: (m/s)1-2: 570.72-3: 609.63-4: 638.6Avg: 606.3T
R 1(us): 25.6
TR 2(us): 19.9
TR 3(us): 14.2
TR 4(us): 14.2
Max P1: 31.4Max P2: 35.3Max P3: 36.4Max P4: 35.0
Sensor 1
Sensor 2
Sensor 3
Sensor 4
102 102.2 102.4 102.6 102.8 103 103.20.08
0.1
0.12
0.14
0.16
0.18
0.2
0.22
0.24
0.26
Time (ms)
Pre
ssur
e (
psi
g)
Speed: (m/s)1-2: Inf2-3: Inf3-4: InfAvg: InfT
R 1(us): 497.2
TR 2(us): 264.2
TR 3(us): 556.8
TR 4(us): 772.7
Max P1: 0.2Max P2: 0.2Max P3: 0.2Max P4: 0.2
Sensor 1
Sensor 2
Sensor 3
Sensor 4
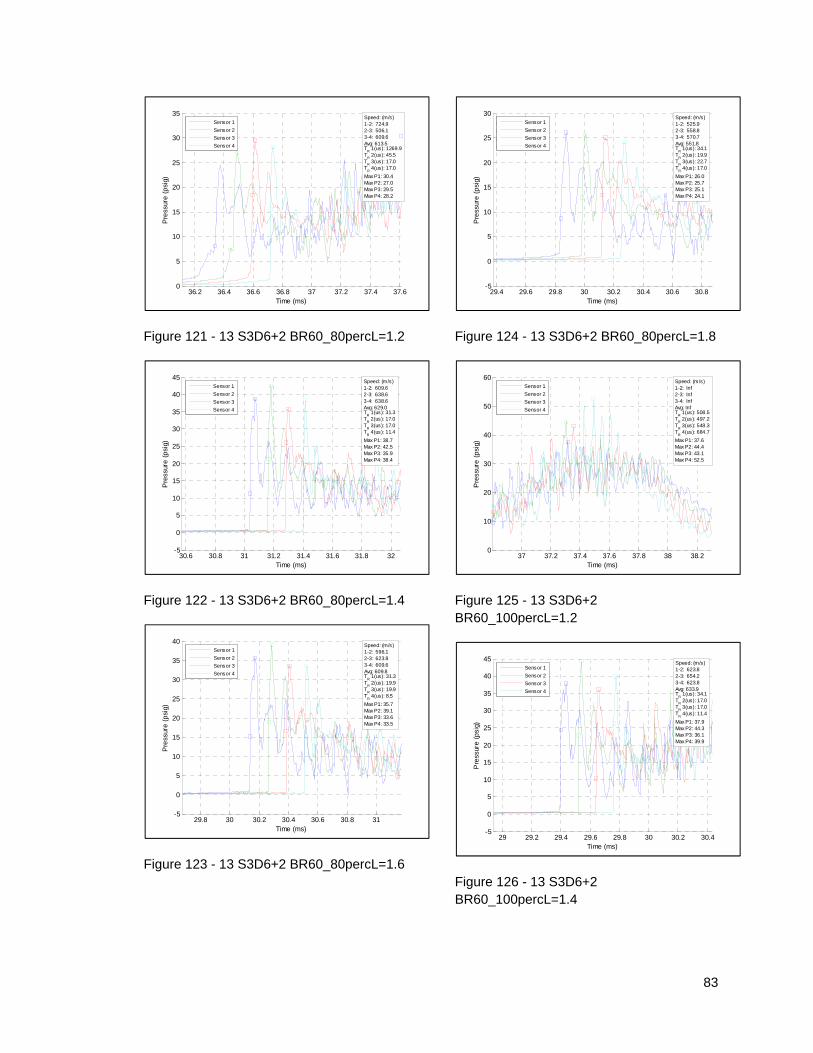
83
Figure 121 - 13 S3D6+2 BR60_80percL=1.2
Figure 122 - 13 S3D6+2 BR60_80percL=1.4
Figure 123 - 13 S3D6+2 BR60_80percL=1.6
Figure 124 - 13 S3D6+2 BR60_80percL=1.8
Figure 125 - 13 S3D6+2 BR60_100percL=1.2
Figure 126 - 13 S3D6+2 BR60_100percL=1.4
36.2 36.4 36.6 36.8 37 37.2 37.4 37.60
5
10
15
20
25
30
35
Time (ms)
Pre
ssur
e (
psi
g)
Speed: (m/s)1-2: 724.92-3: 506.13-4: 609.6Avg: 613.5T
R 1(us): 1269.9
TR 2(us): 45.5
TR 3(us): 17.0
TR 4(us): 17.0
Max P1: 30.4Max P2: 27.0Max P3: 29.5Max P4: 28.2
Sensor 1
Sensor 2
Sensor 3
Sensor 4
30.6 30.8 31 31.2 31.4 31.6 31.8 32-5
0
5
10
15
20
25
30
35
40
45
Time (ms)
Pre
ssur
e (
psi
g)
Speed: (m/s)1-2: 609.62-3: 638.63-4: 638.6Avg: 629.0T
R 1(us): 31.3
TR 2(us): 17.0
TR 3(us): 17.0
TR 4(us): 11.4
Max P1: 38.7Max P2: 42.5Max P3: 35.9Max P4: 38.4
Sensor 1
Sensor 2
Sensor 3
Sensor 4
29.8 30 30.2 30.4 30.6 30.8 31-5
0
5
10
15
20
25
30
35
40
Time (ms)
Pre
ssur
e (
psi
g)
Speed: (m/s)1-2: 596.12-3: 623.83-4: 609.6Avg: 609.8T
R 1(us): 31.3
TR 2(us): 19.9
TR 3(us): 19.9
TR 4(us): 8.5
Max P1: 35.7Max P2: 39.1Max P3: 33.6Max P4: 33.5
Sensor 1
Sensor 2
Sensor 3
Sensor 4
29.4 29.6 29.8 30 30.2 30.4 30.6 30.8-5
0
5
10
15
20
25
30
Time (ms)
Pre
ssur
e (
psi
g)
Speed: (m/s)1-2: 525.92-3: 558.83-4: 570.7Avg: 551.8T
R 1(us): 34.1
TR 2(us): 19.9
TR 3(us): 22.7
TR 4(us): 17.0
Max P1: 26.0Max P2: 25.7Max P3: 25.1Max P4: 24.1
Sensor 1
Sensor 2
Sensor 3
Sensor 4
37 37.2 37.4 37.6 37.8 38 38.20
10
20
30
40
50
60
Time (ms)
Pre
ssur
e (
psi
g)
Speed: (m/s)1-2: Inf2-3: Inf3-4: InfAvg: InfT
R 1(us): 508.5
TR 2(us): 497.2
TR 3(us): 548.3
TR 4(us): 684.7
Max P1: 37.6Max P2: 44.4Max P3: 43.1Max P4: 52.5
Sensor 1
Sensor 2
Sensor 3
Sensor 4
29 29.2 29.4 29.6 29.8 30 30.2 30.4-5
0
5
10
15
20
25
30
35
40
45
Time (ms)
Pre
ssur
e (
psi
g)
Speed: (m/s)1-2: 623.82-3: 654.23-4: 623.8Avg: 633.9T
R 1(us): 34.1
TR 2(us): 17.0
TR 3(us): 17.0
TR 4(us): 11.4
Max P1: 37.9Max P2: 44.3Max P3: 36.1Max P4: 39.9
Sensor 1
Sensor 2
Sensor 3
Sensor 4

84
Figure 127 - 13 S3D6+2 BR60_100percL=1.6
Figure 128 - 13 S3D6+2 BR60_100percL=1.8
Figure 129 - 13 S3D6+2 BR60_120percL=1.2
Figure 130 - 13 S3D6+2 BR60_120percL=1.4
Figure 131 - 13 S3D6+2 BR60_120percL=1.6
Figure 132 - 13 S3D6+2 BR60_120percL=1.8
28.8 29 29.2 29.4 29.6 29.8 30 30.20
5
10
15
20
25
30
35
40
Time (ms)
Pre
ssur
e (
psi
g)
Speed: (m/s)1-2: 583.12-3: 609.63-4: 609.6Avg: 600.8T
R 1(us): 31.3
TR 2(us): 19.9
TR 3(us): 19.9
TR 4(us): 14.2
Max P1: 33.1Max P2: 36.7Max P3: 32.2Max P4: 35.5
Sensor 1
Sensor 2
Sensor 3
Sensor 4
29.8 30 30.2 30.4 30.6 30.8 31-5
0
5
10
15
20
25
30
35
40
45
Time (ms)
Pre
ssur
e (
psi
g)
Speed: (m/s)1-2: 596.12-3: 638.63-4: 623.8Avg: 619.5T
R 1(us): 34.1
TR 2(us): 17.0
TR 3(us): 19.9
TR 4(us): 14.2
Max P1: 36.6Max P2: 41.0Max P3: 34.9Max P4: 37.0
Sensor 1
Sensor 2
Sensor 3
Sensor 4
33.6 33.8 34 34.2 34.4 34.6 34.8 350
10
20
30
40
50
60
Time (ms)
Pre
ssur
e (
psi
g)
Speed: (m/s)1-2: Inf2-3: Inf3-4: InfAvg: InfT
R 1(us): 511.4
TR 2(us): 778.4
TR 3(us): 497.2
TR 4(us): 548.3
Max P1: 45.2Max P2: 43.9Max P3: 55.6Max P4: 59.0
Sensor 1
Sensor 2
Sensor 3
Sensor 4
41.2 41.4 41.6 41.8 42 42.2 42.4 42.60
5
10
15
20
25
30
35
40
45
Time (ms)
Pre
ssur
e (
psi
g)
Speed: (m/s)1-2: Inf2-3: Inf3-4: 2438.4Avg: InfT
R 1(us): 497.2
TR 2(us): 906.3
TR 3(us): 929.0
TR 4(us): 758.5
Max P1: 38.9Max P2: 40.8Max P3: 44.4Max P4: 44.4
Sensor 1
Sensor 2
Sensor 3
Sensor 4
34.4 34.6 34.8 35 35.2 35.4 35.6-10
0
10
20
30
40
50
Time (ms)
Pre
ssur
e (
psi
g)
Speed: (m/s)1-2: 623.82-3: 638.63-4: 638.6Avg: 633.7T
R 1(us): 454.5
TR 2(us): 19.9
TR 3(us): 866.5
TR 4(us): 17.0
Max P1: 42.6Max P2: 41.5Max P3: 48.0Max P4: 36.8
Sensor 1
Sensor 2
Sensor 3
Sensor 4
31.2 31.4 31.6 31.8 32 32.2 32.4 32.60
5
10
15
20
25
30
35
40
45
Time (ms)
Pre
ssur
e (
psi
g)
Speed: (m/s)1-2: 623.82-3: 638.63-4: 623.8Avg: 628.7T
R 1(us): 34.1
TR 2(us): 19.9
TR 3(us): 19.9
TR 4(us): 11.4
Max P1: 38.1Max P2: 42.5Max P3: 37.0Max P4: 39.2
Sensor 1
Sensor 2
Sensor 3
Sensor 4
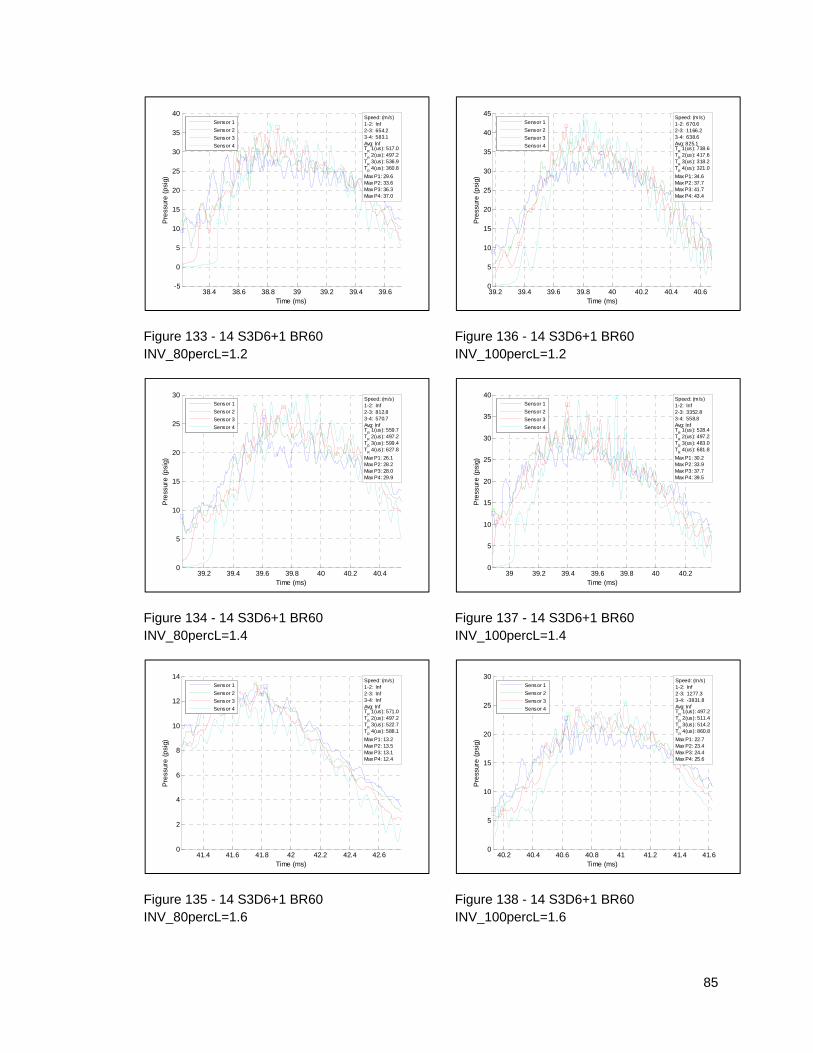
85
Figure 133 - 14 S3D6+1 BR60 INV_80percL=1.2
Figure 134 - 14 S3D6+1 BR60 INV_80percL=1.4
Figure 135 - 14 S3D6+1 BR60 INV_80percL=1.6
Figure 136 - 14 S3D6+1 BR60 INV_100percL=1.2
Figure 137 - 14 S3D6+1 BR60 INV_100percL=1.4
Figure 138 - 14 S3D6+1 BR60 INV_100percL=1.6
38.4 38.6 38.8 39 39.2 39.4 39.6-5
0
5
10
15
20
25
30
35
40
Time (ms)
Pre
ssur
e (
psi
g)
Speed: (m/s)1-2: Inf2-3: 654.23-4: 583.1Avg: InfT
R 1(us): 517.0
TR 2(us): 497.2
TR 3(us): 536.9
TR 4(us): 360.8
Max P1: 29.6Max P2: 33.6Max P3: 36.3Max P4: 37.0
Sensor 1
Sensor 2
Sensor 3
Sensor 4
39.2 39.4 39.6 39.8 40 40.2 40.40
5
10
15
20
25
30
Time (ms)
Pre
ssur
e (
psi
g)
Speed: (m/s)1-2: Inf2-3: 812.83-4: 570.7Avg: InfT
R 1(us): 559.7
TR 2(us): 497.2
TR 3(us): 599.4
TR 4(us): 627.8
Max P1: 26.1Max P2: 28.2Max P3: 28.0Max P4: 29.9
Sensor 1
Sensor 2
Sensor 3
Sensor 4
41.4 41.6 41.8 42 42.2 42.4 42.60
2
4
6
8
10
12
14
Time (ms)
Pre
ssur
e (
psi
g)
Speed: (m/s)1-2: Inf2-3: Inf3-4: InfAvg: InfT
R 1(us): 571.0
TR 2(us): 497.2
TR 3(us): 522.7
TR 4(us): 588.1
Max P1: 13.2Max P2: 13.5Max P3: 13.1Max P4: 12.4
Sensor 1
Sensor 2
Sensor 3
Sensor 4
39.2 39.4 39.6 39.8 40 40.2 40.4 40.60
5
10
15
20
25
30
35
40
45
Time (ms)
Pre
ssur
e (
psi
g)
Speed: (m/s)1-2: 670.62-3: 1166.23-4: 638.6Avg: 825.1T
R 1(us): 738.6
TR 2(us): 417.6
TR 3(us): 318.2
TR 4(us): 321.0
Max P1: 34.6Max P2: 37.7Max P3: 41.7Max P4: 43.4
Sensor 1
Sensor 2
Sensor 3
Sensor 4
39 39.2 39.4 39.6 39.8 40 40.20
5
10
15
20
25
30
35
40
Time (ms)
Pre
ssur
e (
psi
g)
Speed: (m/s)1-2: Inf2-3: 3352.83-4: 558.8Avg: InfT
R 1(us): 528.4
TR 2(us): 497.2
TR 3(us): 483.0
TR 4(us): 681.8
Max P1: 30.2Max P2: 33.9Max P3: 37.7Max P4: 39.5
Sensor 1
Sensor 2
Sensor 3
Sensor 4
40.2 40.4 40.6 40.8 41 41.2 41.4 41.60
5
10
15
20
25
30
Time (ms)
Pre
ssur
e (
psi
g)
Speed: (m/s)1-2: Inf2-3: 1277.33-4: -3831.8Avg: InfT
R 1(us): 497.2
TR 2(us): 511.4
TR 3(us): 514.2
TR 4(us): 860.8
Max P1: 22.7Max P2: 23.4Max P3: 24.4Max P4: 25.6
Sensor 1
Sensor 2
Sensor 3
Sensor 4
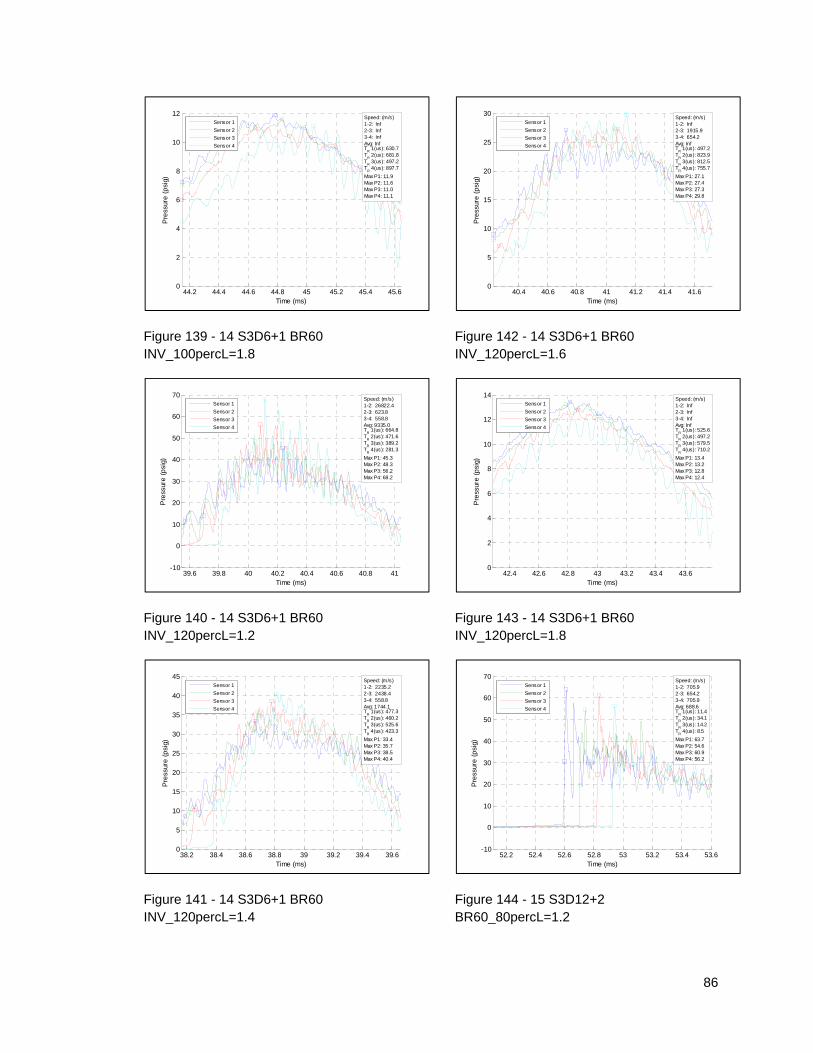
86
Figure 139 - 14 S3D6+1 BR60 INV_100percL=1.8
Figure 140 - 14 S3D6+1 BR60 INV_120percL=1.2
Figure 141 - 14 S3D6+1 BR60 INV_120percL=1.4
Figure 142 - 14 S3D6+1 BR60 INV_120percL=1.6
Figure 143 - 14 S3D6+1 BR60 INV_120percL=1.8
Figure 144 - 15 S3D12+2 BR60_80percL=1.2
44.2 44.4 44.6 44.8 45 45.2 45.4 45.60
2
4
6
8
10
12
Time (ms)
Pre
ssur
e (
psi
g)
Speed: (m/s)1-2: Inf2-3: Inf3-4: InfAvg: InfT
R 1(us): 630.7
TR 2(us): 681.8
TR 3(us): 497.2
TR 4(us): 897.7
Max P1: 11.9Max P2: 11.6Max P3: 11.0Max P4: 11.1
Sensor 1
Sensor 2
Sensor 3
Sensor 4
39.6 39.8 40 40.2 40.4 40.6 40.8 41-10
0
10
20
30
40
50
60
70
Time (ms)
Pre
ssur
e (
psi
g)
Speed: (m/s)1-2: 26822.42-3: 623.83-4: 558.8Avg: 9335.0T
R 1(us): 664.8
TR 2(us): 471.6
TR 3(us): 389.2
TR 4(us): 281.3
Max P1: 45.3Max P2: 48.3Max P3: 56.2Max P4: 68.2
Sensor 1
Sensor 2
Sensor 3
Sensor 4
38.2 38.4 38.6 38.8 39 39.2 39.4 39.60
5
10
15
20
25
30
35
40
45
Time (ms)
Pre
ssur
e (
psi
g)
Speed: (m/s)1-2: 2235.22-3: 2438.43-4: 558.8Avg: 1744.1T
R 1(us): 477.3
TR 2(us): 460.2
TR 3(us): 525.6
TR 4(us): 423.3
Max P1: 33.4Max P2: 35.7Max P3: 38.5Max P4: 40.4
Sensor 1
Sensor 2
Sensor 3
Sensor 4
40.4 40.6 40.8 41 41.2 41.4 41.60
5
10
15
20
25
30
Time (ms)
Pre
ssur
e (
psi
g)
Speed: (m/s)1-2: Inf2-3: 1915.93-4: 654.2Avg: InfT
R 1(us): 497.2
TR 2(us): 823.9
TR 3(us): 812.5
TR 4(us): 755.7
Max P1: 27.1Max P2: 27.4Max P3: 27.3Max P4: 29.8
Sensor 1
Sensor 2
Sensor 3
Sensor 4
42.4 42.6 42.8 43 43.2 43.4 43.60
2
4
6
8
10
12
14
Time (ms)
Pre
ssur
e (
psi
g)
Speed: (m/s)1-2: Inf2-3: Inf3-4: InfAvg: InfT
R 1(us): 525.6
TR 2(us): 497.2
TR 3(us): 579.5
TR 4(us): 710.2
Max P1: 13.4Max P2: 13.2Max P3: 12.8Max P4: 12.4
Sensor 1
Sensor 2
Sensor 3
Sensor 4
52.2 52.4 52.6 52.8 53 53.2 53.4 53.6-10
0
10
20
30
40
50
60
70
Time (ms)
Pre
ssur
e (
psi
g)
Speed: (m/s)1-2: 705.92-3: 654.23-4: 705.9Avg: 688.6T
R 1(us): 11.4
TR 2(us): 34.1
TR 3(us): 14.2
TR 4(us): 8.5
Max P1: 63.7Max P2: 54.6Max P3: 60.9Max P4: 56.2
Sensor 1
Sensor 2
Sensor 3
Sensor 4

87
Figure 145 - 15 S3D12+2 BR60_80percL=1.4
Figure 146 - 15 S3D12+2 BR60_80percL=1.6
Figure 147 - 15 S3D12+2 BR60_80percL=1.8
Figure 148 - 15 S3D12+2 BR60_100percL=1.4
Figure 149 - 15 S3D12+2 BR60_100percL=1.6
Figure 150 - 15 S3D12+2 BR60_100percL=1.8
35.6 35.8 36 36.2 36.4 36.6 36.8-10
0
10
20
30
40
50
60
Time (ms)
Pre
ssur
e (
psi
g)
Speed: (m/s)1-2: 670.62-3: 654.23-4: 724.9Avg: 683.2T
R 1(us): 11.4
TR 2(us): 31.3
TR 3(us): 8.5
TR 4(us): 14.2
Max P1: 51.7Max P2: 46.8Max P3: 55.7Max P4: 57.5
Sensor 1
Sensor 2
Sensor 3
Sensor 4
33.6 33.8 34 34.2 34.4 34.6 34.8 35-10
0
10
20
30
40
50
60
Time (ms)
Pre
ssur
e (
psi
g)
Speed: (m/s)1-2: 654.22-3: 623.83-4: 705.9Avg: 661.3T
R 1(us): 85.2
TR 2(us): 34.1
TR 3(us): 11.4
TR 4(us): 14.2
Max P1: 48.4Max P2: 41.6Max P3: 55.9Max P4: 44.9
Sensor 1
Sensor 2
Sensor 3
Sensor 4
30 30.2 30.4 30.6 30.8 31 31.20
5
10
15
20
25
30
35
40
Time (ms)
Pre
ssur
e (
psi
g)
Speed: (m/s)1-2: 609.62-3: 596.13-4: 583.1Avg: 596.2T
R 1(us): 102.3
TR 2(us): 22.7
TR 3(us): 34.1
TR 4(us): 11.4
Max P1: 34.7Max P2: 34.2Max P3: 37.3Max P4: 37.8
Sensor 1
Sensor 2
Sensor 3
Sensor 4
48.2 48.4 48.6 48.8 49 49.2 49.4-10
0
10
20
30
40
50
60
70
80
90
Time (ms)
Pre
ssur
e (
psi
g)
Speed: (m/s)1-2: 705.92-3: 745.13-4: 766.4Avg: 739.1T
R 1(us): 59.7
TR 2(us): 14.2
TR 3(us): 11.4
TR 4(us): 8.5
Max P1: 68.0Max P2: 80.8Max P3: 70.5Max P4: 70.2
Sensor 1
Sensor 2
Sensor 3
Sensor 4
35.2 35.4 35.6 35.8 36 36.2 36.4 36.6-10
0
10
20
30
40
50
60
70
80
90
Time (ms)
Pre
ssur
e (
psi
g)
Speed: (m/s)1-2: 705.92-3: 766.43-4: 766.4Avg: 746.2T
R 1(us): 48.3
TR 2(us): 8.5
TR 3(us): 11.4
TR 4(us): 11.4
Max P1: 59.3Max P2: 82.9Max P3: 63.0Max P4: 73.2
Sensor 1
Sensor 2
Sensor 3
Sensor 4
30.8 31 31.2 31.4 31.6 31.8 32-10
0
10
20
30
40
50
60
70
Time (ms)
Pre
ssur
e (
psi
g)
Speed: (m/s)1-2: 687.82-3: 687.83-4: 724.9Avg: 700.1T
R 1(us): 11.4
TR 2(us): 28.4
TR 3(us): 11.4
TR 4(us): 11.4
Max P1: 54.7Max P2: 51.1Max P3: 58.8Max P4: 60.3
Sensor 1
Sensor 2
Sensor 3
Sensor 4
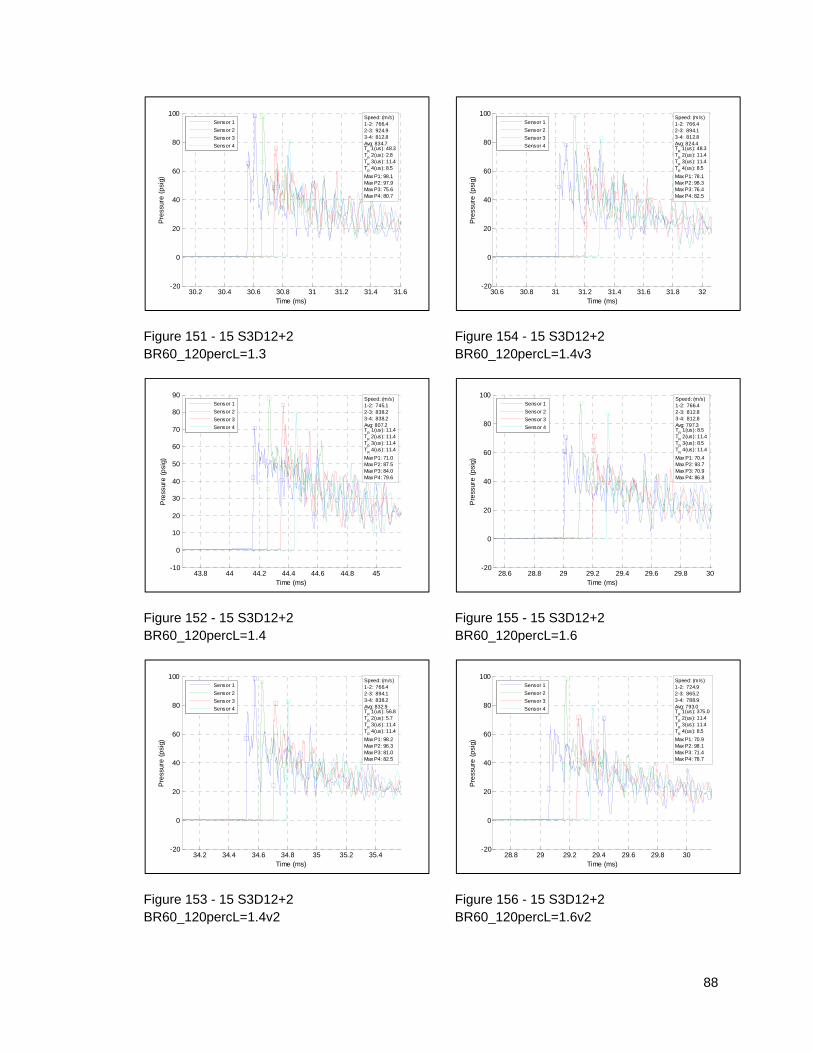
88
Figure 151 - 15 S3D12+2 BR60_120percL=1.3
Figure 152 - 15 S3D12+2 BR60_120percL=1.4
Figure 153 - 15 S3D12+2 BR60_120percL=1.4v2
Figure 154 - 15 S3D12+2 BR60_120percL=1.4v3
Figure 155 - 15 S3D12+2 BR60_120percL=1.6
Figure 156 - 15 S3D12+2 BR60_120percL=1.6v2
30.2 30.4 30.6 30.8 31 31.2 31.4 31.6-20
0
20
40
60
80
100
Time (ms)
Pre
ssur
e (
psi
g)
Speed: (m/s)1-2: 766.42-3: 924.93-4: 812.8Avg: 834.7T
R 1(us): 48.3
TR 2(us): 2.8
TR 3(us): 11.4
TR 4(us): 8.5
Max P1: 98.1Max P2: 97.9Max P3: 75.6Max P4: 80.7
Sensor 1
Sensor 2
Sensor 3
Sensor 4
43.8 44 44.2 44.4 44.6 44.8 45-10
0
10
20
30
40
50
60
70
80
90
Time (ms)
Pre
ssur
e (
psi
g)
Speed: (m/s)1-2: 745.12-3: 838.23-4: 838.2Avg: 807.2T
R 1(us): 11.4
TR 2(us): 11.4
TR 3(us): 11.4
TR 4(us): 11.4
Max P1: 71.0Max P2: 87.5Max P3: 84.0Max P4: 79.6
Sensor 1
Sensor 2
Sensor 3
Sensor 4
34.2 34.4 34.6 34.8 35 35.2 35.4-20
0
20
40
60
80
100
Time (ms)
Pre
ssur
e (
psi
g)
Speed: (m/s)1-2: 766.42-3: 894.13-4: 838.2Avg: 832.9T
R 1(us): 56.8
TR 2(us): 5.7
TR 3(us): 11.4
TR 4(us): 11.4
Max P1: 98.2Max P2: 96.3Max P3: 81.0Max P4: 82.5
Sensor 1
Sensor 2
Sensor 3
Sensor 4
30.6 30.8 31 31.2 31.4 31.6 31.8 32-20
0
20
40
60
80
100
Time (ms)
Pre
ssur
e (
psi
g)
Speed: (m/s)1-2: 766.42-3: 894.13-4: 812.8Avg: 824.4T
R 1(us): 48.3
TR 2(us): 11.4
TR 3(us): 11.4
TR 4(us): 8.5
Max P1: 78.1Max P2: 98.3Max P3: 76.4Max P4: 82.5
Sensor 1
Sensor 2
Sensor 3
Sensor 4
28.6 28.8 29 29.2 29.4 29.6 29.8 30-20
0
20
40
60
80
100
Time (ms)
Pre
ssur
e (
psi
g)
Speed: (m/s)1-2: 766.42-3: 812.83-4: 812.8Avg: 797.3T
R 1(us): 8.5
TR 2(us): 11.4
TR 3(us): 8.5
TR 4(us): 11.4
Max P1: 70.4Max P2: 93.7Max P3: 70.9Max P4: 86.8
Sensor 1
Sensor 2
Sensor 3
Sensor 4
28.8 29 29.2 29.4 29.6 29.8 30-20
0
20
40
60
80
100
Time (ms)
Pre
ssur
e (
psi
g)
Speed: (m/s)1-2: 724.92-3: 865.23-4: 788.9Avg: 793.0T
R 1(us): 375.0
TR 2(us): 11.4
TR 3(us): 11.4
TR 4(us): 8.5
Max P1: 70.9Max P2: 98.1Max P3: 71.4Max P4: 78.7
Sensor 1
Sensor 2
Sensor 3
Sensor 4
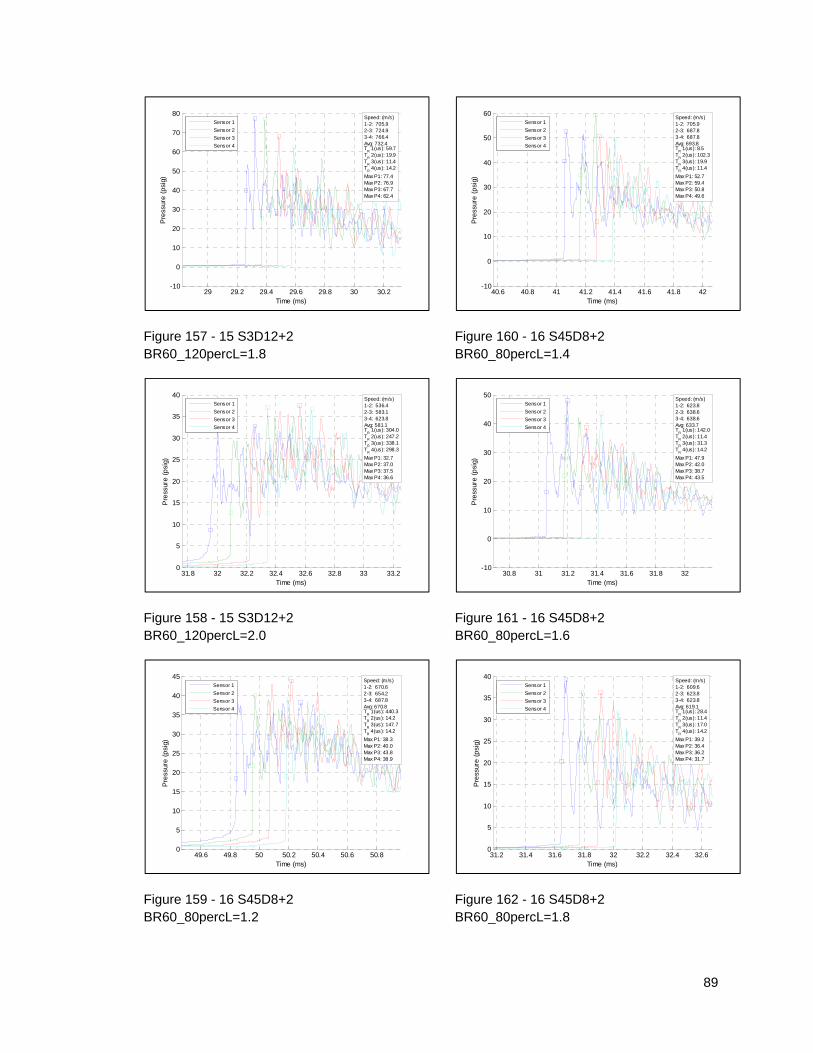
89
Figure 157 - 15 S3D12+2 BR60_120percL=1.8
Figure 158 - 15 S3D12+2 BR60_120percL=2.0
Figure 159 - 16 S45D8+2 BR60_80percL=1.2
Figure 160 - 16 S45D8+2 BR60_80percL=1.4
Figure 161 - 16 S45D8+2 BR60_80percL=1.6
Figure 162 - 16 S45D8+2 BR60_80percL=1.8
29 29.2 29.4 29.6 29.8 30 30.2-10
0
10
20
30
40
50
60
70
80
Time (ms)
Pre
ssur
e (
psi
g)
Speed: (m/s)1-2: 705.92-3: 724.93-4: 766.4Avg: 732.4T
R 1(us): 59.7
TR 2(us): 19.9
TR 3(us): 11.4
TR 4(us): 14.2
Max P1: 77.4Max P2: 76.9Max P3: 67.7Max P4: 62.4
Sensor 1
Sensor 2
Sensor 3
Sensor 4
31.8 32 32.2 32.4 32.6 32.8 33 33.20
5
10
15
20
25
30
35
40
Time (ms)
Pre
ssur
e (
psi
g)
Speed: (m/s)1-2: 536.42-3: 583.13-4: 623.8Avg: 581.1T
R 1(us): 304.0
TR 2(us): 247.2
TR 3(us): 338.1
TR 4(us): 298.3
Max P1: 32.7Max P2: 37.0Max P3: 37.5Max P4: 36.6
Sensor 1
Sensor 2
Sensor 3
Sensor 4
49.6 49.8 50 50.2 50.4 50.6 50.80
5
10
15
20
25
30
35
40
45
Time (ms)
Pre
ssur
e (
psi
g)
Speed: (m/s)1-2: 670.62-3: 654.23-4: 687.8Avg: 670.8T
R 1(us): 440.3
TR 2(us): 14.2
TR 3(us): 147.7
TR 4(us): 14.2
Max P1: 38.3Max P2: 40.0Max P3: 43.8Max P4: 38.9
Sensor 1
Sensor 2
Sensor 3
Sensor 4
40.6 40.8 41 41.2 41.4 41.6 41.8 42-10
0
10
20
30
40
50
60
Time (ms)
Pre
ssur
e (
psi
g)
Speed: (m/s)1-2: 705.92-3: 687.83-4: 687.8Avg: 693.8T
R 1(us): 8.5
TR 2(us): 102.3
TR 3(us): 19.9
TR 4(us): 11.4
Max P1: 52.7Max P2: 59.4Max P3: 50.8Max P4: 49.6
Sensor 1
Sensor 2
Sensor 3
Sensor 4
30.8 31 31.2 31.4 31.6 31.8 32-10
0
10
20
30
40
50
Time (ms)
Pre
ssur
e (
psi
g)
Speed: (m/s)1-2: 623.82-3: 638.63-4: 638.6Avg: 633.7T
R 1(us): 142.0
TR 2(us): 11.4
TR 3(us): 31.3
TR 4(us): 14.2
Max P1: 47.9Max P2: 42.0Max P3: 38.7Max P4: 43.5
Sensor 1
Sensor 2
Sensor 3
Sensor 4
31.2 31.4 31.6 31.8 32 32.2 32.4 32.60
5
10
15
20
25
30
35
40
Time (ms)
Pre
ssur
e (
psi
g)
Speed: (m/s)1-2: 609.62-3: 623.83-4: 623.8Avg: 619.1T
R 1(us): 28.4
TR 2(us): 11.4
TR 3(us): 17.0
TR 4(us): 14.2
Max P1: 39.2Max P2: 36.4Max P3: 36.2Max P4: 31.7
Sensor 1
Sensor 2
Sensor 3
Sensor 4

90
Figure 163 - 16 S45D8+2 BR60_100percL=1.2
Figure 164 - 16 S45D8+2 BR60_100percL=1.4
Figure 165 - 16 S45D8+2 BR60_100percL=1.6
Figure 166 - 16 S45D8+2 BR60_100percL=1.8
Figure 167 - 16 S45D8+2 BR60_120percL=1.2
Figure 168 - 16 S45D8+2 BR60_120percL=1.4
67 67.2 67.4 67.6 67.8 68 68.20
10
20
30
40
50
60
Time (ms)
Pre
ssur
e (
psi
g)
Speed: (m/s)1-2: 1219.22-3: 766.43-4: 687.8Avg: 891.1T
R 1(us): 446.0
TR 2(us): 366.5
TR 3(us): 332.4
TR 4(us): 363.6
Max P1: 42.3Max P2: 40.6Max P3: 48.8Max P4: 53.8
Sensor 1
Sensor 2
Sensor 3
Sensor 4
39.6 39.8 40 40.2 40.4 40.6 40.8-10
0
10
20
30
40
50
60
70
80
90
Time (ms)
Pre
ssur
e (
psi
g)
Speed: (m/s)1-2: 745.12-3: 724.93-4: 788.9Avg: 753.0T
R 1(us): 90.9
TR 2(us): 62.5
TR 3(us): 19.9
TR 4(us): 8.5
Max P1: 83.8Max P2: 84.9Max P3: 79.7Max P4: 75.7
Sensor 1
Sensor 2
Sensor 3
Sensor 4
36.4 36.6 36.8 37 37.2 37.4 37.6 37.8-10
0
10
20
30
40
50
60
70
80
Time (ms)
Pre
ssur
e (
psi
g)
Speed: (m/s)1-2: 705.92-3: 687.83-4: 766.4Avg: 720.0T
R 1(us): 102.3
TR 2(us): 73.9
TR 3(us): 28.4
TR 4(us): 8.5
Max P1: 64.2Max P2: 61.0Max P3: 71.1Max P4: 72.7
Sensor 1
Sensor 2
Sensor 3
Sensor 4
30.8 31 31.2 31.4 31.6 31.8 32 32.2-10
0
10
20
30
40
50
60
70
Time (ms)
Pre
ssur
e (
psi
g)
Speed: (m/s)1-2: 670.62-3: 654.23-4: 705.9Avg: 676.9T
R 1(us): 119.3
TR 2(us): 90.9
TR 3(us): 8.5
TR 4(us): 11.4
Max P1: 68.7Max P2: 51.3Max P3: 50.8Max P4: 49.0
Sensor 1
Sensor 2
Sensor 3
Sensor 4
48.2 48.4 48.6 48.8 49 49.2 49.4 49.60
10
20
30
40
50
60
70
80
Time (ms)
Pre
ssur
e (
psi
g)
Speed: (m/s)1-2: 1166.22-3: 6705.63-4: 432.6Avg: 2768.1T
R 1(us): 551.1
TR 2(us): 431.8
TR 3(us): 528.4
TR 4(us): 306.8
Max P1: 50.1Max P2: 50.0Max P3: 49.1Max P4: 76.5
Sensor 1
Sensor 2
Sensor 3
Sensor 4
34 34.2 34.4 34.6 34.8 35 35.2-20
0
20
40
60
80
100
Time (ms)
Pre
ssur
e (
psi
g)
Speed: (m/s)1-2: 724.92-3: 724.93-4: 838.2Avg: 762.7T
R 1(us): 93.8
TR 2(us): 19.9
TR 3(us): 11.4
TR 4(us): 8.5
Max P1: 94.1Max P2: 67.8Max P3: 91.6Max P4: 81.7
Sensor 1
Sensor 2
Sensor 3
Sensor 4
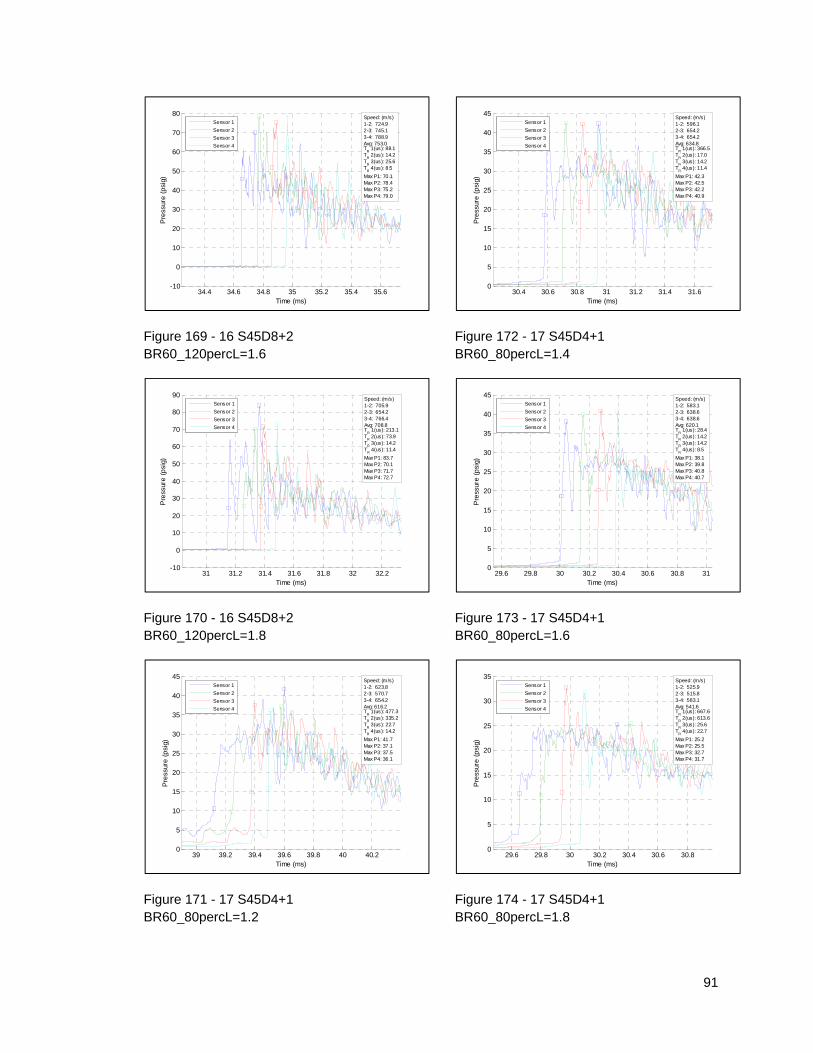
91
Figure 169 - 16 S45D8+2 BR60_120percL=1.6
Figure 170 - 16 S45D8+2 BR60_120percL=1.8
Figure 171 - 17 S45D4+1 BR60_80percL=1.2
Figure 172 - 17 S45D4+1 BR60_80percL=1.4
Figure 173 - 17 S45D4+1 BR60_80percL=1.6
Figure 174 - 17 S45D4+1 BR60_80percL=1.8
34.4 34.6 34.8 35 35.2 35.4 35.6-10
0
10
20
30
40
50
60
70
80
Time (ms)
Pre
ssur
e (
psi
g)
Speed: (m/s)1-2: 724.92-3: 745.13-4: 788.9Avg: 753.0T
R 1(us): 88.1
TR 2(us): 14.2
TR 3(us): 25.6
TR 4(us): 8.5
Max P1: 70.1Max P2: 78.4Max P3: 75.2Max P4: 79.0
Sensor 1
Sensor 2
Sensor 3
Sensor 4
31 31.2 31.4 31.6 31.8 32 32.2-10
0
10
20
30
40
50
60
70
80
90
Time (ms)
Pre
ssur
e (
psi
g)
Speed: (m/s)1-2: 705.92-3: 654.23-4: 766.4Avg: 708.8T
R 1(us): 213.1
TR 2(us): 73.9
TR 3(us): 14.2
TR 4(us): 11.4
Max P1: 83.7Max P2: 70.1Max P3: 71.7Max P4: 72.7
Sensor 1
Sensor 2
Sensor 3
Sensor 4
39 39.2 39.4 39.6 39.8 40 40.20
5
10
15
20
25
30
35
40
45
Time (ms)
Pre
ssur
e (
psi
g)
Speed: (m/s)1-2: 623.82-3: 570.73-4: 654.2Avg: 616.2T
R 1(us): 477.3
TR 2(us): 335.2
TR 3(us): 22.7
TR 4(us): 14.2
Max P1: 41.7Max P2: 37.1Max P3: 37.5Max P4: 36.1
Sensor 1
Sensor 2
Sensor 3
Sensor 4
30.4 30.6 30.8 31 31.2 31.4 31.60
5
10
15
20
25
30
35
40
45
Time (ms)
Pre
ssur
e (
psi
g)
Speed: (m/s)1-2: 596.12-3: 654.23-4: 654.2Avg: 634.8T
R 1(us): 366.5
TR 2(us): 17.0
TR 3(us): 14.2
TR 4(us): 11.4
Max P1: 42.3Max P2: 42.5Max P3: 42.2Max P4: 40.9
Sensor 1
Sensor 2
Sensor 3
Sensor 4
29.6 29.8 30 30.2 30.4 30.6 30.8 310
5
10
15
20
25
30
35
40
45
Time (ms)
Pre
ssur
e (
psi
g)
Speed: (m/s)1-2: 583.12-3: 638.63-4: 638.6Avg: 620.1T
R 1(us): 28.4
TR 2(us): 14.2
TR 3(us): 14.2
TR 4(us): 8.5
Max P1: 38.1Max P2: 39.8Max P3: 40.8Max P4: 40.7
Sensor 1
Sensor 2
Sensor 3
Sensor 4
29.6 29.8 30 30.2 30.4 30.6 30.80
5
10
15
20
25
30
35
Time (ms)
Pre
ssur
e (
psi
g)
Speed: (m/s)1-2: 525.92-3: 515.83-4: 583.1Avg: 541.6T
R 1(us): 667.6
TR 2(us): 613.6
TR 3(us): 25.6
TR 4(us): 22.7
Max P1: 25.2Max P2: 25.5Max P3: 32.7Max P4: 31.7
Sensor 1
Sensor 2
Sensor 3
Sensor 4
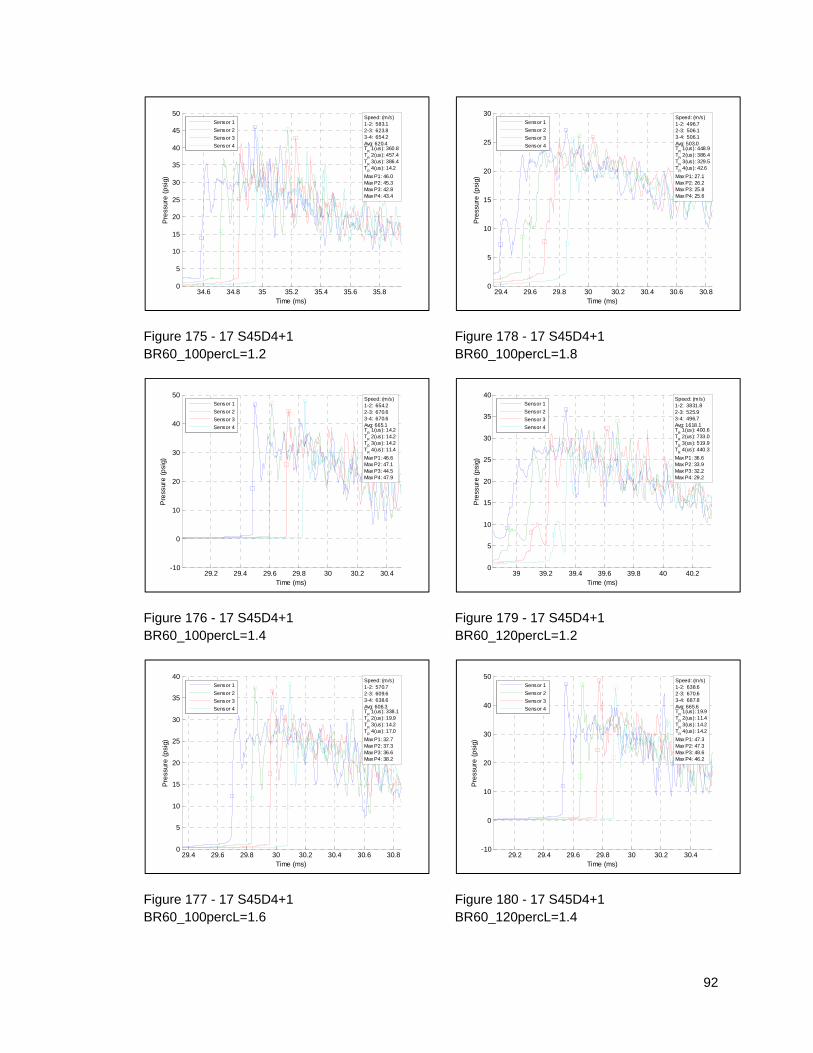
92
Figure 175 - 17 S45D4+1 BR60_100percL=1.2
Figure 176 - 17 S45D4+1 BR60_100percL=1.4
Figure 177 - 17 S45D4+1 BR60_100percL=1.6
Figure 178 - 17 S45D4+1 BR60_100percL=1.8
Figure 179 - 17 S45D4+1 BR60_120percL=1.2
Figure 180 - 17 S45D4+1 BR60_120percL=1.4
34.6 34.8 35 35.2 35.4 35.6 35.80
5
10
15
20
25
30
35
40
45
50
Time (ms)
Pre
ssur
e (
psi
g)
Speed: (m/s)1-2: 583.12-3: 623.83-4: 654.2Avg: 620.4T
R 1(us): 360.8
TR 2(us): 457.4
TR 3(us): 386.4
TR 4(us): 14.2
Max P1: 46.0Max P2: 45.3Max P3: 42.8Max P4: 43.4
Sensor 1
Sensor 2
Sensor 3
Sensor 4
29.2 29.4 29.6 29.8 30 30.2 30.4-10
0
10
20
30
40
50
Time (ms)
Pre
ssur
e (
psi
g)
Speed: (m/s)1-2: 654.22-3: 670.63-4: 670.6Avg: 665.1T
R 1(us): 14.2
TR 2(us): 14.2
TR 3(us): 14.2
TR 4(us): 11.4
Max P1: 46.6Max P2: 47.1Max P3: 44.5Max P4: 47.9
Sensor 1
Sensor 2
Sensor 3
Sensor 4
29.4 29.6 29.8 30 30.2 30.4 30.6 30.80
5
10
15
20
25
30
35
40
Time (ms)
Pre
ssur
e (
psi
g)
Speed: (m/s)1-2: 570.72-3: 609.63-4: 638.6Avg: 606.3T
R 1(us): 338.1
TR 2(us): 19.9
TR 3(us): 14.2
TR 4(us): 17.0
Max P1: 32.7Max P2: 37.3Max P3: 36.6Max P4: 38.2
Sensor 1
Sensor 2
Sensor 3
Sensor 4
29.4 29.6 29.8 30 30.2 30.4 30.6 30.80
5
10
15
20
25
30
Time (ms)
Pre
ssur
e (
psi
g)
Speed: (m/s)1-2: 496.72-3: 506.13-4: 506.1Avg: 503.0T
R 1(us): 448.9
TR 2(us): 386.4
TR 3(us): 329.5
TR 4(us): 42.6
Max P1: 27.1Max P2: 26.2Max P3: 25.8Max P4: 25.6
Sensor 1
Sensor 2
Sensor 3
Sensor 4
39 39.2 39.4 39.6 39.8 40 40.20
5
10
15
20
25
30
35
40
Time (ms)
Pre
ssur
e (
psi
g)
Speed: (m/s)1-2: 3831.82-3: 525.93-4: 496.7Avg: 1618.1T
R 1(us): 400.6
TR 2(us): 733.0
TR 3(us): 519.9
TR 4(us): 440.3
Max P1: 36.6Max P2: 33.9Max P3: 32.2Max P4: 29.2
Sensor 1
Sensor 2
Sensor 3
Sensor 4
29.2 29.4 29.6 29.8 30 30.2 30.4-10
0
10
20
30
40
50
Time (ms)
Pre
ssur
e (
psi
g)
Speed: (m/s)1-2: 638.62-3: 670.63-4: 687.8Avg: 665.6T
R 1(us): 19.9
TR 2(us): 11.4
TR 3(us): 14.2
TR 4(us): 14.2
Max P1: 47.3Max P2: 47.3Max P3: 48.6Max P4: 46.2
Sensor 1
Sensor 2
Sensor 3
Sensor 4
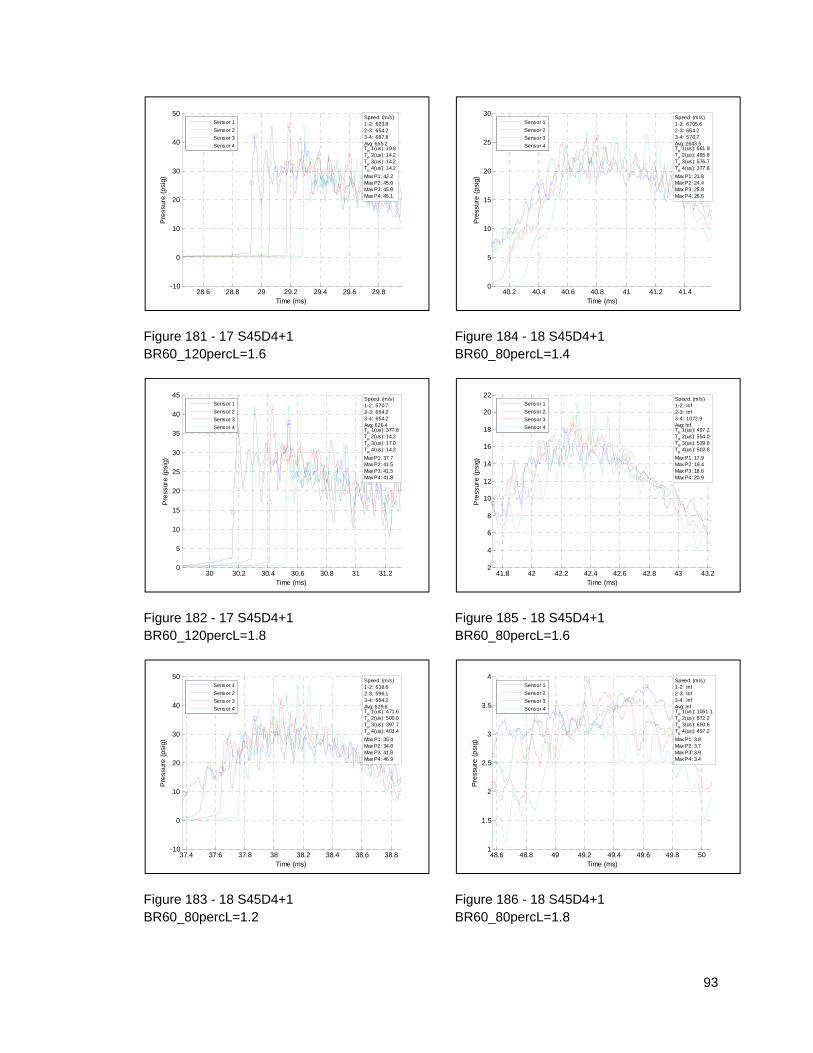
93
Figure 181 - 17 S45D4+1 BR60_120percL=1.6
Figure 182 - 17 S45D4+1 BR60_120percL=1.8
Figure 183 - 18 S45D4+1 BR60_80percL=1.2
Figure 184 - 18 S45D4+1 BR60_80percL=1.4
Figure 185 - 18 S45D4+1 BR60_80percL=1.6
Figure 186 - 18 S45D4+1 BR60_80percL=1.8
28.6 28.8 29 29.2 29.4 29.6 29.8-10
0
10
20
30
40
50
Time (ms)
Pre
ssur
e (
psi
g)
Speed: (m/s)1-2: 623.82-3: 654.23-4: 687.8Avg: 655.2T
R 1(us): 19.9
TR 2(us): 14.2
TR 3(us): 14.2
TR 4(us): 14.2
Max P1: 42.2Max P2: 45.0Max P3: 45.8Max P4: 45.1
Sensor 1
Sensor 2
Sensor 3
Sensor 4
30 30.2 30.4 30.6 30.8 31 31.20
5
10
15
20
25
30
35
40
45
Time (ms)
Pre
ssur
e (
psi
g)
Speed: (m/s)1-2: 570.72-3: 654.23-4: 654.2Avg: 626.4T
R 1(us): 377.8
TR 2(us): 14.2
TR 3(us): 17.0
TR 4(us): 14.2
Max P1: 37.7Max P2: 41.5Max P3: 41.5Max P4: 41.8
Sensor 1
Sensor 2
Sensor 3
Sensor 4
37.4 37.6 37.8 38 38.2 38.4 38.6 38.8-10
0
10
20
30
40
50
Time (ms)
Pre
ssur
e (
psi
g)
Speed: (m/s)1-2: 638.62-3: 596.13-4: 654.2Avg: 629.6T
R 1(us): 471.6
TR 2(us): 500.0
TR 3(us): 397.7
TR 4(us): 403.4
Max P1: 35.4Max P2: 34.8Max P3: 41.8Max P4: 46.9
Sensor 1
Sensor 2
Sensor 3
Sensor 4
40.2 40.4 40.6 40.8 41 41.2 41.40
5
10
15
20
25
30
Time (ms)
Pre
ssur
e (
psi
g)
Speed: (m/s)1-2: 6705.62-3: 654.23-4: 570.7Avg: 2643.5T
R 1(us): 661.9
TR 2(us): 485.8
TR 3(us): 576.7
TR 4(us): 377.8
Max P1: 21.8Max P2: 24.4Max P3: 25.8Max P4: 26.6
Sensor 1
Sensor 2
Sensor 3
Sensor 4
41.8 42 42.2 42.4 42.6 42.8 43 43.22
4
6
8
10
12
14
16
18
20
22
Time (ms)
Pre
ssur
e (
psi
g)
Speed: (m/s)1-2: Inf2-3: Inf3-4: 1072.9Avg: InfT
R 1(us): 497.2
TR 2(us): 554.0
TR 3(us): 539.8
TR 4(us): 502.8
Max P1: 17.9Max P2: 19.4Max P3: 18.6Max P4: 20.9
Sensor 1
Sensor 2
Sensor 3
Sensor 4
48.6 48.8 49 49.2 49.4 49.6 49.8 501
1.5
2
2.5
3
3.5
4
Time (ms)
Pre
ssur
e (
psi
g)
Speed: (m/s)1-2: Inf2-3: Inf3-4: InfAvg: InfT
R 1(us): 1051.1
TR 2(us): 872.2
TR 3(us): 650.6
TR 4(us): 497.2
Max P1: 3.8Max P2: 3.7Max P3: 3.9Max P4: 3.4
Sensor 1
Sensor 2
Sensor 3
Sensor 4
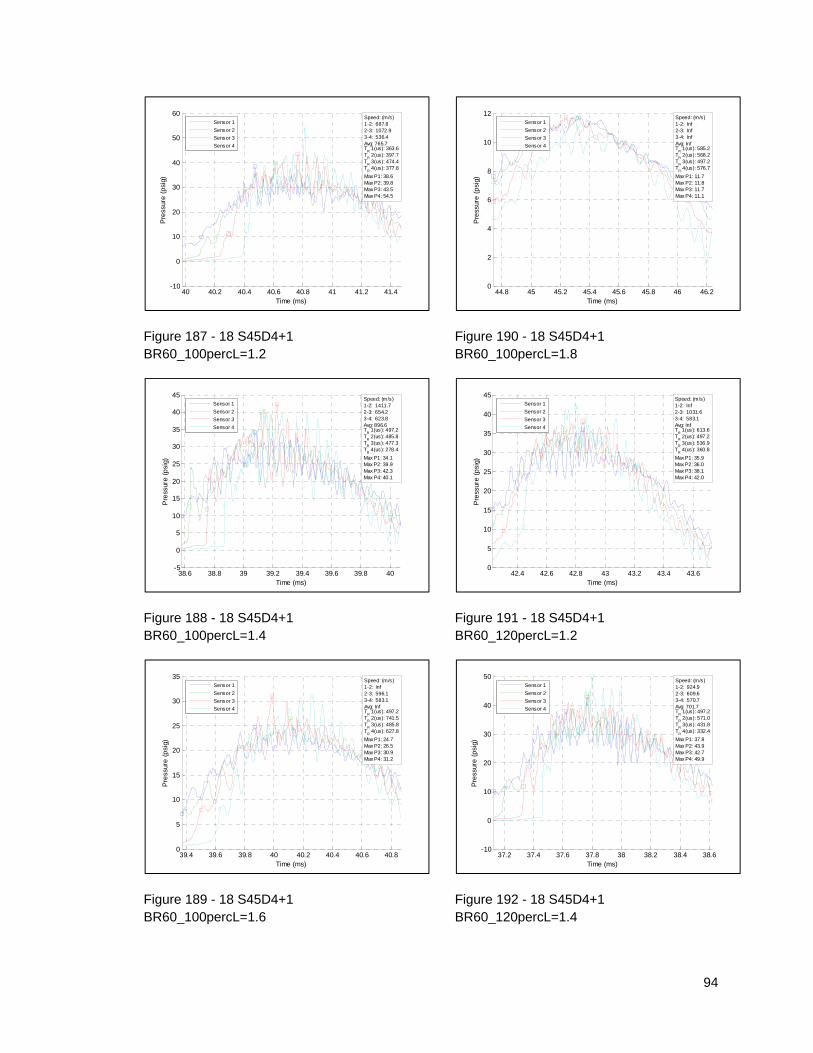
94
Figure 187 - 18 S45D4+1 BR60_100percL=1.2
Figure 188 - 18 S45D4+1 BR60_100percL=1.4
Figure 189 - 18 S45D4+1 BR60_100percL=1.6
Figure 190 - 18 S45D4+1 BR60_100percL=1.8
Figure 191 - 18 S45D4+1 BR60_120percL=1.2
Figure 192 - 18 S45D4+1 BR60_120percL=1.4
40 40.2 40.4 40.6 40.8 41 41.2 41.4-10
0
10
20
30
40
50
60
Time (ms)
Pre
ssur
e (
psi
g)
Speed: (m/s)1-2: 687.82-3: 1072.93-4: 536.4Avg: 765.7T
R 1(us): 363.6
TR 2(us): 397.7
TR 3(us): 474.4
TR 4(us): 377.8
Max P1: 38.6Max P2: 39.8Max P3: 43.5Max P4: 54.5
Sensor 1
Sensor 2
Sensor 3
Sensor 4
38.6 38.8 39 39.2 39.4 39.6 39.8 40-5
0
5
10
15
20
25
30
35
40
45
Time (ms)
Pre
ssur
e (
psi
g)
Speed: (m/s)1-2: 1411.72-3: 654.23-4: 623.8Avg: 896.6T
R 1(us): 497.2
TR 2(us): 485.8
TR 3(us): 477.3
TR 4(us): 278.4
Max P1: 34.1Max P2: 39.9Max P3: 42.3Max P4: 40.1
Sensor 1
Sensor 2
Sensor 3
Sensor 4
39.4 39.6 39.8 40 40.2 40.4 40.6 40.80
5
10
15
20
25
30
35
Time (ms)
Pre
ssur
e (
psi
g)
Speed: (m/s)1-2: Inf2-3: 596.13-4: 583.1Avg: InfT
R 1(us): 497.2
TR 2(us): 741.5
TR 3(us): 485.8
TR 4(us): 627.8
Max P1: 24.7Max P2: 26.5Max P3: 30.9Max P4: 31.2
Sensor 1
Sensor 2
Sensor 3
Sensor 4
44.8 45 45.2 45.4 45.6 45.8 46 46.20
2
4
6
8
10
12
Time (ms)
Pre
ssur
e (
psi
g)
Speed: (m/s)1-2: Inf2-3: Inf3-4: InfAvg: InfT
R 1(us): 585.2
TR 2(us): 568.2
TR 3(us): 497.2
TR 4(us): 576.7
Max P1: 11.7Max P2: 11.8Max P3: 11.7Max P4: 11.1
Sensor 1
Sensor 2
Sensor 3
Sensor 4
42.4 42.6 42.8 43 43.2 43.4 43.60
5
10
15
20
25
30
35
40
45
Time (ms)
Pre
ssur
e (
psi
g)
Speed: (m/s)1-2: Inf2-3: 1031.63-4: 583.1Avg: InfT
R 1(us): 613.6
TR 2(us): 497.2
TR 3(us): 536.9
TR 4(us): 360.8
Max P1: 35.9Max P2: 36.0Max P3: 38.1Max P4: 42.0
Sensor 1
Sensor 2
Sensor 3
Sensor 4
37.2 37.4 37.6 37.8 38 38.2 38.4 38.6-10
0
10
20
30
40
50
Time (ms)
Pre
ssur
e (
psi
g)
Speed: (m/s)1-2: 924.92-3: 609.63-4: 570.7Avg: 701.7T
R 1(us): 497.2
TR 2(us): 571.0
TR 3(us): 431.8
TR 4(us): 332.4
Max P1: 37.8Max P2: 43.9Max P3: 42.7Max P4: 49.9
Sensor 1
Sensor 2
Sensor 3
Sensor 4
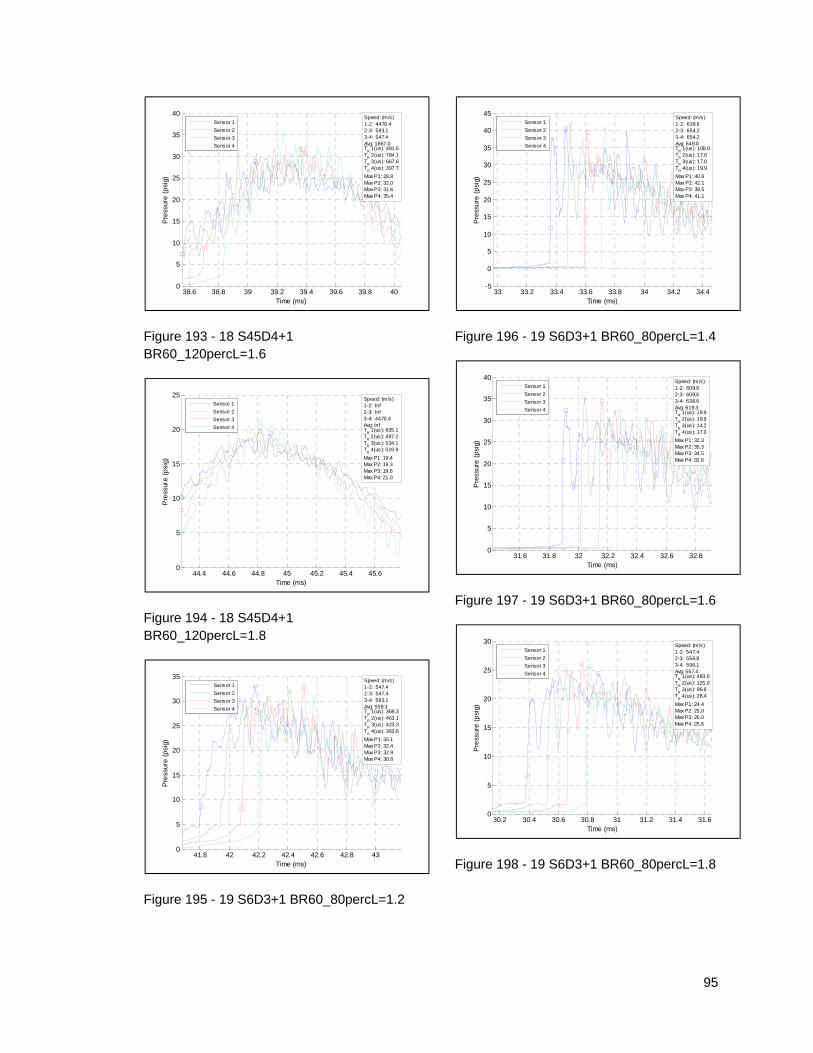
95
Figure 193 - 18 S45D4+1 BR60_120percL=1.6
Figure 194 - 18 S45D4+1 BR60_120percL=1.8
Figure 195 - 19 S6D3+1 BR60_80percL=1.2
Figure 196 - 19 S6D3+1 BR60_80percL=1.4
Figure 197 - 19 S6D3+1 BR60_80percL=1.6
Figure 198 - 19 S6D3+1 BR60_80percL=1.8
38.6 38.8 39 39.2 39.4 39.6 39.8 400
5
10
15
20
25
30
35
40
Time (ms)
Pre
ssur
e (
psi
g)
Speed: (m/s)1-2: 4470.42-3: 583.13-4: 547.4Avg: 1867.0T
R 1(us): 491.5
TR 2(us): 784.1
TR 3(us): 667.6
TR 4(us): 397.7
Max P1: 28.8Max P2: 32.0Max P3: 31.6Max P4: 35.4
Sensor 1
Sensor 2
Sensor 3
Sensor 4
44.4 44.6 44.8 45 45.2 45.4 45.60
5
10
15
20
25
Time (ms)
Pre
ssur
e (
psi
g)
Speed: (m/s)1-2: Inf2-3: Inf3-4: 4470.4Avg: InfT
R 1(us): 605.1
TR 2(us): 497.2
TR 3(us): 534.1
TR 4(us): 519.9
Max P1: 19.4Max P2: 19.3Max P3: 19.6Max P4: 21.0
Sensor 1
Sensor 2
Sensor 3
Sensor 4
41.8 42 42.2 42.4 42.6 42.8 430
5
10
15
20
25
30
35
Time (ms)
Pre
ssur
e (
psi
g)
Speed: (m/s)1-2: 547.42-3: 547.43-4: 583.1Avg: 559.3T
R 1(us): 369.3
TR 2(us): 463.1
TR 3(us): 423.3
TR 4(us): 363.6
Max P1: 33.1Max P2: 32.4Max P3: 32.9Max P4: 30.8
Sensor 1
Sensor 2
Sensor 3
Sensor 4
33 33.2 33.4 33.6 33.8 34 34.2 34.4-5
0
5
10
15
20
25
30
35
40
45
Time (ms)
Pre
ssur
e (
psi
g)
Speed: (m/s)1-2: 638.62-3: 654.23-4: 654.2Avg: 649.0T
R 1(us): 108.0
TR 2(us): 17.0
TR 3(us): 17.0
TR 4(us): 19.9
Max P1: 40.6Max P2: 42.1Max P3: 39.5Max P4: 41.1
Sensor 1
Sensor 2
Sensor 3
Sensor 4
31.6 31.8 32 32.2 32.4 32.6 32.80
5
10
15
20
25
30
35
40
Time (ms)
Pre
ssur
e (
psi
g)
Speed: (m/s)1-2: 609.62-3: 609.63-4: 638.6Avg: 619.3T
R 1(us): 19.9
TR 2(us): 19.9
TR 3(us): 14.2
TR 4(us): 17.0
Max P1: 32.3Max P2: 35.3Max P3: 34.5Max P4: 32.6
Sensor 1
Sensor 2
Sensor 3
Sensor 4
30.2 30.4 30.6 30.8 31 31.2 31.4 31.60
5
10
15
20
25
30
Time (ms)
Pre
ssur
e (
psi
g)
Speed: (m/s)1-2: 547.42-3: 558.83-4: 596.1Avg: 567.4T
R 1(us): 483.0
TR 2(us): 125.0
TR 3(us): 96.6
TR 4(us): 28.4
Max P1: 24.4Max P2: 25.0Max P3: 26.0Max P4: 25.6
Sensor 1
Sensor 2
Sensor 3
Sensor 4
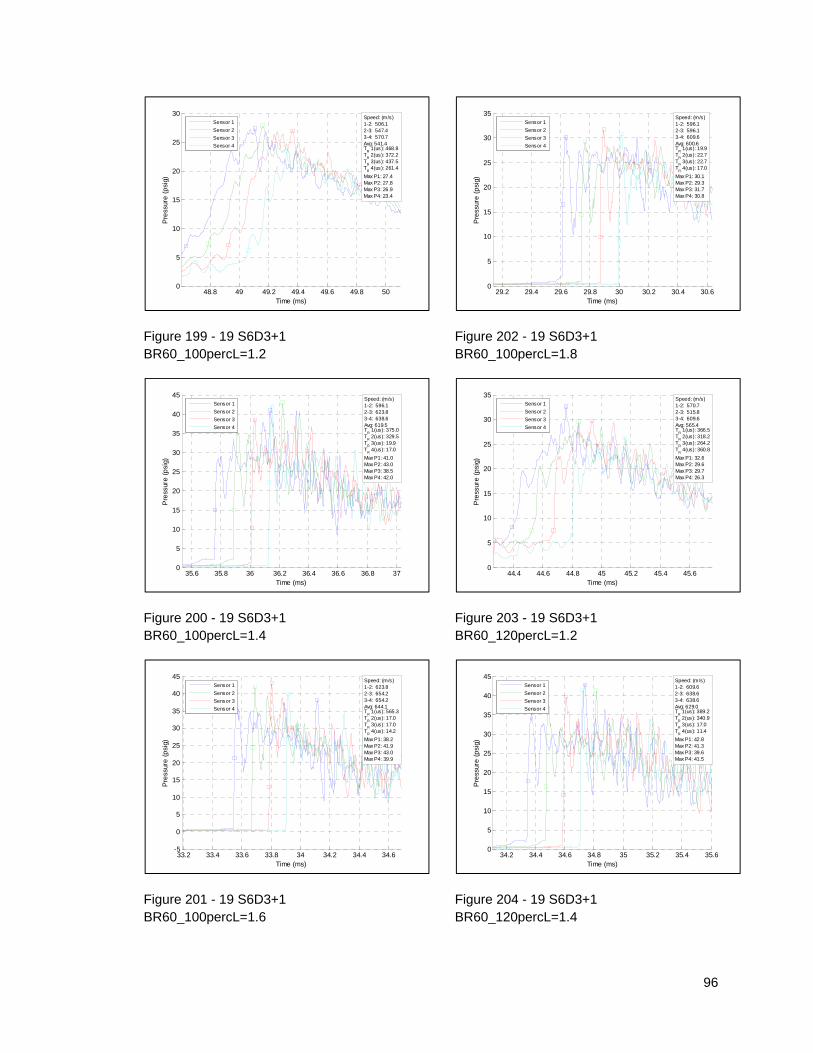
96
Figure 199 - 19 S6D3+1 BR60_100percL=1.2
Figure 200 - 19 S6D3+1 BR60_100percL=1.4
Figure 201 - 19 S6D3+1 BR60_100percL=1.6
Figure 202 - 19 S6D3+1 BR60_100percL=1.8
Figure 203 - 19 S6D3+1 BR60_120percL=1.2
Figure 204 - 19 S6D3+1 BR60_120percL=1.4
48.8 49 49.2 49.4 49.6 49.8 500
5
10
15
20
25
30
Time (ms)
Pre
ssur
e (
psi
g)
Speed: (m/s)1-2: 506.12-3: 547.43-4: 570.7Avg: 541.4T
R 1(us): 468.8
TR 2(us): 372.2
TR 3(us): 437.5
TR 4(us): 261.4
Max P1: 27.4Max P2: 27.8Max P3: 26.9Max P4: 23.4
Sensor 1
Sensor 2
Sensor 3
Sensor 4
35.6 35.8 36 36.2 36.4 36.6 36.8 370
5
10
15
20
25
30
35
40
45
Time (ms)
Pre
ssur
e (
psi
g)
Speed: (m/s)1-2: 596.12-3: 623.83-4: 638.6Avg: 619.5T
R 1(us): 375.0
TR 2(us): 329.5
TR 3(us): 19.9
TR 4(us): 17.0
Max P1: 41.0Max P2: 43.0Max P3: 38.5Max P4: 42.0
Sensor 1
Sensor 2
Sensor 3
Sensor 4
33.2 33.4 33.6 33.8 34 34.2 34.4 34.6-5
0
5
10
15
20
25
30
35
40
45
Time (ms)
Pre
ssur
e (
psi
g)
Speed: (m/s)1-2: 623.82-3: 654.23-4: 654.2Avg: 644.1T
R 1(us): 565.3
TR 2(us): 17.0
TR 3(us): 17.0
TR 4(us): 14.2
Max P1: 38.2Max P2: 41.9Max P3: 43.0Max P4: 39.9
Sensor 1
Sensor 2
Sensor 3
Sensor 4
29.2 29.4 29.6 29.8 30 30.2 30.4 30.60
5
10
15
20
25
30
35
Time (ms)
Pre
ssur
e (
psi
g)
Speed: (m/s)1-2: 596.12-3: 596.13-4: 609.6Avg: 600.6T
R 1(us): 19.9
TR 2(us): 22.7
TR 3(us): 22.7
TR 4(us): 17.0
Max P1: 30.1Max P2: 29.3Max P3: 31.7Max P4: 30.8
Sensor 1
Sensor 2
Sensor 3
Sensor 4
44.4 44.6 44.8 45 45.2 45.4 45.60
5
10
15
20
25
30
35
Time (ms)
Pre
ssur
e (
psi
g)
Speed: (m/s)1-2: 570.72-3: 515.83-4: 609.6Avg: 565.4T
R 1(us): 366.5
TR 2(us): 318.2
TR 3(us): 264.2
TR 4(us): 360.8
Max P1: 32.6Max P2: 29.6Max P3: 29.7Max P4: 26.3
Sensor 1
Sensor 2
Sensor 3
Sensor 4
34.2 34.4 34.6 34.8 35 35.2 35.4 35.60
5
10
15
20
25
30
35
40
45
Time (ms)
Pre
ssur
e (
psi
g)
Speed: (m/s)1-2: 609.62-3: 638.63-4: 638.6Avg: 629.0T
R 1(us): 389.2
TR 2(us): 340.9
TR 3(us): 17.0
TR 4(us): 11.4
Max P1: 42.8Max P2: 41.3Max P3: 39.6Max P4: 41.5
Sensor 1
Sensor 2
Sensor 3
Sensor 4

97
Figure 205 - 19 S6D3+1 BR60_120percL=1.6
Figure 206 - 19 S6D3+1 BR60_120percL=1.8
Figure 207 - 20 S6D3+1 BR60 INV_80percL=1.2
Figure 208 - 20 S6D3+1 BR60 INV_80percL=1.4
Figure 209 - 20 S6D3+1 BR60 INV_80percL=1.6
Figure 210 - 20 S6D3+1 BR60 INV_80percL=1.8
29.6 29.8 30 30.2 30.4 30.6 30.8-10
0
10
20
30
40
50
Time (ms)
Pre
ssur
e (
psi
g)
Speed: (m/s)1-2: 638.62-3: 638.63-4: 670.6Avg: 649.3T
R 1(us): 355.1
TR 2(us): 19.9
TR 3(us): 14.2
TR 4(us): 11.4
Max P1: 41.4Max P2: 46.4Max P3: 43.3Max P4: 41.1
Sensor 1
Sensor 2
Sensor 3
Sensor 4
30 30.2 30.4 30.6 30.8 31 31.20
5
10
15
20
25
30
35
40
Time (ms)
Pre
ssur
e (
psi
g)
Speed: (m/s)1-2: 609.62-3: 609.63-4: 638.6Avg: 619.3T
R 1(us): 369.3
TR 2(us): 19.9
TR 3(us): 17.0
TR 4(us): 17.0
Max P1: 33.7Max P2: 36.9Max P3: 35.7Max P4: 34.1
Sensor 1
Sensor 2
Sensor 3
Sensor 4
50.8 51 51.2 51.4 51.6 51.8 52 52.20
5
10
15
20
25
30
35
Time (ms)
Pre
ssur
e (
psi
g)
Speed: (m/s)1-2: 2235.22-3: 558.83-4: 596.1Avg: 1130.0T
R 1(us): 497.2
TR 2(us): 855.1
TR 3(us): 585.2
TR 4(us): 295.5
Max P1: 29.0Max P2: 31.3Max P3: 32.7Max P4: 33.6
Sensor 1
Sensor 2
Sensor 3
Sensor 4
43.8 44 44.2 44.4 44.6 44.8 45-5
0
5
10
15
20
25
30
35
Time (ms)
Pre
ssur
e (
psi
g)
Speed: (m/s)1-2: 609.62-3: 570.73-4: 623.8Avg: 601.4T
R 1(us): 497.2
TR 2(us): 536.9
TR 3(us): 429.0
TR 4(us): 642.0
Max P1: 28.1Max P2: 31.6Max P3: 32.5Max P4: 31.3
Sensor 1
Sensor 2
Sensor 3
Sensor 4
41.2 41.4 41.6 41.8 42 42.2 42.4 42.60
5
10
15
20
25
30
Time (ms)
Pre
ssur
e (
psi
g)
Speed: (m/s)1-2: Inf2-3: 924.93-4: 570.7Avg: InfT
R 1(us): 556.8
TR 2(us): 497.2
TR 3(us): 497.2
TR 4(us): 519.9
Max P1: 25.2Max P2: 21.4Max P3: 24.7Max P4: 23.5
Sensor 1
Sensor 2
Sensor 3
Sensor 4
44.8 45 45.2 45.4 45.6 45.8 46 46.21
2
3
4
5
6
7
8
9
10
Time (ms)
Pre
ssur
e (
psi
g)
Speed: (m/s)1-2: Inf2-3: Inf3-4: InfAvg: InfT
R 1(us): 778.4
TR 2(us): 556.8
TR 3(us): 497.2
TR 4(us): 849.4
Max P1: 9.0Max P2: 8.3Max P3: 8.0Max P4: 8.2
Sensor 1
Sensor 2
Sensor 3
Sensor 4

98
Figure 211 - 20 S6D3+1 BR60 INV_100percL=1.2
Figure 212 - 20 S6D3+1 BR60 INV_100percL=1.4
Figure 213 - 20 S6D3+1 BR60 INV_100percL=1.6
Figure 214 - 20 S6D3+1 BR60 INV_100percL=1.8
Figure 215 - 20 S6D3+1 BR60 INV_120percL=1.2
Figure 216 - 20 S6D3+1 BR60 INV_120percL=1.4
56 56.2 56.4 56.6 56.8 57 57.2 57.40
5
10
15
20
25
30
35
Time (ms)
Pre
ssur
e (
psi
g)
Speed: (m/s)1-2: Inf2-3: 957.93-4: 525.9Avg: InfT
R 1(us): 750.0
TR 2(us): 505.7
TR 3(us): 417.6
TR 4(us): 315.3
Max P1: 24.6Max P2: 26.1Max P3: 27.3Max P4: 31.2
Sensor 1
Sensor 2
Sensor 3
Sensor 4
43 43.2 43.4 43.6 43.8 44 44.20
5
10
15
20
25
30
35
40
Time (ms)
Pre
ssur
e (
psi
g)
Speed: (m/s)1-2: 6705.62-3: 609.63-4: 609.6Avg: 2641.6T
R 1(us): 528.4
TR 2(us): 485.8
TR 3(us): 502.8
TR 4(us): 275.6
Max P1: 30.4Max P2: 33.1Max P3: 35.6Max P4: 36.7
Sensor 1
Sensor 2
Sensor 3
Sensor 4
44.6 44.8 45 45.2 45.4 45.6 45.8 460
5
10
15
20
25
30
35
Time (ms)
Pre
ssur
e (
psi
g)
Speed: (m/s)1-2: 670.62-3: 596.13-4: 570.7Avg: 612.4T
R 1(us): 650.6
TR 2(us): 383.5
TR 3(us): 545.5
TR 4(us): 471.6
Max P1: 27.1Max P2: 30.1Max P3: 34.4Max P4: 34.7
Sensor 1
Sensor 2
Sensor 3
Sensor 4
43 43.2 43.4 43.6 43.8 44 44.20
5
10
15
20
25
30
Time (ms)
Pre
ssur
e (
psi
g)
Speed: (m/s)1-2: Inf2-3: 957.93-4: 583.1Avg: InfT
R 1(us): 497.2
TR 2(us): 590.9
TR 3(us): 556.8
TR 4(us): 571.0
Max P1: 21.3Max P2: 22.9Max P3: 23.2Max P4: 25.6
Sensor 1
Sensor 2
Sensor 3
Sensor 4
71.4 71.6 71.8 72 72.2 72.4 72.6-2
0
2
4
6
8
10
12
14
16
Time (ms)
Pre
ssur
e (
psi
g)
Speed: (m/s)1-2: Inf2-3: Inf3-4: 1219.2Avg: InfT
R 1(us): 497.2
TR 2(us): 542.6
TR 3(us): 571.0
TR 4(us): 539.8
Max P1: 13.5Max P2: 14.5Max P3: 14.7Max P4: 15.1
Sensor 1
Sensor 2
Sensor 3
Sensor 4
42.6 42.8 43 43.2 43.4 43.6 43.8 440
5
10
15
20
25
30
35
40
45
50
Time (ms)
Pre
ssur
e (
psi
g)
Speed: (m/s)1-2: 894.12-3: 687.83-4: 638.6Avg: 740.2T
R 1(us): 497.2
TR 2(us): 480.1
TR 3(us): 355.1
TR 4(us): 400.6
Max P1: 40.2Max P2: 39.6Max P3: 43.6Max P4: 47.7
Sensor 1
Sensor 2
Sensor 3
Sensor 4
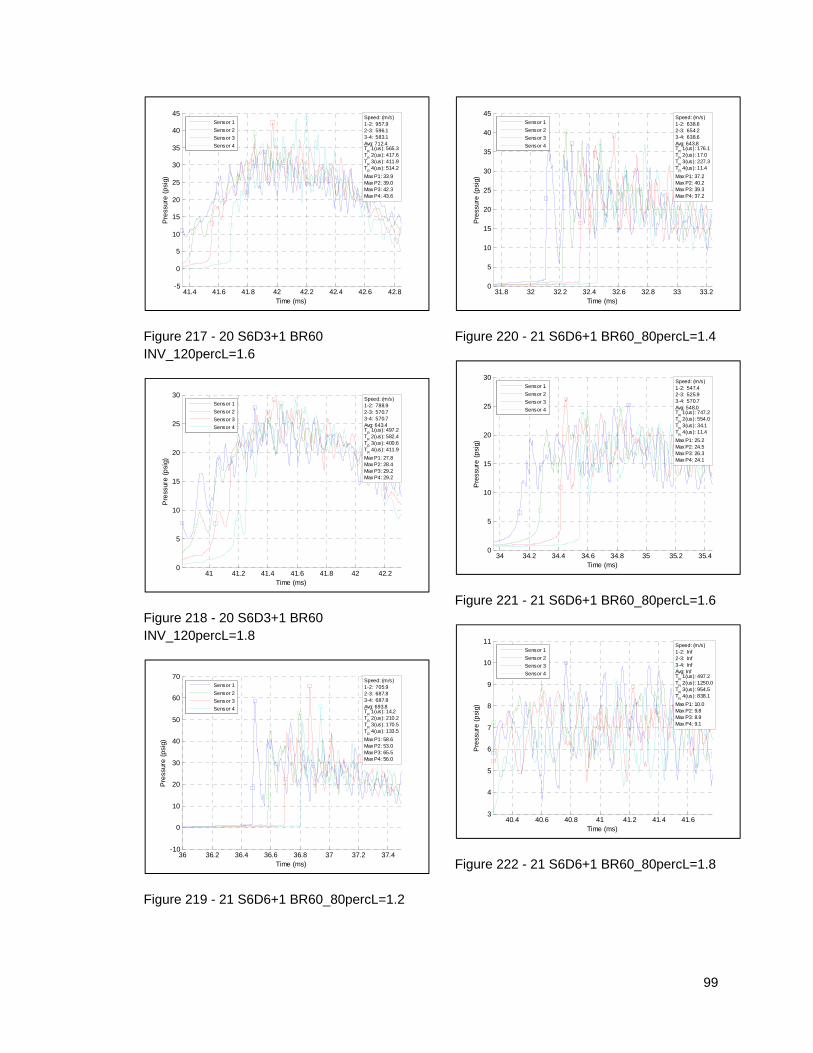
99
Figure 217 - 20 S6D3+1 BR60 INV_120percL=1.6
Figure 218 - 20 S6D3+1 BR60 INV_120percL=1.8
Figure 219 - 21 S6D6+1 BR60_80percL=1.2
Figure 220 - 21 S6D6+1 BR60_80percL=1.4
Figure 221 - 21 S6D6+1 BR60_80percL=1.6
Figure 222 - 21 S6D6+1 BR60_80percL=1.8
41.4 41.6 41.8 42 42.2 42.4 42.6 42.8-5
0
5
10
15
20
25
30
35
40
45
Time (ms)
Pre
ssur
e (
psi
g)
Speed: (m/s)1-2: 957.92-3: 596.13-4: 583.1Avg: 712.4T
R 1(us): 565.3
TR 2(us): 417.6
TR 3(us): 411.9
TR 4(us): 514.2
Max P1: 33.9Max P2: 39.0Max P3: 42.3Max P4: 43.6
Sensor 1
Sensor 2
Sensor 3
Sensor 4
41 41.2 41.4 41.6 41.8 42 42.20
5
10
15
20
25
30
Time (ms)
Pre
ssur
e (
psi
g)
Speed: (m/s)1-2: 788.92-3: 570.73-4: 570.7Avg: 643.4T
R 1(us): 497.2
TR 2(us): 582.4
TR 3(us): 400.6
TR 4(us): 411.9
Max P1: 27.8Max P2: 28.4Max P3: 29.2Max P4: 29.2
Sensor 1
Sensor 2
Sensor 3
Sensor 4
36 36.2 36.4 36.6 36.8 37 37.2 37.4-10
0
10
20
30
40
50
60
70
Time (ms)
Pre
ssur
e (
psi
g)
Speed: (m/s)1-2: 705.92-3: 687.83-4: 687.8Avg: 693.8T
R 1(us): 14.2
TR 2(us): 210.2
TR 3(us): 170.5
TR 4(us): 133.5
Max P1: 58.6Max P2: 53.0Max P3: 65.5Max P4: 56.0
Sensor 1
Sensor 2
Sensor 3
Sensor 4
31.8 32 32.2 32.4 32.6 32.8 33 33.20
5
10
15
20
25
30
35
40
45
Time (ms)
Pre
ssur
e (
psi
g)
Speed: (m/s)1-2: 638.62-3: 654.23-4: 638.6Avg: 643.8T
R 1(us): 176.1
TR 2(us): 17.0
TR 3(us): 227.3
TR 4(us): 11.4
Max P1: 37.2Max P2: 40.2Max P3: 39.3Max P4: 37.2
Sensor 1
Sensor 2
Sensor 3
Sensor 4
34 34.2 34.4 34.6 34.8 35 35.2 35.40
5
10
15
20
25
30
Time (ms)
Pre
ssur
e (
psi
g)
Speed: (m/s)1-2: 547.42-3: 525.93-4: 570.7Avg: 548.0T
R 1(us): 747.2
TR 2(us): 554.0
TR 3(us): 34.1
TR 4(us): 11.4
Max P1: 25.2Max P2: 24.5Max P3: 26.3Max P4: 24.1
Sensor 1
Sensor 2
Sensor 3
Sensor 4
40.4 40.6 40.8 41 41.2 41.4 41.63
4
5
6
7
8
9
10
11
Time (ms)
Pre
ssur
e (
psi
g)
Speed: (m/s)1-2: Inf2-3: Inf3-4: InfAvg: InfT
R 1(us): 497.2
TR 2(us): 1250.0
TR 3(us): 954.5
TR 4(us): 838.1
Max P1: 10.0Max P2: 9.8Max P3: 8.9Max P4: 9.1
Sensor 1
Sensor 2
Sensor 3
Sensor 4
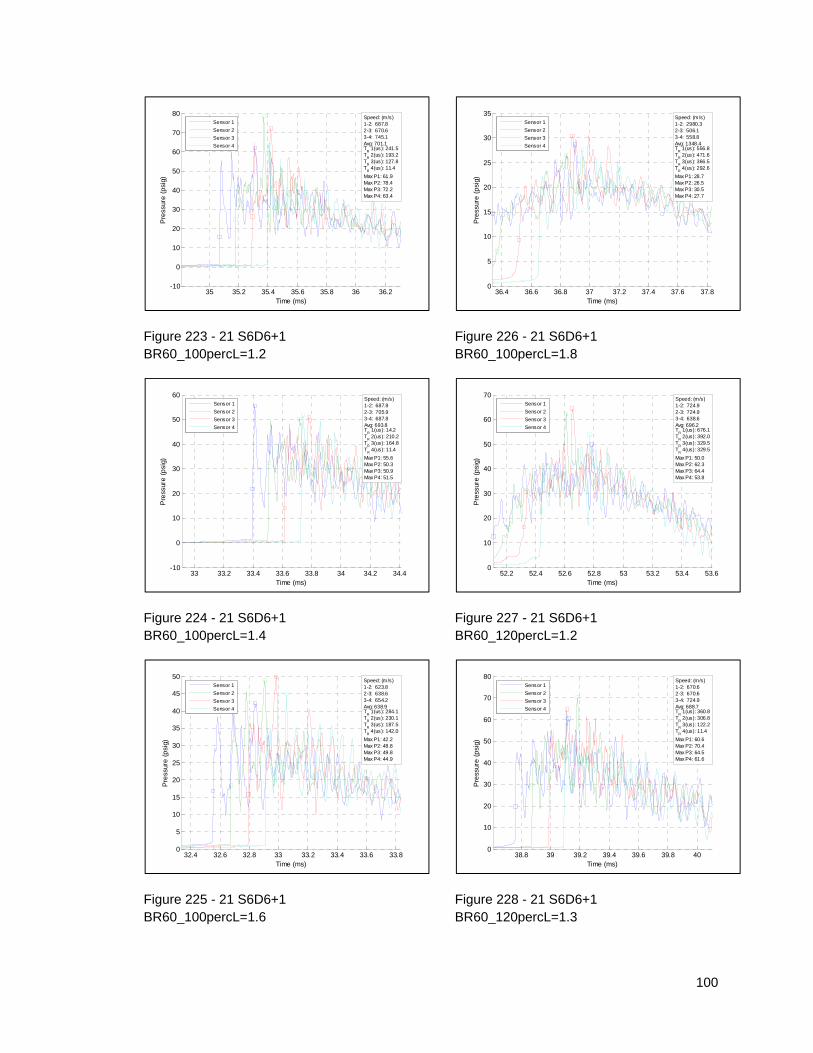
100
Figure 223 - 21 S6D6+1 BR60_100percL=1.2
Figure 224 - 21 S6D6+1 BR60_100percL=1.4
Figure 225 - 21 S6D6+1 BR60_100percL=1.6
Figure 226 - 21 S6D6+1 BR60_100percL=1.8
Figure 227 - 21 S6D6+1 BR60_120percL=1.2
Figure 228 - 21 S6D6+1 BR60_120percL=1.3
35 35.2 35.4 35.6 35.8 36 36.2-10
0
10
20
30
40
50
60
70
80
Time (ms)
Pre
ssur
e (
psi
g)
Speed: (m/s)1-2: 687.82-3: 670.63-4: 745.1Avg: 701.1T
R 1(us): 241.5
TR 2(us): 193.2
TR 3(us): 127.8
TR 4(us): 11.4
Max P1: 61.9Max P2: 78.4Max P3: 72.2Max P4: 63.4
Sensor 1
Sensor 2
Sensor 3
Sensor 4
33 33.2 33.4 33.6 33.8 34 34.2 34.4-10
0
10
20
30
40
50
60
Time (ms)
Pre
ssur
e (
psi
g)
Speed: (m/s)1-2: 687.82-3: 705.93-4: 687.8Avg: 693.8T
R 1(us): 14.2
TR 2(us): 210.2
TR 3(us): 164.8
TR 4(us): 11.4
Max P1: 55.6Max P2: 50.3Max P3: 50.9Max P4: 51.5
Sensor 1
Sensor 2
Sensor 3
Sensor 4
32.4 32.6 32.8 33 33.2 33.4 33.6 33.80
5
10
15
20
25
30
35
40
45
50
Time (ms)
Pre
ssur
e (
psi
g)
Speed: (m/s)1-2: 623.82-3: 638.63-4: 654.2Avg: 638.9T
R 1(us): 284.1
TR 2(us): 230.1
TR 3(us): 187.5
TR 4(us): 142.0
Max P1: 42.2Max P2: 48.8Max P3: 49.8Max P4: 44.9
Sensor 1
Sensor 2
Sensor 3
Sensor 4
36.4 36.6 36.8 37 37.2 37.4 37.6 37.80
5
10
15
20
25
30
35
Time (ms)
Pre
ssur
e (
psi
g)
Speed: (m/s)1-2: 2980.32-3: 506.13-4: 558.8Avg: 1348.4T
R 1(us): 556.8
TR 2(us): 471.6
TR 3(us): 366.5
TR 4(us): 292.6
Max P1: 28.7Max P2: 26.5Max P3: 30.5Max P4: 27.7
Sensor 1
Sensor 2
Sensor 3
Sensor 4
52.2 52.4 52.6 52.8 53 53.2 53.4 53.60
10
20
30
40
50
60
70
Time (ms)
Pre
ssur
e (
psi
g)
Speed: (m/s)1-2: 724.92-3: 724.93-4: 638.6Avg: 696.2T
R 1(us): 676.1
TR 2(us): 392.0
TR 3(us): 329.5
TR 4(us): 329.5
Max P1: 50.0Max P2: 62.3Max P3: 64.4Max P4: 53.8
Sensor 1
Sensor 2
Sensor 3
Sensor 4
38.8 39 39.2 39.4 39.6 39.8 400
10
20
30
40
50
60
70
80
Time (ms)
Pre
ssur
e (
psi
g)
Speed: (m/s)1-2: 670.62-3: 670.63-4: 724.9Avg: 688.7T
R 1(us): 360.8
TR 2(us): 306.8
TR 3(us): 122.2
TR 4(us): 11.4
Max P1: 60.6Max P2: 70.4Max P3: 64.5Max P4: 61.6
Sensor 1
Sensor 2
Sensor 3
Sensor 4

101
Figure 229 - 21 S6D6+1 BR60_120percL=1.4
Figure 230 - 21 S6D6+1 BR60_120percL=1.5
Figure 231 - 21 S6D6+1 BR60_120percL=1.6
Figure 232 - 21 S6D6+1 BR60_120percL=1.8
Figure 233 - 21 S6D6+1 BR60_150percL=1.3
Figure 234 - 21 S6D6+1 BR60_150percL=1.4
39.4 39.6 39.8 40 40.2 40.4 40.60
10
20
30
40
50
60
70
80
90
100
Time (ms)
Pre
ssur
e (
psi
g)
Speed: (m/s)1-2: 705.92-3: 687.83-4: 670.6Avg: 688.1T
R 1(us): 244.3
TR 2(us): 184.7
TR 3(us): 136.4
TR 4(us): 213.1
Max P1: 68.3Max P2: 74.8Max P3: 96.0Max P4: 80.1
Sensor 1
Sensor 2
Sensor 3
Sensor 4
33.4 33.6 33.8 34 34.2 34.4 34.60
10
20
30
40
50
60
70
Time (ms)
Pre
ssur
e (
psi
g)
Speed: (m/s)1-2: 670.62-3: 670.63-4: 724.9Avg: 688.7T
R 1(us): 252.8
TR 2(us): 335.2
TR 3(us): 286.9
TR 4(us): 11.4
Max P1: 51.9Max P2: 54.0Max P3: 69.3Max P4: 59.1
Sensor 1
Sensor 2
Sensor 3
Sensor 4
35.2 35.4 35.6 35.8 36 36.2 36.4 36.6-10
0
10
20
30
40
50
60
70
Time (ms)
Pre
ssur
e (
psi
g)
Speed: (m/s)1-2: 705.92-3: 705.93-4: 705.9Avg: 705.9T
R 1(us): 252.8
TR 2(us): 207.4
TR 3(us): 161.9
TR 4(us): 17.0
Max P1: 58.8Max P2: 67.9Max P3: 60.0Max P4: 48.2
Sensor 1
Sensor 2
Sensor 3
Sensor 4
34.6 34.8 35 35.2 35.4 35.6 35.8 360
5
10
15
20
25
30
35
40
45
50
Time (ms)
Pre
ssur
e (
psi
g)
Speed: (m/s)1-2: 638.62-3: 638.63-4: 638.6Avg: 638.6T
R 1(us): 284.1
TR 2(us): 423.3
TR 3(us): 343.8
TR 4(us): 19.9
Max P1: 41.1Max P2: 46.0Max P3: 41.2Max P4: 40.1
Sensor 1
Sensor 2
Sensor 3
Sensor 4
32.4 32.6 32.8 33 33.2 33.4 33.6 33.8-20
0
20
40
60
80
100
Time (ms)
Pre
ssur
e (
psi
g)
Speed: (m/s)1-2: 724.92-3: 705.93-4: 745.1Avg: 725.3T
R 1(us): 329.5
TR 2(us): 179.0
TR 3(us): 125.0
TR 4(us): 431.8
Max P1: 96.7Max P2: 95.8Max P3: 96.2Max P4: 77.3
Sensor 1
Sensor 2
Sensor 3
Sensor 4
31.4 31.6 31.8 32 32.2 32.4 32.6-10
0
10
20
30
40
50
60
70
80
90
Time (ms)
Pre
ssur
e (
psi
g)
Speed: (m/s)1-2: 724.92-3: 687.83-4: 705.9Avg: 706.2T
R 1(us): 545.5
TR 2(us): 193.2
TR 3(us): 133.5
TR 4(us): 238.6
Max P1: 66.9Max P2: 71.6Max P3: 80.5Max P4: 69.2
Sensor 1
Sensor 2
Sensor 3
Sensor 4
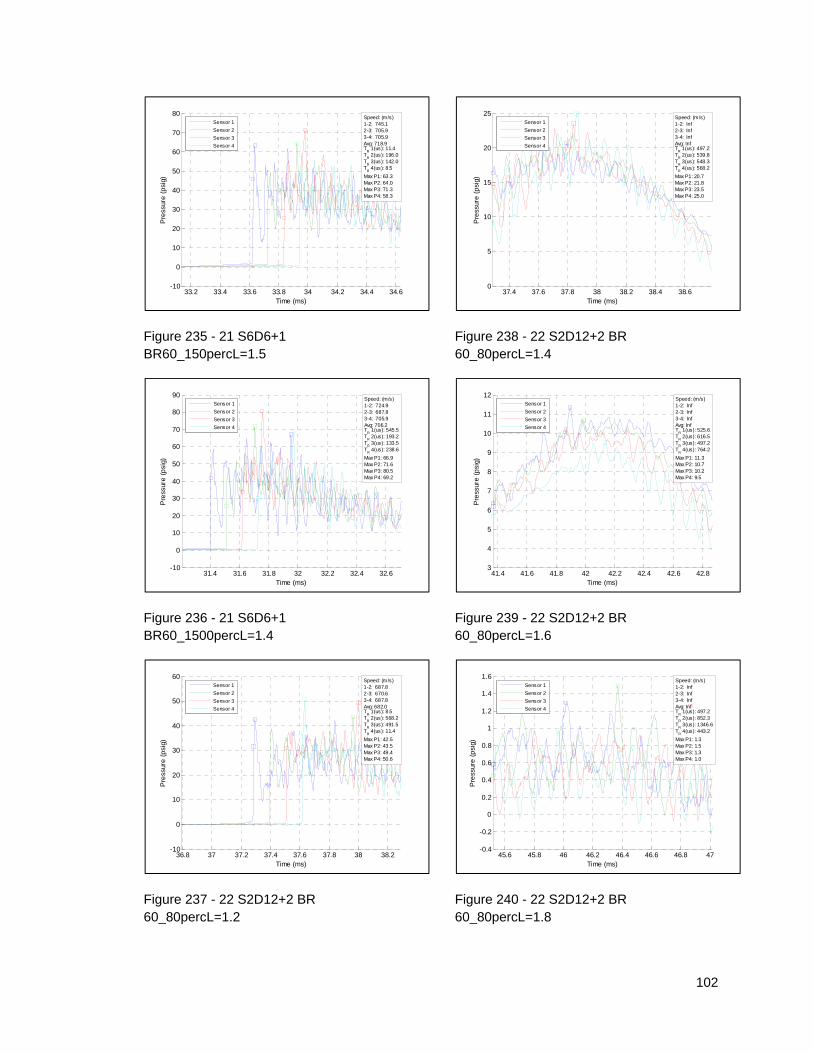
102
Figure 235 - 21 S6D6+1 BR60_150percL=1.5
Figure 236 - 21 S6D6+1 BR60_1500percL=1.4
Figure 237 - 22 S2D12+2 BR 60_80percL=1.2
Figure 238 - 22 S2D12+2 BR 60_80percL=1.4
Figure 239 - 22 S2D12+2 BR 60_80percL=1.6
Figure 240 - 22 S2D12+2 BR 60_80percL=1.8
33.2 33.4 33.6 33.8 34 34.2 34.4 34.6-10
0
10
20
30
40
50
60
70
80
Time (ms)
Pre
ssur
e (
psi
g)
Speed: (m/s)1-2: 745.12-3: 705.93-4: 705.9Avg: 718.9T
R 1(us): 11.4
TR 2(us): 196.0
TR 3(us): 142.0
TR 4(us): 8.5
Max P1: 63.3Max P2: 64.0Max P3: 71.3Max P4: 58.3
Sensor 1
Sensor 2
Sensor 3
Sensor 4
31.4 31.6 31.8 32 32.2 32.4 32.6-10
0
10
20
30
40
50
60
70
80
90
Time (ms)
Pre
ssur
e (
psi
g)
Speed: (m/s)1-2: 724.92-3: 687.83-4: 705.9Avg: 706.2T
R 1(us): 545.5
TR 2(us): 193.2
TR 3(us): 133.5
TR 4(us): 238.6
Max P1: 66.9Max P2: 71.6Max P3: 80.5Max P4: 69.2
Sensor 1
Sensor 2
Sensor 3
Sensor 4
36.8 37 37.2 37.4 37.6 37.8 38 38.2-10
0
10
20
30
40
50
60
Time (ms)
Pre
ssur
e (
psi
g)
Speed: (m/s)1-2: 687.82-3: 670.63-4: 687.8Avg: 682.0T
R 1(us): 8.5
TR 2(us): 568.2
TR 3(us): 491.5
TR 4(us): 11.4
Max P1: 42.5Max P2: 43.5Max P3: 49.4Max P4: 50.6
Sensor 1
Sensor 2
Sensor 3
Sensor 4
37.4 37.6 37.8 38 38.2 38.4 38.60
5
10
15
20
25
Time (ms)
Pre
ssur
e (
psi
g)
Speed: (m/s)1-2: Inf2-3: Inf3-4: InfAvg: InfT
R 1(us): 497.2
TR 2(us): 539.8
TR 3(us): 548.3
TR 4(us): 568.2
Max P1: 20.7Max P2: 21.8Max P3: 23.5Max P4: 25.0
Sensor 1
Sensor 2
Sensor 3
Sensor 4
41.4 41.6 41.8 42 42.2 42.4 42.6 42.83
4
5
6
7
8
9
10
11
12
Time (ms)
Pre
ssur
e (
psi
g)
Speed: (m/s)1-2: Inf2-3: Inf3-4: InfAvg: InfT
R 1(us): 525.6
TR 2(us): 616.5
TR 3(us): 497.2
TR 4(us): 764.2
Max P1: 11.3Max P2: 10.7Max P3: 10.2Max P4: 9.5
Sensor 1
Sensor 2
Sensor 3
Sensor 4
45.6 45.8 46 46.2 46.4 46.6 46.8 47-0.4
-0.2
0
0.2
0.4
0.6
0.8
1
1.2
1.4
1.6
Time (ms)
Pre
ssur
e (
psi
g)
Speed: (m/s)1-2: Inf2-3: Inf3-4: InfAvg: InfT
R 1(us): 497.2
TR 2(us): 852.3
TR 3(us): 1346.6
TR 4(us): 443.2
Max P1: 1.3Max P2: 1.5Max P3: 1.3Max P4: 1.0
Sensor 1
Sensor 2
Sensor 3
Sensor 4
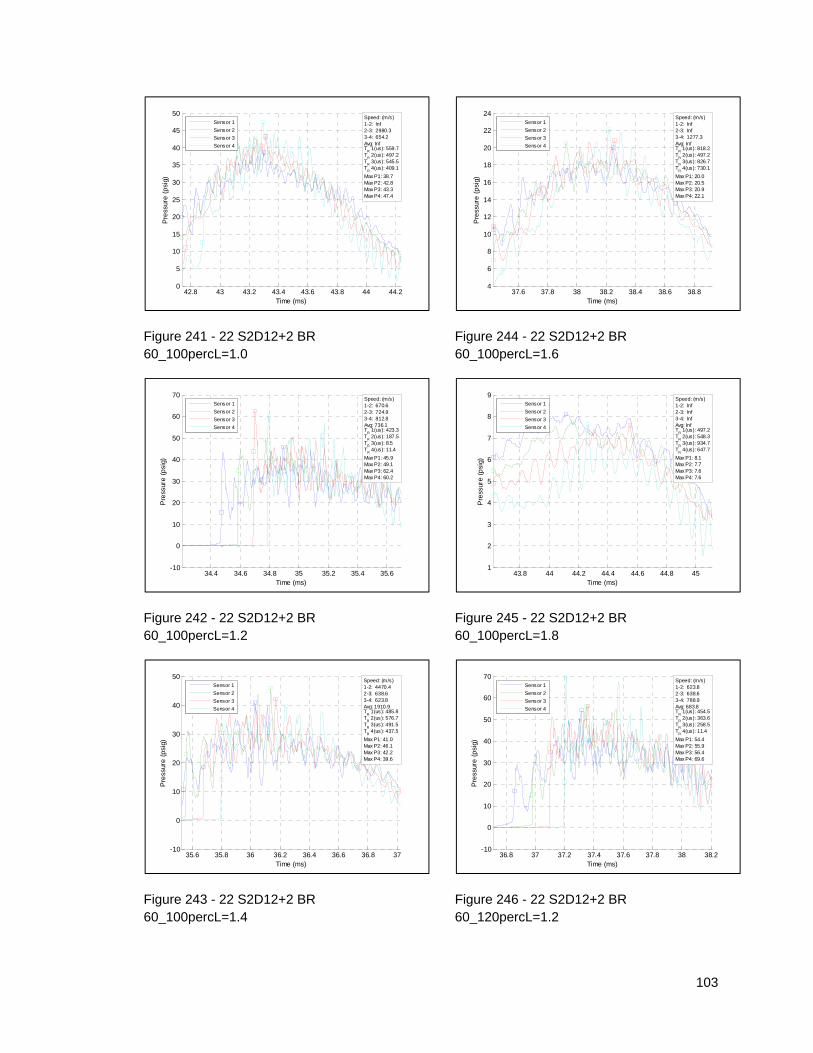
103
Figure 241 - 22 S2D12+2 BR 60_100percL=1.0
Figure 242 - 22 S2D12+2 BR 60_100percL=1.2
Figure 243 - 22 S2D12+2 BR 60_100percL=1.4
Figure 244 - 22 S2D12+2 BR 60_100percL=1.6
Figure 245 - 22 S2D12+2 BR 60_100percL=1.8
Figure 246 - 22 S2D12+2 BR 60_120percL=1.2
42.8 43 43.2 43.4 43.6 43.8 44 44.20
5
10
15
20
25
30
35
40
45
50
Time (ms)
Pre
ssur
e (
psi
g)
Speed: (m/s)1-2: Inf2-3: 2980.33-4: 654.2Avg: InfT
R 1(us): 559.7
TR 2(us): 497.2
TR 3(us): 545.5
TR 4(us): 409.1
Max P1: 38.7Max P2: 42.8Max P3: 43.3Max P4: 47.4
Sensor 1
Sensor 2
Sensor 3
Sensor 4
34.4 34.6 34.8 35 35.2 35.4 35.6-10
0
10
20
30
40
50
60
70
Time (ms)
Pre
ssur
e (
psi
g)
Speed: (m/s)1-2: 670.62-3: 724.93-4: 812.8Avg: 736.1T
R 1(us): 423.3
TR 2(us): 187.5
TR 3(us): 8.5
TR 4(us): 11.4
Max P1: 45.9Max P2: 49.1Max P3: 62.4Max P4: 60.2
Sensor 1
Sensor 2
Sensor 3
Sensor 4
35.6 35.8 36 36.2 36.4 36.6 36.8 37-10
0
10
20
30
40
50
Time (ms)
Pre
ssur
e (
psi
g)
Speed: (m/s)1-2: 4470.42-3: 638.63-4: 623.8Avg: 1910.9T
R 1(us): 485.8
TR 2(us): 576.7
TR 3(us): 491.5
TR 4(us): 437.5
Max P1: 41.0Max P2: 46.1Max P3: 42.2Max P4: 39.6
Sensor 1
Sensor 2
Sensor 3
Sensor 4
37.6 37.8 38 38.2 38.4 38.6 38.84
6
8
10
12
14
16
18
20
22
24
Time (ms)
Pre
ssur
e (
psi
g)
Speed: (m/s)1-2: Inf2-3: Inf3-4: 1277.3Avg: InfT
R 1(us): 818.2
TR 2(us): 497.2
TR 3(us): 826.7
TR 4(us): 730.1
Max P1: 20.0Max P2: 20.5Max P3: 20.9Max P4: 22.1
Sensor 1
Sensor 2
Sensor 3
Sensor 4
43.8 44 44.2 44.4 44.6 44.8 451
2
3
4
5
6
7
8
9
Time (ms)
Pre
ssur
e (
psi
g)
Speed: (m/s)1-2: Inf2-3: Inf3-4: InfAvg: InfT
R 1(us): 497.2
TR 2(us): 548.3
TR 3(us): 934.7
TR 4(us): 647.7
Max P1: 8.1Max P2: 7.7Max P3: 7.6Max P4: 7.6
Sensor 1
Sensor 2
Sensor 3
Sensor 4
36.8 37 37.2 37.4 37.6 37.8 38 38.2-10
0
10
20
30
40
50
60
70
Time (ms)
Pre
ssur
e (
psi
g)
Speed: (m/s)1-2: 623.82-3: 638.63-4: 788.9Avg: 683.8T
R 1(us): 454.5
TR 2(us): 363.6
TR 3(us): 258.5
TR 4(us): 11.4
Max P1: 54.4Max P2: 55.9Max P3: 56.4Max P4: 69.6
Sensor 1
Sensor 2
Sensor 3
Sensor 4
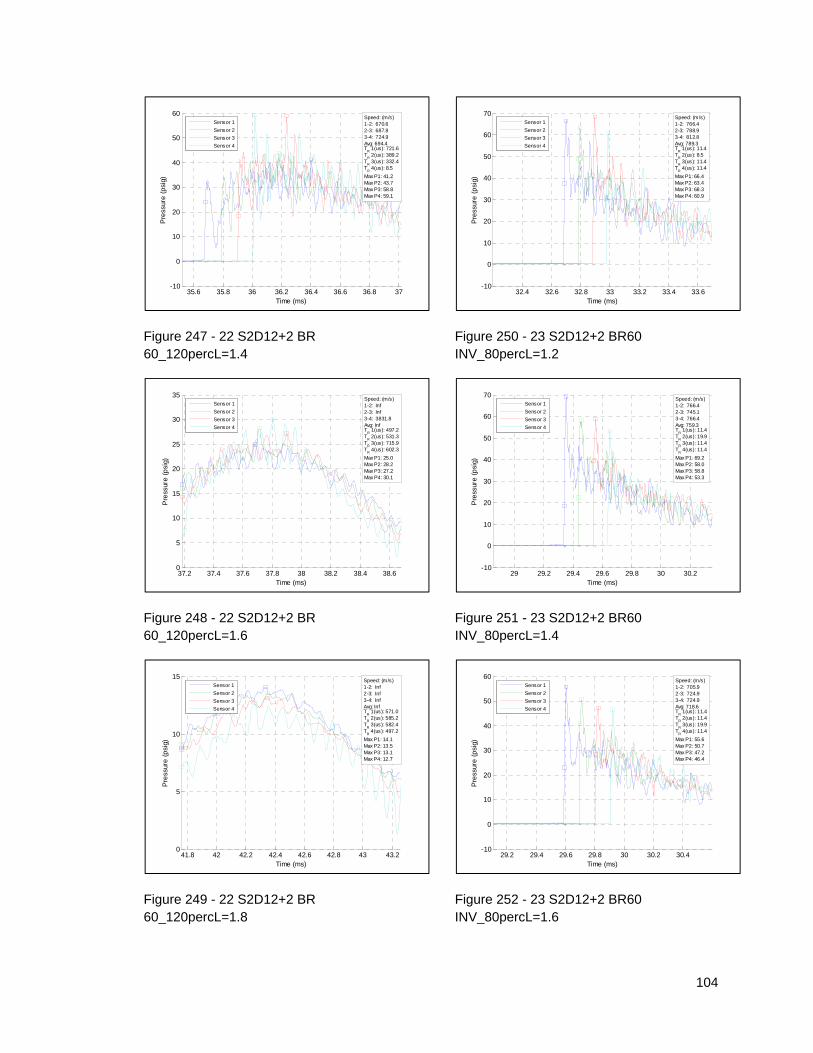
104
Figure 247 - 22 S2D12+2 BR 60_120percL=1.4
Figure 248 - 22 S2D12+2 BR 60_120percL=1.6
Figure 249 - 22 S2D12+2 BR 60_120percL=1.8
Figure 250 - 23 S2D12+2 BR60 INV_80percL=1.2
Figure 251 - 23 S2D12+2 BR60 INV_80percL=1.4
Figure 252 - 23 S2D12+2 BR60 INV_80percL=1.6
35.6 35.8 36 36.2 36.4 36.6 36.8 37-10
0
10
20
30
40
50
60
Time (ms)
Pre
ssur
e (
psi
g)
Speed: (m/s)1-2: 670.62-3: 687.83-4: 724.9Avg: 694.4T
R 1(us): 721.6
TR 2(us): 389.2
TR 3(us): 332.4
TR 4(us): 8.5
Max P1: 41.2Max P2: 43.7Max P3: 58.8Max P4: 59.1
Sensor 1
Sensor 2
Sensor 3
Sensor 4
37.2 37.4 37.6 37.8 38 38.2 38.4 38.60
5
10
15
20
25
30
35
Time (ms)
Pre
ssur
e (
psi
g)
Speed: (m/s)1-2: Inf2-3: Inf3-4: 3831.8Avg: InfT
R 1(us): 497.2
TR 2(us): 531.3
TR 3(us): 715.9
TR 4(us): 602.3
Max P1: 25.0Max P2: 28.2Max P3: 27.2Max P4: 30.1
Sensor 1
Sensor 2
Sensor 3
Sensor 4
41.8 42 42.2 42.4 42.6 42.8 43 43.20
5
10
15
Time (ms)
Pre
ssur
e (
psi
g)
Speed: (m/s)1-2: Inf2-3: Inf3-4: InfAvg: InfT
R 1(us): 571.0
TR 2(us): 585.2
TR 3(us): 582.4
TR 4(us): 497.2
Max P1: 14.1Max P2: 13.5Max P3: 13.1Max P4: 12.7
Sensor 1
Sensor 2
Sensor 3
Sensor 4
32.4 32.6 32.8 33 33.2 33.4 33.6-10
0
10
20
30
40
50
60
70
Time (ms)
Pre
ssur
e (
psi
g)
Speed: (m/s)1-2: 766.42-3: 788.93-4: 812.8Avg: 789.3T
R 1(us): 11.4
TR 2(us): 8.5
TR 3(us): 11.4
TR 4(us): 11.4
Max P1: 66.4Max P2: 63.4Max P3: 68.3Max P4: 60.9
Sensor 1
Sensor 2
Sensor 3
Sensor 4
29 29.2 29.4 29.6 29.8 30 30.2-10
0
10
20
30
40
50
60
70
Time (ms)
Pre
ssur
e (
psi
g)
Speed: (m/s)1-2: 766.42-3: 745.13-4: 766.4Avg: 759.3T
R 1(us): 11.4
TR 2(us): 19.9
TR 3(us): 11.4
TR 4(us): 11.4
Max P1: 69.2Max P2: 58.0Max P3: 58.8Max P4: 53.3
Sensor 1
Sensor 2
Sensor 3
Sensor 4
29.2 29.4 29.6 29.8 30 30.2 30.4-10
0
10
20
30
40
50
60
Time (ms)
Pre
ssur
e (
psi
g)
Speed: (m/s)1-2: 705.92-3: 724.93-4: 724.9Avg: 718.6T
R 1(us): 11.4
TR 2(us): 11.4
TR 3(us): 19.9
TR 4(us): 11.4
Max P1: 55.6Max P2: 50.7Max P3: 47.2Max P4: 46.4
Sensor 1
Sensor 2
Sensor 3
Sensor 4
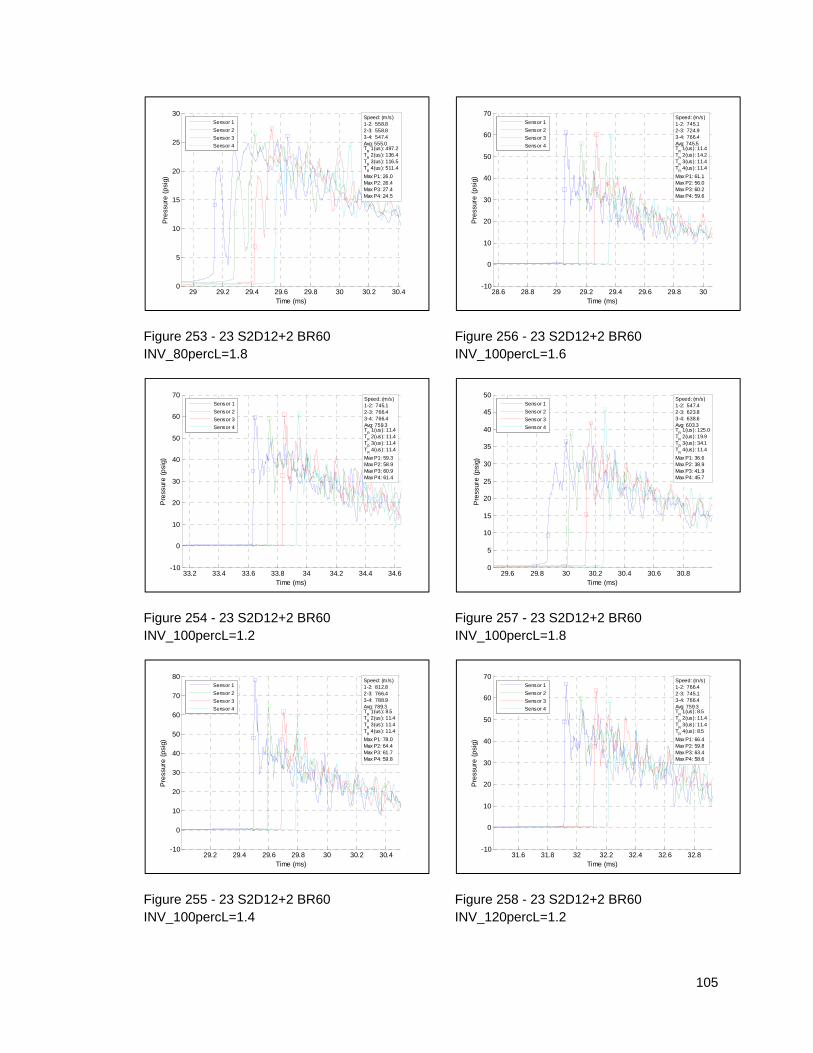
105
Figure 253 - 23 S2D12+2 BR60 INV_80percL=1.8
Figure 254 - 23 S2D12+2 BR60 INV_100percL=1.2
Figure 255 - 23 S2D12+2 BR60 INV_100percL=1.4
Figure 256 - 23 S2D12+2 BR60 INV_100percL=1.6
Figure 257 - 23 S2D12+2 BR60 INV_100percL=1.8
Figure 258 - 23 S2D12+2 BR60 INV_120percL=1.2
29 29.2 29.4 29.6 29.8 30 30.2 30.40
5
10
15
20
25
30
Time (ms)
Pre
ssur
e (
psi
g)
Speed: (m/s)1-2: 558.82-3: 558.83-4: 547.4Avg: 555.0T
R 1(us): 497.2
TR 2(us): 136.4
TR 3(us): 116.5
TR 4(us): 511.4
Max P1: 26.0Max P2: 26.4Max P3: 27.4Max P4: 24.5
Sensor 1
Sensor 2
Sensor 3
Sensor 4
33.2 33.4 33.6 33.8 34 34.2 34.4 34.6-10
0
10
20
30
40
50
60
70
Time (ms)
Pre
ssur
e (
psi
g)
Speed: (m/s)1-2: 745.12-3: 766.43-4: 766.4Avg: 759.3T
R 1(us): 11.4
TR 2(us): 11.4
TR 3(us): 11.4
TR 4(us): 11.4
Max P1: 59.3Max P2: 58.9Max P3: 60.9Max P4: 61.4
Sensor 1
Sensor 2
Sensor 3
Sensor 4
29.2 29.4 29.6 29.8 30 30.2 30.4-10
0
10
20
30
40
50
60
70
80
Time (ms)
Pre
ssur
e (
psi
g)
Speed: (m/s)1-2: 812.82-3: 766.43-4: 788.9Avg: 789.3T
R 1(us): 8.5
TR 2(us): 11.4
TR 3(us): 11.4
TR 4(us): 11.4
Max P1: 78.0Max P2: 64.4Max P3: 61.7Max P4: 59.8
Sensor 1
Sensor 2
Sensor 3
Sensor 4
28.6 28.8 29 29.2 29.4 29.6 29.8 30-10
0
10
20
30
40
50
60
70
Time (ms)
Pre
ssur
e (
psi
g)
Speed: (m/s)1-2: 745.12-3: 724.93-4: 766.4Avg: 745.5T
R 1(us): 11.4
TR 2(us): 14.2
TR 3(us): 11.4
TR 4(us): 11.4
Max P1: 61.1Max P2: 56.0Max P3: 60.2Max P4: 59.6
Sensor 1
Sensor 2
Sensor 3
Sensor 4
29.6 29.8 30 30.2 30.4 30.6 30.80
5
10
15
20
25
30
35
40
45
50
Time (ms)
Pre
ssur
e (
psi
g)
Speed: (m/s)1-2: 547.42-3: 623.83-4: 638.6Avg: 603.3T
R 1(us): 125.0
TR 2(us): 19.9
TR 3(us): 34.1
TR 4(us): 11.4
Max P1: 36.6Max P2: 38.9Max P3: 41.9Max P4: 45.7
Sensor 1
Sensor 2
Sensor 3
Sensor 4
31.6 31.8 32 32.2 32.4 32.6 32.8-10
0
10
20
30
40
50
60
70
Time (ms)
Pre
ssur
e (
psi
g)
Speed: (m/s)1-2: 766.42-3: 745.13-4: 766.4Avg: 759.3T
R 1(us): 8.5
TR 2(us): 11.4
TR 3(us): 11.4
TR 4(us): 8.5
Max P1: 66.4Max P2: 59.8Max P3: 63.4Max P4: 58.6
Sensor 1
Sensor 2
Sensor 3
Sensor 4
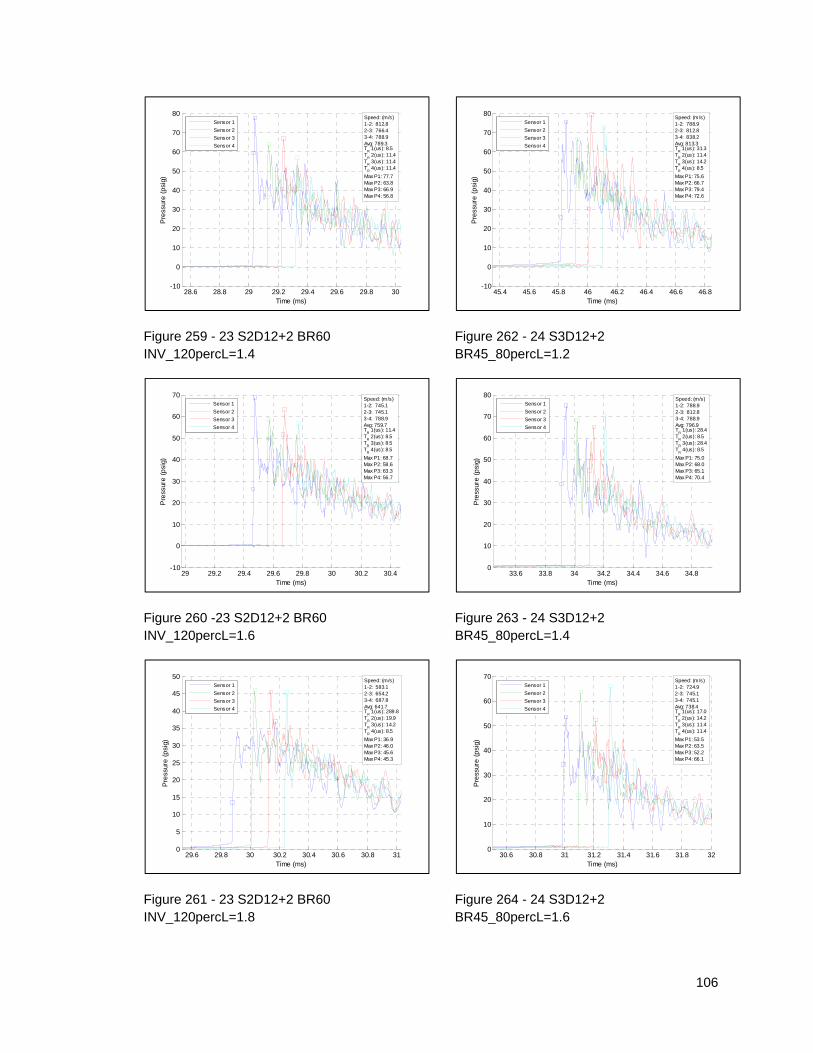
106
Figure 259 - 23 S2D12+2 BR60 INV_120percL=1.4
Figure 260 -23 S2D12+2 BR60 INV_120percL=1.6
Figure 261 - 23 S2D12+2 BR60 INV_120percL=1.8
Figure 262 - 24 S3D12+2 BR45_80percL=1.2
Figure 263 - 24 S3D12+2 BR45_80percL=1.4
Figure 264 - 24 S3D12+2 BR45_80percL=1.6
28.6 28.8 29 29.2 29.4 29.6 29.8 30-10
0
10
20
30
40
50
60
70
80
Time (ms)
Pre
ssur
e (
psi
g)
Speed: (m/s)1-2: 812.82-3: 766.43-4: 788.9Avg: 789.3T
R 1(us): 8.5
TR 2(us): 11.4
TR 3(us): 11.4
TR 4(us): 11.4
Max P1: 77.7Max P2: 63.8Max P3: 66.9Max P4: 56.8
Sensor 1
Sensor 2
Sensor 3
Sensor 4
29 29.2 29.4 29.6 29.8 30 30.2 30.4-10
0
10
20
30
40
50
60
70
Time (ms)
Pre
ssur
e (
psi
g)
Speed: (m/s)1-2: 745.12-3: 745.13-4: 788.9Avg: 759.7T
R 1(us): 11.4
TR 2(us): 8.5
TR 3(us): 8.5
TR 4(us): 8.5
Max P1: 68.7Max P2: 58.6Max P3: 63.3Max P4: 56.7
Sensor 1
Sensor 2
Sensor 3
Sensor 4
29.6 29.8 30 30.2 30.4 30.6 30.8 310
5
10
15
20
25
30
35
40
45
50
Time (ms)
Pre
ssur
e (
psi
g)
Speed: (m/s)1-2: 583.12-3: 654.23-4: 687.8Avg: 641.7T
R 1(us): 289.8
TR 2(us): 19.9
TR 3(us): 14.2
TR 4(us): 8.5
Max P1: 36.9Max P2: 46.0Max P3: 45.6Max P4: 45.3
Sensor 1
Sensor 2
Sensor 3
Sensor 4
45.4 45.6 45.8 46 46.2 46.4 46.6 46.8-10
0
10
20
30
40
50
60
70
80
Time (ms)
Pre
ssur
e (
psi
g)
Speed: (m/s)1-2: 788.92-3: 812.83-4: 838.2Avg: 813.3T
R 1(us): 31.3
TR 2(us): 11.4
TR 3(us): 14.2
TR 4(us): 8.5
Max P1: 75.6Max P2: 66.7Max P3: 79.4Max P4: 72.6
Sensor 1
Sensor 2
Sensor 3
Sensor 4
33.6 33.8 34 34.2 34.4 34.6 34.80
10
20
30
40
50
60
70
80
Time (ms)
Pre
ssur
e (
psi
g)
Speed: (m/s)1-2: 788.92-3: 812.83-4: 788.9Avg: 796.9T
R 1(us): 28.4
TR 2(us): 8.5
TR 3(us): 28.4
TR 4(us): 8.5
Max P1: 75.0Max P2: 68.0Max P3: 65.1Max P4: 70.4
Sensor 1
Sensor 2
Sensor 3
Sensor 4
30.6 30.8 31 31.2 31.4 31.6 31.8 320
10
20
30
40
50
60
70
Time (ms)
Pre
ssur
e (
psi
g)
Speed: (m/s)1-2: 724.92-3: 745.13-4: 745.1Avg: 738.4T
R 1(us): 17.0
TR 2(us): 14.2
TR 3(us): 11.4
TR 4(us): 11.4
Max P1: 53.5Max P2: 63.5Max P3: 52.2Max P4: 66.1
Sensor 1
Sensor 2
Sensor 3
Sensor 4
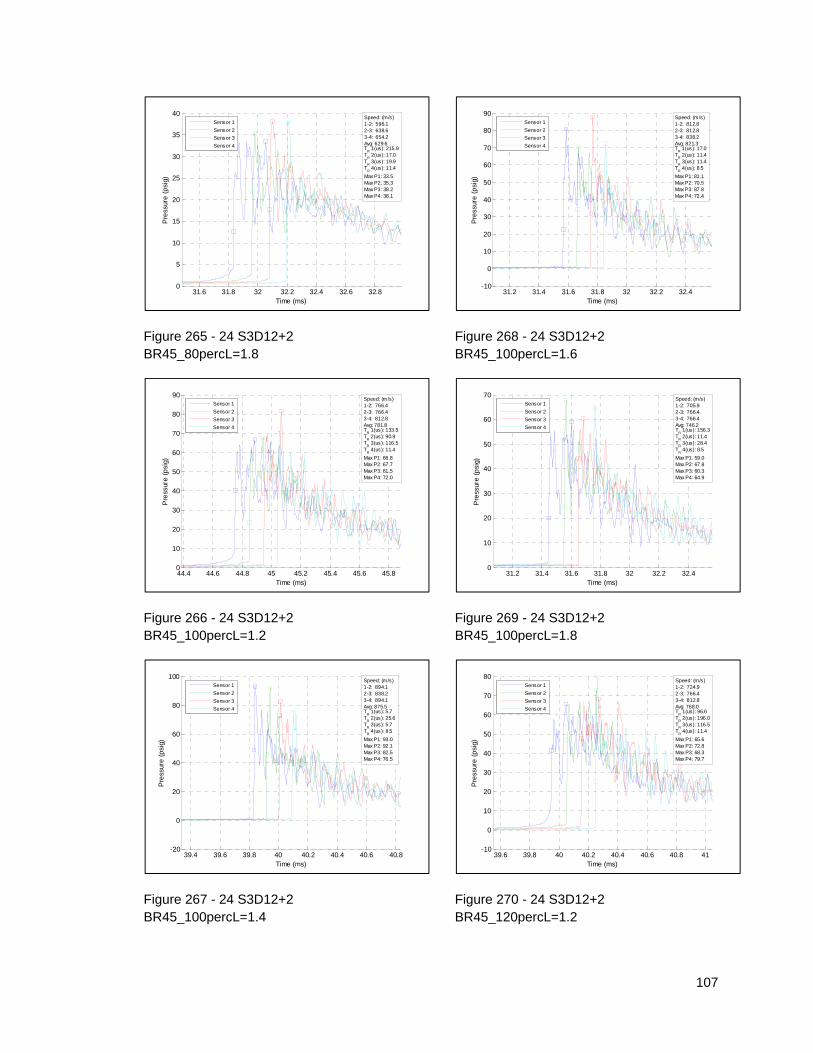
107
Figure 265 - 24 S3D12+2 BR45_80percL=1.8
Figure 266 - 24 S3D12+2 BR45_100percL=1.2
Figure 267 - 24 S3D12+2 BR45_100percL=1.4
Figure 268 - 24 S3D12+2 BR45_100percL=1.6
Figure 269 - 24 S3D12+2 BR45_100percL=1.8
Figure 270 - 24 S3D12+2 BR45_120percL=1.2
31.6 31.8 32 32.2 32.4 32.6 32.80
5
10
15
20
25
30
35
40
Time (ms)
Pre
ssur
e (
psi
g)
Speed: (m/s)1-2: 596.12-3: 638.63-4: 654.2Avg: 629.6T
R 1(us): 215.9
TR 2(us): 17.0
TR 3(us): 19.9
TR 4(us): 11.4
Max P1: 33.5Max P2: 35.3Max P3: 38.2Max P4: 38.1
Sensor 1
Sensor 2
Sensor 3
Sensor 4
44.4 44.6 44.8 45 45.2 45.4 45.6 45.80
10
20
30
40
50
60
70
80
90
Time (ms)
Pre
ssur
e (
psi
g)
Speed: (m/s)1-2: 766.42-3: 766.43-4: 812.8Avg: 781.8T
R 1(us): 133.5
TR 2(us): 90.9
TR 3(us): 116.5
TR 4(us): 11.4
Max P1: 66.8Max P2: 67.7Max P3: 81.5Max P4: 72.0
Sensor 1
Sensor 2
Sensor 3
Sensor 4
39.4 39.6 39.8 40 40.2 40.4 40.6 40.8-20
0
20
40
60
80
100
Time (ms)
Pre
ssur
e (
psi
g)
Speed: (m/s)1-2: 894.12-3: 838.23-4: 894.1Avg: 875.5T
R 1(us): 5.7
TR 2(us): 25.6
TR 3(us): 5.7
TR 4(us): 8.5
Max P1: 93.0Max P2: 92.1Max P3: 82.5Max P4: 76.5
Sensor 1
Sensor 2
Sensor 3
Sensor 4
31.2 31.4 31.6 31.8 32 32.2 32.4-10
0
10
20
30
40
50
60
70
80
90
Time (ms)
Pre
ssur
e (
psi
g)
Speed: (m/s)1-2: 812.82-3: 812.83-4: 838.2Avg: 821.3T
R 1(us): 17.0
TR 2(us): 11.4
TR 3(us): 11.4
TR 4(us): 8.5
Max P1: 81.1Max P2: 70.5Max P3: 87.8Max P4: 72.4
Sensor 1
Sensor 2
Sensor 3
Sensor 4
31.2 31.4 31.6 31.8 32 32.2 32.40
10
20
30
40
50
60
70
Time (ms)
Pre
ssur
e (
psi
g)
Speed: (m/s)1-2: 705.92-3: 766.43-4: 766.4Avg: 746.2T
R 1(us): 156.3
TR 2(us): 11.4
TR 3(us): 28.4
TR 4(us): 8.5
Max P1: 59.0Max P2: 67.8Max P3: 60.3Max P4: 64.9
Sensor 1
Sensor 2
Sensor 3
Sensor 4
39.6 39.8 40 40.2 40.4 40.6 40.8 41-10
0
10
20
30
40
50
60
70
80
Time (ms)
Pre
ssur
e (
psi
g)
Speed: (m/s)1-2: 724.92-3: 766.43-4: 812.8Avg: 768.0T
R 1(us): 96.6
TR 2(us): 196.0
TR 3(us): 116.5
TR 4(us): 11.4
Max P1: 65.6Max P2: 72.8Max P3: 68.3Max P4: 79.7
Sensor 1
Sensor 2
Sensor 3
Sensor 4
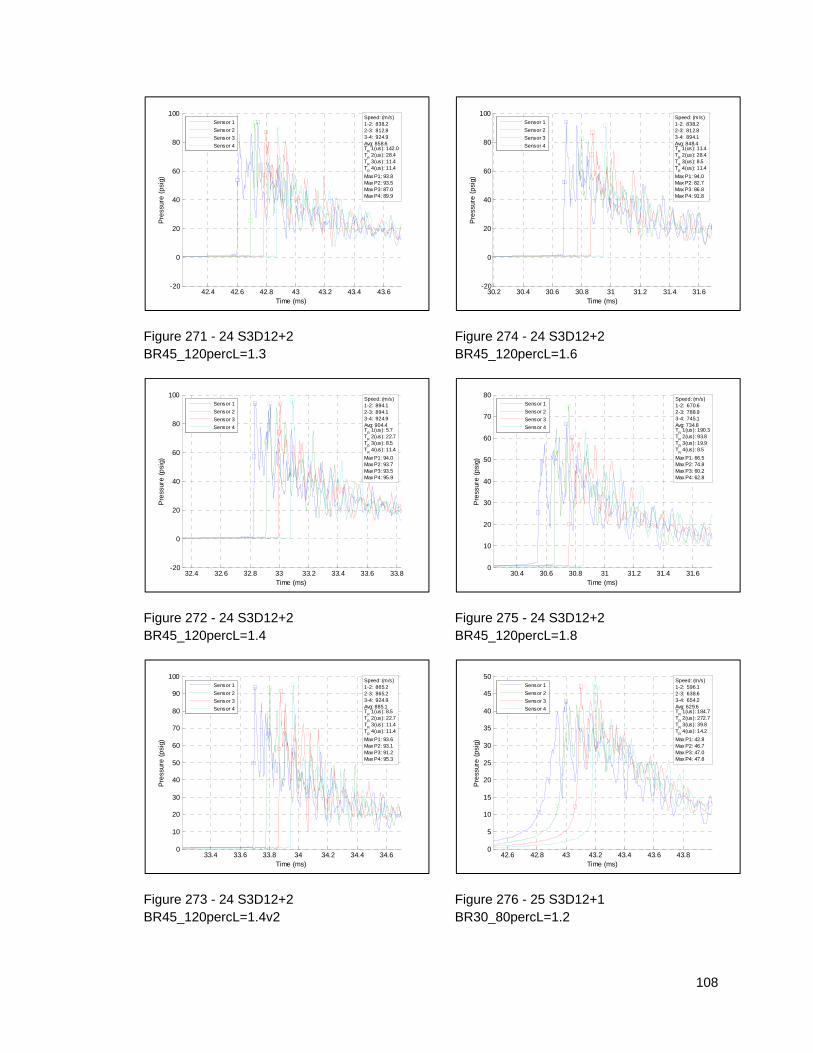
108
Figure 271 - 24 S3D12+2 BR45_120percL=1.3
Figure 272 - 24 S3D12+2 BR45_120percL=1.4
Figure 273 - 24 S3D12+2 BR45_120percL=1.4v2
Figure 274 - 24 S3D12+2 BR45_120percL=1.6
Figure 275 - 24 S3D12+2 BR45_120percL=1.8
Figure 276 - 25 S3D12+1 BR30_80percL=1.2
42.4 42.6 42.8 43 43.2 43.4 43.6-20
0
20
40
60
80
100
Time (ms)
Pre
ssur
e (
psi
g)
Speed: (m/s)1-2: 838.22-3: 812.83-4: 924.9Avg: 858.6T
R 1(us): 142.0
TR 2(us): 28.4
TR 3(us): 11.4
TR 4(us): 11.4
Max P1: 93.8Max P2: 93.5Max P3: 87.0Max P4: 89.9
Sensor 1
Sensor 2
Sensor 3
Sensor 4
32.4 32.6 32.8 33 33.2 33.4 33.6 33.8-20
0
20
40
60
80
100
Time (ms)
Pre
ssur
e (
psi
g)
Speed: (m/s)1-2: 894.12-3: 894.13-4: 924.9Avg: 904.4T
R 1(us): 5.7
TR 2(us): 22.7
TR 3(us): 8.5
TR 4(us): 11.4
Max P1: 94.0Max P2: 93.7Max P3: 93.5Max P4: 95.9
Sensor 1
Sensor 2
Sensor 3
Sensor 4
33.4 33.6 33.8 34 34.2 34.4 34.60
10
20
30
40
50
60
70
80
90
100
Time (ms)
Pre
ssur
e (
psi
g)
Speed: (m/s)1-2: 865.22-3: 865.23-4: 924.9Avg: 885.1T
R 1(us): 8.5
TR 2(us): 22.7
TR 3(us): 11.4
TR 4(us): 11.4
Max P1: 93.6Max P2: 93.1Max P3: 91.2Max P4: 95.3
Sensor 1
Sensor 2
Sensor 3
Sensor 4
30.2 30.4 30.6 30.8 31 31.2 31.4 31.6-20
0
20
40
60
80
100
Time (ms)
Pre
ssur
e (
psi
g)
Speed: (m/s)1-2: 838.22-3: 812.83-4: 894.1Avg: 848.4T
R 1(us): 11.4
TR 2(us): 28.4
TR 3(us): 8.5
TR 4(us): 11.4
Max P1: 94.0Max P2: 82.7Max P3: 86.8Max P4: 91.8
Sensor 1
Sensor 2
Sensor 3
Sensor 4
30.4 30.6 30.8 31 31.2 31.4 31.60
10
20
30
40
50
60
70
80
Time (ms)
Pre
ssur
e (
psi
g)
Speed: (m/s)1-2: 670.62-3: 788.93-4: 745.1Avg: 734.8T
R 1(us): 190.3
TR 2(us): 93.8
TR 3(us): 19.9
TR 4(us): 8.5
Max P1: 66.5Max P2: 74.8Max P3: 60.2Max P4: 62.8
Sensor 1
Sensor 2
Sensor 3
Sensor 4
42.6 42.8 43 43.2 43.4 43.6 43.80
5
10
15
20
25
30
35
40
45
50
Time (ms)
Pre
ssur
e (
psi
g)
Speed: (m/s)1-2: 596.12-3: 638.63-4: 654.2Avg: 629.6T
R 1(us): 184.7
TR 2(us): 272.7
TR 3(us): 39.8
TR 4(us): 14.2
Max P1: 42.8Max P2: 46.7Max P3: 47.0Max P4: 47.8
Sensor 1
Sensor 2
Sensor 3
Sensor 4
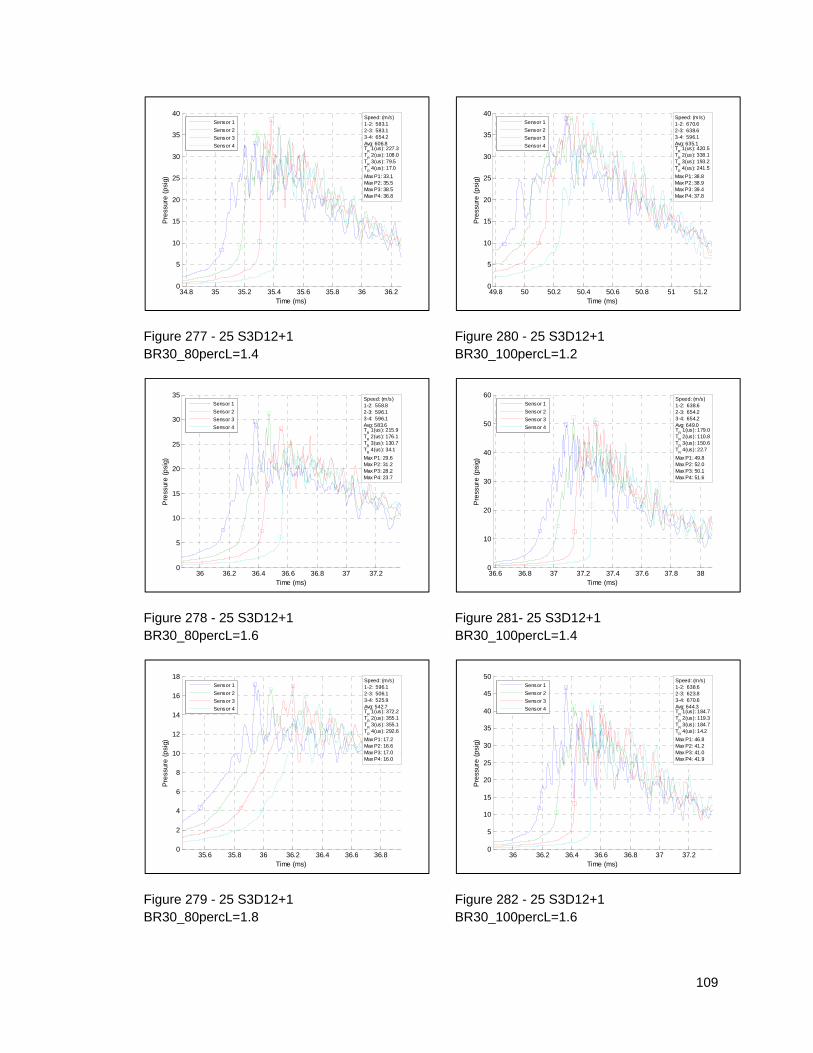
109
Figure 277 - 25 S3D12+1 BR30_80percL=1.4
Figure 278 - 25 S3D12+1 BR30_80percL=1.6
Figure 279 - 25 S3D12+1 BR30_80percL=1.8
Figure 280 - 25 S3D12+1 BR30_100percL=1.2
Figure 281- 25 S3D12+1 BR30_100percL=1.4
Figure 282 - 25 S3D12+1 BR30_100percL=1.6
34.8 35 35.2 35.4 35.6 35.8 36 36.20
5
10
15
20
25
30
35
40
Time (ms)
Pre
ssur
e (
psi
g)
Speed: (m/s)1-2: 583.12-3: 583.13-4: 654.2Avg: 606.8T
R 1(us): 227.3
TR 2(us): 108.0
TR 3(us): 79.5
TR 4(us): 17.0
Max P1: 33.1Max P2: 35.5Max P3: 38.5Max P4: 36.8
Sensor 1
Sensor 2
Sensor 3
Sensor 4
36 36.2 36.4 36.6 36.8 37 37.20
5
10
15
20
25
30
35
Time (ms)
Pre
ssur
e (
psi
g)
Speed: (m/s)1-2: 558.82-3: 596.13-4: 596.1Avg: 583.6T
R 1(us): 215.9
TR 2(us): 176.1
TR 3(us): 130.7
TR 4(us): 34.1
Max P1: 29.6Max P2: 31.2Max P3: 28.2Max P4: 23.7
Sensor 1
Sensor 2
Sensor 3
Sensor 4
35.6 35.8 36 36.2 36.4 36.6 36.80
2
4
6
8
10
12
14
16
18
Time (ms)
Pre
ssur
e (
psi
g)
Speed: (m/s)1-2: 596.12-3: 506.13-4: 525.9Avg: 542.7T
R 1(us): 372.2
TR 2(us): 355.1
TR 3(us): 355.1
TR 4(us): 292.6
Max P1: 17.2Max P2: 16.6Max P3: 17.0Max P4: 16.0
Sensor 1
Sensor 2
Sensor 3
Sensor 4
49.8 50 50.2 50.4 50.6 50.8 51 51.20
5
10
15
20
25
30
35
40
Time (ms)
Pre
ssur
e (
psi
g)
Speed: (m/s)1-2: 670.62-3: 638.63-4: 596.1Avg: 635.1T
R 1(us): 420.5
TR 2(us): 338.1
TR 3(us): 193.2
TR 4(us): 241.5
Max P1: 38.8Max P2: 38.9Max P3: 39.4Max P4: 37.8
Sensor 1
Sensor 2
Sensor 3
Sensor 4
36.6 36.8 37 37.2 37.4 37.6 37.8 380
10
20
30
40
50
60
Time (ms)
Pre
ssur
e (
psi
g)
Speed: (m/s)1-2: 638.62-3: 654.23-4: 654.2Avg: 649.0T
R 1(us): 179.0
TR 2(us): 110.8
TR 3(us): 150.6
TR 4(us): 22.7
Max P1: 49.8Max P2: 52.0Max P3: 50.1Max P4: 51.6
Sensor 1
Sensor 2
Sensor 3
Sensor 4
36 36.2 36.4 36.6 36.8 37 37.20
5
10
15
20
25
30
35
40
45
50
Time (ms)
Pre
ssur
e (
psi
g)
Speed: (m/s)1-2: 638.62-3: 623.83-4: 670.6Avg: 644.3T
R 1(us): 184.7
TR 2(us): 119.3
TR 3(us): 184.7
TR 4(us): 14.2
Max P1: 46.8Max P2: 41.2Max P3: 41.0Max P4: 41.9
Sensor 1
Sensor 2
Sensor 3
Sensor 4
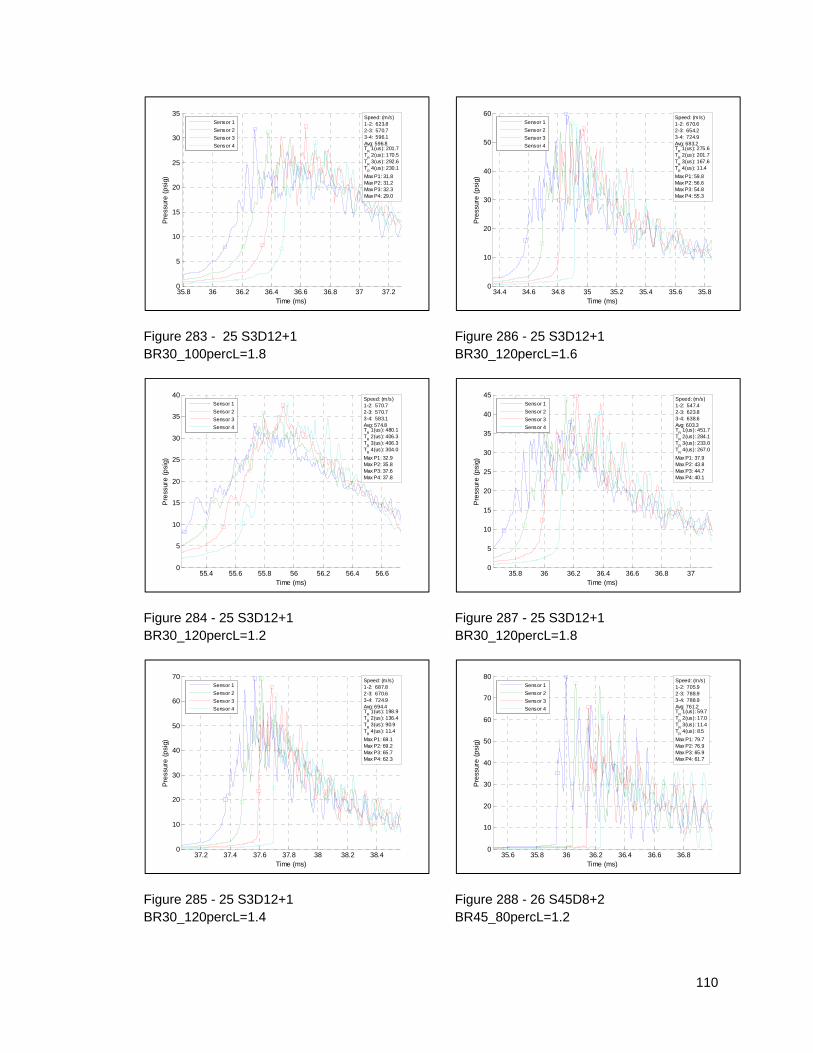
110
Figure 283 - 25 S3D12+1 BR30_100percL=1.8
Figure 284 - 25 S3D12+1 BR30_120percL=1.2
Figure 285 - 25 S3D12+1 BR30_120percL=1.4
Figure 286 - 25 S3D12+1 BR30_120percL=1.6
Figure 287 - 25 S3D12+1 BR30_120percL=1.8
Figure 288 - 26 S45D8+2 BR45_80percL=1.2
35.8 36 36.2 36.4 36.6 36.8 37 37.20
5
10
15
20
25
30
35
Time (ms)
Pre
ssur
e (
psi
g)
Speed: (m/s)1-2: 623.82-3: 570.73-4: 596.1Avg: 596.8T
R 1(us): 201.7
TR 2(us): 170.5
TR 3(us): 292.6
TR 4(us): 230.1
Max P1: 31.8Max P2: 31.2Max P3: 32.3Max P4: 29.0
Sensor 1
Sensor 2
Sensor 3
Sensor 4
55.4 55.6 55.8 56 56.2 56.4 56.60
5
10
15
20
25
30
35
40
Time (ms)
Pre
ssur
e (
psi
g)
Speed: (m/s)1-2: 570.72-3: 570.73-4: 583.1Avg: 574.8T
R 1(us): 480.1
TR 2(us): 406.3
TR 3(us): 406.3
TR 4(us): 304.0
Max P1: 32.9Max P2: 35.8Max P3: 37.6Max P4: 37.8
Sensor 1
Sensor 2
Sensor 3
Sensor 4
37.2 37.4 37.6 37.8 38 38.2 38.40
10
20
30
40
50
60
70
Time (ms)
Pre
ssur
e (
psi
g)
Speed: (m/s)1-2: 687.82-3: 670.63-4: 724.9Avg: 694.4T
R 1(us): 198.9
TR 2(us): 136.4
TR 3(us): 90.9
TR 4(us): 11.4
Max P1: 69.1Max P2: 69.2Max P3: 65.7Max P4: 62.3
Sensor 1
Sensor 2
Sensor 3
Sensor 4
34.4 34.6 34.8 35 35.2 35.4 35.6 35.80
10
20
30
40
50
60
Time (ms)
Pre
ssur
e (
psi
g)
Speed: (m/s)1-2: 670.62-3: 654.23-4: 724.9Avg: 683.2T
R 1(us): 275.6
TR 2(us): 201.7
TR 3(us): 167.6
TR 4(us): 11.4
Max P1: 59.8Max P2: 56.6Max P3: 54.8Max P4: 55.3
Sensor 1
Sensor 2
Sensor 3
Sensor 4
35.8 36 36.2 36.4 36.6 36.8 370
5
10
15
20
25
30
35
40
45
Time (ms)
Pre
ssur
e (
psi
g)
Speed: (m/s)1-2: 547.42-3: 623.83-4: 638.6Avg: 603.3T
R 1(us): 451.7
TR 2(us): 284.1
TR 3(us): 233.0
TR 4(us): 267.0
Max P1: 37.9Max P2: 43.8Max P3: 44.7Max P4: 40.1
Sensor 1
Sensor 2
Sensor 3
Sensor 4
35.6 35.8 36 36.2 36.4 36.6 36.80
10
20
30
40
50
60
70
80
Time (ms)
Pre
ssur
e (
psi
g)
Speed: (m/s)1-2: 705.92-3: 788.93-4: 788.9Avg: 761.2T
R 1(us): 59.7
TR 2(us): 17.0
TR 3(us): 11.4
TR 4(us): 8.5
Max P1: 79.7Max P2: 76.9Max P3: 65.9Max P4: 61.7
Sensor 1
Sensor 2
Sensor 3
Sensor 4
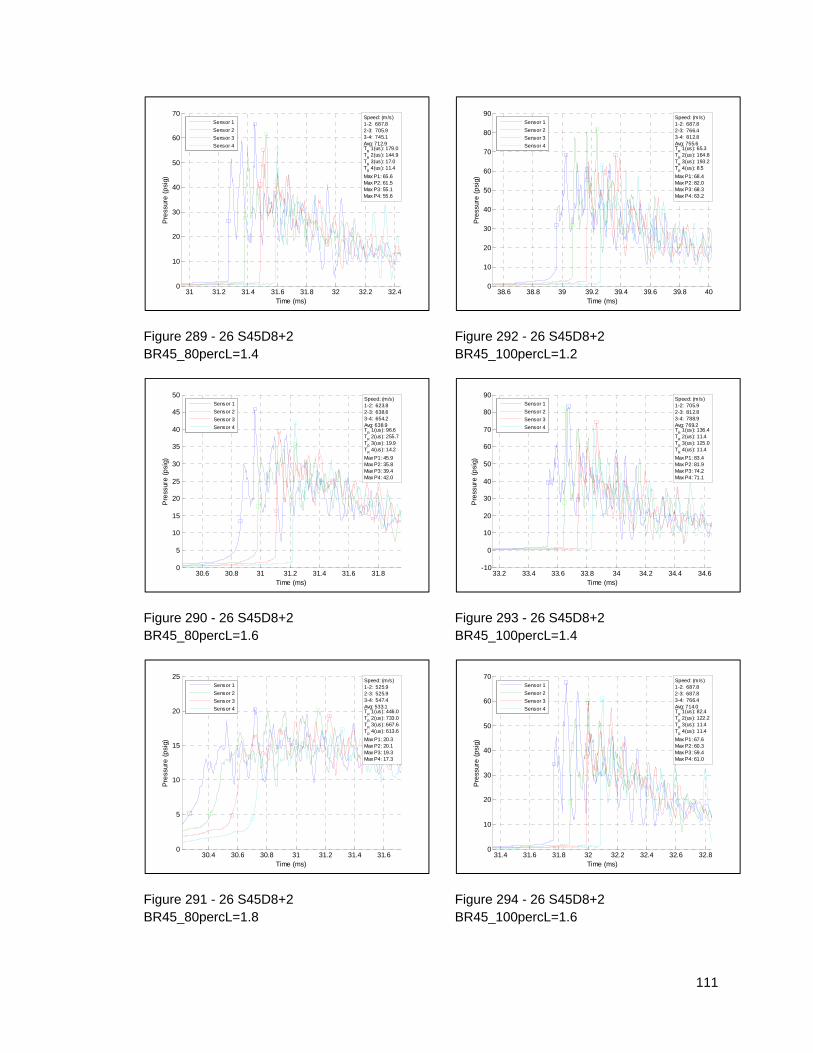
111
Figure 289 - 26 S45D8+2 BR45_80percL=1.4
Figure 290 - 26 S45D8+2 BR45_80percL=1.6
Figure 291 - 26 S45D8+2 BR45_80percL=1.8
Figure 292 - 26 S45D8+2 BR45_100percL=1.2
Figure 293 - 26 S45D8+2 BR45_100percL=1.4
Figure 294 - 26 S45D8+2 BR45_100percL=1.6
31 31.2 31.4 31.6 31.8 32 32.2 32.40
10
20
30
40
50
60
70
Time (ms)
Pre
ssur
e (
psi
g)
Speed: (m/s)1-2: 687.82-3: 705.93-4: 745.1Avg: 712.9T
R 1(us): 179.0
TR 2(us): 144.9
TR 3(us): 17.0
TR 4(us): 11.4
Max P1: 65.6Max P2: 61.5Max P3: 55.1Max P4: 55.6
Sensor 1
Sensor 2
Sensor 3
Sensor 4
30.6 30.8 31 31.2 31.4 31.6 31.80
5
10
15
20
25
30
35
40
45
50
Time (ms)
Pre
ssur
e (
psi
g)
Speed: (m/s)1-2: 623.82-3: 638.63-4: 654.2Avg: 638.9T
R 1(us): 96.6
TR 2(us): 255.7
TR 3(us): 19.9
TR 4(us): 14.2
Max P1: 45.9Max P2: 35.8Max P3: 39.4Max P4: 42.0
Sensor 1
Sensor 2
Sensor 3
Sensor 4
30.4 30.6 30.8 31 31.2 31.4 31.60
5
10
15
20
25
Time (ms)
Pre
ssur
e (
psi
g)
Speed: (m/s)1-2: 525.92-3: 525.93-4: 547.4Avg: 533.1T
R 1(us): 446.0
TR 2(us): 733.0
TR 3(us): 667.6
TR 4(us): 613.6
Max P1: 20.3Max P2: 20.1Max P3: 19.3Max P4: 17.3
Sensor 1
Sensor 2
Sensor 3
Sensor 4
38.6 38.8 39 39.2 39.4 39.6 39.8 400
10
20
30
40
50
60
70
80
90
Time (ms)
Pre
ssur
e (
psi
g)
Speed: (m/s)1-2: 687.82-3: 766.43-4: 812.8Avg: 755.6T
R 1(us): 65.3
TR 2(us): 164.8
TR 3(us): 193.2
TR 4(us): 8.5
Max P1: 68.4Max P2: 82.0Max P3: 68.3Max P4: 63.2
Sensor 1
Sensor 2
Sensor 3
Sensor 4
33.2 33.4 33.6 33.8 34 34.2 34.4 34.6-10
0
10
20
30
40
50
60
70
80
90
Time (ms)
Pre
ssur
e (
psi
g)
Speed: (m/s)1-2: 705.92-3: 812.83-4: 788.9Avg: 769.2T
R 1(us): 136.4
TR 2(us): 11.4
TR 3(us): 125.0
TR 4(us): 11.4
Max P1: 83.4Max P2: 81.9Max P3: 74.2Max P4: 71.1
Sensor 1
Sensor 2
Sensor 3
Sensor 4
31.4 31.6 31.8 32 32.2 32.4 32.6 32.80
10
20
30
40
50
60
70
Time (ms)
Pre
ssur
e (
psi
g)
Speed: (m/s)1-2: 687.82-3: 687.83-4: 766.4Avg: 714.0T
R 1(us): 82.4
TR 2(us): 122.2
TR 3(us): 11.4
TR 4(us): 11.4
Max P1: 67.6Max P2: 60.3Max P3: 59.4Max P4: 61.0
Sensor 1
Sensor 2
Sensor 3
Sensor 4
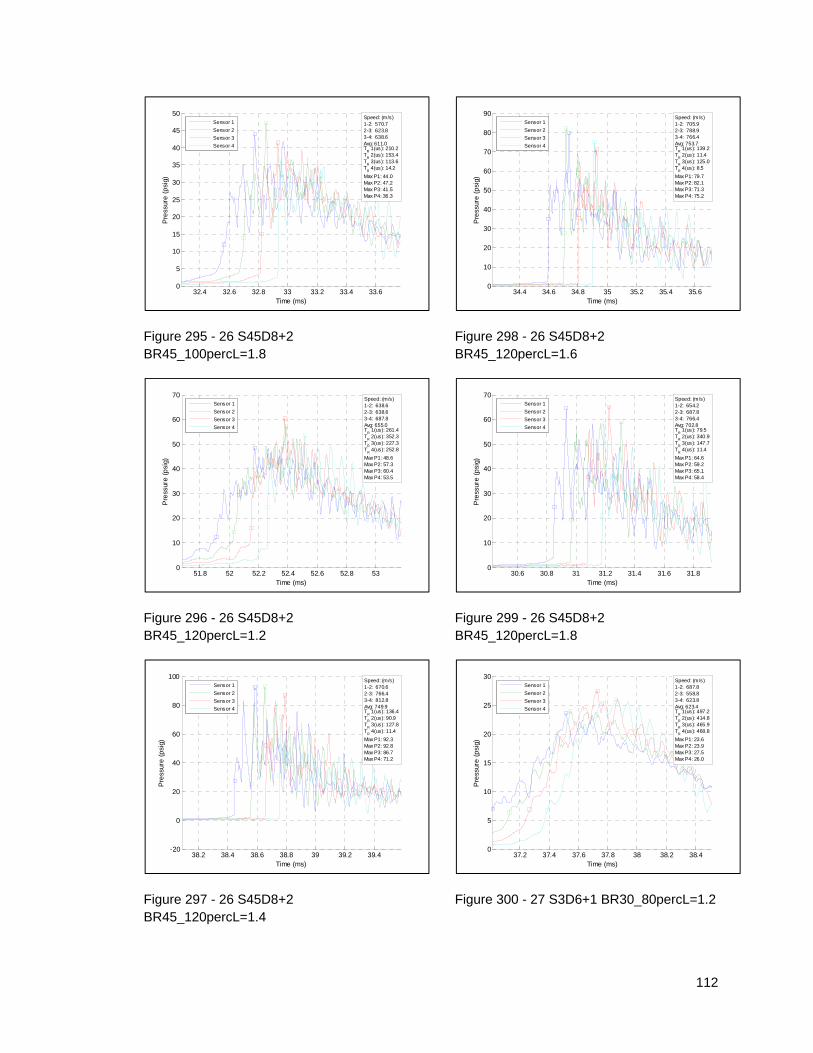
112
Figure 295 - 26 S45D8+2 BR45_100percL=1.8
Figure 296 - 26 S45D8+2 BR45_120percL=1.2
Figure 297 - 26 S45D8+2 BR45_120percL=1.4
Figure 298 - 26 S45D8+2 BR45_120percL=1.6
Figure 299 - 26 S45D8+2 BR45_120percL=1.8
Figure 300 - 27 S3D6+1 BR30_80percL=1.2
32.4 32.6 32.8 33 33.2 33.4 33.60
5
10
15
20
25
30
35
40
45
50
Time (ms)
Pre
ssur
e (
psi
g)
Speed: (m/s)1-2: 570.72-3: 623.83-4: 638.6Avg: 611.0T
R 1(us): 210.2
TR 2(us): 153.4
TR 3(us): 113.6
TR 4(us): 14.2
Max P1: 44.0Max P2: 47.2Max P3: 41.5Max P4: 36.3
Sensor 1
Sensor 2
Sensor 3
Sensor 4
51.8 52 52.2 52.4 52.6 52.8 530
10
20
30
40
50
60
70
Time (ms)
Pre
ssur
e (
psi
g)
Speed: (m/s)1-2: 638.62-3: 638.63-4: 687.8Avg: 655.0T
R 1(us): 261.4
TR 2(us): 352.3
TR 3(us): 227.3
TR 4(us): 252.8
Max P1: 48.6Max P2: 57.3Max P3: 60.4Max P4: 53.5
Sensor 1
Sensor 2
Sensor 3
Sensor 4
38.2 38.4 38.6 38.8 39 39.2 39.4-20
0
20
40
60
80
100
Time (ms)
Pre
ssur
e (
psi
g)
Speed: (m/s)1-2: 670.62-3: 766.43-4: 812.8Avg: 749.9T
R 1(us): 136.4
TR 2(us): 90.9
TR 3(us): 127.8
TR 4(us): 11.4
Max P1: 92.3Max P2: 92.8Max P3: 86.7Max P4: 71.2
Sensor 1
Sensor 2
Sensor 3
Sensor 4
34.4 34.6 34.8 35 35.2 35.4 35.60
10
20
30
40
50
60
70
80
90
Time (ms)
Pre
ssur
e (
psi
g)
Speed: (m/s)1-2: 705.92-3: 788.93-4: 766.4Avg: 753.7T
R 1(us): 139.2
TR 2(us): 11.4
TR 3(us): 125.0
TR 4(us): 8.5
Max P1: 79.7Max P2: 82.1Max P3: 71.3Max P4: 75.2
Sensor 1
Sensor 2
Sensor 3
Sensor 4
30.6 30.8 31 31.2 31.4 31.6 31.80
10
20
30
40
50
60
70
Time (ms)
Pre
ssur
e (
psi
g)
Speed: (m/s)1-2: 654.22-3: 687.83-4: 766.4Avg: 702.8T
R 1(us): 79.5
TR 2(us): 340.9
TR 3(us): 147.7
TR 4(us): 11.4
Max P1: 64.6Max P2: 59.2Max P3: 65.1Max P4: 58.4
Sensor 1
Sensor 2
Sensor 3
Sensor 4
37.2 37.4 37.6 37.8 38 38.2 38.40
5
10
15
20
25
30
Time (ms)
Pre
ssur
e (
psi
g)
Speed: (m/s)1-2: 687.82-3: 558.83-4: 623.8Avg: 623.4T
R 1(us): 497.2
TR 2(us): 414.8
TR 3(us): 465.9
TR 4(us): 468.8
Max P1: 23.6Max P2: 23.9Max P3: 27.5Max P4: 26.0
Sensor 1
Sensor 2
Sensor 3
Sensor 4
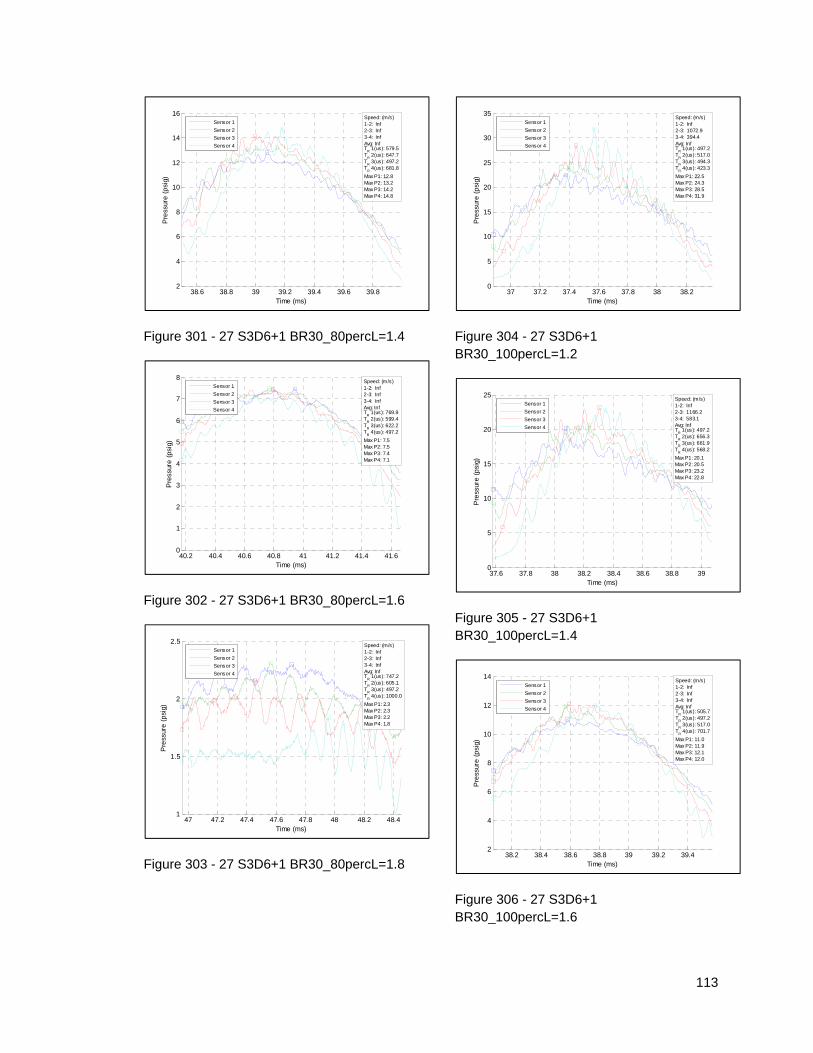
113
Figure 301 - 27 S3D6+1 BR30_80percL=1.4
Figure 302 - 27 S3D6+1 BR30_80percL=1.6
Figure 303 - 27 S3D6+1 BR30_80percL=1.8
Figure 304 - 27 S3D6+1 BR30_100percL=1.2
Figure 305 - 27 S3D6+1 BR30_100percL=1.4
Figure 306 - 27 S3D6+1 BR30_100percL=1.6
38.6 38.8 39 39.2 39.4 39.6 39.82
4
6
8
10
12
14
16
Time (ms)
Pre
ssur
e (
psi
g)
Speed: (m/s)1-2: Inf2-3: Inf3-4: InfAvg: InfT
R 1(us): 579.5
TR 2(us): 647.7
TR 3(us): 497.2
TR 4(us): 681.8
Max P1: 12.8Max P2: 13.2Max P3: 14.2Max P4: 14.8
Sensor 1
Sensor 2
Sensor 3
Sensor 4
40.2 40.4 40.6 40.8 41 41.2 41.4 41.60
1
2
3
4
5
6
7
8
Time (ms)
Pre
ssur
e (
psi
g)
Speed: (m/s)1-2: Inf2-3: Inf3-4: InfAvg: InfT
R 1(us): 769.9
TR 2(us): 599.4
TR 3(us): 622.2
TR 4(us): 497.2
Max P1: 7.5Max P2: 7.5Max P3: 7.4Max P4: 7.1
Sensor 1
Sensor 2
Sensor 3
Sensor 4
47 47.2 47.4 47.6 47.8 48 48.2 48.41
1.5
2
2.5
Time (ms)
Pre
ssur
e (
psi
g)
Speed: (m/s)1-2: Inf2-3: Inf3-4: InfAvg: InfT
R 1(us): 747.2
TR 2(us): 605.1
TR 3(us): 497.2
TR 4(us): 1000.0
Max P1: 2.3Max P2: 2.3Max P3: 2.2Max P4: 1.8
Sensor 1
Sensor 2
Sensor 3
Sensor 4
37 37.2 37.4 37.6 37.8 38 38.20
5
10
15
20
25
30
35
Time (ms)
Pre
ssur
e (
psi
g)
Speed: (m/s)1-2: Inf2-3: 1072.93-4: 394.4Avg: InfT
R 1(us): 497.2
TR 2(us): 517.0
TR 3(us): 494.3
TR 4(us): 423.3
Max P1: 22.5Max P2: 24.3Max P3: 28.5Max P4: 31.9
Sensor 1
Sensor 2
Sensor 3
Sensor 4
37.6 37.8 38 38.2 38.4 38.6 38.8 390
5
10
15
20
25
Time (ms)
Pre
ssur
e (
psi
g)
Speed: (m/s)1-2: Inf2-3: 1166.23-4: 583.1Avg: InfT
R 1(us): 497.2
TR 2(us): 656.3
TR 3(us): 661.9
TR 4(us): 568.2
Max P1: 20.1Max P2: 20.5Max P3: 23.2Max P4: 22.8
Sensor 1
Sensor 2
Sensor 3
Sensor 4
38.2 38.4 38.6 38.8 39 39.2 39.42
4
6
8
10
12
14
Time (ms)
Pre
ssur
e (
psi
g)
Speed: (m/s)1-2: Inf2-3: Inf3-4: InfAvg: InfT
R 1(us): 505.7
TR 2(us): 497.2
TR 3(us): 517.0
TR 4(us): 701.7
Max P1: 11.0Max P2: 11.9Max P3: 12.1Max P4: 12.0
Sensor 1
Sensor 2
Sensor 3
Sensor 4
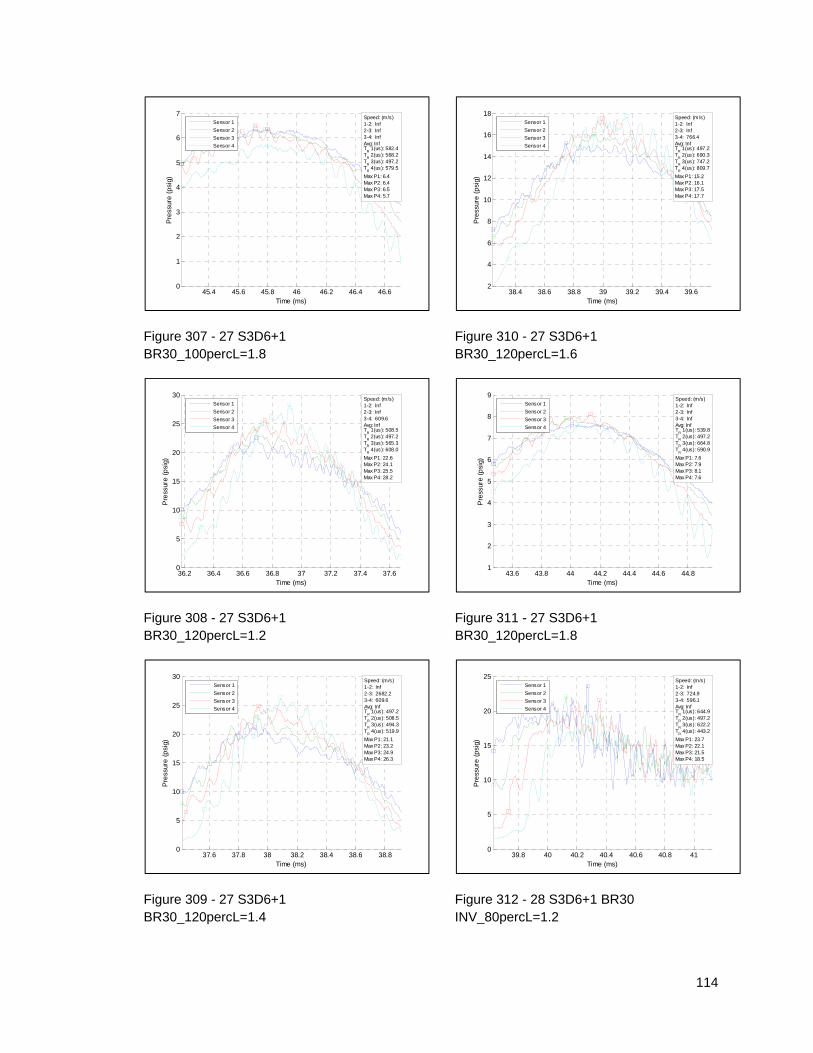
114
Figure 307 - 27 S3D6+1 BR30_100percL=1.8
Figure 308 - 27 S3D6+1 BR30_120percL=1.2
Figure 309 - 27 S3D6+1 BR30_120percL=1.4
Figure 310 - 27 S3D6+1 BR30_120percL=1.6
Figure 311 - 27 S3D6+1 BR30_120percL=1.8
Figure 312 - 28 S3D6+1 BR30 INV_80percL=1.2
45.4 45.6 45.8 46 46.2 46.4 46.60
1
2
3
4
5
6
7
Time (ms)
Pre
ssur
e (
psi
g)
Speed: (m/s)1-2: Inf2-3: Inf3-4: InfAvg: InfT
R 1(us): 582.4
TR 2(us): 568.2
TR 3(us): 497.2
TR 4(us): 579.5
Max P1: 6.4Max P2: 6.4Max P3: 6.5Max P4: 5.7
Sensor 1
Sensor 2
Sensor 3
Sensor 4
36.2 36.4 36.6 36.8 37 37.2 37.4 37.60
5
10
15
20
25
30
Time (ms)
Pre
ssur
e (
psi
g)
Speed: (m/s)1-2: Inf2-3: Inf3-4: 609.6Avg: InfT
R 1(us): 508.5
TR 2(us): 497.2
TR 3(us): 565.3
TR 4(us): 608.0
Max P1: 22.6Max P2: 24.1Max P3: 25.5Max P4: 28.2
Sensor 1
Sensor 2
Sensor 3
Sensor 4
37.6 37.8 38 38.2 38.4 38.6 38.80
5
10
15
20
25
30
Time (ms)
Pre
ssur
e (
psi
g)
Speed: (m/s)1-2: Inf2-3: 2682.23-4: 609.6Avg: InfT
R 1(us): 497.2
TR 2(us): 508.5
TR 3(us): 494.3
TR 4(us): 519.9
Max P1: 21.1Max P2: 23.2Max P3: 24.9Max P4: 26.3
Sensor 1
Sensor 2
Sensor 3
Sensor 4
38.4 38.6 38.8 39 39.2 39.4 39.62
4
6
8
10
12
14
16
18
Time (ms)
Pre
ssur
e (
psi
g)
Speed: (m/s)1-2: Inf2-3: Inf3-4: 766.4Avg: InfT
R 1(us): 497.2
TR 2(us): 690.3
TR 3(us): 747.2
TR 4(us): 809.7
Max P1: 15.2Max P2: 16.1Max P3: 17.5Max P4: 17.7
Sensor 1
Sensor 2
Sensor 3
Sensor 4
43.6 43.8 44 44.2 44.4 44.6 44.81
2
3
4
5
6
7
8
9
Time (ms)
Pre
ssur
e (
psi
g)
Speed: (m/s)1-2: Inf2-3: Inf3-4: InfAvg: InfT
R 1(us): 539.8
TR 2(us): 497.2
TR 3(us): 664.8
TR 4(us): 590.9
Max P1: 7.6Max P2: 7.9Max P3: 8.1Max P4: 7.6
Sensor 1
Sensor 2
Sensor 3
Sensor 4
39.8 40 40.2 40.4 40.6 40.8 410
5
10
15
20
25
Time (ms)
Pre
ssur
e (
psi
g)
Speed: (m/s)1-2: Inf2-3: 724.93-4: 596.1Avg: InfT
R 1(us): 644.9
TR 2(us): 497.2
TR 3(us): 622.2
TR 4(us): 443.2
Max P1: 23.7Max P2: 22.1Max P3: 21.5Max P4: 18.5
Sensor 1
Sensor 2
Sensor 3
Sensor 4
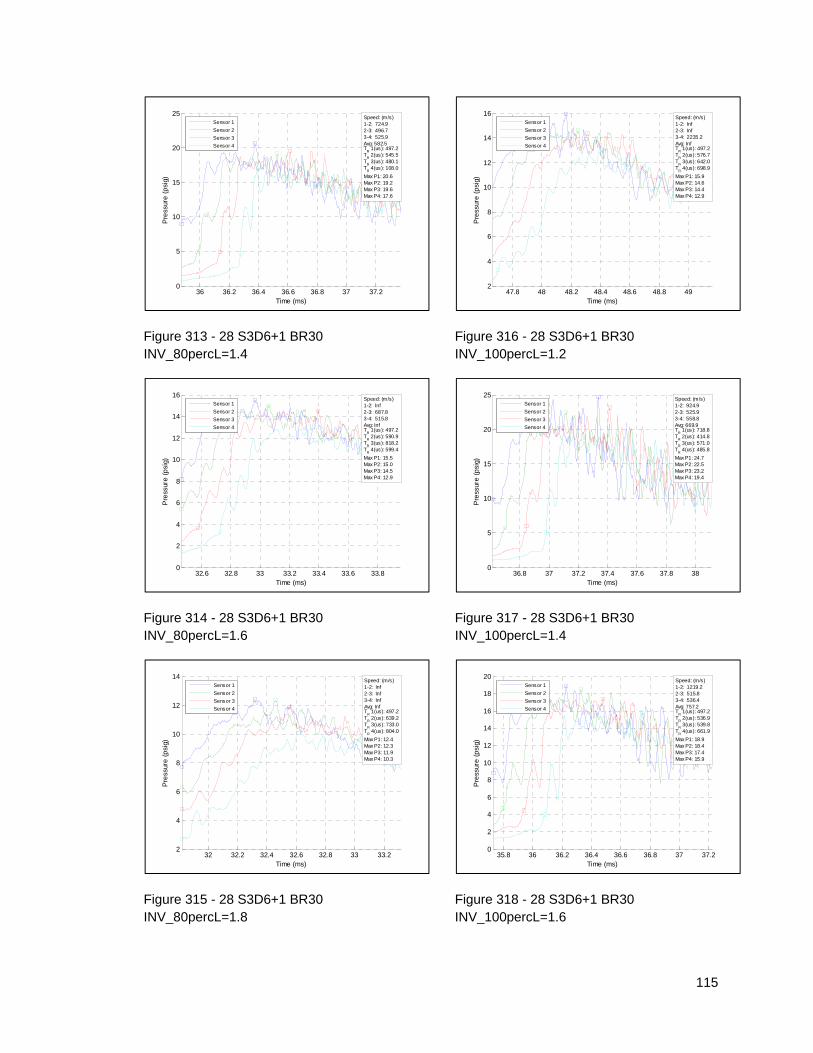
115
Figure 313 - 28 S3D6+1 BR30 INV_80percL=1.4
Figure 314 - 28 S3D6+1 BR30 INV_80percL=1.6
Figure 315 - 28 S3D6+1 BR30 INV_80percL=1.8
Figure 316 - 28 S3D6+1 BR30 INV_100percL=1.2
Figure 317 - 28 S3D6+1 BR30 INV_100percL=1.4
Figure 318 - 28 S3D6+1 BR30 INV_100percL=1.6
36 36.2 36.4 36.6 36.8 37 37.20
5
10
15
20
25
Time (ms)
Pre
ssur
e (
psi
g)
Speed: (m/s)1-2: 724.92-3: 496.73-4: 525.9Avg: 582.5T
R 1(us): 497.2
TR 2(us): 545.5
TR 3(us): 480.1
TR 4(us): 108.0
Max P1: 20.6Max P2: 19.2Max P3: 19.6Max P4: 17.6
Sensor 1
Sensor 2
Sensor 3
Sensor 4
32.6 32.8 33 33.2 33.4 33.6 33.80
2
4
6
8
10
12
14
16
Time (ms)
Pre
ssur
e (
psi
g)
Speed: (m/s)1-2: Inf2-3: 687.83-4: 515.8Avg: InfT
R 1(us): 497.2
TR 2(us): 590.9
TR 3(us): 818.2
TR 4(us): 599.4
Max P1: 15.5Max P2: 15.0Max P3: 14.5Max P4: 12.9
Sensor 1
Sensor 2
Sensor 3
Sensor 4
32 32.2 32.4 32.6 32.8 33 33.22
4
6
8
10
12
14
Time (ms)
Pre
ssur
e (
psi
g)
Speed: (m/s)1-2: Inf2-3: Inf3-4: InfAvg: InfT
R 1(us): 497.2
TR 2(us): 639.2
TR 3(us): 733.0
TR 4(us): 804.0
Max P1: 12.4Max P2: 12.3Max P3: 11.9Max P4: 10.3
Sensor 1
Sensor 2
Sensor 3
Sensor 4
47.8 48 48.2 48.4 48.6 48.8 492
4
6
8
10
12
14
16
Time (ms)
Pre
ssur
e (
psi
g)
Speed: (m/s)1-2: Inf2-3: Inf3-4: 2235.2Avg: InfT
R 1(us): 497.2
TR 2(us): 576.7
TR 3(us): 642.0
TR 4(us): 698.9
Max P1: 15.9Max P2: 14.6Max P3: 14.4Max P4: 12.9
Sensor 1
Sensor 2
Sensor 3
Sensor 4
36.8 37 37.2 37.4 37.6 37.8 380
5
10
15
20
25
Time (ms)
Pre
ssur
e (
psi
g)
Speed: (m/s)1-2: 924.92-3: 525.93-4: 558.8Avg: 669.9T
R 1(us): 718.8
TR 2(us): 414.8
TR 3(us): 571.0
TR 4(us): 485.8
Max P1: 24.7Max P2: 22.5Max P3: 23.2Max P4: 19.4
Sensor 1
Sensor 2
Sensor 3
Sensor 4
35.8 36 36.2 36.4 36.6 36.8 37 37.20
2
4
6
8
10
12
14
16
18
20
Time (ms)
Pre
ssur
e (
psi
g)
Speed: (m/s)1-2: 1219.22-3: 515.83-4: 536.4Avg: 757.2T
R 1(us): 497.2
TR 2(us): 536.9
TR 3(us): 539.8
TR 4(us): 661.9
Max P1: 18.9Max P2: 18.4Max P3: 17.4Max P4: 15.9
Sensor 1
Sensor 2
Sensor 3
Sensor 4
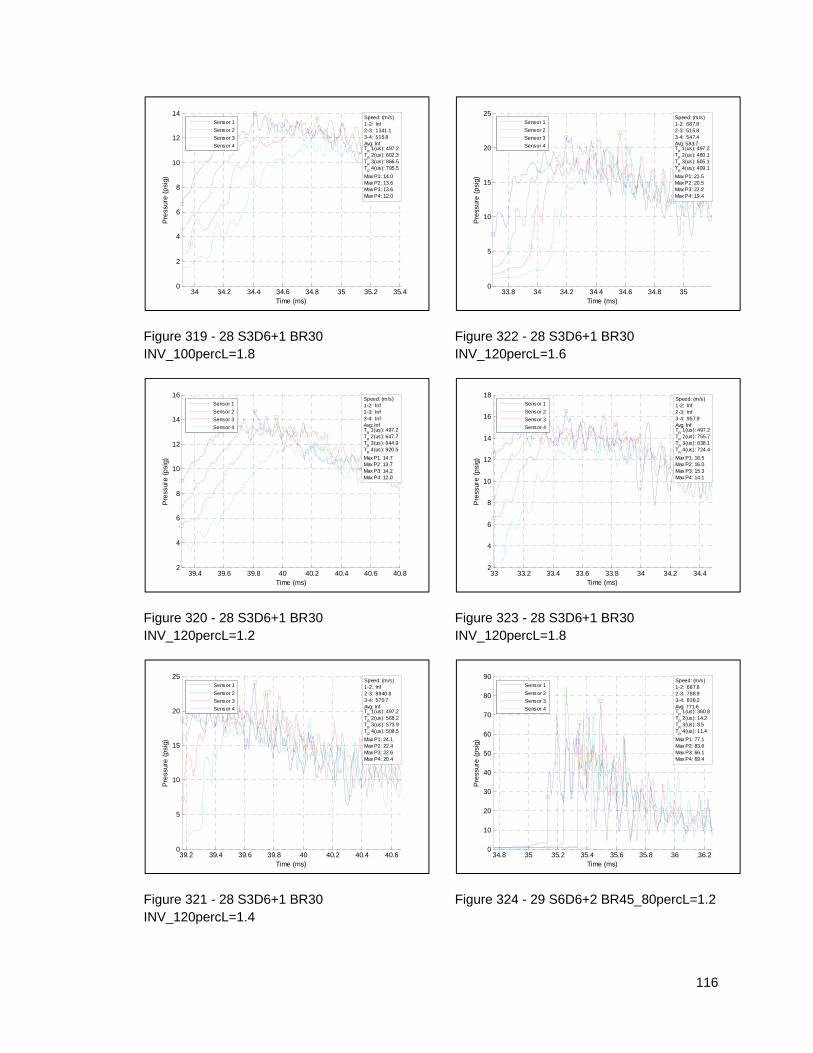
116
Figure 319 - 28 S3D6+1 BR30 INV_100percL=1.8
Figure 320 - 28 S3D6+1 BR30 INV_120percL=1.2
Figure 321 - 28 S3D6+1 BR30 INV_120percL=1.4
Figure 322 - 28 S3D6+1 BR30 INV_120percL=1.6
Figure 323 - 28 S3D6+1 BR30 INV_120percL=1.8
Figure 324 - 29 S6D6+2 BR45_80percL=1.2
34 34.2 34.4 34.6 34.8 35 35.2 35.40
2
4
6
8
10
12
14
Time (ms)
Pre
ssur
e (
psi
g)
Speed: (m/s)1-2: Inf2-3: 1341.13-4: 515.8Avg: InfT
R 1(us): 497.2
TR 2(us): 602.3
TR 3(us): 866.5
TR 4(us): 795.5
Max P1: 14.0Max P2: 13.6Max P3: 13.6Max P4: 12.0
Sensor 1
Sensor 2
Sensor 3
Sensor 4
39.4 39.6 39.8 40 40.2 40.4 40.6 40.82
4
6
8
10
12
14
16
Time (ms)
Pre
ssur
e (
psi
g)
Speed: (m/s)1-2: Inf2-3: Inf3-4: InfAvg: InfT
R 1(us): 497.2
TR 2(us): 647.7
TR 3(us): 644.9
TR 4(us): 920.5
Max P1: 14.7Max P2: 13.7Max P3: 14.2Max P4: 12.0
Sensor 1
Sensor 2
Sensor 3
Sensor 4
39.2 39.4 39.6 39.8 40 40.2 40.4 40.60
5
10
15
20
25
Time (ms)
Pre
ssur
e (
psi
g)
Speed: (m/s)1-2: Inf2-3: 8940.83-4: 570.7Avg: InfT
R 1(us): 497.2
TR 2(us): 568.2
TR 3(us): 573.9
TR 4(us): 508.5
Max P1: 24.1Max P2: 22.4Max P3: 22.6Max P4: 20.4
Sensor 1
Sensor 2
Sensor 3
Sensor 4
33.8 34 34.2 34.4 34.6 34.8 350
5
10
15
20
25
Time (ms)
Pre
ssur
e (
psi
g)
Speed: (m/s)1-2: 687.82-3: 515.83-4: 547.4Avg: 583.7T
R 1(us): 497.2
TR 2(us): 480.1
TR 3(us): 605.1
TR 4(us): 409.1
Max P1: 21.5Max P2: 20.5Max P3: 22.2Max P4: 19.4
Sensor 1
Sensor 2
Sensor 3
Sensor 4
33 33.2 33.4 33.6 33.8 34 34.2 34.42
4
6
8
10
12
14
16
18
Time (ms)
Pre
ssur
e (
psi
g)
Speed: (m/s)1-2: Inf2-3: Inf3-4: 957.9Avg: InfT
R 1(us): 497.2
TR 2(us): 755.7
TR 3(us): 838.1
TR 4(us): 724.4
Max P1: 16.5Max P2: 16.0Max P3: 15.3Max P4: 14.1
Sensor 1
Sensor 2
Sensor 3
Sensor 4
34.8 35 35.2 35.4 35.6 35.8 36 36.20
10
20
30
40
50
60
70
80
90
Time (ms)
Pre
ssur
e (
psi
g)
Speed: (m/s)1-2: 687.82-3: 788.93-4: 838.2Avg: 771.6T
R 1(us): 360.8
TR 2(us): 14.2
TR 3(us): 8.5
TR 4(us): 11.4
Max P1: 77.1Max P2: 83.6Max P3: 66.1Max P4: 69.4
Sensor 1
Sensor 2
Sensor 3
Sensor 4
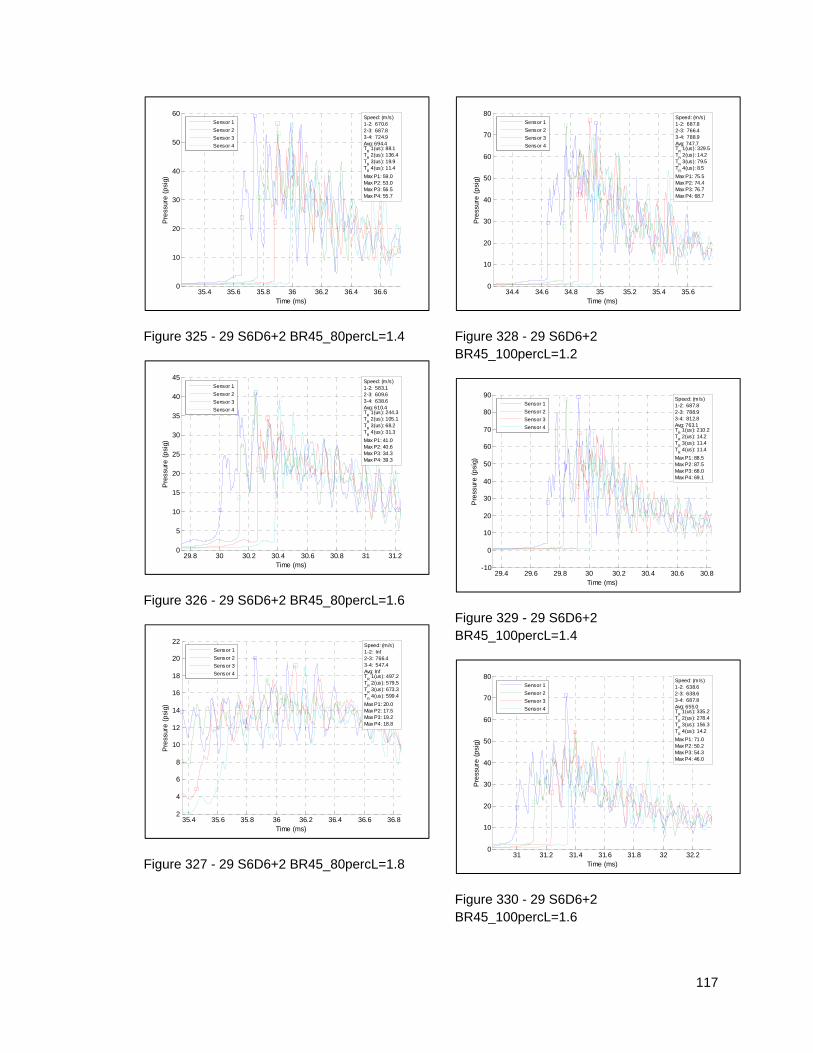
117
Figure 325 - 29 S6D6+2 BR45_80percL=1.4
Figure 326 - 29 S6D6+2 BR45_80percL=1.6
Figure 327 - 29 S6D6+2 BR45_80percL=1.8
Figure 328 - 29 S6D6+2 BR45_100percL=1.2
Figure 329 - 29 S6D6+2 BR45_100percL=1.4
Figure 330 - 29 S6D6+2 BR45_100percL=1.6
35.4 35.6 35.8 36 36.2 36.4 36.60
10
20
30
40
50
60
Time (ms)
Pre
ssur
e (
psi
g)
Speed: (m/s)1-2: 670.62-3: 687.83-4: 724.9Avg: 694.4T
R 1(us): 88.1
TR 2(us): 136.4
TR 3(us): 19.9
TR 4(us): 11.4
Max P1: 59.0Max P2: 53.0Max P3: 56.5Max P4: 55.7
Sensor 1
Sensor 2
Sensor 3
Sensor 4
29.8 30 30.2 30.4 30.6 30.8 31 31.20
5
10
15
20
25
30
35
40
45
Time (ms)
Pre
ssur
e (
psi
g)
Speed: (m/s)1-2: 583.12-3: 609.63-4: 638.6Avg: 610.4T
R 1(us): 244.3
TR 2(us): 105.1
TR 3(us): 68.2
TR 4(us): 31.3
Max P1: 41.0Max P2: 40.6Max P3: 34.3Max P4: 39.3
Sensor 1
Sensor 2
Sensor 3
Sensor 4
35.4 35.6 35.8 36 36.2 36.4 36.6 36.82
4
6
8
10
12
14
16
18
20
22
Time (ms)
Pre
ssur
e (
psi
g)
Speed: (m/s)1-2: Inf2-3: 766.43-4: 547.4Avg: InfT
R 1(us): 497.2
TR 2(us): 579.5
TR 3(us): 673.3
TR 4(us): 599.4
Max P1: 20.0Max P2: 17.5Max P3: 19.2Max P4: 18.8
Sensor 1
Sensor 2
Sensor 3
Sensor 4
34.4 34.6 34.8 35 35.2 35.4 35.60
10
20
30
40
50
60
70
80
Time (ms)
Pre
ssur
e (
psi
g)
Speed: (m/s)1-2: 687.82-3: 766.43-4: 788.9Avg: 747.7T
R 1(us): 329.5
TR 2(us): 14.2
TR 3(us): 79.5
TR 4(us): 8.5
Max P1: 75.5Max P2: 74.4Max P3: 76.7Max P4: 68.7
Sensor 1
Sensor 2
Sensor 3
Sensor 4
29.4 29.6 29.8 30 30.2 30.4 30.6 30.8-10
0
10
20
30
40
50
60
70
80
90
Time (ms)
Pre
ssur
e (
psi
g)
Speed: (m/s)1-2: 687.82-3: 788.93-4: 812.8Avg: 763.1T
R 1(us): 210.2
TR 2(us): 14.2
TR 3(us): 11.4
TR 4(us): 11.4
Max P1: 88.5Max P2: 87.5Max P3: 68.0Max P4: 69.1
Sensor 1
Sensor 2
Sensor 3
Sensor 4
31 31.2 31.4 31.6 31.8 32 32.20
10
20
30
40
50
60
70
80
Time (ms)
Pre
ssur
e (
psi
g)
Speed: (m/s)1-2: 638.62-3: 638.63-4: 687.8Avg: 655.0T
R 1(us): 335.2
TR 2(us): 278.4
TR 3(us): 156.3
TR 4(us): 14.2
Max P1: 71.0Max P2: 50.2Max P3: 54.3Max P4: 46.0
Sensor 1
Sensor 2
Sensor 3
Sensor 4
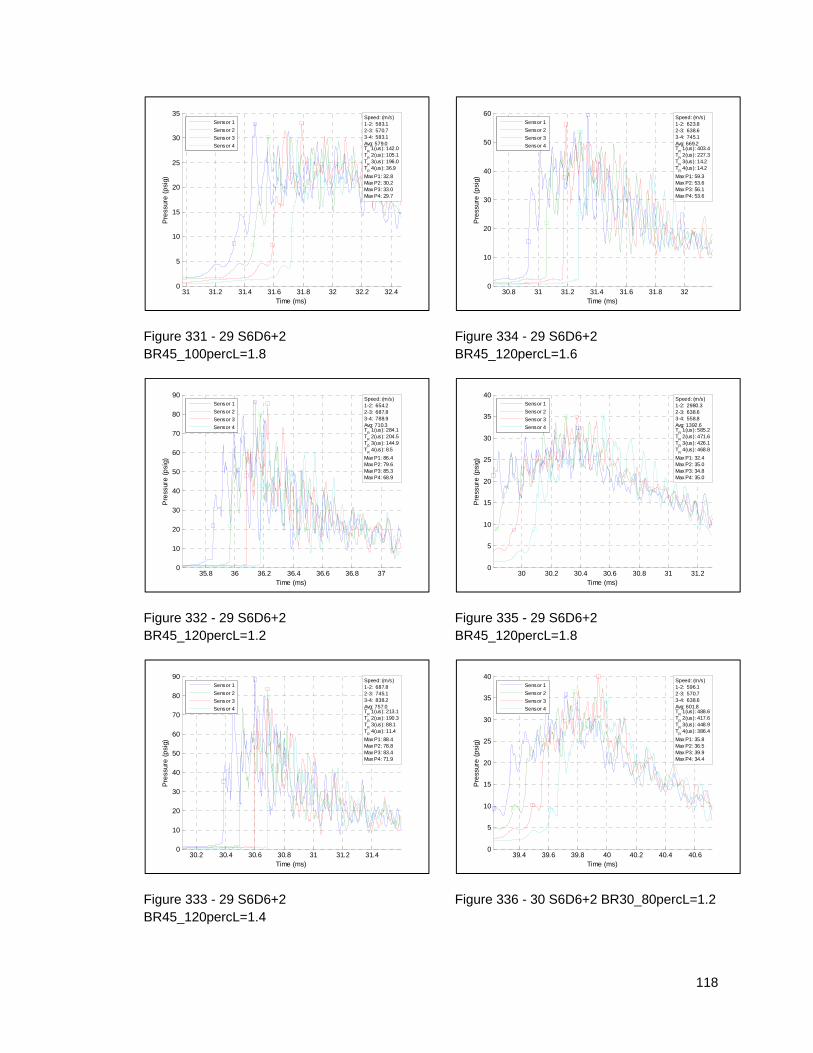
118
Figure 331 - 29 S6D6+2 BR45_100percL=1.8
Figure 332 - 29 S6D6+2 BR45_120percL=1.2
Figure 333 - 29 S6D6+2 BR45_120percL=1.4
Figure 334 - 29 S6D6+2 BR45_120percL=1.6
Figure 335 - 29 S6D6+2 BR45_120percL=1.8
Figure 336 - 30 S6D6+2 BR30_80percL=1.2
31 31.2 31.4 31.6 31.8 32 32.2 32.40
5
10
15
20
25
30
35
Time (ms)
Pre
ssur
e (
psi
g)
Speed: (m/s)1-2: 583.12-3: 570.73-4: 583.1Avg: 579.0T
R 1(us): 142.0
TR 2(us): 105.1
TR 3(us): 196.0
TR 4(us): 36.9
Max P1: 32.8Max P2: 30.2Max P3: 33.0Max P4: 29.7
Sensor 1
Sensor 2
Sensor 3
Sensor 4
35.8 36 36.2 36.4 36.6 36.8 370
10
20
30
40
50
60
70
80
90
Time (ms)
Pre
ssur
e (
psi
g)
Speed: (m/s)1-2: 654.22-3: 687.83-4: 788.9Avg: 710.3T
R 1(us): 284.1
TR 2(us): 204.5
TR 3(us): 144.9
TR 4(us): 8.5
Max P1: 86.4Max P2: 79.6Max P3: 85.3Max P4: 68.9
Sensor 1
Sensor 2
Sensor 3
Sensor 4
30.2 30.4 30.6 30.8 31 31.2 31.40
10
20
30
40
50
60
70
80
90
Time (ms)
Pre
ssur
e (
psi
g)
Speed: (m/s)1-2: 687.82-3: 745.13-4: 838.2Avg: 757.0T
R 1(us): 213.1
TR 2(us): 190.3
TR 3(us): 88.1
TR 4(us): 11.4
Max P1: 88.4Max P2: 78.8Max P3: 83.4Max P4: 71.9
Sensor 1
Sensor 2
Sensor 3
Sensor 4
30.8 31 31.2 31.4 31.6 31.8 320
10
20
30
40
50
60
Time (ms)
Pre
ssur
e (
psi
g)
Speed: (m/s)1-2: 623.82-3: 638.63-4: 745.1Avg: 669.2T
R 1(us): 403.4
TR 2(us): 227.3
TR 3(us): 14.2
TR 4(us): 14.2
Max P1: 59.3Max P2: 53.6Max P3: 56.1Max P4: 53.6
Sensor 1
Sensor 2
Sensor 3
Sensor 4
30 30.2 30.4 30.6 30.8 31 31.20
5
10
15
20
25
30
35
40
Time (ms)
Pre
ssur
e (
psi
g)
Speed: (m/s)1-2: 2980.32-3: 638.63-4: 558.8Avg: 1392.6T
R 1(us): 585.2
TR 2(us): 471.6
TR 3(us): 426.1
TR 4(us): 468.8
Max P1: 32.4Max P2: 35.0Max P3: 34.8Max P4: 35.0
Sensor 1
Sensor 2
Sensor 3
Sensor 4
39.4 39.6 39.8 40 40.2 40.4 40.60
5
10
15
20
25
30
35
40
Time (ms)
Pre
ssur
e (
psi
g)
Speed: (m/s)1-2: 596.12-3: 570.73-4: 638.6Avg: 601.8T
R 1(us): 488.6
TR 2(us): 417.6
TR 3(us): 448.9
TR 4(us): 386.4
Max P1: 35.8Max P2: 36.5Max P3: 39.9Max P4: 34.4
Sensor 1
Sensor 2
Sensor 3
Sensor 4
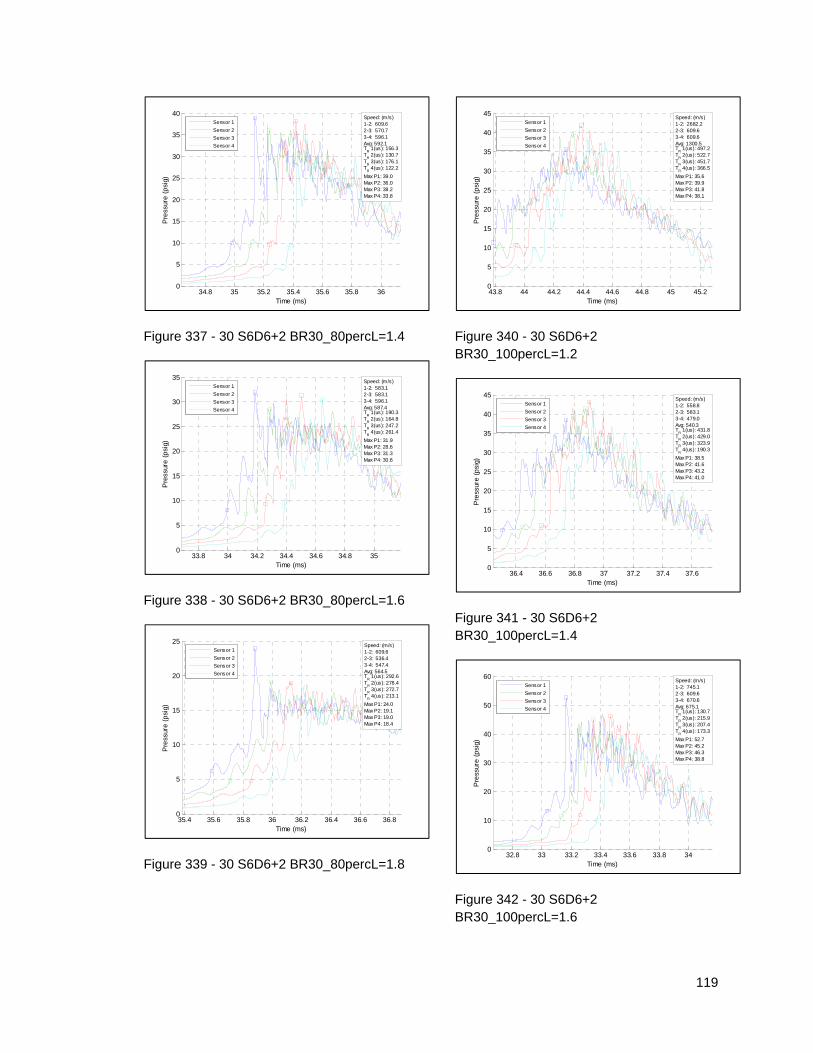
119
Figure 337 - 30 S6D6+2 BR30_80percL=1.4
Figure 338 - 30 S6D6+2 BR30_80percL=1.6
Figure 339 - 30 S6D6+2 BR30_80percL=1.8
Figure 340 - 30 S6D6+2 BR30_100percL=1.2
Figure 341 - 30 S6D6+2 BR30_100percL=1.4
Figure 342 - 30 S6D6+2 BR30_100percL=1.6
34.8 35 35.2 35.4 35.6 35.8 360
5
10
15
20
25
30
35
40
Time (ms)
Pre
ssur
e (
psi
g)
Speed: (m/s)1-2: 609.62-3: 570.73-4: 596.1Avg: 592.1T
R 1(us): 156.3
TR 2(us): 130.7
TR 3(us): 176.1
TR 4(us): 122.2
Max P1: 39.0Max P2: 36.0Max P3: 38.2Max P4: 33.8
Sensor 1
Sensor 2
Sensor 3
Sensor 4
33.8 34 34.2 34.4 34.6 34.8 350
5
10
15
20
25
30
35
Time (ms)
Pre
ssur
e (
psi
g)
Speed: (m/s)1-2: 583.12-3: 583.13-4: 596.1Avg: 587.4T
R 1(us): 190.3
TR 2(us): 164.8
TR 3(us): 247.2
TR 4(us): 261.4
Max P1: 31.9Max P2: 28.6Max P3: 31.3Max P4: 30.6
Sensor 1
Sensor 2
Sensor 3
Sensor 4
35.4 35.6 35.8 36 36.2 36.4 36.6 36.80
5
10
15
20
25
Time (ms)
Pre
ssur
e (
psi
g)
Speed: (m/s)1-2: 609.62-3: 536.43-4: 547.4Avg: 564.5T
R 1(us): 292.6
TR 2(us): 278.4
TR 3(us): 272.7
TR 4(us): 213.1
Max P1: 24.0Max P2: 19.1Max P3: 19.0Max P4: 18.4
Sensor 1
Sensor 2
Sensor 3
Sensor 4
43.8 44 44.2 44.4 44.6 44.8 45 45.20
5
10
15
20
25
30
35
40
45
Time (ms)
Pre
ssur
e (
psi
g)
Speed: (m/s)1-2: 2682.22-3: 609.63-4: 609.6Avg: 1300.5T
R 1(us): 497.2
TR 2(us): 522.7
TR 3(us): 451.7
TR 4(us): 366.5
Max P1: 35.6Max P2: 39.9Max P3: 41.8Max P4: 38.1
Sensor 1
Sensor 2
Sensor 3
Sensor 4
36.4 36.6 36.8 37 37.2 37.4 37.60
5
10
15
20
25
30
35
40
45
Time (ms)
Pre
ssur
e (
psi
g)
Speed: (m/s)1-2: 558.82-3: 583.13-4: 479.0Avg: 540.3T
R 1(us): 431.8
TR 2(us): 429.0
TR 3(us): 323.9
TR 4(us): 190.3
Max P1: 38.5Max P2: 41.6Max P3: 43.2Max P4: 41.0
Sensor 1
Sensor 2
Sensor 3
Sensor 4
32.8 33 33.2 33.4 33.6 33.8 340
10
20
30
40
50
60
Time (ms)
Pre
ssur
e (
psi
g)
Speed: (m/s)1-2: 745.12-3: 609.63-4: 670.6Avg: 675.1T
R 1(us): 130.7
TR 2(us): 215.9
TR 3(us): 207.4
TR 4(us): 173.3
Max P1: 52.7Max P2: 45.2Max P3: 46.3Max P4: 38.8
Sensor 1
Sensor 2
Sensor 3
Sensor 4
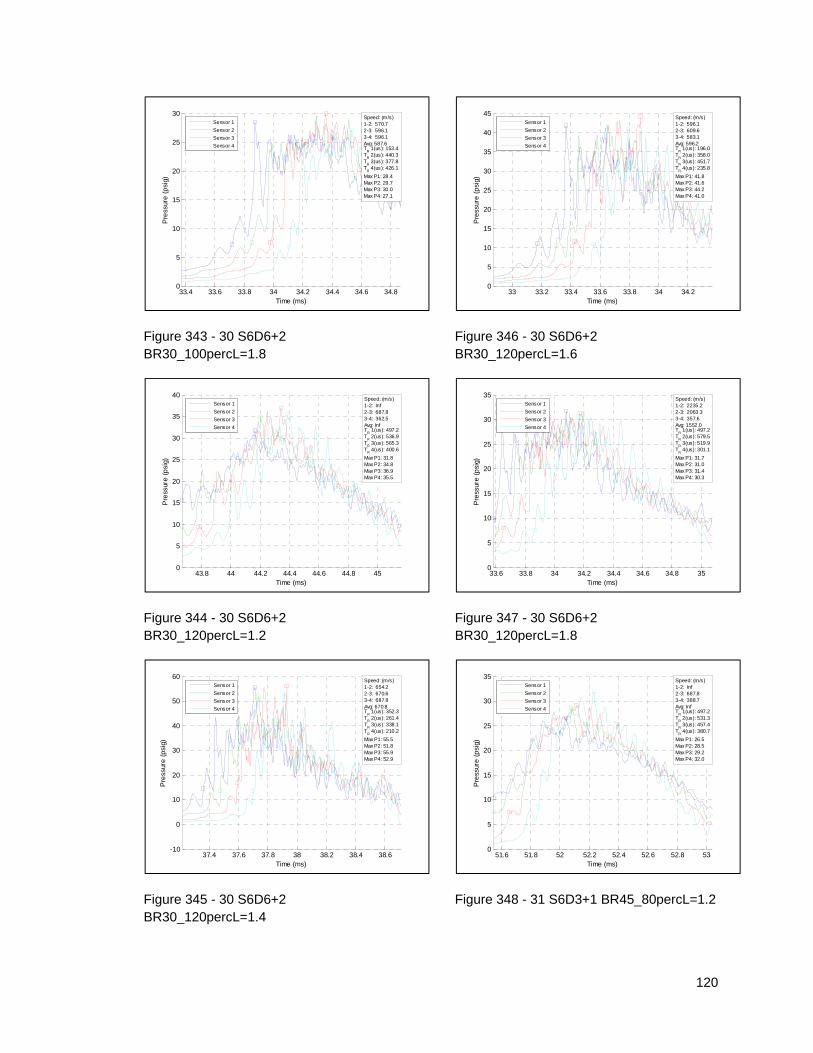
120
Figure 343 - 30 S6D6+2 BR30_100percL=1.8
Figure 344 - 30 S6D6+2 BR30_120percL=1.2
Figure 345 - 30 S6D6+2 BR30_120percL=1.4
Figure 346 - 30 S6D6+2 BR30_120percL=1.6
Figure 347 - 30 S6D6+2 BR30_120percL=1.8
Figure 348 - 31 S6D3+1 BR45_80percL=1.2
33.4 33.6 33.8 34 34.2 34.4 34.6 34.80
5
10
15
20
25
30
Time (ms)
Pre
ssur
e (
psi
g)
Speed: (m/s)1-2: 570.72-3: 596.13-4: 596.1Avg: 587.6T
R 1(us): 153.4
TR 2(us): 440.3
TR 3(us): 377.8
TR 4(us): 426.1
Max P1: 28.4Max P2: 29.7Max P3: 30.0Max P4: 27.1
Sensor 1
Sensor 2
Sensor 3
Sensor 4
43.8 44 44.2 44.4 44.6 44.8 450
5
10
15
20
25
30
35
40
Time (ms)
Pre
ssur
e (
psi
g)
Speed: (m/s)1-2: Inf2-3: 687.83-4: 362.5Avg: InfT
R 1(us): 497.2
TR 2(us): 536.9
TR 3(us): 565.3
TR 4(us): 400.6
Max P1: 31.8Max P2: 34.8Max P3: 36.9Max P4: 35.5
Sensor 1
Sensor 2
Sensor 3
Sensor 4
37.4 37.6 37.8 38 38.2 38.4 38.6-10
0
10
20
30
40
50
60
Time (ms)
Pre
ssur
e (
psi
g)
Speed: (m/s)1-2: 654.22-3: 670.63-4: 687.8Avg: 670.8T
R 1(us): 352.3
TR 2(us): 261.4
TR 3(us): 338.1
TR 4(us): 210.2
Max P1: 55.5Max P2: 51.8Max P3: 55.9Max P4: 52.9
Sensor 1
Sensor 2
Sensor 3
Sensor 4
33 33.2 33.4 33.6 33.8 34 34.20
5
10
15
20
25
30
35
40
45
Time (ms)
Pre
ssur
e (
psi
g)
Speed: (m/s)1-2: 596.12-3: 609.63-4: 583.1Avg: 596.2T
R 1(us): 196.0
TR 2(us): 358.0
TR 3(us): 451.7
TR 4(us): 235.8
Max P1: 41.8Max P2: 41.6Max P3: 44.2Max P4: 41.0
Sensor 1
Sensor 2
Sensor 3
Sensor 4
33.6 33.8 34 34.2 34.4 34.6 34.8 350
5
10
15
20
25
30
35
Time (ms)
Pre
ssur
e (
psi
g)
Speed: (m/s)1-2: 2235.22-3: 2063.33-4: 357.6Avg: 1552.0T
R 1(us): 497.2
TR 2(us): 579.5
TR 3(us): 519.9
TR 4(us): 301.1
Max P1: 31.7Max P2: 31.0Max P3: 31.4Max P4: 30.3
Sensor 1
Sensor 2
Sensor 3
Sensor 4
51.6 51.8 52 52.2 52.4 52.6 52.8 530
5
10
15
20
25
30
35
Time (ms)
Pre
ssur
e (
psi
g)
Speed: (m/s)1-2: Inf2-3: 687.83-4: 388.7Avg: InfT
R 1(us): 497.2
TR 2(us): 531.3
TR 3(us): 457.4
TR 4(us): 380.7
Max P1: 26.5Max P2: 28.5Max P3: 29.2Max P4: 32.0
Sensor 1
Sensor 2
Sensor 3
Sensor 4

121
Figure 349 - 31 S6D3+1 BR45_80percL=1.4
Figure 350 - 31 S6D3+1 BR45_80percL=1.6
Figure 351 - 31 S6D3+1 BR45_80percL=1.8
Figure 352 - 31 S6D3+1 BR45_100percL=1.2
Figure 353 - 31 S6D3+1 BR45_100percL=1.4
Figure 354 - 31 S6D3+1 BR45_100percL=1.6
40.6 40.8 41 41.2 41.4 41.6 41.80
5
10
15
20
25
30
Time (ms)
Pre
ssur
e (
psi
g)
Speed: (m/s)1-2: 2980.32-3: 558.83-4: 570.7Avg: 1369.9T
R 1(us): 497.2
TR 2(us): 514.2
TR 3(us): 437.5
TR 4(us): 483.0
Max P1: 22.0Max P2: 24.7Max P3: 25.3Max P4: 25.6
Sensor 1
Sensor 2
Sensor 3
Sensor 4
39.6 39.8 40 40.2 40.4 40.6 40.8 410
2
4
6
8
10
12
14
16
18
20
Time (ms)
Pre
ssur
e (
psi
g)
Speed: (m/s)1-2: Inf2-3: 26822.43-4: 547.4Avg: InfT
R 1(us): 514.2
TR 2(us): 497.2
TR 3(us): 548.3
TR 4(us): 463.1
Max P1: 16.8Max P2: 17.8Max P3: 18.4Max P4: 18.7
Sensor 1
Sensor 2
Sensor 3
Sensor 4
42.2 42.4 42.6 42.8 43 43.2 43.40
1
2
3
4
5
6
7
Time (ms)
Pre
ssur
e (
psi
g)
Speed: (m/s)1-2: Inf2-3: Inf3-4: InfAvg: InfT
R 1(us): 497.2
TR 2(us): 747.2
TR 3(us): 804.0
TR 4(us): 585.2
Max P1: 6.1Max P2: 6.0Max P3: 5.8Max P4: 5.1
Sensor 1
Sensor 2
Sensor 3
Sensor 4
53.8 54 54.2 54.4 54.6 54.8 550
5
10
15
20
25
30
Time (ms)
Pre
ssur
e (
psi
g)
Speed: (m/s)1-2: Inf2-3: 865.23-4: 525.9Avg: InfT
R 1(us): 497.2
TR 2(us): 656.3
TR 3(us): 571.0
TR 4(us): 494.3
Max P1: 21.3Max P2: 23.0Max P3: 25.7Max P4: 27.3
Sensor 1
Sensor 2
Sensor 3
Sensor 4
39.8 40 40.2 40.4 40.6 40.8 410
5
10
15
20
25
30
35
Time (ms)
Pre
ssur
e (
psi
g)
Speed: (m/s)1-2: 623.82-3: 654.23-4: 623.8Avg: 633.9T
R 1(us): 480.1
TR 2(us): 437.5
TR 3(us): 505.7
TR 4(us): 409.1
Max P1: 27.1Max P2: 30.4Max P3: 33.4Max P4: 32.9
Sensor 1
Sensor 2
Sensor 3
Sensor 4
40.6 40.8 41 41.2 41.4 41.6 41.80
5
10
15
20
25
30
Time (ms)
Pre
ssur
e (
psi
g)
Speed: (m/s)1-2: Inf2-3: 1166.23-4: 583.1Avg: InfT
R 1(us): 497.2
TR 2(us): 536.9
TR 3(us): 500.0
TR 4(us): 423.3
Max P1: 21.7Max P2: 24.2Max P3: 26.0Max P4: 26.0
Sensor 1
Sensor 2
Sensor 3
Sensor 4
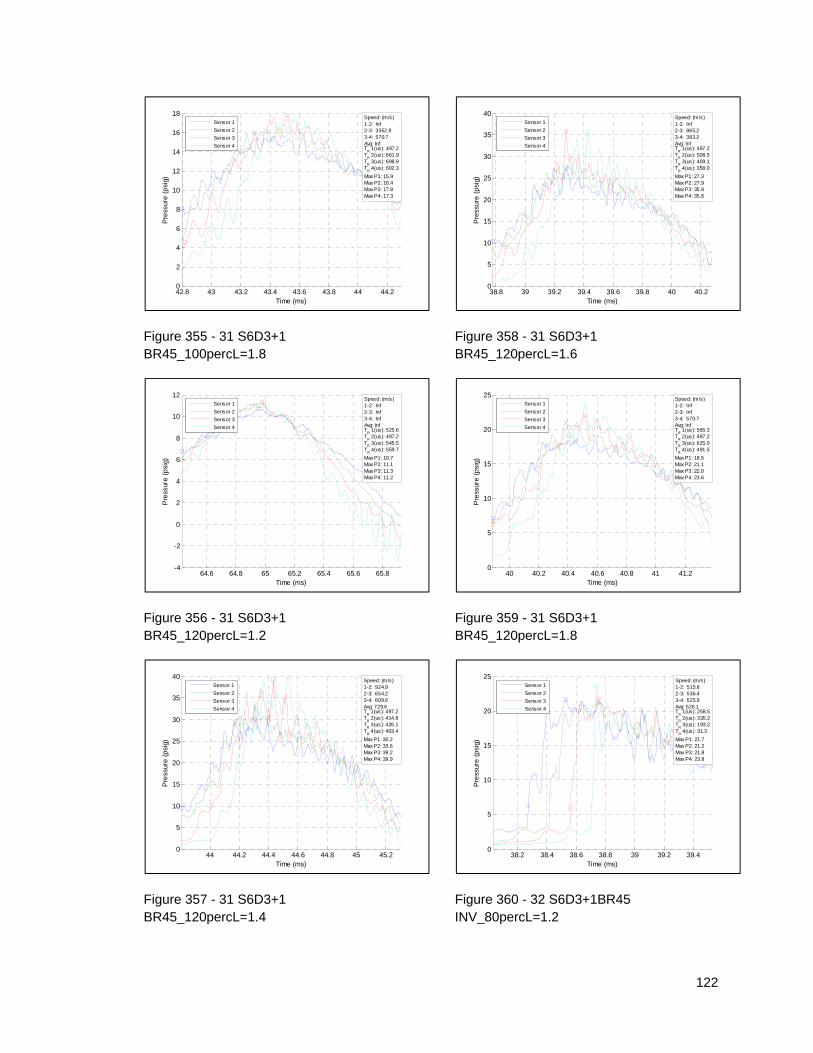
122
Figure 355 - 31 S6D3+1 BR45_100percL=1.8
Figure 356 - 31 S6D3+1 BR45_120percL=1.2
Figure 357 - 31 S6D3+1 BR45_120percL=1.4
Figure 358 - 31 S6D3+1 BR45_120percL=1.6
Figure 359 - 31 S6D3+1 BR45_120percL=1.8
Figure 360 - 32 S6D3+1BR45 INV_80percL=1.2
42.8 43 43.2 43.4 43.6 43.8 44 44.20
2
4
6
8
10
12
14
16
18
Time (ms)
Pre
ssur
e (
psi
g)
Speed: (m/s)1-2: Inf2-3: 3352.83-4: 570.7Avg: InfT
R 1(us): 497.2
TR 2(us): 661.9
TR 3(us): 698.9
TR 4(us): 602.3
Max P1: 15.9Max P2: 16.4Max P3: 17.8Max P4: 17.3
Sensor 1
Sensor 2
Sensor 3
Sensor 4
64.6 64.8 65 65.2 65.4 65.6 65.8-4
-2
0
2
4
6
8
10
12
Time (ms)
Pre
ssur
e (
psi
g)
Speed: (m/s)1-2: Inf2-3: Inf3-4: InfAvg: InfT
R 1(us): 525.6
TR 2(us): 497.2
TR 3(us): 545.5
TR 4(us): 559.7
Max P1: 10.7Max P2: 11.1Max P3: 11.3Max P4: 11.2
Sensor 1
Sensor 2
Sensor 3
Sensor 4
44 44.2 44.4 44.6 44.8 45 45.20
5
10
15
20
25
30
35
40
Time (ms)
Pre
ssur
e (
psi
g)
Speed: (m/s)1-2: 924.92-3: 654.23-4: 609.6Avg: 729.6T
R 1(us): 497.2
TR 2(us): 414.8
TR 3(us): 426.1
TR 4(us): 403.4
Max P1: 30.2Max P2: 33.6Max P3: 39.2Max P4: 39.9
Sensor 1
Sensor 2
Sensor 3
Sensor 4
38.8 39 39.2 39.4 39.6 39.8 40 40.20
5
10
15
20
25
30
35
40
Time (ms)
Pre
ssur
e (
psi
g)
Speed: (m/s)1-2: Inf2-3: 865.23-4: 383.2Avg: InfT
R 1(us): 497.2
TR 2(us): 508.5
TR 3(us): 409.1
TR 4(us): 358.0
Max P1: 27.3Max P2: 27.9Max P3: 35.9Max P4: 35.8
Sensor 1
Sensor 2
Sensor 3
Sensor 4
40 40.2 40.4 40.6 40.8 41 41.20
5
10
15
20
25
Time (ms)
Pre
ssur
e (
psi
g)
Speed: (m/s)1-2: Inf2-3: Inf3-4: 570.7Avg: InfT
R 1(us): 565.3
TR 2(us): 497.2
TR 3(us): 625.0
TR 4(us): 491.5
Max P1: 18.5Max P2: 21.1Max P3: 22.0Max P4: 23.6
Sensor 1
Sensor 2
Sensor 3
Sensor 4
38.2 38.4 38.6 38.8 39 39.2 39.40
5
10
15
20
25
Time (ms)
Pre
ssur
e (
psi
g)
Speed: (m/s)1-2: 515.82-3: 536.43-4: 525.9Avg: 526.1T
R 1(us): 258.5
TR 2(us): 335.2
TR 3(us): 193.2
TR 4(us): 31.3
Max P1: 21.7Max P2: 21.2Max P3: 21.8Max P4: 23.8
Sensor 1
Sensor 2
Sensor 3
Sensor 4
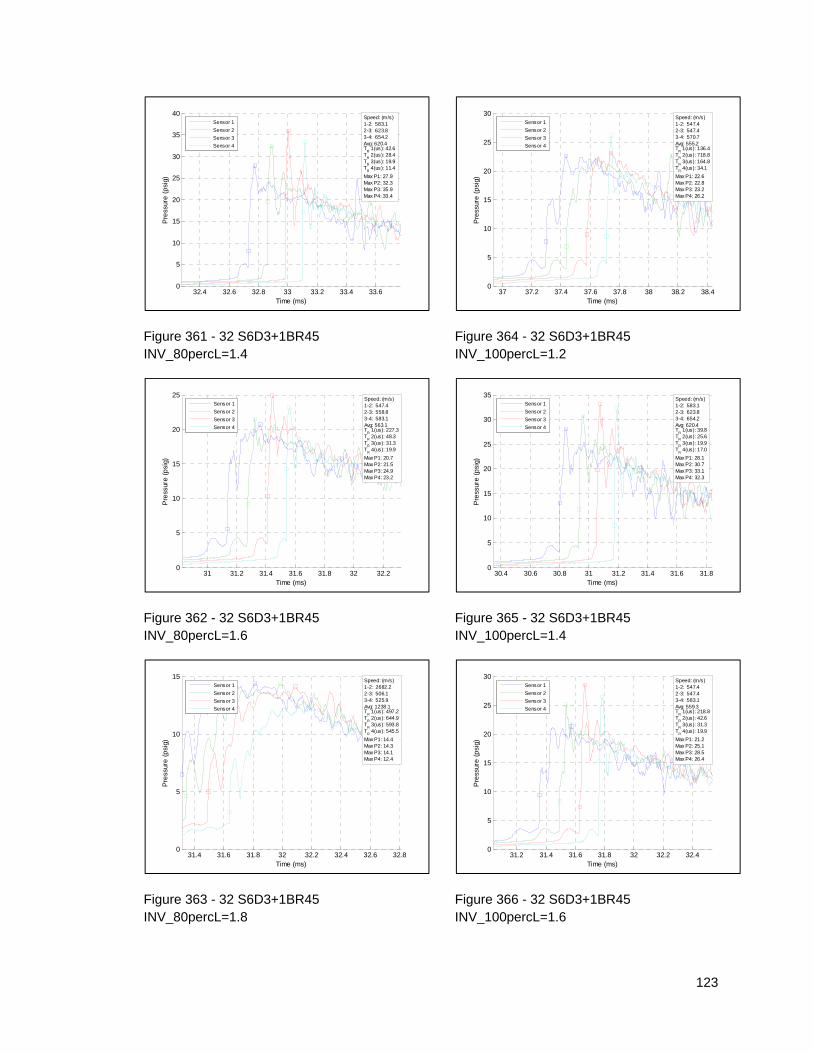
123
Figure 361 - 32 S6D3+1BR45 INV_80percL=1.4
Figure 362 - 32 S6D3+1BR45 INV_80percL=1.6
Figure 363 - 32 S6D3+1BR45 INV_80percL=1.8
Figure 364 - 32 S6D3+1BR45 INV_100percL=1.2
Figure 365 - 32 S6D3+1BR45 INV_100percL=1.4
Figure 366 - 32 S6D3+1BR45 INV_100percL=1.6
32.4 32.6 32.8 33 33.2 33.4 33.60
5
10
15
20
25
30
35
40
Time (ms)
Pre
ssur
e (
psi
g)
Speed: (m/s)1-2: 583.12-3: 623.83-4: 654.2Avg: 620.4T
R 1(us): 42.6
TR 2(us): 28.4
TR 3(us): 19.9
TR 4(us): 11.4
Max P1: 27.9Max P2: 32.3Max P3: 35.9Max P4: 33.4
Sensor 1
Sensor 2
Sensor 3
Sensor 4
31 31.2 31.4 31.6 31.8 32 32.20
5
10
15
20
25
Time (ms)
Pre
ssur
e (
psi
g)
Speed: (m/s)1-2: 547.42-3: 558.83-4: 583.1Avg: 563.1T
R 1(us): 227.3
TR 2(us): 48.3
TR 3(us): 31.3
TR 4(us): 19.9
Max P1: 20.7Max P2: 21.5Max P3: 24.9Max P4: 23.2
Sensor 1
Sensor 2
Sensor 3
Sensor 4
31.4 31.6 31.8 32 32.2 32.4 32.6 32.80
5
10
15
Time (ms)
Pre
ssur
e (
psi
g)
Speed: (m/s)1-2: 2682.22-3: 506.13-4: 525.9Avg: 1238.1T
R 1(us): 497.2
TR 2(us): 644.9
TR 3(us): 593.8
TR 4(us): 545.5
Max P1: 14.4Max P2: 14.3Max P3: 14.1Max P4: 12.4
Sensor 1
Sensor 2
Sensor 3
Sensor 4
37 37.2 37.4 37.6 37.8 38 38.2 38.40
5
10
15
20
25
30
Time (ms)
Pre
ssur
e (
psi
g)
Speed: (m/s)1-2: 547.42-3: 547.43-4: 570.7Avg: 555.2T
R 1(us): 136.4
TR 2(us): 718.8
TR 3(us): 164.8
TR 4(us): 34.1
Max P1: 22.6Max P2: 22.8Max P3: 23.2Max P4: 26.2
Sensor 1
Sensor 2
Sensor 3
Sensor 4
30.4 30.6 30.8 31 31.2 31.4 31.6 31.80
5
10
15
20
25
30
35
Time (ms)
Pre
ssur
e (
psi
g)
Speed: (m/s)1-2: 583.12-3: 623.83-4: 654.2Avg: 620.4T
R 1(us): 39.8
TR 2(us): 25.6
TR 3(us): 19.9
TR 4(us): 17.0
Max P1: 28.1Max P2: 30.7Max P3: 33.1Max P4: 32.3
Sensor 1
Sensor 2
Sensor 3
Sensor 4
31.2 31.4 31.6 31.8 32 32.2 32.40
5
10
15
20
25
30
Time (ms)
Pre
ssur
e (
psi
g)
Speed: (m/s)1-2: 547.42-3: 547.43-4: 583.1Avg: 559.3T
R 1(us): 218.8
TR 2(us): 42.6
TR 3(us): 31.3
TR 4(us): 19.9
Max P1: 21.2Max P2: 25.1Max P3: 28.5Max P4: 26.4
Sensor 1
Sensor 2
Sensor 3
Sensor 4
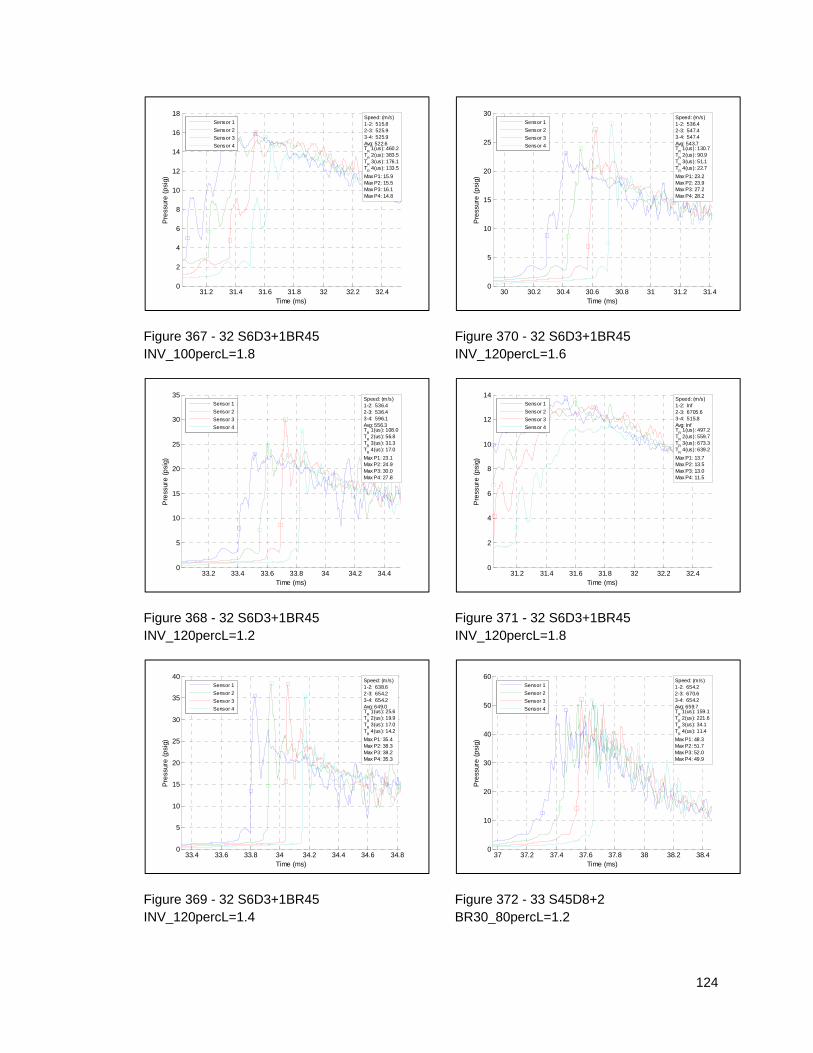
124
Figure 367 - 32 S6D3+1BR45 INV_100percL=1.8
Figure 368 - 32 S6D3+1BR45 INV_120percL=1.2
Figure 369 - 32 S6D3+1BR45 INV_120percL=1.4
Figure 370 - 32 S6D3+1BR45 INV_120percL=1.6
Figure 371 - 32 S6D3+1BR45 INV_120percL=1.8
Figure 372 - 33 S45D8+2 BR30_80percL=1.2
31.2 31.4 31.6 31.8 32 32.2 32.40
2
4
6
8
10
12
14
16
18
Time (ms)
Pre
ssur
e (
psi
g)
Speed: (m/s)1-2: 515.82-3: 525.93-4: 525.9Avg: 522.6T
R 1(us): 460.2
TR 2(us): 383.5
TR 3(us): 176.1
TR 4(us): 133.5
Max P1: 15.9Max P2: 15.5Max P3: 16.1Max P4: 14.8
Sensor 1
Sensor 2
Sensor 3
Sensor 4
33.2 33.4 33.6 33.8 34 34.2 34.40
5
10
15
20
25
30
35
Time (ms)
Pre
ssur
e (
psi
g)
Speed: (m/s)1-2: 536.42-3: 536.43-4: 596.1Avg: 556.3T
R 1(us): 108.0
TR 2(us): 56.8
TR 3(us): 31.3
TR 4(us): 17.0
Max P1: 23.1Max P2: 24.9Max P3: 30.0Max P4: 27.8
Sensor 1
Sensor 2
Sensor 3
Sensor 4
33.4 33.6 33.8 34 34.2 34.4 34.6 34.80
5
10
15
20
25
30
35
40
Time (ms)
Pre
ssur
e (
psi
g)
Speed: (m/s)1-2: 638.62-3: 654.23-4: 654.2Avg: 649.0T
R 1(us): 25.6
TR 2(us): 19.9
TR 3(us): 17.0
TR 4(us): 14.2
Max P1: 35.4Max P2: 38.3Max P3: 38.2Max P4: 35.3
Sensor 1
Sensor 2
Sensor 3
Sensor 4
30 30.2 30.4 30.6 30.8 31 31.2 31.40
5
10
15
20
25
30
Time (ms)
Pre
ssur
e (
psi
g)
Speed: (m/s)1-2: 536.42-3: 547.43-4: 547.4Avg: 543.7T
R 1(us): 130.7
TR 2(us): 90.9
TR 3(us): 51.1
TR 4(us): 22.7
Max P1: 23.2Max P2: 23.9Max P3: 27.2Max P4: 28.2
Sensor 1
Sensor 2
Sensor 3
Sensor 4
31.2 31.4 31.6 31.8 32 32.2 32.40
2
4
6
8
10
12
14
Time (ms)
Pre
ssur
e (
psi
g)
Speed: (m/s)1-2: Inf2-3: 6705.63-4: 515.8Avg: InfT
R 1(us): 497.2
TR 2(us): 559.7
TR 3(us): 673.3
TR 4(us): 639.2
Max P1: 13.7Max P2: 13.5Max P3: 13.0Max P4: 11.5
Sensor 1
Sensor 2
Sensor 3
Sensor 4
37 37.2 37.4 37.6 37.8 38 38.2 38.40
10
20
30
40
50
60
Time (ms)
Pre
ssur
e (
psi
g)
Speed: (m/s)1-2: 654.22-3: 670.63-4: 654.2Avg: 659.7T
R 1(us): 159.1
TR 2(us): 221.6
TR 3(us): 34.1
TR 4(us): 11.4
Max P1: 48.3Max P2: 51.7Max P3: 52.0Max P4: 49.9
Sensor 1
Sensor 2
Sensor 3
Sensor 4
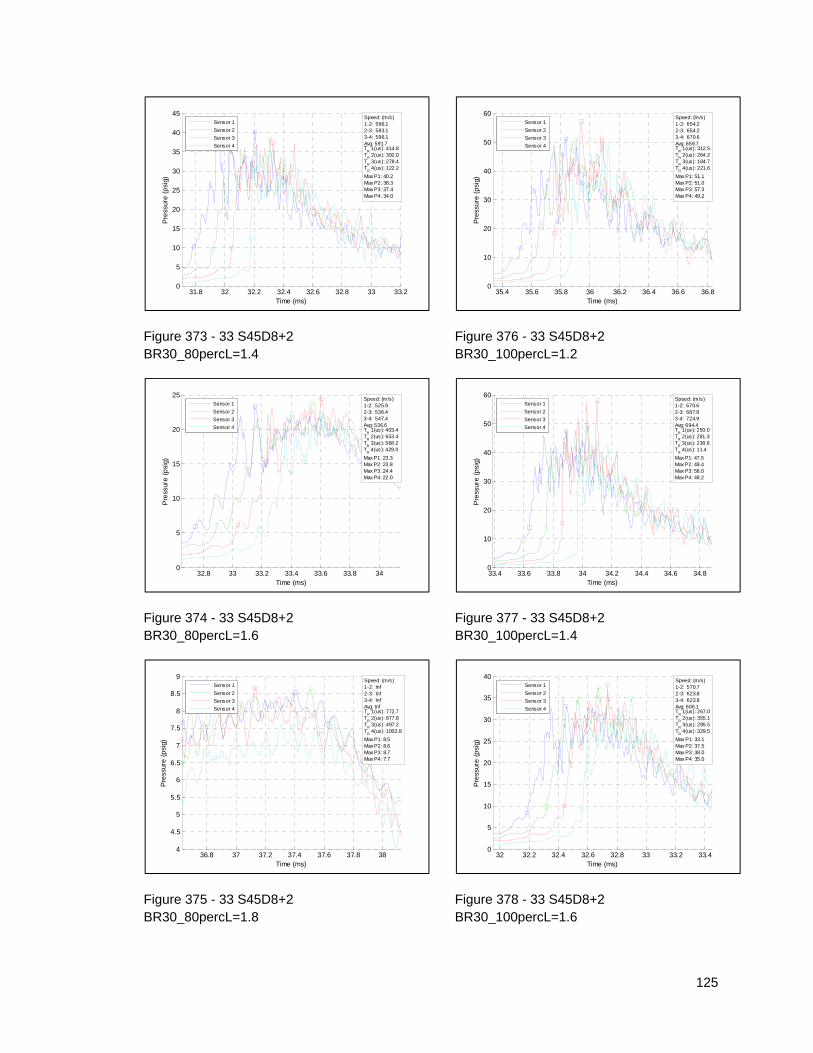
125
Figure 373 - 33 S45D8+2 BR30_80percL=1.4
Figure 374 - 33 S45D8+2 BR30_80percL=1.6
Figure 375 - 33 S45D8+2 BR30_80percL=1.8
Figure 376 - 33 S45D8+2 BR30_100percL=1.2
Figure 377 - 33 S45D8+2 BR30_100percL=1.4
Figure 378 - 33 S45D8+2 BR30_100percL=1.6
31.8 32 32.2 32.4 32.6 32.8 33 33.20
5
10
15
20
25
30
35
40
45
Time (ms)
Pre
ssur
e (
psi
g)
Speed: (m/s)1-2: 596.12-3: 583.13-4: 596.1Avg: 591.7T
R 1(us): 414.8
TR 2(us): 392.0
TR 3(us): 278.4
TR 4(us): 122.2
Max P1: 40.2Max P2: 38.3Max P3: 37.4Max P4: 34.0
Sensor 1
Sensor 2
Sensor 3
Sensor 4
32.8 33 33.2 33.4 33.6 33.8 340
5
10
15
20
25
Time (ms)
Pre
ssur
e (
psi
g)
Speed: (m/s)1-2: 525.92-3: 536.43-4: 547.4Avg: 536.6T
R 1(us): 403.4
TR 2(us): 653.4
TR 3(us): 568.2
TR 4(us): 429.0
Max P1: 23.3Max P2: 23.8Max P3: 24.4Max P4: 22.0
Sensor 1
Sensor 2
Sensor 3
Sensor 4
36.8 37 37.2 37.4 37.6 37.8 384
4.5
5
5.5
6
6.5
7
7.5
8
8.5
9
Time (ms)
Pre
ssur
e (
psi
g)
Speed: (m/s)1-2: Inf2-3: Inf3-4: InfAvg: InfT
R 1(us): 772.7
TR 2(us): 877.8
TR 3(us): 497.2
TR 4(us): 1002.8
Max P1: 8.5Max P2: 8.6Max P3: 8.7Max P4: 7.7
Sensor 1
Sensor 2
Sensor 3
Sensor 4
35.4 35.6 35.8 36 36.2 36.4 36.6 36.80
10
20
30
40
50
60
Time (ms)
Pre
ssur
e (
psi
g)
Speed: (m/s)1-2: 654.22-3: 654.23-4: 670.6Avg: 659.7T
R 1(us): 312.5
TR 2(us): 264.2
TR 3(us): 184.7
TR 4(us): 221.6
Max P1: 51.1Max P2: 51.0Max P3: 57.3Max P4: 49.2
Sensor 1
Sensor 2
Sensor 3
Sensor 4
33.4 33.6 33.8 34 34.2 34.4 34.6 34.80
10
20
30
40
50
60
Time (ms)
Pre
ssur
e (
psi
g)
Speed: (m/s)1-2: 670.62-3: 687.83-4: 724.9Avg: 694.4T
R 1(us): 250.0
TR 2(us): 281.3
TR 3(us): 238.6
TR 4(us): 11.4
Max P1: 47.5Max P2: 49.4Max P3: 58.0Max P4: 49.2
Sensor 1
Sensor 2
Sensor 3
Sensor 4
32 32.2 32.4 32.6 32.8 33 33.2 33.40
5
10
15
20
25
30
35
40
Time (ms)
Pre
ssur
e (
psi
g)
Speed: (m/s)1-2: 570.72-3: 623.83-4: 623.8Avg: 606.1T
R 1(us): 267.0
TR 2(us): 355.1
TR 3(us): 295.5
TR 4(us): 329.5
Max P1: 33.1Max P2: 37.5Max P3: 38.0Max P4: 35.0
Sensor 1
Sensor 2
Sensor 3
Sensor 4
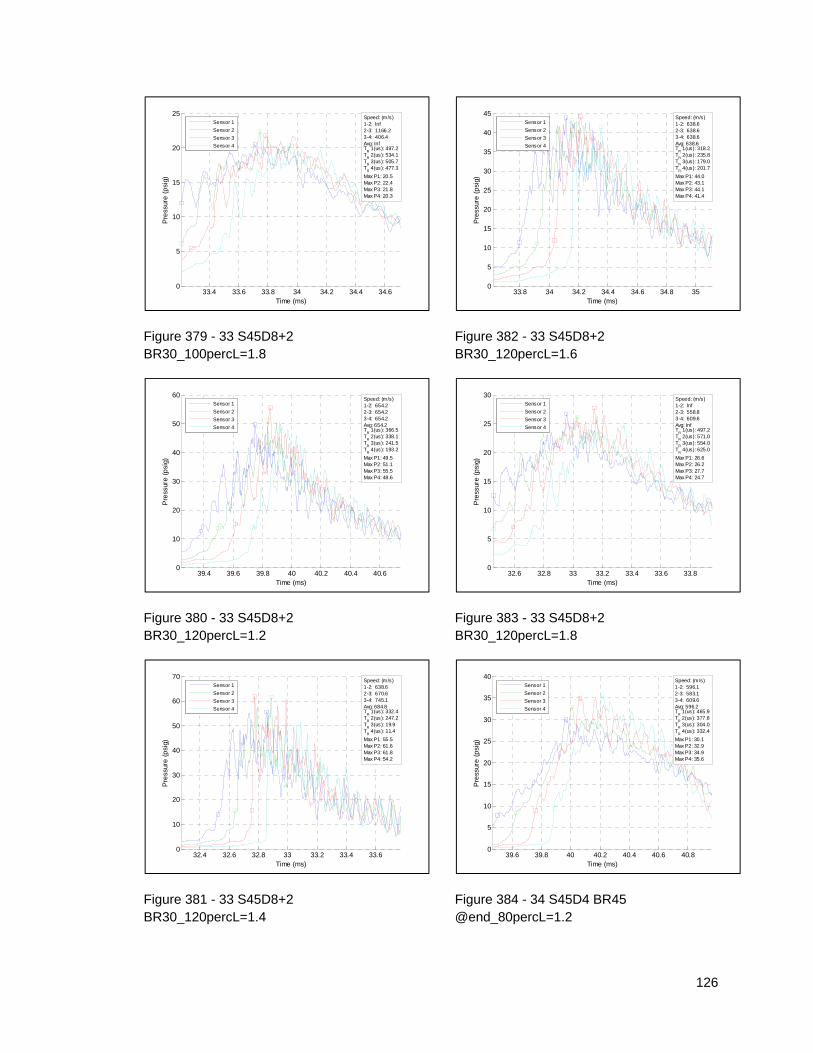
126
Figure 379 - 33 S45D8+2 BR30_100percL=1.8
Figure 380 - 33 S45D8+2 BR30_120percL=1.2
Figure 381 - 33 S45D8+2 BR30_120percL=1.4
Figure 382 - 33 S45D8+2 BR30_120percL=1.6
Figure 383 - 33 S45D8+2 BR30_120percL=1.8
Figure 384 - 34 S45D4 BR45 @end_80percL=1.2
33.4 33.6 33.8 34 34.2 34.4 34.60
5
10
15
20
25
Time (ms)
Pre
ssur
e (
psi
g)
Speed: (m/s)1-2: Inf2-3: 1166.23-4: 406.4Avg: InfT
R 1(us): 497.2
TR 2(us): 534.1
TR 3(us): 505.7
TR 4(us): 477.3
Max P1: 20.5Max P2: 22.4Max P3: 21.8Max P4: 20.3
Sensor 1
Sensor 2
Sensor 3
Sensor 4
39.4 39.6 39.8 40 40.2 40.4 40.60
10
20
30
40
50
60
Time (ms)
Pre
ssur
e (
psi
g)
Speed: (m/s)1-2: 654.22-3: 654.23-4: 654.2Avg: 654.2T
R 1(us): 366.5
TR 2(us): 338.1
TR 3(us): 241.5
TR 4(us): 193.2
Max P1: 49.5Max P2: 51.1Max P3: 55.5Max P4: 48.6
Sensor 1
Sensor 2
Sensor 3
Sensor 4
32.4 32.6 32.8 33 33.2 33.4 33.60
10
20
30
40
50
60
70
Time (ms)
Pre
ssur
e (
psi
g)
Speed: (m/s)1-2: 638.62-3: 670.63-4: 745.1Avg: 684.8T
R 1(us): 332.4
TR 2(us): 247.2
TR 3(us): 19.9
TR 4(us): 11.4
Max P1: 55.5Max P2: 61.6Max P3: 61.8Max P4: 54.2
Sensor 1
Sensor 2
Sensor 3
Sensor 4
33.8 34 34.2 34.4 34.6 34.8 350
5
10
15
20
25
30
35
40
45
Time (ms)
Pre
ssur
e (
psi
g)
Speed: (m/s)1-2: 638.62-3: 638.63-4: 638.6Avg: 638.6T
R 1(us): 318.2
TR 2(us): 235.8
TR 3(us): 179.0
TR 4(us): 201.7
Max P1: 44.0Max P2: 43.1Max P3: 44.1Max P4: 41.4
Sensor 1
Sensor 2
Sensor 3
Sensor 4
32.6 32.8 33 33.2 33.4 33.6 33.80
5
10
15
20
25
30
Time (ms)
Pre
ssur
e (
psi
g)
Speed: (m/s)1-2: Inf2-3: 558.83-4: 609.6Avg: InfT
R 1(us): 497.2
TR 2(us): 571.0
TR 3(us): 554.0
TR 4(us): 625.0
Max P1: 26.6Max P2: 26.2Max P3: 27.7Max P4: 24.7
Sensor 1
Sensor 2
Sensor 3
Sensor 4
39.6 39.8 40 40.2 40.4 40.6 40.80
5
10
15
20
25
30
35
40
Time (ms)
Pre
ssur
e (
psi
g)
Speed: (m/s)1-2: 596.12-3: 583.13-4: 609.6Avg: 596.2T
R 1(us): 465.9
TR 2(us): 377.8
TR 3(us): 304.0
TR 4(us): 332.4
Max P1: 30.1Max P2: 32.9Max P3: 34.9Max P4: 35.6
Sensor 1
Sensor 2
Sensor 3
Sensor 4
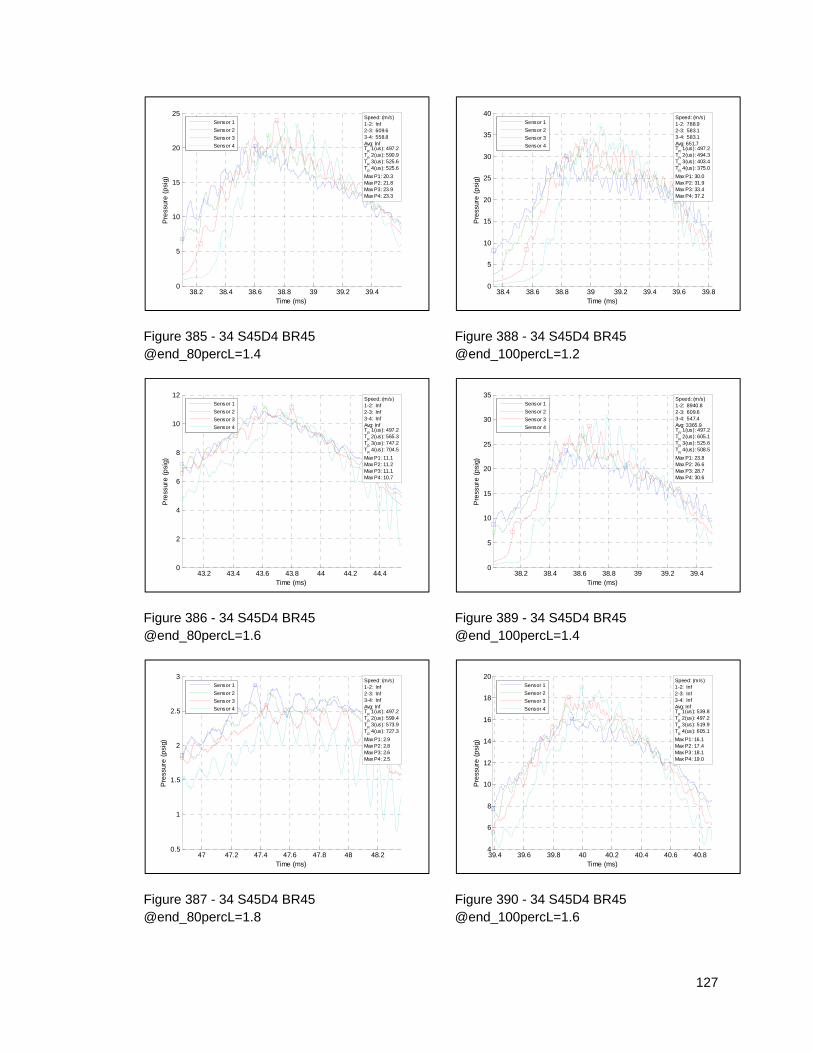
127
Figure 385 - 34 S45D4 BR45 @end_80percL=1.4
Figure 386 - 34 S45D4 BR45 @end_80percL=1.6
Figure 387 - 34 S45D4 BR45 @end_80percL=1.8
Figure 388 - 34 S45D4 BR45 @end_100percL=1.2
Figure 389 - 34 S45D4 BR45 @end_100percL=1.4
Figure 390 - 34 S45D4 BR45 @end_100percL=1.6
38.2 38.4 38.6 38.8 39 39.2 39.40
5
10
15
20
25
Time (ms)
Pre
ssur
e (
psi
g)
Speed: (m/s)1-2: Inf2-3: 609.63-4: 558.8Avg: InfT
R 1(us): 497.2
TR 2(us): 590.9
TR 3(us): 525.6
TR 4(us): 525.6
Max P1: 20.3Max P2: 21.8Max P3: 23.9Max P4: 23.3
Sensor 1
Sensor 2
Sensor 3
Sensor 4
43.2 43.4 43.6 43.8 44 44.2 44.40
2
4
6
8
10
12
Time (ms)
Pre
ssur
e (
psi
g)
Speed: (m/s)1-2: Inf2-3: Inf3-4: InfAvg: InfT
R 1(us): 497.2
TR 2(us): 565.3
TR 3(us): 747.2
TR 4(us): 704.5
Max P1: 11.1Max P2: 11.2Max P3: 11.1Max P4: 10.7
Sensor 1
Sensor 2
Sensor 3
Sensor 4
47 47.2 47.4 47.6 47.8 48 48.20.5
1
1.5
2
2.5
3
Time (ms)
Pre
ssur
e (
psi
g)
Speed: (m/s)1-2: Inf2-3: Inf3-4: InfAvg: InfT
R 1(us): 497.2
TR 2(us): 599.4
TR 3(us): 573.9
TR 4(us): 727.3
Max P1: 2.9Max P2: 2.8Max P3: 2.6Max P4: 2.5
Sensor 1
Sensor 2
Sensor 3
Sensor 4
38.4 38.6 38.8 39 39.2 39.4 39.6 39.80
5
10
15
20
25
30
35
40
Time (ms)
Pre
ssur
e (
psi
g)
Speed: (m/s)1-2: 788.92-3: 583.13-4: 583.1Avg: 651.7T
R 1(us): 497.2
TR 2(us): 494.3
TR 3(us): 403.4
TR 4(us): 375.0
Max P1: 30.0Max P2: 31.9Max P3: 33.4Max P4: 37.2
Sensor 1
Sensor 2
Sensor 3
Sensor 4
38.2 38.4 38.6 38.8 39 39.2 39.40
5
10
15
20
25
30
35
Time (ms)
Pre
ssur
e (
psi
g)
Speed: (m/s)1-2: 8940.82-3: 609.63-4: 547.4Avg: 3365.9T
R 1(us): 497.2
TR 2(us): 605.1
TR 3(us): 525.6
TR 4(us): 508.5
Max P1: 23.8Max P2: 26.6Max P3: 28.7Max P4: 30.6
Sensor 1
Sensor 2
Sensor 3
Sensor 4
39.4 39.6 39.8 40 40.2 40.4 40.6 40.84
6
8
10
12
14
16
18
20
Time (ms)
Pre
ssur
e (
psi
g)
Speed: (m/s)1-2: Inf2-3: Inf3-4: InfAvg: InfT
R 1(us): 539.8
TR 2(us): 497.2
TR 3(us): 519.9
TR 4(us): 605.1
Max P1: 16.1Max P2: 17.4Max P3: 18.1Max P4: 19.0
Sensor 1
Sensor 2
Sensor 3
Sensor 4
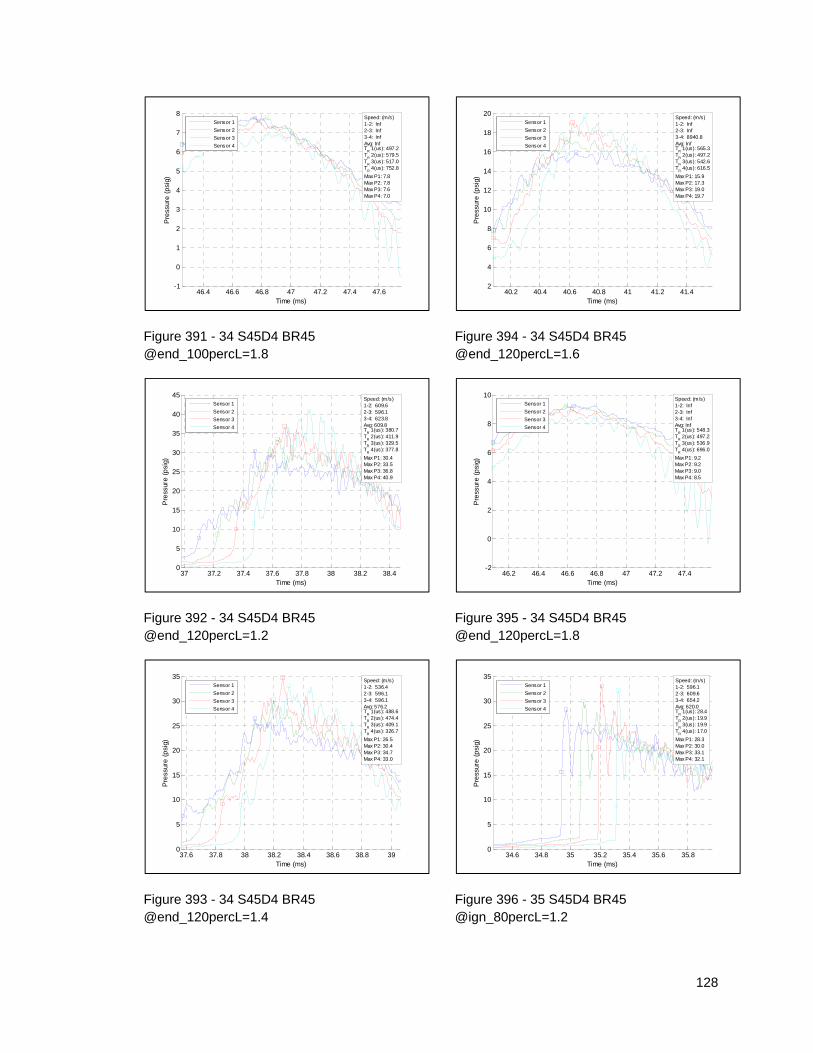
128
Figure 391 - 34 S45D4 BR45 @end_100percL=1.8
Figure 392 - 34 S45D4 BR45 @end_120percL=1.2
Figure 393 - 34 S45D4 BR45 @end_120percL=1.4
Figure 394 - 34 S45D4 BR45 @end_120percL=1.6
Figure 395 - 34 S45D4 BR45 @end_120percL=1.8
Figure 396 - 35 S45D4 BR45 @ign_80percL=1.2
46.4 46.6 46.8 47 47.2 47.4 47.6-1
0
1
2
3
4
5
6
7
8
Time (ms)
Pre
ssur
e (
psi
g)
Speed: (m/s)1-2: Inf2-3: Inf3-4: InfAvg: InfT
R 1(us): 497.2
TR 2(us): 579.5
TR 3(us): 517.0
TR 4(us): 752.8
Max P1: 7.8Max P2: 7.8Max P3: 7.6Max P4: 7.0
Sensor 1
Sensor 2
Sensor 3
Sensor 4
37 37.2 37.4 37.6 37.8 38 38.2 38.40
5
10
15
20
25
30
35
40
45
Time (ms)
Pre
ssur
e (
psi
g)
Speed: (m/s)1-2: 609.62-3: 596.13-4: 623.8Avg: 609.8T
R 1(us): 380.7
TR 2(us): 411.9
TR 3(us): 329.5
TR 4(us): 377.8
Max P1: 30.4Max P2: 33.5Max P3: 36.8Max P4: 40.9
Sensor 1
Sensor 2
Sensor 3
Sensor 4
37.6 37.8 38 38.2 38.4 38.6 38.8 390
5
10
15
20
25
30
35
Time (ms)
Pre
ssur
e (
psi
g)
Speed: (m/s)1-2: 536.42-3: 596.13-4: 596.1Avg: 576.2T
R 1(us): 488.6
TR 2(us): 474.4
TR 3(us): 409.1
TR 4(us): 326.7
Max P1: 26.5Max P2: 30.4Max P3: 34.7Max P4: 33.0
Sensor 1
Sensor 2
Sensor 3
Sensor 4
40.2 40.4 40.6 40.8 41 41.2 41.42
4
6
8
10
12
14
16
18
20
Time (ms)
Pre
ssur
e (
psi
g)
Speed: (m/s)1-2: Inf2-3: Inf3-4: 8940.8Avg: InfT
R 1(us): 565.3
TR 2(us): 497.2
TR 3(us): 542.6
TR 4(us): 616.5
Max P1: 15.9Max P2: 17.3Max P3: 19.0Max P4: 19.7
Sensor 1
Sensor 2
Sensor 3
Sensor 4
46.2 46.4 46.6 46.8 47 47.2 47.4-2
0
2
4
6
8
10
Time (ms)
Pre
ssur
e (
psi
g)
Speed: (m/s)1-2: Inf2-3: Inf3-4: InfAvg: InfT
R 1(us): 548.3
TR 2(us): 497.2
TR 3(us): 536.9
TR 4(us): 696.0
Max P1: 9.2Max P2: 9.2Max P3: 9.0Max P4: 8.5
Sensor 1
Sensor 2
Sensor 3
Sensor 4
34.6 34.8 35 35.2 35.4 35.6 35.80
5
10
15
20
25
30
35
Time (ms)
Pre
ssur
e (
psi
g)
Speed: (m/s)1-2: 596.12-3: 609.63-4: 654.2Avg: 620.0T
R 1(us): 28.4
TR 2(us): 19.9
TR 3(us): 19.9
TR 4(us): 17.0
Max P1: 28.3Max P2: 30.0Max P3: 33.1Max P4: 32.1
Sensor 1
Sensor 2
Sensor 3
Sensor 4
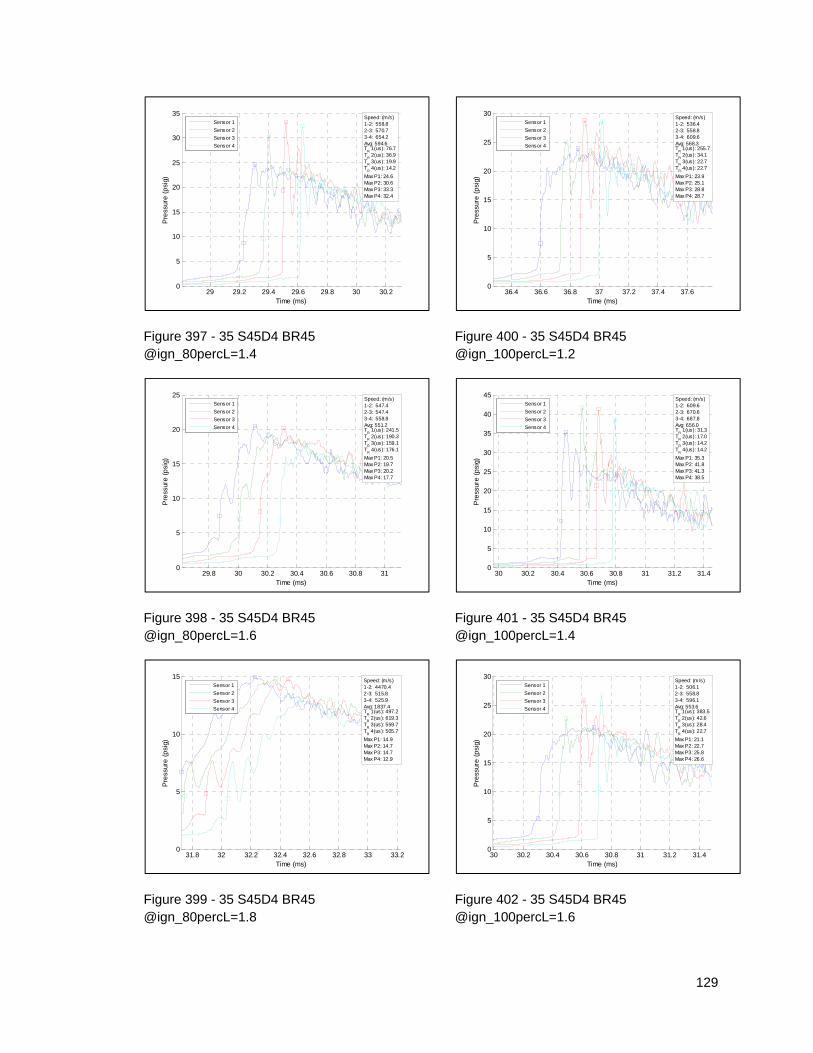
129
Figure 397 - 35 S45D4 BR45 @ign_80percL=1.4
Figure 398 - 35 S45D4 BR45 @ign_80percL=1.6
Figure 399 - 35 S45D4 BR45 @ign_80percL=1.8
Figure 400 - 35 S45D4 BR45 @ign_100percL=1.2
Figure 401 - 35 S45D4 BR45 @ign_100percL=1.4
Figure 402 - 35 S45D4 BR45 @ign_100percL=1.6
29 29.2 29.4 29.6 29.8 30 30.20
5
10
15
20
25
30
35
Time (ms)
Pre
ssur
e (
psi
g)
Speed: (m/s)1-2: 558.82-3: 570.73-4: 654.2Avg: 594.6T
R 1(us): 76.7
TR 2(us): 36.9
TR 3(us): 19.9
TR 4(us): 14.2
Max P1: 24.6Max P2: 30.6Max P3: 33.3Max P4: 32.4
Sensor 1
Sensor 2
Sensor 3
Sensor 4
29.8 30 30.2 30.4 30.6 30.8 310
5
10
15
20
25
Time (ms)
Pre
ssur
e (
psi
g)
Speed: (m/s)1-2: 547.42-3: 547.43-4: 558.8Avg: 551.2T
R 1(us): 241.5
TR 2(us): 190.3
TR 3(us): 159.1
TR 4(us): 176.1
Max P1: 20.5Max P2: 19.7Max P3: 20.2Max P4: 17.7
Sensor 1
Sensor 2
Sensor 3
Sensor 4
31.8 32 32.2 32.4 32.6 32.8 33 33.20
5
10
15
Time (ms)
Pre
ssur
e (
psi
g)
Speed: (m/s)1-2: 4470.42-3: 515.83-4: 525.9Avg: 1837.4T
R 1(us): 497.2
TR 2(us): 619.3
TR 3(us): 559.7
TR 4(us): 505.7
Max P1: 14.9Max P2: 14.7Max P3: 14.7Max P4: 12.9
Sensor 1
Sensor 2
Sensor 3
Sensor 4
36.4 36.6 36.8 37 37.2 37.4 37.60
5
10
15
20
25
30
Time (ms)
Pre
ssur
e (
psi
g)
Speed: (m/s)1-2: 536.42-3: 558.83-4: 609.6Avg: 568.3T
R 1(us): 255.7
TR 2(us): 34.1
TR 3(us): 22.7
TR 4(us): 22.7
Max P1: 23.9Max P2: 25.1Max P3: 28.8Max P4: 28.7
Sensor 1
Sensor 2
Sensor 3
Sensor 4
30 30.2 30.4 30.6 30.8 31 31.2 31.40
5
10
15
20
25
30
35
40
45
Time (ms)
Pre
ssur
e (
psi
g)
Speed: (m/s)1-2: 609.62-3: 670.63-4: 687.8Avg: 656.0T
R 1(us): 31.3
TR 2(us): 17.0
TR 3(us): 14.2
TR 4(us): 14.2
Max P1: 35.3Max P2: 41.8Max P3: 41.3Max P4: 38.5
Sensor 1
Sensor 2
Sensor 3
Sensor 4
30 30.2 30.4 30.6 30.8 31 31.2 31.40
5
10
15
20
25
30
Time (ms)
Pre
ssur
e (
psi
g)
Speed: (m/s)1-2: 506.12-3: 558.83-4: 596.1Avg: 553.6T
R 1(us): 383.5
TR 2(us): 42.6
TR 3(us): 28.4
TR 4(us): 22.7
Max P1: 21.1Max P2: 22.7Max P3: 25.8Max P4: 26.6
Sensor 1
Sensor 2
Sensor 3
Sensor 4
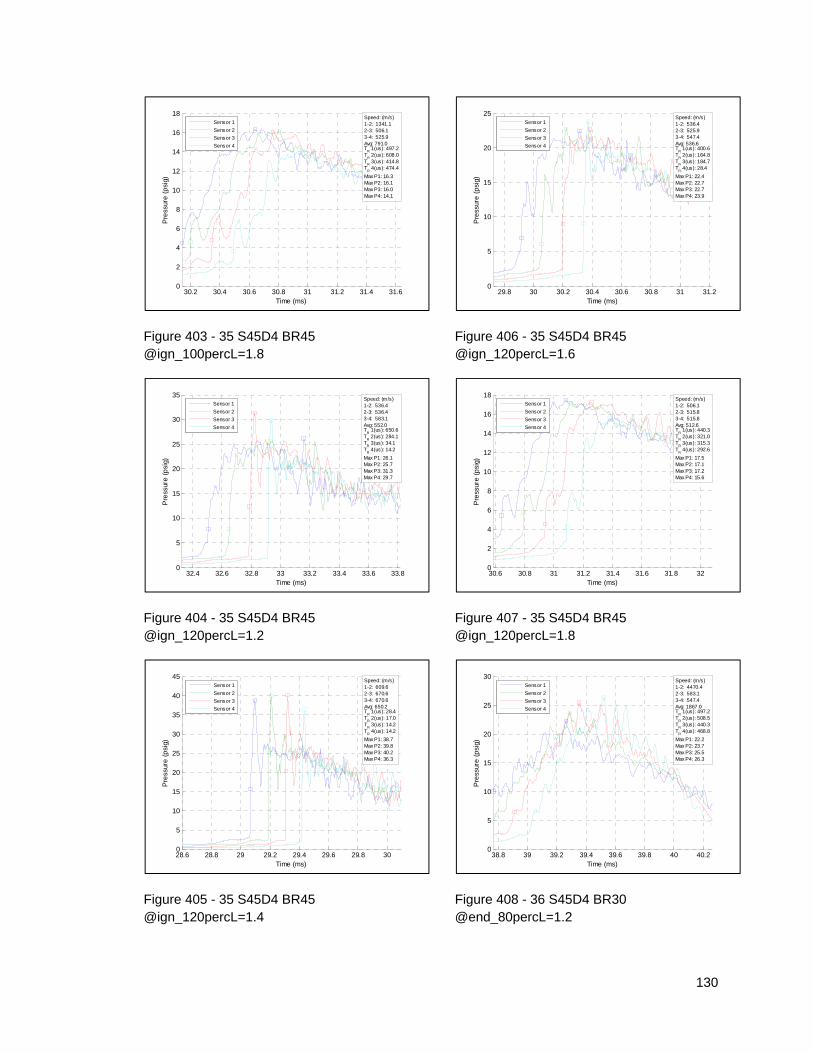
130
Figure 403 - 35 S45D4 BR45 @ign_100percL=1.8
Figure 404 - 35 S45D4 BR45 @ign_120percL=1.2
Figure 405 - 35 S45D4 BR45 @ign_120percL=1.4
Figure 406 - 35 S45D4 BR45 @ign_120percL=1.6
Figure 407 - 35 S45D4 BR45 @ign_120percL=1.8
Figure 408 - 36 S45D4 BR30 @end_80percL=1.2
30.2 30.4 30.6 30.8 31 31.2 31.4 31.60
2
4
6
8
10
12
14
16
18
Time (ms)
Pre
ssur
e (
psi
g)
Speed: (m/s)1-2: 1341.12-3: 506.13-4: 525.9Avg: 791.0T
R 1(us): 497.2
TR 2(us): 608.0
TR 3(us): 414.8
TR 4(us): 474.4
Max P1: 16.3Max P2: 16.1Max P3: 16.0Max P4: 14.1
Sensor 1
Sensor 2
Sensor 3
Sensor 4
32.4 32.6 32.8 33 33.2 33.4 33.6 33.80
5
10
15
20
25
30
35
Time (ms)
Pre
ssur
e (
psi
g)
Speed: (m/s)1-2: 536.42-3: 536.43-4: 583.1Avg: 552.0T
R 1(us): 650.6
TR 2(us): 284.1
TR 3(us): 34.1
TR 4(us): 14.2
Max P1: 26.1Max P2: 25.7Max P3: 31.3Max P4: 29.7
Sensor 1
Sensor 2
Sensor 3
Sensor 4
28.6 28.8 29 29.2 29.4 29.6 29.8 300
5
10
15
20
25
30
35
40
45
Time (ms)
Pre
ssur
e (
psi
g)
Speed: (m/s)1-2: 609.62-3: 670.63-4: 670.6Avg: 650.2T
R 1(us): 28.4
TR 2(us): 17.0
TR 3(us): 14.2
TR 4(us): 14.2
Max P1: 38.7Max P2: 39.8Max P3: 40.2Max P4: 36.3
Sensor 1
Sensor 2
Sensor 3
Sensor 4
29.8 30 30.2 30.4 30.6 30.8 31 31.20
5
10
15
20
25
Time (ms)
Pre
ssur
e (
psi
g)
Speed: (m/s)1-2: 536.42-3: 525.93-4: 547.4Avg: 536.6T
R 1(us): 400.6
TR 2(us): 164.8
TR 3(us): 184.7
TR 4(us): 28.4
Max P1: 22.4Max P2: 22.7Max P3: 22.7Max P4: 23.9
Sensor 1
Sensor 2
Sensor 3
Sensor 4
30.6 30.8 31 31.2 31.4 31.6 31.8 320
2
4
6
8
10
12
14
16
18
Time (ms)
Pre
ssur
e (
psi
g)
Speed: (m/s)1-2: 506.12-3: 515.83-4: 515.8Avg: 512.6T
R 1(us): 440.3
TR 2(us): 321.0
TR 3(us): 315.3
TR 4(us): 292.6
Max P1: 17.5Max P2: 17.1Max P3: 17.2Max P4: 15.6
Sensor 1
Sensor 2
Sensor 3
Sensor 4
38.8 39 39.2 39.4 39.6 39.8 40 40.20
5
10
15
20
25
30
Time (ms)
Pre
ssur
e (
psi
g)
Speed: (m/s)1-2: 4470.42-3: 583.13-4: 547.4Avg: 1867.0T
R 1(us): 497.2
TR 2(us): 508.5
TR 3(us): 440.3
TR 4(us): 468.8
Max P1: 22.2Max P2: 23.7Max P3: 25.5Max P4: 26.3
Sensor 1
Sensor 2
Sensor 3
Sensor 4
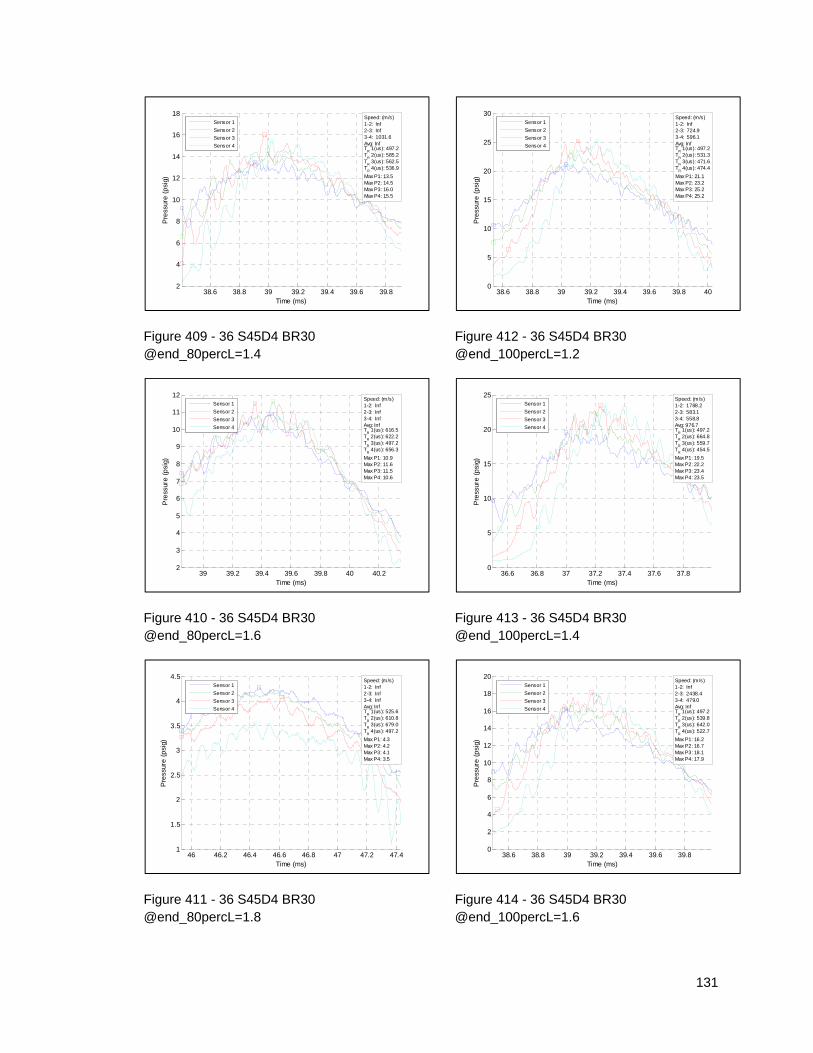
131
Figure 409 - 36 S45D4 BR30 @end_80percL=1.4
Figure 410 - 36 S45D4 BR30 @end_80percL=1.6
Figure 411 - 36 S45D4 BR30 @end_80percL=1.8
Figure 412 - 36 S45D4 BR30 @end_100percL=1.2
Figure 413 - 36 S45D4 BR30 @end_100percL=1.4
Figure 414 - 36 S45D4 BR30 @end_100percL=1.6
38.6 38.8 39 39.2 39.4 39.6 39.82
4
6
8
10
12
14
16
18
Time (ms)
Pre
ssur
e (
psi
g)
Speed: (m/s)1-2: Inf2-3: Inf3-4: 1031.6Avg: InfT
R 1(us): 497.2
TR 2(us): 585.2
TR 3(us): 562.5
TR 4(us): 536.9
Max P1: 13.5Max P2: 14.5Max P3: 16.0Max P4: 15.5
Sensor 1
Sensor 2
Sensor 3
Sensor 4
39 39.2 39.4 39.6 39.8 40 40.22
3
4
5
6
7
8
9
10
11
12
Time (ms)
Pre
ssur
e (
psi
g)
Speed: (m/s)1-2: Inf2-3: Inf3-4: InfAvg: InfT
R 1(us): 616.5
TR 2(us): 622.2
TR 3(us): 497.2
TR 4(us): 656.3
Max P1: 10.9Max P2: 11.6Max P3: 11.5Max P4: 10.6
Sensor 1
Sensor 2
Sensor 3
Sensor 4
46 46.2 46.4 46.6 46.8 47 47.2 47.41
1.5
2
2.5
3
3.5
4
4.5
Time (ms)
Pre
ssur
e (
psi
g)
Speed: (m/s)1-2: Inf2-3: Inf3-4: InfAvg: InfT
R 1(us): 525.6
TR 2(us): 610.8
TR 3(us): 679.0
TR 4(us): 497.2
Max P1: 4.3Max P2: 4.2Max P3: 4.1Max P4: 3.5
Sensor 1
Sensor 2
Sensor 3
Sensor 4
38.6 38.8 39 39.2 39.4 39.6 39.8 400
5
10
15
20
25
30
Time (ms)
Pre
ssur
e (
psi
g)
Speed: (m/s)1-2: Inf2-3: 724.93-4: 596.1Avg: InfT
R 1(us): 497.2
TR 2(us): 531.3
TR 3(us): 471.6
TR 4(us): 474.4
Max P1: 21.1Max P2: 23.2Max P3: 25.2Max P4: 25.2
Sensor 1
Sensor 2
Sensor 3
Sensor 4
36.6 36.8 37 37.2 37.4 37.6 37.80
5
10
15
20
25
Time (ms)
Pre
ssur
e (
psi
g)
Speed: (m/s)1-2: 1788.22-3: 583.13-4: 558.8Avg: 976.7T
R 1(us): 497.2
TR 2(us): 664.8
TR 3(us): 559.7
TR 4(us): 454.5
Max P1: 19.5Max P2: 22.2Max P3: 23.4Max P4: 23.5
Sensor 1
Sensor 2
Sensor 3
Sensor 4
38.6 38.8 39 39.2 39.4 39.6 39.80
2
4
6
8
10
12
14
16
18
20
Time (ms)
Pre
ssur
e (
psi
g)
Speed: (m/s)1-2: Inf2-3: 2438.43-4: 479.0Avg: InfT
R 1(us): 497.2
TR 2(us): 539.8
TR 3(us): 642.0
TR 4(us): 522.7
Max P1: 16.2Max P2: 16.7Max P3: 18.1Max P4: 17.9
Sensor 1
Sensor 2
Sensor 3
Sensor 4
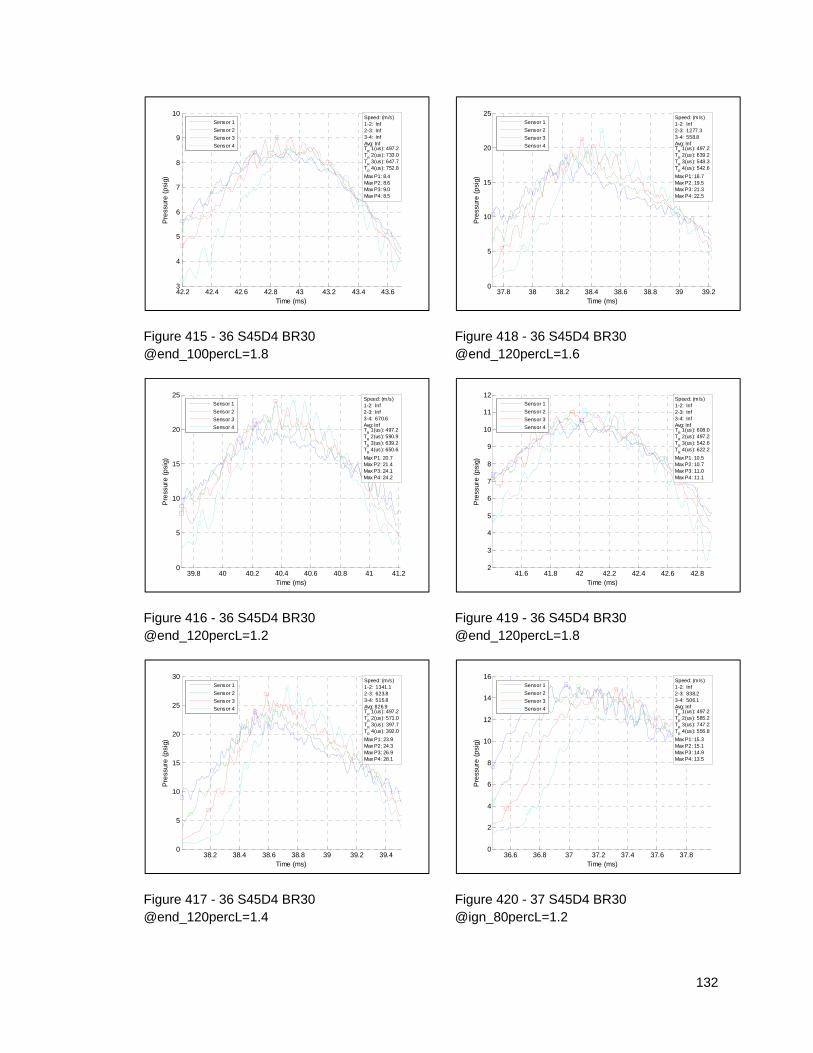
132
Figure 415 - 36 S45D4 BR30 @end_100percL=1.8
Figure 416 - 36 S45D4 BR30 @end_120percL=1.2
Figure 417 - 36 S45D4 BR30 @end_120percL=1.4
Figure 418 - 36 S45D4 BR30 @end_120percL=1.6
Figure 419 - 36 S45D4 BR30 @end_120percL=1.8
Figure 420 - 37 S45D4 BR30 @ign_80percL=1.2
42.2 42.4 42.6 42.8 43 43.2 43.4 43.63
4
5
6
7
8
9
10
Time (ms)
Pre
ssur
e (
psi
g)
Speed: (m/s)1-2: Inf2-3: Inf3-4: InfAvg: InfT
R 1(us): 497.2
TR 2(us): 733.0
TR 3(us): 647.7
TR 4(us): 752.8
Max P1: 8.4Max P2: 8.6Max P3: 9.0Max P4: 8.5
Sensor 1
Sensor 2
Sensor 3
Sensor 4
39.8 40 40.2 40.4 40.6 40.8 41 41.20
5
10
15
20
25
Time (ms)
Pre
ssur
e (
psi
g)
Speed: (m/s)1-2: Inf2-3: Inf3-4: 670.6Avg: InfT
R 1(us): 497.2
TR 2(us): 590.9
TR 3(us): 639.2
TR 4(us): 650.6
Max P1: 20.7Max P2: 21.4Max P3: 24.1Max P4: 24.2
Sensor 1
Sensor 2
Sensor 3
Sensor 4
38.2 38.4 38.6 38.8 39 39.2 39.40
5
10
15
20
25
30
Time (ms)
Pre
ssur
e (
psi
g)
Speed: (m/s)1-2: 1341.12-3: 623.83-4: 515.8Avg: 826.9T
R 1(us): 497.2
TR 2(us): 571.0
TR 3(us): 397.7
TR 4(us): 392.0
Max P1: 23.9Max P2: 24.3Max P3: 26.9Max P4: 28.1
Sensor 1
Sensor 2
Sensor 3
Sensor 4
37.8 38 38.2 38.4 38.6 38.8 39 39.20
5
10
15
20
25
Time (ms)
Pre
ssur
e (
psi
g)
Speed: (m/s)1-2: Inf2-3: 1277.33-4: 558.8Avg: InfT
R 1(us): 497.2
TR 2(us): 639.2
TR 3(us): 548.3
TR 4(us): 542.6
Max P1: 18.7Max P2: 19.5Max P3: 21.3Max P4: 22.5
Sensor 1
Sensor 2
Sensor 3
Sensor 4
41.6 41.8 42 42.2 42.4 42.6 42.82
3
4
5
6
7
8
9
10
11
12
Time (ms)
Pre
ssur
e (
psi
g)
Speed: (m/s)1-2: Inf2-3: Inf3-4: InfAvg: InfT
R 1(us): 608.0
TR 2(us): 497.2
TR 3(us): 542.6
TR 4(us): 622.2
Max P1: 10.5Max P2: 10.7Max P3: 11.0Max P4: 11.1
Sensor 1
Sensor 2
Sensor 3
Sensor 4
36.6 36.8 37 37.2 37.4 37.6 37.80
2
4
6
8
10
12
14
16
Time (ms)
Pre
ssur
e (
psi
g)
Speed: (m/s)1-2: Inf2-3: 838.23-4: 506.1Avg: InfT
R 1(us): 497.2
TR 2(us): 585.2
TR 3(us): 747.2
TR 4(us): 556.8
Max P1: 15.3Max P2: 15.1Max P3: 14.9Max P4: 13.5
Sensor 1
Sensor 2
Sensor 3
Sensor 4
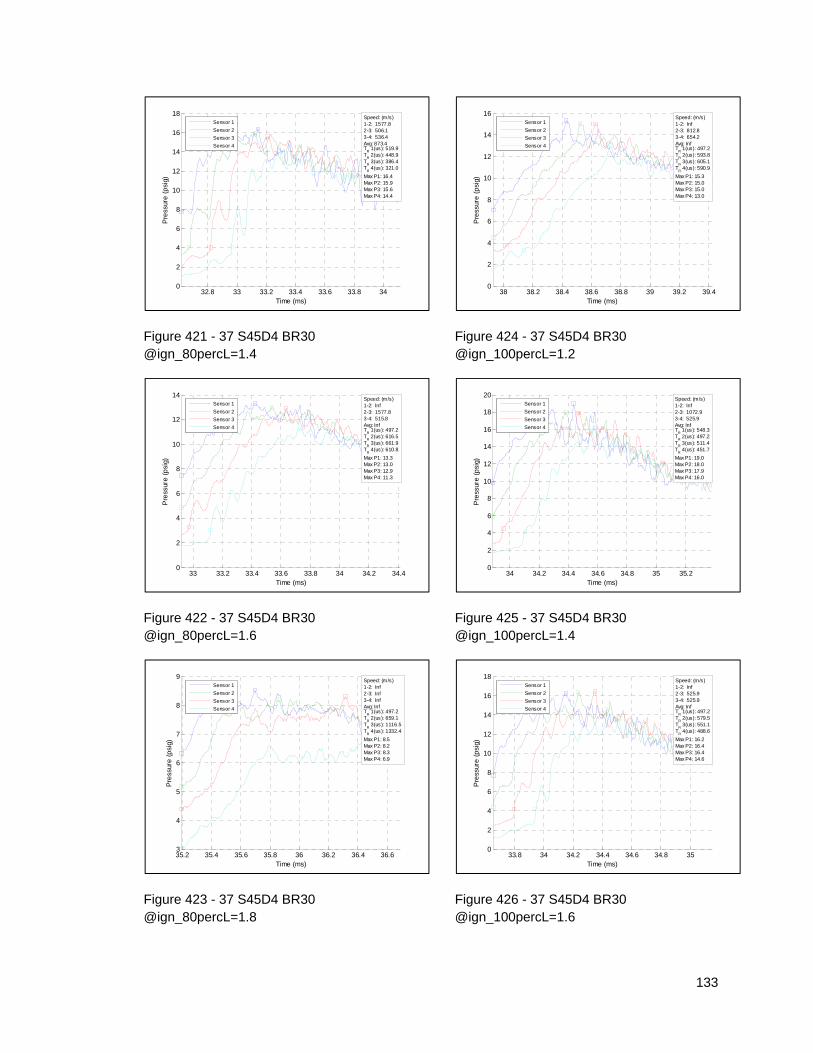
133
Figure 421 - 37 S45D4 BR30 @ign_80percL=1.4
Figure 422 - 37 S45D4 BR30 @ign_80percL=1.6
Figure 423 - 37 S45D4 BR30 @ign_80percL=1.8
Figure 424 - 37 S45D4 BR30 @ign_100percL=1.2
Figure 425 - 37 S45D4 BR30 @ign_100percL=1.4
Figure 426 - 37 S45D4 BR30 @ign_100percL=1.6
32.8 33 33.2 33.4 33.6 33.8 340
2
4
6
8
10
12
14
16
18
Time (ms)
Pre
ssur
e (
psi
g)
Speed: (m/s)1-2: 1577.82-3: 506.13-4: 536.4Avg: 873.4T
R 1(us): 519.9
TR 2(us): 448.9
TR 3(us): 386.4
TR 4(us): 321.0
Max P1: 16.4Max P2: 15.9Max P3: 15.6Max P4: 14.4
Sensor 1
Sensor 2
Sensor 3
Sensor 4
33 33.2 33.4 33.6 33.8 34 34.2 34.40
2
4
6
8
10
12
14
Time (ms)
Pre
ssur
e (
psi
g)
Speed: (m/s)1-2: Inf2-3: 1577.83-4: 515.8Avg: InfT
R 1(us): 497.2
TR 2(us): 616.5
TR 3(us): 661.9
TR 4(us): 610.8
Max P1: 13.3Max P2: 13.0Max P3: 12.9Max P4: 11.3
Sensor 1
Sensor 2
Sensor 3
Sensor 4
35.2 35.4 35.6 35.8 36 36.2 36.4 36.63
4
5
6
7
8
9
Time (ms)
Pre
ssur
e (
psi
g)
Speed: (m/s)1-2: Inf2-3: Inf3-4: InfAvg: InfT
R 1(us): 497.2
TR 2(us): 659.1
TR 3(us): 1116.5
TR 4(us): 1332.4
Max P1: 8.5Max P2: 8.2Max P3: 8.3Max P4: 6.9
Sensor 1
Sensor 2
Sensor 3
Sensor 4
38 38.2 38.4 38.6 38.8 39 39.2 39.40
2
4
6
8
10
12
14
16
Time (ms)
Pre
ssur
e (
psi
g)
Speed: (m/s)1-2: Inf2-3: 812.83-4: 654.2Avg: InfT
R 1(us): 497.2
TR 2(us): 593.8
TR 3(us): 605.1
TR 4(us): 590.9
Max P1: 15.3Max P2: 15.0Max P3: 15.0Max P4: 13.0
Sensor 1
Sensor 2
Sensor 3
Sensor 4
34 34.2 34.4 34.6 34.8 35 35.20
2
4
6
8
10
12
14
16
18
20
Time (ms)
Pre
ssur
e (
psi
g)
Speed: (m/s)1-2: Inf2-3: 1072.93-4: 525.9Avg: InfT
R 1(us): 548.3
TR 2(us): 497.2
TR 3(us): 511.4
TR 4(us): 451.7
Max P1: 19.0Max P2: 18.0Max P3: 17.9Max P4: 16.0
Sensor 1
Sensor 2
Sensor 3
Sensor 4
33.8 34 34.2 34.4 34.6 34.8 350
2
4
6
8
10
12
14
16
18
Time (ms)
Pre
ssur
e (
psi
g)
Speed: (m/s)1-2: Inf2-3: 525.93-4: 525.9Avg: InfT
R 1(us): 497.2
TR 2(us): 579.5
TR 3(us): 551.1
TR 4(us): 488.6
Max P1: 16.2Max P2: 16.4Max P3: 16.4Max P4: 14.6
Sensor 1
Sensor 2
Sensor 3
Sensor 4
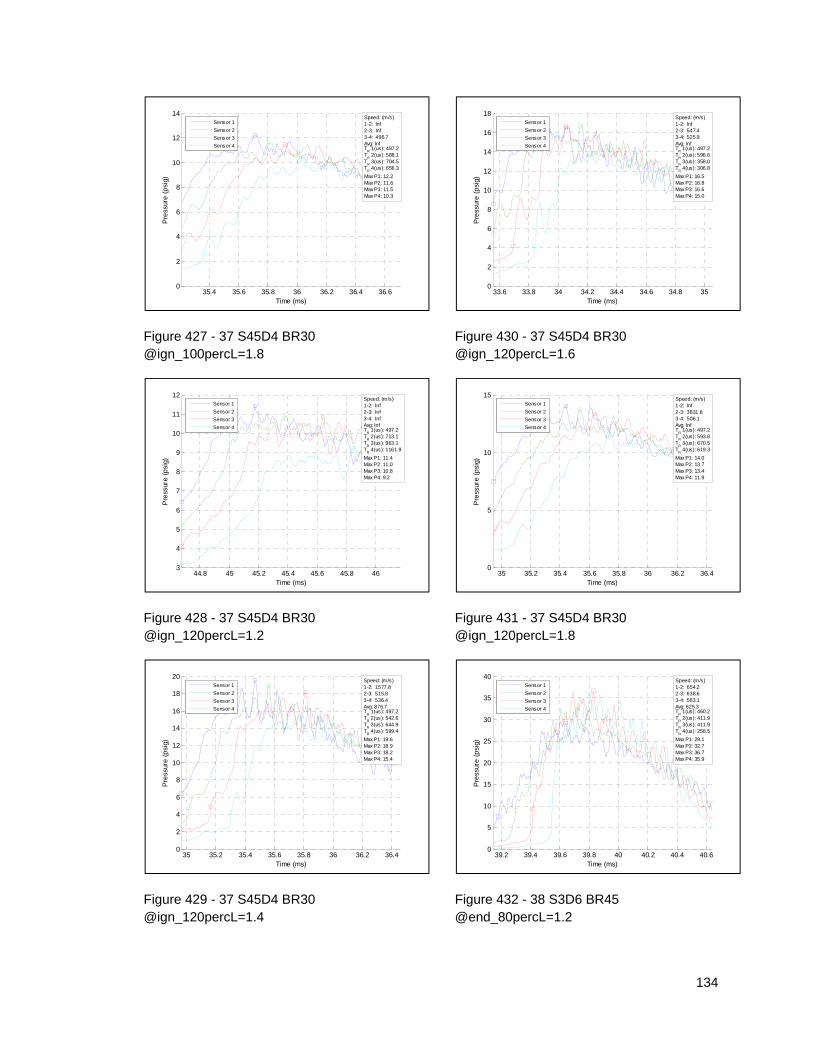
134
Figure 427 - 37 S45D4 BR30 @ign_100percL=1.8
Figure 428 - 37 S45D4 BR30 @ign_120percL=1.2
Figure 429 - 37 S45D4 BR30 @ign_120percL=1.4
Figure 430 - 37 S45D4 BR30 @ign_120percL=1.6
Figure 431 - 37 S45D4 BR30 @ign_120percL=1.8
Figure 432 - 38 S3D6 BR45 @end_80percL=1.2
35.4 35.6 35.8 36 36.2 36.4 36.60
2
4
6
8
10
12
14
Time (ms)
Pre
ssur
e (
psi
g)
Speed: (m/s)1-2: Inf2-3: Inf3-4: 496.7Avg: InfT
R 1(us): 497.2
TR 2(us): 588.1
TR 3(us): 704.5
TR 4(us): 656.3
Max P1: 12.2Max P2: 11.6Max P3: 11.5Max P4: 10.3
Sensor 1
Sensor 2
Sensor 3
Sensor 4
44.8 45 45.2 45.4 45.6 45.8 463
4
5
6
7
8
9
10
11
12
Time (ms)
Pre
ssur
e (
psi
g)
Speed: (m/s)1-2: Inf2-3: Inf3-4: InfAvg: InfT
R 1(us): 497.2
TR 2(us): 713.1
TR 3(us): 963.1
TR 4(us): 1161.9
Max P1: 11.4Max P2: 11.0Max P3: 10.8Max P4: 9.2
Sensor 1
Sensor 2
Sensor 3
Sensor 4
35 35.2 35.4 35.6 35.8 36 36.2 36.40
2
4
6
8
10
12
14
16
18
20
Time (ms)
Pre
ssur
e (
psi
g)
Speed: (m/s)1-2: 1577.82-3: 515.83-4: 536.4Avg: 876.7T
R 1(us): 497.2
TR 2(us): 542.6
TR 3(us): 644.9
TR 4(us): 599.4
Max P1: 19.6Max P2: 18.9Max P3: 18.2Max P4: 15.4
Sensor 1
Sensor 2
Sensor 3
Sensor 4
33.6 33.8 34 34.2 34.4 34.6 34.8 350
2
4
6
8
10
12
14
16
18
Time (ms)
Pre
ssur
e (
psi
g)
Speed: (m/s)1-2: Inf2-3: 547.43-4: 525.9Avg: InfT
R 1(us): 497.2
TR 2(us): 596.6
TR 3(us): 358.0
TR 4(us): 306.8
Max P1: 16.5Max P2: 16.8Max P3: 16.6Max P4: 15.0
Sensor 1
Sensor 2
Sensor 3
Sensor 4
35 35.2 35.4 35.6 35.8 36 36.2 36.40
5
10
15
Time (ms)
Pre
ssur
e (
psi
g)
Speed: (m/s)1-2: Inf2-3: 3831.83-4: 506.1Avg: InfT
R 1(us): 497.2
TR 2(us): 593.8
TR 3(us): 670.5
TR 4(us): 619.3
Max P1: 14.0Max P2: 13.7Max P3: 13.4Max P4: 11.9
Sensor 1
Sensor 2
Sensor 3
Sensor 4
39.2 39.4 39.6 39.8 40 40.2 40.4 40.60
5
10
15
20
25
30
35
40
Time (ms)
Pre
ssur
e (
psi
g)
Speed: (m/s)1-2: 654.22-3: 638.63-4: 583.1Avg: 625.3T
R 1(us): 460.2
TR 2(us): 411.9
TR 3(us): 411.9
TR 4(us): 258.5
Max P1: 29.1Max P2: 32.7Max P3: 36.7Max P4: 35.9
Sensor 1
Sensor 2
Sensor 3
Sensor 4
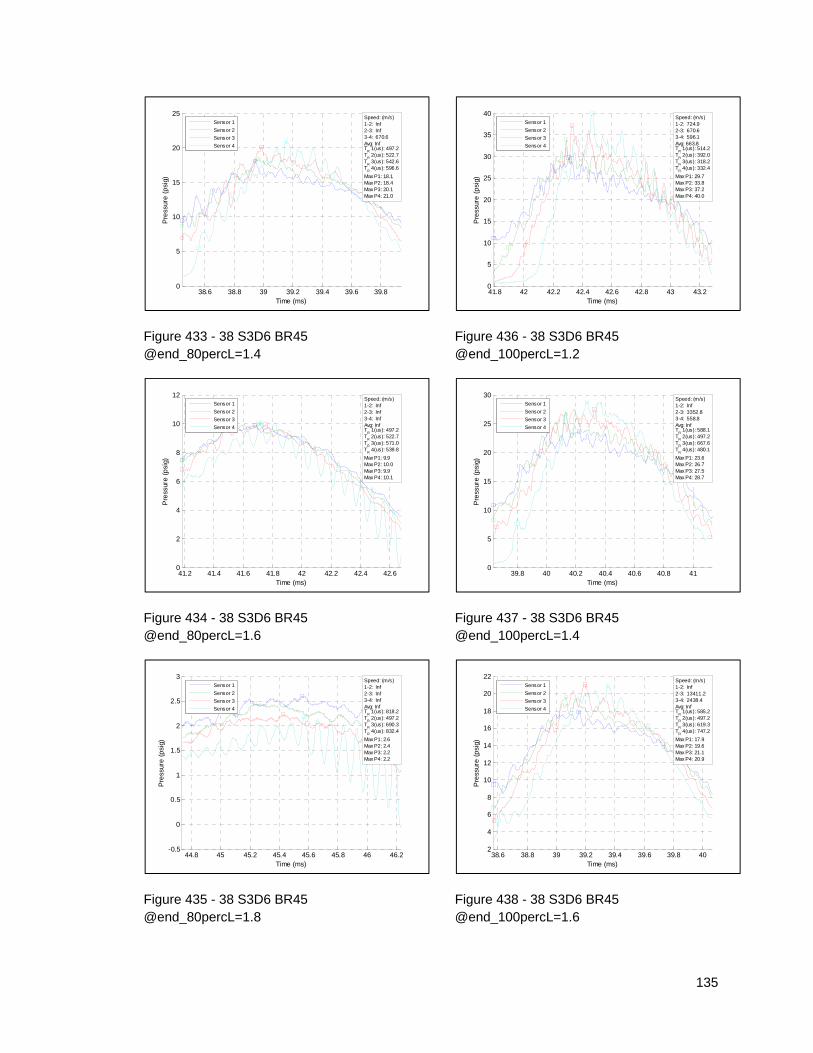
135
Figure 433 - 38 S3D6 BR45 @end_80percL=1.4
Figure 434 - 38 S3D6 BR45 @end_80percL=1.6
Figure 435 - 38 S3D6 BR45 @end_80percL=1.8
Figure 436 - 38 S3D6 BR45 @end_100percL=1.2
Figure 437 - 38 S3D6 BR45 @end_100percL=1.4
Figure 438 - 38 S3D6 BR45 @end_100percL=1.6
38.6 38.8 39 39.2 39.4 39.6 39.80
5
10
15
20
25
Time (ms)
Pre
ssur
e (
psi
g)
Speed: (m/s)1-2: Inf2-3: Inf3-4: 670.6Avg: InfT
R 1(us): 497.2
TR 2(us): 522.7
TR 3(us): 542.6
TR 4(us): 596.6
Max P1: 18.1Max P2: 18.4Max P3: 20.1Max P4: 21.0
Sensor 1
Sensor 2
Sensor 3
Sensor 4
41.2 41.4 41.6 41.8 42 42.2 42.4 42.60
2
4
6
8
10
12
Time (ms)
Pre
ssur
e (
psi
g)
Speed: (m/s)1-2: Inf2-3: Inf3-4: InfAvg: InfT
R 1(us): 497.2
TR 2(us): 522.7
TR 3(us): 571.0
TR 4(us): 539.8
Max P1: 9.9Max P2: 10.0Max P3: 9.9Max P4: 10.1
Sensor 1
Sensor 2
Sensor 3
Sensor 4
44.8 45 45.2 45.4 45.6 45.8 46 46.2-0.5
0
0.5
1
1.5
2
2.5
3
Time (ms)
Pre
ssur
e (
psi
g)
Speed: (m/s)1-2: Inf2-3: Inf3-4: InfAvg: InfT
R 1(us): 818.2
TR 2(us): 497.2
TR 3(us): 690.3
TR 4(us): 832.4
Max P1: 2.6Max P2: 2.4Max P3: 2.2Max P4: 2.2
Sensor 1
Sensor 2
Sensor 3
Sensor 4
41.8 42 42.2 42.4 42.6 42.8 43 43.20
5
10
15
20
25
30
35
40
Time (ms)
Pre
ssur
e (
psi
g)
Speed: (m/s)1-2: 724.92-3: 670.63-4: 596.1Avg: 663.8T
R 1(us): 514.2
TR 2(us): 392.0
TR 3(us): 318.2
TR 4(us): 332.4
Max P1: 29.7Max P2: 33.8Max P3: 37.2Max P4: 40.0
Sensor 1
Sensor 2
Sensor 3
Sensor 4
39.8 40 40.2 40.4 40.6 40.8 410
5
10
15
20
25
30
Time (ms)
Pre
ssur
e (
psi
g)
Speed: (m/s)1-2: Inf2-3: 3352.83-4: 558.8Avg: InfT
R 1(us): 588.1
TR 2(us): 497.2
TR 3(us): 667.6
TR 4(us): 480.1
Max P1: 23.6Max P2: 26.7Max P3: 27.5Max P4: 28.7
Sensor 1
Sensor 2
Sensor 3
Sensor 4
38.6 38.8 39 39.2 39.4 39.6 39.8 402
4
6
8
10
12
14
16
18
20
22
Time (ms)
Pre
ssur
e (
psi
g)
Speed: (m/s)1-2: Inf2-3: 13411.23-4: 2438.4Avg: InfT
R 1(us): 585.2
TR 2(us): 497.2
TR 3(us): 619.3
TR 4(us): 747.2
Max P1: 17.9Max P2: 19.6Max P3: 21.1Max P4: 20.9
Sensor 1
Sensor 2
Sensor 3
Sensor 4
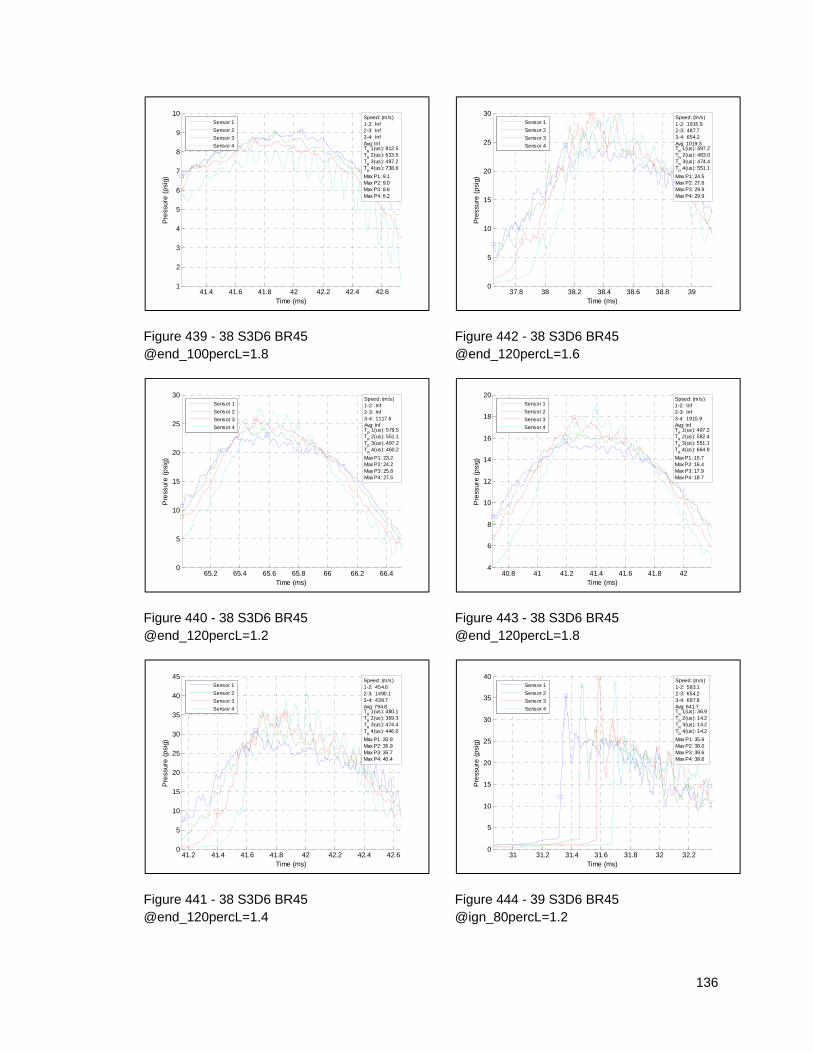
136
Figure 439 - 38 S3D6 BR45 @end_100percL=1.8
Figure 440 - 38 S3D6 BR45 @end_120percL=1.2
Figure 441 - 38 S3D6 BR45 @end_120percL=1.4
Figure 442 - 38 S3D6 BR45 @end_120percL=1.6
Figure 443 - 38 S3D6 BR45 @end_120percL=1.8
Figure 444 - 39 S3D6 BR45 @ign_80percL=1.2
41.4 41.6 41.8 42 42.2 42.4 42.61
2
3
4
5
6
7
8
9
10
Time (ms)
Pre
ssur
e (
psi
g)
Speed: (m/s)1-2: Inf2-3: Inf3-4: InfAvg: InfT
R 1(us): 812.5
TR 2(us): 633.5
TR 3(us): 497.2
TR 4(us): 738.6
Max P1: 9.1Max P2: 9.0Max P3: 8.6Max P4: 8.2
Sensor 1
Sensor 2
Sensor 3
Sensor 4
65.2 65.4 65.6 65.8 66 66.2 66.40
5
10
15
20
25
30
Time (ms)
Pre
ssur
e (
psi
g)
Speed: (m/s)1-2: Inf2-3: Inf3-4: 1117.6Avg: InfT
R 1(us): 579.5
TR 2(us): 551.1
TR 3(us): 497.2
TR 4(us): 460.2
Max P1: 23.2Max P2: 24.2Max P3: 25.8Max P4: 27.5
Sensor 1
Sensor 2
Sensor 3
Sensor 4
41.2 41.4 41.6 41.8 42 42.2 42.4 42.60
5
10
15
20
25
30
35
40
45
Time (ms)
Pre
ssur
e (
psi
g)
Speed: (m/s)1-2: 454.62-3: 1490.13-4: 439.7Avg: 794.8T
R 1(us): 480.1
TR 2(us): 369.3
TR 3(us): 474.4
TR 4(us): 446.0
Max P1: 30.9Max P2: 35.9Max P3: 35.7Max P4: 40.4
Sensor 1
Sensor 2
Sensor 3
Sensor 4
37.8 38 38.2 38.4 38.6 38.8 390
5
10
15
20
25
30
Time (ms)
Pre
ssur
e (
psi
g)
Speed: (m/s)1-2: 1915.92-3: 487.73-4: 654.2Avg: 1019.3T
R 1(us): 497.2
TR 2(us): 483.0
TR 3(us): 474.4
TR 4(us): 551.1
Max P1: 24.5Max P2: 27.6Max P3: 29.9Max P4: 29.9
Sensor 1
Sensor 2
Sensor 3
Sensor 4
40.8 41 41.2 41.4 41.6 41.8 424
6
8
10
12
14
16
18
20
Time (ms)
Pre
ssur
e (
psi
g)
Speed: (m/s)1-2: Inf2-3: Inf3-4: 1915.9Avg: InfT
R 1(us): 497.2
TR 2(us): 582.4
TR 3(us): 551.1
TR 4(us): 664.8
Max P1: 15.7Max P2: 16.4Max P3: 17.9Max P4: 18.7
Sensor 1
Sensor 2
Sensor 3
Sensor 4
31 31.2 31.4 31.6 31.8 32 32.20
5
10
15
20
25
30
35
40
Time (ms)
Pre
ssur
e (
psi
g)
Speed: (m/s)1-2: 583.12-3: 654.23-4: 687.8Avg: 641.7T
R 1(us): 36.9
TR 2(us): 14.2
TR 3(us): 14.2
TR 4(us): 14.2
Max P1: 35.6Max P2: 38.0Max P3: 39.6Max P4: 38.6
Sensor 1
Sensor 2
Sensor 3
Sensor 4
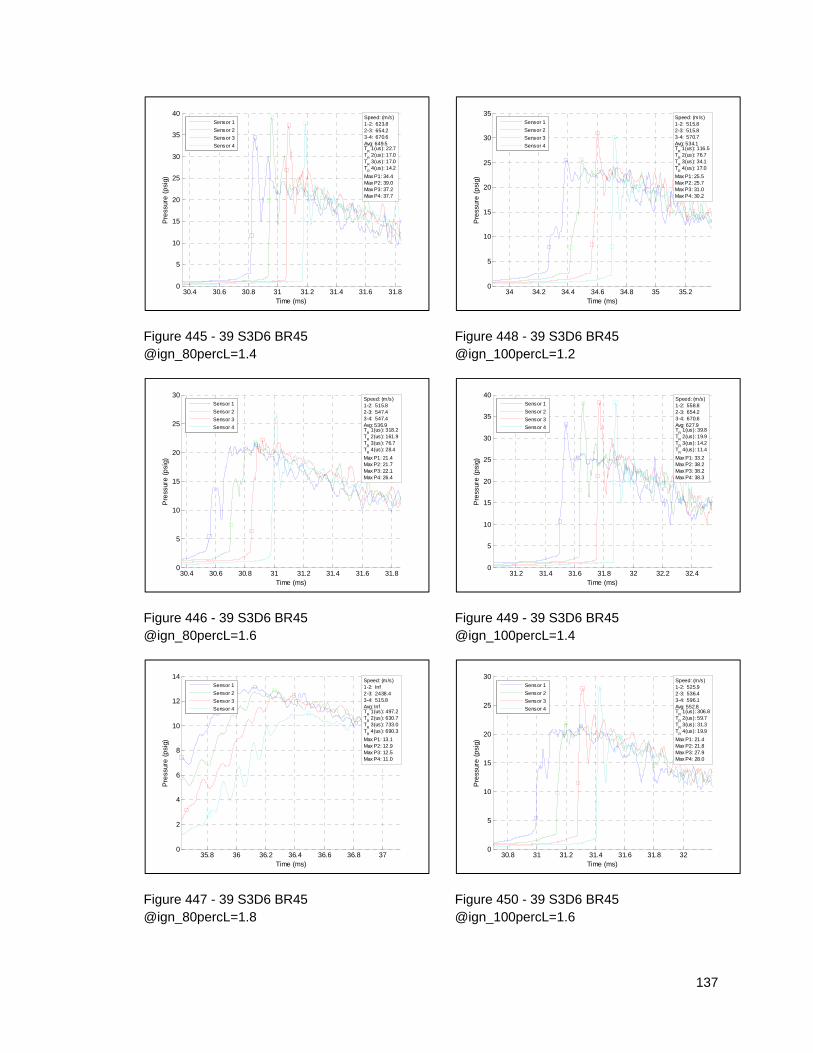
137
Figure 445 - 39 S3D6 BR45 @ign_80percL=1.4
Figure 446 - 39 S3D6 BR45 @ign_80percL=1.6
Figure 447 - 39 S3D6 BR45 @ign_80percL=1.8
Figure 448 - 39 S3D6 BR45 @ign_100percL=1.2
Figure 449 - 39 S3D6 BR45 @ign_100percL=1.4
Figure 450 - 39 S3D6 BR45 @ign_100percL=1.6
30.4 30.6 30.8 31 31.2 31.4 31.6 31.80
5
10
15
20
25
30
35
40
Time (ms)
Pre
ssur
e (
psi
g)
Speed: (m/s)1-2: 623.82-3: 654.23-4: 670.6Avg: 649.5T
R 1(us): 22.7
TR 2(us): 17.0
TR 3(us): 17.0
TR 4(us): 14.2
Max P1: 34.4Max P2: 39.0Max P3: 37.2Max P4: 37.7
Sensor 1
Sensor 2
Sensor 3
Sensor 4
30.4 30.6 30.8 31 31.2 31.4 31.6 31.80
5
10
15
20
25
30
Time (ms)
Pre
ssur
e (
psi
g)
Speed: (m/s)1-2: 515.82-3: 547.43-4: 547.4Avg: 536.9T
R 1(us): 318.2
TR 2(us): 161.9
TR 3(us): 76.7
TR 4(us): 28.4
Max P1: 21.4Max P2: 21.7Max P3: 22.1Max P4: 26.4
Sensor 1
Sensor 2
Sensor 3
Sensor 4
35.8 36 36.2 36.4 36.6 36.8 370
2
4
6
8
10
12
14
Time (ms)
Pre
ssur
e (
psi
g)
Speed: (m/s)1-2: Inf2-3: 2438.43-4: 515.8Avg: InfT
R 1(us): 497.2
TR 2(us): 630.7
TR 3(us): 733.0
TR 4(us): 690.3
Max P1: 13.1Max P2: 12.9Max P3: 12.5Max P4: 11.0
Sensor 1
Sensor 2
Sensor 3
Sensor 4
34 34.2 34.4 34.6 34.8 35 35.20
5
10
15
20
25
30
35
Time (ms)
Pre
ssur
e (
psi
g)
Speed: (m/s)1-2: 515.82-3: 515.83-4: 570.7Avg: 534.1T
R 1(us): 116.5
TR 2(us): 76.7
TR 3(us): 34.1
TR 4(us): 17.0
Max P1: 25.5Max P2: 25.7Max P3: 31.0Max P4: 30.2
Sensor 1
Sensor 2
Sensor 3
Sensor 4
31.2 31.4 31.6 31.8 32 32.2 32.40
5
10
15
20
25
30
35
40
Time (ms)
Pre
ssur
e (
psi
g)
Speed: (m/s)1-2: 558.82-3: 654.23-4: 670.6Avg: 627.9T
R 1(us): 39.8
TR 2(us): 19.9
TR 3(us): 14.2
TR 4(us): 11.4
Max P1: 33.2Max P2: 38.2Max P3: 38.2Max P4: 38.3
Sensor 1
Sensor 2
Sensor 3
Sensor 4
30.8 31 31.2 31.4 31.6 31.8 320
5
10
15
20
25
30
Time (ms)
Pre
ssur
e (
psi
g)
Speed: (m/s)1-2: 525.92-3: 536.43-4: 596.1Avg: 552.8T
R 1(us): 306.8
TR 2(us): 59.7
TR 3(us): 31.3
TR 4(us): 19.9
Max P1: 21.4Max P2: 21.8Max P3: 27.9Max P4: 28.0
Sensor 1
Sensor 2
Sensor 3
Sensor 4
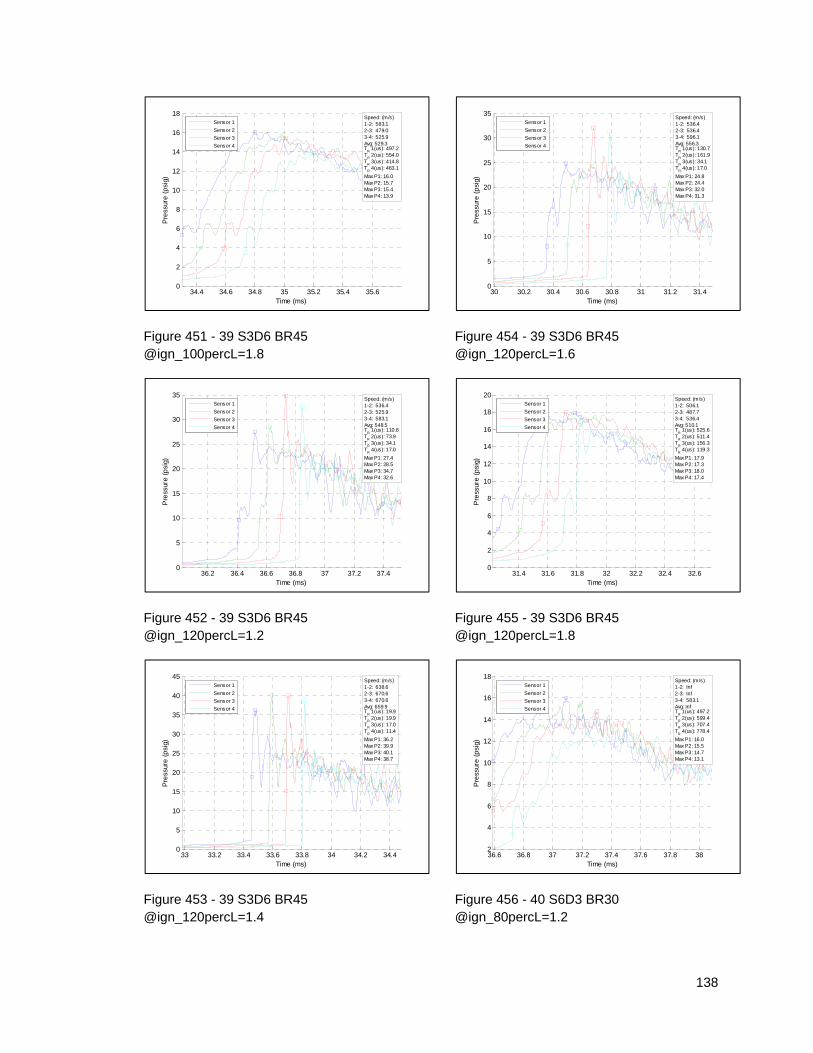
138
Figure 451 - 39 S3D6 BR45 @ign_100percL=1.8
Figure 452 - 39 S3D6 BR45 @ign_120percL=1.2
Figure 453 - 39 S3D6 BR45 @ign_120percL=1.4
Figure 454 - 39 S3D6 BR45 @ign_120percL=1.6
Figure 455 - 39 S3D6 BR45 @ign_120percL=1.8
Figure 456 - 40 S6D3 BR30 @ign_80percL=1.2
34.4 34.6 34.8 35 35.2 35.4 35.60
2
4
6
8
10
12
14
16
18
Time (ms)
Pre
ssur
e (
psi
g)
Speed: (m/s)1-2: 583.12-3: 479.03-4: 525.9Avg: 529.3T
R 1(us): 497.2
TR 2(us): 554.0
TR 3(us): 414.8
TR 4(us): 463.1
Max P1: 16.0Max P2: 15.7Max P3: 15.4Max P4: 13.9
Sensor 1
Sensor 2
Sensor 3
Sensor 4
36.2 36.4 36.6 36.8 37 37.2 37.40
5
10
15
20
25
30
35
Time (ms)
Pre
ssur
e (
psi
g)
Speed: (m/s)1-2: 536.42-3: 525.93-4: 583.1Avg: 548.5T
R 1(us): 110.8
TR 2(us): 73.9
TR 3(us): 34.1
TR 4(us): 17.0
Max P1: 27.4Max P2: 28.5Max P3: 34.7Max P4: 32.6
Sensor 1
Sensor 2
Sensor 3
Sensor 4
33 33.2 33.4 33.6 33.8 34 34.2 34.40
5
10
15
20
25
30
35
40
45
Time (ms)
Pre
ssur
e (
psi
g)
Speed: (m/s)1-2: 638.62-3: 670.63-4: 670.6Avg: 659.9T
R 1(us): 19.9
TR 2(us): 19.9
TR 3(us): 17.0
TR 4(us): 11.4
Max P1: 36.2Max P2: 39.9Max P3: 40.1Max P4: 38.7
Sensor 1
Sensor 2
Sensor 3
Sensor 4
30 30.2 30.4 30.6 30.8 31 31.2 31.40
5
10
15
20
25
30
35
Time (ms)
Pre
ssur
e (
psi
g)
Speed: (m/s)1-2: 536.42-3: 536.43-4: 596.1Avg: 556.3T
R 1(us): 130.7
TR 2(us): 161.9
TR 3(us): 34.1
TR 4(us): 17.0
Max P1: 24.8Max P2: 24.4Max P3: 32.0Max P4: 31.3
Sensor 1
Sensor 2
Sensor 3
Sensor 4
31.4 31.6 31.8 32 32.2 32.4 32.60
2
4
6
8
10
12
14
16
18
20
Time (ms)
Pre
ssur
e (
psi
g)
Speed: (m/s)1-2: 506.12-3: 487.73-4: 536.4Avg: 510.1T
R 1(us): 525.6
TR 2(us): 511.4
TR 3(us): 156.3
TR 4(us): 119.3
Max P1: 17.9Max P2: 17.3Max P3: 18.0Max P4: 17.4
Sensor 1
Sensor 2
Sensor 3
Sensor 4
36.6 36.8 37 37.2 37.4 37.6 37.8 382
4
6
8
10
12
14
16
18
Time (ms)
Pre
ssur
e (
psi
g)
Speed: (m/s)1-2: Inf2-3: Inf3-4: 583.1Avg: InfT
R 1(us): 497.2
TR 2(us): 599.4
TR 3(us): 707.4
TR 4(us): 778.4
Max P1: 16.0Max P2: 15.5Max P3: 14.7Max P4: 13.1
Sensor 1
Sensor 2
Sensor 3
Sensor 4
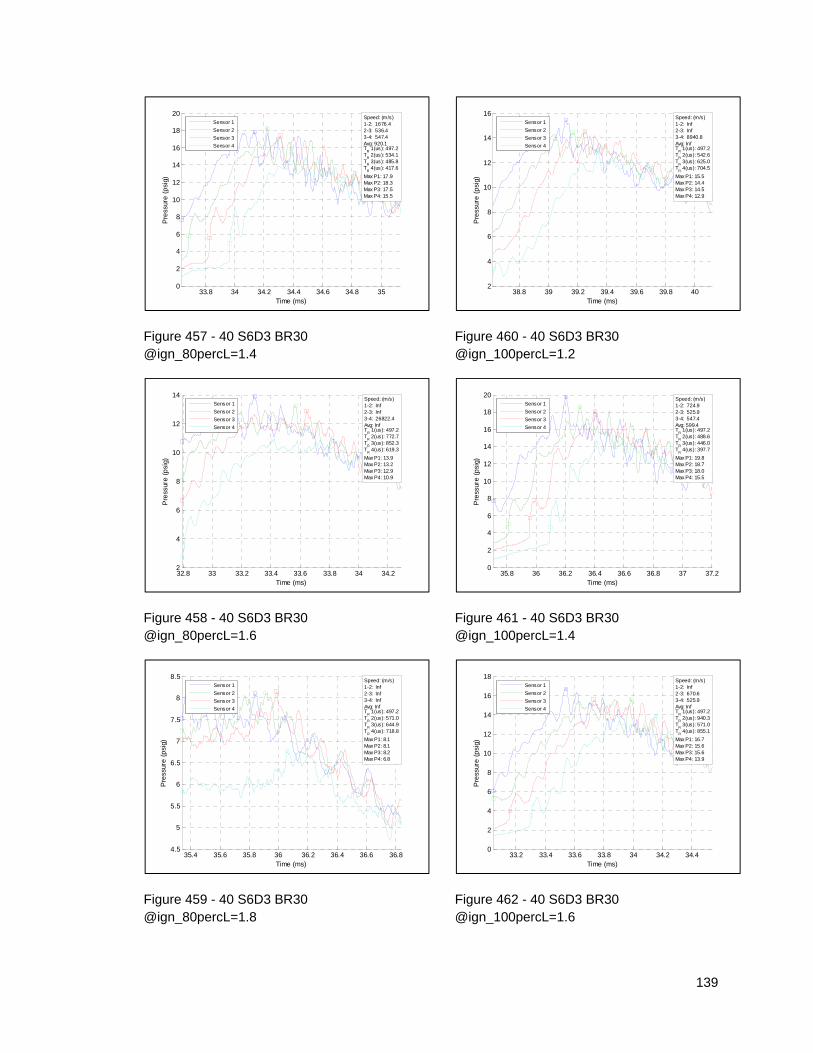
139
Figure 457 - 40 S6D3 BR30 @ign_80percL=1.4
Figure 458 - 40 S6D3 BR30 @ign_80percL=1.6
Figure 459 - 40 S6D3 BR30 @ign_80percL=1.8
Figure 460 - 40 S6D3 BR30 @ign_100percL=1.2
Figure 461 - 40 S6D3 BR30 @ign_100percL=1.4
Figure 462 - 40 S6D3 BR30 @ign_100percL=1.6
33.8 34 34.2 34.4 34.6 34.8 350
2
4
6
8
10
12
14
16
18
20
Time (ms)
Pre
ssur
e (
psi
g)
Speed: (m/s)1-2: 1676.42-3: 536.43-4: 547.4Avg: 920.1T
R 1(us): 497.2
TR 2(us): 534.1
TR 3(us): 485.8
TR 4(us): 417.6
Max P1: 17.9Max P2: 18.3Max P3: 17.5Max P4: 15.5
Sensor 1
Sensor 2
Sensor 3
Sensor 4
32.8 33 33.2 33.4 33.6 33.8 34 34.22
4
6
8
10
12
14
Time (ms)
Pre
ssur
e (
psi
g)
Speed: (m/s)1-2: Inf2-3: Inf3-4: 26822.4Avg: InfT
R 1(us): 497.2
TR 2(us): 772.7
TR 3(us): 852.3
TR 4(us): 619.3
Max P1: 13.9Max P2: 13.2Max P3: 12.9Max P4: 10.9
Sensor 1
Sensor 2
Sensor 3
Sensor 4
35.4 35.6 35.8 36 36.2 36.4 36.6 36.84.5
5
5.5
6
6.5
7
7.5
8
8.5
Time (ms)
Pre
ssur
e (
psi
g)
Speed: (m/s)1-2: Inf2-3: Inf3-4: InfAvg: InfT
R 1(us): 497.2
TR 2(us): 571.0
TR 3(us): 644.9
TR 4(us): 718.8
Max P1: 8.1Max P2: 8.1Max P3: 8.2Max P4: 6.8
Sensor 1
Sensor 2
Sensor 3
Sensor 4
38.8 39 39.2 39.4 39.6 39.8 402
4
6
8
10
12
14
16
Time (ms)
Pre
ssur
e (
psi
g)
Speed: (m/s)1-2: Inf2-3: Inf3-4: 8940.8Avg: InfT
R 1(us): 497.2
TR 2(us): 542.6
TR 3(us): 625.0
TR 4(us): 704.5
Max P1: 15.5Max P2: 14.4Max P3: 14.5Max P4: 12.9
Sensor 1
Sensor 2
Sensor 3
Sensor 4
35.8 36 36.2 36.4 36.6 36.8 37 37.20
2
4
6
8
10
12
14
16
18
20
Time (ms)
Pre
ssur
e (
psi
g)
Speed: (m/s)1-2: 724.92-3: 525.93-4: 547.4Avg: 599.4T
R 1(us): 497.2
TR 2(us): 488.6
TR 3(us): 446.0
TR 4(us): 397.7
Max P1: 19.8Max P2: 18.7Max P3: 18.0Max P4: 15.5
Sensor 1
Sensor 2
Sensor 3
Sensor 4
33.2 33.4 33.6 33.8 34 34.2 34.40
2
4
6
8
10
12
14
16
18
Time (ms)
Pre
ssur
e (
psi
g)
Speed: (m/s)1-2: Inf2-3: 670.63-4: 525.9Avg: InfT
R 1(us): 497.2
TR 2(us): 940.3
TR 3(us): 571.0
TR 4(us): 855.1
Max P1: 16.7Max P2: 15.6Max P3: 15.6Max P4: 13.9
Sensor 1
Sensor 2
Sensor 3
Sensor 4
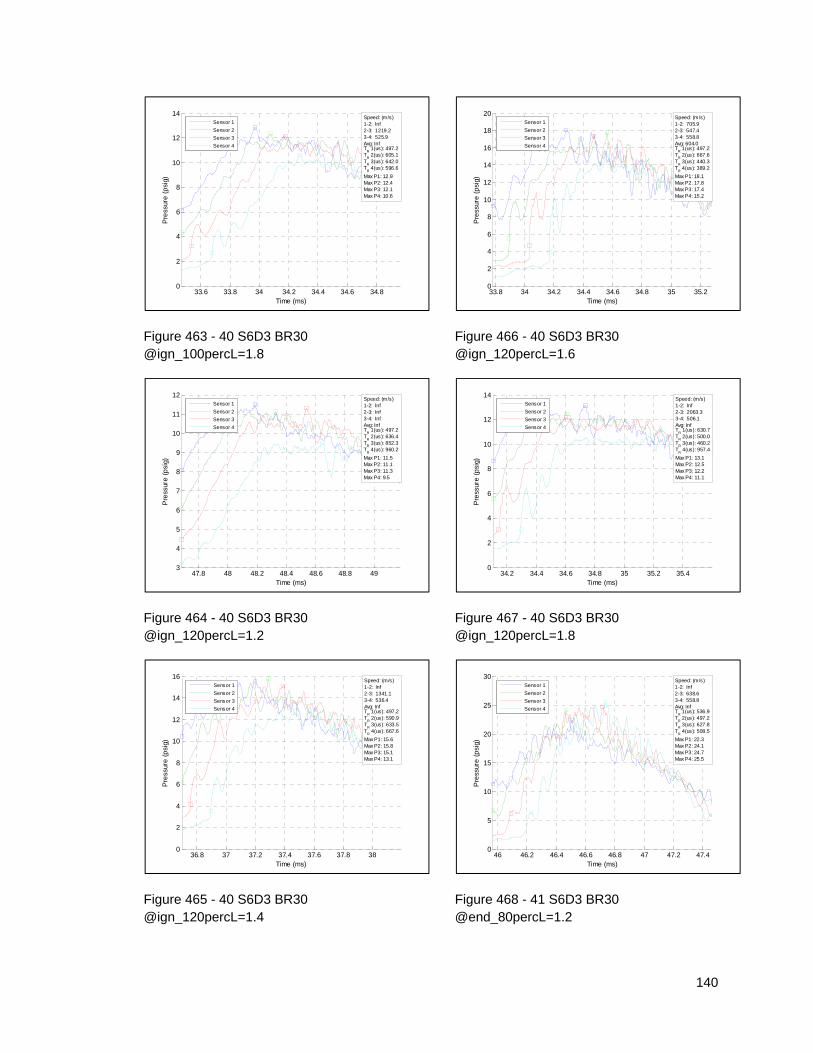
140
Figure 463 - 40 S6D3 BR30 @ign_100percL=1.8
Figure 464 - 40 S6D3 BR30 @ign_120percL=1.2
Figure 465 - 40 S6D3 BR30 @ign_120percL=1.4
Figure 466 - 40 S6D3 BR30 @ign_120percL=1.6
Figure 467 - 40 S6D3 BR30 @ign_120percL=1.8
Figure 468 - 41 S6D3 BR30 @end_80percL=1.2
33.6 33.8 34 34.2 34.4 34.6 34.80
2
4
6
8
10
12
14
Time (ms)
Pre
ssur
e (
psi
g)
Speed: (m/s)1-2: Inf2-3: 1219.23-4: 525.9Avg: InfT
R 1(us): 497.2
TR 2(us): 605.1
TR 3(us): 642.0
TR 4(us): 596.6
Max P1: 12.9Max P2: 12.4Max P3: 12.1Max P4: 10.6
Sensor 1
Sensor 2
Sensor 3
Sensor 4
47.8 48 48.2 48.4 48.6 48.8 493
4
5
6
7
8
9
10
11
12
Time (ms)
Pre
ssur
e (
psi
g)
Speed: (m/s)1-2: Inf2-3: Inf3-4: InfAvg: InfT
R 1(us): 497.2
TR 2(us): 636.4
TR 3(us): 852.3
TR 4(us): 960.2
Max P1: 11.5Max P2: 11.1Max P3: 11.3Max P4: 9.5
Sensor 1
Sensor 2
Sensor 3
Sensor 4
36.8 37 37.2 37.4 37.6 37.8 380
2
4
6
8
10
12
14
16
Time (ms)
Pre
ssur
e (
psi
g)
Speed: (m/s)1-2: Inf2-3: 1341.13-4: 536.4Avg: InfT
R 1(us): 497.2
TR 2(us): 590.9
TR 3(us): 633.5
TR 4(us): 667.6
Max P1: 15.6Max P2: 15.8Max P3: 15.1Max P4: 13.1
Sensor 1
Sensor 2
Sensor 3
Sensor 4
33.8 34 34.2 34.4 34.6 34.8 35 35.20
2
4
6
8
10
12
14
16
18
20
Time (ms)
Pre
ssur
e (
psi
g)
Speed: (m/s)1-2: 705.92-3: 547.43-4: 558.8Avg: 604.0T
R 1(us): 497.2
TR 2(us): 667.6
TR 3(us): 440.3
TR 4(us): 389.2
Max P1: 18.1Max P2: 17.8Max P3: 17.4Max P4: 15.2
Sensor 1
Sensor 2
Sensor 3
Sensor 4
34.2 34.4 34.6 34.8 35 35.2 35.40
2
4
6
8
10
12
14
Time (ms)
Pre
ssur
e (
psi
g)
Speed: (m/s)1-2: Inf2-3: 2063.33-4: 506.1Avg: InfT
R 1(us): 630.7
TR 2(us): 500.0
TR 3(us): 460.2
TR 4(us): 957.4
Max P1: 13.1Max P2: 12.5Max P3: 12.2Max P4: 11.1
Sensor 1
Sensor 2
Sensor 3
Sensor 4
46 46.2 46.4 46.6 46.8 47 47.2 47.40
5
10
15
20
25
30
Time (ms)
Pre
ssur
e (
psi
g)
Speed: (m/s)1-2: Inf2-3: 638.63-4: 558.8Avg: InfT
R 1(us): 536.9
TR 2(us): 497.2
TR 3(us): 627.8
TR 4(us): 508.5
Max P1: 22.3Max P2: 24.1Max P3: 24.7Max P4: 25.5
Sensor 1
Sensor 2
Sensor 3
Sensor 4
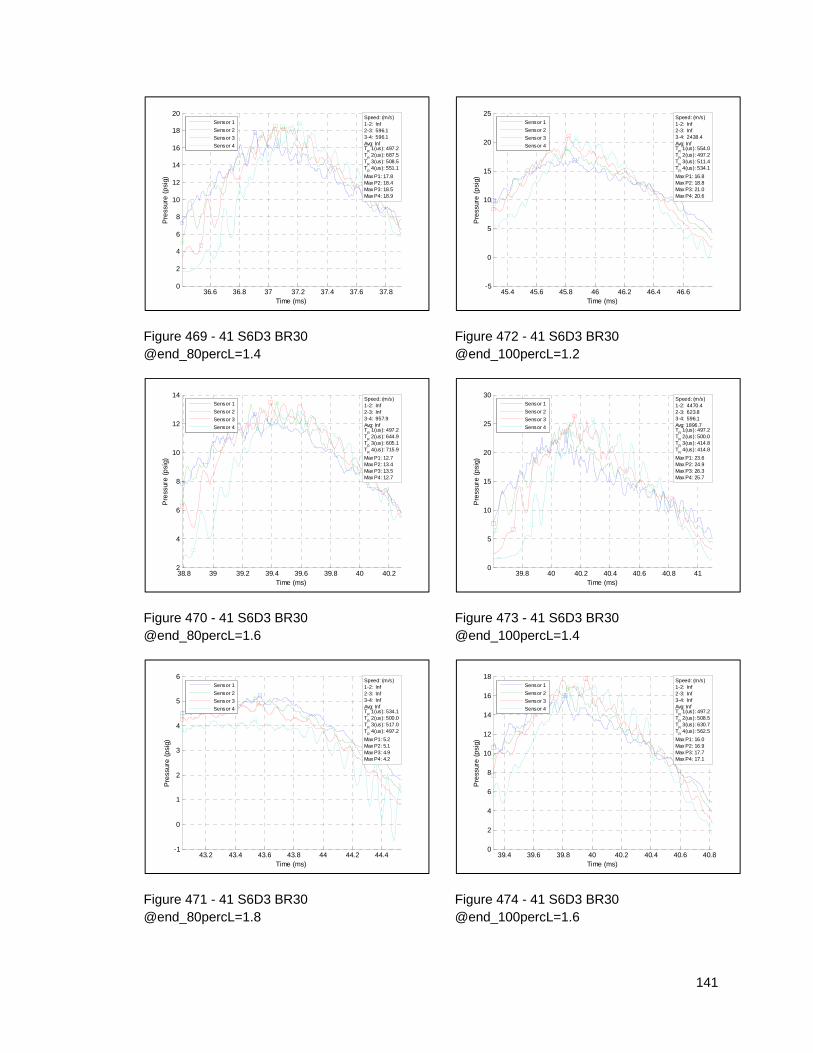
141
Figure 469 - 41 S6D3 BR30 @end_80percL=1.4
Figure 470 - 41 S6D3 BR30 @end_80percL=1.6
Figure 471 - 41 S6D3 BR30 @end_80percL=1.8
Figure 472 - 41 S6D3 BR30 @end_100percL=1.2
Figure 473 - 41 S6D3 BR30 @end_100percL=1.4
Figure 474 - 41 S6D3 BR30 @end_100percL=1.6
36.6 36.8 37 37.2 37.4 37.6 37.80
2
4
6
8
10
12
14
16
18
20
Time (ms)
Pre
ssur
e (
psi
g)
Speed: (m/s)1-2: Inf2-3: 596.13-4: 596.1Avg: InfT
R 1(us): 497.2
TR 2(us): 687.5
TR 3(us): 508.5
TR 4(us): 551.1
Max P1: 17.8Max P2: 18.4Max P3: 18.5Max P4: 18.9
Sensor 1
Sensor 2
Sensor 3
Sensor 4
38.8 39 39.2 39.4 39.6 39.8 40 40.22
4
6
8
10
12
14
Time (ms)
Pre
ssur
e (
psi
g)
Speed: (m/s)1-2: Inf2-3: Inf3-4: 957.9Avg: InfT
R 1(us): 497.2
TR 2(us): 644.9
TR 3(us): 605.1
TR 4(us): 715.9
Max P1: 12.7Max P2: 13.4Max P3: 13.5Max P4: 12.7
Sensor 1
Sensor 2
Sensor 3
Sensor 4
43.2 43.4 43.6 43.8 44 44.2 44.4-1
0
1
2
3
4
5
6
Time (ms)
Pre
ssur
e (
psi
g)
Speed: (m/s)1-2: Inf2-3: Inf3-4: InfAvg: InfT
R 1(us): 534.1
TR 2(us): 500.0
TR 3(us): 517.0
TR 4(us): 497.2
Max P1: 5.2Max P2: 5.1Max P3: 4.9Max P4: 4.2
Sensor 1
Sensor 2
Sensor 3
Sensor 4
45.4 45.6 45.8 46 46.2 46.4 46.6-5
0
5
10
15
20
25
Time (ms)
Pre
ssur
e (
psi
g)
Speed: (m/s)1-2: Inf2-3: Inf3-4: 2438.4Avg: InfT
R 1(us): 554.0
TR 2(us): 497.2
TR 3(us): 511.4
TR 4(us): 534.1
Max P1: 16.8Max P2: 18.8Max P3: 21.0Max P4: 20.6
Sensor 1
Sensor 2
Sensor 3
Sensor 4
39.8 40 40.2 40.4 40.6 40.8 410
5
10
15
20
25
30
Time (ms)
Pre
ssur
e (
psi
g)
Speed: (m/s)1-2: 4470.42-3: 623.83-4: 596.1Avg: 1896.7T
R 1(us): 497.2
TR 2(us): 500.0
TR 3(us): 414.8
TR 4(us): 414.8
Max P1: 23.6Max P2: 24.9Max P3: 26.3Max P4: 25.7
Sensor 1
Sensor 2
Sensor 3
Sensor 4
39.4 39.6 39.8 40 40.2 40.4 40.6 40.80
2
4
6
8
10
12
14
16
18
Time (ms)
Pre
ssur
e (
psi
g)
Speed: (m/s)1-2: Inf2-3: Inf3-4: InfAvg: InfT
R 1(us): 497.2
TR 2(us): 508.5
TR 3(us): 630.7
TR 4(us): 562.5
Max P1: 16.0Max P2: 16.9Max P3: 17.7Max P4: 17.1
Sensor 1
Sensor 2
Sensor 3
Sensor 4
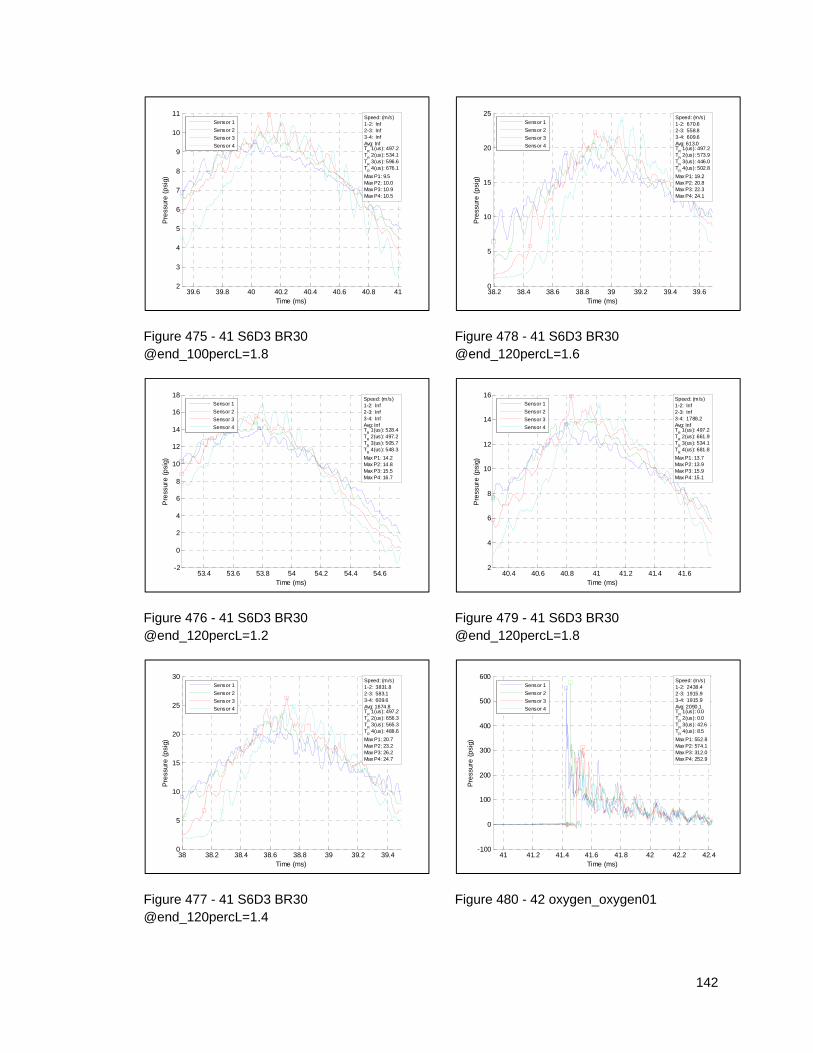
142
Figure 475 - 41 S6D3 BR30 @end_100percL=1.8
Figure 476 - 41 S6D3 BR30 @end_120percL=1.2
Figure 477 - 41 S6D3 BR30 @end_120percL=1.4
Figure 478 - 41 S6D3 BR30 @end_120percL=1.6
Figure 479 - 41 S6D3 BR30 @end_120percL=1.8
Figure 480 - 42 oxygen_oxygen01
39.6 39.8 40 40.2 40.4 40.6 40.8 412
3
4
5
6
7
8
9
10
11
Time (ms)
Pre
ssur
e (
psi
g)
Speed: (m/s)1-2: Inf2-3: Inf3-4: InfAvg: InfT
R 1(us): 497.2
TR 2(us): 534.1
TR 3(us): 596.6
TR 4(us): 676.1
Max P1: 9.5Max P2: 10.0Max P3: 10.9Max P4: 10.5
Sensor 1
Sensor 2
Sensor 3
Sensor 4
53.4 53.6 53.8 54 54.2 54.4 54.6-2
0
2
4
6
8
10
12
14
16
18
Time (ms)
Pre
ssur
e (
psi
g)
Speed: (m/s)1-2: Inf2-3: Inf3-4: InfAvg: InfT
R 1(us): 528.4
TR 2(us): 497.2
TR 3(us): 505.7
TR 4(us): 548.3
Max P1: 14.2Max P2: 14.8Max P3: 15.5Max P4: 16.7
Sensor 1
Sensor 2
Sensor 3
Sensor 4
38 38.2 38.4 38.6 38.8 39 39.2 39.40
5
10
15
20
25
30
Time (ms)
Pre
ssur
e (
psi
g)
Speed: (m/s)1-2: 3831.82-3: 583.13-4: 609.6Avg: 1674.8T
R 1(us): 497.2
TR 2(us): 656.3
TR 3(us): 565.3
TR 4(us): 488.6
Max P1: 20.7Max P2: 23.2Max P3: 26.2Max P4: 24.7
Sensor 1
Sensor 2
Sensor 3
Sensor 4
38.2 38.4 38.6 38.8 39 39.2 39.4 39.60
5
10
15
20
25
Time (ms)
Pre
ssur
e (
psi
g)
Speed: (m/s)1-2: 670.62-3: 558.83-4: 609.6Avg: 613.0T
R 1(us): 497.2
TR 2(us): 573.9
TR 3(us): 446.0
TR 4(us): 502.8
Max P1: 19.2Max P2: 20.8Max P3: 22.3Max P4: 24.1
Sensor 1
Sensor 2
Sensor 3
Sensor 4
40.4 40.6 40.8 41 41.2 41.4 41.62
4
6
8
10
12
14
16
Time (ms)
Pre
ssur
e (
psi
g)
Speed: (m/s)1-2: Inf2-3: Inf3-4: 1788.2Avg: InfT
R 1(us): 497.2
TR 2(us): 661.9
TR 3(us): 534.1
TR 4(us): 681.8
Max P1: 13.7Max P2: 13.9Max P3: 15.9Max P4: 15.1
Sensor 1
Sensor 2
Sensor 3
Sensor 4
41 41.2 41.4 41.6 41.8 42 42.2 42.4-100
0
100
200
300
400
500
600
Time (ms)
Pre
ssur
e (
psi
g)
Speed: (m/s)1-2: 2438.42-3: 1915.93-4: 1915.9Avg: 2090.1T
R 1(us): 0.0
TR 2(us): 0.0
TR 3(us): 42.6
TR 4(us): 8.5
Max P1: 552.8Max P2: 574.1Max P3: 312.0Max P4: 252.9
Sensor 1
Sensor 2
Sensor 3
Sensor 4

143
Figure 481 - 42 oxygen_oxygen02
Figure 482 - 42 oxygen_oxygen03
35.6 35.8 36 36.2 36.4 36.6 36.8 37-200
0
200
400
600
800
1000
Time (ms)
Pre
ssur
e (
psi
g)
Speed: (m/s)1-2: 2980.32-3: 2980.33-4: 2438.4Avg: 2799.6T
R 1(us): 2.8
TR 2(us): 2.8
TR 3(us): 2.8
TR 4(us): 2.8
Max P1: 970.9Max P2: 962.4Max P3: 768.5Max P4: 561.3
Sensor 1
Sensor 2
Sensor 3
Sensor 4
23.2 23.4 23.6 23.8 24 24.2 24.4-2
0
2
4
6
8
10
12
14
16
18
Time (ms)
Pre
ssur
e (
psi
g)
Speed: (m/s)1-2: Inf2-3: Inf3-4: InfAvg: InfT
R 1(us): 656.3
TR 2(us): 497.2
TR 3(us): 517.0
TR 4(us): 525.6
Max P1: 13.3Max P2: 13.8Max P3: 13.9Max P4: 16.3
Sensor 1
Sensor 2
Sensor 3
Sensor 4
Related Documents