Design and optimisation of hydrometric networks Training module on Hydrological Expertise and IWRM WMO / OMM Volta-HYCOS Project IRD - Unite OBHI (Observatoires Hydrologiques and Ingenierie)

Welcome message from author
This document is posted to help you gain knowledge. Please leave a comment to let me know what you think about it! Share it to your friends and learn new things together.
Transcript

Design and
optimisation of
hydrometric
networks
Training module on Hydrological
Expertise and
IWRM
WMO / OMM
Volta-HYCOS Project
IRD -
Unite
OBHI (Observatoires Hydrologiques and Ingenierie)
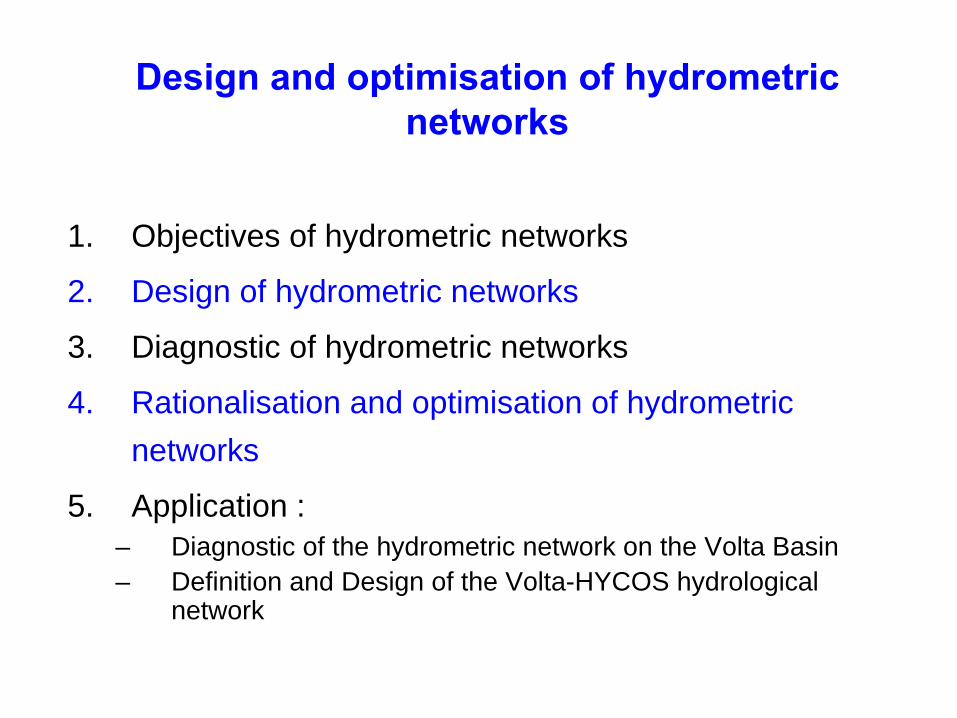
1. Objectives of hydrometric networks
2. Design of hydrometric networks
3. Diagnostic of hydrometric networks
4. Rationalisation and optimisation of hydrometric networks
5. Application : – Diagnostic of the hydrometric network on the Volta Basin– Definition and Design of the Volta-HYCOS hydrological
network
Design and
optimisation of
hydrometric networks
1. Objectives of
hydrometric
networks
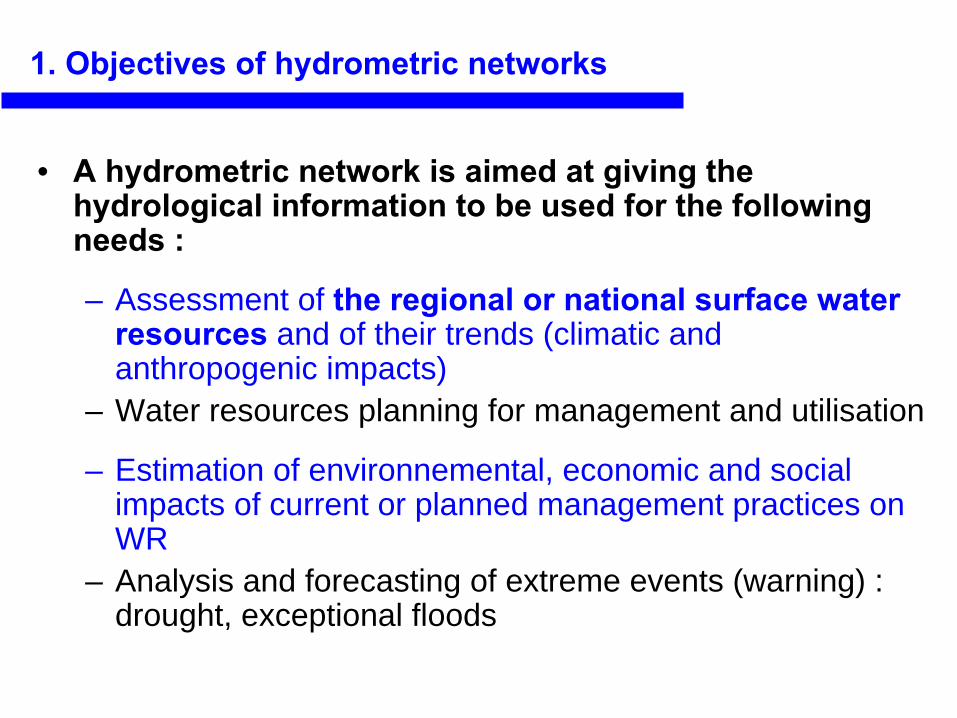
• A hydrometric
network is
aimed
at
giving
the hydrological
information to be
used
for the
following
needs
:
– Assessment of the
regional
or national surface water resources
and of their trends (climatic and
anthropogenic impacts)– Water resources planning for management and utilisation
– Estimation of environnemental, economic and social impacts of current or planned management practices on WR
– Analysis and forecasting of extreme events (warning) : drought, exceptional floods

• The
design of
a network should
answer
the
following questions :
– What hydrological variables are to be recorded ?– Where will they be recorded ?– What is the frequency of recording?– What is the duration of the recording programme? – What is the level of quality of the recorded parameters?
2. Design of
hydrometric
networks

• Definitions : – Minimum density of network:
• = 1st step in the establishment of a hydrological network• It enables us to determine the hydrological characteristics at
any point in the region• But cannot answer to specific needs of WR management and
utilisation • The stations in such networks should be monitored
continuously and their data should be of quality
– Optimal network
2. Design of
hydrometric
networks

• Definitions :– Optimal network:
Optimal networks enable a good interpolation between the stations at any point in the area covered by the network, with enough accuracy for WRs management and utilisation purposes
2. Design of
hydrometric
networks

• Types of networks : – National / regional networks – Representative or experimental basins
• From a few km2 to several km2• Measurements are carried out during one year up
to several years• All the hydro-climatic variables are measured
(Water levels, discharge, evaporation, evapotranspiration, infiltration…) in order to model the relation between rainfall and discharge
2. Design of
hydrometric
networks
• Types of stations making up a network :– Main gauges
Permanent stations and continously and correctly monitored. These are reference stations for statistical analysis
– Secondary
gaugesMaintained for a limitted number of years but sufficient in order to establish good correlation with data at main stations
– Special
gaugesBased on specific needs : irrigation, navigation, flood forecasting, dams management, …
2. Design of
hydrometric
networks
2. Design of
hydrometric
networks
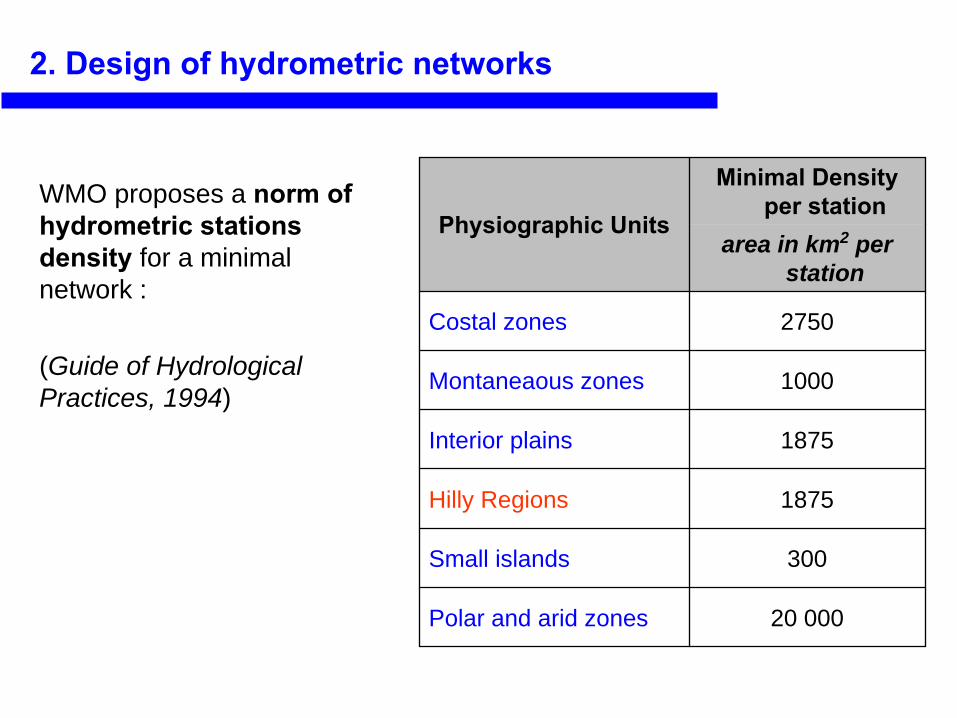
WMO proposes a norm
of
hydrometric
stations density
for a minimal network :
(Guide of Hydrological Practices, 1994)
Physiographic
Units
Minimal Density
per
stationarea in km2 per
station
Costal zones 2750
Montaneaous zones 1000
Interior plains 1875
Hilly Regions 1875
Small islands 300
Polar and arid zones 20 000

Some rules and criteria
• For transboundary water balance : it is indispensable to have for each international river a gauge at the entrancy and/or the outlet of the country
• Confluence between a major and a minor tributary : it is useful to have a gauge in order to appreciate the discharge variation for the main river, downstream of the confluence
• Along a river, installation of a gauge should consider the other stations available on the river : if the difference between the flows at 2 stations is inferior to the margin of error of flow measurement, it is useless to intercalate a supplementary station
2. Design of
hydrometric
networks
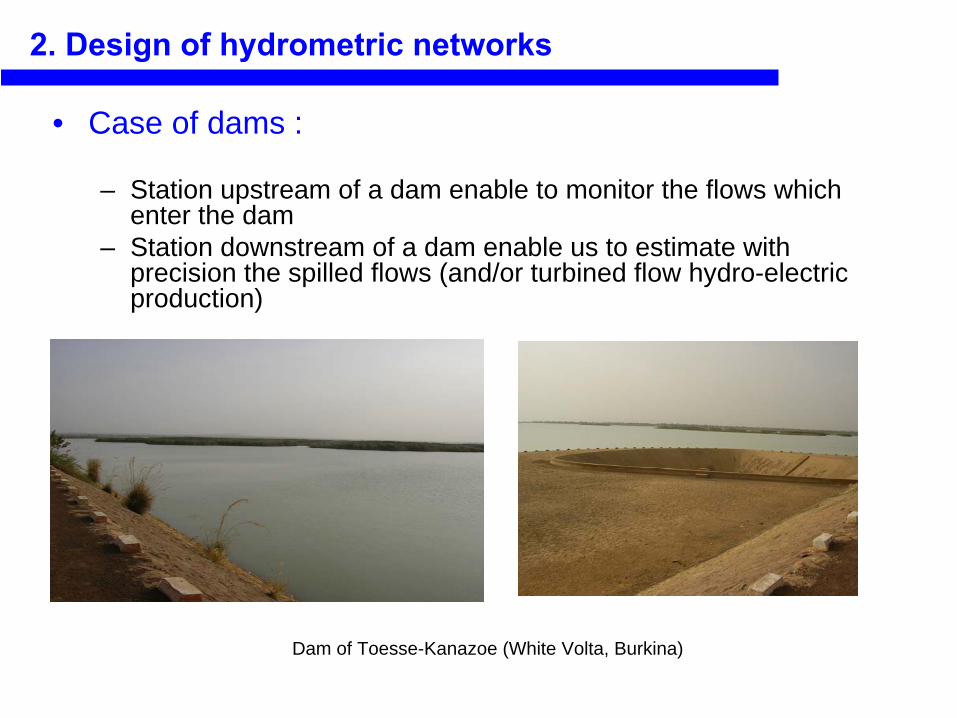
• Case of dams :
– Station upstream of a dam enable to monitor the flows which enter the dam
– Station downstream of a dam enable us to estimate with precision the spilled flows (and/or turbined flow hydro-electric production)
2. Design of
hydrometric
networks
Dam of Toesse-Kanazoe (White Volta, Burkina)
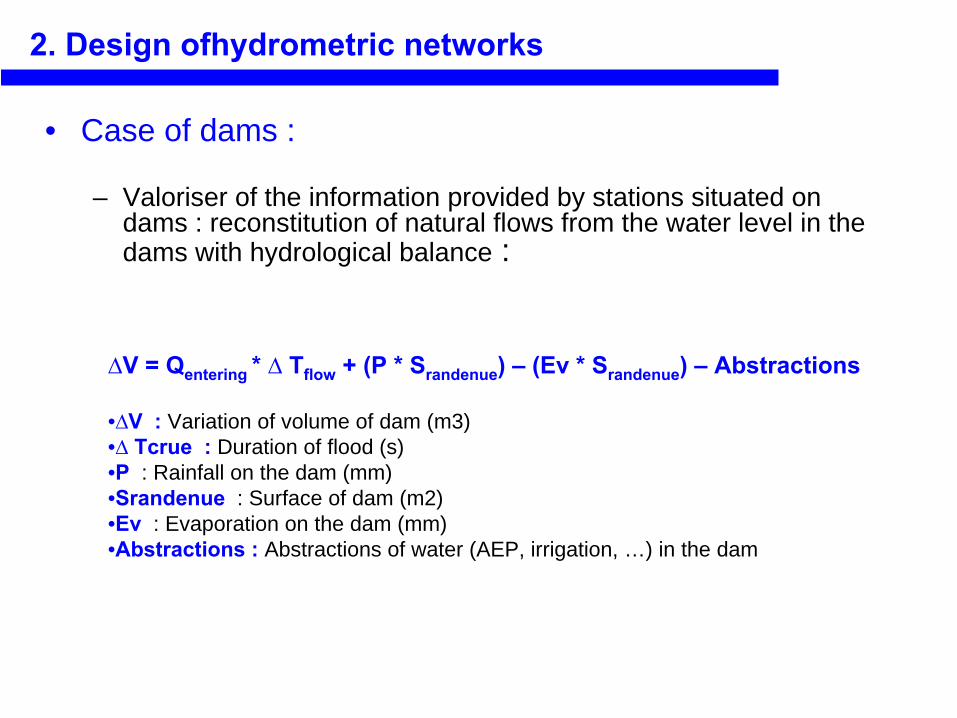
• Case of dams :
– Valoriser of the information provided by stations situated on dams : reconstitution of natural flows from the water level in the dams with hydrological balance :
2. Design ofhydrometric
networks
∆V = Qentering
* ∆
Tflow
+ (P * Srandenue
) –
(Ev
* Srandenue
) –
Abstractions
•∆V : Variation of volume of dam (m3)•∆
Tcrue
:
Duration of flood (s)•P : Rainfall on the dam (mm)•Srandenue
: Surface of dam (m2)•Ev
: Evaporation on the dam (mm)•Abstractions :
Abstractions of water (AEP, irrigation, …) in the dam

Some rules and criteria :
• Rivers passing through or near a city where there’s important abstraction from the river : a station upstream and a station downstream of the city are necessary
• Region with large irrigable area with appreciable abstraction from the river : a station upstream and a station downstream of the irrigable area are necessary
2. Design of
hydrometric
networks
Water Supply pomping station at Nawuni (Ghana)

Water Supply pomping station at Nawuni (Ghana)

• To optimise a network, is to find the best compromise between the richness and the interest of hydrological
information on the
one
hand, and the cost
of
acquisition of data on the
other
hand
• Context in West Africa: important degradation of networks since the 80’s -90’s (reduction of budget of hydrological services / pullout of IRD / ex-ORSTOM in francophone countries)
• Necessity of rationalising existing networks by selecting the stations which must be monitored as priority
3. Rationalisation and
optimisation of
hydrometric
networks

• Technics of optimisation of networks (complementary)– Survey among users of data on the usefulness of each station of
the network ;– Multi-criteria analysis based on indicators which enable us to
appreciate the usefulness of each station in the network and to characterize it
3. Rationalisation and optimisation of hydrometric networks

1. Survey technics
– Objective :Highlight the level of utility of each station on the basis of the use of data by users
– Method : questionnaires
– The survey enables us to highlight : A) The type of use of the station :
– stations which are used for management and other decision;– station which are used for regional and long-term analysis of
water resources– station which are used for design and planning purposes
3. Rationalisation and optimisation of hydrometric networks

1. Survey technics
– The survey enables to highlight :
B) The use of data at the station: – Flood forecast and warning;– Current Management (navigation, level control, dam
management, monitoring of floods and drought,..)– Legal obligation (minimum discharge to be maintained)– Long term statistics (flood frequency analysis, trend
analysis, quartiles etc)– Regional hydrological Analysis (Regional regression
equation for quartiles, regional parameters of hydrological models,..)
3. Rationalisation and optimisation of hydrometric networks

1. Survey technics
– The survey enables to highlight :
B) The use of data at the station : – Hydraulic and hydrological design (design of reservoirs,
hydro-power infrastructure, hydraulic infrastructure,..)– Planification of water resources (planification for water
distribution, ..)– Water quality analysis (quality monitoring, quality
modelling, sea water intrution,..)– …
3. Rationalisation and optimisation of hydrometric networks
1. Survey technics
C) Identify the users of data at the station :– Governmental institutions (NHSs, Agriculture, Fishery, …)– Basin organisations;– Dams managers;– Consulting firms;– environmental monitoring institutes– Research institutes, Universities, – …
3. Rationalisation and optimisation of hydrometric networks
2. Multi-criteria analysis of network
– Objective : diagnose the stations of a network on the basis of different criteria / indicators
– Mean : Points can be attributed to each criteria in order to determine a global score for the station, which will be monitored in priority
– Criteria of evaluation of stations
3. Rationalisation and optimisation of hydrometric networks
2. Multi-criteria analysis of network
Criteria
of
evaluation
of
stations :
- Regional representation of the station : - Is the station representative of a basin and/or of a climatic
zone ?– Drainage area at the station– Lengh of time of the series at the station :
- Longevity of the station (reference stations with series of data > 30 years)
- Regularity of observations of water levels (series with few gaps)
– Level of correlation between the station and other reference stations
3. Rationalisation and optimisation of hydrometric networks

2. Multi-criteria analysis of network
Criteria
of
evaluation
of
stations :
- Stability of the station in time- Constructions upstream or downstream of the station can
modify conditions of flow- Beware of loss of staff gages or reference pillars (bench
marks) (eg : following to construction of bridges, …) - Quality of data at the station :
- Quality of water level data (recordings and readings)- Quality of rating curve : number flow measurements, and
stability of rating curve
3. Rationalisation and optimisation of hydrometric networks

2. Multi-criteria analysis of network
Criteria
of
evaluation
of
stations :
- Usefulness of the station (on the basis of survey) :• Forecasting of High and low flows• Evaluation of flows within riparian countries ;• Evaluation of resource at national level for planification, management and
la prise of decision ;• Evaluation of change on the long term• …
- Accessibility- Economic criteria :
- Running cost (depends on type of equipement, frequency of visits, organisations of field missions)
- Cost of maintenance of the stations

GIS approach for evaluation of hydrometric networks :Example of assessment of Burkina’s national hydrometric network – SNIEau
(National System Information ), 2004
- Spatial distribution of hydrological data in the country. Spatial parameters :• Density of hydrometric of stations • Quality and continuity of data • …
«
Availability
of
hydrological
data in the
sub
basins in Burkina »
(from
SNIEau, 2004)
3. Rationalisation and optimisation of hydrometric networks
NonePoorLowAverageGoodExcellent

Example of assessment of Burkina’s national hydrometric network – SNIEau (National Information System on Water), 2004
- Overlapped spatial information on :
- Availability of hydrological data
- Needs for hydrological data (population density, dams projects, …)…
- … Helps to better assess the weak points of the hydrometric network and to better plan its development
GIS approach for assessment of hydrolometric networks :
« Population density
per
basin and
hydrometric
network
» (from
SNIEau, 2004)
3. Rationalisation and optimisation of hydrometric networks
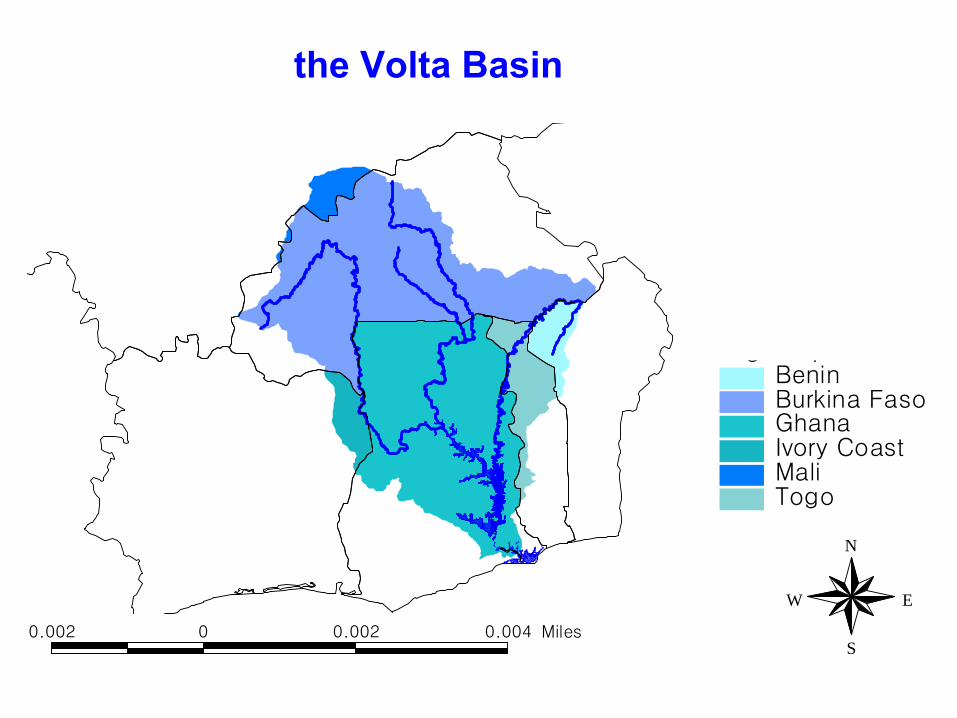
Some data on the Volta Basin :
– Transboundary basin shared between 6 countries : • Benin• Burkina• Cote d’Ivoire• Ghana• Mali• Togo
– Superficy : 400 000 km2
– Hydrographic network : • Black Volta (‘Mouhoun’ in Burkina Faso) • White Volta (‘Nakambe’ in Burkina Faso) • Red Volta (‘Nazinon’ in Burkina Faso) • OtiAkosombo dam (constructed in1964) : volume 148 billion m3 (of which 60Billion m3 are usable)
4. Diagnostic of hydrometric network on the Volta Basin
the
Volta Basin
Logo.shpBeninBurkina FasoGhanaIvory CoastMaliTogo
Voltal.shp01234
L_volta.shpVolta delta.shpTouspays.shp
0.002 0 0.002 0.004 Miles
N
EW
S

Distribution of the Area of the Volta basin between the different counties of the basin
4%
43%
3%
40%
4% 6%BéninBurkinaCôte d'IvoireGhanaMaliTogo
4. Diagnostic of hydrometric network on the Volta Basin
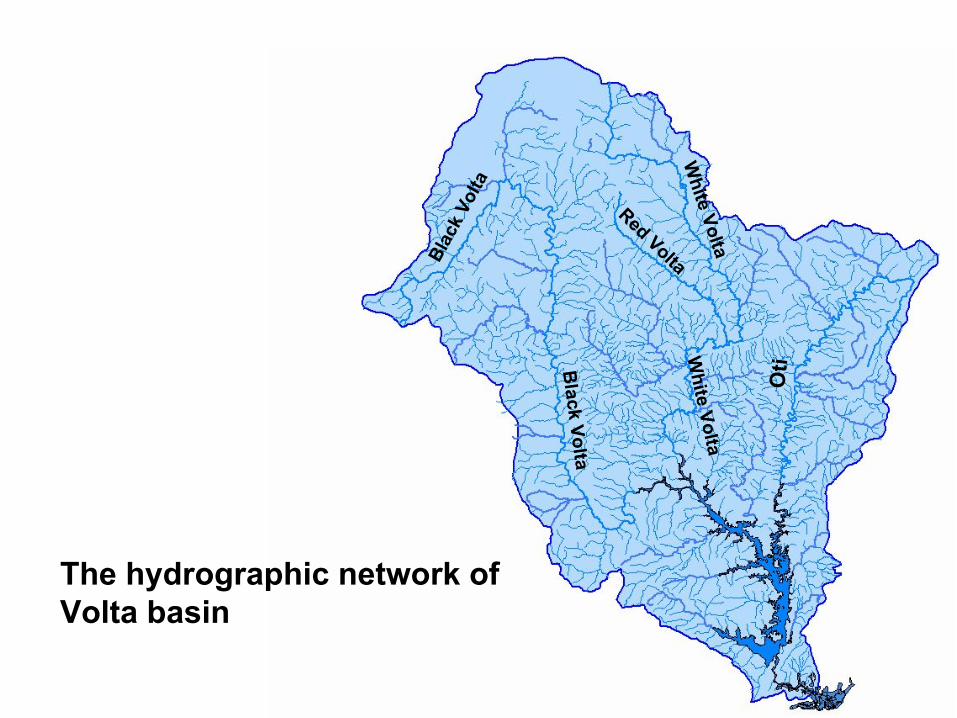
Black Volta
Oti
Blac
k Vo
lta
White Volta
Red VoltaW
hite Volta
The
hydrographic
network of Volta basin

Digital Elevation Model of the Volta Basin(from G. Jung « Regional Climate Change and the impact on hydrology
in the Volta Basin » - 2006)
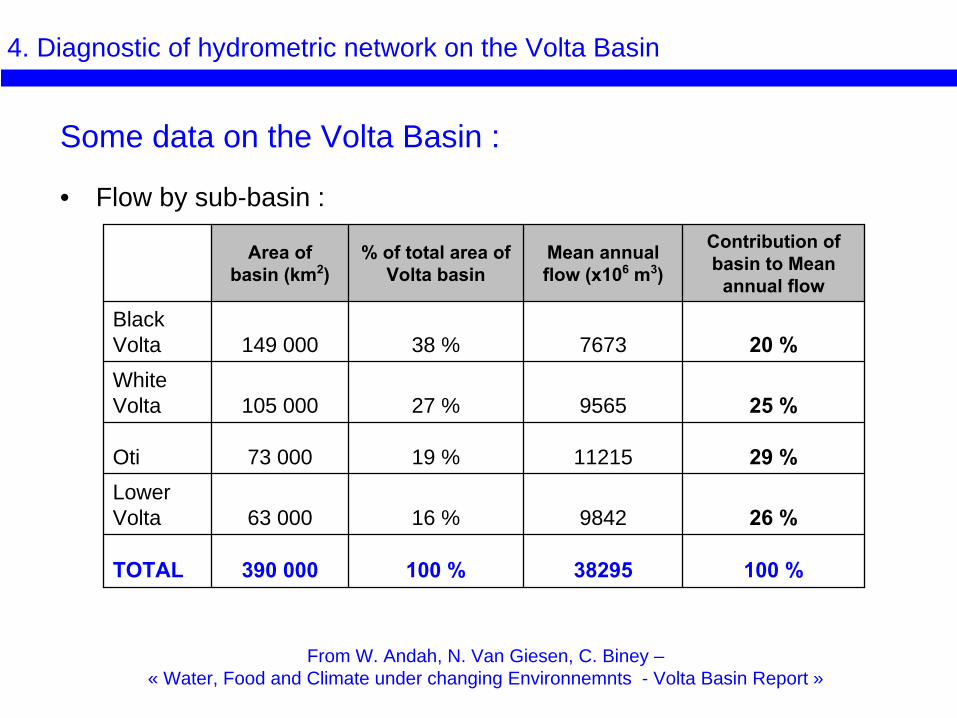
Area of
basin (km2)
% of
total area of
Volta basin
Mean
annual
flow
(x106
m3)
Contribution of
basin to Mean
annual
flow
Black Volta 149 000 38 % 7673 20 %White Volta 105 000 27 % 9565 25 %
Oti 73 000 19 % 11215 29 %Lower Volta 63 000 16 % 9842 26 %
TOTAL 390 000 100 % 38295 100 %
Some data on the Volta Basin :
• Flow by sub-basin :
4. Diagnostic of hydrometric network on the Volta Basin
From W. Andah, N. Van Giesen, C. Biney –« Water, Food and Climate under changing Environnemnts - Volta Basin Report »

The hydrometric network on the Volta Basin :
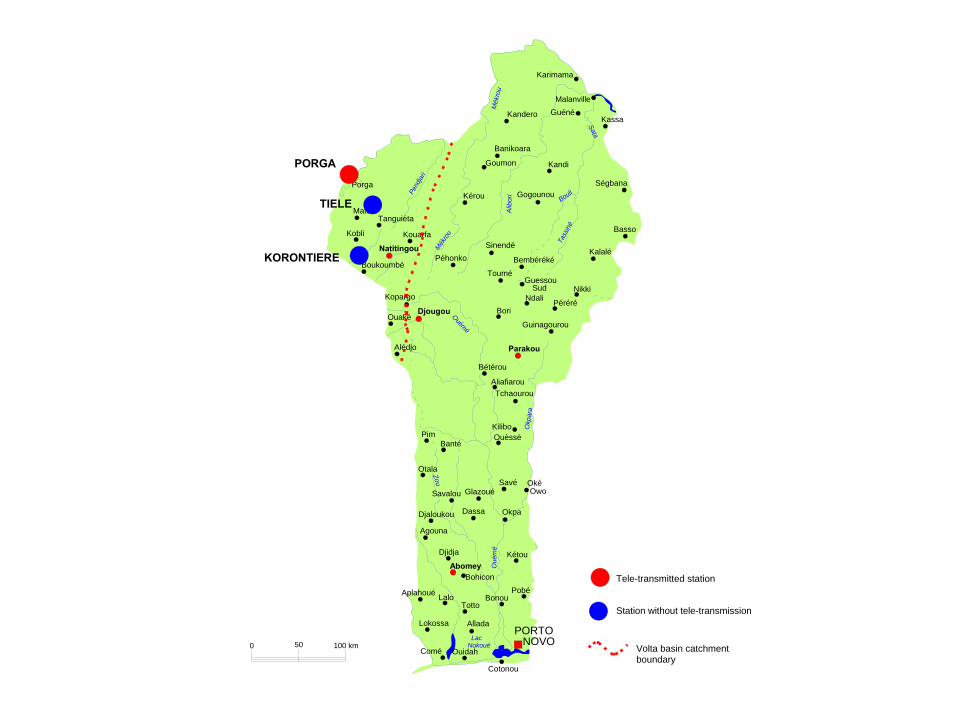
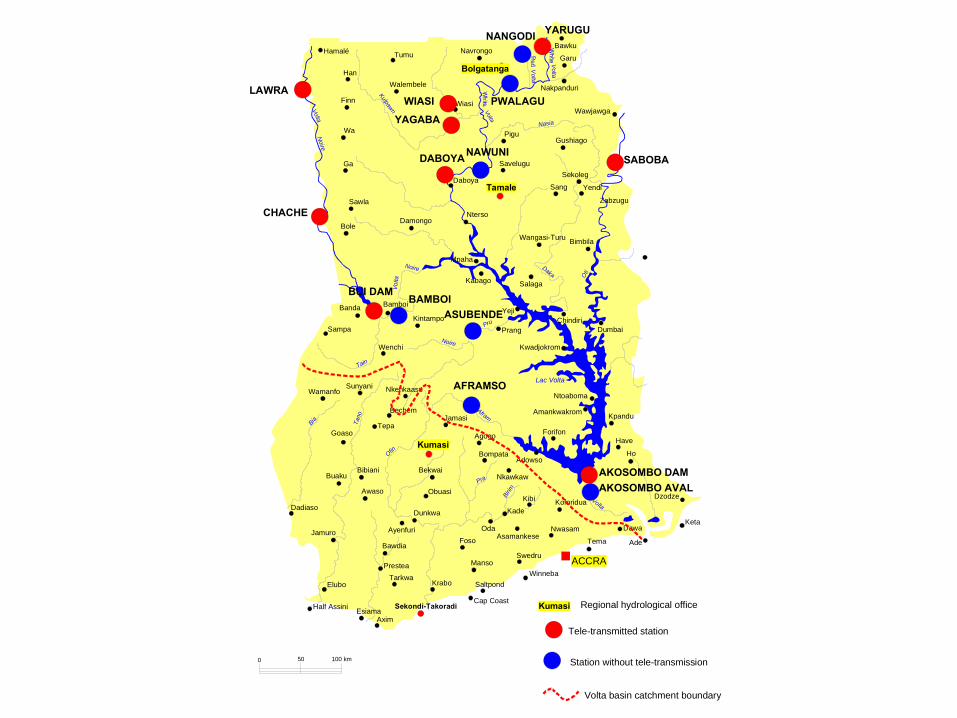
• Distribution of stations per countries :
CountriesArea of
Volta basin in the
country
Number
of
stations in the
Volta Basin (currently monitored)
Density
of
stationsArea/station
Density
of
stations recommended
by WMO
Benin 17 098 2 8549 17 (Mountaneous)
Burkina 178 000 55 3236 95
Cote d'Ivoire 12 500 3 ? 4167 7
Ghana 167 692 67 2503 89
Mali 15 392 0 - 8
Togo 26 700 9 ? 2967 27 (Mountaneous)
TOTAL 417 000 136 ? 3066 222
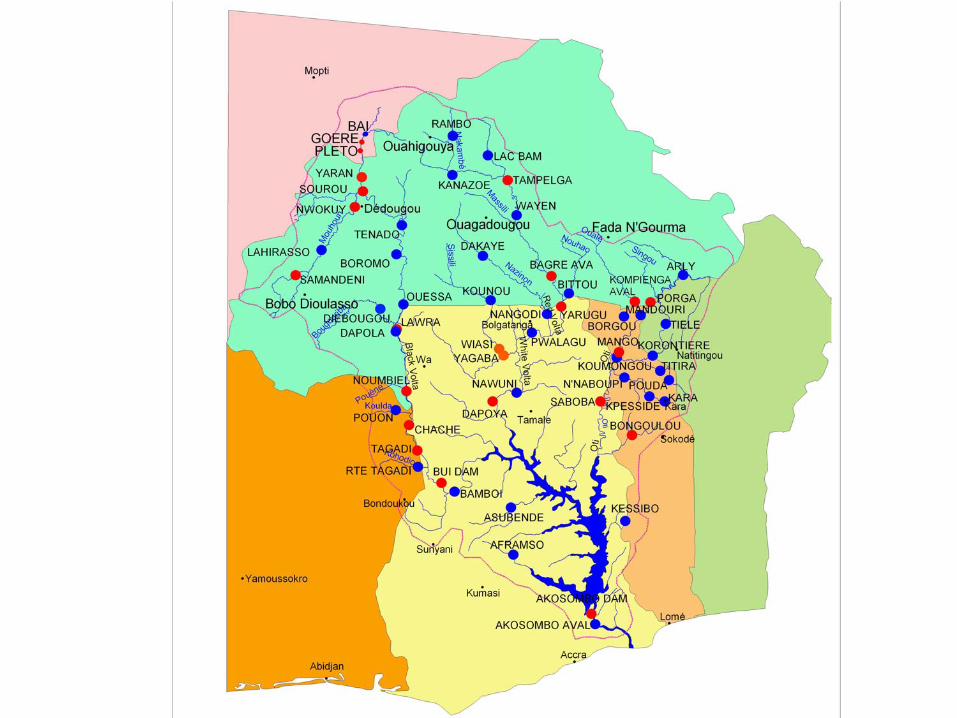
4. Diagnostic of hydrometric network on the Volta Basin

Distribution of hydrometric
stations on
the
Volta Basin

Evolution du nombre de stations hydrométriques exploitées sur le bassin de la Volta
0
10
20
30
40
50
60
70
80
90
100
110
120
130
Bénin Burkina Côte d'Ivoire Ghana Mali Togo
Nombre de stations sur le bassin de laVolta suivies historiquementNombre de stations sur le bassin de laVolta actuellement suivies
Hydrometric network on the Volta basin
• Trends in number of stations in the basin :
4. Diagnostic of hydrometric network on the Volta Basin

Hydrometric network on the Volta basin
• Trend in number of stations in the basin :
4. Diagnostic of hydrometric network on the Volta Basin
countries
Number
of
stations on the
Volta Basin (currently
monitored)
Number
of
stations on the
Volta Basin (before monitored)
Stations closed
or out of
use
Bénin 2 5 3
Burkina 55 128 73
Côte d'Ivoire 3 6 3 ?
Ghana 67 124 57
Mali 0 3 3
Togo 9 20 11
TOTAL 136 ? 286 150
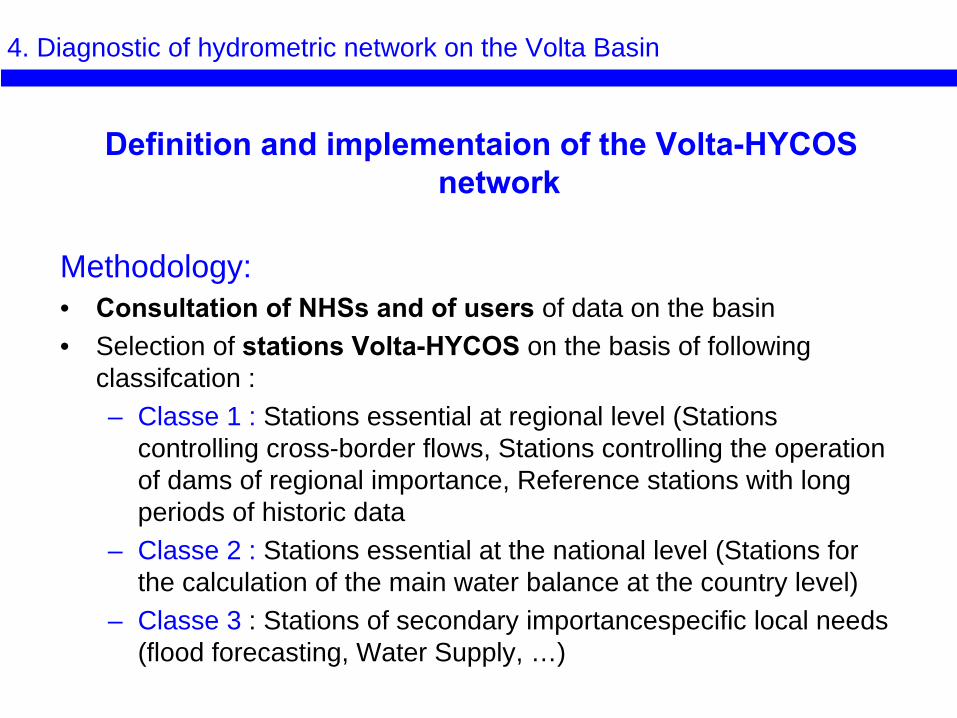
Definition
and
implementaion
of
the
Volta-HYCOS network
Methodology: • Consultation of
NHSs
and
of
users
of data on the basin• Selection of stations Volta-HYCOS
on the basis of following classifcation :– Classe 1 : Stations essential at regional level (Stations
controlling cross-border flows, Stations controlling the operation of dams of regional importance, Reference stations with long periods of historic data
– Classe 2 : Stations essential at the national level (Stations for the calculation of the main water balance at the country level)
– Classe 3 : Stations of secondary importancespecific local needs (flood forecasting, Water Supply, …)
4. Diagnostic of hydrometric network on the Volta Basin

##
###
#
#
####
#
##
#
#
#
###
#
##
####
##
##
##
#
##
#
#
#
##
##
#
#
#
#
#
#
## ###
#
#
##
##
#
#
#
#
##
#
#
#
#
#
#
#
#
#
#
#
#
##
#
##
#
#
# #
#######
###
#
#
#
######
## #
#
###
# ##
##
#
###########
###
#####
###
#
#
#
#
# # ##
###
#
###
### #
#
###
#
##
##
#
#
#
##
#
#
##
#
#
###
#
#
# ######
#####
#
####
##
#
#$T
$T$T
$T$T
$T
$T
$T$T
$T
$T
$T$T
$T$T
$T
$T
$T
$T
$T
$T
$T
$T
$T$T
$T
$T$T
$T
$T$T
$T
$T
$T
$T $T$T $T
$T
$T
$T
$T
$T$T
$T$T$T
$T
$T
$T
$T
$T
300 0 300 600 Miles
N
EW
S
Station Volta-HYCOS
networks nationaux
0 50 100 km
Karimama
MalanvilleGuéné
KassaKandero
Banikoara
Goumon Kandi
SégbanaGogounouKérou
Porga
MatériTanguiéta
Kobli Kouarfa
Natitingou
BoukoumbéPéhonko
Sinendé
Bembéréké
Toumé
Basso
Kalalé
NikkiGuessou
SudNdali Péréré
BoriDjougou
Kopargo
Ouaké
Alédjo
Guinagourou
Parakou
Bétérou
AliafiarouTchaourou
KiliboOuèssèPim
Banté
Otala
Savé OkéOwoGlazouéSavalou
Dassa OkpaDjaloukou
Agouna
Abomey
Djidja
Bohicon
Kétou
PobéBonou
TottoLaloAplahoué
Lokossa
Comé Ouidah
Cotonou
PORTONOVO
Mék
rou
Sata
Ali b
ori
Mék
rou
Bouli
Tass
iné
Pend
jari
Ouémé
Zou
Oué
mé
Allada
LacNokoué
Okp
ara
Volta basin catchment boundary
Tele-transmitted station
Station without tele-transmission
PORGA
KORONTIERE
TIELE

Ouahigouya
Kaya
Ouagadougou
Koudougou
Bobo Dioulasso
Banfora
Kpéré
Djgoué
Gaoua
Vigué
Bondigui
Ouo
Sidéradougou
Oualokanto
OuéléniOrodara
Koloko PéniLéo
Léna
KoumbiaBanzo
Bama
Djigouéra
Faramana
Sami
Satiri
BékouiPadéma
Pa
Fara
Pô Kompienga
Parma
Madjoari
Namounou
Diapaga
Botou
Kantchari
Matiakoali
TôSili
Boromo Manga
Kayao
DjaboFada-Ngourma
Foutouri
Gayéri
Bartibougou
MansilaLiptougou
Bani
KoalaSolna
Sebba
Yamba
Bilanga
Piéla
Mani
TionBogandé
Sampelga
Tibati
Boundoré
Dori
Falagountou
Seytanga
Markoy
Tin Akof
OursiDéou
Gorom Gorom
Gorgadji
Koutougou
AribindaBaraboulé
Djibo Tongomayé
DabloPensa
Yalgo
Ban
KainSolé
Pobé MangaoTitao
Pissala
Ziga
ZogoréToéni Séguénaga
Kongoussi
Kombori
Koupéla
Zoungou
DialgayGarango
TenkodogoNiago
Koubri
ZiniaréSiglé
Bagassi
BonaKona
TchéribaDédougou
Di
Bagaré
Tikaré
Mané
Toéguen
Tougo
Oualé
Tapoa
Diamongou
Sirba
Nakambé
Volta RougeSilissi
Volta Noire
Léraba
Com
oé
Volta
Noi
re
Kossi
Béli
0 50 100 km
Dédougou Regional hydrological office
SAMANDENI
NWOKUY
PONT DE LERY
YARAN
LAHIRASSO
TENADO
BOROMO
OUESSA
DIEBOUGOU
DAPOLA
BATIE
NOUMBIEL
RAMBO
BARRAGE DE KANAZOE
LAC DE BAM
KOMPIENGA AVAL
BAGRE AVALZIOU BITTOU
DAKAYE
TAMPELGA
WAYEN
KOUNOUARLY
Volta basin catchment boundary
Tele-transmitted station
Station without tele-transmission

Tengréla
BoundialiOdienné
Touba
SéguélaMankono
Korhogo
Katiola
Ferkessédougou
Dabakala
Bonna
Bondoukou
TandaBiankouro
Danané Man
Guiglo
Duékoué
Zuénoula
BouafléDaloa
BouakéBéoumi
Sakassou
Tiébissou
Vovoua
Tabou
San Pédro
Soubré
Issio
Simbra
Gagnoa
Sassandra
YAMOUSSOUKRO
Mbahialara
Doaukura AgnibilékrouBakanda
Dimbokro
FourmaoOumé
Lakola
Diva
Bangouanou
Tiassalé
Grand Lahou
Abengourou
ABIDJAN
Dobou
Bongouanou
Agboville
Alégé
Grand Bassam
Abaisso
Adiaké
0 50 100 km
Grabo
Sassandra
Limite du bassin de la Volta
Station avec télé-transmission
Station sans télé-transmission
Bondoukou Direction régionale
TAGADI
RTE TAGADI
POUON
0 50 100 km
Hamalé Tumu Navrongo
Bolgatanga
Bawku
Garu
Nakpanduri
Wiasi
WalembeleHan
Finn
Wa
Ga
Pigu
Wawjawga
Gushiago
SaveluguSekoleg
YendiSang
Zabzugu
TamaleDaboya
Sawla
BoleDamongo
Nterso
Wangasi-Turu Bimbila
Mpaha
Kabago Salaga
Bamboi
KintampoBanda
Sampa
Wenchi
Prang
YejiChindiri
Dumbai
Kwadjokrom
Ntoaboma
Amankwakrom
Nkenkaasu
Jamasi
SunyaniWamanfo
Bechem
TepaGoaso Agogo Forifon
Kpandu
Have
Ho
Dzodze
Keta
Ade
Dawa
Tema
ACCRA
Koforidua
Nwasam
AdowsoBompata
Nkawkaw
Kumasi
Bekwai
ObuasiKibi
Kade
OdaAsamankese
Swedru
Winneba
BuakuBibiani
Awaso
Dadiaso
Jamuro
Elubo
Half Assini EsiamaAxim
Sekondi-Takoradi
TarkwaKrabo
Cap Coast
Saltpond
Manso
Foso
Dunkwa
Ayenfuri
Bawdia
Prestea
VoltaN
oire
Kulpawn
Nasia
Volta
Noire Daka Oti
Lac Volta
VoltaBi
rim
Pra
Tain
Bia Tano
Ofin
Afram
Kumasi
LAWRA
CHACHE
BUI DAM
AKOSOMBO DAMAKOSOMBO AVAL
AFRAMSO
ASUBENDEBAMBOI
DABOYANAWUNISABOBA
YAGABA
WIASI
YARUGUNANGODI
PWALAGU
Volta
Volta
Volta
Noire
Pru
Regional hydrological office
Volta basin catchment boundary
Tele-transmitted station
Station without tele-transmission

•BAÏ
•GOERE
•PLETO
Kayes
BAMAKO
Ségou
Mopti
Sikasso
KadioloKolondiébaYanfofila
KéniébaKita
Bafoulabé
YélimanéNioro
Diéma
KatiKoulikoro
Banamba
Mourdiah
Nara
Niono
Mampala
Dioila
Bougouni
Kangaba Yorosso
Koutiala
San Tominian
Djenné
Koro
Bankass
BandiagaraSévaré
DouentzaYouvarou
Niafounké
Goundam
Tombouctou
Gourma - Rharous
Bourem
Gao
AnsongoMénaka
Tidamène
Araouane
Taoudenni
Tessalit
Abeibara
KidalTi-n-Zaouâtene
Niger
Bani
Faléme
Bao
ulé
Ezgueret
0 200 400 km
Mopti
PLETO
GOERE
BAÏ
Regional hydrological office
Volta basin catchment boundary
Tele-transmitted station
Station without tele-transmission

Mono
Zio
Anié
Mon
oMô
Sinkassé
Dapaong MANDOURI
Nano
Tandjouaré
Mogou
Nadoba
Kandé
PagoudaNiamtougou
Takpamba
Katchamba
Kandjo Guérin-Kouba
Kabou Bafilo
BassarDimori
Baghan
Aléhéridé
Sokodé
Balanka
Tchamba
Yanda
Kamiha
Efofami
LamaDéssi
FazaoTindjassé
Blitta
Yégué Langabou
NotséKpalimé
Tsévié
LOME
Atakpamé
Assoukoko
KoloKopé
Anié
Badou
AmiaméLomNava
Glei
Asrama Tohoun
Aného
Vogan
Noépé
KévéBatoumé
AgouGadzépé
Nyitoé
Adéta Agbatitoé
Haito
Gboto
Tabligbo
Gamé
Gapé
Sotouboua
Kpékplémé
0 40 80 km
Lac Togo
Barragede Nangbeto
Oti
Kara
Ogou
KARA
MANGO
Sérégbéné
Kara
Kéran
Koumongou KOUMONGOU
Kara
TITIRA
BONGOULOU
N'NABOUPI
KESSIBO
BORGOU
POUDA
KPESSIDE
Regional hydrological office
Volta basin catchment boundary
Tele-transmitted station
Station without tele-transmission
#
#
#
##
#
#
##
#
#
##
#
#
#
#
#
#
#
#
#
#
#
#
#
##
#
##
#
#
#
# #
# ##
#
#
#
##
### #
#
#
#
#
N
EW
S
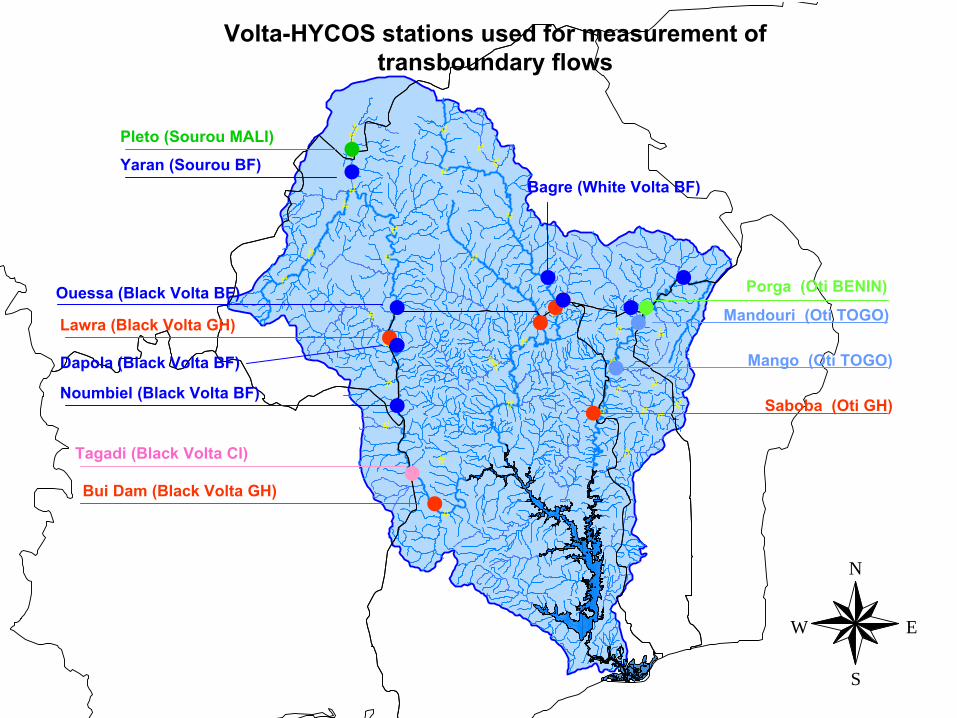
Volta-HYCOS stations used
for measurement
of transboundary
flows
Yaran
(Sourou
BF)
Pleto
(Sourou
MALI)
Ouessa
(Black Volta BF)
Noumbiel
(Black Volta BF)
Dapola
(Black Volta BF)
Lawra (Black Volta GH)
Tagadi
(Black Volta CI)
Bagre
(White Volta BF)
Bui
Dam (Black Volta GH)
Saboba
(Oti GH)
Mango (Oti TOGO)
Mandouri
(Oti TOGO)
Porga
(Oti BENIN)
Related Documents