Design and Analysis of Clinical Study 5. Introduction to R and Statistics Dr. Tuan V. Nguyen Garvan Institute of Medical Research Sydney, Australia

Design and Analysis of Clinical Study 5. Introduction to R and Statistics Dr. Tuan V. Nguyen Garvan Institute of Medical Research Sydney, Australia.
Jan 01, 2016
Welcome message from author
This document is posted to help you gain knowledge. Please leave a comment to let me know what you think about it! Share it to your friends and learn new things together.
Transcript
Design and Analysis of Clinical Study 5. Introduction to R and Statistics
Dr. Tuan V. Nguyen
Garvan Institute of Medical Research
Sydney, Australia

Outline
• Introduction: –Historical development–S, Splus–Capability–Statistical Analysis
• References• Calculator • Data Type• Resources• Simulation and Statistical Tables
–Probability distributions

History
• S: an interactive environment for data analysis developed at Bell Laboratories since 1976
– 1988 - S2: RA Becker, JM Chambers, A Wilks – 1992 - S3: JM Chambers, TJ Hastie– 1998 - S4: JM Chambers
• Exclusively licensed by AT&T/Lucent to Insightful Corporation, Seattle WA. Product name: "S-plus".
• R: initially written by Ross Ihaka and Robert Gentleman at Dep. of Statistics of U of Auckland, New Zealand during 1990s.
• Since 1997: international "R-core" team of ca. 15 people with access to common CVS archive.

Introduction
• R is "GNU S" — A language and environment for data manipula-tion, calculation and graphical display.– a suite of operators for calculations on arrays & matrices.
– a large, coherent, integrated collection of data analysis tools
– graphical facilities for data analysis
– a well developed programming language

What R does and does not
odata handling and storage: numeric, textual
omatrix algebra
ohash tables and regular expressions
ohigh-level data analytic and statistical functions
ographics
oprogramming language: loops, branching, subroutines
ois not a database, but connects to DBMSs
ohas no graphical user interfaces, but connects to Java, TclTk
olanguage interpreter can be very slow, but allows to call own C/C++ code
ono spreadsheet view of data, but connects to Excel/MsOffice
ono professional / commercial support
R and Statistics
• Packaging: a crucial infrastructure to efficiently produce, load and keep consistent software libraries from (many) different sources / authors
• Statistics: most packages deal with statistics and data analysis
• State of the art: many statistical researchers provide their methods as R packages

Data Analysis and Presentation
• The R distribution contains functionality for large number of statistical procedures. – linear and generalized linear models
– nonlinear regression models
– time series analysis
– classical parametric and nonparametric tests
– clustering
– smoothing
• R also has a large set of functions which provide a flexible graphical environment for creating various kinds of data presentations.

R as a calculator
> log2(32)
[1] 5
> sqrt(2)
[1] 1.414214
> seq(0, 5, length=6)
[1] 0 1 2 3 4 5
> plot(sin(seq(0, 2*pi, length=100)))
0 20 40 60 80 100
-1.0
-0.5
0.0
0.5
1.0
Index
sin
(se
q(0
, 2 *
pi,
len
gth
= 1
00
))

Objects
Primitive (or: atomic) data types in R are:
• numeric (integer, double, complex)• character• logical• function
out of these, vectors, arrays, lists can be built.

R "grammar"
object <- function(argument1, argument2, ..., argumentn)
Example: > reg <- lm(y ~ x)
x == 5 x bằng 5x != 5 x không bằng 5y < x y nhỏ hơn xx > y x lớn hơn yz <= 7 z nhỏ hơn hoặc bằng 7p >= 1 p lớn hơn hoặc bằng 1is.na(x) Có phải x là biến số missing A & B A và B (AND)A | B A hoặc B (OR)! Không là (NOT)

Reading Data 1 – Direct Method
age insulin
50 16.5
62 10.8
60 32.3
40 19.3
48 14.2
47 11.3
57 15.5
70 15.8
48 16.2
67 11.2
> age <- c(50,62, 60,40,48,47,57,70,48,67)> insulin <-c(16.5,10.8,32.3,19.3,14.2,11.3,15.5,15.8,16.2,11.2) > ins <- data.frame(age, insulin)

Reading Data 2 – read.table
id sex age bmi hdl ldl tc tg 1 Nam 57 17 5.000 2.0 4.0 1.1 2 Nu 64 18 4.380 3.0 3.5 2.1 3 Nu 60 18 3.360 3.0 4.7 0.8 4 Nam 65 18 5.920 4.0 7.7 1.1 5 Nam 47 18 6.250 2.1 . 2.1 6 Nu 65 18 4.150 3.0 4.2 1.5 7 Nam 76 19 0.737 3.0 5.9 2.6
> setwd("c:/works/stats")
> chol <- read.table("chol.txt", header=TRUE, na.missing=".")

Reading Data 3 – read.csv
• Bước 1: Dùng lệnh "Save as" trong Excel và lưu số liệu dưới dạng "csv";
• Bước 2: Dùng R (lệnh read.csv) để nhập dữ liệu dạng csv
> setwd("c:/works/stats")
> gh <- read.csv ("excel.csv", header=TRUE)

A Simple Session
sex <- c("Nam", "Nu", "Nu","Nam","Nam", "Nu","Nam","Nam","Nam", "Nu", "Nu","Nam", "Nu","Nam","Nam", "Nu", "Nu", "Nu", "Nu", "Nu", "Nu", "Nu", "Nu", "Nu","Nam","Nam", "Nu","Nam", "Nu", "Nu", "Nu","Nam","Nam", "Nu", "Nu","Nam", "Nu","Nam", "Nu", "Nu",
"Nam", "Nu","Nam","Nam","Nam", "Nu","Nam","Nam", "Nu", "Nu")
age <- c(57, 64, 60, 65, 47, 65, 76, 61, 59, 57, 63, 51, 60, 42, 64, 49, 44, 45, 80, 48, 61, 45, 70, 51, 63, 54, 57, 70, 47, 60, 60, 50, 60, 55, 74, 48, 46, 49, 69, 72, 51, 58, 60, 45, 63, 52, 64, 45, 64, 62)
bmi <- c( 17, 18, 18, 18, 18, 18, 19, 19, 19, 19, 20, 20, 20, 20, 20, 20, 21, 21, 21, 21, 21, 21, 21, 21, 22, 22, 22, 22, 22, 22, 22, 22, 22, 22, 23, 23, 23, 23, 23, 23, 23, 23, 24, 24, 24, 24, 24, 24, 25, 25)
hdl <- c(5.000, 4.380, 3.360, 5.920, 6.250, 4.150, 0.737, 7.170, 6.942, 5.000, 4.217, 4.823, 3.750, 1.904, 6.900, 0.633, 5.530, 6.625, 5.960, 3.800, 5.375, 3.360, 5.000, 2.608, 4.130,5.000, 6.235, 3.600, 5.625, 5.360, 6.580, 7.545, 6.440,6.170,5.270, 3.220, 5.400, 6.300, 9.110, 7.750, 6.200, 7.050, 6.300, 5.450,5.000,3.360,7.170,7.880,7.360,7.750)
ldl <- c(2.0, 3.0, 3.0, 4.0, 2.1, 3.0, 3.0, 3.0, 3.0, 2.0, 5.0, 1.3, 1.2, 0.7, 4.0, 4.1, 4.3, 4.0, 4.3, 4.0, 3.1, 3.0, 1.7, 2.0, 2.1, 4.0, 4.1, 4.0, 4.2, 4.2, 4.4, 4.3, 2.3, 6.0, 3.0, 3.0, 2.6, 4.4, 4.3, 4.0, 3.0, 4.1, 4.4, 2.8, 3.0, 2.0, 1.0, 4.0, 4.6, 4.0)
tc <-c (4.0, 3.5, 4.7, 7.7, 5.0, 4.2, 5.9, 6.1, 5.9, 4.0, 6.2, 4.1, 3.0, 4.0, 6.9, 5.7, 5.7, 5.3, 7.1, 3.8, 4.3, 4.8, 4.0, 3.0, 3.1, 5.3, 5.3, 5.4, 4.5, 5.9, 5.6, 8.3, 5.8, 7.6, 5.8, 3.1, 5.4, 6.3, 8.2, 6.2, 6.2, 6.7, 6.3, 6.0, 4.0, 3.7, 6.1, 6.7, 8.1, 6.2)
tg <- c(1.1, 2.1, 0.8, 1.1, 2.1, 1.5, 2.6, 1.5, 5.4, 1.9, 1.7, 1.0, 1.6, 1.1, 1.5, 1.0, 2.7, 3.9, 3.0, 3.1, 2.2, 2.7, 1.1, 0.7, 1.0, 1.7, 2.9, 2.5, 6.2, 1.3, 3.3, 3.0, 1.0, 1.4, 2.5, 0.7, 2.4, 2.4, 1.4, 2.7, 2.4, 3.3, 2.0, 2.6, 1.8, 1.2, 1.9, 3.3, 4.0, 2.5)
cong <- data.frame(sex, age, bmi, hdl, ldl, tc, tg)attach(cong)

Bar Graph
> sex.freq <- table(sex)
> sex.freq
sex
Nam Nu
22 28
> barplot(sex.freq, main="Frequency of males and females")
> barplot(table(sex), main="Frequency of males and females")
> stripchart(tg, main="Strip chart for triglycerides", xlab="mg/L")
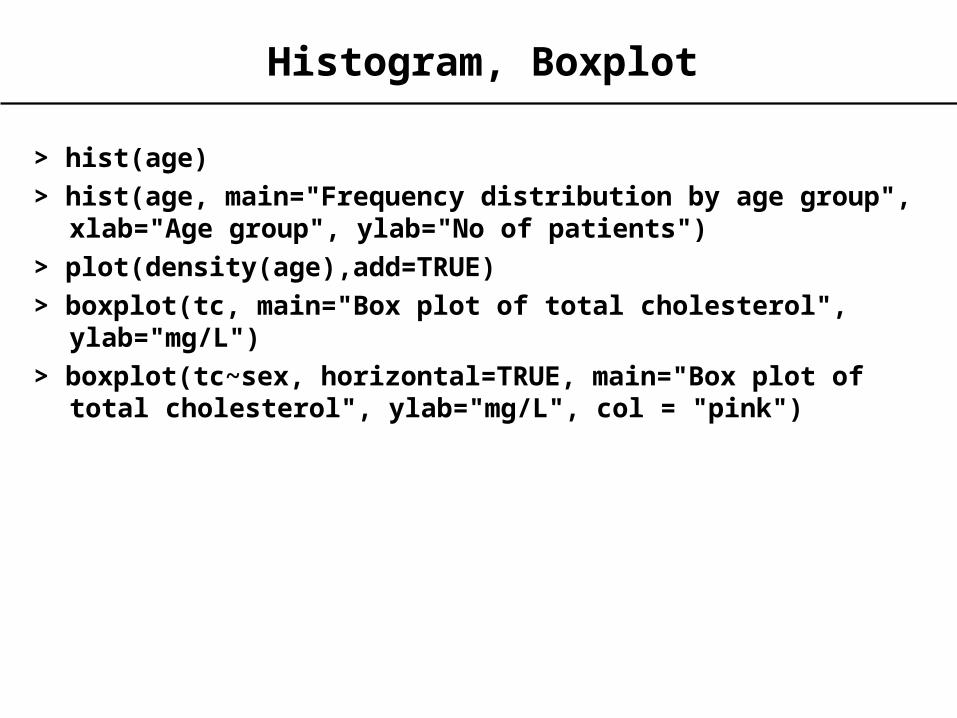
Histogram, Boxplot
> hist(age)
> hist(age, main="Frequency distribution by age group", xlab="Age group", ylab="No of patients")
> plot(density(age),add=TRUE)
> boxplot(tc, main="Box plot of total cholesterol", ylab="mg/L")
> boxplot(tc~sex, horizontal=TRUE, main="Box plot of total cholesterol", ylab="mg/L", col = "pink")
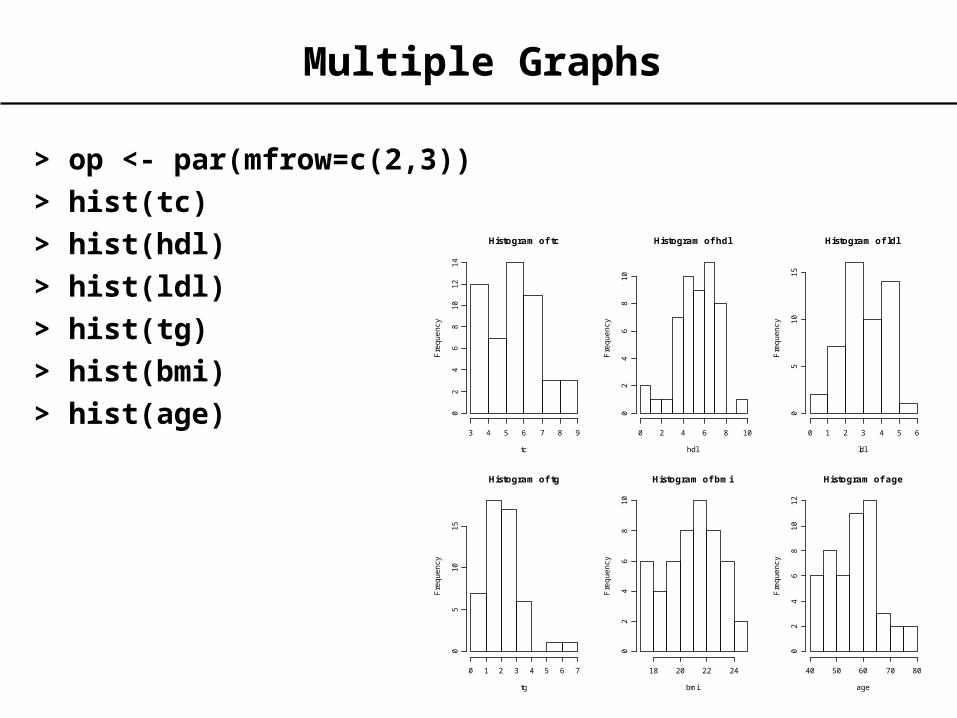
Multiple Graphs
> op <- par(mfrow=c(2,3))
> hist(tc)
> hist(hdl)
> hist(ldl)
> hist(tg)
> hist(bmi)
> hist(age)
Histogram of tc
tc
Fre
qu
en
cy
3 4 5 6 7 8 9
02
46
81
01
21
4
Histogram of hdl
hdl
Fre
qu
en
cy
0 2 4 6 8 10
02
46
81
0
Histogram of ldl
ldl
Fre
qu
en
cy
0 1 2 3 4 5 6
05
10
15
Histogram of tg
tg
Fre
qu
en
cy
0 1 2 3 4 5 6 7
05
10
15
Histogram of bmi
bmi
Fre
qu
en
cy
18 20 22 24
02
46
81
0
Histogram of age
age
Fre
qu
en
cy
40 50 60 70 80
02
46
81
01
2

Scatter Plots
> plot(tc, hdl)
> plot(hdl, tc, pch=ifelse(sex=="Nam", 16, 22))
> plot(hdl, tc, pch=ifelse(sex=="Nam", "M", "F"))
> plot(hdl ~ tc, pch=16, main="Total cholesterol and HDL cholesterol with LOEWSS smooth function", xlab="Total cholesterol", ylab="HDL cholesterol", bty="l")
> lines(lowess(hdl, tc, f=2/3, iter=3), col="red")
> lipid <- data.frame(age,bmi,hdl,ldl,tc)
> pairs(lipid, pch=16)

Descriptive Statistics
> mean(tc)[1] 5.414> var(tc)[1] 1.962045> sd(tc)[1] 1.40073
> summary(cong)
sex age bmi hdl ldl Nam:22 Min. :42.00 Min. :17.00 Min. :0.633 Min. :0.700 Nu :28 1st Qu.:49.25 1st Qu.:20.00 1st Qu.:4.167 1st Qu.:2.650 Median :59.50 Median :22.00 Median :5.425 Median :3.050 Mean :57.64 Mean :21.38 Mean :5.333 Mean :3.292 3rd Qu.:63.75 3rd Qu.:23.00 3rd Qu.:6.545 3rd Qu.:4.100 Max. :80.00 Max. :25.00 Max. :9.110 Max. :6.000 tc tg Min. :3.000 Min. :0.700 1st Qu.:4.125 1st Qu.:1.325 Median :5.650 Median :2.050 Mean :5.414 Mean :2.176 3rd Qu.:6.200 3rd Qu.:2.700 Max. :8.300 Max. :6.200
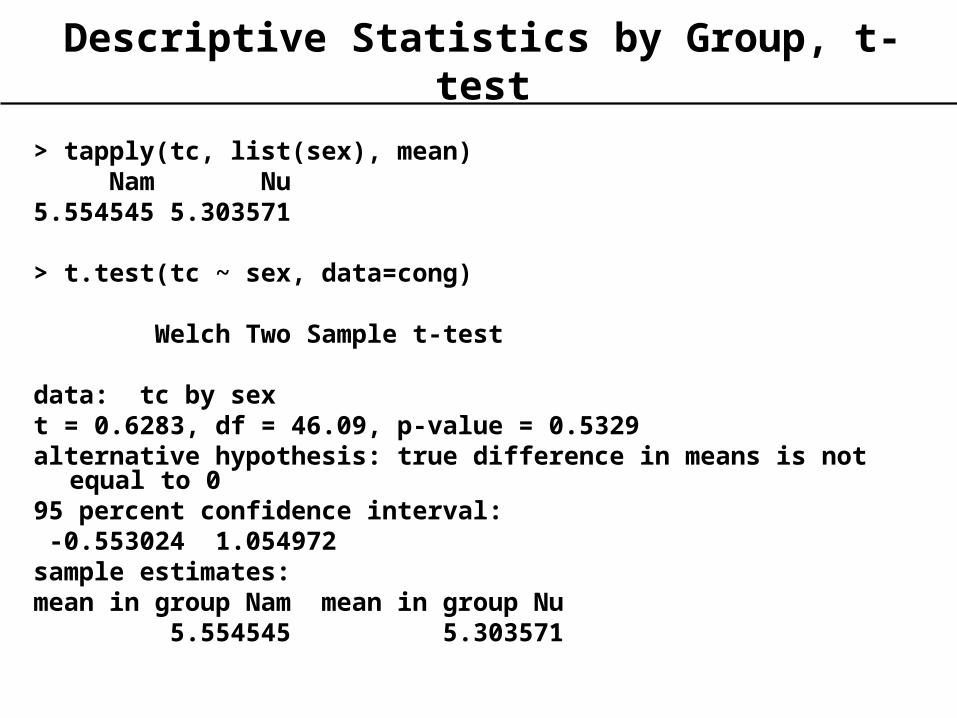
Descriptive Statistics by Group, t-test
> tapply(tc, list(sex), mean) Nam Nu 5.554545 5.303571
> t.test(tc ~ sex, data=cong)
Welch Two Sample t-test
data: tc by sex t = 0.6283, df = 46.09, p-value = 0.5329alternative hypothesis: true difference in means is not
equal to 0 95 percent confidence interval: -0.553024 1.054972 sample estimates:mean in group Nam mean in group Nu 5.554545 5.303571

Wilcoxon test
> wilcox.test(tc ~ sex, data=cong)
Wilcoxon rank sum test with continuity correction
data: tc by sex W = 355, p-value = 0.3629alternative hypothesis: true mu is not equal to 0
Warning message:cannot compute exact p-value with ties in:
wilcox.test.default(x = c(4, 7.7, 5, 5.9, 6.1, 5.9, 4.1, 4, 6.9,

Test for Two Proportions
> fracture <- c(7, 20)
> total <- c(100, 110)
> prop.test(fracture, total)
2-sample test for equality of proportions with continuity correction
data: fracture out of total
X-squared = 4.8901, df = 1, p-value = 0.02701
alternative hypothesis: two.sided
95 percent confidence interval:
-0.20908963 -0.01454673
sample estimates:
prop 1 prop 2
0.0700000 0.1818182
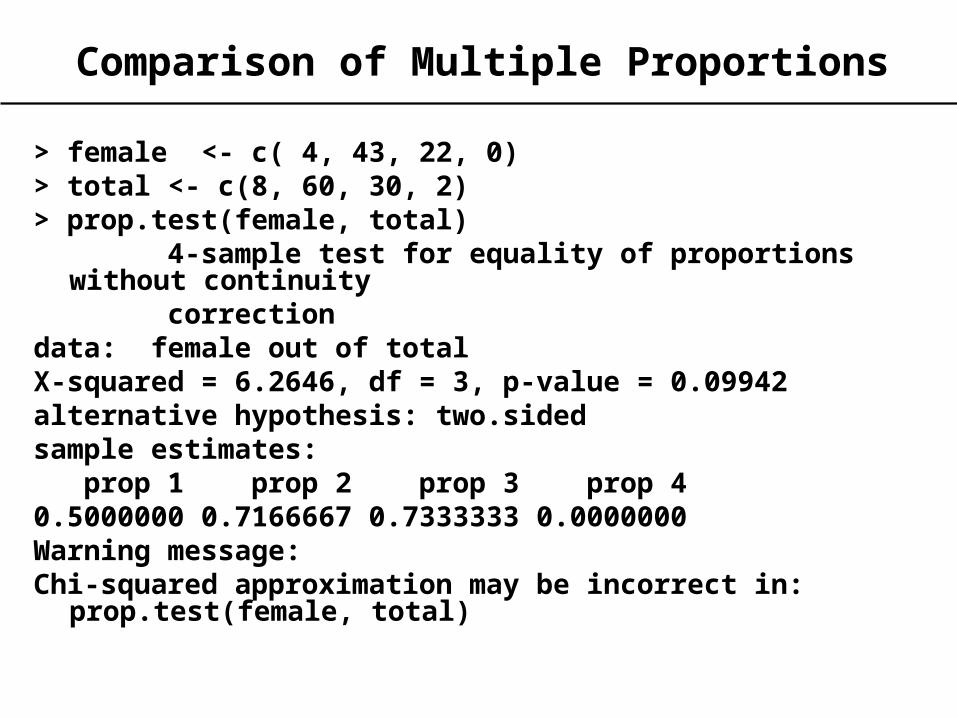
Comparison of Multiple Proportions
> female <- c( 4, 43, 22, 0)> total <- c(8, 60, 30, 2)> prop.test(female, total) 4-sample test for equality of proportions
without continuity correctiondata: female out of total X-squared = 6.2646, df = 3, p-value = 0.09942alternative hypothesis: two.sided sample estimates: prop 1 prop 2 prop 3 prop 4 0.5000000 0.7166667 0.7333333 0.0000000 Warning message:Chi-squared approximation may be incorrect in:
prop.test(female, total)

Linear Regression Analysis
> age <- c(46,20,52,30,57,25,28,36,22,43,57,33,22,63,40,48,28,49)
> bmi <-c(25.4,20.6,26.2,22.6,25.4,23.1,22.7,24.9,19.8,25.3,23.2, 21.8,20.9,26.7,26.4,21.2,21.2,22.8)
> chol <- c(3.5,1.9,4.0,2.6,4.5,3.0,2.9,3.8,2.1,3.8,4.1,3.0,
2.5,4.6,3.2, 4.2,2.3,4.0)> data <- data.frame(age, bmi, chol)> plot(chol ~ age, pch=16)

Coefficient of Correlation
> cor.test(age, chol)
Pearson's product-moment correlation
data: age and chol
t = 10.7035, df = 16, p-value = 1.058e-08
alternative hypothesis: true correlation is not equal to 0
95 percent confidence interval:
0.8350463 0.9765306
sample estimates:
cor
0.936726
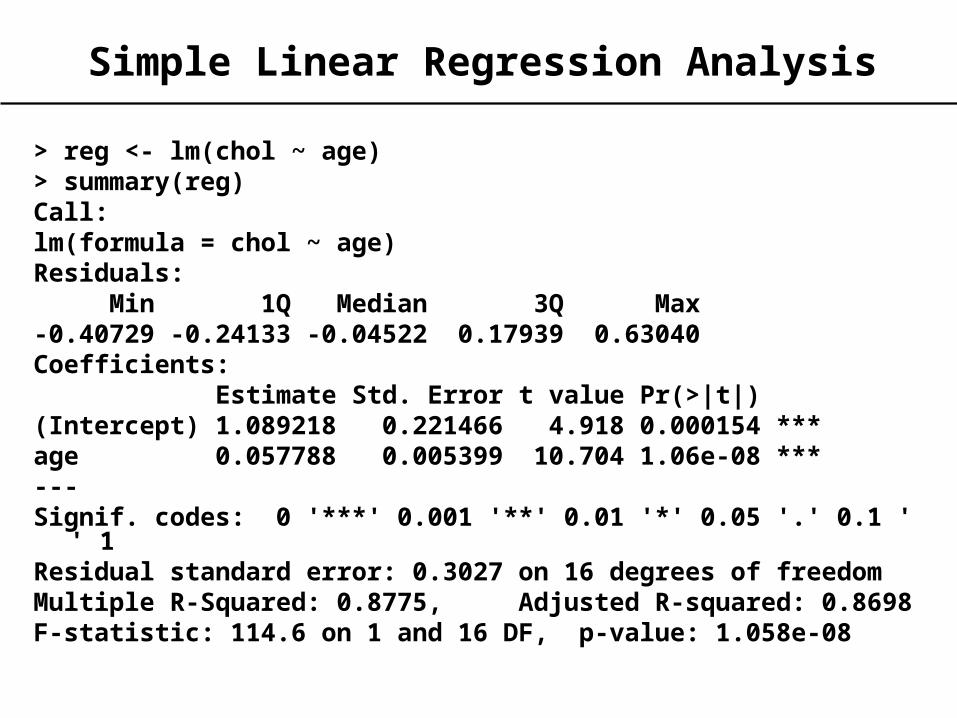
Simple Linear Regression Analysis
> reg <- lm(chol ~ age)> summary(reg)Call:lm(formula = chol ~ age)Residuals: Min 1Q Median 3Q Max -0.40729 -0.24133 -0.04522 0.17939 0.63040 Coefficients: Estimate Std. Error t value Pr(>|t|) (Intercept) 1.089218 0.221466 4.918 0.000154 ***age 0.057788 0.005399 10.704 1.06e-08 ***---Signif. codes: 0 '***' 0.001 '**' 0.01 '*' 0.05 '.' 0.1 '
' 1 Residual standard error: 0.3027 on 16 degrees of freedomMultiple R-Squared: 0.8775, Adjusted R-squared: 0.8698 F-statistic: 114.6 on 1 and 16 DF, p-value: 1.058e-08

Multiple Linear Regression Analysis
> mreg <- lm(chol ~ age + bmi)> summary(mreg)Call:lm(formula = chol ~ age + bmi)Residuals: Min 1Q Median 3Q Max -0.3762 -0.2259 -0.0534 0.1698 0.5679 Coefficients: Estimate Std. Error t value Pr(>|t|) (Intercept) 0.455458 0.918230 0.496 0.627 age 0.054052 0.007591 7.120 3.50e-06 ***bmi 0.033364 0.046866 0.712 0.487 ---Signif. codes: 0 '***' 0.001 '**' 0.01 '*' 0.05 '.' 0.1 '
' 1 Residual standard error: 0.3074 on 15 degrees of freedomMultiple R-Squared: 0.8815, Adjusted R-squared: 0.8657 F-statistic: 55.77 on 2 and 15 DF, p-value: 1.132e-07
Related Documents


