Department of Employment, Training and Rehabilitation, Rehabilitation Division Transition Student Satisfaction Survey Report Date: August 1, 2014 Federal FY 2013 (Service Dates: Oct 2012 – Sept 2013)

Welcome message from author
This document is posted to help you gain knowledge. Please leave a comment to let me know what you think about it! Share it to your friends and learn new things together.
Transcript
Department of Employment,
Training and Rehabilitation,
Rehabilitation Division
Transition Student Satisfaction
Survey
Report Date: August 1, 2014
Federal FY 2013 (Service Dates: Oct 2012 – Sept 2013)

Nevada Department of Employment, Training and Rehabilitation
Federal Fiscal Year 2013 Transition Student Satisfaction Survey
1
Michael J. Doane, M.A.
Graduate Research Assistant, CRDA
Jordan D. Clark, M.A.
Graduate Research Assistant, CRDA
Veronica Blas Dahir, Ph.D.1
Manager, Research Services, CRDA
Principal Investigator
Fan Zhang
Biostatistician
Wei Yang, M.D., Ph.D.2
Professor and Director, CHSI and Co-Principal Investigator
1Please direct any correspondence about this report to Dr. Veronica Dahir at [email protected] or 775-784-6718.
2Please direct any questions about the data analysis to Dr. Wei Yang at [email protected] or 775-682-1094.
Photo credit: http://www.onlineuniversities.com/wp-content/uploads/2012/08/10datamining1.jpg
Nevada Department of Employment, Training and Rehabilitation
Federal Fiscal Year 2013 Transition Student Satisfaction Survey
2
Acknowledgements
We would like to thank Christopher Sanchez and Christopher Swinger, Survey
Lab Managers, for the management of the data collection and all of the survey
lab interviewers and other supervisors at the Center for Research Design and
Analysis for their hard work in the data collection process.
We would also like to thank the Nevada Department of Employment, Training,
and Rehabilitation, Rehabilitation Division. Specifically, we are grateful for
Melissa Starr’s assistance throughout each stage of the project, for Heather
Johnson’s help in providing the sampling frame database, and for Beth Talcott’s
administrative assistance on the project.
Additionally, we would also like to recognize David Shirley, IT Technician II,
and Vamsi Alluri for programming the survey instruments, updating the website
for the project, and aiding with the data management. Finally, we would like to
acknowledge the role of the following co-authors: Fan Zhang and Dr. Wei Yang
for their roles in the programming of all of the data tables in the Appendix and
data analysis.
Nevada Department of Employment, Training and Rehabilitation
Federal Fiscal Year 2013 Transition Student Satisfaction Survey
3
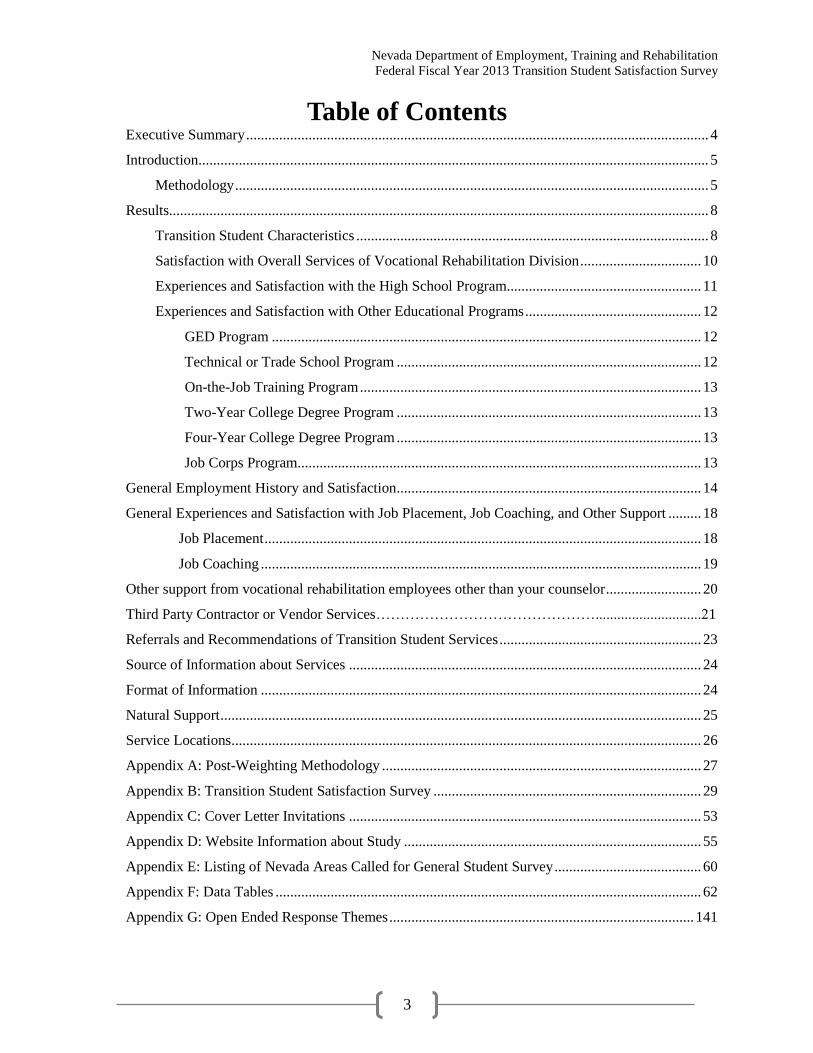
Table of Contents Executive Summary .............................................................................................................................. 4
Introduction ........................................................................................................................................... 5
Methodology ................................................................................................................................. 5
Results................................................................................................................................................... 8
Transition Student Characteristics ................................................................................................ 8
Satisfaction with Overall Services of Vocational Rehabilitation Division ................................. 10
Experiences and Satisfaction with the High School Program..................................................... 11
Experiences and Satisfaction with Other Educational Programs ................................................ 12
GED Program ..................................................................................................................... 12
Technical or Trade School Program ................................................................................... 12
On-the-Job Training Program ............................................................................................. 13
Two-Year College Degree Program ................................................................................... 13
Four-Year College Degree Program ................................................................................... 13
Job Corps Program.............................................................................................................. 13
General Employment History and Satisfaction ................................................................................... 14
General Experiences and Satisfaction with Job Placement, Job Coaching, and Other Support ......... 18
Job Placement ....................................................................................................................... 18
Job Coaching ........................................................................................................................ 19
Other support from vocational rehabilitation employees other than your counselor .......................... 20
Third Party Contractor or Vendor Services……………………………………….............................21
Referrals and Recommendations of Transition Student Services ....................................................... 23
Source of Information about Services ................................................................................................ 24
Format of Information ........................................................................................................................ 24
Natural Support ................................................................................................................................... 25
Service Locations ................................................................................................................................ 26
Appendix A: Post-Weighting Methodology ....................................................................................... 27
Appendix B: Transition Student Satisfaction Survey ......................................................................... 29
Appendix C: Cover Letter Invitations ................................................................................................ 53
Appendix D: Website Information about Study ................................................................................. 55
Appendix E: Listing of Nevada Areas Called for General Student Survey ........................................ 60
Appendix F: Data Tables .................................................................................................................... 62
Appendix G: Open Ended Response Themes ................................................................................... 141

Nevada Department of Employment, Training and Rehabilitation
Federal Fiscal Year 2013 Transition Student Satisfaction Survey
4
Executive Summary
A mixed-mode telephone and web-based survey was conducted quarterly from January 2013
through December 2013 to assess the satisfaction of services received by transition student
clients of the State of Nevada Department of Employment, Training and Rehabilitation,
Rehabilitation Division (see Appendix B). These student clients received services from the
Division between October 1, 2012 and September 30, 2013 (Federal Fiscal Year 2013), and this
report includes all data collected from student clients who received services during the 2013
Federal Fiscal year even though data were collected quarterly. A total of 109 surveys were
completed out of 272 student clients in the population for a raw response rate of 40%. A
cooperation rate of 63% was obtained from those student clients actually reached. Post-
stratification weighting was used to match the responses obtained from the sample to the
population of transition student clients (see Appendix A).
Most of the transition student clients (73%) were satisfied, either ‘very’ or ‘somewhat’, with the
overall services of the Vocational Rehabilitation Division. Further, approximately 61% of the
student clients were ‘very’ or ‘somewhat’ satisfied with the timeliness of the services.
Approximately 58% of transition students reported being employed at the time of their interview.
The majority of respondents (90%) in the sample utilized the high school program, and almost
65% of these respondents were ‘somewhat’ or ‘very satisfied’ with the program. Students
utilized other programs beyond the high school program to varying degrees. Of those students
offered the opportunity for the program, 69% participated in the On-the-Job Training program,
25% in Technical or Trade School, 35% in the Two-Year College Degree program, 20% in the
Four-Year College Degree program, and 26% the Job Corps program. With respect to schooling,
43% of students who completed high school received an adjusted diploma and 49% received a
standard diploma.
A large number of transition student clients (78%) were satisfied, either somewhat or very, with
the support they received from Vocational Rehabilitation staff while in the Job Corps program.
Thirty-six out of 41 students were satisfied with the On-the-Job Training program.
Approximately 52% of the students received job placement services and 51% of students
received job-coaching services. Overall satisfaction was 68% for job placement services and
75% for job coaching services. Transition student clients reported receiving various assistive
technology devices from the Division and 55% of students rated these devices as ‘good’ or
‘excellent’. Overall, transition students were generally satisfied with the services that they
received, and 79% of them would recommend those services to others.
Nevada Department of Employment, Training and Rehabilitation
Federal Fiscal Year 2013 Transition Student Satisfaction Survey
5
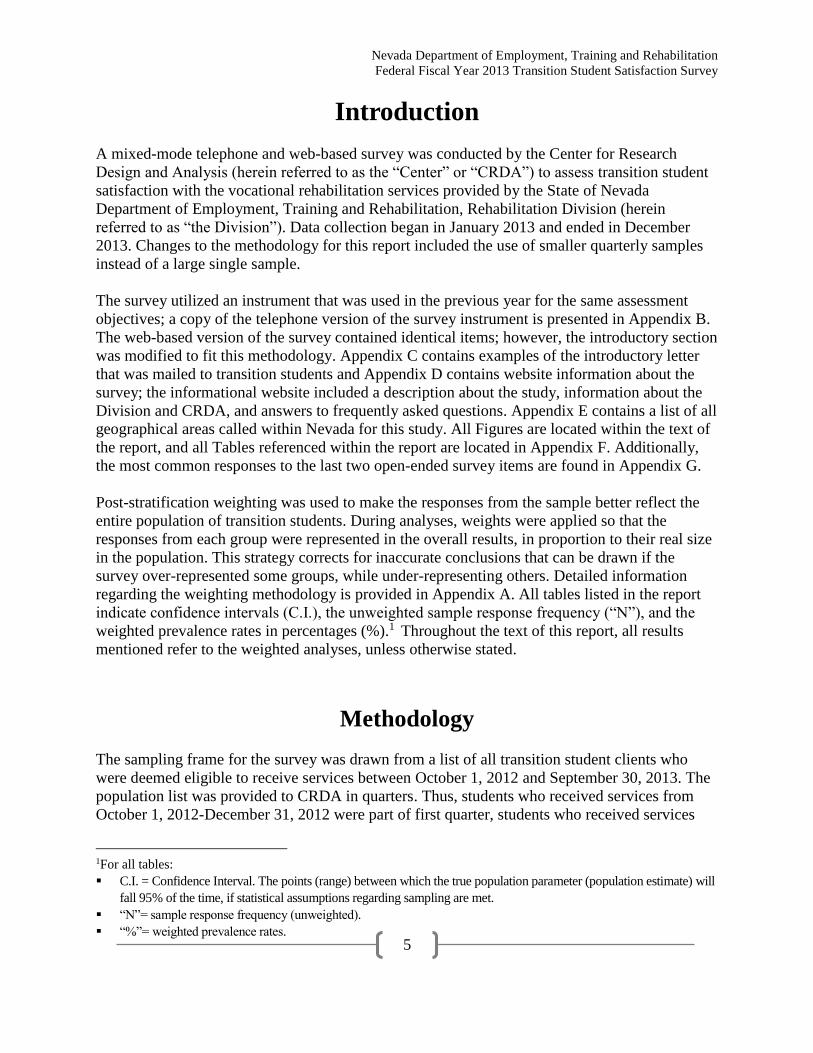
Introduction
A mixed-mode telephone and web-based survey was conducted by the Center for Research
Design and Analysis (herein referred to as the “Center” or “CRDA”) to assess transition student
satisfaction with the vocational rehabilitation services provided by the State of Nevada
Department of Employment, Training and Rehabilitation, Rehabilitation Division (herein
referred to as “the Division”). Data collection began in January 2013 and ended in December
2013. Changes to the methodology for this report included the use of smaller quarterly samples
instead of a large single sample.
The survey utilized an instrument that was used in the previous year for the same assessment
objectives; a copy of the telephone version of the survey instrument is presented in Appendix B.
The web-based version of the survey contained identical items; however, the introductory section
was modified to fit this methodology. Appendix C contains examples of the introductory letter
that was mailed to transition students and Appendix D contains website information about the
survey; the informational website included a description about the study, information about the
Division and CRDA, and answers to frequently asked questions. Appendix E contains a list of all
geographical areas called within Nevada for this study. All Figures are located within the text of
the report, and all Tables referenced within the report are located in Appendix F. Additionally,
the most common responses to the last two open-ended survey items are found in Appendix G.
Post-stratification weighting was used to make the responses from the sample better reflect the
entire population of transition students. During analyses, weights were applied so that the
responses from each group were represented in the overall results, in proportion to their real size
in the population. This strategy corrects for inaccurate conclusions that can be drawn if the
survey over-represented some groups, while under-representing others. Detailed information
regarding the weighting methodology is provided in Appendix A. All tables listed in the report
indicate confidence intervals (C.I.), the unweighted sample response frequency (“N”), and the
weighted prevalence rates in percentages (%).1 Throughout the text of this report, all results
mentioned refer to the weighted analyses, unless otherwise stated.
Methodology
The sampling frame for the survey was drawn from a list of all transition student clients who
were deemed eligible to receive services between October 1, 2012 and September 30, 2013. The
population list was provided to CRDA in quarters. Thus, students who received services from
October 1, 2012-December 31, 2012 were part of first quarter, students who received services
1For all tables:
C.I. = Confidence Interval. The points (range) between which the true population parameter (population estimate) will
fall 95% of the time, if statistical assumptions regarding sampling are met.
“N”= sample response frequency (unweighted).
“%”= weighted prevalence rates.
Nevada Department of Employment, Training and Rehabilitation
Federal Fiscal Year 2013 Transition Student Satisfaction Survey
6
from January 1, 2013-March 31, 2013 were second quarter, students who received services from
April 1, 2013-June 30, 2013 were third quarter, and finally, students who received services from
July 1, 2013-September 30, 2013 were part of the fourth quarter distribution. The sampling
frame was provided by the Division in this manner to ensure that potential participants were
contacted with the most up to date information possible. Thus, recruitment of first quarter
participants was able to commence in January 2013 rather than October, 2013, which would have
been the case if the entire sampling frame had been provided at once in September, 2013.
The sample for the survey was drawn from a compiled list of 316 transition students who were
deemed eligible to receive services between October 1, 2012 and September 30, 2013. This
compiled list was provided by the Division in four segments, and was comprised of students who
went through the Application and Eligibility processes. Once they had been determined eligible,
a Plan was developed for services. Only those students deemed eligible for services were
included in the sampling frame provided by the Division. From this complied list, 44 students
were removed because they did not keep in contact with DETR, did not have contact
information, were deceased, or no longer lived in Nevada. This process resulted in a final
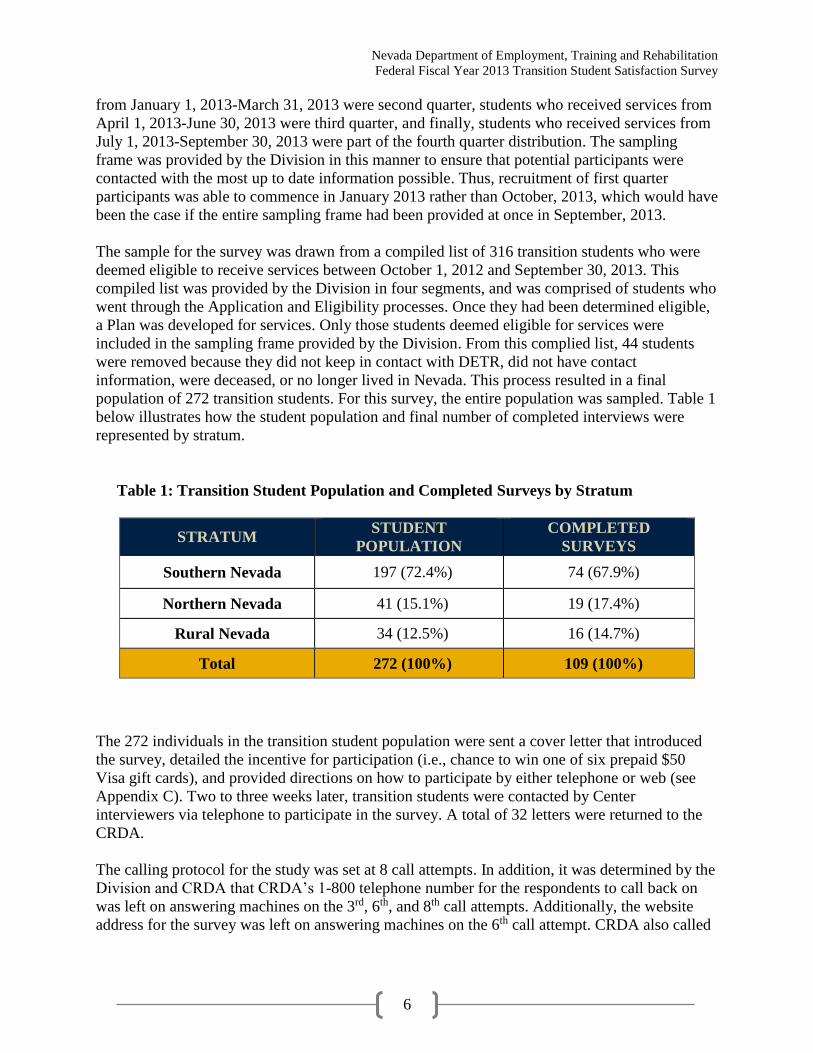
population of 272 transition students. For this survey, the entire population was sampled. Table 1
below illustrates how the student population and final number of completed interviews were
represented by stratum.
Table 1: Transition Student Population and Completed Surveys by Stratum
STRATUM STUDENT
POPULATION
COMPLETED
SURVEYS
Southern Nevada 197 (72.4%) 74 (67.9%)
Northern Nevada 41 (15.1%) 19 (17.4%)
Rural Nevada 34 (12.5%) 16 (14.7%)
Total 272 (100%) 109 (100%)
The 272 individuals in the transition student population were sent a cover letter that introduced
the survey, detailed the incentive for participation (i.e., chance to win one of six prepaid $50
Visa gift cards), and provided directions on how to participate by either telephone or web (see
Appendix C). Two to three weeks later, transition students were contacted by Center
interviewers via telephone to participate in the survey. A total of 32 letters were returned to the
CRDA.
The calling protocol for the study was set at 8 call attempts. In addition, it was determined by the
Division and CRDA that CRDA’s 1-800 telephone number for the respondents to call back on
was left on answering machines on the 3rd, 6th, and 8th call attempts. Additionally, the website
address for the survey was left on answering machines on the 6th call attempt. CRDA also called

Nevada Department of Employment, Training and Rehabilitation
Federal Fiscal Year 2013 Transition Student Satisfaction Survey
7
back all “soft” refusals.2 Thus, the calling protocol was 8 call attempts with no contact, two
“soft” refusals, or one “hard” refusal, regardless of the number of call attempts made.
A total of 103 interviews were completed on the telephone and 6 interviews were completed on
the web, for a raw response rate of 40% (109 out of 272). Of the 272 transition students
interviewers attempted to contact, 98 were not successfully contacted or were unable to
participate. For instance, there were 44 numbers provided by the Division that were no longer
correct or were disconnected. The accuracy of a further 51 numbers could not be determined
because no one in the residence ever answered the telephone over the course of the 8 call
protocol. Unfortunately, three people could not complete the interview due to severe
impairments.
A total of 174 eligible transition students, of the 272 student clients called, were successfully
contacted by telephone and eligible for participation. Of these, 103 completed the interview over
the phone, 6 competed the survey on the web, 6 refused to participate, and 59 never started the
interview and never refused. Excluding the respondents that were never reached or were
ineligible, a cooperation rate of 63% (109 out of 174 successfully contacted) was achieved.
2A “soft” refusal is considered one in which the informant (the person that answered the phone) or the respondent
(the Vocational Rehabilitation client), seemed interested in participating but the interviewer just called at an
inconvenient time (e.g., “We’re in the middle of dinner,” “I was just running out the door.”). A “hard” refusal is a
call where the informant or the respondent is rude to the interviewer, uses profanity, or says something like, “Take
me off your list!” or “Don’t ever call back!”

Nevada Department of Employment, Training and Rehabilitation
Federal Fiscal Year 2013 Transition Student Satisfaction Survey
8
Results
All results are illustrated in tables in Appendix F of this report. It is suggested that the reader
consult the tables for further detail or clarification. As stated above, throughout this report all
results mentioned in text refer to the weighted analyses unless otherwise stated.
Transition Student Characteristics
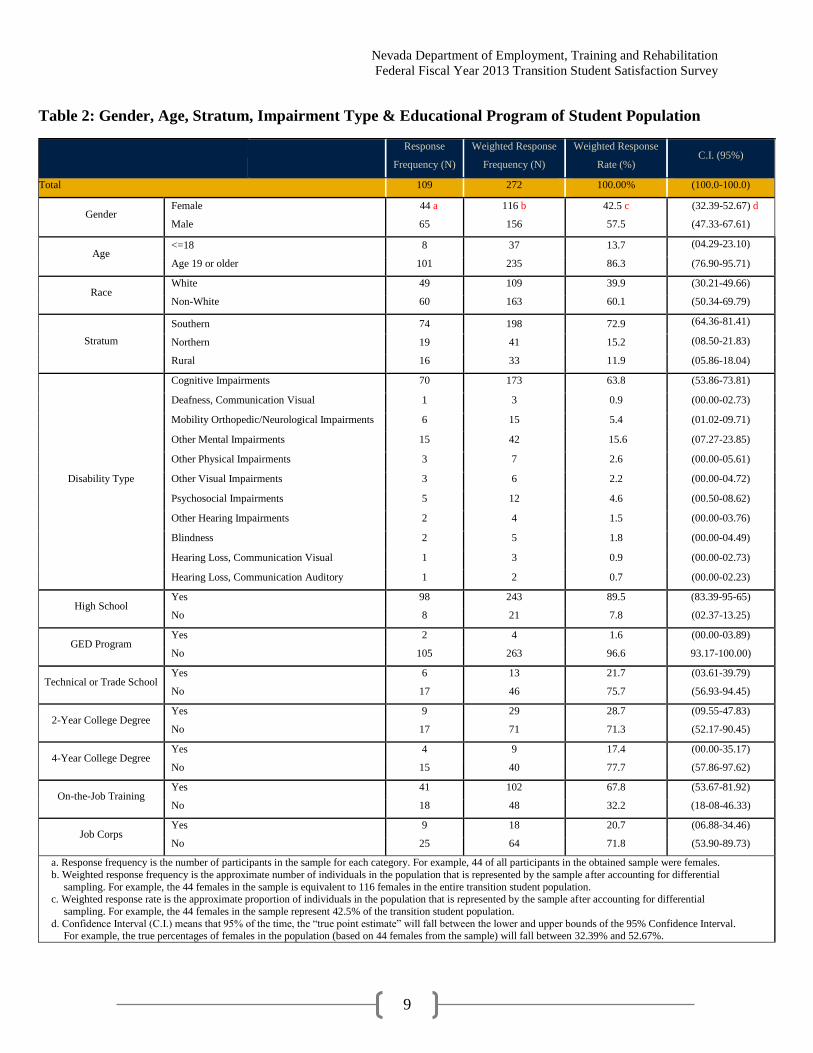
A final sample of 109 transition students responded to the survey. Table 2 on the next page
provides detailed unweighted and weighted sample information by gender, age, race, stratum,
type of impairment, and educational program.
A majority of the transition student clients are located in the Southern stratum of the state (73%),
with smaller numbers located in the Northern stratum (15%) and Rural stratum (12%; see Table
2). There are more men than women (58% vs. 43% respectively) who received the Division’s
Transition Student services. The majority of transition student clients were 19 years of age or
older (86%). Under half of clients identified as White (40%). The largest majority of
impairments of the transition student clients are cognitive (64%), followed by ‘other mental
impairments’ (16%; see Table 2).
The majority of transition students had enrolled in a high school program (90%) and on-the-job
training program (69%). To a lesser degree, students had participated in Job Corps program
(26%), two-year college programs (35%), technical and trade school programs (25%), and four-
year college programs (20%). A small percentage of students participated in GED programs
(2%).
Nevada Department of Employment, Training and Rehabilitation
Federal Fiscal Year 2013 Transition Student Satisfaction Survey
9
Table 2: Gender, Age, Stratum, Impairment Type & Educational Program of Student Population
Response
Frequency (N)
Weighted Response
Frequency (N)
Weighted Response
Rate (%) C.I. (95%)
Total 109 272 100.00% (100.0-100.0)
Gender Female
Male
44 a
65
116 b
156
42.5 c
57.5
(32.39-52.67) d
(47.33-67.61)
Age <=18
Age 19 or older
8
101
37
235
13.7
86.3
(04.29-23.10)
(76.90-95.71)
Race White
Non-White
49 109 39.9 (30.21-49.66)
60 163 60.1 (50.34-69.79)
Stratum
Southern
Northern
Rural
74
19
16
198
41
33
72.9
15.2
11.9
(64.36-81.41)
(08.50-21.83)
(05.86-18.04)
Disability Type
Cognitive Impairments 70 173 63.8 (53.86-73.81)
Deafness, Communication Visual 1 3 0.9 (00.00-02.73)
Mobility Orthopedic/Neurological Impairments 6 15 5.4 (01.02-09.71)
Other Mental Impairments 15 42 15.6 (07.27-23.85)
Other Physical Impairments 3 7 2.6 (00.00-05.61)
Other Visual Impairments 3 6 2.2 (00.00-04.72)
Psychosocial Impairments 5 12 4.6 (00.50-08.62)
Other Hearing Impairments 2 4 1.5 (00.00-03.76)
Blindness 2 5 1.8 (00.00-04.49)
Hearing Loss, Communication Visual 1 3 0.9 (00.00-02.73)
Hearing Loss, Communication Auditory 1 2 0.7 (00.00-02.23)
High School Yes 98 243 89.5 (83.39-95-65)
No 8 21 7.8 (02.37-13.25)
GED Program Yes 2 4 1.6 (00.00-03.89)
No 105 263 96.6 93.17-100.00)
Technical or Trade School Yes 6 13 21.7 (03.61-39.79)
No 17 46 75.7 (56.93-94.45)
2-Year College Degree Yes 9 29 28.7 (09.55-47.83)
No 17 71 71.3 (52.17-90.45)
4-Year College Degree Yes 4 9 17.4 (00.00-35.17)
No 15 40 77.7 (57.86-97.62)
On-the-Job Training Yes 41 102 67.8 (53.67-81.92)
No 18 48 32.2 (18-08-46.33)
Job Corps Yes 9 18 20.7 (06.88-34.46)
No 25 64 71.8 (53.90-89.73)
a. Response frequency is the number of participants in the sample for each category. For example, 44 of all participants in the obtained sample were females.
b. Weighted response frequency is the approximate number of individuals in the population that is represented by the sample after accounting for differential
sampling. For example, the 44 females in the sample is equivalent to 116 females in the entire transition student population. c. Weighted response rate is the approximate proportion of individuals in the population that is represented by the sample after accounting for differential
sampling. For example, the 44 females in the sample represent 42.5% of the transition student population.
d. Confidence Interval (C.I.) means that 95% of the time, the “true point estimate” will fall between the lower and upper bounds of the 95% Confidence Interval. For example, the true percentages of females in the population (based on 44 females from the sample) will fall between 32.39% and 52.67%.
Nevada Department of Employment, Training and Rehabilitation
Federal Fiscal Year 2013 Transition Student Satisfaction Survey
10
Satisfaction with Overall Services of Vocational
Rehabilitation Division
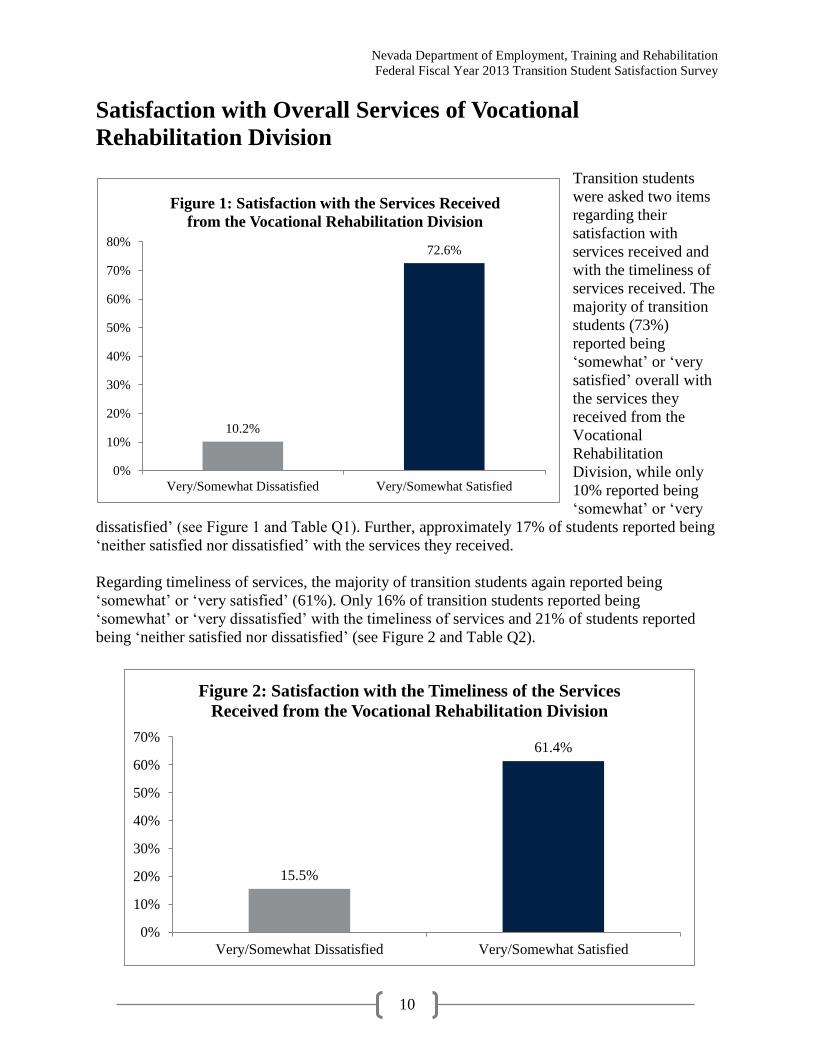
Transition students
were asked two items
regarding their
satisfaction with
services received and
with the timeliness of
services received. The
majority of transition
students (73%)
reported being
‘somewhat’ or ‘very
satisfied’ overall with
the services they
received from the
Vocational
Rehabilitation
Division, while only
10% reported being
‘somewhat’ or ‘very
dissatisfied’ (see Figure 1 and Table Q1). Further, approximately 17% of students reported being
‘neither satisfied nor dissatisfied’ with the services they received.
Regarding timeliness of services, the majority of transition students again reported being
‘somewhat’ or ‘very satisfied’ (61%). Only 16% of transition students reported being
‘somewhat’ or ‘very dissatisfied’ with the timeliness of services and 21% of students reported
being ‘neither satisfied nor dissatisfied’ (see Figure 2 and Table Q2).
10.2%
72.6%
0%
10%
20%
30%
40%
50%
60%
70%
80%
Very/Somewhat Dissatisfied Very/Somewhat Satisfied
Figure 1: Satisfaction with the Services Received
from the Vocational Rehabilitation Division
15.5%
61.4%
0%
10%
20%
30%
40%
50%
60%
70%
Very/Somewhat Dissatisfied Very/Somewhat Satisfied
Figure 2: Satisfaction with the Timeliness of the Services
Received from the Vocational Rehabilitation Division
Nevada Department of Employment, Training and Rehabilitation
Federal Fiscal Year 2013 Transition Student Satisfaction Survey
11
Experiences and Satisfaction with the High School Program
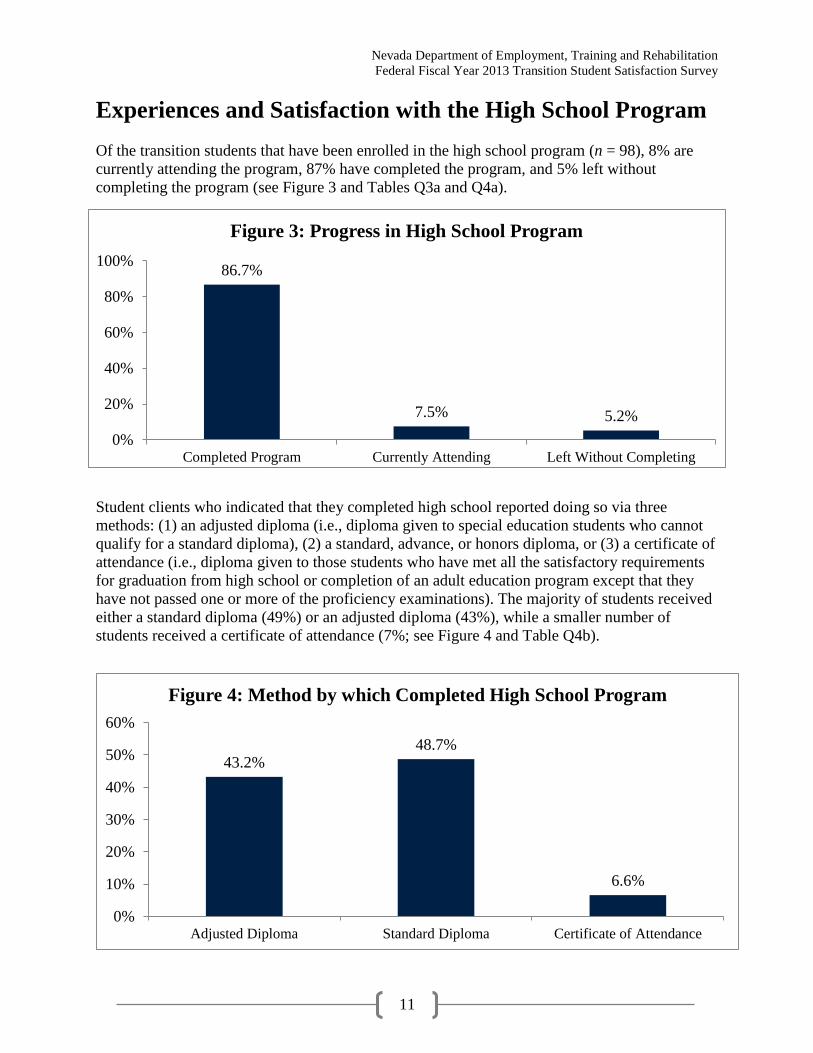
Of the transition students that have been enrolled in the high school program (n = 98), 8% are
currently attending the program, 87% have completed the program, and 5% left without
completing the program (see Figure 3 and Tables Q3a and Q4a).
Student clients who indicated that they completed high school reported doing so via three
methods: (1) an adjusted diploma (i.e., diploma given to special education students who cannot
qualify for a standard diploma), (2) a standard, advance, or honors diploma, or (3) a certificate of
attendance (i.e., diploma given to those students who have met all the satisfactory requirements
for graduation from high school or completion of an adult education program except that they
have not passed one or more of the proficiency examinations). The majority of students received
either a standard diploma (49%) or an adjusted diploma (43%), while a smaller number of
students received a certificate of attendance (7%; see Figure 4 and Table Q4b).
86.7%
7.5% 5.2%
0%
20%
40%
60%
80%
100%
Completed Program Currently Attending Left Without Completing
Figure 3: Progress in High School Program
43.2%48.7%
6.6%
0%
10%
20%
30%
40%
50%
60%
Adjusted Diploma Standard Diploma Certificate of Attendance
Figure 4: Method by which Completed High School Program

Nevada Department of Employment, Training and Rehabilitation
Federal Fiscal Year 2013 Transition Student Satisfaction Survey
12
Clients’ overall satisfaction with the
help the Vocational Rehabilitation
Staff gave them with job or career
planning while in high school was
generally positive; almost two-thirds
(65%) of students reported being
‘somewhat’ or ‘very satisfied’ with
the help, and only 18% of students
reported being ‘somewhat’ or ‘very
dissatisfied’ with the help (see Figure
5 and Table Q5a).
Experiences and
Satisfaction with Other
Educational Programs
Students were asked about their enrollment and satisfaction in a total of six different educational
programs: (1) GED Program, (2) Technical or Trade School Program, (3) On-the-Job Training,
(4) Two-Year College Degree Program, (5) Four-Year College Degree Program, and (6) Job
Corps Program. Each of the educational programs had sample sizes too small to allow summary
analyses by weighted percentages. In addition, the use of weighted statistics to make
comparisons between groups, such as gender, age, and region, is not appropriate as these
descriptions will not be accurate. Below is an overall summary of experience and satisfaction
with these programs by non-weighted frequencies (N). Tables Q3b-Q6ce in Appendix F are
available for further detailed information. Due to the small sample sizes, both weighted
percentages and summary analyses regarding between-group comparisons are excluded from this
text.
GED Program
Two students reported having enrolled in a GED program, and both students left without
completing their GED Program (see Tables Q3b and Q4c). Regarding their level of satisfaction
with the help that Vocational Rehabilitation Staff gave to them for job or career planning while
in the GED program, both students were satisfied, either ‘somewhat’ or ‘very’ (see Table Q5b).
Technical or Trade School Program
Twenty-four students (16 males and 8 females) reported being offered the opportunity to
participate in a technical or trade school program (see Figure 6 on page 14 and Table Q6Aa). Of
the students who were offered the opportunity, six reported participating in a technical or trade
school (see Figure 6 on page 14 and Table Q6Ba). Students participating in a technical or trade
18.0%
64.8%
0%
10%
20%
30%
40%
50%
60%
70%
Very/Somewhat
Dissatisfied
Very/Somewhat Satisfied
Figure 5: Satisfaction with Help
Vocational Rehabilitation Staff Provided
Regarding Job or Career Planning while
in High School Program
Nevada Department of Employment, Training and Rehabilitation
Federal Fiscal Year 2013 Transition Student Satisfaction Survey
13
school program comprised of five males and one female (see Table Q6Ba). Of the six students
who participated in the technical or trade school program, all students were satisfied, either
‘somewhat’ or ‘very,’ with the help they received from the Vocational Rehabilitation staff for the
program (see Table Q6Ca).
On-the-Job Training Program
Fifty-nine students (39 males and 20 females) reported being offered the opportunity to
participate in an on-the-job training program (see Figure 6 on next page and Table Q6Ab). Of the
students who were offered the opportunity, 41 reported participating in on-the-job training
program (see Figure 6 on next page and Table Q6Ab). Students participating in on-the-job
training program were comprised of 27 males and 14 females (see Table Q6Bb). Thirty-six
students were ‘somewhat’ or ‘very satisfied’ with the help Vocational Rehabilitation Staff gave
to them with the on-the-job training program (see Table Q6Cb). Only two students were ‘very
dissatisfied,’ and three were ‘neither satisfied nor dissatisfied’ with the help they received from
the Vocational Rehabilitation Staff for the program (see Table Q6Cb).
Two-Year College Degree Program
Twenty-six students (13 males and 13 females) reported being offered the opportunity to
participate in a two-year college degree program (see Figure 6 on next page and Table Q6Ac).
Of the students who were offered the opportunity, nine students reported participating in a two-
year degree program (see Figure 6 on next page and Table Q6Bc). Students participating in a
two-year college degree program were comprised of four males and five females (see Table
Q6Bc). Six of these students were ‘very’ or ‘somewhat satisfied’ with the help they received
from the Vocational Rehabilitation Staff with the two-year college degree program, while three
students were ‘neither satisfied nor dissatisfied’ with the help they received for the program (see
Table Q6Cc).
Four-Year College Degree Program
Twenty students (11 males and 9 females) reported being offered an opportunity to participate in
a four-year college degree program (see Figure 6 on next page and Table Q6Ad). Of the students
offered the opportunity, four reported participating in a four-year college degree program (see
Figure 6 on next page and Table Q6Bd). Students participating in four-year college degree
program comprised of two males and two females (see Table Q6Bd). All students reported being
satisfied, either ‘somewhat’ or ‘very,’ with the help they received from the Vocational
Rehabilitation Staff with the four-year college degree program (see Table Q6Cd).
Job Corps Program Thirty-five students (22 males and 13 females) reported being offered an opportunity to
participate in a Job Corps program (see Figure 6 on next page and Table Q6Ae). Of the students
offered the opportunity, nine reported participating in a Job Corps Program (see Figure 6 on next
page and Table Q6Be). Students participating in Job Corps Program comprised of seven males
Nevada Department of Employment, Training and Rehabilitation
Federal Fiscal Year 2013 Transition Student Satisfaction Survey
14
and two females (see Table Q6Be). Seven of these students—the majority—were ‘somewhat’ or
‘very satisfied’ with the help they received from the Vocational Rehabilitation staff with the Job
Corps Program, while only two were ‘neither satisfied nor dissatisfied’ with the help they
received for the program (see Table Q6Ce).
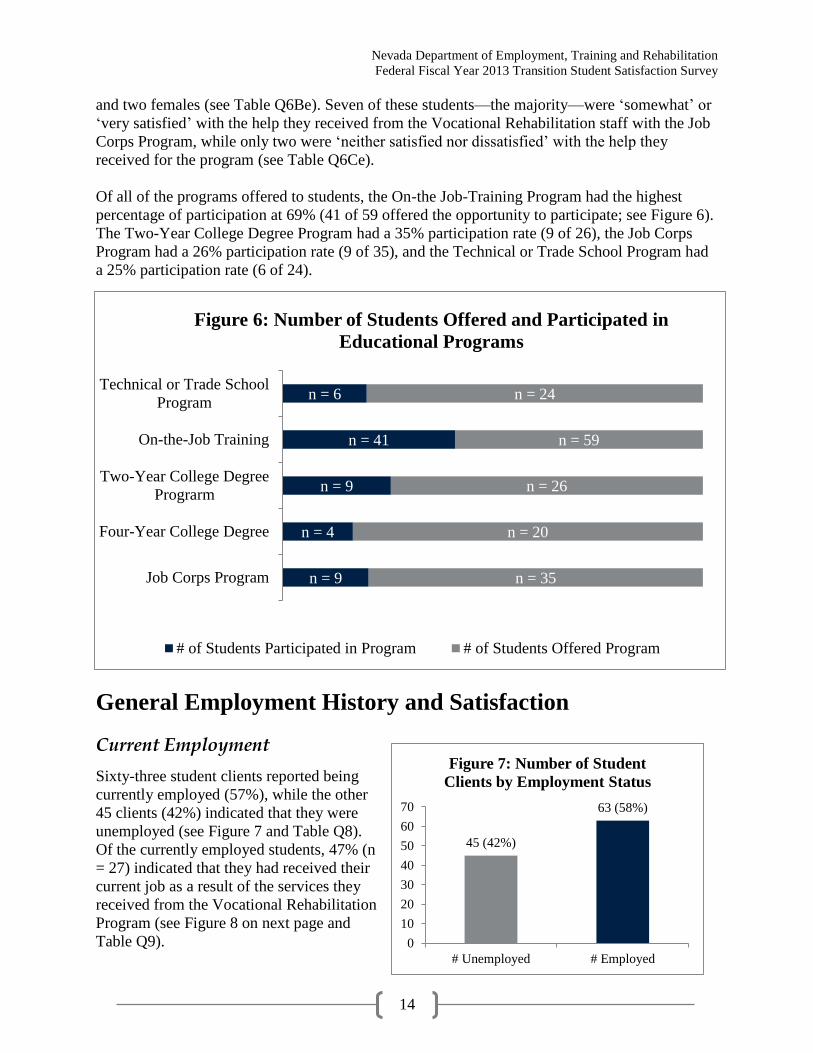
Of all of the programs offered to students, the On-the Job-Training Program had the highest
percentage of participation at 69% (41 of 59 offered the opportunity to participate; see Figure 6).
The Two-Year College Degree Program had a 35% participation rate (9 of 26), the Job Corps
Program had a 26% participation rate (9 of 35), and the Technical or Trade School Program had
a 25% participation rate (6 of 24).
General Employment History and Satisfaction
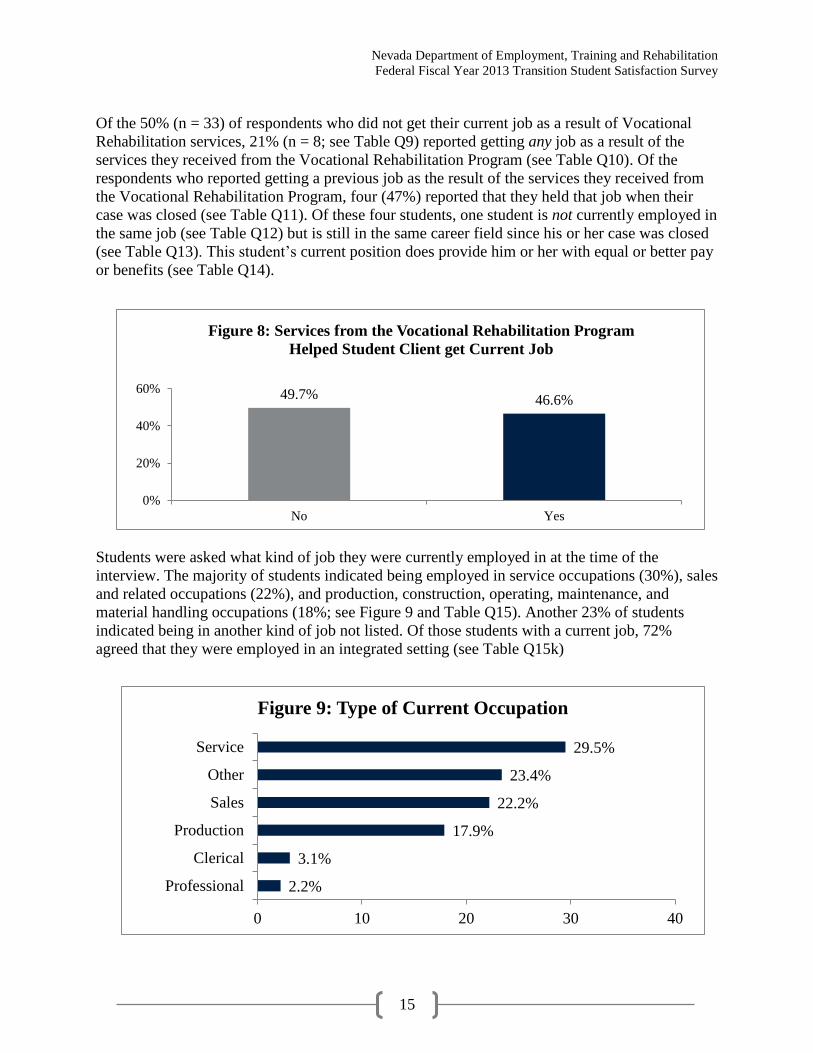
Current Employment
Sixty-three student clients reported being
currently employed (57%), while the other
45 clients (42%) indicated that they were
unemployed (see Figure 7 and Table Q8).
Of the currently employed students, 47% (n
= 27) indicated that they had received their
current job as a result of the services they
received from the Vocational Rehabilitation
Program (see Figure 8 on next page and
Table Q9).
n = 9
n = 4
n = 9
n = 41
n = 6
n = 35
n = 20
n = 26
n = 59
n = 24
Job Corps Program
Four-Year College Degree
Two-Year College Degree
Prograrm
On-the-Job Training
Technical or Trade School
Program
Figure 6: Number of Students Offered and Participated in
Educational Programs
# of Students Participated in Program # of Students Offered Program
45 (42%)
63 (58%)
0
10
20
30
40
50
60
70
# Unemployed # Employed
Figure 7: Number of Student
Clients by Employment Status
Nevada Department of Employment, Training and Rehabilitation
Federal Fiscal Year 2013 Transition Student Satisfaction Survey
15
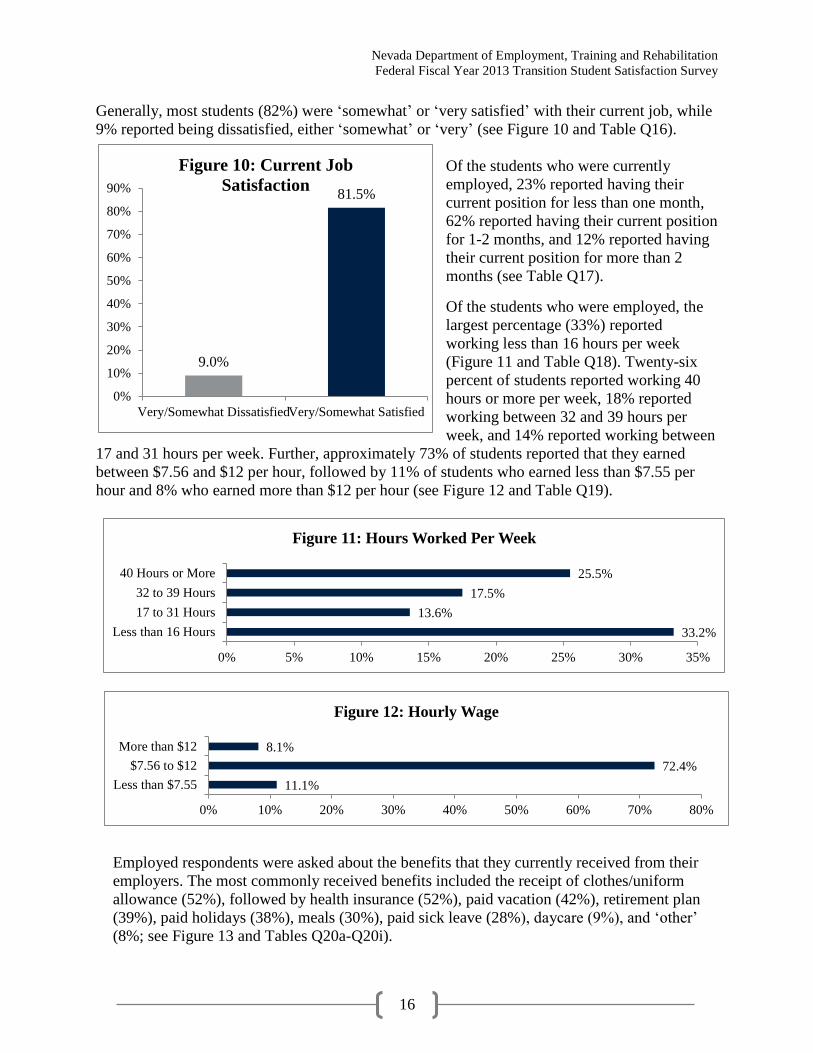
Of the 50% (n = 33) of respondents who did not get their current job as a result of Vocational
Rehabilitation services, 21% (n = 8; see Table Q9) reported getting any job as a result of the
services they received from the Vocational Rehabilitation Program (see Table Q10). Of the
respondents who reported getting a previous job as the result of the services they received from
the Vocational Rehabilitation Program, four (47%) reported that they held that job when their
case was closed (see Table Q11). Of these four students, one student is not currently employed in
the same job (see Table Q12) but is still in the same career field since his or her case was closed
(see Table Q13). This student’s current position does provide him or her with equal or better pay
or benefits (see Table Q14).
Students were asked what kind of job they were currently employed in at the time of the
interview. The majority of students indicated being employed in service occupations (30%), sales
and related occupations (22%), and production, construction, operating, maintenance, and
material handling occupations (18%; see Figure 9 and Table Q15). Another 23% of students
indicated being in another kind of job not listed. Of those students with a current job, 72%
agreed that they were employed in an integrated setting (see Table Q15k)
49.7% 46.6%
0%
20%
40%
60%
No Yes
Figure 8: Services from the Vocational Rehabilitation Program
Helped Student Client get Current Job
2.2%
3.1%
17.9%
22.2%
23.4%
29.5%
0 10 20 30 40
Professional
Clerical
Production
Sales
Other
Service
Figure 9: Type of Current Occupation
Nevada Department of Employment, Training and Rehabilitation
Federal Fiscal Year 2013 Transition Student Satisfaction Survey
16
Generally, most students (82%) were ‘somewhat’ or ‘very satisfied’ with their current job, while
9% reported being dissatisfied, either ‘somewhat’ or ‘very’ (see Figure 10 and Table Q16).
Of the students who were currently
employed, 23% reported having their
current position for less than one month,
62% reported having their current position
for 1-2 months, and 12% reported having
their current position for more than 2
months (see Table Q17).
Of the students who were employed, the
largest percentage (33%) reported
working less than 16 hours per week
(Figure 11 and Table Q18). Twenty-six
percent of students reported working 40
hours or more per week, 18% reported
working between 32 and 39 hours per
week, and 14% reported working between
17 and 31 hours per week. Further, approximately 73% of students reported that they earned
between $7.56 and $12 per hour, followed by 11% of students who earned less than $7.55 per
hour and 8% who earned more than $12 per hour (see Figure 12 and Table Q19).
9.0%
81.5%
0%
10%
20%
30%
40%
50%
60%
70%
80%
90%
Very/Somewhat DissatisfiedVery/Somewhat Satisfied
Figure 10: Current Job
Satisfaction
11.1%
72.4%
8.1%
0% 10% 20% 30% 40% 50% 60% 70% 80%
Less than $7.55
$7.56 to $12
More than $12
Figure 12: Hourly Wage
33.2%
13.6%
17.5%
25.5%
0% 5% 10% 15% 20% 25% 30% 35%
Less than 16 Hours
17 to 31 Hours
32 to 39 Hours
40 Hours or More
Figure 11: Hours Worked Per Week
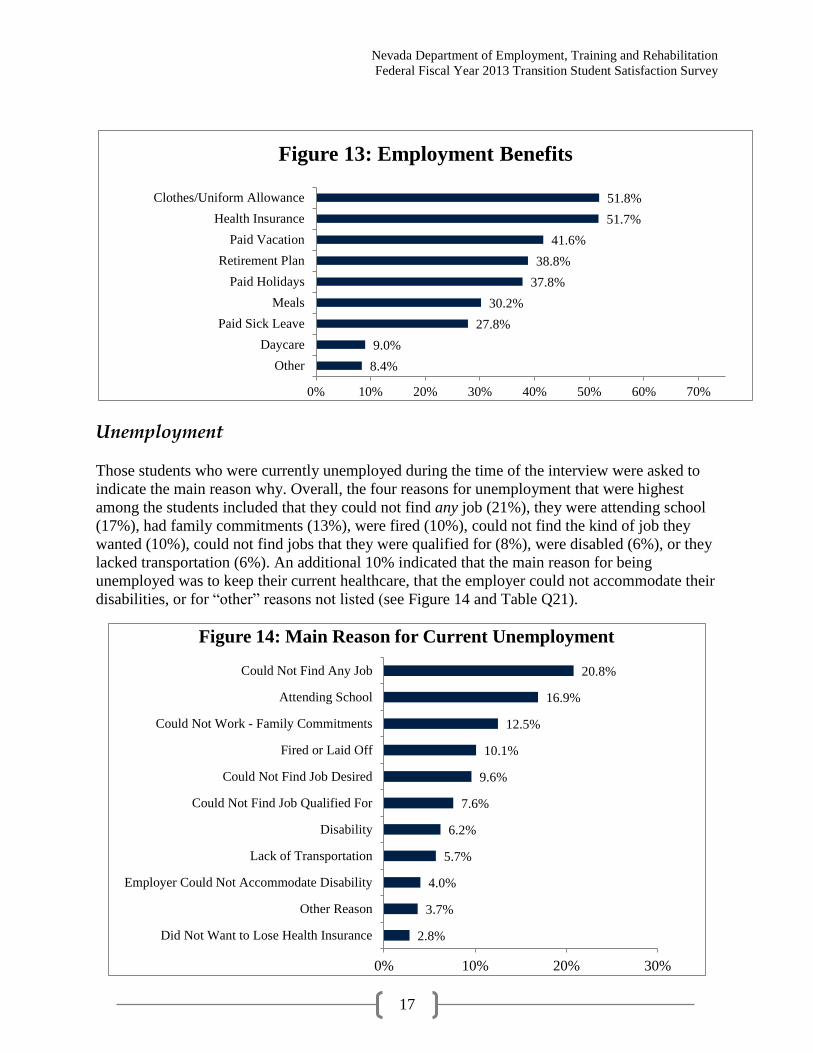
Employed respondents were asked about the benefits that they currently received from their
employers. The most commonly received benefits included the receipt of clothes/uniform
allowance (52%), followed by health insurance (52%), paid vacation (42%), retirement plan
(39%), paid holidays (38%), meals (30%), paid sick leave (28%), daycare (9%), and ‘other’
(8%; see Figure 13 and Tables Q20a-Q20i).
Nevada Department of Employment, Training and Rehabilitation
Federal Fiscal Year 2013 Transition Student Satisfaction Survey
17
Unemployment
Those students who were currently unemployed during the time of the interview were asked to
indicate the main reason why. Overall, the four reasons for unemployment that were highest
among the students included that they could not find any job (21%), they were attending school
(17%), had family commitments (13%), were fired (10%), could not find the kind of job they
wanted (10%), could not find jobs that they were qualified for (8%), were disabled (6%), or they
lacked transportation (6%). An additional 10% indicated that the main reason for being
unemployed was to keep their current healthcare, that the employer could not accommodate their
disabilities, or for “other” reasons not listed (see Figure 14 and Table Q21).
8.4%
9.0%
27.8%
30.2%
37.8%
38.8%
41.6%
51.7%
51.8%
0% 10% 20% 30% 40% 50% 60% 70%
Other
Daycare
Paid Sick Leave
Meals
Paid Holidays
Retirement Plan
Paid Vacation
Health Insurance
Clothes/Uniform Allowance
Figure 13: Employment Benefits
2.8%
3.7%
4.0%
5.7%
6.2%
7.6%
9.6%
10.1%
12.5%
16.9%
20.8%
0% 10% 20% 30%
Did Not Want to Lose Health Insurance
Other Reason
Employer Could Not Accommodate Disability
Lack of Transportation
Disability
Could Not Find Job Qualified For
Could Not Find Job Desired
Fired or Laid Off
Could Not Work - Family Commitments
Attending School
Could Not Find Any Job
Figure 14: Main Reason for Current Unemployment
Nevada Department of Employment, Training and Rehabilitation
Federal Fiscal Year 2013 Transition Student Satisfaction Survey
18
General Experiences and Satisfaction with Job Placement,
Job Coaching, and Other Support Services
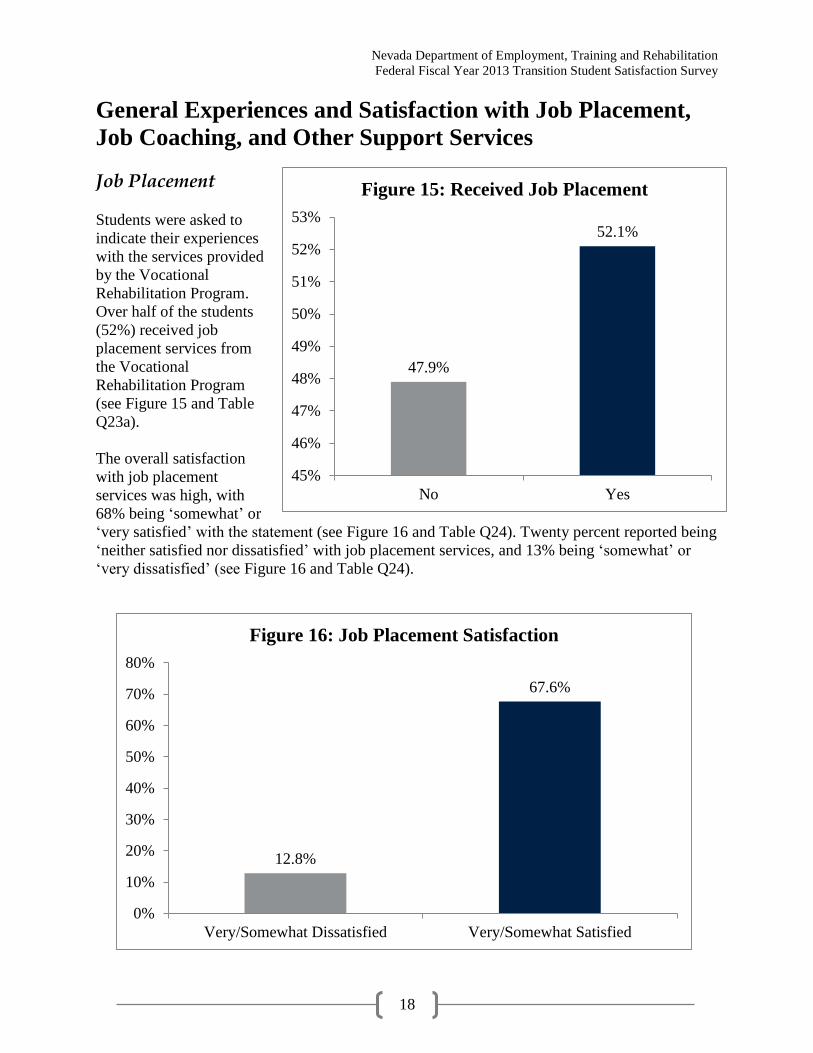
Job Placement
Students were asked to
indicate their experiences
with the services provided
by the Vocational
Rehabilitation Program.
Over half of the students
(52%) received job
placement services from
the Vocational
Rehabilitation Program
(see Figure 15 and Table
Q23a).
The overall satisfaction
with job placement
services was high, with
68% being ‘somewhat’ or
‘very satisfied’ with the statement (see Figure 16 and Table Q24). Twenty percent reported being
‘neither satisfied nor dissatisfied’ with job placement services, and 13% being ‘somewhat’ or
‘very dissatisfied’ (see Figure 16 and Table Q24).
12.8%
67.6%
0%
10%
20%
30%
40%
50%
60%
70%
80%
Very/Somewhat Dissatisfied Very/Somewhat Satisfied
Figure 16: Job Placement Satisfaction
47.9%
52.1%
45%
46%
47%
48%
49%
50%
51%
52%
53%
No Yes
Figure 15: Received Job Placement

Nevada Department of Employment, Training and Rehabilitation
Federal Fiscal Year 2013 Transition Student Satisfaction Survey
19
Job Coaching
Approximately 51% of students received job coaching services from the Vocational
Rehabilitation Program (see Figure 17 and Table Q23b).
The overall satisfaction of job coaching was high, with 75% of students reporting being
‘somewhat’ or ‘very satisfied’ (see Figure 18 / and Table Q25). Approximately 4% reported
dissatisfied, either ‘somewhat’ or ‘very’, and the remaining 21% of students reported being
‘neither satisfied nor dissatisfied’ with job coaching services (see Figure 18 and Table Q25).
3.9%
75.2%
0%
10%
20%
30%
40%
50%
60%
70%
80%
Very/Somewhat Dissatisfied Very/Somewhat Satisfied
Figure 18: Job Coaching Satisfaction
48.4%
51.0%
47%
48%
49%
50%
51%
52%
No Yes
Figure 17: Received Job Coaching

Nevada Department of Employment, Training and Rehabilitation
Federal Fiscal Year 2013 Transition Student Satisfaction Survey
20
Other support from Vocational Rehabilitation employees other than your Counselor
Approximately 66% of students reported that they have received other support from Vocational
Rehabilitation employees other than their primary counselor (see Figure 19 and Table Q23c).
Of those 71 students who received support from employees other than their counselor, 72% of
students were ‘somewhat’ or ‘very satisfied’ with these services (see Figure 20 and Table Q26).
Nearly 22% reported being ‘neither satisfied nor dissatisfied’ with the support they received
from other Vocational Rehabilitation employees, while the remaining 6% reported being
‘somewhat’ or ‘very dissatisfied’ with the support they received (see Figure 21 and Table Q26).
33.8%
66.2%
0%
10%
20%
30%
40%
50%
60%
70%
No Yes
Figure 19: Received Support from Employees Other
than Counselor
5.9%
72.4%
0%
10%
20%
30%
40%
50%
60%
70%
80%
Very/Somewhat Dissatisfied Very/Somewhat Satisfied
Figure 20: Satisfaction with Support from
Other Employees
Nevada Department of Employment, Training and Rehabilitation
Federal Fiscal Year 2013 Transition Student Satisfaction Survey
21
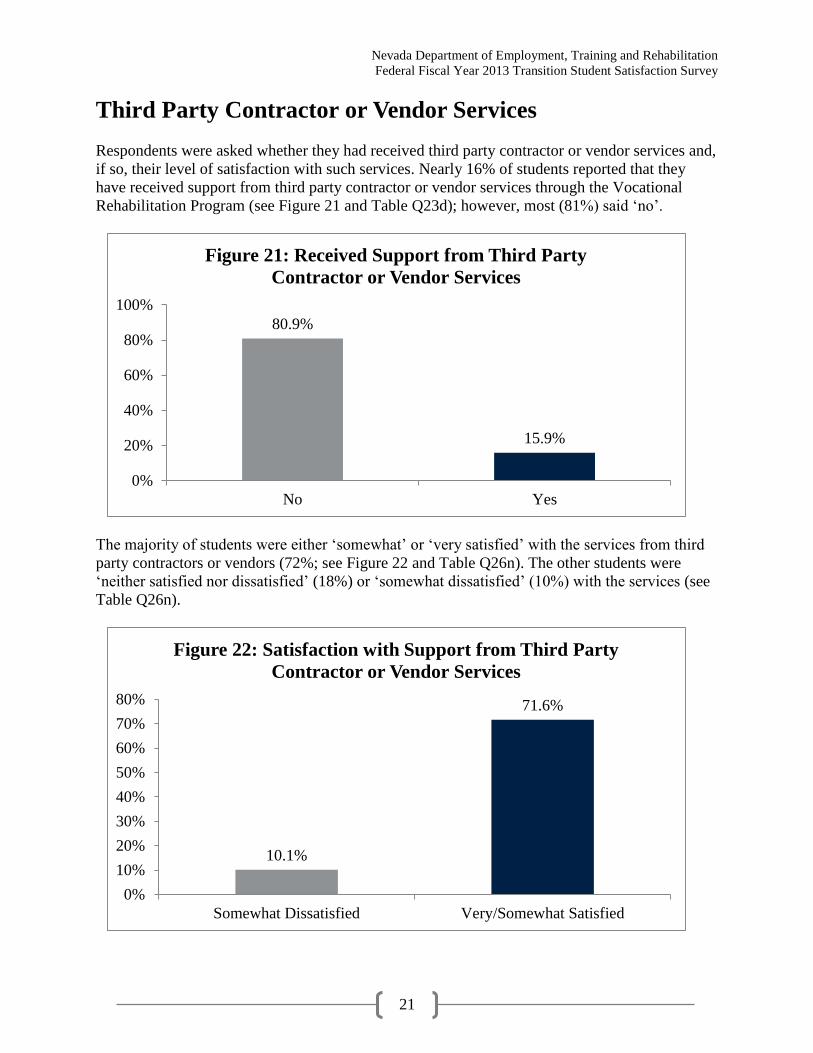
Third Party Contractor or Vendor Services
Respondents were asked whether they had received third party contractor or vendor services and,
if so, their level of satisfaction with such services. Nearly 16% of students reported that they
have received support from third party contractor or vendor services through the Vocational
Rehabilitation Program (see Figure 21 and Table Q23d); however, most (81%) said ‘no’.
The majority of students were either ‘somewhat’ or ‘very satisfied’ with the services from third
party contractors or vendors (72%; see Figure 22 and Table Q26n). The other students were
‘neither satisfied nor dissatisfied’ (18%) or ‘somewhat dissatisfied’ (10%) with the services (see
Table Q26n).
10.1%
71.6%
0%
10%
20%
30%
40%
50%
60%
70%
80%
Somewhat Dissatisfied Very/Somewhat Satisfied
Figure 22: Satisfaction with Support from Third Party
Contractor or Vendor Services
80.9%
15.9%
0%
20%
40%
60%
80%
100%
No Yes
Figure 21: Received Support from Third Party
Contractor or Vendor Services

Nevada Department of Employment, Training and Rehabilitation
Federal Fiscal Year 2013 Transition Student Satisfaction Survey
22
Assistive Technology Devices
The Vocational Rehabilitation Program provides student clients with assistive technology
services, such as providing or purchasing devices to help with vision, hearing, communication,
getting around, and changes to students’ home or workplaces. Of the students who responded to
these questions, 18% received devices that helped them with their vision, such as glasses or
screen readers, and 2% reported receiving devices that helped them to get around, such as
transportation, canes, wheelchairs, or orthotics/prosthetics. Approximately 2% of students
reported receiving devices that made their home or workplace more accessible, such as
specialized office equipment or book/copy holders. Additionally, 10% of students reported
receiving hearing devices, such as hearing aids or alert signal systems, 5% of students reported
receiving devices to help them communicate, such as hand-held digital recorders or AAC box,
and another 3% indicated the receipt of other types of assistive technology devices (see Figure
23 and Tables Q27a-Q27f).
Most of these respondents rated these devices as ‘good’ or ‘excellent’ (54%; see Figure 24 and
Table Q28).
3.3%
5.4%
10.0%
1.9%
1.6%
17.6%
0% 2% 4% 6% 8% 10% 12% 14% 16% 18% 20%
Other
Communication
Hearing
Making Home/Workplace Accessible
Getting Around
Vision
Figure 23: Types of Assistive Technology Devices
14.9%
29.8%
21.3%
34.0%
0%
5%
10%
15%
20%
25%
30%
35%
40%
Poor Fair Good Excellent
Figure 24: Rating the Quality of Assistive Technology Devices
Nevada Department of Employment, Training and Rehabilitation
Federal Fiscal Year 2013 Transition Student Satisfaction Survey
23
Referrals and Recommendations of Transition Student
Services
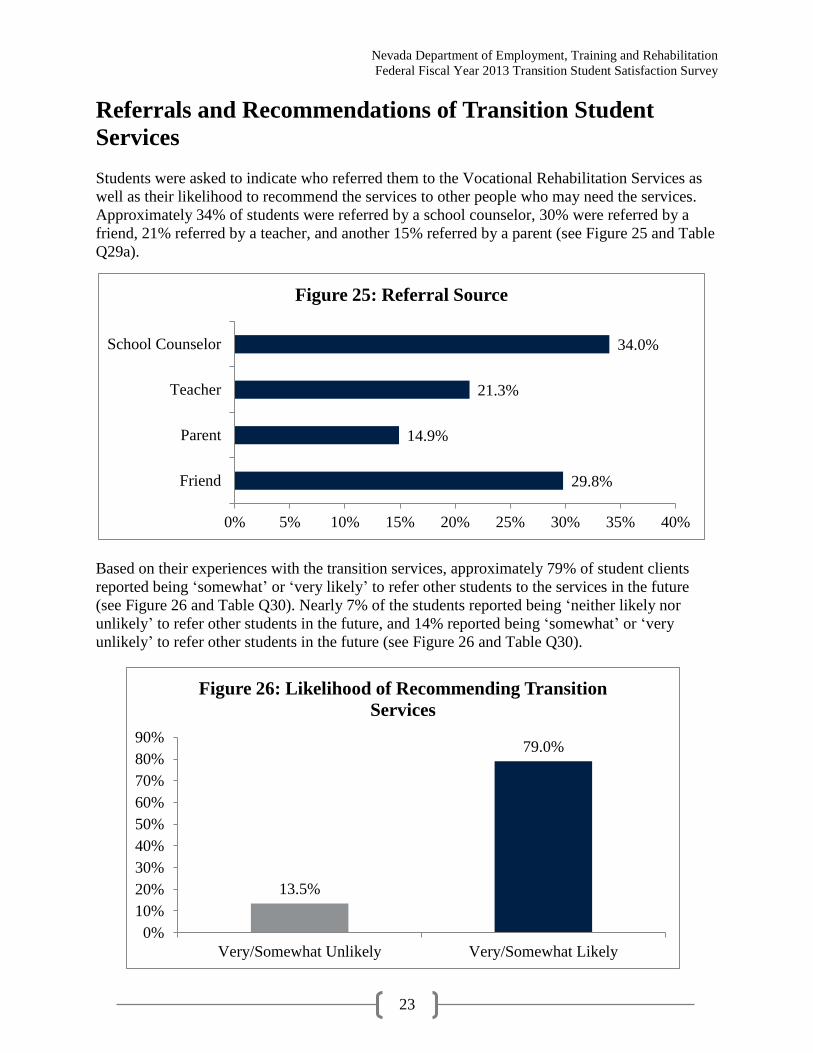
Students were asked to indicate who referred them to the Vocational Rehabilitation Services as
well as their likelihood to recommend the services to other people who may need the services.
Approximately 34% of students were referred by a school counselor, 30% were referred by a
friend, 21% referred by a teacher, and another 15% referred by a parent (see Figure 25 and Table
Q29a).
Based on their experiences with the transition services, approximately 79% of student clients
reported being ‘somewhat’ or ‘very likely’ to refer other students to the services in the future
(see Figure 26 and Table Q30). Nearly 7% of the students reported being ‘neither likely nor
unlikely’ to refer other students in the future, and 14% reported being ‘somewhat’ or ‘very
unlikely’ to refer other students in the future (see Figure 26 and Table Q30).
13.5%
79.0%
0%
10%
20%
30%
40%
50%
60%
70%
80%
90%
Very/Somewhat Unlikely Very/Somewhat Likely
Figure 26: Likelihood of Recommending Transition
Services
29.8%
14.9%
21.3%
34.0%
0% 5% 10% 15% 20% 25% 30% 35% 40%
Friend
Parent
Teacher
School Counselor
Figure 25: Referral Source
Nevada Department of Employment, Training and Rehabilitation
Federal Fiscal Year 2013 Transition Student Satisfaction Survey
24
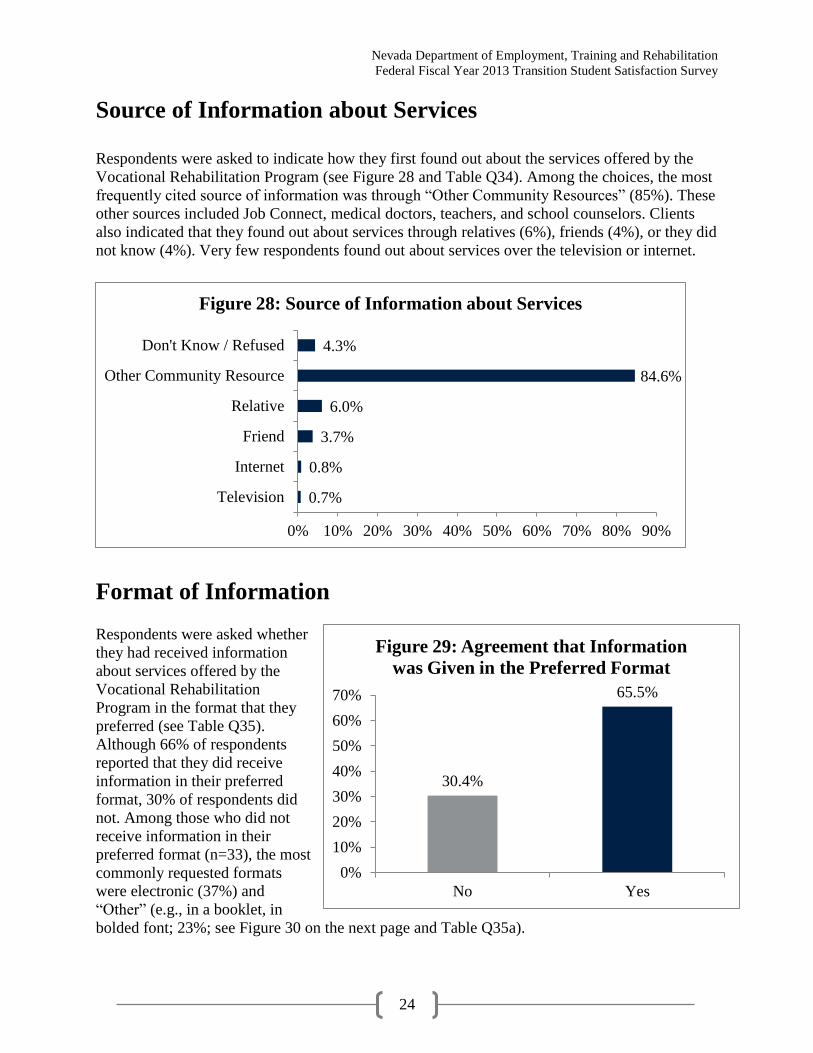
Source of Information about Services
Respondents were asked to indicate how they first found out about the services offered by the
Vocational Rehabilitation Program (see Figure 28 and Table Q34). Among the choices, the most
frequently cited source of information was through “Other Community Resources” (85%). These
other sources included Job Connect, medical doctors, teachers, and school counselors. Clients
also indicated that they found out about services through relatives (6%), friends (4%), or they did
not know (4%). Very few respondents found out about services over the television or internet.
Format of Information
Respondents were asked whether
they had received information
about services offered by the
Vocational Rehabilitation
Program in the format that they
preferred (see Table Q35).
Although 66% of respondents
reported that they did receive
information in their preferred
format, 30% of respondents did
not. Among those who did not
receive information in their
preferred format (n=33), the most
commonly requested formats
were electronic (37%) and
“Other” (e.g., in a booklet, in
bolded font; 23%; see Figure 30 on the next page and Table Q35a).
0.7%
0.8%
3.7%
6.0%
84.6%
4.3%
0% 10% 20% 30% 40% 50% 60% 70% 80% 90%
Television
Internet
Friend
Relative
Other Community Resource
Don't Know / Refused
Figure 28: Source of Information about Services
30.4%
65.5%
0%
10%
20%
30%
40%
50%
60%
70%
No Yes
Figure 29: Agreement that Information
was Given in the Preferred Format

Nevada Department of Employment, Training and Rehabilitation
Federal Fiscal Year 2013 Transition Student Satisfaction Survey
25
Natural Support
Respondents indicated the extent to which they received “natural support” during the services
provided by the Vocational Rehabilitation Program (See Table Q36). Examples of natural
support include help from friends and family. Approximately equal percentages of respondents
indicated that they either often received natural support (36%) or sometimes received natural
support (32%). About 30% of respondents never or seldom received natural support (see Figure
31 and Table Q36).
11.4%
4.3%
36.9%
2.1%
22.8%
22.5%
0% 5% 10% 15% 20% 25% 30% 35% 40%
Large Font
Braille
Electronically
Alternative Language
Other
Don't Know / Refused
Figure 30: Preferred Format for Service Information
21.1%
9.9%
32.2%
35.9%
0%
5%
10%
15%
20%
25%
30%
35%
40%
Never Seldom Sometimes Often
Figure 31: Frequency of Receipt of Natural Support
Nevada Department of Employment, Training and Rehabilitation
Federal Fiscal Year 2013 Transition Student Satisfaction Survey
26
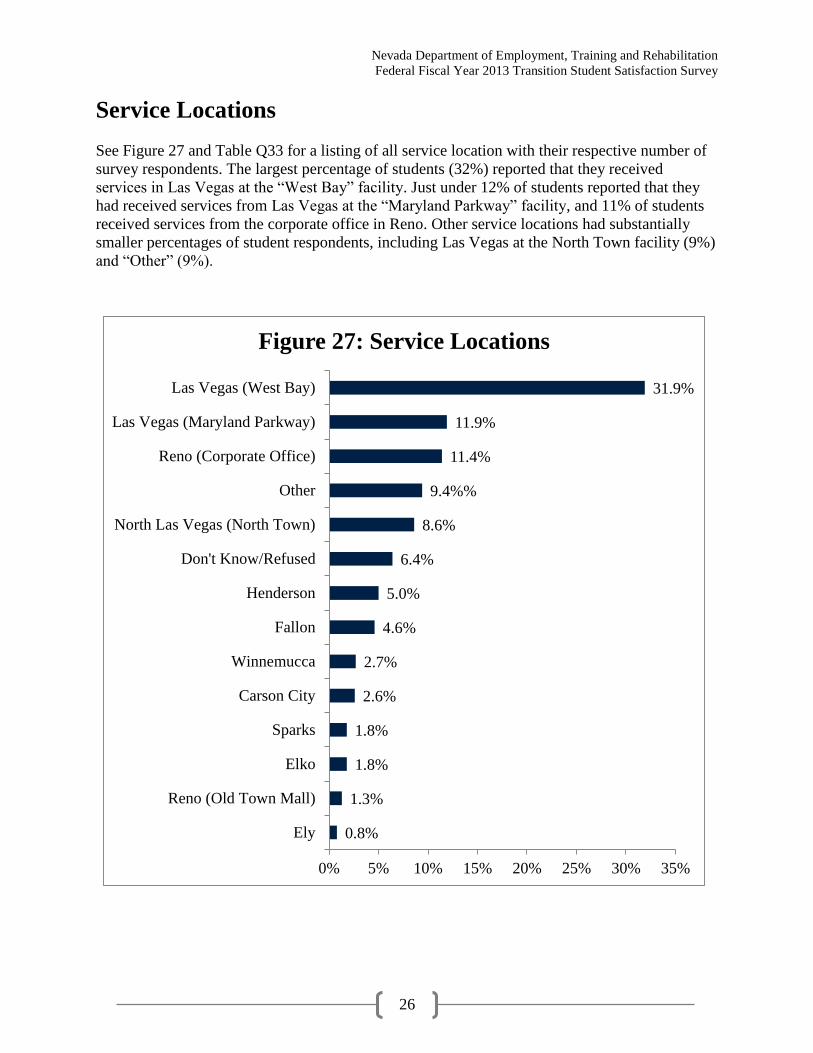
Service Locations
See Figure 27 and Table Q33 for a listing of all service location with their respective number of
survey respondents. The largest percentage of students (32%) reported that they received
services in Las Vegas at the “West Bay” facility. Just under 12% of students reported that they
had received services from Las Vegas at the “Maryland Parkway” facility, and 11% of students
received services from the corporate office in Reno. Other service locations had substantially
smaller percentages of student respondents, including Las Vegas at the North Town facility (9%)
and “Other” (9%).
0.8%
1.3%
1.8%
1.8%
2.6%
2.7%
4.6%
5.0%
6.4%
8.6%
9.4%%
11.4%
11.9%
31.9%
0% 5% 10% 15% 20% 25% 30% 35%
Ely
Reno (Old Town Mall)
Elko
Sparks
Carson City
Winnemucca
Fallon
Henderson
Don't Know/Refused
North Las Vegas (North Town)
Other
Reno (Corporate Office)
Las Vegas (Maryland Parkway)
Las Vegas (West Bay)
Figure 27: Service Locations
Nevada Department of Employment, Training and Rehabilitation
Federal Fiscal Year 2013 Transition Student Satisfaction Survey
27
Appendix A:
Post-Weighting Methodology
Nevada Department of Employment, Training and Rehabilitation
Federal Fiscal Year 2013 Transition Student Satisfaction Survey
28
Post-Weighting Methodology
Surveys are conducted to obtain a representative sample of the population. However, due to the
nature of any sampling process, over-sampling some categories and under-sampling others is
more likely to occur. In other words, the way a certain characteristic (such as region, sex, age
etc.) of the sample is distributed may differ from the way it is distributed in the population,
which introduces bias into any estimate you may obtain from the sample data. To correct for
these biases mathematically and to restore the population’s region, sex and age distribution in the
sample, post-stratification weighting must be conducted. The post-stratification adjustment
forces the sampling weights within each post stratum (region, sex and age in the Division
sample) to the known Division population distribution. Post-stratification improves the precision
of the sample estimators and serves as a correction for non-response and under-coverage error,
which consequently induce a relative reduction in bias.
Un-weighted rates from the survey are not influenced by the stratum, sex, age, and race
distributions in the population. By using un-weighted rates, it is assumed implicitly, that every
single person in the survey represents one and only one person in the whole population (which is
not the case!). For example, if people of the age 18-24 were underrepresented in the survey, after
adjusting for stratum, sex and age, these people of the age 18-24 years old will be granted a
higher weight in order to overcome such under representation in the survey to account for
differing distributions of stratum, sex and age within the entire population. So, to compensate for
over-representation and/or under-representation in the sample, weighted rates must be used.
The formula for the weights is: where is the sample proportion, and is the
same proportion. The formula was used on the cell proportion from tables indicating the size of
particular subpopulations based on known demographic characteristics (e.g., males aged 18 – 24
living in Southern Nevada). After post-stratification, the weighting assured that the
representation of certain subpopulations corresponded to figures from the population as shown in
Tables 2 and 3.
Nevada Department of Employment, Training and Rehabilitation
Federal Fiscal Year 2013 Transition Student Satisfaction Survey
29
Appendix B:
Transition Student
Satisfaction Survey
Nevada Department of Employment, Training and Rehabilitation
Federal Fiscal Year 2013 Transition Student Satisfaction Survey
30
Transition Student Satisfaction Survey
Dial Screen
1st Phone Number: [primary phone]
2nd Phone Number: [secondary phone]
Client Name: [respondent]
Client's Gender: [Male/Female]
Client's City: [city]
Client's Primary Disability: [primary disability]
What happened when you dialed the number?
1 - Someone Answered (skip to Introduction 1)
2 - Busy
3 - No Response
4 - Answering Machine (skip to Answering Machine)
5 - Blocked Call
6 - Disconnected Number
7 -TTY or other Disability-Related Line Impairment
8 - Phone/Line Impairment
9 - Computer/Fax Machine
Introduction 1
Hello, my name is [name] from the University of Nevada. I am calling on behalf of the Nevada
Department of Employment, Training, and Rehabilitation for [respondent]. Each year we call
clients who worked with vocational rehabilitation counselors to receive help with training,
finding a job, or going from school to work or post-educational activities. This information is
confidential and [his/her] name will not be given to anyone. [His/Her] responses will be
combined with information from other clients and given to the Nevada Rehabilitation Division
so they can see how well the Division is doing and to determine how to improve the way they
help people find the best job for them. The questions are brief, and should only take about 10
minutes to complete. For [respondent]s’ participation, [he/she] will also be entered into a
drawing for a chance to receive 1 of 6 prepaid $50.00 VISA gift cards that can be used at any
location that accepts VISA.
If person says they did not receive services, PROBE: We show that you received services
from the Rehabilitation Division between 10/1/12-9/30/13 (READ: October 1st, 2012 and
September 30th, 2013). Did your counselor write up ANY type of plan for services? For
example, did they write up a plan for you to go to work, to go to training, for you to receive bus
passes or any type of transportation, for a uniform, for school, for assistive technology, or maybe
something else?
Read if respondent still doesn’t understand above question: By receiving services, we mean
you went to the Vocational Rehabilitation program, were determined to be eligible for services,
Nevada Department of Employment, Training and Rehabilitation
Federal Fiscal Year 2013 Transition Student Satisfaction Survey
31
and received one or more of the following: an individual employment plan, counseling,
evaluation, advice, or a product.
If person says they have never heard of DETR or Rehabilitation Division, PROBE: The
Rehabilitation Division provides services for people with disabilities to help enable them to work
and live independently. The Rehabilitation Division's vision is that of a barrier-free future where
every individual in Nevada has equal vocational, employment, and independent living
opportunities.
May I speak to [respondent]?
1 - R is available (informant answered phone, transfer to R) (skip to Introduction 1)
2 - R is speaking (respondent answered phone) (skip to Introduction 4)
3 - R has hearing impairment (skip to Hearing Impairment)
4 - Call back set by Informant
5 - Caregiver or Parent/Guardian will complete survey for respondent (skip to Introduction 3)
6 - Severe impairment/OR R unable to complete survey by phone OR WEB
7 - Wrong number (IWER: Verify phone number) (skip to Verify Phone)
8 - Language Barrier
9 - Refused
10 - Eligible respondent away for duration
Introduction 2
Hello, my name is [name], and I'm calling from the University of Nevada on behalf of the
Nevada Department of Employment, Training, and Rehabilitation. Each year we call clients who
worked with vocational rehabilitation counselors to receive help with training, finding a job, or
going from school to work or post-educational activities. We would like to know how you feel
about the services provided to you by your counselor. This information is confidential and your
name will not be given to anyone. Your responses will be combined with information from other
clients and given to the Nevada Rehabilitation Division so they can see how well the Division is
doing and to determine how to improve the way they help people find the best job for them. The
questions are brief, and should only take about 10 minutes to complete. For [respondent]s’
participation, [he/she] will also be entered into a drawing for a chance to receive 1 of 6 prepaid
$50.00 VISA gift cards that can be used at any location that accepts VISA. Would you be willing
to participate in this interview now?
Interviewer: If respondent says, "I have the information on the web, and I was just going to do it
online." Say, "Well if you have time now, it's actually easier to do the survey over the phone
because I can help you through it. May we do the interview now?"
If respondent says that they already did it on the web, thank them, and code out as 4.
If person says they did not receive services, PROBE: We show that you received services
from the Rehabilitation Division between 10/1/12-9/30/13 (READ: October 1st, 2012 and
September 30th, 2013). Did your counselor write up ANY type of plan for services? For
example, did they write up a plan for you to go to work, to go to training, for you to receive bus
Nevada Department of Employment, Training and Rehabilitation
Federal Fiscal Year 2013 Transition Student Satisfaction Survey
32
passes or any type of transportation, for a uniform, for school, for assistive technology, or maybe
something else?
Read if respondent still doesn’t understand above question: By receiving services, we mean
you went to the Vocational Rehabilitation program, were determined to be eligible for services,
and received one or more of the following: an individual employment plan, counseling,
evaluation, advice, or a product.
If person says they have never heard of DETR or Rehabilitation Division, PROBE: The
Rehabilitation Division provides services for people with disabilities to help enable them to work
and live independently. The Rehabilitation Division's vision is that of a barrier-free future where
every individual in Nevada has equal vocational, employment, and independent living
opportunities.
If person says "no" code 7 otherwise continue.
1 - Yes (skip to Impairment Check)
2 - Set call back
4 - No, I already completed it on the web
7 - Ineligible/Did not receive services from DETR
8 - Severe impairment/OR R unable to complete survey by phone or WEB
9 - Refused
Introduction 3
Each year we call clients who worked with vocational rehabilitation counselors to receive help
with training, finding a job, or going from school to work or post-educational activities. Over
the course of this interview, please respond as if you were the client receiving services from the
Department of Employment, Training, and Rehabilitation.
We would like to know about how you feel about the services provided to you by your
counselor. This information is confidential and your name will not be given to anyone. Your
responses will be combined with information from other clients and given to the Nevada
Rehabilitation Division so they can see how well the Division is doing and to determine how to
improve the way they help people find the best job for them.
Again, please respond to the questions as if you were the client receiving services from our
vocational rehabilitation counselors.
Interviewer: If respondent says, "I have the information on the web, and I was just going to do it
online." Say, "Well if you have time now, it's actually easier to do the survey over the phone
because I can help you through it. May we do the interview now?"
If respondent says that they already did it on the web, thank them, and code out as 4.
If person says they did not receive services, PROBE: We show that you received services
Nevada Department of Employment, Training and Rehabilitation
Federal Fiscal Year 2013 Transition Student Satisfaction Survey
33
from the Rehabilitation Division between 10/1/12-9/30/13 (READ: October 1st, 2012 and
September 30th, 2013). Did your counselor write up ANY type of plan for services? For
example, did they write up a plan for you to go to work, to go to training, for you to receive bus
passes or any type of transportation, for a uniform, for school, for assistive technology, or maybe
something else?
Read if respondent still doesn’t understand above question: By receiving services, we mean
you went to the Vocational Rehabilitation program, were determined to be eligible for services,
and received one or more of the following: an individual employment plan, counseling,
evaluation, advice, or a product.
If person says they have never heard of DETR or Rehabilitation Division, PROBE: The
Rehabilitation Division provides services for people with disabilities to help enable them to work
and live independently. The Rehabilitation Division's vision is that of a barrier-free future where
every individual in Nevada has equal vocational, employment, and independent living
opportunities.
If person says "no" code 7 otherwise continue.
1 - Continue (skip to Impairment Check)
2 - Set call back
4 - No, I already completed it on the web
7 - Ineligible/Did not receive services from DETR
9 - Refused
Introduction 4
Okay, as I mentioned, I'm calling from the University of Nevada on behalf of the Nevada
Department of Employment, Training, and Rehabilitation. They would like to know about how
you feel about the services provided to you by your counselor. The questions are brief, and
should only take about 10 minutes to complete. For [respondent]s’ participation, [he/she] will
also be entered into a drawing for a chance to receive 1 of 6 prepaid $50.00 VISA gift cards that
can be used at any location that accepts VISA. Would you be willing to participate in this
interview now?
Interviewer: If respondent says, "I have the information on the web, and I was just going to do it
online." Say, "Well if you have time now, it's actually easier to do the survey over the phone
because I can help you through it. May we do the interview now?"
If respondent says that they already did it on the web, thank them, and code out as 4.
If person says they did not receive services, PROBE: We show that you received services
from the Rehabilitation Division between 10/1/12-9/30/13 (READ: October 1st, 2012 and
September 30th, 2013). Did your counselor write up ANY type of plan for services? For
example, did they write up a plan for you to go to work, to go to training, for you to receive bus
passes or any type of transportation, for a uniform, for school, for assistive technology, or maybe

Nevada Department of Employment, Training and Rehabilitation
Federal Fiscal Year 2013 Transition Student Satisfaction Survey
34
something else?
Read if respondent still doesn’t understand above question: By receiving services, we mean
you went to the Vocational Rehabilitation program, were determined to be eligible for services,
and received one or more of the following: an individual employment plan, counseling,
evaluation, advice, or a product.
If person says they have never heard of DETR or Rehabilitation Division, PROBE: The
Rehabilitation Division provides services for people with disabilities to help enable them to work
and live independently. The Rehabilitation Division's vision is that of a barrier-free future where
every individual in Nevada has equal vocational, employment, and independent living
opportunities.
If person says "no" code 7 otherwise continue.
1 - Yes (skip to Impairment Check)
2 - Set call back
4 - No, I already completed it on the web
7 - Ineligible/Did not receive services from DETR
8 - Severe impairment/OR R unable to complete survey by phone OR WEB
9 - Refused
Hearing Impairment
Interviewer: Read if informant is saying that respondent has a hearing impairment.
[He/She] can fill out the survey online at www.crda.unr.edu/student and enter case ID #[case id].
1 - Continue to memo
Web Information
Okay, you can fill out the brief survey online at www.crda.unr.edu/student and enter case ID #
[case id].
1 - Impairment, gave web address
2 - Not impaired, gave web address (Will call back if it's not completed online in one week)
3 - Severe impairment/OR R unable to complete survey by phone OR WEB
Verify Phone
Let me verify your phone number, is this [primary phone] or [secondary phone]?
1 - Yes
2 - No (skip to Dial Screen)
Answering Machine

Nevada Department of Employment, Training and Rehabilitation
Federal Fiscal Year 2013 Transition Student Satisfaction Survey
35
Hello, my name is [name] from the University of Nevada. I'm calling on behalf of the Nevada
Department of Employment, Training, and Rehabilitation, to gather information about its
services, particularly [respondent]'s experiences with the vocational rehabilitation counselor.
This information is confidential and [his/her] name will not be given to anyone. Please call us
back to complete this brief 10 minute survey at 1-800-929-9079 (for local 784-6412), Monday
through Friday 10am to 9pm, Saturday 10am to 4pm or Sunday 10am to 6pm, and refer to client
#[case id]. Or, you can fill out the brief survey online at www.crda.unr.edu/student, and
reference client ID #[case id]. Thank you for your time, and we look forward to hearing from
you.
1 - Message Left
2 - No Message Left
Impairment Check
Before we begin, do you have any impairment or condition that makes it difficult for you to
complete this interview over the telephone?
1 - Yes (skip to Offer Web Information)
2 - No (continue with interview) (skip to Inf1)
3 - No impairment but don't want to do it over the phone (skip to Web Information)
Interviewer: Before choosing option 1 or 3, say "Well it's actually easier to do the survey over
the phone because I can help you through it. May we do the interview now?" If respondent still
says they would like to do it over the web, choose 3, if they want to continue the interview
choose 2, not 1.
Offer Web Information
If you would prefer, you can complete this interview online. Would you like me to give you the
website address and a user ID so that you can complete the interview this way?
1 - Yes (skip to Web Information)
2 - No, Continue over the phone (skip to Inf1)
8 - Severe impairment/OR R unable to complete survey by phone OR WEB
9 - No, Refused survey
Section 1: Satisfaction with Vocational Rehabilitation Program
The first set of questions asks about your satisfaction level with the Vocational Rehabilitation
Division. For each of the following questions, please rate your level of satisfaction on a scale of
one to five where ONE is very dissatisfied, TWO is somewhat dissatisfied, THREE is neither
dissatisfied nor satisfied, FOUR is somewhat satisfied, and FIVE is very satisfied. The first
question is...
Q1: Overall, how dissatisfied or satisfied are you with the services you received from the
Nevada Department of Employment, Training and Rehabilitation
Federal Fiscal Year 2013 Transition Student Satisfaction Survey
36
Vocational Rehabilitation Division?
1 - Very dissatisfied
2 - Somewhat dissatisfied
3 - Neither dissatisfied nor satisfied
4 - Somewhat satisfied or
5 - Very satisfied
DO NOT READ 8 - Don't Know
9 - Refused
Q2: Overall, how dissatisfied or satisfied were you with the timeliness of the services you
received from the Vocational Rehabilitation Division?
RE-READ ONLY IF NECESSARY 1 - Very dissatisfied
2 - Somewhat dissatisfied
3 - Neither dissatisfied nor satisfied
4 - Somewhat satisfied or
5 - Very satisfied
DO NOT READ 8 - Don't Know
9 - Refused
Section 2: Educational Programs
Q3a: Have you ever enrolled in High School?
READ
1 - Yes
2 - No
DO NOT READ 8. Don’t Know
9. Refused
Q3b: Have you ever enrolled in a GED program?
READ
1 - Yes
2 - No
DO NOT READ 8. Don’t Know
Nevada Department of Employment, Training and Rehabilitation
Federal Fiscal Year 2013 Transition Student Satisfaction Survey
37
9. Refused
Q4a (ask only if Q3a = 1): Which of the following best describes your progress in your High
School program? Do not include GED programs.
READ
1 - Currently attending
2 - Completed the program
3 - Left without completing the program
DO NOT READ
7 - Other
8 - Don't Know
9 - Refused
Q4b (ask only if Q3a = 1 and Q4a = 2): How did you complete High School? Again, do not
include GED programs.
INTERVIEWER NOTE: An adjusted diploma is given to special education students who do
not qualify for a standard diploma. "Aged out" means the student turned 22 and became too old
to attend High School. "Certificate of attendance" means certificate that evidences the
satisfaction of all the requirements for graduation from High School or completion of a program
of adult education except that a pupil has not passed one or more of the High School
proficiency examinations.
READ 1 - Standard, Advanced, or Honors diploma
2 - Adjusted diploma
3 - Aged out
4 - Certificate of attendance
DO NOT READ
8 - Don't Know
9 - Refused
Q4c (ask only if Q3b = 1): Which of the following best describes your progress in your GED
program?
READ
1 - Currently attending
2 - Completed the program
3 - Left without completing the program
DO NOT READ
7 – Other
8 - Don't Know
Nevada Department of Employment, Training and Rehabilitation
Federal Fiscal Year 2013 Transition Student Satisfaction Survey
38
9 - Refused
Section 3: Satisfaction with Educational Programs
Inf2 (read only if either 3a or 3b = 1, yes)
Now, the next set of questions asks about your satisfaction level with the help you received with
the educational programs you indicated you have been previously enrolled in. For each of the
following questions, please rate your level of satisfaction on a scale of one to five where ONE is
very dissatisfied, TWO is somewhat dissatisfied, THREE is neither dissatisfied nor satisfied,
FOUR is somewhat satisfied, and FIVE is very satisfied. The first question is...
Q5a (ask only if Q3a = 1): How dissatisfied or satisfied were you with the help Vocational
Rehabilitation Staff gave you with job or career planning while in your High School program?
Again, do not include GED programs.
RE-READ ON IF NECESSARY
1 - Very dissatisfied
2 - Somewhat dissatisfied
3 - Neither dissatisfied nor satisfied
4 - Somewhat satisfied
5 - Very satisfied
DO NOT READ
8 - Don't Know
9 - Refused
Q5b (ask only if Q3b = 1): How dissatisfied or satisfied were you with the help Vocational
Rehabilitation Staff gave you with job or career planning while in your GED program? Would
you say you were ONE very dissatisfied, TWO somewhat dissatisfied, THREE neither
dissatisfied nor satisfied, FOUR somewhat satisfied, or FIVE very satisfied?
RE-READ ON IF NECESSARY
1 - Very dissatisfied
2 - Somewhat dissatisfied
3 - Neither dissatisfied nor satisfied
4 - Somewhat satisfied
5 - Very satisfied
DO NOT READ
8 - Don't Know
9 - Refused

Nevada Department of Employment, Training and Rehabilitation
Federal Fiscal Year 2013 Transition Student Satisfaction Survey
39
Section 4: Educational Programs
For the next set of questions, I'm going to read you a list of educational programs.
Q6a: Please indicate with a simple "yes" or "no" whether you were EVER OFFERED an
opportunity by the Vocational Rehabilitation Staff to participate in any of the following
programs?
a. Technical or trade school, such as electrician, construction, dog grooming, or cosmetology.
b. On-the-job training
c. Two-year college degree
d. Four-year college degree
e. Job Corps (PRONOUNCE “core”)
1 -Yes
2 - No
8 - Don’t Know
9 - Refused
Q6b: Did you participate in ___(name of program)___?
a. Technical or trade school, such as electrician, construction, dog grooming, or cosmetology.
b. On-the-job training
c. Two-year college degree
d. Four-year college degree
e. Job Corps (PRONOUNCE “core”)
1 -Yes
2 - No
8 - Don’t Know
9 - Refused
Q6ca (ask only if Q6ba = 1): How satisfied or dissatisfied were you with the help Vocational
Rehabilitation Staff gave you with the technical or trade school program?
RE-READ ONLY IF NECESSARY
1 - Very dissatisfied
2 - Somewhat dissatisfied
3 - Neither dissatisfied nor satisfied
4 - Somewhat satisfied or
5 - Very satisfied
DO NOT READ
8 - Don't Know
Nevada Department of Employment, Training and Rehabilitation
Federal Fiscal Year 2013 Transition Student Satisfaction Survey
40
9 - Refused
Q6cb (ask only if Q6bb = 1): How satisfied or dissatisfied were you with the help Vocational
Rehabilitation Staff gave you with the on-the-job training program?
RE-READ ONLY IF NECESSARY
1 - Very dissatisfied
2 - Somewhat dissatisfied
3 - Neither dissatisfied nor satisfied
4 - Somewhat satisfied or
5 - Very satisfied
DO NOT READ
8 - Don't Know
9 - Refused
Q6cc (ask only if Q6bc = 1): How satisfied or dissatisfied were you with the help Vocational
Rehabilitation Staff gave you with the two-year college degree program?
RE-READ ONLY IF NECESSARY
1 - Very dissatisfied
2 - Somewhat dissatisfied
3 - Neither dissatisfied nor satisfied
4 - Somewhat satisfied or
5 - Very satisfied
DO NOT READ
8 - Don't Know
9 - Refused
Q6cd (ask only if Q6bd = 1): How satisfied or dissatisfied were you with the help Vocational
Rehabilitation Staff gave you with the four-year college degree program?
RE-READ ONLY IF NECESSARY
1 - Very dissatisfied
2 - Somewhat dissatisfied
3 - Neither dissatisfied nor satisfied
4 - Somewhat satisfied or
5 - Very satisfied
DO NOT READ
8 - Don't Know
9 - Refused
Nevada Department of Employment, Training and Rehabilitation
Federal Fiscal Year 2013 Transition Student Satisfaction Survey
41
Q6ce (ask only if Q6be = 1): How satisfied or dissatisfied were you with the help Vocational
Rehabilitation Staff gave you with the Job Corps program? Interviewer note: Pronounced
"CORE"
RE-READ ONLY IF NECESSARY
1 - Very dissatisfied
2 - Somewhat dissatisfied
3 - Neither dissatisfied nor satisfied
4 - Somewhat satisfied or
5 - Very satisfied
DO NOT READ
8 - Don't Know
9 - Refused
Section 5: Employment History
The next set of questions asks about your employment history.
Q7 (ask only if Q3a = 1 and Q4a = 2 or 3): How many jobs have you had since you left High
School? Specify number 0-87.
88 - Don't Know
99 - Refused
Q8: Are you currently employed?
1 - Yes
2 - No (skip to Q21)
DO NOT READ 8 - Don't Know (skip to Q23)
9 - Refused (skip to Q23)
Q9: Did you get your current job as a result of the services you received from the Vocational
Rehabilitation Program?
1 - Yes (skip to Q15)
2 - No (skip to Q10)
DO NOT READ 8 - Don't Know (skip to Q10)
9 - Refused (skip to Q10)
Nevada Department of Employment, Training and Rehabilitation
Federal Fiscal Year 2013 Transition Student Satisfaction Survey
42
Q10: Did you get ANY job as a result of the services you received from the Vocational
Rehabilitation Program?
1 - Yes (skip to Q11)
2 – No (skip to Q15)
DO NOT READ 8 - Don't Know (skip to Q15)
9 - Refused (skip to Q15)
Q11: When your case was closed, were you in a job that the Vocational Rehabilitation Program
helped place you in?
1 – Yes (skip to Q12)
2 - No (skip to Q15)
DO NOT READ
8 - Don't Know (skip to Q15)
9 - Refused (skip to Q15)
Q12: Are you currently employed in that same job?
1 - Yes (skip to Q15)
2 - No (skip to Q13)
DO NOT READ
8 - Don't Know (skip to Q15)
9 - Refused (skip to Q15)
Q13: Are you currently employed in the same career field as the job you were in when your case
was closed?
1 – Yes (skip to Q14)
2 - No (skip to Q15)
DO NOT READ
8 - Don't Know (skip to Q15)
9 - Refused (skip to Q15)
Nevada Department of Employment, Training and Rehabilitation
Federal Fiscal Year 2013 Transition Student Satisfaction Survey
43
Q14: Compared to the job you had when your case was closed, does your current job provide
you with either equal or better pay OR equal or better benefits?
IF THEY ANSWER “EQUAL or BETTER PAY OR EQUAL OR BETTER BENEFITS,”
PROBE: We are looking for a “yes” or “no” answer.
1 - Yes (skip to Q15)
2 - No (skip to Q15)
DO NOT READ
8 - Don't Know (skip to Q15)
9 - Refused (skip to Q15)
Q15: In what kind of job are you employed? I am going to read you a list of occupations. Please
allow me to read the entire list before answering. ONE is Agricultural, Forestry, Fishing and
Related, TWO is Clerical and Administrative Support, THREE is Managerial and
Administrative, FOUR is Production, Construction, Operating, Maintenance and Material
Handling, FIVE is Professional, Paraprofessional and Technical, SIX is Sales and Related
Occupations, for example cashiers and stock takers, SEVEN is Service Occupations, for example
food service and attendants, and EIGHT is Other.
INTERVIEWER NOTE: See study materials for list of sales and service occupations.
1 - Agricultural, Forestry, Fishing and Related
2 - Clerical and Administrative Support
3 - Managerial and Administrative
4 - Production, Construction, Operating, Maintenance and Material Handling
5 - Professional, Paraprofessional and Technical
6 - Sales and Related Occupations, for example cashiers and stock takers
7 - Service Occupations, for example food service and attendants
8 - Other (specify)
DO NOT READ
88 - Don't Know
99 - Refused
SPECIFY: [__________________________________________________](50 characters)
Q16: How dissatisfied or satisfied are you with your current job? Would you say you are ONE
very dissatisfied, TWO somewhat dissatisfied, THREE neither dissatisfied nor satisfied, FOUR
somewhat satisfied, or FIVE very satisfied?
Re-read only if necessary
1 - Very dissatisfied
2 - Somewhat dissatisfied
Nevada Department of Employment, Training and Rehabilitation
Federal Fiscal Year 2013 Transition Student Satisfaction Survey
44
3 - Neither dissatisfied nor satisfied
4 - Somewhat satisfied
5 - Very satisfied
DO NOT READ
8 - Don't Know
9 - Refused
Q17: How long have you had your current job? Specify 0 - 87
Interviewer: First enter the duration and then the units
Duration
Units
1 - days
2 - weeks
3 - months
4 - years
DO NOT READ
88 - Don't Know
99 - Refused
Q18: How many hours do you normally work each week? Specify 0 - 160 hours
DO NOT READ
888 - Don't know
999 - Refused
Q19: How much money are you normally paid per hour? Specify 0.00 - 87.99. NOTE: If they
make more than $87.99 enter $87.99 and make a note here.
Dollars
Cents
DO NOT READ
88 - Don't know
99 - Refused
Q20: Which, if any, of the following benefits do you receive as part of your current
employment? Please respond with a simple "yes" or "no."
a. Paid federal or state holidays
b. Paid vacations
c. Health insurance
Nevada Department of Employment, Training and Rehabilitation
Federal Fiscal Year 2013 Transition Student Satisfaction Survey
45
d. Paid sick leave
e. Retirement plan
f. Meals
g. Daycare
h. Clothes/Uniform allowance
i. Other (specify)
1 – Yes
2 – No
DO NOT READ
8 - Don't Know
9 - Refused
INTERVIEWER NOTE: FOR OTHER, ASK "Are there any other benefits that you receive
from your current job that I didn't mention?"
SPECIFY: [__________________________________________________](50 characters)
INTERVIEWER NOTE: FOR OTHER, ASK "Are there any other benefits that you receive
from your current job that I didn't mention?"
SPECIFY: [__________________________________________________](50 characters)
Q21: What is the MAIN REASON you are not currently employed? Please allow me to read the
entire list before answering and choose ONLY ONE response.
READ
1 - Attending school
2 - Volunteering
3 - Employer could not accommodate my disability
4 - Fired or laid off from previous job
5 - Could not find any job
6 - Could not find the kind of job I wanted
7 - Could not find a job I was qualified for
8 - Lack of transportation
9 - Could not work because of family commitments
10 - Could not work because of other commitments
11 - Did not want to lose health insurance from another source
12 - Changed my mind about the value of working
DO NOT READ
77 - Other (specify)
78 – Disability
79 - Other medical reason (not disability-related)
88 - Don't Know
Nevada Department of Employment, Training and Rehabilitation
Federal Fiscal Year 2013 Transition Student Satisfaction Survey
46
99 - Refused
INTERVIEWER NOTE: Read 78 and 79 ONLY if respondent mentions their disability as a
reason for not working; but be sure to read BOTH 78 and 79, PROBE: "So would the MAIN
reason you are not currently employed be because of your disability or some other medical
reason not disability related?"
THIS SPACE IS ONLY FOR CODE 77, “OTHER” SPECIFY:
SPECIFY: [__________________________________________________](50 characters)
Q22 (ask only if Q20c = 2): Do you receive health insurance coverage from ANY source?
1 - Yes
2 - No
DO NOT READ
8 - Don't Know
9 - Refused
Section 6: Vocational Rehabilitation Services
The next set of questions asks about the State of Nevada's Vocational Rehabilitation services.
Q23: Have you EVER received any of the following services from the Vocational Rehabilitation
program? Please respond with a simple "yes" or "no."
a. Job placement
b. Job coaching
c. Other support from vocational rehabilitation employees other than your counselor
1 – Yes
2 – No
DO NOT READ
8 – Don’t Know
9 - Refused
Interviewer note: Read only if they are not sure what you are referring to in item C above, "For
example, clerical staff or a technician." See below also.
DEFINITIONS FOR INTERVIEWER (Read only if requested) "Job Placement" means being
placed, in an integrated work environment with disabled and non-disabled employees for at least
Nevada Department of Employment, Training and Rehabilitation
Federal Fiscal Year 2013 Transition Student Satisfaction Survey
47
minimum wage. Job placement services include things like being referred to a job developer,
being referred to another agency, or receiving services like help preparing a resume or
developing interviewing skills.
A "Job Coach" is someone who works with you to provide support such as verbal reinforcement,
reminders, or additional training. The Job coach might work through difficulties that arise at your
place of employment either initially or after the participant has been employed for a period of
time.
Services from other vocational rehabilitation employees other than your counselor include things
like scheduling appointments, help with transportation needs, and assistance filling out
applications.
Q24 (ask only if Q23a = 1): How dissatisfied or satisfied were you with the job placement
services you received from the Vocational Rehabilitation program? Job placement services
include services such as interest and skill testing. Would you say you were ONE very
dissatisfied, TWO somewhat dissatisfied, THREE neither dissatisfied nor satisfied, FOUR
somewhat satisfied, or FIVE very satisfied?
1 - Very dissatisfied
2 - Somewhat dissatisfied
3 - Neither dissatisfied nor satisfied
4 - Somewhat satisfied
5 - Very satisfied
8 - Don't Know
9 - Refused
Q25 (ask only if Q23b = 1): How dissatisfied or satisfied were you with the job coaching
services you received from the Vocational Rehabilitation program? Would you say you were
ONE very dissatisfied, TWO somewhat dissatisfied, THREE neither dissatisfied nor satisfied,
FOUR somewhat satisfied, or FIVE very satisfied?
1 - Very dissatisfied
2 - Somewhat dissatisfied
3 - Neither dissatisfied nor satisfied
4 - Somewhat satisfied
5 - Very satisfied
DO NOT READ
8 - Don't Know
9 – Refused
Q26 (ask only if Q23c = 1): How dissatisfied or satisfied were you with the other vocational
rehabilitation services you received from employees other than your counselor in the Vocational
Rehabilitation program? Would you say you were ONE very dissatisfied, TWO somewhat
Nevada Department of Employment, Training and Rehabilitation
Federal Fiscal Year 2013 Transition Student Satisfaction Survey
48
dissatisfied, THREE neither dissatisfied nor satisfied, FOUR somewhat satisfied, or FIVE very
satisfied?
Re-read only if necessary
1 - Very dissatisfied
2 - Somewhat dissatisfied
3 - Neither dissatisfied nor satisfied
4 - Somewhat satisfied
5 - Very satisfied
DO NOT READ
8 - Don't Know
9 - Refused
Q27: Assistive technology services include things like providing or purchasing devices to help
with vision, hearing, communication, or changes to your home or workplace. I'm going to read
you a list of various TYPES of assistive technology devices you may have received. Please
indicate with a simple "yes" or "no" whether or not you have received the following DEVICES:
a. Devices to help with your hearing, for example, hearing aids, alert signal systems,
telephone amplifiers or decoders.
b. Devices to help with your vision, for example, glasses, specialized magnifiers, screen
readers, talking equipment, or Braille equipment.
c. Devices to help with getting around, for example, transportation, canes or wheelchairs,
orthotics or prosthetics.
d. Devices to help make your home or workplace more accessible, for example, specialized
office equipment, foot stools, or book or copy holders.
e. Devices to help with your communication, for example, hand-held digital recorders or an
AAC box or iPhone.
f. Devices to help with something else that was not already mentioned above
1 – Yes
2 – No
DO NOT READ
8 – Don’t Know
9 – Refused
INTERVIEWER NOTE: FOR OTHER, ASK "And what was the assistive technology
DEVICE you received?"
SPECIFY: [__________________________________________________](50 characters)
PROBE: IF PERSON SAYS THEY RECEIVED COMPUTER SOFTWARE OR
HARDWARE, PLEASE ASK: “For which of the following categories did you receive the
Nevada Department of Employment, Training and Rehabilitation
Federal Fiscal Year 2013 Transition Student Satisfaction Survey
49
computer software or hardware: hearing, vision, getting around, changes to your home or
workplace, communication, or something else?” IF IT FALLS UNDER ONE OF THE ABOVE
CATEGORIES: a) hearing; b) vision; c) getting around d) home or workplace e) communication,
DO NOT CODE AS “OTHER”
Q28: Overall, how would you rate the quality of those assistive technology DEVICES you
received? Would you say they were poor, fair, good, or excellent?
RE-READ ONLY IF NECESSARY
1 – Poor
2 – Fair
3 - Good or
4 – Excellent
DO NOT READ
8 - Don't Know
9 - Refused
IF PERSON SAYS SOMETHING ABOUT THE SERVICE OR THE PROVIDER, BUT
NOT THE DEVICE, PROBE: “For this question, we are asking you to rate the device itself,
not the person who provided the device to you or explained how to use the device.”
Q29: Who first told you about the transition student services available to you from the Nevada
Department of Employment Training and Rehabilitation?
READ
1 – Parent
2 – Friend
3 - Teacher
4 - School counselor
5 - Found out about them by myself, or
6 - Someone else (specify)
DO NOT READ
8 - Don't Know
9 - Refused
SPECIFY: [__________________________________________________](50 characters)
Section 5: Needed Improvements and Positive Aspects
Q30: Based on your experiences with the transition services you have received, how unlikely or
likely is it that you would recommend these services to other students who might need them?
Would you say ONE very unlikely, TWO somewhat unlikely, THREE neither unlikely nor
likely, FOUR somewhat likely or FIVE very likely:
Nevada Department of Employment, Training and Rehabilitation
Federal Fiscal Year 2013 Transition Student Satisfaction Survey
50
1 - very unlikely
2 - somewhat unlikely
3 - neither unlikely nor likely
4 - somewhat likely
5 - very likely
DO NOT READ
8 - Don't Know
9 - Refused
Q31: Based on your experiences with the student transition program, are there any specific
CHANGES that you think could be made in order to IMPROVE the program?
1 - To answer (specify)
2 - No comments
Q32: Based on your experiences with the student transition program, are there any specific
POSITIVE aspects that should be continued or expanded in the future?
1 - To answer (specify)
2 - No comments
Q33: Which Vocational Rehabilitation location did you receive all OR a majority of your
services from?
NOTE: You may only select one, if you received services from multiple locations, please select
the location you received the majority of your services from.
1 - Carson City (1370 South Curry Street)
2 - Carson City (1933 North Carson Street)
3 - Elko (172 6th Street)
4 - Ely (1500 Ave F #1)
5 - Fallon (121 Industrial Way)
6 - Henderson (119 Water Street)
7 - Las Vegas (3016 West Charleston Boulevard - Suite 200; “West Bay”)
8 - Las Vegas (6161 West Charleston Boulevard; “Mental Health Campus”)
9 - Las Vegas (3405 South Maryland Parkway)
10 - North Las Vegas (2827 Las Vegas Boulevard North; “North Town”)
11 - Reno (1325 Corporate Boulevard; “Corporate Office”)
12 - Reno (4001 South Virginia Street; “Old Town Mall”)
13 - Sparks (1675 East Prater Way)
14 - Winnemucca (475 West Haskell, #2)
15 - Other [please enter here]
Q34: How did you first find out about the Vocational Rehabilitation Program services available
Nevada Department of Employment, Training and Rehabilitation
Federal Fiscal Year 2013 Transition Student Satisfaction Survey
51
to you from the Nevada Department of Employment Training and Rehabilitation?
READ ONLY IF NECESSARY:
01 - Television
02 - Radio
03 - Internet
04 - Newspaper
05 - Brochure
06 - Billboard
07 - Friend
08- Relative or
09- Other community resource (For example, school counselor, Job Connect, disability resource
center) (specify)
DO NOT READ
88 - Don't Know
99 - Refused
SPECIFY: [__________________________________________________](50 characters)
Q35: Was Vocational Rehabilitation Program information given to you in your preferred format,
such as large font, Braille, or electronically?
1 - Yes
2 - No (skip to Q35a)
8 - Don't Know
9 - Refused
IF NO TO Q35: Q35a
What format would you have preferred?
Read
1 – Large font
2 – Braille
3 – Electronically
4 – Alternative Language (specify)
5 – Other (specify)
DO NOT READ
8 - Don't Know
9 - Refused
Nevada Department of Employment, Training and Rehabilitation
Federal Fiscal Year 2013 Transition Student Satisfaction Survey
52
IF 4 to Q35a: Can you please specify what other language you would have preferred? [__________________________________________________](50 characters)
IF 5 to Q35a: Can you please specify what other format you would have preferred?
[__________________________________________________](50 characters)
Q36
How frequently did you receive any natural support (for example, help from a friend, relative,
neighbor, co-worker, etc.) while you were in the Vocational Rehabilitation Program?
Read
1 – Never
2 – Seldom
3 – Sometimes
4 – Often
DO NOT READ
8 - Don't Know
9 - Refused
Closing Statement
Those are all the questions I have. I'd like to thank you on behalf of the Department of
Employment, Training, and Rehabilitation for answering these questions. Thanks again.
Goodbye.
IWER: READ ONLY IF RESPONDENT HAS FURTHER QUESTIONS.
If you have any questions about this survey, you may call my supervisor toll-free at 1-800-929-
9079 or 1-775-784-6421.
1 - To continue
Nevada Department of Employment, Training and Rehabilitation
Federal Fiscal Year 2013 Transition Student Satisfaction Survey
53
Appendix C:
Cover Letter Invitations
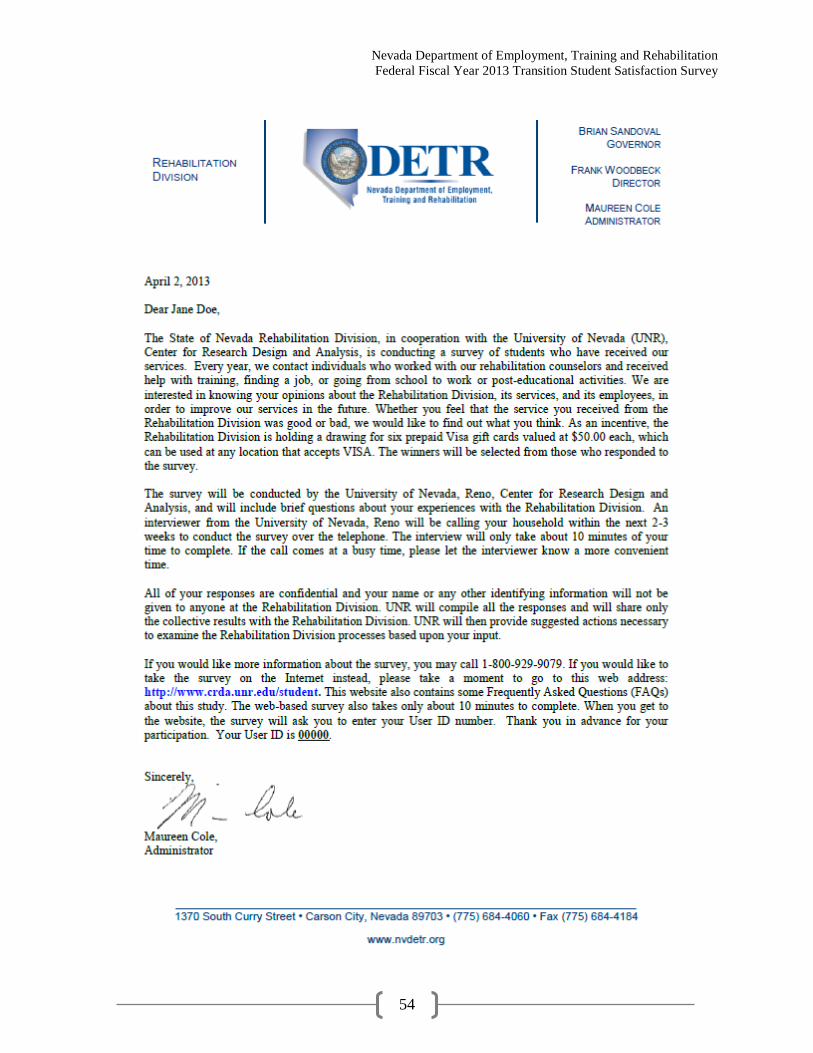
Nevada Department of Employment, Training and Rehabilitation
Federal Fiscal Year 2013 Transition Student Satisfaction Survey
54
Nevada Department of Employment, Training and Rehabilitation
Federal Fiscal Year 2013 Transition Student Satisfaction Survey
55
Appendix D:
Website Information about
Study
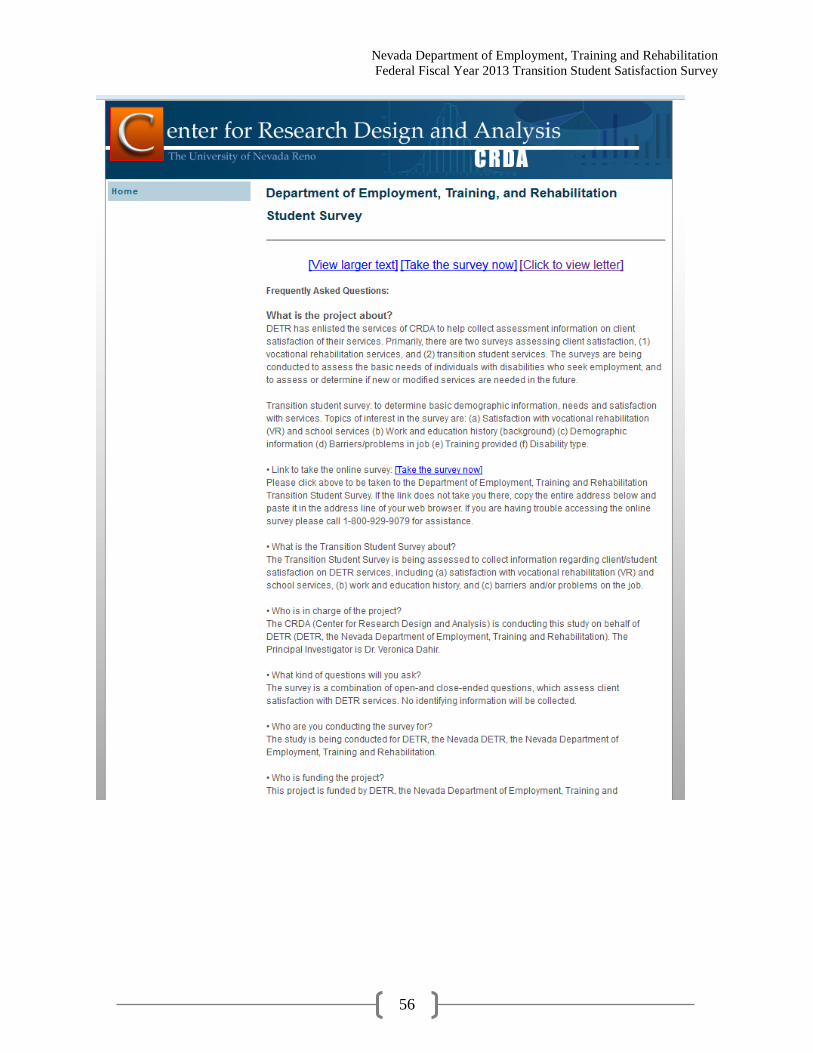
Nevada Department of Employment, Training and Rehabilitation
Federal Fiscal Year 2013 Transition Student Satisfaction Survey
56

Nevada Department of Employment, Training and Rehabilitation
Federal Fiscal Year 2013 Transition Student Satisfaction Survey
57

Nevada Department of Employment, Training and Rehabilitation
Federal Fiscal Year 2013 Transition Student Satisfaction Survey
58

Nevada Department of Employment, Training and Rehabilitation
Federal Fiscal Year 2013 Transition Student Satisfaction Survey
59
Nevada Department of Employment, Training and Rehabilitation
Federal Fiscal Year 2013 Transition Student Satisfaction Survey
60
Appendix E:
Listing of Nevada Areas
Called for General Student
Survey
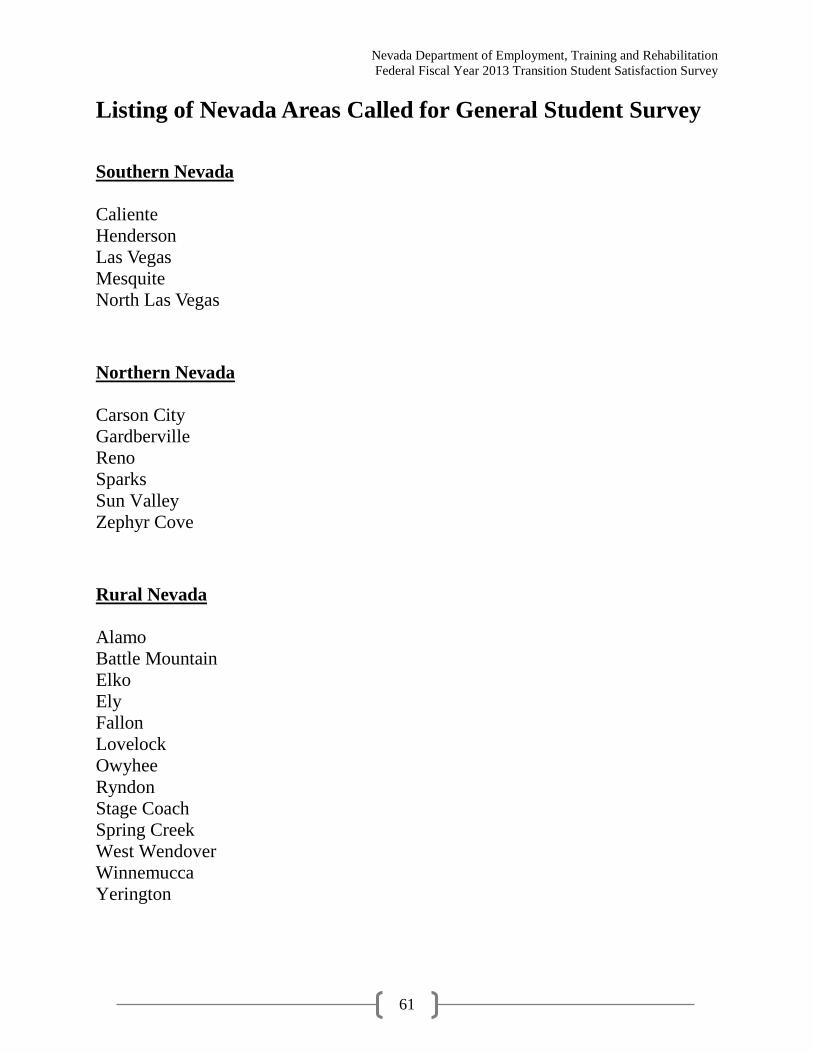
Nevada Department of Employment, Training and Rehabilitation
Federal Fiscal Year 2013 Transition Student Satisfaction Survey
61
Listing of Nevada Areas Called for General Student Survey
Southern Nevada
Caliente
Henderson
Las Vegas
Mesquite
North Las Vegas
Northern Nevada
Carson City
Gardberville
Reno
Sparks
Sun Valley
Zephyr Cove
Rural Nevada
Alamo
Battle Mountain
Elko
Ely
Fallon
Lovelock
Owyhee
Ryndon
Stage Coach
Spring Creek
West Wendover
Winnemucca
Yerington

Nevada Department of Employment, Training and Rehabilitation
Federal Fiscal Year 2013 Transition Student Satisfaction Survey
62
Appendix F:
Data Tables
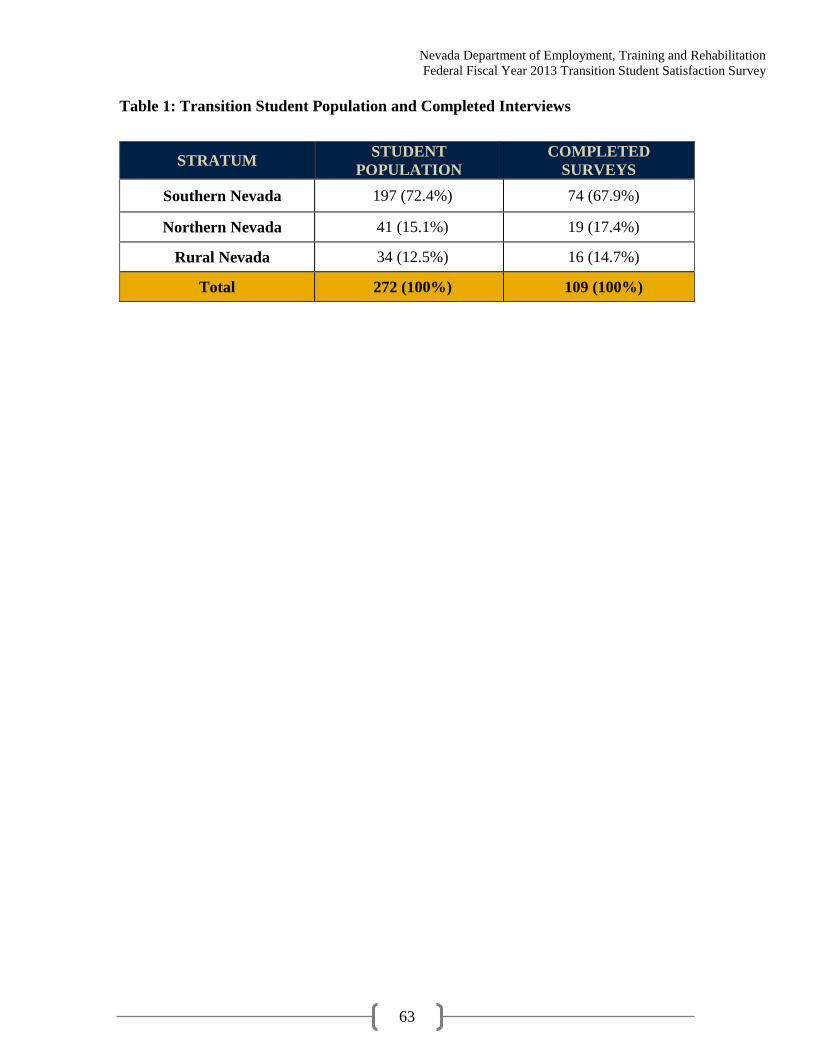
Nevada Department of Employment, Training and Rehabilitation
Federal Fiscal Year 2013 Transition Student Satisfaction Survey
63
Table 1: Transition Student Population and Completed Interviews
STRATUM STUDENT
POPULATION
COMPLETED
SURVEYS
Southern Nevada 197 (72.4%) 74 (67.9%)
Northern Nevada 41 (15.1%) 19 (17.4%)
Rural Nevada 34 (12.5%) 16 (14.7%)
Total 272 (100%) 109 (100%)
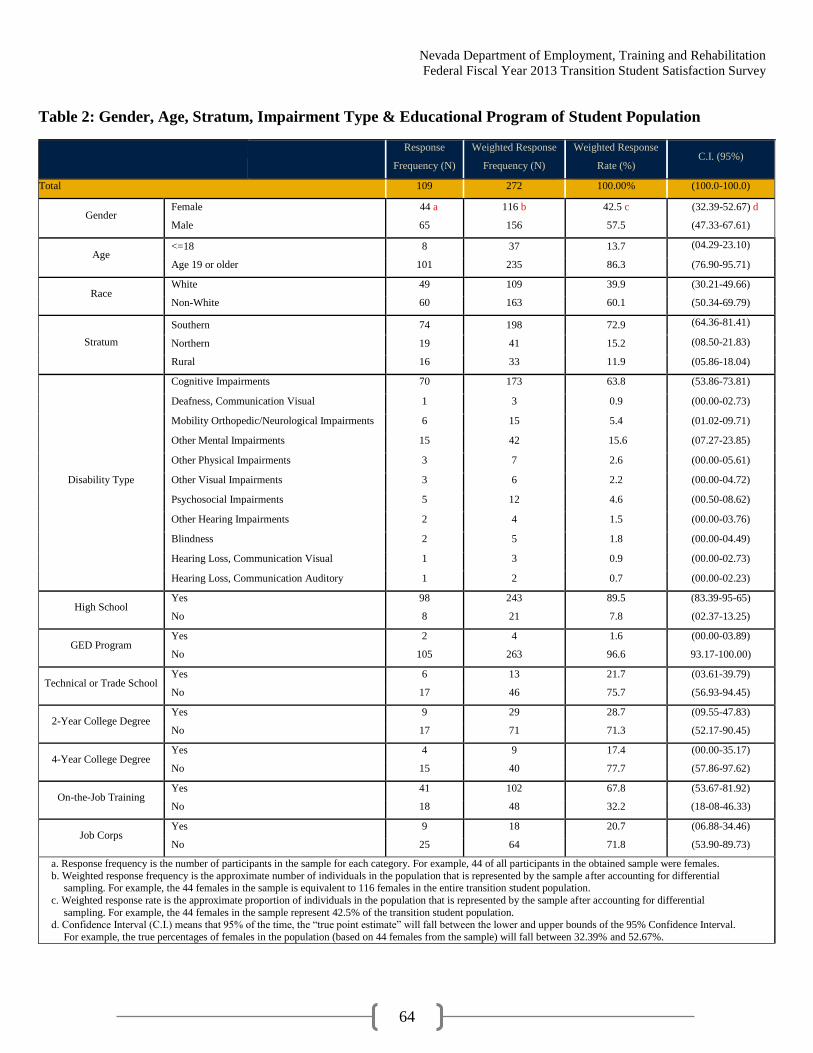
Nevada Department of Employment, Training and Rehabilitation
Federal Fiscal Year 2013 Transition Student Satisfaction Survey
64
Table 2: Gender, Age, Stratum, Impairment Type & Educational Program of Student Population
Response
Frequency (N)
Weighted Response
Frequency (N)
Weighted Response
Rate (%) C.I. (95%)
Total 109 272 100.00% (100.0-100.0)
Gender Female
Male
44 a
65
116 b
156
42.5 c
57.5
(32.39-52.67) d
(47.33-67.61)
Age <=18
Age 19 or older
8
101
37
235
13.7
86.3
(04.29-23.10)
(76.90-95.71)
Race White
Non-White
49 109 39.9 (30.21-49.66)
60 163 60.1 (50.34-69.79)
Stratum
Southern
Northern
Rural
74
19
16
198
41
33
72.9
15.2
11.9
(64.36-81.41)
(08.50-21.83)
(05.86-18.04)
Disability Type
Cognitive Impairments 70 173 63.8 (53.86-73.81)
Deafness, Communication Visual 1 3 0.9 (00.00-02.73)
Mobility Orthopedic/Neurological Impairments 6 15 5.4 (01.02-09.71)
Other Mental Impairments 15 42 15.6 (07.27-23.85)
Other Physical Impairments 3 7 2.6 (00.00-05.61)
Other Visual Impairments 3 6 2.2 (00.00-04.72)
Psychosocial Impairments 5 12 4.6 (00.50-08.62)
Other Hearing Impairments 2 4 1.5 (00.00-03.76)
Blindness 2 5 1.8 (00.00-04.49)
Hearing Loss, Communication Visual 1 3 0.9 (00.00-02.73)
Hearing Loss, Communication Auditory 1 2 0.7 (00.00-02.23)
High School Yes 98 243 89.5 (83.39-95-65)
No 8 21 7.8 (02.37-13.25)
GED Program Yes 2 4 1.6 (00.00-03.89)
No 105 263 96.6 93.17-100.00)
Technical or Trade School Yes 6 13 21.7 (03.61-39.79)
No 17 46 75.7 (56.93-94.45)
2-Year College Degree Yes 9 29 28.7 (09.55-47.83)
No 17 71 71.3 (52.17-90.45)
4-Year College Degree Yes 4 9 17.4 (00.00-35.17)
No 15 40 77.7 (57.86-97.62)
On-the-Job Training Yes 41 102 67.8 (53.67-81.92)
No 18 48 32.2 (18-08-46.33)
Job Corps Yes 9 18 20.7 (06.88-34.46)
No 25 64 71.8 (53.90-89.73)
a. Response frequency is the number of participants in the sample for each category. For example, 44 of all participants in the obtained sample were females.
b. Weighted response frequency is the approximate number of individuals in the population that is represented by the sample after accounting for differential sampling. For example, the 44 females in the sample is equivalent to 116 females in the entire transition student population.
c. Weighted response rate is the approximate proportion of individuals in the population that is represented by the sample after accounting for differential
sampling. For example, the 44 females in the sample represent 42.5% of the transition student population. d. Confidence Interval (C.I.) means that 95% of the time, the “true point estimate” will fall between the lower and upper bounds of the 95% Confidence Interval.
For example, the true percentages of females in the population (based on 44 females from the sample) will fall between 32.39% and 52.67%.

Nevada Department of Employment, Training and Rehabilitation
Federal Fiscal Year 2013 Transition Student Satisfaction Survey
65
Table 3: Stratum, Gender, and Age Distribution for Transition Student Population, Weighted
Sample, and Unweighted Sample
Population (1) Weighted Sample (2) Un-Weighted Sample (3)
Stratum Gender Age Frequency N Percent % Weighted
Frequency N
Weighted
Percent %
Response
Frequency
N
Response
Percent %
Southern Female <=18 14 5.15% 14 5.15% 2 1.83%
Southern Female Age 19 or older 51 18.75% 51 18.75% 26 23.85%
Southern Male <=18 15 5.51% 15 5.51% 6 5.50%
Southern Male Age 19 or older 117 43.01% 117 43.01% 40 36.70%
Southern Subtotal (4) 197 72.43% 197 72.43% 74 67.89
Northern Female <=18 0 0.00% 0 0.00% 0 0.00%
Northern Female Age 19 or older 16 5.88% 16 5.88% 7 6.42%
Northern Male <=18 0 0.00% 0 0.00% 0 0.00%
Northern Male Age 19 or older 25 9.19% 25 9.19% 12 11.01%
Northern Subtotal (4) 41 15.07% 41 15.07% 19 17.43
Rural Female <=18 1 0.37% 1 0.37% 0 0.00%
Rural Female Age 19 or older 17 6.25% 17 6.25% 9 8.26%
Rural Male <=18 0 0.00% 0 0.00% 0 0.00%
Rural Male Age 19 or older 16 5.88% 16 5.88% 7 6.42%
Rural Subtotal (4) 34 12.50% 34 12.50% 16 14.68
Total (5) 272 100.0% 272 100.0% 109 100.0%
1. Transition student population distribution of the State of Nevada Vocational Rehabilitation services.
2. Transition student distribution of the State of Nevada Vocational Rehabilitation services’ sample after weighting for strata, sex, & age.
3. Transition student distribution of the State of Nevada Vocational Rehabilitation services’ sample without post stratification weighting.
4. Frequency, and percentage of each stratum, in the transition student population and sample (weighted and un-weighted).
5. Total subjects in the population and sample (weighted and un-weighted).

Nevada Department of Employment, Training and Rehabilitation
Federal Fiscal Year 2013 Transition Student Satisfaction Survey
66
Q1. Overall, how satisfied or dissatisfied were you with the services you received from the
Vocational Rehabilitation Division?
Very Dissatisfied Somewhat Dissatisfied Neither Satisfied Nor
Dissatisfied Somewhat Satisfied Very Satisfied Total
N % C.I.(95%) N % C.I.(95%) N % C.I.(95%) N % C.I.(95%) N % C.I.(95%) N % C.I.(95%)
Overall Total Total 7 6.4% (1.7-11.1) 5 3.8% (0.4-7.2) 20 17.3% (9.9-24.7) 30 29.7% (19.9-39.4) 47 42.9% (32.6-53.1) 109 100.0% (_-_)
Gender
Female 3 6.5% (0.0-13.8) 3 5.1% (0.0-11.0) 7 15.7% (4.4-26.9) 15 35.6% (20.7-50.6) 16 37.1% (22.1-52.1) 44 42.5% (32.4-52.7)
Male 4 6.3% (0.2-12.4) 2 2.8% (0.0-6.8) 13 18.5% (8.7-28.4) 15 25.2% (12.4-38.1) 31 47.1% (33.3-60.9) 65 57.5% (47.3-67.6)
Total 7 6.4% (1.7-11.1) 5 3.8% (0.4-7.2) 20 17.3% (9.9-24.7) 30 29.7% (19.9-39.4) 47 42.9% (32.6-53.1) 109 100.0% (_-_)
Age
<=18 1 6.4% (0.0-19.3) 0 . (.-.) 1 6.4% (0.0-19.3) 2 35.9% (0.0-74.4) 4 51.3% (12.9-89.7) 8 13.7% (4.3-23.1)
Age 19 or older 6 6.4% (1.3-11.4) 5 4.4% (0.5-8.3) 19 19.0% (10.9-27.2) 28 28.7% (19.3-38.1) 43 41.5% (31.4-51.6) 101 86.3% (76.9-95.7)
Total 7 6.4% (1.7-11.1) 5 3.8% (0.4-7.2) 20 17.3% (9.9-24.7) 30 29.7% (19.9-39.4) 47 42.9% (32.6-53.1) 109 100.0% (_-_)
Race
White 6 12.9% (3.1-22.8) 4 7.9% (0.2-15.5) 10 19.9% (8.5-31.4) 11 22.5% (10.5-34.5) 18 36.7% (22.8-50.7) 49 39.9% (30.2-49.7)
Non White 1 2.0% (0.0-5.9) 1 1.1% (0.0-3.2) 10 15.6% (5.9-25.2) 19 34.4% (20.6-48.3) 29 47.0% (32.7-61.2) 60 60.1% (50.3-69.8)
Total 7 6.4% (1.7-11.1) 5 3.8% (0.4-7.2) 20 17.3% (9.9-24.7) 30 29.7% (19.9-39.4) 47 42.9% (32.6-53.1) 109 100.0% (_-_)
Region
South NV 6 7.7% (1.6-13.8) 2 2.0% (0.0-4.8) 14 17.1% (8.4-25.9) 21 31.8% (19.7-43.9) 31 41.4% (29.0-53.8) 74 72.9% (64.4-81.4)
North NV 1 4.9% (0.0-14.5) 2 11.3% (0.0-26.3) 1 6.4% (0.0-18.6) 7 34.9% (13.0-56.9) 8 42.5% (19.4-65.5) 19 15.2% (8.5-21.8)
Rural NV 0 . (.-.) 1 5.3% (0.0-15.6) 5 32.4% (7.1-57.7) 2 10.1% (0.0-23.8) 8 52.2% (25.6-78.9) 16 12.0% (5.9-18.0)
Total 7 6.4% (1.7-11.1) 5 3.8% (0.4-7.2) 20 17.3% (9.9-24.7) 30 29.7% (19.9-39.4) 47 42.9% (32.6-53.1) 109 100.0% (_-_)
Participated in on-the-job training
Yes 3 7.8% (0.0-16.6) 1 1.7% (0.0-5.1) 4 9.7% (0.1-19.4) 9 22.2% (7.0-37.4) 24 58.6% (41.5-75.7) 41 67.8% (53.7-81.9)
No 1 4.2% (0.0-12.6) 1 3.5% (0.0-10.7) 6 28.6% (6.1-51.2) 3 25.0% (0.0-51.6) 7 38.6% (11.8-65.5) 18 32.2% (18.1-46.3)
Total 4 6.6% (0.0-13.2) 2 2.3% (0.0-5.6) 10 15.8% (6.0-25.7) 12 23.1% (9.7-36.5) 31 52.2% (37.5-66.8) 59 100.0% (_-_)
Participated in Job Corps
Yes 0 . (.-.) 1 9.4% (0.0-28.1) 1 9.4% (0.0-28.1) 2 25.3% (0.0-56.9) 5 55.9% (21.2-90.7) 9 22.4% (7.7-37.0)
No 1 3.9% (0.0-11.8) 2 5.9% (0.0-14.4) 4 11.7% (0.0-23.7) 5 16.1% (1.6-30.6) 13 62.4% (41.6-83.3) 25 77.6% (63.0-92.3)
Total 1 3.0% (0.0-9.2) 3 6.6% (0.0-14.5) 5 11.2% (0.9-21.4) 7 18.2% (4.7-31.7) 18 61.0% (42.8-79.2) 34 100.0% (_-_)
Currently Employed
Yes 3 5.1% (0.0-11.0) 2 2.5% (0.0-6.1) 10 15.4% (5.9-24.8) 18 28.2% (16.3-40.1) 30 48.8% (35.2-62.3) 63 57.3% (47.0-67.6)
No 4 8.2% (0.3-16.1) 3 5.5% (0.0-11.9) 9 18.1% (6.6-29.6) 12 32.3% (16.0-48.6) 17 35.9% (20.8-50.9) 45 42.7% (32.4-53.0)
Total 7 6.4% (1.7-11.2) 5 3.8% (0.4-7.2) 19 16.5% (9.2-23.9) 30 29.9% (20.1-39.8) 47 43.3% (33.0-53.6) 108 100.0% (_-_)

Nevada Department of Employment, Training and Rehabilitation
Federal Fiscal Year 2013 Transition Student Satisfaction Survey
67
Q2. Overall, how satisfied or dissatisfied were you with the
timeliness of the services you received from the Vocational Rehabilitation
Division?
Very Dissatisfied Somewhat Dissatisfied Neither Satisfied Nor
Dissatisfied Somewhat Satisfied Very Satisfied Don't Know/Refused Total
N % C.I.(95%) N % C.I.(95%) N % C.I.(95%) N % C.I.(95%) N % C.I.(95%) N % C.I.(95%) N % C.I.(95%)
Overall Total Total 9 8.1% (2.8-13.5) 7 7.4% (1.3-13.6) 21 21.1% (12.4-29.9) 27 22.8% (14.3-31.3) 43 38.6% (28.7-48.6) 2 1.9% (0.0-4.5) 109 100.0% (_-_)
Gender
Female 4 9.3% (0.3-18.2) 3 6.2% (0.0-13.3) 12 27.1% (13.4-40.8) 10 20.7% (8.5-32.9) 15 36.8% (21.7-51.9) 0 . (.-.) 44 42.5% (32.4-52.7)
Male 5 7.3% (0.9-13.7) 4 8.4% (0.0-17.6) 9 16.8% (5.5-28.0) 17 24.3% (12.7-35.9) 28 40.0% (26.7-53.2) 2 3.3% (0.0-7.8) 65 57.5% (47.3-67.6)
Total 9 8.1% (2.8-13.5) 7 7.4% (1.3-13.6) 21 21.1% (12.4-29.9) 27 22.8% (14.3-31.3) 43 38.6% (28.7-48.6) 2 1.9% (0.0-4.5) 109 100.0% (_-_)
Age
<=18 1 6.4% (0.0-19.3) 2 24.4% (0.0-57.4) 1 18.0% (0.0-49.7) 1 18.0% (0.0-49.7) 3 33.3% (0.0-68.5) 0 . (.-.) 8 13.7% (4.3-23.1)
Age 19 or older 8 8.4% (2.6-14.2) 5 4.8% (0.5-9.1) 20 21.6% (12.9-30.4) 26 23.5% (15.1-32.0) 40 39.4% (29.4-49.5) 2 2.2% (0.0-5.2) 101 86.3% (76.9-95.7)
Total 9 8.1% (2.8-13.5) 7 7.4% (1.3-13.6) 21 21.1% (12.4-29.9) 27 22.8% (14.3-31.3) 43 38.6% (28.7-48.6) 2 1.9% (0.0-4.5) 109 100.0% (_-_)
Race
White 6 12.9% (3.1-22.8) 5 9.5% (1.3-17.7) 9 17.1% (6.5-27.6) 9 18.2% (7.1-29.3) 18 37.6% (23.5-51.6) 2 4.7% (0.0-11.2) 49 39.9% (30.2-49.7)
Non White 3 4.9% (0.0-10.7) 2 6.1% (0.0-14.7) 12 23.8% (11.2-36.5) 18 25.8% (13.8-37.9) 25 39.3% (25.6-53.0) 0 . (.-.) 60 60.1% (50.3-69.8)
Total 9 8.1% (2.8-13.5) 7 7.4% (1.3-13.6) 21 21.1% (12.4-29.9) 27 22.8% (14.3-31.3) 43 38.6% (28.7-48.6) 2 1.9% (0.0-4.5) 109 100.0% (_-_)
Region
South NV 7 9.3% (2.5-16.2) 5 8.6% (0.5-16.6) 13 19.3% (9.0-29.5) 18 22.8% (12.3-33.2) 30 38.8% (26.7-50.9) 1 1.3% (0.0-3.7) 74 72.9% (64.4-81.4)
North NV 2 8.8% (0.0-20.8) 0 . (.-.) 3 16.2% (0.0-33.4) 6 28.3% (8.0-48.5) 7 40.3% (17.2-63.5) 1 6.4% (0.0-18.6) 19 15.2% (8.5-21.8)
Rural NV 0 . (.-.) 2 10.1% (0.0-23.8) 5 38.9% (11.6-66.2) 3 15.9% (0.0-33.2) 6 35.2% (10.2-60.2) 0 . (.-.) 16 12.0% (5.9-18.0)
Total 9 8.1% (2.8-13.5) 7 7.4% (1.3-13.6) 21 21.1% (12.4-29.9) 27 22.8% (14.3-31.3) 43 38.6% (28.7-48.6) 2 1.9% (0.0-4.5) 109 100.0% (_-_)
Participated in on-the-job training
Yes 4 9.3% (0.0-18.6) 0 . (.-.) 5 12.2% (1.4-22.9) 11 27.3% (11.4-43.1) 21 51.3% (34.0-68.5) . . . 41 67.8% (53.7-81.9)
No 1 4.2% (0.0-12.6) 3 23.8% (0.0-50.0) 5 33.3% (6.2-60.5) 4 14.6% (0.0-29.4) 5 24.0% (3.2-44.8) . . . 18 32.2% (18.1-46.3)
Total 5 7.7% (0.7-14.6) 3 7.7% (0.0-17.2) 10 19.0% (6.9-31.1) 15 23.2% (11.1-35.3) 26 42.5% (28.2-56.8) . . . 59 100.0% (_-_)
Participated in Job Corps
Yes 0 . (.-.) . . . 2 20.4% (0.0-47.5) 4 43.4% (8.8-78.1) 3 36.2% (1.8-70.6) . . . 9 22.4% (7.7-37.0)
No 1 3.9% (0.0-11.8) . . . 9 39.3% (16.0-62.6) 6 20.0% (3.6-36.5) 9 36.8% (13.9-59.6) . . . 25 77.6% (63.0-92.3)
Total 1 3.0% (0.0-9.2) . . . 11 35.1% (15.6-54.5) 10 25.3% (9.7-40.8) 12 36.6% (17.3-56.0) . . . 34 100.0% (_-_)
Currently Employed
Yes 3 5.1% (0.0-11.0) 5 7.2% (0.8-13.6) 14 24.5% (12.2-36.9) 13 17.4% (8.1-26.8) 28 45.8% (32.2-59.3) 0 . (.-.) 63 57.3% (47.0-67.6)
No 6 12.4% (2.6-22.1) 2 8.0% (0.0-19.6) 7 17.1% (5.1-29.1) 14 30.5% (15.4-45.5) 15 29.9% (15.9-43.8) 1 2.3% (0.0-6.8) 45 42.7% (32.4-53.0)
Total 9 8.2% (2.8-13.6) 7 7.5% (1.3-13.7) 21 21.3% (12.5-30.1) 27 23.0% (14.4-31.5) 43 39.0% (28.9-49.0) 1 1.0% (0.0-2.9) 108 100.0% (_-_)
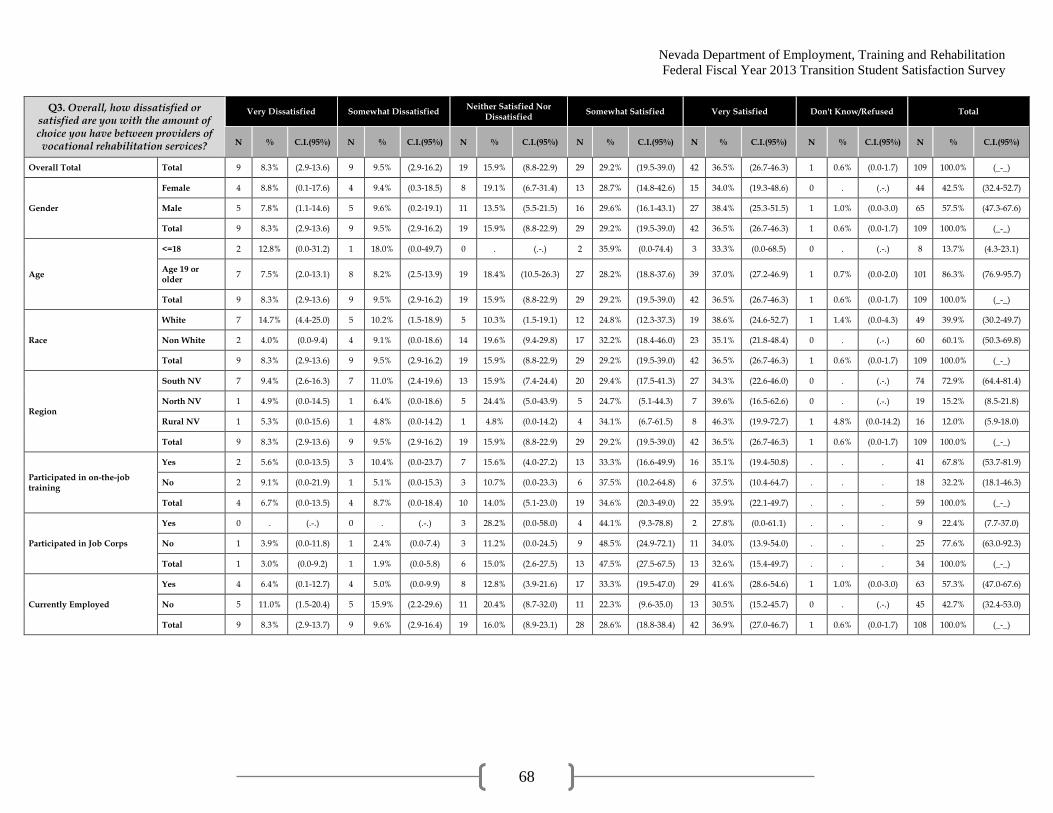
Nevada Department of Employment, Training and Rehabilitation
Federal Fiscal Year 2013 Transition Student Satisfaction Survey
68
Q3. Overall, how dissatisfied or satisfied are you with the amount of choice you have between providers of
vocational rehabilitation services?
Very Dissatisfied Somewhat Dissatisfied Neither Satisfied Nor
Dissatisfied Somewhat Satisfied Very Satisfied Don't Know/Refused Total
N % C.I.(95%) N % C.I.(95%) N % C.I.(95%) N % C.I.(95%) N % C.I.(95%) N % C.I.(95%) N % C.I.(95%)
Overall Total Total 9 8.3% (2.9-13.6) 9 9.5% (2.9-16.2) 19 15.9% (8.8-22.9) 29 29.2% (19.5-39.0) 42 36.5% (26.7-46.3) 1 0.6% (0.0-1.7) 109 100.0% (_-_)
Gender
Female 4 8.8% (0.1-17.6) 4 9.4% (0.3-18.5) 8 19.1% (6.7-31.4) 13 28.7% (14.8-42.6) 15 34.0% (19.3-48.6) 0 . (.-.) 44 42.5% (32.4-52.7)
Male 5 7.8% (1.1-14.6) 5 9.6% (0.2-19.1) 11 13.5% (5.5-21.5) 16 29.6% (16.1-43.1) 27 38.4% (25.3-51.5) 1 1.0% (0.0-3.0) 65 57.5% (47.3-67.6)
Total 9 8.3% (2.9-13.6) 9 9.5% (2.9-16.2) 19 15.9% (8.8-22.9) 29 29.2% (19.5-39.0) 42 36.5% (26.7-46.3) 1 0.6% (0.0-1.7) 109 100.0% (_-_)
Age
<=18 2 12.8% (0.0-31.2) 1 18.0% (0.0-49.7) 0 . (.-.) 2 35.9% (0.0-74.4) 3 33.3% (0.0-68.5) 0 . (.-.) 8 13.7% (4.3-23.1)
Age 19 or older
7 7.5% (2.0-13.1) 8 8.2% (2.5-13.9) 19 18.4% (10.5-26.3) 27 28.2% (18.8-37.6) 39 37.0% (27.2-46.9) 1 0.7% (0.0-2.0) 101 86.3% (76.9-95.7)
Total 9 8.3% (2.9-13.6) 9 9.5% (2.9-16.2) 19 15.9% (8.8-22.9) 29 29.2% (19.5-39.0) 42 36.5% (26.7-46.3) 1 0.6% (0.0-1.7) 109 100.0% (_-_)
Race
White 7 14.7% (4.4-25.0) 5 10.2% (1.5-18.9) 5 10.3% (1.5-19.1) 12 24.8% (12.3-37.3) 19 38.6% (24.6-52.7) 1 1.4% (0.0-4.3) 49 39.9% (30.2-49.7)
Non White 2 4.0% (0.0-9.4) 4 9.1% (0.0-18.6) 14 19.6% (9.4-29.8) 17 32.2% (18.4-46.0) 23 35.1% (21.8-48.4) 0 . (.-.) 60 60.1% (50.3-69.8)
Total 9 8.3% (2.9-13.6) 9 9.5% (2.9-16.2) 19 15.9% (8.8-22.9) 29 29.2% (19.5-39.0) 42 36.5% (26.7-46.3) 1 0.6% (0.0-1.7) 109 100.0% (_-_)
Region
South NV 7 9.4% (2.6-16.3) 7 11.0% (2.4-19.6) 13 15.9% (7.4-24.4) 20 29.4% (17.5-41.3) 27 34.3% (22.6-46.0) 0 . (.-.) 74 72.9% (64.4-81.4)
North NV 1 4.9% (0.0-14.5) 1 6.4% (0.0-18.6) 5 24.4% (5.0-43.9) 5 24.7% (5.1-44.3) 7 39.6% (16.5-62.6) 0 . (.-.) 19 15.2% (8.5-21.8)
Rural NV 1 5.3% (0.0-15.6) 1 4.8% (0.0-14.2) 1 4.8% (0.0-14.2) 4 34.1% (6.7-61.5) 8 46.3% (19.9-72.7) 1 4.8% (0.0-14.2) 16 12.0% (5.9-18.0)
Total 9 8.3% (2.9-13.6) 9 9.5% (2.9-16.2) 19 15.9% (8.8-22.9) 29 29.2% (19.5-39.0) 42 36.5% (26.7-46.3) 1 0.6% (0.0-1.7) 109 100.0% (_-_)
Participated in on-the-job training
Yes 2 5.6% (0.0-13.5) 3 10.4% (0.0-23.7) 7 15.6% (4.0-27.2) 13 33.3% (16.6-49.9) 16 35.1% (19.4-50.8) . . . 41 67.8% (53.7-81.9)
No 2 9.1% (0.0-21.9) 1 5.1% (0.0-15.3) 3 10.7% (0.0-23.3) 6 37.5% (10.2-64.8) 6 37.5% (10.4-64.7) . . . 18 32.2% (18.1-46.3)
Total 4 6.7% (0.0-13.5) 4 8.7% (0.0-18.4) 10 14.0% (5.1-23.0) 19 34.6% (20.3-49.0) 22 35.9% (22.1-49.7) . . . 59 100.0% (_-_)
Participated in Job Corps
Yes 0 . (.-.) 0 . (.-.) 3 28.2% (0.0-58.0) 4 44.1% (9.3-78.8) 2 27.8% (0.0-61.1) . . . 9 22.4% (7.7-37.0)
No 1 3.9% (0.0-11.8) 1 2.4% (0.0-7.4) 3 11.2% (0.0-24.5) 9 48.5% (24.9-72.1) 11 34.0% (13.9-54.0) . . . 25 77.6% (63.0-92.3)
Total 1 3.0% (0.0-9.2) 1 1.9% (0.0-5.8) 6 15.0% (2.6-27.5) 13 47.5% (27.5-67.5) 13 32.6% (15.4-49.7) . . . 34 100.0% (_-_)
Currently Employed
Yes 4 6.4% (0.1-12.7) 4 5.0% (0.0-9.9) 8 12.8% (3.9-21.6) 17 33.3% (19.5-47.0) 29 41.6% (28.6-54.6) 1 1.0% (0.0-3.0) 63 57.3% (47.0-67.6)
No 5 11.0% (1.5-20.4) 5 15.9% (2.2-29.6) 11 20.4% (8.7-32.0) 11 22.3% (9.6-35.0) 13 30.5% (15.2-45.7) 0 . (.-.) 45 42.7% (32.4-53.0)
Total 9 8.3% (2.9-13.7) 9 9.6% (2.9-16.4) 19 16.0% (8.9-23.1) 28 28.6% (18.8-38.4) 42 36.9% (27.0-46.7) 1 0.6% (0.0-1.7) 108 100.0% (_-_)
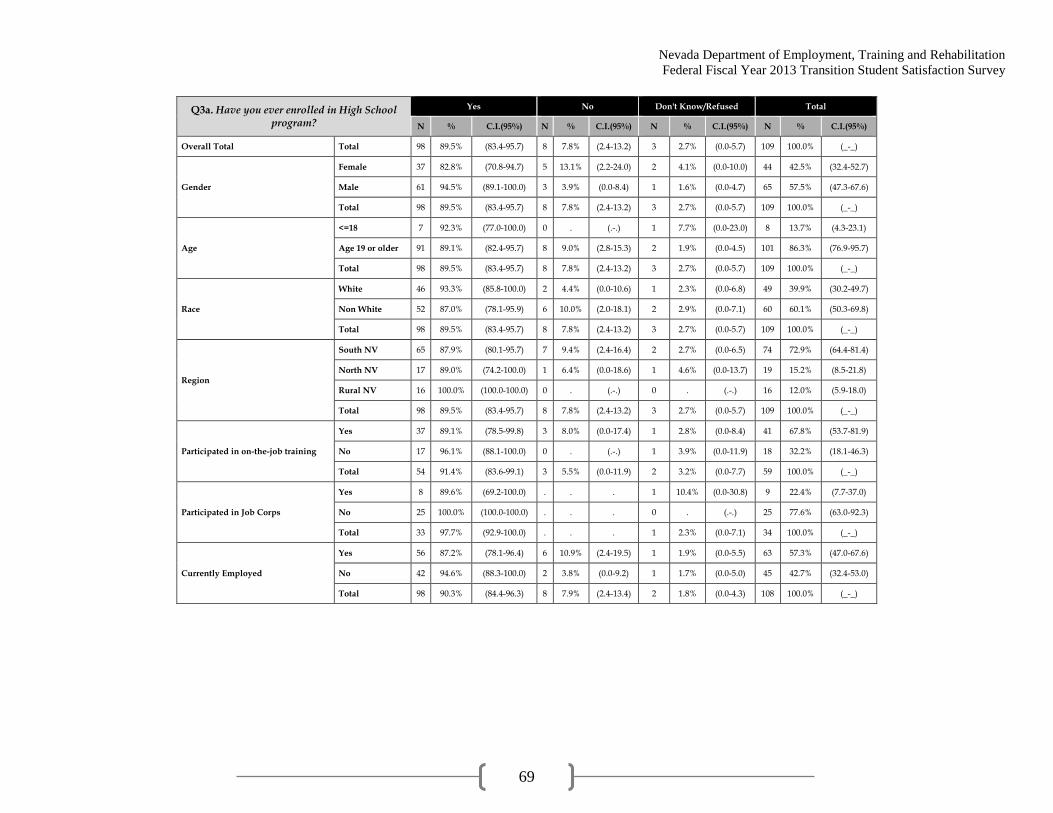
Nevada Department of Employment, Training and Rehabilitation
Federal Fiscal Year 2013 Transition Student Satisfaction Survey
69
Q3a. Have you ever enrolled in High School program?
Yes No Don't Know/Refused Total
N % C.I.(95%) N % C.I.(95%) N % C.I.(95%) N % C.I.(95%)
Overall Total Total 98 89.5% (83.4-95.7) 8 7.8% (2.4-13.2) 3 2.7% (0.0-5.7) 109 100.0% (_-_)
Gender
Female 37 82.8% (70.8-94.7) 5 13.1% (2.2-24.0) 2 4.1% (0.0-10.0) 44 42.5% (32.4-52.7)
Male 61 94.5% (89.1-100.0) 3 3.9% (0.0-8.4) 1 1.6% (0.0-4.7) 65 57.5% (47.3-67.6)
Total 98 89.5% (83.4-95.7) 8 7.8% (2.4-13.2) 3 2.7% (0.0-5.7) 109 100.0% (_-_)
Age
<=18 7 92.3% (77.0-100.0) 0 . (.-.) 1 7.7% (0.0-23.0) 8 13.7% (4.3-23.1)
Age 19 or older 91 89.1% (82.4-95.7) 8 9.0% (2.8-15.3) 2 1.9% (0.0-4.5) 101 86.3% (76.9-95.7)
Total 98 89.5% (83.4-95.7) 8 7.8% (2.4-13.2) 3 2.7% (0.0-5.7) 109 100.0% (_-_)
Race
White 46 93.3% (85.8-100.0) 2 4.4% (0.0-10.6) 1 2.3% (0.0-6.8) 49 39.9% (30.2-49.7)
Non White 52 87.0% (78.1-95.9) 6 10.0% (2.0-18.1) 2 2.9% (0.0-7.1) 60 60.1% (50.3-69.8)
Total 98 89.5% (83.4-95.7) 8 7.8% (2.4-13.2) 3 2.7% (0.0-5.7) 109 100.0% (_-_)
Region
South NV 65 87.9% (80.1-95.7) 7 9.4% (2.4-16.4) 2 2.7% (0.0-6.5) 74 72.9% (64.4-81.4)
North NV 17 89.0% (74.2-100.0) 1 6.4% (0.0-18.6) 1 4.6% (0.0-13.7) 19 15.2% (8.5-21.8)
Rural NV 16 100.0% (100.0-100.0) 0 . (.-.) 0 . (.-.) 16 12.0% (5.9-18.0)
Total 98 89.5% (83.4-95.7) 8 7.8% (2.4-13.2) 3 2.7% (0.0-5.7) 109 100.0% (_-_)
Participated in on-the-job training
Yes 37 89.1% (78.5-99.8) 3 8.0% (0.0-17.4) 1 2.8% (0.0-8.4) 41 67.8% (53.7-81.9)
No 17 96.1% (88.1-100.0) 0 . (.-.) 1 3.9% (0.0-11.9) 18 32.2% (18.1-46.3)
Total 54 91.4% (83.6-99.1) 3 5.5% (0.0-11.9) 2 3.2% (0.0-7.7) 59 100.0% (_-_)
Participated in Job Corps
Yes 8 89.6% (69.2-100.0) . . . 1 10.4% (0.0-30.8) 9 22.4% (7.7-37.0)
No 25 100.0% (100.0-100.0) . . . 0 . (.-.) 25 77.6% (63.0-92.3)
Total 33 97.7% (92.9-100.0) . . . 1 2.3% (0.0-7.1) 34 100.0% (_-_)
Currently Employed
Yes 56 87.2% (78.1-96.4) 6 10.9% (2.4-19.5) 1 1.9% (0.0-5.5) 63 57.3% (47.0-67.6)
No 42 94.6% (88.3-100.0) 2 3.8% (0.0-9.2) 1 1.7% (0.0-5.0) 45 42.7% (32.4-53.0)
Total 98 90.3% (84.4-96.3) 8 7.9% (2.4-13.4) 2 1.8% (0.0-4.3) 108 100.0% (_-_)
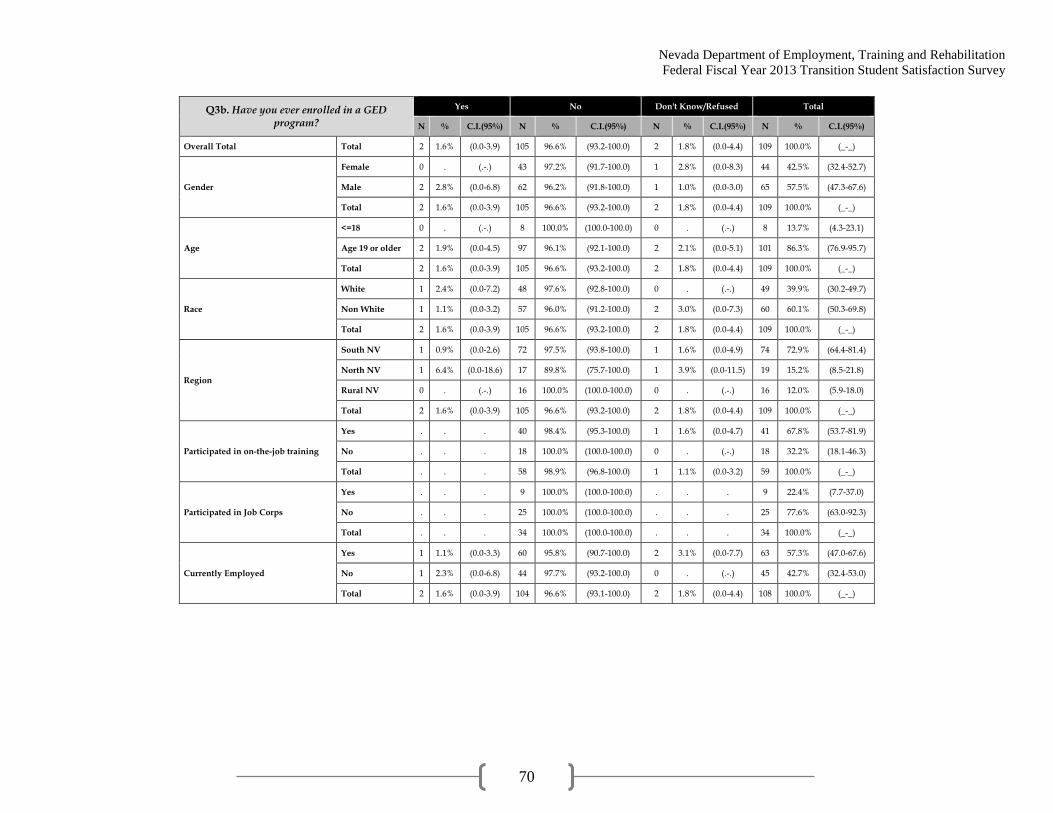
Nevada Department of Employment, Training and Rehabilitation
Federal Fiscal Year 2013 Transition Student Satisfaction Survey
70
Q3b. Have you ever enrolled in a GED program?
Yes No Don't Know/Refused Total
N % C.I.(95%) N % C.I.(95%) N % C.I.(95%) N % C.I.(95%)
Overall Total Total 2 1.6% (0.0-3.9) 105 96.6% (93.2-100.0) 2 1.8% (0.0-4.4) 109 100.0% (_-_)
Gender
Female 0 . (.-.) 43 97.2% (91.7-100.0) 1 2.8% (0.0-8.3) 44 42.5% (32.4-52.7)
Male 2 2.8% (0.0-6.8) 62 96.2% (91.8-100.0) 1 1.0% (0.0-3.0) 65 57.5% (47.3-67.6)
Total 2 1.6% (0.0-3.9) 105 96.6% (93.2-100.0) 2 1.8% (0.0-4.4) 109 100.0% (_-_)
Age
<=18 0 . (.-.) 8 100.0% (100.0-100.0) 0 . (.-.) 8 13.7% (4.3-23.1)
Age 19 or older 2 1.9% (0.0-4.5) 97 96.1% (92.1-100.0) 2 2.1% (0.0-5.1) 101 86.3% (76.9-95.7)
Total 2 1.6% (0.0-3.9) 105 96.6% (93.2-100.0) 2 1.8% (0.0-4.4) 109 100.0% (_-_)
Race
White 1 2.4% (0.0-7.2) 48 97.6% (92.8-100.0) 0 . (.-.) 49 39.9% (30.2-49.7)
Non White 1 1.1% (0.0-3.2) 57 96.0% (91.2-100.0) 2 3.0% (0.0-7.3) 60 60.1% (50.3-69.8)
Total 2 1.6% (0.0-3.9) 105 96.6% (93.2-100.0) 2 1.8% (0.0-4.4) 109 100.0% (_-_)
Region
South NV 1 0.9% (0.0-2.6) 72 97.5% (93.8-100.0) 1 1.6% (0.0-4.9) 74 72.9% (64.4-81.4)
North NV 1 6.4% (0.0-18.6) 17 89.8% (75.7-100.0) 1 3.9% (0.0-11.5) 19 15.2% (8.5-21.8)
Rural NV 0 . (.-.) 16 100.0% (100.0-100.0) 0 . (.-.) 16 12.0% (5.9-18.0)
Total 2 1.6% (0.0-3.9) 105 96.6% (93.2-100.0) 2 1.8% (0.0-4.4) 109 100.0% (_-_)
Participated in on-the-job training
Yes . . . 40 98.4% (95.3-100.0) 1 1.6% (0.0-4.7) 41 67.8% (53.7-81.9)
No . . . 18 100.0% (100.0-100.0) 0 . (.-.) 18 32.2% (18.1-46.3)
Total . . . 58 98.9% (96.8-100.0) 1 1.1% (0.0-3.2) 59 100.0% (_-_)
Participated in Job Corps
Yes . . . 9 100.0% (100.0-100.0) . . . 9 22.4% (7.7-37.0)
No . . . 25 100.0% (100.0-100.0) . . . 25 77.6% (63.0-92.3)
Total . . . 34 100.0% (100.0-100.0) . . . 34 100.0% (_-_)
Currently Employed
Yes 1 1.1% (0.0-3.3) 60 95.8% (90.7-100.0) 2 3.1% (0.0-7.7) 63 57.3% (47.0-67.6)
No 1 2.3% (0.0-6.8) 44 97.7% (93.2-100.0) 0 . (.-.) 45 42.7% (32.4-53.0)
Total 2 1.6% (0.0-3.9) 104 96.6% (93.1-100.0) 2 1.8% (0.0-4.4) 108 100.0% (_-_)

Nevada Department of Employment, Training and Rehabilitation
Federal Fiscal Year 2013 Transition Student Satisfaction Survey
71
Q4a. Which of the following best describes your progress in your High School program?
Currently attending Completed program Left without completing
program Don't Know/Refused Total
N % C.I.(95%) N % C.I.(95%) N % C.I.(95%) N % C.I.(95%) N % C.I.(95%)
Overall Total Total 8 7.5% (2.3-12.6) 84 86.7% (79.9-93.5) 5 5.2% (0.7-9.7) 1 0.7% (0.0-2.1) 98 100.0% (_-_)
Gender
Female 0 . (.-.) 37 100.0% (100.0-100.0) 0 . (.-.) 0 . (.-.) 37 39.3% (28.7-49.9)
Male 8 12.3% (3.9-20.7) 47 78.0% (67.2-88.9) 5 8.5% (1.2-15.8) 1 1.2% (0.0-3.5) 61 60.7% (50.1-71.3)
Total 8 7.5% (2.3-12.6) 84 86.7% (79.9-93.5) 5 5.2% (0.7-9.7) 1 0.7% (0.0-2.1) 98 100.0% (_-_)
Age
<=18 2 13.9% (0.0-34.0) 5 86.1% (66.0-100.0) 0 . (.-.) 0 . (.-.) 7 14.1% (3.9-24.4)
Age 19 or older 6 6.4% (1.3-11.5) 79 86.8% (79.6-94.0) 5 6.0% (0.8-11.2) 1 0.8% (0.0-2.5) 91 85.9% (75.6-96.1)
Total 8 7.5% (2.3-12.6) 84 86.7% (79.9-93.5) 5 5.2% (0.7-9.7) 1 0.7% (0.0-2.1) 98 100.0% (_-_)
Race
White 6 14.5% (3.7-25.4) 35 73.1% (59.5-86.7) 5 12.4% (2.1-22.7) 0 . (.-.) 46 41.6% (31.2-52.1)
Non White 2 2.4% (0.0-5.9) 49 96.4% (92.2-100.0) 0 . (.-.) 1 1.2% (0.0-3.6) 52 58.4% (47.9-68.8)
Total 8 7.5% (2.3-12.6) 84 86.7% (79.9-93.5) 5 5.2% (0.7-9.7) 1 0.7% (0.0-2.1) 98 100.0% (_-_)
Region
South NV 8 10.4% (3.2-17.6) 52 82.9% (73.9-91.9) 4 5.7% (0.1-11.3) 1 1.0% (0.0-3.0) 65 71.6% (62.4-80.8)
North NV 0 . (.-.) 16 92.8% (79.2-100.0) 1 7.2% (0.0-20.8) 0 . (.-.) 17 15.1% (8.0-22.1)
Rural NV 0 . (.-.) 16 100.0% (100.0-100.0) 0 . (.-.) 0 . (.-.) 16 13.4% (6.6-20.1)
Total 8 7.5% (2.3-12.6) 84 86.7% (79.9-93.5) 5 5.2% (0.7-9.7) 1 0.7% (0.0-2.1) 98 100.0% (_-_)
Participated in on-the-job training
Yes 2 5.5% (0.0-13.1) 33 89.1% (78.5-99.6) 2 5.5% (0.0-13.1) . . . 37 66.1% (51.0-81.2)
No 4 17.9% (0.0-35.7) 13 82.1% (64.3-100.0) 0 . (.-.) . . . 17 33.9% (18.8-49.0)
Total 6 9.7% (1.8-17.5) 46 86.7% (77.5-95.9) 2 3.6% (0.0-8.7) . . . 54 100.0% (_-_)
Participated in Job Corps
Yes 1 10.5% (0.0-31.3) 6 74.5% (41.8-100.0) 1 15.0% (0.0-43.4) 0 . (.-.) 8 20.5% (6.1-34.9)
No 0 . (.-.) 24 97.3% (91.7-100.0) 0 . (.-.) 1 2.7% (0.0-8.3) 25 79.5% (65.1-93.9)
Total 1 2.1% (0.0-6.6) 30 92.6% (83.8-100.0) 1 3.1% (0.0-9.4) 1 2.1% (0.0-6.6) 33 100.0% (_-_)
Currently Employed
Yes 4 6.7% (0.1-13.4) 50 89.6% (81.4-97.8) 2 3.7% (0.0-8.8) 0 . (.-.) 56 55.3% (44.4-66.3)
No 4 8.3% (0.2-16.5) 34 83.1% (71.8-94.4) 3 7.0% (0.0-14.8) 1 1.6% (0.0-4.8) 42 44.7% (33.7-55.6)
Total 8 7.5% (2.3-12.6) 84 86.7% (79.9-93.5) 5 5.2% (0.7-9.7) 1 0.7% (0.0-2.1) 98 100.0% (_-_)

Nevada Department of Employment, Training and Rehabilitation
Federal Fiscal Year 2013 Transition Student Satisfaction Survey
72
Q4b. How did you complete High School?
Standard, Advance, or Honors diploma
Adjusted diploma Certificate of attendance Don't Know/Refused Total
N % C.I.(95%) N % C.I.(95%) N % C.I.(95%) N % C.I.(95%) N % C.I.(95%)
Overall Total Total 39 48.7% (36.7-60.7) 39 43.2% (31.4-54.9) 5 6.6% (0.0-13.5) 1 1.5% (0.0-4.6) 84 100.0% (_-_)
Gender
Female 14 40.2% (23.4-57.0) 20 52.3% (35.3-69.3) 2 4.1% (0.0-9.8) 1 3.4% (0.0-10.0) 37 45.4% (33.5-57.2)
Male 25 55.8% (39.1-72.4) 19 35.6% (20.0-51.1) 3 8.7% (0.0-20.2) 0 . (.-.) 47 54.6% (42.8-66.5)
Total 39 48.7% (36.7-60.7) 39 43.2% (31.4-54.9) 5 6.6% (0.0-13.5) 1 1.5% (0.0-4.6) 84 100.0% (_-_)
Age
<=18 2 45.2% (0.0-91.4) 2 32.3% (0.0-74.0) 1 22.6% (0.0-62.0) 0 . (.-.) 5 14.0% (2.5-25.5)
Age 19 or older 37 49.3% (37.5-61.0) 37 45.0% (33.3-56.6) 4 4.0% (0.0-8.0) 1 1.8% (0.0-5.3) 79 86.0% (74.5-97.5)
Total 39 48.7% (36.7-60.7) 39 43.2% (31.4-54.9) 5 6.6% (0.0-13.5) 1 1.5% (0.0-4.6) 84 100.0% (_-_)
Race
White 20 57.1% (40.0-74.1) 13 37.7% (21.0-54.3) 2 5.3% (0.0-12.6) 0 . (.-.) 35 35.1% (24.4-45.8)
Non White 19 44.2% (28.2-60.2) 26 46.2% (30.4-61.9) 3 7.3% (0.0-17.2) 1 2.4% (0.0-7.0) 49 64.9% (54.2-75.6)
Total 39 48.7% (36.7-60.7) 39 43.2% (31.4-54.9) 5 6.6% (0.0-13.5) 1 1.5% (0.0-4.6) 84 100.0% (_-_)
Region
South NV 22 45.2% (29.9-60.5) 26 45.2% (30.1-60.3) 3 7.3% (0.0-16.9) 1 2.2% (0.0-6.7) 52 68.4% (58.1-78.8)
North NV 6 39.7% (14.6-64.9) 9 55.6% (30.2-81.0) 1 4.7% (0.0-13.9) 0 . (.-.) 16 16.1% (8.3-23.9)
Rural NV 11 73.5% (52.0-95.1) 4 21.2% (1.5-40.8) 1 5.3% (0.0-15.7) 0 . (.-.) 16 15.4% (7.6-23.2)
Total 39 48.7% (36.7-60.7) 39 43.2% (31.4-54.9) 5 6.6% (0.0-13.5) 1 1.5% (0.0-4.6) 84 100.0% (_-_)
Participated in on-the-job training
Yes 12 44.2% (23.9-64.4) 19 49.8% (30.1-69.6) 1 2.0% (0.0-6.0) 1 4.0% (0.0-12.0) 33 67.9% (51.3-84.6)
No 6 38.1% (8.2-67.9) 4 34.2% (2.1-66.3) 3 27.7% (0.0-59.2) 0 . (.-.) 13 32.1% (15.4-48.7)
Total 18 42.2% (25.2-59.3) 23 44.8% (28.1-61.5) 4 10.2% (0.0-22.1) 1 2.7% (0.0-8.2) 46 100.0% (_-_)
Participated in Job Corps
Yes 3 43.2% (1.1-85.3) 3 56.8% (14.7-98.9) 0 . (.-.) . . . 6 16.5% (2.8-30.2)
No 11 46.9% (22.9-70.9) 10 36.1% (14.4-57.8) 3 17.0% (0.0-38.3) . . . 24 83.5% (69.8-97.2)
Total 14 46.3% (25.0-67.6) 13 39.5% (19.5-59.5) 3 14.2% (0.0-32.4) . . . 30 100.0% (_-_)
Currently Employed
Yes 24 50.8% (35.3-66.3) 23 41.0% (26.2-55.7) 3 8.3% (0.0-19.3) 0 . (.-.) 50 57.2% (45.2-69.1)
No 15 46.0% (27.1-64.8) 16 46.1% (27.4-64.9) 2 4.3% (0.0-10.5) 1 3.6% (0.0-10.6) 34 42.8% (30.9-54.8)
Total 39 48.7% (36.7-60.7) 39 43.2% (31.4-54.9) 5 6.6% (0.0-13.5) 1 1.5% (0.0-4.6) 84 100.0% (_-_)

Nevada Department of Employment, Training and Rehabilitation
Federal Fiscal Year 2013 Transition Student Satisfaction Survey
73
Q4c. Which of the following best describes your progress in your
GED program?
Left without completing program
Total
N % C.I.(95%) N % C.I.(95%)
Gender Male 2 100.0% (100.0-100.0) 2 100.0% (_-_)
Age Age 19 or older 2 100.0% (100.0-100.0) 2 100.0% (_-_)
Race
White 1 100.0% (100.0-100.0) 1 60.3% (0.0-100.0)
Non White 1 100.0% (100.0-100.0) 1 39.7% (0.0-100.0)
Total 2 100.0% (100.0-100.0) 2 100.0% (_-_)
Region
South NV 1 100.0% (100.0-100.0) 1 39.7% (0.0-100.0)
North NV 1 100.0% (100.0-100.0) 1 60.3% (0.0-100.0)
Total 2 100.0% (100.0-100.0) 2 100.0% (_-_)
Currently Employed
Yes 1 100.0% (100.0-100.0) 1 39.7% (0.0-100.0)
No 1 100.0% (100.0-100.0) 1 60.3% (0.0-100.0)
Total 2 100.0% (100.0-100.0) 2 100.0% (_-_)
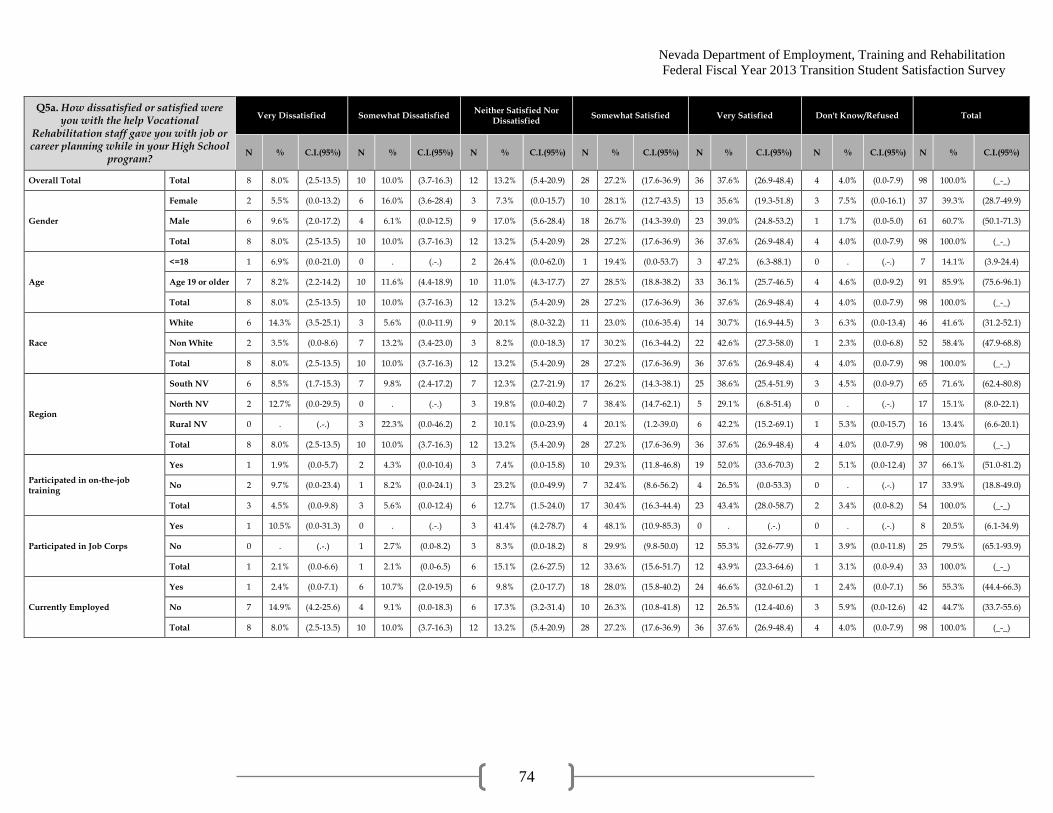
Nevada Department of Employment, Training and Rehabilitation
Federal Fiscal Year 2013 Transition Student Satisfaction Survey
74
Q5a. How dissatisfied or satisfied were you with the help Vocational
Rehabilitation staff gave you with job or career planning while in your High School
program?
Very Dissatisfied Somewhat Dissatisfied Neither Satisfied Nor
Dissatisfied Somewhat Satisfied Very Satisfied Don't Know/Refused Total
N % C.I.(95%) N % C.I.(95%) N % C.I.(95%) N % C.I.(95%) N % C.I.(95%) N % C.I.(95%) N % C.I.(95%)
Overall Total Total 8 8.0% (2.5-13.5) 10 10.0% (3.7-16.3) 12 13.2% (5.4-20.9) 28 27.2% (17.6-36.9) 36 37.6% (26.9-48.4) 4 4.0% (0.0-7.9) 98 100.0% (_-_)
Gender
Female 2 5.5% (0.0-13.2) 6 16.0% (3.6-28.4) 3 7.3% (0.0-15.7) 10 28.1% (12.7-43.5) 13 35.6% (19.3-51.8) 3 7.5% (0.0-16.1) 37 39.3% (28.7-49.9)
Male 6 9.6% (2.0-17.2) 4 6.1% (0.0-12.5) 9 17.0% (5.6-28.4) 18 26.7% (14.3-39.0) 23 39.0% (24.8-53.2) 1 1.7% (0.0-5.0) 61 60.7% (50.1-71.3)
Total 8 8.0% (2.5-13.5) 10 10.0% (3.7-16.3) 12 13.2% (5.4-20.9) 28 27.2% (17.6-36.9) 36 37.6% (26.9-48.4) 4 4.0% (0.0-7.9) 98 100.0% (_-_)
Age
<=18 1 6.9% (0.0-21.0) 0 . (.-.) 2 26.4% (0.0-62.0) 1 19.4% (0.0-53.7) 3 47.2% (6.3-88.1) 0 . (.-.) 7 14.1% (3.9-24.4)
Age 19 or older 7 8.2% (2.2-14.2) 10 11.6% (4.4-18.9) 10 11.0% (4.3-17.7) 27 28.5% (18.8-38.2) 33 36.1% (25.7-46.5) 4 4.6% (0.0-9.2) 91 85.9% (75.6-96.1)
Total 8 8.0% (2.5-13.5) 10 10.0% (3.7-16.3) 12 13.2% (5.4-20.9) 28 27.2% (17.6-36.9) 36 37.6% (26.9-48.4) 4 4.0% (0.0-7.9) 98 100.0% (_-_)
Race
White 6 14.3% (3.5-25.1) 3 5.6% (0.0-11.9) 9 20.1% (8.0-32.2) 11 23.0% (10.6-35.4) 14 30.7% (16.9-44.5) 3 6.3% (0.0-13.4) 46 41.6% (31.2-52.1)
Non White 2 3.5% (0.0-8.6) 7 13.2% (3.4-23.0) 3 8.2% (0.0-18.3) 17 30.2% (16.3-44.2) 22 42.6% (27.3-58.0) 1 2.3% (0.0-6.8) 52 58.4% (47.9-68.8)
Total 8 8.0% (2.5-13.5) 10 10.0% (3.7-16.3) 12 13.2% (5.4-20.9) 28 27.2% (17.6-36.9) 36 37.6% (26.9-48.4) 4 4.0% (0.0-7.9) 98 100.0% (_-_)
Region
South NV 6 8.5% (1.7-15.3) 7 9.8% (2.4-17.2) 7 12.3% (2.7-21.9) 17 26.2% (14.3-38.1) 25 38.6% (25.4-51.9) 3 4.5% (0.0-9.7) 65 71.6% (62.4-80.8)
North NV 2 12.7% (0.0-29.5) 0 . (.-.) 3 19.8% (0.0-40.2) 7 38.4% (14.7-62.1) 5 29.1% (6.8-51.4) 0 . (.-.) 17 15.1% (8.0-22.1)
Rural NV 0 . (.-.) 3 22.3% (0.0-46.2) 2 10.1% (0.0-23.9) 4 20.1% (1.2-39.0) 6 42.2% (15.2-69.1) 1 5.3% (0.0-15.7) 16 13.4% (6.6-20.1)
Total 8 8.0% (2.5-13.5) 10 10.0% (3.7-16.3) 12 13.2% (5.4-20.9) 28 27.2% (17.6-36.9) 36 37.6% (26.9-48.4) 4 4.0% (0.0-7.9) 98 100.0% (_-_)
Participated in on-the-job training
Yes 1 1.9% (0.0-5.7) 2 4.3% (0.0-10.4) 3 7.4% (0.0-15.8) 10 29.3% (11.8-46.8) 19 52.0% (33.6-70.3) 2 5.1% (0.0-12.4) 37 66.1% (51.0-81.2)
No 2 9.7% (0.0-23.4) 1 8.2% (0.0-24.1) 3 23.2% (0.0-49.9) 7 32.4% (8.6-56.2) 4 26.5% (0.0-53.3) 0 . (.-.) 17 33.9% (18.8-49.0)
Total 3 4.5% (0.0-9.8) 3 5.6% (0.0-12.4) 6 12.7% (1.5-24.0) 17 30.4% (16.3-44.4) 23 43.4% (28.0-58.7) 2 3.4% (0.0-8.2) 54 100.0% (_-_)
Participated in Job Corps
Yes 1 10.5% (0.0-31.3) 0 . (.-.) 3 41.4% (4.2-78.7) 4 48.1% (10.9-85.3) 0 . (.-.) 0 . (.-.) 8 20.5% (6.1-34.9)
No 0 . (.-.) 1 2.7% (0.0-8.2) 3 8.3% (0.0-18.2) 8 29.9% (9.8-50.0) 12 55.3% (32.6-77.9) 1 3.9% (0.0-11.8) 25 79.5% (65.1-93.9)
Total 1 2.1% (0.0-6.6) 1 2.1% (0.0-6.5) 6 15.1% (2.6-27.5) 12 33.6% (15.6-51.7) 12 43.9% (23.3-64.6) 1 3.1% (0.0-9.4) 33 100.0% (_-_)
Currently Employed
Yes 1 2.4% (0.0-7.1) 6 10.7% (2.0-19.5) 6 9.8% (2.0-17.7) 18 28.0% (15.8-40.2) 24 46.6% (32.0-61.2) 1 2.4% (0.0-7.1) 56 55.3% (44.4-66.3)
No 7 14.9% (4.2-25.6) 4 9.1% (0.0-18.3) 6 17.3% (3.2-31.4) 10 26.3% (10.8-41.8) 12 26.5% (12.4-40.6) 3 5.9% (0.0-12.6) 42 44.7% (33.7-55.6)
Total 8 8.0% (2.5-13.5) 10 10.0% (3.7-16.3) 12 13.2% (5.4-20.9) 28 27.2% (17.6-36.9) 36 37.6% (26.9-48.4) 4 4.0% (0.0-7.9) 98 100.0% (_-_)

Nevada Department of Employment, Training and Rehabilitation
Federal Fiscal Year 2013 Transition Student Satisfaction Survey
75
Q5b. How dissatisfied or satisfied were you with the help Vocational Rehabilitation staff gave you with
job or career planning while in your GED program?'
Somewhat Satisfied Very Satisfied Total
N % C.I.(95%) N % C.I.(95%) N % C.I.(95%)
Gender Male 1 60.3% (0.0-100.0) 1 39.7% (0.0-100.0) 2 100.0% (_-_)
Age Age 19 or older 1 60.3% (0.0-100.0) 1 39.7% (0.0-100.0) 2 100.0% (_-_)
Race
White 1 100.0% (100.0-100.0) 0 . (.-.) 1 60.3% (0.0-100.0)
Non White 0 . (.-.) 1 100.0% (100.0-100.0) 1 39.7% (0.0-100.0)
Total 1 60.3% (0.0-100.0) 1 39.7% (0.0-100.0) 2 100.0% (_-_)
Region
South NV 0 . (.-.) 1 100.0% (100.0-100.0) 1 39.7% (0.0-100.0)
North NV 1 100.0% (100.0-100.0) 0 . (.-.) 1 60.3% (0.0-100.0)
Total 1 60.3% (0.0-100.0) 1 39.7% (0.0-100.0) 2 100.0% (_-_)
Currently Employed
Yes 0 . (.-.) 1 100.0% (100.0-100.0) 1 39.7% (0.0-100.0)
No 1 100.0% (100.0-100.0) 0 . (.-.) 1 60.3% (0.0-100.0)
Total 1 60.3% (0.0-100.0) 1 39.7% (0.0-100.0) 2 100.0% (_-_)

Nevada Department of Employment, Training and Rehabilitation
Federal Fiscal Year 2013 Transition Student Satisfaction Survey
76
Q6Aa. Ever offered an opportunity to participate in: Technical or trade school
Yes No Don't Know/Refused Total
N % C.I.(95%) N % C.I.(95%) N % C.I.(95%) N % C.I.(95%)
Overall Total Total 24 22.4% (13.4-31.4) 83 76.1% (67.0-85.2) 2 1.5% (0.0-3.6) 109 100.0% (_-_)
Gender
Female 8 16.8% (5.6-28.1) 36 83.2% (71.9-94.4) 0 . (.-.) 44 42.5% (32.4-52.7)
Male 16 26.5% (13.6-39.5) 47 70.9% (57.8-84.0) 2 2.6% (0.0-6.3) 65 57.5% (47.3-67.6)
Total 24 22.4% (13.4-31.4) 83 76.1% (67.0-85.2) 2 1.5% (0.0-3.6) 109 100.0% (_-_)
Age
<=18 3 42.3% (3.9-80.7) 5 57.7% (19.3-96.1) 0 . (.-.) 8 13.7% (4.3-23.1)
Age 19 or older 21 19.3% (11.4-27.1) 78 79.0% (70.9-87.1) 2 1.7% (0.0-4.2) 101 86.3% (76.9-95.7)
Total 24 22.4% (13.4-31.4) 83 76.1% (67.0-85.2) 2 1.5% (0.0-3.6) 109 100.0% (_-_)
Race
White 13 25.4% (13.0-37.8) 34 70.9% (57.9-83.9) 2 3.7% (0.0-9.0) 49 39.9% (30.2-49.7)
Non White 11 20.4% (8.0-32.9) 49 79.6% (67.1-92.0) 0 . (.-.) 60 60.1% (50.3-69.8)
Total 24 22.4% (13.4-31.4) 83 76.1% (67.0-85.2) 2 1.5% (0.0-3.6) 109 100.0% (_-_)
Region
South NV 14 21.4% (10.3-32.5) 59 77.3% (66.1-88.5) 1 1.3% (0.0-3.7) 74 72.9% (64.4-81.4)
North NV 5 25.1% (5.1-45.0) 14 74.9% (55.0-94.9) 0 . (.-.) 19 15.2% (8.5-21.8)
Rural NV 5 24.9% (4.3-45.5) 10 70.3% (48.2-92.4) 1 4.8% (0.0-14.2) 16 12.0% (5.9-18.0)
Total 24 22.4% (13.4-31.4) 83 76.1% (67.0-85.2) 2 1.5% (0.0-3.6) 109 100.0% (_-_)
Participated in on-the-job training
Yes 13 26.6% (12.7-40.6) 27 70.9% (56.5-85.4) 1 2.4% (0.0-7.3) 41 67.8% (53.7-81.9)
No 7 47.7% (20.0-75.4) 11 52.3% (24.6-80.0) 0 . (.-.) 18 32.2% (18.1-46.3)
Total 20 33.4% (19.4-47.5) 38 64.9% (50.8-79.1) 1 1.7% (0.0-5.0) 59 100.0% (_-_)
Participated in Job Corps
Yes 4 46.6% (11.5-81.7) 5 53.4% (18.3-88.5) . . . 9 22.4% (7.7-37.0)
No 10 37.6% (14.9-60.2) 15 62.4% (39.8-85.1) . . . 25 77.6% (63.0-92.3)
Total 14 39.6% (20.2-58.9) 20 60.4% (41.1-79.8) . . . 34 100.0% (_-_)
Currently Employed
Yes 16 25.7% (13.6-37.8) 45 71.7% (59.3-84.1) 2 2.6% (0.0-6.4) 63 57.3% (47.0-67.6)
No 8 18.5% (5.0-31.9) 37 81.5% (68.1-95.0) 0 . (.-.) 45 42.7% (32.4-53.0)
Total 24 22.6% (13.6-31.7) 82 75.9% (66.7-85.0) 2 1.5% (0.0-3.7) 108 100.0% (_-_)
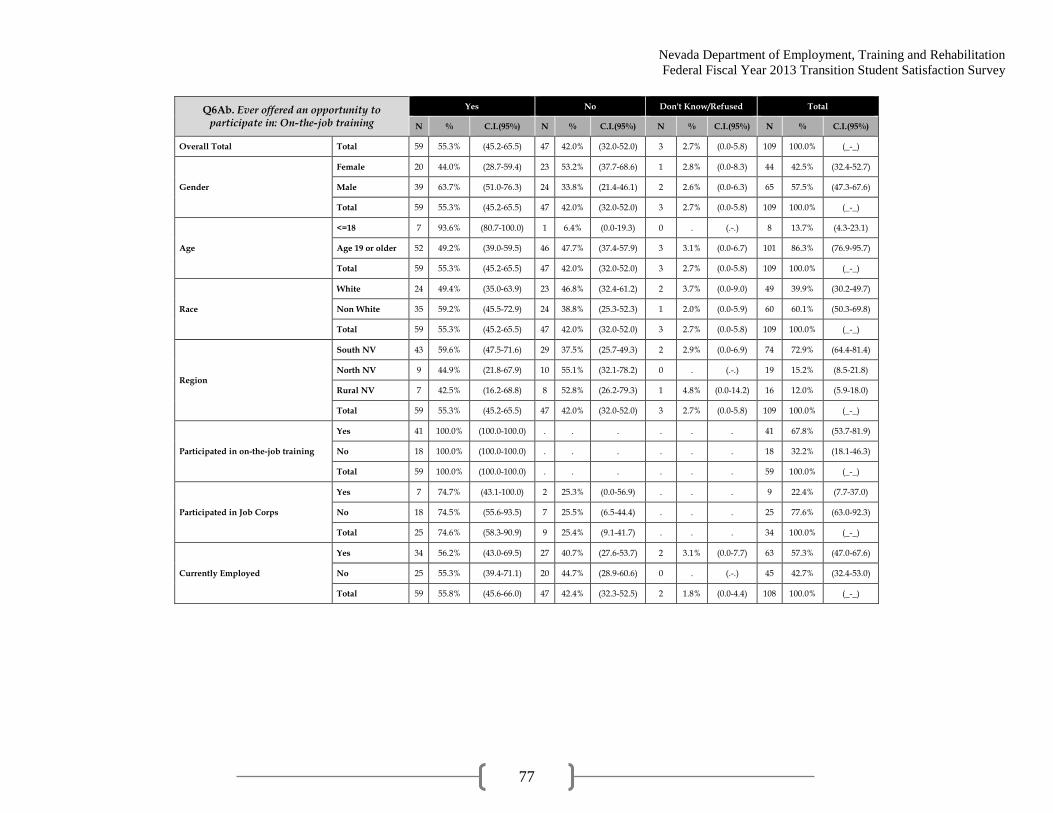
Nevada Department of Employment, Training and Rehabilitation
Federal Fiscal Year 2013 Transition Student Satisfaction Survey
77
Q6Ab. Ever offered an opportunity to participate in: On-the-job training
Yes No Don't Know/Refused Total
N % C.I.(95%) N % C.I.(95%) N % C.I.(95%) N % C.I.(95%)
Overall Total Total 59 55.3% (45.2-65.5) 47 42.0% (32.0-52.0) 3 2.7% (0.0-5.8) 109 100.0% (_-_)
Gender
Female 20 44.0% (28.7-59.4) 23 53.2% (37.7-68.6) 1 2.8% (0.0-8.3) 44 42.5% (32.4-52.7)
Male 39 63.7% (51.0-76.3) 24 33.8% (21.4-46.1) 2 2.6% (0.0-6.3) 65 57.5% (47.3-67.6)
Total 59 55.3% (45.2-65.5) 47 42.0% (32.0-52.0) 3 2.7% (0.0-5.8) 109 100.0% (_-_)
Age
<=18 7 93.6% (80.7-100.0) 1 6.4% (0.0-19.3) 0 . (.-.) 8 13.7% (4.3-23.1)
Age 19 or older 52 49.2% (39.0-59.5) 46 47.7% (37.4-57.9) 3 3.1% (0.0-6.7) 101 86.3% (76.9-95.7)
Total 59 55.3% (45.2-65.5) 47 42.0% (32.0-52.0) 3 2.7% (0.0-5.8) 109 100.0% (_-_)
Race
White 24 49.4% (35.0-63.9) 23 46.8% (32.4-61.2) 2 3.7% (0.0-9.0) 49 39.9% (30.2-49.7)
Non White 35 59.2% (45.5-72.9) 24 38.8% (25.3-52.3) 1 2.0% (0.0-5.9) 60 60.1% (50.3-69.8)
Total 59 55.3% (45.2-65.5) 47 42.0% (32.0-52.0) 3 2.7% (0.0-5.8) 109 100.0% (_-_)
Region
South NV 43 59.6% (47.5-71.6) 29 37.5% (25.7-49.3) 2 2.9% (0.0-6.9) 74 72.9% (64.4-81.4)
North NV 9 44.9% (21.8-67.9) 10 55.1% (32.1-78.2) 0 . (.-.) 19 15.2% (8.5-21.8)
Rural NV 7 42.5% (16.2-68.8) 8 52.8% (26.2-79.3) 1 4.8% (0.0-14.2) 16 12.0% (5.9-18.0)
Total 59 55.3% (45.2-65.5) 47 42.0% (32.0-52.0) 3 2.7% (0.0-5.8) 109 100.0% (_-_)
Participated in on-the-job training
Yes 41 100.0% (100.0-100.0) . . . . . . 41 67.8% (53.7-81.9)
No 18 100.0% (100.0-100.0) . . . . . . 18 32.2% (18.1-46.3)
Total 59 100.0% (100.0-100.0) . . . . . . 59 100.0% (_-_)
Participated in Job Corps
Yes 7 74.7% (43.1-100.0) 2 25.3% (0.0-56.9) . . . 9 22.4% (7.7-37.0)
No 18 74.5% (55.6-93.5) 7 25.5% (6.5-44.4) . . . 25 77.6% (63.0-92.3)
Total 25 74.6% (58.3-90.9) 9 25.4% (9.1-41.7) . . . 34 100.0% (_-_)
Currently Employed
Yes 34 56.2% (43.0-69.5) 27 40.7% (27.6-53.7) 2 3.1% (0.0-7.7) 63 57.3% (47.0-67.6)
No 25 55.3% (39.4-71.1) 20 44.7% (28.9-60.6) 0 . (.-.) 45 42.7% (32.4-53.0)
Total 59 55.8% (45.6-66.0) 47 42.4% (32.3-52.5) 2 1.8% (0.0-4.4) 108 100.0% (_-_)
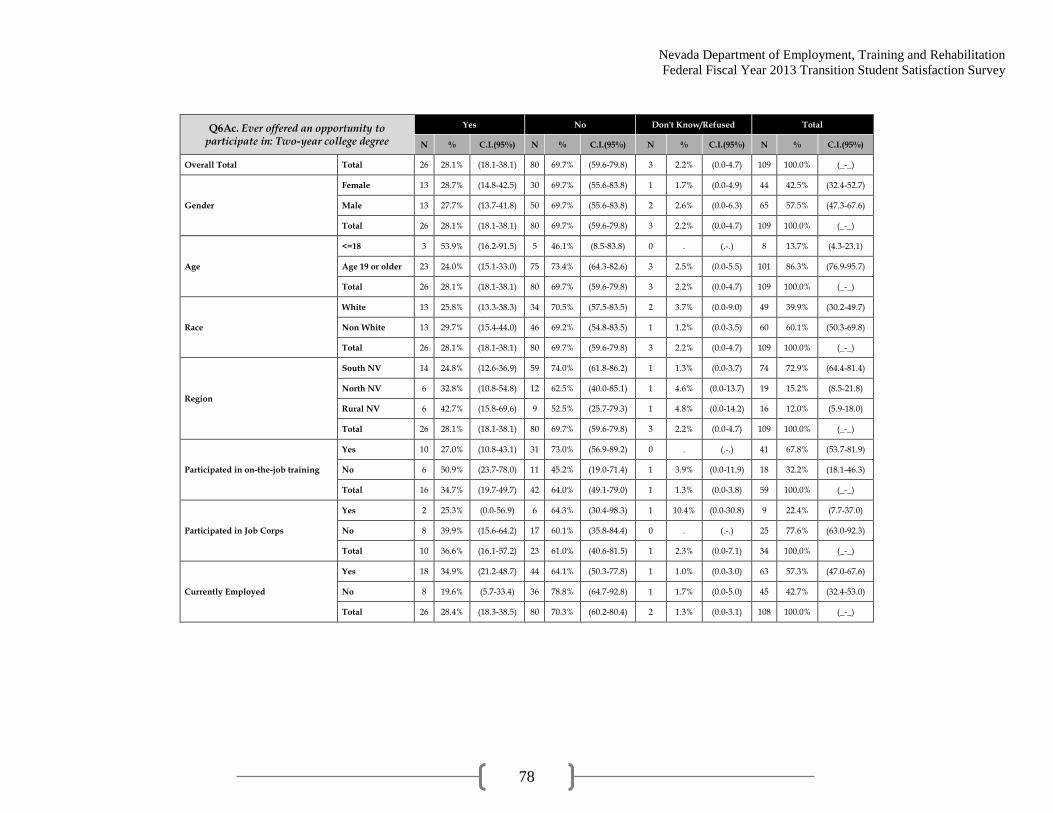
Nevada Department of Employment, Training and Rehabilitation
Federal Fiscal Year 2013 Transition Student Satisfaction Survey
78
Q6Ac. Ever offered an opportunity to participate in: Two-year college degree
Yes No Don't Know/Refused Total
N % C.I.(95%) N % C.I.(95%) N % C.I.(95%) N % C.I.(95%)
Overall Total Total 26 28.1% (18.1-38.1) 80 69.7% (59.6-79.8) 3 2.2% (0.0-4.7) 109 100.0% (_-_)
Gender
Female 13 28.7% (14.8-42.5) 30 69.7% (55.6-83.8) 1 1.7% (0.0-4.9) 44 42.5% (32.4-52.7)
Male 13 27.7% (13.7-41.8) 50 69.7% (55.6-83.8) 2 2.6% (0.0-6.3) 65 57.5% (47.3-67.6)
Total 26 28.1% (18.1-38.1) 80 69.7% (59.6-79.8) 3 2.2% (0.0-4.7) 109 100.0% (_-_)
Age
<=18 3 53.9% (16.2-91.5) 5 46.1% (8.5-83.8) 0 . (.-.) 8 13.7% (4.3-23.1)
Age 19 or older 23 24.0% (15.1-33.0) 75 73.4% (64.3-82.6) 3 2.5% (0.0-5.5) 101 86.3% (76.9-95.7)
Total 26 28.1% (18.1-38.1) 80 69.7% (59.6-79.8) 3 2.2% (0.0-4.7) 109 100.0% (_-_)
Race
White 13 25.8% (13.3-38.3) 34 70.5% (57.5-83.5) 2 3.7% (0.0-9.0) 49 39.9% (30.2-49.7)
Non White 13 29.7% (15.4-44.0) 46 69.2% (54.8-83.5) 1 1.2% (0.0-3.5) 60 60.1% (50.3-69.8)
Total 26 28.1% (18.1-38.1) 80 69.7% (59.6-79.8) 3 2.2% (0.0-4.7) 109 100.0% (_-_)
Region
South NV 14 24.8% (12.6-36.9) 59 74.0% (61.8-86.2) 1 1.3% (0.0-3.7) 74 72.9% (64.4-81.4)
North NV 6 32.8% (10.8-54.8) 12 62.5% (40.0-85.1) 1 4.6% (0.0-13.7) 19 15.2% (8.5-21.8)
Rural NV 6 42.7% (15.8-69.6) 9 52.5% (25.7-79.3) 1 4.8% (0.0-14.2) 16 12.0% (5.9-18.0)
Total 26 28.1% (18.1-38.1) 80 69.7% (59.6-79.8) 3 2.2% (0.0-4.7) 109 100.0% (_-_)
Participated in on-the-job training
Yes 10 27.0% (10.8-43.1) 31 73.0% (56.9-89.2) 0 . (.-.) 41 67.8% (53.7-81.9)
No 6 50.9% (23.7-78.0) 11 45.2% (19.0-71.4) 1 3.9% (0.0-11.9) 18 32.2% (18.1-46.3)
Total 16 34.7% (19.7-49.7) 42 64.0% (49.1-79.0) 1 1.3% (0.0-3.8) 59 100.0% (_-_)
Participated in Job Corps
Yes 2 25.3% (0.0-56.9) 6 64.3% (30.4-98.3) 1 10.4% (0.0-30.8) 9 22.4% (7.7-37.0)
No 8 39.9% (15.6-64.2) 17 60.1% (35.8-84.4) 0 . (.-.) 25 77.6% (63.0-92.3)
Total 10 36.6% (16.1-57.2) 23 61.0% (40.6-81.5) 1 2.3% (0.0-7.1) 34 100.0% (_-_)
Currently Employed
Yes 18 34.9% (21.2-48.7) 44 64.1% (50.3-77.8) 1 1.0% (0.0-3.0) 63 57.3% (47.0-67.6)
No 8 19.6% (5.7-33.4) 36 78.8% (64.7-92.8) 1 1.7% (0.0-5.0) 45 42.7% (32.4-53.0)
Total 26 28.4% (18.3-38.5) 80 70.3% (60.2-80.4) 2 1.3% (0.0-3.1) 108 100.0% (_-_)

Nevada Department of Employment, Training and Rehabilitation
Federal Fiscal Year 2013 Transition Student Satisfaction Survey
79
Q6Ad. Ever offered an opportunity to participate in: Four-year college degree
Yes No Don't Know/Refused Total
N % C.I.(95%) N % C.I.(95%) N % C.I.(95%) N % C.I.(95%)
Overall Total Total 20 18.7% (10.6-26.9) 86 78.8% (70.3-87.3) 3 2.5% (0.0-5.4) 109 100.0% (_-_)
Gender
Female 9 19.3% (7.3-31.3) 33 76.2% (63.2-89.2) 2 4.5% (0.0-10.8) 44 42.5% (32.4-52.7)
Male 11 18.3% (7.2-29.4) 53 80.7% (69.5-91.9) 1 1.0% (0.0-3.0) 65 57.5% (47.3-67.6)
Total 20 18.7% (10.6-26.9) 86 78.8% (70.3-87.3) 3 2.5% (0.0-5.4) 109 100.0% (_-_)
Age
<=18 1 18.0% (0.0-49.7) 7 82.0% (50.3-100.0) 0 . (.-.) 8 13.7% (4.3-23.1)
Age 19 or older 19 18.9% (10.8-26.9) 79 78.3% (69.8-86.7) 3 2.9% (0.0-6.3) 101 86.3% (76.9-95.7)
Total 20 18.7% (10.6-26.9) 86 78.8% (70.3-87.3) 3 2.5% (0.0-5.4) 109 100.0% (_-_)
Race
White 12 24.1% (11.8-36.3) 36 74.5% (62.1-87.0) 1 1.4% (0.0-4.3) 49 39.9% (30.2-49.7)
Non White 8 15.2% (4.4-26.0) 50 81.6% (70.2-93.1) 2 3.2% (0.0-7.7) 60 60.1% (50.3-69.8)
Total 20 18.7% (10.6-26.9) 86 78.8% (70.3-87.3) 3 2.5% (0.0-5.4) 109 100.0% (_-_)
Region
South NV 13 18.6% (8.6-28.7) 60 79.7% (69.4-90.1) 1 1.6% (0.0-4.9) 74 72.9% (64.4-81.4)
North NV 3 17.7% (0.0-36.0) 15 77.7% (58.0-97.4) 1 4.6% (0.0-13.7) 19 15.2% (8.5-21.8)
Rural NV 4 20.6% (1.4-39.9) 11 74.6% (53.7-95.5) 1 4.8% (0.0-14.2) 16 12.0% (5.9-18.0)
Total 20 18.7% (10.6-26.9) 86 78.8% (70.3-87.3) 3 2.5% (0.0-5.4) 109 100.0% (_-_)
Participated in on-the-job training
Yes 8 20.8% (5.8-35.8) 32 76.0% (60.4-91.7) 1 3.2% (0.0-9.5) 41 67.8% (53.7-81.9)
No 3 16.3% (0.0-34.5) 14 79.7% (60.2-99.3) 1 3.9% (0.0-11.9) 18 32.2% (18.1-46.3)
Total 11 19.3% (7.5-31.2) 46 77.2% (64.8-89.6) 2 3.4% (0.0-8.4) 59 100.0% (_-_)
Participated in Job Corps
Yes 2 25.3% (0.0-56.9) 6 64.3% (30.4-98.3) 1 10.4% (0.0-30.8) 9 22.4% (7.7-37.0)
No 9 34.9% (12.4-57.4) 16 65.1% (42.6-87.6) 0 . (.-.) 25 77.6% (63.0-92.3)
Total 11 32.7% (13.8-51.6) 22 65.0% (45.9-84.0) 1 2.3% (0.0-7.1) 34 100.0% (_-_)
Currently Employed
Yes 13 22.9% (10.9-34.9) 48 74.0% (61.6-86.4) 2 3.1% (0.0-7.7) 63 57.3% (47.0-67.6)
No 6 11.4% (2.2-20.5) 38 87.0% (77.3-96.6) 1 1.7% (0.0-5.0) 45 42.7% (32.4-53.0)
Total 19 18.0% (9.9-26.1) 86 79.5% (71.1-88.0) 3 2.5% (0.0-5.5) 108 100.0% (_-_)
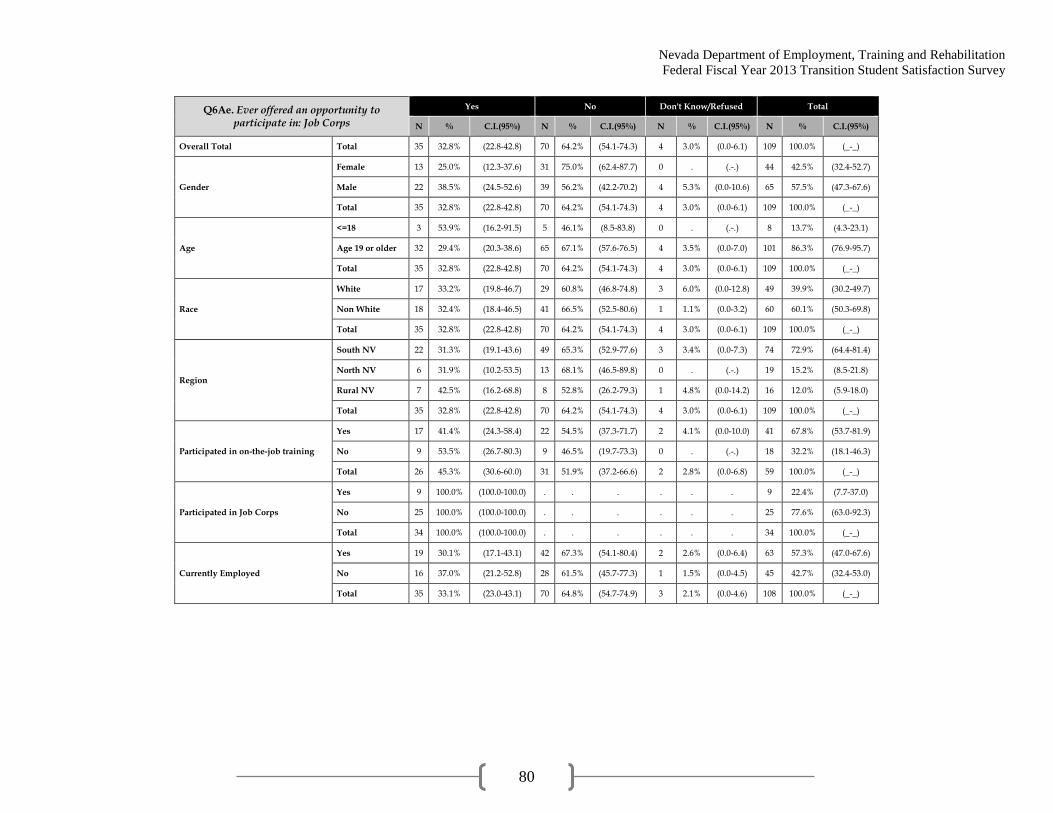
Nevada Department of Employment, Training and Rehabilitation
Federal Fiscal Year 2013 Transition Student Satisfaction Survey
80
Q6Ae. Ever offered an opportunity to participate in: Job Corps
Yes No Don't Know/Refused Total
N % C.I.(95%) N % C.I.(95%) N % C.I.(95%) N % C.I.(95%)
Overall Total Total 35 32.8% (22.8-42.8) 70 64.2% (54.1-74.3) 4 3.0% (0.0-6.1) 109 100.0% (_-_)
Gender
Female 13 25.0% (12.3-37.6) 31 75.0% (62.4-87.7) 0 . (.-.) 44 42.5% (32.4-52.7)
Male 22 38.5% (24.5-52.6) 39 56.2% (42.2-70.2) 4 5.3% (0.0-10.6) 65 57.5% (47.3-67.6)
Total 35 32.8% (22.8-42.8) 70 64.2% (54.1-74.3) 4 3.0% (0.0-6.1) 109 100.0% (_-_)
Age
<=18 3 53.9% (16.2-91.5) 5 46.1% (8.5-83.8) 0 . (.-.) 8 13.7% (4.3-23.1)
Age 19 or older 32 29.4% (20.3-38.6) 65 67.1% (57.6-76.5) 4 3.5% (0.0-7.0) 101 86.3% (76.9-95.7)
Total 35 32.8% (22.8-42.8) 70 64.2% (54.1-74.3) 4 3.0% (0.0-6.1) 109 100.0% (_-_)
Race
White 17 33.2% (19.8-46.7) 29 60.8% (46.8-74.8) 3 6.0% (0.0-12.8) 49 39.9% (30.2-49.7)
Non White 18 32.4% (18.4-46.5) 41 66.5% (52.5-80.6) 1 1.1% (0.0-3.2) 60 60.1% (50.3-69.8)
Total 35 32.8% (22.8-42.8) 70 64.2% (54.1-74.3) 4 3.0% (0.0-6.1) 109 100.0% (_-_)
Region
South NV 22 31.3% (19.1-43.6) 49 65.3% (52.9-77.6) 3 3.4% (0.0-7.3) 74 72.9% (64.4-81.4)
North NV 6 31.9% (10.2-53.5) 13 68.1% (46.5-89.8) 0 . (.-.) 19 15.2% (8.5-21.8)
Rural NV 7 42.5% (16.2-68.8) 8 52.8% (26.2-79.3) 1 4.8% (0.0-14.2) 16 12.0% (5.9-18.0)
Total 35 32.8% (22.8-42.8) 70 64.2% (54.1-74.3) 4 3.0% (0.0-6.1) 109 100.0% (_-_)
Participated in on-the-job training
Yes 17 41.4% (24.3-58.4) 22 54.5% (37.3-71.7) 2 4.1% (0.0-10.0) 41 67.8% (53.7-81.9)
No 9 53.5% (26.7-80.3) 9 46.5% (19.7-73.3) 0 . (.-.) 18 32.2% (18.1-46.3)
Total 26 45.3% (30.6-60.0) 31 51.9% (37.2-66.6) 2 2.8% (0.0-6.8) 59 100.0% (_-_)
Participated in Job Corps
Yes 9 100.0% (100.0-100.0) . . . . . . 9 22.4% (7.7-37.0)
No 25 100.0% (100.0-100.0) . . . . . . 25 77.6% (63.0-92.3)
Total 34 100.0% (100.0-100.0) . . . . . . 34 100.0% (_-_)
Currently Employed
Yes 19 30.1% (17.1-43.1) 42 67.3% (54.1-80.4) 2 2.6% (0.0-6.4) 63 57.3% (47.0-67.6)
No 16 37.0% (21.2-52.8) 28 61.5% (45.7-77.3) 1 1.5% (0.0-4.5) 45 42.7% (32.4-53.0)
Total 35 33.1% (23.0-43.1) 70 64.8% (54.7-74.9) 3 2.1% (0.0-4.6) 108 100.0% (_-_)
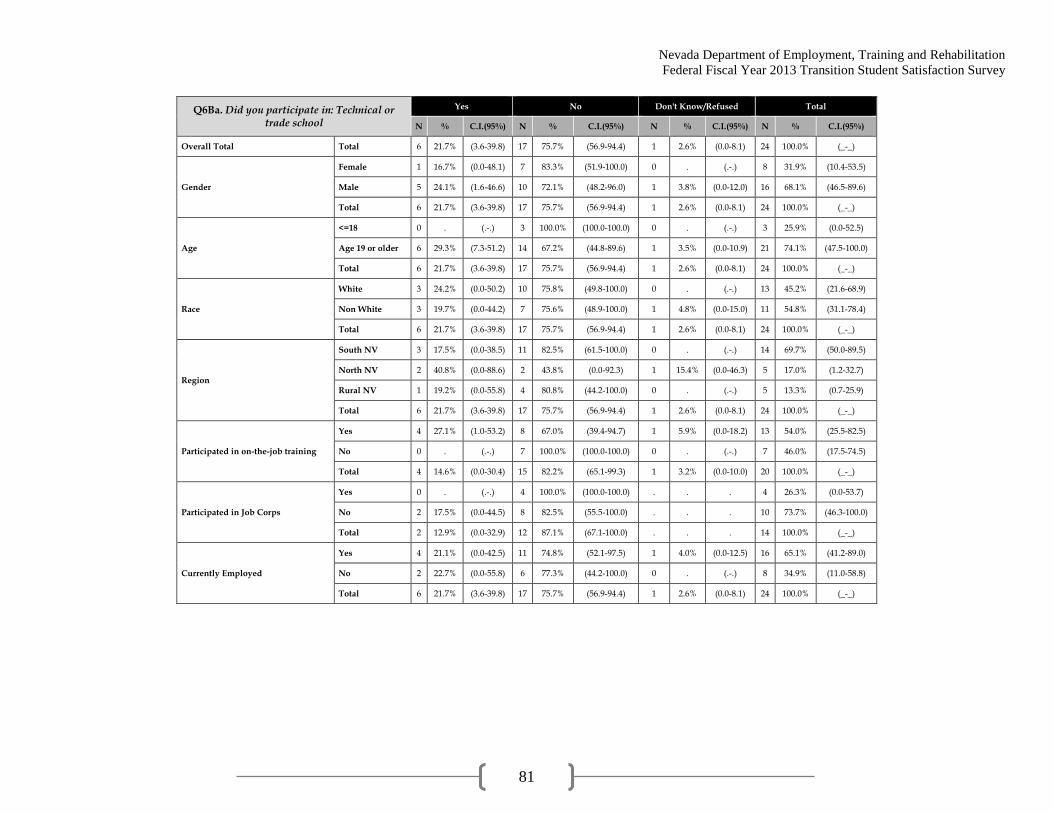
Nevada Department of Employment, Training and Rehabilitation
Federal Fiscal Year 2013 Transition Student Satisfaction Survey
81
Q6Ba. Did you participate in: Technical or trade school
Yes No Don't Know/Refused Total
N % C.I.(95%) N % C.I.(95%) N % C.I.(95%) N % C.I.(95%)
Overall Total Total 6 21.7% (3.6-39.8) 17 75.7% (56.9-94.4) 1 2.6% (0.0-8.1) 24 100.0% (_-_)
Gender
Female 1 16.7% (0.0-48.1) 7 83.3% (51.9-100.0) 0 . (.-.) 8 31.9% (10.4-53.5)
Male 5 24.1% (1.6-46.6) 10 72.1% (48.2-96.0) 1 3.8% (0.0-12.0) 16 68.1% (46.5-89.6)
Total 6 21.7% (3.6-39.8) 17 75.7% (56.9-94.4) 1 2.6% (0.0-8.1) 24 100.0% (_-_)
Age
<=18 0 . (.-.) 3 100.0% (100.0-100.0) 0 . (.-.) 3 25.9% (0.0-52.5)
Age 19 or older 6 29.3% (7.3-51.2) 14 67.2% (44.8-89.6) 1 3.5% (0.0-10.9) 21 74.1% (47.5-100.0)
Total 6 21.7% (3.6-39.8) 17 75.7% (56.9-94.4) 1 2.6% (0.0-8.1) 24 100.0% (_-_)
Race
White 3 24.2% (0.0-50.2) 10 75.8% (49.8-100.0) 0 . (.-.) 13 45.2% (21.6-68.9)
Non White 3 19.7% (0.0-44.2) 7 75.6% (48.9-100.0) 1 4.8% (0.0-15.0) 11 54.8% (31.1-78.4)
Total 6 21.7% (3.6-39.8) 17 75.7% (56.9-94.4) 1 2.6% (0.0-8.1) 24 100.0% (_-_)
Region
South NV 3 17.5% (0.0-38.5) 11 82.5% (61.5-100.0) 0 . (.-.) 14 69.7% (50.0-89.5)
North NV 2 40.8% (0.0-88.6) 2 43.8% (0.0-92.3) 1 15.4% (0.0-46.3) 5 17.0% (1.2-32.7)
Rural NV 1 19.2% (0.0-55.8) 4 80.8% (44.2-100.0) 0 . (.-.) 5 13.3% (0.7-25.9)
Total 6 21.7% (3.6-39.8) 17 75.7% (56.9-94.4) 1 2.6% (0.0-8.1) 24 100.0% (_-_)
Participated in on-the-job training
Yes 4 27.1% (1.0-53.2) 8 67.0% (39.4-94.7) 1 5.9% (0.0-18.2) 13 54.0% (25.5-82.5)
No 0 . (.-.) 7 100.0% (100.0-100.0) 0 . (.-.) 7 46.0% (17.5-74.5)
Total 4 14.6% (0.0-30.4) 15 82.2% (65.1-99.3) 1 3.2% (0.0-10.0) 20 100.0% (_-_)
Participated in Job Corps
Yes 0 . (.-.) 4 100.0% (100.0-100.0) . . . 4 26.3% (0.0-53.7)
No 2 17.5% (0.0-44.5) 8 82.5% (55.5-100.0) . . . 10 73.7% (46.3-100.0)
Total 2 12.9% (0.0-32.9) 12 87.1% (67.1-100.0) . . . 14 100.0% (_-_)
Currently Employed
Yes 4 21.1% (0.0-42.5) 11 74.8% (52.1-97.5) 1 4.0% (0.0-12.5) 16 65.1% (41.2-89.0)
No 2 22.7% (0.0-55.8) 6 77.3% (44.2-100.0) 0 . (.-.) 8 34.9% (11.0-58.8)
Total 6 21.7% (3.6-39.8) 17 75.7% (56.9-94.4) 1 2.6% (0.0-8.1) 24 100.0% (_-_)

Nevada Department of Employment, Training and Rehabilitation
Federal Fiscal Year 2013 Transition Student Satisfaction Survey
82
Q6Bb. Did you participate in: On-the-job training
Yes No Total
N % C.I.(95%) N % C.I.(95%) N % C.I.(95%)
Overall Total Total 41 67.8% (53.7-81.9) 18 32.2% (18.1-46.3) 59 100.0% (_-_)
Gender
Female 14 74.9% (55.8-93.9) 6 25.1% (6.1-44.2) 20 33.9% (20.5-47.2)
Male 27 64.2% (45.6-82.8) 12 35.8% (17.2-54.4) 39 66.1% (52.8-79.5)
Total 41 67.8% (53.7-81.9) 18 32.2% (18.1-46.3) 59 100.0% (_-_)
Age
<=18 4 54.8% (13.8-95.8) 3 45.2% (4.2-86.2) 7 23.2% (7.7-38.7)
Age 19 or older 37 71.7% (58.7-84.7) 15 28.3% (15.3-41.3) 52 76.8% (61.3-92.3)
Total 41 67.8% (53.7-81.9) 18 32.2% (18.1-46.3) 59 100.0% (_-_)
Race
White 15 64.3% (44.4-84.1) 9 35.7% (15.9-55.6) 24 35.7% (22.5-48.8)
Non White 26 69.8% (50.7-88.9) 9 30.2% (11.1-49.3) 35 64.3% (51.2-77.5)
Total 41 67.8% (53.7-81.9) 18 32.2% (18.1-46.3) 59 100.0% (_-_)
Region
South NV 32 72.0% (55.7-88.3) 11 28.0% (11.7-44.3) 43 78.5% (67.9-89.1)
North NV 6 64.5% (31.3-97.7) 3 35.5% (2.3-68.7) 9 12.3% (4.1-20.5)
Rural NV 3 36.2% (0.0-73.1) 4 63.8% (26.9-100.0) 7 9.2% (1.9-16.5)
Total 41 67.8% (53.7-81.9) 18 32.2% (18.1-46.3) 59 100.0% (_-_)
Participated in on-the-job training
Yes 41 100.0% (100.0-100.0) 0 . (.-.) 41 67.8% (53.7-81.9)
No 0 . (.-.) 18 100.0% (100.0-100.0) 18 32.2% (18.1-46.3)
Total 41 67.8% (53.7-81.9) 18 32.2% (18.1-46.3) 59 100.0% (_-_)
Participated in Job Corps
Yes 3 49.7% (9.1-90.3) 4 50.3% (9.7-90.9) 7 22.4% (5.1-39.6)
No 14 74.2% (47.0-100.0) 4 25.8% (0.0-53.0) 18 77.6% (60.4-94.9)
Total 17 68.7% (45.9-91.5) 8 31.3% (8.5-54.1) 25 100.0% (_-_)
Currently Employed
Yes 26 73.7% (55.7-91.7) 8 26.3% (8.3-44.3) 34 57.7% (43.2-72.2)
No 15 59.8% (37.3-82.2) 10 40.2% (17.8-62.7) 25 42.3% (27.8-56.8)
Total 41 67.8% (53.7-81.9) 18 32.2% (18.1-46.3) 59 100.0% (_-_)
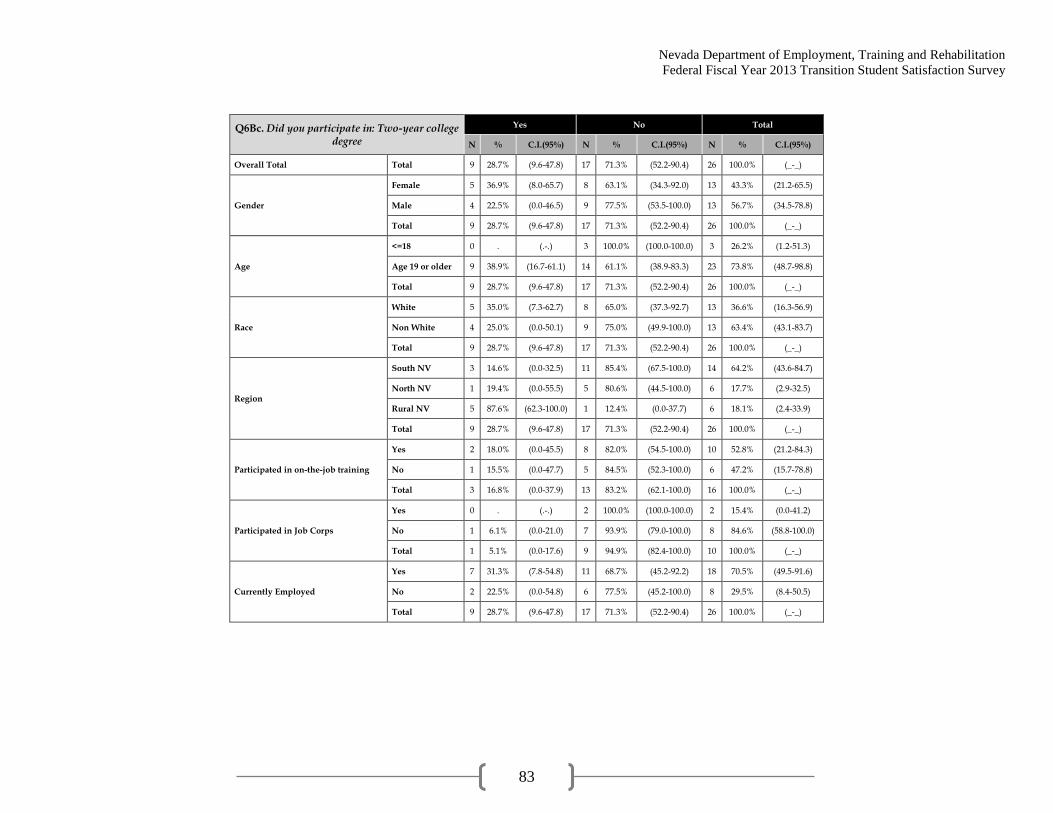
Nevada Department of Employment, Training and Rehabilitation
Federal Fiscal Year 2013 Transition Student Satisfaction Survey
83
Q6Bc. Did you participate in: Two-year college degree
Yes No Total
N % C.I.(95%) N % C.I.(95%) N % C.I.(95%)
Overall Total Total 9 28.7% (9.6-47.8) 17 71.3% (52.2-90.4) 26 100.0% (_-_)
Gender
Female 5 36.9% (8.0-65.7) 8 63.1% (34.3-92.0) 13 43.3% (21.2-65.5)
Male 4 22.5% (0.0-46.5) 9 77.5% (53.5-100.0) 13 56.7% (34.5-78.8)
Total 9 28.7% (9.6-47.8) 17 71.3% (52.2-90.4) 26 100.0% (_-_)
Age
<=18 0 . (.-.) 3 100.0% (100.0-100.0) 3 26.2% (1.2-51.3)
Age 19 or older 9 38.9% (16.7-61.1) 14 61.1% (38.9-83.3) 23 73.8% (48.7-98.8)
Total 9 28.7% (9.6-47.8) 17 71.3% (52.2-90.4) 26 100.0% (_-_)
Race
White 5 35.0% (7.3-62.7) 8 65.0% (37.3-92.7) 13 36.6% (16.3-56.9)
Non White 4 25.0% (0.0-50.1) 9 75.0% (49.9-100.0) 13 63.4% (43.1-83.7)
Total 9 28.7% (9.6-47.8) 17 71.3% (52.2-90.4) 26 100.0% (_-_)
Region
South NV 3 14.6% (0.0-32.5) 11 85.4% (67.5-100.0) 14 64.2% (43.6-84.7)
North NV 1 19.4% (0.0-55.5) 5 80.6% (44.5-100.0) 6 17.7% (2.9-32.5)
Rural NV 5 87.6% (62.3-100.0) 1 12.4% (0.0-37.7) 6 18.1% (2.4-33.9)
Total 9 28.7% (9.6-47.8) 17 71.3% (52.2-90.4) 26 100.0% (_-_)
Participated in on-the-job training
Yes 2 18.0% (0.0-45.5) 8 82.0% (54.5-100.0) 10 52.8% (21.2-84.3)
No 1 15.5% (0.0-47.7) 5 84.5% (52.3-100.0) 6 47.2% (15.7-78.8)
Total 3 16.8% (0.0-37.9) 13 83.2% (62.1-100.0) 16 100.0% (_-_)
Participated in Job Corps
Yes 0 . (.-.) 2 100.0% (100.0-100.0) 2 15.4% (0.0-41.2)
No 1 6.1% (0.0-21.0) 7 93.9% (79.0-100.0) 8 84.6% (58.8-100.0)
Total 1 5.1% (0.0-17.6) 9 94.9% (82.4-100.0) 10 100.0% (_-_)
Currently Employed
Yes 7 31.3% (7.8-54.8) 11 68.7% (45.2-92.2) 18 70.5% (49.5-91.6)
No 2 22.5% (0.0-54.8) 6 77.5% (45.2-100.0) 8 29.5% (8.4-50.5)
Total 9 28.7% (9.6-47.8) 17 71.3% (52.2-90.4) 26 100.0% (_-_)

Nevada Department of Employment, Training and Rehabilitation
Federal Fiscal Year 2013 Transition Student Satisfaction Survey
84
Q6Bd. Did you participate in: Four-year college degree
Yes No Don't Know/Refused Total
N % C.I.(95%) N % C.I.(95%) N % C.I.(95%) N % C.I.(95%)
Overall Total Total 4 17.4% (0.0-35.2) 15 77.7% (57.9-97.6) 1 4.9% (0.0-15.1) 20 100.0% (_-_)
Gender
Female 2 16.8% (0.0-41.1) 7 83.2% (58.9-100.0) 0 . (.-.) 9 43.8% (18.2-69.5)
Male 2 17.9% (0.0-43.2) 8 73.5% (43.7-100.0) 1 8.7% (0.0-26.8) 11 56.2% (30.5-81.8)
Total 4 17.4% (0.0-35.2) 15 77.7% (57.9-97.6) 1 4.9% (0.0-15.1) 20 100.0% (_-_)
Age
<=18 0 . (.-.) 1 100.0% (100.0-100.0) 0 . (.-.) 1 13.1% (0.0-38.3)
Age 19 or older 4 20.0% (0.3-39.7) 14 74.4% (52.7-96.1) 1 5.6% (0.0-17.3) 19 86.9% (61.7-100.0)
Total 4 17.4% (0.0-35.2) 15 77.7% (57.9-97.6) 1 4.9% (0.0-15.1) 20 100.0% (_-_)
Race
White 4 33.9% (4.0-63.8) 7 56.6% (25.2-87.9) 1 9.5% (0.0-28.8) 12 51.3% (24.9-77.6)
Non White 0 . (.-.) 8 100.0% (100.0-100.0) 0 . (.-.) 8 48.7% (22.4-75.1)
Total 4 17.4% (0.0-35.2) 15 77.7% (57.9-97.6) 1 4.9% (0.0-15.1) 20 100.0% (_-_)
Region
South NV 1 6.7% (0.0-20.8) 11 86.6% (67.0-100.0) 1 6.7% (0.0-20.8) 13 72.5% (51.5-93.5)
North NV 2 63.9% (3.1-100.0) 1 36.1% (0.0-96.9) 0 . (.-.) 3 14.3% (0.0-31.1)
Rural NV 1 25.6% (0.0-72.9) 3 74.4% (27.1-100.0) 0 . (.-.) 4 13.2% (0.0-27.1)
Total 4 17.4% (0.0-35.2) 15 77.7% (57.9-97.6) 1 4.9% (0.0-15.1) 20 100.0% (_-_)
Participated in on-the-job training
Yes 0 . (.-.) 8 100.0% (100.0-100.0) . . . 8 72.8% (39.7-100.0)
No 1 31.4% (0.0-93.4) 2 68.6% (6.6-100.0) . . . 3 27.2% (0.0-60.3)
Total 1 8.5% (0.0-27.9) 10 91.5% (72.1-100.0) . . . 11 100.0% (_-_)
Participated in Job Corps
Yes 1 43.6% (0.0-100.0) 1 56.4% (0.0-100.0) . . . 2 17.3% (0.0-44.4)
No 0 . (.-.) 9 100.0% (100.0-100.0) . . . 9 82.7% (55.6-100.0)
Total 1 7.5% (0.0-24.9) 10 92.5% (75.1-100.0) . . . 11 100.0% (_-_)
Currently Employed
Yes 3 18.0% (0.0-39.8) 10 82.0% (60.2-100.0) . . . 13 73.0% (50.8-95.2)
No 1 19.0% (0.0-55.6) 5 81.0% (44.4-100.0) . . . 6 27.0% (4.8-49.2)
Total 4 18.3% (0.0-37.0) 15 81.7% (63.0-100.0) . . . 19 100.0% (_-_)

Nevada Department of Employment, Training and Rehabilitation
Federal Fiscal Year 2013 Transition Student Satisfaction Survey
85
Q6Be. Did you participate in: Job Corps Yes No Don't Know/Refused Total
N % C.I.(95%) N % C.I.(95%) N % C.I.(95%) N % C.I.(95%)
Overall Total Total 9 20.7% (6.9-34.5) 25 71.8% (53.9-89.7) 1 7.5% (0.0-22.1) 35 100.0% (_-_)
Gender
Female 2 13.7% (0.0-32.5) 11 86.3% (67.5-100.0) 0 . (.-.) 13 32.4% (15.2-49.6)
Male 7 24.0% (5.5-42.6) 14 64.9% (40.5-89.2) 1 11.1% (0.0-32.1) 22 67.6% (50.4-84.8)
Total 9 20.7% (6.9-34.5) 25 71.8% (53.9-89.7) 1 7.5% (0.0-22.1) 35 100.0% (_-_)
Age
<=18 0 . (.-.) 2 66.7% (10.5-100.0) 1 33.3% (0.0-89.5) 3 22.5% (0.7-44.3)
Age 19 or older 9 26.7% (10.4-42.9) 23 73.3% (57.1-89.6) 0 . (.-.) 32 77.5% (55.7-99.3)
Total 9 20.7% (6.9-34.5) 25 71.8% (53.9-89.7) 1 7.5% (0.0-22.1) 35 100.0% (_-_)
Race
White 5 31.4% (7.4-55.4) 12 68.6% (44.6-92.6) 0 . (.-.) 17 40.5% (22.1-58.9)
Non White 4 13.4% (0.0-27.5) 13 74.0% (48.8-99.2) 1 12.6% (0.0-36.2) 18 59.5% (41.1-77.9)
Total 9 20.7% (6.9-34.5) 25 71.8% (53.9-89.7) 1 7.5% (0.0-22.1) 35 100.0% (_-_)
Region
South NV 4 12.3% (0.0-25.2) 17 76.9% (54.7-99.1) 1 10.8% (0.0-31.2) 22 69.8% (53.3-86.3)
North NV 4 70.0% (32.4-100.0) 2 30.0% (0.0-67.6) 0 . (.-.) 6 14.7% (2.7-26.8)
Rural NV 1 11.2% (0.0-33.7) 6 88.8% (66.3-100.0) 0 . (.-.) 7 15.5% (3.1-27.9)
Total 9 20.7% (6.9-34.5) 25 71.8% (53.9-89.7) 1 7.5% (0.0-22.1) 35 100.0% (_-_)
Participated in on-the-job training
Yes 3 16.2% (0.0-35.0) 14 83.8% (65.0-100.0) 0 . (.-.) 17 61.9% (37.8-86.1)
No 4 26.7% (0.0-56.6) 4 47.5% (4.6-90.4) 1 25.8% (0.0-69.5) 9 38.1% (13.9-62.2)
Total 7 20.2% (4.3-36.1) 18 70.0% (48.0-91.9) 1 9.8% (0.0-28.9) 26 100.0% (_-_)
Participated in Job Corps
Yes 9 100.0% (100.0-100.0) 0 . (.-.) . . . 9 22.4% (7.7-37.0)
No 0 . (.-.) 25 100.0% (100.0-100.0) . . . 25 77.6% (63.0-92.3)
Total 9 22.4% (7.7-37.0) 25 77.6% (63.0-92.3) . . . 34 100.0% (_-_)
Currently Employed
Yes 6 26.1% (4.9-47.3) 13 73.9% (52.7-95.1) 0 . (.-.) 19 52.2% (32.4-72.0)
No 3 14.7% (0.0-31.9) 12 69.6% (40.7-98.4) 1 15.7% (0.0-44.0) 16 47.8% (28.0-67.6)
Total 9 20.7% (6.9-34.5) 25 71.8% (53.9-89.7) 1 7.5% (0.0-22.1) 35 100.0% (_-_)
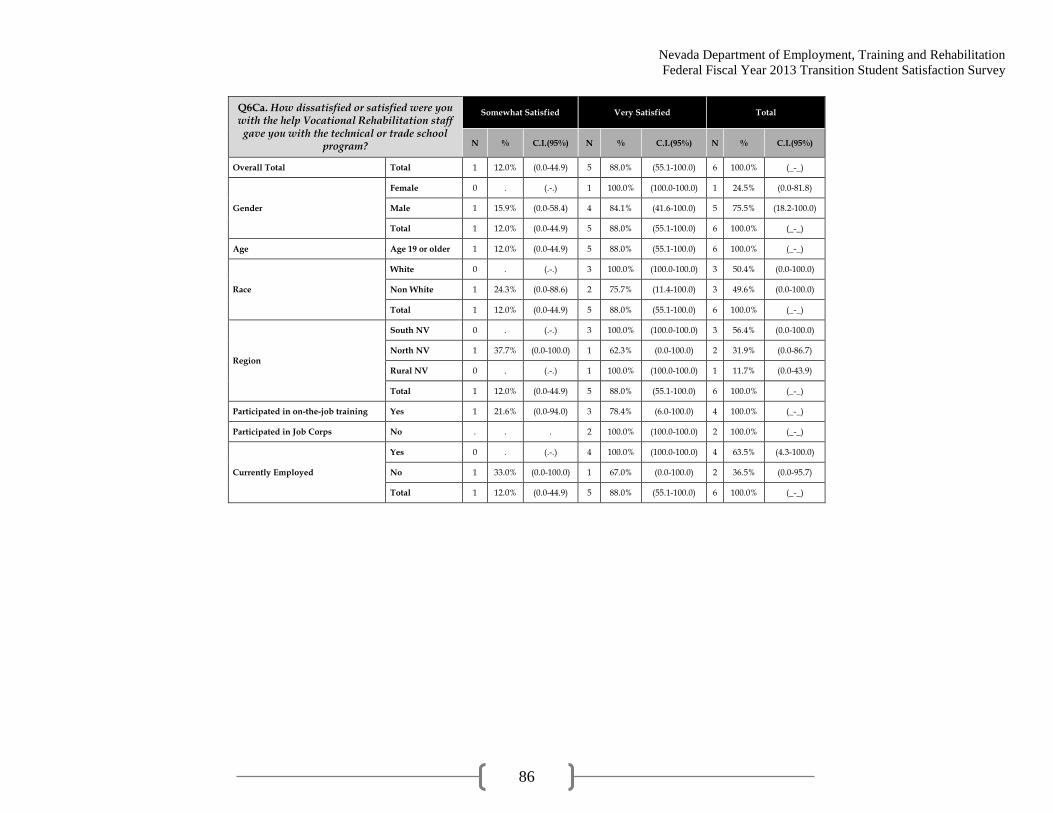
Nevada Department of Employment, Training and Rehabilitation
Federal Fiscal Year 2013 Transition Student Satisfaction Survey
86
Q6Ca. How dissatisfied or satisfied were you with the help Vocational Rehabilitation staff
gave you with the technical or trade school program?
Somewhat Satisfied Very Satisfied Total
N % C.I.(95%) N % C.I.(95%) N % C.I.(95%)
Overall Total Total 1 12.0% (0.0-44.9) 5 88.0% (55.1-100.0) 6 100.0% (_-_)
Gender
Female 0 . (.-.) 1 100.0% (100.0-100.0) 1 24.5% (0.0-81.8)
Male 1 15.9% (0.0-58.4) 4 84.1% (41.6-100.0) 5 75.5% (18.2-100.0)
Total 1 12.0% (0.0-44.9) 5 88.0% (55.1-100.0) 6 100.0% (_-_)
Age Age 19 or older 1 12.0% (0.0-44.9) 5 88.0% (55.1-100.0) 6 100.0% (_-_)
Race
White 0 . (.-.) 3 100.0% (100.0-100.0) 3 50.4% (0.0-100.0)
Non White 1 24.3% (0.0-88.6) 2 75.7% (11.4-100.0) 3 49.6% (0.0-100.0)
Total 1 12.0% (0.0-44.9) 5 88.0% (55.1-100.0) 6 100.0% (_-_)
Region
South NV 0 . (.-.) 3 100.0% (100.0-100.0) 3 56.4% (0.0-100.0)
North NV 1 37.7% (0.0-100.0) 1 62.3% (0.0-100.0) 2 31.9% (0.0-86.7)
Rural NV 0 . (.-.) 1 100.0% (100.0-100.0) 1 11.7% (0.0-43.9)
Total 1 12.0% (0.0-44.9) 5 88.0% (55.1-100.0) 6 100.0% (_-_)
Participated in on-the-job training Yes 1 21.6% (0.0-94.0) 3 78.4% (6.0-100.0) 4 100.0% (_-_)
Participated in Job Corps No . . . 2 100.0% (100.0-100.0) 2 100.0% (_-_)
Currently Employed
Yes 0 . (.-.) 4 100.0% (100.0-100.0) 4 63.5% (4.3-100.0)
No 1 33.0% (0.0-100.0) 1 67.0% (0.0-100.0) 2 36.5% (0.0-95.7)
Total 1 12.0% (0.0-44.9) 5 88.0% (55.1-100.0) 6 100.0% (_-_)
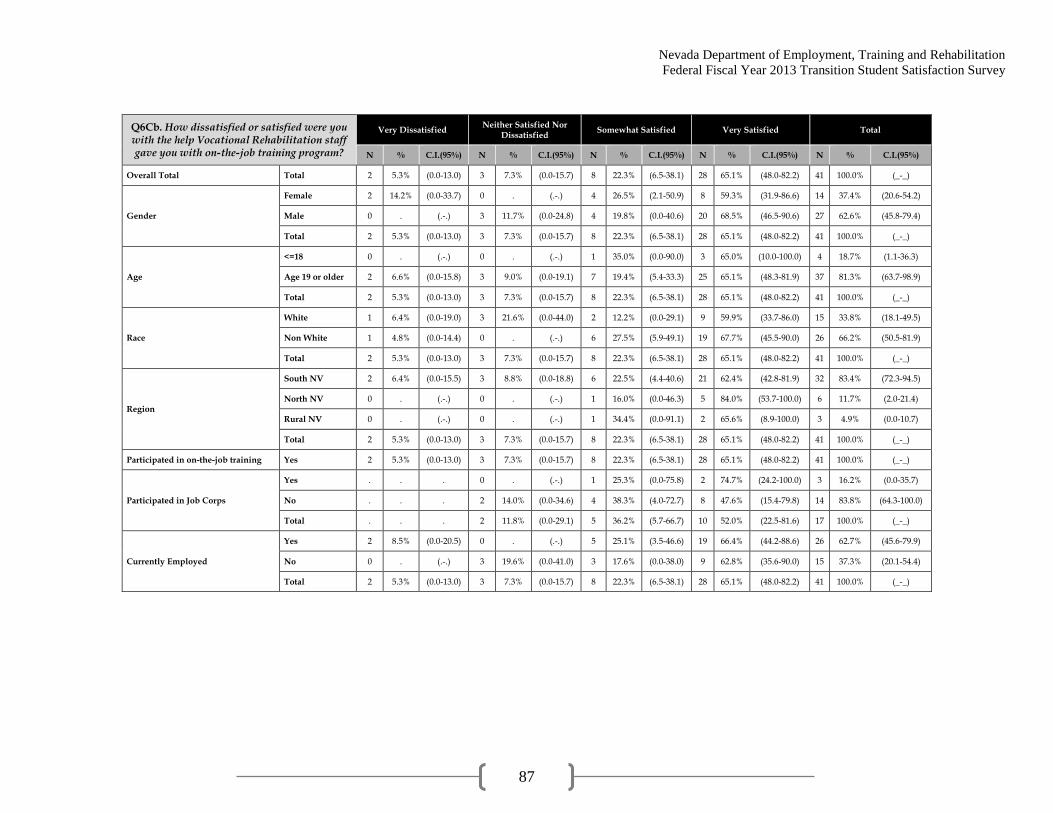
Nevada Department of Employment, Training and Rehabilitation
Federal Fiscal Year 2013 Transition Student Satisfaction Survey
87
Q6Cb. How dissatisfied or satisfied were you with the help Vocational Rehabilitation staff gave you with on-the-job training program?
Very Dissatisfied Neither Satisfied Nor
Dissatisfied Somewhat Satisfied Very Satisfied Total
N % C.I.(95%) N % C.I.(95%) N % C.I.(95%) N % C.I.(95%) N % C.I.(95%)
Overall Total Total 2 5.3% (0.0-13.0) 3 7.3% (0.0-15.7) 8 22.3% (6.5-38.1) 28 65.1% (48.0-82.2) 41 100.0% (_-_)
Gender
Female 2 14.2% (0.0-33.7) 0 . (.-.) 4 26.5% (2.1-50.9) 8 59.3% (31.9-86.6) 14 37.4% (20.6-54.2)
Male 0 . (.-.) 3 11.7% (0.0-24.8) 4 19.8% (0.0-40.6) 20 68.5% (46.5-90.6) 27 62.6% (45.8-79.4)
Total 2 5.3% (0.0-13.0) 3 7.3% (0.0-15.7) 8 22.3% (6.5-38.1) 28 65.1% (48.0-82.2) 41 100.0% (_-_)
Age
<=18 0 . (.-.) 0 . (.-.) 1 35.0% (0.0-90.0) 3 65.0% (10.0-100.0) 4 18.7% (1.1-36.3)
Age 19 or older 2 6.6% (0.0-15.8) 3 9.0% (0.0-19.1) 7 19.4% (5.4-33.3) 25 65.1% (48.3-81.9) 37 81.3% (63.7-98.9)
Total 2 5.3% (0.0-13.0) 3 7.3% (0.0-15.7) 8 22.3% (6.5-38.1) 28 65.1% (48.0-82.2) 41 100.0% (_-_)
Race
White 1 6.4% (0.0-19.0) 3 21.6% (0.0-44.0) 2 12.2% (0.0-29.1) 9 59.9% (33.7-86.0) 15 33.8% (18.1-49.5)
Non White 1 4.8% (0.0-14.4) 0 . (.-.) 6 27.5% (5.9-49.1) 19 67.7% (45.5-90.0) 26 66.2% (50.5-81.9)
Total 2 5.3% (0.0-13.0) 3 7.3% (0.0-15.7) 8 22.3% (6.5-38.1) 28 65.1% (48.0-82.2) 41 100.0% (_-_)
Region
South NV 2 6.4% (0.0-15.5) 3 8.8% (0.0-18.8) 6 22.5% (4.4-40.6) 21 62.4% (42.8-81.9) 32 83.4% (72.3-94.5)
North NV 0 . (.-.) 0 . (.-.) 1 16.0% (0.0-46.3) 5 84.0% (53.7-100.0) 6 11.7% (2.0-21.4)
Rural NV 0 . (.-.) 0 . (.-.) 1 34.4% (0.0-91.1) 2 65.6% (8.9-100.0) 3 4.9% (0.0-10.7)
Total 2 5.3% (0.0-13.0) 3 7.3% (0.0-15.7) 8 22.3% (6.5-38.1) 28 65.1% (48.0-82.2) 41 100.0% (_-_)
Participated in on-the-job training Yes 2 5.3% (0.0-13.0) 3 7.3% (0.0-15.7) 8 22.3% (6.5-38.1) 28 65.1% (48.0-82.2) 41 100.0% (_-_)
Participated in Job Corps
Yes . . . 0 . (.-.) 1 25.3% (0.0-75.8) 2 74.7% (24.2-100.0) 3 16.2% (0.0-35.7)
No . . . 2 14.0% (0.0-34.6) 4 38.3% (4.0-72.7) 8 47.6% (15.4-79.8) 14 83.8% (64.3-100.0)
Total . . . 2 11.8% (0.0-29.1) 5 36.2% (5.7-66.7) 10 52.0% (22.5-81.6) 17 100.0% (_-_)
Currently Employed
Yes 2 8.5% (0.0-20.5) 0 . (.-.) 5 25.1% (3.5-46.6) 19 66.4% (44.2-88.6) 26 62.7% (45.6-79.9)
No 0 . (.-.) 3 19.6% (0.0-41.0) 3 17.6% (0.0-38.0) 9 62.8% (35.6-90.0) 15 37.3% (20.1-54.4)
Total 2 5.3% (0.0-13.0) 3 7.3% (0.0-15.7) 8 22.3% (6.5-38.1) 28 65.1% (48.0-82.2) 41 100.0% (_-_)

Nevada Department of Employment, Training and Rehabilitation
Federal Fiscal Year 2013 Transition Student Satisfaction Survey
88
Q6Cc. How dissatisfied or satisfied were you with the help Vocational Rehabilitation staff
gave you with the two-year college degree program?
Neither Satisfied Nor Dissatisfied
Somewhat Satisfied Very Satisfied Total
N % C.I.(95%) N % C.I.(95%) N % C.I.(95%) N % C.I.(95%)
Overall Total Total 3 36.5% (0.0-78.7) 1 14.8% (0.0-47.6) 5 48.8% (6.0-91.5) 9 100.0% (_-_)
Gender
Female 0 . (.-.) 1 26.5% (0.0-80.3) 4 73.5% (19.7-100.0) 5 55.7% (12.9-98.4)
Male 3 82.2% (40.4-100.0) 0 . (.-.) 1 17.8% (0.0-59.6) 4 44.3% (1.6-87.1)
Total 3 36.5% (0.0-78.7) 1 14.8% (0.0-47.6) 5 48.8% (6.0-91.5) 9 100.0% (_-_)
Age Age 19 or older 3 36.5% (0.0-78.7) 1 14.8% (0.0-47.6) 5 48.8% (6.0-91.5) 9 100.0% (_-_)
Race
White 2 42.6% (0.0-98.4) 0 . (.-.) 3 57.4% (1.6-100.0) 5 44.7% (3.0-86.4)
Non White 1 31.5% (0.0-93.0) 1 26.7% (0.0-82.6) 2 41.8% (0.0-100.0) 4 55.3% (13.6-97.0)
Total 3 36.5% (0.0-78.7) 1 14.8% (0.0-47.6) 5 48.8% (6.0-91.5) 9 100.0% (_-_)
Region
South NV 0 . (.-.) 1 45.2% (0.0-100.0) 2 54.8% (0.0-100.0) 3 32.6% (0.0-72.3)
North NV 1 100.0% (100.0-100.0) 0 . (.-.) 0 . (.-.) 1 12.0% (0.0-39.5)
Rural NV 2 44.2% (0.0-100.0) 0 . (.-.) 3 55.8% (0.0-100.0) 5 55.4% (12.9-97.9)
Total 3 36.5% (0.0-78.7) 1 14.8% (0.0-47.6) 5 48.8% (6.0-91.5) 9 100.0% (_-_)
Participated in on-the-job training
Yes 0 . (.-.) 1 65.2% (0.0-100.0) 1 34.8% (0.0-100.0) 2 56.5% (0.0-100.0)
No 1 100.0% (100.0-100.0) 0 . (.-.) 0 . (.-.) 1 43.5% (0.0-100.0)
Total 1 43.5% (0.0-100.0) 1 36.9% (0.0-100.0) 1 19.7% (0.0-100.0) 3 100.0% (_-_)
Participated in Job Corps No 1 100.0% (.-.) . . . . . . 1 100.0% (_-_)
Currently Employed
Yes 3 47.4% (0.0-96.3) 1 19.2% (0.0-60.5) 3 33.4% (0.0-75.9) 7 76.9% (40.3-100.0)
No 0 . (.-.) 0 . (.-.) 2 100.0% (100.0-100.0) 2 23.1% (0.0-59.7)
Total 3 36.5% (0.0-78.7) 1 14.8% (0.0-47.6) 5 48.8% (6.0-91.5) 9 100.0% (_-_)
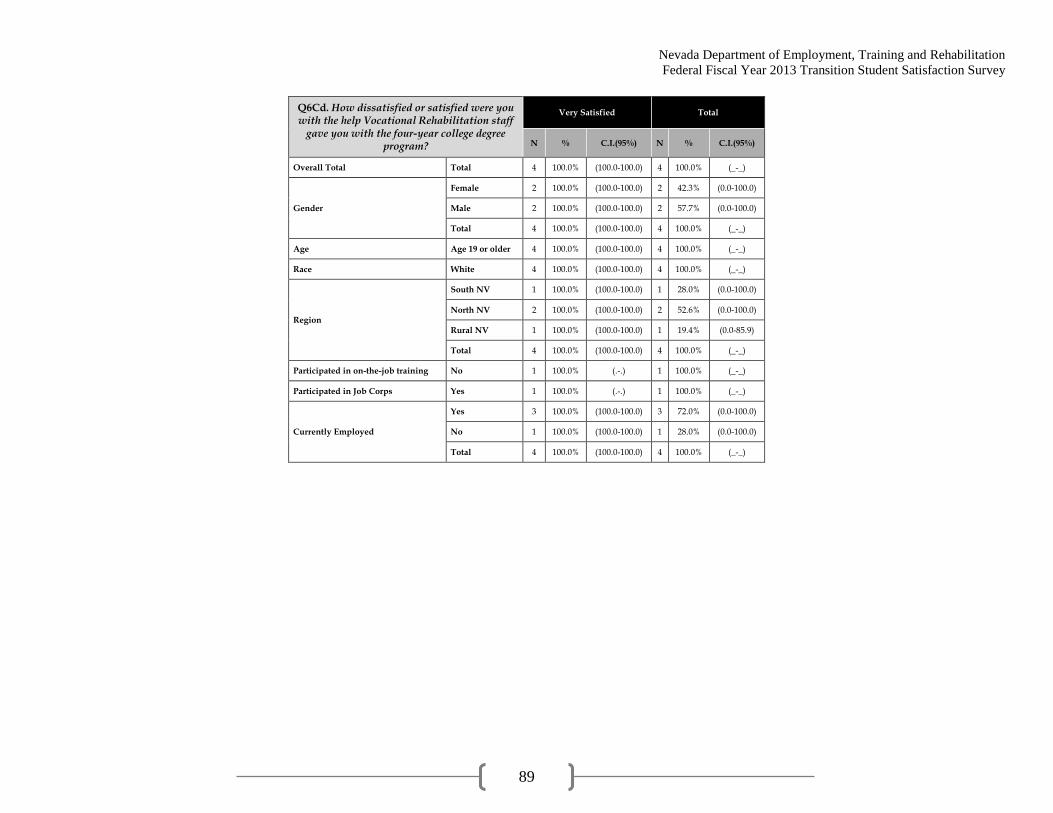
Nevada Department of Employment, Training and Rehabilitation
Federal Fiscal Year 2013 Transition Student Satisfaction Survey
89
Q6Cd. How dissatisfied or satisfied were you with the help Vocational Rehabilitation staff
gave you with the four-year college degree program?
Very Satisfied Total
N % C.I.(95%) N % C.I.(95%)
Overall Total Total 4 100.0% (100.0-100.0) 4 100.0% (_-_)
Gender
Female 2 100.0% (100.0-100.0) 2 42.3% (0.0-100.0)
Male 2 100.0% (100.0-100.0) 2 57.7% (0.0-100.0)
Total 4 100.0% (100.0-100.0) 4 100.0% (_-_)
Age Age 19 or older 4 100.0% (100.0-100.0) 4 100.0% (_-_)
Race White 4 100.0% (100.0-100.0) 4 100.0% (_-_)
Region
South NV 1 100.0% (100.0-100.0) 1 28.0% (0.0-100.0)
North NV 2 100.0% (100.0-100.0) 2 52.6% (0.0-100.0)
Rural NV 1 100.0% (100.0-100.0) 1 19.4% (0.0-85.9)
Total 4 100.0% (100.0-100.0) 4 100.0% (_-_)
Participated in on-the-job training No 1 100.0% (.-.) 1 100.0% (_-_)
Participated in Job Corps Yes 1 100.0% (.-.) 1 100.0% (_-_)
Currently Employed
Yes 3 100.0% (100.0-100.0) 3 72.0% (0.0-100.0)
No 1 100.0% (100.0-100.0) 1 28.0% (0.0-100.0)
Total 4 100.0% (100.0-100.0) 4 100.0% (_-_)

Nevada Department of Employment, Training and Rehabilitation
Federal Fiscal Year 2013 Transition Student Satisfaction Survey
90
Q6Ce. How dissatisfied or satisfied were you with the help Vocational Rehabilitation staff
gave you with the Job Corps program?
Neither Satisfied Nor Dissatisfied
Somewhat Satisfied Very Satisfied Total
N % C.I.(95%) N % C.I.(95%) N % C.I.(95%) N % C.I.(95%)
Overall Total Total 2 18.8% (0.0-49.0) 4 44.1% (2.9-85.2) 3 37.1% (0.0-78.1) 9 100.0% (_-_)
Gender
Female 1 48.5% (0.0-100.0) 1 51.5% (0.0-100.0) 0 . (.-.) 2 21.4% (0.0-54.6)
Male 1 10.7% (0.0-36.1) 3 42.0% (0.0-88.6) 3 47.2% (0.0-94.7) 7 78.6% (45.4-100.0)
Total 2 18.8% (0.0-49.0) 4 44.1% (2.9-85.2) 3 37.1% (0.0-78.1) 9 100.0% (_-_)
Age Age 19 or older 2 18.8% (0.0-49.0) 4 44.1% (2.9-85.2) 3 37.1% (0.0-78.1) 9 100.0% (_-_)
Race
White 1 13.7% (0.0-46.1) 2 41.1% (0.0-96.0) 2 45.1% (0.0-100.0) 5 61.5% (22.3-100.0)
Non White 1 26.9% (0.0-82.5) 2 48.7% (0.0-100.0) 1 24.4% (0.0-76.4) 4 38.5% (0.0-77.7)
Total 2 18.8% (0.0-49.0) 4 44.1% (2.9-85.2) 3 37.1% (0.0-78.1) 9 100.0% (_-_)
Region
South NV 0 . (.-.) 2 45.1% (0.0-100.0) 2 54.9% (0.0-100.0) 4 41.6% (1.1-82.2)
North NV 1 20.8% (0.0-67.3) 2 50.6% (0.0-100.0) 1 28.6% (0.0-86.4) 4 49.9% (8.4-91.5)
Rural NV 1 100.0% (100.0-100.0) 0 . (.-.) 0 . (.-.) 1 8.4% (0.0-28.5)
Total 2 18.8% (0.0-49.0) 4 44.1% (2.9-85.2) 3 37.1% (0.0-78.1) 9 100.0% (_-_)
Participated in on-the-job training
Yes 0 . (.-.) 1 25.3% (0.0-86.4) 2 74.7% (13.6-100.0) 3 49.7% (0.0-100.0)
No 2 50.0% (0.0-100.0) 1 25.0% (0.0-82.2) 1 25.0% (0.0-82.2) 4 50.3% (0.0-100.0)
Total 2 25.2% (0.0-67.2) 2 25.1% (0.0-67.0) 3 49.7% (0.0-100.0) 7 100.0% (_-_)
Participated in Job Corps Yes 2 18.8% (0.0-49.0) 4 44.1% (2.9-85.2) 3 37.1% (0.0-78.1) 9 100.0% (_-_)
Currently Employed
Yes 1 12.8% (0.0-42.7) 2 30.9% (0.0-76.7) 3 56.3% (6.6-100.0) 6 66.0% (26.5-100.0)
No 1 30.5% (0.0-94.4) 2 69.5% (5.6-100.0) 0 . (.-.) 3 34.0% (0.0-73.5)
Total 2 18.8% (0.0-49.0) 4 44.1% (2.9-85.2) 3 37.1% (0.0-78.1) 9 100.0% (_-_)
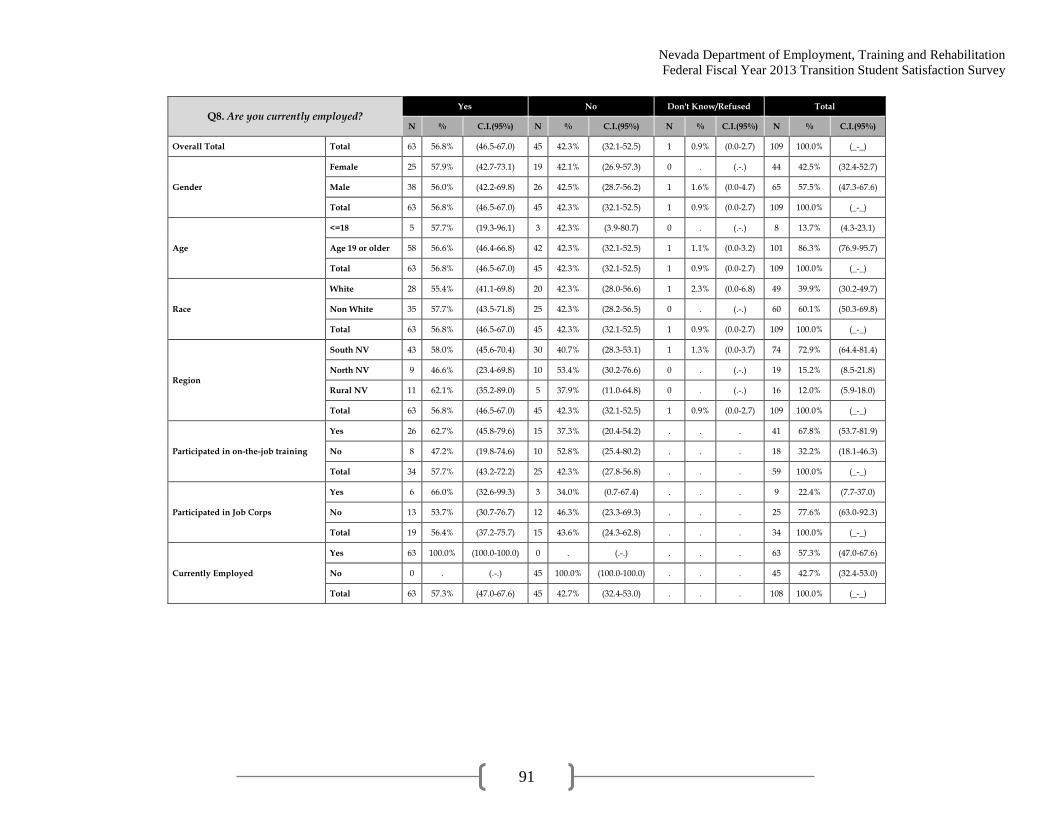
Nevada Department of Employment, Training and Rehabilitation
Federal Fiscal Year 2013 Transition Student Satisfaction Survey
91
Q8. Are you currently employed? Yes No Don't Know/Refused Total
N % C.I.(95%) N % C.I.(95%) N % C.I.(95%) N % C.I.(95%)
Overall Total Total 63 56.8% (46.5-67.0) 45 42.3% (32.1-52.5) 1 0.9% (0.0-2.7) 109 100.0% (_-_)
Gender
Female 25 57.9% (42.7-73.1) 19 42.1% (26.9-57.3) 0 . (.-.) 44 42.5% (32.4-52.7)
Male 38 56.0% (42.2-69.8) 26 42.5% (28.7-56.2) 1 1.6% (0.0-4.7) 65 57.5% (47.3-67.6)
Total 63 56.8% (46.5-67.0) 45 42.3% (32.1-52.5) 1 0.9% (0.0-2.7) 109 100.0% (_-_)
Age
<=18 5 57.7% (19.3-96.1) 3 42.3% (3.9-80.7) 0 . (.-.) 8 13.7% (4.3-23.1)
Age 19 or older 58 56.6% (46.4-66.8) 42 42.3% (32.1-52.5) 1 1.1% (0.0-3.2) 101 86.3% (76.9-95.7)
Total 63 56.8% (46.5-67.0) 45 42.3% (32.1-52.5) 1 0.9% (0.0-2.7) 109 100.0% (_-_)
Race
White 28 55.4% (41.1-69.8) 20 42.3% (28.0-56.6) 1 2.3% (0.0-6.8) 49 39.9% (30.2-49.7)
Non White 35 57.7% (43.5-71.8) 25 42.3% (28.2-56.5) 0 . (.-.) 60 60.1% (50.3-69.8)
Total 63 56.8% (46.5-67.0) 45 42.3% (32.1-52.5) 1 0.9% (0.0-2.7) 109 100.0% (_-_)
Region
South NV 43 58.0% (45.6-70.4) 30 40.7% (28.3-53.1) 1 1.3% (0.0-3.7) 74 72.9% (64.4-81.4)
North NV 9 46.6% (23.4-69.8) 10 53.4% (30.2-76.6) 0 . (.-.) 19 15.2% (8.5-21.8)
Rural NV 11 62.1% (35.2-89.0) 5 37.9% (11.0-64.8) 0 . (.-.) 16 12.0% (5.9-18.0)
Total 63 56.8% (46.5-67.0) 45 42.3% (32.1-52.5) 1 0.9% (0.0-2.7) 109 100.0% (_-_)
Participated in on-the-job training
Yes 26 62.7% (45.8-79.6) 15 37.3% (20.4-54.2) . . . 41 67.8% (53.7-81.9)
No 8 47.2% (19.8-74.6) 10 52.8% (25.4-80.2) . . . 18 32.2% (18.1-46.3)
Total 34 57.7% (43.2-72.2) 25 42.3% (27.8-56.8) . . . 59 100.0% (_-_)
Participated in Job Corps
Yes 6 66.0% (32.6-99.3) 3 34.0% (0.7-67.4) . . . 9 22.4% (7.7-37.0)
No 13 53.7% (30.7-76.7) 12 46.3% (23.3-69.3) . . . 25 77.6% (63.0-92.3)
Total 19 56.4% (37.2-75.7) 15 43.6% (24.3-62.8) . . . 34 100.0% (_-_)
Currently Employed
Yes 63 100.0% (100.0-100.0) 0 . (.-.) . . . 63 57.3% (47.0-67.6)
No 0 . (.-.) 45 100.0% (100.0-100.0) . . . 45 42.7% (32.4-53.0)
Total 63 57.3% (47.0-67.6) 45 42.7% (32.4-53.0) . . . 108 100.0% (_-_)

Nevada Department of Employment, Training and Rehabilitation
Federal Fiscal Year 2013 Transition Student Satisfaction Survey
92
Q9. Did you get your current job as a result of the services you received from the Vocational
Rehabilitation Program?
Yes No Don't Know/Refused Total
N % C.I.(95%) N % C.I.(95%) N % C.I.(95%) N % C.I.(95%)
Overall Total Total 27 46.6% (32.8-60.4) 33 49.7% (36.0-63.4) 3 3.7% (0.0-8.1) 63 100.0% (_-_)
Gender
Female 9 35.9% (16.0-55.8) 16 64.1% (44.2-84.0) 0 . (.-.) 25 43.4% (29.8-56.9)
Male 18 54.7% (36.9-72.5) 17 38.7% (21.7-55.6) 3 6.6% (0.0-14.3) 38 56.6% (43.1-70.2)
Total 27 46.6% (32.8-60.4) 33 49.7% (36.0-63.4) 3 3.7% (0.0-8.1) 63 100.0% (_-_)
Age
<=18 5 100.0% (100.0-100.0) 0 . (.-.) 0 . (.-.) 5 13.9% (1.6-26.2)
Age 19 or older 22 37.9% (24.6-51.2) 33 57.7% (44.2-71.3) 3 4.3% (0.0-9.4) 58 86.1% (73.8-98.4)
Total 27 46.6% (32.8-60.4) 33 49.7% (36.0-63.4) 3 3.7% (0.0-8.1) 63 100.0% (_-_)
Race
White 12 46.2% (26.8-65.6) 14 47.1% (27.8-66.4) 2 6.7% (0.0-16.2) 28 39.0% (26.2-51.8)
Non White 15 46.8% (27.9-65.7) 19 51.4% (32.6-70.2) 1 1.8% (0.0-5.5) 35 61.0% (48.2-73.8)
Total 27 46.6% (32.8-60.4) 33 49.7% (36.0-63.4) 3 3.7% (0.0-8.1) 63 100.0% (_-_)
Region
South NV 17 44.6% (27.8-61.4) 24 51.7% (35.1-68.4) 2 3.7% (0.0-8.9) 43 74.5% (63.6-85.4)
North NV 7 81.2% (56.2-100.0) 2 18.8% (0.0-43.8) 0 . (.-.) 9 12.5% (4.3-20.6)
Rural NV 3 24.7% (0.0-50.7) 7 67.6% (39.1-96.0) 1 7.7% (0.0-22.8) 11 13.1% (5.0-21.1)
Total 27 46.6% (32.8-60.4) 33 49.7% (36.0-63.4) 3 3.7% (0.0-8.1) 63 100.0% (_-_)
Participated in on-the-job training
Yes 14 58.9% (37.9-79.8) 12 41.1% (20.2-62.1) . . . 26 73.7% (55.3-92.1)
No 4 54.8% (13.7-95.8) 4 45.2% (4.2-86.3) . . . 8 26.3% (7.9-44.7)
Total 18 57.8% (39.0-76.6) 16 42.2% (23.4-61.0) . . . 34 100.0% (_-_)
Participated in Job Corps
Yes 3 56.3% (12.5-100.0) 3 43.7% (0.0-87.5) 0 . (.-.) 6 26.1% (3.9-48.3)
No 5 54.5% (20.2-88.8) 7 41.0% (8.2-73.7) 1 4.5% (0.0-14.4) 13 73.9% (51.7-96.1)
Total 8 55.0% (27.2-82.7) 10 41.7% (14.8-68.6) 1 3.3% (0.0-10.6) 19 100.0% (_-_)
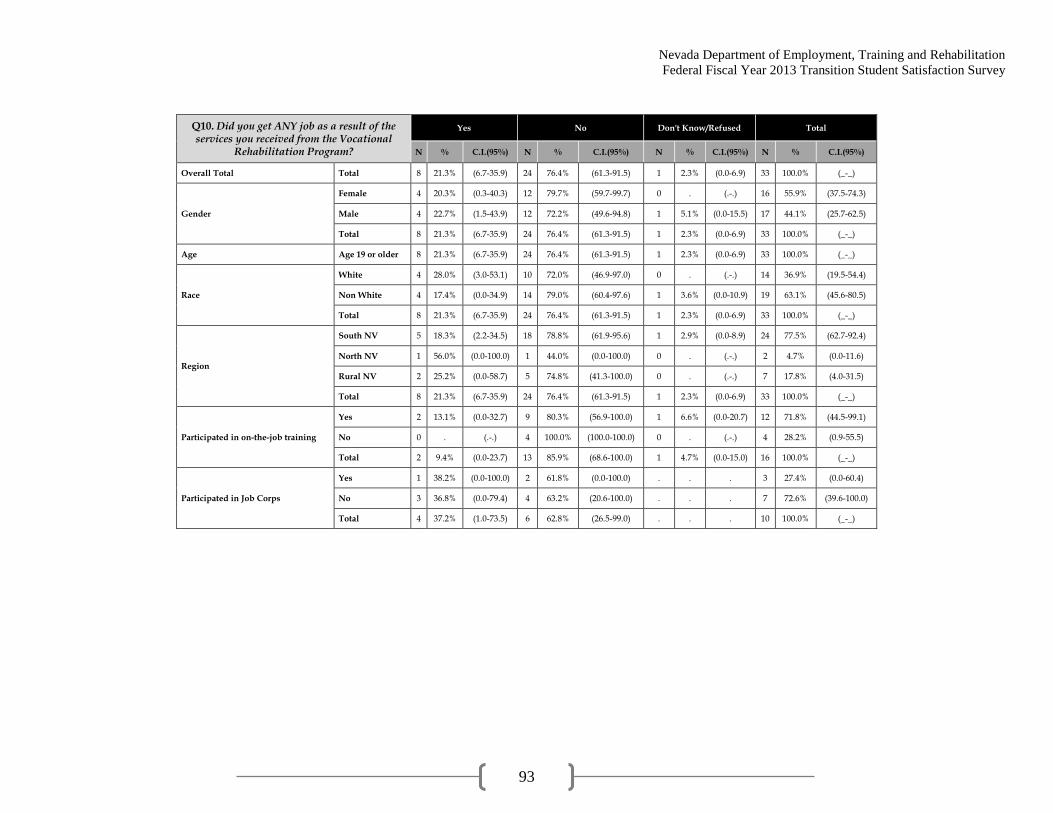
Nevada Department of Employment, Training and Rehabilitation
Federal Fiscal Year 2013 Transition Student Satisfaction Survey
93
Q10. Did you get ANY job as a result of the services you received from the Vocational
Rehabilitation Program?
Yes No Don't Know/Refused Total
N % C.I.(95%) N % C.I.(95%) N % C.I.(95%) N % C.I.(95%)
Overall Total Total 8 21.3% (6.7-35.9) 24 76.4% (61.3-91.5) 1 2.3% (0.0-6.9) 33 100.0% (_-_)
Gender
Female 4 20.3% (0.3-40.3) 12 79.7% (59.7-99.7) 0 . (.-.) 16 55.9% (37.5-74.3)
Male 4 22.7% (1.5-43.9) 12 72.2% (49.6-94.8) 1 5.1% (0.0-15.5) 17 44.1% (25.7-62.5)
Total 8 21.3% (6.7-35.9) 24 76.4% (61.3-91.5) 1 2.3% (0.0-6.9) 33 100.0% (_-_)
Age Age 19 or older 8 21.3% (6.7-35.9) 24 76.4% (61.3-91.5) 1 2.3% (0.0-6.9) 33 100.0% (_-_)
Race
White 4 28.0% (3.0-53.1) 10 72.0% (46.9-97.0) 0 . (.-.) 14 36.9% (19.5-54.4)
Non White 4 17.4% (0.0-34.9) 14 79.0% (60.4-97.6) 1 3.6% (0.0-10.9) 19 63.1% (45.6-80.5)
Total 8 21.3% (6.7-35.9) 24 76.4% (61.3-91.5) 1 2.3% (0.0-6.9) 33 100.0% (_-_)
Region
South NV 5 18.3% (2.2-34.5) 18 78.8% (61.9-95.6) 1 2.9% (0.0-8.9) 24 77.5% (62.7-92.4)
North NV 1 56.0% (0.0-100.0) 1 44.0% (0.0-100.0) 0 . (.-.) 2 4.7% (0.0-11.6)
Rural NV 2 25.2% (0.0-58.7) 5 74.8% (41.3-100.0) 0 . (.-.) 7 17.8% (4.0-31.5)
Total 8 21.3% (6.7-35.9) 24 76.4% (61.3-91.5) 1 2.3% (0.0-6.9) 33 100.0% (_-_)
Participated in on-the-job training
Yes 2 13.1% (0.0-32.7) 9 80.3% (56.9-100.0) 1 6.6% (0.0-20.7) 12 71.8% (44.5-99.1)
No 0 . (.-.) 4 100.0% (100.0-100.0) 0 . (.-.) 4 28.2% (0.9-55.5)
Total 2 9.4% (0.0-23.7) 13 85.9% (68.6-100.0) 1 4.7% (0.0-15.0) 16 100.0% (_-_)
Participated in Job Corps
Yes 1 38.2% (0.0-100.0) 2 61.8% (0.0-100.0) . . . 3 27.4% (0.0-60.4)
No 3 36.8% (0.0-79.4) 4 63.2% (20.6-100.0) . . . 7 72.6% (39.6-100.0)
Total 4 37.2% (1.0-73.5) 6 62.8% (26.5-99.0) . . . 10 100.0% (_-_)
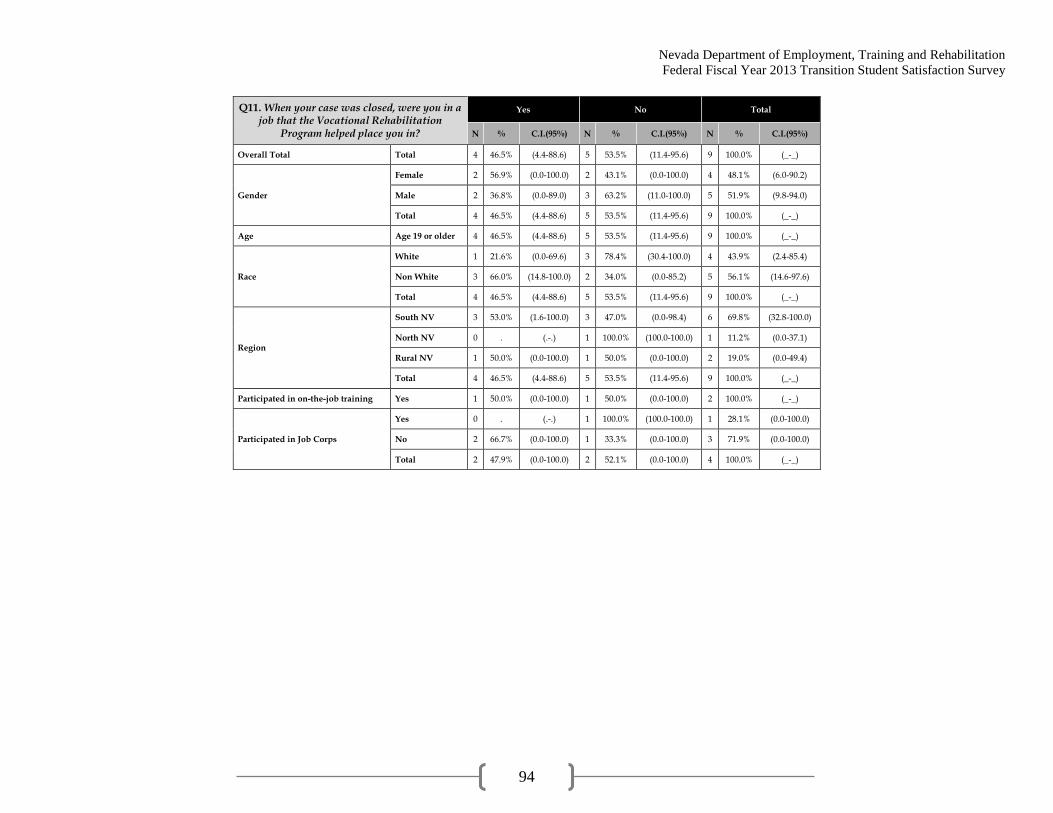
Nevada Department of Employment, Training and Rehabilitation
Federal Fiscal Year 2013 Transition Student Satisfaction Survey
94
Q11. When your case was closed, were you in a job that the Vocational Rehabilitation
Program helped place you in?
Yes No Total
N % C.I.(95%) N % C.I.(95%) N % C.I.(95%)
Overall Total Total 4 46.5% (4.4-88.6) 5 53.5% (11.4-95.6) 9 100.0% (_-_)
Gender
Female 2 56.9% (0.0-100.0) 2 43.1% (0.0-100.0) 4 48.1% (6.0-90.2)
Male 2 36.8% (0.0-89.0) 3 63.2% (11.0-100.0) 5 51.9% (9.8-94.0)
Total 4 46.5% (4.4-88.6) 5 53.5% (11.4-95.6) 9 100.0% (_-_)
Age Age 19 or older 4 46.5% (4.4-88.6) 5 53.5% (11.4-95.6) 9 100.0% (_-_)
Race
White 1 21.6% (0.0-69.6) 3 78.4% (30.4-100.0) 4 43.9% (2.4-85.4)
Non White 3 66.0% (14.8-100.0) 2 34.0% (0.0-85.2) 5 56.1% (14.6-97.6)
Total 4 46.5% (4.4-88.6) 5 53.5% (11.4-95.6) 9 100.0% (_-_)
Region
South NV 3 53.0% (1.6-100.0) 3 47.0% (0.0-98.4) 6 69.8% (32.8-100.0)
North NV 0 . (.-.) 1 100.0% (100.0-100.0) 1 11.2% (0.0-37.1)
Rural NV 1 50.0% (0.0-100.0) 1 50.0% (0.0-100.0) 2 19.0% (0.0-49.4)
Total 4 46.5% (4.4-88.6) 5 53.5% (11.4-95.6) 9 100.0% (_-_)
Participated in on-the-job training Yes 1 50.0% (0.0-100.0) 1 50.0% (0.0-100.0) 2 100.0% (_-_)
Participated in Job Corps
Yes 0 . (.-.) 1 100.0% (100.0-100.0) 1 28.1% (0.0-100.0)
No 2 66.7% (0.0-100.0) 1 33.3% (0.0-100.0) 3 71.9% (0.0-100.0)
Total 2 47.9% (0.0-100.0) 2 52.1% (0.0-100.0) 4 100.0% (_-_)
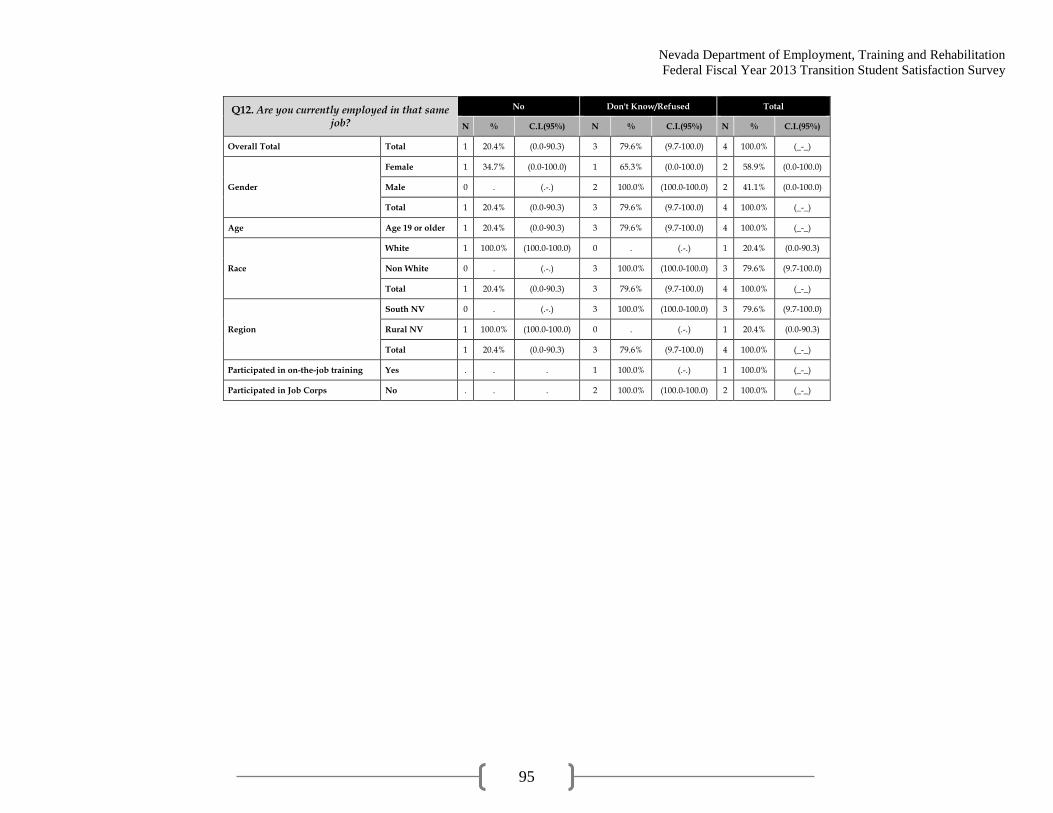
Nevada Department of Employment, Training and Rehabilitation
Federal Fiscal Year 2013 Transition Student Satisfaction Survey
95
Q12. Are you currently employed in that same job?
No Don't Know/Refused Total
N % C.I.(95%) N % C.I.(95%) N % C.I.(95%)
Overall Total Total 1 20.4% (0.0-90.3) 3 79.6% (9.7-100.0) 4 100.0% (_-_)
Gender
Female 1 34.7% (0.0-100.0) 1 65.3% (0.0-100.0) 2 58.9% (0.0-100.0)
Male 0 . (.-.) 2 100.0% (100.0-100.0) 2 41.1% (0.0-100.0)
Total 1 20.4% (0.0-90.3) 3 79.6% (9.7-100.0) 4 100.0% (_-_)
Age Age 19 or older 1 20.4% (0.0-90.3) 3 79.6% (9.7-100.0) 4 100.0% (_-_)
Race
White 1 100.0% (100.0-100.0) 0 . (.-.) 1 20.4% (0.0-90.3)
Non White 0 . (.-.) 3 100.0% (100.0-100.0) 3 79.6% (9.7-100.0)
Total 1 20.4% (0.0-90.3) 3 79.6% (9.7-100.0) 4 100.0% (_-_)
Region
South NV 0 . (.-.) 3 100.0% (100.0-100.0) 3 79.6% (9.7-100.0)
Rural NV 1 100.0% (100.0-100.0) 0 . (.-.) 1 20.4% (0.0-90.3)
Total 1 20.4% (0.0-90.3) 3 79.6% (9.7-100.0) 4 100.0% (_-_)
Participated in on-the-job training Yes . . . 1 100.0% (.-.) 1 100.0% (_-_)
Participated in Job Corps No . . . 2 100.0% (100.0-100.0) 2 100.0% (_-_)
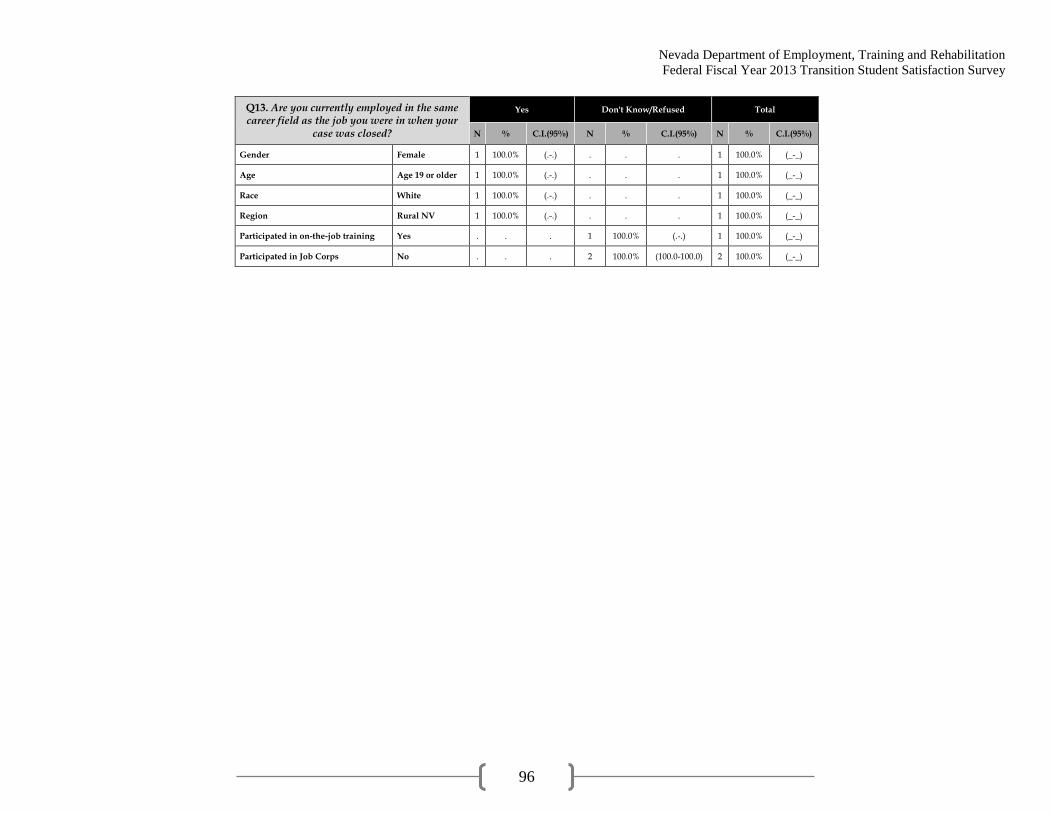
Nevada Department of Employment, Training and Rehabilitation
Federal Fiscal Year 2013 Transition Student Satisfaction Survey
96
Q13. Are you currently employed in the same career field as the job you were in when your
case was closed?
Yes Don't Know/Refused Total
N % C.I.(95%) N % C.I.(95%) N % C.I.(95%)
Gender Female 1 100.0% (.-.) . . . 1 100.0% (_-_)
Age Age 19 or older 1 100.0% (.-.) . . . 1 100.0% (_-_)
Race White 1 100.0% (.-.) . . . 1 100.0% (_-_)
Region Rural NV 1 100.0% (.-.) . . . 1 100.0% (_-_)
Participated in on-the-job training Yes . . . 1 100.0% (.-.) 1 100.0% (_-_)
Participated in Job Corps No . . . 2 100.0% (100.0-100.0) 2 100.0% (_-_)
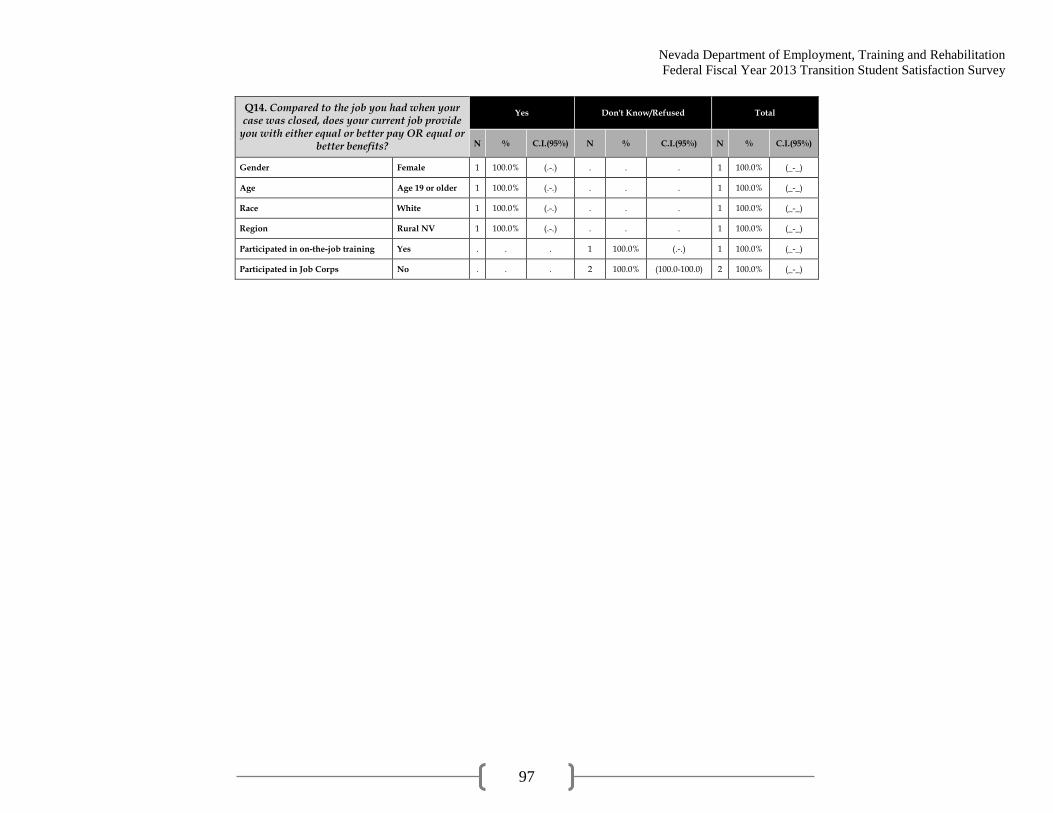
Nevada Department of Employment, Training and Rehabilitation
Federal Fiscal Year 2013 Transition Student Satisfaction Survey
97
Q14. Compared to the job you had when your case was closed, does your current job provide
you with either equal or better pay OR equal or better benefits?
Yes Don't Know/Refused Total
N % C.I.(95%) N % C.I.(95%) N % C.I.(95%)
Gender Female 1 100.0% (.-.) . . . 1 100.0% (_-_)
Age Age 19 or older 1 100.0% (.-.) . . . 1 100.0% (_-_)
Race White 1 100.0% (.-.) . . . 1 100.0% (_-_)
Region Rural NV 1 100.0% (.-.) . . . 1 100.0% (_-_)
Participated in on-the-job training Yes . . . 1 100.0% (.-.) 1 100.0% (_-_)
Participated in Job Corps No . . . 2 100.0% (100.0-100.0) 2 100.0% (_-_)

Nevada Department of Employment, Training and Rehabilitation
Federal Fiscal Year 2013 Transition Student Satisfaction Survey
98
Q15. In what kind of job are you employed?
Clerical and admin support
Production, construction, operating, maintenance, and material handling
Professional, paraprofessional, and
technical
Sales and related occupations
N % C.I.(95%) N % C.I.(95%) N % C.I.(95%) N % C.I.(95%)
Overall Total Total 2 3.1% (0.0-7.7) 12 17.9% (7.9-28.0) 2 2.2% (0.0-5.4) 16 22.2% (11.7-32.7)
Gender
Female 1 4.8% (0.0-14.3) 2 9.1% (0.0-21.5) 1 2.6% (0.0-7.7) 4 16.0% (0.9-31.1)
Male 1 1.8% (0.0-5.3) 10 24.7% (9.9-39.5) 1 2.0% (0.0-5.9) 12 26.9% (12.3-41.6)
Total 2 3.1% (0.0-7.7) 12 17.9% (7.9-28.0) 2 2.2% (0.0-5.4) 16 22.2% (11.7-32.7)
Age
<=18 0 . (.-.) 1 13.3% (0.0-39.9) 0 . (.-.) 0 . (.-.)
Age 19 or older 2 3.6% (0.0-8.9) 11 18.7% (7.9-29.4) 2 2.6% (0.0-6.3) 16 25.8% (14.1-37.5)
Total 2 3.1% (0.0-7.7) 12 17.9% (7.9-28.0) 2 2.2% (0.0-5.4) 16 22.2% (11.7-32.7)
Race
White 1 2.6% (0.0-7.7) 5 18.0% (3.0-33.1) 1 2.9% (0.0-8.6) 8 28.9% (11.3-46.5)
Non White 1 3.4% (0.0-10.2) 7 17.9% (4.5-31.2) 1 1.8% (0.0-5.5) 8 17.9% (5.3-30.5)
Total 2 3.1% (0.0-7.7) 12 17.9% (7.9-28.0) 2 2.2% (0.0-5.4) 16 22.2% (11.7-32.7)
Region
South NV 1 2.8% (0.0-8.4) 7 13.5% (3.4-23.6) 1 1.5% (0.0-4.5) 12 23.0% (10.3-35.7)
North NV 0 . (.-.) 2 27.3% (0.0-59.6) 0 . (.-.) 2 24.2% (0.0-54.2)
Rural NV 1 7.7% (0.0-22.8) 3 34.3% (1.2-67.4) 1 8.5% (0.0-25.1) 2 15.4% (0.0-36.1)
Total 2 3.1% (0.0-7.7) 12 17.9% (7.9-28.0) 2 2.2% (0.0-5.4) 16 22.2% (11.7-32.7)
Participated in on-the-job training
Yes . . . 5 16.4% (1.7-31.1) 1 2.7% (0.0-8.3) 5 17.3% (2.1-32.4)
No . . . 2 23.5% (0.0-57.1) 0 . (.-.) 1 7.6% (0.0-23.3)
Total . . . 7 18.3% (4.3-32.3) 1 2.0% (0.0-6.1) 6 14.7% (2.6-26.8)
Participated in Job Corps
Yes . . . 2 34.4% (0.0-77.7) 0 . (.-.) 3 51.4% (6.5-96.3)
No . . . 0 . (.-.) 1 5.0% (0.0-15.9) 4 21.0% (0.0-44.0)
Total . . . 2 9.0% (0.0-22.8) 1 3.7% (0.0-11.7) 7 28.9% (6.1-51.8)

Nevada Department of Employment, Training and Rehabilitation
Federal Fiscal Year 2013 Transition Student Satisfaction Survey
99
Q15. In what kind of job are you employed? Service occupations Other Don't Know/Refused Total
N % C.I.(95%) N % C.I.(95%) N % C.I.(95%) N % C.I.(95%)
Overall Total Total 15 29.5% (15.8-43.2) 15 23.4% (12.2-34.6) 1 1.6% (0.0-4.8) 63 100.0% (_-_)
Gender
Female 7 30.0% (10.7-49.3) 10 37.5% (17.6-57.3) 0 . (.-.) 25 43.4% (29.8-56.9)
Male 8 29.2% (10.0-48.3) 5 12.6% (1.6-23.7) 1 2.8% (0.0-8.5) 38 56.6% (43.1-70.2)
Total 15 29.5% (15.8-43.2) 15 23.4% (12.2-34.6) 1 1.6% (0.0-4.8) 63 100.0% (_-_)
Age
<=18 3 73.3% (36.3-100.0) 1 13.3% (0.0-39.9) 0 . (.-.) 5 13.9% (1.6-26.2)
Age 19 or older 12 22.5% (10.6-34.3) 14 25.0% (13.0-37.0) 1 1.9% (0.0-5.6) 58 86.1% (73.8-98.4)
Total 15 29.5% (15.8-43.2) 15 23.4% (12.2-34.6) 1 1.6% (0.0-4.8) 63 100.0% (_-_)
Race
White 5 18.7% (3.4-34.0) 7 24.8% (8.1-41.5) 1 4.1% (0.0-12.2) 28 39.0% (26.2-51.8)
Non White 10 36.5% (17.2-55.7) 8 22.5% (7.6-37.4) 0 . (.-.) 35 61.0% (48.2-73.8)
Total 15 29.5% (15.8-43.2) 15 23.4% (12.2-34.6) 1 1.6% (0.0-4.8) 63 100.0% (_-_)
Region
South NV 11 34.0% (17.0-51.0) 10 23.0% (9.6-36.4) 1 2.2% (0.0-6.5) 43 74.5% (63.6-85.4)
North NV 3 24.8% (0.0-51.5) 2 23.6% (0.0-53.2) 0 . (.-.) 9 12.5% (4.3-20.6)
Rural NV 1 8.5% (0.0-25.1) 3 25.6% (0.0-52.1) 0 . (.-.) 11 13.1% (5.0-21.1)
Total 15 29.5% (15.8-43.2) 15 23.4% (12.2-34.6) 1 1.6% (0.0-4.8) 63 100.0% (_-_)
Participated in on-the-job training
Yes 8 36.7% (14.3-59.2) 7 26.9% (8.0-45.7) . . . 26 73.7% (55.3-92.1)
No 2 39.7% (0.0-84.0) 3 29.3% (0.0-63.4) . . . 8 26.3% (7.9-44.7)
Total 10 37.5% (17.2-57.8) 10 27.5% (11.0-44.0) . . . 34 100.0% (_-_)
Participated in Job Corps
Yes 0 . (.-.) 1 14.2% (0.0-43.2) . . . 6 26.1% (3.9-48.3)
No 4 53.4% (18.8-88.0) 4 20.6% (0.0-43.2) . . . 13 73.9% (51.7-96.1)
Total 4 39.4% (8.0-70.8) 5 18.9% (0.8-37.1) . . . 19 100.0% (_-_)
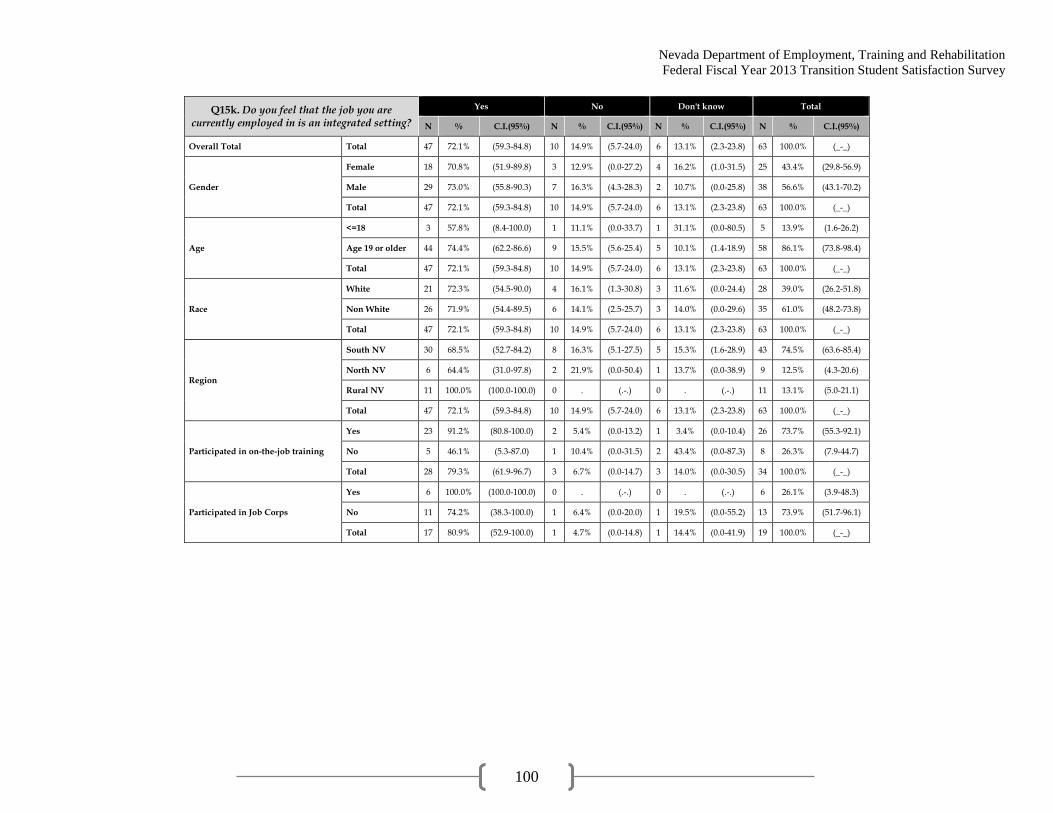
Nevada Department of Employment, Training and Rehabilitation
Federal Fiscal Year 2013 Transition Student Satisfaction Survey
100
Q15k. Do you feel that the job you are currently employed in is an integrated setting?
Yes No Don't know Total
N % C.I.(95%) N % C.I.(95%) N % C.I.(95%) N % C.I.(95%)
Overall Total Total 47 72.1% (59.3-84.8) 10 14.9% (5.7-24.0) 6 13.1% (2.3-23.8) 63 100.0% (_-_)
Gender
Female 18 70.8% (51.9-89.8) 3 12.9% (0.0-27.2) 4 16.2% (1.0-31.5) 25 43.4% (29.8-56.9)
Male 29 73.0% (55.8-90.3) 7 16.3% (4.3-28.3) 2 10.7% (0.0-25.8) 38 56.6% (43.1-70.2)
Total 47 72.1% (59.3-84.8) 10 14.9% (5.7-24.0) 6 13.1% (2.3-23.8) 63 100.0% (_-_)
Age
<=18 3 57.8% (8.4-100.0) 1 11.1% (0.0-33.7) 1 31.1% (0.0-80.5) 5 13.9% (1.6-26.2)
Age 19 or older 44 74.4% (62.2-86.6) 9 15.5% (5.6-25.4) 5 10.1% (1.4-18.9) 58 86.1% (73.8-98.4)
Total 47 72.1% (59.3-84.8) 10 14.9% (5.7-24.0) 6 13.1% (2.3-23.8) 63 100.0% (_-_)
Race
White 21 72.3% (54.5-90.0) 4 16.1% (1.3-30.8) 3 11.6% (0.0-24.4) 28 39.0% (26.2-51.8)
Non White 26 71.9% (54.4-89.5) 6 14.1% (2.5-25.7) 3 14.0% (0.0-29.6) 35 61.0% (48.2-73.8)
Total 47 72.1% (59.3-84.8) 10 14.9% (5.7-24.0) 6 13.1% (2.3-23.8) 63 100.0% (_-_)
Region
South NV 30 68.5% (52.7-84.2) 8 16.3% (5.1-27.5) 5 15.3% (1.6-28.9) 43 74.5% (63.6-85.4)
North NV 6 64.4% (31.0-97.8) 2 21.9% (0.0-50.4) 1 13.7% (0.0-38.9) 9 12.5% (4.3-20.6)
Rural NV 11 100.0% (100.0-100.0) 0 . (.-.) 0 . (.-.) 11 13.1% (5.0-21.1)
Total 47 72.1% (59.3-84.8) 10 14.9% (5.7-24.0) 6 13.1% (2.3-23.8) 63 100.0% (_-_)
Participated in on-the-job training
Yes 23 91.2% (80.8-100.0) 2 5.4% (0.0-13.2) 1 3.4% (0.0-10.4) 26 73.7% (55.3-92.1)
No 5 46.1% (5.3-87.0) 1 10.4% (0.0-31.5) 2 43.4% (0.0-87.3) 8 26.3% (7.9-44.7)
Total 28 79.3% (61.9-96.7) 3 6.7% (0.0-14.7) 3 14.0% (0.0-30.5) 34 100.0% (_-_)
Participated in Job Corps
Yes 6 100.0% (100.0-100.0) 0 . (.-.) 0 . (.-.) 6 26.1% (3.9-48.3)
No 11 74.2% (38.3-100.0) 1 6.4% (0.0-20.0) 1 19.5% (0.0-55.2) 13 73.9% (51.7-96.1)
Total 17 80.9% (52.9-100.0) 1 4.7% (0.0-14.8) 1 14.4% (0.0-41.9) 19 100.0% (_-_)
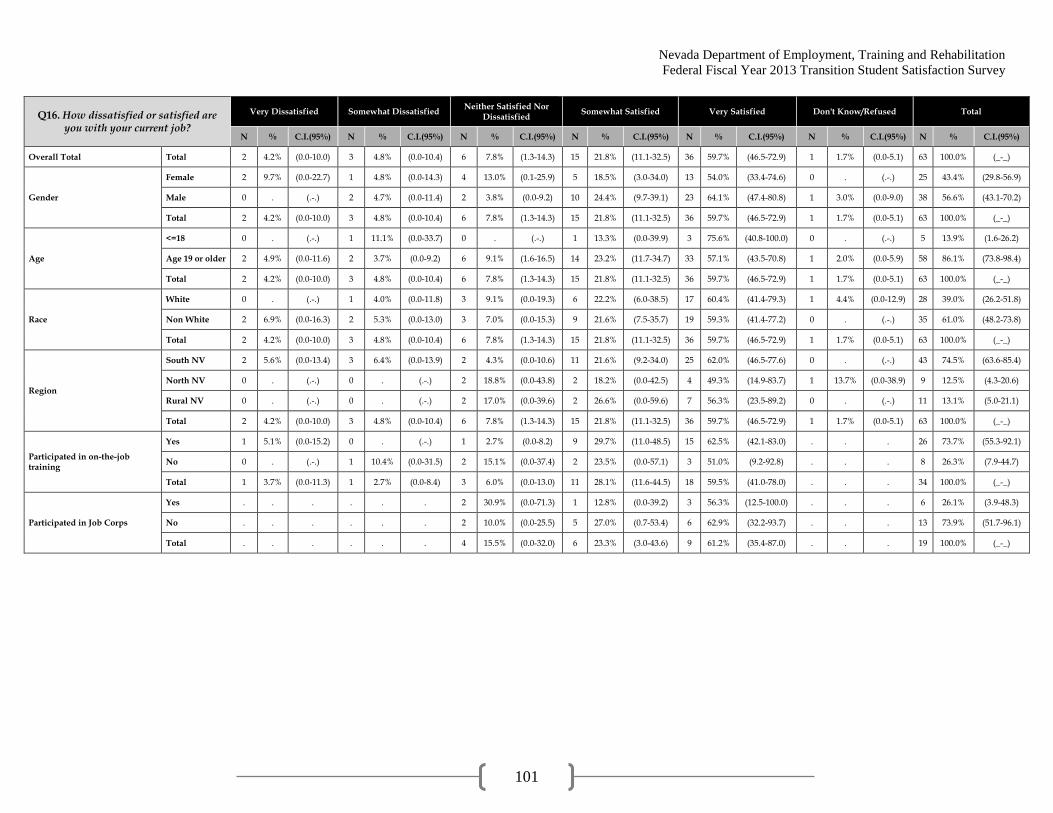
Nevada Department of Employment, Training and Rehabilitation
Federal Fiscal Year 2013 Transition Student Satisfaction Survey
101
Q16. How dissatisfied or satisfied are you with your current job?
Very Dissatisfied Somewhat Dissatisfied Neither Satisfied Nor
Dissatisfied Somewhat Satisfied Very Satisfied Don't Know/Refused Total
N % C.I.(95%) N % C.I.(95%) N % C.I.(95%) N % C.I.(95%) N % C.I.(95%) N % C.I.(95%) N % C.I.(95%)
Overall Total Total 2 4.2% (0.0-10.0) 3 4.8% (0.0-10.4) 6 7.8% (1.3-14.3) 15 21.8% (11.1-32.5) 36 59.7% (46.5-72.9) 1 1.7% (0.0-5.1) 63 100.0% (_-_)
Gender
Female 2 9.7% (0.0-22.7) 1 4.8% (0.0-14.3) 4 13.0% (0.1-25.9) 5 18.5% (3.0-34.0) 13 54.0% (33.4-74.6) 0 . (.-.) 25 43.4% (29.8-56.9)
Male 0 . (.-.) 2 4.7% (0.0-11.4) 2 3.8% (0.0-9.2) 10 24.4% (9.7-39.1) 23 64.1% (47.4-80.8) 1 3.0% (0.0-9.0) 38 56.6% (43.1-70.2)
Total 2 4.2% (0.0-10.0) 3 4.8% (0.0-10.4) 6 7.8% (1.3-14.3) 15 21.8% (11.1-32.5) 36 59.7% (46.5-72.9) 1 1.7% (0.0-5.1) 63 100.0% (_-_)
Age
<=18 0 . (.-.) 1 11.1% (0.0-33.7) 0 . (.-.) 1 13.3% (0.0-39.9) 3 75.6% (40.8-100.0) 0 . (.-.) 5 13.9% (1.6-26.2)
Age 19 or older 2 4.9% (0.0-11.6) 2 3.7% (0.0-9.2) 6 9.1% (1.6-16.5) 14 23.2% (11.7-34.7) 33 57.1% (43.5-70.8) 1 2.0% (0.0-5.9) 58 86.1% (73.8-98.4)
Total 2 4.2% (0.0-10.0) 3 4.8% (0.0-10.4) 6 7.8% (1.3-14.3) 15 21.8% (11.1-32.5) 36 59.7% (46.5-72.9) 1 1.7% (0.0-5.1) 63 100.0% (_-_)
Race
White 0 . (.-.) 1 4.0% (0.0-11.8) 3 9.1% (0.0-19.3) 6 22.2% (6.0-38.5) 17 60.4% (41.4-79.3) 1 4.4% (0.0-12.9) 28 39.0% (26.2-51.8)
Non White 2 6.9% (0.0-16.3) 2 5.3% (0.0-13.0) 3 7.0% (0.0-15.3) 9 21.6% (7.5-35.7) 19 59.3% (41.4-77.2) 0 . (.-.) 35 61.0% (48.2-73.8)
Total 2 4.2% (0.0-10.0) 3 4.8% (0.0-10.4) 6 7.8% (1.3-14.3) 15 21.8% (11.1-32.5) 36 59.7% (46.5-72.9) 1 1.7% (0.0-5.1) 63 100.0% (_-_)
Region
South NV 2 5.6% (0.0-13.4) 3 6.4% (0.0-13.9) 2 4.3% (0.0-10.6) 11 21.6% (9.2-34.0) 25 62.0% (46.5-77.6) 0 . (.-.) 43 74.5% (63.6-85.4)
North NV 0 . (.-.) 0 . (.-.) 2 18.8% (0.0-43.8) 2 18.2% (0.0-42.5) 4 49.3% (14.9-83.7) 1 13.7% (0.0-38.9) 9 12.5% (4.3-20.6)
Rural NV 0 . (.-.) 0 . (.-.) 2 17.0% (0.0-39.6) 2 26.6% (0.0-59.6) 7 56.3% (23.5-89.2) 0 . (.-.) 11 13.1% (5.0-21.1)
Total 2 4.2% (0.0-10.0) 3 4.8% (0.0-10.4) 6 7.8% (1.3-14.3) 15 21.8% (11.1-32.5) 36 59.7% (46.5-72.9) 1 1.7% (0.0-5.1) 63 100.0% (_-_)
Participated in on-the-job training
Yes 1 5.1% (0.0-15.2) 0 . (.-.) 1 2.7% (0.0-8.2) 9 29.7% (11.0-48.5) 15 62.5% (42.1-83.0) . . . 26 73.7% (55.3-92.1)
No 0 . (.-.) 1 10.4% (0.0-31.5) 2 15.1% (0.0-37.4) 2 23.5% (0.0-57.1) 3 51.0% (9.2-92.8) . . . 8 26.3% (7.9-44.7)
Total 1 3.7% (0.0-11.3) 1 2.7% (0.0-8.4) 3 6.0% (0.0-13.0) 11 28.1% (11.6-44.5) 18 59.5% (41.0-78.0) . . . 34 100.0% (_-_)
Participated in Job Corps
Yes . . . . . . 2 30.9% (0.0-71.3) 1 12.8% (0.0-39.2) 3 56.3% (12.5-100.0) . . . 6 26.1% (3.9-48.3)
No . . . . . . 2 10.0% (0.0-25.5) 5 27.0% (0.7-53.4) 6 62.9% (32.2-93.7) . . . 13 73.9% (51.7-96.1)
Total . . . . . . 4 15.5% (0.0-32.0) 6 23.3% (3.0-43.6) 9 61.2% (35.4-87.0) . . . 19 100.0% (_-_)

Nevada Department of Employment, Training and Rehabilitation
Federal Fiscal Year 2013 Transition Student Satisfaction Survey
102
Q17. How long have you had your current job? <1 month 1-2 months > 2 months Don't know/Refused Total
N % C.I.(95%) N % C.I.(95%) N % C.I.(95%) N % C.I.(95%) N % C.I.(95%)
Overall Total Total 15 22.7% (11.7-33.6) 37 61.7% (48.7-74.6) 8 12.1% (3.6-20.5) 3 3.5% (0.0-7.7) 63 100.0% (_-_)
Gender
Female 6 25.9% (7.4-44.4) 14 55.6% (34.9-76.2) 4 15.3% (0.6-30.0) 1 3.3% (0.0-9.8) 25 43.4% (29.8-56.9)
Male 9 20.2% (7.2-33.2) 23 66.4% (50.4-82.4) 4 9.6% (0.0-19.2) 2 3.8% (0.0-9.1) 38 56.6% (43.1-70.2)
Total 15 22.7% (11.7-33.6) 37 61.7% (48.7-74.6) 8 12.1% (3.6-20.5) 3 3.5% (0.0-7.7) 63 100.0% (_-_)
Age
<=18 0 . (.-.) 5 100.0% (100.0-100.0) 0 . (.-.) 0 . (.-.) 5 13.9% (1.6-26.2)
Age 19 or older 15 26.4% (14.2-38.5) 32 55.5% (41.8-69.1) 8 14.0% (4.4-23.6) 3 4.1% (0.0-8.9) 58 86.1% (73.8-98.4)
Total 15 22.7% (11.7-33.6) 37 61.7% (48.7-74.6) 8 12.1% (3.6-20.5) 3 3.5% (0.0-7.7) 63 100.0% (_-_)
Race
White 5 19.7% (3.9-35.4) 17 59.4% (40.3-78.5) 4 14.7% (0.9-28.6) 2 6.2% (0.0-15.0) 28 39.0% (26.2-51.8)
Non White 10 24.6% (9.7-39.6) 20 63.1% (45.9-80.4) 4 10.4% (0.0-21.0) 1 1.8% (0.0-5.5) 35 61.0% (48.2-73.8)
Total 15 22.7% (11.7-33.6) 37 61.7% (48.7-74.6) 8 12.1% (3.6-20.5) 3 3.5% (0.0-7.7) 63 100.0% (_-_)
Region
South NV 14 29.1% (14.9-43.3) 23 58.2% (42.3-74.1) 4 9.3% (0.1-18.5) 2 3.4% (0.0-8.3) 43 74.5% (63.6-85.4)
North NV 1 8.3% (0.0-24.6) 5 59.2% (25.9-92.5) 3 32.5% (0.6-64.4) 0 . (.-.) 9 12.5% (4.3-20.6)
Rural NV 0 . (.-.) 9 83.8% (62.1-100.0) 1 8.5% (0.0-25.1) 1 7.7% (0.0-22.8) 11 13.1% (5.0-21.1)
Total 15 22.7% (11.7-33.6) 37 61.7% (48.7-74.6) 8 12.1% (3.6-20.5) 3 3.5% (0.0-7.7) 63 100.0% (_-_)
Participated in on-the-job training
Yes 4 12.5% (0.0-25.1) 19 77.0% (60.1-94.0) 2 7.8% (0.0-19.2) 1 2.7% (0.0-8.3) 26 73.7% (55.3-92.1)
No 2 21.7% (0.0-52.7) 6 78.3% (47.3-100.0) 0 . (.-.) 0 . (.-.) 8 26.3% (7.9-44.7)
Total 6 14.9% (2.6-27.3) 25 77.4% (62.5-92.3) 2 5.7% (0.0-14.2) 1 2.0% (0.0-6.1) 34 100.0% (_-_)
Participated in Job Corps
Yes 1 14.2% (0.0-43.2) 4 69.1% (28.7-100.0) 1 16.7% (0.0-49.7) 0 . (.-.) 6 26.1% (3.9-48.3)
No 2 10.1% (0.0-25.6) 8 73.5% (47.6-99.4) 1 5.0% (0.0-15.9) 2 11.4% (0.0-28.9) 13 73.9% (51.7-96.1)
Total 3 11.2% (0.0-25.0) 12 72.4% (50.3-94.4) 2 8.1% (0.0-20.3) 2 8.4% (0.0-21.2) 19 100.0% (_-_)

Nevada Department of Employment, Training and Rehabilitation
Federal Fiscal Year 2013 Transition Student Satisfaction Survey
103
Q18. How many hours do you normally work each week?
1 - 16 or fewer hours/week 17-31 hours/week 32-39 hours/week 40 or more hours/week Don't know/Refused Total
N % C.I.(95%) N % C.I.(95%) N % C.I.(95%) N % C.I.(95%) N % C.I.(95%) N % C.I.(95%)
Overall Total Total 21 33.2% (20.6-45.8) 10 13.6% (5.2-22.1) 8 17.5% (5.0-30.1) 18 25.5% (14.2-36.9) 6 10.1% (2.0-18.2) 63 100.0% (_-_)
Gender
Female 10 44.0% (23.3-64.7) 6 18.8% (4.0-33.7) 1 2.9% (0.0-8.6) 4 17.1% (1.1-33.1) 4 17.2% (1.3-33.1) 25 43.4% (29.8-56.9)
Male 11 24.9% (10.7-39.2) 4 9.6% (0.1-19.2) 7 28.8% (9.4-48.2) 14 32.0% (16.1-48.0) 2 4.6% (0.0-11.3) 38 56.6% (43.1-70.2)
Total 21 33.2% (20.6-45.8) 10 13.6% (5.2-22.1) 8 17.5% (5.0-30.1) 18 25.5% (14.2-36.9) 6 10.1% (2.0-18.2) 63 100.0% (_-_)
Age
<=18 2 24.4% (0.0-59.2) 0 . (.-.) 2 62.2% (18.9-100.0) 0 . (.-.) 1 13.3% (0.0-39.9) 5 13.9% (1.6-26.2)
Age 19 or older 19 34.6% (21.3-47.9) 10 15.8% (6.2-25.4) 6 10.3% (2.2-18.5) 18 29.7% (17.2-42.2) 5 9.6% (1.1-18.0) 58 86.1% (73.8-98.4)
Total 21 33.2% (20.6-45.8) 10 13.6% (5.2-22.1) 8 17.5% (5.0-30.1) 18 25.5% (14.2-36.9) 6 10.1% (2.0-18.2) 63 100.0% (_-_)
Race
White 6 23.1% (6.4-39.7) 7 23.8% (7.6-40.0) 4 16.7% (1.5-32.0) 8 26.0% (9.4-42.7) 3 10.3% (0.0-22.0) 28 39.0% (26.2-51.8)
Non White 15 39.7% (21.9-57.5) 3 7.1% (0.0-15.6) 4 18.1% (0.0-36.1) 10 25.2% (10.0-40.5) 3 9.9% (0.0-20.9) 35 61.0% (48.2-73.8)
Total 21 33.2% (20.6-45.8) 10 13.6% (5.2-22.1) 8 17.5% (5.0-30.1) 18 25.5% (14.2-36.9) 6 10.1% (2.0-18.2) 63 100.0% (_-_)
Region
South NV 17 38.0% (22.3-53.7) 6 12.0% (2.3-21.8) 6 19.6% (3.8-35.4) 9 18.1% (6.3-29.9) 5 12.2% (1.7-22.7) 43 74.5% (63.6-85.4)
North NV 3 30.2% (0.0-61.1) 1 10.6% (0.0-30.8) 2 23.6% (0.0-53.2) 3 35.6% (2.2-69.0) 0 . (.-.) 9 12.5% (4.3-20.6)
Rural NV 1 8.5% (0.0-25.1) 3 25.6% (0.0-52.1) 0 . (.-.) 6 58.2% (27.3-89.1) 1 7.7% (0.0-22.8) 11 13.1% (5.0-21.1)
Total 21 33.2% (20.6-45.8) 10 13.6% (5.2-22.1) 8 17.5% (5.0-30.1) 18 25.5% (14.2-36.9) 6 10.1% (2.0-18.2) 63 100.0% (_-_)
Participated in on-the-job training
Yes 11 40.7% (19.6-61.9) 4 13.9% (0.0-27.9) 6 27.8% (6.1-49.5) 3 9.2% (0.0-20.2) 2 8.4% (0.0-20.1) 26 73.7% (55.3-92.1)
No 3 25.6% (0.0-56.0) 1 7.5% (0.0-23.2) 1 29.3% (0.0-75.3) 2 23.5% (0.0-57.1) 1 14.2% (0.0-41.7) 8 26.3% (7.9-44.7)
Total 14 36.7% (18.7-54.8) 5 12.2% (1.0-23.4) 7 28.2% (8.1-48.3) 5 13.0% (0.8-25.2) 3 9.9% (0.0-21.2) 34 100.0% (_-_)
Participated in Job Corps
Yes 2 28.5% (0.0-66.7) 1 16.7% (0.0-49.7) 1 20.4% (0.0-59.0) 2 34.4% (0.0-77.7) . . . 6 26.1% (3.9-48.3)
No 3 18.6% (0.0-41.6) 3 15.0% (0.0-34.1) 4 51.7% (16.5-87.0) 3 14.6% (0.0-33.1) . . . 13 73.9% (51.7-96.1)
Total 5 21.2% (1.2-41.2) 4 15.5% (0.0-32.0) 5 43.6% (13.0-74.1) 5 19.8% (0.7-38.8) . . . 19 100.0% (_-_)
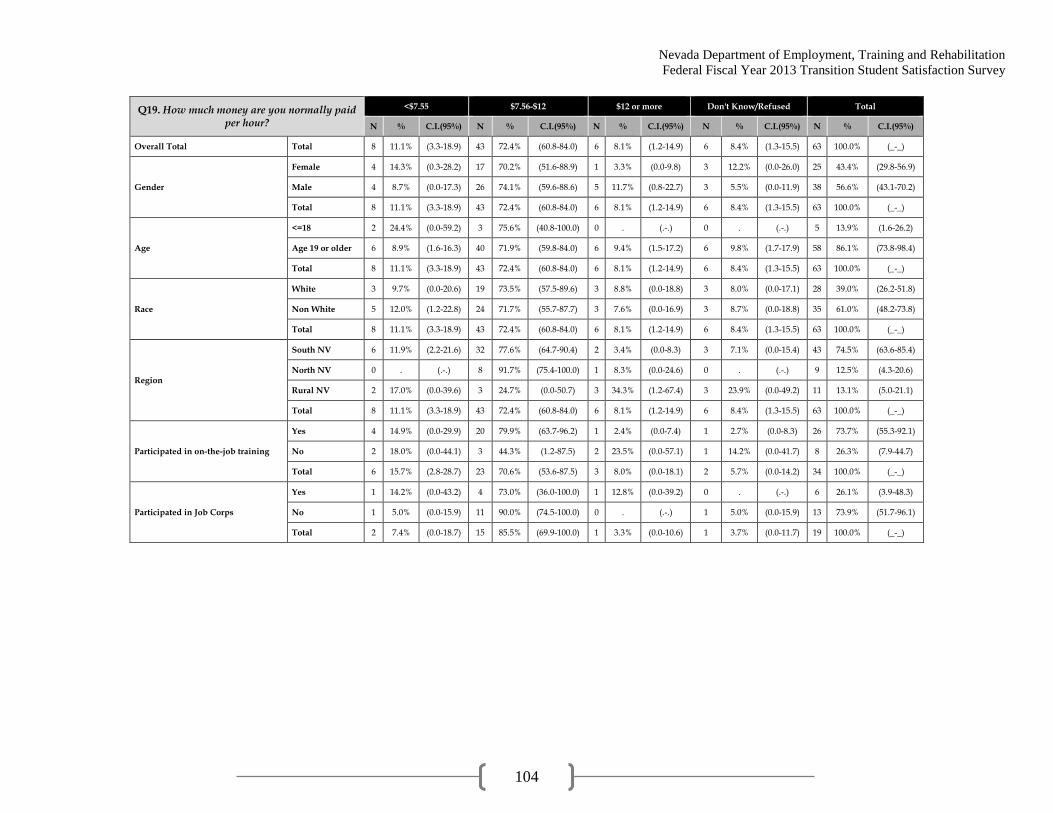
Nevada Department of Employment, Training and Rehabilitation
Federal Fiscal Year 2013 Transition Student Satisfaction Survey
104
Q19. How much money are you normally paid per hour?
<$7.55 $7.56-$12 $12 or more Don't Know/Refused Total
N % C.I.(95%) N % C.I.(95%) N % C.I.(95%) N % C.I.(95%) N % C.I.(95%)
Overall Total Total 8 11.1% (3.3-18.9) 43 72.4% (60.8-84.0) 6 8.1% (1.2-14.9) 6 8.4% (1.3-15.5) 63 100.0% (_-_)
Gender
Female 4 14.3% (0.3-28.2) 17 70.2% (51.6-88.9) 1 3.3% (0.0-9.8) 3 12.2% (0.0-26.0) 25 43.4% (29.8-56.9)
Male 4 8.7% (0.0-17.3) 26 74.1% (59.6-88.6) 5 11.7% (0.8-22.7) 3 5.5% (0.0-11.9) 38 56.6% (43.1-70.2)
Total 8 11.1% (3.3-18.9) 43 72.4% (60.8-84.0) 6 8.1% (1.2-14.9) 6 8.4% (1.3-15.5) 63 100.0% (_-_)
Age
<=18 2 24.4% (0.0-59.2) 3 75.6% (40.8-100.0) 0 . (.-.) 0 . (.-.) 5 13.9% (1.6-26.2)
Age 19 or older 6 8.9% (1.6-16.3) 40 71.9% (59.8-84.0) 6 9.4% (1.5-17.2) 6 9.8% (1.7-17.9) 58 86.1% (73.8-98.4)
Total 8 11.1% (3.3-18.9) 43 72.4% (60.8-84.0) 6 8.1% (1.2-14.9) 6 8.4% (1.3-15.5) 63 100.0% (_-_)
Race
White 3 9.7% (0.0-20.6) 19 73.5% (57.5-89.6) 3 8.8% (0.0-18.8) 3 8.0% (0.0-17.1) 28 39.0% (26.2-51.8)
Non White 5 12.0% (1.2-22.8) 24 71.7% (55.7-87.7) 3 7.6% (0.0-16.9) 3 8.7% (0.0-18.8) 35 61.0% (48.2-73.8)
Total 8 11.1% (3.3-18.9) 43 72.4% (60.8-84.0) 6 8.1% (1.2-14.9) 6 8.4% (1.3-15.5) 63 100.0% (_-_)
Region
South NV 6 11.9% (2.2-21.6) 32 77.6% (64.7-90.4) 2 3.4% (0.0-8.3) 3 7.1% (0.0-15.4) 43 74.5% (63.6-85.4)
North NV 0 . (.-.) 8 91.7% (75.4-100.0) 1 8.3% (0.0-24.6) 0 . (.-.) 9 12.5% (4.3-20.6)
Rural NV 2 17.0% (0.0-39.6) 3 24.7% (0.0-50.7) 3 34.3% (1.2-67.4) 3 23.9% (0.0-49.2) 11 13.1% (5.0-21.1)
Total 8 11.1% (3.3-18.9) 43 72.4% (60.8-84.0) 6 8.1% (1.2-14.9) 6 8.4% (1.3-15.5) 63 100.0% (_-_)
Participated in on-the-job training
Yes 4 14.9% (0.0-29.9) 20 79.9% (63.7-96.2) 1 2.4% (0.0-7.4) 1 2.7% (0.0-8.3) 26 73.7% (55.3-92.1)
No 2 18.0% (0.0-44.1) 3 44.3% (1.2-87.5) 2 23.5% (0.0-57.1) 1 14.2% (0.0-41.7) 8 26.3% (7.9-44.7)
Total 6 15.7% (2.8-28.7) 23 70.6% (53.6-87.5) 3 8.0% (0.0-18.1) 2 5.7% (0.0-14.2) 34 100.0% (_-_)
Participated in Job Corps
Yes 1 14.2% (0.0-43.2) 4 73.0% (36.0-100.0) 1 12.8% (0.0-39.2) 0 . (.-.) 6 26.1% (3.9-48.3)
No 1 5.0% (0.0-15.9) 11 90.0% (74.5-100.0) 0 . (.-.) 1 5.0% (0.0-15.9) 13 73.9% (51.7-96.1)
Total 2 7.4% (0.0-18.7) 15 85.5% (69.9-100.0) 1 3.3% (0.0-10.6) 1 3.7% (0.0-11.7) 19 100.0% (_-_)

Nevada Department of Employment, Training and Rehabilitation
Federal Fiscal Year 2013 Transition Student Satisfaction Survey
105
Q20a. Benefits: Paid federal or state holidays Yes No Don't Know/Refused Total
N % C.I.(95%) N % C.I.(95%) N % C.I.(95%) N % C.I.(95%)
Overall Total Total 24 37.8% (24.4-51.1) 30 47.5% (33.9-61.2) 9 14.7% (5.3-24.0) 63 100.0% (_-_)
Gender
Female 9 37.9% (17.6-58.2) 12 45.9% (25.3-66.5) 4 16.2% (1.0-31.5) 25 43.4% (29.8-56.9)
Male 15 37.7% (19.9-55.4) 18 48.8% (30.5-67.1) 5 13.5% (1.9-25.1) 38 56.6% (43.1-70.2)
Total 24 37.8% (24.4-51.1) 30 47.5% (33.9-61.2) 9 14.7% (5.3-24.0) 63 100.0% (_-_)
Age
<=18 3 57.8% (8.4-100.0) 2 42.2% (0.0-91.6) 0 . (.-.) 5 13.9% (1.6-26.2)
Age 19 or older 21 34.5% (21.6-47.5) 28 48.4% (34.7-62.2) 9 17.1% (6.5-27.6) 58 86.1% (73.8-98.4)
Total 24 37.8% (24.4-51.1) 30 47.5% (33.9-61.2) 9 14.7% (5.3-24.0) 63 100.0% (_-_)
Race
White 7 23.7% (7.4-40.0) 15 52.3% (32.9-71.6) 6 24.0% (7.0-41.1) 28 39.0% (26.2-51.8)
Non White 17 46.7% (28.1-65.4) 15 44.5% (25.8-63.2) 3 8.7% (0.0-18.8) 35 61.0% (48.2-73.8)
Total 24 37.8% (24.4-51.1) 30 47.5% (33.9-61.2) 9 14.7% (5.3-24.0) 63 100.0% (_-_)
Region
South NV 17 39.1% (22.8-55.3) 18 43.5% (27.0-60.0) 8 17.4% (5.7-29.2) 43 74.5% (63.6-85.4)
North NV 3 35.6% (2.2-69.0) 5 50.7% (16.3-85.1) 1 13.7% (0.0-38.9) 9 12.5% (4.3-20.6)
Rural NV 4 32.4% (4.0-60.9) 7 67.6% (39.1-96.0) 0 . (.-.) 11 13.1% (5.0-21.1)
Total 24 37.8% (24.4-51.1) 30 47.5% (33.9-61.2) 9 14.7% (5.3-24.0) 63 100.0% (_-_)
Participated in on-the-job training
Yes 13 53.2% (31.6-74.9) 8 28.8% (9.8-47.7) 5 18.0% (2.4-33.6) 26 73.7% (55.3-92.1)
No 3 21.9% (0.0-48.8) 4 64.0% (27.2-100.0) 1 14.2% (0.0-41.7) 8 26.3% (7.9-44.7)
Total 16 45.0% (25.5-64.5) 12 38.0% (18.6-57.4) 6 17.0% (3.4-30.6) 34 100.0% (_-_)
Participated in Job Corps
Yes 3 48.6% (3.7-93.5) 3 51.4% (6.5-96.3) 0 . (.-.) 6 26.1% (3.9-48.3)
No 5 41.8% (5.9-77.7) 7 53.2% (17.3-89.1) 1 5.0% (0.0-15.9) 13 73.9% (51.7-96.1)
Total 8 43.6% (14.6-72.5) 10 52.7% (23.7-81.7) 1 3.7% (0.0-11.7) 19 100.0% (_-_)

Nevada Department of Employment, Training and Rehabilitation
Federal Fiscal Year 2013 Transition Student Satisfaction Survey
106
Q20b. Benefits: Paid vacation Yes No Don't Know/Refused Total
N % C.I.(95%) N % C.I.(95%) N % C.I.(95%) N % C.I.(95%)
Overall Total Total 25 41.6% (28.0-55.2) 33 49.6% (35.9-63.3) 5 8.8% (1.1-16.5) 63 100.0% (_-_)
Gender
Female 8 33.3% (13.6-53.0) 14 52.7% (32.0-73.5) 3 14.0% (0.0-28.9) 25 43.4% (29.8-56.9)
Male 17 48.0% (29.7-66.3) 19 47.2% (29.0-65.4) 2 4.8% (0.0-11.7) 38 56.6% (43.1-70.2)
Total 25 41.6% (28.0-55.2) 33 49.6% (35.9-63.3) 5 8.8% (1.1-16.5) 63 100.0% (_-_)
Age
<=18 1 31.1% (0.0-80.5) 3 55.5% (6.0-100.0) 1 13.3% (0.0-39.9) 5 13.9% (1.6-26.2)
Age 19 or older 24 43.3% (29.6-57.0) 30 48.6% (34.9-62.4) 4 8.0% (0.1-16.0) 58 86.1% (73.8-98.4)
Total 25 41.6% (28.0-55.2) 33 49.6% (35.9-63.3) 5 8.8% (1.1-16.5) 63 100.0% (_-_)
Race
White 11 42.3% (23.0-61.6) 16 53.6% (34.2-73.0) 1 4.1% (0.0-12.2) 28 39.0% (26.2-51.8)
Non White 14 41.2% (22.6-59.8) 17 47.0% (28.4-65.7) 4 11.8% (0.3-23.2) 35 61.0% (48.2-73.8)
Total 25 41.6% (28.0-55.2) 33 49.6% (35.9-63.3) 5 8.8% (1.1-16.5) 63 100.0% (_-_)
Region
South NV 19 42.9% (26.5-59.2) 19 45.3% (28.8-61.9) 5 11.8% (1.5-22.0) 43 74.5% (63.6-85.4)
North NV 3 41.0% (6.3-75.7) 6 59.0% (24.3-93.7) 0 . (.-.) 9 12.5% (4.3-20.6)
Rural NV 3 35.1% (2.0-68.3) 8 64.9% (31.7-98.0) 0 . (.-.) 11 13.1% (5.0-21.1)
Total 25 41.6% (28.0-55.2) 33 49.6% (35.9-63.3) 5 8.8% (1.1-16.5) 63 100.0% (_-_)
Participated in on-the-job training
Yes 9 37.0% (14.9-59.0) 14 52.0% (30.0-74.0) 3 11.1% (0.0-23.9) 26 73.7% (55.3-92.1)
No 2 24.3% (0.0-58.3) 5 61.6% (21.8-100.0) 1 14.2% (0.0-41.7) 8 26.3% (7.9-44.7)
Total 11 33.6% (14.7-52.6) 19 54.5% (34.9-74.1) 4 11.9% (0.0-23.8) 34 100.0% (_-_)
Participated in Job Corps
Yes 2 35.8% (0.0-79.7) 4 64.2% (20.3-100.0) 0 . (.-.) 6 26.1% (3.9-48.3)
No 4 38.1% (2.1-74.2) 8 56.9% (20.9-92.8) 1 5.0% (0.0-15.9) 13 73.9% (51.7-96.1)
Total 6 37.5% (8.5-66.5) 12 58.8% (29.7-87.8) 1 3.7% (0.0-11.7) 19 100.0% (_-_)
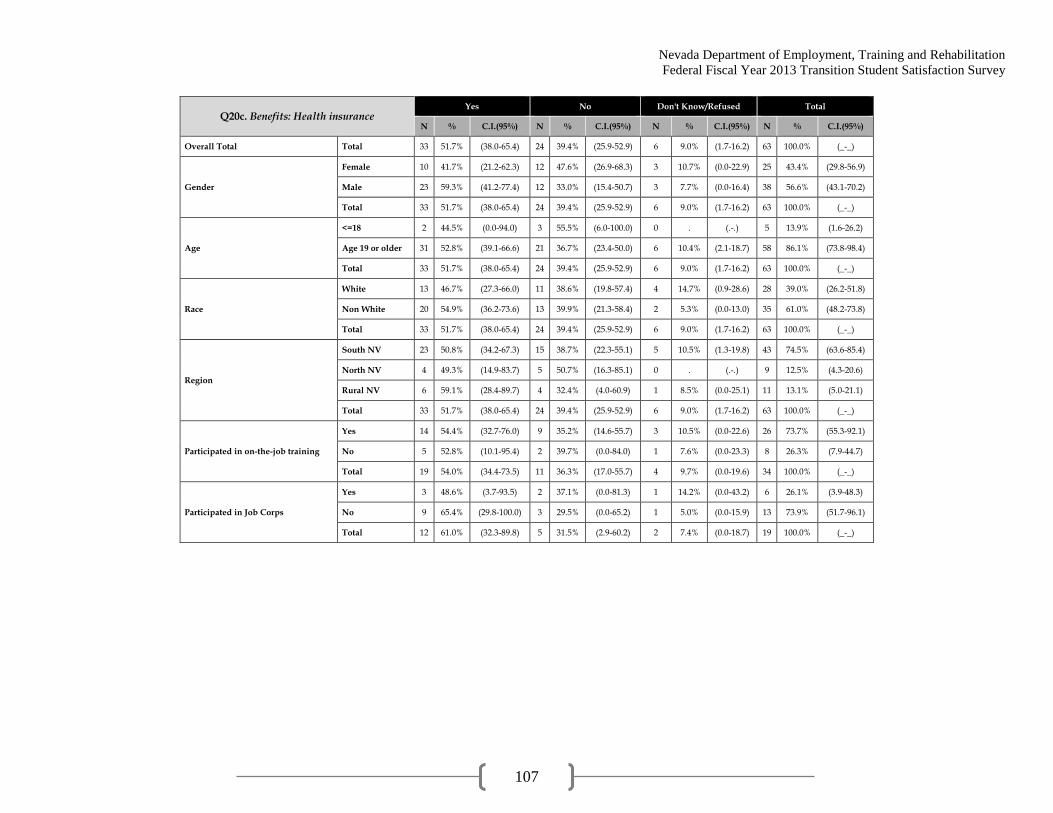
Nevada Department of Employment, Training and Rehabilitation
Federal Fiscal Year 2013 Transition Student Satisfaction Survey
107
Q20c. Benefits: Health insurance Yes No Don't Know/Refused Total
N % C.I.(95%) N % C.I.(95%) N % C.I.(95%) N % C.I.(95%)
Overall Total Total 33 51.7% (38.0-65.4) 24 39.4% (25.9-52.9) 6 9.0% (1.7-16.2) 63 100.0% (_-_)
Gender
Female 10 41.7% (21.2-62.3) 12 47.6% (26.9-68.3) 3 10.7% (0.0-22.9) 25 43.4% (29.8-56.9)
Male 23 59.3% (41.2-77.4) 12 33.0% (15.4-50.7) 3 7.7% (0.0-16.4) 38 56.6% (43.1-70.2)
Total 33 51.7% (38.0-65.4) 24 39.4% (25.9-52.9) 6 9.0% (1.7-16.2) 63 100.0% (_-_)
Age
<=18 2 44.5% (0.0-94.0) 3 55.5% (6.0-100.0) 0 . (.-.) 5 13.9% (1.6-26.2)
Age 19 or older 31 52.8% (39.1-66.6) 21 36.7% (23.4-50.0) 6 10.4% (2.1-18.7) 58 86.1% (73.8-98.4)
Total 33 51.7% (38.0-65.4) 24 39.4% (25.9-52.9) 6 9.0% (1.7-16.2) 63 100.0% (_-_)
Race
White 13 46.7% (27.3-66.0) 11 38.6% (19.8-57.4) 4 14.7% (0.9-28.6) 28 39.0% (26.2-51.8)
Non White 20 54.9% (36.2-73.6) 13 39.9% (21.3-58.4) 2 5.3% (0.0-13.0) 35 61.0% (48.2-73.8)
Total 33 51.7% (38.0-65.4) 24 39.4% (25.9-52.9) 6 9.0% (1.7-16.2) 63 100.0% (_-_)
Region
South NV 23 50.8% (34.2-67.3) 15 38.7% (22.3-55.1) 5 10.5% (1.3-19.8) 43 74.5% (63.6-85.4)
North NV 4 49.3% (14.9-83.7) 5 50.7% (16.3-85.1) 0 . (.-.) 9 12.5% (4.3-20.6)
Rural NV 6 59.1% (28.4-89.7) 4 32.4% (4.0-60.9) 1 8.5% (0.0-25.1) 11 13.1% (5.0-21.1)
Total 33 51.7% (38.0-65.4) 24 39.4% (25.9-52.9) 6 9.0% (1.7-16.2) 63 100.0% (_-_)
Participated in on-the-job training
Yes 14 54.4% (32.7-76.0) 9 35.2% (14.6-55.7) 3 10.5% (0.0-22.6) 26 73.7% (55.3-92.1)
No 5 52.8% (10.1-95.4) 2 39.7% (0.0-84.0) 1 7.6% (0.0-23.3) 8 26.3% (7.9-44.7)
Total 19 54.0% (34.4-73.5) 11 36.3% (17.0-55.7) 4 9.7% (0.0-19.6) 34 100.0% (_-_)
Participated in Job Corps
Yes 3 48.6% (3.7-93.5) 2 37.1% (0.0-81.3) 1 14.2% (0.0-43.2) 6 26.1% (3.9-48.3)
No 9 65.4% (29.8-100.0) 3 29.5% (0.0-65.2) 1 5.0% (0.0-15.9) 13 73.9% (51.7-96.1)
Total 12 61.0% (32.3-89.8) 5 31.5% (2.9-60.2) 2 7.4% (0.0-18.7) 19 100.0% (_-_)
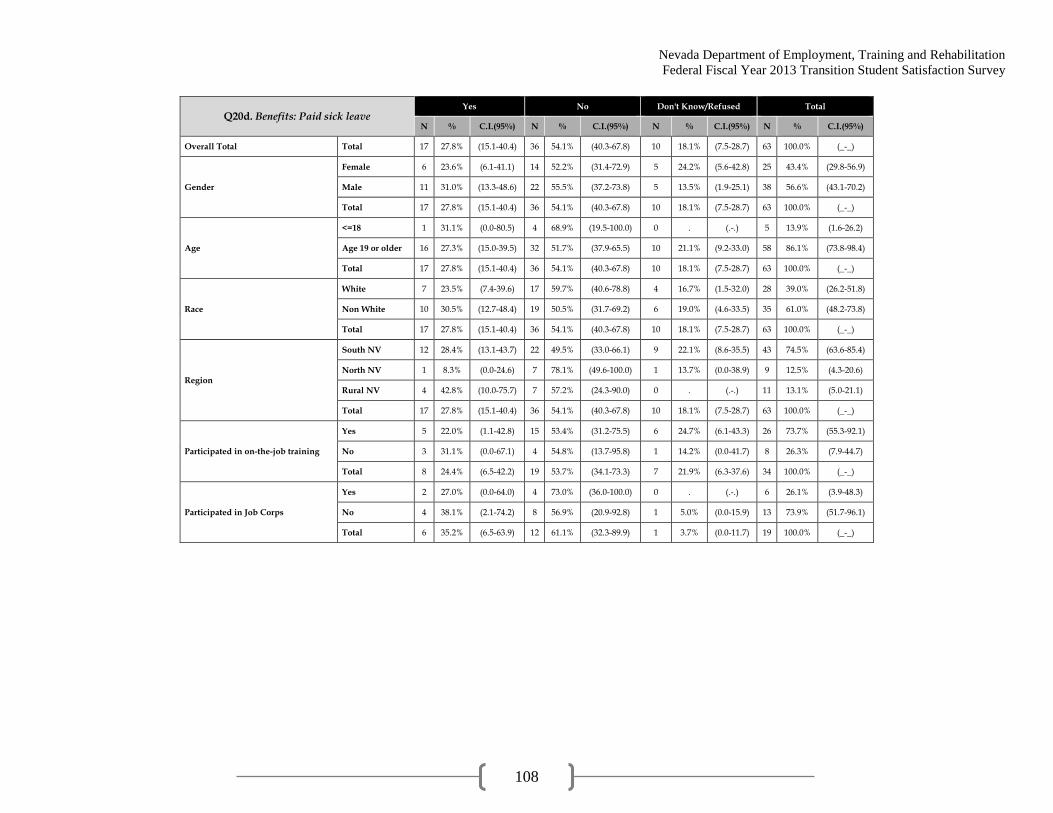
Nevada Department of Employment, Training and Rehabilitation
Federal Fiscal Year 2013 Transition Student Satisfaction Survey
108
Q20d. Benefits: Paid sick leave Yes No Don't Know/Refused Total
N % C.I.(95%) N % C.I.(95%) N % C.I.(95%) N % C.I.(95%)
Overall Total Total 17 27.8% (15.1-40.4) 36 54.1% (40.3-67.8) 10 18.1% (7.5-28.7) 63 100.0% (_-_)
Gender
Female 6 23.6% (6.1-41.1) 14 52.2% (31.4-72.9) 5 24.2% (5.6-42.8) 25 43.4% (29.8-56.9)
Male 11 31.0% (13.3-48.6) 22 55.5% (37.2-73.8) 5 13.5% (1.9-25.1) 38 56.6% (43.1-70.2)
Total 17 27.8% (15.1-40.4) 36 54.1% (40.3-67.8) 10 18.1% (7.5-28.7) 63 100.0% (_-_)
Age
<=18 1 31.1% (0.0-80.5) 4 68.9% (19.5-100.0) 0 . (.-.) 5 13.9% (1.6-26.2)
Age 19 or older 16 27.3% (15.0-39.5) 32 51.7% (37.9-65.5) 10 21.1% (9.2-33.0) 58 86.1% (73.8-98.4)
Total 17 27.8% (15.1-40.4) 36 54.1% (40.3-67.8) 10 18.1% (7.5-28.7) 63 100.0% (_-_)
Race
White 7 23.5% (7.4-39.6) 17 59.7% (40.6-78.8) 4 16.7% (1.5-32.0) 28 39.0% (26.2-51.8)
Non White 10 30.5% (12.7-48.4) 19 50.5% (31.7-69.2) 6 19.0% (4.6-33.5) 35 61.0% (48.2-73.8)
Total 17 27.8% (15.1-40.4) 36 54.1% (40.3-67.8) 10 18.1% (7.5-28.7) 63 100.0% (_-_)
Region
South NV 12 28.4% (13.1-43.7) 22 49.5% (33.0-66.1) 9 22.1% (8.6-35.5) 43 74.5% (63.6-85.4)
North NV 1 8.3% (0.0-24.6) 7 78.1% (49.6-100.0) 1 13.7% (0.0-38.9) 9 12.5% (4.3-20.6)
Rural NV 4 42.8% (10.0-75.7) 7 57.2% (24.3-90.0) 0 . (.-.) 11 13.1% (5.0-21.1)
Total 17 27.8% (15.1-40.4) 36 54.1% (40.3-67.8) 10 18.1% (7.5-28.7) 63 100.0% (_-_)
Participated in on-the-job training
Yes 5 22.0% (1.1-42.8) 15 53.4% (31.2-75.5) 6 24.7% (6.1-43.3) 26 73.7% (55.3-92.1)
No 3 31.1% (0.0-67.1) 4 54.8% (13.7-95.8) 1 14.2% (0.0-41.7) 8 26.3% (7.9-44.7)
Total 8 24.4% (6.5-42.2) 19 53.7% (34.1-73.3) 7 21.9% (6.3-37.6) 34 100.0% (_-_)
Participated in Job Corps
Yes 2 27.0% (0.0-64.0) 4 73.0% (36.0-100.0) 0 . (.-.) 6 26.1% (3.9-48.3)
No 4 38.1% (2.1-74.2) 8 56.9% (20.9-92.8) 1 5.0% (0.0-15.9) 13 73.9% (51.7-96.1)
Total 6 35.2% (6.5-63.9) 12 61.1% (32.3-89.9) 1 3.7% (0.0-11.7) 19 100.0% (_-_)

Nevada Department of Employment, Training and Rehabilitation
Federal Fiscal Year 2013 Transition Student Satisfaction Survey
109
Q20e. Benefits: Retirement plan Yes No Don't Know/Refused Total
N % C.I.(95%) N % C.I.(95%) N % C.I.(95%) N % C.I.(95%)
Overall Total Total 23 38.8% (25.2-52.3) 32 48.7% (35.0-62.4) 8 12.5% (3.9-21.1) 63 100.0% (_-_)
Gender
Female 9 37.4% (17.2-57.7) 12 47.6% (26.9-68.3) 4 15.0% (0.6-29.3) 25 43.4% (29.8-56.9)
Male 14 39.8% (21.6-58.0) 20 49.5% (31.3-67.8) 4 10.7% (0.3-21.1) 38 56.6% (43.1-70.2)
Total 23 38.8% (25.2-52.3) 32 48.7% (35.0-62.4) 8 12.5% (3.9-21.1) 63 100.0% (_-_)
Age
<=18 1 31.1% (0.0-80.5) 3 55.5% (6.0-100.0) 1 13.3% (0.0-39.9) 5 13.9% (1.6-26.2)
Age 19 or older 22 40.0% (26.4-53.6) 29 47.6% (33.9-61.3) 7 12.4% (3.4-21.4) 58 86.1% (73.8-98.4)
Total 23 38.8% (25.2-52.3) 32 48.7% (35.0-62.4) 8 12.5% (3.9-21.1) 63 100.0% (_-_)
Race
White 10 35.6% (17.0-54.2) 13 45.3% (26.0-64.5) 5 19.1% (3.6-34.7) 28 39.0% (26.2-51.8)
Non White 13 40.8% (22.1-59.5) 19 50.9% (32.1-69.6) 3 8.3% (0.0-17.9) 35 61.0% (48.2-73.8)
Total 23 38.8% (25.2-52.3) 32 48.7% (35.0-62.4) 8 12.5% (3.9-21.1) 63 100.0% (_-_)
Region
South NV 15 37.1% (20.9-53.4) 22 49.8% (33.3-66.4) 6 13.0% (2.7-23.4) 43 74.5% (63.6-85.4)
North NV 3 35.6% (2.2-69.0) 5 50.7% (16.3-85.1) 1 13.7% (0.0-38.9) 9 12.5% (4.3-20.6)
Rural NV 5 51.4% (19.4-83.3) 5 40.1% (9.7-70.5) 1 8.5% (0.0-25.1) 11 13.1% (5.0-21.1)
Total 23 38.8% (25.2-52.3) 32 48.7% (35.0-62.4) 8 12.5% (3.9-21.1) 63 100.0% (_-_)
Participated in on-the-job training
Yes 7 31.1% (9.1-53.2) 13 47.1% (25.4-68.9) 6 21.7% (4.8-38.7) 26 73.7% (55.3-92.1)
No 5 52.8% (10.1-95.4) 3 47.2% (4.6-89.9) 0 . (.-.) 8 26.3% (7.9-44.7)
Total 12 36.8% (17.5-56.1) 16 47.2% (27.6-66.7) 6 16.0% (3.1-29.0) 34 100.0% (_-_)
Participated in Job Corps
Yes 3 48.6% (3.7-93.5) 3 51.4% (6.5-96.3) 0 . (.-.) 6 26.1% (3.9-48.3)
No 5 43.1% (7.2-79.1) 6 46.8% (11.0-82.7) 2 10.0% (0.0-25.5) 13 73.9% (51.7-96.1)
Total 8 44.6% (15.6-73.6) 9 48.0% (19.0-77.0) 2 7.4% (0.0-18.7) 19 100.0% (_-_)

Nevada Department of Employment, Training and Rehabilitation
Federal Fiscal Year 2013 Transition Student Satisfaction Survey
110
Q20f. Benefits: Meals Yes No Don't Know/Refused Total
N % C.I.(95%) N % C.I.(95%) N % C.I.(95%) N % C.I.(95%)
Overall Total Total 19 30.2% (17.5-43.0) 40 62.8% (49.5-76.2) 4 6.9% (0.0-13.8) 63 100.0% (_-_)
Gender
Female 8 30.9% (12.0-49.9) 15 59.4% (39.0-79.8) 2 9.7% (0.0-22.7) 25 43.4% (29.8-56.9)
Male 11 29.7% (12.5-46.9) 25 65.5% (47.9-83.1) 2 4.8% (0.0-11.7) 38 56.6% (43.1-70.2)
Total 19 30.2% (17.5-43.0) 40 62.8% (49.5-76.2) 4 6.9% (0.0-13.8) 63 100.0% (_-_)
Age
<=18 2 44.5% (0.0-94.0) 3 55.5% (6.0-100.0) 0 . (.-.) 5 13.9% (1.6-26.2)
Age 19 or older 17 27.9% (15.8-40.1) 37 64.0% (50.9-77.2) 4 8.0% (0.1-16.0) 58 86.1% (73.8-98.4)
Total 19 30.2% (17.5-43.0) 40 62.8% (49.5-76.2) 4 6.9% (0.0-13.8) 63 100.0% (_-_)
Race
White 7 25.9% (8.8-42.9) 20 70.0% (52.1-87.9) 1 4.1% (0.0-12.2) 28 39.0% (26.2-51.8)
Non White 12 33.0% (15.3-50.8) 20 58.3% (39.8-76.8) 3 8.7% (0.0-18.8) 35 61.0% (48.2-73.8)
Total 19 30.2% (17.5-43.0) 40 62.8% (49.5-76.2) 4 6.9% (0.0-13.8) 63 100.0% (_-_)
Region
South NV 15 34.6% (18.7-50.4) 24 56.1% (39.7-72.6) 4 9.3% (0.1-18.5) 43 74.5% (63.6-85.4)
North NV 3 27.1% (0.0-55.6) 6 72.9% (44.4-100.0) 0 . (.-.) 9 12.5% (4.3-20.6)
Rural NV 1 8.5% (0.0-25.1) 10 91.5% (74.9-100.0) 0 . (.-.) 11 13.1% (5.0-21.1)
Total 19 30.2% (17.5-43.0) 40 62.8% (49.5-76.2) 4 6.9% (0.0-13.8) 63 100.0% (_-_)
Participated in on-the-job training
Yes 7 30.6% (8.7-52.5) 16 57.8% (35.5-80.0) 3 11.6% (0.0-25.2) 26 73.7% (55.3-92.1)
No 2 21.7% (0.0-52.6) 6 78.3% (47.4-100.0) 0 . (.-.) 8 26.3% (7.9-44.7)
Total 9 28.2% (9.9-46.6) 22 63.2% (44.0-82.3) 3 8.6% (0.0-18.7) 34 100.0% (_-_)
Participated in Job Corps
Yes 1 16.7% (0.0-49.7) 5 83.3% (50.3-100.0) 0 . (.-.) 6 26.1% (3.9-48.3)
No 6 48.1% (12.2-84.1) 6 46.8% (10.9-82.7) 1 5.0% (0.0-15.9) 13 73.9% (51.7-96.1)
Total 7 39.9% (11.0-68.8) 11 56.3% (27.4-85.3) 1 3.7% (0.0-11.7) 19 100.0% (_-_)

Nevada Department of Employment, Training and Rehabilitation
Federal Fiscal Year 2013 Transition Student Satisfaction Survey
111
Q20g. Benefits: Daycare Yes No Don't Know/Refused Total
N % C.I.(95%) N % C.I.(95%) N % C.I.(95%) N % C.I.(95%)
Overall Total Total 5 9.0% (1.1-16.9) 55 86.6% (77.4-95.8) 3 4.3% (0.0-9.5) 63 100.0% (_-_)
Gender
Female 4 17.1% (1.1-33.1) 20 78.1% (60.4-95.7) 1 4.8% (0.0-14.3) 25 43.4% (29.8-56.9)
Male 1 2.8% (0.0-8.5) 35 93.2% (85.3-100.0) 2 4.0% (0.0-9.5) 38 56.6% (43.1-70.2)
Total 5 9.0% (1.1-16.9) 55 86.6% (77.4-95.8) 3 4.3% (0.0-9.5) 63 100.0% (_-_)
Age
<=18 0 . (.-.) 5 100.0% (100.0-100.0) 0 . (.-.) 5 13.9% (1.6-26.2)
Age 19 or older 5 10.5% (1.4-19.5) 50 84.5% (74.1-94.9) 3 5.0% (0.0-11.0) 58 86.1% (73.8-98.4)
Total 5 9.0% (1.1-16.9) 55 86.6% (77.4-95.8) 3 4.3% (0.0-9.5) 63 100.0% (_-_)
Race
White 2 7.0% (0.0-16.7) 26 93.0% (83.3-100.0) 0 . (.-.) 28 39.0% (26.2-51.8)
Non White 3 10.3% (0.0-21.7) 29 82.6% (68.9-96.2) 3 7.1% (0.0-15.6) 35 61.0% (48.2-73.8)
Total 5 9.0% (1.1-16.9) 55 86.6% (77.4-95.8) 3 4.3% (0.0-9.5) 63 100.0% (_-_)
Region
South NV 4 10.6% (0.4-20.8) 36 83.6% (71.7-95.4) 3 5.8% (0.0-12.8) 43 74.5% (63.6-85.4)
North NV 0 . (.-.) 9 100.0% (100.0-100.0) 0 . (.-.) 9 12.5% (4.3-20.6)
Rural NV 1 8.5% (0.0-25.1) 10 91.5% (74.9-100.0) 0 . (.-.) 11 13.1% (5.0-21.1)
Total 5 9.0% (1.1-16.9) 55 86.6% (77.4-95.8) 3 4.3% (0.0-9.5) 63 100.0% (_-_)
Participated in on-the-job training
Yes 2 8.9% (0.0-21.5) 22 85.7% (71.2-100.0) 2 5.4% (0.0-13.2) 26 73.7% (55.3-92.1)
No 0 . (.-.) 8 100.0% (100.0-100.0) 0 . (.-.) 8 26.3% (7.9-44.7)
Total 2 6.6% (0.0-16.0) 30 89.4% (78.6-100.0) 2 4.0% (0.0-9.8) 34 100.0% (_-_)
Participated in Job Corps
Yes 0 . (.-.) 6 100.0% (100.0-100.0) 0 . (.-.) 6 26.1% (3.9-48.3)
No 1 7.2% (0.0-22.6) 10 82.7% (61.1-100.0) 2 10.1% (0.0-25.6) 13 73.9% (51.7-96.1)
Total 1 5.3% (0.0-16.7) 16 87.2% (71.4-100.0) 2 7.4% (0.0-18.8) 19 100.0% (_-_)
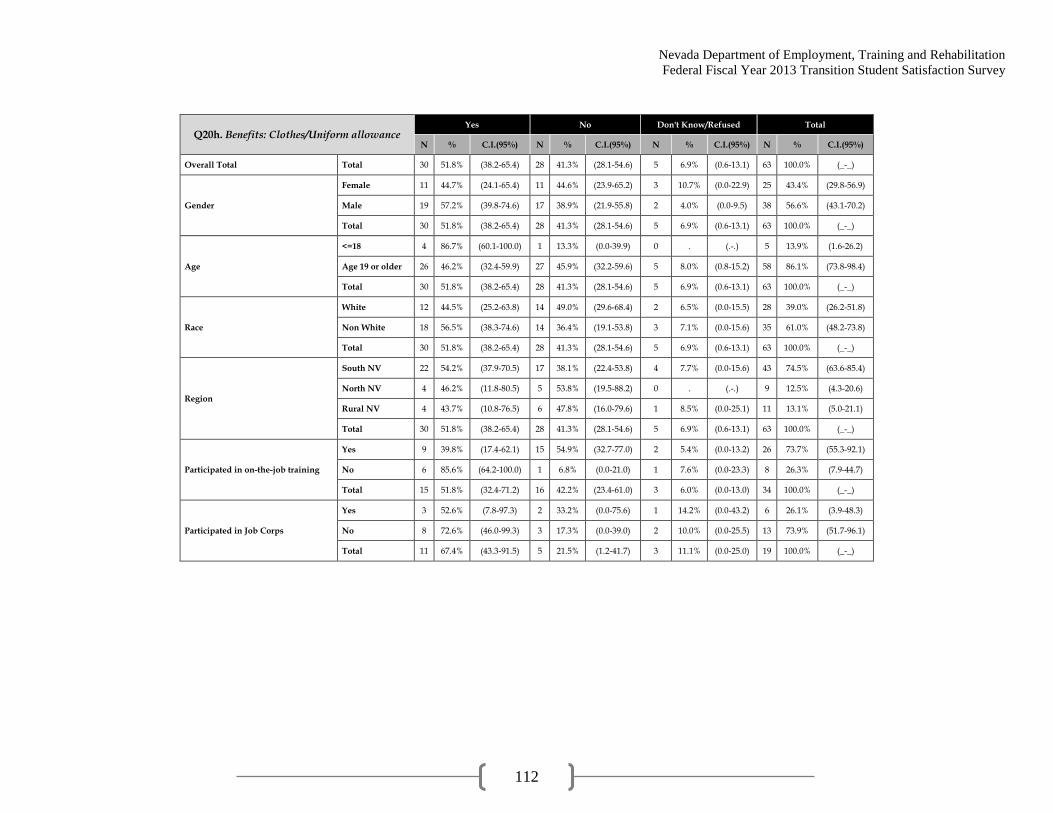
Nevada Department of Employment, Training and Rehabilitation
Federal Fiscal Year 2013 Transition Student Satisfaction Survey
112
Q20h. Benefits: Clothes/Uniform allowance Yes No Don't Know/Refused Total
N % C.I.(95%) N % C.I.(95%) N % C.I.(95%) N % C.I.(95%)
Overall Total Total 30 51.8% (38.2-65.4) 28 41.3% (28.1-54.6) 5 6.9% (0.6-13.1) 63 100.0% (_-_)
Gender
Female 11 44.7% (24.1-65.4) 11 44.6% (23.9-65.2) 3 10.7% (0.0-22.9) 25 43.4% (29.8-56.9)
Male 19 57.2% (39.8-74.6) 17 38.9% (21.9-55.8) 2 4.0% (0.0-9.5) 38 56.6% (43.1-70.2)
Total 30 51.8% (38.2-65.4) 28 41.3% (28.1-54.6) 5 6.9% (0.6-13.1) 63 100.0% (_-_)
Age
<=18 4 86.7% (60.1-100.0) 1 13.3% (0.0-39.9) 0 . (.-.) 5 13.9% (1.6-26.2)
Age 19 or older 26 46.2% (32.4-59.9) 27 45.9% (32.2-59.6) 5 8.0% (0.8-15.2) 58 86.1% (73.8-98.4)
Total 30 51.8% (38.2-65.4) 28 41.3% (28.1-54.6) 5 6.9% (0.6-13.1) 63 100.0% (_-_)
Race
White 12 44.5% (25.2-63.8) 14 49.0% (29.6-68.4) 2 6.5% (0.0-15.5) 28 39.0% (26.2-51.8)
Non White 18 56.5% (38.3-74.6) 14 36.4% (19.1-53.8) 3 7.1% (0.0-15.6) 35 61.0% (48.2-73.8)
Total 30 51.8% (38.2-65.4) 28 41.3% (28.1-54.6) 5 6.9% (0.6-13.1) 63 100.0% (_-_)
Region
South NV 22 54.2% (37.9-70.5) 17 38.1% (22.4-53.8) 4 7.7% (0.0-15.6) 43 74.5% (63.6-85.4)
North NV 4 46.2% (11.8-80.5) 5 53.8% (19.5-88.2) 0 . (.-.) 9 12.5% (4.3-20.6)
Rural NV 4 43.7% (10.8-76.5) 6 47.8% (16.0-79.6) 1 8.5% (0.0-25.1) 11 13.1% (5.0-21.1)
Total 30 51.8% (38.2-65.4) 28 41.3% (28.1-54.6) 5 6.9% (0.6-13.1) 63 100.0% (_-_)
Participated in on-the-job training
Yes 9 39.8% (17.4-62.1) 15 54.9% (32.7-77.0) 2 5.4% (0.0-13.2) 26 73.7% (55.3-92.1)
No 6 85.6% (64.2-100.0) 1 6.8% (0.0-21.0) 1 7.6% (0.0-23.3) 8 26.3% (7.9-44.7)
Total 15 51.8% (32.4-71.2) 16 42.2% (23.4-61.0) 3 6.0% (0.0-13.0) 34 100.0% (_-_)
Participated in Job Corps
Yes 3 52.6% (7.8-97.3) 2 33.2% (0.0-75.6) 1 14.2% (0.0-43.2) 6 26.1% (3.9-48.3)
No 8 72.6% (46.0-99.3) 3 17.3% (0.0-39.0) 2 10.0% (0.0-25.5) 13 73.9% (51.7-96.1)
Total 11 67.4% (43.3-91.5) 5 21.5% (1.2-41.7) 3 11.1% (0.0-25.0) 19 100.0% (_-_)
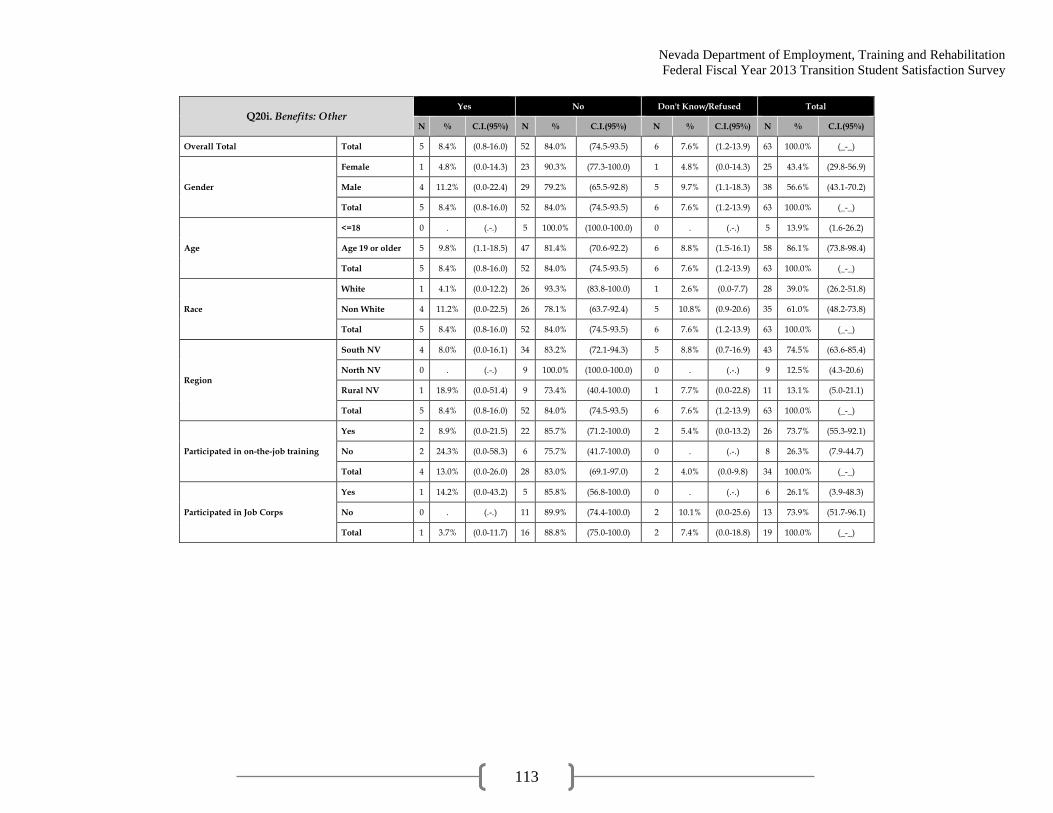
Nevada Department of Employment, Training and Rehabilitation
Federal Fiscal Year 2013 Transition Student Satisfaction Survey
113
Q20i. Benefits: Other Yes No Don't Know/Refused Total
N % C.I.(95%) N % C.I.(95%) N % C.I.(95%) N % C.I.(95%)
Overall Total Total 5 8.4% (0.8-16.0) 52 84.0% (74.5-93.5) 6 7.6% (1.2-13.9) 63 100.0% (_-_)
Gender
Female 1 4.8% (0.0-14.3) 23 90.3% (77.3-100.0) 1 4.8% (0.0-14.3) 25 43.4% (29.8-56.9)
Male 4 11.2% (0.0-22.4) 29 79.2% (65.5-92.8) 5 9.7% (1.1-18.3) 38 56.6% (43.1-70.2)
Total 5 8.4% (0.8-16.0) 52 84.0% (74.5-93.5) 6 7.6% (1.2-13.9) 63 100.0% (_-_)
Age
<=18 0 . (.-.) 5 100.0% (100.0-100.0) 0 . (.-.) 5 13.9% (1.6-26.2)
Age 19 or older 5 9.8% (1.1-18.5) 47 81.4% (70.6-92.2) 6 8.8% (1.5-16.1) 58 86.1% (73.8-98.4)
Total 5 8.4% (0.8-16.0) 52 84.0% (74.5-93.5) 6 7.6% (1.2-13.9) 63 100.0% (_-_)
Race
White 1 4.1% (0.0-12.2) 26 93.3% (83.8-100.0) 1 2.6% (0.0-7.7) 28 39.0% (26.2-51.8)
Non White 4 11.2% (0.0-22.5) 26 78.1% (63.7-92.4) 5 10.8% (0.9-20.6) 35 61.0% (48.2-73.8)
Total 5 8.4% (0.8-16.0) 52 84.0% (74.5-93.5) 6 7.6% (1.2-13.9) 63 100.0% (_-_)
Region
South NV 4 8.0% (0.0-16.1) 34 83.2% (72.1-94.3) 5 8.8% (0.7-16.9) 43 74.5% (63.6-85.4)
North NV 0 . (.-.) 9 100.0% (100.0-100.0) 0 . (.-.) 9 12.5% (4.3-20.6)
Rural NV 1 18.9% (0.0-51.4) 9 73.4% (40.4-100.0) 1 7.7% (0.0-22.8) 11 13.1% (5.0-21.1)
Total 5 8.4% (0.8-16.0) 52 84.0% (74.5-93.5) 6 7.6% (1.2-13.9) 63 100.0% (_-_)
Participated in on-the-job training
Yes 2 8.9% (0.0-21.5) 22 85.7% (71.2-100.0) 2 5.4% (0.0-13.2) 26 73.7% (55.3-92.1)
No 2 24.3% (0.0-58.3) 6 75.7% (41.7-100.0) 0 . (.-.) 8 26.3% (7.9-44.7)
Total 4 13.0% (0.0-26.0) 28 83.0% (69.1-97.0) 2 4.0% (0.0-9.8) 34 100.0% (_-_)
Participated in Job Corps
Yes 1 14.2% (0.0-43.2) 5 85.8% (56.8-100.0) 0 . (.-.) 6 26.1% (3.9-48.3)
No 0 . (.-.) 11 89.9% (74.4-100.0) 2 10.1% (0.0-25.6) 13 73.9% (51.7-96.1)
Total 1 3.7% (0.0-11.7) 16 88.8% (75.0-100.0) 2 7.4% (0.0-18.8) 19 100.0% (_-_)
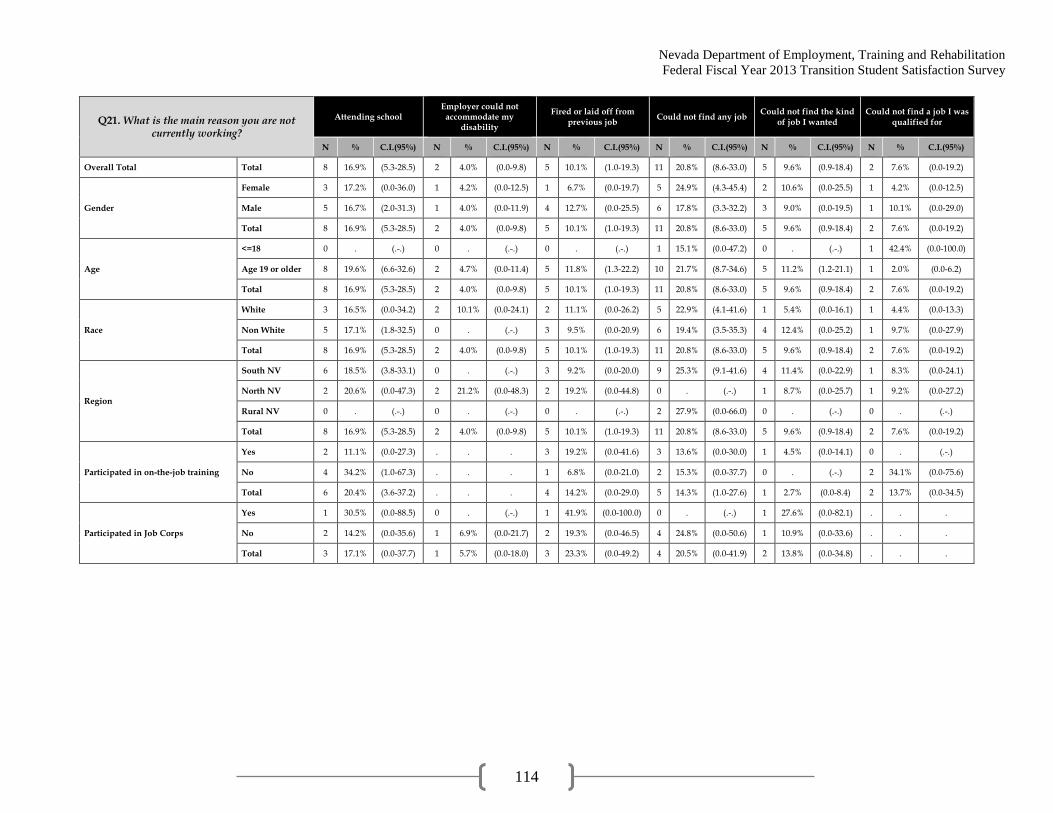
Nevada Department of Employment, Training and Rehabilitation
Federal Fiscal Year 2013 Transition Student Satisfaction Survey
114
Q21. What is the main reason you are not currently working?
Attending school Employer could not
accommodate my disability
Fired or laid off from previous job
Could not find any job Could not find the kind
of job I wanted Could not find a job I was
qualified for
N % C.I.(95%) N % C.I.(95%) N % C.I.(95%) N % C.I.(95%) N % C.I.(95%) N % C.I.(95%)
Overall Total Total 8 16.9% (5.3-28.5) 2 4.0% (0.0-9.8) 5 10.1% (1.0-19.3) 11 20.8% (8.6-33.0) 5 9.6% (0.9-18.4) 2 7.6% (0.0-19.2)
Gender
Female 3 17.2% (0.0-36.0) 1 4.2% (0.0-12.5) 1 6.7% (0.0-19.7) 5 24.9% (4.3-45.4) 2 10.6% (0.0-25.5) 1 4.2% (0.0-12.5)
Male 5 16.7% (2.0-31.3) 1 4.0% (0.0-11.9) 4 12.7% (0.0-25.5) 6 17.8% (3.3-32.2) 3 9.0% (0.0-19.5) 1 10.1% (0.0-29.0)
Total 8 16.9% (5.3-28.5) 2 4.0% (0.0-9.8) 5 10.1% (1.0-19.3) 11 20.8% (8.6-33.0) 5 9.6% (0.9-18.4) 2 7.6% (0.0-19.2)
Age
<=18 0 . (.-.) 0 . (.-.) 0 . (.-.) 1 15.1% (0.0-47.2) 0 . (.-.) 1 42.4% (0.0-100.0)
Age 19 or older 8 19.6% (6.6-32.6) 2 4.7% (0.0-11.4) 5 11.8% (1.3-22.2) 10 21.7% (8.7-34.6) 5 11.2% (1.2-21.1) 1 2.0% (0.0-6.2)
Total 8 16.9% (5.3-28.5) 2 4.0% (0.0-9.8) 5 10.1% (1.0-19.3) 11 20.8% (8.6-33.0) 5 9.6% (0.9-18.4) 2 7.6% (0.0-19.2)
Race
White 3 16.5% (0.0-34.2) 2 10.1% (0.0-24.1) 2 11.1% (0.0-26.2) 5 22.9% (4.1-41.6) 1 5.4% (0.0-16.1) 1 4.4% (0.0-13.3)
Non White 5 17.1% (1.8-32.5) 0 . (.-.) 3 9.5% (0.0-20.9) 6 19.4% (3.5-35.3) 4 12.4% (0.0-25.2) 1 9.7% (0.0-27.9)
Total 8 16.9% (5.3-28.5) 2 4.0% (0.0-9.8) 5 10.1% (1.0-19.3) 11 20.8% (8.6-33.0) 5 9.6% (0.9-18.4) 2 7.6% (0.0-19.2)
Region
South NV 6 18.5% (3.8-33.1) 0 . (.-.) 3 9.2% (0.0-20.0) 9 25.3% (9.1-41.6) 4 11.4% (0.0-22.9) 1 8.3% (0.0-24.1)
North NV 2 20.6% (0.0-47.3) 2 21.2% (0.0-48.3) 2 19.2% (0.0-44.8) 0 . (.-.) 1 8.7% (0.0-25.7) 1 9.2% (0.0-27.2)
Rural NV 0 . (.-.) 0 . (.-.) 0 . (.-.) 2 27.9% (0.0-66.0) 0 . (.-.) 0 . (.-.)
Total 8 16.9% (5.3-28.5) 2 4.0% (0.0-9.8) 5 10.1% (1.0-19.3) 11 20.8% (8.6-33.0) 5 9.6% (0.9-18.4) 2 7.6% (0.0-19.2)
Participated in on-the-job training
Yes 2 11.1% (0.0-27.3) . . . 3 19.2% (0.0-41.6) 3 13.6% (0.0-30.0) 1 4.5% (0.0-14.1) 0 . (.-.)
No 4 34.2% (1.0-67.3) . . . 1 6.8% (0.0-21.0) 2 15.3% (0.0-37.7) 0 . (.-.) 2 34.1% (0.0-75.6)
Total 6 20.4% (3.6-37.2) . . . 4 14.2% (0.0-29.0) 5 14.3% (1.0-27.6) 1 2.7% (0.0-8.4) 2 13.7% (0.0-34.5)
Participated in Job Corps
Yes 1 30.5% (0.0-88.5) 0 . (.-.) 1 41.9% (0.0-100.0) 0 . (.-.) 1 27.6% (0.0-82.1) . . .
No 2 14.2% (0.0-35.6) 1 6.9% (0.0-21.7) 2 19.3% (0.0-46.5) 4 24.8% (0.0-50.6) 1 10.9% (0.0-33.6) . . .
Total 3 17.1% (0.0-37.7) 1 5.7% (0.0-18.0) 3 23.3% (0.0-49.2) 4 20.5% (0.0-41.9) 2 13.8% (0.0-34.8) . . .
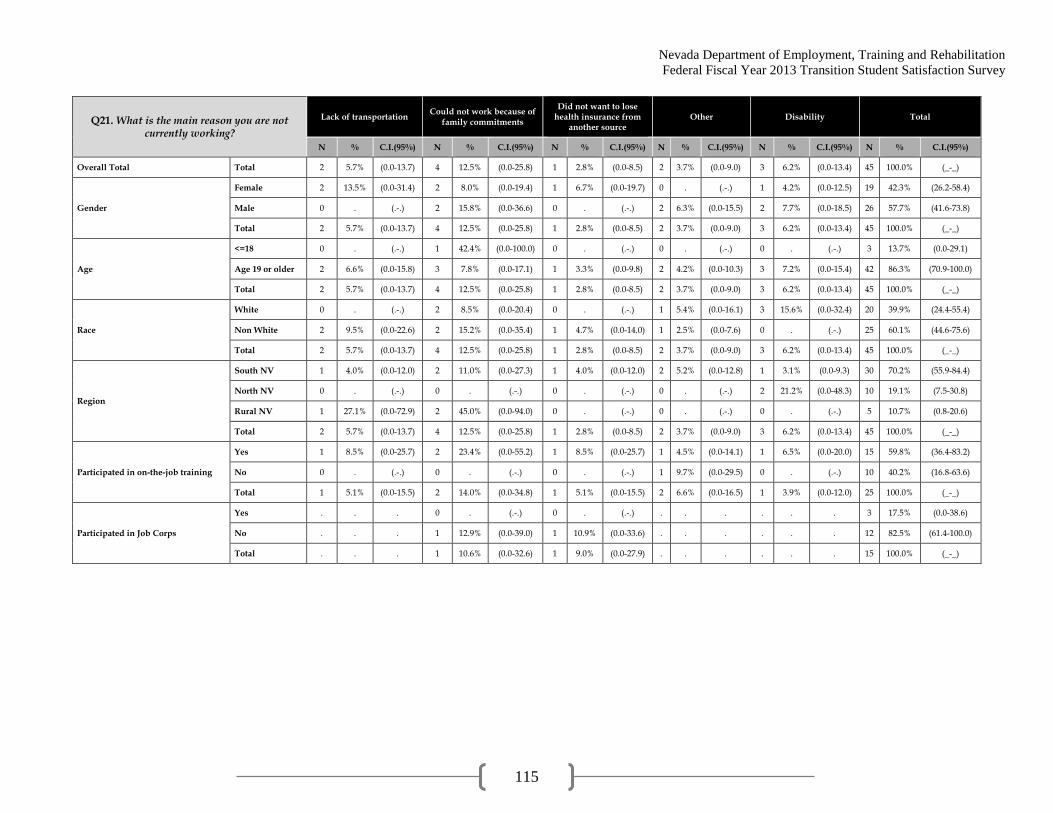
Nevada Department of Employment, Training and Rehabilitation
Federal Fiscal Year 2013 Transition Student Satisfaction Survey
115
Q21. What is the main reason you are not currently working?
Lack of transportation Could not work because of
family commitments
Did not want to lose health insurance from
another source Other Disability Total
N % C.I.(95%) N % C.I.(95%) N % C.I.(95%) N % C.I.(95%) N % C.I.(95%) N % C.I.(95%)
Overall Total Total 2 5.7% (0.0-13.7) 4 12.5% (0.0-25.8) 1 2.8% (0.0-8.5) 2 3.7% (0.0-9.0) 3 6.2% (0.0-13.4) 45 100.0% (_-_)
Gender
Female 2 13.5% (0.0-31.4) 2 8.0% (0.0-19.4) 1 6.7% (0.0-19.7) 0 . (.-.) 1 4.2% (0.0-12.5) 19 42.3% (26.2-58.4)
Male 0 . (.-.) 2 15.8% (0.0-36.6) 0 . (.-.) 2 6.3% (0.0-15.5) 2 7.7% (0.0-18.5) 26 57.7% (41.6-73.8)
Total 2 5.7% (0.0-13.7) 4 12.5% (0.0-25.8) 1 2.8% (0.0-8.5) 2 3.7% (0.0-9.0) 3 6.2% (0.0-13.4) 45 100.0% (_-_)
Age
<=18 0 . (.-.) 1 42.4% (0.0-100.0) 0 . (.-.) 0 . (.-.) 0 . (.-.) 3 13.7% (0.0-29.1)
Age 19 or older 2 6.6% (0.0-15.8) 3 7.8% (0.0-17.1) 1 3.3% (0.0-9.8) 2 4.2% (0.0-10.3) 3 7.2% (0.0-15.4) 42 86.3% (70.9-100.0)
Total 2 5.7% (0.0-13.7) 4 12.5% (0.0-25.8) 1 2.8% (0.0-8.5) 2 3.7% (0.0-9.0) 3 6.2% (0.0-13.4) 45 100.0% (_-_)
Race
White 0 . (.-.) 2 8.5% (0.0-20.4) 0 . (.-.) 1 5.4% (0.0-16.1) 3 15.6% (0.0-32.4) 20 39.9% (24.4-55.4)
Non White 2 9.5% (0.0-22.6) 2 15.2% (0.0-35.4) 1 4.7% (0.0-14.0) 1 2.5% (0.0-7.6) 0 . (.-.) 25 60.1% (44.6-75.6)
Total 2 5.7% (0.0-13.7) 4 12.5% (0.0-25.8) 1 2.8% (0.0-8.5) 2 3.7% (0.0-9.0) 3 6.2% (0.0-13.4) 45 100.0% (_-_)
Region
South NV 1 4.0% (0.0-12.0) 2 11.0% (0.0-27.3) 1 4.0% (0.0-12.0) 2 5.2% (0.0-12.8) 1 3.1% (0.0-9.3) 30 70.2% (55.9-84.4)
North NV 0 . (.-.) 0 . (.-.) 0 . (.-.) 0 . (.-.) 2 21.2% (0.0-48.3) 10 19.1% (7.5-30.8)
Rural NV 1 27.1% (0.0-72.9) 2 45.0% (0.0-94.0) 0 . (.-.) 0 . (.-.) 0 . (.-.) 5 10.7% (0.8-20.6)
Total 2 5.7% (0.0-13.7) 4 12.5% (0.0-25.8) 1 2.8% (0.0-8.5) 2 3.7% (0.0-9.0) 3 6.2% (0.0-13.4) 45 100.0% (_-_)
Participated in on-the-job training
Yes 1 8.5% (0.0-25.7) 2 23.4% (0.0-55.2) 1 8.5% (0.0-25.7) 1 4.5% (0.0-14.1) 1 6.5% (0.0-20.0) 15 59.8% (36.4-83.2)
No 0 . (.-.) 0 . (.-.) 0 . (.-.) 1 9.7% (0.0-29.5) 0 . (.-.) 10 40.2% (16.8-63.6)
Total 1 5.1% (0.0-15.5) 2 14.0% (0.0-34.8) 1 5.1% (0.0-15.5) 2 6.6% (0.0-16.5) 1 3.9% (0.0-12.0) 25 100.0% (_-_)
Participated in Job Corps
Yes . . . 0 . (.-.) 0 . (.-.) . . . . . . 3 17.5% (0.0-38.6)
No . . . 1 12.9% (0.0-39.0) 1 10.9% (0.0-33.6) . . . . . . 12 82.5% (61.4-100.0)
Total . . . 1 10.6% (0.0-32.6) 1 9.0% (0.0-27.9) . . . . . . 15 100.0% (_-_)

Nevada Department of Employment, Training and Rehabilitation
Federal Fiscal Year 2013 Transition Student Satisfaction Survey
116
Q22. Do you receive health insurance coverage from ANY source? Not currently employed?
Yes No Don't Know/Refused Total
N % C.I.(95%) N % C.I.(95%) N % C.I.(95%) N % C.I.(95%)
Overall Total Total 40 56.7% (43.6-69.8) 22 34.0% (21.2-46.9) 7 9.3% (2.1-16.4) 69 100.0% (_-_)
Gender
Female 18 58.5% (40.2-76.8) 10 32.5% (15.0-49.9) 3 9.1% (0.0-19.4) 31 45.8% (32.8-58.8)
Male 22 55.2% (36.6-73.7) 12 35.4% (16.9-53.9) 4 9.5% (0.0-19.3) 38 54.2% (41.2-67.2)
Total 40 56.7% (43.6-69.8) 22 34.0% (21.2-46.9) 7 9.3% (2.1-16.4) 69 100.0% (_-_)
Age
<=18 4 51.7% (6.4-97.0) 2 48.3% (3.0-93.6) 0 . (.-.) 6 15.8% (3.3-28.2)
Age 19 or older 36 57.6% (44.7-70.6) 20 31.4% (19.2-43.5) 7 11.0% (2.7-19.3) 63 84.2% (71.8-96.7)
Total 40 56.7% (43.6-69.8) 22 34.0% (21.2-46.9) 7 9.3% (2.1-16.4) 69 100.0% (_-_)
Race
White 20 65.1% (47.8-82.4) 9 29.0% (12.5-45.6) 2 5.9% (0.0-14.0) 31 39.3% (27.0-51.6)
Non White 20 51.2% (33.1-69.4) 13 37.3% (19.2-55.3) 5 11.5% (1.0-22.0) 38 60.7% (48.4-73.0)
Total 40 56.7% (43.6-69.8) 22 34.0% (21.2-46.9) 7 9.3% (2.1-16.4) 69 100.0% (_-_)
Region
South NV 27 59.2% (43.0-75.5) 14 34.0% (17.9-50.1) 4 6.7% (0.0-13.7) 45 71.2% (60.2-82.2)
North NV 8 54.3% (28.0-80.5) 5 33.0% (8.1-57.8) 2 12.8% (0.0-29.8) 15 18.1% (9.1-27.0)
Rural NV 5 43.8% (9.4-78.2) 3 35.9% (1.2-70.7) 1 20.3% (0.0-54.9) 9 10.7% (3.3-18.1)
Total 40 56.7% (43.6-69.8) 22 34.0% (21.2-46.9) 7 9.3% (2.1-16.4) 69 100.0% (_-_)
Participated in on-the-job training
Yes 16 70.6% (51.0-90.2) 7 26.6% (7.5-45.6) 1 2.9% (0.0-8.7) 24 63.6% (44.4-82.8)
No 4 27.1% (0.4-53.9) 6 62.0% (31.3-92.7) 2 10.8% (0.0-26.7) 12 36.4% (17.2-55.6)
Total 20 54.8% (35.5-74.0) 13 39.5% (20.1-58.8) 3 5.8% (0.0-12.6) 36 100.0% (_-_)
Participated in Job Corps
Yes 2 40.8% (0.0-88.6) 3 59.2% (11.4-100.0) 0 . (.-.) 5 21.3% (2.0-40.6)
No 8 43.1% (13.8-72.5) 5 39.1% (7.5-70.7) 2 17.8% (0.0-42.1) 15 78.7% (59.4-98.0)
Total 10 42.6% (17.4-67.8) 8 43.4% (16.7-70.1) 2 14.0% (0.0-33.5) 20 100.0% (_-_)

Nevada Department of Employment, Training and Rehabilitation
Federal Fiscal Year 2013 Transition Student Satisfaction Survey
117
Q23a. Ever received: Job placement Yes No Total
N % C.I.(95%) N % C.I.(95%) N % C.I.(95%)
Overall Total Total 57 52.1% (41.8-62.4) 52 47.9% (37.6-58.2) 109 100.0% (_-_)
Gender
Female 25 57.6% (42.3-72.9) 19 42.4% (27.1-57.7) 44 42.5% (32.4-52.7)
Male 32 48.1% (34.3-61.9) 33 51.9% (38.1-65.7) 65 57.5% (47.3-67.6)
Total 57 52.1% (41.8-62.4) 52 47.9% (37.6-58.2) 109 100.0% (_-_)
Age
<=18 5 57.7% (19.3-96.1) 3 42.3% (3.9-80.7) 8 13.7% (4.3-23.1)
Age 19 or older 52 51.2% (41.0-61.5) 49 48.8% (38.5-59.0) 101 86.3% (76.9-95.7)
Total 57 52.1% (41.8-62.4) 52 47.9% (37.6-58.2) 109 100.0% (_-_)
Race
White 22 45.6% (31.2-60.0) 27 54.4% (40.0-68.8) 49 39.9% (30.2-49.7)
Non White 35 56.5% (42.3-70.7) 25 43.5% (29.3-57.7) 60 60.1% (50.3-69.8)
Total 57 52.1% (41.8-62.4) 52 47.9% (37.6-58.2) 109 100.0% (_-_)
Region
South NV 43 57.6% (45.1-70.0) 31 42.4% (30.0-54.9) 74 72.9% (64.4-81.4)
North NV 9 46.2% (23.1-69.4) 10 53.8% (30.6-76.9) 19 15.2% (8.5-21.8)
Rural NV 5 26.5% (5.0-47.9) 11 73.5% (52.1-95.0) 16 12.0% (5.9-18.0)
Total 57 52.1% (41.8-62.4) 52 47.9% (37.6-58.2) 109 100.0% (_-_)
Participated in on-the-job training
Yes 31 79.2% (66.4-92.0) 10 20.8% (8.0-33.6) 41 67.8% (53.7-81.9)
No 7 26.9% (6.6-47.3) 11 73.1% (52.7-93.4) 18 32.2% (18.1-46.3)
Total 38 62.4% (47.9-76.8) 21 37.6% (23.2-52.1) 59 100.0% (_-_)
Participated in Job Corps
Yes 5 60.8% (27.4-94.2) 4 39.2% (5.8-72.6) 9 22.4% (7.7-37.0)
No 16 58.8% (35.3-82.2) 9 41.2% (17.8-64.7) 25 77.6% (63.0-92.3)
Total 21 59.2% (39.5-78.9) 13 40.8% (21.1-60.5) 34 100.0% (_-_)
Currently Employed
Yes 37 59.4% (46.0-72.7) 26 40.6% (27.3-54.0) 63 57.3% (47.0-67.6)
No 19 41.4% (25.5-57.2) 26 58.6% (42.8-74.5) 45 42.7% (32.4-53.0)
Total 56 51.7% (41.3-62.0) 52 48.3% (38.0-58.7) 108 100.0% (_-_)

Nevada Department of Employment, Training and Rehabilitation
Federal Fiscal Year 2013 Transition Student Satisfaction Survey
118
Q23b. Ever received: Job coaching Yes No Don't Know/Refused Total
N % C.I.(95%) N % C.I.(95%) N % C.I.(95%) N % C.I.(95%)
Overall Total Total 54 51.0% (40.7-61.3) 54 48.4% (38.1-58.7) 1 0.6% (0.0-1.9) 109 100.0% (_-_)
Gender
Female 25 56.0% (40.6-71.4) 19 44.0% (28.6-59.4) 0 . (.-.) 44 42.5% (32.4-52.7)
Male 29 47.3% (33.4-61.1) 35 51.6% (37.8-65.5) 1 1.1% (0.0-3.3) 65 57.5% (47.3-67.6)
Total 54 51.0% (40.7-61.3) 54 48.4% (38.1-58.7) 1 0.6% (0.0-1.9) 109 100.0% (_-_)
Age
<=18 6 75.6% (42.6-100.0) 2 24.4% (0.0-57.4) 0 . (.-.) 8 13.7% (4.3-23.1)
Age 19 or older 48 47.0% (36.8-57.3) 52 52.2% (42.0-62.5) 1 0.7% (0.0-2.2) 101 86.3% (76.9-95.7)
Total 54 51.0% (40.7-61.3) 54 48.4% (38.1-58.7) 1 0.6% (0.0-1.9) 109 100.0% (_-_)
Race
White 22 45.7% (31.4-60.1) 27 54.3% (39.9-68.6) 0 . (.-.) 49 39.9% (30.2-49.7)
Non White 32 54.4% (40.3-68.5) 27 44.5% (30.4-58.6) 1 1.1% (0.0-3.2) 60 60.1% (50.3-69.8)
Total 54 51.0% (40.7-61.3) 54 48.4% (38.1-58.7) 1 0.6% (0.0-1.9) 109 100.0% (_-_)
Region
South NV 38 54.3% (41.8-66.7) 35 44.9% (32.5-57.3) 1 0.9% (0.0-2.6) 74 72.9% (64.4-81.4)
North NV 12 58.6% (35.3-81.8) 7 41.4% (18.2-64.7) 0 . (.-.) 19 15.2% (8.5-21.8)
Rural NV 4 21.2% (1.6-40.8) 12 78.8% (59.2-98.4) 0 . (.-.) 16 12.0% (5.9-18.0)
Total 54 51.0% (40.7-61.3) 54 48.4% (38.1-58.7) 1 0.6% (0.0-1.9) 109 100.0% (_-_)
Participated in on-the-job training
Yes 28 72.2% (57.8-86.7) 12 26.1% (11.9-40.3) 1 1.7% (0.0-5.1) 41 67.8% (53.7-81.9)
No 10 50.1% (22.7-77.4) 8 49.9% (22.6-77.3) 0 . (.-.) 18 32.2% (18.1-46.3)
Total 38 65.1% (51.2-78.9) 20 33.8% (20.0-47.5) 1 1.1% (0.0-3.5) 59 100.0% (_-_)
Participated in Job Corps
Yes 6 67.9% (35.4-100.0) 3 32.1% (0.0-64.6) 0 . (.-.) 9 22.4% (7.7-37.0)
No 12 46.3% (23.0-69.6) 12 51.0% (27.6-74.3) 1 2.7% (0.0-8.3) 25 77.6% (63.0-92.3)
Total 18 51.1% (31.4-70.9) 15 46.8% (27.0-66.6) 1 2.1% (0.0-6.4) 34 100.0% (_-_)
Currently Employed
Yes 37 59.1% (45.7-72.5) 25 39.8% (26.4-53.1) 1 1.1% (0.0-3.3) 63 57.3% (47.0-67.6)
No 16 39.0% (22.7-55.3) 29 61.0% (44.7-77.3) 0 . (.-.) 45 42.7% (32.4-53.0)
Total 53 50.5% (40.1-60.9) 54 48.9% (38.5-59.2) 1 0.6% (0.0-1.9) 108 100.0% (_-_)
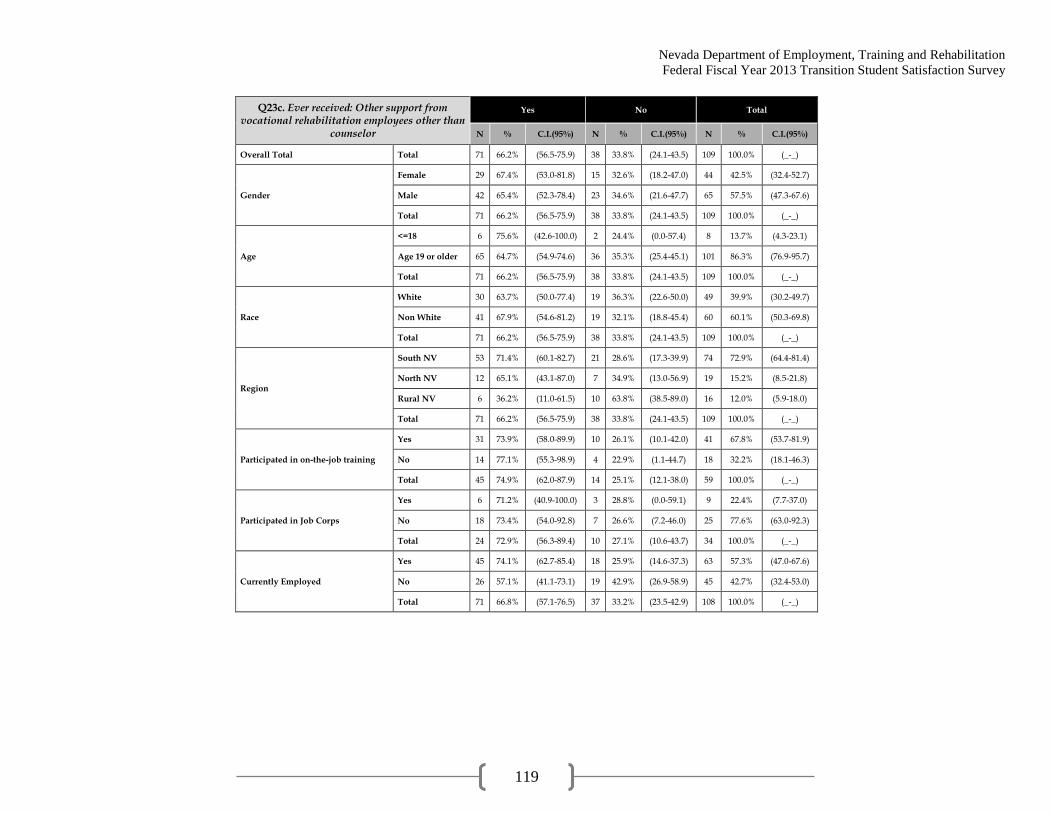
Nevada Department of Employment, Training and Rehabilitation
Federal Fiscal Year 2013 Transition Student Satisfaction Survey
119
Q23c. Ever received: Other support from vocational rehabilitation employees other than
counselor
Yes No Total
N % C.I.(95%) N % C.I.(95%) N % C.I.(95%)
Overall Total Total 71 66.2% (56.5-75.9) 38 33.8% (24.1-43.5) 109 100.0% (_-_)
Gender
Female 29 67.4% (53.0-81.8) 15 32.6% (18.2-47.0) 44 42.5% (32.4-52.7)
Male 42 65.4% (52.3-78.4) 23 34.6% (21.6-47.7) 65 57.5% (47.3-67.6)
Total 71 66.2% (56.5-75.9) 38 33.8% (24.1-43.5) 109 100.0% (_-_)
Age
<=18 6 75.6% (42.6-100.0) 2 24.4% (0.0-57.4) 8 13.7% (4.3-23.1)
Age 19 or older 65 64.7% (54.9-74.6) 36 35.3% (25.4-45.1) 101 86.3% (76.9-95.7)
Total 71 66.2% (56.5-75.9) 38 33.8% (24.1-43.5) 109 100.0% (_-_)
Race
White 30 63.7% (50.0-77.4) 19 36.3% (22.6-50.0) 49 39.9% (30.2-49.7)
Non White 41 67.9% (54.6-81.2) 19 32.1% (18.8-45.4) 60 60.1% (50.3-69.8)
Total 71 66.2% (56.5-75.9) 38 33.8% (24.1-43.5) 109 100.0% (_-_)
Region
South NV 53 71.4% (60.1-82.7) 21 28.6% (17.3-39.9) 74 72.9% (64.4-81.4)
North NV 12 65.1% (43.1-87.0) 7 34.9% (13.0-56.9) 19 15.2% (8.5-21.8)
Rural NV 6 36.2% (11.0-61.5) 10 63.8% (38.5-89.0) 16 12.0% (5.9-18.0)
Total 71 66.2% (56.5-75.9) 38 33.8% (24.1-43.5) 109 100.0% (_-_)
Participated in on-the-job training
Yes 31 73.9% (58.0-89.9) 10 26.1% (10.1-42.0) 41 67.8% (53.7-81.9)
No 14 77.1% (55.3-98.9) 4 22.9% (1.1-44.7) 18 32.2% (18.1-46.3)
Total 45 74.9% (62.0-87.9) 14 25.1% (12.1-38.0) 59 100.0% (_-_)
Participated in Job Corps
Yes 6 71.2% (40.9-100.0) 3 28.8% (0.0-59.1) 9 22.4% (7.7-37.0)
No 18 73.4% (54.0-92.8) 7 26.6% (7.2-46.0) 25 77.6% (63.0-92.3)
Total 24 72.9% (56.3-89.4) 10 27.1% (10.6-43.7) 34 100.0% (_-_)
Currently Employed
Yes 45 74.1% (62.7-85.4) 18 25.9% (14.6-37.3) 63 57.3% (47.0-67.6)
No 26 57.1% (41.1-73.1) 19 42.9% (26.9-58.9) 45 42.7% (32.4-53.0)
Total 71 66.8% (57.1-76.5) 37 33.2% (23.5-42.9) 108 100.0% (_-_)

Nevada Department of Employment, Training and Rehabilitation
Federal Fiscal Year 2013 Transition Student Satisfaction Survey
120
Q23d. Have you EVER received THIRD PARTY CONTRACTOR OR VENDOR SERVICES from
the Vocational Rehabilitation program?
Yes No Don't Know/Refused Total
N % C.I.(95%) N % C.I.(95%) N % C.I.(95%) N % C.I.(95%)
Overall Total Total 17 15.9% (8.2-23.5) 88 80.9% (72.8-89.0) 4 3.3% (0.0-6.5) 109 100.0% (_-_)
Gender
Female 5 10.3% (1.3-19.2) 37 86.3% (76.4-96.3) 2 3.4% (0.0-8.1) 44 42.5% (32.4-52.7)
Male 12 20.0% (8.6-31.4) 51 76.8% (65.0-88.7) 2 3.2% (0.0-7.6) 65 57.5% (47.3-67.6)
Total 17 15.9% (8.2-23.5) 88 80.9% (72.8-89.0) 4 3.3% (0.0-6.5) 109 100.0% (_-_)
Age
<=18 2 25.6% (0.0-59.2) 6 74.4% (40.8-100.0) 0 . (.-.) 8 13.7% (4.3-23.1)
Age 19 or older 15 14.3% (7.3-21.3) 82 81.9% (74.2-89.6) 4 3.8% (0.0-7.5) 101 86.3% (76.9-95.7)
Total 17 15.9% (8.2-23.5) 88 80.9% (72.8-89.0) 4 3.3% (0.0-6.5) 109 100.0% (_-_)
Race
White 11 23.4% (11.0-35.8) 34 68.4% (54.9-81.9) 4 8.2% (0.3-16.1) 49 39.9% (30.2-49.7)
Non White 6 10.8% (1.2-20.5) 54 89.2% (79.5-98.8) 0 . (.-.) 60 60.1% (50.3-69.8)
Total 17 15.9% (8.2-23.5) 88 80.9% (72.8-89.0) 4 3.3% (0.0-6.5) 109 100.0% (_-_)
Region
South NV 6 9.8% (1.5-18.2) 65 86.6% (77.5-95.6) 3 3.6% (0.0-7.7) 74 72.9% (64.4-81.4)
North NV 9 49.4% (26.2-72.7) 10 50.6% (27.3-73.8) 0 . (.-.) 19 15.2% (8.5-21.8)
Rural NV 2 10.1% (0.0-23.8) 13 84.6% (67.8-100.0) 1 5.3% (0.0-15.6) 16 12.0% (5.9-18.0)
Total 17 15.9% (8.2-23.5) 88 80.9% (72.8-89.0) 4 3.3% (0.0-6.5) 109 100.0% (_-_)
Participated in on-the-job training
Yes 7 19.2% (4.3-34.1) 33 78.4% (63.1-93.7) 1 2.4% (0.0-7.3) 41 67.8% (53.7-81.9)
No 2 8.7% (0.0-21.1) 15 86.8% (71.6-100.0) 1 4.5% (0.0-13.6) 18 32.2% (18.1-46.3)
Total 9 15.8% (4.7-26.9) 48 81.1% (69.4-92.8) 2 3.1% (0.0-7.5) 59 100.0% (_-_)
Participated in Job Corps
Yes 2 28.5% (0.0-62.4) 7 71.5% (37.6-100.0) 0 . (.-.) 9 22.4% (7.7-37.0)
No 5 22.9% (1.5-44.3) 19 73.7% (51.9-95.5) 1 3.4% (0.0-10.4) 25 77.6% (63.0-92.3)
Total 7 24.2% (5.9-42.4) 26 73.2% (54.6-91.7) 1 2.7% (0.0-8.1) 34 100.0% (_-_)
Currently Employed
Yes 11 18.6% (7.3-29.8) 51 79.8% (68.3-91.3) 1 1.6% (0.0-4.8) 63 57.3% (47.0-67.6)
No 6 12.5% (2.8-22.3) 37 84.1% (73.4-94.7) 2 3.4% (0.0-8.2) 45 42.7% (32.4-53.0)
Total 17 16.0% (8.3-23.8) 88 81.6% (73.6-89.7) 3 2.4% (0.0-5.1) 108 100.0% (_-_)
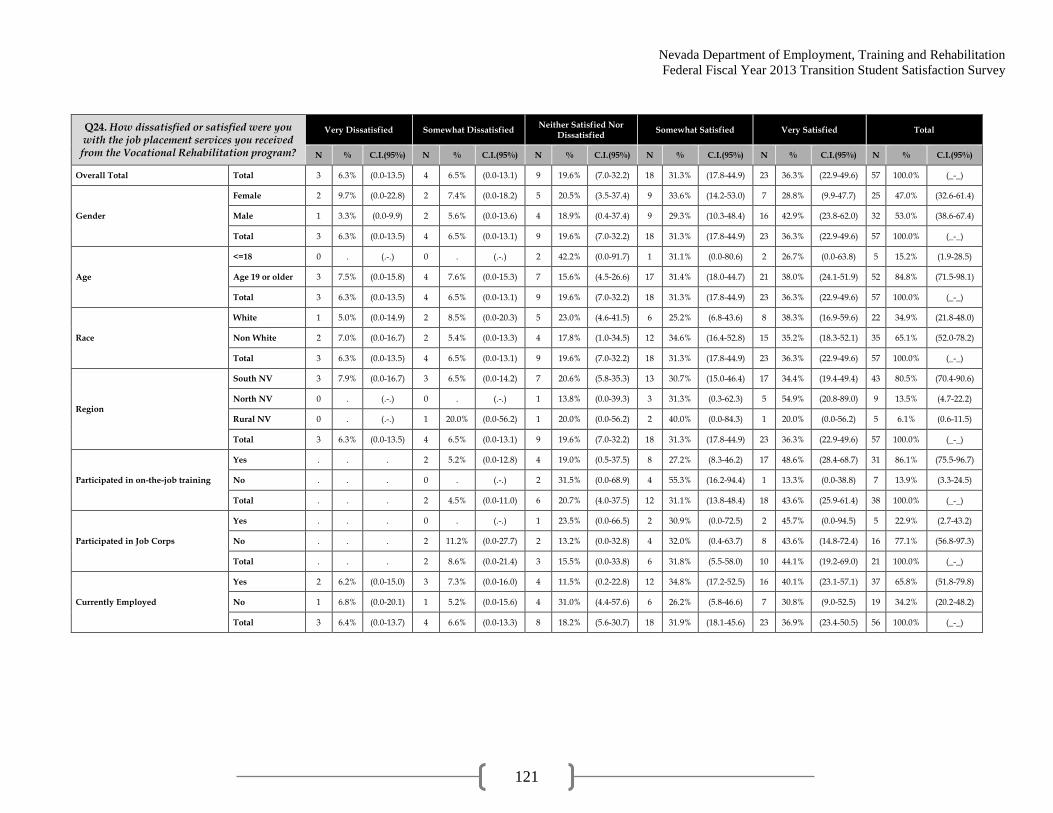
Nevada Department of Employment, Training and Rehabilitation
Federal Fiscal Year 2013 Transition Student Satisfaction Survey
121
Q24. How dissatisfied or satisfied were you with the job placement services you received from the Vocational Rehabilitation program?
Very Dissatisfied Somewhat Dissatisfied Neither Satisfied Nor
Dissatisfied Somewhat Satisfied Very Satisfied Total
N % C.I.(95%) N % C.I.(95%) N % C.I.(95%) N % C.I.(95%) N % C.I.(95%) N % C.I.(95%)
Overall Total Total 3 6.3% (0.0-13.5) 4 6.5% (0.0-13.1) 9 19.6% (7.0-32.2) 18 31.3% (17.8-44.9) 23 36.3% (22.9-49.6) 57 100.0% (_-_)
Gender
Female 2 9.7% (0.0-22.8) 2 7.4% (0.0-18.2) 5 20.5% (3.5-37.4) 9 33.6% (14.2-53.0) 7 28.8% (9.9-47.7) 25 47.0% (32.6-61.4)
Male 1 3.3% (0.0-9.9) 2 5.6% (0.0-13.6) 4 18.9% (0.4-37.4) 9 29.3% (10.3-48.4) 16 42.9% (23.8-62.0) 32 53.0% (38.6-67.4)
Total 3 6.3% (0.0-13.5) 4 6.5% (0.0-13.1) 9 19.6% (7.0-32.2) 18 31.3% (17.8-44.9) 23 36.3% (22.9-49.6) 57 100.0% (_-_)
Age
<=18 0 . (.-.) 0 . (.-.) 2 42.2% (0.0-91.7) 1 31.1% (0.0-80.6) 2 26.7% (0.0-63.8) 5 15.2% (1.9-28.5)
Age 19 or older 3 7.5% (0.0-15.8) 4 7.6% (0.0-15.3) 7 15.6% (4.5-26.6) 17 31.4% (18.0-44.7) 21 38.0% (24.1-51.9) 52 84.8% (71.5-98.1)
Total 3 6.3% (0.0-13.5) 4 6.5% (0.0-13.1) 9 19.6% (7.0-32.2) 18 31.3% (17.8-44.9) 23 36.3% (22.9-49.6) 57 100.0% (_-_)
Race
White 1 5.0% (0.0-14.9) 2 8.5% (0.0-20.3) 5 23.0% (4.6-41.5) 6 25.2% (6.8-43.6) 8 38.3% (16.9-59.6) 22 34.9% (21.8-48.0)
Non White 2 7.0% (0.0-16.7) 2 5.4% (0.0-13.3) 4 17.8% (1.0-34.5) 12 34.6% (16.4-52.8) 15 35.2% (18.3-52.1) 35 65.1% (52.0-78.2)
Total 3 6.3% (0.0-13.5) 4 6.5% (0.0-13.1) 9 19.6% (7.0-32.2) 18 31.3% (17.8-44.9) 23 36.3% (22.9-49.6) 57 100.0% (_-_)
Region
South NV 3 7.9% (0.0-16.7) 3 6.5% (0.0-14.2) 7 20.6% (5.8-35.3) 13 30.7% (15.0-46.4) 17 34.4% (19.4-49.4) 43 80.5% (70.4-90.6)
North NV 0 . (.-.) 0 . (.-.) 1 13.8% (0.0-39.3) 3 31.3% (0.3-62.3) 5 54.9% (20.8-89.0) 9 13.5% (4.7-22.2)
Rural NV 0 . (.-.) 1 20.0% (0.0-56.2) 1 20.0% (0.0-56.2) 2 40.0% (0.0-84.3) 1 20.0% (0.0-56.2) 5 6.1% (0.6-11.5)
Total 3 6.3% (0.0-13.5) 4 6.5% (0.0-13.1) 9 19.6% (7.0-32.2) 18 31.3% (17.8-44.9) 23 36.3% (22.9-49.6) 57 100.0% (_-_)
Participated in on-the-job training
Yes . . . 2 5.2% (0.0-12.8) 4 19.0% (0.5-37.5) 8 27.2% (8.3-46.2) 17 48.6% (28.4-68.7) 31 86.1% (75.5-96.7)
No . . . 0 . (.-.) 2 31.5% (0.0-68.9) 4 55.3% (16.2-94.4) 1 13.3% (0.0-38.8) 7 13.9% (3.3-24.5)
Total . . . 2 4.5% (0.0-11.0) 6 20.7% (4.0-37.5) 12 31.1% (13.8-48.4) 18 43.6% (25.9-61.4) 38 100.0% (_-_)
Participated in Job Corps
Yes . . . 0 . (.-.) 1 23.5% (0.0-66.5) 2 30.9% (0.0-72.5) 2 45.7% (0.0-94.5) 5 22.9% (2.7-43.2)
No . . . 2 11.2% (0.0-27.7) 2 13.2% (0.0-32.8) 4 32.0% (0.4-63.7) 8 43.6% (14.8-72.4) 16 77.1% (56.8-97.3)
Total . . . 2 8.6% (0.0-21.4) 3 15.5% (0.0-33.8) 6 31.8% (5.5-58.0) 10 44.1% (19.2-69.0) 21 100.0% (_-_)
Currently Employed
Yes 2 6.2% (0.0-15.0) 3 7.3% (0.0-16.0) 4 11.5% (0.2-22.8) 12 34.8% (17.2-52.5) 16 40.1% (23.1-57.1) 37 65.8% (51.8-79.8)
No 1 6.8% (0.0-20.1) 1 5.2% (0.0-15.6) 4 31.0% (4.4-57.6) 6 26.2% (5.8-46.6) 7 30.8% (9.0-52.5) 19 34.2% (20.2-48.2)
Total 3 6.4% (0.0-13.7) 4 6.6% (0.0-13.3) 8 18.2% (5.6-30.7) 18 31.9% (18.1-45.6) 23 36.9% (23.4-50.5) 56 100.0% (_-_)

Nevada Department of Employment, Training and Rehabilitation
Federal Fiscal Year 2013 Transition Student Satisfaction Survey
122
Q25. How dissatisfied or satisfied were you with the job coaching services you received
from the Vocational Rehabilitation program?
Very Dissatisfied Somewhat Dissatisfied Neither Satisfied Nor
Dissatisfied Somewhat Satisfied Very Satisfied Total
N % C.I.(95%) N % C.I.(95%) N % C.I.(95%) N % C.I.(95%) N % C.I.(95%) N % C.I.(95%)
Overall Total Total 1 1.6% (0.0-4.8) 1 2.3% (0.0-7.0) 11 20.9% (8.2-33.5) 15 27.8% (14.2-41.5) 26 47.4% (32.3-62.4) 54 100.0% (_-_)
Gender
Female 1 3.4% (0.0-10.2) 1 5.0% (0.0-14.8) 6 21.7% (5.0-38.3) 7 27.1% (8.7-45.4) 10 42.9% (22.1-63.6) 25 46.7% (31.7-61.7)
Male 0 . (.-.) 0 . (.-.) 5 20.1% (1.3-39.0) 8 28.5% (8.6-48.4) 16 51.4% (29.6-73.1) 29 53.3% (38.3-68.3)
Total 1 1.6% (0.0-4.8) 1 2.3% (0.0-7.0) 11 20.9% (8.2-33.5) 15 27.8% (14.2-41.5) 26 47.4% (32.3-62.4) 54 100.0% (_-_)
Age
<=18 0 . (.-.) 0 . (.-.) 2 32.2% (0.0-74.2) 1 23.7% (0.0-64.6) 3 44.1% (0.0-88.1) 6 20.3% (5.0-35.7)
Age 19 or older 1 2.0% (0.0-6.0) 1 2.9% (0.0-8.8) 9 18.0% (6.5-29.4) 14 28.9% (15.3-42.5) 23 48.2% (33.1-63.3) 48 79.7% (64.3-95.0)
Total 1 1.6% (0.0-4.8) 1 2.3% (0.0-7.0) 11 20.9% (8.2-33.5) 15 27.8% (14.2-41.5) 26 47.4% (32.3-62.4) 54 100.0% (_-_)
Race
White 1 4.4% (0.0-13.2) 0 . (.-.) 5 21.1% (3.8-38.5) 7 30.7% (10.8-50.6) 9 43.7% (22.0-65.5) 22 35.8% (22.2-49.5)
Non White 0 . (.-.) 1 3.6% (0.0-10.9) 6 20.7% (3.5-37.9) 8 26.2% (8.1-44.4) 17 49.4% (29.3-69.6) 32 64.2% (50.5-77.8)
Total 1 1.6% (0.0-4.8) 1 2.3% (0.0-7.0) 11 20.9% (8.2-33.5) 15 27.8% (14.2-41.5) 26 47.4% (32.3-62.4) 54 100.0% (_-_)
Region
South NV 1 2.0% (0.0-6.1) 1 3.0% (0.0-9.0) 7 20.4% (5.2-35.7) 11 28.6% (12.3-45.0) 18 45.9% (28.1-63.8) 38 77.6% (66.7-88.5)
North NV 0 . (.-.) 0 . (.-.) 2 14.5% (0.0-34.1) 3 25.2% (0.0-50.8) 7 60.3% (31.5-89.1) 12 17.4% (7.5-27.3)
Rural NV 0 . (.-.) 0 . (.-.) 2 50.0% (0.0-100.0) 1 25.0% (0.0-68.8) 1 25.0% (0.0-68.8) 4 5.0% (0.0-10.0)
Total 1 1.6% (0.0-4.8) 1 2.3% (0.0-7.0) 11 20.9% (8.2-33.5) 15 27.8% (14.2-41.5) 26 47.4% (32.3-62.4) 54 100.0% (_-_)
Participated in on-the-job training
Yes 1 3.0% (0.0-9.0) . . . 3 8.0% (0.0-17.6) 7 30.3% (9.5-51.2) 17 58.6% (37.3-80.0) 28 75.2% (59.0-91.4)
No 0 . (.-.) . . . 4 52.4% (15.3-89.5) 4 29.7% (0.0-59.4) 2 17.9% (0.0-43.1) 10 24.8% (8.6-41.0)
Total 1 2.2% (0.0-6.8) . . . 7 19.0% (3.6-34.5) 11 30.2% (12.8-47.6) 19 48.5% (29.9-67.2) 38 100.0% (_-_)
Participated in Job Corps
Yes . . . . . . 1 15.3% (0.0-46.1) 4 63.7% (19.7-100.0) 1 21.0% (0.0-60.5) 6 29.7% (5.7-53.7)
No . . . . . . 3 20.0% (0.0-44.4) 3 25.1% (0.0-54.2) 6 54.9% (20.1-89.6) 12 70.3% (46.3-94.3)
Total . . . . . . 4 18.6% (0.0-37.9) 7 36.6% (10.3-62.8) 7 44.8% (15.8-73.9) 18 100.0% (_-_)
Currently Employed
Yes 1 2.4% (0.0-7.2) 0 . (.-.) 6 15.7% (3.2-28.2) 11 27.0% (12.0-41.9) 19 54.9% (37.4-72.4) 37 67.0% (52.0-82.1)
No 0 . (.-.) 1 7.2% (0.0-21.4) 5 32.4% (4.3-60.5) 4 31.2% (2.6-59.7) 6 29.2% (5.8-52.6) 16 33.0% (17.9-48.0)
Total 1 1.6% (0.0-4.9) 1 2.4% (0.0-7.1) 11 21.2% (8.3-34.1) 15 28.3% (14.5-42.2) 25 46.4% (31.2-61.6) 53 100.0% (_-_)

Nevada Department of Employment, Training and Rehabilitation
Federal Fiscal Year 2013 Transition Student Satisfaction Survey
123
Q26. How dissatisfied or satisfied were you with the other vocational rehabilitation
services you received from the Vocational Rehabilitation program?
Very Dissatisfied Somewhat Dissatisfied Neither Satisfied Nor
Dissatisfied Somewhat Satisfied Very Satisfied Total
N % C.I.(95%) N % C.I.(95%) N % C.I.(95%) N % C.I.(95%) N % C.I.(95%) N % C.I.(95%)
Overall Total Total 1 1.4% (0.0-4.1) 3 4.5% (0.0-9.6) 14 21.8% (10.7-32.9) 29 41.4% (28.6-54.3) 24 31.0% (19.6-42.3) 71 100.0% (_-_)
Gender
Female 0 . (.-.) 2 7.0% (0.0-16.7) 7 24.7% (8.1-41.3) 11 39.0% (20.2-57.7) 9 29.4% (12.1-46.6) 29 43.3% (30.6-56.0)
Male 1 2.4% (0.0-7.3) 1 2.6% (0.0-7.7) 7 19.6% (4.6-34.5) 18 43.3% (25.8-60.8) 15 32.2% (17.0-47.3) 42 56.7% (44.0-69.4)
Total 1 1.4% (0.0-4.1) 3 4.5% (0.0-9.6) 14 21.8% (10.7-32.9) 29 41.4% (28.6-54.3) 24 31.0% (19.6-42.3) 71 100.0% (_-_)
Age
<=18 0 . (.-.) 0 . (.-.) 2 32.2% (0.0-73.8) 2 47.5% (2.5-92.4) 2 20.3% (0.0-49.0) 6 15.6% (3.4-27.9)
Age 19 or older 1 1.6% (0.0-4.9) 3 5.3% (0.0-11.4) 12 19.9% (9.4-30.3) 27 40.3% (27.7-52.9) 22 32.9% (20.9-44.9) 65 84.4% (72.1-96.6)
Total 1 1.4% (0.0-4.1) 3 4.5% (0.0-9.6) 14 21.8% (10.7-32.9) 29 41.4% (28.6-54.3) 24 31.0% (19.6-42.3) 71 100.0% (_-_)
Race
White 1 3.6% (0.0-10.7) 2 7.0% (0.0-16.5) 6 20.5% (5.5-35.6) 7 23.1% (7.6-38.7) 14 45.8% (27.3-64.2) 30 38.4% (26.4-50.5)
Non White 0 . (.-.) 1 2.9% (0.0-8.7) 8 22.6% (7.2-37.9) 22 52.8% (35.4-70.2) 10 21.7% (8.5-34.9) 41 61.6% (49.5-73.6)
Total 1 1.4% (0.0-4.1) 3 4.5% (0.0-9.6) 14 21.8% (10.7-32.9) 29 41.4% (28.6-54.3) 24 31.0% (19.6-42.3) 71 100.0% (_-_)
Region
South NV 1 1.8% (0.0-5.3) 2 3.8% (0.0-9.3) 13 26.4% (12.8-39.9) 22 42.4% (27.4-57.5) 15 25.6% (13.4-37.8) 53 78.6% (68.9-88.2)
North NV 0 . (.-.) 1 9.8% (0.0-28.4) 1 7.1% (0.0-21.0) 6 47.8% (18.4-77.2) 4 35.3% (6.7-63.9) 12 14.9% (6.6-23.2)
Rural NV 0 . (.-.) 0 . (.-.) 0 . (.-.) 1 14.6% (0.0-42.3) 5 85.4% (57.7-100.0) 6 6.5% (1.0-12.0)
Total 1 1.4% (0.0-4.1) 3 4.5% (0.0-9.6) 14 21.8% (10.7-32.9) 29 41.4% (28.6-54.3) 24 31.0% (19.6-42.3) 71 100.0% (_-_)
Participated in on-the-job training
Yes . . . 1 2.9% (0.0-8.8) 5 17.1% (2.7-31.5) 13 44.5% (24.6-64.3) 12 35.5% (17.4-53.7) 31 66.9% (50.2-83.6)
No . . . 0 . (.-.) 4 34.0% (2.1-66.0) 6 41.8% (9.9-73.7) 4 24.2% (0.5-47.8) 14 33.1% (16.4-49.8)
Total . . . 1 1.9% (0.0-5.9) 9 22.7% (7.8-37.6) 19 43.6% (26.6-60.6) 16 31.8% (17.1-46.5) 45 100.0% (_-_)
Participated in Job Corps
Yes . . . . . . 3 46.7% (3.2-90.3) 2 33.2% (0.0-74.6) 1 20.0% (0.0-57.2) 6 21.8% (3.9-39.7)
No . . . . . . 4 30.1% (1.5-58.8) 8 46.8% (18.0-75.7) 6 23.0% (3.3-42.8) 18 78.2% (60.3-96.1)
Total . . . . . . 7 33.7% (9.6-57.9) 10 43.9% (19.4-68.3) 7 22.4% (5.0-39.8) 24 100.0% (_-_)
Currently Employed
Yes 1 2.2% (0.0-6.5) 2 4.7% (0.0-11.5) 6 16.4% (2.8-29.9) 19 41.8% (25.7-57.9) 17 34.9% (20.1-49.8) 45 63.5% (51.1-75.9)
No 0 . (.-.) 1 4.0% (0.0-11.9) 8 31.2% (12.0-50.4) 10 40.7% (19.3-62.2) 7 24.1% (7.1-41.0) 26 36.5% (24.1-48.9)
Total 1 1.4% (0.0-4.1) 3 4.5% (0.0-9.6) 14 21.8% (10.7-32.9) 29 41.4% (28.6-54.3) 24 31.0% (19.6-42.3) 71 100.0% (_-_)
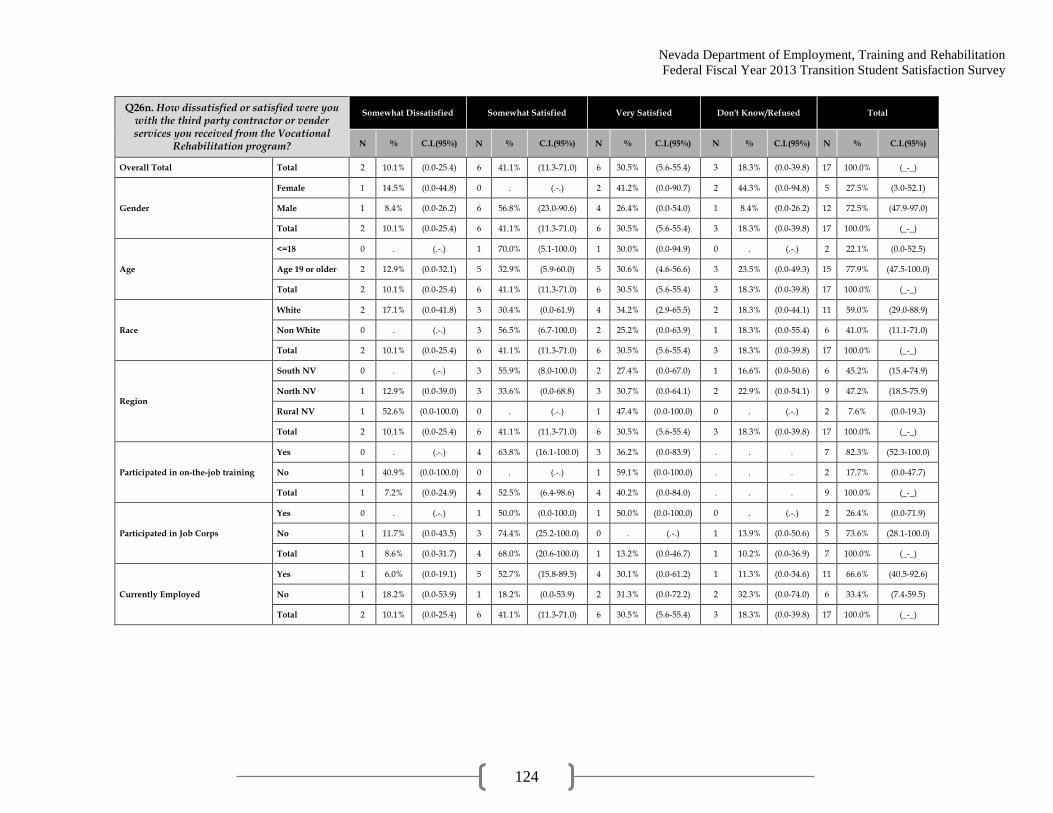
Nevada Department of Employment, Training and Rehabilitation
Federal Fiscal Year 2013 Transition Student Satisfaction Survey
124
Q26n. How dissatisfied or satisfied were you with the third party contractor or vender services you received from the Vocational
Rehabilitation program?
Somewhat Dissatisfied Somewhat Satisfied Very Satisfied Don't Know/Refused Total
N % C.I.(95%) N % C.I.(95%) N % C.I.(95%) N % C.I.(95%) N % C.I.(95%)
Overall Total Total 2 10.1% (0.0-25.4) 6 41.1% (11.3-71.0) 6 30.5% (5.6-55.4) 3 18.3% (0.0-39.8) 17 100.0% (_-_)
Gender
Female 1 14.5% (0.0-44.8) 0 . (.-.) 2 41.2% (0.0-90.7) 2 44.3% (0.0-94.8) 5 27.5% (3.0-52.1)
Male 1 8.4% (0.0-26.2) 6 56.8% (23.0-90.6) 4 26.4% (0.0-54.0) 1 8.4% (0.0-26.2) 12 72.5% (47.9-97.0)
Total 2 10.1% (0.0-25.4) 6 41.1% (11.3-71.0) 6 30.5% (5.6-55.4) 3 18.3% (0.0-39.8) 17 100.0% (_-_)
Age
<=18 0 . (.-.) 1 70.0% (5.1-100.0) 1 30.0% (0.0-94.9) 0 . (.-.) 2 22.1% (0.0-52.5)
Age 19 or older 2 12.9% (0.0-32.1) 5 32.9% (5.9-60.0) 5 30.6% (4.6-56.6) 3 23.5% (0.0-49.3) 15 77.9% (47.5-100.0)
Total 2 10.1% (0.0-25.4) 6 41.1% (11.3-71.0) 6 30.5% (5.6-55.4) 3 18.3% (0.0-39.8) 17 100.0% (_-_)
Race
White 2 17.1% (0.0-41.8) 3 30.4% (0.0-61.9) 4 34.2% (2.9-65.5) 2 18.3% (0.0-44.1) 11 59.0% (29.0-88.9)
Non White 0 . (.-.) 3 56.5% (6.7-100.0) 2 25.2% (0.0-63.9) 1 18.3% (0.0-55.4) 6 41.0% (11.1-71.0)
Total 2 10.1% (0.0-25.4) 6 41.1% (11.3-71.0) 6 30.5% (5.6-55.4) 3 18.3% (0.0-39.8) 17 100.0% (_-_)
Region
South NV 0 . (.-.) 3 55.9% (8.0-100.0) 2 27.4% (0.0-67.0) 1 16.6% (0.0-50.6) 6 45.2% (15.4-74.9)
North NV 1 12.9% (0.0-39.0) 3 33.6% (0.0-68.8) 3 30.7% (0.0-64.1) 2 22.9% (0.0-54.1) 9 47.2% (18.5-75.9)
Rural NV 1 52.6% (0.0-100.0) 0 . (.-.) 1 47.4% (0.0-100.0) 0 . (.-.) 2 7.6% (0.0-19.3)
Total 2 10.1% (0.0-25.4) 6 41.1% (11.3-71.0) 6 30.5% (5.6-55.4) 3 18.3% (0.0-39.8) 17 100.0% (_-_)
Participated in on-the-job training
Yes 0 . (.-.) 4 63.8% (16.1-100.0) 3 36.2% (0.0-83.9) . . . 7 82.3% (52.3-100.0)
No 1 40.9% (0.0-100.0) 0 . (.-.) 1 59.1% (0.0-100.0) . . . 2 17.7% (0.0-47.7)
Total 1 7.2% (0.0-24.9) 4 52.5% (6.4-98.6) 4 40.2% (0.0-84.0) . . . 9 100.0% (_-_)
Participated in Job Corps
Yes 0 . (.-.) 1 50.0% (0.0-100.0) 1 50.0% (0.0-100.0) 0 . (.-.) 2 26.4% (0.0-71.9)
No 1 11.7% (0.0-43.5) 3 74.4% (25.2-100.0) 0 . (.-.) 1 13.9% (0.0-50.6) 5 73.6% (28.1-100.0)
Total 1 8.6% (0.0-31.7) 4 68.0% (20.6-100.0) 1 13.2% (0.0-46.7) 1 10.2% (0.0-36.9) 7 100.0% (_-_)
Currently Employed
Yes 1 6.0% (0.0-19.1) 5 52.7% (15.8-89.5) 4 30.1% (0.0-61.2) 1 11.3% (0.0-34.6) 11 66.6% (40.5-92.6)
No 1 18.2% (0.0-53.9) 1 18.2% (0.0-53.9) 2 31.3% (0.0-72.2) 2 32.3% (0.0-74.0) 6 33.4% (7.4-59.5)
Total 2 10.1% (0.0-25.4) 6 41.1% (11.3-71.0) 6 30.5% (5.6-55.4) 3 18.3% (0.0-39.8) 17 100.0% (_-_)

Nevada Department of Employment, Training and Rehabilitation
Federal Fiscal Year 2013 Transition Student Satisfaction Survey
125
Q27. Have you received any assistive technology devices?
Yes No Total
N % C.I.(95%) N % C.I.(95%) N % C.I.(95%)
Overall Total Total 29 27.9% (18.3-37.5) 78 72.1% (62.5-81.7) 107 100.0% (_-_)
Gender
Female 13 27.0% (13.6-40.4) 31 73.0% (59.6-86.4) 44 43.3% (33.1-53.6)
Male 16 28.6% (15.2-42.1) 47 71.4% (57.9-84.8) 63 56.7% (46.4-66.9)
Total 29 27.9% (18.3-37.5) 78 72.1% (62.5-81.7) 107 100.0% (_-_)
Age
<=18 3 43.6% (5.1-82.1) 5 56.4% (17.9-94.9) 8 14.0% (4.4-23.5)
Age 19 or older 26 25.4% (16.5-34.3) 73 74.6% (65.7-83.5) 99 86.0% (76.5-95.6)
Total 29 27.9% (18.3-37.5) 78 72.1% (62.5-81.7) 107 100.0% (_-_)
Race
White 14 30.0% (16.5-43.6) 33 70.0% (56.4-83.5) 47 38.8% (29.0-48.5)
Non White 15 26.6% (13.4-39.7) 45 73.4% (60.3-86.6) 60 61.2% (51.5-71.0)
Total 29 27.9% (18.3-37.5) 78 72.1% (62.5-81.7) 107 100.0% (_-_)
Region
South NV 18 26.3% (14.6-37.9) 55 73.7% (62.1-85.4) 73 73.4% (64.8-81.9)
North NV 7 42.4% (18.5-66.2) 11 57.6% (33.8-81.5) 18 14.5% (7.9-21.0)
Rural NV 4 20.6% (1.4-39.9) 12 79.4% (60.1-98.6) 16 12.2% (6.0-18.4)
Total 29 27.9% (18.3-37.5) 78 72.1% (62.5-81.7) 107 100.0% (_-_)
Participated in on-the-job training
Yes 13 40.3% (21.9-58.6) 26 59.7% (41.4-78.1) 39 66.7% (52.1-81.2)
No 4 13.9% (0.0-28.0) 14 86.1% (72.0-100.0) 18 33.3% (18.8-47.9)
Total 17 31.5% (17.1-45.8) 40 68.5% (54.2-82.9) 57 100.0% (_-_)
Participated in Job Corps
Yes 4 44.6% (8.1-81.1) 4 55.4% (18.9-91.9) 8 19.8% (5.8-33.7)
No 12 49.4% (26.0-72.8) 13 50.6% (27.2-74.0) 25 80.2% (66.3-94.2)
Total 16 48.5% (28.3-68.6) 17 51.5% (31.4-71.7) 33 100.0% (_-_)
Currently Employed
Yes 17 26.9% (14.6-39.1) 45 73.1% (60.9-85.4) 62 57.4% (47.0-67.8)
No 12 29.9% (14.5-45.4) 32 70.1% (54.6-85.5) 44 42.6% (32.2-53.0)
Total 29 28.2% (18.5-37.8) 77 71.8% (62.2-81.5) 106 100.0% (_-_)

Nevada Department of Employment, Training and Rehabilitation
Federal Fiscal Year 2013 Transition Student Satisfaction Survey
126
Q27a. Have you received devices to help with your hearing?
Yes No Total
N % C.I.(95%) N % C.I.(95%) N % C.I.(95%)
Overall Total Total 9 10.0% (2.6-17.5) 98 90.0% (82.5-97.4) 107 100.0% (_-_)
Gender
Female 4 6.6% (0.1-13.1) 40 93.4% (86.9-99.9) 44 43.3% (33.1-53.6)
Male 5 12.7% (0.7-24.6) 58 87.3% (75.4-99.3) 63 56.7% (46.4-66.9)
Total 9 10.0% (2.6-17.5) 98 90.0% (82.5-97.4) 107 100.0% (_-_)
Age
<=18 2 35.9% (0.0-74.4) 6 64.1% (25.6-100.0) 8 14.0% (4.4-23.5)
Age 19 or older 7 5.8% (1.5-10.2) 92 94.2% (89.8-98.5) 99 86.0% (76.5-95.6)
Total 9 10.0% (2.6-17.5) 98 90.0% (82.5-97.4) 107 100.0% (_-_)
Race
White 6 11.3% (2.5-20.1) 41 88.7% (79.9-97.5) 47 38.8% (29.0-48.5)
Non White 3 9.2% (0.0-20.2) 57 90.8% (79.8-100.0) 60 61.2% (51.5-71.0)
Total 9 10.0% (2.6-17.5) 98 90.0% (82.5-97.4) 107 100.0% (_-_)
Region
South NV 5 10.1% (0.5-19.7) 68 89.9% (80.3-99.5) 73 73.4% (64.8-81.9)
North NV 1 5.3% (0.0-15.5) 17 94.7% (84.5-100.0) 18 14.5% (7.9-21.0)
Rural NV 3 15.4% (0.0-32.2) 13 84.6% (67.8-100.0) 16 12.2% (6.0-18.4)
Total 9 10.0% (2.6-17.5) 98 90.0% (82.5-97.4) 107 100.0% (_-_)
Participated in on-the-job training
Yes 4 18.2% (0.4-35.9) 35 81.8% (64.1-99.6) 39 66.7% (52.1-81.2)
No 3 10.3% (0.0-22.4) 15 89.7% (77.6-100.0) 18 33.3% (18.8-47.9)
Total 7 15.5% (2.7-28.3) 50 84.5% (71.7-97.3) 57 100.0% (_-_)
Participated in Job Corps
Yes 2 22.7% (0.0-52.6) 6 77.3% (47.4-100.0) 8 19.8% (5.8-33.7)
No 6 25.8% (4.1-47.6) 19 74.2% (52.4-95.9) 25 80.2% (66.3-94.2)
Total 8 25.2% (6.8-43.7) 25 74.8% (56.3-93.2) 33 100.0% (_-_)
Currently Employed
Yes 6 10.5% (0.9-20.1) 56 89.5% (79.9-99.1) 62 57.4% (47.0-67.8)
No 3 9.7% (0.0-21.8) 41 90.3% (78.2-100.0) 44 42.6% (32.2-53.0)
Total 9 10.1% (2.6-17.7) 97 89.9% (82.3-97.4) 106 100.0% (_-_)
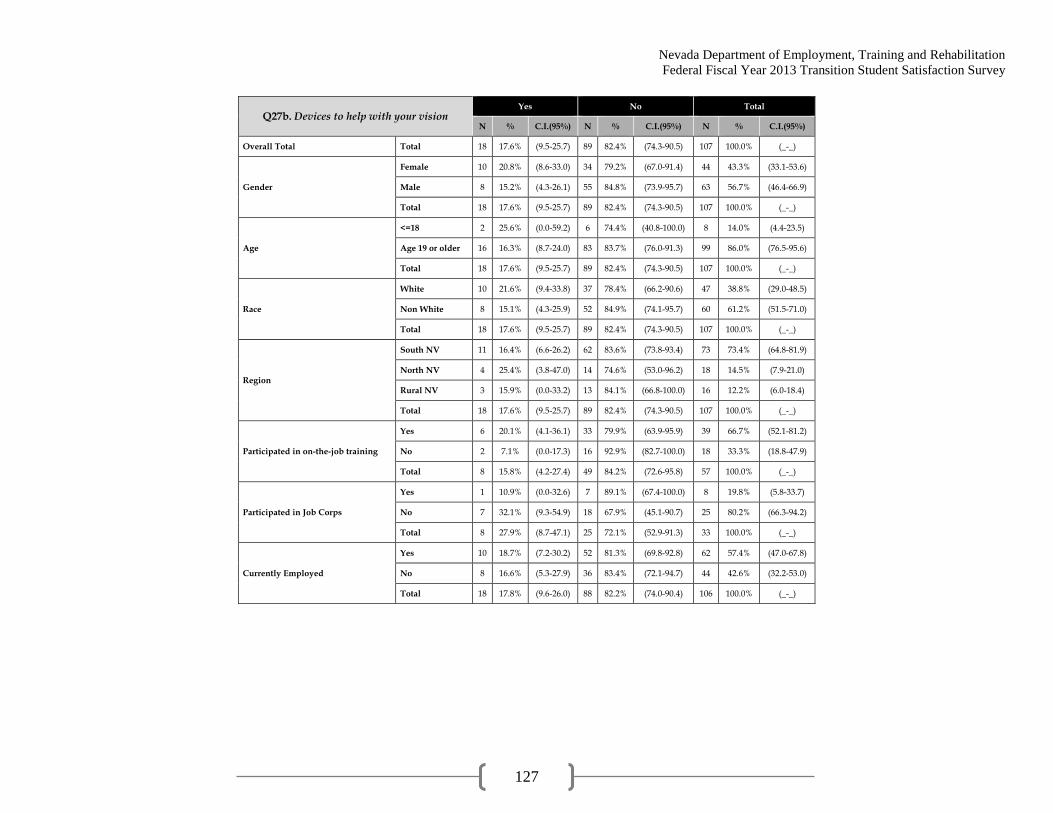
Nevada Department of Employment, Training and Rehabilitation
Federal Fiscal Year 2013 Transition Student Satisfaction Survey
127
Q27b. Devices to help with your vision Yes No Total
N % C.I.(95%) N % C.I.(95%) N % C.I.(95%)
Overall Total Total 18 17.6% (9.5-25.7) 89 82.4% (74.3-90.5) 107 100.0% (_-_)
Gender
Female 10 20.8% (8.6-33.0) 34 79.2% (67.0-91.4) 44 43.3% (33.1-53.6)
Male 8 15.2% (4.3-26.1) 55 84.8% (73.9-95.7) 63 56.7% (46.4-66.9)
Total 18 17.6% (9.5-25.7) 89 82.4% (74.3-90.5) 107 100.0% (_-_)
Age
<=18 2 25.6% (0.0-59.2) 6 74.4% (40.8-100.0) 8 14.0% (4.4-23.5)
Age 19 or older 16 16.3% (8.7-24.0) 83 83.7% (76.0-91.3) 99 86.0% (76.5-95.6)
Total 18 17.6% (9.5-25.7) 89 82.4% (74.3-90.5) 107 100.0% (_-_)
Race
White 10 21.6% (9.4-33.8) 37 78.4% (66.2-90.6) 47 38.8% (29.0-48.5)
Non White 8 15.1% (4.3-25.9) 52 84.9% (74.1-95.7) 60 61.2% (51.5-71.0)
Total 18 17.6% (9.5-25.7) 89 82.4% (74.3-90.5) 107 100.0% (_-_)
Region
South NV 11 16.4% (6.6-26.2) 62 83.6% (73.8-93.4) 73 73.4% (64.8-81.9)
North NV 4 25.4% (3.8-47.0) 14 74.6% (53.0-96.2) 18 14.5% (7.9-21.0)
Rural NV 3 15.9% (0.0-33.2) 13 84.1% (66.8-100.0) 16 12.2% (6.0-18.4)
Total 18 17.6% (9.5-25.7) 89 82.4% (74.3-90.5) 107 100.0% (_-_)
Participated in on-the-job training
Yes 6 20.1% (4.1-36.1) 33 79.9% (63.9-95.9) 39 66.7% (52.1-81.2)
No 2 7.1% (0.0-17.3) 16 92.9% (82.7-100.0) 18 33.3% (18.8-47.9)
Total 8 15.8% (4.2-27.4) 49 84.2% (72.6-95.8) 57 100.0% (_-_)
Participated in Job Corps
Yes 1 10.9% (0.0-32.6) 7 89.1% (67.4-100.0) 8 19.8% (5.8-33.7)
No 7 32.1% (9.3-54.9) 18 67.9% (45.1-90.7) 25 80.2% (66.3-94.2)
Total 8 27.9% (8.7-47.1) 25 72.1% (52.9-91.3) 33 100.0% (_-_)
Currently Employed
Yes 10 18.7% (7.2-30.2) 52 81.3% (69.8-92.8) 62 57.4% (47.0-67.8)
No 8 16.6% (5.3-27.9) 36 83.4% (72.1-94.7) 44 42.6% (32.2-53.0)
Total 18 17.8% (9.6-26.0) 88 82.2% (74.0-90.4) 106 100.0% (_-_)
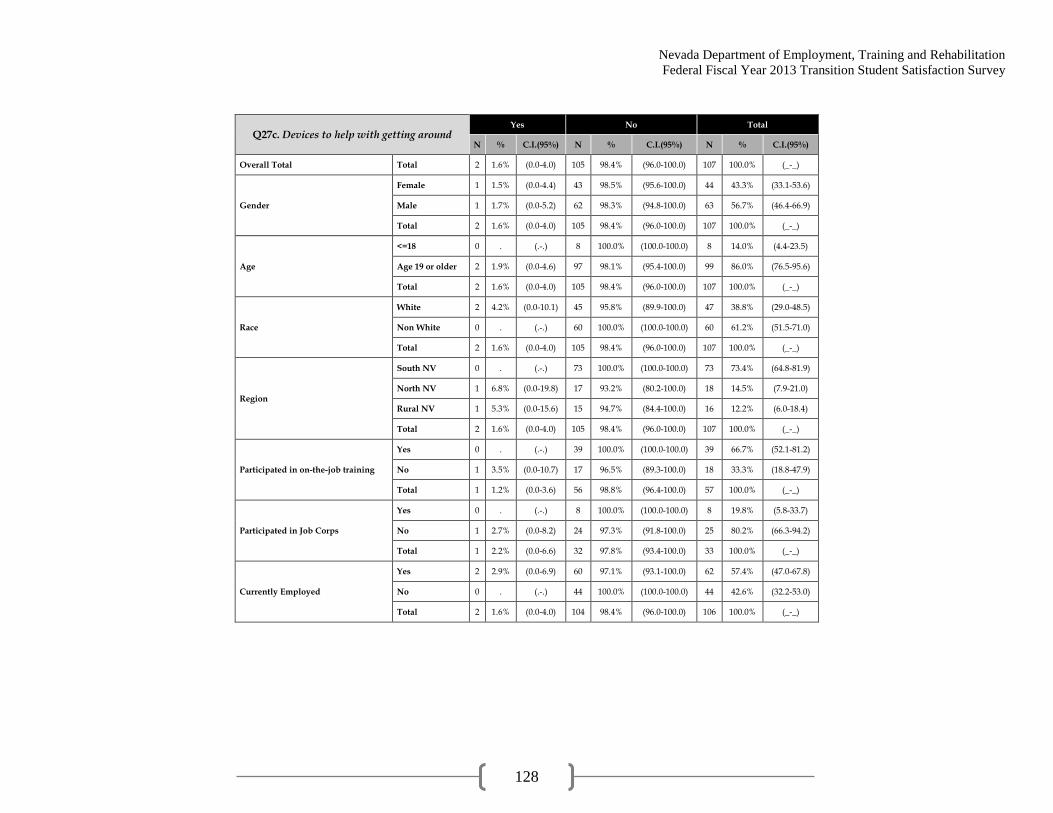
Nevada Department of Employment, Training and Rehabilitation
Federal Fiscal Year 2013 Transition Student Satisfaction Survey
128
Q27c. Devices to help with getting around Yes No Total
N % C.I.(95%) N % C.I.(95%) N % C.I.(95%)
Overall Total Total 2 1.6% (0.0-4.0) 105 98.4% (96.0-100.0) 107 100.0% (_-_)
Gender
Female 1 1.5% (0.0-4.4) 43 98.5% (95.6-100.0) 44 43.3% (33.1-53.6)
Male 1 1.7% (0.0-5.2) 62 98.3% (94.8-100.0) 63 56.7% (46.4-66.9)
Total 2 1.6% (0.0-4.0) 105 98.4% (96.0-100.0) 107 100.0% (_-_)
Age
<=18 0 . (.-.) 8 100.0% (100.0-100.0) 8 14.0% (4.4-23.5)
Age 19 or older 2 1.9% (0.0-4.6) 97 98.1% (95.4-100.0) 99 86.0% (76.5-95.6)
Total 2 1.6% (0.0-4.0) 105 98.4% (96.0-100.0) 107 100.0% (_-_)
Race
White 2 4.2% (0.0-10.1) 45 95.8% (89.9-100.0) 47 38.8% (29.0-48.5)
Non White 0 . (.-.) 60 100.0% (100.0-100.0) 60 61.2% (51.5-71.0)
Total 2 1.6% (0.0-4.0) 105 98.4% (96.0-100.0) 107 100.0% (_-_)
Region
South NV 0 . (.-.) 73 100.0% (100.0-100.0) 73 73.4% (64.8-81.9)
North NV 1 6.8% (0.0-19.8) 17 93.2% (80.2-100.0) 18 14.5% (7.9-21.0)
Rural NV 1 5.3% (0.0-15.6) 15 94.7% (84.4-100.0) 16 12.2% (6.0-18.4)
Total 2 1.6% (0.0-4.0) 105 98.4% (96.0-100.0) 107 100.0% (_-_)
Participated in on-the-job training
Yes 0 . (.-.) 39 100.0% (100.0-100.0) 39 66.7% (52.1-81.2)
No 1 3.5% (0.0-10.7) 17 96.5% (89.3-100.0) 18 33.3% (18.8-47.9)
Total 1 1.2% (0.0-3.6) 56 98.8% (96.4-100.0) 57 100.0% (_-_)
Participated in Job Corps
Yes 0 . (.-.) 8 100.0% (100.0-100.0) 8 19.8% (5.8-33.7)
No 1 2.7% (0.0-8.2) 24 97.3% (91.8-100.0) 25 80.2% (66.3-94.2)
Total 1 2.2% (0.0-6.6) 32 97.8% (93.4-100.0) 33 100.0% (_-_)
Currently Employed
Yes 2 2.9% (0.0-6.9) 60 97.1% (93.1-100.0) 62 57.4% (47.0-67.8)
No 0 . (.-.) 44 100.0% (100.0-100.0) 44 42.6% (32.2-53.0)
Total 2 1.6% (0.0-4.0) 104 98.4% (96.0-100.0) 106 100.0% (_-_)
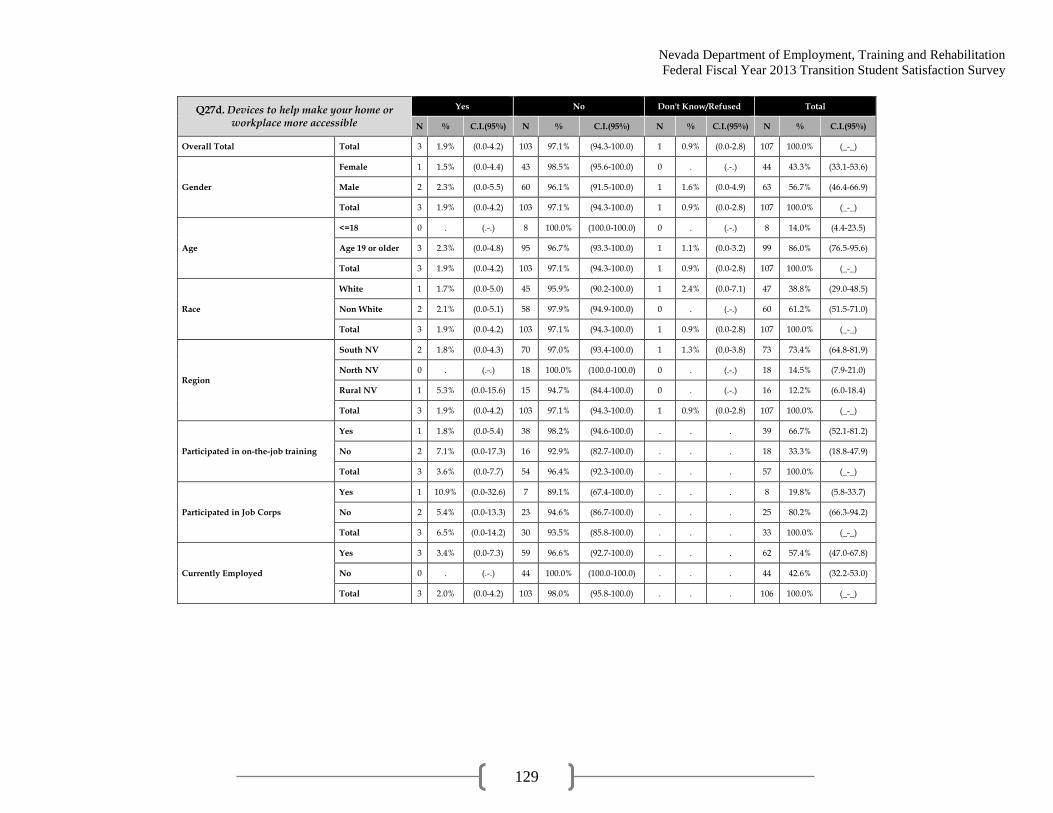
Nevada Department of Employment, Training and Rehabilitation
Federal Fiscal Year 2013 Transition Student Satisfaction Survey
129
Q27d. Devices to help make your home or workplace more accessible
Yes No Don't Know/Refused Total
N % C.I.(95%) N % C.I.(95%) N % C.I.(95%) N % C.I.(95%)
Overall Total Total 3 1.9% (0.0-4.2) 103 97.1% (94.3-100.0) 1 0.9% (0.0-2.8) 107 100.0% (_-_)
Gender
Female 1 1.5% (0.0-4.4) 43 98.5% (95.6-100.0) 0 . (.-.) 44 43.3% (33.1-53.6)
Male 2 2.3% (0.0-5.5) 60 96.1% (91.5-100.0) 1 1.6% (0.0-4.9) 63 56.7% (46.4-66.9)
Total 3 1.9% (0.0-4.2) 103 97.1% (94.3-100.0) 1 0.9% (0.0-2.8) 107 100.0% (_-_)
Age
<=18 0 . (.-.) 8 100.0% (100.0-100.0) 0 . (.-.) 8 14.0% (4.4-23.5)
Age 19 or older 3 2.3% (0.0-4.8) 95 96.7% (93.3-100.0) 1 1.1% (0.0-3.2) 99 86.0% (76.5-95.6)
Total 3 1.9% (0.0-4.2) 103 97.1% (94.3-100.0) 1 0.9% (0.0-2.8) 107 100.0% (_-_)
Race
White 1 1.7% (0.0-5.0) 45 95.9% (90.2-100.0) 1 2.4% (0.0-7.1) 47 38.8% (29.0-48.5)
Non White 2 2.1% (0.0-5.1) 58 97.9% (94.9-100.0) 0 . (.-.) 60 61.2% (51.5-71.0)
Total 3 1.9% (0.0-4.2) 103 97.1% (94.3-100.0) 1 0.9% (0.0-2.8) 107 100.0% (_-_)
Region
South NV 2 1.8% (0.0-4.3) 70 97.0% (93.4-100.0) 1 1.3% (0.0-3.8) 73 73.4% (64.8-81.9)
North NV 0 . (.-.) 18 100.0% (100.0-100.0) 0 . (.-.) 18 14.5% (7.9-21.0)
Rural NV 1 5.3% (0.0-15.6) 15 94.7% (84.4-100.0) 0 . (.-.) 16 12.2% (6.0-18.4)
Total 3 1.9% (0.0-4.2) 103 97.1% (94.3-100.0) 1 0.9% (0.0-2.8) 107 100.0% (_-_)
Participated in on-the-job training
Yes 1 1.8% (0.0-5.4) 38 98.2% (94.6-100.0) . . . 39 66.7% (52.1-81.2)
No 2 7.1% (0.0-17.3) 16 92.9% (82.7-100.0) . . . 18 33.3% (18.8-47.9)
Total 3 3.6% (0.0-7.7) 54 96.4% (92.3-100.0) . . . 57 100.0% (_-_)
Participated in Job Corps
Yes 1 10.9% (0.0-32.6) 7 89.1% (67.4-100.0) . . . 8 19.8% (5.8-33.7)
No 2 5.4% (0.0-13.3) 23 94.6% (86.7-100.0) . . . 25 80.2% (66.3-94.2)
Total 3 6.5% (0.0-14.2) 30 93.5% (85.8-100.0) . . . 33 100.0% (_-_)
Currently Employed
Yes 3 3.4% (0.0-7.3) 59 96.6% (92.7-100.0) . . . 62 57.4% (47.0-67.8)
No 0 . (.-.) 44 100.0% (100.0-100.0) . . . 44 42.6% (32.2-53.0)
Total 3 2.0% (0.0-4.2) 103 98.0% (95.8-100.0) . . . 106 100.0% (_-_)
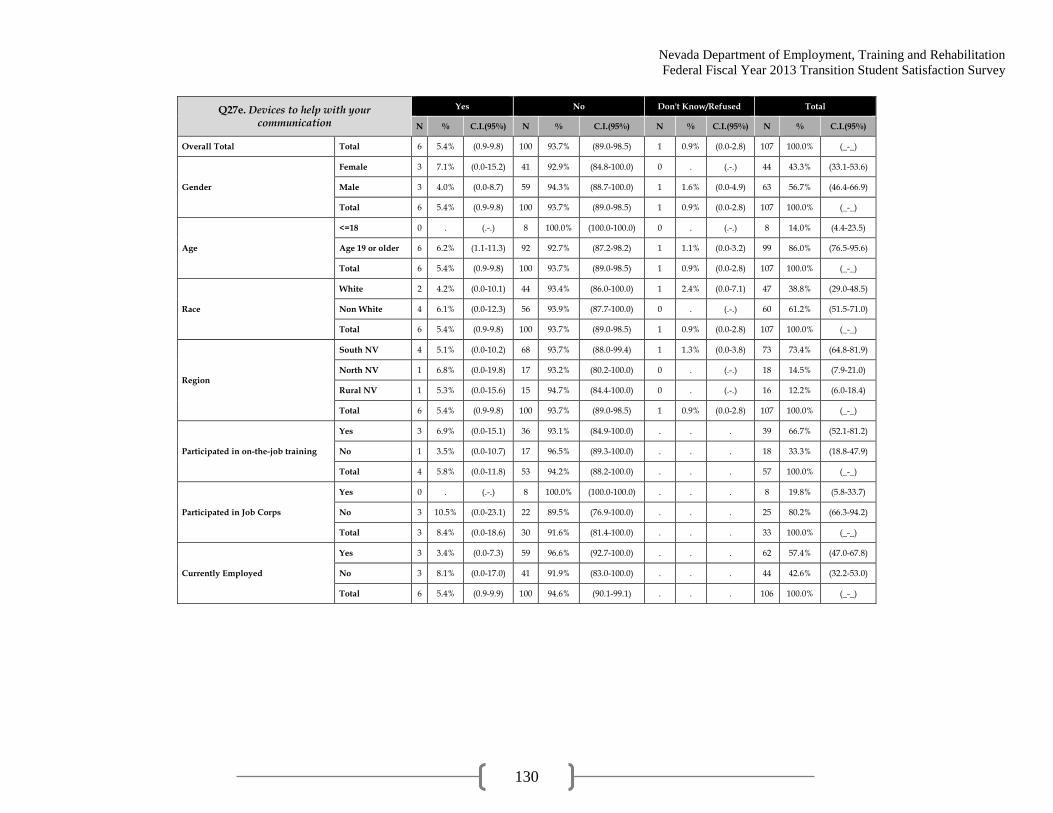
Nevada Department of Employment, Training and Rehabilitation
Federal Fiscal Year 2013 Transition Student Satisfaction Survey
130
Q27e. Devices to help with your communication
Yes No Don't Know/Refused Total
N % C.I.(95%) N % C.I.(95%) N % C.I.(95%) N % C.I.(95%)
Overall Total Total 6 5.4% (0.9-9.8) 100 93.7% (89.0-98.5) 1 0.9% (0.0-2.8) 107 100.0% (_-_)
Gender
Female 3 7.1% (0.0-15.2) 41 92.9% (84.8-100.0) 0 . (.-.) 44 43.3% (33.1-53.6)
Male 3 4.0% (0.0-8.7) 59 94.3% (88.7-100.0) 1 1.6% (0.0-4.9) 63 56.7% (46.4-66.9)
Total 6 5.4% (0.9-9.8) 100 93.7% (89.0-98.5) 1 0.9% (0.0-2.8) 107 100.0% (_-_)
Age
<=18 0 . (.-.) 8 100.0% (100.0-100.0) 0 . (.-.) 8 14.0% (4.4-23.5)
Age 19 or older 6 6.2% (1.1-11.3) 92 92.7% (87.2-98.2) 1 1.1% (0.0-3.2) 99 86.0% (76.5-95.6)
Total 6 5.4% (0.9-9.8) 100 93.7% (89.0-98.5) 1 0.9% (0.0-2.8) 107 100.0% (_-_)
Race
White 2 4.2% (0.0-10.1) 44 93.4% (86.0-100.0) 1 2.4% (0.0-7.1) 47 38.8% (29.0-48.5)
Non White 4 6.1% (0.0-12.3) 56 93.9% (87.7-100.0) 0 . (.-.) 60 61.2% (51.5-71.0)
Total 6 5.4% (0.9-9.8) 100 93.7% (89.0-98.5) 1 0.9% (0.0-2.8) 107 100.0% (_-_)
Region
South NV 4 5.1% (0.0-10.2) 68 93.7% (88.0-99.4) 1 1.3% (0.0-3.8) 73 73.4% (64.8-81.9)
North NV 1 6.8% (0.0-19.8) 17 93.2% (80.2-100.0) 0 . (.-.) 18 14.5% (7.9-21.0)
Rural NV 1 5.3% (0.0-15.6) 15 94.7% (84.4-100.0) 0 . (.-.) 16 12.2% (6.0-18.4)
Total 6 5.4% (0.9-9.8) 100 93.7% (89.0-98.5) 1 0.9% (0.0-2.8) 107 100.0% (_-_)
Participated in on-the-job training
Yes 3 6.9% (0.0-15.1) 36 93.1% (84.9-100.0) . . . 39 66.7% (52.1-81.2)
No 1 3.5% (0.0-10.7) 17 96.5% (89.3-100.0) . . . 18 33.3% (18.8-47.9)
Total 4 5.8% (0.0-11.8) 53 94.2% (88.2-100.0) . . . 57 100.0% (_-_)
Participated in Job Corps
Yes 0 . (.-.) 8 100.0% (100.0-100.0) . . . 8 19.8% (5.8-33.7)
No 3 10.5% (0.0-23.1) 22 89.5% (76.9-100.0) . . . 25 80.2% (66.3-94.2)
Total 3 8.4% (0.0-18.6) 30 91.6% (81.4-100.0) . . . 33 100.0% (_-_)
Currently Employed
Yes 3 3.4% (0.0-7.3) 59 96.6% (92.7-100.0) . . . 62 57.4% (47.0-67.8)
No 3 8.1% (0.0-17.0) 41 91.9% (83.0-100.0) . . . 44 42.6% (32.2-53.0)
Total 6 5.4% (0.9-9.9) 100 94.6% (90.1-99.1) . . . 106 100.0% (_-_)

Nevada Department of Employment, Training and Rehabilitation
Federal Fiscal Year 2013 Transition Student Satisfaction Survey
131
Q27f. Devices to help with something else that was not already mentioned above
Yes No Don't Know/Refused Total
N % C.I.(95%) N % C.I.(95%) N % C.I.(95%) N % C.I.(95%)
Overall Total Total 4 3.3% (0.0-6.7) 102 95.7% (91.9-99.5) 1 0.9% (0.0-2.8) 107 100.0% (_-_)
Gender
Female 1 1.7% (0.0-4.9) 43 98.3% (95.1-100.0) 0 . (.-.) 44 43.3% (33.1-53.6)
Male 3 4.6% (0.0-9.9) 59 93.7% (87.6-99.9) 1 1.6% (0.0-4.9) 63 56.7% (46.4-66.9)
Total 4 3.3% (0.0-6.7) 102 95.7% (91.9-99.5) 1 0.9% (0.0-2.8) 107 100.0% (_-_)
Age
<=18 0 . (.-.) 8 100.0% (100.0-100.0) 0 . (.-.) 8 14.0% (4.4-23.5)
Age 19 or older 4 3.9% (0.0-7.7) 94 95.0% (90.7-99.4) 1 1.1% (0.0-3.2) 99 86.0% (76.5-95.6)
Total 4 3.3% (0.0-6.7) 102 95.7% (91.9-99.5) 1 0.9% (0.0-2.8) 107 100.0% (_-_)
Race
White 2 5.1% (0.0-12.0) 44 92.5% (84.3-100.0) 1 2.4% (0.0-7.1) 47 38.8% (29.0-48.5)
Non White 2 2.2% (0.0-5.4) 58 97.8% (94.6-100.0) 0 . (.-.) 60 61.2% (51.5-71.0)
Total 4 3.3% (0.0-6.7) 102 95.7% (91.9-99.5) 1 0.9% (0.0-2.8) 107 100.0% (_-_)
Region
South NV 1 0.9% (0.0-2.6) 71 97.8% (94.8-100.0) 1 1.3% (0.0-3.8) 73 73.4% (64.8-81.9)
North NV 3 18.6% (0.0-37.8) 15 81.4% (62.2-100.0) 0 . (.-.) 18 14.5% (7.9-21.0)
Rural NV 0 . (.-.) 16 100.0% (100.0-100.0) 0 . (.-.) 16 12.2% (6.0-18.4)
Total 4 3.3% (0.0-6.7) 102 95.7% (91.9-99.5) 1 0.9% (0.0-2.8) 107 100.0% (_-_)
Participated in on-the-job training
Yes 2 3.8% (0.0-9.1) 37 96.2% (90.9-100.0) . . . 39 66.7% (52.1-81.2)
No 0 . (.-.) 18 100.0% (100.0-100.0) . . . 18 33.3% (18.8-47.9)
Total 2 2.5% (0.0-6.1) 55 97.5% (93.9-100.0) . . . 57 100.0% (_-_)
Participated in Job Corps
Yes 0 . (.-.) 8 100.0% (100.0-100.0) . . . 8 19.8% (5.8-33.7)
No 2 5.7% (0.0-14.0) 23 94.3% (86.0-100.0) . . . 25 80.2% (66.3-94.2)
Total 2 4.6% (0.0-11.2) 31 95.4% (88.8-100.0) . . . 33 100.0% (_-_)
Currently Employed
Yes 3 4.1% (0.0-8.9) 59 95.9% (91.1-100.0) . . . 62 57.4% (47.0-67.8)
No 1 2.3% (0.0-6.9) 43 97.7% (93.1-100.0) . . . 44 42.6% (32.2-53.0)
Total 4 3.4% (0.0-6.7) 102 96.6% (93.3-100.0) . . . 106 100.0% (_-_)

Nevada Department of Employment, Training and Rehabilitation
Federal Fiscal Year 2013 Transition Student Satisfaction Survey
132
Q28. Overall, how would you rate the quality of those assistive technology
DEVICES you received?
Poor Fair Good Excellent Total
N % C.I.(95%) N % C.I.(95%) N % C.I.(95%) N % C.I.(95%) N % C.I.(95%)
Overall Total Total 4 14.9% (0.1-29.6) 7 29.8% (7.5-52.1) 7 21.3% (5.5-37.1) 11 34.0% (14.8-53.2) 29 100.0% (_-_)
Gender
Female 3 29.9% (0.9-59.0) 1 6.1% (0.0-18.6) 2 12.5% (0.0-30.3) 7 51.4% (21.5-81.3) 13 41.9% (21.3-62.6)
Male 1 4.0% (0.0-12.3) 6 46.9% (16.2-77.6) 5 27.6% (3.6-51.7) 4 21.5% (0.0-43.0) 16 58.1% (37.4-78.7)
Total 4 14.9% (0.1-29.6) 7 29.8% (7.5-52.1) 7 21.3% (5.5-37.1) 11 34.0% (14.8-53.2) 29 100.0% (_-_)
Age
<=18 1 17.6% (0.0-54.8) 2 82.4% (45.2-100.0) 0 . (.-.) 0 . (.-.) 3 21.8% (0.0-44.6)
Age 19 or older
3 14.1% (0.0-30.1) 5 15.2% (1.7-28.6) 7 27.2% (8.6-45.9) 11 43.5% (22.6-64.5) 26 78.2% (55.4-100.0)
Total 4 14.9% (0.1-29.6) 7 29.8% (7.5-52.1) 7 21.3% (5.5-37.1) 11 34.0% (14.8-53.2) 29 100.0% (_-_)
Race
White 0 . (.-.) 0 . (.-.) 6 45.5% (17.2-73.7) 8 54.5% (26.3-82.8) 14 41.7% (21.4-62.1)
Non White 4 25.5% (0.8-50.3) 7 51.2% (20.5-81.8) 1 4.0% (0.0-12.3) 3 19.3% (0.0-41.5) 15 58.3% (37.9-78.6)
Total 4 14.9% (0.1-29.6) 7 29.8% (7.5-52.1) 7 21.3% (5.5-37.1) 11 34.0% (14.8-53.2) 29 100.0% (_-_)
Region
South NV 4 21.5% (0.5-42.6) 6 39.5% (10.7-68.2) 4 17.3% (0.0-34.8) 4 21.7% (0.7-42.7) 18 69.0% (50.9-87.1)
North NV 0 . (.-.) 1 11.7% (0.0-34.9) 2 32.1% (0.0-70.3) 4 56.2% (16.6-95.8) 7 22.0% (5.8-38.1)
Rural NV 0 . (.-.) 0 . (.-.) 1 25.6% (0.0-71.5) 3 74.4% (28.5-100.0) 4 9.0% (0.0-18.4)
Total 4 14.9% (0.1-29.6) 7 29.8% (7.5-52.1) 7 21.3% (5.5-37.1) 11 34.0% (14.8-53.2) 29 100.0% (_-_)
Participated in on-the-job training
Yes 4 28.4% (0.0-57.1) 4 43.2% (7.1-79.3) 3 17.2% (0.0-38.6) 2 11.3% (0.0-28.6) 13 85.3% (69.1-100.0)
No 0 . (.-.) 1 25.7% (0.0-73.9) 0 . (.-.) 3 74.3% (26.1-100.0) 4 14.7% (0.0-30.9)
Total 4 24.2% (0.0-48.7) 5 40.6% (8.3-72.9) 3 14.6% (0.0-32.8) 5 20.5% (0.5-40.6) 17 100.0% (_-_)
Participated in Job Corps
Yes 0 . (.-.) 2 49.1% (0.0-100.0) 0 . (.-.) 2 50.9% (0.0-100.0) 4 18.2% (0.0-37.8)
No 2 20.5% (0.0-49.0) 2 26.6% (0.0-64.6) 3 21.2% (0.0-46.8) 5 31.7% (2.1-61.3) 12 81.8% (62.2-100.0)
Total 2 16.8% (0.0-40.4) 4 30.7% (0.0-62.8) 3 17.3% (0.0-38.3) 7 35.2% (8.2-62.2) 16 100.0% (_-_)
Currently Employed
Yes 2 11.3% (0.0-27.6) 3 24.9% (0.0-54.2) 4 19.9% (0.1-39.7) 8 43.9% (16.6-71.2) 17 54.7% (33.2-76.3)
No 2 19.2% (0.0-44.8) 4 35.8% (1.8-69.7) 3 23.0% (0.0-48.3) 3 22.1% (0.0-47.2) 12 45.3% (23.7-66.8)
Total 4 14.9% (0.1-29.6) 7 29.8% (7.5-52.1) 7 21.3% (5.5-37.1) 11 34.0% (14.8-53.2) 29 100.0% (_-_)
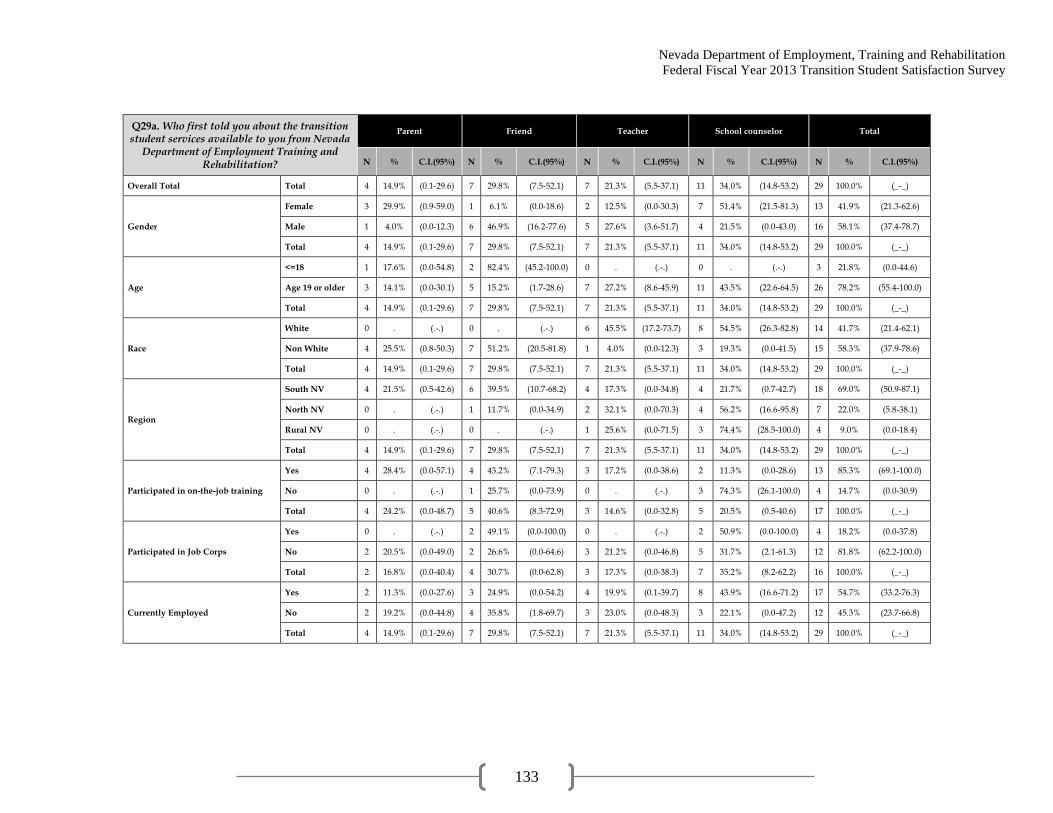
Nevada Department of Employment, Training and Rehabilitation
Federal Fiscal Year 2013 Transition Student Satisfaction Survey
133
Q29a. Who first told you about the transition student services available to you from Nevada
Department of Employment Training and Rehabilitation?
Parent Friend Teacher School counselor Total
N % C.I.(95%) N % C.I.(95%) N % C.I.(95%) N % C.I.(95%) N % C.I.(95%)
Overall Total Total 4 14.9% (0.1-29.6) 7 29.8% (7.5-52.1) 7 21.3% (5.5-37.1) 11 34.0% (14.8-53.2) 29 100.0% (_-_)
Gender
Female 3 29.9% (0.9-59.0) 1 6.1% (0.0-18.6) 2 12.5% (0.0-30.3) 7 51.4% (21.5-81.3) 13 41.9% (21.3-62.6)
Male 1 4.0% (0.0-12.3) 6 46.9% (16.2-77.6) 5 27.6% (3.6-51.7) 4 21.5% (0.0-43.0) 16 58.1% (37.4-78.7)
Total 4 14.9% (0.1-29.6) 7 29.8% (7.5-52.1) 7 21.3% (5.5-37.1) 11 34.0% (14.8-53.2) 29 100.0% (_-_)
Age
<=18 1 17.6% (0.0-54.8) 2 82.4% (45.2-100.0) 0 . (.-.) 0 . (.-.) 3 21.8% (0.0-44.6)
Age 19 or older 3 14.1% (0.0-30.1) 5 15.2% (1.7-28.6) 7 27.2% (8.6-45.9) 11 43.5% (22.6-64.5) 26 78.2% (55.4-100.0)
Total 4 14.9% (0.1-29.6) 7 29.8% (7.5-52.1) 7 21.3% (5.5-37.1) 11 34.0% (14.8-53.2) 29 100.0% (_-_)
Race
White 0 . (.-.) 0 . (.-.) 6 45.5% (17.2-73.7) 8 54.5% (26.3-82.8) 14 41.7% (21.4-62.1)
Non White 4 25.5% (0.8-50.3) 7 51.2% (20.5-81.8) 1 4.0% (0.0-12.3) 3 19.3% (0.0-41.5) 15 58.3% (37.9-78.6)
Total 4 14.9% (0.1-29.6) 7 29.8% (7.5-52.1) 7 21.3% (5.5-37.1) 11 34.0% (14.8-53.2) 29 100.0% (_-_)
Region
South NV 4 21.5% (0.5-42.6) 6 39.5% (10.7-68.2) 4 17.3% (0.0-34.8) 4 21.7% (0.7-42.7) 18 69.0% (50.9-87.1)
North NV 0 . (.-.) 1 11.7% (0.0-34.9) 2 32.1% (0.0-70.3) 4 56.2% (16.6-95.8) 7 22.0% (5.8-38.1)
Rural NV 0 . (.-.) 0 . (.-.) 1 25.6% (0.0-71.5) 3 74.4% (28.5-100.0) 4 9.0% (0.0-18.4)
Total 4 14.9% (0.1-29.6) 7 29.8% (7.5-52.1) 7 21.3% (5.5-37.1) 11 34.0% (14.8-53.2) 29 100.0% (_-_)
Participated in on-the-job training
Yes 4 28.4% (0.0-57.1) 4 43.2% (7.1-79.3) 3 17.2% (0.0-38.6) 2 11.3% (0.0-28.6) 13 85.3% (69.1-100.0)
No 0 . (.-.) 1 25.7% (0.0-73.9) 0 . (.-.) 3 74.3% (26.1-100.0) 4 14.7% (0.0-30.9)
Total 4 24.2% (0.0-48.7) 5 40.6% (8.3-72.9) 3 14.6% (0.0-32.8) 5 20.5% (0.5-40.6) 17 100.0% (_-_)
Participated in Job Corps
Yes 0 . (.-.) 2 49.1% (0.0-100.0) 0 . (.-.) 2 50.9% (0.0-100.0) 4 18.2% (0.0-37.8)
No 2 20.5% (0.0-49.0) 2 26.6% (0.0-64.6) 3 21.2% (0.0-46.8) 5 31.7% (2.1-61.3) 12 81.8% (62.2-100.0)
Total 2 16.8% (0.0-40.4) 4 30.7% (0.0-62.8) 3 17.3% (0.0-38.3) 7 35.2% (8.2-62.2) 16 100.0% (_-_)
Currently Employed
Yes 2 11.3% (0.0-27.6) 3 24.9% (0.0-54.2) 4 19.9% (0.1-39.7) 8 43.9% (16.6-71.2) 17 54.7% (33.2-76.3)
No 2 19.2% (0.0-44.8) 4 35.8% (1.8-69.7) 3 23.0% (0.0-48.3) 3 22.1% (0.0-47.2) 12 45.3% (23.7-66.8)
Total 4 14.9% (0.1-29.6) 7 29.8% (7.5-52.1) 7 21.3% (5.5-37.1) 11 34.0% (14.8-53.2) 29 100.0% (_-_)
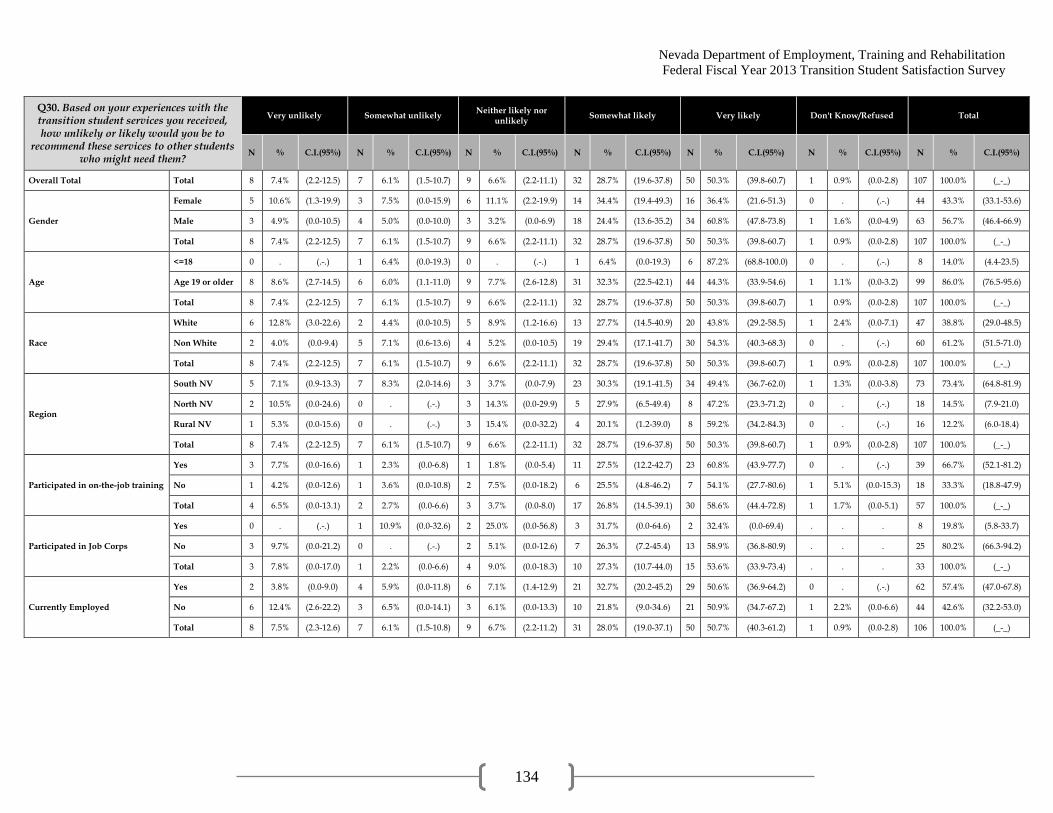
Nevada Department of Employment, Training and Rehabilitation
Federal Fiscal Year 2013 Transition Student Satisfaction Survey
134
Q30. Based on your experiences with the transition student services you received, how unlikely or likely would you be to
recommend these services to other students who might need them?
Very unlikely Somewhat unlikely Neither likely nor
unlikely Somewhat likely Very likely Don't Know/Refused Total
N % C.I.(95%) N % C.I.(95%) N % C.I.(95%) N % C.I.(95%) N % C.I.(95%) N % C.I.(95%) N % C.I.(95%)
Overall Total Total 8 7.4% (2.2-12.5) 7 6.1% (1.5-10.7) 9 6.6% (2.2-11.1) 32 28.7% (19.6-37.8) 50 50.3% (39.8-60.7) 1 0.9% (0.0-2.8) 107 100.0% (_-_)
Gender
Female 5 10.6% (1.3-19.9) 3 7.5% (0.0-15.9) 6 11.1% (2.2-19.9) 14 34.4% (19.4-49.3) 16 36.4% (21.6-51.3) 0 . (.-.) 44 43.3% (33.1-53.6)
Male 3 4.9% (0.0-10.5) 4 5.0% (0.0-10.0) 3 3.2% (0.0-6.9) 18 24.4% (13.6-35.2) 34 60.8% (47.8-73.8) 1 1.6% (0.0-4.9) 63 56.7% (46.4-66.9)
Total 8 7.4% (2.2-12.5) 7 6.1% (1.5-10.7) 9 6.6% (2.2-11.1) 32 28.7% (19.6-37.8) 50 50.3% (39.8-60.7) 1 0.9% (0.0-2.8) 107 100.0% (_-_)
Age
<=18 0 . (.-.) 1 6.4% (0.0-19.3) 0 . (.-.) 1 6.4% (0.0-19.3) 6 87.2% (68.8-100.0) 0 . (.-.) 8 14.0% (4.4-23.5)
Age 19 or older 8 8.6% (2.7-14.5) 6 6.0% (1.1-11.0) 9 7.7% (2.6-12.8) 31 32.3% (22.5-42.1) 44 44.3% (33.9-54.6) 1 1.1% (0.0-3.2) 99 86.0% (76.5-95.6)
Total 8 7.4% (2.2-12.5) 7 6.1% (1.5-10.7) 9 6.6% (2.2-11.1) 32 28.7% (19.6-37.8) 50 50.3% (39.8-60.7) 1 0.9% (0.0-2.8) 107 100.0% (_-_)
Race
White 6 12.8% (3.0-22.6) 2 4.4% (0.0-10.5) 5 8.9% (1.2-16.6) 13 27.7% (14.5-40.9) 20 43.8% (29.2-58.5) 1 2.4% (0.0-7.1) 47 38.8% (29.0-48.5)
Non White 2 4.0% (0.0-9.4) 5 7.1% (0.6-13.6) 4 5.2% (0.0-10.5) 19 29.4% (17.1-41.7) 30 54.3% (40.3-68.3) 0 . (.-.) 60 61.2% (51.5-71.0)
Total 8 7.4% (2.2-12.5) 7 6.1% (1.5-10.7) 9 6.6% (2.2-11.1) 32 28.7% (19.6-37.8) 50 50.3% (39.8-60.7) 1 0.9% (0.0-2.8) 107 100.0% (_-_)
Region
South NV 5 7.1% (0.9-13.3) 7 8.3% (2.0-14.6) 3 3.7% (0.0-7.9) 23 30.3% (19.1-41.5) 34 49.4% (36.7-62.0) 1 1.3% (0.0-3.8) 73 73.4% (64.8-81.9)
North NV 2 10.5% (0.0-24.6) 0 . (.-.) 3 14.3% (0.0-29.9) 5 27.9% (6.5-49.4) 8 47.2% (23.3-71.2) 0 . (.-.) 18 14.5% (7.9-21.0)
Rural NV 1 5.3% (0.0-15.6) 0 . (.-.) 3 15.4% (0.0-32.2) 4 20.1% (1.2-39.0) 8 59.2% (34.2-84.3) 0 . (.-.) 16 12.2% (6.0-18.4)
Total 8 7.4% (2.2-12.5) 7 6.1% (1.5-10.7) 9 6.6% (2.2-11.1) 32 28.7% (19.6-37.8) 50 50.3% (39.8-60.7) 1 0.9% (0.0-2.8) 107 100.0% (_-_)
Participated in on-the-job training
Yes 3 7.7% (0.0-16.6) 1 2.3% (0.0-6.8) 1 1.8% (0.0-5.4) 11 27.5% (12.2-42.7) 23 60.8% (43.9-77.7) 0 . (.-.) 39 66.7% (52.1-81.2)
No 1 4.2% (0.0-12.6) 1 3.6% (0.0-10.8) 2 7.5% (0.0-18.2) 6 25.5% (4.8-46.2) 7 54.1% (27.7-80.6) 1 5.1% (0.0-15.3) 18 33.3% (18.8-47.9)
Total 4 6.5% (0.0-13.1) 2 2.7% (0.0-6.6) 3 3.7% (0.0-8.0) 17 26.8% (14.5-39.1) 30 58.6% (44.4-72.8) 1 1.7% (0.0-5.1) 57 100.0% (_-_)
Participated in Job Corps
Yes 0 . (.-.) 1 10.9% (0.0-32.6) 2 25.0% (0.0-56.8) 3 31.7% (0.0-64.6) 2 32.4% (0.0-69.4) . . . 8 19.8% (5.8-33.7)
No 3 9.7% (0.0-21.2) 0 . (.-.) 2 5.1% (0.0-12.6) 7 26.3% (7.2-45.4) 13 58.9% (36.8-80.9) . . . 25 80.2% (66.3-94.2)
Total 3 7.8% (0.0-17.0) 1 2.2% (0.0-6.6) 4 9.0% (0.0-18.3) 10 27.3% (10.7-44.0) 15 53.6% (33.9-73.4) . . . 33 100.0% (_-_)
Currently Employed
Yes 2 3.8% (0.0-9.0) 4 5.9% (0.0-11.8) 6 7.1% (1.4-12.9) 21 32.7% (20.2-45.2) 29 50.6% (36.9-64.2) 0 . (.-.) 62 57.4% (47.0-67.8)
No 6 12.4% (2.6-22.2) 3 6.5% (0.0-14.1) 3 6.1% (0.0-13.3) 10 21.8% (9.0-34.6) 21 50.9% (34.7-67.2) 1 2.2% (0.0-6.6) 44 42.6% (32.2-53.0)
Total 8 7.5% (2.3-12.6) 7 6.1% (1.5-10.8) 9 6.7% (2.2-11.2) 31 28.0% (19.0-37.1) 50 50.7% (40.3-61.2) 1 0.9% (0.0-2.8) 106 100.0% (_-_)
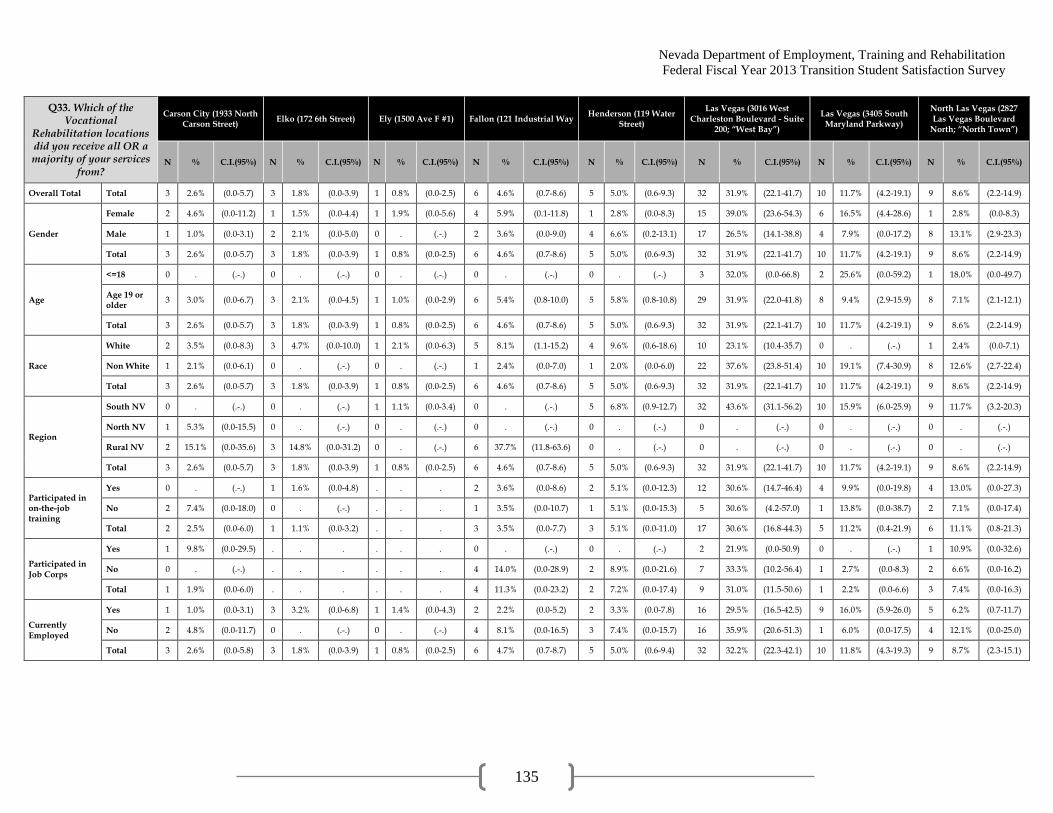
Nevada Department of Employment, Training and Rehabilitation
Federal Fiscal Year 2013 Transition Student Satisfaction Survey
135
Q33. Which of the Vocational
Rehabilitation locations did you receive all OR a majority of your services
from?
Carson City (1933 North Carson Street)
Elko (172 6th Street) Ely (1500 Ave F #1) Fallon (121 Industrial Way Henderson (119 Water
Street)
Las Vegas (3016 West Charleston Boulevard - Suite
200; “West Bay”)
Las Vegas (3405 South Maryland Parkway)
North Las Vegas (2827 Las Vegas Boulevard
North; “North Town”)
N % C.I.(95%) N % C.I.(95%) N % C.I.(95%) N % C.I.(95%) N % C.I.(95%) N % C.I.(95%) N % C.I.(95%) N % C.I.(95%)
Overall Total Total 3 2.6% (0.0-5.7) 3 1.8% (0.0-3.9) 1 0.8% (0.0-2.5) 6 4.6% (0.7-8.6) 5 5.0% (0.6-9.3) 32 31.9% (22.1-41.7) 10 11.7% (4.2-19.1) 9 8.6% (2.2-14.9)
Gender
Female 2 4.6% (0.0-11.2) 1 1.5% (0.0-4.4) 1 1.9% (0.0-5.6) 4 5.9% (0.1-11.8) 1 2.8% (0.0-8.3) 15 39.0% (23.6-54.3) 6 16.5% (4.4-28.6) 1 2.8% (0.0-8.3)
Male 1 1.0% (0.0-3.1) 2 2.1% (0.0-5.0) 0 . (.-.) 2 3.6% (0.0-9.0) 4 6.6% (0.2-13.1) 17 26.5% (14.1-38.8) 4 7.9% (0.0-17.2) 8 13.1% (2.9-23.3)
Total 3 2.6% (0.0-5.7) 3 1.8% (0.0-3.9) 1 0.8% (0.0-2.5) 6 4.6% (0.7-8.6) 5 5.0% (0.6-9.3) 32 31.9% (22.1-41.7) 10 11.7% (4.2-19.1) 9 8.6% (2.2-14.9)
Age
<=18 0 . (.-.) 0 . (.-.) 0 . (.-.) 0 . (.-.) 0 . (.-.) 3 32.0% (0.0-66.8) 2 25.6% (0.0-59.2) 1 18.0% (0.0-49.7)
Age 19 or older
3 3.0% (0.0-6.7) 3 2.1% (0.0-4.5) 1 1.0% (0.0-2.9) 6 5.4% (0.8-10.0) 5 5.8% (0.8-10.8) 29 31.9% (22.0-41.8) 8 9.4% (2.9-15.9) 8 7.1% (2.1-12.1)
Total 3 2.6% (0.0-5.7) 3 1.8% (0.0-3.9) 1 0.8% (0.0-2.5) 6 4.6% (0.7-8.6) 5 5.0% (0.6-9.3) 32 31.9% (22.1-41.7) 10 11.7% (4.2-19.1) 9 8.6% (2.2-14.9)
Race
White 2 3.5% (0.0-8.3) 3 4.7% (0.0-10.0) 1 2.1% (0.0-6.3) 5 8.1% (1.1-15.2) 4 9.6% (0.6-18.6) 10 23.1% (10.4-35.7) 0 . (.-.) 1 2.4% (0.0-7.1)
Non White 1 2.1% (0.0-6.1) 0 . (.-.) 0 . (.-.) 1 2.4% (0.0-7.0) 1 2.0% (0.0-6.0) 22 37.6% (23.8-51.4) 10 19.1% (7.4-30.9) 8 12.6% (2.7-22.4)
Total 3 2.6% (0.0-5.7) 3 1.8% (0.0-3.9) 1 0.8% (0.0-2.5) 6 4.6% (0.7-8.6) 5 5.0% (0.6-9.3) 32 31.9% (22.1-41.7) 10 11.7% (4.2-19.1) 9 8.6% (2.2-14.9)
Region
South NV 0 . (.-.) 0 . (.-.) 1 1.1% (0.0-3.4) 0 . (.-.) 5 6.8% (0.9-12.7) 32 43.6% (31.1-56.2) 10 15.9% (6.0-25.9) 9 11.7% (3.2-20.3)
North NV 1 5.3% (0.0-15.5) 0 . (.-.) 0 . (.-.) 0 . (.-.) 0 . (.-.) 0 . (.-.) 0 . (.-.) 0 . (.-.)
Rural NV 2 15.1% (0.0-35.6) 3 14.8% (0.0-31.2) 0 . (.-.) 6 37.7% (11.8-63.6) 0 . (.-.) 0 . (.-.) 0 . (.-.) 0 . (.-.)
Total 3 2.6% (0.0-5.7) 3 1.8% (0.0-3.9) 1 0.8% (0.0-2.5) 6 4.6% (0.7-8.6) 5 5.0% (0.6-9.3) 32 31.9% (22.1-41.7) 10 11.7% (4.2-19.1) 9 8.6% (2.2-14.9)
Participated in on-the-job training
Yes 0 . (.-.) 1 1.6% (0.0-4.8) . . . 2 3.6% (0.0-8.6) 2 5.1% (0.0-12.3) 12 30.6% (14.7-46.4) 4 9.9% (0.0-19.8) 4 13.0% (0.0-27.3)
No 2 7.4% (0.0-18.0) 0 . (.-.) . . . 1 3.5% (0.0-10.7) 1 5.1% (0.0-15.3) 5 30.6% (4.2-57.0) 1 13.8% (0.0-38.7) 2 7.1% (0.0-17.4)
Total 2 2.5% (0.0-6.0) 1 1.1% (0.0-3.2) . . . 3 3.5% (0.0-7.7) 3 5.1% (0.0-11.0) 17 30.6% (16.8-44.3) 5 11.2% (0.4-21.9) 6 11.1% (0.8-21.3)
Participated in Job Corps
Yes 1 9.8% (0.0-29.5) . . . . . . 0 . (.-.) 0 . (.-.) 2 21.9% (0.0-50.9) 0 . (.-.) 1 10.9% (0.0-32.6)
No 0 . (.-.) . . . . . . 4 14.0% (0.0-28.9) 2 8.9% (0.0-21.6) 7 33.3% (10.2-56.4) 1 2.7% (0.0-8.3) 2 6.6% (0.0-16.2)
Total 1 1.9% (0.0-6.0) . . . . . . 4 11.3% (0.0-23.2) 2 7.2% (0.0-17.4) 9 31.0% (11.5-50.6) 1 2.2% (0.0-6.6) 3 7.4% (0.0-16.3)
Currently Employed
Yes 1 1.0% (0.0-3.1) 3 3.2% (0.0-6.8) 1 1.4% (0.0-4.3) 2 2.2% (0.0-5.2) 2 3.3% (0.0-7.8) 16 29.5% (16.5-42.5) 9 16.0% (5.9-26.0) 5 6.2% (0.7-11.7)
No 2 4.8% (0.0-11.7) 0 . (.-.) 0 . (.-.) 4 8.1% (0.0-16.5) 3 7.4% (0.0-15.7) 16 35.9% (20.6-51.3) 1 6.0% (0.0-17.5) 4 12.1% (0.0-25.0)
Total 3 2.6% (0.0-5.8) 3 1.8% (0.0-3.9) 1 0.8% (0.0-2.5) 6 4.7% (0.7-8.7) 5 5.0% (0.6-9.4) 32 32.2% (22.3-42.1) 10 11.8% (4.3-19.3) 9 8.7% (2.3-15.1)

Nevada Department of Employment, Training and Rehabilitation
Federal Fiscal Year 2013 Transition Student Satisfaction Survey
136
Q33. Which of the Vocational
Rehabilitation locations did you receive all OR a majority of your services
from?
Reno (1325 Corporate Boulevard; “Corporate
Office”)
Reno (4001 South Virginia Street; “Old
Town Mall”)
Sparks (1675 East Prater Way)
Winnemucca (475 West Haskell, #2)
Other Location Don't Know/Refused Total
N % C.I.(95%) N % C.I.(95%) N % C.I.(95%) N % C.I.(95%) N % C.I.(95%) N % C.I.(95%) N % C.I.(95%)
Overall Total Total 14 11.4% (5.4-17.3) 2 1.3% (0.0-3.2) 2 1.8% (0.0-4.2) 3 2.7% (0.0-6.0) 9 9.4% (2.7-16.1) 7 6.4% (1.7-11.2) 106 100.0% (_-_)
Gender
Female 5 8.3% (1.1-15.5) 1 1.7% (0.0-4.9) 1 1.8% (0.0-5.2) 1 1.5% (0.0-4.4) 3 7.1% (0.0-15.2) 2 4.7% (0.0-11.3) 44 43.6% (33.3-54.0)
Male 9 13.7% (4.9-22.6) 1 1.1% (0.0-3.2) 1 1.8% (0.0-5.2) 2 3.6% (0.0-9.0) 6 11.2% (1.2-21.2) 5 7.8% (1.0-14.6) 62 56.4% (46.0-66.7)
Total 14 11.4% (5.4-17.3) 2 1.3% (0.0-3.2) 2 1.8% (0.0-4.2) 3 2.7% (0.0-6.0) 9 9.4% (2.7-16.1) 7 6.4% (1.7-11.2) 106 100.0% (_-_)
Age
<=18 0 . (.-.) 0 . (.-.) 0 . (.-.) 0 . (.-.) 2 24.4% (0.0-57.4) 0 . (.-.) 8 14.0% (4.4-23.7)
Age 19 or older
14 13.2% (6.5-20.0) 2 1.5% (0.0-3.7) 2 2.0% (0.0-4.9) 3 3.1% (0.0-7.0) 7 7.0% (1.7-12.2) 7 7.5% (2.0-13.0) 98 86.0% (76.3-95.6)
Total 14 11.4% (5.4-17.3) 2 1.3% (0.0-3.2) 2 1.8% (0.0-4.2) 3 2.7% (0.0-6.0) 9 9.4% (2.7-16.1) 7 6.4% (1.7-11.2) 106 100.0% (_-_)
Race
White 9 20.8% (8.5-33.1) 0 . (.-.) 2 4.5% (0.0-10.7) 2 3.2% (0.0-7.6) 3 6.4% (0.0-13.5) 5 11.7% (1.9-21.5) 47 39.0% (29.2-48.8)
Non White 5 5.3% (0.6-10.1) 2 2.2% (0.0-5.2) 0 . (.-.) 1 2.4% (0.0-7.0) 6 11.4% (1.4-21.3) 2 3.1% (0.0-7.5) 59 61.0% (51.2-70.8)
Total 14 11.4% (5.4-17.3) 2 1.3% (0.0-3.2) 2 1.8% (0.0-4.2) 3 2.7% (0.0-6.0) 9 9.4% (2.7-16.1) 7 6.4% (1.7-11.2) 106 100.0% (_-_)
Region
South NV 0 . (.-.) 0 . (.-.) 0 . (.-.) 0 . (.-.) 8 12.0% (3.1-20.8) 7 8.8% (2.3-15.3) 72 73.2% (64.6-81.8)
North NV 13 73.6% (52.9-94.3) 2 9.1% (0.0-21.5) 2 12.1% (0.0-28.1) 0 . (.-.) 0 . (.-.) 0 . (.-.) 18 14.6% (8.0-21.2)
Rural NV 1 5.3% (0.0-15.7) 0 . (.-.) 0 . (.-.) 3 21.8% (0.0-45.5) 1 5.3% (0.0-15.7) 0 . (.-.) 16 12.3% (6.0-18.5)
Total 14 11.4% (5.4-17.3) 2 1.3% (0.0-3.2) 2 1.8% (0.0-4.2) 3 2.7% (0.0-6.0) 9 9.4% (2.7-16.1) 7 6.4% (1.7-11.2) 106 100.0% (_-_)
Participated in on-the-job training
Yes 4 8.0% (0.0-16.0) 1 1.6% (0.0-5.0) . . . 0 . (.-.) 6 18.2% (2.8-33.6) 3 8.5% (0.0-18.0) 39 66.7% (52.1-81.2)
No 1 5.4% (0.0-16.2) 1 3.9% (0.0-11.9) . . . 2 11.4% (0.0-28.0) 2 11.6% (0.0-27.6) 0 . (.-.) 18 33.3% (18.8-47.9)
Total 5 7.1% (0.6-13.6) 2 2.4% (0.0-5.9) . . . 2 3.8% (0.0-9.5) 8 16.0% (4.3-27.7) 3 5.6% (0.0-12.1) 57 100.0% (_-_)
Participated in Job Corps
Yes 1 12.9% (0.0-37.7) 1 12.1% (0.0-35.7) 1 16.6% (0.0-47.4) 0 . (.-.) 0 . (.-.) 1 15.7% (0.0-45.1) 8 19.8% (5.8-33.7)
No 1 3.0% (0.0-9.1) 0 . (.-.) 1 3.2% (0.0-9.7) 2 5.1% (0.0-12.6) 3 17.0% (0.0-37.9) 2 6.1% (0.0-15.1) 25 80.2% (66.3-94.2)
Total 2 4.9% (0.0-12.1) 1 2.4% (0.0-7.3) 2 5.8% (0.0-14.3) 2 4.1% (0.0-10.1) 3 13.7% (0.0-30.8) 3 8.0% (0.0-17.5) 33 100.0% (_-_)
Currently Employed
Yes 9 12.1% (4.2-19.9) 0 . (.-.) 0 . (.-.) 3 4.7% (0.0-10.4) 7 14.2% (3.3-25.0) 4 6.4% (0.2-12.5) 62 57.8% (47.3-68.2)
No 5 10.7% (1.5-19.9) 2 3.2% (0.0-7.6) 2 4.2% (0.0-10.1) 0 . (.-.) 2 3.1% (0.0-7.5) 2 4.5% (0.0-11.0) 43 42.2% (31.8-52.7)
Total 14 11.5% (5.5-17.5) 2 1.3% (0.0-3.2) 2 1.8% (0.0-4.3) 3 2.7% (0.0-6.0) 9 9.5% (2.7-16.3) 6 5.6% (1.1-10.1) 105 100.0% (_-_)
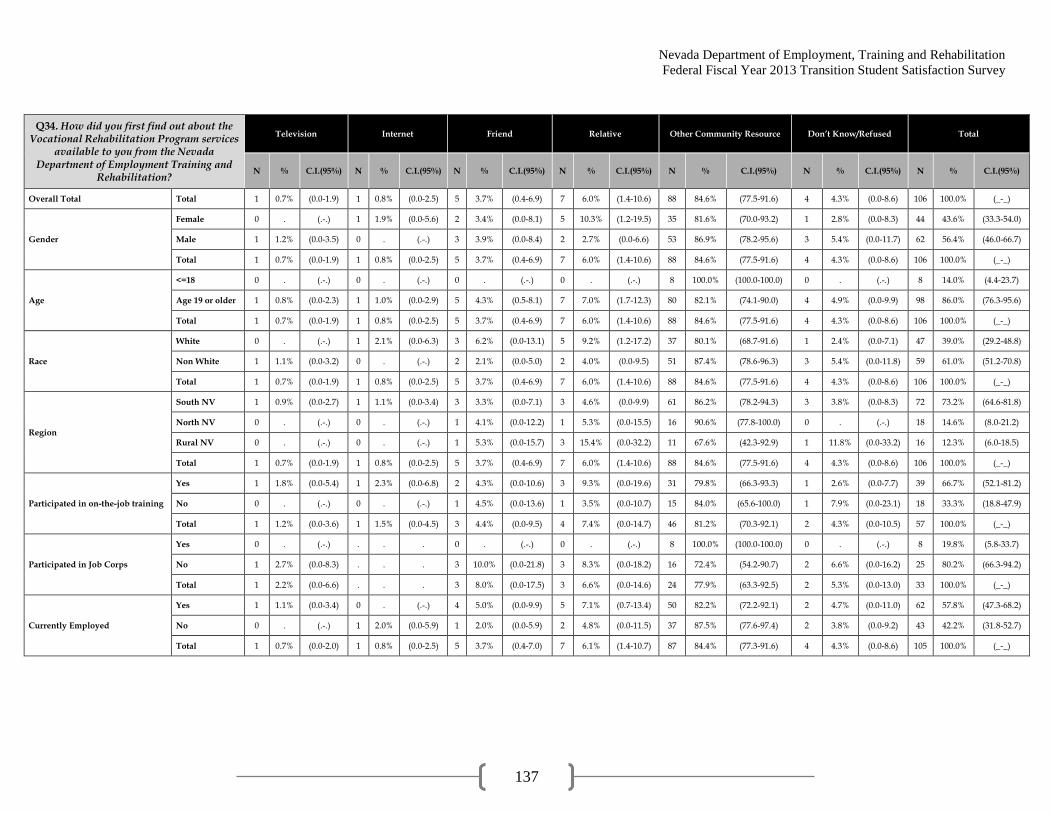
Nevada Department of Employment, Training and Rehabilitation
Federal Fiscal Year 2013 Transition Student Satisfaction Survey
137
Q34. How did you first find out about the Vocational Rehabilitation Program services
available to you from the Nevada Department of Employment Training and
Rehabilitation?
Television Internet Friend Relative Other Community Resource Don’t Know/Refused Total
N % C.I.(95%) N % C.I.(95%) N % C.I.(95%) N % C.I.(95%) N % C.I.(95%) N % C.I.(95%) N % C.I.(95%)
Overall Total Total 1 0.7% (0.0-1.9) 1 0.8% (0.0-2.5) 5 3.7% (0.4-6.9) 7 6.0% (1.4-10.6) 88 84.6% (77.5-91.6) 4 4.3% (0.0-8.6) 106 100.0% (_-_)
Gender
Female 0 . (.-.) 1 1.9% (0.0-5.6) 2 3.4% (0.0-8.1) 5 10.3% (1.2-19.5) 35 81.6% (70.0-93.2) 1 2.8% (0.0-8.3) 44 43.6% (33.3-54.0)
Male 1 1.2% (0.0-3.5) 0 . (.-.) 3 3.9% (0.0-8.4) 2 2.7% (0.0-6.6) 53 86.9% (78.2-95.6) 3 5.4% (0.0-11.7) 62 56.4% (46.0-66.7)
Total 1 0.7% (0.0-1.9) 1 0.8% (0.0-2.5) 5 3.7% (0.4-6.9) 7 6.0% (1.4-10.6) 88 84.6% (77.5-91.6) 4 4.3% (0.0-8.6) 106 100.0% (_-_)
Age
<=18 0 . (.-.) 0 . (.-.) 0 . (.-.) 0 . (.-.) 8 100.0% (100.0-100.0) 0 . (.-.) 8 14.0% (4.4-23.7)
Age 19 or older 1 0.8% (0.0-2.3) 1 1.0% (0.0-2.9) 5 4.3% (0.5-8.1) 7 7.0% (1.7-12.3) 80 82.1% (74.1-90.0) 4 4.9% (0.0-9.9) 98 86.0% (76.3-95.6)
Total 1 0.7% (0.0-1.9) 1 0.8% (0.0-2.5) 5 3.7% (0.4-6.9) 7 6.0% (1.4-10.6) 88 84.6% (77.5-91.6) 4 4.3% (0.0-8.6) 106 100.0% (_-_)
Race
White 0 . (.-.) 1 2.1% (0.0-6.3) 3 6.2% (0.0-13.1) 5 9.2% (1.2-17.2) 37 80.1% (68.7-91.6) 1 2.4% (0.0-7.1) 47 39.0% (29.2-48.8)
Non White 1 1.1% (0.0-3.2) 0 . (.-.) 2 2.1% (0.0-5.0) 2 4.0% (0.0-9.5) 51 87.4% (78.6-96.3) 3 5.4% (0.0-11.8) 59 61.0% (51.2-70.8)
Total 1 0.7% (0.0-1.9) 1 0.8% (0.0-2.5) 5 3.7% (0.4-6.9) 7 6.0% (1.4-10.6) 88 84.6% (77.5-91.6) 4 4.3% (0.0-8.6) 106 100.0% (_-_)
Region
South NV 1 0.9% (0.0-2.7) 1 1.1% (0.0-3.4) 3 3.3% (0.0-7.1) 3 4.6% (0.0-9.9) 61 86.2% (78.2-94.3) 3 3.8% (0.0-8.3) 72 73.2% (64.6-81.8)
North NV 0 . (.-.) 0 . (.-.) 1 4.1% (0.0-12.2) 1 5.3% (0.0-15.5) 16 90.6% (77.8-100.0) 0 . (.-.) 18 14.6% (8.0-21.2)
Rural NV 0 . (.-.) 0 . (.-.) 1 5.3% (0.0-15.7) 3 15.4% (0.0-32.2) 11 67.6% (42.3-92.9) 1 11.8% (0.0-33.2) 16 12.3% (6.0-18.5)
Total 1 0.7% (0.0-1.9) 1 0.8% (0.0-2.5) 5 3.7% (0.4-6.9) 7 6.0% (1.4-10.6) 88 84.6% (77.5-91.6) 4 4.3% (0.0-8.6) 106 100.0% (_-_)
Participated in on-the-job training
Yes 1 1.8% (0.0-5.4) 1 2.3% (0.0-6.8) 2 4.3% (0.0-10.6) 3 9.3% (0.0-19.6) 31 79.8% (66.3-93.3) 1 2.6% (0.0-7.7) 39 66.7% (52.1-81.2)
No 0 . (.-.) 0 . (.-.) 1 4.5% (0.0-13.6) 1 3.5% (0.0-10.7) 15 84.0% (65.6-100.0) 1 7.9% (0.0-23.1) 18 33.3% (18.8-47.9)
Total 1 1.2% (0.0-3.6) 1 1.5% (0.0-4.5) 3 4.4% (0.0-9.5) 4 7.4% (0.0-14.7) 46 81.2% (70.3-92.1) 2 4.3% (0.0-10.5) 57 100.0% (_-_)
Participated in Job Corps
Yes 0 . (.-.) . . . 0 . (.-.) 0 . (.-.) 8 100.0% (100.0-100.0) 0 . (.-.) 8 19.8% (5.8-33.7)
No 1 2.7% (0.0-8.3) . . . 3 10.0% (0.0-21.8) 3 8.3% (0.0-18.2) 16 72.4% (54.2-90.7) 2 6.6% (0.0-16.2) 25 80.2% (66.3-94.2)
Total 1 2.2% (0.0-6.6) . . . 3 8.0% (0.0-17.5) 3 6.6% (0.0-14.6) 24 77.9% (63.3-92.5) 2 5.3% (0.0-13.0) 33 100.0% (_-_)
Currently Employed
Yes 1 1.1% (0.0-3.4) 0 . (.-.) 4 5.0% (0.0-9.9) 5 7.1% (0.7-13.4) 50 82.2% (72.2-92.1) 2 4.7% (0.0-11.0) 62 57.8% (47.3-68.2)
No 0 . (.-.) 1 2.0% (0.0-5.9) 1 2.0% (0.0-5.9) 2 4.8% (0.0-11.5) 37 87.5% (77.6-97.4) 2 3.8% (0.0-9.2) 43 42.2% (31.8-52.7)
Total 1 0.7% (0.0-2.0) 1 0.8% (0.0-2.5) 5 3.7% (0.4-7.0) 7 6.1% (1.4-10.7) 87 84.4% (77.3-91.6) 4 4.3% (0.0-8.6) 105 100.0% (_-_)

Nevada Department of Employment, Training and Rehabilitation
Federal Fiscal Year 2013 Transition Student Satisfaction Survey
138
Q35. Was Vocational Rehabilitation Program information given to you in your preferred
format?
Yes No Don’t Know/Refused Total
N % C.I.(95%) N % C.I.(95%) N % C.I.(95%) N % C.I.(95%)
Overall Total Total 68 65.5% (55.7-75.4) 33 30.4% (20.9-40.0) 5 4.0% (0.3-7.8) 106 100.0% (_-_)
Gender
Female 28 63.0% (47.9-78.0) 15 34.2% (19.5-49.0) 1 2.8% (0.0-8.3) 44 43.6% (33.3-54.0)
Male 40 67.5% (54.6-80.5) 18 27.4% (15.0-39.9) 4 5.0% (0.0-10.0) 62 56.4% (46.0-66.7)
Total 68 65.5% (55.7-75.4) 33 30.4% (20.9-40.0) 5 4.0% (0.3-7.8) 106 100.0% (_-_)
Age
<=18 6 74.4% (40.8-100.0) 2 25.6% (0.0-59.2) 0 . (.-.) 8 14.0% (4.4-23.7)
Age 19 or older 62 64.1% (54.1-74.1) 31 31.2% (21.5-40.8) 5 4.7% (0.4-9.0) 98 86.0% (76.3-95.6)
Total 68 65.5% (55.7-75.4) 33 30.4% (20.9-40.0) 5 4.0% (0.3-7.8) 106 100.0% (_-_)
Race
White 31 67.6% (53.9-81.2) 14 28.5% (15.4-41.7) 2 3.9% (0.0-9.4) 47 39.0% (29.2-48.8)
Non White 37 64.3% (50.7-77.8) 19 31.6% (18.4-44.8) 3 4.1% (0.0-9.1) 59 61.0% (51.2-70.8)
Total 68 65.5% (55.7-75.4) 33 30.4% (20.9-40.0) 5 4.0% (0.3-7.8) 106 100.0% (_-_)
Region
South NV 45 63.1% (50.9-75.3) 23 32.2% (20.4-44.1) 4 4.7% (0.0-9.5) 72 73.2% (64.6-81.8)
North NV 14 78.9% (59.7-98.0) 4 21.1% (2.0-40.3) 0 . (.-.) 18 14.6% (8.0-21.2)
Rural NV 9 64.5% (40.7-88.3) 6 30.7% (8.1-53.3) 1 4.8% (0.0-14.2) 16 12.3% (6.0-18.5)
Total 68 65.5% (55.7-75.4) 33 30.4% (20.9-40.0) 5 4.0% (0.3-7.8) 106 100.0% (_-_)
Participated in on-the-job training
Yes 28 73.1% (58.1-88.1) 9 21.8% (8.0-35.6) 2 5.1% (0.0-12.6) 39 66.7% (52.1-81.2)
No 12 66.4% (40.0-92.9) 6 33.6% (7.1-60.0) 0 . (.-.) 18 33.3% (18.8-47.9)
Total 40 70.9% (57.4-84.3) 15 25.7% (12.7-38.7) 2 3.4% (0.0-8.5) 57 100.0% (_-_)
Participated in Job Corps
Yes 5 66.0% (31.8-100.0) 3 34.0% (0.0-68.2) 0 . (.-.) 8 19.8% (5.8-33.7)
No 16 69.6% (49.9-89.3) 6 19.9% (3.5-36.4) 3 10.5% (0.0-23.1) 25 80.2% (66.3-94.2)
Total 21 68.9% (51.6-86.2) 9 22.7% (7.7-37.7) 3 8.4% (0.0-18.6) 33 100.0% (_-_)
Currently Employed
Yes 40 68.7% (56.6-80.7) 20 29.2% (17.3-41.0) 2 2.2% (0.0-5.2) 62 57.8% (47.3-68.2)
No 28 62.7% (46.5-78.9) 13 32.8% (16.9-48.7) 2 4.5% (0.0-11.0) 43 42.2% (31.8-52.7)
Total 68 66.2% (56.3-76.0) 33 30.7% (21.1-40.3) 4 3.1% (0.0-6.4) 105 100.0% (_-_)
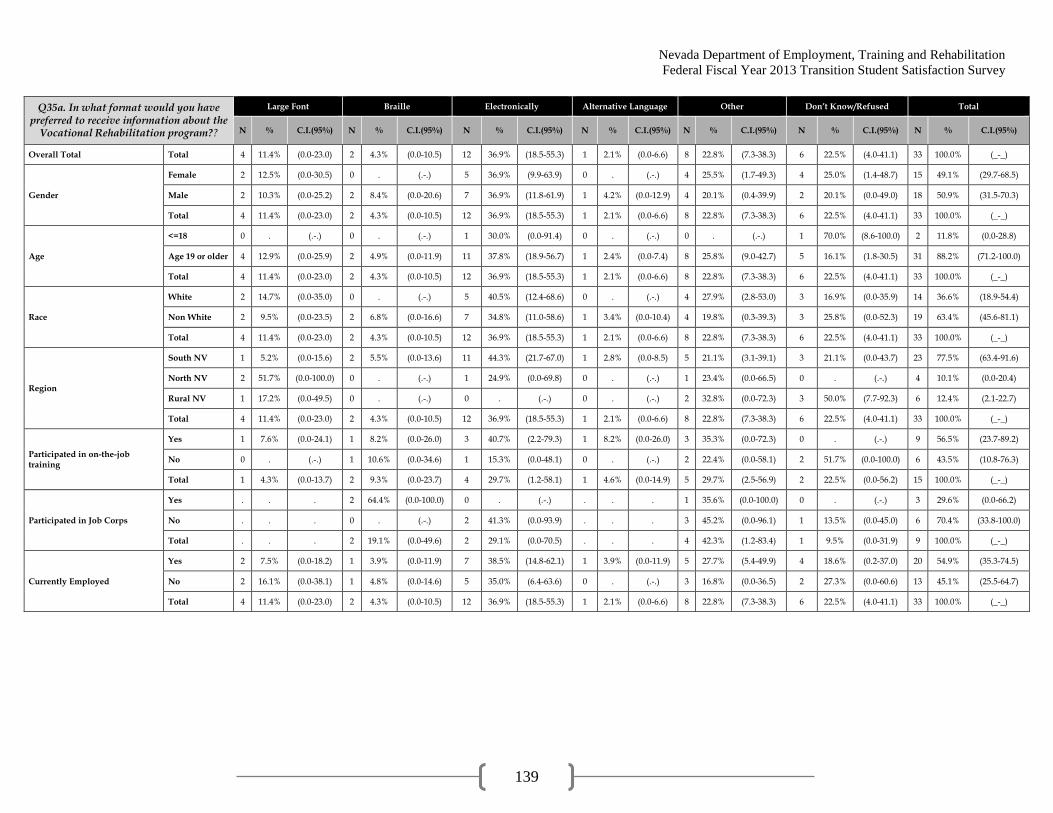
Nevada Department of Employment, Training and Rehabilitation
Federal Fiscal Year 2013 Transition Student Satisfaction Survey
139
Q35a. In what format would you have preferred to receive information about the
Vocational Rehabilitation program??
Large Font Braille Electronically Alternative Language Other Don’t Know/Refused Total
N % C.I.(95%) N % C.I.(95%) N % C.I.(95%) N % C.I.(95%) N % C.I.(95%) N % C.I.(95%) N % C.I.(95%)
Overall Total Total 4 11.4% (0.0-23.0) 2 4.3% (0.0-10.5) 12 36.9% (18.5-55.3) 1 2.1% (0.0-6.6) 8 22.8% (7.3-38.3) 6 22.5% (4.0-41.1) 33 100.0% (_-_)
Gender
Female 2 12.5% (0.0-30.5) 0 . (.-.) 5 36.9% (9.9-63.9) 0 . (.-.) 4 25.5% (1.7-49.3) 4 25.0% (1.4-48.7) 15 49.1% (29.7-68.5)
Male 2 10.3% (0.0-25.2) 2 8.4% (0.0-20.6) 7 36.9% (11.8-61.9) 1 4.2% (0.0-12.9) 4 20.1% (0.4-39.9) 2 20.1% (0.0-49.0) 18 50.9% (31.5-70.3)
Total 4 11.4% (0.0-23.0) 2 4.3% (0.0-10.5) 12 36.9% (18.5-55.3) 1 2.1% (0.0-6.6) 8 22.8% (7.3-38.3) 6 22.5% (4.0-41.1) 33 100.0% (_-_)
Age
<=18 0 . (.-.) 0 . (.-.) 1 30.0% (0.0-91.4) 0 . (.-.) 0 . (.-.) 1 70.0% (8.6-100.0) 2 11.8% (0.0-28.8)
Age 19 or older 4 12.9% (0.0-25.9) 2 4.9% (0.0-11.9) 11 37.8% (18.9-56.7) 1 2.4% (0.0-7.4) 8 25.8% (9.0-42.7) 5 16.1% (1.8-30.5) 31 88.2% (71.2-100.0)
Total 4 11.4% (0.0-23.0) 2 4.3% (0.0-10.5) 12 36.9% (18.5-55.3) 1 2.1% (0.0-6.6) 8 22.8% (7.3-38.3) 6 22.5% (4.0-41.1) 33 100.0% (_-_)
Race
White 2 14.7% (0.0-35.0) 0 . (.-.) 5 40.5% (12.4-68.6) 0 . (.-.) 4 27.9% (2.8-53.0) 3 16.9% (0.0-35.9) 14 36.6% (18.9-54.4)
Non White 2 9.5% (0.0-23.5) 2 6.8% (0.0-16.6) 7 34.8% (11.0-58.6) 1 3.4% (0.0-10.4) 4 19.8% (0.3-39.3) 3 25.8% (0.0-52.3) 19 63.4% (45.6-81.1)
Total 4 11.4% (0.0-23.0) 2 4.3% (0.0-10.5) 12 36.9% (18.5-55.3) 1 2.1% (0.0-6.6) 8 22.8% (7.3-38.3) 6 22.5% (4.0-41.1) 33 100.0% (_-_)
Region
South NV 1 5.2% (0.0-15.6) 2 5.5% (0.0-13.6) 11 44.3% (21.7-67.0) 1 2.8% (0.0-8.5) 5 21.1% (3.1-39.1) 3 21.1% (0.0-43.7) 23 77.5% (63.4-91.6)
North NV 2 51.7% (0.0-100.0) 0 . (.-.) 1 24.9% (0.0-69.8) 0 . (.-.) 1 23.4% (0.0-66.5) 0 . (.-.) 4 10.1% (0.0-20.4)
Rural NV 1 17.2% (0.0-49.5) 0 . (.-.) 0 . (.-.) 0 . (.-.) 2 32.8% (0.0-72.3) 3 50.0% (7.7-92.3) 6 12.4% (2.1-22.7)
Total 4 11.4% (0.0-23.0) 2 4.3% (0.0-10.5) 12 36.9% (18.5-55.3) 1 2.1% (0.0-6.6) 8 22.8% (7.3-38.3) 6 22.5% (4.0-41.1) 33 100.0% (_-_)
Participated in on-the-job training
Yes 1 7.6% (0.0-24.1) 1 8.2% (0.0-26.0) 3 40.7% (2.2-79.3) 1 8.2% (0.0-26.0) 3 35.3% (0.0-72.3) 0 . (.-.) 9 56.5% (23.7-89.2)
No 0 . (.-.) 1 10.6% (0.0-34.6) 1 15.3% (0.0-48.1) 0 . (.-.) 2 22.4% (0.0-58.1) 2 51.7% (0.0-100.0) 6 43.5% (10.8-76.3)
Total 1 4.3% (0.0-13.7) 2 9.3% (0.0-23.7) 4 29.7% (1.2-58.1) 1 4.6% (0.0-14.9) 5 29.7% (2.5-56.9) 2 22.5% (0.0-56.2) 15 100.0% (_-_)
Participated in Job Corps
Yes . . . 2 64.4% (0.0-100.0) 0 . (.-.) . . . 1 35.6% (0.0-100.0) 0 . (.-.) 3 29.6% (0.0-66.2)
No . . . 0 . (.-.) 2 41.3% (0.0-93.9) . . . 3 45.2% (0.0-96.1) 1 13.5% (0.0-45.0) 6 70.4% (33.8-100.0)
Total . . . 2 19.1% (0.0-49.6) 2 29.1% (0.0-70.5) . . . 4 42.3% (1.2-83.4) 1 9.5% (0.0-31.9) 9 100.0% (_-_)
Currently Employed
Yes 2 7.5% (0.0-18.2) 1 3.9% (0.0-11.9) 7 38.5% (14.8-62.1) 1 3.9% (0.0-11.9) 5 27.7% (5.4-49.9) 4 18.6% (0.2-37.0) 20 54.9% (35.3-74.5)
No 2 16.1% (0.0-38.1) 1 4.8% (0.0-14.6) 5 35.0% (6.4-63.6) 0 . (.-.) 3 16.8% (0.0-36.5) 2 27.3% (0.0-60.6) 13 45.1% (25.5-64.7)
Total 4 11.4% (0.0-23.0) 2 4.3% (0.0-10.5) 12 36.9% (18.5-55.3) 1 2.1% (0.0-6.6) 8 22.8% (7.3-38.3) 6 22.5% (4.0-41.1) 33 100.0% (_-_)
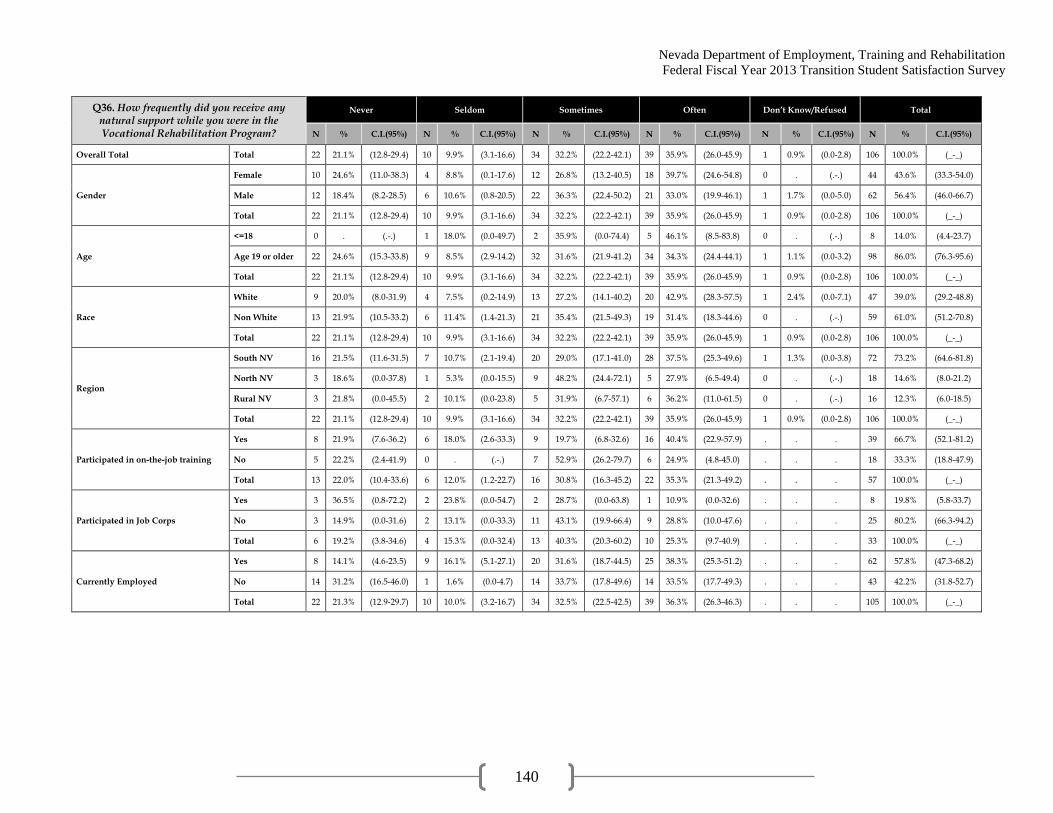
Nevada Department of Employment, Training and Rehabilitation
Federal Fiscal Year 2013 Transition Student Satisfaction Survey
140
Q36. How frequently did you receive any natural support while you were in the Vocational Rehabilitation Program?
Never Seldom Sometimes Often Don’t Know/Refused Total
N % C.I.(95%) N % C.I.(95%) N % C.I.(95%) N % C.I.(95%) N % C.I.(95%) N % C.I.(95%)
Overall Total Total 22 21.1% (12.8-29.4) 10 9.9% (3.1-16.6) 34 32.2% (22.2-42.1) 39 35.9% (26.0-45.9) 1 0.9% (0.0-2.8) 106 100.0% (_-_)
Gender
Female 10 24.6% (11.0-38.3) 4 8.8% (0.1-17.6) 12 26.8% (13.2-40.5) 18 39.7% (24.6-54.8) 0 . (.-.) 44 43.6% (33.3-54.0)
Male 12 18.4% (8.2-28.5) 6 10.6% (0.8-20.5) 22 36.3% (22.4-50.2) 21 33.0% (19.9-46.1) 1 1.7% (0.0-5.0) 62 56.4% (46.0-66.7)
Total 22 21.1% (12.8-29.4) 10 9.9% (3.1-16.6) 34 32.2% (22.2-42.1) 39 35.9% (26.0-45.9) 1 0.9% (0.0-2.8) 106 100.0% (_-_)
Age
<=18 0 . (.-.) 1 18.0% (0.0-49.7) 2 35.9% (0.0-74.4) 5 46.1% (8.5-83.8) 0 . (.-.) 8 14.0% (4.4-23.7)
Age 19 or older 22 24.6% (15.3-33.8) 9 8.5% (2.9-14.2) 32 31.6% (21.9-41.2) 34 34.3% (24.4-44.1) 1 1.1% (0.0-3.2) 98 86.0% (76.3-95.6)
Total 22 21.1% (12.8-29.4) 10 9.9% (3.1-16.6) 34 32.2% (22.2-42.1) 39 35.9% (26.0-45.9) 1 0.9% (0.0-2.8) 106 100.0% (_-_)
Race
White 9 20.0% (8.0-31.9) 4 7.5% (0.2-14.9) 13 27.2% (14.1-40.2) 20 42.9% (28.3-57.5) 1 2.4% (0.0-7.1) 47 39.0% (29.2-48.8)
Non White 13 21.9% (10.5-33.2) 6 11.4% (1.4-21.3) 21 35.4% (21.5-49.3) 19 31.4% (18.3-44.6) 0 . (.-.) 59 61.0% (51.2-70.8)
Total 22 21.1% (12.8-29.4) 10 9.9% (3.1-16.6) 34 32.2% (22.2-42.1) 39 35.9% (26.0-45.9) 1 0.9% (0.0-2.8) 106 100.0% (_-_)
Region
South NV 16 21.5% (11.6-31.5) 7 10.7% (2.1-19.4) 20 29.0% (17.1-41.0) 28 37.5% (25.3-49.6) 1 1.3% (0.0-3.8) 72 73.2% (64.6-81.8)
North NV 3 18.6% (0.0-37.8) 1 5.3% (0.0-15.5) 9 48.2% (24.4-72.1) 5 27.9% (6.5-49.4) 0 . (.-.) 18 14.6% (8.0-21.2)
Rural NV 3 21.8% (0.0-45.5) 2 10.1% (0.0-23.8) 5 31.9% (6.7-57.1) 6 36.2% (11.0-61.5) 0 . (.-.) 16 12.3% (6.0-18.5)
Total 22 21.1% (12.8-29.4) 10 9.9% (3.1-16.6) 34 32.2% (22.2-42.1) 39 35.9% (26.0-45.9) 1 0.9% (0.0-2.8) 106 100.0% (_-_)
Participated in on-the-job training
Yes 8 21.9% (7.6-36.2) 6 18.0% (2.6-33.3) 9 19.7% (6.8-32.6) 16 40.4% (22.9-57.9) . . . 39 66.7% (52.1-81.2)
No 5 22.2% (2.4-41.9) 0 . (.-.) 7 52.9% (26.2-79.7) 6 24.9% (4.8-45.0) . . . 18 33.3% (18.8-47.9)
Total 13 22.0% (10.4-33.6) 6 12.0% (1.2-22.7) 16 30.8% (16.3-45.2) 22 35.3% (21.3-49.2) . . . 57 100.0% (_-_)
Participated in Job Corps
Yes 3 36.5% (0.8-72.2) 2 23.8% (0.0-54.7) 2 28.7% (0.0-63.8) 1 10.9% (0.0-32.6) . . . 8 19.8% (5.8-33.7)
No 3 14.9% (0.0-31.6) 2 13.1% (0.0-33.3) 11 43.1% (19.9-66.4) 9 28.8% (10.0-47.6) . . . 25 80.2% (66.3-94.2)
Total 6 19.2% (3.8-34.6) 4 15.3% (0.0-32.4) 13 40.3% (20.3-60.2) 10 25.3% (9.7-40.9) . . . 33 100.0% (_-_)
Currently Employed
Yes 8 14.1% (4.6-23.5) 9 16.1% (5.1-27.1) 20 31.6% (18.7-44.5) 25 38.3% (25.3-51.2) . . . 62 57.8% (47.3-68.2)
No 14 31.2% (16.5-46.0) 1 1.6% (0.0-4.7) 14 33.7% (17.8-49.6) 14 33.5% (17.7-49.3) . . . 43 42.2% (31.8-52.7)
Total 22 21.3% (12.9-29.7) 10 10.0% (3.2-16.7) 34 32.5% (22.5-42.5) 39 36.3% (26.3-46.3) . . . 105 100.0% (_-_)
Nevada Department of Employment, Training and Rehabilitation
Federal Fiscal Year 2013 Transition Student Satisfaction Survey
141
Appendix G:
Open Ended Response
Themes
Nevada Department of Employment, Training and Rehabilitation
Federal Fiscal Year 2013 Transition Student Satisfaction Survey
142
Question 31: Based on your experiences with the student
transition program, are there any specific CHANGES that
you think could be made in order to IMPROVE the
program?
Needs of Clients
More individual attention and more communication with counselors.
Follow up on clients after job placement.
Respond to clients’ needs in a more timely fashion.
Job Placement Needs
Greater effort to find jobs clients desire.
Help students find jobs.
Nevada Department of Employment, Training and Rehabilitation
Federal Fiscal Year 2013 Transition Student Satisfaction Survey
143
Question 32: Based on your experiences with the student
transition program, are there any specific POSITIVE
aspects that should be continued or expanded in the future?
Employment Opportunities
Continue to help clients find employment.
Continue the job assessment program.
Expand the number of job options.
Staff/Counselors
Continue to create structure.
Continue having face-to-face interactions with clients.
Related Documents