Department of Employment, Training and Rehabilitation 2004 -2005 Employers Survey BY: Pamela Gallion Peggy Perkins University of Nevada, Las Vegas

Department of Employment, Training and Rehabilitation 2004 -2005 Employers Survey BY: Pamela Gallion Peggy Perkins University of Nevada, Las Vegas.
Dec 25, 2015
Welcome message from author
This document is posted to help you gain knowledge. Please leave a comment to let me know what you think about it! Share it to your friends and learn new things together.
Transcript

Department of Employment, Training and Rehabilitation
2004 -2005 Employers Survey
BY:Pamela GallionPeggy Perkins
University of Nevada, Las Vegas
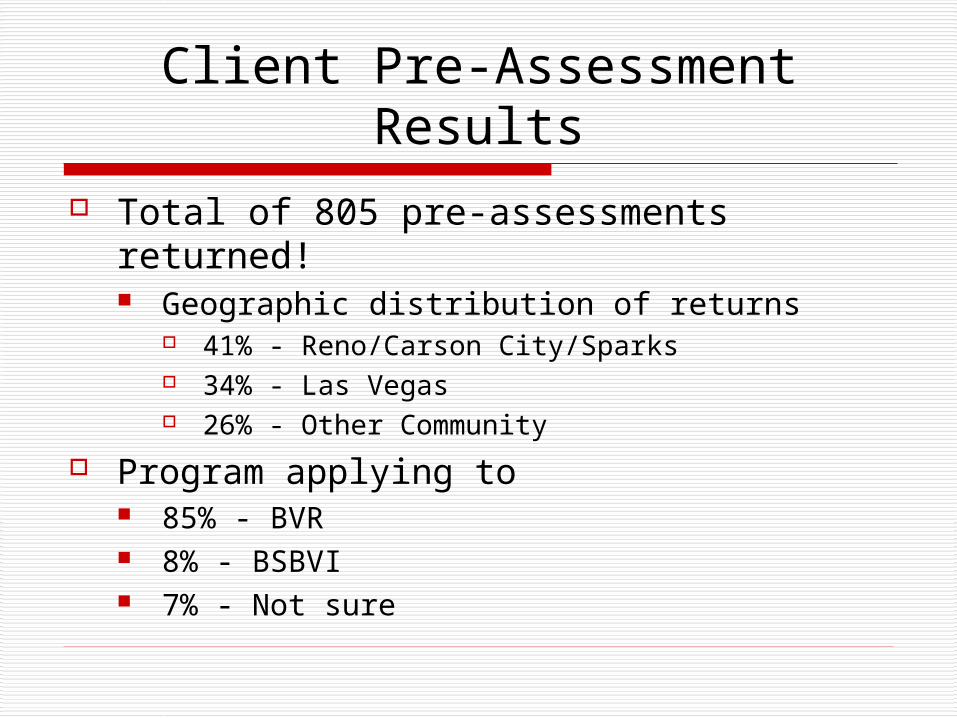
Client Pre-Assessment Results Total of 805 pre-assessments returned!
Geographic distribution of returns 41% - Reno/Carson City/Sparks 34% - Las Vegas 26% - Other Community
Program applying to 85% - BVR 8% - BSBVI 7% - Not sure

Services Needed to Obtain Work
68%
56% 60% 54%
46%
0%
10%
20%
30%
40%
50%
60%
70%
Job Training Job Referral Voc / Careercounseling
SchoolProgram
AssistiveTechnology
Services Needed to Obtain Work
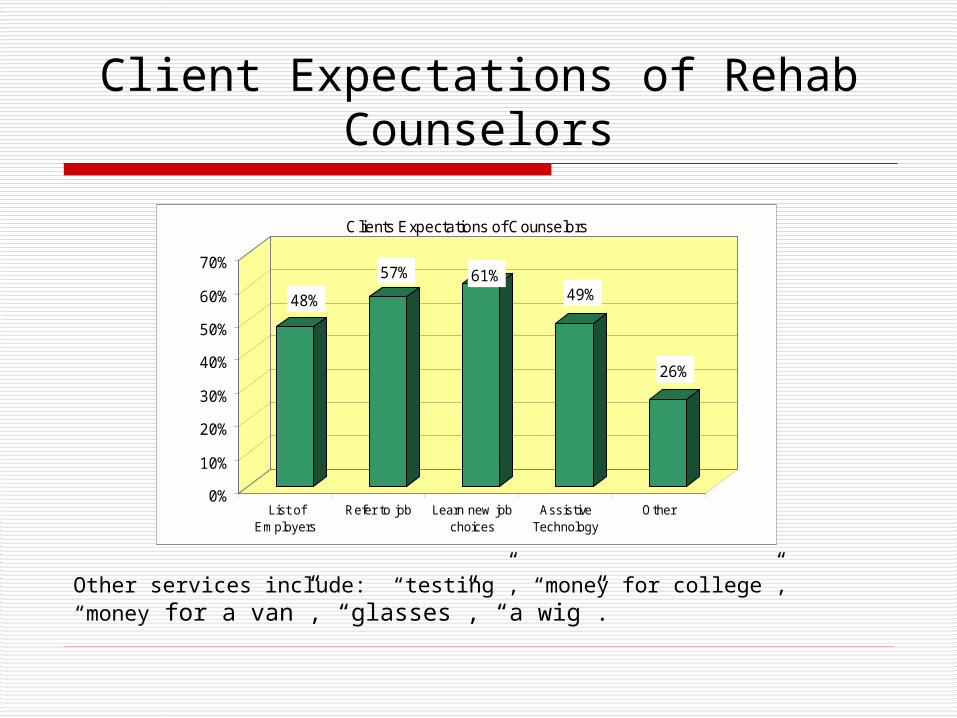
Client Expectations of Rehab Counselors
48%
57% 61%49%
26%
0%
10%
20%
30%
40%
50%
60%
70%
List ofEmployers
Refer to job Learn new jobchoices
AssistiveTechnology
Other
Clients Expectations of Counselors
Other services include: “testing”, “money for college”, “money for a van”, “glasses”, “a wig”.

Client Expectations of Program Length
37%
26%
20% 16%
0%
5%
10%
15%
20%
25%
30%
35%
40%
Less than 90 days 90 - 180 days 180 days to a year More than a year
Clients Expectations on Program Length

Demographics
Age Mean – 41 years of age Median – 42 Mode – 18
Gender Female – 52% Male – 48%

Demographics
Race / Ethnicity White / Caucasian – 72% Black / African American – 13% American Indian/Alaska Native – 4% Asian – 2% Pacific Islander – 1% Hispanic / Latino – 8%

Client Post Assessment Results
Methodology Conducted via telephone List = 425 names
179 names eliminated (42%) Three attempts to each eligible number 137 interviews completed
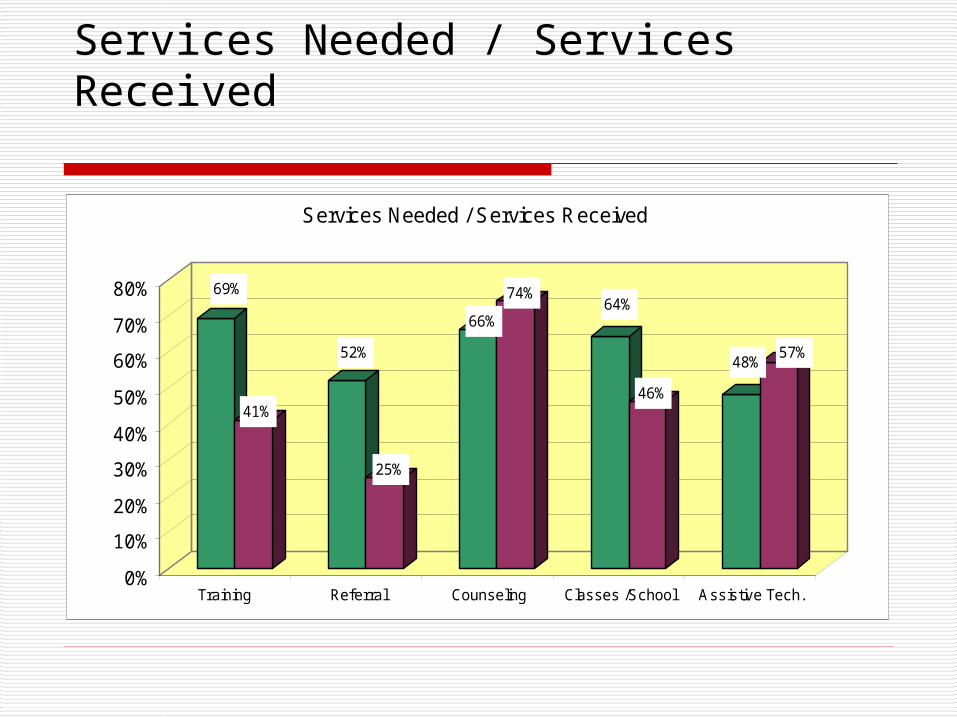
Services Needed / Services Received
69%
41%
52%
25%
66%
74%64%
46%
48%57%
0%
10%
20%
30%
40%
50%
60%
70%
80%
Training Referral Counseling Classes /School Assistive Tech.
Services Needed / Services Received

Satisfaction with Services
2%2%
7% 37% 51%
11% 22% 28% 39%
6%
2%
5% 22% 66%
13%
3%
5% 23% 54%
3%
3%
11% 16% 66%
0% 10% 20% 30% 40% 50% 60% 70% 80% 90% 100%
Job Training
Referral
Counseling
Classes
Assistive Tech
Satisfaction with Services

Overall Satisfaction with Services Provided by BVR / BSBVI
10% 9% 13%
20%
48%
0%5%
10%15%20%25%30%35%40%45%50%
1 = Lowestsatisfaction
3 5 = HighestSatisfaction
Overall Level of Satisfaction
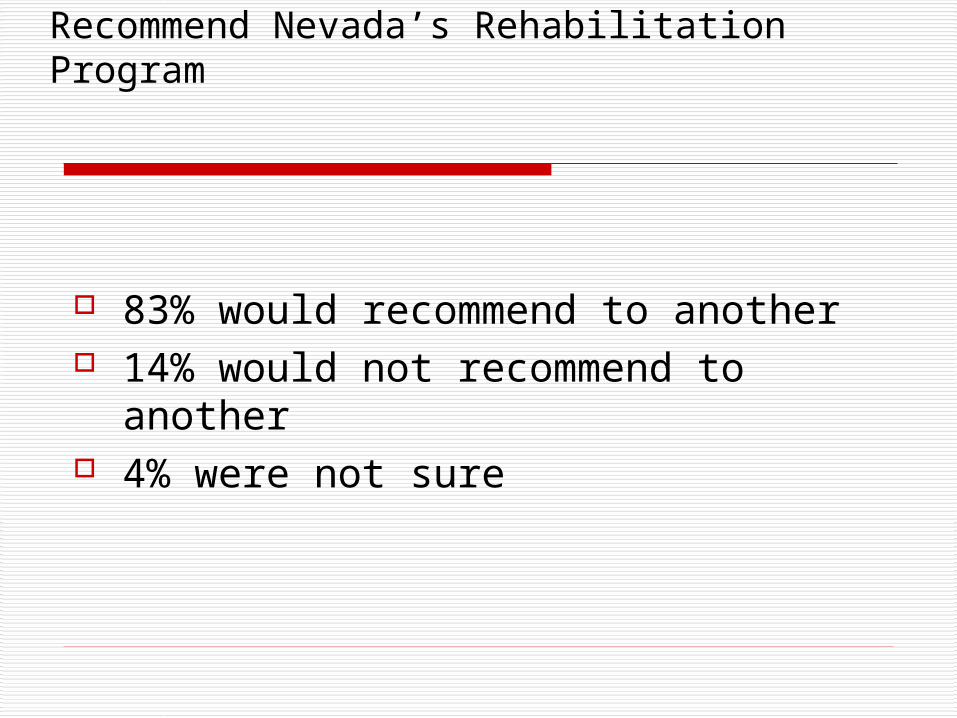
Recommend Nevada’s Rehabilitation Program
83% would recommend to another 14% would not recommend to
another 4% were not sure

04-05 Transition Students Survey Results
Methodology Conducted via telephone 474 eligible names provided by DETR Four attempts made on each number 184 completed interviews 57% response rate

Length of time out of high school
14%
42%
10%2%
17%
7%2%
0%5%
10%15%20%25%30%35%40%45%
< 1 Yr. 1 Yr.-3 Yrs.
3 Yrs.- 5
Yrs.
> 5Yrs.
HS.Sr.
HS.Jr.
Other
Educational Status
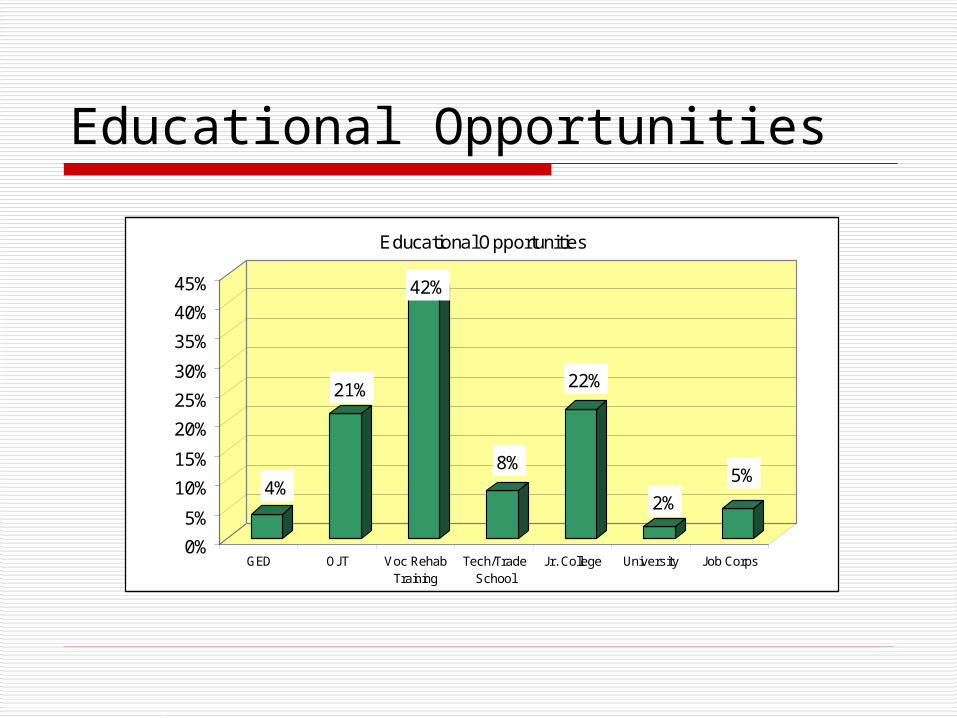
Educational Opportunities
4%
21%
42%
8%
22%
2%
5%
0%
5%
10%
15%
20%
25%
30%
35%
40%
45%
GED OJT Voc RehabTraining
Tech/TradeSchool
Jr. College University Job Corps
Educational Opportunities
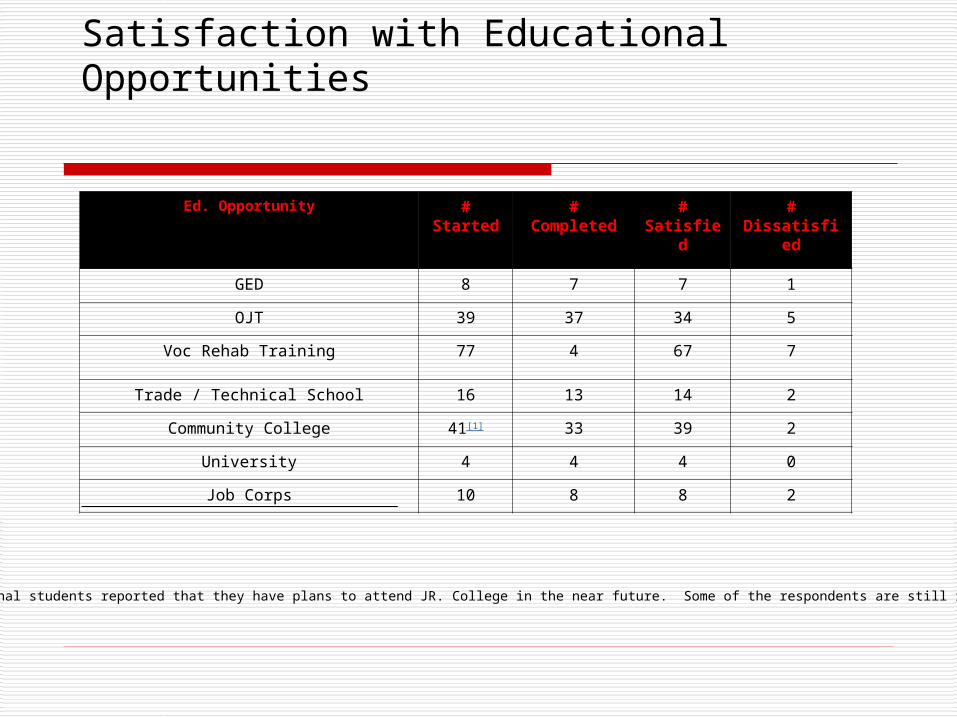
Satisfaction with Educational Opportunities
[1] Five additional students reported that they have plans to attend JR. College in the near future. Some of the respondents are still in high school.
Ed. Opportunity # Started # Completed #Satisfied
#Dissatisfied
GED 8 7 7 1
OJT 39 37 34 5
Voc Rehab Training 77 4 67 7
Trade / Technical School 16 13 14 2
Community College 41[1] 33 39 2
University 4 4 4 0
Job Corps 10 8 8 2

Number of Jobs Since HS
17%
36%
27%
9%
4%7%
0%
5%
10%
15%
20%
25%
30%
35%
40%
None One Tw o Three Four Four +
Number of Jobs Since High School
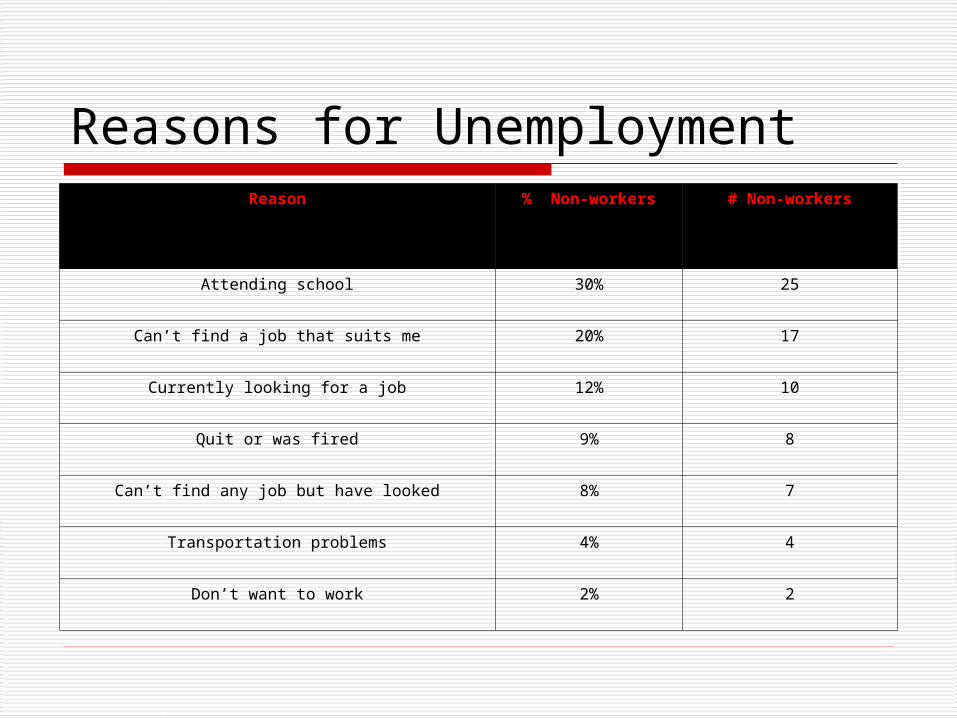
Reasons for UnemploymentReason % Non-workers # Non-workers
Attending school 30% 25
Can’t find a job that suits me 20% 17
Currently looking for a job 12% 10
Quit or was fired 9% 8
Can’t find any job but have looked 8% 7
Transportation problems 4% 4
Don’t want to work 2% 2
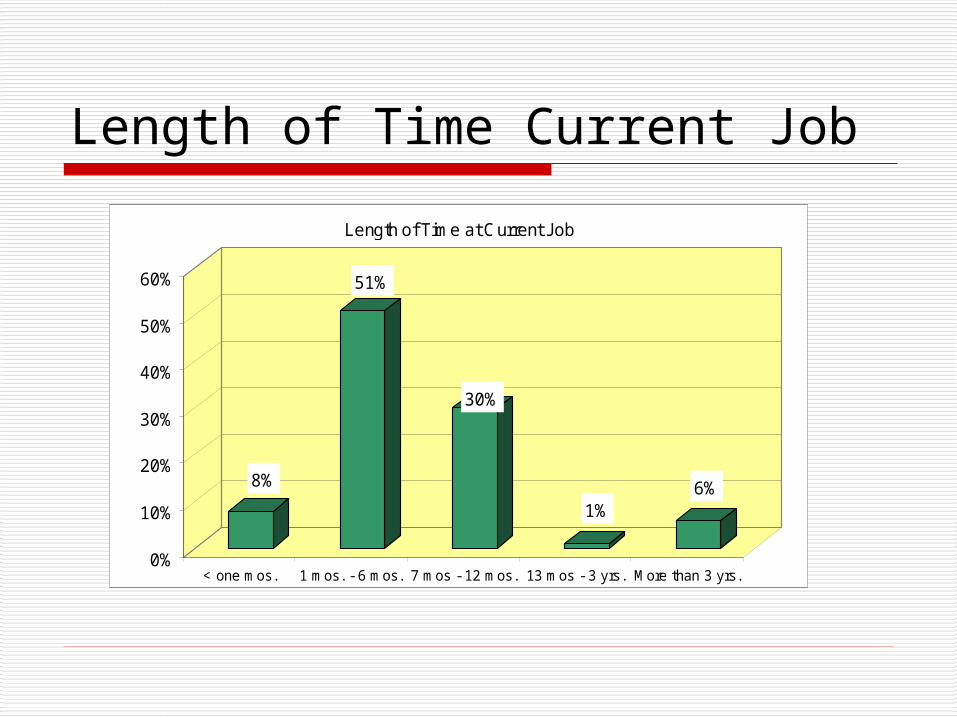
Length of Time Current Job
8%
51%
30%
1%6%
0%
10%
20%
30%
40%
50%
60%
< one mos. 1 mos. - 6 mos. 7 mos - 12 mos. 13 mos - 3 yrs. More than 3 yrs.
Length of Time at Current Job
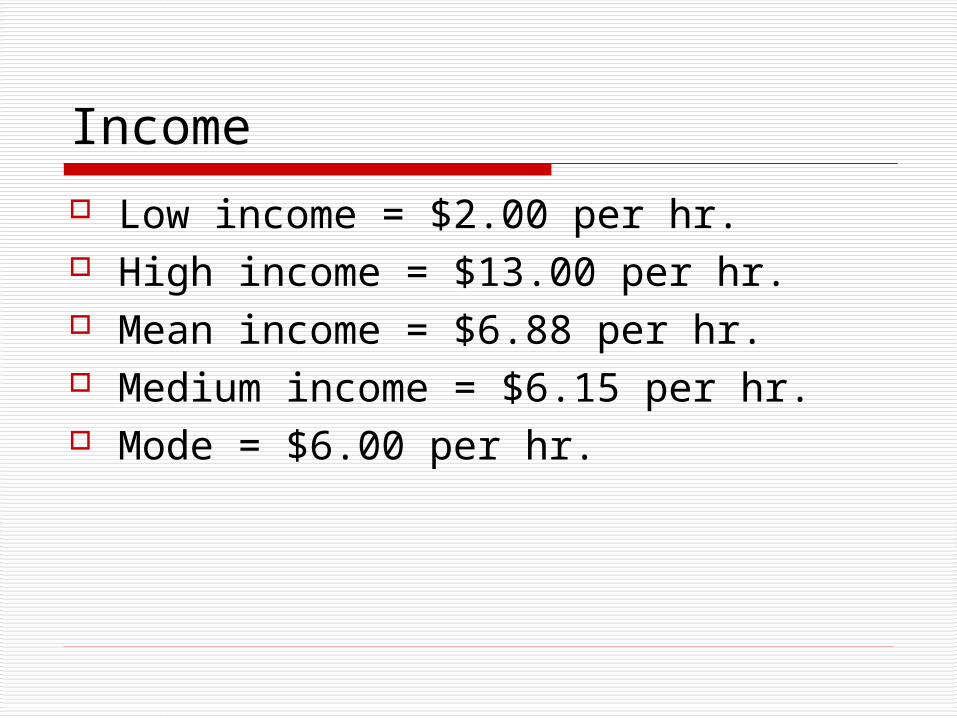
Income
Low income = $2.00 per hr. High income = $13.00 per hr. Mean income = $6.88 per hr. Medium income = $6.15 per hr. Mode = $6.00 per hr.
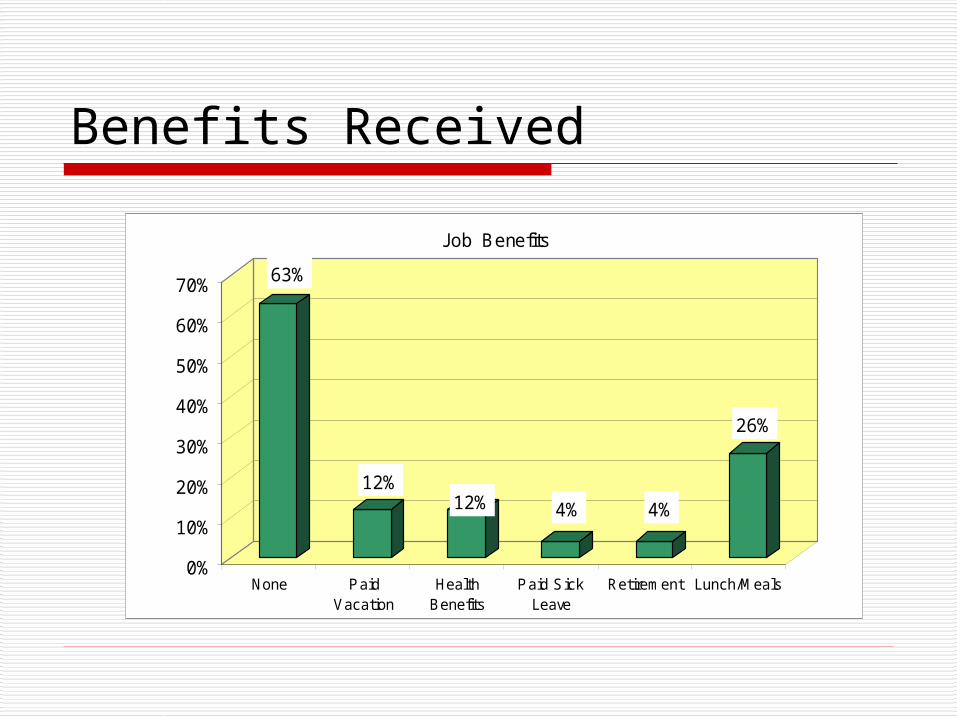
Benefits Received
63%
12%12% 4% 4%
26%
0%
10%
20%
30%
40%
50%
60%
70%
None PaidVacation
HealthBenefits
Paid SickLeave
Retirement Lunch/Meals
Job Benefits

Purpose and Participation Purpose of survey
Assess basic usage patterns of division services
Assess the rehabilitation counselor’s assistance through the process
Participation 470 eligible employers 73% response rate 317 completed surveys analyzed
Misc. Information
75% are satisfied with current job. Graduation
28% Regular diploma 51% Special diploma 21% Still in school or DNF
85% would recommend transition services to another needing them

Where learned about transition services.
5%
14%
3%
29%31%
18%
0%
5%
10%
15%
20%
25%
30%
35%
Myself Parents Friend Teacher SchoolCounselor
Other
Where Learned about Transition Services

Demographics
Geographic location 72% - Southern Nevada 11% - Reno /Carson City / Sparks 18% Other community
Gender 61% - Male 39% - Female

04-05 Employers Survey Results
Methodology Conducted via telephone with a list
provided by DETR Three attempts were made to each
number 317 Interviews completed Response rate – 73%

Percentage of Employers per Area
“ In what community is your business located?”
42% from Las Vegas area 24% from Reno, Carson City or Sparks 34% from remaining areas in the state

Company Awareness
“Is your company aware if it has hired people with disabilities in the past two years?” 55% (N=175) gave a yes response 36% (N=114) were not aware 8% (N=28) did not know

First quartile: 1-3 jobs available 53 employers 42% in Las Vegas 19% in the Reno, Carson City, Sparks area 39% in another community Employers included:
Small hotel Non-profit agencies Childcare centers Small businesses
103 available jobs

Second quartile: 4-11 jobs 52 employers 46% in Las Vegas 31% in Reno, Carson City or Sparks 23% in another community Employers included:
Department store chains Larger hotels including hotel chains Non-profit agencies Small businesses
341 available jobs

Third quartile: 12-49 jobs 47 employers 47% in Las Vegas 26% in Reno, Carson City, or Sparks 27% in another community Employers included:
Municipalities, including libraries and parks and recreation divisions Non-profit agencies Childcare Large area hospitals Banks
Large food chains Sierra Nevada Job Corps Institutions within the UCCSN system
1,080 available jobs

Fourth quartile: 50-1000 jobs 58 employers 59% in Las Vegas 26% in Reno, Carson City or Sparks 16% in another community Employers included:
Municipalities School districts Very large chain stores
(e.g. Wal-Mart or Home Depot) County government VA clinic
8,569 available jobs

Number of Potential jobs “ If you had a job opening, did you call the
Bureau of Vocational Rehabilitation or Bureau of Services to the Blind and Visually Impaired to ask if either agency had a qualified candidate?” 17% (N=52) reported they did call BVR/BSBVI to see
if they had a qualified candidate. “If yes, did they send you a candidate?”
81% (N=35) were sent a candidate from BVR/BSBVI.

Number of Potential Jobs “Is it likely that your company
will continue to interview and hire qualified people with disabilities in the future?” 86% (N=207) said they would continue
to interview and hire qualified people with disabilities
10% (N=24) said it is not likely they would interview and hire people with disabilities.

Experience with BVR/BSBVI “If you used the service of the Bureau of Vocational
Rehabilitation and the Bureau of Services to the Blind or Visually Impaired, please rate your overall satisfaction with the services provided. Use a scale of 1 to 10 where 1 means very dissatisfied and 10 means you were very satisfied with the service you received from either bureau.” 94% rated their level of satisfaction with
BVR/BSBVI services as favorable (rated five and above).
26% (N=14) reported they were very satisfied with the services received.

Experience with BVR/BSBVI “Considering experiences you may have had about using
the services of Bureau of Vocational Rehabilitation and the Bureau of Services to the Blind and Visually Impaired, to what extent have the services met your expectations? Use a scale of 1 to 10 where 1 means the services “fall short of your expectations” and 10 means the service “exceeds your expectations”.
85% responded that the services had met or exceeded expectations, with “exceeds expectations” receiving the highest number of responses (N=16).

Experience with BVR/BSBVI When you hired someone did you receive
assistance from the rehab counselor? How would you rate the service you received from the rehab counselor?” 68% of employers (N=42) that called BVR/BSBVI and
hired a candidate received assistance from a rehabilitation counselor.
53% of the employers (N=24) rated the assistance from the rehabilitation counselor “excellent”
33% rated counselor assistance “good” (N=15) 23% of employers (N=14) did not receive assistance
from the rehabilitation counselor
Related Documents