Department for Work and Pensions Equality Information - Employee Data Report under the Public Sector Equality Duty July 2016

Welcome message from author
This document is posted to help you gain knowledge. Please leave a comment to let me know what you think about it! Share it to your friends and learn new things together.
Transcript

Department for Work and
Pensions Equality
Information - Employee Data
Report under the Public Sector Equality Duty
July 2016

2
Contents
List of tables (workforce data) ................................................................................. 3
Introduction ............................................................................................................. 4
Our overall approach .............................................................................................. 6
Our approach to providing information relating to our employees .......................... 6
Our approach to benchmarking as an employer ..................................................... 7
Our approach to engaging with our employees ...................................................... 7
Our approach to developing equality objectives ..................................................... 8
Our approach to Equality Analysis .......................................................................... 8
Alternative formats .................................................................................................. 8
Feedback ................................................................................................................ 8
Information about our employees ........................................................................... 9
1. The DWP Workforce ..................................................................................... 9
2. Disciplinary procedures ............................................................................... 18
3. Exits ............................................................................................................ 22
4. Working Patterns ......................................................................................... 28
5. Grievances .................................................................................................. 32
6. Performance................................................................................................ 36
7. Promotion .................................................................................................... 38
8. Recruitment process ................................................................................... 42
9. Pay gap ............................................................................................................ 48
9. Training data ............................................................................................... 54
10 Maternity data ............................................................................................. 58
Links to additional information .............................................................................. 61

3
List of tables (workforce data)
Table 1.1-1.8 Percentage of DWP workforce by age, disability, ethnicity and gender. Table 2.1- 2.4 Percentage of employees disciplined by age, disability, ethnicity and gender. Table 3.1- 3.8 Percentage of reason for leaving by age, disability, ethnicity and gender. Table 4.1- 4.4 Percentage of employees with a part time working pattern by age, disability, ethnicity and gender. Table 5.1- 5.4 Percentage of employees raising a grievance by age, disability, ethnicity and gender. Table 6.1 - 6.4 Percentage of performance mark awarded by age, disability, ethnicity and gender. Table 7.1- 7.4 Percentage of employees promoted by age, disability, ethnicity and gender. Table 8.1-8.8 Percentage of applicants at different stages of the recruitment process by age, disability, ethnicity and gender. Table 9.1- 9.4 Pay gap by age, disability, ethnicity and gender Table 10.1- 10.4 Percentage of training applications by age, disability, ethnicity and gender. Table 11.1- 11.4 Percentage of employees returning from maternity leave by age, disability and ethnicity.

4
Introduction
We aim to build a workforce which reflects the society we serve, and to create an
inclusive culture which values and respects diversity. As a public body, the
Department for Work and Pensions (DWP) has a specific duty to publish relevant
proportionate information annually to demonstrate our compliance with the Public
Sector Equality Duty (PSED), part of the Equality Act 2010. We publish information
relating to people affected by our policies and practices and employees who share
protected characteristics in order to demonstrate our commitment to developing an
inclusive workplace, and to carry out our legal responsibilities against the three aims
of the general Equality Duty, to give due regard to the need to:
eliminate unlawful discrimination, harassment, victimisation and any other
conduct that is prohibited by or under the Act;
advance equality of opportunity between persons who share a relevant
protected characteristic and persons who do not share it; and
foster good relations between persons who share a relevant protected
characteristic and persons who do not share it.
The protected characteristics covered by the Equality Duty are:
• age;
• disability;
• gender reassignment;
• pregnancy and maternity;
• race – this includes ethnic or national origins, colour or nationality;
• religion or belief – this includes lack of belief;
• sex;
• sexual orientation; and
• marriage and civil partnership – in respect of eliminating unlawful discrimination
only.
This is our sixth report under this duty. The last report was published in July 2015.
We encourage our employees to voluntarily and confidentially provide information in
relation to their: sexual orientation; religion or belief; disability; and ethnicity. Having
robust data is vital in measuring progress on equality and to ensure that we can
accurately assess the impact of our policies on those with protected characteristics.
We monitor the effectiveness of our policies and processes in relation to these
principles primarily by analysing information collected by our internal Human

5
Resources (HR) databases; this requires reasonably complete levels of information
and sufficiently large volumes to be precise.

6
Our overall approach
Transparency is a key operating principle for the Department, we want the
information we provide to be easy to use and understand and fully accessible. To
help achieve this, where possible and relevant, we have provided:
• tables of data for all protected characteristics where data is available;
• a brief explanation of what this tells us and how an improvement will be shown;
• a description of how each table compares to previous years; and
• links to other information that you may find useful.
To allow annual comparisons, the data sets included cover the same time period as
previous publications, where possible.
Our approach to providing information relating to our employees
DWP offers a variety of services and everyone, at some point in their lives, will come
into contact with the Department. As a result, our customer base is wide and diverse.
Our continued aim is to build a workforce which reflects the society we serve, and to
create an inclusive culture which values and respects diversity. We monitor the
effectiveness of our policies and processes in relation to these principles and
primarily by analysing information collected by our internal Human Resources (HR)
database.
We encourage our employees to voluntarily provide information, in confidence, in
relation to their: sexual orientation; religion or belief; disability; and ethnicity.
Following Cabinet Office consultation with the Government Equalities Office (GEO)
and a:gender (a support network for staff in government departments) we do not
currently include questions on gender identity. We monitor our progress on
transgender equality in an appropriate and proportionate way, for example by
consulting with staff network groups and participating in the a:gender Trans Equality
Index.
As at 31 March 2016 we had 84,919 employees (headcount).The proportion of
employees who had shared information on ethnicity was 76.2% and on disability
82.2%. Also at 31 March 2016, 9.6% of our people had chosen to indicate their
sexual orientation and 4.6% their religious belief. We are taking steps to encourage
more people to provide this information. Having robust data is vital in measuring
progress on equality and ensuring that we can accurately assess the impact of our
policies on those with protected characteristics. The DWP Diversity and Inclusion
team will continue to encourage our employees to provide their diversity information,
and remind everyone why sharing personal information is important and how it will
be used carefully and appropriately.
Throughout this report data is presented in relation to the following protected
characteristics: age; disability; ethnicity; and gender. When interpreting differences in
7
the data between these groups it must be taken into consideration that the
information provided in relation to disability and ethnicity is incomplete and as such it
can be difficult to draw firm conclusions, particularly where small volumes are
concerned.
On this occasion, the levels of information provided for sexual orientation and
religion or belief are too low for publication.
Our approach to benchmarking as an employer The Department participates in a number of external benchmarking exercises that
compare our performance with other public and private sector organisations. For
example: Stonewall’s Top 100 Workplace Equality Index, Race for Opportunity and
Business Disability Forum’s Disability Standard. In 2015 we also participated in
a:gender’s Health Check and the Employers Network for Equality and Inclusion
benchmarking assessment.
Our approach to engaging with our employees
We understand the importance of engaging with our employees and the benefits and
value that an engaged workforce brings to individuals, the organisation and the
communities we serve. We use a wide range of engagement tools and techniques.
For example, employees may use a weekly publication “Have Your Say” to voice
their opinions on our intranet. Published articles receive written responses from the
relevant business area. ‘Robert’s Question Time’, a conference call, continues to be
held monthly where employees may talk to our Permanent Secretary, Robert
Devereux. They are encouraged to ask questions, raise issues and offer up ideas or
suggestions, with each receiving a response.
We continue to operate 'on the road' discussions where senior leaders visit different
locations to meet and facilitate open conversations with employees.
We use a structured approach to staff diversity network groups, recognising the
valuable role they play in communicating the views of our employees, promoting
diversity and inclusion across the Department. We also have a corporate Equality
Group which looks at all of the protected characteristics. The group issues a monthly
newsletter. An intranet based equality hub involving on-line communities provides a
route for dialogue and a range of resources about each of the protected
characteristics. Themes emerging from the on-line communities are escalated by the
Equality Group and discussed with the Permanent Secretary at quarterly meetings.
The Department offers our employees the opportunity to spend a day working for a
local voluntary or community organisation in their area. Since 2012 we have
committed to giving 10,000 volunteering days each year via our ‘Community 10,000’
scheme.
Working with our Departmental Trade Unions is an important part of employee
engagement. Representatives from across the Department meet our Trade Unions

8
on a regular basis, at both a national and regional level to discuss and progress
relevant issues.
Our approach to developing equality objectives
The specific duty required the Department to set measurable equality objectives by
April 2012 and to refresh them at intervals of not less than 4 years. DWP's equality
objectives for 2012 to 2016 looked at addressing key equality and inclusion issues
for both our customers and employees. They are embedded within our
organisational aims and align with our Single Departmental Plan. Our objectives for
2016 to 2020 are currently under review and will be formally published by Autumn
2016.
Our approach to Equality Analysis
We embed equality analysis into the processes we use to develop, deliver and
evaluate our policies, practices and services. This ensures that we continue to
consider the likely and actual effects of what we do and this, in turn, informs our
decision making processes.
Alternative formats
If you would like a copy of this report in an alternative format, please contact:
Diversity & Inclusion
Kings Court
80 Hanover Way
Sheffield
S2 7UF
Email: [email protected]
Feedback
Thank you for taking the time to read this report, we welcome your feedback. We will
review the format of the publication for next year with the view of streamlining it and
would welcome users comments on what they find useful. Please write to us using
the details above.

9
Information about our employees
1. The DWP Workforce
As part of our commitment to achieving a workforce representative of the society we
serve and providing equality of opportunity, we monitor representation of protected
characteristics by grade across the Department. We also set representation targets
for staff at senior grades for ethnicity, disability and gender.
The Civil Service grading structure indicates level of seniority within the organisation
and covers a range of roles:
Senior Civil Service (SCS):
Pay Band 3 Director General
Pay Bands 2 and 1 Director and Deputy Director
Senior Management:
Grade 6/Band G
Grade 7/Band F
Managerial:
SEO/Band E
HEO/Band D
EO/Band C
Administrative:
AO/Band B
AA/Band A
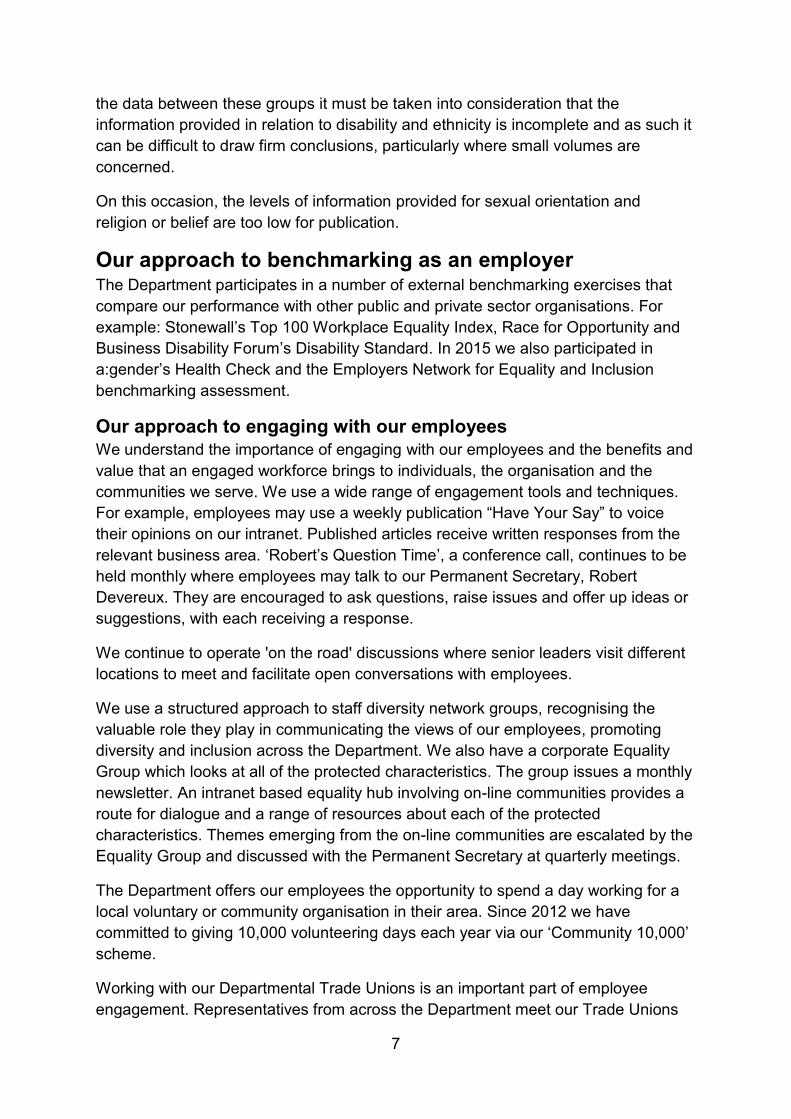
What does this tell us?
The data presented here show the Department’s employees by grade as
percentages against each of the following protected characteristics: age; disability;
ethnicity; and gender.

10
Proportionally, there has been little change on 2015. Around 65% of staff are aged
45 and over, with 1.7% aged 65+.
The targets for disability representation have been exceeded by all grades that have
a target with the exception of Grade 6, which is 0.1 percentage points below target.
From 2015 to 2016 there were increases in Grade 7 and SCS representation, both of
which had been below target in 2015.
The target for ethnic minority representation has been exceeded at the SCS grade in
2016 although the total number of staff at this grade is small. However the targets
have not been reached in the grades from HEO to Grade 6. There is no ethnicity
target for the AA to EO grades, which cover the bulk of DWP staff, as a
consequence of representation at these grades being above the economically active
rate when the targets were set.
The gender target for Grade 7 was exceeded. However the targets for Grade 6 and
SCS were not achieved. The numbers in these bands are small.
How will an improvement be shown?
A higher percentage under each protected characteristic will suggest that we employ
a greater proportion of people with that protected characteristic.

11
Table 1.1: Percentage of DWP workforce by age and grade in relation to overall headcount 1,2,3,4
Grade
% of Total headcount Age
% Band A /
AA to Band C / EO
% Band D /
HEO & Band E /
SEO
% Band F /
G7 % Band
G / G6 %
SCS (All)
% Not Known/
Other
16-24 2.2 1.0 * 0.0 0.0 0.0 2.0
25-34 10.7 7.3 9.2 4.4 4.5 0.0 10.2
35-44 22.5 21.2 23.8 21.9 24.9 0.0 22.4
45-54 38.6 47.3 45.9 48.7 50.7 0.0 39.8
55-64 24.1 22.6 20.6 24.9 19.5 0.0 23.9
65+ 1.8 0.7 0.4 * * 0.0 1.7
Total 100 100 100 100 100 0.0 100 Total % of headcount by grade 86.6 10.5 1.9 0.7 0.3 0.0 100

12
Table 1.2: Percentage of DWP workforce by age and proportion in grade 1,2,3,4
Grade
% Total % of Total headcount Age
% Band A / AA to Band C /
EO
% Band D / HEO & Band E / SEO
% Band F / G7
% Band G / G6
% SCS (All)
% Not Known/ Other
16-24 94.8 5.1 * 0.0 0.0 0.0 100 2.0
25-34 90.4 7.5 1.7 0.3 0.1 0.0 100 10.2
35-44 87.0 10.0 2.0 0.7 0.3 0.0 100 22.4
45-54 84.1 12.5 2.2 0.9 0.3 0.0 100 39.8
55-64 87.4 10.0 1.6 0.8 0.2 0.0 100 23.9
65+ 94.7 4.6 0.5 * * 0.0 100 1.7
Total % of headcount by grade 86.6 10.5 1.9 0.7 0.3 0.0 100 100
13
Table 1.3: Percentage of DWP workforce by grade and indicated disability in relation to overall
headcount [indicated] 1,3,4
Grade
% of Total headcount Disability
% Band A / AA to Band
C / EO
% Band D / HEO &
Band E / SEO
% Band F / G7
% Band G / G6
% SCS (All)
% Not Known/ Other
2012-2016 Target 6.0 5.5 5.2 5.2 5.2 N/A N/A
Disabled 7.3 5.7 5.4 5.1 6.0 0.0 7.0
Non-disabled 92.7 94.3 94.6 94.9 94.0 0.0 93.0
Total 100 100 100 100 100 0.0 100
Total % of headcount by grade 86.1 11.2 1.8 0.7 0.2 0.0 100

14
Table 1.4: Percentage of DWP workforce by indicated disability and proportion in grade 1,,3,4
Grade
%Total % of Total headcount Disability
% Band A / AA to Band C /
EO
% Band D / HEO &
Band E / SEO
% Band F / G7
% Band G / G6
% SCS (All)
% Not Known/
Other
Disabled 88.9 9.0 1.4 0.5 0.2 0.0 100 7.0
Non-disabled 85.9 11.3 1.9 0.7 0.2 0.0 100 93.0 Total % of headcount by grade 86.1 11.2 1.8 0.7 0.2 0.0 100 100

15
Table 1.5: Percentage of DWP workforce by grade and indicated ethnicity in relation to overall headcount
[indicated] 1,3,4
Grade
% of Total
headcount Minority
% Band A /
AA to Band C / EO
% Band D /
HEO & Band E /
SEO % Band F
/ G7 % Band
G / G6 % SCS
(All)
% Not Known/
Other
2012-2016 Target N/A 7.5 5.5 5.5 5.0 N/A N/A
Ethnic minority 12.3 7.3 5.2 2.9 5.4 0.0 11.6
White 87.7 92.7 94.8 97.1 94.6 0.0 88.4
Total 100 100 100 100 100 0.0 100
Total % of headcount by grade 86.2 11.1 1.8 0.7 0.2 0.0 100

16
Table 1.6: Percentage of DWP workforce by indicated ethnicity and proportion in grade 1,3,4
Grade
% Total % of Total headcount Minority
% Band A / AA to
Band C / EO
% Band D / HEO & Band E /
SEO % Band
F / G7 % Band
G / G6 % SCS
(All)
% Not
Known/ Other
Ethnic minority 91.9 7.0 0.8 0.2 0.1 0.0 100 11.6
White 85.4 11.6 2.0 0.8 0.2 0.0 100 88.4
Total % of headcount by grade 86.2 11.1 1.8 0.7 0.2 0.0 100 100
Table 1.7: Percentage of DWP workforce by grade and gender in relation to overall headcount 1,3,4
Grade
% of Total headcount Gender
% Band A / AA to
Band C / EO
% Band D / HEO &
Band E / SEO % Band
F / G7 % Band
G / G6 % SCS
(All)
% Not Known/
Other
2012-2016 Target N/A N/A 47.0 45.0 39.5 N/A N/A
Female 69.9 61.2 50.2 43.8 38.9 0.0 68.4
Male 30.1 38.8 49.8 56.2 61.1 0.0 31.6
Total 100 100 100 100 100 0.0 100 Total % of headcount by grade 86.6 10.5 1.9 0.7 0.3 0.0 100

17
Table 1.8: Percentage of DWP workforce by gender and proportion in grade 1,3,4
Grade
% Total % of Total headcount Gender
% Band A / AA to Band C /
EO
% Band D / HEO & Band
E / SEO % Band
F / G7 % Band
G / G6 % SCS
(All)
% Not
Known/ Other
Female 88.5 9.4 1.4 0.5 0.1 0.0 100 68.4
Male 82.3 12.9 3.0 1.3 0.5 0.0 100 31.6 Total % of headcount by grade 86.6 10.5 1.9 0.7 0.3 0.0 100 100
All data sourced from DWPs HR Database
Notes:
1. Data as at 31 March 2016
2. * - Level of data too low for publication and percentages are rounded to 1 decimal place.
3. Percentages shown are the number of employees by protected characteristic, over the total number of employees who have
chosen to indicate that protected characteristic.
4. Percentages shown are the number of employees working part time by protected characteristic, over the total number of
employees working part time who have chosen to indicate that protected characteristic.
.

18
2. Disciplinary procedures
What does this tell us?
The data presented here shows the percentage of employees who have been
subject to formal disciplinary procedures against their status in relation to each of the
following protected characteristics: age; disability; ethnicity and gender. For ease of
comparison the tables include a column illustrating the overall headcount breakdown
for the protected characteristic taken from the tables in section earlier in this report.
Compared with the 2015 report, the percentage of staff disciplined has declined for
all age groups. It can also be noted that the volumes in the 16-24 and over 65 age
groups are too small to draw any conclusions.
How will an improvement be shown?
Generally the similarity of this indicator in a protected and non-protected group will
indicate equivalent amounts of disciplinary action.

19
Table 2.1: Percentage of employees by age who were disciplined 1,2,3,4,5
Age % of total headcount in group 3 % disciplined in group 4 % of group
disciplined 5
16-24 2.0 * *
25-34 10.2 12.0 1.0
35-44 22.4 25.4 0.9
45-54 39.8 36.2 0.8
55-64 23.9 23.5 0.8
65+ 1.7 2.4 1.2
Total 100 100
Table 2.2: Percentage of employees by indicated disability who were disciplined 1,3,4,5
Disability % of total headcount in group
3 % disciplined in group 4 % of group disciplined 5
Disabled 7.0 12.0 1.4
Non-disabled 93.0 88.0 0.8
Total 100 100

20
Table 2.3: Percentage of employees by indicated ethnicity who were disciplined 1,3,4,5
Ethnicity % of total headcount in group
3 % disciplined in group 4 % of group disciplined 5
Ethnic minority 11.6 12.6 0.9
White 88.4 87.4 0.9
Total 100 100

21
Table 2.4: Percentage of employees by gender who were disciplined 1,3,4,5
Gender % of total headcount in group 3 % disciplined in group 4 % of group disciplined 5
Female 68.4 56.2 0.7
Male 31.6 43.8 1.1
Total 100 100
All data sourced from DWPs HR Database.
Notes:
1. Data period 1 April 2015 to 31 March 2016
2. * - Level of data too low for publication and percentages are rounded to 1 decimal place.
3. Percentages shown are the number of employees by protected characteristic, over the total number of employees who have
chosen to indicate that protected characteristic.
4. Percentages shown are the number of employees disciplined by protected characteristic, over the total number of employees
disciplined who have chosen to indicate that protected characteristic.
5. Percentages shown are the number of employees disciplined by protected characteristic, over the total number of employees that have chosen to indicate that protected characteristic

22
3. Exits
What does this tell us?
The data presented here shows the reasons why employees leave the Department
against their status in relation to each of the following protected characteristics: age;
disability; ethnicity; and gender.
The results indicate that the main reasons for leaving are due to managed exits,
retirement and resignation. Above age 35, resignation tends to be replaced by
managed exits and retirement.
The ‘Other’ reason no longer includes transfers. The split of ‘Other’ leavers has
consequently shifted to have a larger proportion staff who have indicated they are
disabled than in 2015. ‘Other’ reasons include ill-health retirement, which may affect
disabled staff more.
Managed exits make up a larger proportion of leavers than in 2015, around 39% in
2016 compared with around 29% in 2015. The proportion of female leavers
attributed to managed exits has increased around fifteen percentage points on last
year, compared to a 2 percentage point increase for male leavers.
How will an improvement be shown?
A decrease in the percentage does not necessarily constitute an improvement, as
the decision by an individual to leave the organisation is impacted by a range of
personal factors.

23
Table 3.1: Percentage of reason for leaving by age in relation to overall number of leavers 1,2,3,4,5,6,7
Age % Dismissals % Managed
exits % Resignation % Retirement % Transfers % Other % of Total leavers
16-24 6.6 * 12.4 0.0 5.2 39.0 4.6
25-34 11.2 4.2 26.4
34.5 7.2 12.6
35-44 23.0 13.8 21.4 0.6 28.6 5.1 15.4
45-54 29.4 34.0 21.1 6.3 26.3 17.8 24.8
55-64 25.8 41.8 17.1 67.8 5.2 25.8 34.9
65+ 3.9 6.2 1.7 25.2 * 5.1 7.6
Total 100 100 100 100 100 100 100 Total % leavers by reason 7.3 39.2 20.2 17.5 13.3 2.4 100

24
Table 3.2: Percentage of reason for leaving by age in relation to total number of leavers in that group 1,2,3,4,5,6,7
Age % Dismissals % Managed
exits %
Resignation % Retirement %
Transfers % Other %
Total % of Total
leavers
16-24 10.4 * 53.9 0.0 15.0 20.3 100 4.6
25-34 6.5 13.0 42.4 * 36.5 1.4 100 12.6
35-44 10.9 35.0 28.0 0.7 24.6 0.8 100 15.4
45-54 8.6 53.8 17.2 4.5 14.1 1.7 100 24.8
55-64 5.4 47.0 9.9 34.0 2.0 1.8 100 34.9
65+ 3.8 32.1 4.6 57.7 * 1.6 100 7.6 Total % leavers by reason 7.3 39.2 20.2 17.5 13.3 2.4 100 100
Table 3.3: Percentage of reason for leaving by indicated disability in relation to overall number of leavers 1,2,3,5,6,7
Disability % Dismissals % Managed
exits %
Resignation % Retirement %
Transfers % Other % of Total
leavers
Disabled 12.2 9.3 6.3 10.9 5.0 16.3 9.1
Non-disabled 87.8 90.7 93.7 89.1 95.0 83.7 90.9
Total 100 100 100 100 100 100 100 Total % leavers by reason 6.9 46.6 13.4 21.0 10.5 1.7 100

25
Table 3.4: Percentage of reason for leaving by indicated disability in relation to total number of leavers in
that group 1,2,3,5,6,7
Disability % Dismissals %
Managed exits %
Resignation %
Retirement %
Transfers %
Other Total
% of Total
leavers
Disabled 9.2 47.7 9.2 25.0 5.7 3.1 100 9.1
Non-disabled 6.6 46.4 13.8 20.6 11.0 1.6 100 90.9 Total % leavers by reason 6.9 46.6 13.4 21.0 10.5 1.7 100 100
Table 3.5: Percentage of reason for leaving by indicated ethnicity in relation to overall number of leavers
1,2,3,5,6,7
Ethnicity % Dismissals
% Managed
exits % Resignation %
Retirement % Transfers %
Other % of Total
leavers
Ethnic minority 10.3 10.9 10.2 6.8 15.6 14.3 10.5
White 89.7 89.1 89.8 93.2 84.4 85.7 89.5
Total 100 100 100 100 100 100 100
Total % leavers by reason 6.7 44.9 15.4 19.7 11.5 1.9 100

26
Table 3.6: Percentage of reason for leaving by indicated ethnicity in relation to total number of leavers in
that group 1,2,3,5,6,7
Ethnicity %
Dismissals
% Managed
exits %
Resignation %
Retirement %
Transfers %
Other % Total % of Total
leavers
Ethnic minority 6.5 46.3 14.9 12.6 17.0 2.5 100 10.5
White 6.7 44.7 15.5 20.5 10.8 1.8 100 89.5
Total % leavers by reason 6.7 44.9 15.4 19.7 11.5 1.9 100 100
Table 3.7: Percentage of reason for leaving by gender in relation to overall number of leavers 1,2, 3,5,6,7
Gender % Dismissals % Managed
exits % Resignation % Retirement %
Transfers % Other % of Total
leavers
Female 61.0 76.3 59.9 67.0 56.4 55.1 67.1
Male 39.0 23.7 40.1 33.0 43.6 44.9 32.9
Total 100 100 100 100 100 100 100
Total % leavers by reason 7.3 39.2 20.2 17.5 13.3 2.4 100

27
Table 3.8: Percentage of reason for leaving by gender in relation to total number of leavers in that group 1,2,3,5,6,7
Gender %
Dismissals
% Managed
exits %
Resignation %
Retirement %
Transfers %
Other % Total % of Total
leavers
Female 6.6 44.6 18.1 17.5 11.2 2.0 100 67.1
Male 8.7 28.3 24.6 17.5 17.6 3.3 100 32.9
Total % leavers by reason 7.3 39.2 20.2 17.5 13.3 2.4 100 100
All data sourced from DWPs HR Database.
Notes:
1. Percentages shown are the number of leavers who have chosen to indicate that protected characteristic and reason for leaving,
over the total number of employees by reason for leaving.
2. Percentages shown are the number of leavers who have chosen to indicate that protected characteristic and reason for leaving,
over the total number of leavers in that particular group.
3. Data period 1 April 2015 to 31 March 2016
4. * - Level of data too low for publication and percentages are rounded to 1 decimal place.
5. Dismissal - dismissal and discharged probation.
6. Early exits - approved early retirement, voluntary early release, early retirement, early severance.
7. Other - death in service, end of temporary contract and blank reason for leaving.

28
4. Working Patterns
What does this tell us?
The data presented here shows the percentage of employees with a part-time
working pattern against their status in relation to each of the following protected
characteristics: age; disability; ethnicity; and gender.
There has been a small decrease in the proportion of staff that work part time; this is
seen across all age groups.
The percentages of those employees who identified themselves as being disabled or
ethnic minority who work part-time are close to the values for the corresponding non-
protected groups, suggesting similar behaviour. Part time working does show a
large difference by gender. The table implies that women are considerably more
likely to work part time than men.
How will an improvement be shown?
Generally the similarity of this indicator in a protected and non-protected group will
indicate equivalent behaviour.

29
Table 4.1: Percentage of employees by age with a part-time working pattern 1,2,3,4
Age % of total headcount in group % of part time workers in group % of group that are part time
16-24 2.0 0.3 6.2
25-34 10.2 7.6 31.2
35-44 22.4 24.4 45.4
45-54 39.8 37.9 39.7
55-64 23.9 26.7 46.6
65+ 1.7 3.0 75.2
Total 100 100
Table 4.2: Percentage of employees by indicated disability with a part-time working pattern 1,2,3,4
Disability % of total headcount in group % of part time workers in group % of group that are part time
Disabled 7.0 6.8 43.7
Non-disabled 93.0 93.2 45.1
Total 100 100

30
Table 4.3: Percentage of employees by indicated ethnicity with a part-time working pattern 1,2,3,4
Ethnicity % of total headcount in group % of part time workers in group % of group that are part time
Ethnic minority 11.6 10.8 40.4
White 88.4 89.2 43.7
Total 100 100

31
Table 4.4: Percentage of employees by gender with a part-time working pattern 1,2,3,4
Gender % of total headcount in group % of part time workers in group % of group that are part time
Female 68.4 88.0 53.7
Male 31.6 12.0 15.8
Total 100 100
All data sourced from DWPs HR Database
Notes:
1. Data as at 31 March 2016
2. Percentages shown are the number of employees by protected characteristic, over the total number of employees who have
chosen to indicate that protected characteristic.
3. Percentages shown are the number of employees working part time by protected characteristic, over the total number of
employees working part time who have chosen to indicate that protected characteristic.
4. Percentages shown are the number of employees working part time by protected characteristic, over the total number of
employees that have chosen to indicate that protected characteristic.

32
5. Grievances
What does this tell us?
The data presented here shows the percentage of employees who have raised a
grievance against their status in relation to each of the following protected
characteristics: age; disability; ethnicity; and gender.
As the total numbers of grievances are quite small, the percentages can vary
considerably without implying significant differences.
How will an improvement be shown?
Generally the similarity of this indicator in a protected and non-protected group will
indicate equivalent behaviour. It should also be borne in mind that raising a
grievance is a decision of the individual that takes into account a range of personal
factors.

33
Table 5.1: Percentage of employees by age who raised a grievance 1,2,3,4,5
Age % of total headcount in group 3 % of grievances in group 4 % of group that raised a grievance 5
16-24 2.0 * *
25-34 10.2 7.7 1.0
35-44 22.4 22.8 1.3
45-54 39.8 40.1 1.3
55-64 23.9 26.4 1.4
65+ 1.7 2.7 2.1
Total 100 100
Table 5.2: Percentage of employees by indicated disability who raised a grievance 1,3,4,5
Disability % of total headcount in group 3 % of grievances in group 4 % of group that raised a
grievance 5
Disabled 7.0 9.8 1.9
Non-disabled 93.0 90.2 1.3
Total 100 100

34
Table 5.3: Percentage of employees by indicated ethnicity who raised a grievance 1,3,4,5
Ethnicity % of total headcount in group % of grievances in group % of group that raised a
grievance5
Ethnic minority 11.6 11.5 1.3
White 88.4 88.5 1.3
Total 100 100

35
Table 5.4: Percentage of employees by gender who raised a grievance 1,3,4,5
Gender % of total headcount in group 3 % of grievances in group 4 % of group that raised a grievance 5
Female 68.4 66.1 1.2
Male 31.6 33.9 1.4
Total 100 100
All data sourced from DWPs HR Database
Notes:
1. Data period 1 April 2015 to 31 March 2016
2. * - Level of data too low for publication and percentages are rounded to 1 decimal place.
3. Percentages shown are the number of employees by protected characteristic, over the total number of employees who have
chosen to indicate that protected characteristic.
4. Percentages shown are the number of employees raising a grievance by protected characteristic, over the total number of
employees raising a grievance who have chosen to indicate that protected characteristic.
5. Percentages shown are the number of employees raising a grievance by protected characteristic, over the total number of
employees that have chosen to indicate that protected characteristic.

36
6. Performance
What does this tell us?
The data presented here shows the proportion of employees awarded each
performance marking against their status in relation to each of the following
protected characteristics: age; disability; ethnicity; and gender.
In the 2015 /16 performance management marking system employees were
categorised as 'Exceeded', 'Achieved' and 'Must Improve'. Employees who were not
awarded a marking for the 2015 /16 performance year have been omitted from this
data.
How will an improvement be shown? Generally the similarity of this indicator between groups will indicate equivalent
behaviour. When interpreting differences in the data it must be taken into consideration
that the information provided in relation to disability and ethnicity is incomplete.
Table 6.1: Percentage of performance mark awarded by age in
relation to total number of employees in that group
Age Range
Performance Markings
Total % %
Exceeded % Achieved % Must Improve
16-24 12.0 73.9 14.2 100.0
25-34 24.6 68.6 6.8 100.0
35-44 23.2 70.3 6.5 100.0
45-54 21.1 71.7 7.2 100.0
55-64 13.7 74.8 11.5 100.0
65+ 5.1 75.0 19.9 100.0
All 19.7 71.9 8.4 100.0

37
Table 6.2: Percentage of performance mark awarded by indicated
disability in relation to total number of employees in that group
Disability
Performance Markings
Total %
% Exceeded % Achieved
% Must Improve
Disabled 13.9 73.2 12.9 100.0
Non-Disabled 20.4 71.8 7.8 100.0
All 18.4 72.3 9.3 100.0
Table 6.3: Percentage of performance mark awarded by indicated
ethnicity in relation to total number of employees in that group
Ethnicity
Performance Markings
Total %
% Exceeded % Achieved
% Must Improve
Ethnic Minority 15.9 73.8 10.3 100.0
White 20.7 71.4 7.9 100.0
All 16.8 71.4 11.8 100.0
Table 6.4: Percentage of performance mark awarded by gender in relation
to total number of employees in that group
Gender
Performance Markings
Total %
% Exceeded % Achieved
% Must Improve
Female 20.4 72.4 7.1 100.0
Male 18.1 70.8 11.1 100.0
All 19.7 71.9 8.4 100.0
All data sourced from DWPs HR Database Notes: 1. Data as at 31 March 2016. 2. Percentages are rounded to 1 decimal place. 3. Percentages shown are the number of employees awarded a performance
marking by protected characteristic, over the total number of employees awarded a performance marking who have chosen to indicate that protected characteristic.
4. This data does not include the SCS or employees who have not been awarded a marking.

38
7. Promotion
What does this tell us?
The data presented here shows employees promoted against their status in relation
to each of the following protected characteristics: age; disability; ethnicity and
gender.
In 2016 the rate of promotion increased on 2015 to 4.7% overall from 1.8%. When
looking at this overall promotion rate split by the protected characteristics some
variation is observed, most notably for disability. In 2015 the promotion rate for staff
who identified as not disabled was almost twice that of disabled staff and this gap is
proportionally smaller in 2016. It is difficult to draw conclusions as differences are
obscured by small volumes as well as incomplete information for disability.
How will an improvement be shown?
Generally the similarity of this indicator in a protected and non-protected group will
indicate equivalent behaviour.

39
Table 7.1 Percentage of employees promoted by age 1, 3, 4, 5
Age % of total headcount in group 3
% of promotions in group 4 % of group promoted 5
16-24 25-34 35-44 45-54 55-64 65+ Total
2.0 10.2 22.4 39.8 23.9 1.7 100
0.6 19.9 33.7 36.6 9.1 0.2 100
1.3 9.2 7.1 4.3 1.8 0.6
Table 7.2: Percentage of employees promoted by indicated disability 1,3,4, 5
Disability % of total headcount in group3 % of promotions in group 4 % of group promoted5
Disabled 7.0 5.1 3.3
Non-disabled 93.0 94.9 4.7
Total 100 100

40
Table 7.3: Percentage of employees promoted by indicated ethnicity 1,3,4,5
Ethnicity % of total headcount in group3 % of promotions in group 4 % of group promoted 5
Ethnic minority 11.6 12.0 5.0
White 88.4 88.0 4.8
Total 100 100

41
Table 7.4: Percentage of employees promoted by gender 1,,3,4, 5
Gender % of total headcount in group3 % of promotions in group4 % of group promoted5
Female 68.4 69.8 4.8
Male 31.6 30.2 4.5
Total 100 100
All data sourced from DWPs HR Database.
Notes:
1. Data period 1 April 2015 to 31 March 2016
2. * - Level of data too low for publication and percentages are rounded to 1 decimal place.
3. Percentages shown are the number of employees by protected characteristic, over the total number of employees who have chosen to indicate that protected characteristic.
4. Percentages shown are the number of employees promoted by protected characteristic, over the total number of employees promoted who have chosen to indicate that protected characteristic.
5. Percentages shown are the number of employees promoted by protected characteristic, over the total number of employees that have chosen to indicate that protected characteristic.

42
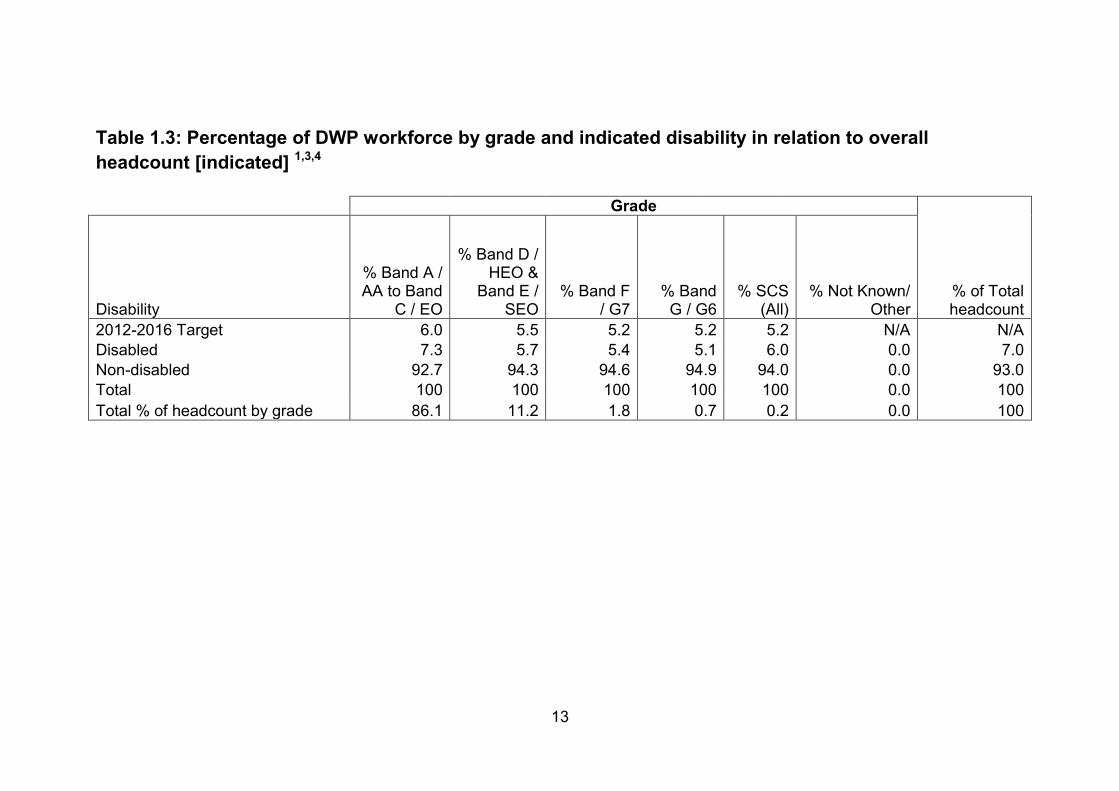
8. Recruitment process
What does this tell us?
There were 122,849 applications for posts in DWP between April 2015 and March
2016. The data show percentages of employees at different stages of the
recruitment process for our vacancies opened with Civil Service Resourcing during
the period, against their status in relation to each of the following protected
characteristics: age; disability; ethnicity; and gender.
It is difficult to compare Table 8.1 to previous years as the proportion in each stage
of the recruitment process will depend on where in the recruitment cycle we were
when the data was cut. It can be noted that there is little variation between the
groups for any of the characteristics although the percentages of unknowns makes it
hard to draw a conclusion for ethnicity and disability.
The percentage of applicants who have indicated they are from an ethnic minority is
somewhat higher than the DWP value in Table 1.5. However the DWP value is
subject to uncertainty due to the sizeable percentage of staff not providing
information.
The percentage of female applicants is rather lower than the percentage already
working for the DWP.
How will an improvement be shown?
Generally the similarity of this indicator in a protected and non-protected group will
indicate equivalent behaviour. However, this will require sufficiently large volumes in
each category to be able to draw firm conclusions.
43
Table 8.1: Percentage of applicants at different stages of the recruitment process by age 1, 2, 3
Stage
Age % of applications received
% Success
% In progress
% Withdrawn
% Unsuccessful
16-24 14.5 9.8 0.1 13.4 76.7 25-29 14.4 13.5 0.5 13.8 72.3 30-34 14.3 14.3 0.4 12.3 73.0 35-39 12.5 13.8 0.6 11.6 74.0 40-44 12.3 13.8 0.6 10.2 75.4 45-49 13.0 13.0 0.5 10.1 76.5 50-54 10.5 11.9 0.4 8.6 79.2 55-59 5.4 10.3 0.4 8.6 80.8 60-64 1.4 8.3 0.1 9.9 81.7 65+ 0.1 12.2 0.0 11.0 76.8 Prefer not to say/ Unknown
1.8 9.5 0.4 14.1 76.0
Total 100 - - - -

44
Table 8.2 Percentage of applicants at the completed stage of the recruitment process by age1, 2, 3, 4
Age % Success
% Unsuccessful
16-24 11.3 88.7 25-29 15.7 84.3 30-34 16.4 83.7 35-39 15.8 84.3 40-44 15.5 84.5 45-49 14.6 85.5 50-54 13.0 87.0 55-59 11.3 88.7 60-64 9.2 90.8 65+ 13.7 86.3 Prefer not to say/ Unknown
11.1 88.9

45
Table 8.3 Percentage of applicants at different stages of the recruitment process by disability 1, 2, 3
Stage
Disability % of applications received
% Success
% In progress
% Withdrawn
% Unsuccessful
Disabled 6.4 10.8 0.6 12.1 76.5 Non-disabled 90.0 12.8 0.4 11.3 75.5 Prefer not to say/ unknown
3.6 10.2 1.0 12.7 76.2
Total 100 - - - -
Table 8.4 Percentage of applicants at the completed stage of the recruitment process by disability 1,2,3,4
Disability % Success
% Unsuccessful
Disabled 12.4 87.6 Non-disabled 14.5 85.5 Prefer not to say/ Unknown 11.8
88.2

46
Table 8.5 Percentage of applicants at different stages of the recruitment process by ethnicity 1, 2, 3
Stage
% of applications received
% Success
% In progress
% Withdrawn
% Unsuccessful
Ethnic minority 20.0 10.1 0.4 11.6 77.9 White 77.8 13.3 0.4 11.3 74.9 Prefer not say/ unknown
2.3 9.6 0.5 13.6 76.3
Total 100 - - - -
Table 8.6 Percentage of applicants at the completed stage of the recruitment process by ethnicity 1,2,3,4
% Success
% Unsuccessful
Ethnic minority 11.4 88.6 White 15.1 84.9 Prefer not say/ unknown 11.2 88.9

47
Table 8.7 Percentage of applicants at different stages of the recruitment process by gender 1, 2, 3
Stage
% of applications received
% Success
% In progress
% Withdrawn
% Unsuccessful
Female 54.5 14.2 0.4 11.0 74.4 Male 44.9 10.7 0.4 11.8 77.1 Prefer not say/ unknown
0.7 7.7 0.4 25.2 66.8
Total 100 - - - -
Table 8.8 Percentage of applicants at the completed stage of the recruitment process by gender1, 2, 3, 4
% Success
% Unsuccessful
Female 16.0 84.0 Male 12.2 87.8 Prefer not say/ unknown 10.3 89.7
Notes
1. Source: WCN Candidate Statistics
2. DWP D& E data for all apps received between 1st April 2015 and 31st March 2016
3. Percentages may not sum due to rounding
4. Withdrawn applications are excluded

48
9. Pay gap
The Department analyses data to identify any differences in pay on the grounds of
gender, race, age and disability.
The pay gap is calculated by adding together the pay of all of the members of the
potentially disadvantaged group in the Department who are in grades below the
Senior Civil Service (SCS) and then working out an average salary. This is then
compared to the average salary of the potentially advantaged group. The gap is the
difference between the two averages divided by the average pay of the advantaged
group.
Pay gap = (Pay difference)
(Pay of the advantaged group)
The ‘Pay difference’ above is defined as the mean pay of the advantaged group
minus the mean pay of the disadvantaged group.
Therefore, in the case of the gender pay gap, the average salary of women in grades
below SCS is calculated and then compared to the average salary of men in grades
below SCS. The difference is expressed as a percentage and is presented by grade.
The calculation includes an adjustment for differences in working pattern and pay
zone (see Notes 2, 3 and 4 below Table 9.4).
What does this tell us?
The table below shows which group is considered to be advantaged or
disadvantaged for the purposes of expressing the pay gap for that protected
characteristic. In the case of age, the majority age group (25-54) is shown against
both the younger group (16-24) and the older age group (55 and above).
Comparison table by protected characteristic for pay gap data
Protected characteristic Disadvantaged group Advantaged group
Age 16-24 25-54
55 and above 25-54
Disability Disabled Non-disabled
Ethnicity Ethnic minority White
Gender Female Male

49
How will an improvement be shown?
Generally the similarity of this indicator in an advantaged and disadvantaged group
will indicate equivalent behaviour. However, this will require sufficiently large
volumes in each category to be able to draw firm conclusions. As an example, the 16
to 24 disadvantaged age group only contains 2% of the headcount (Table 1.1), so
makes robust comparisons difficult.

50
Table 9.1 Pay gap by age 1,2,3,4,5,7,8
Age AA AO EO HEO SEO G7 G6 All
Grades
Age 16-24 (mean salary) £15,530 £16,811 £22,032 £24,225 £37,620 N/A N/A £18,092 Age 25-54 (mean salary) £15,767 £18,280 £23,628 £28,155 £34,050 N/A N/A £22,943 Pay gap (% 16-24 to 25-54) 1.50 8.04 6.75 13.96 -10.48 N/A N/A 21.14
Age AA AO EO HEO SEO G7 G6 All
Grades
Age 55 and above (mean salary) £15,758 £18,601 £24,403 £29,910 £36,056 £49,792 £62,792 £23,305 Age 25-54 (mean salary) £15,767 £18,280 £23,628 £28,155 £34,050 £47,560 £60,014 £22,943 Pay gap (% 55+ to 25-54) 0.06 -1.76 -3.28 -6.23 -5.89 -4.69 -4.63 -1.58

51
Table 9.2: Pay gap by indicated disability 1, 2,3,4,5,6,7,8
Disability AA AO EO HEO SEO G7 G6 All
Grades
Disabled (mean salary) £15,799 £18,638 £24,143 £28,938 £34,807 £47,969 £61,535 £23,037 Non Disabled (mean salary) £15,778 £18,644 £23,988 £28,661 £34,565 £47,907 £60,627 £23,374 Pay gap (% disabled to non-disabled) -0.13 0.03 -0.64 -0.97 -0.70 -0.13 -1.50 1.44
Table 9.3: Pay gap by indicted ethnicity 1,2,3,4,5,7,8
Ethnicity AA AO EO HEO SEO G7 G6 All
Grades
Ethnic Minority (mean salary) £15,795 £18,621 £23,619 £28,503 £34,316 £47,751 £59,120 £22,177 White (mean salary) £15,767 £18,469 £23,951 £28,626 £34,587 £47,887 £60,496 £23,329 Pay gap (% ethnic minority to white) -0.18 -0.82 1.39 0.43 0.78 0.28 2.28 4.94

52
Table 9.4: Pay gap by gender1, 2, 3, 4, 5, 7, 8
Gender AA AO EO HEO SEO G7 G6 All
Grades
Female (mean salary) £15,759 £18,400 £23,836 £28,468 £34,365 £47,371 £59,500 £22,623 Male (mean salary) £15,759 £18,105 £23,752 £28,480 £34,707 £48,643 £61,557 £23,525 Pay gap (% female to male) 0.0 -1.6 -0.4 0.0 1.0 2.6 3.3 3.8
Notes:
1. Source of staff details (and all other tables and charts in this package) is the Dataview/Point-in-Time table for March 2016 as
processed by SSCL Accounting Services.
2. Salary Totals are the total of full-time equivalent (FTE) or pro-rated salaries in the pay band, excluding allowances and overtime.
However, to prevent skews in diversity analyses due to different pay zones, all salaries here are treated as though they are on
DWP National pay scales. That is, salaries on pay scales for Inner London, Outer London and Special Location Pay Zones have
been placed on their equivalent position on the National pay scale. ERNIC & Civil Service Pension contributions are excluded from
these figures.
3. The staff count is the FTE total of staff in the pay band; part time staff are a proportion of 1 according to their working pattern.
4. Mean salary is the total FTE basic salaries for the pay band, divided into the FTE count.
5. Records excluded from this analysis include SCS staff. Casual and Fixed-Term Appointments are included. The population used
in the analysis therefore represents 99.5% of DWP staff paid and in post on 31 March 201.
6. As staff records have an option not to record ethnicity or disability types, only 76% of records could be used to analyse ethnicity,
and 82% disability.

53
7. The pay gap calculation is: Pay Gap = (Pay Difference) / (Pay of the Advantaged Group), where "Pay Difference" is: Mean Pay of
the Advantaged Group – Mean Pay of the Disadvantaged Group.
8. The Advantaged (A) and Disadvantaged (D) Groups have been defined as follows: Gender - Men (A) Women (D); Ethnicity -
White (A) Ethnic Minorities (D); Disability - Non Disabled (A) Disabled (D); Age - 26-55 (A) 16-25 (D) 55+ (D).

54
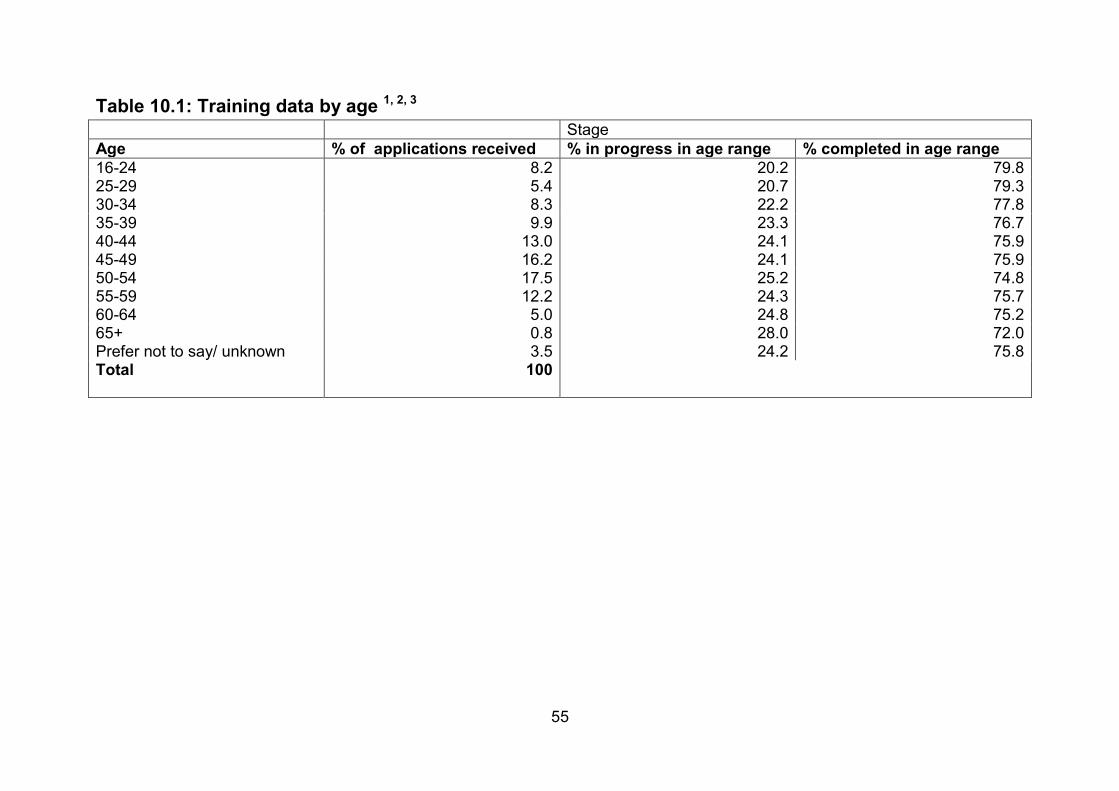
9. Training data
What does this tell us?
These data show percentages of our employees who are at different stages of
completing e-learning applied for with Civil Service Learning in the period, against
their status in relation to each of the following protected characteristics: age;
disability; ethnicity; and gender.
The tables suggest similar behaviour for progress or completion for the protected
characteristics of disability, ethnicity or gender.
The percentages of applications are roughly in line with the headcount (Tables 1.3
and 1.5).
How will an improvement be shown?
Broadly an increase in the percentage would constitute an improvement as it would
indicate an increase in the amount of training applied for and completed. However,
this needs to be considered alongside relative headcount, relevant rates and
volumes of information provided, so is not precise. In addition, it should also be
borne in mind that training needs are unique to each individual within the
organisation.
55
Table 10.1: Training data by age 1, 2, 3
Stage
Age % of applications received % in progress in age range % completed in age range
16-24 8.2 20.2 79.8 25-29 5.4 20.7 79.3 30-34 8.3 22.2 77.8 35-39 9.9 23.3 76.7 40-44 13.0 24.1 75.9 45-49 16.2 24.1 75.9 50-54 17.5 25.2 74.8 55-59 12.2 24.3 75.7 60-64 5.0 24.8 75.2 65+ 0.8 28.0 72.0 Prefer not to say/ unknown 3.5 24.2 75.8 Total 100

56
Table 10.2: Training data by disability 1, 2, 3
Stage
Disability % of applications received % in progress % completed
Disabled 7.0 26.1 73.9 Non-disabled 83.2 23.4 76.6 Prefer not to say/ unknown 9.8 24.2 75.8 Total
Table 10.3: Training data by ethnicity 1, 2, 3
Stage
Ethnicity %of applications received %in progress % completed
Ethnic minority 9.4 30.3 69.7 White 83.3 22.7 77.3 Prefer not to say/ unknown 7.2 25.3 74.7 Total 100

57
Table 10.4 Training data by gender 1, 2, 3
Stage
Gender % of applications received % in progress %completed
Female 66.5 24.4 75.6 Male 31.8 22.1 77.9 Prefer not to say/ other/ unknown 1.8 22.7 77.3 Total 100
Notes:
1. Source- Civil Service Learning
2. Period covered 1 April 2015 to 31 March 2016
3. Percentages are rounded to 1 decimal place so may not exactly total 100%.

58
10 Maternity data
What does this tell us?
These data show the percentage of employees returning from maternity leave
against their status in relation to each of the following protected characteristics: age;
disability; and ethnicity.
The percentage distribution by age is reasonably similar to the 2015 report. The
disability and ethnic minority groups are also very much the same as the 2015
report. The staff numbers are too small to indicate any significant difference.
How will an improvement be shown?
A change in the percentage when compared to the previous report does not
necessarily imply an improvement. An individual decision to return to work after
maternity leave is affected by a range of personal and economic factors.

59
Table 11.1: Percentage of employees returning from maternity leave in period by age 1,2
Age Total %
16-24 0.7
25-34 58.4
35-44 40.4
45-54 0.5
55-64 0.0
65+ 0.0
Total 100
Table 11.2 : Percentage of employees returning from maternity leave in period by indicated disability 1,2
Disability Total %
Disabled 1.8
Non-disabled 98.2
Total 100

60
Table 11.3: Percentage of employees returning from maternity leave in period by indicated ethnicity 1,2
Ethnicity Total %
Ethnic minority 14.2
White 85.8
Total 100
Table 11.4: Percentage of employees returning from maternity leave in period by indicated gender 1,2
Gender Total %
Female 100.0
Male 0.0
Total 100
All data sourced from DWPs HR Database
Notes:
1. Data period 1 April 2015 to 31 March 2016
2. Percentages shown are the number of employees returning from maternity leave in the period by indicated protected
characteristic, over the total number of employees returning from maternity leave.
61
Links to additional information The supporting data for this report is available on-line and provides comparable figures from the previous reports. 2015 People Survey results – includes details of the DWP People Survey which is part of the Civil Service People Survey. It contains questions to help determine employee engagement throughout the Civil Service. Performance Related Pay – includes details of non-consolidated performance-related pay by DWP, our agencies and executive Non- Departmental Public Bodies (NDPBs) for the performance years 2010-11, 2011-12, 2012-13, 2013-14 and 2014-15.
Business Plan Quarterly Data Summary – provides a quarterly snapshot on how each
Department is spending its budget, the results it has achieved and how it is deploying its
workforce.

62
DWP Equality Information 2016
Report under the Public Sector Equality Duty
Under the Public Sector Equality Duty, part of the Equality Act 2010, as a public
body the Department for Work and Pensions has a specific duty to publish relevant
proportionate information to demonstrate our compliance. Information showing that
we have paid due regard to the aims of the Equality Duty is contained in this report.
___________________
Diversity & Inclusion
Kings Court
80 Hanover Way
Sheffield
S2 7UF
___________________
ISBN 978-1-78425-790-3 DWP’s Public Sector Equality Duty report
Published by the Department for Work and Pensions
www.gov.uk/dwp
Related Documents