Environmental Microbiology (2006) 8(4), 720–731 doi:10.1111/j.1462-2920.2005.00950.x © 2005 Society for Applied Microbiology and Blackwell Publishing Ltd No claim to original French government works Blackwell Science, LtdOxford, UKEMIEnvironmental Microbiology1462-2912© 2005 Society for Applied Microbiology and Blackwell Publishing Ltd; No claim to original French government works ? 200584720731Original Article Molecular fingerprintings to measure microbial diversityP. Loisel et al. Received 30 June, 2005; accepted 28 September, 2005. *For correspondence. E-mail [email protected]; Tel. (+33) 4 68 42 51 54; Fax (+33) 4 68 42 51 60. Denaturing gradient electrophoresis (DGE) and single- strand conformation polymorphism (SSCP) molecular fingerprintings revisited by simulation and used as a tool to measure microbial diversity Patrice Loisel, 1 Jérôme Harmand, 1,2 Olivier Zemb, 2,3 Eric Latrille, 2 Claude Lobry, 1 Jean-Philippe Delgenès 2 and Jean-Jacques Godon 2 * 1 INRA-INRIA MERE Research Team, UMR Analyse des Systèmes et Biométrie, ENSAM Institut National de la Recherche Agronomique, Montpellier, France. 2 Laboratoire de Biotechnologie de l’Environnement, Institut National de la Recherche Agronomique, Avenue des Etangs, 11100 Narbonne, France. 3 Laboratoire Arago, Observatoire Océanologique, Centre National de la Recherche Scientifique, Institut National des Sciences de l’University, Université Paris VI, 66651 Banyuls-sur-Mer, France. Summary The exact extent of microbial diversity remains unknowable. Nevertheless, fingerprinting patterns [denaturing gradient electrophoresis (DGE), single- strand conformation polymorphism (SSCP)] provide an image of a microbial ecosystem and contain diversity data. We generated numerical simulation fingerprinting patterns based on three types of distribution (uniform, geometric and lognormal) with a range of units from 10 to 500 000. First, simulated patterns containing a diversity of around 1000 units or more gave patterns similar to those obtained in experiments. Second, the number of bands or peaks saturated quickly to about 35 and were unrelated to the degree of diversity. Finally, assuming lognormal distribution, we used an estimator of diversity on in silico and experimental fingerprinting patterns. Results on in silico patterns corresponded to the sim- ulation inputs. Diversity results in experimental pat- terns were in the same range as those obtained from the same DNA sample in molecular inventories. Thus, fingerprinting patterns contain extractable data about diversity although not on the basis of a number of bands or peaks, as is generally assumed to be the case. Introduction The estimation of microbial diversity, used here in the sense of species richness, remains a challenge for micro- biologists (Hughes et al ., 2001; Cases and de Lorenzo, 2002; Curtis and Sloan, 2004). New genetic techniques have revealed extensive microbial diversity that has pre- viously gone undetected with culture-dependent methods (Pace, 1997). Inventories and fingerprinting pattern anal- ysis [denaturing gradient electrophoresis (DGE), single- strand conformation polymorphism (SSCP)] based on 16S rDNA sequences are widely used in microbial ecol- ogy studies. Unfortunately, exhaustive inventories still remain impractical as only a tiny fraction can be analysed (Dunbar et al ., 2002). Consequently, the exact extent of diversity remains unknown. Despite this limitation, several mathematical methods have been proposed and com- pared as a way of estimating diversity based on inventory data (Hughes et al ., 2001; Dunbar et al ., 2002; Martin, 2002; Kemp and Aller, 2004a,b). In a different way, finger- printing patterns, due to the size of the analysed fraction, can be considered as an ‘image’ of the whole microbial ecosystem free of inventory limitation. Such a picture of the bacterial community is given by discrete bands or peaks which emerge from the signal subband or subpeak background. Discrete bands or peaks have been associ- ated to numerically dominant sequences whereas the subband or subpeak background has been considered as coming from a large number of numerically subdominant (rare) sequences, and generally omitted from the analysis (Nakatsu et al ., 2000; Fromin et al ., 2002). From these images, discrete bands or peaks are applied to estimate dynamics and diversities (Muyzer and Smalla, 1998), assuming that each band or peak refers to a unique sequence called a phylotype, ribotype or operational tax- onomic unit (OTU). Co-migrating bands or peaks have been anticipated depending on the breadth of the opera- tional frame and the range of the microbial diversity (Schmalenberger and Tebbe, 2003). Co-migrating events

Welcome message from author
This document is posted to help you gain knowledge. Please leave a comment to let me know what you think about it! Share it to your friends and learn new things together.
Transcript
Environmental Microbiology (2006)
8
(4), 720–731 doi:10.1111/j.1462-2920.2005.00950.x
© 2005 Society for Applied Microbiology and Blackwell Publishing LtdNo claim to original French government works
Blackwell Science, LtdOxford, UKEMIEnvironmental Microbiology1462-2912© 2005 Society for Applied Microbiology and Blackwell Publishing Ltd; No claim to original French government works
? 2005
8
4720731
Original Article
Molecular fingerprintings to measure microbial diversityP. Loisel
et al.
Received 30 June, 2005; accepted 28 September, 2005. *Forcorrespondence. E-mail [email protected];Tel. (
+
33) 4 68 42 51 54; Fax (
+
33) 4 68 42 51 60.
Denaturing gradient electrophoresis (DGE) and single-strand conformation polymorphism (SSCP) molecular fingerprintings revisited by simulation and used as a tool to measure microbial diversity
Patrice Loisel,
1
Jérôme Harmand,
1,2
Olivier Zemb,
2,3
Eric Latrille,
2
Claude Lobry,
1
Jean-Philippe Delgenès
2
and Jean-Jacques Godon
2
*
1
INRA-INRIA MERE Research Team, UMR Analyse des Systèmes et Biométrie, ENSAM Institut National de la Recherche Agronomique, Montpellier, France.
2
Laboratoire de Biotechnologie de l’Environnement, Institut National de la Recherche Agronomique, Avenue des Etangs, 11100 Narbonne, France.
3
Laboratoire Arago, Observatoire Océanologique, Centre National de la Recherche Scientifique, Institut National des Sciences de l’University, Université Paris VI, 66651 Banyuls-sur-Mer, France.
Summary
The exact extent of microbial diversity remainsunknowable. Nevertheless, fingerprinting patterns[denaturing gradient electrophoresis (DGE), single-strand conformation polymorphism (SSCP)] providean image of a microbial ecosystem and containdiversity data. We generated numerical simulationfingerprinting patterns based on three types ofdistribution (uniform, geometric and lognormal) witha range of units from 10 to 500 000. First, simulatedpatterns containing a diversity of around 1000 unitsor more gave patterns similar to those obtained inexperiments. Second, the number of bands or peakssaturated quickly to about 35 and were unrelated tothe degree of diversity. Finally, assuming lognormaldistribution, we used an estimator of diversity on
insilico
and experimental fingerprinting patterns.Results on
in silico
patterns corresponded to the sim-ulation inputs. Diversity results in experimental pat-terns were in the same range as those obtained fromthe same DNA sample in molecular inventories. Thus,fingerprinting patterns contain extractable data aboutdiversity although not on the basis of a number of
bands or peaks, as is generally assumed to be thecase.
Introduction
The estimation of microbial diversity, used here in thesense of species richness, remains a challenge for micro-biologists (Hughes
et al
., 2001; Cases and de Lorenzo,2002; Curtis and Sloan, 2004). New genetic techniqueshave revealed extensive microbial diversity that has pre-viously gone undetected with culture-dependent methods(Pace, 1997). Inventories and fingerprinting pattern anal-ysis [denaturing gradient electrophoresis (DGE), single-strand conformation polymorphism (SSCP)] based on16S rDNA sequences are widely used in microbial ecol-ogy studies. Unfortunately, exhaustive inventories stillremain impractical as only a tiny fraction can be analysed(Dunbar
et al
., 2002). Consequently, the exact extent ofdiversity remains unknown. Despite this limitation, severalmathematical methods have been proposed and com-pared as a way of estimating diversity based on inventorydata (Hughes
et al
., 2001; Dunbar
et al
., 2002; Martin,2002; Kemp and Aller, 2004a,b). In a different way, finger-printing patterns, due to the size of the analysed fraction,can be considered as an ‘image’ of the whole microbialecosystem free of inventory limitation. Such a picture ofthe bacterial community is given by discrete bands orpeaks which emerge from the signal subband or subpeakbackground. Discrete bands or peaks have been associ-ated to numerically dominant sequences whereas thesubband or subpeak background has been considered ascoming from a large number of numerically subdominant(rare) sequences, and generally omitted from the analysis(Nakatsu
et al
., 2000; Fromin
et al
., 2002). From theseimages, discrete bands or peaks are applied to estimatedynamics and diversities (Muyzer and Smalla, 1998),assuming that each band or peak refers to a uniquesequence called a phylotype, ribotype or operational tax-onomic unit (OTU). Co-migrating bands or peaks havebeen anticipated depending on the breadth of the opera-tional frame and the range of the microbial diversity(Schmalenberger and Tebbe, 2003). Co-migrating events
Molecular fingerprintings to measure microbial diversity
721
© 2005 Society for Applied Microbiology and Blackwell Publishing Ltd,
Environmental Microbiology
,
8
, 720–731No claim to original French government works
have been authoritatively described (Kowalchuk andStephen, 2001; Schmalenberger and Tebbe, 2003) but aregenerally considered as ‘bad luck’.
Although based on the same upstream molecular tech-niques [DNA extraction, polymerase chain reaction(PCR)], generally using 16S rDNA genes, the results ofmolecular inventories of microbial ecosystems give differ-ent estimates of diversity when compared with the resultsderived from fingerprinting methods (Diez
et al
., 2001).Based on a small number of clones analysed (Kemp andAller, 2004b), molecular inventories present a large diver-sity with a low level of dominance and numerous single-tons. In contrast, the images generated from a largenumber of 16S rDNA molecules in fingerprinting patternshave been analysed as presenting a high level of domi-nance. Statistical bias has generally been evoked toexplain this discrepancy but comparisons have rarelybeen carried out. The first goal of this study was to simu-late fingerprinting patterns reflecting known data in accor-dance with high diversity as found in molecularinventories. The second objective was to verify whetherdata on microbial diversity can be extracted from finger-printing patterns using estimators such as those used formolecular inventories (Curtis
et al
., 2002).
Results
Construction of
in silico
fingerprinting patterns
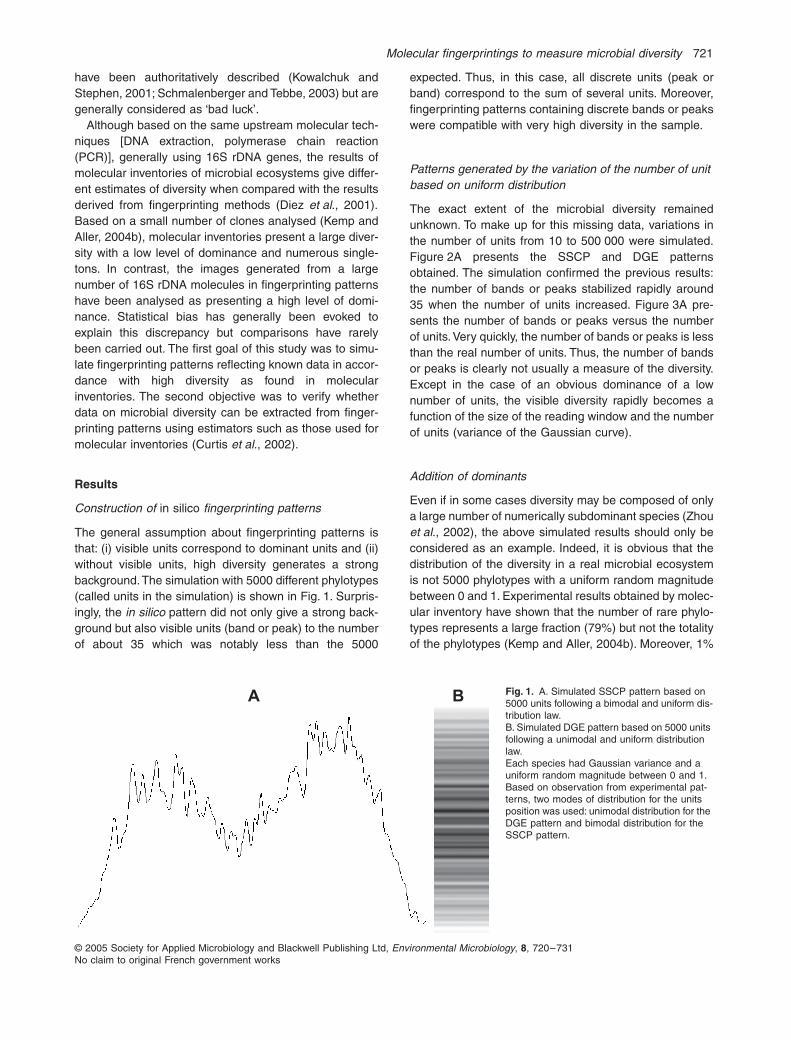
The general assumption about fingerprinting patterns isthat: (i) visible units correspond to dominant units and (ii)without visible units, high diversity generates a strongbackground. The simulation with 5000 different phylotypes(called units in the simulation) is shown in Fig. 1. Surpris-ingly, the
in silico
pattern did not only give a strong back-ground but also visible units (band or peak) to the numberof about 35 which was notably less than the 5000
expected. Thus, in this case, all discrete units (peak orband) correspond to the sum of several units. Moreover,fingerprinting patterns containing discrete bands or peakswere compatible with very high diversity in the sample.
Patterns generated by the variation of the number of unit based on uniform distribution
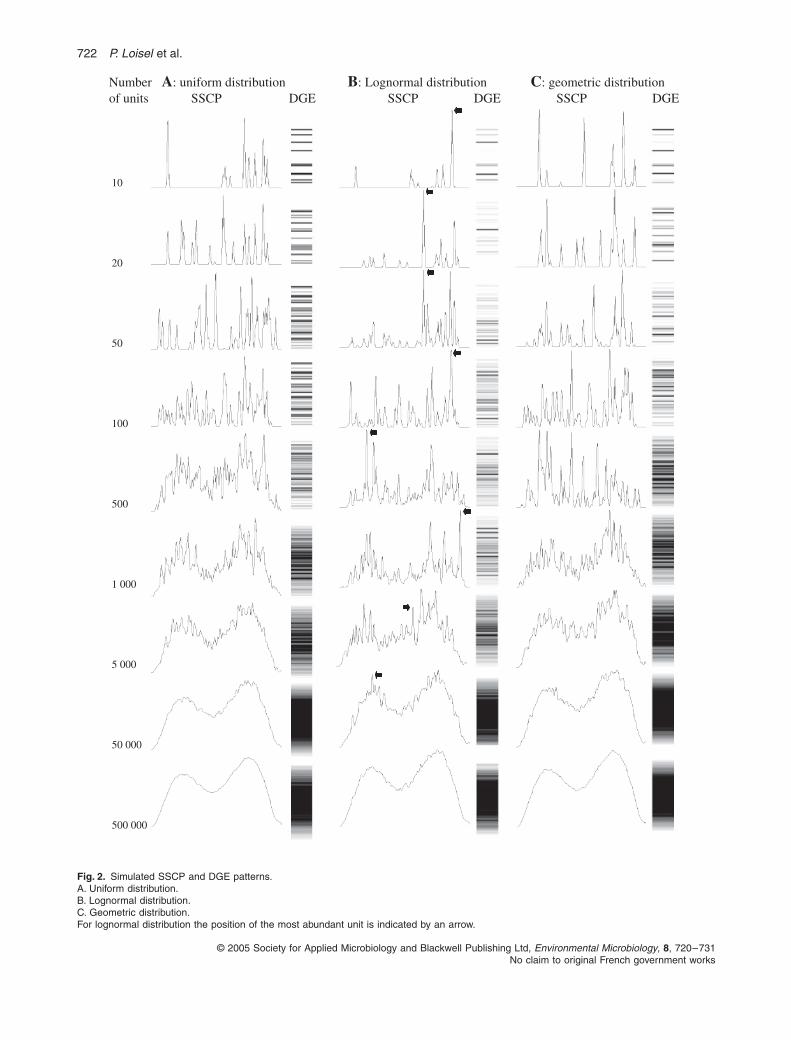
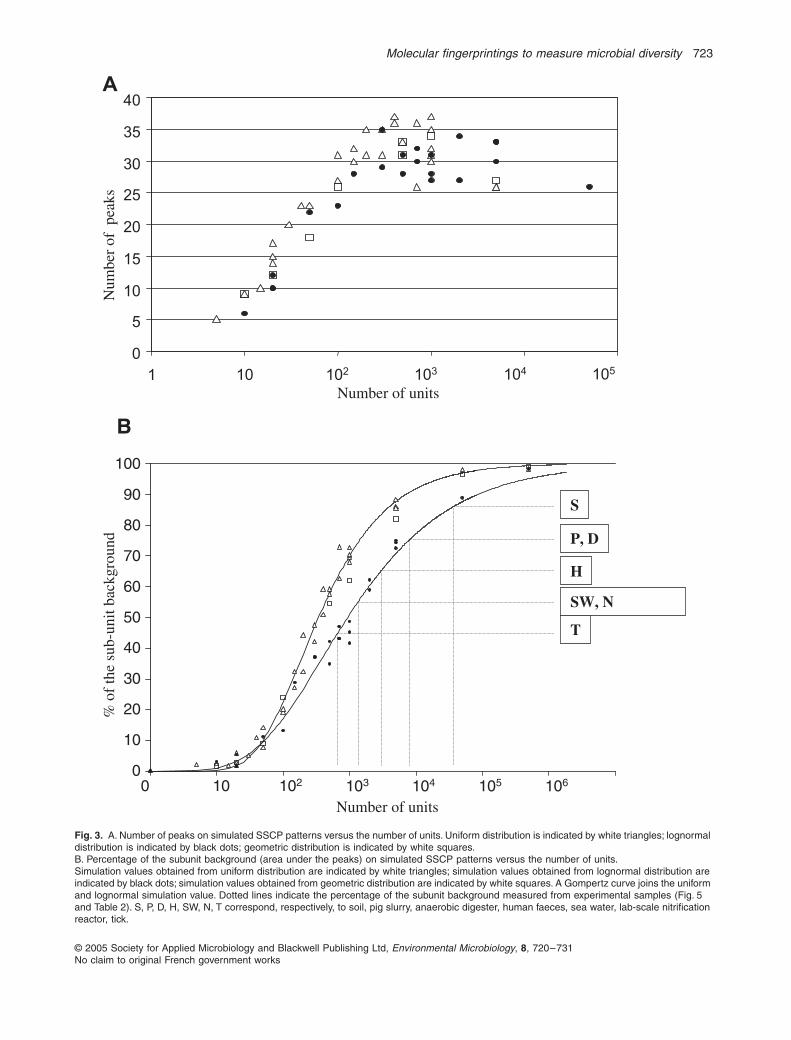
The exact extent of the microbial diversity remainedunknown. To make up for this missing data, variations inthe number of units from 10 to 500 000 were simulated.Figure 2A presents the SSCP and DGE patternsobtained. The simulation confirmed the previous results:the number of bands or peaks stabilized rapidly around35 when the number of units increased. Figure 3A pre-sents the number of bands or peaks versus the numberof units. Very quickly, the number of bands or peaks is lessthan the real number of units. Thus, the number of bandsor peaks is clearly not usually a measure of the diversity.Except in the case of an obvious dominance of a lownumber of units, the visible diversity rapidly becomes afunction of the size of the reading window and the numberof units (variance of the Gaussian curve).
Addition of dominants
Even if in some cases diversity may be composed of onlya large number of numerically subdominant species (Zhou
et al
., 2002), the above simulated results should only beconsidered as an example. Indeed, it is obvious that thedistribution of the diversity in a real microbial ecosystemis not 5000 phylotypes with a uniform random magnitudebetween 0 and 1. Experimental results obtained by molec-ular inventory have shown that the number of rare phylo-types represents a large fraction (79%) but not the totalityof the phylotypes (Kemp and Aller, 2004b). Moreover, 1%
BA
Fig. 1.
A. Simulated SSCP pattern based on 5000 units following a bimodal and uniform dis-tribution law.B. Simulated DGE pattern based on 5000 units following a unimodal and uniform distribution law.Each species had Gaussian variance and a uniform random magnitude between 0 and 1. Based on observation from experimental pat-terns, two modes of distribution for the units position was used: unimodal distribution for the DGE pattern and bimodal distribution for the SSCP pattern.
722
P. Loisel
et al.
© 2005 Society for Applied Microbiology and Blackwell Publishing Ltd,
Environmental Microbiology
,
8
, 720–731No claim to original French government works
Fig. 2.
Simulated SSCP and DGE patterns.A. Uniform distribution.B. Lognormal distribution.C. Geometric distribution.For lognormal distribution the position of the most abundant unit is indicated by an arrow.
10
100
1 000
5 000
Number A: uniform distribution B: Lognormal distribution C: geometric distributionof units SSCP DGE SSCP DGE SSCP DGE
20
50 000
500 000
500
50
Molecular fingerprintings to measure microbial diversity
723
© 2005 Society for Applied Microbiology and Blackwell Publishing Ltd,
Environmental Microbiology
,
8
, 720–731No claim to original French government works
Fig. 3.
A. Number of peaks on simulated SSCP patterns versus the number of units. Uniform distribution is indicated by white triangles; lognormal distribution is indicated by black dots; geometric distribution is indicated by white squares.B. Percentage of the subunit background (area under the peaks) on simulated SSCP patterns versus the number of units.Simulation values obtained from uniform distribution are indicated by white triangles; simulation values obtained from lognormal distribution are indicated by black dots; simulation values obtained from geometric distribution are indicated by white squares. A Gompertz curve joins the uniform and lognormal simulation value. Dotted lines indicate the percentage of the subunit background measured from experimental samples (Fig. 5 and Table 2). S, P, D, H, SW, N, T correspond, respectively, to soil, pig slurry, anaerobic digester, human faeces, sea water, lab-scale nitrification reactor, tick.
0
5
10
15
20
25
30
35
40
1 10 102 103 104 105
Number of units
Num
ber
of p
eaks
A
0
10
20
30
40
50
60
70
80
90
100
0 10 102 103 104 105 106
Number of units
% o
f th
e su
b-un
it ba
ckgr
ound
SW, N
S
P, D
H
T
B
724
P. Loisel
et al.
© 2005 Society for Applied Microbiology and Blackwell Publishing Ltd,
Environmental Microbiology
,
8
, 720–731No claim to original French government works
was previously considered as the abundance limit fordenaturing gradient gel electrophoresis (DGGE) detection(Fromin
et al
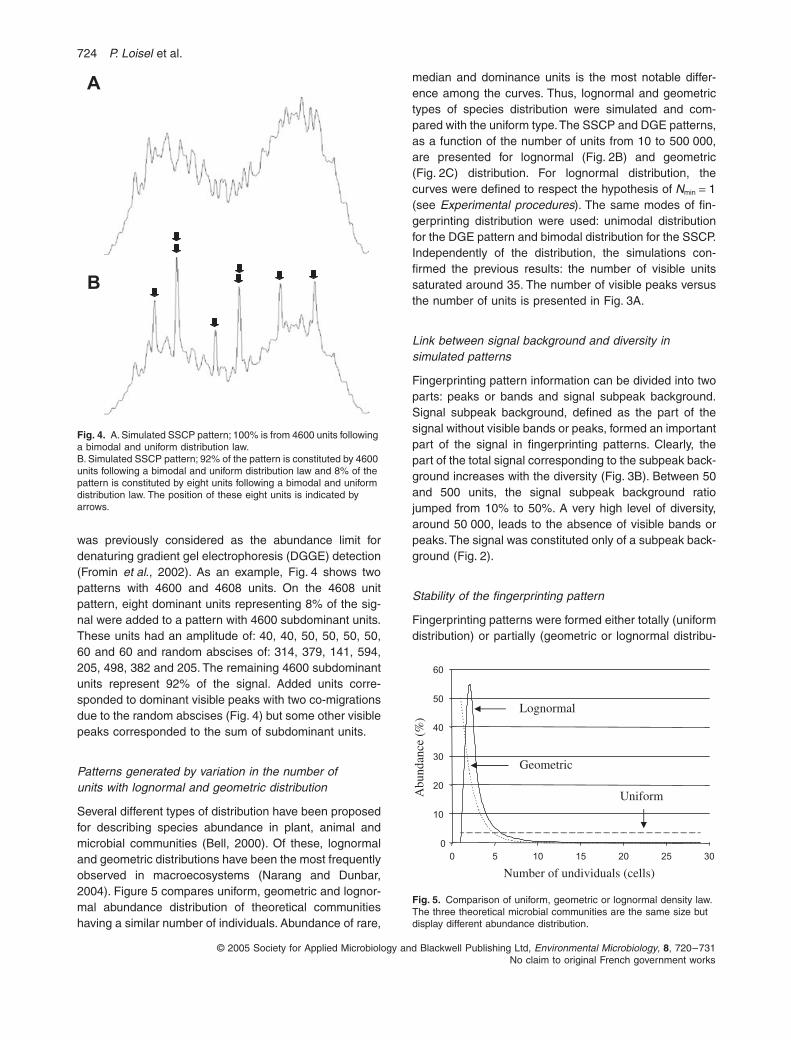
., 2002). As an example, Fig. 4 shows twopatterns with 4600 and 4608 units. On the 4608 unitpattern, eight dominant units representing 8% of the sig-nal were added to a pattern with 4600 subdominant units.These units had an amplitude of: 40, 40, 50, 50, 50, 50,60 and 60 and random abscises of: 314, 379, 141, 594,205, 498, 382 and 205. The remaining 4600 subdominantunits represent 92% of the signal. Added units corre-sponded to dominant visible peaks with two co-migrationsdue to the random abscises (Fig. 4) but some other visiblepeaks corresponded to the sum of subdominant units.
Patterns generated by variation in the number of units with lognormal and geometric distribution
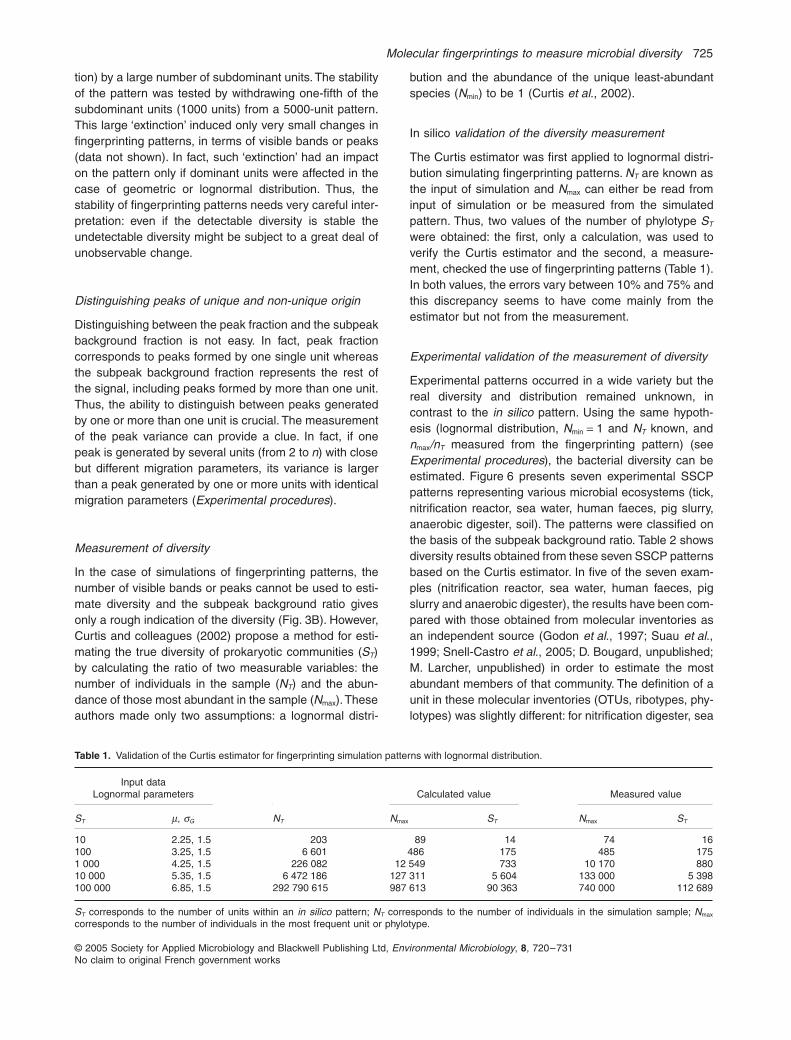
Several different types of distribution have been proposedfor describing species abundance in plant, animal andmicrobial communities (Bell, 2000). Of these, lognormaland geometric distributions have been the most frequentlyobserved in macroecosystems (Narang and Dunbar,2004). Figure 5 compares uniform, geometric and lognor-mal abundance distribution of theoretical communitieshaving a similar number of individuals. Abundance of rare,
median and dominance units is the most notable differ-ence among the curves. Thus, lognormal and geometrictypes of species distribution were simulated and com-pared with the uniform type. The SSCP and DGE patterns,as a function of the number of units from 10 to 500 000,are presented for lognormal (Fig. 2B) and geometric(Fig. 2C) distribution. For lognormal distribution, thecurves were defined to respect the hypothesis of
N
min
=
1(see
Experimental procedures
). The same modes of fin-gerprinting distribution were used: unimodal distributionfor the DGE pattern and bimodal distribution for the SSCP.Independently of the distribution, the simulations con-firmed the previous results: the number of visible unitssaturated around 35. The number of visible peaks versusthe number of units is presented in Fig. 3A.
Link between signal background and diversity in simulated patterns
Fingerprinting pattern information can be divided into twoparts: peaks or bands and signal subpeak background.Signal subpeak background, defined as the part of thesignal without visible bands or peaks, formed an importantpart of the signal in fingerprinting patterns. Clearly, thepart of the total signal corresponding to the subpeak back-ground increases with the diversity (Fig. 3B). Between 50and 500 units, the signal subpeak background ratiojumped from 10% to 50%. A very high level of diversity,around 50 000, leads to the absence of visible bands orpeaks. The signal was constituted only of a subpeak back-ground (Fig. 2).
Stability of the fingerprinting pattern
Fingerprinting patterns were formed either totally (uniformdistribution) or partially (geometric or lognormal distribu-
Fig. 4.
A. Simulated SSCP pattern; 100% is from 4600 units following a bimodal and uniform distribution law.B. Simulated SSCP pattern; 92% of the pattern is constituted by 4600 units following a bimodal and uniform distribution law and 8% of the pattern is constituted by eight units following a bimodal and uniform distribution law. The position of these eight units is indicated by arrows.
B
A
Fig. 5.
Comparison of uniform, geometric or lognormal density law. The three theoretical microbial communities are the same size but display different abundance distribution.
0
10
20
30
40
50
60
0 5 10 15 20 25 30
Number of undividuals (cells)
Abu
ndan
ce (
%)
Geometric
Lognormal
Uniform
Molecular fingerprintings to measure microbial diversity
725
© 2005 Society for Applied Microbiology and Blackwell Publishing Ltd,
Environmental Microbiology
,
8
, 720–731No claim to original French government works
tion) by a large number of subdominant units. The stabilityof the pattern was tested by withdrawing one-fifth of thesubdominant units (1000 units) from a 5000-unit pattern.This large ‘extinction’ induced only very small changes infingerprinting patterns, in terms of visible bands or peaks(data not shown). In fact, such ‘extinction’ had an impacton the pattern only if dominant units were affected in thecase of geometric or lognormal distribution. Thus, thestability of fingerprinting patterns needs very careful inter-pretation: even if the detectable diversity is stable theundetectable diversity might be subject to a great deal ofunobservable change.
Distinguishing peaks of unique and non-unique origin
Distinguishing between the peak fraction and the subpeakbackground fraction is not easy. In fact, peak fractioncorresponds to peaks formed by one single unit whereasthe subpeak background fraction represents the rest ofthe signal, including peaks formed by more than one unit.Thus, the ability to distinguish between peaks generatedby one or more than one unit is crucial. The measurementof the peak variance can provide a clue. In fact, if onepeak is generated by several units (from 2 to
n
) with closebut different migration parameters, its variance is largerthan a peak generated by one or more units with identicalmigration parameters (
Experimental procedures
).
Measurement of diversity
In the case of simulations of fingerprinting patterns, thenumber of visible bands or peaks cannot be used to esti-mate diversity and the subpeak background ratio givesonly a rough indication of the diversity (Fig. 3B). However,Curtis and colleagues (2002) propose a method for esti-mating the true diversity of prokaryotic communities (
S
T
)by calculating the ratio of two measurable variables: thenumber of individuals in the sample (
N
T
) and the abun-dance of those most abundant in the sample (
N
max
). Theseauthors made only two assumptions: a lognormal distri-
bution and the abundance of the unique least-abundantspecies (
N
min
) to be 1 (Curtis
et al
., 2002).
In silico
validation of the diversity measurement
The Curtis estimator was first applied to lognormal distri-bution simulating fingerprinting patterns.
N
T
are known asthe input of simulation and
N
max
can either be read frominput of simulation or be measured from the simulatedpattern. Thus, two values of the number of phylotype
S
T
were obtained: the first, only a calculation, was used toverify the Curtis estimator and the second, a measure-ment, checked the use of fingerprinting patterns (Table 1).In both values, the errors vary between 10% and 75% andthis discrepancy seems to have come mainly from theestimator but not from the measurement.
Experimental validation of the measurement of diversity
Experimental patterns occurred in a wide variety but thereal diversity and distribution remained unknown, incontrast to the
in silico
pattern. Using the same hypoth-esis (lognormal distribution,
N
min
=
1 and
N
T
known, and
n
max
/n
T
measured from the fingerprinting pattern) (see
Experimental procedures
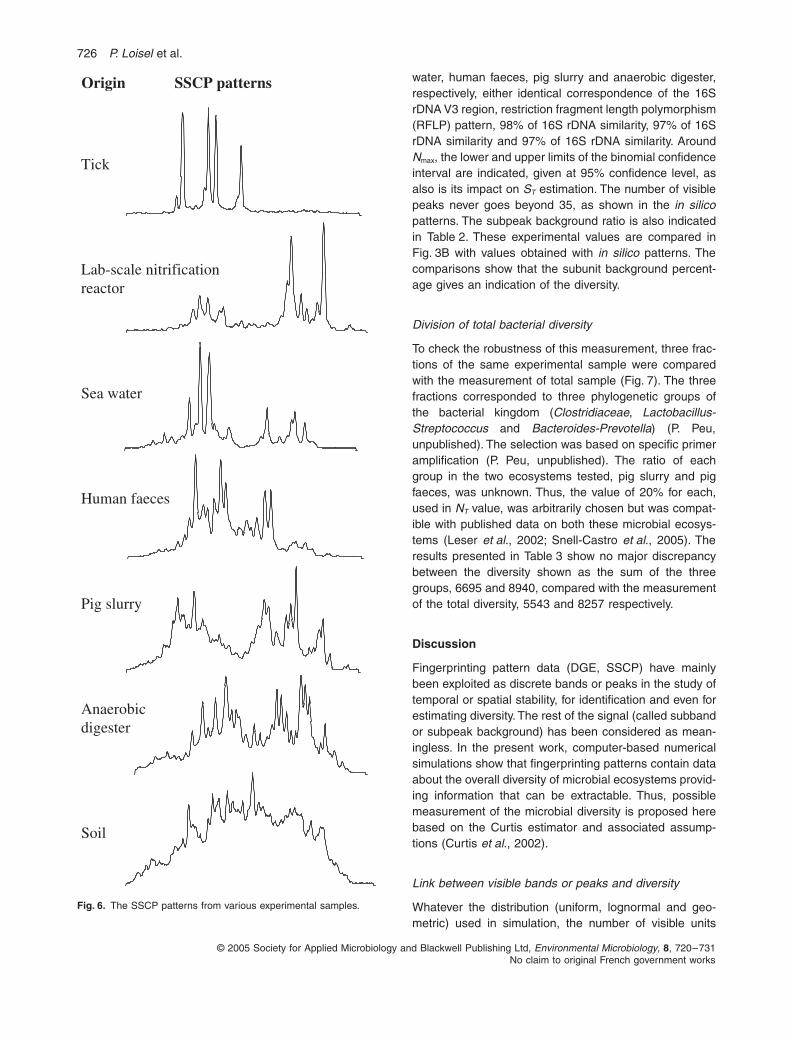
), the bacterial diversity can beestimated. Figure 6 presents seven experimental SSCPpatterns representing various microbial ecosystems (tick,nitrification reactor, sea water, human faeces, pig slurry,anaerobic digester, soil). The patterns were classified onthe basis of the subpeak background ratio. Table 2 showsdiversity results obtained from these seven SSCP patternsbased on the Curtis estimator. In five of the seven exam-ples (nitrification reactor, sea water, human faeces, pigslurry and anaerobic digester), the results have been com-pared with those obtained from molecular inventories asan independent source (Godon
et al
., 1997; Suau
et al
.,1999; Snell-Castro
et al
., 2005; D. Bougard, unpublished;M. Larcher, unpublished) in order to estimate the mostabundant members of that community. The definition of aunit in these molecular inventories (OTUs, ribotypes, phy-lotypes) was slightly different: for nitrification digester, sea
Table 1.
Validation of the Curtis estimator for fingerprinting simulation patterns with lognormal distribution.
Input data Lognormal parameters
N
T
Calculated value Measured value
S
T
µ
,
σ
G
N
max
S
T
N
max
S
T
10 2.25, 1.5 203 89 14 74 16100 3.25, 1.5 6 601 486 175 485 1751 000 4.25, 1.5 226 082 12 549 733 10 170 88010 000 5.35, 1.5 6 472 186 127 311 5 604 133 000 5 398100 000 6.85, 1.5 292 790 615 987 613 90 363 740 000 112 689
S
T
corresponds to the number of units within an
in silico
pattern;
N
T
corresponds to the number of individuals in the simulation sample;
N
max
corresponds to the number of individuals in the most frequent unit or phylotype.
726
P. Loisel
et al.
© 2005 Society for Applied Microbiology and Blackwell Publishing Ltd,
Environmental Microbiology
,
8
, 720–731No claim to original French government works
water, human faeces, pig slurry and anaerobic digester,respectively, either identical correspondence of the 16SrDNA V3 region, restriction fragment length polymorphism(RFLP) pattern, 98% of 16S rDNA similarity, 97% of 16SrDNA similarity and 97% of 16S rDNA similarity. Around
N
max
, the lower and upper limits of the binomial confidenceinterval are indicated, given at 95% confidence level, asalso is its impact on
S
T
estimation. The number of visiblepeaks never goes beyond 35, as shown in the
in silico
patterns. The subpeak background ratio is also indicatedin Table 2. These experimental values are compared inFig. 3B with values obtained with
in silico
patterns. Thecomparisons show that the subunit background percent-age gives an indication of the diversity.
Division of total bacterial diversity
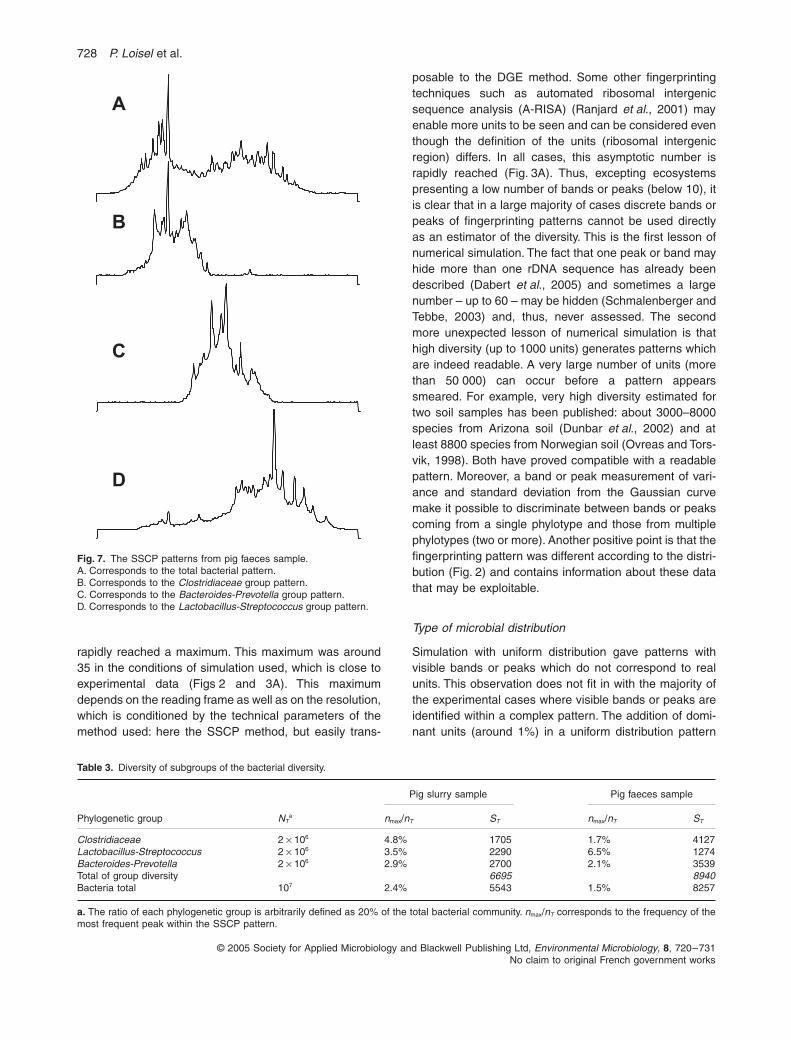
To check the robustness of this measurement, three frac-tions of the same experimental sample were comparedwith the measurement of total sample (Fig. 7). The threefractions corresponded to three phylogenetic groups ofthe bacterial kingdom (
Clostridiaceae
,
Lactobacillus-Streptococcus
and
Bacteroides-Prevotella
) (P. Peu,unpublished). The selection was based on specific primeramplification (P. Peu, unpublished). The ratio of eachgroup in the two ecosystems tested, pig slurry and pigfaeces, was unknown. Thus, the value of 20% for each,used in
N
T
value, was arbitrarily chosen but was compat-ible with published data on both these microbial ecosys-tems (Leser
et al
., 2002; Snell-Castro
et al
., 2005). Theresults presented in Table 3 show no major discrepancybetween the diversity shown as the sum of the threegroups, 6695 and 8940, compared with the measurementof the total diversity, 5543 and 8257 respectively.
Discussion
Fingerprinting pattern data (DGE, SSCP) have mainlybeen exploited as discrete bands or peaks in the study oftemporal or spatial stability, for identification and even forestimating diversity. The rest of the signal (called subbandor subpeak background) has been considered as mean-ingless. In the present work, computer-based numericalsimulations show that fingerprinting patterns contain dataabout the overall diversity of microbial ecosystems provid-ing information that can be extractable. Thus, possiblemeasurement of the microbial diversity is proposed herebased on the Curtis estimator and associated assump-tions (Curtis
et al
., 2002).
Link between visible bands or peaks and diversity
Whatever the distribution (uniform, lognormal and geo-metric) used in simulation, the number of visible units
Fig. 6.
The SSCP patterns from various experimental samples.
Soil
Human faeces
Lab-scale nitrificationreactor
Anaerobicdigester
Pig slurry
Tick
Origin SSCP patterns
Sea water
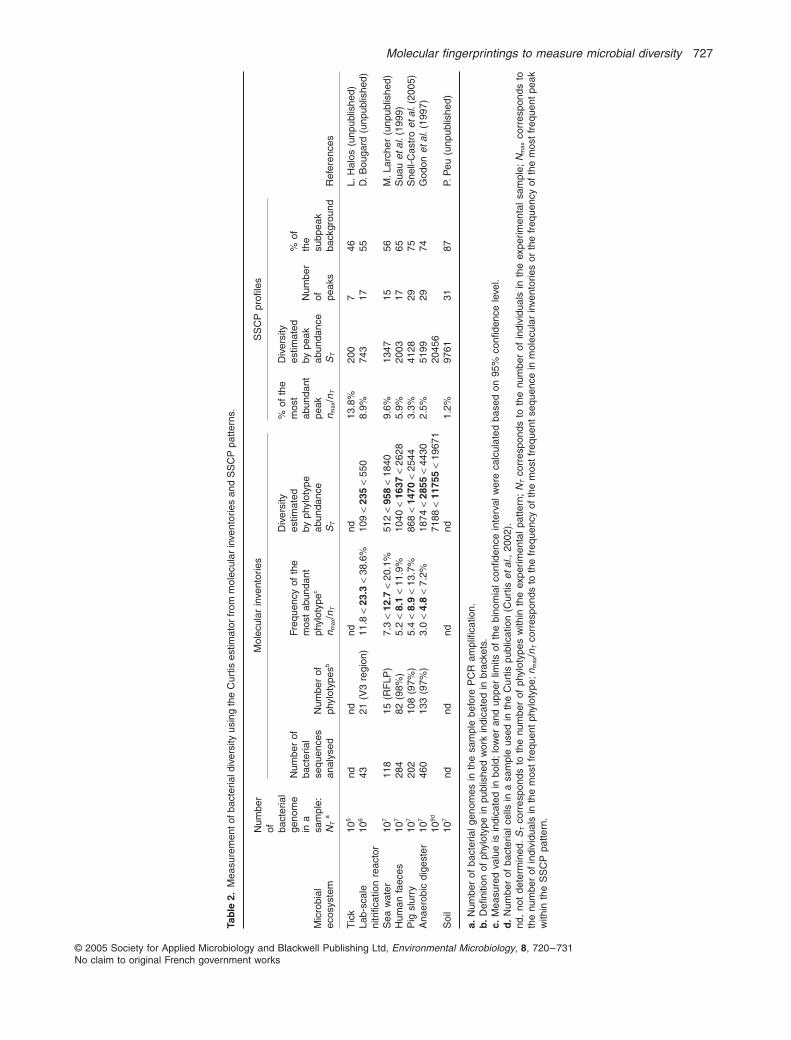
Molecular fingerprintings to measure microbial diversity 727
© 2005 Society for Applied Microbiology and Blackwell Publishing Ltd, Environmental Microbiology, 8, 720–731No claim to original French government works
Tab
le 2
.M
easu
rem
ent o
f bac
teria
l div
ersi
ty u
sing
the
Cur
tis e
stim
ator
from
mol
ecul
ar in
vent
orie
s an
d S
SC
P p
atte
rns.
Mic
robi
al
ecos
yste
m
Num
ber
of
bact
eria
l ge
nom
ein
a
sam
ple:
NT a
Mol
ecul
ar in
vent
orie
sS
SC
P p
rofil
es
Ref
eren
ces
Num
ber
of
bact
eria
l se
quen
ces
anal
ysed
Num
ber
of
phyl
otyp
esb
Freq
uenc
y of
the
m
ost
abun
dant
ph
ylot
ypec
n max
/nT
Div
ersi
ty
estim
ated
by
phy
loty
pe
abun
danc
e S
T
% o
f th
em
ost
abun
dant
peak
n m
ax/n
T
Div
ersi
ty
estim
ated
by
pea
k ab
unda
nce
ST
Num
ber
of
peak
s
% o
f
the
su
bpea
k
back
grou
nd
Tic
k10
5nd
ndnd
nd13
.8%
200
746
L. H
alos
(un
publ
ishe
d)La
b-sc
ale
nitr
ifica
tion
reac
tor
106
4321
(V
3 re
gion
)11
.8 <
23.
3 <
38.6
%10
9 <
235
< 55
08.
9%74
317
55D
. Bou
gard
(un
publ
ishe
d)
Sea
wat
er10
711
815
(R
FLP
)7.
3 <
12.7
< 2
0.1%
512
< 95
8 <
1840
9.6%
1347
1556
M. L
arch
er (
unpu
blis
hed)
Hum
an f
aece
s10
728
482
(98
%)
5.2
< 8.
1 <
11.9
%10
40 <
163
7 <
2628
5.9%
2003
1765
Sua
u et
al.
(199
9)P
ig s
lurr
y10
720
210
8 (9
7%)
5.4
< 8.
9 <
13.7
%86
8 <
1470
< 2
544
3.3%
4128
2975
Sne
ll-C
astr
o et
al.
(200
5)A
naer
obic
dig
este
r10
746
013
3 (9
7%)
3.0
< 4.
8 <
7.2%
1874
< 2
855
< 44
302.
5%51
9929
74G
odon
et a
l. (1
997)
109d
7188
< 1
1755
< 1
9671
2045
6S
oil
107
ndnd
ndnd
1.2%
9761
3187
P. P
eu (
unpu
blis
hed)
a. N
umbe
r of
bac
teria
l gen
omes
in t
he s
ampl
e be
fore
PC
R a
mpl
ifica
tion.
b.
Defi
nitio
n of
phy
loty
pe in
pub
lishe
d w
ork
indi
cate
d in
bra
cket
s.c.
Mea
sure
d va
lue
is in
dica
ted
in b
old;
low
er a
nd u
pper
lim
its o
f th
e bi
nom
ial c
onfid
ence
inte
rval
wer
e ca
lcul
ated
bas
ed o
n 95
% c
onfid
ence
leve
l.d
. N
umbe
r of
bac
teria
l cel
ls in
a s
ampl
e us
ed in
the
Cur
tis p
ublic
atio
n (C
urtis
et a
l., 2
002)
.nd
, no
t de
term
ined
. S
T c
orre
spon
ds t
o th
e nu
mbe
r of
phy
loty
pes
with
in t
he e
xper
imen
tal
patte
rn;
NT c
orre
spon
ds t
o th
e nu
mbe
r of
ind
ivid
uals
in
the
expe
rimen
tal
sam
ple;
Nm
ax c
orre
spon
ds t
oth
e nu
mbe
r of
indi
vidu
als
in t
he m
ost
freq
uent
phy
loty
pe; n
max
/nT c
orre
spon
ds t
o th
e fr
eque
ncy
of t
he m
ost
freq
uent
seq
uenc
e in
mol
ecul
ar in
vent
orie
s or
the
fre
quen
cy o
f th
e m
ost
freq
uent
pea
kw
ithin
the
SS
CP
pat
tern
.
728 P. Loisel et al.
© 2005 Society for Applied Microbiology and Blackwell Publishing Ltd, Environmental Microbiology, 8, 720–731No claim to original French government works
rapidly reached a maximum. This maximum was around35 in the conditions of simulation used, which is close toexperimental data (Figs 2 and 3A). This maximumdepends on the reading frame as well as on the resolution,which is conditioned by the technical parameters of themethod used: here the SSCP method, but easily trans-
posable to the DGE method. Some other fingerprintingtechniques such as automated ribosomal intergenicsequence analysis (A-RISA) (Ranjard et al., 2001) mayenable more units to be seen and can be considered eventhough the definition of the units (ribosomal intergenicregion) differs. In all cases, this asymptotic number israpidly reached (Fig. 3A). Thus, excepting ecosystemspresenting a low number of bands or peaks (below 10), itis clear that in a large majority of cases discrete bands orpeaks of fingerprinting patterns cannot be used directlyas an estimator of the diversity. This is the first lesson ofnumerical simulation. The fact that one peak or band mayhide more than one rDNA sequence has already beendescribed (Dabert et al., 2005) and sometimes a largenumber – up to 60 – may be hidden (Schmalenberger andTebbe, 2003) and, thus, never assessed. The secondmore unexpected lesson of numerical simulation is thathigh diversity (up to 1000 units) generates patterns whichare indeed readable. A very large number of units (morethan 50 000) can occur before a pattern appearssmeared. For example, very high diversity estimated fortwo soil samples has been published: about 3000–8000species from Arizona soil (Dunbar et al., 2002) and atleast 8800 species from Norwegian soil (Ovreas and Tors-vik, 1998). Both have proved compatible with a readablepattern. Moreover, a band or peak measurement of vari-ance and standard deviation from the Gaussian curvemake it possible to discriminate between bands or peakscoming from a single phylotype and those from multiplephylotypes (two or more). Another positive point is that thefingerprinting pattern was different according to the distri-bution (Fig. 2) and contains information about these datathat may be exploitable.
Type of microbial distribution
Simulation with uniform distribution gave patterns withvisible bands or peaks which do not correspond to realunits. This observation does not fit in with the majority ofthe experimental cases where visible bands or peaks areidentified within a complex pattern. The addition of domi-nant units (around 1%) in a uniform distribution pattern
Fig. 7. The SSCP patterns from pig faeces sample.A. Corresponds to the total bacterial pattern.B. Corresponds to the Clostridiaceae group pattern.C. Corresponds to the Bacteroides-Prevotella group pattern.D. Corresponds to the Lactobacillus-Streptococcus group pattern.
A
B
C
D
Table 3. Diversity of subgroups of the bacterial diversity.
Phylogenetic group NTa
Pig slurry sample Pig faeces sample
nmax/nT ST nmax/nT ST
Clostridiaceae 2 × 10⁶ 4.8% 1705 1.7% 4127Lactobacillus-Streptococcus 2 × 10⁶ 3.5% 2290 6.5% 1274Bacteroides-Prevotella 2 × 10⁶ 2.9% 2700 2.1% 3539Total of group diversity 6695 8940Bacteria total 107 2.4% 5543 1.5% 8257
a. The ratio of each phylogenetic group is arbitrarily defined as 20% of the total bacterial community. nmax/nT corresponds to the frequency of themost frequent peak within the SSCP pattern.
Molecular fingerprintings to measure microbial diversity 729
© 2005 Society for Applied Microbiology and Blackwell Publishing Ltd, Environmental Microbiology, 8, 720–731No claim to original French government works
shows clearly the emergence of these units even if theyrepresent only a small fraction of the total (Fig. 4). Incontrast to uniform distribution, lognormal and geometricdistributions present dominant units (Fig. 5) and simula-tion gave patterns closer to reality. This convergenceshould enrich the debate about the distribution of speciesabundance in microbial ecosystems (Curtis et al., 2002;Narang and Dunbar, 2004) and supports the tentative useof lognormal distribution by the Curtis estimator. More-over, this low level of dominance fits in with evidence fromthe data of molecular inventories (Kemp and Aller, 2004b).
Measurement of diversity from simulated and experimental patterns
However, simulations of lognormal and geometric distri-bution patterns are closer to real patterns than are uniformdistribution patterns. Within lognormal and geometric dis-tribution patterns most of the dominant peaks or bandscorrespond to real dominant units, even if 1% is sufficientto be dominant (Fig. 4). Two measurements can beextracted from fingerprinting patterns to estimate microbialdiversity. The first is the measurement of the subpeak area(Fig. 3B). This is only a rough estimate because as thepeak number increases, the value rapidly reaches a pla-teau. The second measurement is based on the Curtisestimator (ratio between the total number of individuals inthe community and the abundance of the most abundantmembers of that community) (Curtis et al., 2002). Thisestimator, proposed for molecular inventories, requires anassumption of lognormal distribution. This estimator, testedon numerical simulation patterns, refined the simulateddiversity (Table 1). From experimental data, the degree ofdiversity obtained by the Curtis estimator is roughly doublethat of the SSCP pattern when compared with inventoryresults (Table 2). This overestimate could be explained inat least two ways. First, by the cut-off used (Acinas et al.,2004): in molecular inventories, OTUs, ribotypes or phy-lotypes have generally been clustered on the basis of 97%similarity whereas the cut-off in fingerprinting is an identicalsequence in a short variable region (around 180 bp). Forexample, in a phosphate-accumulating microbial ecosys-tem, the number of phylotypes based on the 16S rDNAV3 region is double that based on a 97% similarity (Dabertet al., 2001). Second, by the imprecision of the nmax mea-surement in molecular inventories as shown by the bino-mial confidence interval (Table 2): fingerprinting patternmeasurement of diversity gives results similar to those ofa molecular inventory but the actual process is muchcheaper and faster. Thus, such pattern measurement couldfacilitate the rapid comparison of a large set of data. Thismeasurement of diversity should be applicable using allfingerprint methods with continuous (SSCP, DGE) or dis-crete (A-RISA, terminal RFLP; Liu et al., 1997) unit sep-
aration. Although applicable the measurement should notstrictly comparable due to method-specific definition of thediversity unit [V3 region, internally transcribed spacer(ITS), restriction sites]. Moreover, the accuracy of the rationmax/nT is assessed taking into account the totality of PCRproducts and not merely a subsample, as in a cloningprocedure. As a result, this method is more precise dueto the large number of molecules analysed and this pre-cision is proved by the reproducibility of the patterns. Theremaining difficulty is the measurement of NT, the numberof individuals in the sample. Curtis used the estimatednumber of bacteria in the sample (Curtis et al., 2002),whereas here we have used the estimated number ofbacterial genomes before PCR amplification (see Exper-imental procedures). The number of bacterial genomes inPCR DNA matrices is considered as a final subsample ofthe microbial community. This measurement is 100 timeslower than the Curtis value. This discrepancy changed theestimate and the result corresponds roughly to a fourfolddivision. The variable number and the sequence variationof the 16S rDNA also impaired the results, so suggestinginvestigation of other DNA sequences (Dahllof et al.,2000). Thus, these approximations, along with the classicPCR bias (Suzuki and Giovannoni, 1996), remain a sourceof error in estimating ST. The other validations, based onmeasurements from simulated patterns and totalized sub-group diversities, have shown the robustness of theapproaches but, also, the relative imprecision of the mea-surement (Tables 1 and 3).
In conclusion, and contrary to molecular inventories,fingerprinting patterns do not reflect only a tiny fraction ofreality but correspond to a representation of the wholemicrobial consortium. Numerical simulation of fingerprint-ing patterns shows that this picture can be used to estimatemicrobial diversity but not by reference to the number ofvisible bands or peaks. Using the Curtis estimator is onepossibility for extracting diversity data from fingerprintingpatterns. Despite approximations, such estimates arerobust, rapid, inexpensive and provide a way of comparingmicrobial diversity. Moreover, the fact that diversity dataare accessible in fingerprinting patterns may enhancemethods of estimation. Thus, paradoxically, it may turn outthat diversity will be easier to measure in microbial com-munities than in communities of macroorganisms.
Experimental procedures
Definition of terms used
DGE: includes fingerprinting methods based on denaturinggradient electrophoresis, such as DGGE, temperature gra-dient gel electrophoresis (TGGE), temporal temperaturegradient gel electrophoresis (TTGE).
Band, peak: correspond, respectively, to visible elementswithin experimental or simulated DGE and SSCP patterns.
730 P. Loisel et al.
© 2005 Society for Applied Microbiology and Blackwell Publishing Ltd, Environmental Microbiology, 8, 720–731No claim to original French government works
Unit: in silico pattern counterpart of a phylotype from anexperimental pattern.
ST: number of units or phylotype within in silico and experi-mental patterns respectively.
NT: number of individuals in the experimental or simulationsample.
nT: number of individuals in the cloning sample or SSCPpattern.
Nmax: number of individuals in the most frequent unit andphylotype in the simulation or experimental sample.
nmax: number of individuals in the most frequent phylotype inthe cloning sample or SSCP pattern.
Nmin: number of individuals in the least abundant unit orphylotype in the simulation or experimental sample.
Generation of fingerprinting patterns
Simulated fingerprinting patterns were generated followingfour parameters: (i) the number of units (corresponding tobacterial phylotype), (ii) the shape of the units (correspondingto gel resolution), (iii) the position of the unit in the pattern(corresponding to condition of migration) and (iv) the intensitythe units (corresponding to the number of individuals in eachphylotype).
The number of units ST was carried out in simulation forvarious values from 10 to 500 000.
As for experimental patterns the shape of each single unitbeing represented in the pattern by a Gaussian curve func-tion. All units had a constant variance, ( ) which corre-sponds to the experimental measurement of a single SSCPpeak. The position of the unit in the pattern was randomlydetermined according to experimental observations of thesize of the window (750 scans) and distribution curve (bimo-dal for SSCP pattern and unimodal for DGE pattern). Theintensity the units within the simulated pattern follow distribu-tion laws (uniform, lognormal and geometric).
Simulated patterns were generated according to the follow-ing equation:
where, ST is the number of species, Φ is a Gaussian-centredunit variance density, σ0 is the standard deviation, x is theposition of the scan, i is the number of individuals in phylotypeand ai was derived from a probability density law g.
For uniform density, g depends on .
For lognormal density, g depends on parameters µ (mean)and σ 2
G (variance):
the σG value is 1.5 and the µ values are, respectively, 2.25,2.80, 2.80, 3.25, 4.20, 4.75, 5.35, 6.60 and 7.00 for 10, 20,50, 100, 500, 1000, 5000, 50 000 and 500 000 units.
For geometric density, g depends on parameter p,g(a) = Cpa.
The position of each peak bi was derived from a bimodalprobability density law f:
s 02
ya x b
xi
i
Si
T
=-Ê
ˈ¯
=Â s s01 0
F for = 1 to 750
U N g aN
GG
0 21
2, ,[ ] ( ) =
log ~ , explog
a N g ai GG
aG( ) ( ) ( ) =
( )-[ ]m,s
pss
m2
1
2
1
2 22
for SSCP patterns. The position of each band µi was derivedfrom a unimodal probability density law f:
for DGE patterns. C and C′ were constants of normalizationand x indicates the number of scans.
Measurement of peak and background areas and identification of true units within a pattern
True peaks were defined as unit(s) with a similar single migra-tion coefficient (one Gaussian curve) whereas false peakswere defined as units with several migration coefficients (twoor more Gaussian curves). True peaks were determined fol-lowing assumptions from the laws F and G. For our purposes,10 representative points were considered on both sides of apeak. A regression on a linear tendency, added to a Gaussianwith unknown variance, was carried out. If the estimate of thevariance was equal to or of the same order of magnitude as
, the peak was considered to be a single unit. If theestimated variance was definitely larger than , the peakwas considered to result from either the contribution of atleast two units or from the sum of many subdominant units.The highest peak was considered as the most frequent unit.Its abundance within the SSCP pattern was measured as theratio between the area of the peak and the total area of thepattern.
The estimate of the subpeak background signal area wasbased on the smoothing of a piecewise linear curve whichjoined the different minima of the SSCP pattern.
Measurement of the diversity using a Curtis estimator
The number of species ST was estimated following themethod of Curtis and colleagues (2002) with the followingassumptions: distribution law G was lognormal and the leastfrequent unit only contained one or at most two units.
The number of individuals in the sample (NT) was eitherexactly known, as in a simulated pattern (input data), ormeasured in an experimental pattern. In the latter case, NT
was approximated as the number of bacterial genomes in thesample before PCR amplification. The DNA concentrationwas estimated by agarose gel electrophoresis and the num-ber of genomes calculated assuming 2 Mb per bacterialgenome (Button and Robertson, 2001).
The final parameter, the number of individuals in the mostfrequent units or phylotype (Nmax), was obtained in differentways: (i) in simulated patterns, Nmax was exactly known frominput data, (ii) in simulated patterns, Nmax was approximated as
and (iii) in simulated and experimental patterns, Nmax wasmeasured from the pattern and approximated using the sameequation.
f x Cx x x
( ) = -ÊË
ˆ¯
ÈÎÍ
˘˚̇ + -Ê
ˈ¯
ÈÎÍ
˘˚̇750
1750
0 03750
0 4752 2
. .
f x Cx x
( ) = -ÊË
ˆ¯′
750 7501
s 02
s 02
Nnn
NT
Tmaxmax=
Molecular fingerprintings to measure microbial diversity 731
© 2005 Society for Applied Microbiology and Blackwell Publishing Ltd, Environmental Microbiology, 8, 720–731No claim to original French government works
Acknowledgements
We would like to thank P. Dabert and J. Hamelin for helpfuldiscussion. Thanks also to D. Bougard, J. Doré, M. Larcher,P. Lebaron, P. Peu, R. Snell Castro and G. Vourc’h for DNAsamples.
References
Acinas, S.G., Klepac-Ceraj, V., Hunt, D.E., Pharino, C.,Ceraj, I., Distel, D.L., and Polz, M.F. (2004) Fine-scalephylogenetic architecture of a complex bacterial commu-nity. Nature 430: 551–554.
Bell, G. (2000) The distribution of abundance in neutral com-munities. Am Naturalist 155: 606–617.
Button, D.K., and Robertson, B.R. (2001) Determination ofDNA content of aquatic bacteria by flow cytometry. ApplEnviron Microbiol 67: 1636–1645.
Cases, I., and de Lorenzo, V. (2002) The grammar of(micro)biological diversity. Environ Microbiol 4: 623–627.
Curtis, T.P., and Sloan, W.T. (2004) Prokaryotic diversity andits limits: microbial community structure in nature and impli-cations for microbial ecology. Curr Opin Microbiol 7: 221–226.
Curtis, T.P., Sloan, W.T., and Scannell, J.W. (2002) Estimat-ing prokaryotic diversity and its limits. Proc Natl Acad SciUSA 99: 10494–10499.
Dabert, P., Fleura-Lessard, A., Mounier, E., Delgenes, J.P.,Moletta, R., and Godon, J.J. (2001) Monitoring of themicrobial community of a sequencing batch reactor bioaug-mented to improve its phosphorus removal capabilities.Water Sci Technol 43: 1–8.
Dabert, P., Delgenes, J.P., and Godon, J.J. (2005) Monitor-ing the impact of bioaugmentation on the start up of bio-logical phosphorus removal in a laboratory scale activatedsludge ecosystem. Appl Microbiol Biotechnol 66: 575–588.
Dahllof, I., Baillie, H., and Kjelleberg, S. (2000) rpoB-basedmicrobial community analysis avoids limitations inherent in16S rRNA gene intraspecies heterogeneity. Appl EnvironMicrobiol 66: 3376–3380.
Diez, B., Pedros-Alio, C., Marsh, T.L., and Massana, R.(2001) Application of denaturing gradient gel electrophore-sis (DGGE) to study the diversity of marine picoeukaryoticassemblages and comparison of DGGE with other molec-ular techniques. Appl Environ Microbiol 67: 2942–2951.
Dunbar, J., Barns, S.M., Ticknor, L.O., and Kuske, C.R.(2002) Empirical and theoretical bacterial diversity in fourArizona soils. Appl Environ Microbiol 68: 3035–3045.
Fromin, N., Hamelin, J., Tarnawski, S., Roesti, D., Jourdain-Miserez, K., Forestier, N., et al. (2002) Statistical analysisof denaturing gel electrophoresis (DGE) fingerprinting pat-terns. Environ Microbiol 4: 634–643.
Godon, J.J., Zumstein, E., Dabert, P., Habouzit, F., andMoletta, R. (1997) Molecular microbial diversity of ananaerobic digestor as determined by small-subunit rDNAsequence analysis. Appl Environ Microbiol 63: 2802–2813.
Hughes, J.B., Hellmann, J.J., Ricketts, T.H., and Bohannan,B.J.M. (2001) Counting the uncountable: statisticalapproaches to estimating microbial diversity. Appl EnvironMicrobiol 67: 4399–4406.
Kemp, P.F., and Aller, J.Y. (2004a) Estimating prokaryoticdiversity: when are 16S rDNA libraries large enough? Lim-nol Oceanogr Methods 2: 114–125.
Kemp, P.F., and Aller, J.Y. (2004b) Bacterial diversity inaquatic and other environments: what 16S rDNA librariescan tell us. FEMS Microbiol Ecol 47: 161–177.
Kowalchuk, G.A., and Stephen, J.R. (2001) Ammonia-oxidiz-ing bacteria: a model for molecular microbial ecology. AnnuRev Microbiol 55: 485–529.
Leser, T.D., Amenuvor, J.Z., Jensen, T.K., Lindecrona, R.H.,Boye, M., and Moller, K. (2002) Culture-independent anal-ysis of gut bacteria: the pig gastrointestinal tract microbiotarevisited. Appl Environ Microbiol 68: 673–690.
Liu, W.T., Marsh, T.L., Cheng, H., and Forney, L.J. (1997)Characterization of microbial diversity by determining ter-minal restriction fragment length polymorphisms of genesencoding 16S rRNA. Appl Environ Microbiol 63: 4516–4522.
Martin, A.P. (2002) Phylogenetic approaches for describingand comparing the diversity of microbial communities. ApplEnviron Microbiol 68: 3673–3682.
Muyzer, G., and Smalla, K. (1998) Application of denaturinggradient gel electrophoresis (DGGE) and temperature gra-dient gel electrophoresis (TGGE) in microbial ecology.Antonie Van Leeuwenhoek 73: 127–141.
Nakatsu, C.H., Torsvik, V., and Ovreas, L. (2000) Soil com-munity analysis using DGGE of 16S rDNA polymerasechain reaction products. Soil Sci Soc Am J 64: 1382–1388.
Narang, R., and Dunbar, J. (2004) Modeling bacterial speciesabundance from small community surveys. Microb Ecol 47:396–406.
Ovreas, L., and Torsvik, V. (1998) Microbial diversity andcommunity structure in two different agricultural soil com-munities. Microb Ecol 36: 303–315.
Pace, N.R. (1997) A molecular view of microbial diversity andthe biosphere. Science 276: 734–740.
Ranjard, L., Poly, F., Lata, J.C., Mougel, C., Thioulouse, J.,and Nazaret, S. (2001) Characterization of bacterial andfungal soil communities by automated ribosomal intergenicspacer analysis fingerprints: biological and methodologicalvariability. Appl Environ Microbiol 67: 4479–4487.
Schmalenberger, A., and Tebbe, C.C. (2003) Bacterial diver-sity in maize rhizospheres: conclusions on the use of gen-etic profiles based on PCR-amplified partial small subunitrRNA genes in ecological studies. Mol Ecol 12: 251–261.
Snell-Castro, R., Godon, J.-J., Delgenes, J.-P., and Dabert,P. (2005) Characterisation of the microbial diversity in apig manure storage pit using small subunit rDNA sequenceanalysis. FEMS Microbiol Ecol 52: 229–242.
Suau, A., Bonnet, R., Sutren, M., Godon, J.J., Gibson, G.R.,Collins, M.D., and Dore, J. (1999) Direct analysis of genesencoding 16S rRNA from complex communities revealsmany novel molecular species within the human gut. ApplEnviron Microbiol 65: 4799–4807.
Suzuki, M., and Giovannoni, S. (1996) Bias caused by tem-plate annealing in the amplification of mixtures of 16SrRNA genes by PCR. Appl Environ Microbiol 62: 625–630.
Zhou, J., Xia, B., Treves, D.S., Wu, L.-Y., Marsh, T.L., O’Neill,R.V., et al. (2002) Spatial and resource factors influencinghigh microbial diversity in soil. Appl Environ Microbiol 68:326–334.
Related Documents