Demand Side Management Workshop Fiji Islands November 2-6,2009 Introduction to Demand Side Introduction to Demand Side Management Management Day 1 - Dr. Herb Wade Day 1 - Dr. Herb Wade

Demand Side Management Workshop Fiji Islands November 2-6,2009 Introduction to Demand Side Management Day 1 - Dr. Herb Wade.
Dec 15, 2015
Welcome message from author
This document is posted to help you gain knowledge. Please leave a comment to let me know what you think about it! Share it to your friends and learn new things together.
Transcript
Demand Side Management WorkshopFiji Islands
November 2-6,2009
Introduction to Demand Side ManagementIntroduction to Demand Side Management
Day 1 - Dr. Herb WadeDay 1 - Dr. Herb Wade
e8 /
PPA
DSM
Wor
ksho
p
Fiji
Isla
nds
Nov
embe
r 2-6
, 200
9
Demand Side Management for UtilitiesDemand Side Management for Utilities
Course outlineCourse outline

e8 /
PPA
DSM
Wor
ksho
p
Fiji
Isla
nds
Nov
embe
r 2-6
, 200
9Program Days 1-4Program Days 1-4
Start at 0800
Review of previous day’s work
Morning Lectures and Demonstrations
Lunch
Case studies, practical work, exercises
Daily Comprehensive quiz
Finish about 1700

e8 /
PPA
DSM
Wor
ksho
p
Fiji
Isla
nds
Nov
embe
r 2-6
, 200
9Day 5 Day 5
• Visit to a government facility to do an energy audit
• Course review and comprehensive examination
• Presentation of certificates of participation
• Closing

e8 /
PPA
DSM
Wor
ksho
p
Fiji
Isla
nds
Nov
embe
r 2-6
, 200
9
Course ContentCourse Content

e8 /
PPA
DSM
Wor
ksho
p
Fiji
Isla
nds
Nov
embe
r 2-6
, 200
9
Focus is on DSM and UtilitiesFocus is on DSM and Utilities
• How DSM programmes affect utilities both technically and financially
• Why utilities do DSM programmes
• Creating DSM programmes to provide benefits to utilities• Case studies of DSM activities by utilities
• Practical work in energy audits, financial analysis and with tools for DSM

e8 /
PPA
DSM
Wor
ksho
p
Fiji
Isla
nds
Nov
embe
r 2-6
, 200
9Utility Management Issues and DSMUtility Management Issues and DSM
• Determining the financial effects of DSM activities on the utility
– How lowering kWh sales through DSM changes cash flow for a utility
– Impact of meeting external requirements for implementing DSM
– Planning, forecasting and DSM

e8 /
PPA
DSM
Wor
ksho
p
Fiji
Isla
nds
Nov
embe
r 2-6
, 200
9Technical Aspects of DSMTechnical Aspects of DSM
• Energy auditing– Commercial– Industrial– Government– Residential
• Energy management technology
• Utility technical operations and DSM
• Renewable energy and DSM

e8 /
PPA
DSM
Wor
ksho
p
Fiji
Isla
nds
Nov
embe
r 2-6
, 200
9Analyzing Cost/Benefits of DSMAnalyzing Cost/Benefits of DSM
• Life cycle costing for DSM investment
• Concept of “payback period” for DSM investments
• DSM in situations where tariffs are below service delivery cost
• DSM in rising fuel price conditions

e8 /
PPA
DSM
Wor
ksho
p
Fiji
Isla
nds
Nov
embe
r 2-6
, 200
9DSM ProgrammingDSM Programming
• Energy Surveys and Audits
• Designing programmes for each class of customers
• Public Information programmes
• Appliance efficiency rating programmes
• ESCO type activities
• DSM programmes and government
• Energy codes for buildings

e8 /
PPA
DSM
Wor
ksho
p
Fiji
Isla
nds
Nov
embe
r 2-6
, 200
9Energy Service Companies and DSMEnergy Service Companies and DSM
• ESCO Services
• ESCO type operations by utilities

e8 /
PPA
DSM
Wor
ksho
p
Fiji
Isla
nds
Nov
embe
r 2-6
, 200
9
So What Really is DSM?So What Really is DSM?
e8 /
PPA
DSM
Wor
ksho
p
Fiji
Isla
nds
Nov
embe
r 2-6
, 200
9
Demand Side ManagementDemand Side Management
• Actions carried out by the utility on the customer’s premises that help manage the customer’s electrical usage
– To modify energy use patterns including electricity demand timing or amount of demand
– To encourage actions by the customer to modify the electrical usage to meet some goal, usually a reduction in electricity cost
e8 /
PPA
DSM
Wor
ksho
p
Fiji
Isla
nds
Nov
embe
r 2-6
, 200
9
• While load management can be implemented by customers without any interaction by the utility, usually the term Demand Side Management (DSM) refers to actions taken on the customer’s premises that are actively encouraged or carried out by the utility.
e8 /
PPA
DSM
Wor
ksho
p
Fiji
Isla
nds
Nov
embe
r 2-6
, 200
9Supply Side Management Supply Side Management (SSM)(SSM)
• Actions carried out by the utility on its own premises to manage electricity supply
– Usually incorporates efficiency improvements to reduce technical losses
Fuel efficiency improvements Reduce parasitic loads Reduce transformer losses Reduce line losses
e8 /
PPA
DSM
Wor
ksho
p
Fiji
Isla
nds
Nov
embe
r 2-6
, 200
9
• May also incorporate generation and distribution management
– Operating the optimum mix of generators Improving fuel efficiency by shifting generators on and
off line to keep generator loads at optimums
– Maintaining a high power factor Incorporating compensators to keep generation power
factor high
– Managing the distribution system optimally Substation management Power routing management

e8 /
PPA
DSM
Wor
ksho
p
Fiji
Isla
nds
Nov
embe
r 2-6
, 200
9
What about Non-Technical Losses?What about Non-Technical Losses?
• Non-Technical losses include such things as:
– Excess use by customers having electricity provided without metering (24 hour street lights, un-metered government customers, broken meters, etc.)
– Electricity stolen through customers wiring around meters, tapping feeders or modifying metering
– Non payment of bills by customers

e8 /
PPA
DSM
Wor
ksho
p
Fiji
Isla
nds
Nov
embe
r 2-6
, 200
9Comparison of DSM and SSM ActionsComparison of DSM and SSM Actions
• Longevity of results– Supply side 20-30 years– Demand Side much shorter term unless continually
promoted
• Quantification– Supply side benefits easily measured– Demand side benefits often difficult to quantify
e8 /
PPA
DSM
Wor
ksho
p
Fiji
Isla
nds
Nov
embe
r 2-6
, 200
9
• Non-Technical losses are often not considered in either SSM or DSM programmes
– Typically treated as an administrative issue

e8 /
PPA
DSM
Wor
ksho
p
Fiji
Isla
nds
Nov
embe
r 2-6
, 200
9
• This course covers only DSM. Neither SSM nor non-technical loss reduction will be covered
e8 /
PPA
DSM
Wor
ksho
p
Fiji
Isla
nds
Nov
embe
r 2-6
, 200
9Objectives of DSM by UtilitiesObjectives of DSM by Utilities
• Financial benefits
• Political benefits
• Socio-Economic benefits
• Improved quality of electrical services
– Avoiding the need for power cuts and rolling blackouts
– Improving voltage stability in distribution

e8 /
PPA
DSM
Wor
ksho
p
Fiji
Isla
nds
Nov
embe
r 2-6
, 200
9Does DSM Differ from Energy Conservation?Does DSM Differ from Energy Conservation?
• DSM strives to improve the efficiency of energy use without any reduction in the services that the energy provides
• Conservation includes energy efficiency but also adds reducing energy use through the reduction of non-essential services

e8 /
PPA
DSM
Wor
ksho
p
Fiji
Isla
nds
Nov
embe
r 2-6
, 200
9Why Do DSM?Why Do DSM?
• Maybe advantageous to the utility because:
– Can avoid capital investment in higher capacity for generation and/or distribution
– Currently losing money on each kWh sold due to rates set below cost of service delivery
– May allow increased generation efficiency and lower fuel bills
– Marginal Costs are higher than average costs
– Load patterns cause inefficiencies in generation or distribution

e8 /
PPA
DSM
Wor
ksho
p
Fiji
Isla
nds
Nov
embe
r 2-6
, 200
9
• DSM is Mandated by Government
– Reduction in fuel imports– Carbon emission reduction goals– Donor programmes
• Public Relations
– Customer’s perceive the utility in a more favourable light
e8 /
PPA
DSM
Wor
ksho
p
Fiji
Isla
nds
Nov
embe
r 2-6
, 200
9
How can a Utility Make More Money by How can a Utility Make More Money by Selling Less Electricity?Selling Less Electricity?
e8 /
PPA
DSM
Wor
ksho
p
Fiji
Isla
nds
Nov
embe
r 2-6
, 200
9Tariff is too LowTariff is too Low
• Government forces the utility to sell electricity below actual cost
– Often residential rates are substantially below the real cost of service and are subsidised by higher commercial and government customers rates.
residential DSM allows the utility to keep more of the revenue from commercial and government customers

e8 /
PPA
DSM
Wor
ksho
p
Fiji
Isla
nds
Nov
embe
r 2-6
, 200
9Tariff cannot keep up with fuel price increasesTariff cannot keep up with fuel price increases
• In times of rising fuel prices, tariff increases lag behind fuel prices.
– DSM helps reduce fuel cost and losses due to tariffs consistently below the real cost of service.
e8 /
PPA
DSM
Wor
ksho
p
Fiji
Isla
nds
Nov
embe
r 2-6
, 200
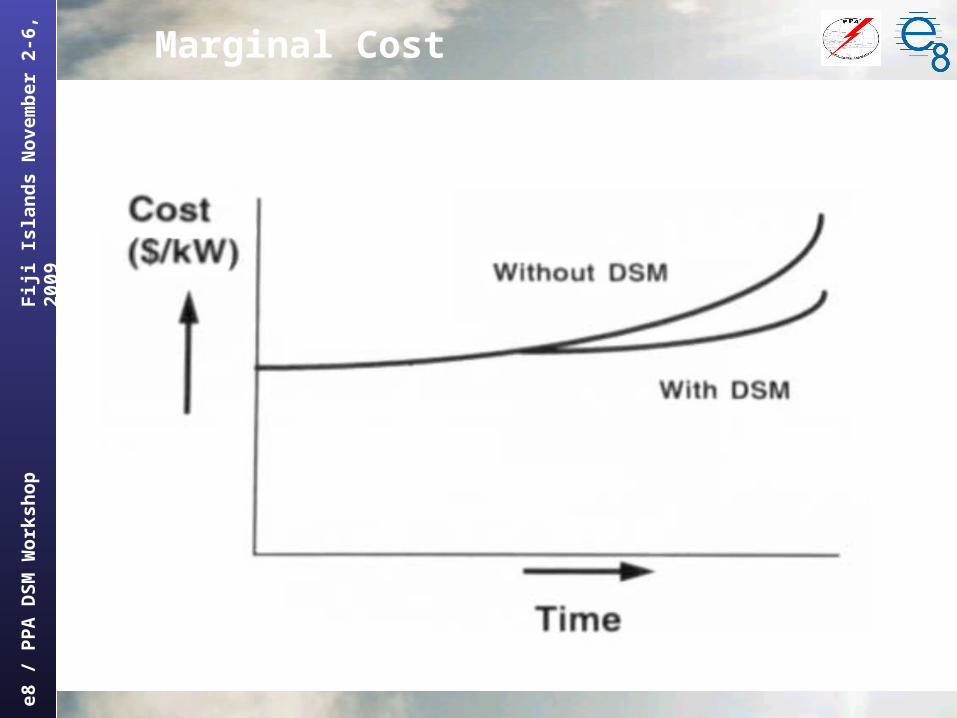
9Marginal Costs Higher than Average CostsMarginal Costs Higher than Average Costs
• For each kW of new capacity needed the per kWh generation cost is higher than current costs
– Slow down rate of demand growth to limit the need for higher cost new capacity
e8 /
PPA
DSM
Wor
ksho
p
Fiji
Isla
nds
Nov
embe
r 2-6
, 200
9 Marginal Cost

e8 /
PPA
DSM
Wor
ksho
p
Fiji
Isla
nds
Nov
embe
r 2-6
, 200
9Generation Capacity Barely AdequateGeneration Capacity Barely Adequate
• Improving the efficiency of customer energy use may keep the peak load within existing capacity and avoid or at least put off new investment in generation
e8 /
PPA
DSM
Wor
ksho
p
Fiji
Isla
nds
Nov
embe
r 2-6
, 200
9Inadequate Capacity Forces DSMInadequate Capacity Forces DSM
• Rolling blackouts
– the ultimate DSM measure is turning off the power to the customer
– Rolling blackouts possibly can be avoided through other DSM measures
Small rural hydro based utility in Bhutan could not meet demand until all incandescent lights were changed to CFLs.
e8 /
PPA
DSM
Wor
ksho
p
Fiji
Isla
nds
Nov
embe
r 2-6
, 200
9Distribution Capacity InadequateDistribution Capacity Inadequate
• DSM may allow the utility to avoid investment in distribution upgrading
– DSM measures specifically focused on customers connected to feeders that are at or above the proper loading level

e8 /
PPA
DSM
Wor
ksho
p
Fiji
Isla
nds
Nov
embe
r 2-6
, 200
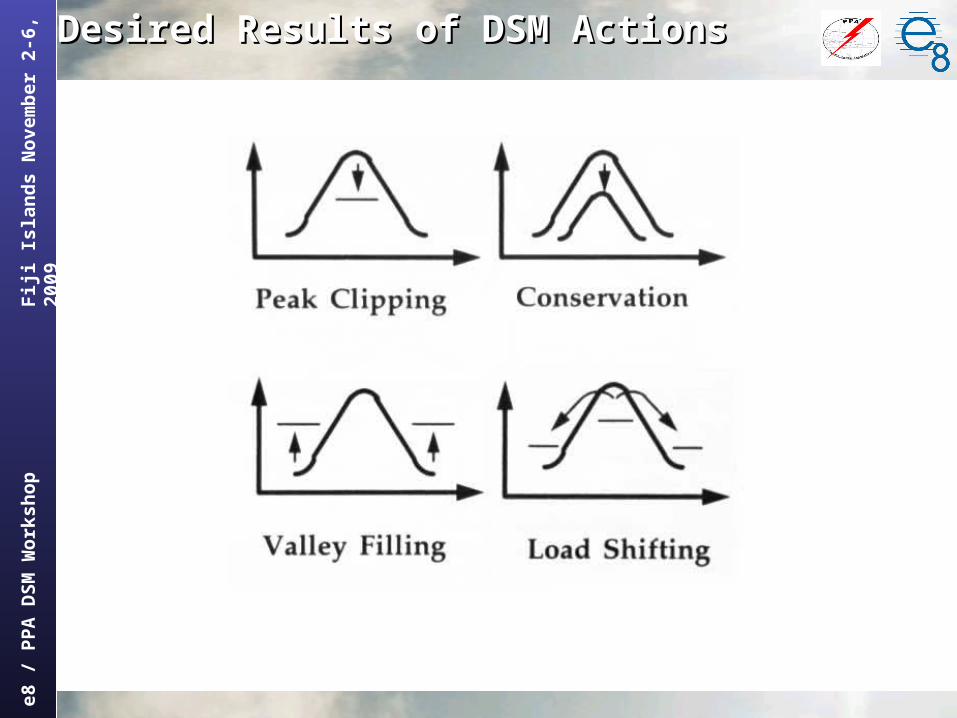
9Load LevellingLoad Levelling
• The more constant the system load, the more efficient the system can be. High peaks and/or deep valleys in the daily load curve usually cause increased losses and higher costs to the utility
– DSM applied specifically to loads that cause the peaks/valleys can help level the load over the day

e8 /
PPA
DSM
Wor
ksho
p
Fiji
Isla
nds
Nov
embe
r 2-6
, 200
9Increasing/Shifting DemandIncreasing/Shifting Demand
• DSM is not just applied to lowering demand, it also can be used to increase or shift the timing of demand either globally, seasonally or at particular times of the day
– During the wet season in a country with diesel+hydro, energy costs are lower so increased demand at that time will increase utility net income
– Shifting electric water heating to late at night may improve generation efficiency
– Ice making/fish freezing can be shifted to times when loads are too low to allow efficient generation
e8 /
PPA
DSM
Wor
ksho
p
Fiji
Isla
nds
Nov
embe
r 2-6
, 200
9Desired Results of DSM ActionsDesired Results of DSM Actions

e8 /
PPA
DSM
Wor
ksho
p
Fiji
Isla
nds
Nov
embe
r 2-6
, 200
9
Providing Services Associated with DSMProviding Services Associated with DSM
• Renting customers energy efficiency equipment (e.g. solar water heaters) and charging a fee equivalent to the non-fuel cost of generating the kWh saved by the equipment
• Joint venture with a gas company to shift customers from electric cooking to gas
• Joint venture with a local engineering firm to provide ESCO type services to industrial, government and commercial users
– Determine equipment needs, provide finance and maintenance for a fee that covers costs plus the non-fuel cost of generating the kWh saved

e8 /
PPA
DSM
Wor
ksho
p
Fiji
Isla
nds
Nov
embe
r 2-6
, 200
9How are Users Encouraged to do DSM?How are Users Encouraged to do DSM?
• Usually by financial incentives– Lower electric bills– Lowered rates for desired actions– Higher rates for undesired actions– Finance for investing in energy efficiency
measures– Provision of low or no cost CFLs to replace
incandescent lights
e8 /
PPA
DSM
Wor
ksho
p
Fiji
Isla
nds
Nov
embe
r 2-6
, 200
9
• Technical assistance services– Energy audits to determine where energy use can
be reduced without reducing services
– Advice/assistance in specifying and locating equipment that can provide higher efficiency
– Joint ventures/cooperative agreements with local engineering firms to provide technical advice for energy efficiency improvements in commercial and industrial facilities
– Training and information programmes Workshops for hotel, office building and government
building managers Public information programmes through local media,
events, public meetings and school activities

e8 /
PPA
DSM
Wor
ksho
p
Fiji
Isla
nds
Nov
embe
r 2-6
, 200
9Selection of DSM TechnologiesSelection of DSM Technologies
• Technologies that have the greatest potential for overall energy saving
• Technologies that are cost effective (payback in less than 10 years)
• Technologies that can be installed and maintained locally

e8 /
PPA
DSM
Wor
ksho
p
Fiji
Isla
nds
Nov
embe
r 2-6
, 200
9Financial Analysis of Energy AlternativesFinancial Analysis of Energy Alternatives
• Typically used to compare the “before” and the “after” financial results of implementing DSM.
– Financial Rate of Return (FRR) The effective interest rate received for the investment
through energy savings Often required by financiers but actually not always a
good objective measure of DSM effectiveness
– Payback period The amount of time needed before the savings pay for
the investment Good mainly to eliminate clearly poor options and to
provide an easily understandable measure of effectiveness.

e8 /
PPA
DSM
Wor
ksho
p
Fiji
Isla
nds
Nov
embe
r 2-6
, 200
9
– Life Cycle Cost (or Net Present Value)
The total cost of implementing an energy efficiency measure compared to BAU (Business As Usual) energy costs
Includes capital investment, energy cost, repairs, replacements, maintenance, interest and inflation
Most realistic measure of the financial effectiveness of a DSM action
Requires a good understanding of costs and their timing

e8 /
PPA
DSM
Wor
ksho
p
Fiji
Isla
nds
Nov
embe
r 2-6
, 200
9Understanding Life Cycle CostingUnderstanding Life Cycle Costing
• Time value of money
– Through investing money, more money can be made over time. This gives today’s money increased value over time.
– This value can be stated as an “annual interest rate”, the percentage of increase in money value each year

e8 /
PPA
DSM
Wor
ksho
p
Fiji
Isla
nds
Nov
embe
r 2-6
, 200
9Interest CalculationInterest Calculation
• Period = amount of time the investment is increasing value due to interest (day, month, year, etc)
• Interest rate is the % growth for each period (6% per year, .5% per month, etc.). If no period is stated, a year is assumed.
So $5000 invested at 6% for 1 year will increase in value $5000 X .06 = $300

e8 /
PPA
DSM
Wor
ksho
p
Fiji
Isla
nds
Nov
embe
r 2-6
, 200
9Simple InterestSimple Interest
• Calculations are made as though each year had no effect on other years. This is equivalent to spending the interest as soon as it comes in.
Year 1: $5000 X .06 = $300 ($5300 total)Year 2: $5000 X .06 = $300 ($5600 total)Year 3: $5000 X .06 = $300 ($5900 total)Year 4: $5000 X .06 = $300 ($6200 total)
e8 /
PPA
DSM
Wor
ksho
p
Fiji
Isla
nds
Nov
embe
r 2-6
, 200
9Compound InterestCompound Interest
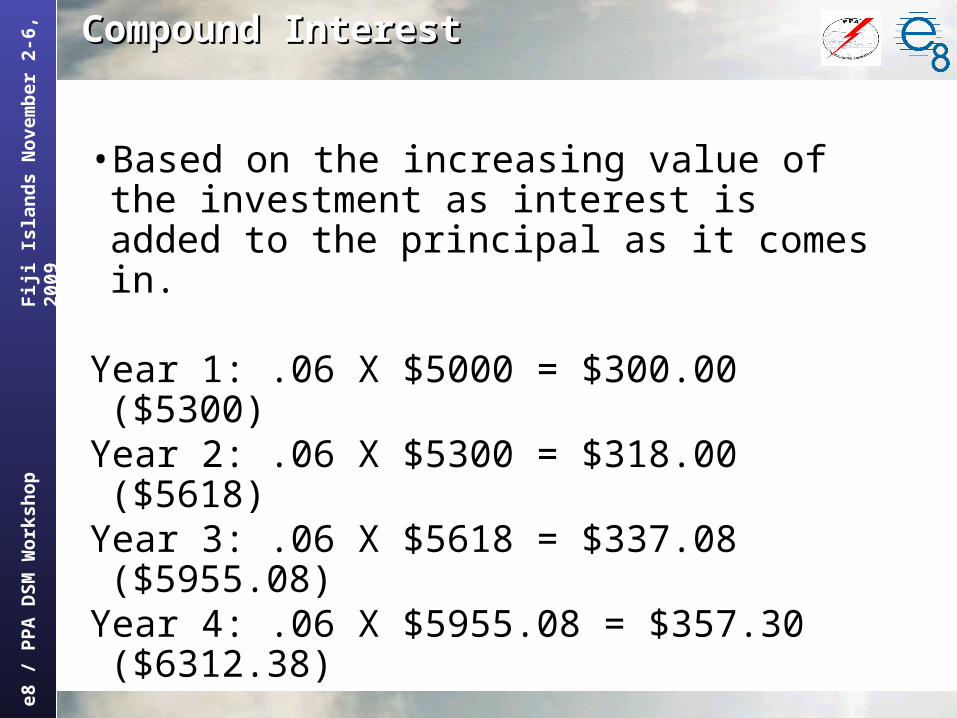
• Based on the increasing value of the investment as interest is added to the principal as it comes in.
Year 1: .06 X $5000 = $300.00 ($5300)Year 2: .06 X $5300 = $318.00 ($5618)Year 3: .06 X $5618 = $337.08 ($5955.08)Year 4: .06 X $5955.08 = $357.30 ($6312.38)
So compounding shows increased value of $112.38 over that of simple interest

e8 /
PPA
DSM
Wor
ksho
p
Fiji
Isla
nds
Nov
embe
r 2-6
, 200
9
Future Value = Today’s value times ( 1+i )N
Where N = the number of periods (years, months, etc.) at the interest rate “i” for one of those periods.
e8 /
PPA
DSM
Wor
ksho
p
Fiji
Isla
nds
Nov
embe
r 2-6
, 200
9
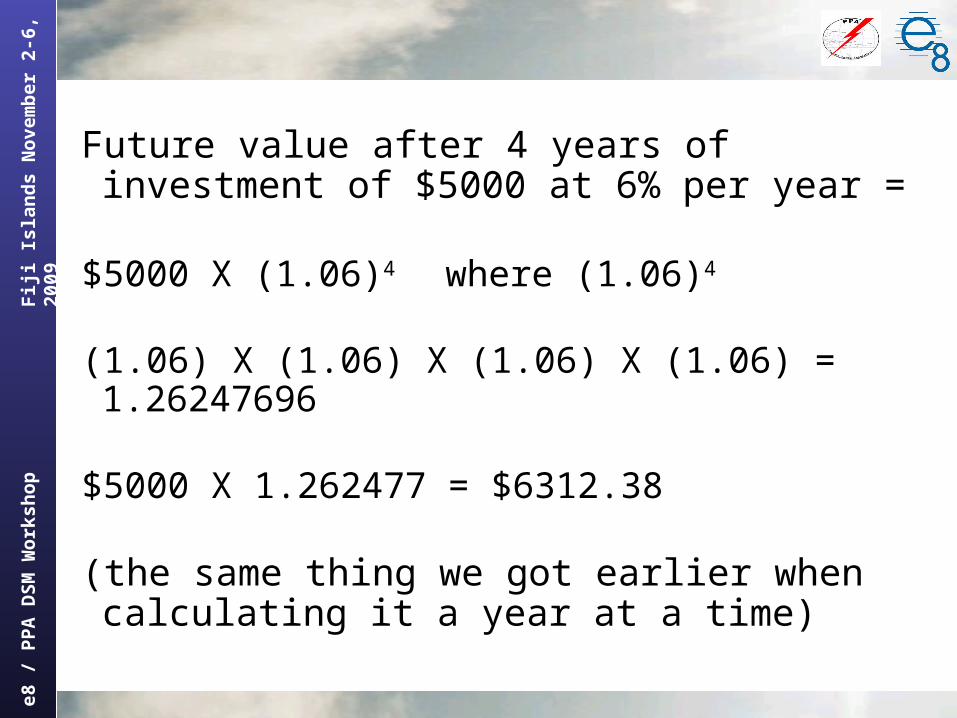
Future value after 4 years of investment of $5000 at 6% per year =
$5000 X (1.06)4 where (1.06)4
(1.06) X (1.06) X (1.06) X (1.06) = 1.26247696
$5000 X 1.262477 = $6312.38
(the same thing we got earlier when calculating it a year at a time)

e8 /
PPA
DSM
Wor
ksho
p
Fiji
Isla
nds
Nov
embe
r 2-6
, 200
9
4 years of $5000 invested at 6% annual interest compounded annually:
Year 1: .06 X $5000 = $300.00 ($5300)Year 2: .06 X $5300 = $318.00 ($5618)Year 3: .06 X $5618 = $337.08 ($5955.08)Year 4: .06 X $5955.08 = $357.30 ($6312.38) or using the formula $5000 X (1.06)4
$5000 X 1.262477 = $6312.38

e8 /
PPA
DSM
Wor
ksho
p
Fiji
Isla
nds
Nov
embe
r 2-6
, 200
9The effect of the time interval in compoundingThe effect of the time interval in compounding
• The more frequently you add in the interest, the higher the final value of the investment.

e8 /
PPA
DSM
Wor
ksho
p
Fiji
Isla
nds
Nov
embe
r 2-6
, 200
9
Assume $5000 at 6% compounded every 12 months for 4 years:
$5000 X (1.06)4 = $6312.38
Assume $5000 at 6% compounded every 6 months for 4 years:
$5000 X (1_.06/2)8 = $6333.85 ($21.47 more)
Assume $5000 at 6% compounded every month for 4 years
$5000 X (1_.06/12)48 = $6352.45 ($40.07 more)
Assume $5000 at 6% compounded every day for 4 years
$5000 X (1+.06/365)1460 = $6356.12 ($43.70 more)

e8 /
PPA
DSM
Wor
ksho
p
Fiji
Isla
nds
Nov
embe
r 2-6
, 200
9Present Value (PV)Present Value (PV)
• The present value of a future payment is equal to the amount of interest bearing money needed to be invested today in an interest bearing account in order to exactly pay off that future payment when it occurs

e8 /
PPA
DSM
Wor
ksho
p
Fiji
Isla
nds
Nov
embe
r 2-6
, 200
9Present Value example:Present Value example:
If we need to make a payment of $6356.12 four years from now and we can get 6% interest compounded daily for money invested today, then the Present Value (PV) of the $6356.12 payment to be made 4 years from now will be $5000

e8 /
PPA
DSM
Wor
ksho
p
Fiji
Isla
nds
Nov
embe
r 2-6
, 200
9Inflation and EscalationInflation and Escalation
• Inflation is the increase in overall cost of operations over time
– Essentially due to the decrease in the value of a country’s currency over time relative to goods and services
• Escalation is the increase in cost of a specific commodity over time (e.g. fuel)
– Due to inflation plus other factors such as a depleting resource, market demand, etc.

e8 /
PPA
DSM
Wor
ksho
p
Fiji
Isla
nds
Nov
embe
r 2-6
, 200
9Discount RateDiscount Rate
• The time value of the money invested today to pay off the stream of payments.
– Typically the inflation rate (or escalation rate if known) minus the rate of interest for low risk investment (e.g. government bonds)
For Present Value calculation purposes the discount rate for utility investments can reasonably be assumed to be 6%

e8 /
PPA
DSM
Wor
ksho
p
Fiji
Isla
nds
Nov
embe
r 2-6
, 200
9Formula for Present ValueFormula for Present Value
• To calculate the Present Value of a future payment use the formula:
PV = Future Payment/(1+discount rate)N
Where N = the number of compounding periods used in the calculation and the discount rate is the interest rate for one compounding period
So the present value of a future payment 4 years from now of $6356.12 with a discount rate of 6% compounded daily will be:
PV= $6356.12 / (1+.06/365)1460 = $5000
e8 /
PPA
DSM
Wor
ksho
p
Fiji
Isla
nds
Nov
embe
r 2-6
, 200
9Present Value of a stream of paymentsPresent Value of a stream of payments
• For a long series of payments (such as needed in figuring life cycle cost) you figure the Present Value of each payment and then add them all together
e8 /
PPA
DSM
Wor
ksho
p
Fiji
Isla
nds
Nov
embe
r 2-6
, 200
9Example of CFL vs Incandescent bulbExample of CFL vs Incandescent bulb
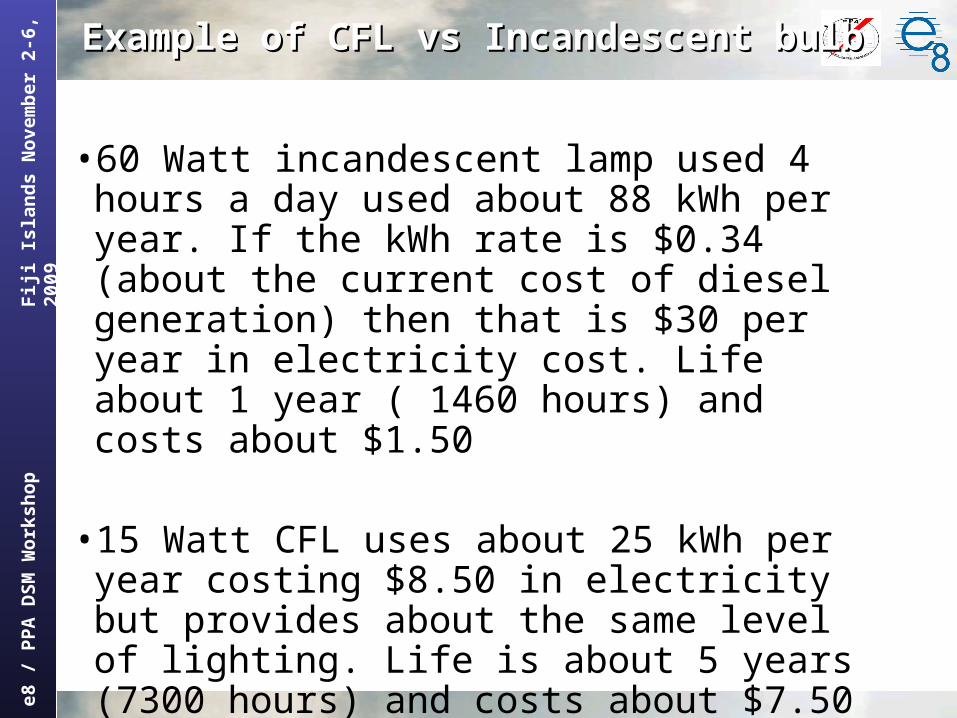
• 60 Watt incandescent lamp used 4 hours a day used about 88 kWh per year. If the kWh rate is $0.34 (about the current cost of diesel generation) then that is $30 per year in electricity cost. Life about 1 year ( 1460 hours) and costs about $1.50
• 15 Watt CFL uses about 25 kWh per year costing $8.50 in electricity but provides about the same level of lighting. Life is about 5 years (7300 hours) and costs about $7.50

e8 /
PPA
DSM
Wor
ksho
p
Fiji
Isla
nds
Nov
embe
r 2-6
, 200
9
• For a 5 year period, calculate the Present Value of an Incandescent light that costs $1.50 to buy, costs $30 per year to operate and has to be replaced every year
PV of bulb purchases =
Bulb 1 = $1.50/1.060=$1.50Bulb 2 = 1.50/1.061=$1.42Bulb 3 = 1.50/1.062=$1.33Bulb 5 = 1.50/1.063=$1.26Bulb 4 = 1.50/1.064=$1.19Total PV for the stream of bulb purchases = $6.70

e8 /
PPA
DSM
Wor
ksho
p
Fiji
Isla
nds
Nov
embe
r 2-6
, 200
9
• That means that if you invest $6.30 today at 6%, you will be able to buy a new bulb each year for 5 years.

e8 /
PPA
DSM
Wor
ksho
p
Fiji
Isla
nds
Nov
embe
r 2-6
, 200
9
• PV of the electrical use:
Year 1= $30/1.061= $28.30Year 2 = $30/1.062= $26.70Year 3 = $30/1.063= $25.19Year 4 = $30/1.064= $23.76Year 5 = $30/1.065= $22.42
Total PV of electrical use = $126.37

e8 /
PPA
DSM
Wor
ksho
p
Fiji
Isla
nds
Nov
embe
r 2-6
, 200
9
• Total Life-Cycle Cost of incandescent bulb over 5 years =
PV of investment + PV of operations =$6.70 +$126.37 = $133.07

e8 /
PPA
DSM
Wor
ksho
p
Fiji
Isla
nds
Nov
embe
r 2-6
, 200
9
PV of CFL over 5 yearsPV of CFL over 5 years
• Purchase price of CFL = $7.50
• CFL uses $8.50 per year in electricity• CFL lasts 5 years
PV of investment = $7.50Year 1 cost = $7.50/(1.06)1 = $8.02Year 2 cost = $7.50/(1.06)2 = $7.57Year 3 cost = $7.50/(1.06)3 = $7.14Year 4 cost = $7.50/(1.06)4 = $6.73Year 5 cost = $7.50/(1.06)5 = $6.35
PV of cost = $35.79
Total PV of CFL = $43.29

e8 /
PPA
DSM
Wor
ksho
p
Fiji
Isla
nds
Nov
embe
r 2-6
, 200
9
• Present Value of CFL = $43.29• Present Value of Incandescent = $133.07
So this means that over a 5 year period, the real savings of the CFL bulb in today’s money will be about:
$133.07 - $43.29 = $89.78
e8 /
PPA
DSM
Wor
ksho
p
Fiji
Isla
nds
Nov
embe
r 2-6
, 200
9Payback PeriodPayback Period
• The amount of time it takes to recover the added investment for energy efficiency from energy savings
– True payback period considers the time value of money
– Simple payback period ignores the time cost of money Easy for the layman to understand Reasonable for actions that have fast payback
such as solar water heating Simply divide the added cost for energy
efficiency by the annual savings in energy

e8 /
PPA
DSM
Wor
ksho
p
Fiji
Isla
nds
Nov
embe
r 2-6
, 200
9
• Simple Payback Example:
– Solar water heater costs $2000 to install and $25 per year average maintenance cost. 15 year life expectancy
– Electric water costs $200 to install and has an average annual cost of operation of $350. 10 year life expectancy
– Simple payback time = (2000-200)/(350-25) = 5.54 years
Related Documents