Unit - 2 Unit - 2 Ch - 3 Ch - 3 Demand Analysis Demand Analysis By – Ram Ahir

Welcome message from author
This document is posted to help you gain knowledge. Please leave a comment to let me know what you think about it! Share it to your friends and learn new things together.
Transcript
Unit - 2Unit - 2
Ch - 3Ch - 3Demand AnalysisDemand Analysis
By – Ram Ahir
The Concept of The Concept of Demand. . .Demand. . .
Market refers to the interaction between seller and buyers of a good or services at a mutually agreed upon price.
Demand is defined as that want, need or desire which is backed by willingness and ability to buy a particular commodity, in a given period of time.
Demand is the quantity of a commodity which consumers are willing to buy at a given price for a particular unit of time.
The Concept of The Concept of Demand. . .Demand. . .
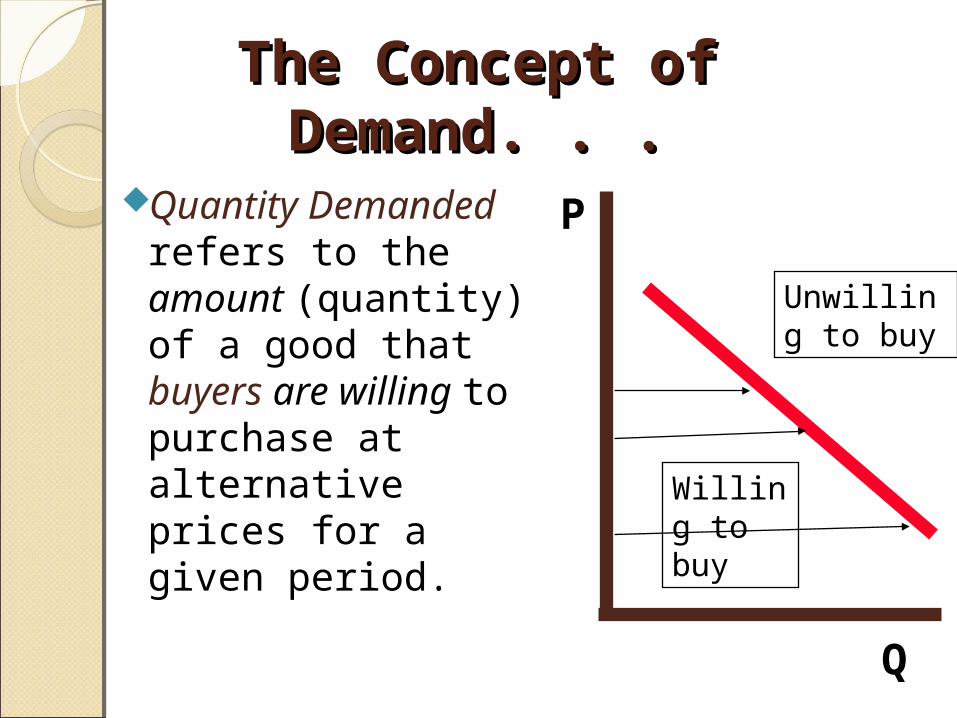
Quantity Demanded refers to the amount (quantity) of a good that buyers are willing to purchase at alternative prices for a given period.
P
Q
Unwilling to buy
Willing to buy
Definition of DemandDefinition of DemandThe demand for a product refers to the amount of it which will be bought per unit of time at a particular price
Demand = Desire + Ability to pay (i.e., Money or Purchasing Power) + Will to spend
Demand is an effective desire, as it is backed by willingness to pay and ability to pay.
Types of DemandTypes of Demand1. Demand for consumers’ goods and
producers’ goods2. Demand for perishable and durable goods3. Autonomous (direct) and derived
(indirect) demand4. Normal/superior and inferior goods5. Necessary, comforts and luxury goods6. Related goods: Substitutes and
complementary goods7. Individual buyer’s demand and all
buyers’ (aggregate / market) demand.8. Firm and Industry demand9. Demand by market segments and by total
market
Consumers’ Goods and Producers’ Consumers’ Goods and Producers’ GoodsGoods
Goods and Services used for final consumption are called consumers’ goods.
These include those consumed by human-beings (e.g. food items, clothes, kitchen tools, residential houses, medicines, and services of teachers, doctors, lawyers, washer men and shoe-makers), animals (e.g. dog food and fish food), birds (e.g. grains), etc.
Producers’ goods refer to the goods used for production of other goods.
Thus, producers’ goods consist of plant and machines, factory buildings, services of business employees, raw-materials, etc.
The distinction is somewhat arbitrary. This is because, whether a good is consumers’ or producers’ depends on its use.
For ex., if a sofa set is used in the drawing room of a house - it is a consumers’ good; while if is a used in the reception room of a business house – it is a producers’ good.
But, the distinction is useful for a proper demand analysis for while the demand for consumers’ goods depends on households’ income, that for producers’ goods varies with the production level, among other things.
Perishable and durable Perishable and durable goodsgoodsBoth consumers’ and producers’
goods are further classified into perishable (non-durable) and durable goods.
In laymen’s language, perishable goods are those which perish or become unusable after sometime, the rest are durable goods.
In economics, perishable goods refer to those goods which can be consumed only once while in case of durable goods, their services only are consumed.
Perishable goods include all services (e.g. services of teachers and doctors), food items, raw-materials, coal, and electricity, while durable goods include plant and machinery, buildings, furniture, automobiles, refrigerators, and fans.
Durable goods pose more complicated problems for demand analysis than do non-durables.
Sales of non-durables are made largely to meet current demands which depends on current conditions.
In contrast, sales of durable goods go partly to satisfy new demand and partly to replace old items.
Further, the letter set of goods are generally more expensive than the former set, and their demand alone is subject to preponment and postponement, depending on current market conditions vis-à-vis expected market conditions in future.
Autonomous (direct) and Autonomous (direct) and Derived (Indirect) DemandDerived (Indirect) Demand
The goods whose demand is not tied with the demand for some other goods are said to have autonomous demand, while the rest have derived demand.
Thus, the demands for all producers’ goods are derived demands, for they are needed in order to obtain consumers or producers goods.
Thus, the demand for goods which fulfill our basic Physiological requirements, are generally included in autonomous demand.
For example; Demand for soap, clothing etc
While the demand for goods for the production of other goods and services are included in derived.
For example; Demand for raw material like steel, cement, plant and machinery etc,
Demand for money which is needed not for its own sake but for its purchasing power, which can buy goods and services.
Similarly, demand for car’s battery or petrol is a derived demand, for it is linked to the demand for a car.
There is hardly anything whose demand is totally independent of any other demand.
But the degree of this dependence varies widely from product to product.
For ex: Demand for petrol is totally linked to the demand for petrol driven vehicles, while the demand for sugar is only loosely linked with the demand for milk.
Goods that are demanded for their own sake have direct demand while goods that are needed in order to obtain some other goods possess indirect demand.
In this sense, all consumers’ goods have direct demands while all producers’ goods, including money, have indirect demand.
Normal/Superior and Normal/Superior and Inferior GoodsInferior Goods
Normal goods, also called as superior goods.
The former are those whose demand increases as income increases, and the latter are those whose demand falls as income goes up, and vice versa.
For example, milk, refrigerator, television, education, and the good quality of food grains and clothes are superior goods while the poor quality of food grains and clothes are inferior goods.
In other words, the superior goods are the ones which the rich people consume while the inferior goods are for the poor people’s consumption.
Further, these are relative concepts.
Thus, for example, scooter/bike is a superior good in relation to a cycle, while it is an inferior good relative to a car.
Necessary, comforts and Luxury Necessary, comforts and Luxury GoodsGoods
In common sense, the necessary goods are essential for existence, comforts goods make the life comfortable and luxury goods are luxuries of life.
However, in economics they have special meanings.
These all are considered as superior goods but of different degrees.
Thus, as the consumers income rise, more of each of these three kinds of goods is consumed but the proportion of the consumption budgets differ.
In case of necessary goods, as income increases, while the consumption expenditure on them increases, the percentage of total expenditure/income spent on each of them goes down.
In case of comforts, the said percentage remains the same, while in case of luxuries, it goes up.
In general, ordinary foods, drinks, clothing, some education and medical aids are considered as necessary.

Some means of transport, good quality of food, drinks and clothing, tourism, etc. are taken as comforts.
Luxuries include foods in high end hotels, designers clothing, specious residences, foreign touruism, and so on.
Substitute and Complementary Substitute and Complementary GoodsGoods
Goods which crated joint demand are complementary goods.
Therefore demand for one commodity is dependent upon demand for the other one.
For ex: pen and ink, printer and ink cartridge, computer and software, car and petrol(diesel) etc.
Goods that complete with each other to satisfy any particular want are called substitute.
Also, note that the degree of substitution might vary form product to product.
Substitute and Complementary Substitute and Complementary GoodsGoods
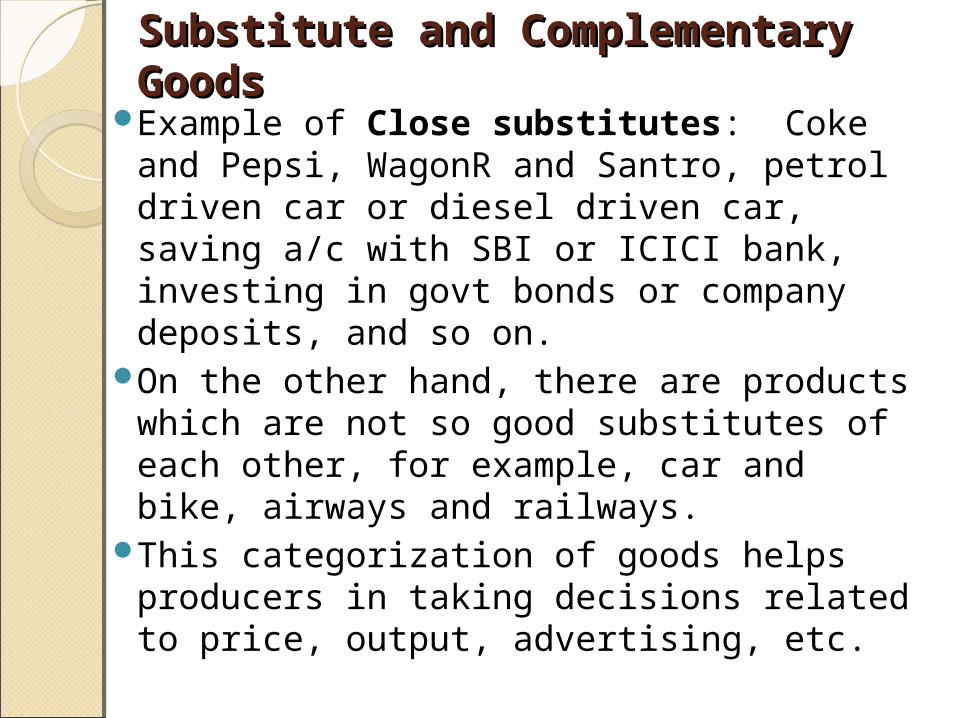
Example of Close substitutes: Coke and Pepsi, WagonR and Santro, petrol driven car or diesel driven car, saving a/c with SBI or ICICI bank, investing in govt bonds or company deposits, and so on.
On the other hand, there are products which are not so good substitutes of each other, for example, car and bike, airways and railways.
This categorization of goods helps producers in taking decisions related to price, output, advertising, etc.
Individual’s Demand and Individual’s Demand and Market DemandMarket Demand
The demand for a good by an individual buyer is called individual’s demand while the demand for a good by all buyers in a market is called market demand.
For ex, if the milk market consisted of, say, only three buyers, then individuals and market demand (monthly) could be as follows.
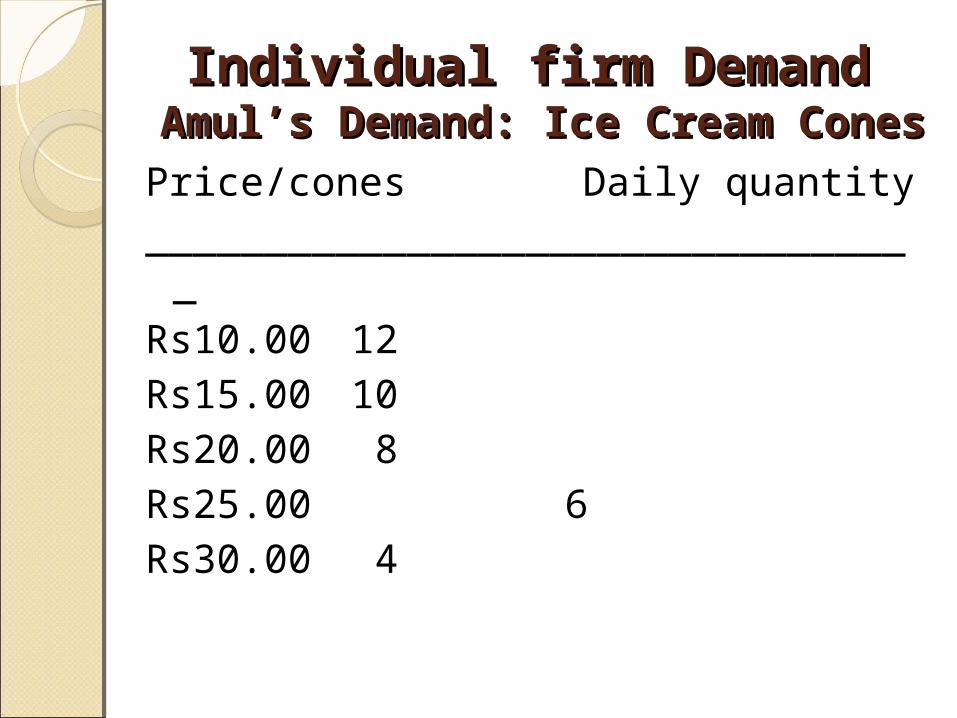
Individual firm Demand Individual firm Demand Amul’s Demand: Ice Cream ConesAmul’s Demand: Ice Cream ConesPrice/cones Daily quantity_________________________________
Rs10.00 12Rs15.00 10Rs20.00 8Rs25.00 6Rs30.00 4
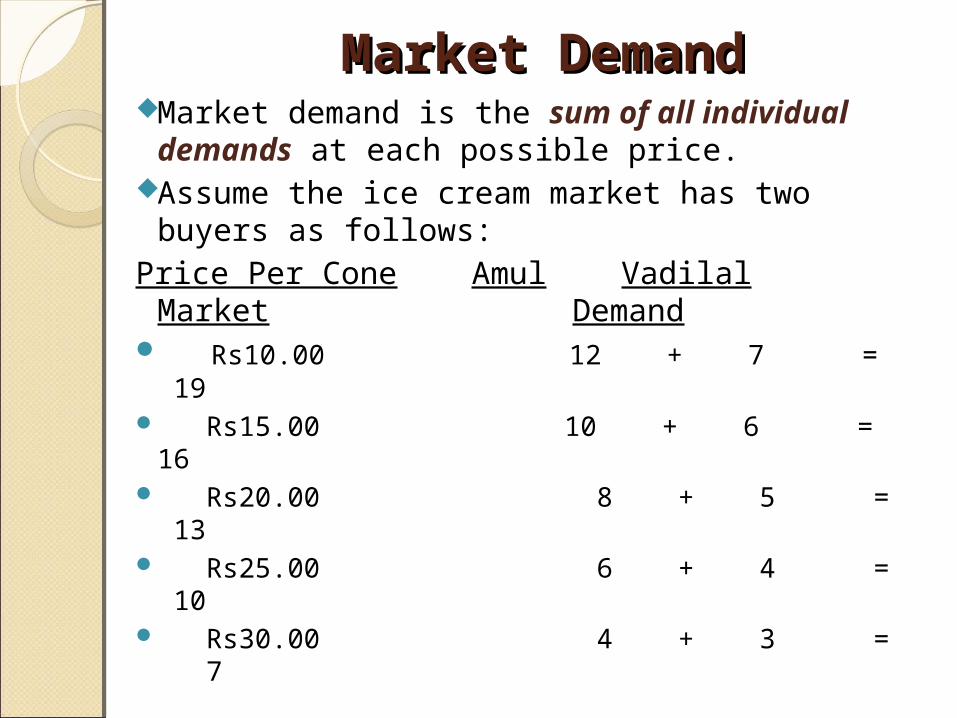
Market DemandMarket DemandMarket demand is the sum of all individual
demands at each possible price.Assume the ice cream market has two buyers as follows:
Price Per Cone Amul Vadilal Market Demand
Rs10.00 12 + 7 = 19
Rs15.00 10 + 6 = 16
Rs20.00 8 + 5 = 13
Rs25.00 6 + 4 = 10
Rs30.00 4 + 3 = 7
Firm and Industry DemandFirm and Industry DemandMost goods today are produced by more than one firm and so there is a difference between the demand facing an individual firm and that facing an industry (all firms producing a particular good constitute an industry engaged in the production of that good).
For ex: Cars in India are manufactured by Maruti Suzuki, TATA motors, Hindustan Motors, Premier Automobiles, and Standard Motor Products of India.
Demand for Maruti car alone is a firm’s (company) demand where as demand for all kinds of cars is industry’s demand.
Similarly, demand for Godrej refrigerators is a firm’s demand while that for all brands of refrigerators is the industry’s demand.
Demand by Market Segments Demand by Market Segments and by Total Marketand by Total Market
The market demand is the total demand for the product in the market. It is the sum (total) of the demand of a product by all the consumers in the market.
In managerial economic the total market demand concept is having very less importance.
On the other hand demand by segment is the entire market is divided into different groups on the basic of location, demography, life style and behavior of the consumers in the classification is more meaningful in managerial economics.
The demand condition in each segment is different from other, which provides better guidance for the manager in understanding the different class of consumers.
Recurring and Recurring and Replacement DemandReplacement DemandConsumer goods can be further divided into consumable goods and durable goods. Consumable goods have recurring demand, i.e. they are consumed at frequent intervals, like eat food twice a day, take tea and snacks three to four times a day, read newspaper everyday, fill petrol in your vehicle every week, etc.
Durable consumer goods are purchased to be used for a long time but they need replacement.
For ex : car, mobile, furniture, house etc.
Why Demand Analysis is Why Demand Analysis is needed?needed?
Demand analysis is needed basically for three purpose:
1.To provide the basis for analyzing market influences on the demand
2.To provide the guidance for manipulating the demand
3.To guide in production planning through forecasting the demand
Demand FunctionDemand FunctionA function is that which describes the relationship between a variable (dependent variable) and its determinants (independent variables).
Thus, the demand function for a good relates the quantities of a goods which consumers demand during some specific period to the factors which influence that demand.
Mathematically, the demand function for a goods x can be expressed as follows:
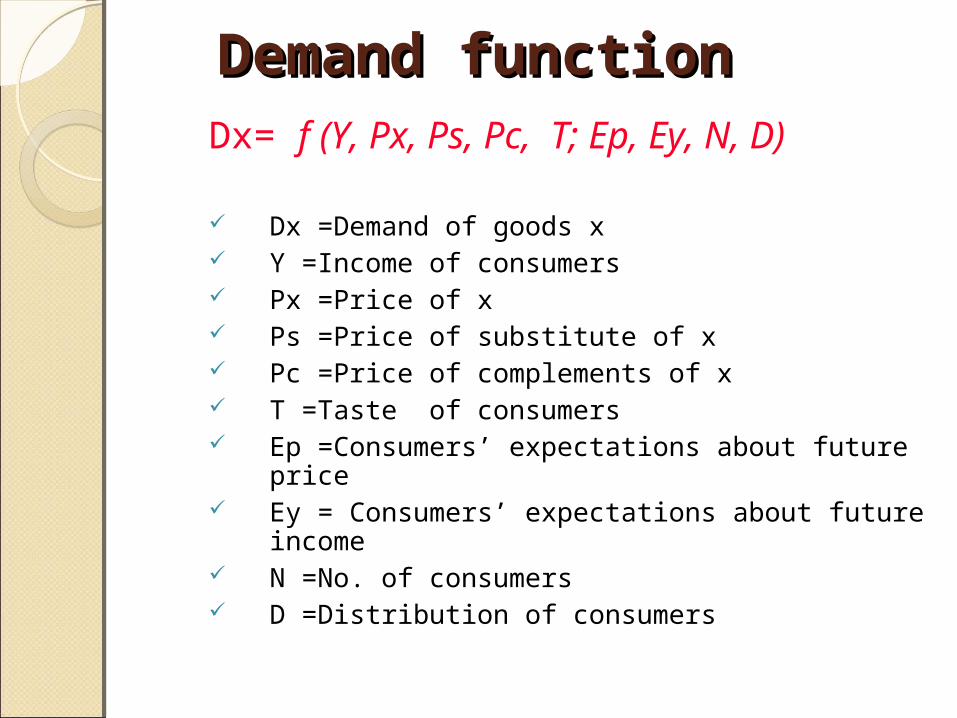
Demand functionDemand functionDx= f (Y, Px, Ps, Pc, T; Ep, Ey, N, D)
Dx =Demand of goods x Y =Income of consumers Px =Price of x Ps =Price of substitute of x Pc =Price of complements of x T =Taste of consumers Ep =Consumers’ expectations about future
price Ey = Consumers’ expectations about future
income N =No. of consumers D =Distribution of consumers
The first five determinants affect the demand for all goods, the next two are influence mainly on the demand for durable and expensive goods, and the next tow are arguments only in the demand functions for a group of consumers.
The impact of these determinants on Demand is
1) Price effect on demand: Demand for x is inversely related to its own price.
2) Substitution effect on demand: If y is a substitute of x, then as price of y increases, demand for x also increases.
3) Complementary effect on demand: If z is a complement of x, then as the price of z falls, the demand for z goes up and thus the demand for x also tends to rise.
4)Price expectation effect on demand: Here the relation may not be definite as the psychology of the consumer comes into play.
5) Income effect on demand: As income rises, consumers buy more of normal goods (positive effect) and less of inferior goods (negative effect).
6) Promotional effect on demand: Advertisement increases the sale of a firm up to a point.
Socio-psychological determinants of demand like tastes and preferences, custom, habits, etc.
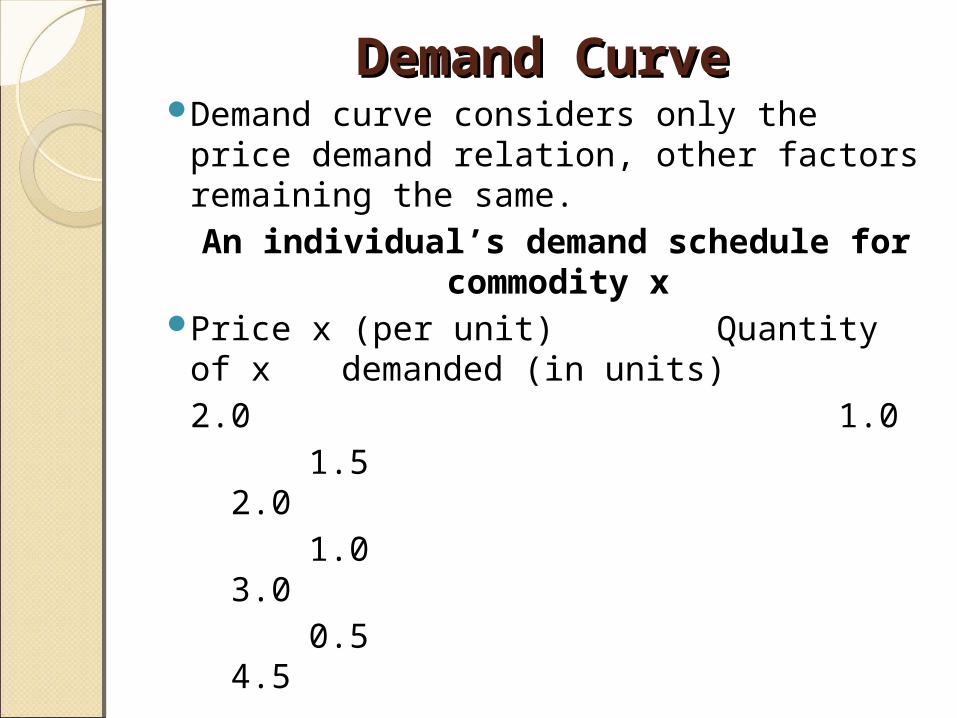
Demand CurveDemand CurveDemand curve considers only the price demand relation, other factors remaining the same. An individual’s demand schedule for
commodity xPrice x (per unit) Quantity of x demanded (in units)2.0 1.0
1.5 2.0
1.0 3.0
0.5 4.5
The demand curve is negatively sloped, indicating that the individual purchases more of the commodity per time period at lower prices.
The inverse relationship between the price of the commodity and the quantity demanded per time period is referred to as the law of demand.
A fall in Px leads to an increase in Dx because of the substitution effect and income effect.
Determinants of DemandDeterminants of DemandProduct’s Own PriceConsumer IncomePrices of Related GoodsTastes & preferencesExpectations about future price &
incomeNumber of Consumers & their
Distribution
Law of DemandLaw of DemandLaw of demand states that, ceteris paribus, demand for a product is inversely proportional to its price.
Price of the product is the most important variable of a product’s demand. i.e. Dx = f(Px)
Law of Diminishing Marginal Utility:According to this law, the consumer consumes successive units of a commodity, the utility derived from each additional unit (marginal unit) goes on falling. Hence, the consumer would purchase only as many units of the commodity, where the marginal utility of the commodity is equal to its price.
Demand Schedule and Demand Schedule and Demand CurveDemand CurveDemand Schedule is the list or tabular statement of the different combinations of price and quantity demanded of a commodity.
Demand curve shows the relationship between price of a good and the quantity demanded by consumers.
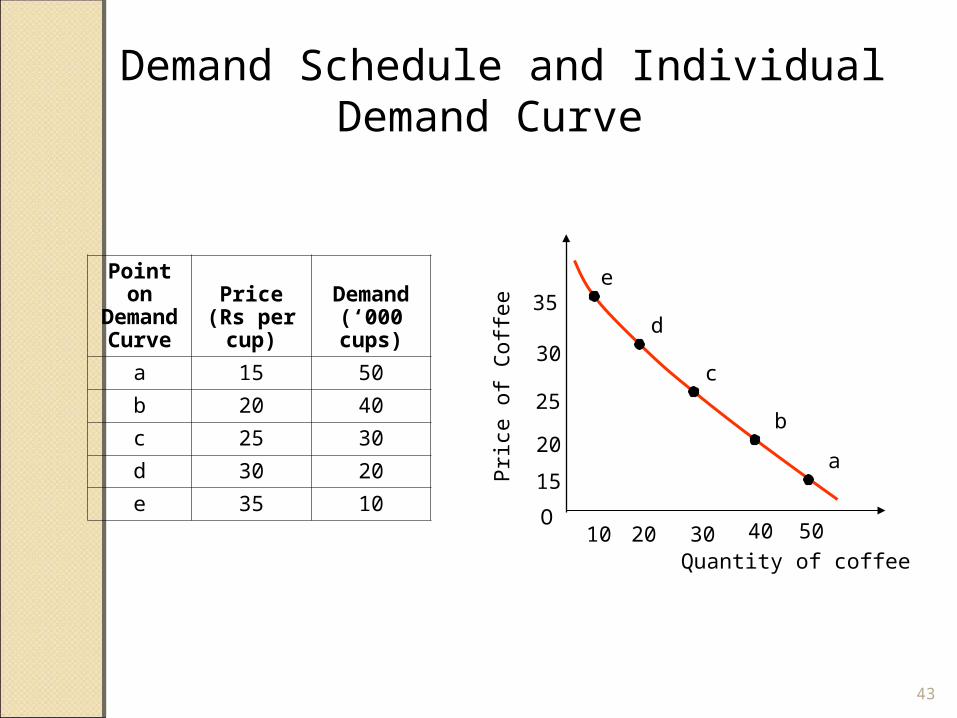
Demand Schedule and Individual Demand Curve
Point on
Demand Curve
Price (Rs per cup)
Demand (‘000 cups)
a 15 50b 20 40c 25 30d 30 20e 35 10
e
ba
c
10 20 30
1520
30
35
5040
25
Quantity of coffee
Pric
e of
Cof
fee
O
d
43
Law of SupplyLaw of SupplyAny discussion on demand cannot be complete without understanding supply.
Demand and Supply are like two sides of a coin or two blades of scissors.
Demand indicates the willingness of a purchaser to buy a particular commodity, supply means the willingness of the firms to sell a particular commodity.
Supply refers to the quantities of a good or service that the seller is willing and able to provide at a price, at a given point of time, ceteris paribus.
The Law of supply states that other things remaining the same, the higher the price of a commodity, the grater is the quantity supplied.
Supply Function:Sx = f(Px, C, T, G, N)
Where C= Cost of Production(wages, interest, rent and price of raw materials)
T = State of technologyG = Govt. policy regarding taxes and subsidies
N = No. of firms
Determinants of SupplyDeterminants of SupplySupply is positively related to price of the commodity.
Supply is reduced if the cost of production rises.
Technology bears a positive relationship with supply. An improved techology reduces cost of production per unit of output, enhances productivity and thus increases the supply of the product.
Government policies related to taxes and subsidies on certain products also have an effect on supply as they increase or decrease the cost. Such effects may be either negative (in case of taxes) or positive (in case of subsidies).
No of firms: With increase in the number of producers of a particular product, the supply of the product in the market will increase.
If entry is unrestricted, new firms will continue to enter the market, thus increasing supply and degree of competition. (Perfectly Competitive market, in the long run, as more firms enter into the industry, the aggregate supply curve of the product shifts to the right (or left) due to an increase in the supply of the product.)
Shift in Demand CurveShift in Demand CurveShift of demand curve due to a change in any of the factors other than price is a change in demand.
When demand increases without any change in price, the demand curve will shift to the right, and with a reduction in demand, the curve will shift to the left.
Demand curve shifts to the right if income rises and shifts to the left if income falls, ceteris paribus.
Change in Demand
D1
D2
D0
Price
Quantity0
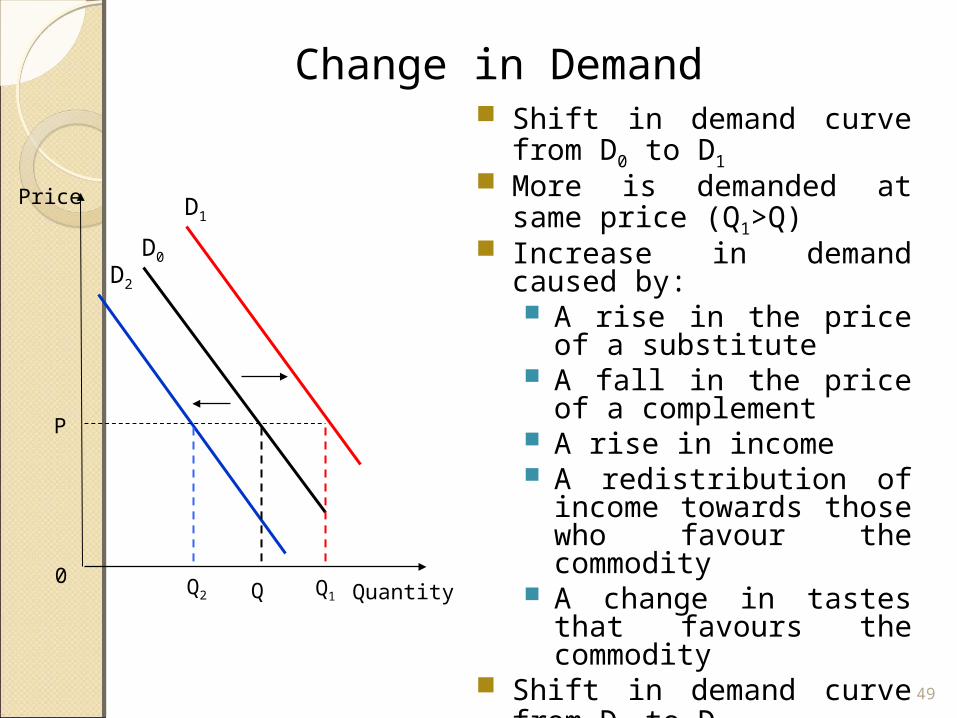
Shift in demand curve from D0 to D1
More is demanded at same price (Q1>Q)
Increase in demand caused by: A rise in the price of a substitute
A fall in the price of a complement
A rise in income A redistribution of income towards those who favour the commodity
A change in tastes that favours the commodity
Shift in demand curve from D0 to D2
Less is demanded at each price (Q2<Q)
P
Q1QQ2
49
Concept of ElasticityConcept of ElasticityElasticity can be defined as “the proportionate change in demand of product in response to the proportionate change in any of the factors affecting demand”. The benefit of concept of elasticity that it shows the amount of change in the demand.
When the law of demand only shows the direction of change in demand, the elasticity of demand shows the direction as well as the % change in demand. So, Elasticity of demand is more useful concept than price.
Concept of ElasticityConcept of ElasticityElasticity is a measure of the sensitiveness of one variable to changes in some other variable.
It is expressed in terms of a percentage and is devoid of any unit of measurement.
Elasticity of a variable x with respect to variable y is expressed as ex,y.
ex,y = % change in x % change in y
Demand ElasticitiesDemand ElasticitiesDemand elasticities refer to elasticities of demand for a good with respect to each of the determinants of its demand.
1.Price elasticity of demand2.Income elasticity of demand3.Cross elasticity of demand4.Promotional elasticity of demand
Price elasticity of Price elasticity of demanddemand
Price elasticity can be defined as “the proportionate change in demand of product in response to the proportionate change in price of a product.’
Ep= % change in demand of X % change in price of XPrice Elasticity of Demand is negative since there is an inverse [negative] relationship between price and the demand of the product. If price increase, demand decrease, if price decrease, demand increases.
Types of price elasticity1.Perfectly elastic demand ( e = α)When an insignificant or minor change in the price will result in an extra ordinary large change in demand, the demand is said to be a perfectly elastic. A slight change means a slight decrease in the price will result in the increase in demand to infinity and a slight increase in the price will lead to the decrease in demand to ‘0’. But in actual situation the demand cannot be perfectly elastic.
2. Perfectly inelastic demand: (e = 0)
When the demand for the commodity remains constant irrespective of the change in the price of commodity.
There is hardly any commodity in the world for which this is true.
For ex: salt. Salt is an inexpensive and yet an essential consumption item and its consumption can vary only within a small range.
For this reason alone, its consumption hardly varies with variations in its price.
3. Unitary elastic demand: (e = 1)When the percentage change in the price of a commodity brings about the same percentage change in the demand of the commodity, the demand is said to be unitary elastic. For, e.g., 5% increase or decrease in the price will result in 5% decrease or increase in demand for the commodity.
4. Elastic demand [ e > l ]In this case changes in price leads to a more than proportionate change in demand. For, e.g., if the price of commodity X changes by 2 %, the demand for X will change by more than 2%.
Most luxury items have elastic demands.
5. Inelastic demand [ e < l ]In this case changes in price leads to a less than proportionate change in demand. For, e.g., if the price changes 2% the demand changes by less than 2%.
A large number of goods and services, which include all the essential items, have inelastic demand.
Income Elasticity of Income Elasticity of DemandDemand
We know the income of the consumer is an important determinant of demand.
Although income does not vary in the short run, its impact on long term demand analysis in very crucial.
Therefore it is useful to learn income elasticity of demand (ey).
Income elasticity of demand measures the degree of responsiveness of demand for a commodity to a given change in consumer’s income.
Assume that all other variables are ceteris paribus.
Income elasticity of Income elasticity of demanddemand
The Income Elasticity expresses the relationship between the % change in income and corresponding % change in demand for a particular commodity.
It measure the % change in demand due to % change in the income of consumers
ey = % change in demand of X % change in income of consumer
ey = Q2 – Q1/Q1 Y2 – Y1/ Y1
Degrees of Income Degrees of Income ElasticityElasticity
Income elasticity of demand also has similar degrees of price elasticity of demand, namely perfectly elastic, perfectly inelastic, relatively elastic, relatively inelastic and unitary elastic.
Hence, when the proportionate change in demand is more than that in income, demand is highly elastic; when the proportionate change in demand is less than that of income, demand is highly inelastic.
Normally the demand for commodity has a tendency to increase as income increases, so income Elasticity is generally positive, but this may not be saw in case of inferior goods.
The demand for inferior goods reduces as the income of the consumer increases because higher income leads to the use of superior quality of goods.
Hence the value of income elasticity can be either negative or positive, depending upon nature of product.
Degrees of Income Degrees of Income ElasticityElasticity
1. Positive Income Elasticity
2. Zero Income Elasticity3. Negative Income
Elasticity
Positive Income Positive Income ElasticityElasticity
A good that has positive income elasticity is regarded as normal good.
A normal good is one which a consumer buys in more quantities when his income increases.
Ex : Clothes, fruits, jewellery, etc.
Zero Income ElasticityZero Income ElasticityZero income elasticity implies that there is no change in the demand for a commodity when there is a change in income. Such goods are called neutral goods.
Ex: match box, salt, needles, postcard etc.
Negative Income Negative Income ElasticityElasticity
It implies that demand for a commodity decreases as the income of the consumer increases.
A good that has negative income elasticity of demand is regarded as an inferior good. i.e. The consumer buys less of such a good when his income increases and consumer would switch over consumption to superior quality of good with increase in income.
Ex : Poor quality of food, clothes etc.
Income Elasticity of demand is-Positive for superior /normal goods
Negative for interior goodPositive and More than 1 for all luxuries goods
Positive and around unity for all comforts goods.
Positive and Less than 1 for all superior and necesssary goods
May be 0 for the products like salt, match box, needle, etc
Cross Elasticity of Cross Elasticity of DemandDemand
Demand for commodity is influents not only by price commodity and income, but also by the price of other commodity. It expresses the relationship between a change in demand for a commodity due to change in the price of some other commodity. It measures the proportionate change in demand due to proportionate change in price of some other commodity. Ec of product is negative. For, e.g., tea & coffee in case of substitute goods.
Ey = % change in demand of X % change in Price of YIt is positive if goods x and y are substitutes in the consumption basket, negative if they are complements, and zero if the two goods are unrelated.
The greater the magnitude of this elasticity, the stornger is the relationship between two goods.
Positive Cross Elasticity:- Substitute goods are those which compact with each other. For, e.g., tea, coffee etc. For substitutes goods the cross elasticity is positive.
Generally if the price of tea falls, the demand of tea rise and at the same, time tea become cheaper than coffee. So, some of the customer currently consuming coffee will start consuming tea instead of coffee. So the demand of coffee reduces.
For substitutes quantity demanded of one good moves in the same direction as the price of the other.
Ex : coke and pepsi, zen and santro, etc.
Negative Cross Elasticity:Complementary goods are those goods which have to be consumed simultaneously it means if a consumer wants to consume one product he has to consume other product.
For complements, quantity demanded of one good moves in the opposite direction as the price of the other.
For, e.g., car & petrol. Elasticity for complementary goods is negative. If the price of car reduces, the demand for it increases and at the same time the requirement of petrol also increases, which will increases the demand for it.
Ex: bread and butter, tea and sugar, pen and ink, etc.
Zero Cross elasticity:Ec for unrelated goods is zero because one commodity does not affect the other commodity if the price of one commodity changes it will not affect the demand for other commodity. If the price of tea changes by 2% it will not create any affect on the demand of clothes.
Promotional Elasticity Promotional Elasticity of Demandof Demand
Advertising and promotion are vital tools in the competitive market to generate awareness about its products.
Promotional elasticity of demand measures the degree of responsiveness of demand to a given change in advertising expenditure.
It must obviously be positive, for advertisement expenditures are supposed to boost up the market.
Some goods (like consumer goods) are more responsive to advertising than others (like heavy capital equipments)
When Ea > 1, a firm should go for heavy expenditure on advertisement.
When Ea < 1, a firm should not spent too much on advertisement because the product is not sensitive to promotion.
For Ex: we find the advertisement for lubricants, generators, inverters, etc. but would not find advertisements for electricity, petrol or diesel.
Related Documents


