Delta Air Lines Raymond James 41st Annual Institutional Investors Conference Paul Jacobson, Chief Financial Officer March 2, 2020

Welcome message from author
This document is posted to help you gain knowledge. Please leave a comment to let me know what you think about it! Share it to your friends and learn new things together.
Transcript

Delta Air Lines
Raymond James 41st Annual Institutional Investors Conference
Paul Jacobson, Chief Financial Officer
March 2, 2020

Safe Harbor
2
Statements in this presentation that are not historical facts, including statements regarding our estimates, expectations, beliefs, intentions,
projections or strategies for the future, may be "forward-looking statements" as defined in the Private Securities Litigation Reform Act of 1995.
All forward-looking statements involve a number of risks and uncertainties that could cause actual results to differ materially from the
estimates, expectations, beliefs, intentions, projections and strategies reflected in or suggested by the forward-looking statements. These
risks and uncertainties include, but are not limited to, the cost of aircraft fuel; the availability of aircraft fuel; the impact of fuel hedging activity
including rebalancing our hedge portfolio, recording mark-to-market adjustments or posting collateral in connection with our fuel hedge
contracts; the performance of our significant investments in airlines in other parts of the world; the possible effects of accidents involving our
aircraft; breaches or security lapses in our information technology systems; disruptions in our information technology infrastructure; our
dependence on technology in our operations; the restrictions that financial covenants in our financing agreements could have on our financial
and business operations; labor issues; the effects of weather, natural disasters and seasonality on our business; the effects of an extended
disruption in services provided by third parties; failure or inability of insurance to cover a significant liability at Monroe’s Trainer refinery; the
impact of environmental regulation on the Trainer refinery, including costs related to renewable fuel standard regulations; our ability to retain
senior management and key employees; damage to our reputation and brand if we are exposed to significant adverse publicity through social
media; the effects of terrorist attacks or geopolitical conflict; competitive conditions in the airline industry; interruptions or disruptions in service
at major airports at which we operate; the effects of extensive government regulation on our business; the sensitivity of the airline industry to
prolonged periods of stagnant or weak economic conditions; uncertainty in economic conditions and regulatory environment in the United
Kingdom related to the exit of the United Kingdom from the European Union; and the effects of the rapid spread of contagious illnesses.
Additional information concerning risks and uncertainties that could cause differences between actual results and forward-looking statements
is contained in our Securities and Exchange Commission filings, including our Annual Report on Form 10-K for the fiscal year ended
December 31, 2019. Caution should be taken not to place undue reliance on our forward-looking statements, which represent our views only
as of March 2, 2020, and which we have no current intention to update.
Established
Solid Foundation2009 - 2013
Momentum Building Following Transformational Decade
3
Accelerating
Our Momentum2019 and beyond
Strengthened
Competitive Advantages2014 - 2018
Delta’s Unique Culture Underpins our Success
• Created more customer-
focused operation
• Improved product, reliability
and service
• Deployed opportunistic fleet
strategy
• Achieved investment grade
rating
• Established shareholder
return program
• Pioneered multi-class product
segmentation
• Strengthened global presence
and domestic footprint
• Established industry-leading
operational reliability
• Improved NPS and grew
revenue premium
• Delivered strong financial
performance
• Diversifying revenue stream
• Leveraging scale
• Delivering personalization
• Driving efficiency through fleet
transformation
• Increasing commitment to
environmental sustainability
• Maintaining financial
leadership position

Strong 2019 Financial Performance Caps Decade of Transformation
Note: Adjusted for special items; non-GAAP financial measures reconciled in Appendix
4
Fifth consecutive year >$5 billion
$1.5B
$5.3B
$6.2B
2010 2017 2019
Targeting ~70%of FCF to owners withsteady dividend growth
$2.4B
$3.0B
2010 2017 2019
Pre-Tax Profit
Returns to Shareholders
$2.8B
$6.8B
$8.5B
2010 2017 2019
Operating Cash Flow
Consistent reinvestment and
shareholder returns
$0B

6%
8%
5%
18%
63%
Ancillary and Cargo
Travel Related Services
Loyalty Program
Premium Products
Main Cabin
Building Durability through Healthy and Diverse Revenue Streams
5In
du
str
y
2019$47B
Ge
og
rap
hy
Lo
ya
lty
Corporate Revenue Mix by Sector
Top Sectors
1. Manufacturing (16%)
2. Financial Services (14%)
3. Technology (14%)
Domestic (72%)
Atlantic (15%)
Latin (7%)
Pacific (6%)
Ticket Revenue Mix by Entity
Ticket Revenue Mix by SkyMiles Status
Medallion (30%)
General Member (34%)
Non Member (36%)
47%
32%
10%
5%
6%
Note: All figures based on 2019
2011$35B

Committing $1 Billion Over Next Ten Years to Become First Carbon Neutral Airline Globally
6
• Investment will drive innovation, advance clean air
travel technologies, accelerate the reduction of carbon
emissions and waste, and establish new projects to
mitigate the balance of emissions
• Efforts towards carbon neutrality focused on:
‒ Carbon reduction – Including an ambitious fleet
renewal program, improved flight operations,
weight reduction, and increased development and
use of sustainable aviation fuels
‒ Carbon removal – Investigating opportunities
through forestry, wetland restoration, grassland
conservation, marine and soil capture
‒ Stakeholder engagement – Building coalitions to
maximize our global impact

Balanced Capital Allocation Priorities
7
1 Reinvest inthe Business
Renewing Delta’s fleet with
more efficient next-generation
aircraft, while investing in
facilities and technology for
future growth
Maintain Investment Grade Balance Sheet2
Targeting adjusted debt to
EBITDAR range of 1.5x -
2.5x, supporting investment
grade rating through the
economic cycle
Return Cashto Owners3
Consistently returning cash to
shareholders, targeting 70%
of free cash flow returned to
owners annually
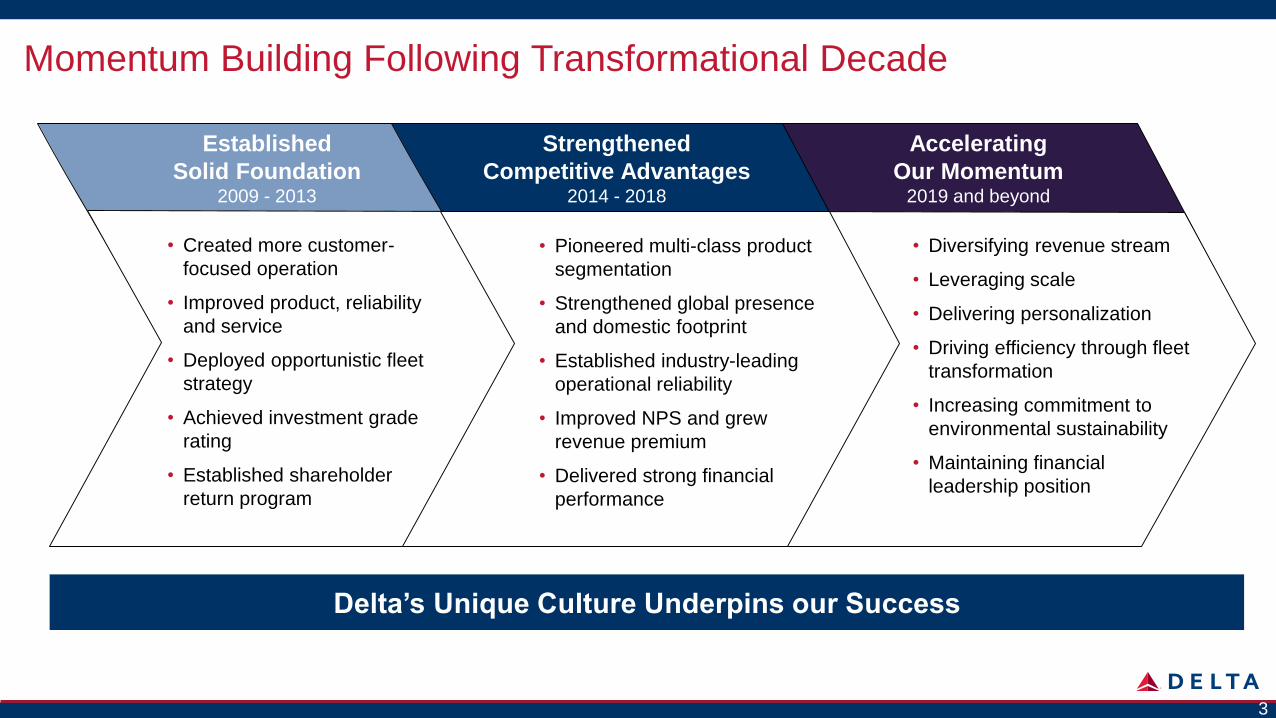
Our Investments are Driving Strong Returns
• Approximately 500 basis points of ROIC
improvement on a $17 billion increase in
invested capital base since 2010
• Compounding benefits of reinvestment
support long-term growth
ROIC and Invested Capital
$17B
$34B~11%
~16%
2010 2019
Invested Capital ROIC, after-tax
8
Note: Adjusted for special items; non-GAAP financial measures reconciled in Appendix
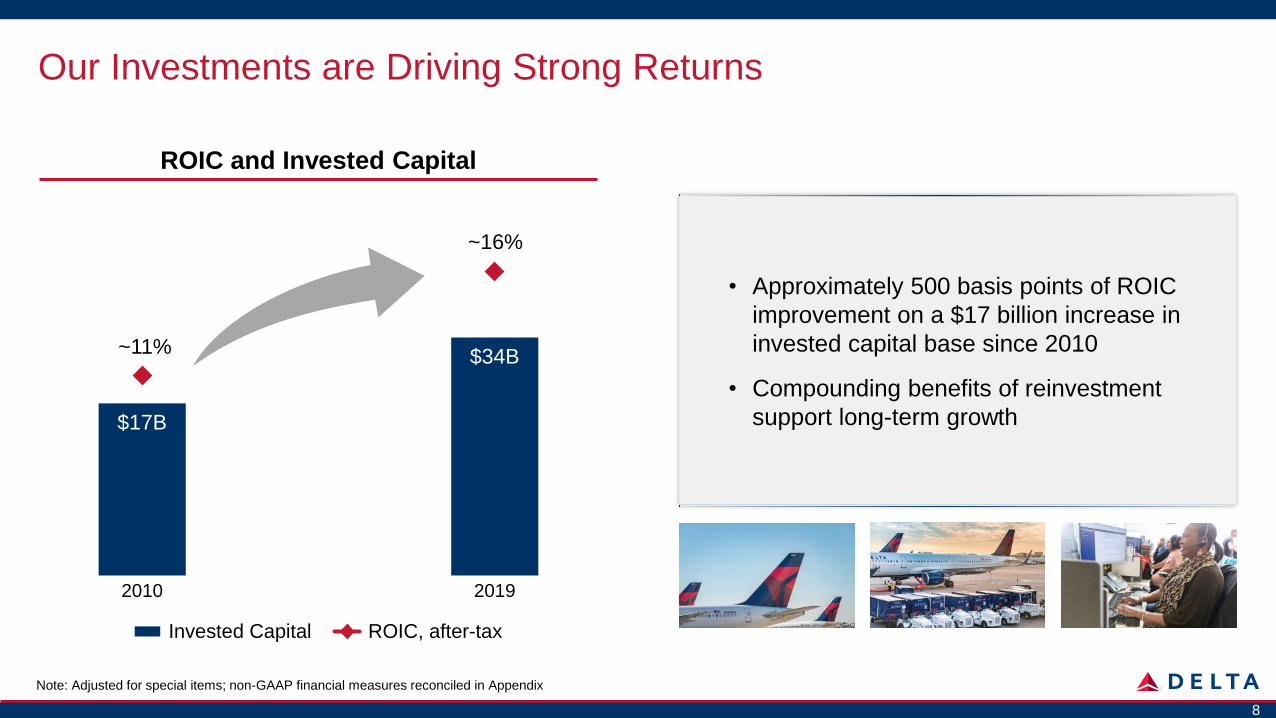
I N V E S T M E N T T H E S I S
Delta is a Compelling Long-Term Investment Opportunity
9
Powerful Brand
With Industry-
leading Returns
Strong Partner
Portfolio and
Global Scale
Unmatched
Competitive
Advantages
Proven Track Record
of Execution &
Reinvestment
Record customer
satisfaction
Durable revenue and
margin premium
Consistent returns to
owners since 2013
Global relevance with
partner network
covering 98% of GDP
Expanding footprint
and deepening
integration with JV
partners
Engaged and
empowered people
Unique loyalty and co-
brand program
Extending our lead by
investing for the future
Consistent operational
excellence
Best-in-class products
and service
Improving ROIC on a
growing capital base

Non-GAAP Reconciliations
10
Non-GAAP Financial Measures
The following tables show reconciliations of non-GAAP financial measures. The reasons Delta uses these measures are described below. Reconciliations may not calculate due to rounding.
Delta sometimes uses information ("non-GAAP financial measures") that is derived from the Consolidated Financial Statements, but that is not presented in accordance with accounting principles
generally accepted in the U.S. (“GAAP”). Under the U.S. Securities and Exchange Commission rules, non-GAAP financial measures may be considered in addition to results prepared in accordance
with GAAP, but should not be considered a substitute for or superior to GAAP results. The tables below show reconciliations of non-GAAP financial measures used in this presentation to the most
directly comparable GAAP financial measures.
Forward Looking Projections. While we are able to reconcile forward looking non-GAAP financial measures related to 2019, we do not reconcile future period measures (i.e., beyond 2019) because
the adjusting items such as those used in the reconciliations below will not be known until the end of the period and could be significant.

We adjust pre-tax income and net income for the following items to determine pre-tax income and net income, adjusted for the reasons described below. We include the income tax effect of adjustments
when presenting net income, adjusted.
MTM adjustments and settlements. Mark-to-market ("MTM") adjustments are defined as fair value changes recorded in periods other than the settlement period. Such fair value changes are not
necessarily indicative of the actual settlement value of the underlying hedge in the contract settlement period. Settlements represent cash received or paid on hedge contracts settled during the
period.
Equity investment MTM adjustments. We record our proportionate share of earnings/loss from our equity investments in Virgin Atlantic and Aeroméxico in non-operating expense. We adjust for
our equity method investees' MTM adjustments to allow investors to understand and analyze our core financial performance in the periods shown.
Restructuring and other and Loss on extinguishment of debt. Because of the variability from period to period, the adjustments for these items are helpful to investors to analyze the company’s
core operational performance in the periods shown.
Pre-Tax Income and Net Income, Adjusted
Non-GAAP Reconciliations
11
Year Ended Year Ended
December 31, 2017 December 31, 2010
5.5$ 0.6$
(0.3) -
0.1 -
0.5
0.4
(0.2) 0.9
5.3$ 1.5$
(in billions)
GAAP
Adjusted for:
MTM adjustments and settlements on hedges
Equity investment MTM adjustments
Total adjustments
Non-GAAP
Restructuring and other
Loss on extinguishment of debt

We present operating cash flow, adjusted because management believes adjusting for the following items provides a more meaningful measure for investors. Adjustments include:
Hedge deferrals, including early settlements. During the March 2015 quarter, we effectively deferred settlement of a portion of our fuel hedge portfolio by entering into transactions that, excluding
market movements from the date of inception, would provide approximately $300 million in cash receipts during the second half of 2015 and require approximately $300 million in cash payments
in 2016. During the March 2016 quarter, we further deferred settlement of a portion of our hedge portfolio until 2017 by entering into transactions that, excluding market movements from the date
of inception, would provide approximately $300 million in cash receipts during the second half of 2016 and require approximately $300 million in cash payments in 2017. Operating cash flow is
adjusted to include the impact of these deferral transactions in order to allow investors to better understand the net impact of hedging activities in the periods shown.
Hedge margin and other. Operating cash flow is adjusted for hedge margin as we believe this adjustment removes the impact of market volatility on our unsettled hedges and allows investors to
better understand and analyze the company’s core operational performance in the periods shown.
Reimbursements from third parties related to build-to-suit facilities and other. Management believes investors should be informed that these reimbursements for build-to-suit leased facilities
effectively reduce net cash provided by operating activities and related capital expenditures.
Pension plan contribution. In 2017, we contributed $2 billion to our pension plans using net proceeds from our debt issuance. We adjusted operating cash flow to exclude this contribution to
allow investors to understand the cash flows related to our core operations in the periods shown.
Operating Cash Flow, Adjusted
Non-GAAP Reconciliations
12
Year Ended Year Ended
(in billions) December 31, 2019 December 31, 2017
Net cash provided by operating activities (GAAP) 8.4$ 5.0$
Adjustments:
Hedge deferrals, including early settlements — (0.2)
Hedge margin and other — —
Reimbursements from third parties related to build-to-suit leased facilities and other (0.1) —
Pension plan contribution — 2.0
Net cash provided by operating activities, adjusted 8.5$ 6.8$

We present after-tax return on invested capital as management believes this metric is helpful to investors in assessing the company's ability to generate returns using its invested capital as a measure
against the industry. Return on invested capital is tax-effected adjusted total pre-tax income divided by average adjusted invested capital. Average adjusted invested capital represents the sum of the
adjusted book value of equity at the end of the last five quarters, adjusted for pension and fuel hedge impacts within other comprehensive income. Average adjusted gross debt is calculated using
amounts as of the end of the last five quarters. All adjustments to calculate ROIC are intended to provide a more meaningful comparison of our results to the airline industry.
After-Tax Return on Invested Capital
Non-GAAP Reconciliations
13
(in billions except %) December 31, 2019 December 31, 2010
Pre-tax income 6.2$ 0.6$
Adjusted for:
Restructuring and other — 0.5
Loss on extinguishment of debt — 0.4
Interest expense, net 0.3 1.2
Interest expense included in aircraft rent 0.3 0.2
Amortization of retirement actuarial losses 0.3 —
Pre-tax adjusted income 7.1$ 2.9$
Tax effect (1.6) (1.0)
Tax-effected adjusted total pre-tax income 5.5$ 1.9$
Adjusted book value of equity 22.1 0.9
Average adjusted gross debt 11.7 15.9
Averaged adjusted invested capital 33.9$ 16.8$
After-tax return (Tax-effected adjusted total pre-tax income) 16.2% 11.3%
Change year-over-year 490 basis pts
Change year-over-year in invested capital base 17.1$
Last Twelve Months Ended
Related Documents