THIRD QUARTER 2009 By Wayne W. Eckerson BEYOND REPORTING Delivering Insights with Next-Generation Analytics www.tdwi.org TDWI BEST PRACTICES REPORT

Welcome message from author
This document is posted to help you gain knowledge. Please leave a comment to let me know what you think about it! Share it to your friends and learn new things together.
Transcript

t hird qua r t er 2009
By Wayne W. Eckerson
be yond report ingDelivering Insights with Next-Generation Analytics
www.tdwi.org
TDWI besT pracTIces reporT
Research Sponsors
ADVIZOR Solutions, Inc.
MicroStrategy
Oracle
SAP
SAS
Tableau Software
Teradata Corporation
TIBCO Spotfire

www.tdwi.org 1
© 2009 by TDWI (The Data Warehousing InstituteTM), a division of 1105 Media, Inc. All rights reserved. Reproductions in whole or in part are prohibited
except by written permission. E-mail requests or feedback to [email protected]. Product and company names mentioned herein may be trademarks and/or
registered trademarks of their respective companies.
Table of Contents
By Wayne W. Eckerson
beyond report ingDelivering Insights with
Next-Generation Analytics
third QUArtEr 2009TDWI besT pracTIces reporT
Research Methodology . . . . . . . . . . . . . . . . . . . . . . 3
Beyond Reporting: Understanding Analytics . . . . . . . . . . 4
Context . . . . . . . . . . . . . . . . . . . . . . . . . . . . . . 4
Business Intelligence . . . . . . . . . . . . . . . . . . . . . . . 4
Creating User Classification Frameworks . . . . . . . . . . . . . 4
User Trends. . . . . . . . . . . . . . . . . . . . . . . . . . . . . 6
Casual Users . . . . . . . . . . . . . . . . . . . . . . . . . . . 7
Power Users. . . . . . . . . . . . . . . . . . . . . . . . . . . . 11
Types of Analytical Tools . . . . . . . . . . . . . . . . . . . . . 15
Analytical Tools for Casual Users . . . . . . . . . . . . . . . . . 15
Analytical Tools for Business Analysts . . . . . . . . . . . . . . . 18
Analytical Tools for Super Users . . . . . . . . . . . . . . . . . . 23
Tools for Analytical Modelers . . . . . . . . . . . . . . . . . . . 24
Recommendations . . . . . . . . . . . . . . . . . . . . . . . . . 28

2 TDWI rese arch
BE yOND REPORT ING
About the AuthorWAYNE ECKERSON is the director of TDWI Research at The Data Warehousing Institute. Eckerson is an industry analyst, consultant, and educator who has served the DW and BI community since 1995. Eckerson is author of the bestselling book Performance Dashboards: Measuring, Monitoring, and Managing Your Business (John Wiley & Sons, 2005) and numerous in-depth reports on business intelligence topics. He is also the author of TDWI’s BI Maturity Model and Assessment Service, which enables organizations to benchmark their BI programs against industry norms. Eckerson speaks frequently at industry events and works closely with BI teams to optimize the agility and value of their BI initiatives. He can be reached at [email protected].
About TDWIThe Data Warehousing Institute™ (TDWI), a division of 1105 Media, Inc., is the premier provider of in-depth, high-quality education and research in the business intelligence and data warehousing industry. TDWI is dedicated to educating business and information technology professionals about the strategies, techniques, and tools required to successfully design, build, and maintain business intelligence and data warehousing solutions. It also fosters the advancement of business intelligence and data warehousing research and contributes to knowledge transfer and professional development of its Members. TDWI sponsors and promotes a worldwide Membership program, quarterly educational conferences, regional educational seminars, role-based training, onsite courses, certification, solution provider partnerships, an awards program for best practices, resourceful publications, an in-depth research program, and a comprehensive Web site (www.tdwi.org).
AcknowledgmentsTDWI would like to thank many people who contributed to this report. First, we appreciate the many users who responded to our survey, as well as those who responded to our requests for phone interviews. We would also like to recognize TDWI’s account and production team: Jennifer Agee, Roxanne Cooke, Bill Grimmer, Denelle Hanlon, and Deirdre Hoffman.
SponsorsADVIZOR Solutions, Inc.; MicroStrategy; Oracle; SAP; SAS; Tableau Software; Teradata Corporation; and TIBCO Spotfire sponsored the research for this report.

www.tdwi.org 3
Research Methodology
Where are you located?
U.S. 68%
Europe 13%
Canada 7%
Asia 7%
Mexico, Central/South America 3%
Other 2%
What is your level?
Executive 9%
Director 18%
Manager 44%
Developer 22%
Administrator 7%
What industry are you from?
Consulting 12%
Software 9%
Insurance 9%
Banking 8%
Healthcare 7%
Telecommunications 5%
Financial services 5%
Federal government 4%
Manufacturing 4%
Education (university) 4%
Other 33%
How many years has your organization had a formal BI program?
0 years 7%
1 year 13%
2 to 4 years 32%
5 to 9 years 27%
10 to 14 years 16%
15 years or longer 5%
Based on 222 respondents. Percentages are rounded to the nearest whole number throughout this report.
Research MethodologyFocus. This report is designed for business and technical managers who are responsible for setting, measuring, monitoring, and managing business performance and overseeing teams of analysts responsible for analyzing data to support strategic and tactical decisions and ongoing planning efforts.
Methodology. The research for this report is based on in-depth interviews with BI practitioners and solution providers as well as a 20-question survey that TDWI conducted in February 2009. Almost 250 people responded to the survey, with 222 meeting our criteria as qualified respondents. We included responses from survey takers who are IT professionals, business sponsors or users, or consultants or systems integrators. We did not include respondents who work in academics or for BI/DW vendors.
Respondent profile. A majority of survey respondents are corporate IT professionals (60%) who work predominantly for organizations making under $1 billion in annual revenue (51%) in the United States (68%). Almost two-thirds are either managers or directors (62%) representing a range of industries.
What is your position?
IT professional 60%
Business sponsor or user 20%
Consultant or systems integrator 16%
Other 4%
What are the annual revenues of your organization?
Less than $100 million 20%
$100 million to $500 million 18%
$500 million to $1 billion 13%
$1 billion to $5 billion 15%
$5 billion to $10 billion 8%
$10 billion or more 16%
Don’t know 10%
Average = 5.15 years

4 TDWI rese arch
BE yOND REPORT ING
Beyond Reporting: Understanding Analytics ContextDefinitions. Webster’s Revised Unabridged Dictionary defines analytics as “the science of analysis,” and analysis as “the tracing of things to their source, and the resolving of knowledge into its original principles.” From a business perspective, these definitions imply that analytics is about understanding the root causes of business events and conditions. The upshot, of course, is that business people, armed with insights, will make the right decisions and take the appropriate actions to further their organizations’ tactical and strategic goals.
Analytics is iterative. Typically, business people identify root causes by asking a series of questions in a heuristic fashion. The answer to each question sheds new insights and generates new questions, and the process continues until one discovers desired insights. Most people analyze issues verbally by posing questions to other people, such as colleagues, associates, and experts. As organizations accumulate information about every aspect of their operations, customers, and competitors, they increasingly ask questions of data.
Challenges. Unfortunately, analyzing data is not easy. First, finding people who have sufficient knowledge of the business processes, underlying data structures, and data access and analysis tools is challenging. Analytical literacy in most organizations is woefully lacking, and business analysts are a scarce commodity. Second, preparing and packaging organizational data so that business people can access and trust it is difficult, time-consuming, and expensive. Many companies want to reduce the time and cost required to clean, integrate, and load data for analysis, but there are few shortcuts here.
Third, today’s de facto analytical tools—spreadsheets, desktop databases, and reporting tools—are rudimentary at best and haven’t changed much in decades. Fortunately, there are many new analytical tools and technologies designed to improve the productivity of business analysts and preserve information consistency throughout an organization. These analytical tools and the types of users they are geared to are the focus of this report.
Business IntelligenceAll BI involves analysis. Few veteran BI professionals equate “reporting” or “monitoring” with analytics, but it is not entirely inaccurate to do so. Business people can use reports to understand the business, analyze root causes, and guide future activities (and dashboards are really just graphical, multilayered exception reports).
The question is not whether reports and dashboards are analysis tools; it’s whether these tools and methods are best suited to the types of people doing the analysis. For certain types of users, such as executives and managers, reports and dashboards are optimal analytical tools; but for others, such as data-savvy analysts, we need to move beyond reporting (and spreadsheets and desktop databases) to analytical and predictive technologies with richer functionality.
Creating User Classification FrameworksOptimal fit. One of the classic mistakes that organizations make when purchasing business intelligence tools is to straddle the middle. That is, they purchase tools that are too complex for casual users but not sophisticated enough for power users. The key to a successful deployment of BI technology is to understand your business users, the roles they play, the information they need, and the manner in which they want to consume and analyze that information. This is easier said than done.
Analytical literacy in most organizations is
woefully lacking.
The classic mistake is to purchase BI tools that are too complex
for casual users but not sophisticated enough
for power users.

www.tdwi.org 5
Understanding Analytics
We are fortunate today to have a plethora of tools and technologies to offer organizations that want to increase their analytical IQ. The downside of this technological cornucopia is that it’s difficult to know which tools to give to which users. This is further complicated by the fact that most users play multiple roles, sometimes simultaneously, and each role has different information requirements and different styles of consuming information. Plus, these patterns vary by industry, geography, corporate culture, and individual preferences, so there is no surefire scheme for outfitting users with appropriate tools.
For example, executives in a regional bank may look at weekly profit/loss reports and a monthly scorecard, while executives in a shipping company may use an operational dashboard to track the percentage of on-time shipments on an hourly basis. Such roles may change based on economic conditions. For example, given the current economic downturn, bank presidents are probably examining operational metrics in detail on a daily basis.
Ultimately, BI needs to be customized to users’ roles and personalized to their individual tastes. The best way to start this process is to create an inventory of your users at an aggregate level. This requires classifying users based on some logical scheme, such as business titles, departments, or information consumption patterns. These categories should be based on how business users consume information today.
TDWI sample classification. Figure 1 represents a classification I’ve used for years. Most organizations will take this type of framework as a starting point and create about a dozen groups with unique identities. My classification scheme divides all business users into two main categories: consumers and producers. (I often use the term “casual user” instead of consumer and “power user” instead of producer, since I view these classifications as equivalent.)
Typical User Classification
Figure 1. A user classification defines types of users by information requirements and maps them to BI technologies.
Repo
rting
(Bre
adth
)
Analysis (Depth)LOW
HIGH
HIGH
ProductionReports
ParameterizedReports
Dashboards/Scorecards
Ad Hoc Queries/Search;OLAP; Visual Analysis
Forecasts, Scenarios,Statistical Models
CUSTOMERS/SUPPLIERS
IT DEVELOPERS
EXECUTIVES
SUPER USERS
MANAGERS/STAFF
BUSINESSANALYSTS
BUSINESSANALYSTS
ANALYTICAL MODELERS
80%CASUALUSERS
20%POWERUSERS

6 TDWI rese arch
BE yOND REPORT ING
Casual versus power. Information consumers—or casual users—consume the output of others (the information producers) and represent about 80% of all employees. Information producers—or power users—produce reports, dashboards, and models for themselves as well as the consumers. The producers represent about 20% of all employees, but have an oversized impact on the BI environment because they produce the content, design the BI road map, and influence the selection of BI tools.
This classification further divides consumers into customers/suppliers, executives, managers/staff, and business analysts, and it divides producers into IT developers, super users, business analysts, and analytical modelers. Each of these groups exhibits unique characteristics when it comes to consuming or producing information. A good classification describes these characteristics and assigns a fictional name and photo to each group to crystallize requirements and features.
Map to BI output. The classification then maps each group to the types of BI output they consume and/or produce. The capabilities are represented in a chart that plots reporting versus analysis. Capabilities at the top left address a broad range of users and subjects but deliver static output, while capabilities in the bottom right are focused on fewer users and subjects but offer greater interactivity. (Breadth = data and users; depth = interactivity.)
When creating a user classification, remember that there is a natural tension between the tools and approaches business users use today to analyze information and the tools and approaches they could or should use. Many BI deployments get shipwrecked on the shoals of over-fitting users. (This is largely because power users dominate the purchasing process.) Although executives could benefit from performing multidimensional analysis, most won’t do it if they have never done it before and aren’t comfortable analyzing spreadsheets. The same holds true with other types of users.
To improve an organization’s analytical IQ, BI teams need to build bridges from users’ current analytical environments to more optimal future environments. A small group of users will cross the bridge immediately and ask why it took the BI team so long to implement the new tools. The majority will initially resist change, but as good corporate citizens, they will slowly but surely cross the bridge. A small minority will fiercely resist any and all changes. The higher-placed this last group of users is in the organization, the more likely you’ll lose any head-to-head battle; thus, it’s wise in these cases to simply grandfather their wayward tools and information consumption habits and move on.
User Trends Self-service BI is the mantra that BI managers are chanting these days. Their thinking goes like this:
“If we empower users to create their own reports and views, they won’t have to rely on us to create reports for them, and they’ll be happier because they’ll get exactly what they want much faster.” Unfortunately, the theory doesn’t always work in reality.
What most people don’t realize is that there are two types of self-service. One type—ad hoc report creation—is geared to power users, while the other type—ad hoc report navigation—is geared to casual users. Report creation involves creating queries against databases, manipulating the results, and formatting the output. This is what power users do every day. With report navigation, users traverse predefined pathways through a predefined data set, starting with a dozen high-level metrics or KPIs and drilling down through more detailed views of the metrics from there. Both types of self-service can be used to analyze information, but report creation requires considerably more technical savvy than report navigation.
What most people don’t realize is that there are
two types of self-service.
To improve analytical IQ, BI teams need to
build bridges from current analytical
environments to more optimal future ones.
Many BI deployments get shipwrecked on
the shoals of over-fitting users.
www.tdwi.org 7
User Trends
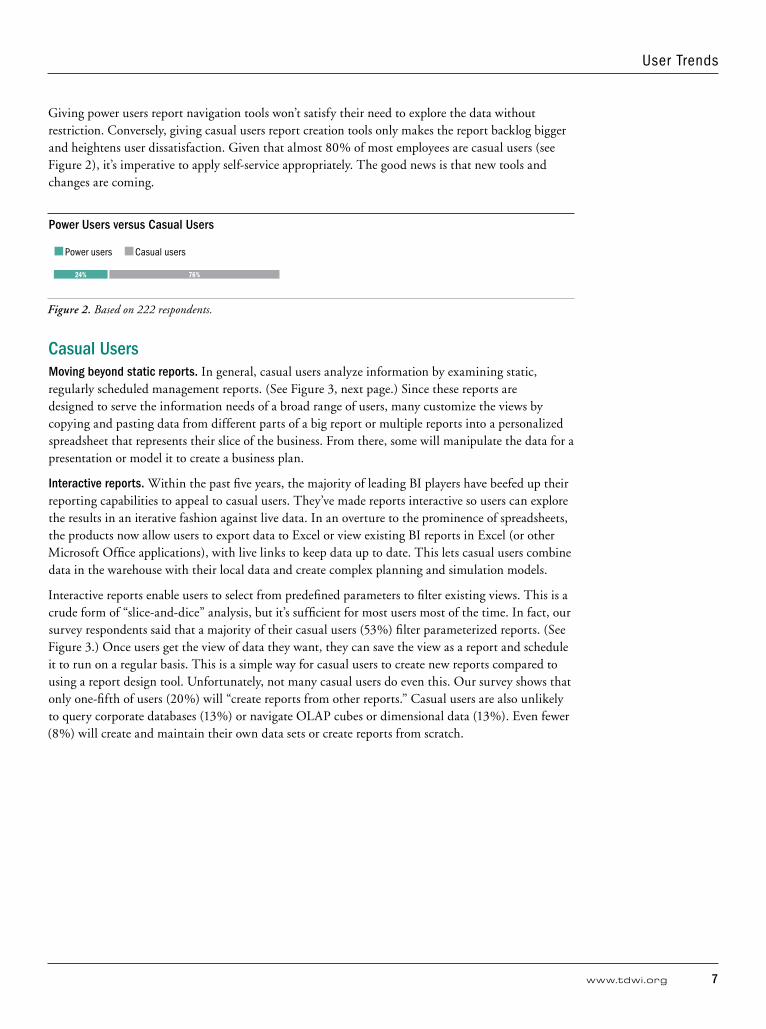
Giving power users report navigation tools won’t satisfy their need to explore the data without restriction. Conversely, giving casual users report creation tools only makes the report backlog bigger and heightens user dissatisfaction. Given that almost 80% of most employees are casual users (see Figure 2), it’s imperative to apply self-service appropriately. The good news is that new tools and changes are coming.
Power Users versus Casual Users
Power users Casual users
24% 76%
Figure 2. Based on 222 respondents.
Casual UsersMoving beyond static reports. In general, casual users analyze information by examining static, regularly scheduled management reports. (See Figure 3, next page.) Since these reports are designed to serve the information needs of a broad range of users, many customize the views by copying and pasting data from different parts of a big report or multiple reports into a personalized spreadsheet that represents their slice of the business. From there, some will manipulate the data for a presentation or model it to create a business plan.
Interactive reports. Within the past five years, the majority of leading BI players have beefed up their reporting capabilities to appeal to casual users. They’ve made reports interactive so users can explore the results in an iterative fashion against live data. In an overture to the prominence of spreadsheets, the products now allow users to export data to Excel or view existing BI reports in Excel (or other Microsoft Office applications), with live links to keep data up to date. This lets casual users combine data in the warehouse with their local data and create complex planning and simulation models.
Interactive reports enable users to select from predefined parameters to filter existing views. This is a crude form of “slice-and-dice” analysis, but it’s sufficient for most users most of the time. In fact, our survey respondents said that a majority of their casual users (53%) filter parameterized reports. (See Figure 3.) Once users get the view of data they want, they can save the view as a report and schedule it to run on a regular basis. This is a simple way for casual users to create new reports compared to using a report design tool. Unfortunately, not many casual users do even this. Our survey shows that only one-fifth of users (20%) will “create reports from other reports.” Casual users are also unlikely to query corporate databases (13%) or navigate OLAP cubes or dimensional data (13%). Even fewer (8%) will create and maintain their own data sets or create reports from scratch.

8 TDWI rese arch
BE yOND REPORT ING
How many of your casual users perform the following tasks?
All Most
View static reports or dashboards 44% 32% 76%
Filter parameterized reports or dashboards 18% 35% 53%
Model data via spreadsheets 12% 23% 35%
Create reports from other reports 3% 17% 20%
Query corporate databases directly 4% 9% 13%
Navigate OLAP cubes or dimensional data 3% 10% 13%
Create and maintain their own database 1% 7% 8%
Create reports from scratch 1% 7% 8%
Figure 3. Casual users primarily view static reports, filter parameterized reports, and export report data to spreadsheets.
What casual users want. Most survey respondents said that casual users would be more productive if the technologies they used supported more interactive features. At the top of the list, drillable dashboards and scorecards were cited by 80% of respondents. (See Figure 4.) A majority also cited better charting and visualization (65%), speed of thought filtering and analysis (64%), search tools that generate queries and charts (55%), predictive scores built into reports (54%), real-time data and alerts (51%), and dimensionally aware ”what-if modeling” (50%).
To what degree would the following technologies make your casual users more productive?
Very High High
Drillable dashboards and scorecards 37% 43% 80%
Better charting and visualization 28% 37% 65%
Speed of thought filtering and analysis 24% 40% 64%
Search tools that generate queries/charts 19% 36% 55%
Predictive scores built into reports 18% 36% 54%
More real-time data and alerts 15% 36% 51%
Dimensionally aware “what-if” modeling 20% 30% 50%
Web-based gadgets and portlets 11% 25% 36%
Packaged BI applications 13% 23% 36%
DW appliances 9% 14% 23%
Figure 4. Casual users would be more productive if they were given more analytic capabilities.
Go MAD! The MAD framework represents the optimal way to design a BI environment to meet the analytical needs of casual users, reflecting the survey results shown in Figure 4. MAD stands for monitor, analyze, and drill to detail. The monitoring layer consists of graphical KPIs that enable business users to assess the status and trend of KPIs at a glance. If a KPI stoplight is yellow or red, they can drill down to the analysis layer to explore the KPI from multiple perspectives or dimensions using filters. Once they discover the root cause of the problem, they can drill to atomic-level data in the data warehouse or source system to identify the customers or products affected by the problem and take action.
A MAD framework creates an interactive information sandbox that parcels out information and insights to casual users on demand, optimizing usability and adoption. The amount of data,
The MAD framework represents the optimal
way to design a BI environment for
casual users.

www.tdwi.org 9
User Trends
dimensions, and measures expands exponentially at each level, as indicated by the pyramid shape of the framework. MAD prevents users from getting overwhelmed by too much data; in essence, MAD gives them information on demand based on what matters most. BI applications based on the MAD framework address 60 to 80% of the questions asked by casual users. (See Figure 5.)
The MAD Framework
Figure 5. The MAD framework parcels out information and insights on demand.
Users can start anywhere in the framework. Managers and executives typically start at the monitoring layer and drill down; analysts start at the middle layer and drill up, down, or across; and field staff start at the detailed data layer using operational reports. KPIs cascade from the top to the bottom, while data rolls up from the bottom to the top. Role-based permissions determine which users see what data at each level of the framework, and personalization features let users tailor certain parts of the application to suit their information preferences.
The monitoring layer is usually supported by a portal or dashboard interface, the analysis layer by an OLAP tool, and the drill-to-detail layer by dynamically generated queries into a data warehouse or source application. However, there are multiple techniques for building layered insight delivery systems. Many BI vendors—including most of the sponsors of this report—have or are creating full-fledged, MAD-like solutions with seamless interfaces between the three layers.
Double MAD. Vendors are starting to expand the MAD framework to extend the analytical reach of casual users. (See Figure 6, next page.) Rather than giving casual users separate analytical tools that they likely won’t use, a MAD solution embeds analytical capabilities into the application in a seamless fashion. Users hardly recognize that they’re crossing the boundary from casual to power user.
The monitoring layer of a double MAD application enables users to perform “what-if” analyses. Users move interactive sliders or click on charts to change variables in their KPIs and view the impact on current and forecasted results. The analysis layer embeds more sophisticated visualization and analytical functions that make it easy for users to spot outliers, patterns, and relationships in the data. The bottom layer incorporates collaboration and closed-loop capabilities so users can share ideas about data trends and issues, update or interact with operational applications, and trigger alerts and workflows.
With double MAD, users hardly recognize that they’re crossing the boundary from casual to power user.
Executives/Managers
Managers/Analysts
Analysts/Workers
GraphicalKPIs
FUNCTIONALITY USERS
Dimensional Viewsand Filters
Operational Queries and Reports
Monitor
Analyze
Drill

10 TDWI rese arch
BE yOND REPORT ING
The Double MAD Framework
Figure 6. The double MAD framework incorporates additional analytical and collaborative capabilities in a seamless way.
Mapping roles. The MAD framework also provides an interesting way to map users to tools. (See Figure 7.) Most of the time, casual users will only need to monitor, analyze, and drill to detail using a MAD solution. (A double MAD application will meet an even greater percentage of casual users’ information requirements.)
What about the rest of the time? Occasionally, casual users require true ad hoc capabilities, such as the ability to find reports, query databases, and create and modify “what-if” models. Giving casual users traditional power user tools, such as query, report authoring, and OLAP tools, doesn’t work. To support the ad hoc requirements of casual users, organizations need to supplement the MAD framework with (1) next-generation BI search tools that can find reports and generate SQL queries, (2) visual discovery tools to slice/dice data intuitively at the speed of thought, and (3) planning tools, including Excel-based BI tools and pure-play planning tools.
MAD Classification Scheme
80% of the Time 20% of the Time
Casual Users
TASk TOOL TASk TOOL
Monitor
MAD dashboard
Issue queries BI search
Analyze Discover trends Visual discovery
Drill through Create plans Excel/Planning
Power Users
Author Report design tool ——— ———
Plan Excel/Planning Monitor
MAD dashboardAnalyze OLAP/Visual discovery Analyze
Predict Data mining Drill through
Figure 7. Use the MAD framework to classify users and fit them to different types of tools.
Modeling (“What If”)
Advanced Analytics
Do (Collaborate and Act)
GraphicalKPIs
CURRENT FUTURE
Dimensional Viewsand Filters
Operational Queries and Reports
Monitor
Analyze
Drill
Tailored Delivery Ad Hoc
Most users play multiple roles, and each role has
different information requirements.

www.tdwi.org 11
User Trends
Power UsersOn the other side of the equation, power users require MAD capabilities 20 to 40% of the time. The bulk of their time is spent using tools designed to handle a variety of analytical tasks, including report authoring tools, spreadsheet-based modeling tools, sophisticated OLAP and visual design tools, and predictive modeling and data mining tools.
Times have never been better for power users. Their desktop computers contain more processing power and can hold more data than ever before. Today, there are more tools designed to help power users exploit these computing resources to analyze information. Many cost less than $1,000 for a single user or can be downloaded from the Internet. “Power users have more power today than ever to perform deep analytics,” says John O’Brien, president of Zukeran Technologies, a BI consultancy.
Despite the plentiful options, many power users are bereft of optimal analytical tools. Either they restrict themselves to spreadsheets and desktop databases, or that’s all their organization will give them. Most homeowners wouldn’t hire a carpenter with just one or two tools in his toolbox; they want a carpenter whose toolbox contains tools for every type of carpentry task imaginable. In the same way, organizations need to empower power users with a multitude of tools and technologies to make them more productive as analysts. If implemented correctly, the technology can liberate analysts to gather, analyze, and present data quickly and efficiently without undermining enterprise IT standards governing data, semantics, and tools.
Four types. Power users are a diverse group who perform a variety of analytical tasks. I’ve divided power users into four types:
1. Business analysts. Data- and process-savvy business users who use data to identify trends, solve problems, and devise plans.
2. Super users. Technically savvy departmental business users who create ad hoc reports on behalf of their colleagues.
3. Analytical modelers. Business analysts who create statistical and data mining models that quantify relationships and can be used to predict future behavior or conditions.
4. IT report developers. IT developers, analysts, or administrators who create complex reports and train and support super users.
According to our survey, most organizations have all four types of power users, although only 51% have analytical modelers. (See Figure 8.)
Which of the following types of power users exist in your organization?
IT report developers/analysts 86%
Business analysts 83%
Business super users 81%
Analytical modelers 51%
Figure 8. Most organizations have all four types of power users.
The finance department has the highest percentage of all types of power users, followed by sales, marketing, and service. Marketing has the second highest percentage of analytical modelers. (See Figure 8a.)
Despite the plentiful options, many power users are bereft of optimal analytical tools.

12 TDWI rese arch
BE yOND REPORT ING
Which departments have dedicated analysts?
Super users Business analysts IT report developers Analytical modelers
Finance/accounting 68% 58% 41% 43%
Sales 39% 39% 19% 13%
Marketing 37% 37% 19% 22%
Service 32% 32% 27% 19%
Product management 23% 23% 16% 10%
HR 21% 21% 11% 5%
Logistics 16% 16% 7% 7%
R&D 16% 16% 0% 19%
Procurement 14% 14% 22% 4%
Manufacturing 11% 11% 9% 5%
Figure 8a. Percentage of departments with dedicated analysts.
BUSINESS ANALYSTS. Business analysts sit at the intersection of data, process, and strategy, and they play a significant role in helping the business solve problems, devise plans, and exploit opportunities. Their titles include “business analyst,” “financial analyst,” “marketing specialist,” and “operations research analyst.” Executives view them as critical advisors who keep them grounded in reality (data) and help them bolster arguments for courses of action.
Business analysts perform three major tasks:
1. Gather data. Analysts explore the characteristics of various data sets, extract desired data, and transform the extracted data into a standard format for analysis.
2. Analyze data. Analysts examine data sets in an iterative fashion—essentially “playing with the data”—to identify trends or root causes. Analysts will visualize, aggregate, filter, sort, rank, calculate, drill, pivot, model, and add or delete columns, among other things.
3. Present data. Analysts deliver the results of their analysis to others in a standard format, such as a report, presentation, spreadsheet, PDF document, or dashboard.
Today, business analysts spend an inordinate amount of time on steps 1 and 3 and not enough time on step 2, which is what they were hired to do. Unfortunately, due to the sorry state of data in most organizations, they have become human data warehouses. TDWI estimates that business analysts spend an average of two days every week gathering and formatting data instead of analyzing it, costing organizations an average of $780,000 a year.1
According to our survey, most business analysts use spreadsheets to access, analyze, and present data, followed by BI reporting and analysis tools. However, in most cases, the analysts use BI tools as glorified extract tools to grab data warehouse data and dump it into a spreadsheet or desktop database, where they normalize the data and then analyze it. The next most popular tool is SQL, which analysts use to access operational and other sources so they can dump the data into spreadsheets or desktop databases (which rank number five on the list, following OLAP tools). (See Figure 9.)
1 From Wayne Eckerson and Rick Sherman, Strategies for Managing Spreadmarts: Migrating to a Managed BI Environment, TDWI Best Practices Report, Q1 2008. Available at www.tdwi.org/research/reportseries.
Due to the sorry state of data,
most business analysts have become human
data warehouses.

www.tdwi.org 13
User Trends
Top Seven Toolsets Used by Business Analysts
1. Spreadsheets
2. BI reporting/analysis tools
3. SQL
4. OLAP tools
5. Desktop databases
6. BI authoring tools
7. Interactive visualization tools
Figure 9. Business analysts use BI tools and SQL to dump data into spreadsheets or desktop databases to do their analyses.
To improve the productivity and effectiveness of business analysts, organizations should continue to expand the breadth and depth of their data warehouses, which will reduce the number of data sources that analysts need to access directly. They should also equip analysts with better analytical tools that operate the way they do. These types of tools include speed-of-thought analysis (i.e., sub-second responses to all actions) and better visualizations to spot outliers and trends more quickly.
SUPER USERS. Super users are typically technically savvy business users who take responsibility for creating reports on behalf of colleagues in their departments. In most cases, the super users are self-appointed volunteers who handle reporting tasks in their departments.
In a mature BI environment, super users are part of a BI competency center, which provides them with training and support. The super users fulfill departmental requests for ad hoc reports, offloading such requests from the BICC, and make suggestions to enhance and extend the standard BI reports designed by the BICC. The super users also participate in BICC working committees and help to craft the BI road map, select products, and design an enterprise BI architecture.
Super users generally use BICC-supplied BI reporting/analysis tools to create reports on behalf of their colleagues. (See Figure 10.) This means that they are crafting queries against a set of business objects (or metadata) that they can drag and drop into a query panel or report template. The BICC creates the business objects, shielding super users from the complexities of the back-end database(s). In organizations without a BICC, the super users may be business analysts and use spreadsheets, SQL, or OLAP tools.
Top Seven Toolsets Used by Super Users
1. BI reporting/analysis tools
2. Spreadsheets
3. SQL
4. OLAP tools
5. BI authoring tools
6. Interactive visualization tools
7. ERP/CRM reporting applications
Figure 10. Super users use BI report tools to create reports for colleagues.
The way to make super users more productive is to provide an organizational framework for the delivery of BI capabilities. This includes establishing a BICC with formal roles and responsibilities
In a mature BI environment, super users are part of a BICC, which provides them with training and support.
14 TDWI rese arch
BE yOND REPORT ING
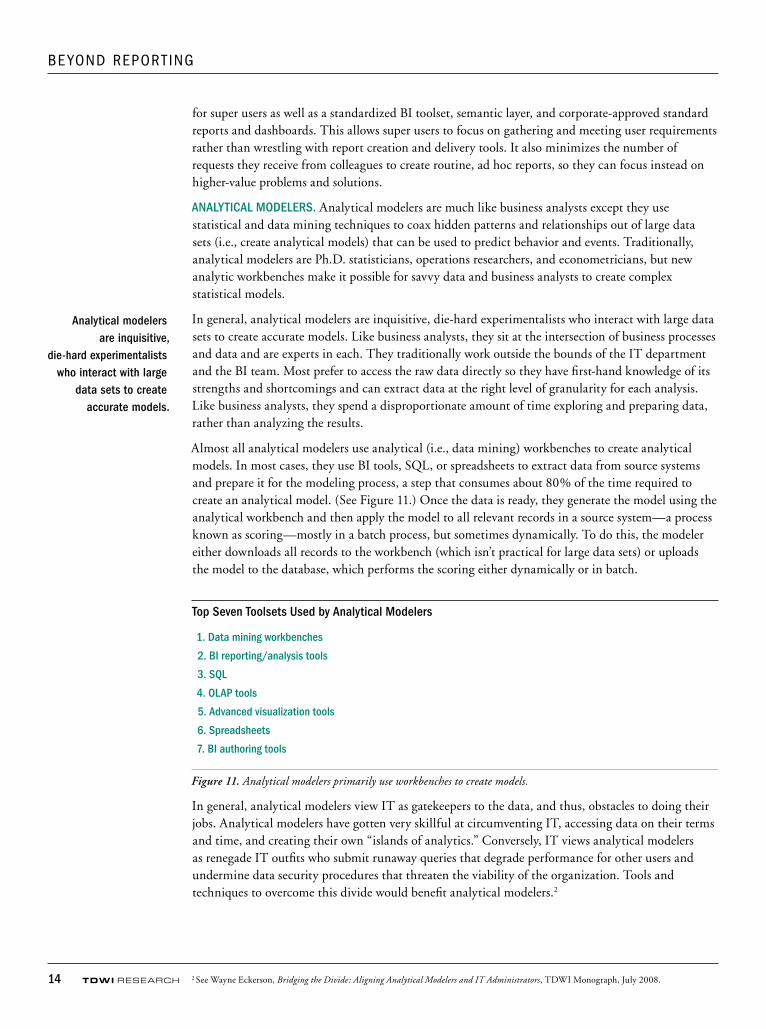
2 See Wayne Eckerson, Bridging the Divide: Aligning Analytical Modelers and IT Administrators, TDWI Monograph, July 2008.
for super users as well as a standardized BI toolset, semantic layer, and corporate-approved standard reports and dashboards. This allows super users to focus on gathering and meeting user requirements rather than wrestling with report creation and delivery tools. It also minimizes the number of requests they receive from colleagues to create routine, ad hoc reports, so they can focus instead on higher-value problems and solutions.
ANALYTICAL MODELERS. Analytical modelers are much like business analysts except they use statistical and data mining techniques to coax hidden patterns and relationships out of large data sets (i.e., create analytical models) that can be used to predict behavior and events. Traditionally, analytical modelers are Ph.D. statisticians, operations researchers, and econometricians, but new analytic workbenches make it possible for savvy data and business analysts to create complex statistical models.
In general, analytical modelers are inquisitive, die-hard experimentalists who interact with large data sets to create accurate models. Like business analysts, they sit at the intersection of business processes and data and are experts in each. They traditionally work outside the bounds of the IT department and the BI team. Most prefer to access the raw data directly so they have first-hand knowledge of its strengths and shortcomings and can extract data at the right level of granularity for each analysis. Like business analysts, they spend a disproportionate amount of time exploring and preparing data, rather than analyzing the results.
Almost all analytical modelers use analytical (i.e., data mining) workbenches to create analytical models. In most cases, they use BI tools, SQL, or spreadsheets to extract data from source systems and prepare it for the modeling process, a step that consumes about 80% of the time required to create an analytical model. (See Figure 11.) Once the data is ready, they generate the model using the analytical workbench and then apply the model to all relevant records in a source system—a process known as scoring—mostly in a batch process, but sometimes dynamically. To do this, the modeler either downloads all records to the workbench (which isn’t practical for large data sets) or uploads the model to the database, which performs the scoring either dynamically or in batch.
Top Seven Toolsets Used by Analytical Modelers
1. Data mining workbenches
2. BI reporting/analysis tools
3. SQL
4. OLAP tools
5. Advanced visualization tools
6. Spreadsheets
7. BI authoring tools
Figure 11. Analytical modelers primarily use workbenches to create models.
In general, analytical modelers view IT as gatekeepers to the data, and thus, obstacles to doing their jobs. Analytical modelers have gotten very skillful at circumventing IT, accessing data on their terms and time, and creating their own “islands of analytics.” Conversely, IT views analytical modelers as renegade IT outfits who submit runaway queries that degrade performance for other users and undermine data security procedures that threaten the viability of the organization. Tools and techniques to overcome this divide would benefit analytical modelers.2
Analytical modelers are inquisitive,
die-hard experimentalists who interact with large
data sets to create accurate models.

www.tdwi.org 15
Analytical Tools
IT REPORT DEVELOPERS. IT report developers have many titles: BI manager, BI developer, database administrator, ETL developer, and software developer. They are a central resource that creates reports for business units and end users. In an organization without a formal BI program, this group is the sole developer of reports and dashboards. Traditionally, this approach creates a significant backlog of report development requests. When it comes to tools, IT report developers primarily use SQL and BI reporting and authoring tools to create reports for the business.
Top Seven Toolsets Used by IT Developers
1. SQL
2. BI reporting/analysis tools
3. BI authoring tools
4. OLAP tools
5. Spreadsheets
6. Interactive visualization tools
7. ERP/CRM reporting applications
Figure 12. IT developers use SQL and BI reporting tools to support BI requirements.
To avoid backlogs, most IT organizations have created a BICC that works collaboratively with super users and governance teams to create a BI delivery environment that meets user requirements in a timely fashion. The IT group also establishes data governance programs and recruits stewards in each department or business unit (who may also be super users) to help define and maintain data definitions and policies for updating, revising, and maintaining critical data elements.
The goal with BI and data governance programs is to get the business to take ownership and responsibility for its reporting and data environments, using IT as a resource to facilitate the process and manage the infrastructure. Unfortunately, it is difficult for IT to create such governance programs without strong buy-in from the business. IT would benefit from strong executive vision about the value of data and analysis and adequate funding and sponsorship of governance programs.
Types of Analytical ToolsNow that we’ve profiled the basic types of users in TDWI’s user classification scheme, we can map them to BI tools and technologies. We’ll focus most of this section on tools for power users, since many of the newest tools are geared to them.
Analytical Tools for Casual UsersThe two key toolsets for casual users are BI platforms (which can deliver MAD-based solutions) and BI search tools (when deployed properly).
1. BI PLATFORMS. Leading BI vendors such as MicroStrategy, Oracle, SAP BusinessObjects, and SAS now offer a “BI platform”—an integrated suite of BI modules built on a unified, services-based architecture. BI platforms integrate BI capabilities that customers previously had to purchase from multiple vendors and integrate themselves.
Most BI platforms include the following BI modules in a base package: (1) production reporting, (2) end user reporting, (3) ad hoc query, (4) online analytic processing tools (OLAP), (5) dashboards and scorecards, (6) integration with Microsoft Office, (7) a BI portal, and (8) support for multiple
The goal with BI and data governance programs is to get the business to take ownership of its reporting and data environments.

16 TDWI rese arch
BE yOND REPORT ING
From a casual user’s perspective, a BI platform should
only expose the BI capabilities they need
and want using role-based access control.
DELI
VERY
CH
ANNE
LS
Web Desktop Mobile Portal Printer Social Media
BI M
ODU
LES
Production Reporting
Ad Hoc Queries
Dashboards/ Scorecards OLAP End-User
Reporting
Proactive Detection and
Alerts
Disconnected and Mobile Analytics
MS Office and Outlook Integration
SERV
ICES
COMMON SEMANTIC LAyER
Security Data Access Metadata Query Engine Calculation Engine User Access Caching
SOU
RCES
OLTP and ODS Systems
Data Warehouse/ Data Mart
OLAP Packaged and Custom Apps
Files/Excel/ XML
Business Process
delivery channels (e.g., Web, desktop, mobile, PDF, printer). Some vendors bundle other modules in the package, such as data mining, search, rules-based notification and alerts, or data integration tools. The underlying architecture provides a common set of services for security, data access, metadata management, query execution, calculations, user management, and caching, among other things. (See Figure 13.)
A BI Platform
Figure 13. BI platforms offer BI capabilities running a unified architecture.
From a casual user’s perspective, a BI platform should only expose the BI capabilities they need and want using role-based access control. From there, BI platforms should parcel out information on demand using the MAD framework. For example, a BI platform might let users view role-based KPIs graphically in a report, dashboard, scorecard, or portal; analyze KPI trends by drilling into an OLAP cube; and view transactions that comprise the KPI by linking to detailed operational or data warehouse reports.
These actions should be seamless for users, who should not be required to know which module to open to perform each step in the analysis. Vendors are working on making these types of cross-module actions seamless to users by passing parameters from one module to the next, making the BI platform appear as a single application instead of a patchwork of products. Such integration, which is the premise behind the MAD framework, will greatly enhance adoption by casual users.
Some BI platform vendors have built packaged applications on top of their BI platforms that make it even easier for users to derive insights from BI tools. For example, Oracle offers a suite of applications that spans sales, service, marketing, procurement, supply chain, financials, and human resources and runs on top of the Oracle BI Enterprise Edition platform and a common data model. (See Figure 14.) SAP, SAS, and Teradata also offer packaged analytic applications.

www.tdwi.org 17
Analytical Tools
Packaged Analytic Applications
Figure 14. Packaged analytic applications, like the ones listed above from Oracle, usually run on a common BI platform and unified data model and come with predefined ETL mappings, metadata, and reports tailored to various departments and industries.
2. SEARCH AND EXPLORATION. As mentioned in the previous section, casual users need true ad hoc capability 20% or more of the time, but it has been proven that giving casual users ad hoc query tools or OLAP tools doesn’t work. Fortunately, vendors are borrowing a page from Google and providing BI search tools that not only index reports and files, but also generate ad hoc queries.
For example, SAP has gained significant traction with its SAP BusinessObjects Explorer product. Users type free-form text into a search box. Explorer dynamically generates queries and returns data that users can filter, view in tables and charts, or export to spreadsheets. Explorer, which is based on the open source search engine Lucene, works by indexing SAP BusinessObjects’ semantic layer (i.e., Universe). (See Figure 15, next page.) Other BI search engines, such as those from Progress EasyAsk or Semantra, incorporate linguistic intelligence and database models to capture the meaning of keyword items and generate appropriate queries.
Sales Service and Contact Center Marketing Procurement
and Spend
Supply Chain and Order
ManagementFinancials Human
Resources
Pipeline analysis
Service effectiveness
Campaign effectiveness
Direct / indirect spend
Revenue and backlog
General ledger
Employee productivity
Forecast accuracy
Customer satisfaction
Customer insight
Buyer productivity
InventoryAccounts receivable
Compensation
Sales team effectiveness
Resolution rates
Product propensity
Off-contract purchases
Fulfillment status
Accounts payable
Compliance reporting
Up-sell / cross-sell
Service rep efficiency
Loyalty and attrition
Supplier performance
Customer status
Cash flowWorkforce
profile
Cycle times Service costMarket
basket analysisPurchase cycle time
Order cycle time
ProfitabilityRetention analysis
Lead conversion
Churn and service trends
Campaign ROI Employee expensesBOM
analysisExpense
managementReturn on
human capital

18 TDWI rese arch
BE yOND REPORT ING
BI Search
Figure 15. Distribution of sales for a consumer packaged goods company across European countries. Screenshot courtesy SAP BusinessObjects Explorer.
Analytical Tools for Business AnalystsBusiness analysts can benefit from three types of analytical tools: OLAP, visual discovery, and Excel-based tools. Visual discovery tools are the newest addition to the business analyst toolbox.
1. OLAP TOOLS. Other than spreadsheets and desktop databases, OLAP tools have been popular with business analysts, especially financial analysts, who like being able to slice/dice data dimensionally and navigate up and down organizational, product, and account hierarchies at the speed of thought (which most OLAP tools support). From a business perspective, OLAP tools make it easy to uncover the root causes of problems, identify trends, and compare performance across groups.
OLAP tools store data in multidimensional databases or cubes, which are like spreadsheets on steroids—supporting multiple dimensions instead of just two. One downside of this approach is that the cubes contain only summary information, because it takes too long for OLAP databases to calculate data values at the intersection of every dimension in every hierarchy. Vendors of multidimensional databases—which include Oracle (Essbase), Microsoft (Analysis Services), and SAP (Business Warehouse)—have made great strides in expanding the amount of data that cubes can contain by dynamically calculating data within cubes and joining data across cubes. Some of these vendors have also made it possible for users to input data values to perform planning, budgeting, and “what-if” analyses.
Many vendors also provide graphical clients tools to access the databases, although Excel is still the preferred OLAP client in the finance department. SAP, for instance, is working on a new OLAP client code-named Pioneer that will blend the best of its Business Explorer (BEx), an Excel-based client for SAP BW geared to data analysts, and BusinessObjects Voyager, a graphical OLAP client designed for BI professionals, according to John MacGregor, product manager for Voyager. SAP has
OLAP tools store data in multidimensional databases or cubes,
which are like spreadsheets on steroids.
www.tdwi.org 19
Analytical Tools
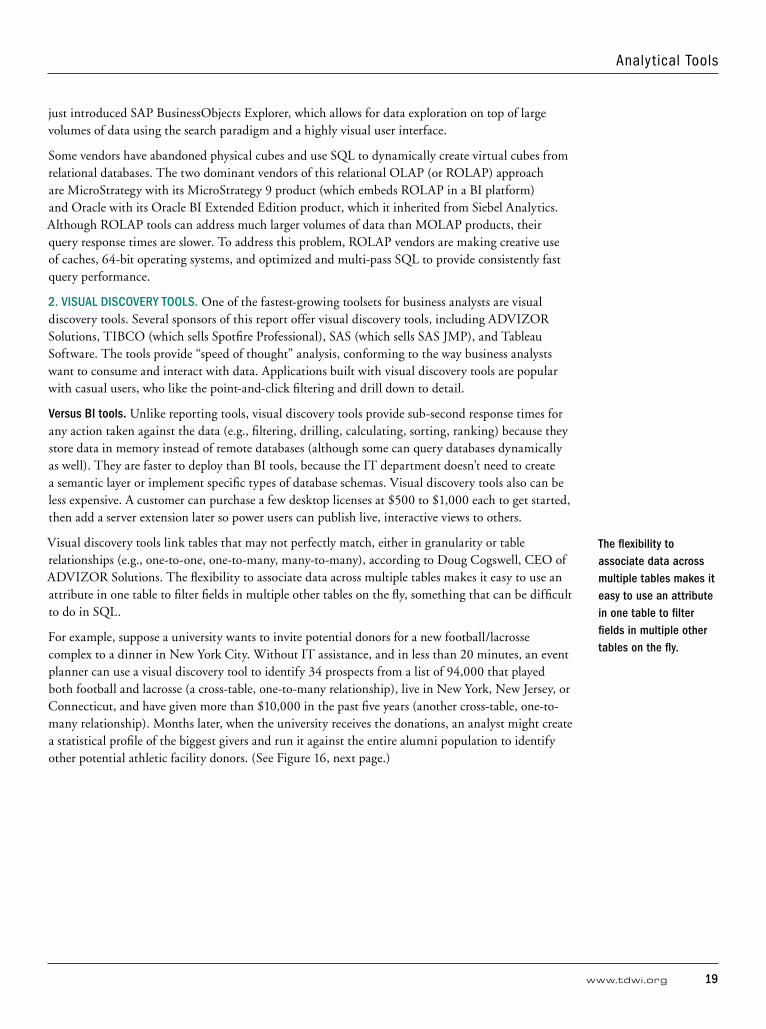
just introduced SAP BusinessObjects Explorer, which allows for data exploration on top of large volumes of data using the search paradigm and a highly visual user interface.
Some vendors have abandoned physical cubes and use SQL to dynamically create virtual cubes from relational databases. The two dominant vendors of this relational OLAP (or ROLAP) approach are MicroStrategy with its MicroStrategy 9 product (which embeds ROLAP in a BI platform) and Oracle with its Oracle BI Extended Edition product, which it inherited from Siebel Analytics. Although ROLAP tools can address much larger volumes of data than MOLAP products, their query response times are slower. To address this problem, ROLAP vendors are making creative use of caches, 64-bit operating systems, and optimized and multi-pass SQL to provide consistently fast query performance.
2. VISUAL DISCOVERY TOOLS. One of the fastest-growing toolsets for business analysts are visual discovery tools. Several sponsors of this report offer visual discovery tools, including ADVIZOR Solutions, TIBCO (which sells Spotfire Professional), SAS (which sells SAS JMP), and Tableau Software. The tools provide “speed of thought” analysis, conforming to the way business analysts want to consume and interact with data. Applications built with visual discovery tools are popular with casual users, who like the point-and-click filtering and drill down to detail.
Versus BI tools. Unlike reporting tools, visual discovery tools provide sub-second response times for any action taken against the data (e.g., filtering, drilling, calculating, sorting, ranking) because they store data in memory instead of remote databases (although some can query databases dynamically as well). They are faster to deploy than BI tools, because the IT department doesn’t need to create a semantic layer or implement specific types of database schemas. Visual discovery tools also can be less expensive. A customer can purchase a few desktop licenses at $500 to $1,000 each to get started, then add a server extension later so power users can publish live, interactive views to others.
Visual discovery tools link tables that may not perfectly match, either in granularity or table relationships (e.g., one-to-one, one-to-many, many-to-many), according to Doug Cogswell, CEO of ADVIZOR Solutions. The flexibility to associate data across multiple tables makes it easy to use an attribute in one table to filter fields in multiple other tables on the fly, something that can be difficult to do in SQL.
For example, suppose a university wants to invite potential donors for a new football/lacrosse complex to a dinner in New York City. Without IT assistance, and in less than 20 minutes, an event planner can use a visual discovery tool to identify 34 prospects from a list of 94,000 that played both football and lacrosse (a cross-table, one-to-many relationship), live in New York, New Jersey, or Connecticut, and have given more than $10,000 in the past five years (another cross-table, one-to-many relationship). Months later, when the university receives the donations, an analyst might create a statistical profile of the biggest givers and run it against the entire alumni population to identify other potential athletic facility donors. (See Figure 16, next page.)
The flexibility to associate data across multiple tables makes it easy to use an attribute in one table to filter fields in multiple other tables on the fly.
20 TDWI rese arch
BE yOND REPORT ING
Visual Discovery Tools
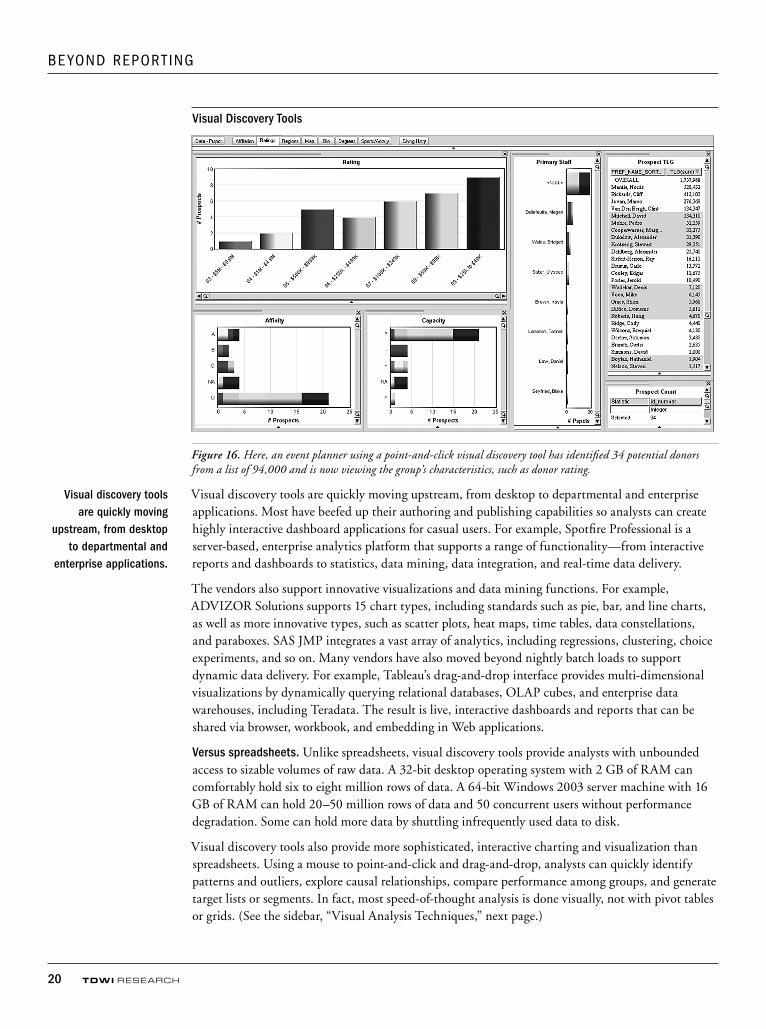
Figure 16. Here, an event planner using a point-and-click visual discovery tool has identified 34 potential donors from a list of 94,000 and is now viewing the group’s characteristics, such as donor rating.
Visual discovery tools are quickly moving upstream, from desktop to departmental and enterprise applications. Most have beefed up their authoring and publishing capabilities so analysts can create highly interactive dashboard applications for casual users. For example, Spotfire Professional is a server-based, enterprise analytics platform that supports a range of functionality—from interactive reports and dashboards to statistics, data mining, data integration, and real-time data delivery.
The vendors also support innovative visualizations and data mining functions. For example, ADVIZOR Solutions supports 15 chart types, including standards such as pie, bar, and line charts, as well as more innovative types, such as scatter plots, heat maps, time tables, data constellations, and paraboxes. SAS JMP integrates a vast array of analytics, including regressions, clustering, choice experiments, and so on. Many vendors have also moved beyond nightly batch loads to support dynamic data delivery. For example, Tableau’s drag-and-drop interface provides multi-dimensional visualizations by dynamically querying relational databases, OLAP cubes, and enterprise data warehouses, including Teradata. The result is live, interactive dashboards and reports that can be shared via browser, workbook, and embedding in Web applications.
Versus spreadsheets. Unlike spreadsheets, visual discovery tools provide analysts with unbounded access to sizable volumes of raw data. A 32-bit desktop operating system with 2 GB of RAM can comfortably hold six to eight million rows of data. A 64-bit Windows 2003 server machine with 16 GB of RAM can hold 20–50 million rows of data and 50 concurrent users without performance degradation. Some can hold more data by shuttling infrequently used data to disk.
Visual discovery tools also provide more sophisticated, interactive charting and visualization than spreadsheets. Using a mouse to point-and-click and drag-and-drop, analysts can quickly identify patterns and outliers, explore causal relationships, compare performance among groups, and generate target lists or segments. In fact, most speed-of-thought analysis is done visually, not with pivot tables or grids. (See the sidebar, “Visual Analysis Techniques,” next page.)
Visual discovery tools are quickly moving
upstream, from desktop to departmental and
enterprise applications.

www.tdwi.org 21
Analytical Tools
Versus OLAP. Unlike most OLAP tools, visual discovery tools fit the structure of the question being asked rather than fitting the analysis to the structure of the data, according to William Smith, principal of Claraview, a division of Teradata. Visual discovery tools don’t need an IT person to design a dimensional data model based on rigid dimensions and hierarchies. As a result, the tools aren’t restricted to predefined navigation paths and hierarchies. In addition, the tools use a “load-and-go” approach in which analysts load raw data from multiple sources and simply link tables along common keys to get a unified view of the data set. The tools typically load atomic-level data, not aggregated data via a lengthy calculation process. As a result, most visual discovery tools can be deployed in a few hours or days, depending on the complexity and cleanliness of source data.
Downsides. A BI purist might be quick to point out some of the downsides of visual discovery tools, especially when implemented independently of a BI platform and data warehousing environment: (1) They don’t address data quality issues, (2) they don’t generate standard reports, (3) the data sets are not persistent and must be refreshed from scratch each time there is a change (although some now support dynamic updates or direct query connections), (4) they don’t join large tables; they simply link them in memory, (5) they don’t support dimensions, aggregations, hierarchies, or predefined calculations, unless a designer spends time to model these constructs within the tool’s metadata (if allowed), and (6) performance will degrade if all the data can’t fit in memory.
VISUAL ANALYSIS TECHNIQUES
Visual discovery tools let users analyze data
visually by clicking on charts and visualizations
rather than manipulating tables and grids.
See Figure 17. Common visual discovery
operations include:
• Drag a group or data element onto a chart to display it
• Drag a slider or click on a chart to filter data
• Hover over a data point in a chart to view its details
• Use the cursor to highlight data points in a chart to create a new group
• Click to drill down or across or filter data
• Work with one table or many linked tables in memory
Visual Discovery Tools
Figure 17. Visual discovery tools often resemble dashboards but are much more interactive. In the top image, a dashboard is filtered using checkboxes; in the lower image, every view is filtered by directly clicking one mark in one view.
Visual discovery tools fit the structure of the question being asked rather than fitting the analysis to the structure of the data.

22 TDWI rese arch
BE yOND REPORT ING
Of course, most of these “deficits” don’t bother business analysts. For example, most prefer to work with raw data—defects and all—rather than aggregated or precalculated data filtered through a metadata layer. Most also don’t want the data to change underneath them and prefer to work with snapshots rather than dynamically changing data. The tools can help analysts perform rudimentary quality control because they make it easy to spot outliers.
3. EXCEL-BASED ANALYTICAL TOOLS. Another important toolset for business analysts is Excel-based analytical tools. Because business analysts primarily use Excel to perform the bulk of their analyses, some vendors believe that forcing them to adopt a new interface is ludicrous. “If you can’t beat them, join them” is a common refrain.
Excel plug-ins. Of course, most of these vendors are well aware of the problems that Excel creates when used outside of a managed BI environment. That’s why most vendors offer BI tools in which Excel is the front-end to a BI server of some sort. Even Microsoft has recognized this problem and has gradually begun offering BI-friendly versions of Excel, such as Excel Services (a thin-client version of Excel that works with SharePoint) and SQL Server Table Services (an Excel plug-in for using data mining functions in Analysis Services).
Most leading BI vendors, such as SAP, SAS, and MicroStrategy, currently offer Microsoft Office plug-ins that let users view and interact with predefined BI reports as MS Office documents, such as an Excel spreadsheet. The plug-ins maintain “live” connections to the BI reports so users always view the most up-to-date information. Most visual discovery tools flip that paradigm and source from Excel rather than publish to it. Tableau, for example, enables users to flip back and forth between the spreadsheet data and Tableau’s visualizations of it. Excel is one of the more popular sources of data for visual discovery tools.
Excel clients. Several vendors have gone a step further, making Excel a full-fledged client to their BI servers. This lets business analysts create reports natively in Excel (or an Excel look-alike) instead of having to create the reports in the BI tool and then export them to a file or download them to Excel via a smart plug-in.
For example, several vendors use Excel as a client to access one or more OLAP servers. XL Cubed and Microsoft run Excel natively against Microsoft Analysis Services; SAP’s BEx Analyzer runs against Business Warehouse; and Applix (now owned by IBM via Cognos) uses Excel to access TM1. Other vendors provide spreadsheet-based access to relational databases via an analytic server. Eivia provides thin-client access to an Excel-like spreadsheet that lets users perform what-if analyses against all dimensions and hierarchies in a data warehouse, which is not an easy task!
Other vendors have created Excel-based products that run on a desktop yet can be managed in a centralized fashion. For instance, Lyzasoft shipped a desktop tool in 2008 geared to business analysts that gives them an Excel-like interface to gather, analyze, and present data from multiple sources using an intuitive visual design tool. The tool traces the analyst’s steps, capturing the workflows in a central repository for reuse and auditing/monitoring by analysts and IT administrators, respectively. ModelSheet provides a Web-based modeling environment to create and maintain spreadsheet models, deliver them using conventional spreadsheets, and manage changes in a centralized fashion.
“If you can’t beat them, join them” is a
common refrain.

www.tdwi.org 23
Analytical Tools
Analytical Tools for Super UsersSuper users generally use an organization’s standardized set of BI tools to create reports for colleagues. In the absence of a robust BICC, super users employ a variety of analytical tools, including Excel, visual discovery tools, OLAP, and a new breed of low-cost, integrated reporting and analysis tools that I call “workgroup BI.”
1. WORKGROUP BI. Workgroup BI tools are a new breed of SQL-based reporting suites that are geared to small to midsize businesses (SMB) or workgroups and departments in large organizations that don’t have an active BI governance program or direct IT support.
Workgroup BI toolsets provide super users all the components they need to deliver interactive reports and dashboards in days or weeks with minimal to no IT involvement, including data integration and report authoring tools. The tools don’t require IT to create a semantic layer, a data warehouse, or data mart, and most provide direct access to files, Web pages, and relational sources via ODBC/JDBC interfaces. (Some also access OLAP cubes via MDX.) The user interfaces leverage AJAX and Flex technology to improve application responsiveness and interactivity, and some can easily be embedded in enterprise portals and applications. Finally, most offer simplified pricing—usually unlimited users per server—to encourage sizable deployments and gain a foothold within an enterprise. Departmental deployments range from $20,000 to $50,000.
Most workgroup BI tools are sold by small, start-up vendors that developed their solutions from scratch to work as a highly integrated toolset for building interactive reports and/or dashboards. These include a host of smaller report- or dashboard-centric vendors, such as Inetsoft, LogiXML, eThority, Corda, iDashboards, Visual Mining, Autometrics, Decision Support Panel, Dundas, and Gaussoft. Visual discovery tools also make good workgroup BI tools. For example, Tableau offers a workgroup BI solution starting at $11,800 that requires no professional services and can be implemented in hours.
Leading BI vendors have created SMB packages of their enterprise BI platforms. For example, SAP offers BusinessObjects Edge for $35,000, which includes five concurrent user licenses to Web Intelligence (end-user reporting), Crystal Reports (production reporting), Dashboard Builder,
Workgroup BI tools provide an end-to-
end design environment that makes it
possible for super users to build interactive
reports and dashboards for workgroup and
departmental applications. Workgroup BI
tools share the following characteristics:
• End-to-end toolset for building interactive reports and dashboards
• Single design environment for ETL and report development
• Doesn’t require a data mart or data warehouse
• Direct SQL-based data access without a semantic layer
• Interactive, Web-based dashboards and reports
• Simplified pricing, ranging from $20,000 to $50,000
• Geared to workgroups (up to 25 users) or departments (up to 200 people)
WORkgROUP BI TOOL CHARACTERISTICS
Workgroup BI tools are geared to SMBs or workgroups in large companies that don’t have IT support.
Leading BI vendors now offer SMB versions of their toolsets.

24 TDWI rese arch
BE yOND REPORT ING
InfoView (portal), Explorer (search and exploration), and Data Integrator (ETL) running on SAP’s XI architecture. Not to be outdone, MicroStrategy recently created a major stir in the industry by offering its MicroStrategy Reporting Suite for up to 100 business users at no charge. (The suite includes fully functional Web Reporter and Intelligence server on a single CPU server and online support.) MicroStrategy’s rationale was to change market perceptions that it only offers high-end BI tools, expand its footprint into smaller applications and deals, and grow the number of companies it does business with.
2. BI PLATFORMS. Super users aligned with a BICC will predominantly use the organization’s standard BI platform to create reports for colleagues and expand the boundaries of a MAD-based performance dashboard or BI environment. Super users generally use the BI platform’s end-user reporting tool (versus the report design tool geared to IT), which uses a point-and-click interface and rich semantic layer to create reports and dashboards against data marts and data warehouses. With a solid BI toolset with which to work and ample guidance and support from a BICC, few super users will stray outside the data boundaries set by the BICC and circumscribed by data available in a data warehouse or data marts. However, the BICC may train some of the more advanced super users to use the professional report authoring tool in the BI platform to create standard MAD-based views and reports.
3. VISUAL DISCOVERY TOOLS. As described earlier, visual discovery tools have added application servers so analysts can publish and distribute their work to others. Used in this way, the visual discovery tools become a nice tool for nonaligned super users to create Web-based reports and dashboards for colleagues. These reports are not static; they are “live” and interactive so casual users can analyze data just as business analysts would without the hassle of starting from scratch.
Tools for Analytical ModelersAnalytical modelers are big users of analytical workbenches, Excel, and desktop databases. With IT’s help and encouragement, many are beginning to explore the analytical capabilities built into today’s modern relational database management systems as well as specialized databases geared to high-performance analytical processing.
1. ANALYTICAL WORKBENCHES AND FUNCTIONS. The primary toolset for an analytical modeler is an analytical workbench such as SAS Enterprise Miner, which is the leading workbench on the market today. These workbenches, which typically run on high-powered workstations, pre-integrate and automate a number of functions and tasks that analytic modelers previously had to perform manually or with different tools. For example, the tools enable developers to create and manage project plans; explore and profile data sets; create, test, and validate models; and deploy and manage the models. As a result, analytic workbenches have made it possible for average business and data analysts to create effective models without needing a Ph.D. in statistics.
Graphical modeling. The workbenches graphically model the flow of information and automate many of the tasks required to create and score analytic models. For example, they automatically run multiple models and algorithms against a data set and measure the impacts to see which provides the best performance. Previously, developers had to spend time testing each type of model and algorithm, effectively limiting the options they could test. “I can’t develop models without the types of analytic tools available today since I don’t have programming skills,” says TN Marketing’s Brian Siegel.
“Today, I can create one hundred little steps in a graphical workflow, configure each step, and then hit a button to make the program run. The tool builds the programming logic behind the scenes so I don’t have to.”
Analytic workbenches have made it possible
for the average business analyst to create models without a Ph.D. in statistics.

www.tdwi.org 25
Analytical Tools
Integrated with BI tools. There has been a wave of interest in analytics in the past several years as organizations seek to deliver greater value from their data warehousing investments. Consequently, many BI vendors have been eager to integrate predictive analytics capabilities into their toolsets. For example, SAS also offers BI and visualization tools, which it integrates tightly with its analytical software. SAS embeds statistical functions and programs in its BI and visualization tools and makes it easy to import scores and models into reports. SAS’s visual discovery tool, SAS JMP, also has embedded sophisticated statistical and data mining algorithms.
MicroStrategy embeds many statistical functions that report developers can apply to data. It offers a Data Mining Services option that uses Predictive Model Markup Language (PMML) to import predictive models, which can be applied to report data and the output displayed as columns or recommendations. SAP takes a slightly different approach with its BusinessObjects Predictive Workbench. Users are able to build SPSS Clementine models using the BusinessObjects semantic layer as a data source, thereby allowing organizations to fully leverage their BI investment. Analytical modelers are able to build models using the same data definitions as their business counterparts.
The TIBCO Spotfire Enterprise Analytics Platform provides a statistics and data mining workbench with its Spotfire S+ and Spotfire Miner products. By integrating statistics and predictive models into graphical displays, Spotfire enables a relatively broader base of users to apply powerful methods without requiring expertise in statistics. Tableau Software enables trend modeling within its visual framework by visually providing linear regression modeling capabilities from within the Tableau user interface. ADVIZOR Solutions embeds KXEN data mining algorithms that make it easy to create accurate models without in-depth statistical knowledge.
Text analytics. Many vendors, such as SAS, SAP, Oracle, and Teradata (through partners), now support text analytics, which enable organizations to automatically detect the topic of unstructured information stored in documents, Web pages, and the text fields of applications and databases. Text analytics products can extract relevant entities and facts and store them in relational databases where they can be queried alongside other data. The tools can also categorize documents and generate summaries based on the inherent meaning of the text. Finally, they can be used to analyze sentiment within text, such as whether customers are happy with products or service.
Most employ natural language technology that uses grammar, parts of speech, and specialized dictionaries to dissect the meaning contained in textual information. The aggregated results can be summarized and presented to users, often using charts and graphics, and users can usually drill down to view text in actual documents or records, if they desire.
2. IN-DATABASE ANALYTICS. Like business analysts, analytical modelers want direct access to raw data so they can massage and manipulate it to answer questions and solve problems. Analytical modelers typically work with much larger volumes of data and more complex data sets (i.e., more variables or fields per row) and require much greater processing power when running models against a corporate database.
Traditionally, analytical modelers patch together a local data set from multiple sources both inside and outside the organization against which they can create a model using a desktop workstation. To score the model, they either download the corporate database to their workstation, or more realistically, recode the model in SQL or C and run it as a function within the corporate database. Obviously, either approach involves moving large volumes of data in and around a corporate network and requires analytical modelers to learn how to write code.
Analytical modelers work with larger volumes of data and more complex data sets.
26 TDWI rese arch
BE yOND REPORT ING
Many enlightened modelers and IT administrators now recognize that there is a more efficient and cost-effective way to support the analytical modeling process that minimizes data movement. Leading-edge practitioners are moving as much data-centric processing as possible into a corporate data warehouse or database to save time and costs. This approach, which is known as in-database analytics, minimizes data movement and enables analytical modelers to leverage the power of a database management system running on a high-end server to handle various steps in the modeling process, particularly data exploration, data preparation, and scoring. This frees modelers from having to sample data (because they often can’t download all of it to their workstations) and speeds processing. Several database vendors, including Oracle and Teradata, now offer analytic functions within the database to support the creation and scoring of predictive models.
Flattened data. Of course, there are some obstacles to in-database analytics. First, a corporate database or warehouse is only as good as the data that it contains. In most cases, analytical modelers need to access more data than is in the data warehouse. To be useful, IT administrators need to understand analytical modelers’ information requirements and then populate the data warehouse with that data, including external data, and design ETL processes to format the data in the preferred way. (Typically, modelers create “flattened” data sets that consist of a single, wide table with hundreds of columns.) IT administrators are successful if they populate the data warehouse with 80% of the data that analytical modelers require for a mining project.
Sandboxes. To accommodate the other 20% or more of missing data, IT administrators often set up “sandboxes” within a corporate data warehouse and give analytical modelers free rein within it to upload their own data, merge it with warehouse data, and run queries and calculations until they get the data in a shape and form they prefer. Typically, database administrators set parameters on these sandboxes to prevent the modelers’ activities from bogging down performance for other users of the data warehouse. To avoid contention issues, some organizations implement the sandboxes as dependent data marts on dedicated servers.
User-defined functions. In addition, it takes effort to convert analytical functions into code that can run natively in the database and can be invoked with SQL calls. For example, Teradata and SAS have kicked off a series of programs to convert SAS functions into Teradata user-defined functions (UDFs) and educate SAS analysts on how to create and leverage these functions. One of the programs, the SAS Scoring Accelerator for Teradata, converts SAS Enterprise Miner models into Teradata UDFs. Another program, the Teradata Data Set Builder for SAS, generates optimized SQL to facilitate in-database exploration and the creation of analytic data sets. Teradata also offers an Analytic Sandbox Service that enables customers to build analytic sandboxes within Teradata using workload management capabilities augmented with governance policies.
3. HIGH-PERFORMANCE ANALYTICAL PLATFORMS. Given the rapid growth in data volumes, rising number of users, and increasing query complexity, it’s no surprise that query performance in many data warehouses and large data marts is degrading. The intersection of big data and deep analytics has created the perfect storm. Many database management systems were designed to run transaction workloads, not complex analytical queries and algorithms against millions of records. Traditional relational database platforms choke on such workloads or, at best, require expensive hardware upgrades and lots of care and feeding that make them cost-prohibitive for all but the biggest companies.
As a result, data-driven companies that want to analyze terabytes or petabytes of data have begun to experiment with new technologies designed from the ground up to handle complex queries against big data. These high-performance analytic platforms—which some people label generically as “data
The intersection of big data and deep
analytics has created the perfect storm.
www.tdwi.org 27
Analytical Tools
warehousing appliances”—generally consist of massively parallel (MPP) databases running on either preconfigured or off-the-shelf commodity hardware. Because the systems are purpose-built and designed largely as “plug-and-play” systems, their price/performance and total cost of ownership are jaw dropping for most grizzled data warehousing veterans who have tried to remediate poor query performance by pitching multi-million-dollar data warehousing upgrades to skeptical executives.
Many companies are deploying high-performance analytic platforms to off-load complex analytic processing from overburdened data warehouses. This includes sequential pattern analysis, time-series tracking and forecasting, statistical analytics (e.g., Bayesian, regression, classification, association, clustering), data mining operations (decision trees, neural networks), simulation, optimization, and complex data profiling and transformation operations. Compared to traditional databases that require significant configuration and setup, these systems are virtually “load and go”: you can wheel in an appliance, load data, and begin analyzing data almost immediately.3
Teradata, for example, added three appliances last fall to complement its high-end active enterprise data warehouse platform. The Teradata 551 is a data mart or test/development appliance that holds up to 6 TB; the Teradata 2550 is geared to entry-level data warehouses or analytical sandboxes and holds up to 140 TB of data; and the Teradata 1550 is geared to running fast table scans on extreme volumes of data, as much as 50 petabytes. All three appliances are aggressively priced to compete in the burgeoning appliance market and targeted at specific types of uses and workloads. In contrast, Teradata’s enterprise data warehouse platform (i.e., Teradata 5555) uses mixed-workload capabilities (which the appliances don’t support) to handle a variety of applications and processing loads typical of an enterprise data warehouse.
Many high-performance analytic platforms provide built-in support for user-defined functions that manipulate the data in ways that can’t easily be done with SQL. As a result, many analysts export data sets and perform the calculations on other platforms. Teradata supports third-party algorithms and models as UDFs and stored procedures that are executed in parallel along with SQL. Netezza, which kicked off the DW appliance boomlet in 2002, supports UDFs written as compiled C++ code. Greenplum and Aster support MapReduce functions that can be invoked with SQL.
3 While appliances promise “load and go” deployments, they do require setup and configuration. But deployment times are measured in days or weeks, rather than months.
Many companies are deploying high-performance analytic platforms to off-load complex, analytic processing.

28 TDWI rese arch
BE yOND REPORT ING
RecommendationsBI teams have many options today for outfitting users with analytical tools that let them analyze information in an iterative fashion to understand trends, compare performance, and identify root causes. To optimize the deployment of analytical capabilities, we recommend BI teams take the following actions:
1. Distinguish casual versus power users. Understand that casual users and power users have different information requirements. Don’t give casual users tools designed for power users or vice versa. The biggest mistake that organizations make is providing casual users with BI tools that are too powerful and power users with tools that are not powerful enough.
2. Know the nuances of self-service BI. Self-service BI is a wonderful concept when applied appropriately. Self-service BI for casual users entails letting users navigate predefined sets of data using prompts or drill paths (i.e., ad hoc report navigation). Self-service BI for power users entails giving users authoring tools to create reports and dashboards from scratch (i.e., ad hoc report creation). Mixing the two is a recipe for disaster.
3. Classify users. Classify your users into distinct groups based on their preferred method of interacting with information. As a guide, you can classify users by role, tasks, technical astuteness, information requirements, or some combination of these. Many users may fall into multiple categories because they play multiple roles in an organization.
4. Fit tools to categories of users. Once you’ve categorized users, find the tools or modules within a BI platform that are best suited to each category. BI platforms provide flexibility, since they offer multiple tools in a single package running on a unified architecture, but these tools may not all be best of breed or integrated. Most organizations find it necessary to standardize on two or three tools: one for reporting, another for analysis, and a third for predictions.
5. Evaluate new categories of business analyst tools. Two of the newest categories of analytical tools are visual discovery and workgroup BI tools. The former are geared to individual business analysts, although they can also be used to create interactive departmental dashboards. The latter are geared to super users in small and midsize companies or departments in larger organizations that don’t have IT support or established BI standards.
6. Evaluate new analytical modeling techniques. Organizations should empower their savvy business and data analysts to create analytical models using the new generation of analytical workbenches that don’t require a Ph.D. to use. These workbenches now integrate with BI tools and relational databases, increasing the value and timeliness of analytical models.
7. Evaluate high-performance analytic platforms. These specialized databases, which run in parallel on commodity or preconfigured hardware, can be used to offload expensive analytical processing from overburdened data warehouses that don’t have robust mixed- workload management. They can also be used to create powerful sandboxes so business analysts can experiment without interfering with other BI users or creating analytical silos.

Research Sponsors
ADVIZOR Solutions, Inc.www.advizorsolutions.com
ADVIZOR Visual Discovery™ software enables people to make better and faster fact-based decisions from their business data. Built on patented visualization software from Bell Labs and best-of-breed predictive analytics from kXEN, ADVIZOR empowers business people to understand and analyze information without relying on others to prepare or interpret the results. ADVIZOR enables this through: • Simple and clear visual display• Easy ad hoc interaction and analysis with a mouse• Flexible thick and thin client deployments• Tight integration with common databases and office tools
ADVIZOR is world-class in empowering people to display, analyze, and share their business information.
MicroStrategywww.microstrategy.com
MicroStrategy is the leading independent provider of open systems business intelligence software. Founded in 1989, MicroStrategy provides integrated reporting, analysis, and monitoring software that helps leading organizations worldwide make better business decisions every day. Companies choose MicroStrategy for its advanced technical capabilities, sophisticated analytics, and superior data and user scalability.
With more than 15 years of industry experience, thousands of customer successes, and a reputation for innovation and leadership, MicroStrategy is the clear choice for your business intelligence investment.
Oraclewww.oracle.com
Oracle is the leader in Enterprise Performance Management (EPM), unifying performance management and business intelligence, supporting a broad range of strategic, financial and operational processes. Oracle provides a complete and integrated system for managing and optimizing enterprise wide performance. To learn more, visit www.oracle.com/epm or call us at 800-ORACLE-1.
SAPwww.sap.com
SAP is the world’s leading provider of business software, offering applications and services that enable companies of all sizes and in more than 25 industries to become best-run businesses. SAP has more than 82,000 customers in over 120 countries. The SAP® BusinessObjects™ portfolio transforms the way the world works by connecting people, information and businesses. With open, heterogeneous solutions in the areas of business intelligence; information management; governance, risk and compliance; and enterprise performance management, the SAP BusinessObjects portfolio enables organizations to close the gap between business strategy and execution.
SASwww.sas.com
SAS is the leader in business analytics software and services, and the largest independent vendor in the business intelligence market. Through innovative solutions delivered within an integrated framework, SAS helps customers at more than 45,000 sites improve performance and deliver value by making better decisions faster. Since 1976 SAS has been giving customers around the world THE POWER TO kNOW®.
Tableau Softwarewww.tableausoftware.com
Tableau Software builds software for data visualization and rapid-fire business intelligence. Our mission is simple: help people see and understand data. Tableau’s award-winning products are easy to deploy and make analytics and business intelligence fast, easy and fun. They include Tableau Desktop, Tableau Server and the no-charge Tableau Reader.
We understand the needs of businesspeople, non-technical and technical alike, when it comes to retrieving and analyzing large volumes of data. As a result, Tableau has already attracted over 30,000 licensed users in companies from one-person businesses to the world’s largest organizations. For a free trial, visit www.tableausoftware.com/trial.
TIBCO Spotfirehttp://spotfire.tibco.com
TIBCO Software Inc. (NASDAQ: TIBX) is a leading provider of enterprise analytics software for next generation business intelligence. TIBCO Spotfire products offer a visual and interactive experience that helps professionals quickly discover new and actionable insights in information. Distinguished by its speed to insight and adaptability to specific business challenges, Spotfire rapidly reveals unseen threats and new opportunities, creating significant economic value. Spotfire customers include industry leaders among the Global 2000 that have deployed Spotfire analytics to gain an information advantage over their competitors.
Teradata Corporation www.teradata.com
Teradata is the acknowledged global leader in data warehouse innovation and analytical solution development. Every day we raise our customers’ intelligence to higher levels, making them more focused and competitive by gathering enterprise information and extracting actionable insight.
Teradata elevates enterprise intelligence by giving every decision maker the insight required for smarter, faster decisions. We add value and reveal opportunity across more dimensions than any competing solution.
In every industry and geography, our technologies and expertise make the difference. Simply put, Teradata solutions make companies smarter and give them the competitive advantage to win.

1201 Monster Road SW
Suite 250
Renton, WA 98057
T 425.277.9126
F 425.687.2842
www.tdwi.org
TDWI Research provides research and advice for BI professionals worldwide. TDWI Research focuses exclusively on BI/DW issues and teams up with industry practitioners to deliver both broad and deep understanding of the business and technical issues surrounding the deployment of business intelligence and data warehousing solutions. TDWI Research offers reports, commentary, and inquiry services via a worldwide Membership program and provides custom research, benchmarking, and strategic planning services to user and vendor organizations.
TDWI rese a rch
Related Documents