Welcome message from author
This document is posted to help you gain knowledge. Please leave a comment to let me know what you think about it! Share it to your friends and learn new things together.
Transcript
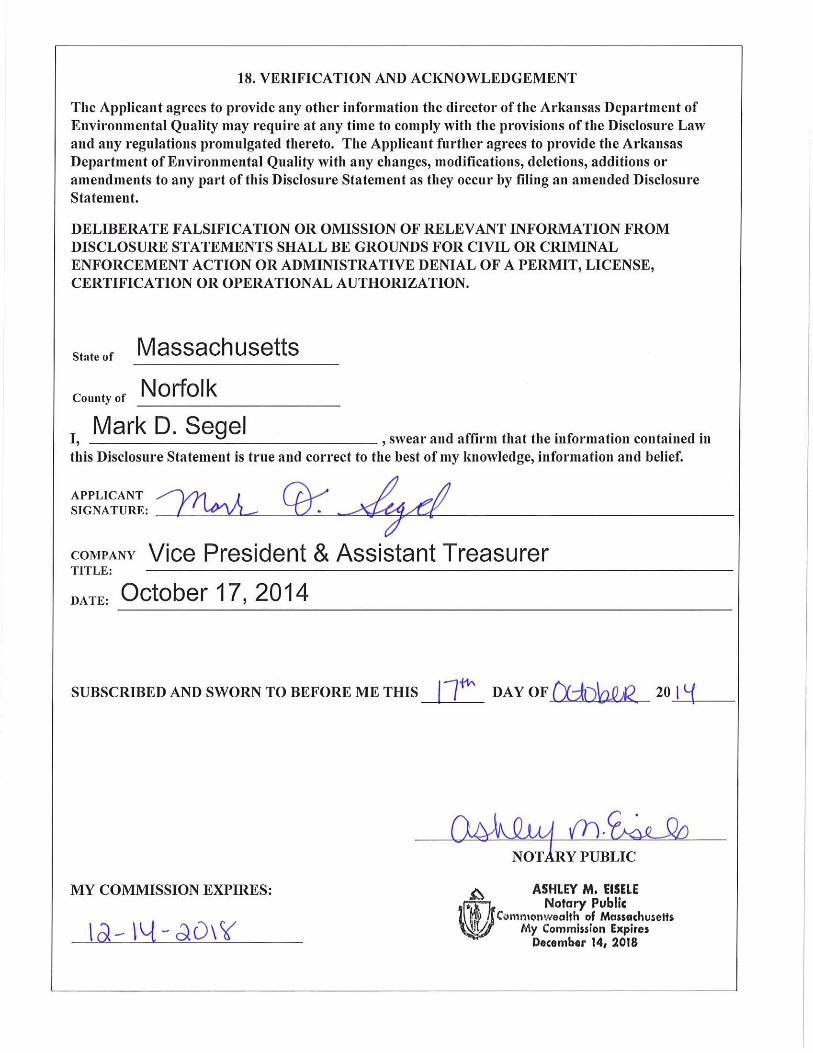
Jeffrey wr Bulloa,secmtary astate
AUTHENTION: 1096527
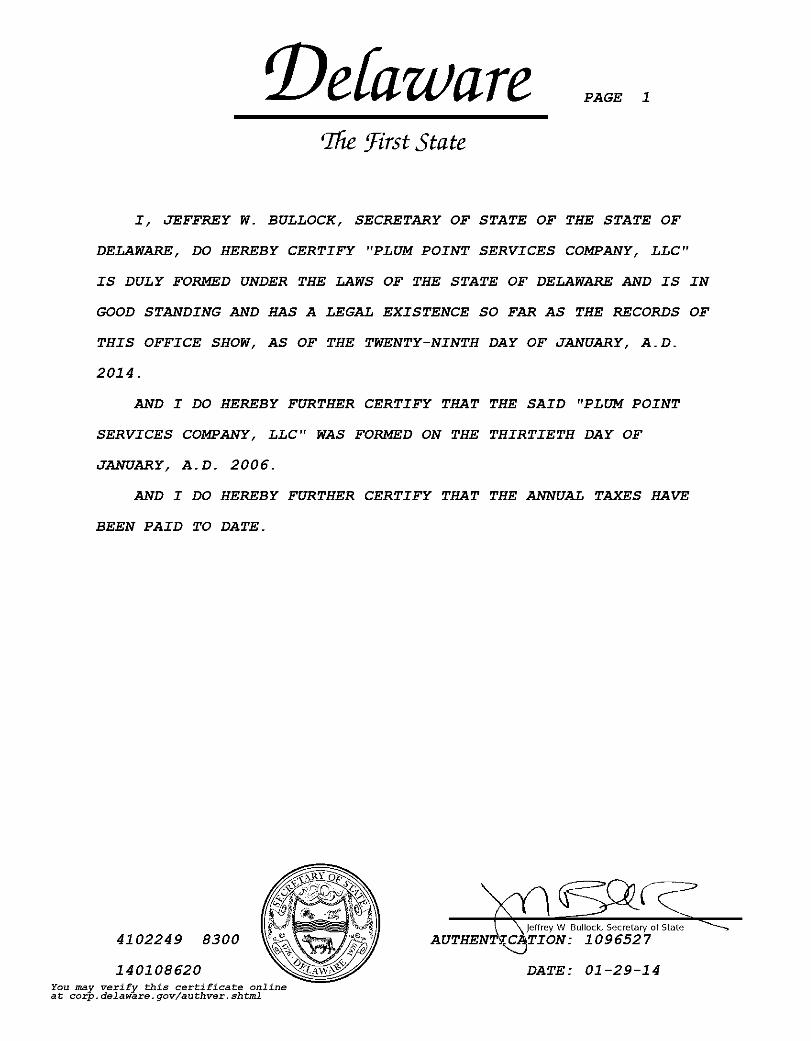
Delaware PAGE 1
The First State
I, JEFFREY W. BULLOCK, SECRETARY OF STATE OF THE STATE OF
DELAWARE, DO HEREBY CERTIFY "PLUM POINT SERVICES COMPANY, LLC"
IS DULY FORMED UNDER THE LAWS OF THE STATE OF DELAWARE AND IS IN
GOOD STANDING AND HAS A LEGAL EXISTENCE SO FAR AS THE RECORDS OF
THIS OFFICE SHOW, AS OF THE TWENTY—NINTH DAY OF JANUARY, A.D.
2014.
AND I DO HEREBY FURTHER CERTIFY THAT THE SAID "PLUM POINT
SERVICES COMPANY, LLC" WAS FORMED ON THE THIRTIETH DAY OF
JANUARY, A.D. 2006.
AND I DO HEREBY FURTHER CERTIFY THAT THE ANNUAL TAXES HAVE
BEEN PAID TO DATE.
4102249 8300,. ?-28-..6..4,`"
140108620AtAwS'z'& You may verify this certificate online--- at corp. delaware . gov/authver . shtml
DATE: 01-29-14


UNITED STATES SECURITIES AND EXCHANGE COMMISSION
WASHINGTON, D.C. 20549
FORM 10-Q
(Mark One)
Quarterly report pursuant to Section 13 or 15(d) of the Securities Exchange Act of 1934
For the quarterly period ended March 31, 2014 or
� Transition report pursuant to Section 13 or 15(d) of the Securities Exchange Act of 1934
For the transition period from ______________ to ____________.
Commission file number: 1-3368
THE EMPIRE DISTRICT ELECTRIC COMPANY (Exact name of registrant as specified in its charter)
Kansas (State of Incorporation)
44-0236370 (I.R.S. Employer Identification No.)
602 S. Joplin Avenue, Joplin, Missouri
(Address of principal executive offices)
64801
(zip code)
Registrant's telephone number: (417) 625-5100
Indicate by check mark whether the registrant (1) has filed all reports required to be filed by Section 13 or 15(d) of the Securities Exchange Act of 1934 during the preceding 12 months (or for such shorter period that the registrant was required to file such reports), and (2) has been subject to such filing requirements for the past 90 days. Yes √√√√ No ___ Indicate by check mark whether the registrant has submitted electronically and posted on its corporate Web site, if any, every Interactive Data File required to be submitted and posted pursuant to Rule 405 of Regulation S-T (§232.405 of this chapter) during the preceding 12 months (or for such shorter period that the registrant was required to submit and post such files). Yes √√√√ No ___
Indicate by check mark whether the registrant is a large accelerated filer, an accelerated filer, a non-accelerated filer, or a smaller reporting company. See the definitions of “large accelerated filer,” “accelerated filer” and “smaller reporting company” in Rule 12b-2 of the Exchange Act.
Large accelerated filer √√√√ Accelerated filer __ Non-accelerated filer __ (Do not check if a smaller reporting company) Smaller reporting company __
Indicate by check mark whether the registrant is a shell company (as defined in Rule 12b-2 of the Exchange Act). Yes___ No √√√√
As of April 30, 2014, 43,204,872 shares of common stock were outstanding.

2
THE EMPIRE DISTRICT ELECTRIC COMPANY
INDEX PAGE
Forward Looking Statements ............................................................................ 3 Part I - Financial Information: Item 1. Financial Statements: a. Consolidated Statements of Income ........................................................... 4 b. Consolidated Balance Sheets ..................................................................... 6 c. Consolidated Statements of Cash Flows .................................................... 8 d. Notes to Consolidated Financial Statements............................................... 9 Item 2. Management's Discussion and Analysis of Financial Condition and Results of
Operations 25
Executive Summary.. ........................................................................................ 25 Results of Operations.. ..................................................................................... 27 Rate Matters ..................................................................................................... 34 Markets and Transmission ................................................................................ 34 Liquidity and Capital Resources ....................................................................... 35 Contractual Obligations... ................................................................................. 39 Dividends... ....................................................................................................... 39
Off-Balance Sheet Arrangements ..................................................................... 40 Critical Accounting Policies and Estimates. ...................................................... 40 Recently Issued Accounting Standards. ........................................................... 40 Item 3. Quantitative and Qualitative Disclosures About Market Risk............................. 40 Item 4. Controls and Procedures .................................................................................. 42 Part II - Other Information: 42 Item 1. Legal Proceedings ............................................................................................ 42 Item 1A. Risk Factors ..................................................................................................... 42 Item 2. Unregistered Sales of Equity Securities and Use of Proceeds – (none) Item 3. Defaults Upon Senior Securities - (none) Item 4. Mine Safety Disclosures - (none) Item 5. Other Information ............................................................................................. 43 Item 6. Exhibits ............................................................................................................. 43 Signatures ........................................................................................................ 44

3
FORWARD LOOKING STATEMENTS
Certain matters discussed in this quarterly report are “forward-looking statements” intended to qualify for the safe harbor from liability established by the Private Securities Litigation Reform Act of 1995. Such statements address or may address future plans, objectives, expectations and events or conditions concerning various matters such as capital expenditures, earnings, pension and other costs, competition, litigation, our construction program, our generation plans, our financing plans, potential acquisitions, rate and other regulatory matters, liquidity and capital resources and accounting matters. Forward-looking statements may contain words like “anticipate”, “believe”, “expect”, “project”, “objective” or similar expressions to identify them as forward-looking statements. Factors that could cause actual results to differ materially from those currently anticipated in such statements include:
• weather, business and economic conditions and other factors which may impact sales volumes and customer growth;
• the costs and other impacts resulting from natural disasters, such as tornados and ice storms;
• the amount, terms and timing of rate relief we seek and related matters;
• the results of prudency and similar reviews by regulators of costs we incur, including capital expenditures and fuel and purchased power costs, including any regulatory disallowances that could result from prudency reviews;
• unauthorized physical or virtual access to our facilities and systems and acts of terrorism, including, but not limited to, cyber-terrorism;
• legislation and regulation, including environmental regulation (such as NOx, SO2, mercury, ash and CO2) and health care regulation;
• the periodic revision of our construction and capital expenditure plans and cost and timing estimates;
• costs and activities associated with markets and transmission, including the Southwest Power Pool (SPP) regional transmission organization (RTO) transmission development, and SPP Day-Ahead Market;
• the impact of energy efficiency and alternative energy sources;
• electric utility restructuring,
• spending rates, terminal value calculations and other factors integral to the calculations utilized to test the impairment of goodwill, in addition to market and economic conditions which could adversely affect the analysis and ultimately negatively impact earnings;
• volatility in the credit, equity and other financial markets and the resulting impact on short term debt costs and our ability to issue debt or equity securities, or otherwise secure funds to meet our capital expenditure, dividend and liquidity needs;
• the effect of changes in our credit ratings on the availability and cost of funds;
• the performance of our pension assets and other post employment benefit plan assets and the resulting impact on our related funding commitments;
• our exposure to the credit risk of our hedging counterparties;
• the cost and availability of purchased power and fuel, including costs and activities associated with the SPP Day-Ahead Market, and the results of our activities (such as hedging) to reduce the volatility of such costs;
• interruptions or changes in our coal delivery, gas transportation or storage agreements or arrangements;
• operation of our electric generation facilities and electric and gas transmission and distribution systems, including the performance of our joint owners;
• changes in accounting requirements;
• costs and effects of legal and administrative proceedings, settlements, investigations and claims;
• performance of acquired businesses; and
• other circumstances affecting anticipated rates, revenues and costs.
All such factors are difficult to predict, contain uncertainties that may materially affect actual results, and may be beyond our control. New factors emerge from time to time and it is not possible for management to predict all such factors or to assess the impact of each such factor on us. Any forward-looking statement speaks only as of the date on which such statement is made, and we do not undertake any obligation to update any forward-looking statement to reflect events or circumstances after the date on which such statement is made.
We caution you that any forward-looking statements are not guarantees of future performance and involve known and unknown risk, uncertainties and other factors which may cause our actual results, performance or achievements to differ materially from the facts, results, performance or achievements we have anticipated in such forward-looking statements.

4
PART I. FINANCIAL INFORMATION
Item 1. Financial Statements
THE EMPIRE DISTRICT ELECTRIC COMPANY CONSOLIDATED STATEMENTS OF INCOME (UNAUDITED) Three Months Ended March 31, 2014 2013 (000’s except per share amounts) Operating revenues: Electric $ 153,089 $ 128,762 Gas 24,609 20,493 Other 1,975 1,885 179,673 151,140 Operating revenue deductions: Fuel and purchased power 55,586 45,303 Cost of natural gas sold and transported 15,045 11,925 Regulated operating expenses 27,957 27,137 Other operating expenses 716 794 Maintenance and repairs 10,257 9,157 Loss on plant disallowance - 2,409 Depreciation and amortization 17,940 16,100 Provision for income taxes 12,174 7,454 Other taxes 10,510 9,003 150,185 129,282 Operating income 29,488 21,858 Other income and (deductions): Allowance for equity funds used during construction 1,252 526 Interest income 41 508 Benefit/(provision) for other income taxes 53 (28) Other - non-operating expense, net (345) (289) 1,001 717 Interest charges: Long-term debt 10,105 9,951 Short-term debt 5 47 Allowance for borrowed funds used during construction (741) (305) Other 215 252 9,584 9,945 Net income $ 20,905 $ 12,630 Weighted average number of common shares outstanding - basic 43,111 42,564 Weighted average number of common shares outstanding – diluted
43,144 42,587
Total earnings per weighted average share of common stock – basic and diluted
$ 0.48 $ 0.30
Dividends declared per share of common stock $ 0.255 $ 0.250
See accompanying Notes to Consolidated Financial Statements.

5
THE EMPIRE DISTRICT ELECTRIC COMPANY CONSOLIDATED STATEMENTS OF INCOME (UNAUDITED) Twelve Months Ended
March 31,
2014 2013 (000’s except per share amounts) Operating revenues: Electric $ 560,740 $ 519,690 Gas 54,157 44,659 Other 7,966 6,745 622,863 571,094 Operating revenue deductions: Fuel and purchased power 185,690 178,971 Cost of natural gas sold and transported 28,914 21,977 Regulated operating expenses 106,153 98,160 Other operating expenses 3,064 2,926 Maintenance and repairs 41,973 40,476 Loss on plant disallowance - 2,409 Depreciation and amortization 71,146 61,612 Provision for income taxes 42,185 35,466 Other taxes 36,445 31,828 515,570 473,825 Operating income 107,293 97,269 Other income and (deductions): Allowance for equity funds used during construction 4,579 1,623 Interest income 100 1,300 Benefit for other income taxes 54 25 Other - non-operating expense, net (1,273) (1,973) 3,460 975 Interest charges: Long-term debt 40,509 39,488 Short-term debt 17 205 Allowance for borrowed funds used during construction (2,522) (1,038) Other 1,028 1,083 39,032 39,738 Net income $ 71,721 $ 58,506 Weighted average number of common shares outstanding - basic 42,916 42,385 Weighted average number of common shares outstanding – diluted
42,936 42,401
Total earnings per weighted average share of common stock – basic and diluted
$ 1.67 $ 1.38
Dividends declared per share of common stock $ 1.01 $ 1.00 See accompanying Notes to Consolidated Financial Statements.
6
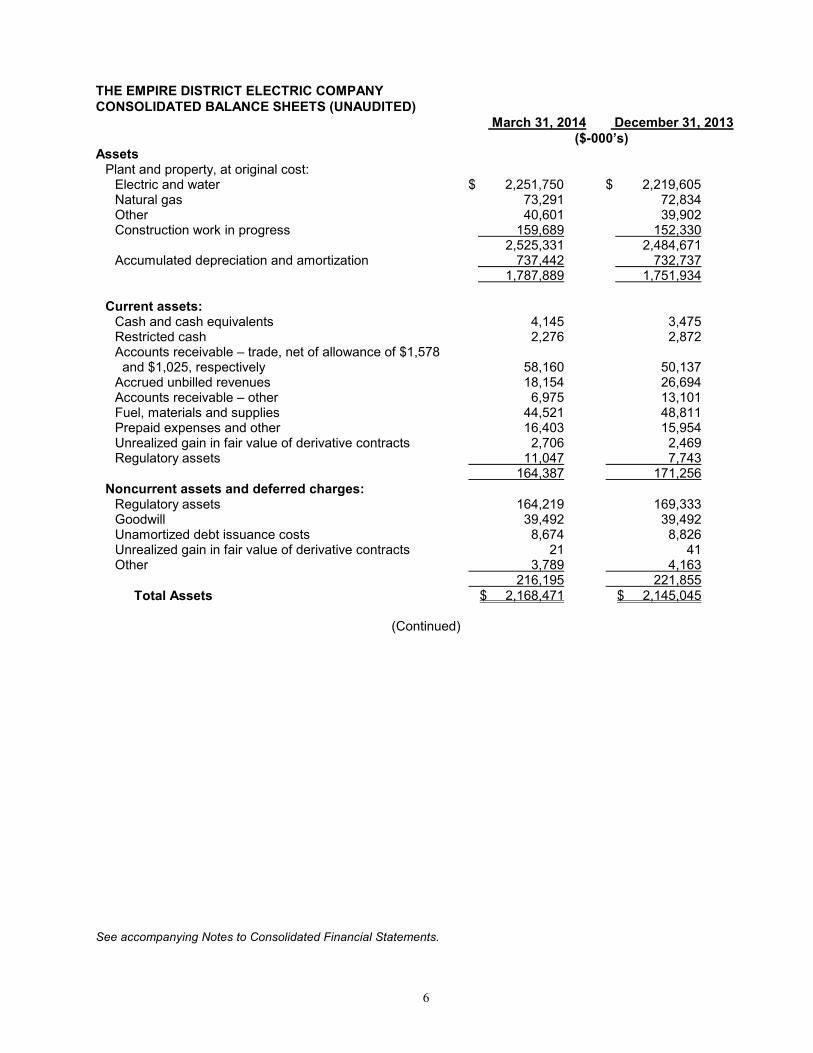
THE EMPIRE DISTRICT ELECTRIC COMPANY CONSOLIDATED BALANCE SHEETS (UNAUDITED)
March 31, 2014 December 31, 2013 ($-000’s) Assets Plant and property, at original cost: Electric and water $ 2,251,750 $ 2,219,605 Natural gas 73,291 72,834 Other 40,601 39,902 Construction work in progress 159,689 152,330
2,525,331 2,484,671 Accumulated depreciation and amortization 737,442 732,737
1,787,889 1,751,934 Current assets: Cash and cash equivalents 4,145 3,475 Restricted cash 2,276 2,872 Accounts receivable – trade, net of allowance of $1,578 and $1,025, respectively 58,160 50,137 Accrued unbilled revenues 18,154 26,694 Accounts receivable – other 6,975 13,101 Fuel, materials and supplies 44,521 48,811 Prepaid expenses and other 16,403 15,954 Unrealized gain in fair value of derivative contracts 2,706 2,469 Regulatory assets 11,047 7,743
164,387 171,256 Noncurrent assets and deferred charges: Regulatory assets 164,219 169,333 Goodwill 39,492 39,492 Unamortized debt issuance costs 8,674 8,826 Unrealized gain in fair value of derivative contracts 21 41 Other 3,789 4,163
216,195 221,855 Total Assets $ 2,168,471 $ 2,145,045
(Continued)
See accompanying Notes to Consolidated Financial Statements.
7
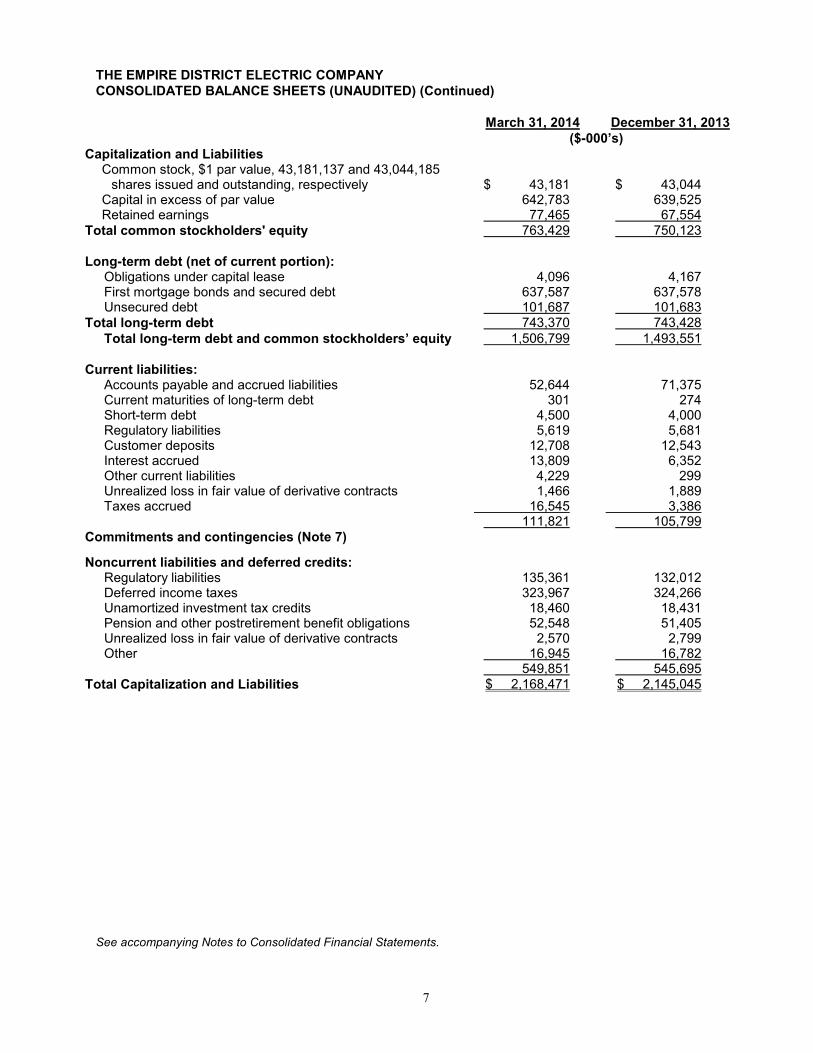
THE EMPIRE DISTRICT ELECTRIC COMPANY CONSOLIDATED BALANCE SHEETS (UNAUDITED) (Continued)
March 31, 2014 December 31, 2013 ($-000’s) Capitalization and Liabilities Common stock, $1 par value, 43,181,137 and 43,044,185 shares issued and outstanding, respectively $ 43,181 $ 43,044
Capital in excess of par value 642,783 639,525 Retained earnings 77,465 67,554
Total common stockholders' equity 763,429 750,123 Long-term debt (net of current portion):
Obligations under capital lease 4,096 4,167 First mortgage bonds and secured debt 637,587 637,578 Unsecured debt 101,687 101,683
Total long-term debt 743,370 743,428 Total long-term debt and common stockholders’ equity 1,506,799 1,493,551
Current liabilities:
Accounts payable and accrued liabilities 52,644 71,375 Current maturities of long-term debt 301 274 Short-term debt 4,500 4,000 Regulatory liabilities 5,619 5,681 Customer deposits 12,708 12,543 Interest accrued 13,809 6,352 Other current liabilities 4,229 299 Unrealized loss in fair value of derivative contracts 1,466 1,889 Taxes accrued 16,545 3,386 111,821 105,799
Commitments and contingencies (Note 7) Noncurrent liabilities and deferred credits:
Regulatory liabilities 135,361 132,012 Deferred income taxes 323,967 324,266 Unamortized investment tax credits 18,460 18,431 Pension and other postretirement benefit obligations 52,548 51,405 Unrealized loss in fair value of derivative contracts 2,570 2,799 Other 16,945 16,782 549,851 545,695
Total Capitalization and Liabilities $ 2,168,471 $ 2,145,045 See accompanying Notes to Consolidated Financial Statements.

8
THE EMPIRE DISTRICT ELECTRIC COMPANY CONSOLIDATED STATEMENTS OF CASH FLOWS (UNAUDITED) Three Months Ended
March 31, 2014 2013 ($-000’s) Operating activities: Net income $ 20,905 $ 12,630 Adjustments to reconcile net income to cash flows from operating activities:
Depreciation and amortization including regulatory items 19,491 16,813 Pension and other postretirement benefit costs, net of contributions 3,320 3,423 Deferred income taxes and unamortized investment tax credit, net 2,145 5,243 Allowance for equity funds used during construction (1,252) (526) Stock compensation expense 1,381 1,351 Loss on plant disallowance - 2,409 Reverse gain on sale of assets - 1,236 Non-cash (gain)/loss on derivatives (683) 7 Cash flows impacted by changes in: Accounts receivable and accrued unbilled revenues 7,326 (640) Fuel, materials and supplies 4,290 7,563 Prepaid expenses, other current assets and deferred charges (1,326) 119 Accounts payable and accrued liabilities (22,873) (19,497) Interest, taxes accrued and customer deposits 20,781 12,820 Asset retirement obligations (17) - Other liabilities and other deferred credits 1,084 1,126 Net cash provided by operating activities 54,572 44,077 Investing activities: Capital expenditures – regulated (45,882) (37,398) Capital expenditures and other investments – non-regulated (481) (362) Restricted cash 596 2,585 Net cash used in investing activities (45,767) (35,175) Financing activities: Proceeds from issuance of common stock, net of issuance costs 2,416 2,764 Net short-term borrowings/(repayments) 500 (1,000) Dividends (10,994) (10,644) Other (57) (227) Net cash used in financing activities (8,135) (9,107) Net increase (decrease) in cash and cash equivalents 670 (205) Cash and cash equivalents at beginning of period 3,475 3,375 Cash and cash equivalents at end of period $ 4,145 $ 3,170
See accompanying Notes to Consolidated Financial Statements.

9
NOTES TO CONSOLIDATED FINANCIAL STATEMENTS (UNAUDITED)
Note 1 - Summary of Significant Accounting Policies
We operate our businesses as three segments: electric, gas and other. The Empire District Electric Company (EDE), a Kansas corporation organized in 1909, is an operating public utility engaged in the generation, purchase, transmission, distribution and sale of electricity in parts of Missouri, Kansas, Oklahoma and Arkansas. As part of our electric segment, we also provide water service to three towns in Missouri. The Empire District Gas Company (EDG) is our wholly-owned subsidiary which provides natural gas distribution to customers in 48 communities in northwest, north central and west central Missouri. Our other segment consists of our fiber optics business. The accompanying interim financial statements do not include all disclosures included in the annual financial statements and therefore should be read in conjunction with the financial statements and notes thereto included in our Annual Report on Form 10-K for the fiscal year ended December 31, 2013. The information furnished reflects all adjustments which are in our opinion necessary to state fairly the results for the interim periods as well as present these periods on a consistent basis with the financial statements for the fiscal year ended December 31, 2013. Note 2 - Recently Issued and Proposed Accounting Standards
There were no recently issued or newly proposed accounting standards in the first quarter of 2014 required to be disclosed.
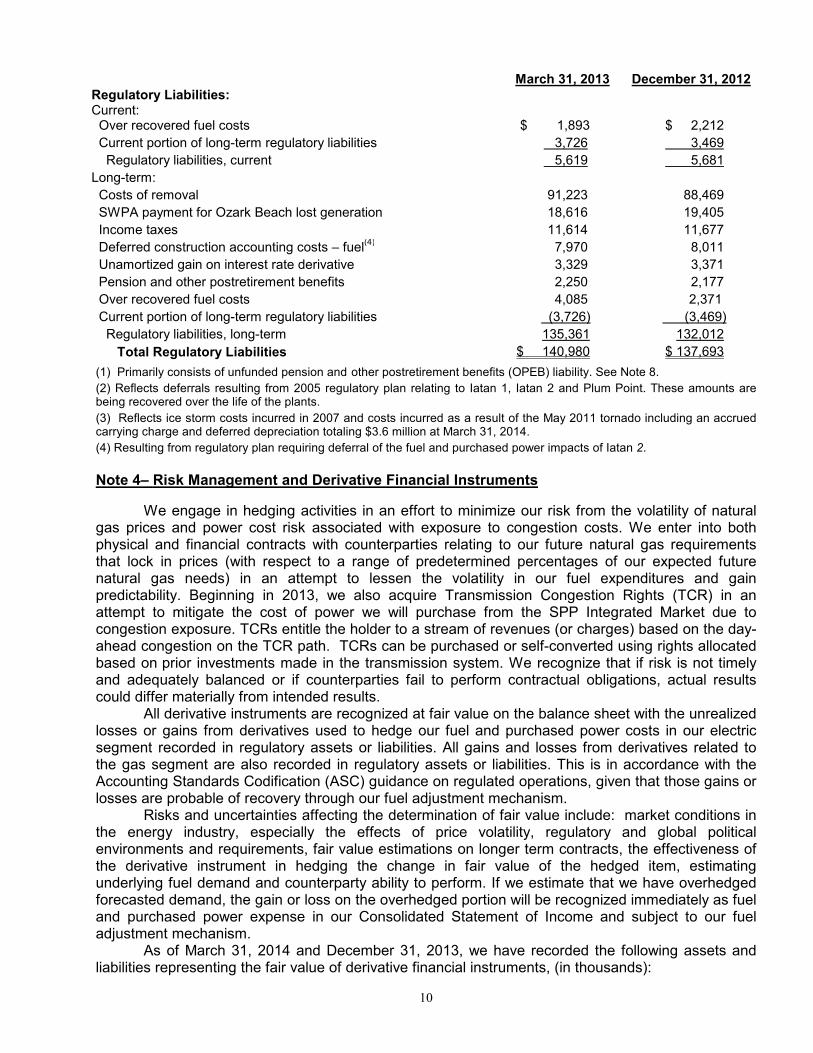
See Note 1 under “Notes to Consolidated Financial Statements” in our Annual Report on Form 10-K for the year ended December 31, 2013 for further information regarding recently issued and proposed accounting standards. Note 3– Regulatory Matters
The following table sets forth the components of our regulatory assets and liabilities on our consolidated balance sheet (in thousands).
Regulatory Assets and Liabilities
March 31, 2014 December 31, 2013 Regulatory Assets: Current: Under recovered fuel costs $ 4,165 $ 1,411 Current portion of long-term regulatory assets 6,882 6,332 Regulatory assets, current 11,047 7,743 Long-term: Pension and other postretirement benefits
(1) 67,895 70,035
Income taxes 47,708 48,033 Deferred construction accounting costs
(2) 16,163 16,275
Unamortized loss on reacquired debt 10,910 11,078 Unsettled derivative losses – electric segment 3,673 4,269 System reliability – vegetation management 6,639 7,539 Storm costs
(3) 4,738 4,911
Asset retirement obligation 4,729 4,673 Customer programs 4,877 4,935 Unamortized loss on interest rate derivative 978 989 Deferred operating and maintenance expense 1,688 2,095 Current portion of long-term regulatory assets (6,882) (6,332) Other 1,103 833 Regulatory assets, long-term 164,219 169,333 Total Regulatory Assets $ 175,266 $ 177,076
10
March 31, 2013 December 31, 2012 Regulatory Liabilities: Current: Over recovered fuel costs $ 1,893 $ 2,212
Current portion of long-term regulatory liabilities 3,726 3,469
Regulatory liabilities, current 5,619 5,681
Long-term:
Costs of removal 91,223 88,469
SWPA payment for Ozark Beach lost generation 18,616 19,405
Income taxes 11,614 11,677
Deferred construction accounting costs – fuel(4) 7,970 8,011
Unamortized gain on interest rate derivative 3,329 3,371
Pension and other postretirement benefits 2,250 2,177
Over recovered fuel costs 4,085 2,371
Current portion of long-term regulatory liabilities (3,726) (3,469)
Regulatory liabilities, long-term 135,361 132,012
Total Regulatory Liabilities $ 140,980 $ 137,693
(1) Primarily consists of unfunded pension and other postretirement benefits (OPEB) liability. See Note 8.
(2) Reflects deferrals resulting from 2005 regulatory plan relating to Iatan 1, Iatan 2 and Plum Point. These amounts are being recovered over the life of the plants.
(3) Reflects ice storm costs incurred in 2007 and costs incurred as a result of the May 2011 tornado including an accrued carrying charge and deferred depreciation totaling $3.6 million at March 31, 2014.
(4) Resulting from regulatory plan requiring deferral of the fuel and purchased power impacts of Iatan 2.
Note 4– Risk Management and Derivative Financial Instruments
We engage in hedging activities in an effort to minimize our risk from the volatility of natural gas prices and power cost risk associated with exposure to congestion costs. We enter into both physical and financial contracts with counterparties relating to our future natural gas requirements that lock in prices (with respect to a range of predetermined percentages of our expected future natural gas needs) in an attempt to lessen the volatility in our fuel expenditures and gain predictability. Beginning in 2013, we also acquire Transmission Congestion Rights (TCR) in an attempt to mitigate the cost of power we will purchase from the SPP Integrated Market due to congestion exposure. TCRs entitle the holder to a stream of revenues (or charges) based on the day-ahead congestion on the TCR path. TCRs can be purchased or self-converted using rights allocated based on prior investments made in the transmission system. We recognize that if risk is not timely and adequately balanced or if counterparties fail to perform contractual obligations, actual results could differ materially from intended results. All derivative instruments are recognized at fair value on the balance sheet with the unrealized losses or gains from derivatives used to hedge our fuel and purchased power costs in our electric segment recorded in regulatory assets or liabilities. All gains and losses from derivatives related to the gas segment are also recorded in regulatory assets or liabilities. This is in accordance with the Accounting Standards Codification (ASC) guidance on regulated operations, given that those gains or losses are probable of recovery through our fuel adjustment mechanism. Risks and uncertainties affecting the determination of fair value include: market conditions in the energy industry, especially the effects of price volatility, regulatory and global political environments and requirements, fair value estimations on longer term contracts, the effectiveness of the derivative instrument in hedging the change in fair value of the hedged item, estimating underlying fuel demand and counterparty ability to perform. If we estimate that we have overhedged forecasted demand, the gain or loss on the overhedged portion will be recognized immediately as fuel and purchased power expense in our Consolidated Statement of Income and subject to our fuel adjustment mechanism. As of March 31, 2014 and December 31, 2013, we have recorded the following assets and liabilities representing the fair value of derivative financial instruments, (in thousands):
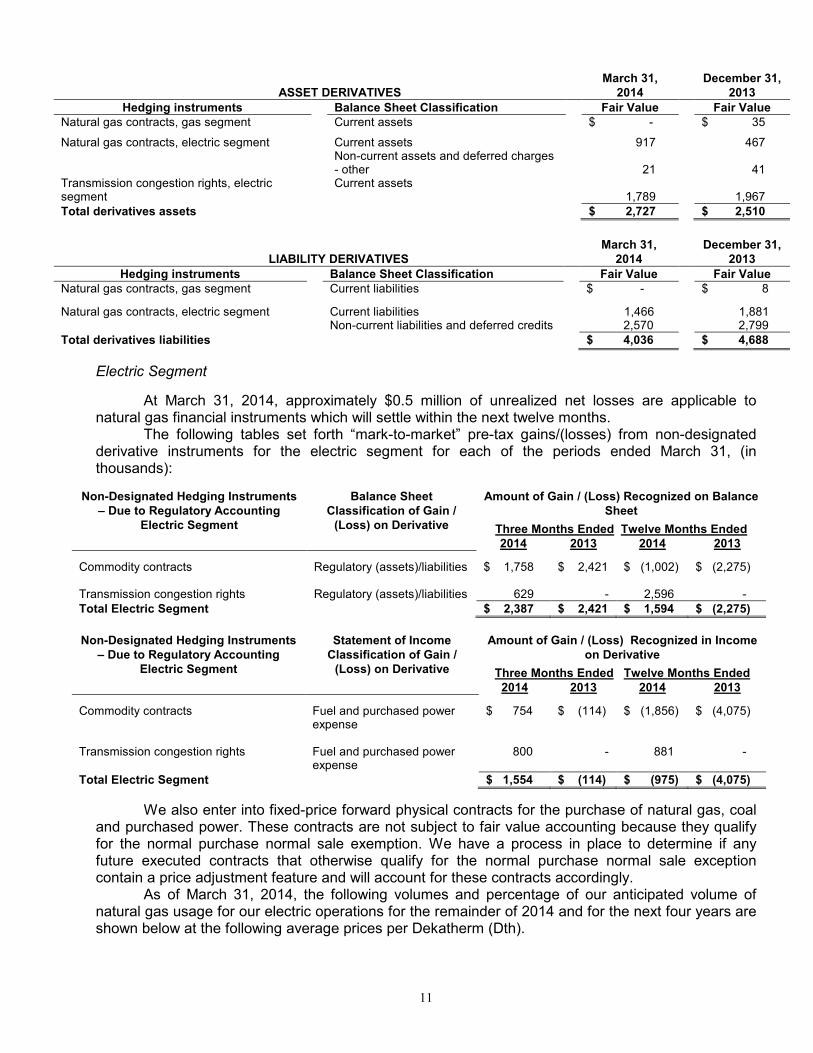
11
March 31, December 31, ASSET DERIVATIVES 2014 2013
Hedging instruments Balance Sheet Classification Fair Value Fair Value Natural gas contracts, gas segment Current assets $ - $ 35 Natural gas contracts, electric segment Current assets 917 467 Non-current assets and deferred charges
- other
21
41 Transmission congestion rights, electric segment
Current assets 1,789
1,967
Total derivatives assets $ 2,727 $ 2,510
March 31, December 31,
LIABILITY DERIVATIVES 2014 2013
Hedging instruments Balance Sheet Classification Fair Value Fair Value Natural gas contracts, gas segment Current liabilities $ - $ 8 Natural gas contracts, electric segment Current liabilities 1,466 1,881 Non-current liabilities and deferred credits 2,570 2,799 Total derivatives liabilities $ 4,036 $ 4,688
Electric Segment
At March 31, 2014, approximately $0.5 million of unrealized net losses are applicable to natural gas financial instruments which will settle within the next twelve months. The following tables set forth “mark-to-market” pre-tax gains/(losses) from non-designated derivative instruments for the electric segment for each of the periods ended March 31, (in thousands):
Non-Designated Hedging Instruments – Due to Regulatory Accounting
Electric Segment
Balance Sheet Classification of Gain / (Loss) on Derivative
Amount of Gain / (Loss) Recognized on Balance Sheet
Three Months Ended Twelve Months Ended 2014 2013 2014 2013 Commodity contracts Regulatory (assets)/liabilities $ 1,758 $ 2,421 $ (1,002) $ (2,275) Transmission congestion rights Regulatory (assets)/liabilities 629 - 2,596 - Total Electric Segment $ 2,387 $ 2,421 $ 1,594 $ (2,275)
Non-Designated Hedging Instruments
– Due to Regulatory Accounting Electric Segment
Statement of Income Classification of Gain / (Loss) on Derivative
Amount of Gain / (Loss) Recognized in Income on Derivative
Three Months Ended Twelve Months Ended 2014 2013 2014 2013 Commodity contracts Fuel and purchased power $ 754 $ (114) $ (1,856) $ (4,075) expense Transmission congestion rights Fuel and purchased power 800 - 881 - expense Total Electric Segment $ 1,554 $ (114) $ (975) $ (4,075)
We also enter into fixed-price forward physical contracts for the purchase of natural gas, coal and purchased power. These contracts are not subject to fair value accounting because they qualify for the normal purchase normal sale exemption. We have a process in place to determine if any future executed contracts that otherwise qualify for the normal purchase normal sale exception contain a price adjustment feature and will account for these contracts accordingly. As of March 31, 2014, the following volumes and percentage of our anticipated volume of natural gas usage for our electric operations for the remainder of 2014 and for the next four years are shown below at the following average prices per Dekatherm (Dth).

12
Dth Hedged Year % Hedged Physical Financial Average Price
Remainder 2014 59% 1,365,000 3,440,000 $ 4.532 2015 41% 0 4,010,000 $ 4.578 2016 32% 976,000 2,100,000 $ 4.140 2017 14% 420,900 1,050,000 $ 4.193 2018 - - - -
We utilize the following procurement guidelines for our electric segment, allowing the flexibility to hedge up to 100% of the current year’s and 80% of any future year’s expected requirements while being cognizant of volume risk. The 80% guideline is an annual target and volumes up to 100% can be hedged in any given month. For years beyond year four, additional factors of long term uncertainty (including with respect to required volumes and counterparty credit) are also considered.
Year Minimum % Hedged Current Up to 100% First 60% Second 40% Third 20% Fourth 10%
At March 31, 2014, the following transmission congestion rights (TCR) have been obtained to hedge congestion risk in the SPP Integrated Market (dollars in thousands):
Year Monthly MWH Hedged
$ Value
2014 1,373 $ 1,789
Gas Segment
We attempt to mitigate our natural gas price risk for our gas segment by a combination of (1) injecting natural gas into storage during the off-heating season months, (2) purchasing physical forward contracts and (3) purchasing financial derivative contracts. We target to have 95% of our storage capacity full by November 1 for the upcoming winter heating season. As the winter progresses, gas is withdrawn from storage to serve our customers. As of March 31, 2014, we had 0.1 million Dths in storage on the three pipelines that serve our customers. This represents 7% of our storage capacity. The following table sets forth our long-term hedge strategy of mitigating price volatility for our customers by hedging a minimum of expected gas usage for the current winter season and the next two winter seasons by the beginning of the Actual Cost Adjustment (ACA) year at September 1 and illustrates our hedged position as of March 31, 2014 (in thousands).
Season Minimum % Hedged Dth Hedged – Financial
Dth Hedged – Physical
Dth in Storage Actual % Hedged
Current 50% - - 142,485 4% Second Up to 50% - - - - Third Up to 20% - - - -
A Purchased Gas Adjustment (PGA) clause is included in our rates for our gas segment operations, therefore, we mark to market any unrealized gains or losses and any realized gains or losses relating to financial derivative contracts to a regulatory asset or regulatory liability account on our balance sheet. The following table sets forth “mark-to-market” pre-tax gains / (losses) from derivatives not designated as hedging instruments for the gas segment for each of the periods ended March 31, (in thousands).
13
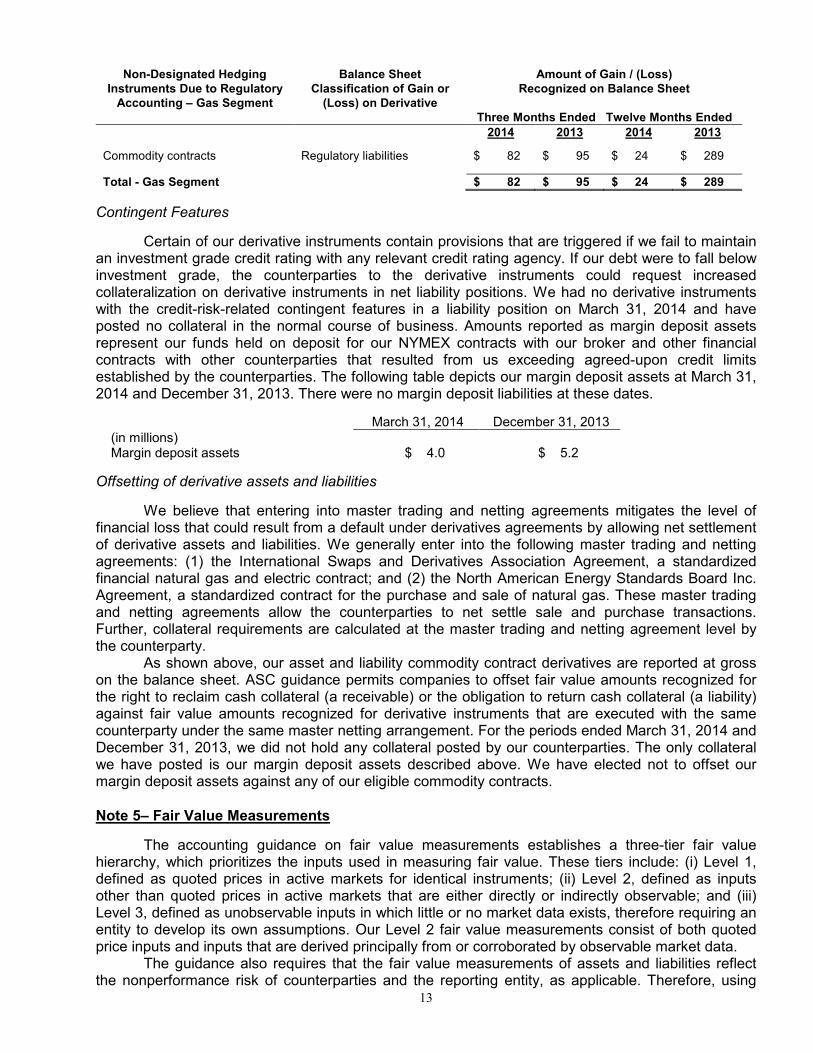
Non-Designated Hedging Instruments Due to Regulatory Accounting – Gas Segment
Balance Sheet Classification of Gain or (Loss) on Derivative
Amount of Gain / (Loss) Recognized on Balance Sheet
Three Months Ended Twelve Months Ended
2014 2013 2014 2013 Commodity contracts Regulatory liabilities $ 82 $ 95 $ 24 $ 289 Total - Gas Segment $ 82 $ 95 $ 24 $ 289
Contingent Features
Certain of our derivative instruments contain provisions that are triggered if we fail to maintain an investment grade credit rating with any relevant credit rating agency. If our debt were to fall below investment grade, the counterparties to the derivative instruments could request increased collateralization on derivative instruments in net liability positions. We had no derivative instruments with the credit-risk-related contingent features in a liability position on March 31, 2014 and have posted no collateral in the normal course of business. Amounts reported as margin deposit assets represent our funds held on deposit for our NYMEX contracts with our broker and other financial contracts with other counterparties that resulted from us exceeding agreed-upon credit limits established by the counterparties. The following table depicts our margin deposit assets at March 31, 2014 and December 31, 2013. There were no margin deposit liabilities at these dates.
March 31, 2014 December 31, 2013 (in millions) Margin deposit assets $ 4.0 $ 5.2
Offsetting of derivative assets and liabilities
We believe that entering into master trading and netting agreements mitigates the level of financial loss that could result from a default under derivatives agreements by allowing net settlement of derivative assets and liabilities. We generally enter into the following master trading and netting agreements: (1) the International Swaps and Derivatives Association Agreement, a standardized financial natural gas and electric contract; and (2) the North American Energy Standards Board Inc. Agreement, a standardized contract for the purchase and sale of natural gas. These master trading and netting agreements allow the counterparties to net settle sale and purchase transactions. Further, collateral requirements are calculated at the master trading and netting agreement level by the counterparty.
As shown above, our asset and liability commodity contract derivatives are reported at gross on the balance sheet. ASC guidance permits companies to offset fair value amounts recognized for the right to reclaim cash collateral (a receivable) or the obligation to return cash collateral (a liability) against fair value amounts recognized for derivative instruments that are executed with the same counterparty under the same master netting arrangement. For the periods ended March 31, 2014 and December 31, 2013, we did not hold any collateral posted by our counterparties. The only collateral we have posted is our margin deposit assets described above. We have elected not to offset our margin deposit assets against any of our eligible commodity contracts. Note 5– Fair Value Measurements
The accounting guidance on fair value measurements establishes a three-tier fair value hierarchy, which prioritizes the inputs used in measuring fair value. These tiers include: (i) Level 1, defined as quoted prices in active markets for identical instruments; (ii) Level 2, defined as inputs other than quoted prices in active markets that are either directly or indirectly observable; and (iii) Level 3, defined as unobservable inputs in which little or no market data exists, therefore requiring an entity to develop its own assumptions. Our Level 2 fair value measurements consist of both quoted price inputs and inputs that are derived principally from or corroborated by observable market data. The guidance also requires that the fair value measurements of assets and liabilities reflect the nonperformance risk of counterparties and the reporting entity, as applicable. Therefore, using

14
credit default spreads, we factored the impact of our own credit standing and the credit standing of our counterparties, as well as any potential credit enhancements (e.g. collateral) into the consideration of nonperformance risk for both derivative assets and liabilities. The results of this analysis were not material to the financial statements. Our TCR positions, which are acquired on the SPP Integrated Market, are valued using the most recent monthly auction clearing prices. Our commodity contracts are valued using the market value approach on a recurring basis. The following fair value hierarchy table presents information about our TCR and commodity contracts measured at fair value as of March 31, 2014 and December 31, 2013 (in thousands):
Fair Value Measurements at Reporting Date Using
Description
Assets/(Liabilities) at Fair Value
Quoted Prices in Active Markets for Identical Assets/(Liabilities)
(Level 1)
Significant Other Observable
Inputs (Level 2)
Significant Unobservable
Inputs (Level 3)
March 31, 2014
Derivative assets $ 2,727 $ 939 $ 1,788 $ - Derivative liabilities $ (4,036) $ (4,036) $ - $ -
December 31, 2013 Derivative assets $ 2,510 $ 543 $ 1,967 $ - Derivative liabilities $ (4,688) $ (4,688) $ - $ - *The only recurring measurements are derivative related.
Other fair value considerations
Our cash and cash equivalents approximate fair value because of the short-term nature of these instruments, and are classified as Level 1 in the fair value hierarchy. The carrying amount of our short-term debt, which is composed of Empire issued commercial paper or revolving credit borrowings, also approximates fair value because of their short-term nature. These instruments are classified as Level 2 in the fair value hierarchy as they are valued based on market rates for similar market transactions.
The carrying amount of our total long-term debt exclusive of capital leases at both March 31, 2014 and December 31, 2013 was $739 million. The fair market value at March 31, 2014 was approximately $746 million as compared to approximately $715 million at December 31, 2013. These estimates were based on a bond pricing model, utilizing inputs classified as Level 2 in the fair value hierarchy, which include the quoted market prices for the same or similar issues or on the current rates offered to us for debt of the same remaining maturities. The estimated fair market value may not represent the actual value that could have been realized as of March 31, 2014 or that will be realizable in the future.
Note 6– Financing
We have an unsecured revolving credit facility of $150 million in place through January 17, 2017. The facility is used for working capital, general corporate purposes and to back-up our use of commercial paper. This facility requires our total indebtedness to be less than 62.5% of our total capitalization at the end of each fiscal quarter and our EBITDA (defined as net income plus interest, taxes, depreciation and amortization) to be at least two times our interest charges for the trailing four fiscal quarters at the end of each fiscal quarter. Failure to maintain these ratios will result in an event of default under the credit facility and will prohibit us from borrowing funds thereunder. As of March 31, 2014, we are in compliance with these ratios. Our total indebtedness is 49.5% of our total capitalization as of March 31, 2014 and our EBITDA is 5.8 times our interest charges. This credit facility is also subject to cross-default if we default on in excess of $10 million in the aggregate on our other indebtedness. This arrangement does not serve to legally restrict the use of our cash in the normal course of operations. There were no outstanding borrowings under this agreement at March 31, 2014, however, $4.5 million was used to back up our outstanding commercial paper.

15
Note 7– Commitments and Contingencies
Legal Proceedings
We are a party to various claims and legal proceedings arising out of the normal course of our business. Management regularly analyzes this information, and has provided accruals for any liabilities, in accordance with the guidelines presented in the ASC on accounting for contingencies. In the opinion of management, it is not probable, given the company’s defenses, that the ultimate outcome of these claims and lawsuits will have a material adverse effect upon our financial condition, or results of operations or cash flows.
Coal, Natural Gas and Transportation Contracts
The following table sets forth our commitments under physical gas, coal and transportation contracts for the periods indicated as of March 31, 2014 (in millions).
Firm physical gas and transportation contracts
Coal and coal transportation contracts
April 1, 2014 through December 31, 2014 $ 18.9 $ 16.4 January 1, 2015 through December 31, 2016 36.4 29.2 January 1, 2017 through December 31, 2018 33.2 23.0 January 1, 2019 and beyond 49.5 11.5
We have entered into long and short-term agreements to purchase coal and natural gas for our energy supply and natural gas operations. Under these contracts, the natural gas supplies are divided into firm physical commitments and derivatives that are used to hedge future purchases. In the event that this gas cannot be used at our plants, the gas would be liquidated at market price. The firm physical gas and transportation commitments are detailed in the table above. We have coal supply agreements and transportation contracts in place to provide for the delivery of coal to the plants. These contracts are written with Force Majeure clauses that enable us to reduce tonnages or cease shipments under certain circumstances or events. These include mechanical or electrical maintenance items, acts of God, war or insurrection, strikes, weather and other disrupting events. This reduces the risk we have for not taking the minimum requirements of fuel under the contracts. The minimum requirements for our coal and coal transportation contracts as of March 31, 2014, are included in the table above.
Purchased Power
We currently supplement our on-system (native load) generating capacity with purchases of capacity and energy from other entities in order to meet the demands of our customers and the capacity margins applicable to us under current pooling agreements and National Electric Reliability Council (NERC) rules. The Plum Point Energy Station (Plum Point) is a 670-megawatt, coal-fired generating facility near Osceola, Arkansas. We own, through an undivided interest, 50 megawatts of the unit’s capacity. We also have a long-term (30 year) agreement for the purchase of capacity from Plum Point. Commitments under this agreement are approximately $294.8 million through August 31, 2039, the end date of the agreement. We have the option to purchase an undivided ownership interest in the 50 megawatts covered by the purchased power agreement in 2015. We evaluated this purchase option as part of our Integrated Resource Plan (IRP), which was filed with the MPSC on July 1, 2013. While it is not currently our intention to exercise this option in 2015, we will continue to evaluate this purchase option through the exercise date as well as explore other options with the purchase power agreement holder, Plum Point Energy Associates (PPEA), related to the timing of this option.
We have a 20-year purchased power agreement, which began on December 15, 2008, with Cloud County Windfarm, LLC, owned by EDP Renewables North America LLC, Houston, Texas to purchase the energy generated at the approximately 105-megawatt Phase 1 Meridian Way Wind Farm located in Cloud County, Kansas. Annual payments are contingent upon output of the facility

16
and can range from zero to a maximum of approximately $14.6 million based on a 20-year average cost.
We also have a 20-year contract, which began on December 15, 2005, with Elk River Windfarm, LLC, owned by IBERDROLA RENEWABLES, Inc., to purchase the energy generated at the 150-megawatt Elk River Windfarm located in Butler County, Kansas. Annual payments are contingent upon output of the facility and can range from zero to a maximum of approximately $16.9 million based on a 20-year average cost.
Payments for these wind agreements are recorded as purchased power expenses, and, because of the contingent nature of these payments, are not included in our operating lease obligations.
New Construction
We have in place a contract with a third party vendor to complete engineering, procurement, and construction activities at our Riverton plant to convert Riverton Unit 12 from a simple cycle combustion turbine to a combined cycle unit. The conversion will include the installation of a heat recovery steam generator (HRSG), steam turbine generator, auxiliary boiler, cooling tower, and other auxiliary equipment. The Air Emission Source Construction Permit necessary for this project was issued by Kansas Department of Health and Environment on July 11, 2013. This conversion is currently scheduled to be completed in mid-2016 at a cost estimated to range from $165 million to $175 million, excluding AFUDC. This amount is included in our five-year capital expenditure plan. Construction costs, consisting of pre-engineering, site preparation activities and contract costs incurred project to date through March 31, 2014 were $29.8 million, excluding AFUDC.
We also have in place a contract with a third party vendor to complete environmental retrofits at our Asbury plant. The retrofits will include the installation of a pulse-jet fabric filter (baghouse), circulating dry scrubber and powder activated carbon injection system. This equipment will enable us to comply with the Mercury and Air Toxics Standard (MATS). The addition of this air quality control equipment is expected to be completed by early 2015 at a cost ranging from $112.0 million to $130.0 million, excluding AFUDC. Construction costs through March 31, 2014 were $89.4 million for the project to date, excluding AFUDC.
See “Environmental Matters” below for more information on both of these projects.
Leases
We have purchased power agreements with Cloud County Windfarm, LLC and Elk River Windfarm, LLC, which are considered operating leases for GAAP purposes. Details of these agreements are disclosed in the Purchased Power section of this note. We also currently have short-term operating leases for two unit trains to meet coal delivery demands, for garage and office facilities for our electric segment and for one office facility related to our gas segment. In addition, we have capital leases for certain office equipment and 108 railcars to provide coal delivery for our ownership and purchased power agreement shares of the Plum Point generating facility.
The gross amount of assets recorded under capital leases total $5.5 million at March 31, 2014.
Environmental Matters
We are subject to various federal, state, and local laws and regulations with respect to air and water quality and with respect to hazardous and toxic materials and hazardous and other wastes, including their identification, transportation, disposal, record-keeping and reporting, as well as remediation of contaminated sites and other environmental matters. We believe that our operations are in material compliance with present environmental laws and regulations. Environmental requirements have changed frequently and become more stringent over time. We expect this trend to continue. While we are not in a position to accurately estimate compliance costs for any new requirements, we expect any such costs to be material, although recoverable in rates.
17
Electric Segment
The Federal Clean Air Act (CAA) and comparable state laws regulate air emissions from stationary sources such as electric power plants through permitting and/or emission control and related requirements. These requirements include maximum emission limits on our facilities for sulfur dioxide (SO2), particulate matter, nitrogen oxides (NOx), carbon monoxide (CO), and hazardous air pollutants including mercury. In the future they will include limits on greenhouse gases (GHG) such as carbon dioxide (CO2).
Compliance Plan
In order to comply with current and forthcoming environmental regulations, we are taking actions to implement our compliance plan and strategy (Compliance Plan). The Mercury Air Toxic Standards (MATS) and the Clean Air Interstate Rule (CAIR) and its subsequent replacement rule, both regulations which we discuss further below, are the drivers behind our Compliance Plan and its implementation schedule. The MATS require reductions in mercury, acid gases and other emissions considered hazardous air pollutants (HAPS). They became effective in April 2012 and require full compliance by April 16, 2015 (with flexibility for extensions for reliability reasons). The Cross State Air Pollution Rule (CSAPR – formerly the Clean Air Transport Rule, or CATR) was first proposed by the EPA in July 2010 as a replacement of CAIR and was set to take effect on January 1, 2012. CSAPR was stayed by the D.C Circuit Court of Appeals in late December 2011, then vacated by court order in August 2012. On April 29, 2014, the U.S. Supreme Court (the Court) reversed the D.C Circuit Court of Appeals judgment, and remanded the case back to the D.C. Circuit Court for further proceedings consistent with the Court’s opinion. Consequently, CAIR will remain in effect until regulatory guidance is developed by the EPA. We anticipate compliance costs associated with the MATS and CAIR (or its subsequent replacement) regulations to be recoverable in our rates.
Our Compliance Plan largely follows the preferred plan presented in our Integrated Resource Plan (IRP), filed in mid-2013 with the MPSC. As described above under New Construction, we are in the process of installing a scrubber, fabric filter, and powder activated carbon injection system at our Asbury plant. The addition of this air quality control equipment is expected to be completed by early 2015. This addition required the retirement of Asbury Unit 2, a steam turbine rated at 14 megawatts that was used for peaking purposes. Asbury Unit 2 was retired on December 31, 2013.
In September 2012, we completed the transition of our Riverton Units 7 and 8 from operation on coal and natural gas to operating completely on natural gas. Riverton Units 7 and 8, along with Riverton Unit 9, a small combustion turbine that requires steam from Unit 7 or 8 for start-up, will be retired upon the conversion of Riverton Unit 12, a simple cycle combustion turbine, to a combined cycle unit. This conversion is currently scheduled to be completed in mid-2016.
Once our Asbury and Riverton projects are completed, our generating fleet aggregate emissions will be in compliance with CSAPR’s emission limits as originally proposed. However, the current version of CSAPR is likely to be revised to be consistent with the April 29, 2014 U.S. Supreme Court decision.
See “New Construction” above for project costs for both of these projects.
Air Emissions
The CAA regulates the amount of NOx and SO2 an affected unit can emit. As currently operated, each of our affected units is in compliance with the applicable NOx and SO2 limits. Currently, NOx emissions are regulated by the CAIR (to be replaced by CSAPR) and National Ambient Air Quality Standard (NAAQS) rules for ozone (discussed below). SO2 emissions are currently regulated by the Title IV Acid Rain Program and the CAIR (to be replaced by CSAPR).
CAIR:
The CAIR generally calls for fossil-fueled power plants greater than 25 megawatts to reduce emission levels of SO2 and/or NOx in 28 eastern states and the District of Columbia, including Missouri, where our Asbury, Energy Center, State Line and Iatan Units No. 1 and No. 2 are located.
18
Kansas was not included in CAIR and our Riverton Plant was not affected. Arkansas, where our Plum Point Plant is located, was included for ozone season NOx but not for SO2.
SO2 allowance allocations under the Title IV Acid Rain Program are used for compliance in the CAIR SO2 Program. The alternate plans in our Integrated Resource Plan (IRP) assumed costs for other emissions such as SO2, NOx and mercury. In the most recent five-year business plan 2014-2018, which assumes normal operations, we do not anticipate the need to purchase any allowances for these pollutants. However, if economically beneficial, we could purchase minimal quantities of allowances in the future.
Based on the April 29, 2014 U.S. Supreme Court decision, the current version of CSAPR (CAIR’s replacement) is likely to be revised to be consistent with the court’s opinion.
Mercury Air Toxics Standard (MATS):
As described above, the MATS standard became effective in April 2012, and requires compliance by April 2015 (with flexibility for extensions for reliability reasons). For all existing and new coal-fired electric utility steam generating units (EGUs), the MATS standard will be phased in over three years, and allows states the ability to give facilities a fourth year to comply. On March 28, 2013, the EPA finalized updates to certain emission limits for new power plants under the MATS. The new standards affect only new coal and oil-fired power plants that will be built in the future. The update does not change the final emission limits or other requirements for existing power plants.
National Ambient Air Quality Standards (NAAQS):
Under the CAA, the EPA sets NAAQS for certain emissions considered harmful to public health and the environment, including particulate matter (PM), NOx, CO, SO2, and ozone which result from fossil fuel combustion. Our facilities are currently in compliance with all applicable NAAQS.
In January 2013, the EPA finalized the revised PM 2.5 primary annual standard at 12 ug/m3
(micrograms per cubic meter of air). States are required to meet the primary standard in 2020. The standard should have no impact on our existing generating fleet because the regional ambient monitor results are below the PM 2.5 required level. However, the PM 2.5 standards could impact future major modifications/construction projects that require additional permits.
Ozone, also called ground level smog, is formed by the mixing of NOx and Volatile Organic Compounds (VOCs) in the presence of sunlight. Based on the current standard, our service territory is designated as attainment, meaning that it is in compliance with the standard. A revised Ozone NAAQS is expected to be proposed by the EPA in early 2015 and the final rule is expected in November 2015.
Greenhouse Gases (GHGs):
Under regulations known as the Tailoring Rule, the EPA regulates carbon dioxide and other GHG emissions from certain stationary sources. EDE and EDG’s GHG emissions for 2011, 2012, and 2013 have been reported to the EPA as required by the Tailoring Rule.
In addition to the Tailoring Rule, there are a number of federal and state regulatory initiatives aimed at the regulation of GHGs. However, because of the uncertainties regarding future GHG regulation (discussed below), the ultimate cost of compliance cannot be determined at this time. In any case, we expect the cost of complying with any such regulations to be recoverable in our rates.
In April 2012, the EPA proposed a Carbon Pollution Standard for new power plants to limit the amount of carbon emitted by EGUs. This standard was rescinded, and a re-proposal of standards of performance for affected fossil fuel-fired EGUs was published in January 2014. The comment period has been extended to May 9, 2014. The proposed rule applies only to new EGUs and sets separate standards for natural gas-fired combustion turbines and for fossil fuel-fired utility boilers. The proposal would not apply to existing units, including modifications such as those required to meet other air pollution standards which are currently being undertaken at our Asbury facility and at the Riverton facility with the conversion of simple cycle Unit 12 to combined cycle.

19
In response to President Obama’s June 2013 memorandum to the EPA regarding carbon pollution standards for the power industry, the EPA is undertaking a process to identify approaches to establish GHG standards for currently operating power plants. The memorandum requested that the EPA issue proposed GHG standards, for modified, reconstructed, and existing power plants by June 1, 2014; issue final standards, regulations, or guidelines, for modified, reconstructed, and existing power plants by June 1, 2015; and include in the guidelines addressing existing power plants a requirement that states submit implementation plans to the EPA by June 30, 2016. In February 2014, the U.S. Supreme Court heard arguments regarding whether the EPA could regulate GHG emissions from fixed sources based on a previous decision on GHG emissions from cars. A decision is expected later in 2014.
In addition, certain states in which we have EGUs have taken steps to develop cap and trade programs and/or other regulatory systems to measure and report Carbon Dioxide Equivalent (CO2e) emissions that may or may not be more stringent than any federal requirements. However, at this time such states are not proposing regulatory systems pending federal legislative developments.
Water Discharges
We operate under the Kansas and Missouri Water Pollution Plans pursuant to the Federal Clean Water Act (CWA). Our plants are in material compliance with applicable regulations and have received all necessary discharge permits.
The Riverton Units 7 and 8 and Iatan Unit 1, which utilize once-through cooling water, were affected by regulations for Cooling Water Intake Structures issued by the EPA under the CWA Section 316(b) Phase II. In 2007, the United States Court of Appeals remanded key sections of these CWA regulations to the EPA. The EPA suspended the regulations. Following a series of court approved delays; the EPA is now scheduled to finalize the rule by May 16, 2014. We will not know the full impact of these rules until they are finalized. If adopted in their proposed form, we expect the regulations to have a limited impact at Riverton. The retirement of units 7 and 8 is scheduled in 2016. A new intake structure design and cooling tower will be constructed as part of the Unit 12 conversion at Riverton. Impacts at Iatan 1 could range from flow velocity reductions or traveling screen modifications for fish handling to installation of a closed cycle cooling tower retrofit. Our new Iatan Unit 2 and Plum Point Unit 1 are covered by the proposed regulation, but were constructed with cooling towers, the proposed Best Technology Available. We expect them to be unaffected or minimally impacted by the final rule.
Surface Impoundments
We own and maintain coal ash impoundments located at our Riverton and Asbury Power Plants. Additionally, we own a 12% interest in a coal ash impoundment at the Iatan Generating Station and a 7.52% interest in a coal ash impoundment at Plum Point. On April 19, 2013, the EPA signed a notice of proposed rulemaking to revise its wastewater effluent limitation guidelines and standards under the CWA for coal-fired power plants. The proposal calls for updates to operating permits beginning in July 2017. Once the new guidelines are issued, the EPA and states would incorporate the new standards into wastewater discharge permits, including permits for coal ash impoundments. We do not have sufficient information at this time to estimate additional costs that might result from any new standards. All of our coal ash impoundments are compliant with existing state and federal regulations.
In June 2010, the EPA proposed to regulate coal combustion residuals (CCRs) under the Federal Resource Conservation and Recovery Act (RCRA). In the proposal, the EPA presented two options: (1) regulation of CCR under RCRA subtitle C as a hazardous waste and (2) regulation of CCR under RCRA subtitle D as a non-hazardous waste. It is anticipated that the final regulation will be published in 2014. We expect compliance with either option to result in the need to construct a new landfill and the conversion of existing ash handling from a wet to a dry system(s) at a potential cost of up to $15 million at our Asbury Power Plant. This preliminary estimate will likely change based on the final CCR rule and its requirements. We expect resulting costs to be recoverable in our rates.
20
As a result of the transition from coal to natural gas fuel for Riverton Units 7 and 8, closure of the Riverton ash impoundment is in progress in compliance with Kansas regulations. We expect to complete the closure in mid-2014. We have received preliminary permit approval in Missouri for a new utility waste landfill adjacent to the Asbury plant. Receipt of the final construction permit for the waste landfill is expected in 2015.
Renewable Energy
Missouri regulations currently require Empire and other investor-owned utilities in Missouri to generate or purchase electricity from renewable energy sources, such as solar, wind, biomass and hydro power, or purchase Renewable Energy Credits (RECs), in amounts equal to at least 5% of retail sales in 2014, increasing to at least 15% by 2021. We are currently in compliance with this regulatory requirement as a result of purchased power agreements with Cloud County Windfarm, LLC, located in Cloud County, Kansas and Elk River Windfarm, LLC, located in Butler County, Kansas. The regulations also require that 2% of the energy from renewable energy sources must be solar; however, we are exempted by statute from that solar requirement. As noted in our December 31, 2013 10-K filing, Renew Missouri and others have challenged our exemption with the MPSC, which was denied. Recently, Renew Missouri and others have further challenged our exemption before the Missouri Supreme Court. Kansas established a renewable portfolio standard (RPS), effective November 19, 2010. It requires 10% of our Kansas retail customer peak capacity requirements to be sourced from renewables in 2012, increasing to 15% by 2016, and 20% by 2020. We are currently in compliance with this regulatory requirement as a result of purchased power agreements with Cloud County Windfarm, LLC, located in Cloud County, Kansas and Elk River Windfarm, LLC, located in Butler County, Kansas. In addition, there are several proposals currently before the U.S. Congress to adopt a nationwide RPS.
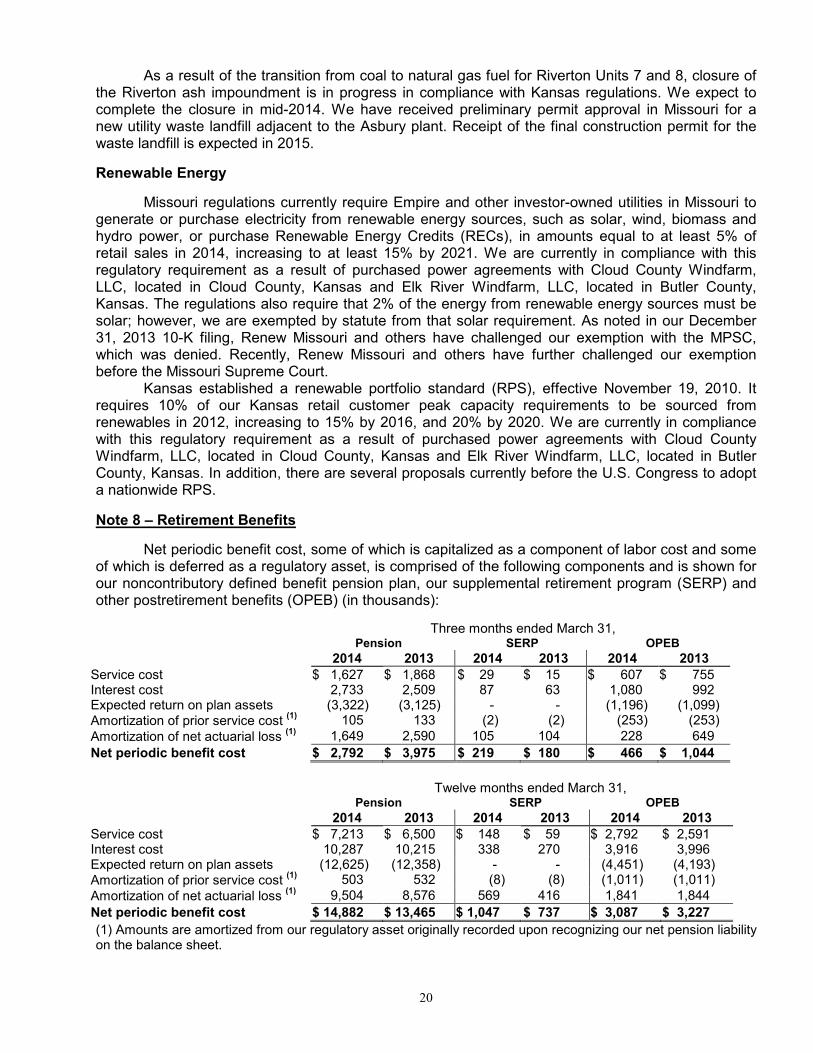
Note 8 – Retirement Benefits
Net periodic benefit cost, some of which is capitalized as a component of labor cost and some of which is deferred as a regulatory asset, is comprised of the following components and is shown for our noncontributory defined benefit pension plan, our supplemental retirement program (SERP) and other postretirement benefits (OPEB) (in thousands):
Three months ended March 31, Pension SERP OPEB
2014 2013 2014 2013 2014 2013
Service cost $ 1,627 $ 1,868 $ 29 $ 15 $ 607 $ 755 Interest cost 2,733 2,509 87 63 1,080 992 Expected return on plan assets (3,322) (3,125) - - (1,196) (1,099) Amortization of prior service cost
(1) 105 133 (2) (2) (253) (253)
Amortization of net actuarial loss (1) 1,649 2,590 105 104 228 649
Net periodic benefit cost $ 2,792 $ 3,975 $ 219 $ 180 $ 466 $ 1,044
Twelve months ended March 31, Pension SERP OPEB
2014 2013 2014 2013 2014 2013
Service cost $ 7,213 $ 6,500 $ 148 $ 59 $ 2,792 $ 2,591 Interest cost 10,287 10,215 338 270 3,916 3,996 Expected return on plan assets (12,625) (12,358) - - (4,451) (4,193) Amortization of prior service cost
(1) 503 532 (8) (8) (1,011) (1,011)
Amortization of net actuarial loss (1) 9,504 8,576 569 416 1,841 1,844
Net periodic benefit cost $ 14,882 $ 13,465 $ 1,047 $ 737 $ 3,087 $ 3,227
(1) Amounts are amortized from our regulatory asset originally recorded upon recognizing our net pension liability on the balance sheet.
21
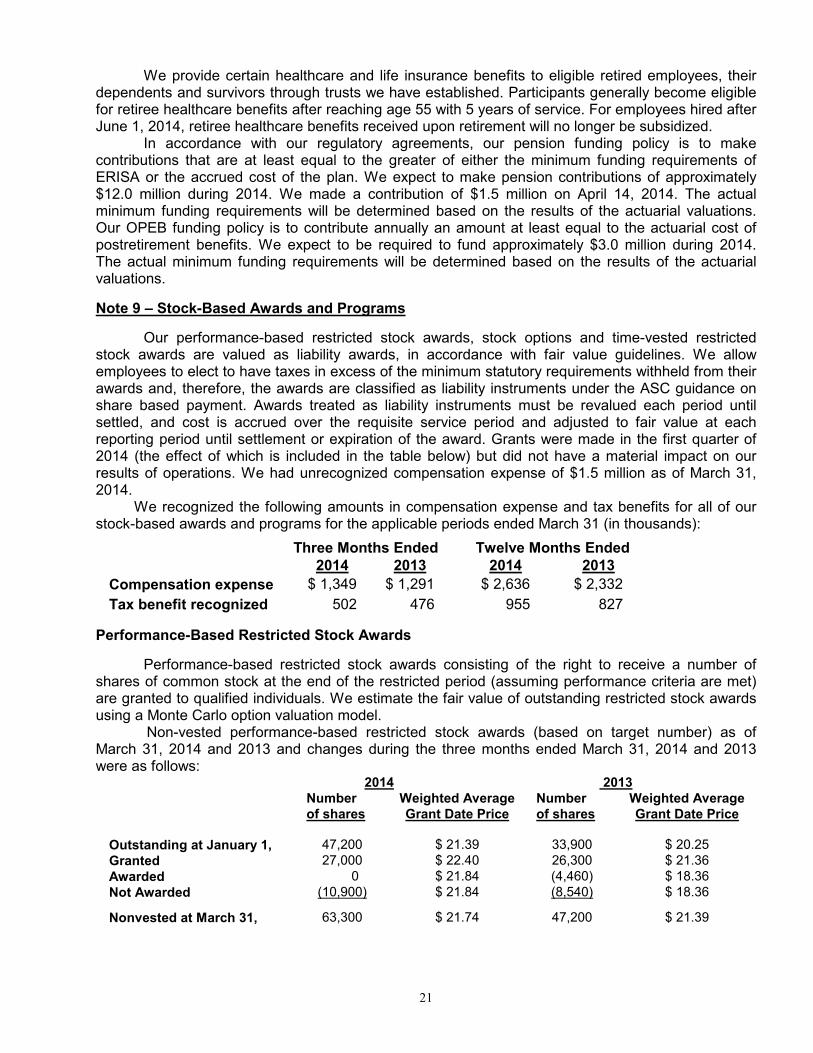
We provide certain healthcare and life insurance benefits to eligible retired employees, their dependents and survivors through trusts we have established. Participants generally become eligible for retiree healthcare benefits after reaching age 55 with 5 years of service. For employees hired after June 1, 2014, retiree healthcare benefits received upon retirement will no longer be subsidized.
In accordance with our regulatory agreements, our pension funding policy is to make contributions that are at least equal to the greater of either the minimum funding requirements of ERISA or the accrued cost of the plan. We expect to make pension contributions of approximately $12.0 million during 2014. We made a contribution of $1.5 million on April 14, 2014. The actual minimum funding requirements will be determined based on the results of the actuarial valuations. Our OPEB funding policy is to contribute annually an amount at least equal to the actuarial cost of postretirement benefits. We expect to be required to fund approximately $3.0 million during 2014. The actual minimum funding requirements will be determined based on the results of the actuarial valuations.
Note 9 – Stock-Based Awards and Programs
Our performance-based restricted stock awards, stock options and time-vested restricted stock awards are valued as liability awards, in accordance with fair value guidelines. We allow employees to elect to have taxes in excess of the minimum statutory requirements withheld from their awards and, therefore, the awards are classified as liability instruments under the ASC guidance on share based payment. Awards treated as liability instruments must be revalued each period until settled, and cost is accrued over the requisite service period and adjusted to fair value at each reporting period until settlement or expiration of the award. Grants were made in the first quarter of 2014 (the effect of which is included in the table below) but did not have a material impact on our results of operations. We had unrecognized compensation expense of $1.5 million as of March 31, 2014.
We recognized the following amounts in compensation expense and tax benefits for all of our stock-based awards and programs for the applicable periods ended March 31 (in thousands):
Three Months Ended Twelve Months Ended 2014 2013 2014 2013
Compensation expense $ 1,349 $ 1,291 $ 2,636 $ 2,332
Tax benefit recognized 502 476 955 827
Performance-Based Restricted Stock Awards
Performance-based restricted stock awards consisting of the right to receive a number of shares of common stock at the end of the restricted period (assuming performance criteria are met) are granted to qualified individuals. We estimate the fair value of outstanding restricted stock awards using a Monte Carlo option valuation model. Non-vested performance-based restricted stock awards (based on target number) as of March 31, 2014 and 2013 and changes during the three months ended March 31, 2014 and 2013 were as follows: 2014 2013 Number
of shares Weighted Average Grant Date Price
Number of shares
Weighted Average Grant Date Price
Outstanding at January 1, 47,200 $ 21.39 33,900 $ 20.25 Granted 27,000 $ 22.40 26,300 $ 21.36 Awarded 0 $ 21.84 (4,460) $ 18.36 Not Awarded (10,900) $ 21.84 (8,540) $ 18.36 Nonvested at March 31, 63,300 $ 21.74 47,200 $ 21.39
22
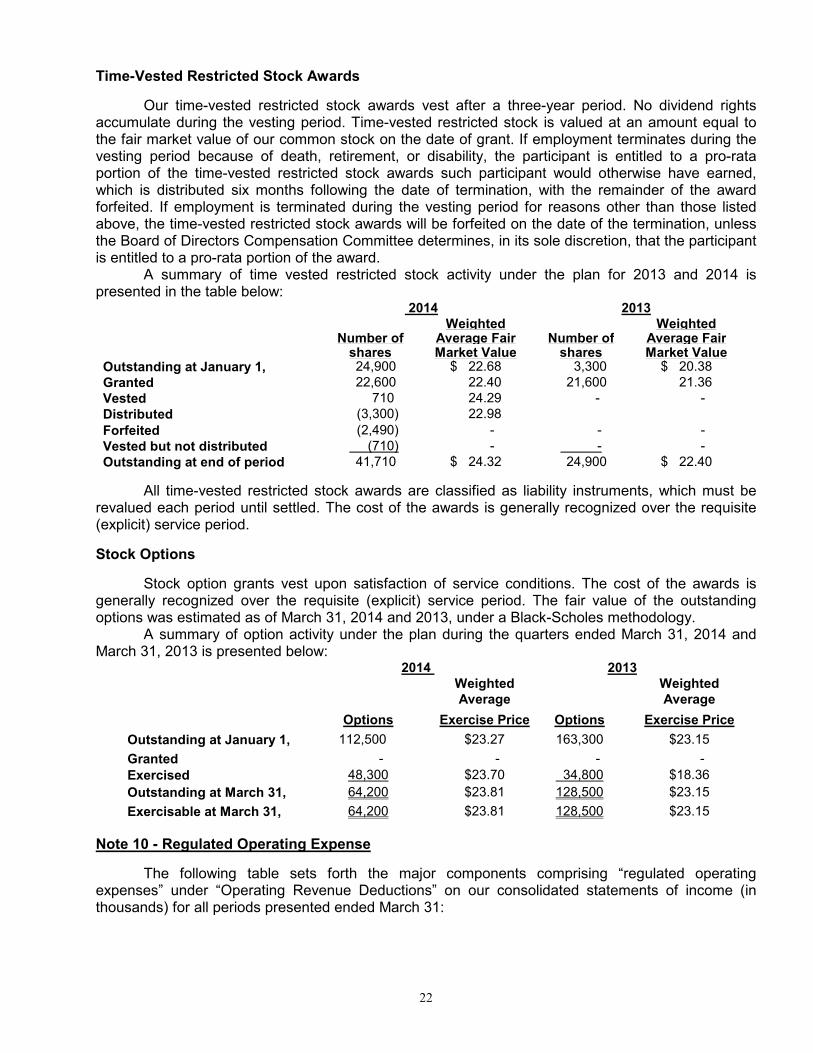
Time-Vested Restricted Stock Awards
Our time-vested restricted stock awards vest after a three-year period. No dividend rights accumulate during the vesting period. Time-vested restricted stock is valued at an amount equal to the fair market value of our common stock on the date of grant. If employment terminates during the vesting period because of death, retirement, or disability, the participant is entitled to a pro-rata portion of the time-vested restricted stock awards such participant would otherwise have earned, which is distributed six months following the date of termination, with the remainder of the award forfeited. If employment is terminated during the vesting period for reasons other than those listed above, the time-vested restricted stock awards will be forfeited on the date of the termination, unless the Board of Directors Compensation Committee determines, in its sole discretion, that the participant is entitled to a pro-rata portion of the award.
A summary of time vested restricted stock activity under the plan for 2013 and 2014 is presented in the table below: 2014 2013 Weighted Weighted Number of Average Fair Number of Average Fair shares Market Value shares Market Value Outstanding at January 1, 24,900 $ 22.68 3,300 $ 20.38 Granted 22,600 22.40 21,600 21.36 Vested 710 24.29 - - Distributed (3,300) 22.98
Forfeited (2,490) - - - Vested but not distributed (710) - - - Outstanding at end of period 41,710 $ 24.32 24,900 $ 22.40
All time-vested restricted stock awards are classified as liability instruments, which must be revalued each period until settled. The cost of the awards is generally recognized over the requisite (explicit) service period.
Stock Options
Stock option grants vest upon satisfaction of service conditions. The cost of the awards is generally recognized over the requisite (explicit) service period. The fair value of the outstanding options was estimated as of March 31, 2014 and 2013, under a Black-Scholes methodology.
A summary of option activity under the plan during the quarters ended March 31, 2014 and March 31, 2013 is presented below:
2014 2013 Weighted
Average Weighted
Average
Options Exercise Price Options Exercise Price
Outstanding at January 1, 112,500 $23.27 163,300 $23.15
Granted - - - -
Exercised 48,300 $23.70 34,800 $18.36
Outstanding at March 31, 64,200 $23.81 128,500 $23.15
Exercisable at March 31, 64,200 $23.81 128,500 $23.15
Note 10 - Regulated Operating Expense
The following table sets forth the major components comprising “regulated operating expenses” under “Operating Revenue Deductions” on our consolidated statements of income (in thousands) for all periods presented ended March 31:
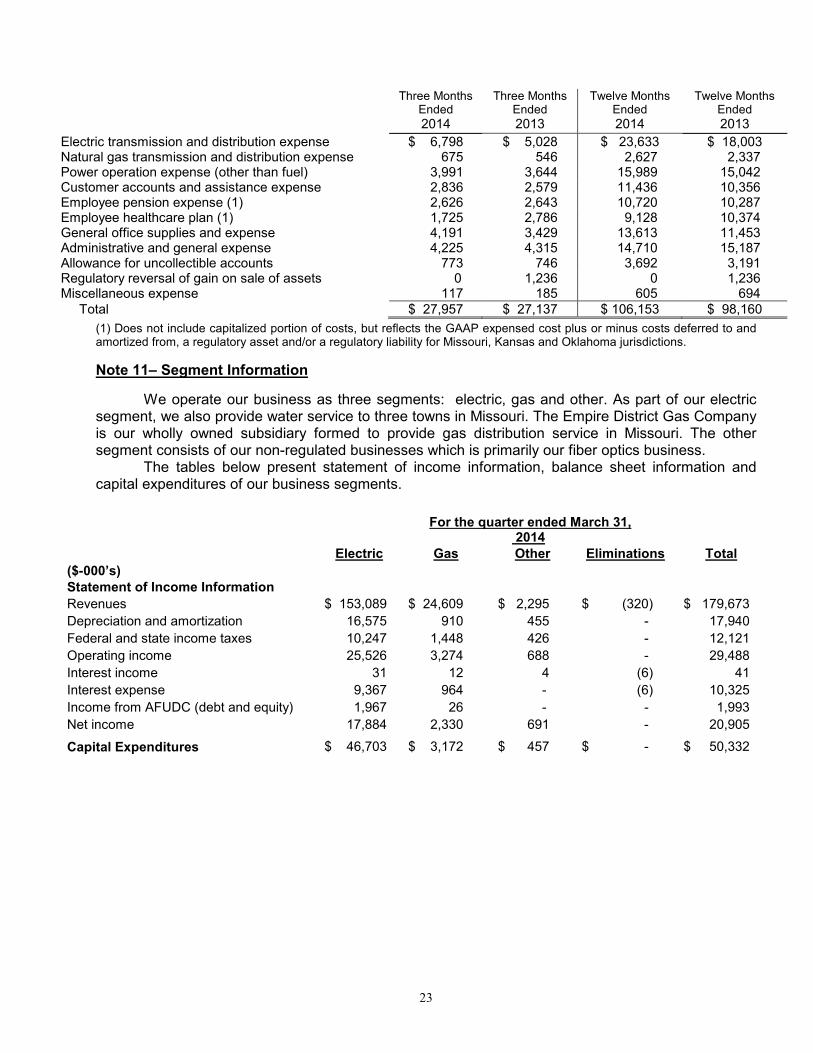
23
Three Months Ended
Three Months Ended
Twelve Months Ended
Twelve Months Ended
2014 2013 2014 2013
Electric transmission and distribution expense $ 6,798 $ 5,028 $ 23,633 $ 18,003 Natural gas transmission and distribution expense 675 546 2,627 2,337 Power operation expense (other than fuel) 3,991 3,644 15,989 15,042 Customer accounts and assistance expense 2,836 2,579 11,436 10,356 Employee pension expense (1) 2,626 2,643 10,720 10,287 Employee healthcare plan (1) 1,725 2,786 9,128 10,374 General office supplies and expense 4,191 3,429 13,613 11,453 Administrative and general expense 4,225 4,315 14,710 15,187 Allowance for uncollectible accounts 773 746 3,692 3,191 Regulatory reversal of gain on sale of assets 0 1,236 0 1,236 Miscellaneous expense 117 185 605 694 Total $ 27,957 $ 27,137 $ 106,153 $ 98,160
(1) Does not include capitalized portion of costs, but reflects the GAAP expensed cost plus or minus costs deferred to and amortized from, a regulatory asset and/or a regulatory liability for Missouri, Kansas and Oklahoma jurisdictions.
Note 11– Segment Information
We operate our business as three segments: electric, gas and other. As part of our electric segment, we also provide water service to three towns in Missouri. The Empire District Gas Company is our wholly owned subsidiary formed to provide gas distribution service in Missouri. The other segment consists of our non-regulated businesses which is primarily our fiber optics business. The tables below present statement of income information, balance sheet information and capital expenditures of our business segments.
For the quarter ended March 31, 2014
Electric Gas Other Eliminations Total
($-000’s)
Statement of Income Information
Revenues $ 153,089 $ 24,609 $ 2,295 $ (320) $ 179,673
Depreciation and amortization 16,575 910 455 - 17,940
Federal and state income taxes 10,247 1,448 426 - 12,121
Operating income 25,526 3,274 688 - 29,488
Interest income 31 12 4 (6) 41
Interest expense 9,367 964 - (6) 10,325
Income from AFUDC (debt and equity) 1,967 26 - - 1,993
Net income 17,884 2,330 691 - 20,905
Capital Expenditures $ 46,703 $ 3,172 $ 457 $ - $ 50,332
24
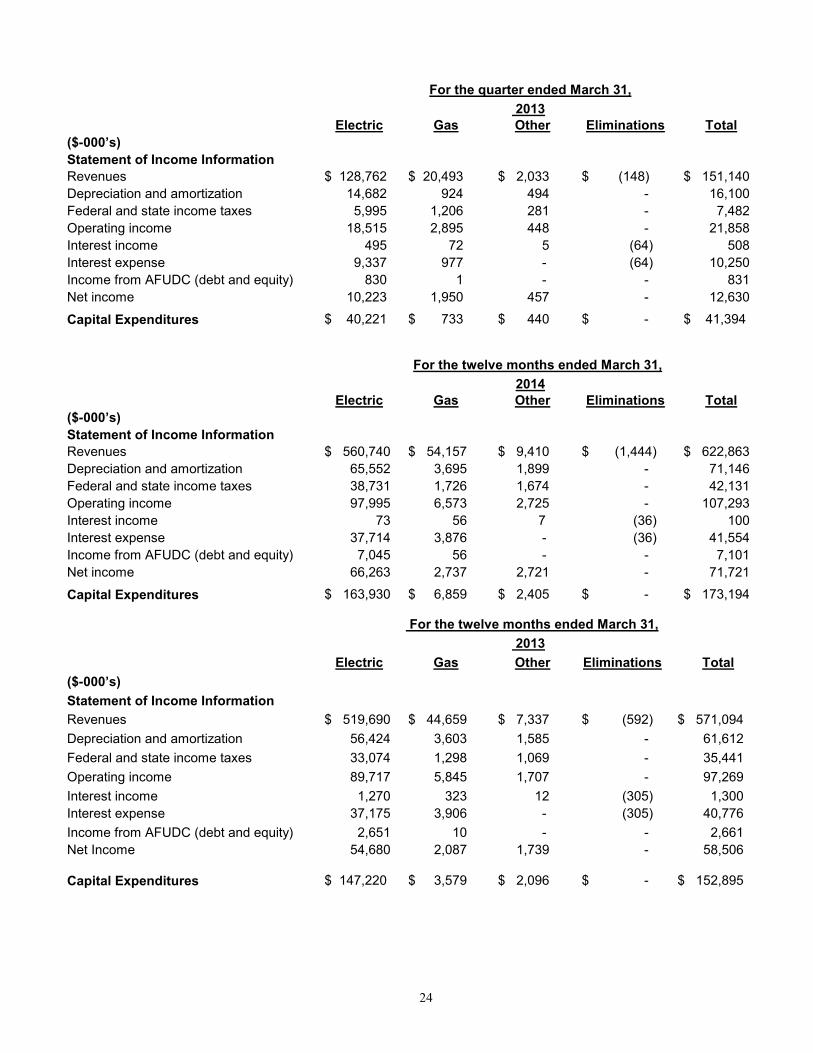
For the quarter ended March 31,
2013 Electric Gas Other Eliminations Total
($-000’s)
Statement of Income Information
Revenues $ 128,762 $ 20,493 $ 2,033 $ (148) $ 151,140
Depreciation and amortization 14,682 924 494 - 16,100
Federal and state income taxes 5,995 1,206 281 - 7,482
Operating income 18,515 2,895 448 - 21,858
Interest income 495 72 5 (64) 508
Interest expense 9,337 977 - (64) 10,250
Income from AFUDC (debt and equity) 830 1 - - 831
Net income 10,223 1,950 457 - 12,630
Capital Expenditures $ 40,221 $ 733 $ 440 $ - $ 41,394
For the twelve months ended March 31,
2014 Electric Gas Other Eliminations Total
($-000’s)
Statement of Income Information
Revenues $ 560,740 $ 54,157 $ 9,410 $ (1,444) $ 622,863
Depreciation and amortization 65,552 3,695 1,899 - 71,146
Federal and state income taxes 38,731 1,726 1,674 - 42,131
Operating income 97,995 6,573 2,725 - 107,293
Interest income 73 56 7 (36) 100
Interest expense 37,714 3,876 - (36) 41,554
Income from AFUDC (debt and equity) 7,045 56 - - 7,101
Net income 66,263 2,737 2,721 - 71,721
Capital Expenditures $ 163,930 $ 6,859 $ 2,405 $ - $ 173,194
For the twelve months ended March 31,
2013
Electric Gas Other Eliminations Total
($-000’s)
Statement of Income Information
Revenues $ 519,690 $ 44,659 $ 7,337 $ (592) $ 571,094
Depreciation and amortization 56,424 3,603 1,585 - 61,612
Federal and state income taxes 33,074 1,298 1,069 - 35,441
Operating income 89,717 5,845 1,707 - 97,269
Interest income 1,270 323 12 (305) 1,300
Interest expense 37,175 3,906 - (305) 40,776
Income from AFUDC (debt and equity) 2,651 10 - - 2,661
Net Income 54,680 2,087 1,739 - 58,506
Capital Expenditures
$ 147,220 $ 3,579 $ 2,096 $ - $ 152,895

25
As of March 31, 2014
($-000’s) Electric Gas
(1) Other Eliminations Total
Balance Sheet Information
Total assets $ 2,054,575 $ 126,389 $ 31,527 $ (44,020) $ 2,168,471
(1) Includes goodwill of $39,492.
As of December 31, 2013
($-000’s) Electric Gas(1) Other Eliminations Total
Balance Sheet Information
Total assets $ 2,034,234 $ 123,736 $ 31,306 $ (44,231) $ 2,145,045
(1) Includes goodwill of $39,492.
Note 12– Income Taxes
The following table shows the changes in our provision for income taxes (in millions) and our consolidated effective federal and state income tax rates for the applicable periods ended March 31,:
Three Months Ended Twelve Months Ended 2014 2013 2014 2013 Consolidated provision for income taxes $ 12.1 $ 7.5 $ 42.1 $ 35.4 Consolidated effective federal and state income tax rates 36.7% 37.2% 37.0% 37.7%
The effective income tax rate for the three and twelve month periods ended March 31, 2014 is lower than comparable periods in 2013 primarily due to higher equity AFUDC income in 2014 compared with 2013.
We do not have any unrecognized tax benefits as of March 31, 2014. We did not recognize any significant interest or penalties in any of the periods presented. We do not expect any significant changes to our unrecognized tax benefits over the next twelve months.
In 2010, we received $17.7 million of investment tax credits based on our investment in Iatan 2. We utilized $0.7 million of these credits when preparing our 2012 tax return. We expect to utilize approximately $10.7 million of these credits on our 2013 tax return. We expect to use the remaining credits on our 2014 tax return. The tax credit will have no significant income statement impact as the credits will flow to our customers as we amortize the tax credits over the life of the plant.
The American Taxpayer Relief Act of 2012 (the “Act”) was signed into law on January 2, 2013. The Act restored several expired business tax provisions, including bonus depreciation for 2013. Our 2014 tax payments are expected to be higher than 2013 due to the expiration of bonus depreciation. However, we expect to utilize investment tax credits noted above to partially offset the 2014 payments.
On September 13, 2013, the IRS and the Treasury Department released final regulations under Sections 162(a) and 263(a) on the deduction and capitalization of expenditures related to tangible property. These regulations apply to tax years beginning on or after January 1, 2014, and we plan to utilize the book capitalization method as allowable under the final regulations. We expect an immaterial impact to the effective tax rate based on the book capitalization method. Item 2. Management's Discussion and Analysis of Financial Condition and Results of Operations
EXECUTIVE SUMMARY
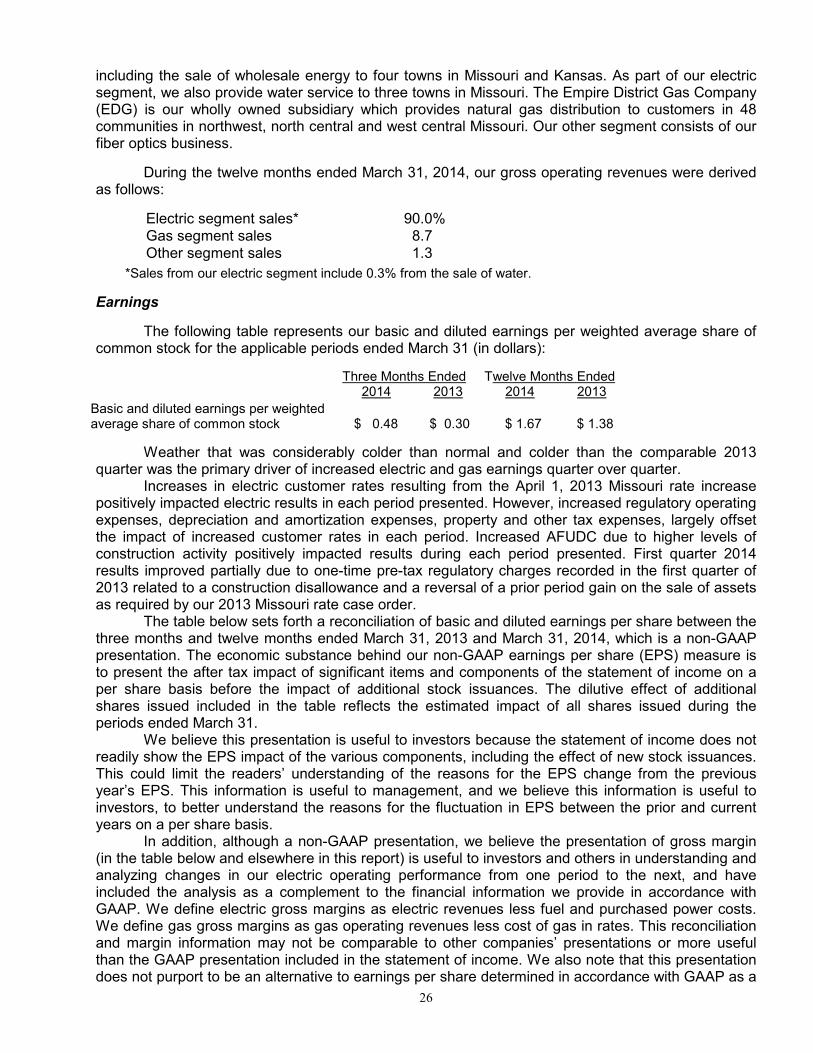
We operate our businesses as three segments: electric, gas and other. The Empire District Electric Company (EDE) is an operating public utility engaged in the generation, purchase, transmission, distribution and sale of electricity in parts of Missouri, Kansas, Oklahoma and Arkansas,
26
including the sale of wholesale energy to four towns in Missouri and Kansas. As part of our electric segment, we also provide water service to three towns in Missouri. The Empire District Gas Company (EDG) is our wholly owned subsidiary which provides natural gas distribution to customers in 48 communities in northwest, north central and west central Missouri. Our other segment consists of our fiber optics business.
During the twelve months ended March 31, 2014, our gross operating revenues were derived as follows:
Electric segment sales* 90.0% Gas segment sales 8.7 Other segment sales 1.3
*Sales from our electric segment include 0.3% from the sale of water.
Earnings
The following table represents our basic and diluted earnings per weighted average share of common stock for the applicable periods ended March 31 (in dollars):
Three Months Ended Twelve Months Ended 2014 2013 2014 2013 Basic and diluted earnings per weighted average share of common stock
$ 0.48
$ 0.30
$ 1.67
$ 1.38
Weather that was considerably colder than normal and colder than the comparable 2013 quarter was the primary driver of increased electric and gas earnings quarter over quarter.
Increases in electric customer rates resulting from the April 1, 2013 Missouri rate increase positively impacted electric results in each period presented. However, increased regulatory operating expenses, depreciation and amortization expenses, property and other tax expenses, largely offset the impact of increased customer rates in each period. Increased AFUDC due to higher levels of construction activity positively impacted results during each period presented. First quarter 2014 results improved partially due to one-time pre-tax regulatory charges recorded in the first quarter of 2013 related to a construction disallowance and a reversal of a prior period gain on the sale of assets as required by our 2013 Missouri rate case order.
The table below sets forth a reconciliation of basic and diluted earnings per share between the three months and twelve months ended March 31, 2013 and March 31, 2014, which is a non-GAAP presentation. The economic substance behind our non-GAAP earnings per share (EPS) measure is to present the after tax impact of significant items and components of the statement of income on a per share basis before the impact of additional stock issuances. The dilutive effect of additional shares issued included in the table reflects the estimated impact of all shares issued during the periods ended March 31.
We believe this presentation is useful to investors because the statement of income does not readily show the EPS impact of the various components, including the effect of new stock issuances. This could limit the readers’ understanding of the reasons for the EPS change from the previous year’s EPS. This information is useful to management, and we believe this information is useful to investors, to better understand the reasons for the fluctuation in EPS between the prior and current years on a per share basis.
In addition, although a non-GAAP presentation, we believe the presentation of gross margin (in the table below and elsewhere in this report) is useful to investors and others in understanding and analyzing changes in our electric operating performance from one period to the next, and have included the analysis as a complement to the financial information we provide in accordance with GAAP. We define electric gross margins as electric revenues less fuel and purchased power costs. We define gas gross margins as gas operating revenues less cost of gas in rates. This reconciliation and margin information may not be comparable to other companies’ presentations or more useful than the GAAP presentation included in the statement of income. We also note that this presentation does not purport to be an alternative to earnings per share determined in accordance with GAAP as a
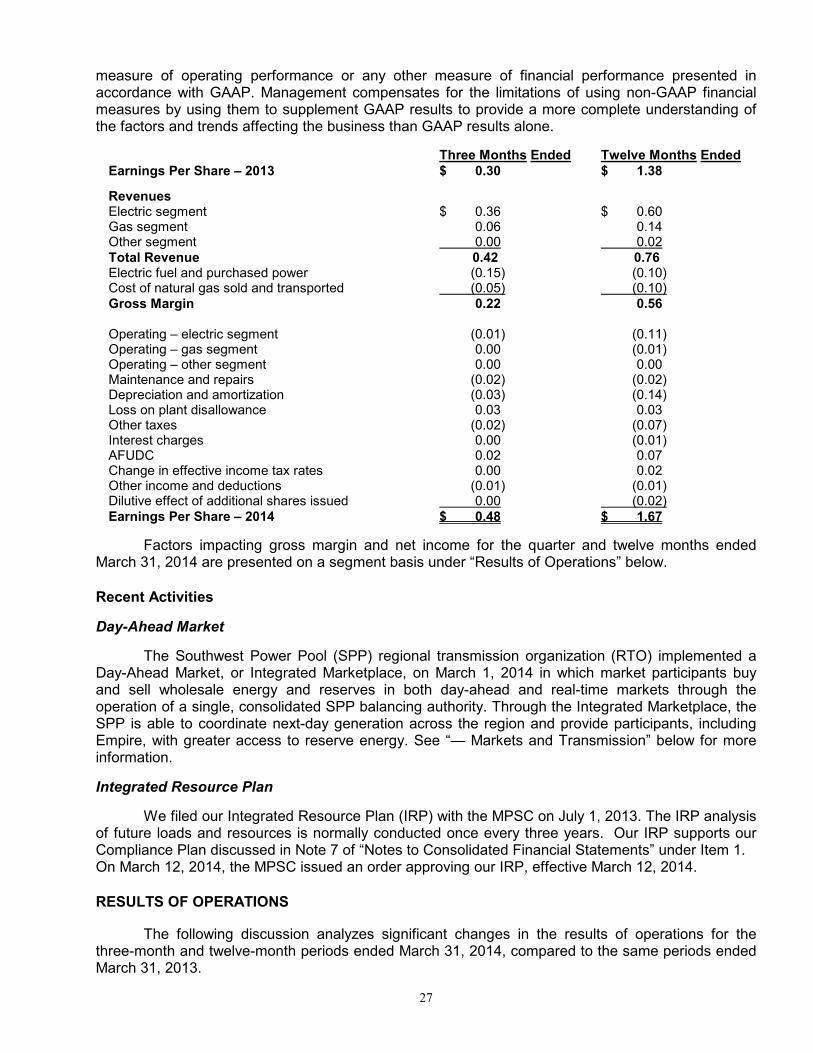
27
measure of operating performance or any other measure of financial performance presented in accordance with GAAP. Management compensates for the limitations of using non-GAAP financial measures by using them to supplement GAAP results to provide a more complete understanding of the factors and trends affecting the business than GAAP results alone.
Three Months Ended Twelve Months Ended Earnings Per Share – 2013 $ 0.30 $ 1.38 Revenues Electric segment $ 0.36 $ 0.60 Gas segment 0.06 0.14 Other segment 0.00 0.02 Total Revenue 0.42 0.76 Electric fuel and purchased power (0.15) (0.10) Cost of natural gas sold and transported (0.05) (0.10) Gross Margin 0.22 0.56 Operating – electric segment (0.01) (0.11) Operating – gas segment 0.00 (0.01) Operating – other segment 0.00 0.00 Maintenance and repairs (0.02) (0.02) Depreciation and amortization (0.03) (0.14) Loss on plant disallowance 0.03 0.03 Other taxes (0.02) (0.07) Interest charges 0.00 (0.01) AFUDC 0.02 0.07 Change in effective income tax rates 0.00 0.02 Other income and deductions (0.01) (0.01) Dilutive effect of additional shares issued 0.00 (0.02) Earnings Per Share – 2014 $ 0.48 $ 1.67
Factors impacting gross margin and net income for the quarter and twelve months ended March 31, 2014 are presented on a segment basis under “Results of Operations” below. Recent Activities
Day-Ahead Market
The Southwest Power Pool (SPP) regional transmission organization (RTO) implemented a Day-Ahead Market, or Integrated Marketplace, on March 1, 2014 in which market participants buy and sell wholesale energy and reserves in both day-ahead and real-time markets through the operation of a single, consolidated SPP balancing authority. Through the Integrated Marketplace, the SPP is able to coordinate next-day generation across the region and provide participants, including Empire, with greater access to reserve energy. See “— Markets and Transmission” below for more information.
Integrated Resource Plan
We filed our Integrated Resource Plan (IRP) with the MPSC on July 1, 2013. The IRP analysis of future loads and resources is normally conducted once every three years. Our IRP supports our Compliance Plan discussed in Note 7 of “Notes to Consolidated Financial Statements” under Item 1. On March 12, 2014, the MPSC issued an order approving our IRP, effective March 12, 2014. RESULTS OF OPERATIONS
The following discussion analyzes significant changes in the results of operations for the three-month and twelve-month periods ended March 31, 2014, compared to the same periods ended March 31, 2013.

28
The following table represents our results of operations by operating segment for the applicable periods ended March 31 (in millions):
Three Months Ended Twelve Months Ended 2014 2013 2014 2013 Electric $ 17.9 $ 10.2 $ 66.3 $ 54.7 Gas 2.3 1.9 2.7 2.1 Other 0.7 0.5 2.7 1.7 Net income $ 20.9 $ 12.6 $ 71.7 $ 58.5
Electric Segment
Gross Margin
The table below represents our electric gross margins for the applicable periods ended March 31 (dollars in millions):
Quarter Ended Twelve Months Ended 2014 2013 2014 2013 Electric segment revenues $ 153.1 $ 128.8 $ 560.7 $ 519.7 Fuel and purchased power 55.6 45.3 185.7 179.0 Electric segment gross margins $ 97.5 $ 83.5 $ 375.0 $ 340.7
As shown in the table above, electric segment gross margin increased approximately $14.0 million during the first quarter of 2014 as compared to the first quarter of 2013 mainly due to increased demand resulting from colder weather in the first quarter of 2014 and increased rates for our Missouri electric customers.
The electric gross margin increased approximately $34.3 million for the twelve months ended March 31, 2014 as compared to the same period in 2013, due to a full twelve months of increased Missouri electric rates that were effective April 1, 2013, increased demand resulting from the favorable 2013-2014 heating season and an increase in average electric customer counts.
Sales and Revenues
Electric operating revenues comprised approximately 85.2% of our total operating revenues during the first quarter of 2014. The amounts and percentage changes from the prior periods in kilowatt-hour (kWh) sales by major customer class for on-system (native load) sales for the applicable periods ended March 31, were as follows:
kWh Sales (in millions)
First First 12 Months 12 Months Quarter Quarter % Ended Ended % Customer Class 2014 2013 Change
(1) 2014 2013 Change
(1) Residential 641.6 571.1 12.3% 2,007.1 1,945.4 3.2% Commercial 388.5 359.7 8.0 1,570.6 1,580.1 (0.6) Industrial 237.1 240.6 (1.4) 1,012.0 1,027.3 (1.5) Wholesale on-system 84.1 84.4 (0.4) 342.7 353.1 (2.9) Other
(2) 35.2 33.0 6.6 131.6 125.9 4.5
Total on-system sales 1,386.5 1,288.8 7.6 5,064.0 5,031.8 0.6 (1) Percentage changes are based on actual kWh sales and may not agree to the rounded amounts shown above. (2) Other kWh sales include street lighting, other public authorities and interdepartmental usage.
KWh sales for our on-system customers increased 7.6% during the first quarter of 2014 as compared to the first quarter of 2013, primarily due to increased demand resulting from colder weather in the first quarter of 2014. The increase in residential and commercial kWh sales was mainly due to the colder weather. Total heating degree days for the first quarter of 2014 were 14.6% more than the same period last year and 14.8% more than the 30-year average. Industrial sales decreased 1.4%.

29
KWh sales for our on-system customers increased 0.6% during the twelve months ended March 31, 2014, as compared to the same period in 2013, due to increased demand resulting from increased customer counts and colder weather, which was mostly offset by the milder cooling season weather in the 2013 period. Residential kWh sales increased 3.2% primarily due to the favorable weather. Commercial kWh sales decreased slightly and industrial sales decreased 1.5%. The amounts and percentage changes from the prior periods in electric segment operating revenues by major customer class for on-system and off-system sales for the applicable periods ended March 31, were as follows:
Electric Segment Operating Revenues (in millions)
First
First
12 Months
12 Months
Quarter Quarter % Ended Ended % Customer Class 2014 2013 Change
(1) 2014 2013 Change
(1)
Residential $ 72.2 $ 61.2 17.9% $ 238.6 $ 221.5 7.7% Commercial 40.1 34.8 15.2 167.7 159.2 5.3 Industrial 18.0 17.1 5.2 81.4 77.9 4.5 Wholesale on-system 5.1 4.8 7.5 20.4 19.4 5.4 Other
(2) 3.9 3.5 11.3 15.4 14.0 9.3
Total on-system revenues $ 139.3 $ 121.4 14.7 $ 523.5 $ 492.0 6.4 Off-system and SPP Integrated Market activity
(3) 9.3 3.7 153.1 21.1 16.2 30.9
Total Revenues from kWh Sales 148.6 125.1 18.8 544.6 508.2 7.2 Miscellaneous Revenues
(4) 4.0 3.2 24.9 14.0 9.6 45.4
Total Electric Operating Revenues $ 152.6 $ 128.3 19.0 $ 558.6 $ 517.8 7.9 Water Revenues 0.5 0.5 0.0 2.1 1.9 12.8 Total Electric Segment Operating Revenues $ 153.1 $ 128.8 18.9 $ 560.7 $ 519.7 7.9
(1) Percentage changes are based on actual revenues and may not agree to the rounded amounts shown above. (2) Other operating revenues include street lighting, other public authorities and interdepartmental usage. (3)As of March 1, 2014, off-system revenues were effectively replaced by SPP Integrated Market activity. For the first quarter
of 2014, SPP integrated market net sales were $6.2 million. See “— Markets and Transmission” below for more information. (4)Miscellaneous revenues include transmission net revenue, late payment fees, renewable energy credit sales, rent, etc.
Revenues for our on-system customers increased $17.9 million during the first quarter of 2014 primarily due to colder weather as compared to the first quarter of 2013. The impact of weather and other related factors increased revenues an estimated $9.2 million. Rate changes increased revenues an estimated $7.6 million. Improved customer counts increased revenues an estimated $0.4 million. An increase in fuel recovery revenue (and corresponding increase in fuel expenses, resulting in no net effect on gross margin) from Missouri customers during the first quarter of 2014 compared to the prior year quarter increased revenues by $0.7 million. Revenues for our on-system customers increased $31.4 million for the twelve months ended March 31, 2014. Rate changes, primarily the April 2013 Missouri rate increase, contributed an estimated $31.2 million to revenues. Weather and other related factors increased revenues an estimated $2.2 million. Improved customer counts increased revenues an estimated $2.1 million. A change to our estimate of unbilled revenues in the third quarter of 2012 increased revenues $3.4 million. The 2014 twelve-month ended period does not include a corresponding adjustment. Additionally, a $0.7 million decrease in fuel recovery revenue (and corresponding reduction in fuel expenses, resulting in no net effect on gross margin) from Missouri customers during the twelve months ended March 31, 2014 compared to the same period in 2013 negatively impacted revenues.
Off-System Electric Transactions
In the past, in addition to sales to our own customers, we also sold power to other utilities as available, including (since 2007) through the SPP Energy Imbalance Services (EIS) market. However, on March 1, 2014, the SPP RTO implemented a Day-Ahead Market, or Integrated Marketplace, which replaces the real-time EIS market. SPP integrated market activity is settled for each market participant in various time increments. When we sell more generation to the market than we

30
purchase, based on the prescribed time increments, the net sale is included as part of electric revenues. When we purchase more generation from the market than we sell, based on the prescribed time increments, the net purchase is recorded as a component of fuel and purchased power on the financial statements. See “— Markets and Transmission” below. The majority of our market activity sales margin is included as a component of the fuel adjustment clause in our Missouri, Kansas and Oklahoma jurisdictions and our transmission rider in our Arkansas jurisdiction. As a result, nearly all of the market activity sales margin flows back to the customer and has little effect on margin or net income.
Miscellaneous Revenues
Our miscellaneous revenues were $4.0 million for the first quarter of 2014 as compared to $3.2 million for the first quarter of 2013. Our miscellaneous revenues were $14.0 million for the twelve months ended March 31, 2014 as compared to $9.6 million for the same period in 2013, mainly due to increased transmission revenues. These revenues are comprised mainly of transmission revenues, reflecting our position as an SPP transmission owner, late payment fees and renewable energy credit sales.
Operating Revenue Deductions – Fuel and Purchased Power
Included in our fuel and purchased power expenditures are our generation costs and net purchases from the SPP Integrated Marketplace. Net SPP integrated market activity is settled for each market participant in various time increments. When we purchase more generation from the market than we sell, based on the prescribed time increments, the net purchase is recorded as a component of fuel and purchased power on the financial statements. The table below is a reconciliation of our actual fuel and purchased power expenditures (netted with the regulatory adjustments) to the fuel and purchased power expense shown on our statements of income for the applicable periods ended March 31, 2014 and 2013. Three Months Ended Twelve Months Ended (in millions) 2014 2013 2014 2013 Actual fuel and purchased power expenditures
(1) $ 61.3 $ 47.7 $ 195.6 $ 180.6
Missouri fuel adjustment recovery (2) 0.3 (0.4) (2.0) (1.2)
Missouri fuel adjustment deferral(3) (4.6) (1.1) (4.0) 2.4
Kansas and Oklahoma regulatory adjustments(3) (0.5) 0.1 (0.9) 0.7
SWPA amortization(4) (0.8) (0.8) (2.8) (2.9)
Unrealized (gain)/loss on derivatives (0.1) (0.2) (0.2) (0.6) Total fuel and purchased power expense per income statement
$ 55.6
$ 45.3
$ 185.7
$ 179.0
(1) The periods ended March 31, 2014 include SPP integrated market net purchases of $6.3 million.
(2) A positive amount indicates costs recovered from customers from under recovery in prior deferral periods. A negative
amount indicates costs refunded to customers from over recovery in prior deferral periods.
(3)A negative amount indicates costs have been under recovered from customers and a positive amount indicates costs
have been over recovered from customers.
(4) Missouri ten year amortization of the $26.6 million payment received from the SWPA in September, 2010.
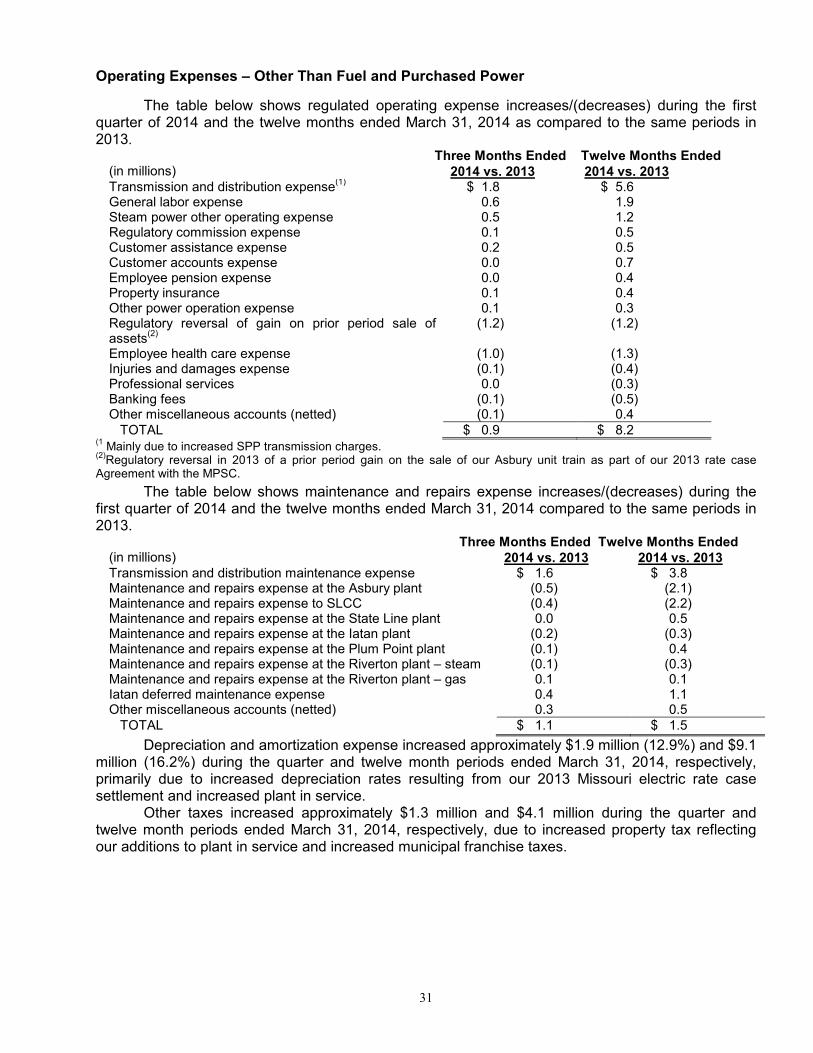
31
Operating Expenses – Other Than Fuel and Purchased Power
The table below shows regulated operating expense increases/(decreases) during the first quarter of 2014 and the twelve months ended March 31, 2014 as compared to the same periods in 2013.
Three Months Ended Twelve Months Ended (in millions) 2014 vs. 2013 2014 vs. 2013 Transmission and distribution expense
(1) $ 1.8 $ 5.6
General labor expense 0.6 1.9 Steam power other operating expense 0.5 1.2 Regulatory commission expense 0.1 0.5 Customer assistance expense 0.2 0.5 Customer accounts expense 0.0 0.7 Employee pension expense 0.0 0.4 Property insurance 0.1 0.4 Other power operation expense 0.1 0.3 Regulatory reversal of gain on prior period sale of assets
(2)
(1.2) (1.2)
Employee health care expense (1.0) (1.3) Injuries and damages expense (0.1) (0.4) Professional services 0.0 (0.3) Banking fees (0.1) (0.5) Other miscellaneous accounts (netted) (0.1) 0.4 TOTAL $ 0.9 $ 8.2
(1 Mainly due to increased SPP transmission charges.
(2)Regulatory reversal in 2013 of a prior period gain on the sale of our Asbury unit train as part of our 2013 rate case
Agreement with the MPSC.
The table below shows maintenance and repairs expense increases/(decreases) during the first quarter of 2014 and the twelve months ended March 31, 2014 compared to the same periods in 2013. Three Months Ended Twelve Months Ended
(in millions) 2014 vs. 2013 2014 vs. 2013 Transmission and distribution maintenance expense $ 1.6 $ 3.8 Maintenance and repairs expense at the Asbury plant (0.5) (2.1) Maintenance and repairs expense to SLCC (0.4) (2.2) Maintenance and repairs expense at the State Line plant 0.0 0.5 Maintenance and repairs expense at the Iatan plant (0.2) (0.3) Maintenance and repairs expense at the Plum Point plant (0.1) 0.4 Maintenance and repairs expense at the Riverton plant – steam (0.1) (0.3) Maintenance and repairs expense at the Riverton plant – gas 0.1 0.1 Iatan deferred maintenance expense 0.4 1.1 Other miscellaneous accounts (netted) 0.3 0.5 TOTAL $ 1.1 $ 1.5
Depreciation and amortization expense increased approximately $1.9 million (12.9%) and $9.1 million (16.2%) during the quarter and twelve month periods ended March 31, 2014, respectively, primarily due to increased depreciation rates resulting from our 2013 Missouri electric rate case settlement and increased plant in service. Other taxes increased approximately $1.3 million and $4.1 million during the quarter and twelve month periods ended March 31, 2014, respectively, due to increased property tax reflecting our additions to plant in service and increased municipal franchise taxes.

32
Gas Segment
Gas Operating Revenues and Sales
The following table details our natural gas sales for the periods ended March 31:
Total Gas Delivered to Customers Three Months Ended Twelve Months Ended (bcf sales) 2014 2013 % change 2014 2013 % change Residential 1.54 1.34 15.5% 2.95 2.38 23.8% Commercial 0.67 0.60 10.4 1.41 1.21 16.9 Industrial 0.04 0.03 8.3 0.07 0.07 14.8 Other
(1) 0.02 0.02 14.0 0.04 0.03 26.8
Total retail sales 2.27 1.99 13.8 4.47 3.69 21.4 Transportation sales 1.56 1.41 10.5 4.68 4.44 5.4 Total gas operating sales 3.83 3.40 12.5 9.15 8.13 12.6 (1) Other includes other public authorities and interdepartmental usage.
The following table details our natural gas revenues for the periods ended March 31:
Operating Revenues and Cost of Gas Sold Three Months Ended Twelve Months Ended ($ in millions) 2014 2013 % change 2014 2013 % change Residential $ 16.1 $ 13.3 21.0% $ 34.3 $ 28.0 22.9% Commercial 6.6 5.7 17.7 14.7 12.2 20.4 Industrial 0.3 0.2 24.8 0.6 0.5 12.9 Other
(1) 0.2 0.2 22.6 0.4 0.3 31.3
Total retail revenues $ 23.2 $ 19.4 20.1 $ 50.0 $ 41.0 22.1 Other revenues 0.1 0.0 24.1 0.4 0.4 17.9 Transportation revenues 1.3 1.1 18.9 3.7 3.3 11.6 Total gas operating revenues $ 24.6 $ 20.5 20.1 $ 54.1 $ 44.7 21.3 Cost of gas sold 15.0 11.9 26.2 28.9 22.0 31.6 Gas segment gross margins $ 9.6 $ 8.6 11.6 $ 25.2 $ 22.7 11.3 (1) Other includes other public authorities and interdepartmental usage.
Gas retail sales and revenues increased during the first quarter of 2014 as compared to 2013 reflecting colder weather during the first quarter of 2014. Heating degree days were 14.8% more in the first quarter of 2014 as compared to the first quarter of 2013 and 18.3% more than the 30-year average. As a result, our gas gross margin (defined as gas operating revenues less cost of gas in rates) increased $1.0 million in the first quarter of 2014 as compared to the same period in 2013.
Gas retail sales and revenues increased during the twelve months ended March 31, 2014 as compared to the same period in 2013, reflecting the colder heating season in 2014. Total heating degree days for the 2013-2014 gas heating season (which runs from November to March) were 19.6% more than the 2012-2013 gas heating season and 15.1% more than the 30-year average gas heating season. Our margin for the twelve months ended March 31, 2014 increased $2.6 million as compared to the same period in 2013. We have a PGA clause in place that allows us to recover from our customers, subject to routine regulatory review, the cost of purchased gas supplies, transportation and storage, including costs associated with the use of financial instruments to hedge the purchase price of natural gas. Pursuant to the provisions of the PGA clause, the difference between actual costs incurred and costs recovered through the application of the PGA are reflected as a regulatory asset or regulatory liability until the balance is recovered from or credited to customers. As of March 31, 2014, we had unrecovered purchased gas costs of $0.1 million recorded as a current regulatory asset and $3.2 million recorded as a non-current regulatory liability.
Operating Revenue Deductions
The table below shows regulated operating expense increases/(decreases) for the applicable periods ended March 31, 2014 as compared to the same periods in 2013.

33
Three Months Ended Twelve Months Ended (in millions) 2014 vs. 2013 2014 vs. 2013 Distribution operation expense $ 0.0 $ 0.2 Transmission operation expense 0.1 0.1 Customer accounts expense
(1) 0.0 0.4
TOTAL $ 0.1 $ 0.7 (1)Primarily uncollectible accounts.
The following table represents our results of operations for our gas segment for the applicable periods ended March 31 (in millions):
Three Months Ended Twelve Months Ended 2014 2013 2014 2013 Gas segment net income $ 2.3 $ 1.9 $ 2.7 $ 2.1
Consolidated Company
Income Taxes
The following table shows the changes in our provision for income taxes (in millions) and our consolidated effective federal and state income tax rates for the applicable periods ended March 31:
Three Months Ended Twelve Months Ended 2014 2013 2014 2013 Consolidated provision for income taxes $ 12.1 $ 7.5 $ 42.1 $ 35.4 Consolidated effective federal and state income tax rates 36.7% 37.2% 37.0% 37.7%
See Note 12 of “Notes to Consolidated Financial Statements (Unaudited)” for more information and discussion concerning our income tax provision and effective tax rates.
Nonoperating Items
The following table shows the total allowance for funds used during construction (AFUDC) for the applicable periods ended March 31. AFUDC increased during all periods presented in 2014 reflecting the environmental retrofit project at our Asbury plant.
Three Months Ended Twelve Months Ended ($ in millions) 2014 2013 2014 2013 Allowance for equity funds used during construction $ 1.3 $ 0.5 $ 4.6 $ 1.7 Allowance for borrowed funds used during construction 0.7 0.3 2.5 1.0 Total AFUDC $ 2.0 $ 0.8 $ 7.1 $ 2.7
Total interest charges on long-term and short-term debt for the periods ended March 31 are shown below. The change in long-term debt interest for 2014 compared to 2013 reflects the issuance, on May 30, 2013, of $30.0 million of 3.73% First Mortgage Bonds due May 30, 2033 and $120.0 million of 4.32% First Mortgage Bonds due May 30, 2043. We used a portion of the proceeds from the sale of these bonds to redeem all $98.0 million aggregate principal amount of our Senior Notes, 4.50% Series due June 15, 2013. Interest Charges ($ in millions)
3 Months 3 Months 12 Months 12 Months
Ended Ended % Ended Ended %
2014 2013 Change 2014 2013 Change
Long-term debt interest $ 10.1 $ 10.0 1.6% $ 40.5 $39.5 2.6% Short-term debt interest 0.0 0.0 (89.3) 0.0 0.2 (91.5) Other interest 0.2 0.2 (14.9) 1.1 1.1 (5.1) Total interest charges $ 10.3 $ 10.2 0.7 $ 41.6 $ 40.8 1.9

34
RATE MATTERS
We assess the need for rate relief in all of the jurisdictions we serve and file for such relief when necessary. Our rates for retail electric and natural gas services (other than specially negotiated retail rates for industrial or large commercial customers, which are subject to regulatory review and approval) are determined on a “cost of service” basis. Rates are designed to provide, after recovery of allowable operating expenses, an opportunity for us to earn a reasonable return on “rate base.” “Rate base” is generally determined by reference to the original cost (net of accumulated depreciation and amortization) of utility plant in service, subject to various adjustments for deferred taxes and other items. Over time, rate base is increased by additions to utility plant in service and reduced by depreciation, amortization and retirement of utility plant or write-off's as ordered by the utility commissions. In general, a request of new rates is made on the basis of a “rate base” as of a date prior to the date of the request and allowable operating expenses for a 12-month test period ended prior to the date of the request. Although the current rate making process provides recovery of some future changes in rate base and operating costs, it does not reflect all changes in costs for the period in which new retail rates will be in place. This results in a lag (commonly referred to as “regulatory lag”) between the time we incur costs and the time when we can start recovering the costs through rates.
The following table sets forth information regarding electric and water rate increases since January 1, 2011:
Jurisdiction
Date Requested
Annual Increase Granted
Percent Increase Granted
Date Effective
Missouri – Electric July 6, 2012 $ 27,500,000 6.78% April 1, 2013 Missouri – Water May 21, 2012 $ 450,000 25.5% November 23, 2012 Missouri – Electric September 28, 2010 $ 18,700,000 4.70% June 15, 2011 Kansas – Electric June 17, 2011 $ 1,250,000 5.20% January 1, 2012 Oklahoma – Electric June 30, 2011 $ 240,000 1.66% January 4, 2012 Oklahoma – Electric January 28, 2011 $ 1,063,100 9.32% March 1, 2011 Arkansas - Electric August 19, 2010 $ 2,104,321 19.00% April 13, 2011
On December 3, 2013, we filed a request with the Arkansas Public Service Commission for changes in rates for our Arkansas electric customers. We are seeking an annual increase in total revenue of approximately $2.2 million, or approximately 18%. The rate increase was requested to recover costs incurred to ensure continued reliable service for our customers, including capital investments, operating systems replacement costs and ongoing increases in other operation and maintenance expenses and capital costs. On May 18, 2012, we filed a request with the Federal Energy Regulatory Commission (FERC) to implement a cost-based transmission formula rate (TFR). On June 13, 2013, we, the Kansas Corporation Commission and the cities of Monett, Mt. Vernon and Lockwood, Missouri and Chetopa, Kansas, filed a unanimous Settlement Agreement (Agreement) with the FERC. The Agreement includes a TFR that establishes an ROE of 10.0%. The FERC conditionally approved the Agreement on November 18, 2013, and we made a compliance filing with the FERC on December 18, 2013 in connection with this conditional approval. Final FERC action on our compliance filing is pending.
Our other rate cases, as we reported in our Annual Report on Form 10-K for the year ended December 31, 2013, remain unchanged. See Note 3, “Regulatory Matters” in our Annual Report on Form 10-K for the year ended December 31, 2013 for additional information
MARKETS AND TRANSMISSION
Electric Segment
Day Ahead Market: On March 1, 2014, the SPP RTO implemented its Integrated Marketplace (or Day-Ahead Market), which replaced the Energy Imbalance Services (EIS) market. The SPP RTO created a single NERC-approved balancing authority (BA) that took over balancing authority

35
responsibilities for its members, including Empire. The SPP BA is expected to provide operational, economic and NERC Compliance benefits to our customers.
As part of the Integrated Marketplace, we, along with other SPP members are able to submit offers to sell power and bids to purchase power into the SPP market, with the SPP serving as a centralized dispatch. The SPP matches offers and bids based upon operating and reliability considerations. It is expected that 90%-95% of all next day generation needed throughout the SPP territory will be cleared through this Integrated Marketplace. We also acquire Transmission Congestion Rights (TCR) in an attempt to mitigate congestion costs associated with the power we will purchase from the SPP Integrated Market. The net financial effect of these Integrated Marketplace transactions are included in our fuel adjustment mechanisms.
SPP/Midcontinent Independent System Operator (MISO) Joint Operating Agreement: On December 19, 2013, Entergy integrated its generation, transmission, and load into the MISO regional transmission organization. Based on the current terms and conditions of MISO membership, Entergy’s participation in MISO will not be beneficial to our customers as it will significantly increase transmission delivery costs for our Plum Point power station as well as utilize our transmission system without compensation. In February 2014, the FERC granted a Request For Rehearing regarding the increased MISO transmission rate for Plum Point as well as established its own docket that was consolidated with the Entergy transmission formula rate docket. The consolidated dockets have been set for settlement evidentiary hearings in June 2014. Prior to Entergy’s integration into MISO, the SPP filed a Petition for Review of FERC’s Orders on the interpretation of the SPP/MISO Joint Operating Agreement at the United States Court of Appeals for the District of Columbia (DC). In early December 2013, the DC Court vacated and remanded FERC’s Orders that agreed with MISO regarding interpretation of the Joint Operating Agreement to utilize SPP’s system to integrate Entergy into MISO. The SPP believed MISO’s intentional and free use of the SPP transmission system was unjust and unreasonable and made unexecuted service agreement filings at the FERC in February 2014 to initiate billings to MISO. SPP members have intervened in the SPP’s Petition and are actively involved in the SPP stakeholder processes and other FERC dockets to address our concerns. In March 2014, the FERC issued key Orders accepting the SPP’s filing to collect transmission revenues on our behalf, subject to refund, and established a settlement hearing process for resolution of the SPP/MISO dispute. Although the FERC’s order is positive, the transmission revenue financial impact and realization of such increased revenues due to MISO’s use of the SPP transmission system, including our system, is uncertain at this time and may take several months for the FERC acceptance of a resolution between the parties.
Information concerning recent and pending SPP RTO and other FERC activities can be found under Note 3, “Regulatory Matters – Markets and Transmission” in our Annual Report on Form 10-K for the year ended December 31, 2013. LIQUIDITY AND CAPITAL RESOURCES Overview. Our primary sources of liquidity are cash provided by operating activities, short-term borrowings under our commercial paper program (which is supported by our credit facilities) and borrowings from our unsecured revolving credit facility. As needed, we raise funds from the debt and equity capital markets to fund our liquidity and capital resource needs. Our issuance of various securities, including equity, long-term and short-term debt, is subject to customary approval or authorization by state and federal regulatory bodies including state public service commissions and the SEC. We believe the cash provided by operating activities, together with the amounts available to us under our credit facilities and the issuance of debt and equity securities, will allow us to meet our needs for working capital, pension contributions, our continuing construction expenditures, anticipated debt redemptions, interest payments on debt obligations, dividend payments and other cash needs through the next several years. See “Capital Requirements and Investing Activities” below for further information. We will continue to evaluate our need to increase available liquidity based on our view of working capital requirements, including the timing of our construction programs and other factors.

36
See Item 1A, “Risk Factors” in our Annual Report on Form 10-K for the year ended December 31, 2013 for additional information on items that could impact our liquidity and capital resource requirements. The following table provides a summary of our operating, investing and financing activities for the quarters ended March 31:
Summary of Cash Flows Quarter Ended March 31, (in millions) 2014 2013 Change
Cash provided by/(used in): Operating activities $ 54.6 $ 44.1 $ 10.5 Investing activities (45.8) (35.2) (10.6) Financing activities (8.1) (9.1) 1.0 Net change in cash and cash equivalents $ 0.7 $ (0.2) $ 0.9
Cash flow from Operating Activities
We prepare our statement of cash flows using the indirect method. Under this method, we reconcile net income to cash flows from operating activities by adjusting net income for those items that impact net income but may not result in actual cash receipts or payments during the period. These reconciling items include depreciation and amortization, pension costs, deferred income taxes, equity AFUDC, changes in commodity risk management assets and liabilities and changes in the consolidated balance sheet for working capital from the beginning to the end of the period. Period-over-period changes in our operating cash flows are attributable primarily to working capital changes resulting from the impact of weather, the timing of customer collections, payments for natural gas and coal purchases, the effects of deferred fuel recoveries and the size and timing of pension contributions. The increase or decrease in natural gas prices directly impacts the cost of gas stored in inventory.
First Quarter 2014 Compared to 2013. During the first quarter of 2014, our net cash flows provided from operating activities increased $10.5 million or 23.8% from 2013. This change resulted from the following:
• Increase in net income - $8.3 million. • Increased plant in service depreciation - $1.6 million and fuel adjustment amortizations - $0.7
million. • Increased cash flow from changes in unbilled revenues - $5.6 million and various accounts
receivable - $2.5 million. • Increased cash flow from changes in income and property tax accruals - $7.9 million. • Adjustment to cash flow for increased AFUDC - $(0.7) million. • Cash flow adjustments related to the 2013 Missouri electric rate case for a loss on plant
disallowance - $(2.4) million and a reversal of a prior period gain on the sale of assets - $(1.2) million.
• Lower cash flow adjustments for deferred taxes mostly based on the expiration of bonus depreciation - $(3.1) million.
• Higher cash outflows resulting from changes in fuel inventories in part due to higher sales - $(3.9) million.
• Higher cash outflows resulting from changes in prepaid accounts, accounts payable and accrued liabilities - $(4.8) million.
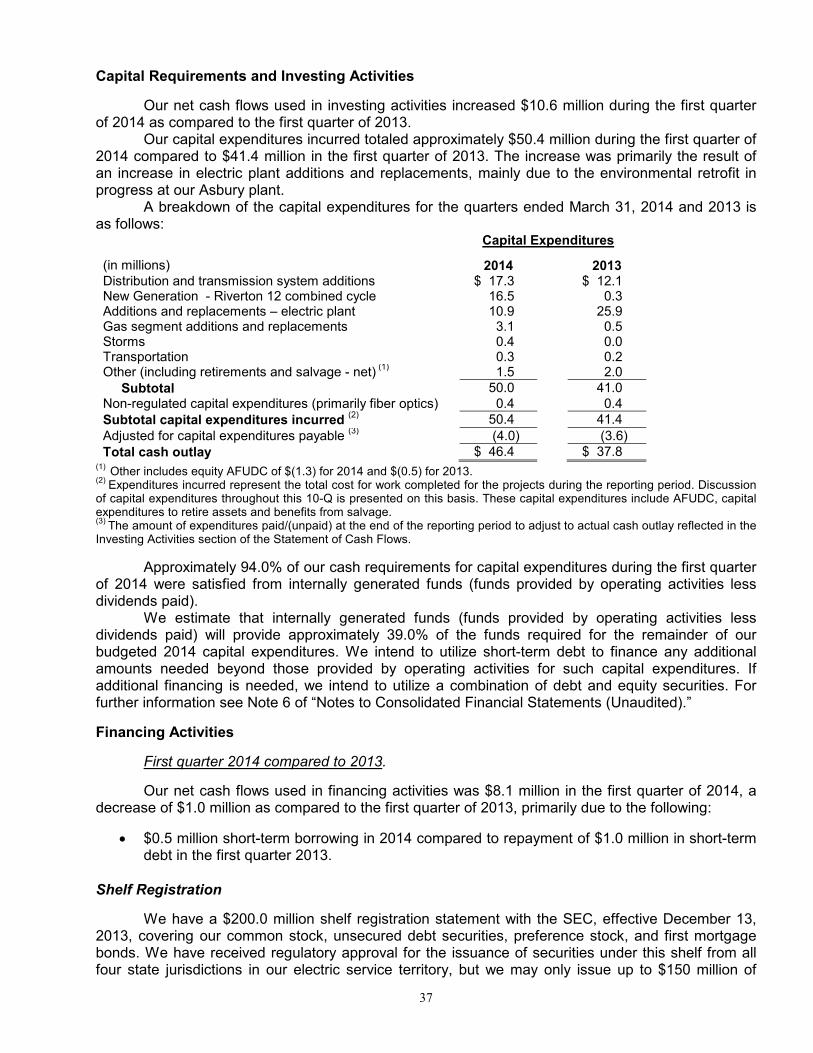
37
Capital Requirements and Investing Activities
Our net cash flows used in investing activities increased $10.6 million during the first quarter of 2014 as compared to the first quarter of 2013. Our capital expenditures incurred totaled approximately $50.4 million during the first quarter of 2014 compared to $41.4 million in the first quarter of 2013. The increase was primarily the result of an increase in electric plant additions and replacements, mainly due to the environmental retrofit in progress at our Asbury plant. A breakdown of the capital expenditures for the quarters ended March 31, 2014 and 2013 is as follows: Capital Expenditures (in millions) 2014 2013 Distribution and transmission system additions $ 17.3 $ 12.1 New Generation - Riverton 12 combined cycle 16.5 0.3 Additions and replacements – electric plant 10.9 25.9 Gas segment additions and replacements 3.1 0.5 Storms 0.4 0.0 Transportation 0.3 0.2 Other (including retirements and salvage - net)
(1) 1.5 2.0
Subtotal 50.0 41.0 Non-regulated capital expenditures (primarily fiber optics) 0.4 0.4 Subtotal capital expenditures incurred
(2) 50.4 41.4
Adjusted for capital expenditures payable (3) (4.0) (3.6)
Total cash outlay $ 46.4 $ 37.8 (1)
Other includes equity AFUDC of $(1.3) for 2014 and $(0.5) for 2013. (2)
Expenditures incurred represent the total cost for work completed for the projects during the reporting period. Discussion of capital expenditures throughout this 10-Q is presented on this basis. These capital expenditures include AFUDC, capital expenditures to retire assets and benefits from salvage. (3)
The amount of expenditures paid/(unpaid) at the end of the reporting period to adjust to actual cash outlay reflected in the Investing Activities section of the Statement of Cash Flows.
Approximately 94.0% of our cash requirements for capital expenditures during the first quarter of 2014 were satisfied from internally generated funds (funds provided by operating activities less dividends paid). We estimate that internally generated funds (funds provided by operating activities less dividends paid) will provide approximately 39.0% of the funds required for the remainder of our budgeted 2014 capital expenditures. We intend to utilize short-term debt to finance any additional amounts needed beyond those provided by operating activities for such capital expenditures. If additional financing is needed, we intend to utilize a combination of debt and equity securities. For further information see Note 6 of “Notes to Consolidated Financial Statements (Unaudited).”
Financing Activities
First quarter 2014 compared to 2013. Our net cash flows used in financing activities was $8.1 million in the first quarter of 2014, a decrease of $1.0 million as compared to the first quarter of 2013, primarily due to the following:
• $0.5 million short-term borrowing in 2014 compared to repayment of $1.0 million in short-term debt in the first quarter 2013.
Shelf Registration
We have a $200.0 million shelf registration statement with the SEC, effective December 13, 2013, covering our common stock, unsecured debt securities, preference stock, and first mortgage bonds. We have received regulatory approval for the issuance of securities under this shelf from all four state jurisdictions in our electric service territory, but we may only issue up to $150 million of

38
such securities in the form of first mortgage bonds. We plan to use proceeds from offerings made pursuant to this shelf to fund capital expenditures, refinance existing debt or general corporate needs during the three-year effective period.
Credit Agreements
On January 17, 2012, we entered into the Third Amended and Restated Unsecured Credit Agreement which amended and restated our Second Amended and Restated Unsecured Credit Agreement dated January 26, 2010. This agreement extended the termination date of the revolving credit facility from January 26, 2013 to January 17, 2017. The agreement also removed the letter of credit facility and includes a swingline loan facility with a $15 million swingline loan sublimit. The aggregate amount of the revolving credit commitments remains $150 million, inclusive of the $15 million swingline loan sublimit. In addition, the pricing and fees under the facility were amended. Interest on borrowings under the facility accrues at a rate equal to, at our option, (i) the highest of (A) the bank’s prime commercial rate, (B) the federal funds effective rate plus 0.5% or (C) one month LIBOR plus 1.0%, plus a margin or (ii) one month, two month or three month LIBOR, in each case, plus a margin. Each margin is based on our current credit ratings and the pricing schedule in the facility. As of the date hereof, and based on our current credit ratings, the LIBOR margin under the facility is 1.25%. A facility fee is payable quarterly on the full amount of the commitments under the facility based on our current credit ratings, which fee is currently 0.20%. In addition, upon entering into the amended and restated facility, we paid an upfront fee to the revolving credit banks of $262,500 in the aggregate. There were no other material changes to the terms of the facility.
The facility is used for working capital, general corporate purposes and to back-up our use of commercial paper. This facility requires our total indebtedness to be less than 62.5% of our total capitalization at the end of each fiscal quarter and our EBITDA (defined as net income plus interest, taxes, depreciation and amortization) to be at least two times our interest charges for the trailing four fiscal quarters at the end of each fiscal quarter. Failure to maintain these ratios will result in an event of default under the credit facility and will prohibit us from borrowing funds thereunder. As of March 31, 2014, we are in compliance with these ratios. Our total indebtedness is 49.5% of our total capitalization as of March 31, 2014 and our EBITDA is 5.8 times our interest charges. This credit facility is also subject to cross-default if we default on in excess of $10 million in the aggregate on our other indebtedness. This arrangement does not serve to legally restrict the use of our cash in the normal course of operations. There were no outstanding borrowings under this agreement at March 31, 2014. However, $4.5 million was used to back up our outstanding commercial paper.
EDE Mortgage Indenture
The principal amount of all series of first mortgage bonds outstanding at any one time under the EDE Mortgage is limited by terms of the mortgage to $1.0 billion. Substantially all of the property, plant and equipment of The Empire District Electric Company (but not its subsidiaries) is subject to the lien of the EDE Mortgage. Restrictions in the EDE mortgage bond indenture could affect our liquidity. The EDE Mortgage contains a requirement that for new first mortgage bonds to be issued, our net earnings (as defined in the EDE Mortgage) for any twelve consecutive months within the fifteen months preceding issuance must be two times the annual interest requirements (as defined in the EDE Mortgage) on all first mortgage bonds then outstanding and on the prospective issue of new first mortgage bonds. Our earnings for the twelve months ended March 31, 2014 would permit us to issue approximately $721.9 million of new first mortgage bonds based on this test with an assumed interest rate of 5.5%. In addition to the interest coverage requirement, the EDE Mortgage provides that new bonds must be issued against, among other things, retired bonds or 60% of net property additions. At March 31, 2014, we had retired bonds and net property additions which would enable the issuance of at least $880.7 million principal amount of bonds if the annual interest requirements are met. However, based on the $1 billion limit on the principal amount of first mortgage bonds outstanding set forth by the EDE mortgage, and our current level of outstanding first mortgage bonds, we are limited to the issuance of $417.0 million of new first mortgage bonds. As of March 31, 2014, we are in compliance with all restrictive covenants of the EDE Mortgage.

39
EDG Mortgage Indenture
The principal amount of all series of first mortgage bonds outstanding at any one time under the EDG Mortgage is limited by terms of the mortgage to $300.0 million. Substantially all of the property, plant and equipment of The Empire District Gas Company is subject to the lien of the EDG Mortgage. The EDG Mortgage contains a requirement that for new first mortgage bonds to be issued, the amount of such new first mortgage bonds shall not exceed 75% of the cost of property additions acquired after the date of the Missouri Gas acquisition. The mortgage also contains a limitation on the issuance by EDG of debt (including first mortgage bonds, but excluding short-term debt incurred in the ordinary course under working capital facilities) unless, after giving effect to such issuance, EDG’s ratio of EBITDA (defined as net income plus interest, taxes, depreciation, amortization and certain other non-cash charges) to interest charges for the most recent four fiscal quarters is at least 2.0 to 1.0. As of March 31, 2014, this test would allow us to issue approximately $18.0 million principal amount of new first mortgage bonds at an assumed interest rate of 5.5%.
Credit Ratings
Currently, our corporate credit ratings and the ratings for our securities are as follows: Fitch Moody’s Standard & Poor’s Corporate Credit Rating n/r* Baa1 BBB EDE First Mortgage Bonds BBB+ A2 A- Senior Notes BBB Baa1 BBB Commercial Paper F3 P-2 A-2 Outlook Stable Stable Stable
*Not rated
On January 30, 2014, Moody’s upgraded our corporate credit rating to Baa1 from Baa2, senior secured debt to A2 from A3, senior unsecured debt to Baa1 from Baa2 and affirmed our commercial paper rating at P-2. On March 6, 2013, Standard & Poor’s upgraded our corporate credit rating to BBB from BBB-, senior secured debt to A- from BBB+, senior unsecured debt to BBB from BBB- and our commercial paper rating to A-2 from A-3. On May 24, 2013, Fitch reaffirmed our ratings. A security rating is not a recommendation to buy, sell or hold securities. Each rating is subject to revision or withdrawal at any time by the assigning rating organization. Each security rating agency has its own methodology for assigning ratings, and, accordingly, each rating should be considered independently of all other ratings. CONTRACTUAL OBLIGATIONS
Our contractual obligations have not materially changed at March 31, 2014, compared to December 31, 2013. See “Contractual Obligations” in our Annual Report on Form 10-K for the year ended December 31, 2013.
DIVIDENDS
Holders of our common stock are entitled to dividends if, as, and when declared by the Board of Directors, out of funds legally available therefore, subject to the prior rights of holders of any outstanding cumulative preferred stock and preference stock. Payment of dividends is determined by our Board of Directors after considering all relevant factors, including the amount of our retained earnings (which is essentially our accumulated net income less dividend payouts). A reduction of our dividend per share, partially or in whole, could have an adverse effect on our common stock price.
The following table shows our diluted earnings per share, dividends paid per share, total dividends paid and retained earnings balance for the quarters ended March 31, 2014 and 2013, and the year ended December 31, 2013:

40
Quarters Ended Year Ended (in millions, except per share amounts) March 2014 March 2013 December 2013 Diluted earnings per share $ 0.48 $ 0.30 $ 1.48 Dividends paid per share $ 0.255 $ 0.25 $ 1.005 Total dividends paid $ 11.0 $ 10.6 $ 43.0 Retained earnings period-end balance $ 77.5 $ 49.1 $ 67.6
OFF-BALANCE SHEET ARRANGEMENTS
We have no off-balance sheet arrangements that have or are reasonably likely to have a current or future effect on our financial condition, changes in financial condition, revenues or expenses, results of operations, liquidity, capital expenditures or capital resources, other than operating leases entered into in the normal course of business.
CRITICAL ACCOUNTING POLICIES
See “Item 7 – Management’s Discussion and Analysis of Financial Condition and Results of Operations” in our Annual Report on Form 10-K for the year ended December 31, 2013 for a discussion of additional critical accounting policies. There were no changes in these policies in the quarter ended March 31, 2014.
RECENTLY ISSUED ACCOUNTING STANDARDS
See Note 2 of “Notes to Consolidated Financial Statements (Unaudited)”.
Item 3. Quantitative and Qualitative Disclosures about Market Risk
Our fuel procurement activities involve primary market risk exposures, including commodity price risk and credit risk. Commodity price risk is the potential adverse price impact related to the fuel procurement for our generating units. Credit risk is the potential adverse financial impact resulting from non-performance by a counterparty of its contractual obligations. Additionally, we are exposed to interest rate risk which is the potential adverse financial impact related to changes in interest rates.
Market Risk and Hedging Activities. Prices in the wholesale power markets can be extremely volatile. This volatility impacts our cost of power purchased and our participation in energy trades. If we were unable to generate an adequate supply of electricity for our customers, we would attempt to purchase power from others. Such supplies are not always available. In addition, congestion on the transmission system can limit our ability to make purchases from (or sell into) the wholesale markets. We engage in physical and financial trading activities with the goals of reducing risk from market fluctuations. In accordance with our established Energy Risk Management Policy, which typically includes entering into various derivative transactions, we attempt to mitigate our commodity market risk. Derivatives are utilized to manage our gas commodity market risk. We also acquire Transmission Congestion Rights (TCR) in an attempt to lessen the cost of power we purchase from the SPP Integrated Market due to congestion costs. See Note 4, of “Notes to Consolidated Financial Statements (Unaudited)”.
Commodity Price Risk. We are exposed to the impact of market fluctuations in the price and transportation costs of coal, natural gas, and electricity and employ established policies and procedures to manage the risks associated with these market fluctuations, including utilizing derivatives.
We satisfied 65.8% of our 2013 generation fuel supply need through coal. Approximately 96% of our 2013 coal supply was Western coal. We have contracts and binding proposals to supply a portion of the fuel for our coal plants through 2016. These contracts satisfy approximately 97% of our anticipated fuel requirements for 2014, 39% for 2015 and 19% for 2016 for our Asbury coal plant. In order to manage our exposure to fuel prices, future coal supplies will be acquired using a combination of short-term and long-term contracts.

41
We are exposed to changes in market prices for natural gas we must purchase to run our combustion turbine generators. Our natural gas procurement program is designed to manage our costs to avoid volatile natural gas prices. We enter into physical forward and financial derivative contracts with counterparties relating to our future natural gas requirements that lock in prices (with respect to predetermined percentages of our expected future natural gas needs) in an attempt to lessen the volatility in our fuel expenditures and improve predictability. As of March 31, 2014, 59%, or 4.8 million Dths’s, of our anticipated volume of natural gas usage for our electric operations for the remainder of 2014 is hedged. Based on our expected natural gas purchases for our electric operations for the next twelve months, if average natural gas prices should increase 10% more than the price at March 31, 2014, our natural gas expenditures would increase by approximately $1.9 million based on our March 31, 2014 total hedged positions for the next twelve months. However, such an increase would be probable of recovery through fuel adjustment mechanisms in all of our jurisdictions, which significantly reduces the impact of fluctuating fuel costs.
We attempt to mitigate a portion of our natural gas price risk associated with our gas segment using physical forward purchase agreements, storage and derivative contracts. As of March 31, 2014, we have 0.1 million Dths in storage on the three pipelines that serve our customers. This represents 7% of our storage capacity. We have no additional Dths hedged through financial derivatives or physical contracts. See Note 4 of “Notes to Consolidated Financial Statements (Unaudited)” for further information.
Credit Risk. In order to minimize overall credit risk, we maintain credit policies, including the evaluation of counterparty financial condition and the use of standardized agreements that facilitate the netting of cash flows associated with a single counterparty. See Note 4 of “Notes to Consolidated Financial Statements (Unaudited)” regarding agreements containing credit risk contingent features. In addition, certain counterparties make available collateral in the form of cash held as margin deposits as a result of exceeding agreed-upon credit exposure thresholds or may be required to prepay the transaction. Conversely, we are required to post collateral with counterparties at certain thresholds, which is typically the result of changes in commodity prices. Amounts reported as margin deposit liabilities represent counterparty funds we hold that result from various trading counterparties exceeding agreed-upon credit exposure thresholds. Amounts reported as margin deposit assets represent our funds held on deposit for our NYMEX contracts with our broker and other financial contracts with other counterparties that resulted from us exceeding agreed-upon credit limits established by the counterparties. The following table depicts our margin deposit assets at March 31, 2014 and December 31, 2013. There were no margin deposit liabilities at these dates.
March 31, 2014 December 31, 2013 (in millions) Margin deposit assets $ 4.0 $ 5.2
Our exposure to credit risk is concentrated primarily within our fuel procurement process, as we transact with a small group of counterparties and transactions may involve large notional volumes and potentially volatile commodity prices. Below is a table showing our net credit exposure at March 31, 2014, reflecting that our counterparties are exposed to Empire for the net unrealized mark-to-market losses for physical forward and financial natural gas contracts carried at fair value.
(in millions) Net unrealized mark-to-market losses for physical forward natural gas contracts $ 0.8 Net unrealized mark-to-market losses for financial natural gas contracts 3.2 Net credit exposure $ 4.0
The $3.2 million net unrealized mark-to-market loss for financial natural gas contracts is comprised entirely of $3.2 million that our counterparties are exposed to Empire for unrealized losses. We are holding no collateral from any counterparty since we are below the $10.0 million mark-to-

42
market collateral threshold in our agreements. As noted above, as of March 31, 2014, we have $4.0 million on deposit for NYMEX contract exposure to Empire, of which $3.7 million represents our collateral requirement. If NYMEX gas prices decreased 25% from their March 31,
2014 levels, our
collateral requirement would increase $9.7 million. If these prices increased 25%, our collateral requirement would decrease $2.3 million. Our other counterparties would not be required to post collateral with Empire.
We sell electricity and gas and provide distribution and transmission services to a diverse group of customers, including residential, commercial and industrial customers. Credit risk associated with trade accounts receivable from energy customers is limited due to the large number of customers. In addition, we enter into contracts with various companies in the energy industry for purchases of energy-related commodities, including natural gas in our fuel procurement process.
Interest Rate Risk. We are exposed to changes in interest rates as a result of financing through our issuance of commercial paper and other short-term debt. We manage our interest rate exposure by limiting our variable-rate exposure (applicable to commercial paper and borrowings under our unsecured credit agreement) to a certain percentage of total capitalization, as set by policy, and by monitoring the effects of market changes in interest rates. If market interest rates average 1% more in 2014 than in 2013, our interest expense would increase, and income before taxes would decrease by less than $0.3 million. This amount has been determined by considering the impact of the hypothetical interest rates on our highest month-end commercial paper balance for 2013. These analyses do not consider the effects of the reduced level of overall economic activity that could exist in such an environment. In the event of a significant change in interest rates, management would likely take actions to further mitigate its exposure to the change. However, due to the uncertainty of the specific actions that would be taken and their possible effects, the sensitivity analysis assumes no changes in our financial structure.
Item 4. Controls and Procedures
As of the end of the period covered by this report, an evaluation was carried out, under the supervision and with the participation of our management, including our Chief Executive Officer and Chief Financial Officer, of the effectiveness of the design and operation of our disclosure controls and procedures (as such term is defined in Rule 13a-15(e) of the Securities Exchange Act of 1934). Based upon that evaluation, the Chief Executive Officer and Chief Financial Officer concluded that our disclosure controls and procedures were effective as of March 31, 2014. There have been no changes in our internal control over financial reporting that occurred during the first quarter of 2014 that have materially affected, or are reasonably likely to materially affect, our internal control over financial reporting other than changes resulting from the implementation of the SPP Integrated Market. We made appropriate changes to internal controls and procedures as expected, mostly relating to our revenue and fuel expense cycles and certain information technology controls. None of the changes resulting from the implementation impair or significantly alter the effectiveness of our internal control over financial reporting.
PART II. OTHER INFORMATION
Item 1. Legal Proceedings
See Note 7 of “Notes to Consolidated Financial Statements (Unaudited)” under “Legal Proceedings”, which description is incorporated herein by reference
Item 1A. Risk Factors.
There have been no material changes to the factors disclosed in Part I, Item 1-A. Risk Factors in our Annual Report on Form 10-K for the year ended December 31, 2013.
43
Item 5. Other Information.
For the twelve months ended March 31, 2014, our ratio of earnings to fixed charges was 3.19x. See Exhibit (12) hereto.
Item 6. Exhibits.
(a) Exhibits.
(12) Computation of Ratio of Earnings to Fixed Charges.
(31)(a) Certification of Chief Executive Officer pursuant to Section 302 of the Sarbanes-Oxley Act of 2002.
(31)(b) Certification of Chief Financial Officer pursuant to Section 302 of the Sarbanes-Oxley Act of 2002.
(32)(a) Certification of Chief Executive Officer pursuant to 18 U.S.C. Section 1350, as adopted pursuant to Section 906 of the Sarbanes-Oxley Act of 2002.*
(32)(b) Certification of Chief Financial Officer pursuant to 18 U.S.C. Section 1350, as adopted pursuant to Section 906 of the Sarbanes-Oxley Act of 2002.*
(101) The following financial information from The Empire District Electric Company’s Quarterly Report on Form 10-Q for the period ended March 31, 2014, filed with the SEC on May 9, 2014, formatted in Extensible Business Reporting Language (XBRL): (i) the Consolidated Statements of Income for the three and twelve month periods ended March 31, 2014 and 2013, (ii) the Consolidated Balance Sheets at March 31, 2014 and December 31, 2013, (iii) the Consolidated Statements of Cash Flows for the three-month periods ended March 31, 2014 and 2013, and (iv) Notes to Consolidated Financial Statements.**
*This certification accompanies this Report pursuant to Section 906 of the Sarbanes-Oxley Act of 2002 and shall not be deemed filed by the Company for purposes of Section 18 or any other provision of the Securities Exchange Act of 1934, as amended.
**Pursuant to Rule 406T of Regulation S-T, the XBRL related information in Exhibit 101 to this Quarterly Report on Form 10-Q shall not be deemed to be “filed” for purposes of Section 18 of the Exchange Act, or otherwise subject to the liability of that section, and shall not be deemed incorporated by reference into, or part of a registration statement, prospectus or other document filed under the Securities Act of 1933, as amended or the Exchange Act of 1934, as amended except as shall be expressly set forth by specific reference in such filings.

44
SIGNATURES
Pursuant to the requirements of the Securities Exchange Act of 1934, the Registrant has duly caused this report to be signed on its behalf by the undersigned thereunto duly authorized.
THE EMPIRE DISTRICT ELECTRIC COMPANY Registrant
By /s/ Laurie A. Delano Laurie A. Delano
Vice President – Finance and Chief Financial Officer
By /s/ Robert W. Sager Robert W. Sager
Controller, Assistant Secretary and Assistant Treasurer May 9, 2014
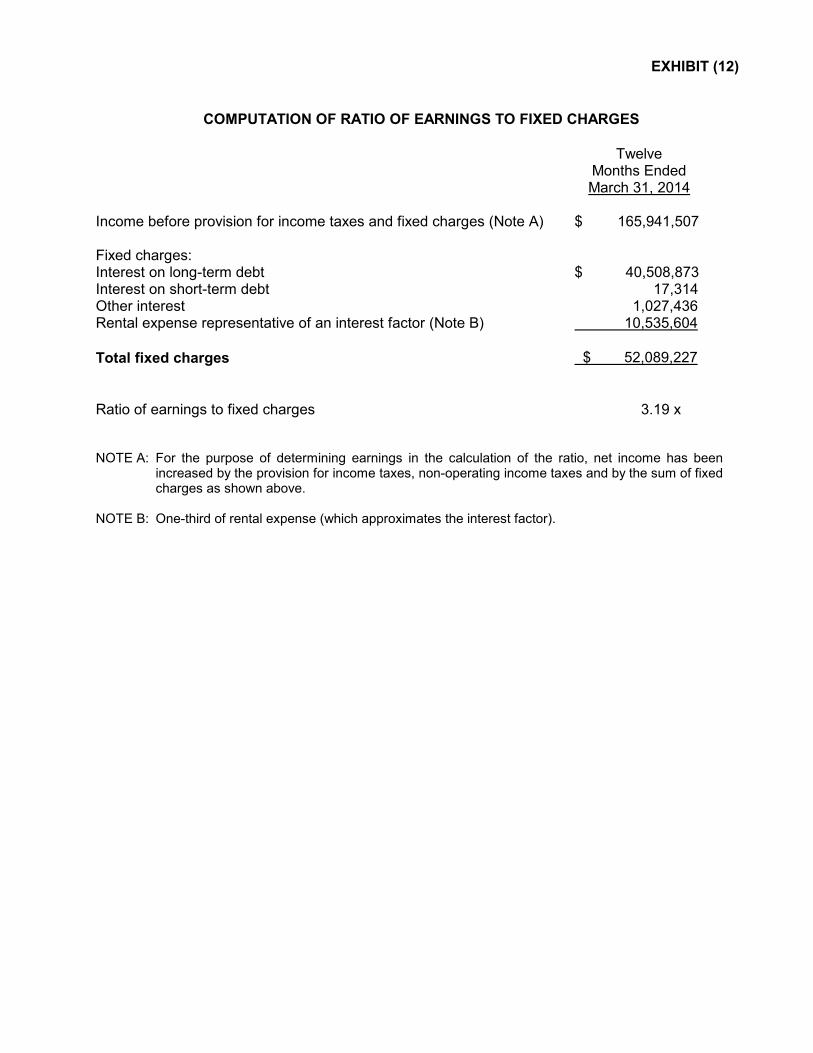
EXHIBIT (12)
COMPUTATION OF RATIO OF EARNINGS TO FIXED CHARGES
Twelve Months Ended March 31, 2014 Income before provision for income taxes and fixed charges (Note A) $ 165,941,507 Fixed charges: Interest on long-term debt $ 40,508,873 Interest on short-term debt 17,314 Other interest 1,027,436 Rental expense representative of an interest factor (Note B) 10,535,604 Total fixed charges $ 52,089,227 Ratio of earnings to fixed charges 3.19 x
NOTE A: For the purpose of determining earnings in the calculation of the ratio, net income has been increased by the provision for income taxes, non-operating income taxes and by the sum of fixed charges as shown above.
NOTE B: One-third of rental expense (which approximates the interest factor).

Exhibit (31)(a)
CERTIFICATION OF CHIEF EXECUTIVE OFFICER PURSUANT TO SECTION 302 OF THE SARBANES-OXLEY ACT OF 2002
I, Bradley P. Beecher, certify that: 1. I have reviewed this quarterly report on Form 10-Q of The Empire District Electric Company; 2. Based on my knowledge, this report does not contain any untrue statement of a material fact or omit to state a material fact necessary to make the statements made, in light of the circumstances under which such statements were made, not misleading with respect to the period covered by this report; 3. Based on my knowledge, the financial statements, and other financial information included in this report, fairly present in all material respects the financial condition, results of operations and cash flows of the registrant as of, and for, the periods presented in this report; 4. The registrant’s other certifying officer and I are responsible for establishing and maintaining disclosure controls and procedures (as defined in Exchange Act Rules 13a-15(e) and 15d-15(e)) and internal control over financial reporting (as defined in Exchange Act Rules 13a-15(f) and 15d-15(f)) for the registrant and have:
a) Designed such disclosure controls and procedures, or caused such disclosure controls and procedures to be designed under our supervision, to ensure that material information relating to the registrant, including its consolidated subsidiaries, is made known to us by others within those entities, particularly during the period in which this report is being prepared;
b) Designed such internal control over financial reporting, or caused such internal control over
financial reporting to be designed under our supervision, to provide reasonable assurance regarding the reliability of financial reporting and the preparation of financial statements for external purposes in accordance with generally accepted accounting principles;
c) Evaluated the effectiveness of the registrant’s disclosure controls and procedures and
presented in this report our conclusions about the effectiveness of the disclosure controls and procedures as of the end of the period covered by this report based on such evaluation; and
d) Disclosed in this report any change in the registrant’s internal control over financial reporting
that occurred during the registrant’s most recent fiscal quarter (the registrant’s fourth fiscal quarter in the case of an annual report) that has materially affected, or is reasonably likely to materially affect, the registrant’s internal control over financial reporting; and
5. The registrant’s other certifying officer and I have disclosed, based on our most recent evaluation of internal control over financial reporting, to the registrant’s auditors and the audit committee of the registrant’s board of directors (or persons performing the equivalent functions):
a) All significant deficiencies and material weaknesses in the design or operation of internal
control over financial reporting, which are reasonably likely to adversely affect the registrant’s ability to record, process, summarize and report financial information; and
b) Any fraud, whether or not material, that involves management or other employees who have a
significant role in the registrant’s internal control over financial reporting. Date: May 9, 2014 By: /s/ Bradley P. Beecher Name: Bradley P. Beecher Title: President and Chief Executive Officer
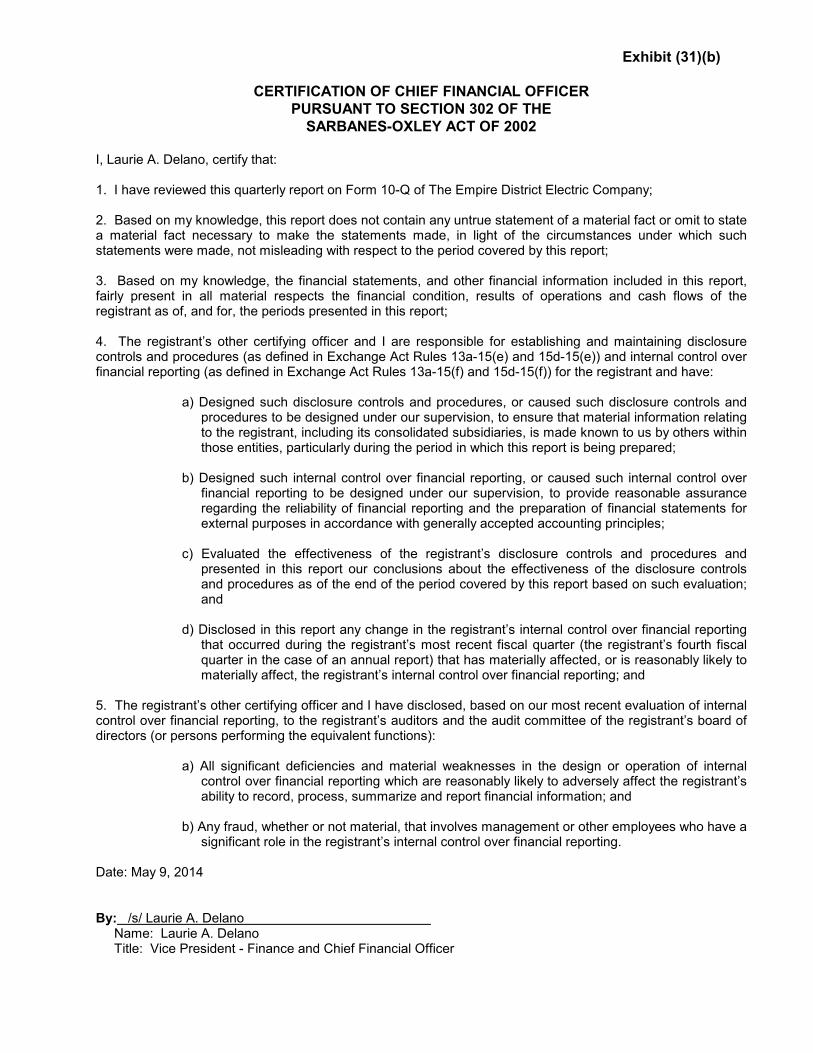
Exhibit (31)(b)
CERTIFICATION OF CHIEF FINANCIAL OFFICER PURSUANT TO SECTION 302 OF THE SARBANES-OXLEY ACT OF 2002
I, Laurie A. Delano, certify that: 1. I have reviewed this quarterly report on Form 10-Q of The Empire District Electric Company; 2. Based on my knowledge, this report does not contain any untrue statement of a material fact or omit to state a material fact necessary to make the statements made, in light of the circumstances under which such statements were made, not misleading with respect to the period covered by this report; 3. Based on my knowledge, the financial statements, and other financial information included in this report, fairly present in all material respects the financial condition, results of operations and cash flows of the registrant as of, and for, the periods presented in this report; 4. The registrant’s other certifying officer and I are responsible for establishing and maintaining disclosure controls and procedures (as defined in Exchange Act Rules 13a-15(e) and 15d-15(e)) and internal control over financial reporting (as defined in Exchange Act Rules 13a-15(f) and 15d-15(f)) for the registrant and have:
a) Designed such disclosure controls and procedures, or caused such disclosure controls and
procedures to be designed under our supervision, to ensure that material information relating to the registrant, including its consolidated subsidiaries, is made known to us by others within those entities, particularly during the period in which this report is being prepared;
b) Designed such internal control over financial reporting, or caused such internal control over
financial reporting to be designed under our supervision, to provide reasonable assurance regarding the reliability of financial reporting and the preparation of financial statements for external purposes in accordance with generally accepted accounting principles;
c) Evaluated the effectiveness of the registrant’s disclosure controls and procedures and
presented in this report our conclusions about the effectiveness of the disclosure controls and procedures as of the end of the period covered by this report based on such evaluation; and
d) Disclosed in this report any change in the registrant’s internal control over financial reporting
that occurred during the registrant’s most recent fiscal quarter (the registrant’s fourth fiscal quarter in the case of an annual report) that has materially affected, or is reasonably likely to materially affect, the registrant’s internal control over financial reporting; and
5. The registrant’s other certifying officer and I have disclosed, based on our most recent evaluation of internal control over financial reporting, to the registrant’s auditors and the audit committee of the registrant’s board of directors (or persons performing the equivalent functions):
a) All significant deficiencies and material weaknesses in the design or operation of internal
control over financial reporting which are reasonably likely to adversely affect the registrant’s ability to record, process, summarize and report financial information; and
b) Any fraud, whether or not material, that involves management or other employees who have a
significant role in the registrant’s internal control over financial reporting. Date: May 9, 2014 By: /s/ Laurie A. Delano Name: Laurie A. Delano Title: Vice President - Finance and Chief Financial Officer

Exhibit (32)(a)
Certification Pursuant to 18 U.S.C. Section 1350, As Adopted Pursuant to Section 906 of the Sarbanes-Oxley Act of 2002
In connection with the Quarterly Report of The Empire District Electric Company (the “Company”) on Form 10-Q for the period ending March 31, 2014 as filed with the Securities and Exchange Commission on the date hereof (the “Report”), Bradley P. Beecher, as Chief Executive Officer of the Company, certifies, pursuant to 18 U.S.C. Section 1350, as adopted pursuant to Section 906 of the Sarbanes-Oxley Act of 2002, that: (1) The Report fully complies with the requirements of section 13(a) of the Securities Exchange Act of 1934; and (2) The information contained in the Report fairly presents, in all material respects, the financial condition and result of operations of the Company. By /s/ Bradley P. Beecher Name: Bradley P. Beecher Title: President and Chief Executive Officer Date: May 9, 2014 A signed original of this written statement required by Section 906 or other document authenticating, acknowledging or otherwise adopting the signature that appears in typed form within the electronic version of this written statement required by Section 906, has been provided to The Empire District Electric Company and will be retained by The Empire District Electric Company and furnished to the Securities and Exchange Commission or its staff upon request.
Exhibit (32)(b)
Certification Pursuant to 18 U.S.C. Section 1350,
As Adopted Pursuant to Section 906 of the Sarbanes-Oxley Act of 2002 In connection with the Quarterly Report of The Empire District Electric Company (the “Company”) on Form 10-Q for the period ending March 31, 2014 as filed with the Securities and Exchange Commission on the date hereof (the “Report”), Laurie A. Delano, as Chief Financial Officer of the Company, certifies, pursuant to 18 U.S.C. Section 1350, as adopted pursuant to Section 906 of the Sarbanes-Oxley Act of 2002, that: (1) The Report fully complies with the requirements of section 13(a) of the Securities Exchange Act of 1934; and (2) The information contained in the Report fairly presents, in all material respects, the financial condition and result of operations of the Company. By /s/ Laurie A. Delano Name: Laurie A. Delano Title: Vice President - Finance and Chief Financial Officer Date: May 9, 2014 A signed original of this written statement required by Section 906 or other document authenticating, acknowledging or otherwise adopting the signature that appears in typed form within the electronic version of this written statement required by Section 906, has been provided to The Empire District Electric Company and will be retained by The Empire District Electric Company and furnished to the Securities and Exchange Commission or its staff upon request.
UNITED STATES SECURITIES AND EXCHANGE COMMISSION
WASHINGTON, D.C. 20549
FORM 10-Q
(Mark One)
Quarterly report pursuant to Section 13 or 15(d) of the Securities Exchange Act of 1934
For the quarterly period ended June 30, 2014 or
� Transition report pursuant to Section 13 or 15(d) of the Securities Exchange Act of 1934
For the transition period from ______________ to ____________.
Commission file number: 1-3368
THE EMPIRE DISTRICT ELECTRIC COMPANY (Exact name of registrant as specified in its charter)
Kansas (State of Incorporation)
44-0236370 (I.R.S. Employer Identification No.)
602 S. Joplin Avenue, Joplin, Missouri
(Address of principal executive offices)
64801
(zip code)
Registrant's telephone number: (417) 625-5100
Indicate by check mark whether the registrant (1) has filed all reports required to be filed by Section 13 or 15(d) of the Securities Exchange Act of 1934 during the preceding 12 months (or for such shorter period that the registrant was required to file such reports), and (2) has been subject to such filing requirements for the past 90 days. Yes √√√√ No ___ Indicate by check mark whether the registrant has submitted electronically and posted on its corporate Web site, if any, every Interactive Data File required to be submitted and posted pursuant to Rule 405 of Regulation S-T (§232.405 of this chapter) during the preceding 12 months (or for such shorter period that the registrant was required to submit and post such files). Yes √√√√ No ___ Indicate by check mark whether the registrant is a large accelerated filer, an accelerated filer, a non-accelerated filer, or a smaller reporting company. See the definitions of “large accelerated filer,” “accelerated filer” and “smaller reporting company” in Rule 12b-2 of the Exchange Act.
Large accelerated filer √√√√ Accelerated filer __ Non-accelerated filer __ (Do not check if a smaller reporting company) Smaller reporting company __
Indicate by check mark whether the registrant is a shell company (as defined in Rule 12b-2 of the Exchange Act). Yes___ No √√√√
As of July 31, 2014, 43,354,196 shares of common stock were outstanding.

2
THE EMPIRE DISTRICT ELECTRIC COMPANY
INDEX PAGE
Forward Looking Statements ............................................................................ 3 Part I - Financial Information: Item 1. Financial Statements: a. Consolidated Statements of Income ........................................................... 4 b. Consolidated Balance Sheets ..................................................................... 7 c. Consolidated Statements of Cash Flows .................................................... 9 d. Notes to Consolidated Financial Statements............................................... 10 Item 2. Management's Discussion and Analysis of Financial Condition and Results of
Operations 28
Executive Summary.. ........................................................................................ 28 Results of Operations.. ..................................................................................... 31 Rate Matters ..................................................................................................... 38 Markets and Transmission ................................................................................ 39 Liquidity and Capital Resources ....................................................................... 40 Contractual Obligations... ................................................................................. 44 Dividends... ....................................................................................................... 44
Off-Balance Sheet Arrangements ..................................................................... 44 Critical Accounting Policies and Estimates. ...................................................... 44 Recently Issued Accounting Standards. ........................................................... 44 Item 3. Quantitative and Qualitative Disclosures About Market Risk............................. 44 Item 4. Controls and Procedures .................................................................................. 46 Part II- Other Information: Item 1. Legal Proceedings ........................................................................................... 47 Item 1A. Risk Factors ..................................................................................................... 47 Item 2. Unregistered Sales of Equity Securities and Use of Proceeds - (none) Item 3. Defaults Upon Senior Securities - (none) Item 4. Mine Safety Disclosures - (none) Item 5. Other Information ............................................................................................. 47 Item 6. Exhibits ............................................................................................................. 47 Signatures ........................................................................................................ 48

3
FORWARD LOOKING STATEMENTS
Certain matters discussed in this quarterly report are “forward-looking statements” intended to qualify for the safe harbor from liability established by the Private Securities Litigation Reform Act of 1995. Such statements address or may address future plans, objectives, expectations and events or conditions concerning various matters such as capital expenditures, earnings, pension and other costs, competition, litigation, our construction program, our generation plans, our financing plans, potential acquisitions, rate and other regulatory matters, liquidity and capital resources and accounting matters. Forward-looking statements may contain words like “anticipate”, “believe”, “expect”, “project”, “objective” or similar expressions to identify them as forward-looking statements. Factors that could cause actual results to differ materially from those currently anticipated in such statements include:
• weather, business and economic conditions and other factors which may impact sales volumes and customer growth;
• the costs and other impacts resulting from natural disasters, such as tornados and ice storms;
• the amount, terms and timing of rate relief we seek and related matters;
• the results of prudency and similar reviews by regulators of costs we incur, including capital expenditures and fuel and purchased power costs, including any regulatory disallowances that could result from prudency reviews;
• unauthorized physical or virtual access to our facilities and systems and acts of terrorism, including, but not limited to, cyber-terrorism;
• legislation and regulation, including environmental regulation (such as NOx, SO2, mercury, ash and CO2) and health care regulation;
• the periodic revision of our construction and capital expenditure plans and cost and timing estimates;
• costs and activities associated with markets and transmission, including the Southwest Power Pool (SPP) regional transmission organization (RTO) transmission development, and SPP Day-Ahead Market;
• the impact of energy efficiency and alternative energy sources;
• electric utility restructuring;
• spending rates, terminal value calculations and other factors integral to the calculations utilized to test the impairment of goodwill, in addition to market and economic conditions which could adversely affect the analysis and ultimately negatively impact earnings;
• volatility in the credit, equity and other financial markets and the resulting impact on short term debt costs and our ability to issue debt or equity securities, or otherwise secure funds to meet our capital expenditure, dividend and liquidity needs;
• the effect of changes in our credit ratings on the availability and cost of funds;
• the performance of our pension assets and other post employment benefit plan assets and the resulting impact on our related funding commitments;
• our exposure to the credit risk of our hedging counterparties;
• the cost and availability of purchased power and fuel, including costs and activities associated with the SPP Day-Ahead Market, and the results of our activities (such as hedging) to reduce the volatility of such costs;
• interruptions or changes in our coal delivery, gas transportation or storage agreements or arrangements;
• operation of our electric generation facilities and electric and gas transmission and distribution systems, including the performance of our joint owners;
• changes in accounting requirements;
• costs and effects of legal and administrative proceedings, settlements, investigations and claims;
• performance of acquired businesses; and
• other circumstances affecting anticipated rates, revenues and costs.
All such factors are difficult to predict, contain uncertainties that may materially affect actual results, and may be beyond our control. New factors emerge from time to time and it is not possible for management to predict all factors or to assess the impact of each factor on us. Any forward-looking statement speaks only as of the date on which such statement is made, and we do not undertake any obligation to update any forward-looking statement to reflect events or circumstances after the date on which such statement is made.
We caution you that any forward-looking statements are not guarantees of future performance and involve known and unknown risk, uncertainties and other factors which may cause our actual results, performance or achievements to differ materially from the facts, results, performance or achievements we have anticipated in such forward-looking statements.

4
PART I. FINANCIAL INFORMATION
Item 1. Financial Statements
THE EMPIRE DISTRICT ELECTRIC COMPANY CONSOLIDATED STATEMENTS OF INCOME (UNAUDITED)
Three Months Ended
June 30, 2014 2013
(000’s except per share amounts)
Operating revenues: Electric $ 140,767 $ 127,026 Gas 6,989 7,777 Other 2,026 1,843 149,782 136,646 Operating revenue deductions: Fuel and purchased power 54,358 42,013 Cost of natural gas sold and transported 2,678 3,113 Regulated operating expenses 27,609 26,647 Other operating expenses 782 872 Maintenance and repairs 11,393 9,933 Depreciation and amortization 18,157 17,635 Provision for income taxes 6,694 7,042 Other taxes 8,609 8,281 130,280 115,536 Operating income 19,502 21,110 Other income and (deductions): Allowance for equity funds used during construction 1,522 867 Interest income 3 10 Benefit/(provision) for other income taxes 45 (7) Other - non-operating expense, net (300) (290) 1,270 580 Interest charges: Long-term debt 10,105 10,190 Short-term debt 13 12 Allowance for borrowed funds used during construction (830) (472) Other 290 302 9,578 10,032 Net income $ 11,194 $ 11,658 Weighted average number of common shares outstanding - basic 43,236 42,707 Weighted average number of common shares outstanding - diluted 43,269 42,727 Total earnings per weighted average share of common stock – basic and diluted
$ 0.26 $ 0.27
Dividends declared per share of common stock $ 0.255 $ 0.25
See accompanying Notes to Consolidated Financial Statements.

5
THE EMPIRE DISTRICT ELECTRIC COMPANY CONSOLIDATED STATEMENTS OF INCOME (UNAUDITED)
Six Months Ended
June 30, 2014 2013
(000’s except per share amounts)
Operating revenues: Electric $ 293,856 $ 255,788 Gas 31,598 28,270 Other 4,001 3,728 329,455 287,786 Operating revenue deductions: Fuel and purchased power 109,944 87,316 Cost of natural gas sold and transported 17,723 15,038 Regulated operating expenses 55,566 53,784 Other operating expenses 1,498 1,665 Maintenance and repairs 21,650 19,090 Loss on plant disallowance - 2,409 Depreciation and amortization 36,097 33,736 Provision for income taxes 18,868 14,496 Other taxes 19,119 17,284 280,465 244,818 Operating income 48,990 42,968 Other income and (deductions): Allowance for equity funds used during construction 2,773 1,393 Interest income 44 517 Benefit/(provision) for other income taxes 99 (35) Other - non-operating expense, net (645) (579) 2,271 1,296 Interest charges: Long-term debt 20,210 20,141 Short-term debt 18 59 Allowance for borrowed funds used during construction (1,570) (777) Other 504 554 19,162 19,977 Net income $ 32,099 $ 24,287 Weighted average number of common shares outstanding - basic 43,173 42,636 Weighted average number of common shares outstanding – diluted 43,200 42,652 Total earnings per weighted average share of common stock – basic and diluted
$ 0.74 $ 0.57
Dividends declared per share of common stock $ 0.51 $ 0.50 See accompanying Notes to Consolidated Financial Statements.
6
THE EMPIRE DISTRICT ELECTRIC COMPANY CONSOLIDATED STATEMENTS OF INCOME (UNAUDITED) Twelve Months Ended
June 30,
2014 2013
(000’s except per share amounts)
Operating revenues: Electric $ 574,481 $ 522,624 Gas 53,369 46,632 Other 8,148 6,851 635,998 576,107 Operating revenue deductions: Fuel and purchased power 198,034 175,456 Cost of natural gas sold and transported 28,479 23,321 Regulated operating expenses 107,115 101,963 Other operating expenses 2,974 3,026 Maintenance and repairs 43,433 39,613 Loss on plant disallowance - 2,409 Depreciation and amortization 71,668 64,180 Provision for income taxes 41,837 35,835 Other taxes 36,773 32,689 530,313 478,492 Operating income 105,685 97,615 Other income and (deductions): Allowance for equity funds used during construction 5,234 2,437 Interest income 92 1,187 Benefit for other income taxes 106 105 Other - non-operating expense, net (1,283) (2,060) 4,149 1,669 Interest charges: Long-term debt 40,424 40,042 Short-term debt 18 87 Allowance for borrowed funds used during construction (2,880) (1,392) Other 1,015 1,091 38,577 39,828 Net income $ 71,257 $ 59,456 Weighted average number of common shares outstanding – basic 43,048 42,512 Weighted average number of common shares outstanding – diluted 43,069 42,526 Total earnings per weighted average share of common stock – basic
$ 1.66 $ 1.40
Total earnings per weighted average share of common stock – diluted
$ 1.65 $ 1.40
Dividends declared per share of common stock $ 1.015 $ 1.00 See accompanying Notes to Consolidated Financial Statements.

7
THE EMPIRE DISTRICT ELECTRIC COMPANY CONSOLIDATED BALANCE SHEETS (UNAUDITED)
June 30, 2014 December 31, 2013 ($-000’s) Assets Plant and property, at original cost: Electric $ 2,253,657 $ 2,219,605 Natural gas 77,894 72,834 Other 41,051 39,902 Construction work in progress 184,580 152,330 2,557,182 2,484,671 Accumulated depreciation and amortization 740,989 732,737 1,816,193 1,751,934
Current assets: Cash and cash equivalents 2,939 3,475 Restricted cash 7,726 2,872 Accounts receivable – trade, net of allowance $944 and $1,025, respectively 48,824 50,137 Accrued unbilled revenues 19,299 26,694 Accounts receivable – other 16,238 13,101 Fuel, materials and supplies 48,800 48,811 Prepaid expenses and other 15,554 15,954 Unrealized gain in fair value of derivative contracts 9,153 2,469 Regulatory assets 10,229 7,743
178,762 171,256 Noncurrent assets and deferred charges: Regulatory assets 161,389 169,333 Goodwill 39,492 39,492 Unamortized debt issuance costs 8,511 8,826 Unrealized gain in fair value of derivative contracts 39 41 Other 3,395 4,163 212,826 221,855
Total Assets $ 2,207,781 $ 2,145,045 (Continued)
See accompanying Notes to Consolidated Financial Statements.
8
THE EMPIRE DISTRICT ELECTRIC COMPANY CONSOLIDATED BALANCE SHEETS (UNAUDITED) (Continued)
June 30, 2014 December 31, 2013 ($-000’s) Capitalization and Liabilities Common stock, $1 par value, 43,334,811 and 43,044,185 shares issued and outstanding, respectively $ 43,335 $ 43,044
Capital in excess of par value 645,236 639,525 Retained earnings 77,626 67,554 Total common stockholders' equity 766,197 750,123
Long-term debt (net of current portion): Obligations under capital lease 4,023 4,167 First mortgage bonds and secured debt 637,597 637,578 Unsecured debt 101,691 101,683
Total long-term debt 743,311 743,428 Total long-term debt and common stockholders’ equity 1,509,508 1,493,551
Current liabilities: Accounts payable and accrued liabilities 50,525 71,375 Current maturities of long-term debt 283 274 Short-term debt 52,500 4,000 Regulatory liabilities 11,869 5,681 Customer deposits 12,734 12,543 Interest accrued 6,592 6,352 Other current liabilities 2,894 299 Unrealized loss in fair value of derivative contracts 970 1,889 Taxes accrued 14,456 3,386 152,823 105,799
Commitments and contingencies (Note 7) Noncurrent liabilities and deferred credits: Regulatory liabilities 132,241 132,012 Deferred income taxes 324,663 324,266 Unamortized investment tax credits 18,474 18,431 Pension and other postretirement benefit obligations 52,206 51,405 Unrealized loss in fair value of derivative contracts 2,096 2,799 Other 15,770 16,782 545,450 545,695 Total Capitalization and Liabilities $ 2,207,781 $ 2,145,045 See accompanying Notes to Consolidated Financial Statements.
9
THE EMPIRE DISTRICT ELECTRIC COMPANY CONSOLIDATED STATEMENTS OF CASH FLOWS (UNAUDITED)
Six Months Ended
June 30, 2014 2013 ($-000’s) Operating activities: Net income $ 32,099 $ 24,287 Adjustments to reconcile net income to cash flows from operating activities: Depreciation and amortization including regulatory items 39,527 35,268 Pension and other postretirement benefit costs, net of contributions 5,154 7,174 Deferred income taxes and unamortized investment tax credit, net 3,513 12,096 Allowance for equity funds used during construction (2,773) (1,393) Stock compensation expense 2,046 1,900 Loss on plant disallowance - 2,409 Reverse gain on sale of assets - 1,236 Non-cash (gain) on derivatives (526) (67) Cash flows impacted by changes in: Accounts receivable and accrued unbilled revenues 6,096 (7,140) Fuel, materials and supplies 11 8,138 Prepaid expenses, other current assets and deferred charges (3,104) 542 Accounts payable and accrued liabilities (22,610) (20,639) Interest, taxes accrued and customer deposits 11,501 9,832 Asset retirement obligations (1,234) - Other liabilities and other deferred credits (656) (2,638) Net cash provided by operating activities 69,044 71,005 Investing activities: Capital expenditures – regulated (94,783) (74,834) Capital expenditures and other investments – non-regulated (784) (934) Restricted cash (4,854) 2,585 Net cash used in investing activities (100,421) (73,183) Financing activities: Proceeds from first mortgage bonds, net - 150,000 Long-term debt issuance costs - (1,744) Redemption of senior notes - (98,000) Proceeds from issuance of common stock net of issuance costs 4,515 5,161 Net short-term borrowings/(repayments) 48,500 (24,000) Dividends (22,027) (21,332) Other (147) (432) Net cash provided by financing activities 30,841 9,653 Net increase/(decrease) in cash and cash equivalents (536) 7,475 Cash and cash equivalents at beginning of period 3,475 3,375 Cash and cash equivalents at end of period $ 2,939 $ 10,850
See accompanying Notes to Consolidated Financial Statements.
10
NOTES TO CONSOLIDATED FINANCIAL STATEMENTS (UNAUDITED)
Note 1 - Summary of Significant Accounting Policies
We operate our businesses as three segments: electric, gas and other. The Empire District Electric Company (EDE), a Kansas corporation organized in 1909, is an operating public utility engaged in the generation, purchase, transmission, distribution and sale of electricity in parts of Missouri, Kansas, Oklahoma and Arkansas. As part of our electric segment, we also provide water service to three towns in Missouri. The Empire District Gas Company (EDG) is our wholly-owned subsidiary which provides natural gas distribution to customers in 48 communities in northwest, north central and west central Missouri. Our other segment consists of our fiber optics business. The accompanying interim financial statements do not include all disclosures included in the annual financial statements and therefore should be read in conjunction with the financial statements and notes thereto included in our Annual Report on Form 10-K for the fiscal year ended December 31, 2013. The information furnished reflects all adjustments, consisting only of normal recurring adjustments, which are in our opinion necessary to state fairly the results for the interim periods as well as present these periods on a consistent basis with the financial statements for the fiscal year ended December 31, 2013.
Note 2 - Recently Issued and Proposed Accounting Standards
Revenue from contracts with customers: In June 2014, the FASB issued new guidance governing revenue recognition. Under the new guidance, an entity is required to recognize revenue in a pattern that depicts the transfer of promised goods or services to customers in an amount that reflects the consideration to which the entity expects to be entitled in exchange for those goods or services. The new standard is effective for interim and annual reporting periods beginning after December 15, 2016. We are evaluating the impact of the adoption of this standard.
See Note 1 under “Notes to Consolidated Financial Statements” in our Annual Report on Form 10-K for the year ended December 31, 2013 for further information regarding recently issued and proposed accounting standards.
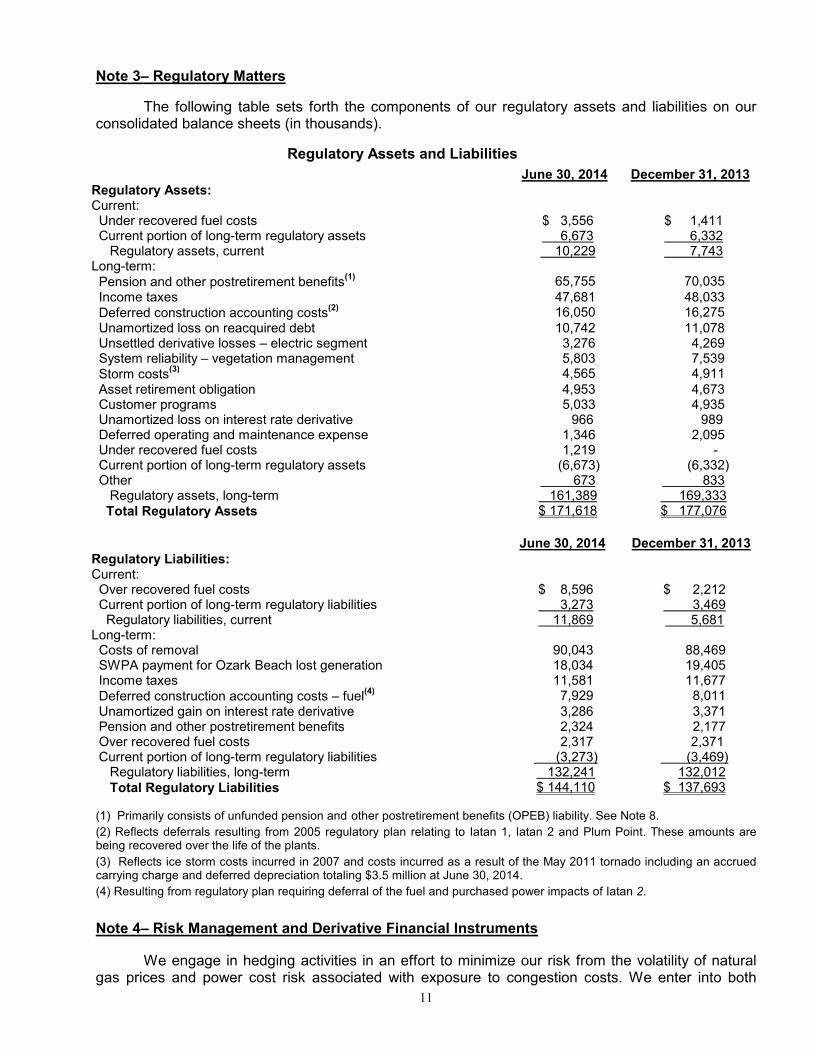
11
Note 3– Regulatory Matters
The following table sets forth the components of our regulatory assets and liabilities on our consolidated balance sheets (in thousands).
Regulatory Assets and Liabilities
June 30, 2014 December 31, 2013 Regulatory Assets: Current: Under recovered fuel costs $ 3,556 $ 1,411 Current portion of long-term regulatory assets 6,673 6,332 Regulatory assets, current 10,229 7,743 Long-term: Pension and other postretirement benefits
(1) 65,755 70,035
Income taxes 47,681 48,033 Deferred construction accounting costs
(2) 16,050 16,275
Unamortized loss on reacquired debt 10,742 11,078 Unsettled derivative losses – electric segment 3,276 4,269 System reliability – vegetation management 5,803 7,539 Storm costs
(3) 4,565 4,911
Asset retirement obligation 4,953 4,673 Customer programs 5,033 4,935 Unamortized loss on interest rate derivative 966 989 Deferred operating and maintenance expense 1,346 2,095 Under recovered fuel costs 1,219 - Current portion of long-term regulatory assets (6,673) (6,332) Other 673 833 Regulatory assets, long-term 161,389 169,333 Total Regulatory Assets $ 171,618 $ 177,076
June 30, 2014 December 31, 2013 Regulatory Liabilities: Current: Over recovered fuel costs $ 8,596 $ 2,212 Current portion of long-term regulatory liabilities 3,273 3,469 Regulatory liabilities, current 11,869 5,681 Long-term: Costs of removal 90,043 88,469 SWPA payment for Ozark Beach lost generation 18,034 19,405 Income taxes 11,581 11,677 Deferred construction accounting costs – fuel
(4) 7,929 8,011
Unamortized gain on interest rate derivative 3,286 3,371 Pension and other postretirement benefits 2,324 2,177 Over recovered fuel costs 2,317 2,371 Current portion of long-term regulatory liabilities (3,273) (3,469) Regulatory liabilities, long-term 132,241 132,012 Total Regulatory Liabilities $ 144,110 $ 137,693
(1) Primarily consists of unfunded pension and other postretirement benefits (OPEB) liability. See Note 8.
(2) Reflects deferrals resulting from 2005 regulatory plan relating to Iatan 1, Iatan 2 and Plum Point. These amounts are being recovered over the life of the plants.
(3) Reflects ice storm costs incurred in 2007 and costs incurred as a result of the May 2011 tornado including an accrued carrying charge and deferred depreciation totaling $3.5 million at June 30, 2014.
(4) Resulting from regulatory plan requiring deferral of the fuel and purchased power impacts of Iatan 2.
Note 4– Risk Management and Derivative Financial Instruments
We engage in hedging activities in an effort to minimize our risk from the volatility of natural gas prices and power cost risk associated with exposure to congestion costs. We enter into both

12
physical and financial contracts with counterparties relating to our future natural gas requirements that lock in prices (with respect to a range of predetermined percentages of our expected future natural gas needs) in an attempt to lessen the volatility in our fuel expenditures and gain predictability. We began acquiring Transmission Congestion Rights (TCR) in 2013 in an attempt to mitigate the cost of power we purchase from the SPP Integrated Market due to congestion exposure. TCRs entitle the holder to a stream of revenues (or charges) based on the day-ahead congestion on the transmission path. TCRs can be purchased or self-converted using rights allocated based on prior investments made in the transmission system. We recognize that if risk is not timely and adequately balanced or if counterparties fail to perform contractual obligations, actual results could differ materially from intended results. All derivative instruments are recognized at fair value on the balance sheet. The unrealized losses or gains from derivatives used to hedge our fuel and purchased power costs in our electric segment are recorded in regulatory assets or liabilities. All gains and losses from derivatives related to the gas segment are also recorded in regulatory assets or liabilities. This is in accordance with the Accounting Standards Codification (ASC) guidance on regulated operations, given that those gains or losses are probable of refund or recovery, respectively, through our fuel adjustment mechanism. Risks and uncertainties affecting the determination of fair value include: market conditions in the energy industry, especially the effects of price volatility, regulatory and global political environments and requirements, fair value estimations on longer term contracts, the effectiveness of the derivative instrument in hedging the change in fair value of the hedged item, estimating underlying fuel demand and counterparty ability to perform. If we estimate that we have overhedged forecasted demand, the gain or loss on the overhedged portion will be recognized immediately as fuel and purchased power expense in our Consolidated Statement of Income and subject to our fuel adjustment mechanism. As of June 30, 2014 and December 31, 2013, we have recorded the following assets and liabilities representing the fair value of derivative financial instruments, (in thousands):
June 30, December 31, ASSET DERIVATIVES 2014 2013
Hedging instruments Balance Sheet Classification Fair Value Fair Value Natural gas contracts, gas segment Current assets $ 2 $ 35 Natural gas contracts, electric segment Current assets 480 467 Non-current assets and deferred charges -
other
39
41 Transmission congestion rights, electric segment
(1)
Current assets
8,671
1,967
Total derivatives assets $ 9,192 $ 2,510
(1) We initially began acquiring transmission congestion rights during the fourth quarter of 2013. The first full year annual auction applicable to the June 1, 2014 through May 31, 2015 period occurred during the second quarter of 2014 causing an increase in derivative TCR positions.
June 30, December 31,
LIABILITY DERIVATIVES 2014 2013
Hedging instruments Balance Sheet Classification
Natural gas contracts, gas segment Current liabilities $ 3 $ 8
Natural gas contracts, electric segment Current liabilities 967 1,881 Non-current liabilities and deferred credits 2,096 2,799 Total derivatives liabilities $ 3,066 $ 4,688
Electric Segment
At June 30, 2014, approximately $0.5 million of unrealized net losses are applicable to natural gas financial instruments which will settle within the next twelve months. The following tables set forth “mark-to-market” pre-tax gains/(losses) from non-designated derivative instruments for the electric segment for each of the periods ended June 30, (in thousands):
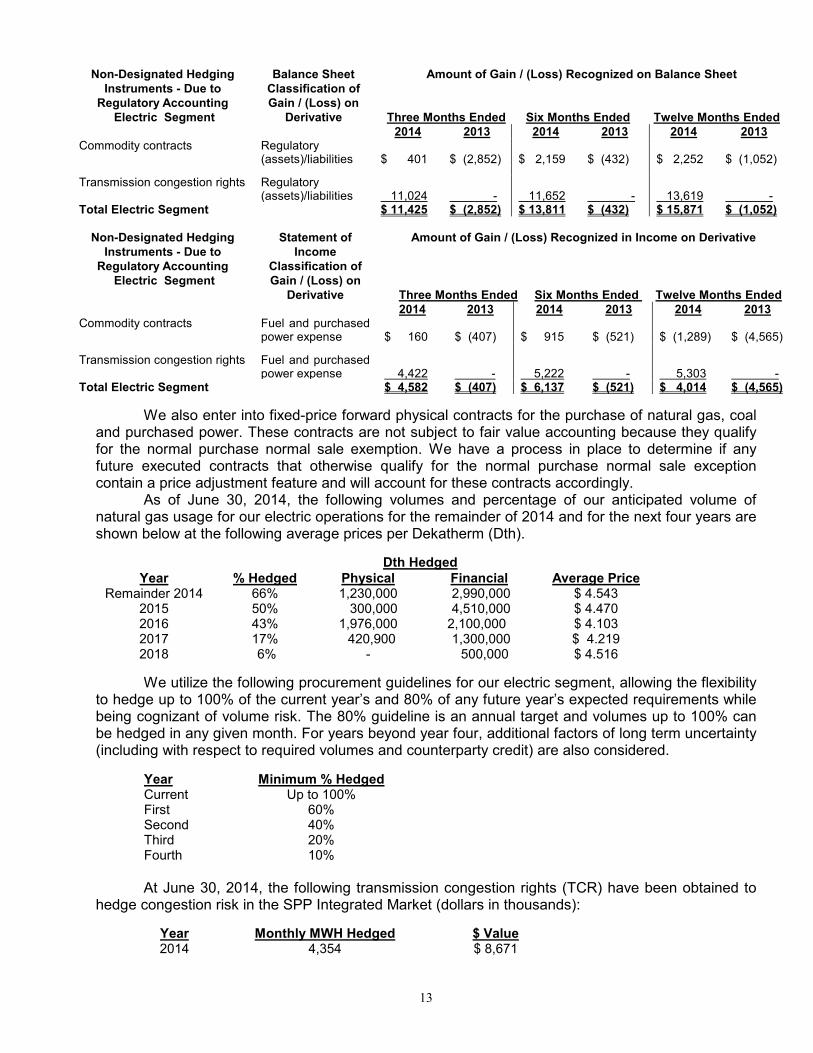
13
Non-Designated Hedging Instruments - Due to
Regulatory Accounting Electric Segment
Balance Sheet Classification of Gain / (Loss) on
Derivative
Amount of Gain / (Loss) Recognized on Balance Sheet
Three Months Ended Six Months Ended Twelve Months Ended 2014 2013 2014 2013 2014 2013 Commodity contracts Regulatory
(assets)/liabilities $ 401
$ (2,852)
$ 2,159
$ (432)
$ 2,252
$ (1,052)
Transmission congestion rights Regulatory
(assets)/liabilities 11,024
-
11,652
-
13,619
-
Total Electric Segment $ 11,425 $ (2,852) $ 13,811 $ (432) $ 15,871 $ (1,052) Non-Designated Hedging Instruments - Due to
Regulatory Accounting Electric Segment
Statement of Income
Classification of Gain / (Loss) on
Derivative
Amount of Gain / (Loss) Recognized in Income on Derivative
Three Months Ended Six Months Ended Twelve Months Ended 2014 2013 2014 2013 2014 2013 Commodity contracts Fuel and purchased
power expense $ 160
$ (407)
$ 915
$ (521)
$ (1,289)
$ (4,565)
Transmission congestion rights Fuel and purchased
power expense 4,422
-
5,222
-
5,303
-
Total Electric Segment $ 4,582 $ (407) $ 6,137 $ (521) $ 4,014 $ (4,565)
We also enter into fixed-price forward physical contracts for the purchase of natural gas, coal and purchased power. These contracts are not subject to fair value accounting because they qualify for the normal purchase normal sale exemption. We have a process in place to determine if any future executed contracts that otherwise qualify for the normal purchase normal sale exception contain a price adjustment feature and will account for these contracts accordingly. As of June 30, 2014, the following volumes and percentage of our anticipated volume of natural gas usage for our electric operations for the remainder of 2014 and for the next four years are shown below at the following average prices per Dekatherm (Dth).
Dth Hedged Year % Hedged Physical Financial Average Price
Remainder 2014 66% 1,230,000 2,990,000 $ 4.543 2015 50% 300,000 4,510,000 $ 4.470 2016 43% 1,976,000 2,100,000 $ 4.103 2017 17% 420,900 1,300,000 $ 4.219 2018 6% - 500,000 $ 4.516
We utilize the following procurement guidelines for our electric segment, allowing the flexibility to hedge up to 100% of the current year’s and 80% of any future year’s expected requirements while being cognizant of volume risk. The 80% guideline is an annual target and volumes up to 100% can be hedged in any given month. For years beyond year four, additional factors of long term uncertainty (including with respect to required volumes and counterparty credit) are also considered.
Year Minimum % Hedged Current Up to 100% First 60% Second 40% Third 20% Fourth 10%
At June 30, 2014, the following transmission congestion rights (TCR) have been obtained to hedge congestion risk in the SPP Integrated Market (dollars in thousands):
Year Monthly MWH Hedged $ Value 2014 4,354 $ 8,671

14
Gas Segment
We attempt to mitigate our natural gas price risk for our gas segment by a combination of (1) injecting natural gas into storage during the off-heating season months, (2) purchasing physical forward contracts and (3) purchasing financial derivative contracts. We target to have 95% of our storage capacity full by November 1 for the upcoming winter heating season. As the winter progresses, gas is withdrawn from storage to serve our customers. As of June 30, 2014, we had 0.8 million Dths in storage on the three pipelines that serve our customers. This represents 39% of our storage capacity. The following table sets forth our long-term hedge strategy of mitigating price volatility for our customers by hedging a minimum of expected gas usage for the current winter season and the next two winter seasons by the beginning of the Actual Cost Adjustment (ACA) year at September 1 and illustrates our hedged position as of June 30, 2014 (in thousands):
Season
Minimum % Hedged
Dth Hedged Financial
Dth Hedged Physical
Dth in Storage
Actual % Hedged
Current 50% 120,000 785,809 28% Second Up to 50% - - - - Third Up to 20% - - - -
A Purchased Gas Adjustment (PGA) clause is included in our rates for our gas segment operations, therefore, we mark to market any unrealized gains or losses and any realized gains or losses relating to financial derivative contracts to a regulatory asset or regulatory liability account on our balance sheet. The following table sets forth “mark-to-market” pre-tax gains / (losses) from derivatives not designated as hedging instruments for the gas segment for each of the periods ended June 30, (in thousands).
Non-Designated Hedging Instruments Due to Regulatory Accounting - Gas Segment
Balance Sheet Classification of Gain / (Loss) on
Derivative
Amount of Gain/(Loss) Recognized on Balance Sheet
Three Months Ended Six Months Ended Twelve Months Ended
2014 2013 2014 2013 2014 2013 Commodity contracts Regulatory
(assets)/liabilities $ (1)
$ (71)
$ (1)
$ (18)
$ 137
$ 12
Total - Gas Segment $ (1) $ (71) $ (1) $ (18) $ 137 $ 12
Contingent Features
Certain of our derivative instruments contain provisions that are triggered if we fail to maintain an investment grade credit rating with any relevant credit rating agency. If our debt were to fall below investment grade, the counterparties to the derivative instruments could request increased collateralization on derivative instruments in net liability positions. We had no derivative instruments with the credit-risk-related contingent features in a liability position on June 30, 2014 and have posted no collateral in the normal course of business. Amounts reported as margin deposit assets represent our funds held on deposit for our NYMEX contracts with our broker and other financial contracts with other counterparties that resulted from us exceeding agreed-upon credit limits established by the counterparties. The following table depicts our margin deposit assets at June 30, 2014 and December 31, 2013. There were no margin deposit liabilities at these dates.
June 30, 2014 December 31, 2013 (in millions) Margin deposit assets $ 3.5 $ 5.2
Offsetting of derivative assets and liabilities
We believe that entering into master trading and netting agreements mitigates the level of financial loss that could result from a default under derivatives agreements by allowing net settlement of derivative assets and liabilities. We generally enter into the following master trading and netting

15
agreements: (1) the International Swaps and Derivatives Association Agreement, a standardized financial natural gas and electric contract; and (2) the North American Energy Standards Board Inc. Agreement, a standardized contract for the purchase and sale of natural gas. These master trading and netting agreements allow the counterparties to net settle sale and purchase transactions. Collateral requirements are calculated at the master trading and netting agreement level by the counterparty.
As shown above, our asset and liability commodity contract derivatives are reported at gross on the balance sheet. ASC guidance permits companies to offset fair value amounts recognized for the right to reclaim cash collateral (a receivable) or the obligation to return cash collateral (a liability) against fair value amounts recognized for derivative instruments that are executed with the same counterparty under the same master netting arrangement. For the periods ended June 30, 2014 and December 31, 2013, we did not hold any collateral posted by our counterparties. The only collateral we have posted is our margin deposit assets described above. We have elected not to offset our margin deposit assets against any of our eligible commodity contracts.
Note 5– Fair Value Measurements
The accounting guidance on fair value measurements establishes a three-tier fair value hierarchy, which prioritizes the inputs used in measuring fair value. These tiers include: (i) Level 1, defined as quoted prices in active markets for identical instruments; (ii) Level 2, defined as inputs other than quoted prices in active markets that are either directly or indirectly observable; and (iii) Level 3, defined as unobservable inputs in which little or no market data exists, therefore requiring an entity to develop its own assumptions. Our Level 2 fair value measurements consist of both quoted price inputs and inputs that are derived principally from or corroborated by observable market data. The guidance also requires that the fair value measurements of assets and liabilities reflect the nonperformance risk of counterparties and the reporting entity, as applicable. Therefore, using credit default spreads, we factored the impact of our own credit standing and the credit standing of our counterparties, as well as any potential credit enhancements (e.g. collateral) into the consideration of nonperformance risk for both derivative assets and liabilities. The results of this analysis were not material to the financial statements. Our TCR positions, which are acquired on the SPP Integrated Market, are valued using the most recent monthly auction clearing prices. Our commodity contracts are valued using the market value approach on a recurring basis. The following fair value hierarchy table presents information about our TCR and commodity contracts measured at fair value as of June 30, 2014 and December 31, 2013.
Fair Value Measurements at Reporting Date Using ($ in 000’s)
Description
Assets/(Liabilities) at Fair Value
Quoted Prices in Active Markets for Identical Liabilities
(Level 1)
Significant Other Observable
Inputs (Level 2)
Significant Unobservable
Inputs (Level 3)
June 30, 2014
Derivative assets $ 9,192 $ 521 $ 8,671 $ - Derivative liabilities $ (3,066) $ (3,066) $ - $ -
December 31, 2013
Derivative assets $ 2,510 $ 543 $ 1,967 $ - Derivative liabilities $ (4,688) $ (4,688) $ - $ - *The only recurring measurements are derivative related.
Other fair value considerations
Our cash and cash equivalents approximate fair value because of the short-term nature of these instruments, and are classified as Level 1 in the fair value hierarchy. The carrying amount of our short-term debt, which is composed of Empire issued commercial paper or revolving credit borrowings, also approximates fair value because of their short-term nature. These instruments are

16
classified as Level 2 in the fair value hierarchy as they are valued based on market rates for similar market transactions.
The carrying amount of our total long-term debt exclusive of capital leases at June 30, 2014 was $739 million and at December 31, 2013 was $739 million. The fair market value at June 30, 2014 was approximately $767 million as compared to approximately $715 million at December 31, 2013. These estimates were based on a bond pricing model, utilizing inputs classified as Level 2 in the fair value hierarchy, which include the quoted market prices for the same or similar issues or on the current rates offered to us for debt of the same remaining maturities. The estimated fair market value may not represent the actual value that could have been realized as of June 30, 2014 or that will be realizable in the future.
Note 6– Financing
We have an unsecured revolving credit facility of $150 million in place through January 17, 2017. The facility is used for working capital, general corporate purposes and to back-up our use of commercial paper. This facility requires our total indebtedness to be less than 62.5% of our total capitalization at the end of each fiscal quarter and our EBITDA (defined as net income plus interest, taxes, depreciation and amortization) to be at least two times our interest charges for the trailing four fiscal quarters at the end of each fiscal quarter. Failure to maintain these ratios will result in an event of default under the credit facility and will prohibit us from borrowing funds thereunder. As of June 30, 2014, we are in compliance with these ratios. Our total indebtedness is 51.0% of our total capitalization as of June 30, 2014 and our EBITDA is 5.9 times our interest charges. This credit facility is also subject to cross-default if we default on in excess of $10 million in the aggregate on our other indebtedness. This arrangement does not serve to legally restrict the use of our cash in the normal course of operations. There were no outstanding borrowings under this agreement at June 30, 2014, however, $52.5 million was used to back up our outstanding commercial paper.
Note 7– Commitments and Contingencies
Legal Proceedings
We are a party to various claims and legal proceedings arising out of the normal course of our business. We regularly analyze this information, and provide accruals for any liabilities, in accordance with the guidelines presented in the ASC on accounting for contingencies. In our opinion, it is not probable, given the company’s defenses, that the ultimate outcome of these claims and lawsuits will have a material adverse effect upon our financial condition, or results of operations or cash flows.
Coal, Natural Gas and Transportation Contracts
The following table sets forth our firm physical gas, coal and transportation contracts for the periods indicated as of June 30, 2014 (in millions).
Firm physical gas and transportation contracts
Coal and coal transportation contracts
July 1, 2014 through December 31, 2014 $ 15.0 $ 8.0 January 1, 2015 through December 31, 2016 41.6 33.6 January 1, 2017 through December 31, 2018 33.2 25.5 January 1, 2019 and beyond 49.5 11.5
We have entered into long and short-term agreements to purchase coal and natural gas for our energy supply and natural gas operations. Under these contracts, the natural gas supplies are divided into firm physical commitments and derivatives that are used to hedge future purchases. In the event that this gas cannot be used at our plants, the gas would be placed in storage. The firm physical gas and transportation commitments are detailed in the table above. We have coal supply agreements and transportation contracts in place to provide for the delivery of coal to the plants. These contracts are written with Force Majeure clauses that enable us
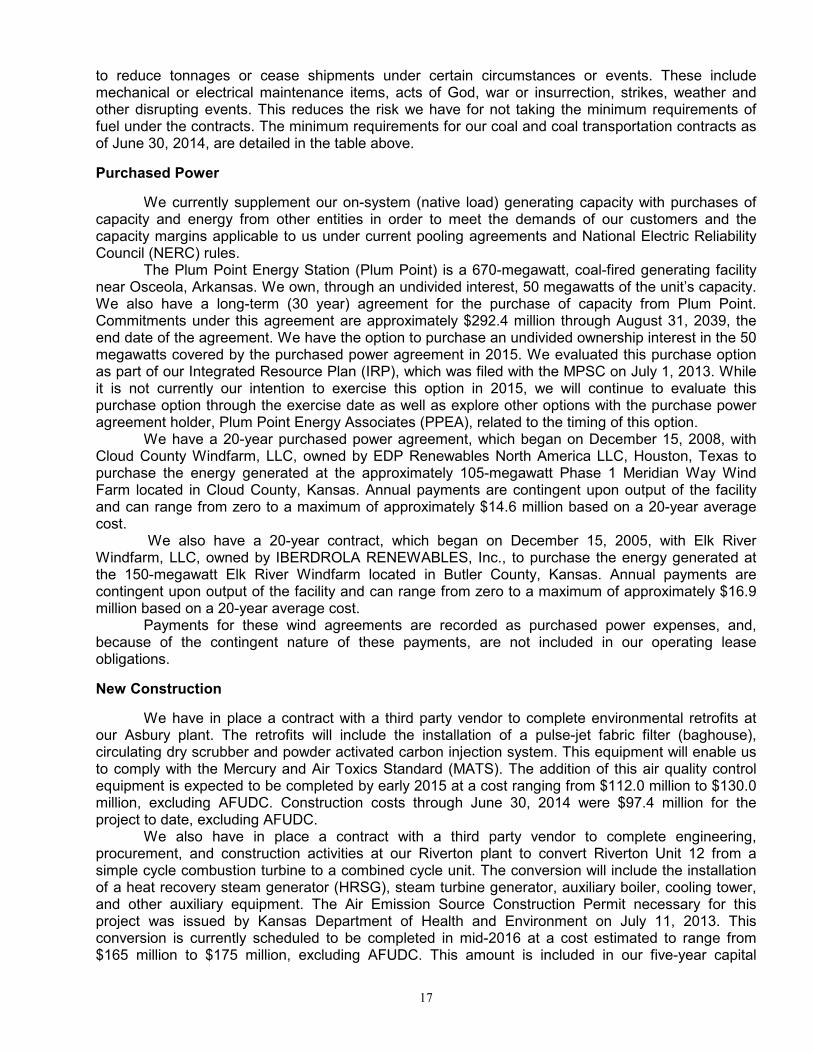
17
to reduce tonnages or cease shipments under certain circumstances or events. These include mechanical or electrical maintenance items, acts of God, war or insurrection, strikes, weather and other disrupting events. This reduces the risk we have for not taking the minimum requirements of fuel under the contracts. The minimum requirements for our coal and coal transportation contracts as of June 30, 2014, are detailed in the table above.
Purchased Power
We currently supplement our on-system (native load) generating capacity with purchases of capacity and energy from other entities in order to meet the demands of our customers and the capacity margins applicable to us under current pooling agreements and National Electric Reliability Council (NERC) rules. The Plum Point Energy Station (Plum Point) is a 670-megawatt, coal-fired generating facility near Osceola, Arkansas. We own, through an undivided interest, 50 megawatts of the unit’s capacity. We also have a long-term (30 year) agreement for the purchase of capacity from Plum Point. Commitments under this agreement are approximately $292.4 million through August 31, 2039, the end date of the agreement. We have the option to purchase an undivided ownership interest in the 50 megawatts covered by the purchased power agreement in 2015. We evaluated this purchase option as part of our Integrated Resource Plan (IRP), which was filed with the MPSC on July 1, 2013. While it is not currently our intention to exercise this option in 2015, we will continue to evaluate this purchase option through the exercise date as well as explore other options with the purchase power agreement holder, Plum Point Energy Associates (PPEA), related to the timing of this option.
We have a 20-year purchased power agreement, which began on December 15, 2008, with Cloud County Windfarm, LLC, owned by EDP Renewables North America LLC, Houston, Texas to purchase the energy generated at the approximately 105-megawatt Phase 1 Meridian Way Wind Farm located in Cloud County, Kansas. Annual payments are contingent upon output of the facility and can range from zero to a maximum of approximately $14.6 million based on a 20-year average cost.
We also have a 20-year contract, which began on December 15, 2005, with Elk River Windfarm, LLC, owned by IBERDROLA RENEWABLES, Inc., to purchase the energy generated at the 150-megawatt Elk River Windfarm located in Butler County, Kansas. Annual payments are contingent upon output of the facility and can range from zero to a maximum of approximately $16.9 million based on a 20-year average cost.
Payments for these wind agreements are recorded as purchased power expenses, and, because of the contingent nature of these payments, are not included in our operating lease obligations.
New Construction
We have in place a contract with a third party vendor to complete environmental retrofits at our Asbury plant. The retrofits will include the installation of a pulse-jet fabric filter (baghouse), circulating dry scrubber and powder activated carbon injection system. This equipment will enable us to comply with the Mercury and Air Toxics Standard (MATS). The addition of this air quality control equipment is expected to be completed by early 2015 at a cost ranging from $112.0 million to $130.0 million, excluding AFUDC. Construction costs through June 30, 2014 were $97.4 million for the project to date, excluding AFUDC.
We also have in place a contract with a third party vendor to complete engineering, procurement, and construction activities at our Riverton plant to convert Riverton Unit 12 from a simple cycle combustion turbine to a combined cycle unit. The conversion will include the installation of a heat recovery steam generator (HRSG), steam turbine generator, auxiliary boiler, cooling tower, and other auxiliary equipment. The Air Emission Source Construction Permit necessary for this project was issued by Kansas Department of Health and Environment on July 11, 2013. This conversion is currently scheduled to be completed in mid-2016 at a cost estimated to range from $165 million to $175 million, excluding AFUDC. This amount is included in our five-year capital

18
expenditure plan. Construction costs, consisting of pre-engineering, site preparation activities and contract costs incurred project to date through June 30, 2014 were $42.4 million, excluding AFUDC.
See “Environmental Matters” below for more information on both of these projects.
Leases
We have purchased power agreements with Cloud County Windfarm, LLC and Elk River Windfarm, LLC, which are considered operating leases for GAAP purposes. Details of these agreements are disclosed in the Purchased Power section of this note. We also currently have short-term operating leases for two unit trains to meet coal delivery demands, for garage and office facilities for our electric segment and for one office facility related to our gas segment. In addition, we have capital leases for certain office equipment and 108 railcars to provide coal delivery for our ownership and purchased power agreement shares of the Plum Point generating facility.
The gross amount of assets recorded under capital leases total $5.3 million at June 30, 2014.
Environmental Matters
We are subject to various federal, state, and local laws and regulations with respect to air and water quality and with respect to hazardous and toxic materials and hazardous and other wastes, including their identification, transportation, disposal, record-keeping and reporting, as well as remediation of contaminated sites and other environmental matters. We believe that our operations are in material compliance with present environmental laws and regulations. Environmental requirements have changed frequently and become more stringent over time. We expect this trend to continue. While we are not in a position to accurately estimate compliance costs for any new requirements, we expect any such costs to be material, although recoverable in rates.
Electric Segment
The Federal Clean Air Act (CAA) and comparable state laws regulate air emissions from stationary sources such as electric power plants through permitting and/or emission control and related requirements. These requirements include maximum emission limits on our facilities for sulfur dioxide (SO2), particulate matter, nitrogen oxides (NOx), carbon monoxide (CO), and hazardous air pollutants including mercury. In the future they will include limits on greenhouse gases (GHG) such as carbon dioxide (CO2).
Compliance Plan
In order to comply with current and forthcoming environmental regulations, we are taking actions to implement our compliance plan and strategy (Compliance Plan). The Mercury Air Toxic Standards (MATS) and the Clean Air Interstate Rule (CAIR) and its subsequent replacement rule, both regulations which we discuss further below, are the drivers behind our Compliance Plan and its implementation schedule. The MATS require reductions in mercury, acid gases and other emissions considered hazardous air pollutants (HAPS). They became effective in April 2012 and require full compliance by April 16, 2015 (with flexibility for extensions for reliability reasons). The Cross State Air Pollution Rule (CSAPR – formerly the Clean Air Transport Rule, or CATR) was first proposed by the EPA in July 2010 as a replacement of CAIR and was set to take effect on January 1, 2012. CSAPR was stayed by the D.C Circuit Court of Appeals in late December 2011, then vacated by court order in August 2012. On April 29, 2014, the U.S. Supreme Court (the Court) reversed the D.C Circuit Court of Appeals judgment, and remanded the case back to the D.C. Circuit Court for further proceedings consistent with the Court’s opinion. In light of the Supreme Court’s decision upholding the EPA’s approach to implementing the good neighbor provision in CSAPR, on June 26, 2014, the EPA moved to lift the stay entered in late December 2011. However, CAIR will remain in effect until proceedings become final. We anticipate compliance costs associated with the MATS and CAIR (or its subsequent replacement) regulations to be recoverable in our rates.

19
Our Compliance Plan largely follows the preferred plan presented in our Integrated Resource Plan (IRP), filed in mid-2013 with the MPSC. As described above under New Construction, we are in the process of installing a scrubber, fabric filter, and powder activated carbon injection system at our Asbury plant. The addition of this air quality control equipment is expected to be completed by early 2015. This addition required the retirement of Asbury Unit 2, a steam turbine rated at 14 megawatts that was used for peaking purposes. Asbury Unit 2 was retired on December 31, 2013.
In September 2012, we completed the transition of our Riverton Units 7 and 8 from operation on coal and natural gas to operation solely on natural gas. Riverton Unit 7 was permanently removed from service on June 30, 2014. Riverton Unit 8 and Riverton Unit 9, a small combustion turbine that requires steam from Unit 8 for start-up, are planned to be retired upon the conversion of Riverton Unit 12, a simple cycle combustion turbine, to a combined cycle unit. This conversion is currently scheduled to be completed in mid-2016. Once our Asbury and Riverton projects are completed, our generating fleet aggregate emissions will be in compliance with CSAPR’s emission limits as originally proposed. However, the current version of CSAPR is likely to be revised to be consistent with the April 29, 2014 U.S. Supreme Court decision.
See “New Construction” above for project costs for both of these projects.
Air Emissions
The CAA regulates the amount of NOx and SO2 an affected unit can emit. As currently operated, each of our affected units is in compliance with the applicable NOx and SO2 limits. Currently, NOx emissions are regulated by the CAIR and National Ambient Air Quality Standard (NAAQS) rules for ozone (discussed below). SO2 emissions are currently regulated by the Title IV Acid Rain Program and the CAIR.
CAIR:
The CAIR generally calls for fossil-fueled power plants greater than 25 megawatts to reduce emission levels of SO2 and/or NOx in 28 eastern states and the District of Columbia, including Missouri, where our Asbury, Energy Center, State Line and Iatan Units No. 1 and No. 2 are located. Kansas was not included in CAIR and our Riverton Plant was not affected. Arkansas, where our Plum Point Plant is located, was included for ozone season NOx but not for SO2.
SO2 allowance allocations under the Title IV Acid Rain Program are used for compliance in the CAIR SO2 Program. The alternate plans in our Integrated Resource Plan (IRP) assumed costs for other emissions such as SO2, NOx and mercury. In the most recent five-year business plan 2014-2018, which assumes normal operations, we do not anticipate the need to purchase any allowances for these pollutants. However, if economically beneficial, we could purchase minimal quantities of allowances in the future.
Based on the April 29, 2014 U.S. Supreme Court decision, the current version of CSAPR (CAIR’s replacement) is likely to be revised to be consistent with the court’s opinion.
Mercury Air Toxics Standard (MATS):
As described above, the MATS standard became effective in April 2012, and requires compliance by April 2015 (with flexibility for extensions for reliability reasons). For all existing and new coal-fired electric utility steam generating units (EGUs), the MATS standard will be phased in over three years, and allows states the ability to give facilities a fourth year to comply. On March 28, 2013, the EPA finalized updates to certain emission limits for new power plants under the MATS. The new standards affect only new coal and oil-fired power plants that will be built in the future. The update does not change the final emission limits or other requirements for existing power plants.
National Ambient Air Quality Standards (NAAQS):
Under the CAA, the EPA sets NAAQS for certain emissions considered harmful to public health and the environment, including particulate matter (PM), NOx, CO, SO2, and ozone which result from fossil fuel combustion. Our facilities are currently in compliance with all applicable NAAQS.
20
In January 2013, the EPA finalized the revised PM 2.5 primary annual standard at 12 ug/m3
(micrograms per cubic meter of air). States are required to meet the primary standard in 2020. The standard should have no impact on our existing generating fleet because the regional ambient monitor results are below the PM 2.5 required level. However, the PM 2.5 standards could impact future major modifications/construction projects that require additional permits.
Ozone, also called ground level smog, is formed by the mixing of NOx and Volatile Organic Compounds (VOCs) in the presence of sunlight. Based on the current standard, our service territory is designated as attainment, meaning that it is in compliance with the standard. A revised Ozone NAAQS is expected to be proposed by the EPA in early 2015 and the final rule is expected in November 2015.
Greenhouse Gases (GHGs):
As the EPA began to prepare for future regulations, GHG emissions have been reported for several years under the Mandatory GHG Reporting Rule. EDE and EDG’s GHG emissions for each year, including 2013, have been reported to the EPA as required.
A series of actions and decisions including the Tailoring Rule, which regulates carbon dioxide and other GHG emissions from certain stationary sources, have further set the foundation for the regulation of GHGs. However, because of the uncertainties regarding the final outcome of the GHG regulations (discussed below), the ultimate cost of compliance cannot be determined at this time. In any case, we expect the cost of complying with any such regulations to be recoverable in our rates.
In April 2012, the EPA proposed a Carbon Pollution Standard for new power plants to limit the amount of carbon emitted by EGUs. This standard was rescinded, and a re-proposal of standards of performance for affected fossil fuel-fired EGUs was published in January 2014. The comment period ended May 9, 2014. The proposed rule applies only to new EGUs and sets separate standards for natural gas-fired combustion turbines and for fossil fuel-fired utility boilers. The proposal would not apply to existing units, including modifications such as those required to meet other air pollution standards which are currently being undertaken at our Asbury facility and at the Riverton facility with the conversion of simple cycle Unit 12 to combined cycle.
On June 2, 2014, the EPA released the proposed rule for limiting carbon emissions from existing power plants. The “Clean Power Plan” requires a 30% carbon emission reduction from 2005 baseline levels by 2030 and requires fossil-fuel fired power plants across the nation, including those in Empire’s fleet, to meet state-specific goals to lower carbon levels. The EPA has identified four building block strategies to achieve the best system of emission reduction (BSER). Included in these strategies are the following: making fossil fuel power plants more efficient; using lower-emitting sources (such as natural gas combined cycle units); using more renewables and keeping nuclear sources; and using power more efficiently. States will use the building blocks to craft their compliance plans or may work with other states in developing a regional approach to compliance, in which case additional time is given for implementation.
The EPA is scheduled to issue the final rule for existing power plants by June 1, 2015. Each state must submit its initial plan by June 30, 2016 with additional time available by request until June 2017 for a single state or June 2018 for a multi-state approach. Currently, state and industry representatives including Empire are collaborating to evaluate future impacts of the rule as proposed by the EPA.
Water Discharges
We operate under the Kansas and Missouri Water Pollution Plans pursuant to the Federal Clean Water Act (CWA). Our plants are in material compliance with applicable regulations and have received all necessary discharge permits.
The Riverton Units 7 and 8 and Iatan Unit 1, which utilize once-through cooling water, were affected by regulations for Cooling Water Intake Structures issued by the EPA under the CWA Section 316(b) Phase II. In 2007, the United States Court of Appeals remanded key sections of these CWA regulations to the EPA. The EPA suspended the regulations. Following a series of court approved delays, the EPA announced its final rule on May 19, 2014 but has not established an
21
effective date of the regulation. We expect the regulations to have a limited impact at Riverton. The retirement of unit 8 is scheduled in 2016. A new intake structure design and cooling tower will be constructed as part of the Unit 12 conversion at Riverton. Impacts at Iatan 1 could range from flow velocity reductions or traveling screen modifications for fish handling to installation of a closed cycle cooling tower retrofit. Our new Iatan Unit 2 and Plum Point Unit 1 are covered by the proposed regulation, but were constructed with cooling towers, the proposed Best Technology Available. We expect them to be unaffected or minimally affected by the final rule.
Surface Impoundments
We own and maintain coal ash impoundments located at our Riverton and Asbury Power Plants. Additionally, we own a 12% interest in a coal ash impoundment at the Iatan Generating Station and a 7.52% interest in a coal ash impoundment at Plum Point. On April 19, 2013, the EPA signed a notice of proposed rulemaking to revise its wastewater effluent limitation guidelines and standards under the CWA for coal-fired power plants. The proposal calls for updates to operating permits beginning in July 2017. Once the new guidelines are issued, the EPA and states would incorporate the new standards into wastewater discharge permits, including permits for coal ash impoundments. We do not have sufficient information at this time to estimate additional costs that might result from any new standards. All of our coal ash impoundments are compliant with existing state and federal regulations.
In June 2010, the EPA proposed to regulate coal combustion residuals (CCRs) under the Federal Resource Conservation and Recovery Act (RCRA). In the proposal, the EPA presented two options: (1) regulation of CCR under RCRA subtitle C as a hazardous waste and (2) regulation of CCR under RCRA subtitle D as a non-hazardous waste. It is anticipated that the final regulation will be published in late 2014. We expect compliance with either option to result in the need to construct a new landfill and the conversion of existing ash handling from a wet to a dry system(s) at a potential cost of up to $15 million at our Asbury Power Plant. This preliminary estimate will likely change based on the final CCR rule and its requirements. We expect resulting costs to be recoverable in our rates.
As a result of the transition from coal to natural gas fuel for Riverton Units 7 and 8, the former Riverton ash impoundment has been capped and closed. Final closure as an industrial (coal combustion waste) landfill was approved on June 30, 2014 by the Kansas Department of Health and Environment (KDHE).
We have received preliminary permit approval in Missouri for a new utility waste landfill adjacent to the Asbury plant. Our Detailed Site Investigation (DSI) will be finalized in late 2014. Receipt of the final construction permit for the waste landfill is expected in late 2015.
Renewable Energy
Missouri regulations currently require Empire and other investor-owned utilities in Missouri to generate or purchase electricity from renewable energy sources, such as solar, wind, biomass and hydro power, or purchase Renewable Energy Credits (RECs), in amounts equal to at least 5% of retail sales in 2014, increasing to at least 15% by 2021. We are currently in compliance with this regulatory requirement as a result of generation from our Ozark Beach Hydroelectric Project and purchased power agreements with Cloud County Windfarm, LLC, located in Cloud County, Kansas, and Elk River Windfarm, LLC, located in Butler County, Kansas. The regulations also require that 2% of the energy from renewable energy sources must be solar; however, we are exempted by statute from that solar requirement. As noted in our Annual Report on Form 10-K for the year ended December 31, 2013, the Earth Island Institute, d/b/a Renew Missouri, and others challenged our solar exemption by filing a complaint with the MPSC. The MPSC dismissed the complaint and Renew Missouri filed a notice of appeal seeking review by the Missouri Supreme Court. The case has been briefed by the parties and is awaiting action by the Court. Kansas established a renewable portfolio standard (RPS), effective November 19, 2010. It requires 10% of our Kansas retail customer peak capacity requirements to be sourced from renewables in 2012, increasing to 15% by 2016, and to 20% by 2020. We are currently in compliance with this regulatory requirement as a result of purchased power agreements with Cloud County
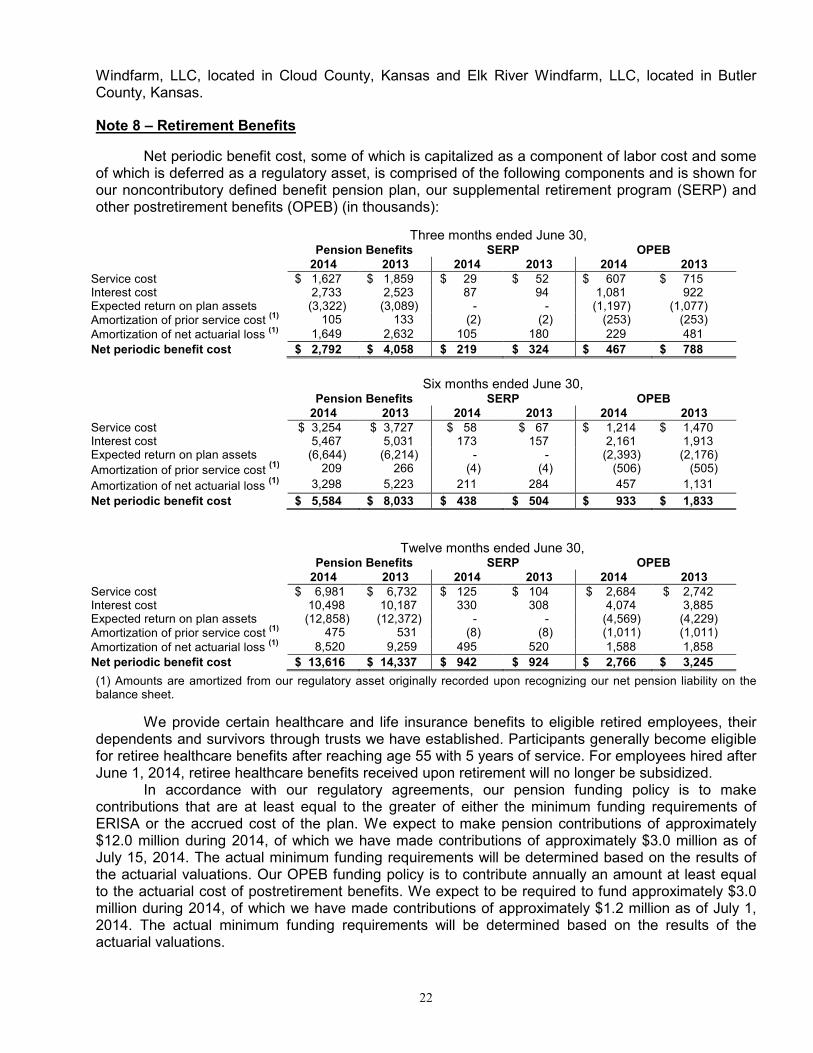
22
Windfarm, LLC, located in Cloud County, Kansas and Elk River Windfarm, LLC, located in Butler County, Kansas.
Note 8 – Retirement Benefits
Net periodic benefit cost, some of which is capitalized as a component of labor cost and some of which is deferred as a regulatory asset, is comprised of the following components and is shown for our noncontributory defined benefit pension plan, our supplemental retirement program (SERP) and other postretirement benefits (OPEB) (in thousands):
Three months ended June 30, Pension Benefits SERP OPEB 2014 2013 2014 2013 2014 2013 Service cost $ 1,627 $ 1,859 $ 29 $ 52 $ 607 $ 715 Interest cost 2,733 2,523 87 94 1,081 922 Expected return on plan assets (3,322) (3,089) - - (1,197) (1,077) Amortization of prior service cost
(1) 105 133 (2) (2) (253) (253)
Amortization of net actuarial loss (1) 1,649 2,632 105 180 229 481
Net periodic benefit cost $ 2,792 $ 4,058 $ 219 $ 324 $ 467 $ 788
Six months ended June 30, Pension Benefits SERP OPEB 2014 2013 2014 2013 2014 2013 Service cost $ 3,254 $ 3,727 $ 58 $ 67 $ 1,214 $ 1,470 Interest cost 5,467 5,031 173 157 2,161 1,913 Expected return on plan assets (6,644) (6,214) - - (2,393) (2,176)
Amortization of prior service cost (1) 209 266 (4) (4) (506) (505)
Amortization of net actuarial loss (1) 3,298 5,223 211 284 457 1,131
Net periodic benefit cost $ 5,584 $ 8,033 $ 438 $ 504 $ 933 $ 1,833
Twelve months ended June 30, Pension Benefits SERP OPEB 2014 2013 2014 2013 2014 2013 Service cost $ 6,981 $ 6,732 $ 125 $ 104 $ 2,684 $ 2,742 Interest cost 10,498 10,187 330 308 4,074 3,885 Expected return on plan assets (12,858) (12,372) - - (4,569) (4,229) Amortization of prior service cost
(1) 475 531 (8) (8) (1,011) (1,011)
Amortization of net actuarial loss (1) 8,520 9,259 495 520 1,588 1,858
Net periodic benefit cost $ 13,616 $ 14,337 $ 942 $ 924 $ 2,766 $ 3,245
(1) Amounts are amortized from our regulatory asset originally recorded upon recognizing our net pension liability on the balance sheet.
We provide certain healthcare and life insurance benefits to eligible retired employees, their dependents and survivors through trusts we have established. Participants generally become eligible for retiree healthcare benefits after reaching age 55 with 5 years of service. For employees hired after June 1, 2014, retiree healthcare benefits received upon retirement will no longer be subsidized.
In accordance with our regulatory agreements, our pension funding policy is to make contributions that are at least equal to the greater of either the minimum funding requirements of ERISA or the accrued cost of the plan. We expect to make pension contributions of approximately $12.0 million during 2014, of which we have made contributions of approximately $3.0 million as of July 15, 2014. The actual minimum funding requirements will be determined based on the results of the actuarial valuations. Our OPEB funding policy is to contribute annually an amount at least equal to the actuarial cost of postretirement benefits. We expect to be required to fund approximately $3.0 million during 2014, of which we have made contributions of approximately $1.2 million as of July 1, 2014. The actual minimum funding requirements will be determined based on the results of the actuarial valuations.
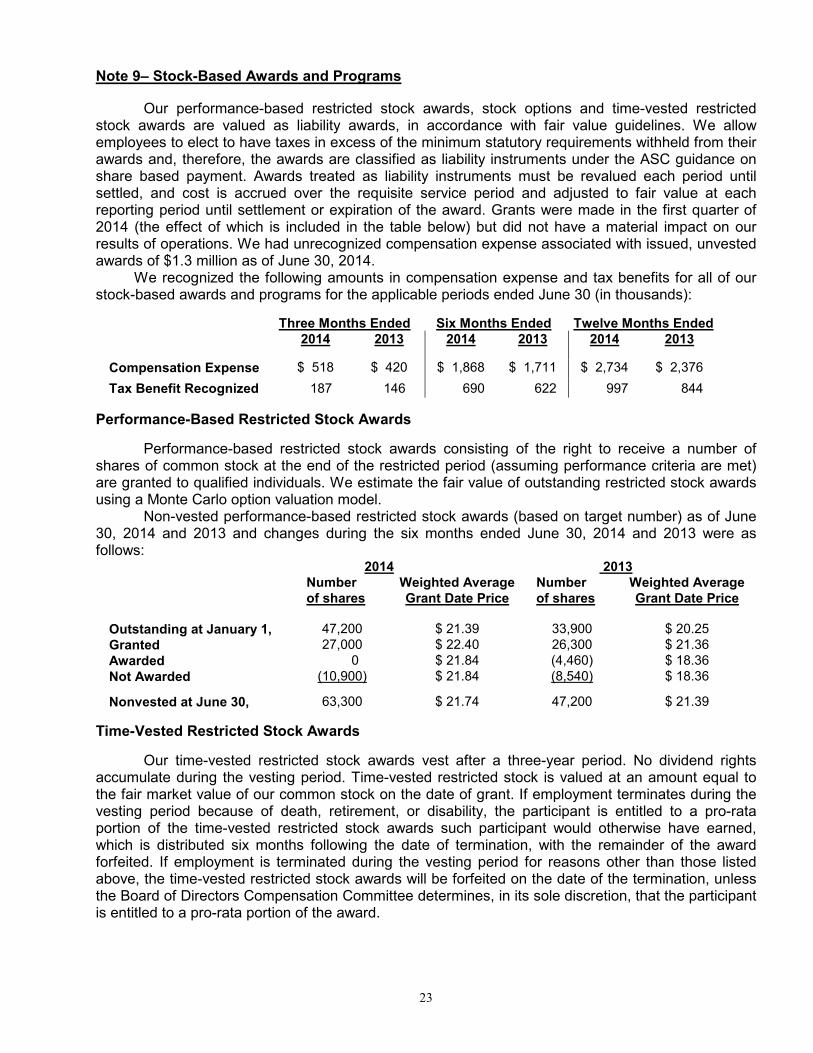
23
Note 9– Stock-Based Awards and Programs
Our performance-based restricted stock awards, stock options and time-vested restricted stock awards are valued as liability awards, in accordance with fair value guidelines. We allow employees to elect to have taxes in excess of the minimum statutory requirements withheld from their awards and, therefore, the awards are classified as liability instruments under the ASC guidance on share based payment. Awards treated as liability instruments must be revalued each period until settled, and cost is accrued over the requisite service period and adjusted to fair value at each reporting period until settlement or expiration of the award. Grants were made in the first quarter of 2014 (the effect of which is included in the table below) but did not have a material impact on our results of operations. We had unrecognized compensation expense associated with issued, unvested awards of $1.3 million as of June 30, 2014.
We recognized the following amounts in compensation expense and tax benefits for all of our stock-based awards and programs for the applicable periods ended June 30 (in thousands):
Three Months Ended Six Months Ended Twelve Months Ended 2014 2013 2014 2013 2014 2013
Compensation Expense $ 518 $ 420 $ 1,868 $ 1,711 $ 2,734 $ 2,376
Tax Benefit Recognized 187 146 690 622 997 844
Performance-Based Restricted Stock Awards
Performance-based restricted stock awards consisting of the right to receive a number of shares of common stock at the end of the restricted period (assuming performance criteria are met) are granted to qualified individuals. We estimate the fair value of outstanding restricted stock awards using a Monte Carlo option valuation model.
Non-vested performance-based restricted stock awards (based on target number) as of June 30, 2014 and 2013 and changes during the six months ended June 30, 2014 and 2013 were as follows: 2014 2013 Number
of shares Weighted Average Grant Date Price
Number of shares
Weighted Average Grant Date Price
Outstanding at January 1, 47,200 $ 21.39 33,900 $ 20.25 Granted 27,000 $ 22.40 26,300 $ 21.36 Awarded 0 $ 21.84 (4,460) $ 18.36 Not Awarded (10,900) $ 21.84 (8,540) $ 18.36 Nonvested at June 30, 63,300 $ 21.74 47,200 $ 21.39
Time-Vested Restricted Stock Awards
Our time-vested restricted stock awards vest after a three-year period. No dividend rights accumulate during the vesting period. Time-vested restricted stock is valued at an amount equal to the fair market value of our common stock on the date of grant. If employment terminates during the vesting period because of death, retirement, or disability, the participant is entitled to a pro-rata portion of the time-vested restricted stock awards such participant would otherwise have earned, which is distributed six months following the date of termination, with the remainder of the award forfeited. If employment is terminated during the vesting period for reasons other than those listed above, the time-vested restricted stock awards will be forfeited on the date of the termination, unless the Board of Directors Compensation Committee determines, in its sole discretion, that the participant is entitled to a pro-rata portion of the award.

24
A summary of time vested restricted stock activity under the plan for 2013 and 2014 is presented in the table below: 2014 2013 Weighted Weighted Number of Average Fair Number of Average Fair shares Market Value shares Market Value Outstanding at January 1, 24,900 $ 22.68 3,300 $ 20.38 Granted 22,600 22.40 21,600 21.36 Vested 710 24.29 - - Distributed (3,300) 22.98
Forfeited (2,490) - - - Vested but not distributed (710) - - - Outstanding at end of period 41,710 $ 24.32 24,900 $ 22.40
All time-vested restricted stock awards are classified as liability instruments, which must be revalued each period until settled. The cost of the awards is generally recognized over the requisite (explicit) service period.
Stock Options
Stock option grants vest upon satisfaction of service conditions. The cost of the awards is generally recognized over the requisite (explicit) service period. The fair value of the outstanding options was estimated as of June 30, 2014 and 2013, under a Black-Scholes methodology.
A summary of option activity under the plan during the quarters ended June 30, 2014 and June 30, 2013 is presented below:
2014 2013 Weighted
Average Weighted
Average
Options Exercise Price Options Exercise Price
Outstanding at January 1, 112,500 $23.27 163,300 $23.15
Granted - - - -
Exercised June 30, 67,000 $23.98 40,200 $21.66
Outstanding at June 30, 45,500 $23.81 123,100 $23.19
Exercisable at June 30, 45,500 $23.81 123,100 $23.19
Employee Stock Purchase Plan
Our Employee Stock Purchase Plan (ESPP) permits the grant to eligible employees of options to purchase common stock at 90% of the lower of market value at date of grant or at date of exercise. The lookback feature of this plan is valued at 90% of the Black-Scholes methodology plus 10% of the maximum subscription price. As of June 30, 2014, there were 70,838 shares available for issuance in this plan. On May 1, 2014, our shareholders approved an amended and restated ESPP to reserve an additional 750,000 shares.
2014 2013
Subscriptions outstanding at June 30 58,627 62,793
Maximum subscription price(1) $21.43 $19.58
Shares of stock issued 56,942 68,099
Stock issuance price $19.58 $17.95
(1) Stock will be issued on the closing date of the purchase period, which runs from June 1, 2014 to May 31, 2015.
Assumptions for valuation of these shares are shown in the table below.
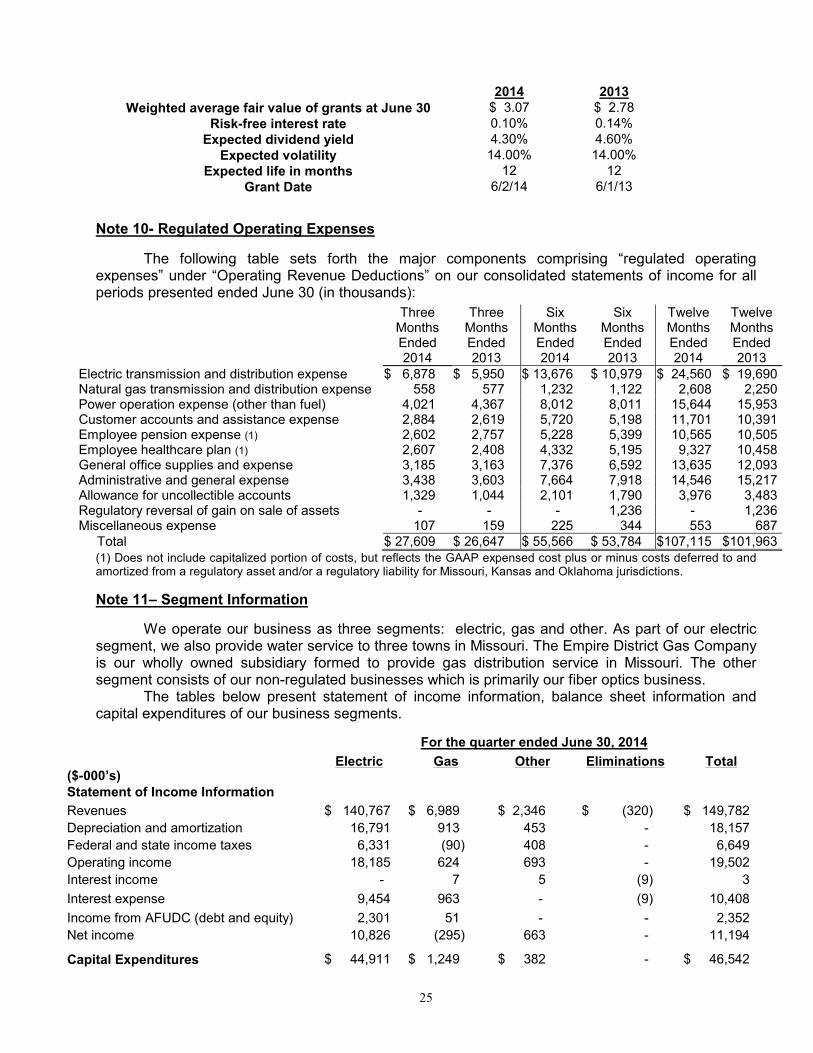
25
Note 10- Regulated Operating Expenses
The following table sets forth the major components comprising “regulated operating expenses” under “Operating Revenue Deductions” on our consolidated statements of income for all periods presented ended June 30 (in thousands):
Three Months Ended
Three Months Ended
Six Months Ended
Six Months Ended
Twelve Months Ended
Twelve Months Ended
2014 2013 2014 2013 2014 2013 Electric transmission and distribution expense $ 6,878 $ 5,950 $ 13,676 $ 10,979 $ 24,560 $ 19,690 Natural gas transmission and distribution expense 558 577 1,232 1,122 2,608 2,250 Power operation expense (other than fuel) 4,021 4,367 8,012 8,011 15,644 15,953 Customer accounts and assistance expense 2,884 2,619 5,720 5,198 11,701 10,391 Employee pension expense (1) 2,602 2,757 5,228 5,399 10,565 10,505 Employee healthcare plan (1) 2,607 2,408 4,332 5,195 9,327 10,458 General office supplies and expense 3,185 3,163 7,376 6,592 13,635 12,093 Administrative and general expense 3,438 3,603 7,664 7,918 14,546 15,217 Allowance for uncollectible accounts 1,329 1,044 2,101 1,790 3,976 3,483 Regulatory reversal of gain on sale of assets - - - 1,236 - 1,236 Miscellaneous expense 107 159 225 344 553 687 Total $ 27,609 $ 26,647 $ 55,566 $ 53,784 $107,115 $101,963
(1) Does not include capitalized portion of costs, but reflects the GAAP expensed cost plus or minus costs deferred to and amortized from a regulatory asset and/or a regulatory liability for Missouri, Kansas and Oklahoma jurisdictions.
Note 11– Segment Information
We operate our business as three segments: electric, gas and other. As part of our electric segment, we also provide water service to three towns in Missouri. The Empire District Gas Company is our wholly owned subsidiary formed to provide gas distribution service in Missouri. The other segment consists of our non-regulated businesses which is primarily our fiber optics business. The tables below present statement of income information, balance sheet information and capital expenditures of our business segments.
For the quarter ended June 30, 2014
Electric Gas Other Eliminations Total ($-000’s)
Statement of Income Information
Revenues $ 140,767 $ 6,989 $ 2,346 $ (320) $ 149,782
Depreciation and amortization 16,791 913 453 - 18,157
Federal and state income taxes 6,331 (90) 408 - 6,649
Operating income 18,185 624 693 - 19,502
Interest income - 7 5 (9) 3
Interest expense 9,454 963 - (9) 10,408
Income from AFUDC (debt and equity) 2,301 51 - - 2,352
Net income 10,826 (295) 663 - 11,194
Capital Expenditures $ 44,911 $ 1,249 $ 382 - $ 46,542
2014 2013
Weighted average fair value of grants at June 30 $ 3.07 $ 2.78 Risk-free interest rate 0.10% 0.14% Expected dividend yield 4.30% 4.60%
Expected volatility 14.00% 14.00% Expected life in months 12 12
Grant Date 6/2/14 6/1/13

26
For the quarter ended June 30, 2013
Electric Gas Other Eliminations Total
($-000’s)
Statement of Income Information
Revenues $ 127,026 $ 7,777 $ 1,991 $ (148) $ 136,646
Depreciation and amortization 16,205 927 503 - 17,635
Federal and state income taxes 6,948 (129) 230 - 7,049
Operating income 19,994 744 372 - 21,110
Interest income 3 34 2 (29) 10
Interest expense 9,557 976 - (29) 10,504
Income from AFUDC (debt and equity) 1,331 8 - - 1,339
Net income 11,498 (214) 374 - 11,658
Capital Expenditures $ 36,535 $ 1,463 $ 502 - $ 38,500
For the six months ended June 30, 2014
Electric Gas Other Eliminations Total ($-000’s)
Statement of Income Information
Revenues $ 293,856 $ 31,598 $ 4,641 $ (640) $ 329,455
Depreciation and amortization 33,366 1,824 907 - 36,097
Federal and state income taxes 16,578 1,358 833 - 18,769
Operating income 43,711 3,899 1,380 - 48,990
Interest income 32 19 8 (15) 44
Interest expense 18,821 1,926 - (15) 20,732
Income from AFUDC (debt and equity) 4,267 76 - - 4,343
Net income 28,710 2,035 1,354 - 32,099
Capital Expenditures
$ 91,614 $ 4,422 $ 839 - $ 96,875
For the six months ended June 30, 2013
Electric Gas Other Eliminations Total ($-000’s)
Statement of Income Information
Revenues $ 255,788 $ 28,270 $ 4,024 $ (296) $ 287,786
Depreciation and amortization 30,887 1,851 998 - 33,736
Federal and state income taxes 12,943 1,076 512 - 14,531
Operating income 38,509 3,639 820 - 42,968
Interest income 497 105 7 (92) 517
Interest expense 18,893 1,953 - (92) 20,754
Income from AFUDC (debt and equity) 2,161 9 - - 2,170
Net income 21,721 1,735 831 - 24,287
Capital Expenditures
$ 73,070 $ 2,196 $ 942 - $ 76,208

27
For the twelve months ended June 30, 2014
Electric Gas Other Eliminations Total ($-000’s)
Statement of Income Information
Revenues $ 574,481 $ 53,369 $ 9,764 $ (1,616) $ 635,998
Depreciation and amortization 66,138 3,682 1,848 - 71,668
Federal and state income taxes 38,113 1,766 1,852 - 41,731
Operating income 96,187 6,453 3,045 - 105,685
Interest income 71 29 9 (17) 92
Interest expense 37,612 3,862 - (17) 41,457
Income from AFUDC (debt and equity) 8,016 98 - - 8,114
Net income 65,592 2,655 3,010 - 71,257
Capital Expenditures
$ 175,445 $ 6,645 $ 2,285 - $ 184,375
For the twelve months ended June 30, 2013
Electric Gas Other Eliminations Total ($-000’s)
Statement of Income Information
Revenues $ 522,624 $ 46,632 $ 7,443 $ (592) $ 576,107
Depreciation and amortization 58,869 3,669 1,642 - 64,180
Federal and state income taxes 33,277 1,406 1,047 - 35,730
Operating income 89,876 6,055 1,684 - 97,615
Interest income 1,155 262 13 (243) 1,187
Interest expense 37,558 3,905 - (243) 41,220
Income from AFUDC (debt and equity) 3,811 18 - - 3,829
Net Income 55,487 2,267 1,702 - 59,456
Capital Expenditures
$ 149,619 $ 4,198 $ 2,003 - $ 155,820
As of June 30, 2014
($-000’s) Electric Gas
(1) Other Elimination
s Total
Balance Sheet Information
Total assets $ 2,098,131 $ 122,304 $ 31,965 $ (44,619) $ 2,207,781
(1) Includes goodwill of $39,492.
As of December 31, 2013
($-000’s) Electric Gas(1) Other Elimination
s Total
Balance Sheet Information
Total assets $ 2,034,234 $ 123,736 $ 31,306 $ (44,231) $ 2,145,045
(1) Includes goodwill of $39,492.

28
Note 12– Income Taxes
The following table shows our provision for income taxes and our consolidated effective federal and state income tax rates for the applicable periods ended June 30 (dollars in millions):
Three Months Ended Six-Months Ended Twelve Months Ended 2014 2013 2014 2013 2014 2013 Consolidated provision for income taxes $ 6.6 $ 7.0 $ 18.8 $ 14.5 $ 41.7 $ 35.7 Consolidated effective federal and state income tax rates
37.3%
37.7%
36.9%
37.4%
36.9%
37.5%
The effective income tax rate for the three, six and twelve month periods ended June 30, 2014 is lower than comparable periods in 2013 primarily due to higher equity AFUDC income in 2014 compared with 2013.
We do not have any unrecognized tax benefits as of June 30, 2014. We did not recognize any significant interest or penalties in any of the periods presented. We do not expect any significant changes to our unrecognized tax benefits over the next twelve months.
In 2010, we received $17.7 million of investment tax credits based on our investment in Iatan 2. We utilized $0.7 million of these credits when preparing our 2012 tax return. We expect to utilize approximately $10.7 million of these credits on our 2013 tax return. We expect to use the remaining credits on our 2014 tax return. The tax credits will have no significant income statement impact because they will flow to our customers as we amortize the tax credits over the life of the plant.
The American Taxpayer Relief Act of 2012 (the “Act”) was signed into law on January 2, 2013. The Act restored several expired business tax provisions, including bonus depreciation for 2013. Our 2014 tax payments are expected to be higher than 2013 due to the expiration of bonus depreciation. However, we expect to utilize investment tax credits noted above to partially offset the 2014 payments.
On September 13, 2013, the IRS and the Treasury Department released final regulations under Sections 162(a) and 263(a) on the deduction and capitalization of expenditures related to tangible property. These regulations apply to tax years beginning on or after January 1, 2014, and we plan to utilize the book capitalization method as allowable under the final regulations. We expect an immaterial impact to the effective tax rate based on the book capitalization method. Item 2. Management's Discussion and Analysis of Financial Condition and Results of
Operations
EXECUTIVE SUMMARY
We operate our businesses as three segments: electric, gas and other. The Empire District Electric Company (EDE) is an operating public utility engaged in the generation, purchase, transmission, distribution and sale of electricity in parts of Missouri, Kansas, Oklahoma and Arkansas, including the sale of wholesale energy to four towns in Missouri and Kansas. As part of our electric segment, we also provide water service to three towns in Missouri. The Empire District Gas Company (EDG) is our wholly owned subsidiary which provides natural gas distribution to customers in 48 communities in northwest, north central and west central Missouri. Our other segment consists of our fiber optics business. During the twelve months ended June 30, 2014, our gross operating revenues were derived as follows:
Electric segment sales* 90.3% Gas segment sales 8.4 Other segment sales 1.3
*Sales from our electric segment include 0.3% from the sale of water.
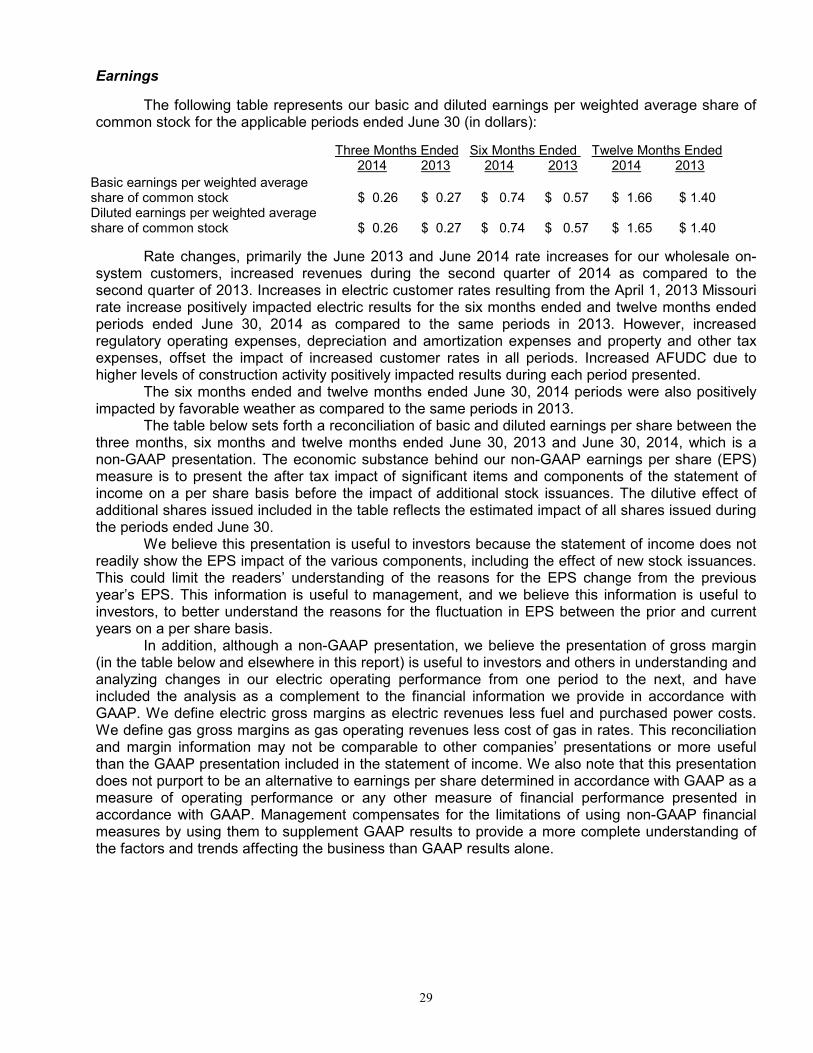
29
Earnings
The following table represents our basic and diluted earnings per weighted average share of common stock for the applicable periods ended June 30 (in dollars):
Three Months Ended Six Months Ended Twelve Months Ended 2014 2013 2014 2013 2014 2013 Basic earnings per weighted average share of common stock
$ 0.26
$ 0.27
$ 0.74
$ 0.57
$ 1.66
$ 1.40
Diluted earnings per weighted average share of common stock
$ 0.26
$ 0.27
$ 0.74
$ 0.57
$ 1.65
$ 1.40
Rate changes, primarily the June 2013 and June 2014 rate increases for our wholesale on-system customers, increased revenues during the second quarter of 2014 as compared to the second quarter of 2013. Increases in electric customer rates resulting from the April 1, 2013 Missouri rate increase positively impacted electric results for the six months ended and twelve months ended periods ended June 30, 2014 as compared to the same periods in 2013. However, increased regulatory operating expenses, depreciation and amortization expenses and property and other tax expenses, offset the impact of increased customer rates in all periods. Increased AFUDC due to higher levels of construction activity positively impacted results during each period presented. The six months ended and twelve months ended June 30, 2014 periods were also positively impacted by favorable weather as compared to the same periods in 2013.
The table below sets forth a reconciliation of basic and diluted earnings per share between the three months, six months and twelve months ended June 30, 2013 and June 30, 2014, which is a non-GAAP presentation. The economic substance behind our non-GAAP earnings per share (EPS) measure is to present the after tax impact of significant items and components of the statement of income on a per share basis before the impact of additional stock issuances. The dilutive effect of additional shares issued included in the table reflects the estimated impact of all shares issued during the periods ended June 30.
We believe this presentation is useful to investors because the statement of income does not readily show the EPS impact of the various components, including the effect of new stock issuances. This could limit the readers’ understanding of the reasons for the EPS change from the previous year’s EPS. This information is useful to management, and we believe this information is useful to investors, to better understand the reasons for the fluctuation in EPS between the prior and current years on a per share basis.
In addition, although a non-GAAP presentation, we believe the presentation of gross margin (in the table below and elsewhere in this report) is useful to investors and others in understanding and analyzing changes in our electric operating performance from one period to the next, and have included the analysis as a complement to the financial information we provide in accordance with GAAP. We define electric gross margins as electric revenues less fuel and purchased power costs. We define gas gross margins as gas operating revenues less cost of gas in rates. This reconciliation and margin information may not be comparable to other companies’ presentations or more useful than the GAAP presentation included in the statement of income. We also note that this presentation does not purport to be an alternative to earnings per share determined in accordance with GAAP as a measure of operating performance or any other measure of financial performance presented in accordance with GAAP. Management compensates for the limitations of using non-GAAP financial measures by using them to supplement GAAP results to provide a more complete understanding of the factors and trends affecting the business than GAAP results alone.
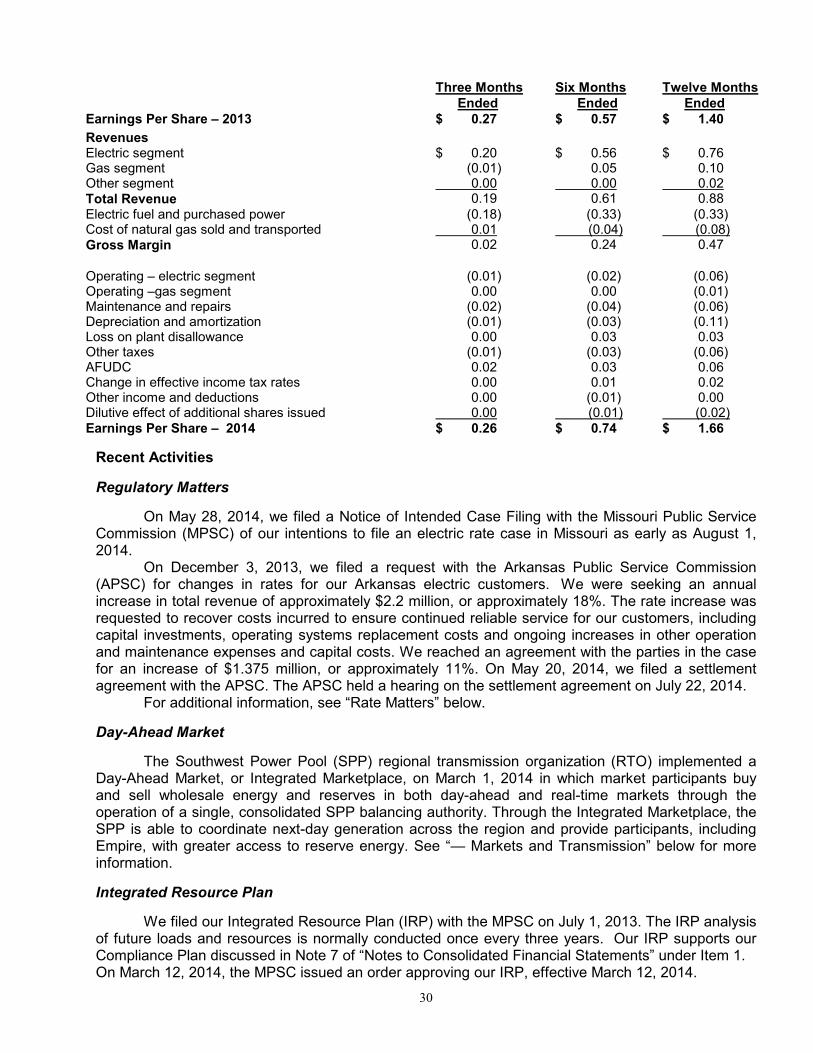
30
Three Months Ended
Six Months Ended
Twelve Months Ended
Earnings Per Share – 2013 $ 0.27 $ 0.57 $ 1.40 Revenues Electric segment $ 0.20 $ 0.56 $ 0.76 Gas segment (0.01) 0.05 0.10 Other segment 0.00 0.00 0.02 Total Revenue 0.19 0.61 0.88 Electric fuel and purchased power (0.18) (0.33) (0.33) Cost of natural gas sold and transported 0.01 (0.04) (0.08) Gross Margin 0.02 0.24 0.47 Operating – electric segment (0.01) (0.02) (0.06) Operating –gas segment 0.00 0.00 (0.01) Maintenance and repairs (0.02) (0.04) (0.06) Depreciation and amortization (0.01) (0.03) (0.11) Loss on plant disallowance 0.00 0.03 0.03 Other taxes (0.01) (0.03) (0.06) AFUDC 0.02 0.03 0.06 Change in effective income tax rates 0.00 0.01 0.02 Other income and deductions 0.00 (0.01) 0.00 Dilutive effect of additional shares issued 0.00 (0.01) (0.02) Earnings Per Share – 2014 $ 0.26 $ 0.74 $ 1.66
Recent Activities
Regulatory Matters
On May 28, 2014, we filed a Notice of Intended Case Filing with the Missouri Public Service Commission (MPSC) of our intentions to file an electric rate case in Missouri as early as August 1, 2014. On December 3, 2013, we filed a request with the Arkansas Public Service Commission (APSC) for changes in rates for our Arkansas electric customers. We were seeking an annual increase in total revenue of approximately $2.2 million, or approximately 18%. The rate increase was requested to recover costs incurred to ensure continued reliable service for our customers, including capital investments, operating systems replacement costs and ongoing increases in other operation and maintenance expenses and capital costs. We reached an agreement with the parties in the case for an increase of $1.375 million, or approximately 11%. On May 20, 2014, we filed a settlement agreement with the APSC. The APSC held a hearing on the settlement agreement on July 22, 2014.
For additional information, see “Rate Matters” below.
Day-Ahead Market
The Southwest Power Pool (SPP) regional transmission organization (RTO) implemented a Day-Ahead Market, or Integrated Marketplace, on March 1, 2014 in which market participants buy and sell wholesale energy and reserves in both day-ahead and real-time markets through the operation of a single, consolidated SPP balancing authority. Through the Integrated Marketplace, the SPP is able to coordinate next-day generation across the region and provide participants, including Empire, with greater access to reserve energy. See “— Markets and Transmission” below for more information.
Integrated Resource Plan
We filed our Integrated Resource Plan (IRP) with the MPSC on July 1, 2013. The IRP analysis of future loads and resources is normally conducted once every three years. Our IRP supports our Compliance Plan discussed in Note 7 of “Notes to Consolidated Financial Statements” under Item 1. On March 12, 2014, the MPSC issued an order approving our IRP, effective March 12, 2014.
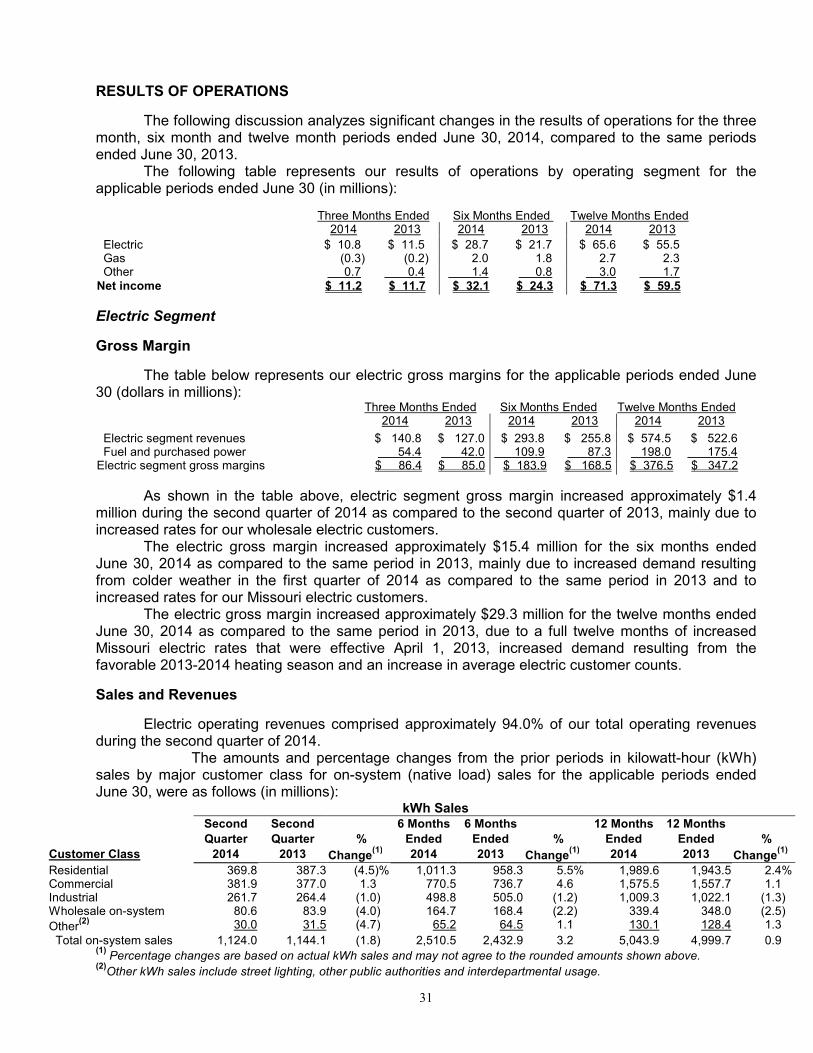
31
RESULTS OF OPERATIONS
The following discussion analyzes significant changes in the results of operations for the three month, six month and twelve month periods ended June 30, 2014, compared to the same periods ended June 30, 2013.
The following table represents our results of operations by operating segment for the applicable periods ended June 30 (in millions):
Three Months Ended Six Months Ended Twelve Months Ended 2014 2013 2014 2013 2014 2013 Electric $ 10.8 $ 11.5 $ 28.7 $ 21.7 $ 65.6 $ 55.5 Gas (0.3) (0.2) 2.0 1.8 2.7 2.3 Other 0.7 0.4 1.4 0.8 3.0 1.7 Net income $ 11.2 $ 11.7 $ 32.1 $ 24.3 $ 71.3 $ 59.5
Electric Segment
Gross Margin
The table below represents our electric gross margins for the applicable periods ended June 30 (dollars in millions):
Three Months Ended Six Months Ended Twelve Months Ended
2014 2013 2014 2013 2014 2013
Electric segment revenues $ 140.8 $ 127.0 $ 293.8 $ 255.8 $ 574.5 $ 522.6 Fuel and purchased power 54.4 42.0 109.9 87.3 198.0 175.4 Electric segment gross margins $ 86.4 $ 85.0 $ 183.9 $ 168.5 $ 376.5 $ 347.2
As shown in the table above, electric segment gross margin increased approximately $1.4 million during the second quarter of 2014 as compared to the second quarter of 2013, mainly due to increased rates for our wholesale electric customers. The electric gross margin increased approximately $15.4 million for the six months ended June 30, 2014 as compared to the same period in 2013, mainly due to increased demand resulting from colder weather in the first quarter of 2014 as compared to the same period in 2013 and to increased rates for our Missouri electric customers.
The electric gross margin increased approximately $29.3 million for the twelve months ended June 30, 2014 as compared to the same period in 2013, due to a full twelve months of increased Missouri electric rates that were effective April 1, 2013, increased demand resulting from the favorable 2013-2014 heating season and an increase in average electric customer counts.
Sales and Revenues
Electric operating revenues comprised approximately 94.0% of our total operating revenues during the second quarter of 2014.
The amounts and percentage changes from the prior periods in kilowatt-hour (kWh) sales by major customer class for on-system (native load) sales for the applicable periods ended June 30, were as follows (in millions): kWh Sales
Second Second 6 Months 6 Months 12 Months 12 Months
Quarter Quarter % Ended Ended % Ended Ended %
Customer Class 2014 2013 Change(1) 2014 2013 Change
(1) 2014 2013 Change
(1)
Residential 369.8 387.3 (4.5)% 1,011.3 958.3 5.5% 1,989.6 1,943.5 2.4% Commercial 381.9 377.0 1.3 770.5 736.7 4.6 1,575.5 1,557.7 1.1 Industrial 261.7 264.4 (1.0) 498.8 505.0 (1.2) 1,009.3 1,022.1 (1.3) Wholesale on-system 80.6 83.9 (4.0) 164.7 168.4 (2.2) 339.4 348.0 (2.5)
Other(2) 30.0 31.5 (4.7) 65.2 64.5 1.1 130.1 128.4 1.3
Total on-system sales 1,124.0 1,144.1 (1.8) 2,510.5 2,432.9 3.2 5,043.9 4,999.7 0.9 (1) Percentage changes are based on actual kWh sales and may not agree to the rounded amounts shown above.
(2)Other kWh sales include street lighting, other public authorities and interdepartmental usage.
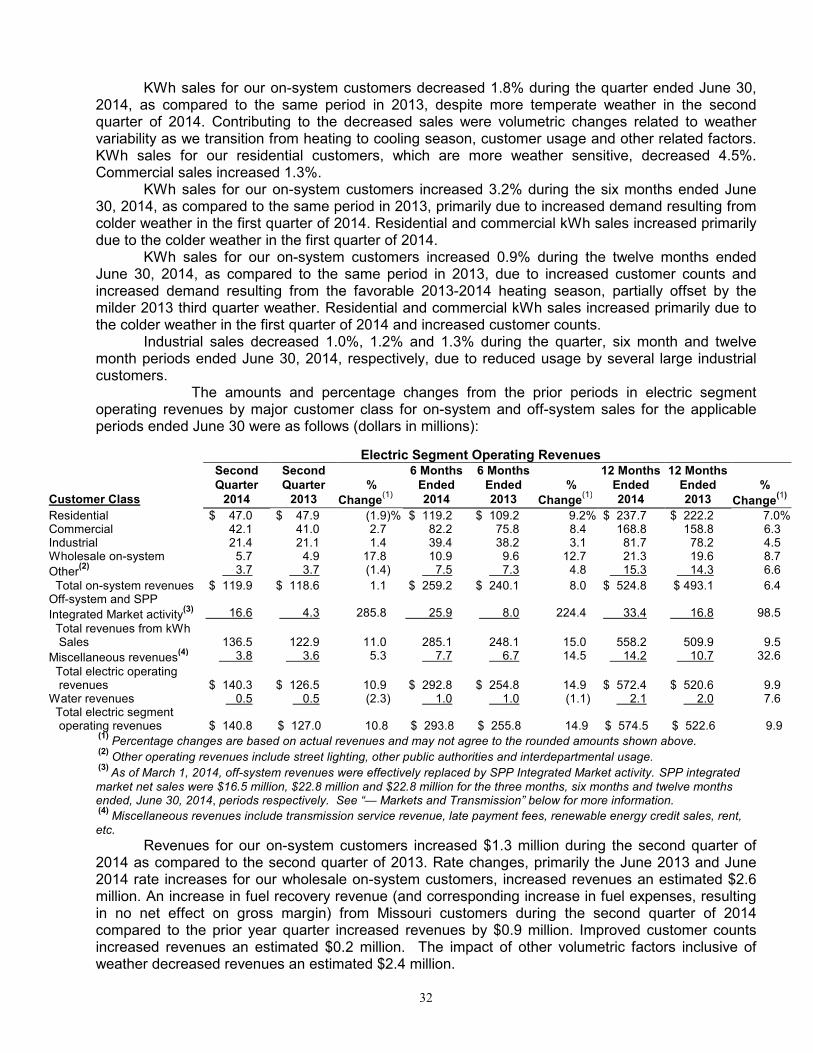
32
KWh sales for our on-system customers decreased 1.8% during the quarter ended June 30, 2014, as compared to the same period in 2013, despite more temperate weather in the second quarter of 2014. Contributing to the decreased sales were volumetric changes related to weather variability as we transition from heating to cooling season, customer usage and other related factors. KWh sales for our residential customers, which are more weather sensitive, decreased 4.5%. Commercial sales increased 1.3%.
KWh sales for our on-system customers increased 3.2% during the six months ended June 30, 2014, as compared to the same period in 2013, primarily due to increased demand resulting from colder weather in the first quarter of 2014. Residential and commercial kWh sales increased primarily due to the colder weather in the first quarter of 2014.
KWh sales for our on-system customers increased 0.9% during the twelve months ended June 30, 2014, as compared to the same period in 2013, due to increased customer counts and increased demand resulting from the favorable 2013-2014 heating season, partially offset by the milder 2013 third quarter weather. Residential and commercial kWh sales increased primarily due to the colder weather in the first quarter of 2014 and increased customer counts.
Industrial sales decreased 1.0%, 1.2% and 1.3% during the quarter, six month and twelve month periods ended June 30, 2014, respectively, due to reduced usage by several large industrial customers.
The amounts and percentage changes from the prior periods in electric segment operating revenues by major customer class for on-system and off-system sales for the applicable periods ended June 30 were as follows (dollars in millions):
Electric Segment Operating Revenues Second Second 6 Months 6 Months 12 Months 12 Months Quarter Quarter % Ended Ended % Ended Ended % Customer Class 2014 2013 Change
(1) 2014 2013 Change
(1) 2014 2013 Change
(1)
Residential $ 47.0 $ 47.9 (1.9)% $ 119.2 $ 109.2 9.2% $ 237.7 $ 222.2 7.0% Commercial 42.1 41.0 2.7 82.2 75.8 8.4 168.8 158.8 6.3 Industrial 21.4 21.1 1.4 39.4 38.2 3.1 81.7 78.2 4.5 Wholesale on-system 5.7 4.9 17.8 10.9 9.6 12.7 21.3 19.6 8.7
Other(2) 3.7 3.7 (1.4) 7.5 7.3 4.8 15.3 14.3 6.6
Total on-system revenues $ 119.9 $ 118.6 1.1 $ 259.2 $ 240.1 8.0 $ 524.8 $ 493.1 6.4 Off-system and SPP
Integrated Market activity(3)
16.6
4.3
285.8
25.9
8.0
224.4
33.4
16.8
98.5
Total revenues from kWh Sales 136.5 122.9 11.0 285.1 248.1 15.0 558.2 509.9 9.5
Miscellaneous revenues(4) 3.8 3.6 5.3 7.7 6.7 14.5 14.2 10.7 32.6
Total electric operating revenues $ 140.3 $ 126.5 10.9 $ 292.8 $ 254.8 14.9 $ 572.4 $ 520.6 9.9 Water revenues 0.5 0.5 (2.3) 1.0 1.0 (1.1) 2.1 2.0 7.6 Total electric segment operating revenues $ 140.8 $ 127.0 10.8 $ 293.8 $ 255.8 14.9 $ 574.5 $ 522.6 9.9
(1) Percentage changes are based on actual revenues and may not agree to the rounded amounts shown above.
(2) Other operating revenues include street lighting, other public authorities and interdepartmental usage.
(3) As of March 1, 2014, off-system revenues were effectively replaced by SPP Integrated Market activity. SPP integrated
market net sales were $16.5 million, $22.8 million and $22.8 million for the three months, six months and twelve months ended, June 30, 2014, periods respectively. See “— Markets and Transmission” below for more information. (4) Miscellaneous revenues include transmission service revenue, late payment fees, renewable energy credit sales, rent,
etc.
Revenues for our on-system customers increased $1.3 million during the second quarter of 2014 as compared to the second quarter of 2013. Rate changes, primarily the June 2013 and June 2014 rate increases for our wholesale on-system customers, increased revenues an estimated $2.6 million. An increase in fuel recovery revenue (and corresponding increase in fuel expenses, resulting in no net effect on gross margin) from Missouri customers during the second quarter of 2014 compared to the prior year quarter increased revenues by $0.9 million. Improved customer counts increased revenues an estimated $0.2 million. The impact of other volumetric factors inclusive of weather decreased revenues an estimated $2.4 million.

33
Revenues for our on-system customers increased $19.2 million for the six months ended June 30, 2014 as compared to the same period in 2013. Rate changes, primarily the April 2013 Missouri retail on-system customer rate increase and the June 2013 increase for our wholesale on-system customers, contributed an estimated $10.2 million to revenues. Weather and other related factors increased revenues an estimated $6.8 million during the six months ended June 30, 2014. A $1.6 million increase in fuel recovery revenue (and corresponding reduction in fuel expenses, resulting in no net effect on gross margin) from Missouri customers during the six months ended June 30, 2014 compared to the same period in 2013 positively impacted revenues. Improved customer counts increased revenues an estimated $0.6 million. Revenues for our on-system customers increased $31.6 million for the twelve months ended June 30, 2014 as compared to the same period in 2013. Rate changes, primarily the April 2013 Missouri retail on-system customer rate increase and the June 2013 increase for our wholesale on-system customers, contributed an estimated $26.0 million to revenues. Weather and other related factors increased revenues an estimated $4.0 million during the twelve months ended June 30, 2014. A $3.3 million increase in fuel recovery revenue (and corresponding reduction in fuel expenses, resulting in no net effect on gross margin) from Missouri customers during the twelve months ended June 30, 2014 compared to the same period in 2013 positively impacted revenues. Improved customer counts increased revenues an estimated $1.7 million. A change to our estimate of unbilled revenues in the third quarter of 2012 increased revenues $3.4 million in the 2013 twelve-month period. The 2014 twelve-month ended period does not include a corresponding adjustment.
Off-System Electric Transactions.
In the past, in addition to sales to our own customers, we also sold power to other utilities as available, including (since 2007) through the SPP Energy Imbalance Services (EIS) market. However, on March 1, 2014, the SPP RTO implemented a Day-Ahead Market, or Integrated Marketplace, which replaces the real-time EIS market. SPP integrated market activity is settled for each market participant in various time increments. When we sell more generation to the market than we purchase, based on the prescribed time increments, the net sale is included as part of electric revenues. When we purchase more generation from the market than we sell, based on the prescribed time increments, the net purchase is recorded as a component of fuel and purchased power on the financial statements. See “— Markets and Transmission” below. The majority of our market activity sales margin is included as a component of the fuel adjustment clause in our Missouri, Kansas and Oklahoma jurisdictions and our transmission rider in our Arkansas jurisdiction. As a result, nearly all of the market activity sales margin flows back to the customer and has little effect on margin or net income.
Miscellaneous Revenues
Our miscellaneous revenues are comprised mainly of transmission revenues, reflecting our position as an SPP transmission owner, late payment fees and renewable energy credit sales.
The following table represents our miscellaneous revenues for our electric segment for the applicable periods ended June 30 (in millions):
Three Months Ended Six Months Ended Twelve Months Ended 2014 2013 2014 2013 2014 2013 Miscellaneous revenues $ 3.8 $ 3.6 $ 7.7 $ 6.7 $ 14.2 $ 10.7 Our miscellaneous revenues increased for the three months ended June 30, 2014 period as compared to the same period in 2013, mainly due to increased renewable energy credit sales. Our miscellaneous revenues increased for the six months ended and the twelve months ended June 30, 2014 periods as compared to the same periods in 2013, mainly due to increased transmission revenues and renewable energy credit sales.
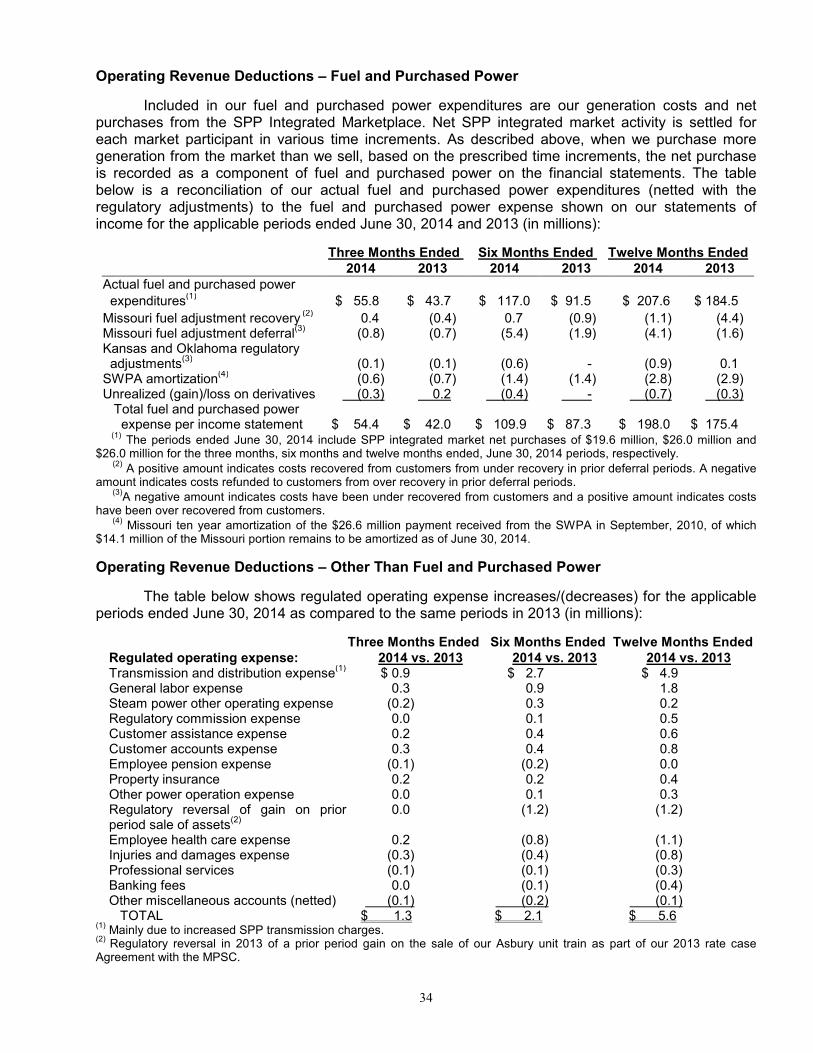
34
Operating Revenue Deductions – Fuel and Purchased Power
Included in our fuel and purchased power expenditures are our generation costs and net purchases from the SPP Integrated Marketplace. Net SPP integrated market activity is settled for each market participant in various time increments. As described above, when we purchase more generation from the market than we sell, based on the prescribed time increments, the net purchase is recorded as a component of fuel and purchased power on the financial statements. The table below is a reconciliation of our actual fuel and purchased power expenditures (netted with the regulatory adjustments) to the fuel and purchased power expense shown on our statements of income for the applicable periods ended June 30, 2014 and 2013 (in millions):
Three Months Ended Six Months Ended Twelve Months Ended 2014 2013 2014 2013 2014 2013 Actual fuel and purchased power
expenditures(1) $ 55.8 $ 43.7 $ 117.0 $ 91.5 $ 207.6 $ 184.5
Missouri fuel adjustment recovery (2) 0.4 (0.4) 0.7 (0.9) (1.1) (4.4)
Missouri fuel adjustment deferral(3) (0.8) (0.7) (5.4) (1.9) (4.1) (1.6)
Kansas and Oklahoma regulatory adjustments
(3) (0.1) (0.1) (0.6) - (0.9) 0.1
SWPA amortization(4) (0.6) (0.7) (1.4) (1.4) (2.8) (2.9)
Unrealized (gain)/loss on derivatives (0.3) 0.2 (0.4) - (0.7) (0.3) Total fuel and purchased power expense per income statement $ 54.4 $ 42.0 $ 109.9 $ 87.3 $ 198.0 $ 175.4
(1) The periods ended June 30, 2014 include SPP integrated market net purchases of $19.6 million, $26.0 million and
$26.0 million for the three months, six months and twelve months ended, June 30, 2014 periods, respectively.
(2) A positive amount indicates costs recovered from customers from under recovery in prior deferral periods. A negative
amount indicates costs refunded to customers from over recovery in prior deferral periods.
(3)A negative amount indicates costs have been under recovered from customers and a positive amount indicates costs
have been over recovered from customers.
(4) Missouri ten year amortization of the $26.6 million payment received from the SWPA in September, 2010, of which
$14.1 million of the Missouri portion remains to be amortized as of June 30, 2014.
Operating Revenue Deductions – Other Than Fuel and Purchased Power
The table below shows regulated operating expense increases/(decreases) for the applicable periods ended June 30, 2014 as compared to the same periods in 2013 (in millions):
Three Months Ended Six Months Ended Twelve Months Ended Regulated operating expense: 2014 vs. 2013 2014 vs. 2013 2014 vs. 2013 Transmission and distribution expense
(1) $ 0.9 $ 2.7 $ 4.9
General labor expense 0.3 0.9 1.8 Steam power other operating expense (0.2) 0.3 0.2 Regulatory commission expense 0.0 0.1 0.5 Customer assistance expense 0.2 0.4 0.6 Customer accounts expense 0.3 0.4 0.8 Employee pension expense (0.1) (0.2) 0.0 Property insurance 0.2 0.2 0.4 Other power operation expense 0.0 0.1 0.3 Regulatory reversal of gain on prior period sale of assets
(2)
0.0 (1.2) (1.2)
Employee health care expense 0.2 (0.8) (1.1) Injuries and damages expense (0.3) (0.4) (0.8) Professional services (0.1) (0.1) (0.3) Banking fees 0.0 (0.1) (0.4) Other miscellaneous accounts (netted) (0.1) (0.2) (0.1) TOTAL $ 1.3 $ 2.1 $ 5.6
(1) Mainly due to increased SPP transmission charges.
(2) Regulatory reversal in 2013 of a prior period gain on the sale of our Asbury unit train as part of our 2013 rate case
Agreement with the MPSC.
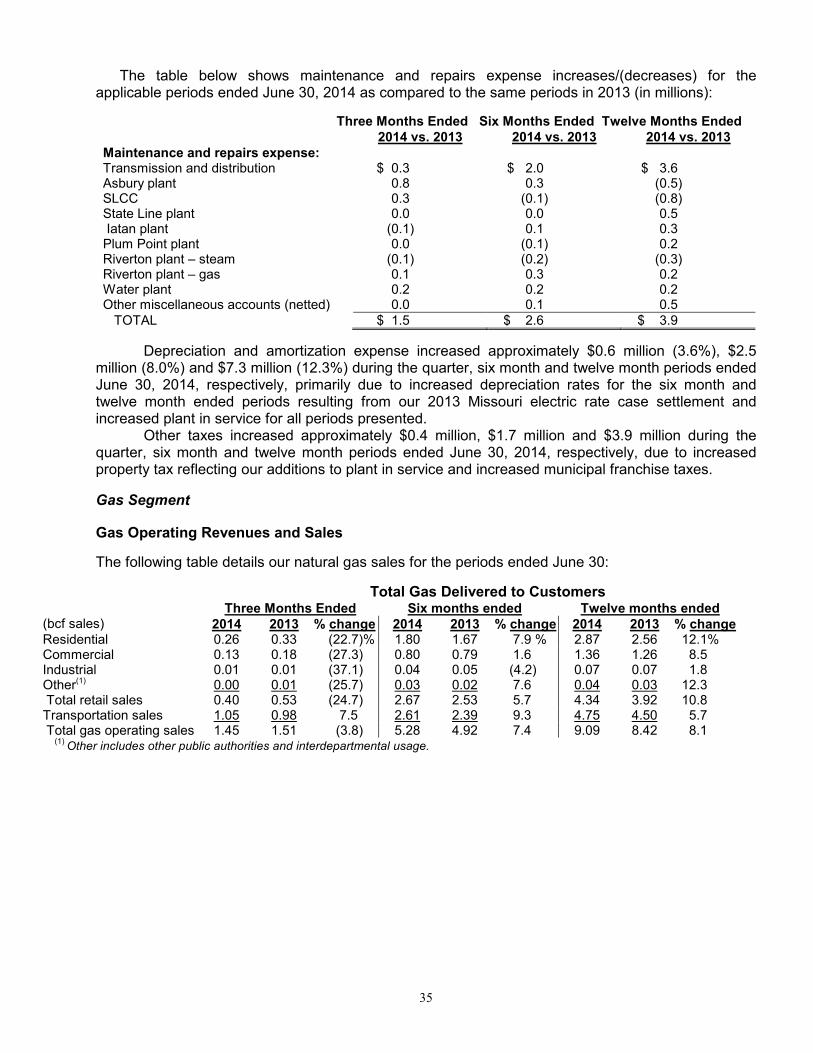
35
The table below shows maintenance and repairs expense increases/(decreases) for the applicable periods ended June 30, 2014 as compared to the same periods in 2013 (in millions):
Three Months Ended Six Months Ended Twelve Months Ended 2014 vs. 2013 2014 vs. 2013 2014 vs. 2013 Maintenance and repairs expense: Transmission and distribution $ 0.3 $ 2.0 $ 3.6 Asbury plant 0.8 0.3 (0.5) SLCC 0.3 (0.1) (0.8) State Line plant 0.0 0.0 0.5 Iatan plant (0.1) 0.1 0.3 Plum Point plant 0.0 (0.1) 0.2 Riverton plant – steam (0.1) (0.2) (0.3) Riverton plant – gas 0.1 0.3 0.2 Water plant 0.2 0.2 0.2 Other miscellaneous accounts (netted) 0.0 0.1 0.5 TOTAL $ 1.5 $ 2.6 $ 3.9
Depreciation and amortization expense increased approximately $0.6 million (3.6%), $2.5 million (8.0%) and $7.3 million (12.3%) during the quarter, six month and twelve month periods ended June 30, 2014, respectively, primarily due to increased depreciation rates for the six month and twelve month ended periods resulting from our 2013 Missouri electric rate case settlement and increased plant in service for all periods presented. Other taxes increased approximately $0.4 million, $1.7 million and $3.9 million during the quarter, six month and twelve month periods ended June 30, 2014, respectively, due to increased property tax reflecting our additions to plant in service and increased municipal franchise taxes.
Gas Segment
Gas Operating Revenues and Sales
The following table details our natural gas sales for the periods ended June 30:
Total Gas Delivered to Customers Three Months Ended Six months ended Twelve months ended
(bcf sales) 2014 2013 % change 2014 2013 % change 2014 2013 % change Residential 0.26 0.33 (22.7)% 1.80 1.67 7.9 % 2.87 2.56 12.1% Commercial 0.13 0.18 (27.3) 0.80 0.79 1.6 1.36 1.26 8.5 Industrial 0.01 0.01 (37.1) 0.04 0.05 (4.2) 0.07 0.07 1.8 Other(1) 0.00 0.01 (25.7) 0.03 0.02 7.6 0.04 0.03 12.3 Total retail sales 0.40 0.53 (24.7) 2.67 2.53 5.7 4.34 3.92 10.8 Transportation sales 1.05 0.98 7.5 2.61 2.39 9.3 4.75 4.50 5.7 Total gas operating sales 1.45 1.51 (3.8) 5.28 4.92 7.4 9.09 8.42 8.1 (1)
Other includes other public authorities and interdepartmental usage.
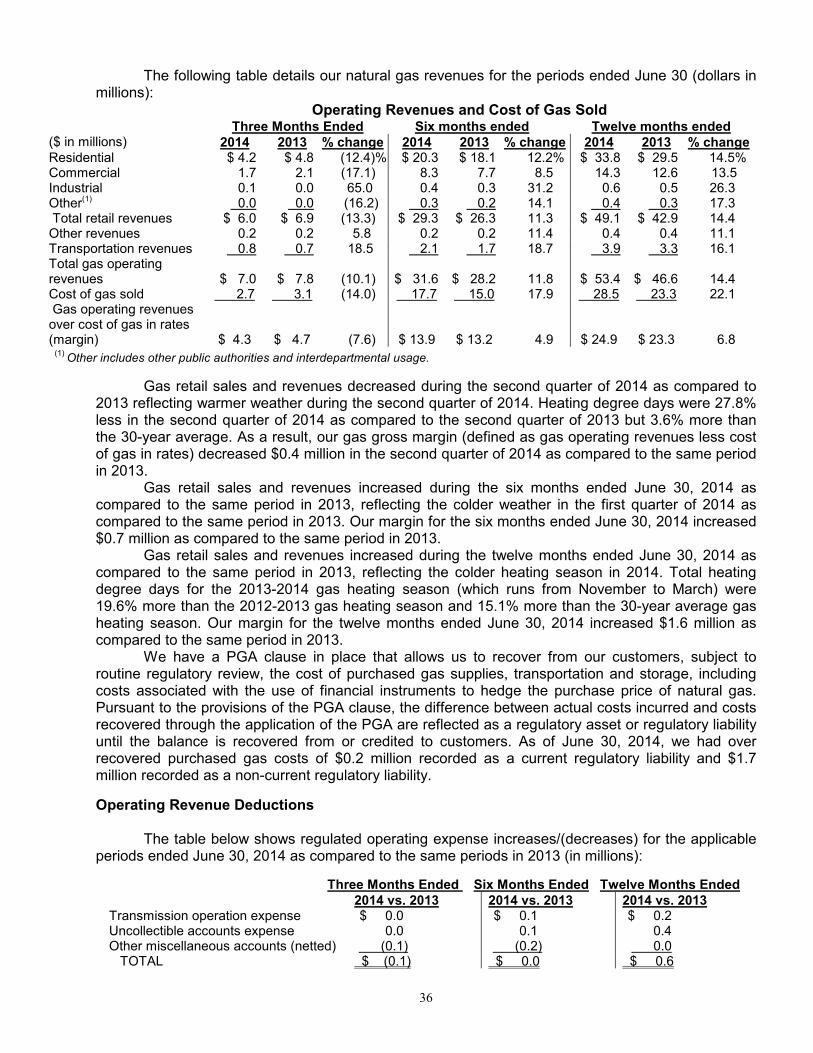
36
The following table details our natural gas revenues for the periods ended June 30 (dollars in millions): Operating Revenues and Cost of Gas Sold Three Months Ended Six months ended Twelve months ended
($ in millions) 2014 2013 % change 2014 2013 % change 2014 2013 % change Residential $ 4.2 $ 4.8 (12.4)% $ 20.3 $ 18.1 12.2% $ 33.8 $ 29.5 14.5% Commercial 1.7 2.1 (17.1) 8.3 7.7 8.5 14.3 12.6 13.5 Industrial 0.1 0.0 65.0 0.4 0.3 31.2 0.6 0.5 26.3 Other(1) 0.0 0.0 (16.2) 0.3 0.2 14.1 0.4 0.3 17.3 Total retail revenues $ 6.0 $ 6.9 (13.3) $ 29.3 $ 26.3 11.3 $ 49.1 $ 42.9 14.4 Other revenues 0.2 0.2 5.8 0.2 0.2 11.4 0.4 0.4 11.1 Transportation revenues 0.8 0.7 18.5 2.1 1.7 18.7 3.9 3.3 16.1 Total gas operating revenues
$ 7.0
$ 7.8
(10.1)
$ 31.6
$ 28.2
11.8
$ 53.4
$ 46.6
14.4
Cost of gas sold 2.7 3.1 (14.0) 17.7 15.0 17.9 28.5 23.3 22.1 Gas operating revenues over cost of gas in rates (margin)
$ 4.3
$ 4.7
(7.6)
$ 13.9
$ 13.2
4.9
$ 24.9
$ 23.3
6.8 (1)
Other includes other public authorities and interdepartmental usage.
Gas retail sales and revenues decreased during the second quarter of 2014 as compared to 2013 reflecting warmer weather during the second quarter of 2014. Heating degree days were 27.8% less in the second quarter of 2014 as compared to the second quarter of 2013 but 3.6% more than the 30-year average. As a result, our gas gross margin (defined as gas operating revenues less cost of gas in rates) decreased $0.4 million in the second quarter of 2014 as compared to the same period in 2013.
Gas retail sales and revenues increased during the six months ended June 30, 2014 as compared to the same period in 2013, reflecting the colder weather in the first quarter of 2014 as compared to the same period in 2013. Our margin for the six months ended June 30, 2014 increased $0.7 million as compared to the same period in 2013.
Gas retail sales and revenues increased during the twelve months ended June 30, 2014 as compared to the same period in 2013, reflecting the colder heating season in 2014. Total heating degree days for the 2013-2014 gas heating season (which runs from November to March) were 19.6% more than the 2012-2013 gas heating season and 15.1% more than the 30-year average gas heating season. Our margin for the twelve months ended June 30, 2014 increased $1.6 million as compared to the same period in 2013.
We have a PGA clause in place that allows us to recover from our customers, subject to routine regulatory review, the cost of purchased gas supplies, transportation and storage, including costs associated with the use of financial instruments to hedge the purchase price of natural gas. Pursuant to the provisions of the PGA clause, the difference between actual costs incurred and costs recovered through the application of the PGA are reflected as a regulatory asset or regulatory liability until the balance is recovered from or credited to customers. As of June 30, 2014, we had over recovered purchased gas costs of $0.2 million recorded as a current regulatory liability and $1.7 million recorded as a non-current regulatory liability.
Operating Revenue Deductions
The table below shows regulated operating expense increases/(decreases) for the applicable periods ended June 30, 2014 as compared to the same periods in 2013 (in millions):
Three Months Ended Six Months Ended Twelve Months Ended 2014 vs. 2013 2014 vs. 2013 2014 vs. 2013 Transmission operation expense $ 0.0 $ 0.1 $ 0.2 Uncollectible accounts expense 0.0 0.1 0.4 Other miscellaneous accounts (netted) (0.1) (0.2) 0.0 TOTAL $ (0.1) $ 0.0 $ 0.6
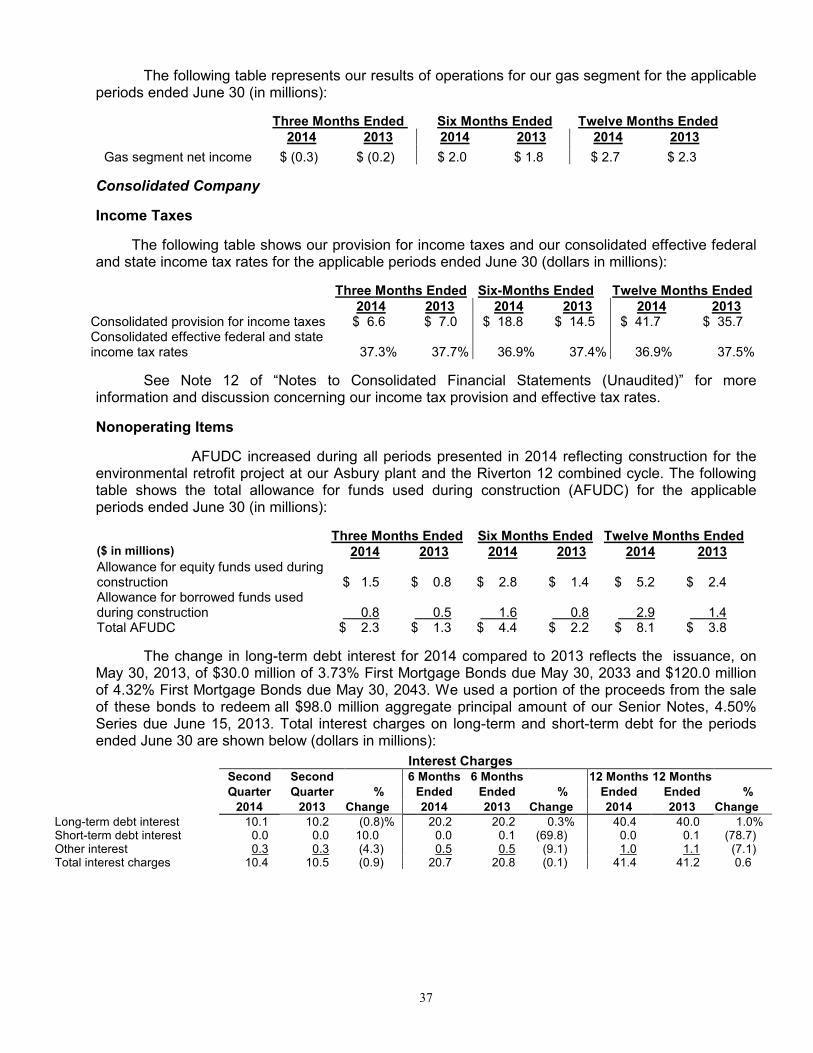
37
The following table represents our results of operations for our gas segment for the applicable periods ended June 30 (in millions):
Three Months Ended Six Months Ended Twelve Months Ended 2014 2013 2014 2013 2014 2013 Gas segment net income $ (0.3) $ (0.2) $ 2.0 $ 1.8 $ 2.7 $ 2.3
Consolidated Company
Income Taxes
The following table shows our provision for income taxes and our consolidated effective federal and state income tax rates for the applicable periods ended June 30 (dollars in millions):
Three Months Ended Six-Months Ended Twelve Months Ended 2014 2013 2014 2013 2014 2013 Consolidated provision for income taxes $ 6.6 $ 7.0 $ 18.8 $ 14.5 $ 41.7 $ 35.7 Consolidated effective federal and state income tax rates
37.3%
37.7%
36.9%
37.4%
36.9%
37.5%
See Note 12 of “Notes to Consolidated Financial Statements (Unaudited)” for more information and discussion concerning our income tax provision and effective tax rates.
Nonoperating Items
AFUDC increased during all periods presented in 2014 reflecting construction for the environmental retrofit project at our Asbury plant and the Riverton 12 combined cycle. The following table shows the total allowance for funds used during construction (AFUDC) for the applicable periods ended June 30 (in millions):
Three Months Ended Six Months Ended Twelve Months Ended ($ in millions) 2014 2013 2014 2013 2014 2013 Allowance for equity funds used during construction
$ 1.5
$ 0.8
$ 2.8
$ 1.4
$ 5.2
$ 2.4
Allowance for borrowed funds used during construction
0.8
0.5
1.6
0.8
2.9
1.4
Total AFUDC $ 2.3 $ 1.3 $ 4.4 $ 2.2 $ 8.1 $ 3.8
The change in long-term debt interest for 2014 compared to 2013 reflects the issuance, on May 30, 2013, of $30.0 million of 3.73% First Mortgage Bonds due May 30, 2033 and $120.0 million of 4.32% First Mortgage Bonds due May 30, 2043. We used a portion of the proceeds from the sale of these bonds to redeem all $98.0 million aggregate principal amount of our Senior Notes, 4.50% Series due June 15, 2013. Total interest charges on long-term and short-term debt for the periods ended June 30 are shown below (dollars in millions):
Interest Charges Second Second 6 Months 6 Months 12 Months 12 Months
Quarter Quarter % Ended Ended % Ended Ended %
2014 2013 Change 2014 2013 Change 2014 2013 Change
Long-term debt interest 10.1 10.2 (0.8)% 20.2 20.2 0.3% 40.4 40.0 1.0% Short-term debt interest 0.0 0.0 10.0 0.0 0.1 (69.8) 0.0 0.1 (78.7) Other interest 0.3 0.3 (4.3) 0.5 0.5 (9.1) 1.0 1.1 (7.1) Total interest charges 10.4 10.5 (0.9) 20.7 20.8 (0.1) 41.4 41.2 0.6

38
RATE MATTERS
We assess the need for rate relief in all of the jurisdictions we serve and file for such relief when necessary. Our rates for retail electric and natural gas services (other than specially negotiated retail rates for industrial or large commercial customers, which are subject to regulatory review and approval) are determined on a “cost of service” basis. Rates are designed to provide, after recovery of allowable operating expenses, an opportunity for us to earn a reasonable return on “rate base.” “Rate base” is generally determined by reference to the original cost (net of accumulated depreciation and amortization) of utility plant in service, subject to various adjustments for deferred taxes and other items. Over time, rate base is increased by additions to utility plant in service and reduced by depreciation, amortization and retirement of utility plant or write-off's as ordered by the utility commissions. In general, a request of new rates is made on the basis of a “rate base” as of a date prior to the date of the request and allowable operating expenses for a 12-month test period ended prior to the date of the request. Although the current rate making process provides recovery of some future changes in rate base and operating costs, it does not reflect all changes in costs for the period in which new retail rates will be in place. This results in a lag (commonly referred to as “regulatory lag”) between the time we incur costs and the time when we can start recovering the costs through rates.
The following table sets forth information regarding electric and water rate increases since January 1, 2011:
Jurisdiction
Date Requested
Annual Increase Granted
Percent Increase Granted
Date Effective
Missouri – Electric July 6, 2012 $ 27,500,000 6.78% April 1, 2013 Missouri – Water May 21, 2012 $ 450,000 25.5% November 23, 2012 Missouri – Electric September 28, 2010 $ 18,700,000 4.70% June 15, 2011 Kansas – Electric June 17, 2011 $ 1,250,000 5.20% January 1, 2012 Oklahoma – Electric June 30, 2011 $ 240,722 1.66% January 4, 2012 Oklahoma – Electric January 28, 2011 $ 1,063,100 9.32% March 1, 2011 Arkansas - Electric August 19, 2010 $ 2,104,321 19.00% April 13, 2011
On May 28, 2014, we filed a Notice of Intended Case Filing with the Missouri Public Service Commission (MPSC) of our intentions to file an electric rate case in Missouri as early as August 1, 2014. On December 3, 2013, we filed a request with the Arkansas Public Service Commission (APSC) for changes in rates for our Arkansas electric customers. We were seeking an annual increase in total revenue of approximately $2.2 million, or approximately 18%. The rate increase was requested to recover costs incurred to ensure continued reliable service for our customers, including capital investments, operating systems replacement costs and ongoing increases in other operation and maintenance expenses and capital costs. We reached an agreement with the parties in the case for an increase of $1.375 million, or approximately 11%. On May 20, 2014, we filed a settlement agreement with the APSC. The APSC held a hearing on the settlement agreement on July 22, 2014. On May 18, 2012, we filed a request with the Federal Energy Regulatory Commission (FERC) to implement a cost-based transmission formula rate (TFR). On June 13, 2013, we, the Kansas Corporation Commission and the cities of Monett, Mt. Vernon and Lockwood, Missouri and Chetopa, Kansas, filed a unanimous Settlement Agreement (Agreement) with the FERC. The Agreement includes a TFR that establishes an ROE of 10.0%. The FERC conditionally approved the Agreement on November 18, 2013, and we made a compliance filing with the FERC on December 18, 2013 in connection with this conditional approval. The FERC approved our compliance filing on June 12, 2014.
Our other rate cases, as we reported in our Annual Report on Form 10-K for the year ended December 31, 2013, remain unchanged. See Note 3, “Regulatory Matters” in our Annual Report on Form 10-K for the year ended December 31, 2013 for additional information.
39
MARKETS AND TRANSMISSION
Electric Segment
Day Ahead Market: On March 1, 2014, the SPP RTO implemented its Integrated Marketplace (or Day-Ahead Market), which replaced the Energy Imbalance Services (EIS) market. The SPP RTO created a single NERC-approved balancing authority (BA) that took over balancing authority responsibilities for its members, including Empire. The SPP BA is providing operational, economic and NERC Compliance benefits to our customers.
As part of the Integrated Marketplace, we and other SPP members are able to submit generation offers to sell power and bids to purchase power into the SPP market, the SPP serving as a centralized dispatch of SPP members’ generation resources. The SPP matches offers and bids based upon operating and reliability considerations. It is expected that 90%-95% of all next day generation needed throughout the SPP territory will be cleared through this Integrated Marketplace. We also acquire Transmission Congestion Rights (TCR) in an attempt to mitigate congestion costs associated with the power we will purchase from the SPP Integrated Market. The net financial effect of these Integrated Marketplace transactions are included in our fuel adjustment mechanisms.
Plum Point Transmission Delivery Costs: On December 19, 2013, Entergy integrated its generation, transmission, and load into the MISO regional transmission organization. Based on the current terms and conditions of MISO membership, Entergy’s participation in MISO will not be beneficial to our customers as it will significantly increase transmission delivery costs for our Plum Point power station as well as utilize our transmission system without compensation. In February 2014, the FERC granted a Request For Rehearing regarding the increased MISO transmission rate for Plum Point and established its own docket that was consolidated with the Entergy transmission formula rate docket. The consolidated dockets were set for settlement evidentiary hearings. Settlement discussions are ongoing.
SPP/Midcontinent Independent System Operator (MISO) Joint Operating Agreement: Prior to Entergy’s integration into MISO, the SPP filed a Petition for Review of FERC’s Orders on the interpretation of the SPP/MISO Joint Operating Agreement at the United States Court of Appeals for the District of Columbia (DC). In early December 2013, the DC Court vacated and remanded FERC’s Orders that agreed with MISO regarding interpretation of the Joint Operating Agreement to utilize SPP’s system to integrate Entergy into MISO. The SPP’s position is that MISO’s intentional and free use of the SPP transmission system was unjust and unreasonable and made unexecuted service agreement filings at the FERC in February 2014 to initiate billings to MISO. SPP members have intervened in the SPP’s Petition and are actively involved in the SPP stakeholder processes and other FERC dockets to address our concerns. In March 2014, the FERC issued key Orders accepting the SPP’s filing to collect transmission revenues on our behalf, subject to refund, and established a settlement hearing process for resolution of the SPP/MISO dispute. Although the FERC’s order is positive, the transmission revenue financial impact and realization of such increased revenues due to MISO’s use of the SPP transmission system, including our system, is uncertain at this time and may take several months for a FERC acceptance of a resolution between the parties.
Information concerning recent and pending SPP RTO and other FERC activities can be found under Note 3, “Regulatory Matters – Markets and Transmission” in our Annual Report on Form 10-K for the year ended December 31, 2013.
LIQUIDITY AND CAPITAL RESOURCES
Overview. Our primary sources of liquidity are cash provided by operating activities, short-term borrowings under our commercial paper program (which is supported by our credit facilities) and borrowings from our unsecured revolving credit facility. We raise funds as needed from the debt and equity capital markets to fund our liquidity and capital resource needs. Our issuance of various securities, including equity, long-term and short-term debt, is subject to customary approval or authorization by state and federal regulatory bodies including state public

40
service commissions and the SEC. We believe the cash provided by operating activities, together with the amounts available to us under our credit facilities and the issuance of debt and equity securities, will allow us to meet our needs for working capital, pension contributions, our continuing construction expenditures, anticipated debt redemptions, interest payments on debt obligations, dividend payments and other cash needs through the next several years. See “Capital Requirements and Investing Activities” below for further information.
We will continue to evaluate our need to increase available liquidity based on our view of working capital requirements, including the timing of our construction programs and other factors. See Item 1A, “Risk Factors” in our Annual Report on Form 10-K for the year ended December 31, 2013 for additional information on items that could impact our liquidity and capital resource requirements. The following table provides a summary of our operating, investing and financing activities for the six months ended June 30 (in millions):
Summary of Cash Flows
2014 2013 Change
Cash provided by/(used in): Operating activities $ 69.0 $ 71.0 $ (2.0) Investing activities (100.4) (73.2) (27.2) Financing activities 30.9 9.7 21.2 Net change in cash and cash equivalents $ (0.5) $ 7.5 $ (8.0)
Cash flow from Operating Activities
We prepare our statement of cash flows using the indirect method. Under this method, we reconcile net income to cash flows from operating activities by adjusting net income for those items that impact net income but may not result in actual cash receipts or payments during the period. These reconciling items include depreciation and amortization, pension costs, deferred income taxes, equity AFUDC, changes in commodity risk management assets and liabilities and changes in the consolidated balance sheet for working capital from the beginning to the end of the period. Period-over-period changes in our operating cash flows are attributable primarily to working capital changes resulting from the impact of weather, the timing of customer collections, payments for natural gas and coal purchases, the effects of deferred fuel recoveries and the size and timing of pension contributions. The increase or decrease in natural gas prices directly impacts the cost of gas stored in inventory.
Six Months Ended June 30, 2014 Compared to 2013. During the six months ended June 30, 2014, our net cash flows provided from operating activities decreased $2.0 million or 2.8% from 2013. This change resulted primarily from the following:
• Increase in net income - $7.8 million. • Increased plant in service depreciation - $2.2 million and fuel adjustment amortizations - $1.8
million. • Increased cash flow from changes in property tax accruals - $2.6 million. • Increased cash flow from fuel adjustment deferrals - $1.4 million. • Changes related to other post-employment benefits - $1.0 million. • Adjustment to cash flow for increased AFUDC - $(1.4) million. • Cash flow adjustments related to the 2013 Missouri electric rate case for a loss on plant
disallowance - $(2.4) million and a reversal of a prior period gain on the sale of assets - $(1.2) million.
• Lower cash flow adjustments for deferred taxes mostly based on the expiration of bonus depreciation - $(8.6) million.
• Cash outflows resulting from settlements of asset retirement obligations - $(1.2) million.

41
Capital Requirements and Investing Activities
Our net cash flows used in investing activities increased $27.2 million during the six months ended June 30, 2014 as compared to the same period in 2013. Our capital expenditures incurred totaled approximately $96.9 million during the six months ended June 30, 2014 compared to $76.2 million for the six months ended June 30, 2013. The increase was primarily the result of an increase in new generation construction due to the Riverton 12 combined cycle construction. A breakdown of the capital expenditures for the six months ended June 30, 2014 and 2013 is as follows (in millions):
Capital Expenditures 2014 2013 Distribution and transmission system additions $ 32.4 $ 27.0 New Generation – Riverton 12 combined cycle 29.6 1.1 Additions and replacements – electric plant 23.0 40.2 Storms 1.9 0.2 Transportation 0.4 0.4 Gas segment additions and replacements 4.4 2.1 Other (including retirements and salvage -net)
(1) 4.4 4.3
Subtotal 96.1 75.3 Non-regulated capital expenditures (primarily fiber optics) 0.8 0.9 Subtotal capital expenditures incurred
(2) 96.9 76.2
Adjusted for capital expenditures payable (3) (1.3) (0.4)
Total cash outlay $ 95.6 $ 75.8 (1)
Other includes equity AFUDC of $(2.8) million and $(1.4) million for 2014 and 2013, respectively. (2)
Expenditures incurred represent the total cost for work completed for the projects during the reporting period. Discussion of capital expenditures throughout this 10-Q is presented on this basis. These capital expenditures include AFUDC, capital expenditures to retire assets and benefits from salvage. (3)
The amount of expenditures paid/(unpaid) at the end of the reporting period to adjust to actual cash outlay reflected in the Investing Activities section of the Statement of Cash Flows.
Approximately 7.0% of our cash requirements for capital expenditures during the second quarter of 2014 were satisfied from internally generated funds (funds provided by operating activities less dividends paid). We estimate that internally generated funds (funds provided by operating activities less dividends paid) will provide approximately 45.8% of the funds required for the remainder of our budgeted 2014 capital expenditures. We intend to utilize short-term debt to finance any additional amounts needed beyond those provided by operating activities for such capital expenditures. In addition, we plan to issue private placement debt with a delayed settlement option in the near term. We expect this financing to be in the range of $60 million. If additional financing is needed, we intend to utilize a combination of debt and equity securities. For further information see Note 6 of “Notes to Consolidated Financial Statements (Unaudited).”
Financing Activities
Our net cash flows provided by financing activities was $30.9 million in the six months ended June 30, 2014, an increase of $21.2 million as compared to the six months ended June 30, 2013, primarily due to the following:
• Issuance of $48.5 million in short-term debt in the six months ended June 30, 2014 as compared to repayment of $24.0 million in short-term debt in the six months ended June 30, 2013.
• No first mortgage bonds issued in the six months ended June 30, 2014 compared to $150.0 million issued in the six months ended June 30, 2013.
• No repayment of senior notes in the six months ended June 30, 2014 compared to $98.0 million of senior notes repaid in the six months ended June 30, 2013.

42
Shelf Registration
We have a $200.0 million shelf registration statement with the SEC, effective December 13, 2013, covering our common stock, unsecured debt securities, preference stock, and first mortgage bonds. We have received regulatory approval for the issuance of securities under this shelf from all four state jurisdictions in our electric service territory, but we may only issue up to $150 million of such securities in the form of first mortgage bonds. We plan to use proceeds from offerings made pursuant to this shelf to fund capital expenditures, refinance existing debt or general corporate needs during the three-year effective period.
Credit Agreements
On January 17, 2012, we entered into the Third Amended and Restated Unsecured Credit Agreement which amended and restated our Second Amended and Restated Unsecured Credit Agreement dated January 26, 2010. This agreement extended the termination date of the revolving credit facility from January 26, 2013 to January 17, 2017. The agreement also removed the letter of credit facility and includes a swingline loan facility with a $15 million swingline loan sublimit. The aggregate amount of the revolving credit commitments remains $150 million, inclusive of the $15 million swingline loan sublimit. In addition, the pricing and fees under the facility were amended. Interest on borrowings under the facility accrues at a rate equal to, at our option, (i) the highest of (A) the bank’s prime commercial rate, (B) the federal funds effective rate plus 0.5% or (C) one month LIBOR plus 1.0%, plus a margin or (ii) one month, two month or three month LIBOR, in each case, plus a margin. Each margin is based on our current credit ratings and the pricing schedule in the facility. As of the date hereof, and based on our current credit ratings, the LIBOR margin under the facility is 1.25%. A facility fee is payable quarterly on the full amount of the commitments under the facility based on our current credit ratings, which fee is currently 0.20%. In addition, upon entering into the amended and restated facility, we paid an upfront fee to the revolving credit banks of $262,500 in the aggregate. There were no other material changes to the terms of the facility.
The facility is used for working capital, general corporate purposes and to back-up our use of commercial paper. This facility requires our total indebtedness to be less than 62.5% of our total capitalization at the end of each fiscal quarter and our EBITDA (defined as net income plus interest, taxes, depreciation and amortization) to be at least two times our interest charges for the trailing four fiscal quarters at the end of each fiscal quarter. Failure to maintain these ratios will result in an event of default under the credit facility and will prohibit us from borrowing funds thereunder. As of June 30, 2014, we are in compliance with these ratios. Our total indebtedness is 51.0% of our total capitalization as of June 30, 2014 and our EBITDA is 5.9 times our interest charges. This credit facility is also subject to cross-default if we default on in excess of $10 million in the aggregate on our other indebtedness. This arrangement does not serve to legally restrict the use of our cash in the normal course of operations. There were no outstanding borrowings under this agreement at June 30, 2014. However, $52.5 million was used to back up our outstanding commercial paper.
EDE Mortgage Indenture
The principal amount of all series of first mortgage bonds outstanding at any one time under the EDE Mortgage is limited by terms of the mortgage to $1.0 billion. Substantially all of the property, plant and equipment of The Empire District Electric Company (but not its subsidiaries) is subject to the lien of the EDE Mortgage. Restrictions in the EDE mortgage bond indenture could affect our liquidity. The EDE Mortgage contains a requirement that for new first mortgage bonds to be issued, our net earnings (as defined in the EDE Mortgage) for any twelve consecutive months within the fifteen months preceding issuance must be two times the annual interest requirements (as defined in the EDE Mortgage) on all first mortgage bonds then outstanding and on the prospective issue of new first mortgage bonds. Our earnings for the twelve months ended June 30, 2014 would permit us to issue approximately $719.7 million of new first mortgage bonds based on this test with an assumed interest rate of 5.5%. In addition to the interest coverage requirement, the EDE Mortgage provides that new bonds must be issued against, among other things, retired bonds or 60% of net property

43
additions. At June 30, 2014, we had retired bonds and net property additions which would enable the issuance of at least $899.3 million principal amount of bonds if the annual interest requirements are met. However, based on the $1 billion limit on the principal amount of first mortgage bonds outstanding set forth by the EDE mortgage, and our current level of outstanding first mortgage bonds, we are limited to the issuance of $417.0 million of new first mortgage bonds. As of June 30, 2014, we are in compliance with all restrictive covenants of the EDE Mortgage.
EDG Mortgage Indenture
The principal amount of all series of first mortgage bonds outstanding at any one time under the EDG Mortgage is limited by terms of the mortgage to $300.0 million. Substantially all of the property, plant and equipment of The Empire District Gas Company is subject to the lien of the EDG Mortgage. The EDG Mortgage contains a requirement that for new first mortgage bonds to be issued, the amount of such new first mortgage bonds shall not exceed 75% of the cost of property additions acquired after the date of the Missouri Gas acquisition. The mortgage also contains a limitation on the issuance by EDG of debt (including first mortgage bonds, but excluding short-term debt incurred in the ordinary course under working capital facilities) unless, after giving effect to such issuance, EDG’s ratio of EBITDA (defined as net income plus interest, taxes, depreciation, amortization and certain other non-cash charges) to interest charges for the most recent four fiscal quarters is at least 2.0 to 1.0. As of June 30, 2014, this test would allow us to issue approximately $18.8 million principal amount of new first mortgage bonds at an assumed interest rate of 5.5%.
Credit Ratings
Currently, our corporate credit ratings and the ratings for our securities are as follows: Fitch Moody’s Standard & Poor’s Corporate Credit Rating n/r* Baa1 BBB EDE First Mortgage Bonds BBB+ A2 A- Senior Notes BBB Baa1 BBB Commercial Paper F3 P-2 A-2 Outlook Stable Stable Stable
*Not rated
On January 30, 2014, Moody’s upgraded our corporate credit rating to Baa1 from Baa2, senior secured debt to A2 from A3, senior unsecured debt to Baa1 from Baa2 and affirmed our commercial paper rating at P-2. Standard & Poor’s and Fitch reaffirmed our ratings on March 20, 2014 and June 11, 2014, respectively. A security rating is not a recommendation to buy, sell or hold securities. Each rating is subject to revision or withdrawal at any time by the assigning rating organization. Each security rating agency has its own methodology for assigning ratings, and, accordingly, each rating should be considered independently of all other ratings.
CONTRACTUAL OBLIGATIONS
Our contractual obligations have not materially changed at June 30, 2014, compared to December 31, 2013. See “Contractual Obligations” in our Annual Report on Form 10-K for the year ended December 31, 2013.
DIVIDENDS
Holders of our common stock are entitled to dividends if declared by the Board of Directors, out of funds legally available therefore, subject to the prior rights of holders of any outstanding cumulative preferred stock and preference stock. Payment of dividends is determined by our Board of Directors after considering all relevant factors, including the amount of our retained earnings (which is essentially our accumulated net income less dividend payouts). A reduction of our dividend per share, partially or in whole, could have an adverse effect on our common stock price.
44
OFF-BALANCE SHEET ARRANGEMENTS
We have no off-balance sheet arrangements that have or are reasonably likely to have a current or future effect on our financial condition, changes in financial condition, revenues or expenses, results of operations, liquidity, capital expenditures or capital resources, other than operating leases entered into in the normal course of business.
CRITICAL ACCOUNTING POLICIES AND ESTIMATES
See “Item 7 – Management’s Discussion and Analysis of Financial Condition and Results of Operations” in our Annual Report on Form 10-K for the year ended December 31, 2013 for a discussion of additional critical accounting policies and estimates. There were no changes in these policies or estimates in the quarter ended June 30, 2014.
RECENTLY ISSUED ACCOUNTING STANDARDS
See Note 2 of “Notes to Consolidated Financial Statements (Unaudited)”.
Item 3. Quantitative and Qualitative Disclosures about Market Risk
Our fuel procurement activities involve primary market risk exposures, including commodity price risk and credit risk. Commodity price risk is the potential adverse price impact related to the fuel procurement for our generating units. Credit risk is the potential adverse financial impact resulting from non-performance by a counterparty of its contractual obligations. Additionally, we are exposed to interest rate risk which is the potential adverse financial impact related to changes in interest rates.
Market Risk and Hedging Activities. Prices in the wholesale power markets often are extremely volatile. This volatility impacts our cost of power purchased and our participation in energy trades. If we were unable to generate an adequate supply of electricity for our customers, we would attempt to purchase power from others. Such supplies are not always available. In addition, congestion on the transmission system can limit our ability to make purchases from (or sell into) the wholesale markets. We engage in physical and financial trading activities with the goals of reducing risk from market fluctuations. In accordance with our established Energy Risk Management Policy, which typically includes entering into various derivative transactions, we attempt to mitigate our commodity market risk. Derivatives are utilized to manage our gas commodity market risk. We also acquire Transmission Congestion Rights (TCR) in an attempt to lessen the cost of power we purchase from the SPP Integrated Market due to congestion costs. See Note 4 of "Notes to Consolidated Financial Statements (Unaudited)" for further information.
Commodity Price Risk. We are exposed to the impact of market fluctuations in the price and transportation costs of coal, natural gas, and electricity and employ established policies and procedures to manage the risks associated with these market fluctuations, including utilizing derivatives.
We satisfied 65.8% of our 2013 generation fuel supply need through coal. Approximately 96% of our 2013 coal supply was Western coal. We have contracts and binding proposals to supply a portion of the fuel for our coal plants through 2016. These contracts satisfy approximately 95% of our anticipated fuel requirements for 2014, 58% for 2015, 39% for 2016 and 19% for 2017 for our Asbury coal plant. In order to manage our exposure to fuel prices, future coal supplies will be acquired using a combination of short-term and long-term contracts. We are exposed to changes in market prices for natural gas we must purchase to run our combustion turbine generators. Our natural gas procurement program is designed to manage our costs to avoid volatile natural gas prices. We enter into physical forward and financial derivative contracts with counterparties relating to our future natural gas requirements that lock in prices (with respect to predetermined percentages of our expected future natural gas needs) in an attempt to lessen the volatility in our fuel expenditures and improve predictability. As of June 30, 2014, 66%, or
45
4.2 million Dths’s, of our anticipated volume of natural gas usage for our electric operations for the remainder of 2014 is hedged. Based on our expected natural gas purchases for our electric operations for the next twelve months, if average natural gas prices should increase 10% more than the price at June 30, 2014, our natural gas expenditures would increase by approximately $1.8 million based on our June 30, 2014 total hedged positions for the next twelve months. However, such an increase would be probable of recovery through fuel adjustment mechanisms in all of our jurisdictions, which significantly reduces the impact of fluctuating fuel costs.
We attempt to mitigate a portion of our natural gas price risk associated with our gas segment using physical forward purchase agreements, storage and derivative contracts. As of June 30, 2014, we have 0.8 million Dths in storage on the three pipelines that serve our customers. This represents 39% of our storage capacity. We have an additional 0.1 million Dths hedged through financial derivatives and physical contracts.
See Note 4 of “Notes to Consolidated Financial Statements (Unaudited)” for further information.
Credit Risk. In order to minimize overall credit risk, we maintain credit policies, including the evaluation of counterparty financial condition and the use of standardized agreements that facilitate the netting of cash flows associated with a single counterparty. See Note 4 of “Notes to Consolidated Financial Statements (Unaudited)” regarding agreements containing credit risk contingent features. In addition, certain counterparties make available collateral in the form of cash held as margin deposits as a result of exceeding agreed-upon credit exposure thresholds or may be required to prepay the transaction. Conversely, we are required to post collateral with counterparties at certain thresholds, which is typically the result of changes in commodity prices. Amounts reported as margin deposit liabilities represent counterparty funds we hold that result from various trading counterparties exceeding agreed-upon credit exposure thresholds. Amounts reported as margin deposit assets represent our funds held on deposit for our NYMEX contracts with our broker and other financial contracts with other counterparties that resulted from us exceeding agreed-upon credit limits established by the counterparties. The following table depicts our margin deposit assets at June 30, 2014 and December 31, 2013(in millions).
June 30, 2014 December 31, 2013 Margin deposit assets $ 3.5 $ 5.2
There were no margin deposit liabilities at these dates. Our exposure to credit risk is concentrated primarily within our fuel procurement process, as
we transact with a small group of counterparties and transactions may involve large notional volumes and potentially volatile commodity prices. Below is a table showing our net credit exposure at June 30, 2014, reflecting that our counterparties are exposed to Empire for the net unrealized mark-to-market losses for physical forward and financial natural gas contracts carried at fair value(in millions).
Net unrealized mark-to-market losses for physical forward natural gas contracts $ 0.1 Net unrealized mark-to-market losses for financial natural gas contracts 2.8 Net credit exposure $ 2.9
The $2.8 million net unrealized mark-to-market loss for financial natural gas contracts is comprised entirely of $2.8 million for which our counterparties are exposed to Empire for unrealized losses. We are holding no collateral from any counterparty since they are below the $10.0 million mark-to-market collateral threshold in our agreements. As noted above, as of June 30, 2014, we have $3.5 million on deposit for NYMEX contract exposure to Empire, of which $3.3 million represents our collateral requirement. If NYMEX gas prices decreased 25% from their June 30,
2014 levels, our
collateral requirement would increase $11.3 million. If these prices increased 25%, our collateral
46
requirement would decrease $1.6 million. Our other counterparties would not be required to post collateral with Empire.
We sell electricity and gas and provide distribution and transmission services to a diverse group of customers, including residential, commercial and industrial customers. Credit risk associated with trade accounts receivable from energy customers is limited due to the large number of customers. In addition, we enter into contracts with various companies in the energy industry for purchases of energy-related commodities, including natural gas in our fuel procurement process.
Interest Rate Risk. We are exposed to changes in interest rates as a result of financing through our issuance of commercial paper and other short-term debt. We manage our interest rate exposure by limiting our variable-rate exposure (applicable to commercial paper and borrowings under our unsecured credit agreement) to a certain percentage of total capitalization, as set by policy, and by monitoring the effects of market changes in interest rates. If market interest rates average 1% more in 2014 than in 2013, our interest expense would increase, and income before taxes would decrease by less than $0.3 million. This amount has been determined by considering the impact of the hypothetical interest rates on our highest month-end commercial paper balance for 2013. These analyses do not consider the effects of the reduced level of overall economic activity that could exist in such an environment. In the event of a significant change in interest rates, management would likely take actions to further mitigate its exposure to the change. However, due to the uncertainty of the specific actions that would be taken and their possible effects, the sensitivity analysis assumes no changes in our financial structure.
Item 4. Controls and Procedures
As of the end of the period covered by this report, an evaluation was carried out, under the supervision and with the participation of our management, including our Chief Executive Officer and Chief Financial Officer, of the effectiveness of the design and operation of our disclosure controls and procedures (as such term is defined in Rule 13a-15(e) of the Securities Exchange Act of 1934). Based upon that evaluation, the Chief Executive Officer and Chief Financial Officer concluded that our disclosure controls and procedures were effective as of June 30, 2014. There have been no changes in our internal control over financial reporting that occurred during the second quarter of 2014 that have materially affected, or are reasonably likely to materially affect, our internal control over financial reporting.
PART II. OTHER INFORMATION Item 1. Legal Proceedings
See Note 7 of “Notes to Consolidated Financial Statements (Unaudited)” under “Legal Proceedings”, which description is incorporated herein by reference. Item 1A. Risk Factors. There have been no material changes to the factors disclosed in Part I, Item 1-A. Risk Factors in our Annual Report on Form 10-K for the year ended December 31, 2013.
Item 5. Other Information. For the twelve months ended June 30, 2014, our ratio of earnings to fixed charges was 3.17x. See Exhibit (12) hereto.

47
Item 6. Exhibits. (a) Exhibits.
(10)(a) Amended and Restated Employee Stock Purchase Plan (incorporated by reference to Appendix A to the definitive proxy statement filed pursuant to Regulation 14A on March 19, 2014, File No. 1-03368).
(10)(b) 2015 Stock Incentive Plan (incorporated by reference to Appendix B to the definitive proxy statement filed pursuant to Regulation 14A on March 19, 2014, File No. 1-03368).
(10)(c) Amended and Restated Stock Unit Plan for Directors (incorporated by reference to Appendix C to the definitive proxy statement filed pursuant to Regulation 14A on March 19, 2014, File No. 1-03368). (12) Computation of Ratio of Earnings to Fixed Charges.
(31)(a) Certification of Chief Executive Officer pursuant to Section 302 of the Sarbanes-Oxley Act of 2002.
(31)(b) Certification of Chief Financial Officer pursuant to Section 302 of the Sarbanes-Oxley Act of 2002.
(32)(a) Certification of Chief Executive Officer pursuant to 18 U.S.C. Section 1350, as adopted pursuant to Section 906 of the Sarbanes-Oxley Act of 2002.*
(32)(b) Certification of Chief Financial Officer pursuant to 18 U.S.C. Section 1350, as adopted pursuant to Section 906 of the Sarbanes-Oxley Act of 2002.*
(101) The following financial information from The Empire District Electric Company’s Quarterly Report on Form 10-Q for the period ended June 30, 2014, filed with the SEC on August 8, 2013, formatted in Extensible Business Reporting Language (XBRL): (i) the Consolidated Statements of Income for the three, six and twelve month periods ended June 30, 2014 and 2013, (ii) the Consolidated Balance Sheets at June 30, 2014 and December 31, 2013, (iii) the Consolidated Statements of Cash Flows for the six-month periods ended June 30, 2014 and 2013, and (iv) Notes to Consolidated Financial Statements.**
*This certification accompanies this Report pursuant to Section 906 of the Sarbanes-Oxley Act of 2002 and shall not be deemed filed by the Company for purposes of Section 18 or any other provision of the Securities Exchange Act of 1934, as amended.
**Pursuant to Rule 406T of Regulation S-T, the XBRL related information in Exhibit 101 to this Quarterly Report on Form 10-Q shall not be deemed to be “filed” for purposes of Section 18 of the Exchange Act, or otherwise subject to the liability of that section, and shall not be deemed incorporated by reference into, or part of a registration statement, prospectus or other document filed under the Securities Act of 1933, as amended or the Exchange Act of 1934, as amended except as shall be expressly set forth by specific reference in such filings.

48
SIGNATURES
Pursuant to the requirements of the Securities Exchange Act of 1934, the Registrant has duly caused this report to be signed on its behalf by the undersigned thereunto duly authorized.
THE EMPIRE DISTRICT ELECTRIC COMPANY Registrant
By /s/ Laurie A. Delano Laurie A. Delano
Vice President – Finance and Chief Financial Officer
By /s/ Robert W. Sager Robert W. Sager
Controller, Assistant Secretary and Assistant Treasurer August 8, 2014
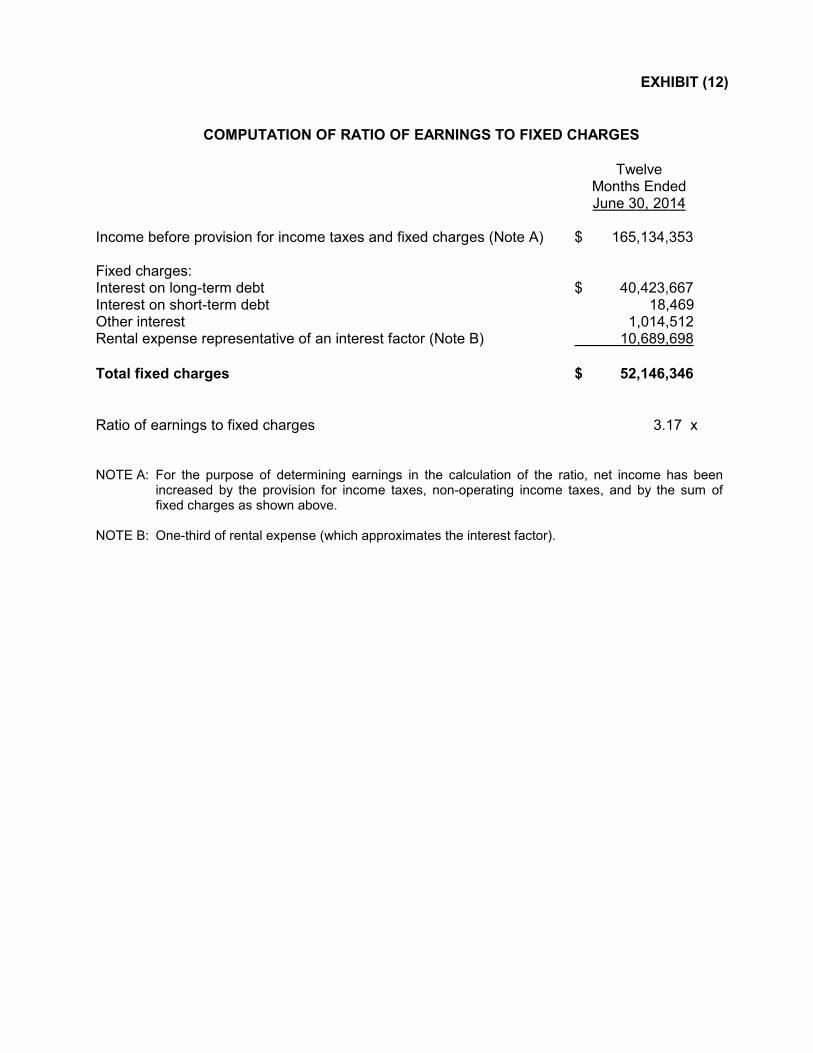
EXHIBIT (12)
COMPUTATION OF RATIO OF EARNINGS TO FIXED CHARGES
Twelve Months Ended June 30, 2014 Income before provision for income taxes and fixed charges (Note A) $ 165,134,353 Fixed charges: Interest on long-term debt $ 40,423,667 Interest on short-term debt 18,469 Other interest 1,014,512 Rental expense representative of an interest factor (Note B) 10,689,698 Total fixed charges $ 52,146,346 Ratio of earnings to fixed charges 3.17 x NOTE A: For the purpose of determining earnings in the calculation of the ratio, net income has been
increased by the provision for income taxes, non-operating income taxes, and by the sum of fixed charges as shown above.
NOTE B: One-third of rental expense (which approximates the interest factor).

Exhibit (31)(a)
CERTIFICATION OF CHIEF EXECUTIVE OFFICER PURSUANT TO SECTION 302 OF THE SARBANES-OXLEY ACT OF 2002
I, Bradley P.Beecher, certify that: 1. I have reviewed this quarterly report on Form 10-Q of The Empire District Electric Company; 2. Based on my knowledge, this report does not contain any untrue statement of a material fact or omit to state a material fact necessary to make the statements made, in light of the circumstances under which such statements were made, not misleading with respect to the period covered by this report; 3. Based on my knowledge, the financial statements, and other financial information included in this report, fairly present in all material respects the financial condition, results of operations and cash flows of the registrant as of, and for, the periods presented in this report; 4. The registrant’s other certifying officer and I are responsible for establishing and maintaining disclosure controls and procedures (as defined in Exchange Act Rules 13a-15(e) and 15d-15(e)) and internal control over financial reporting (as defined in Exchange Act Rules 13a-15(f) and 15d-15(f)) for the registrant and have:
a) Designed such disclosure controls and procedures, or caused such disclosure controls and procedures to be designed under our supervision, to ensure that material information relating to the registrant, including its consolidated subsidiaries, is made known to us by others within those entities, particularly during the period in which this report is being prepared;
b) Designed such internal control over financial reporting, or caused such internal control over
financial reporting to be designed under our supervision, to provide reasonable assurance regarding the reliability of financial reporting and the preparation of financial statements for external purposes in accordance with generally accepted accounting principles;
c) Evaluated the effectiveness of the registrant’s disclosure controls and procedures and
presented in this report our conclusions about the effectiveness of the disclosure controls and procedures as of the end of the period covered by this report based on such evaluation; and
d) Disclosed in this report any change in the registrant’s internal control over financial reporting
that occurred during the registrant’s most recent fiscal quarter (the registrant’s fourth fiscal quarter in the case of an annual report) that has materially affected, or is reasonably likely to materially affect, the registrant’s internal control over financial reporting; and
5. The registrant’s other certifying officer and I have disclosed, based on our most recent evaluation of internal control over financial reporting, to the registrant’s auditors and the audit committee of the registrant’s board of directors (or persons performing the equivalent functions):
a) All significant deficiencies and material weaknesses in the design or operation of internal
control over financial reporting, which are reasonably likely to adversely affect the registrant’s ability to record, process, summarize and report financial information; and
b) Any fraud, whether or not material, that involves management or other employees who have a
significant role in the registrant’s internal control over financial reporting.
Date: August 8, 2014
By: /s/ Bradley P. Beecher Name: Bradley P.Beecher Title: President and Chief Executive Officer

Exhibit (31)(b)
CERTIFICATION OF CHIEF FINANCIAL OFFICER PURSUANT TO SECTION 302 OF THE SARBANES-OXLEY ACT OF 2002
I, Laurie A. Delano, certify that: 1. I have reviewed this quarterly report on Form 10-Q of The Empire District Electric Company; 2. Based on my knowledge, this report does not contain any untrue statement of a material fact or omit to state a material fact necessary to make the statements made, in light of the circumstances under which such statements were made, not misleading with respect to the period covered by this report; 3. Based on my knowledge, the financial statements, and other financial information included in this report, fairly present in all material respects the financial condition, results of operations and cash flows of the registrant as of, and for, the periods presented in this report; 4. The registrant’s other certifying officer and I are responsible for establishing and maintaining disclosure controls and procedures (as defined in Exchange Act Rules 13a-15(e) and 15d-15(e)) and internal control over financial reporting (as defined in Exchange Act Rules 13a-15(f) and 15d-15(f)) for the registrant and have:
a) Designed such disclosure controls and procedures, or caused such disclosure controls and
procedures to be designed under our supervision, to ensure that material information relating to the registrant, including its consolidated subsidiaries, is made known to us by others within those entities, particularly during the period in which this report is being prepared;
b) Designed such internal control over financial reporting, or caused such internal control over
financial reporting to be designed under our supervision, to provide reasonable assurance regarding the reliability of financial reporting and the preparation of financial statements for external purposes in accordance with generally accepted accounting principles;
c) Evaluated the effectiveness of the registrant’s disclosure controls and procedures and
presented in this report our conclusions about the effectiveness of the disclosure controls and procedures as of the end of the period covered by this report based on such evaluation; and
d) Disclosed in this report any change in the registrant’s internal control over financial reporting
that occurred during the registrant’s most recent fiscal quarter (the registrant’s fourth fiscal quarter in the case of an annual report) that has materially affected, or is reasonably likely to materially affect, the registrant’s internal control over financial reporting; and
5. The registrant’s other certifying officer and I have disclosed, based on our most recent evaluation of internal control over financial reporting, to the registrant’s auditors and the audit committee of the registrant’s board of directors (or persons performing the equivalent functions):
a) All significant deficiencies and material weaknesses in the design or operation of internal
control over financial reporting which are reasonably likely to adversely affect the registrant’s ability to record, process, summarize and report financial information; and
b) Any fraud, whether or not material, that involves management or other employees who have a
significant role in the registrant’s internal control over financial reporting.
Date: August 8, 2014
By: /s/ Laurie A. Delano Name: Laurie A. Delano Title: Vice President - Finance and Chief Financial Officer
Exhibit (32)(a)
Certification Pursuant to 18 U.S.C. Section 1350, As Adopted Pursuant to Section 906 of the Sarbanes-Oxley Act of 2002
In connection with the Quarterly Report of The Empire District Electric Company (the “Company”) on Form 10-Q for the period ending June 30, 2014 as filed with the Securities and Exchange Commission on the date hereof (the “Report”), Bradley P. Beecher, as Chief Executive Officer of the Company, certifies, pursuant to 18 U.S.C. Section 1350, as adopted pursuant to Section 906 of the Sarbanes-Oxley Act of 2002, that: (1) The Report fully complies with the requirements of section 13(a) of the Securities Exchange Act of 1934; and (2) The information contained in the Report fairly presents, in all material respects, the financial condition and result of operations of the Company. By /s/ Bradley P. Beecher Name: Bradley P. Beecher Title: President and Chief Executive Officer Date: August 8, 2014 A signed original of this written statement required by Section 906 or other document authenticating, acknowledging or otherwise adopting the signature that appears in typed form within the electronic version of this written statement required by Section 906, has been provided to The Empire District Electric Company and will be retained by The Empire District Electric Company and furnished to the Securities and Exchange Commission or its staff upon request.

Exhibit (32)(b)
Certification Pursuant to 18 U.S.C. Section 1350,
As Adopted Pursuant to Section 906 of the Sarbanes-Oxley Act of 2002 In connection with the Quarterly Report of The Empire District Electric Company (the “Company”) on Form 10-Q for the period ending June 30, 2014 as filed with the Securities and Exchange Commission on the date hereof (the “Report”), Laurie A. Delano, as Chief Financial Officer of the Company, certifies, pursuant to 18 U.S.C. Section 1350, as adopted pursuant to Section 906 of the Sarbanes-Oxley Act of 2002, that: (1) The Report fully complies with the requirements of section 13(a) of the Securities Exchange Act of 1934; and (2) The information contained in the Report fairly presents, in all material respects, the financial condition and result of operations of the Company. By /s/ Laurie A. Delano Name: Laurie A. Delano Title: Vice President - Finance and Chief Financial Officer Date: August 8, 2014 A signed original of this written statement required by Section 906 or other document authenticating, acknowledging or otherwise adopting the signature that appears in typed form within the electronic version of this written statement required by Section 906, has been provided to The Empire District Electric Company and will be retained by The Empire District Electric Company and furnished to the Securities and Exchange Commission or its staff upon request.

UNITED STATES SECURITIES AND EXCHANGE COMMISSION
WASHINGTON, D.C. 20549
FORM 10-Q
(Mark One)
Quarterly report pursuant to Section 13 or 15(d) of the Securities Exchange Act of 1934
For the quarterly period ended September 30, 2013 or
� Transition report pursuant to Section 13 or 15(d) of the Securities Exchange Act of 1934
For the transition period from ______________ to ____________.
Commission file number: 1-3368
THE EMPIRE DISTRICT ELECTRIC COMPANY (Exact name of registrant as specified in its charter)
Kansas
(State of Incorporation) 44-0236370
(I.R.S. Employer Identification No.)
602 S. Joplin Avenue, Joplin, Missouri
(Address of principal executive offices)
64801
(zip code)
Registrant's telephone number: (417) 625-5100
Indicate by check mark whether the registrant (1) has filed all reports required to be filed by Section 13 or 15(d) of the Securities Exchange Act of 1934 during the preceding 12 months (or for such shorter period that the registrant was required to file such reports), and (2) has been subject to such filing requirements for the past 90 days. Yes √√√√ No __ Indicate by check mark whether the registrant has submitted electronically and posted on its corporate Web site, if any, every Interactive Data File required to be submitted and posted pursuant to Rule 405 of Regulation S-T (§232.405 of this chapter) during the preceding 12 months (or for such shorter period that the registrant was required to submit and post such files). Yes √√√√ No __ Indicate by check mark whether the registrant is a large accelerated filer, an accelerated filer, a non-accelerated filer, or a smaller reporting company. See the definitions of “large accelerated filer,” “accelerated filer” and “smaller reporting company” in Rule 12b-2 of the Exchange Act.
Large accelerated filer √√√√ Accelerated filer __ Non-accelerated filer __ (Do not check if a smaller reporting company) Smaller reporting company _ Indicate by check mark whether the registrant is a shell company (as defined in Rule 12b-2 of the Exchange Act). Yes___ No √√√√
As of October 31, 2013, 42,968,104 shares of common stock were outstanding.

2
THE EMPIRE DISTRICT ELECTRIC COMPANY
INDEX PAGE
Forward Looking Statements ............................................................................ 3 Part I - Financial Information: Item 1. Financial Statements: a. Consolidated Statements of Income ........................................................... 4 b. Consolidated Balance Sheets ..................................................................... 7 c. Consolidated Statements of Cash Flows..................................................... 9 d. Notes to Consolidated Financial Statements............................................... 10 Item 2. Management's Discussion and Analysis of Financial Condition and Results of
Operations 31
Executive Summary.. ........................................................................................ 31 Results of Operations.. ..................................................................................... 34 Rate Matters ..................................................................................................... 42 Competition and Markets .................................................................................. 43 Liquidity and Capital Resources........................................................................ 44 Contractual Obligations..................................................................................... 48 Dividends... ....................................................................................................... 49
Off-Balance Sheet Arrangements ..................................................................... 50 Critical Accounting Policies and Estimates........................................................ 50 Recently Issued Accounting Standards............................................................. 50 Item 3. Quantitative and Qualitative Disclosures About Market Risk............................. 50 Item 4. Controls and Procedures .................................................................................. 52 Part II- Other Information: Item 1. Legal Proceedings ........................................................................................... 52 Item 1A. Risk Factors...................................................................................................... 52 Item 2. Unregistered Sales of Equity Securities and Use of Proceeds - (none) Item 3. Defaults Upon Senior Securities - (none) Item 4. Mine Safety Disclosures – (none) Item 5. Other Information.............................................................................................. 53 Item 6. Exhibits ............................................................................................................. 53 Signatures ........................................................................................................ 54
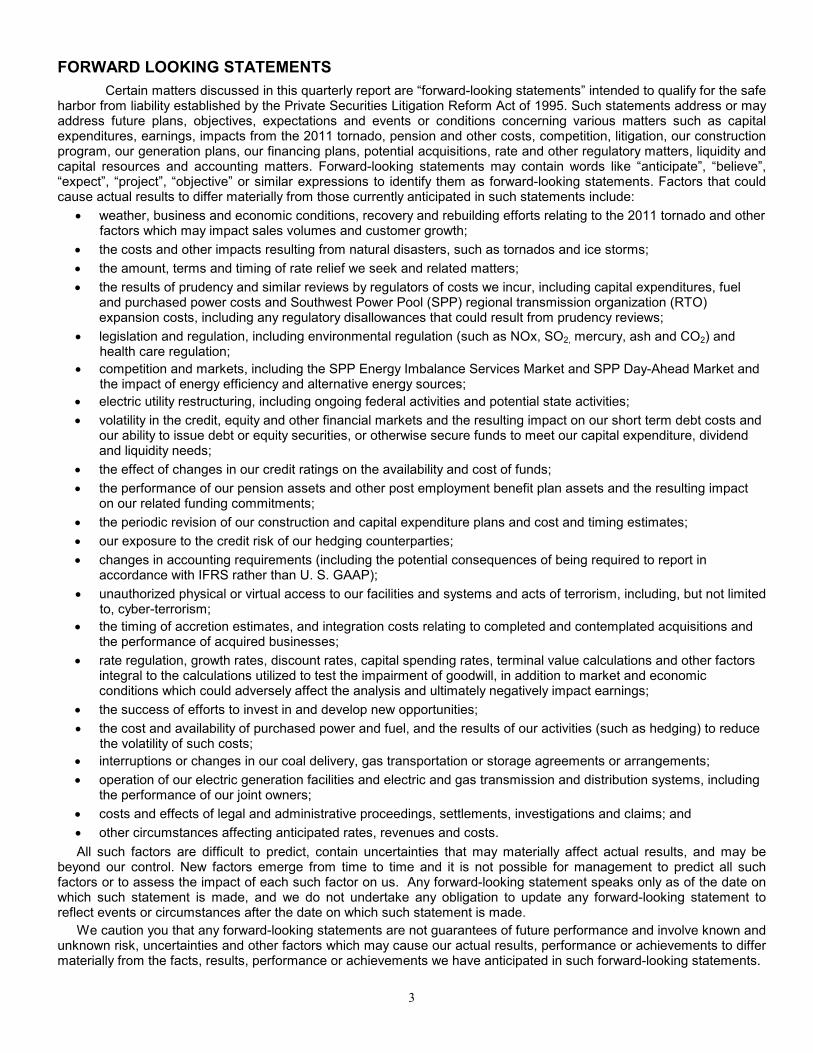
3
FORWARD LOOKING STATEMENTS
Certain matters discussed in this quarterly report are “forward-looking statements” intended to qualify for the safe harbor from liability established by the Private Securities Litigation Reform Act of 1995. Such statements address or may address future plans, objectives, expectations and events or conditions concerning various matters such as capital expenditures, earnings, impacts from the 2011 tornado, pension and other costs, competition, litigation, our construction program, our generation plans, our financing plans, potential acquisitions, rate and other regulatory matters, liquidity and capital resources and accounting matters. Forward-looking statements may contain words like “anticipate”, “believe”, “expect”, “project”, “objective” or similar expressions to identify them as forward-looking statements. Factors that could cause actual results to differ materially from those currently anticipated in such statements include:
• weather, business and economic conditions, recovery and rebuilding efforts relating to the 2011 tornado and other factors which may impact sales volumes and customer growth;
• the costs and other impacts resulting from natural disasters, such as tornados and ice storms;
• the amount, terms and timing of rate relief we seek and related matters;
• the results of prudency and similar reviews by regulators of costs we incur, including capital expenditures, fuel and purchased power costs and Southwest Power Pool (SPP) regional transmission organization (RTO) expansion costs, including any regulatory disallowances that could result from prudency reviews;
• legislation and regulation, including environmental regulation (such as NOx, SO2, mercury, ash and CO2) and health care regulation;
• competition and markets, including the SPP Energy Imbalance Services Market and SPP Day-Ahead Market and the impact of energy efficiency and alternative energy sources;
• electric utility restructuring, including ongoing federal activities and potential state activities;
• volatility in the credit, equity and other financial markets and the resulting impact on our short term debt costs and our ability to issue debt or equity securities, or otherwise secure funds to meet our capital expenditure, dividend and liquidity needs;
• the effect of changes in our credit ratings on the availability and cost of funds;
• the performance of our pension assets and other post employment benefit plan assets and the resulting impact on our related funding commitments;
• the periodic revision of our construction and capital expenditure plans and cost and timing estimates;
• our exposure to the credit risk of our hedging counterparties;
• changes in accounting requirements (including the potential consequences of being required to report in accordance with IFRS rather than U. S. GAAP);
• unauthorized physical or virtual access to our facilities and systems and acts of terrorism, including, but not limited to, cyber-terrorism;
• the timing of accretion estimates, and integration costs relating to completed and contemplated acquisitions and the performance of acquired businesses;
• rate regulation, growth rates, discount rates, capital spending rates, terminal value calculations and other factors integral to the calculations utilized to test the impairment of goodwill, in addition to market and economic conditions which could adversely affect the analysis and ultimately negatively impact earnings;
• the success of efforts to invest in and develop new opportunities;
• the cost and availability of purchased power and fuel, and the results of our activities (such as hedging) to reduce the volatility of such costs;
• interruptions or changes in our coal delivery, gas transportation or storage agreements or arrangements;
• operation of our electric generation facilities and electric and gas transmission and distribution systems, including the performance of our joint owners;
• costs and effects of legal and administrative proceedings, settlements, investigations and claims; and
• other circumstances affecting anticipated rates, revenues and costs.
All such factors are difficult to predict, contain uncertainties that may materially affect actual results, and may be beyond our control. New factors emerge from time to time and it is not possible for management to predict all such factors or to assess the impact of each such factor on us. Any forward-looking statement speaks only as of the date on which such statement is made, and we do not undertake any obligation to update any forward-looking statement to reflect events or circumstances after the date on which such statement is made.
We caution you that any forward-looking statements are not guarantees of future performance and involve known and unknown risk, uncertainties and other factors which may cause our actual results, performance or achievements to differ materially from the facts, results, performance or achievements we have anticipated in such forward-looking statements.

4
PART I. FINANCIAL INFORMATION
Item 1. Financial Statements
THE EMPIRE DISTRICT ELECTRIC COMPANY CONSOLIDATED STATEMENTS OF INCOME (UNAUDITED)
Three Months Ended
September 30 2013 2012 (000’s except per share amounts)
Operating revenues: Electric $ 150,370 $ 152,730 Gas 4,952 4,999 Other 2,164 1,473 157,486 159,202 Operating revenue deductions: Fuel and purchased power 44,864 48,036 Cost of natural gas sold and transported 1,191 1,251 Regulated operating expenses 26,100 24,038 Other operating expenses 805 776 Maintenance and repairs 10,674 10,972 Depreciation and amortization 17,735 15,108 Provision for income taxes 14,197 15,428 Other taxes 9,024 8,311 124,590 123,920 Operating income 32,896 35,282 Other income and (deductions): Allowance for equity funds used during construction 1,128 292 Interest income 5 265 Benefit/(provision) for other income taxes 47 (49) Other – non-operating expense, net (333) (274) 847 234 Interest charges: Long-term debt 10,102 9,950 Short-term debt - 16 Allowance for borrowed funds used during construction (606) (243) Other 251 251 9,747 9,974 Net income $ 23,996 $ 25,542 Weighted average number of common shares outstanding - basic 42,869 42,345 Weighted average number of common shares outstanding - diluted 42,898 42,374 Total earnings per weighted average share of common stock – basic and diluted
$ 0.56
$ 0.60
Dividends declared per share of common stock $ 0.25 $ 0.25
See accompanying Notes to Consolidated Financial Statements.

5
THE EMPIRE DISTRICT ELECTRIC COMPANY CONSOLIDATED STATEMENTS OF INCOME (UNAUDITED)
Nine Months Ended
September 30, 2013 2012 (000’s except per share amounts) Operating revenues: Electric $ 406,158 $ 396,546 Gas 33,222 26,486 Other 5,892 4,945 445,272 427,977 Operating revenue deductions: Fuel and purchased power 132,179 138,792 Cost of natural gas sold and transported 16,229 11,601 Regulated operating expenses 79,884 70,230 Other operating expenses 2,470 2,145 Maintenance and repairs 29,764 30,893 Loss on plant disallowance 2,409 - Depreciation and amortization 51,471 45,111 Provision for income taxes 28,693 28,185 Other taxes 26,309 24,166 369,408 351,123 Operating income 75,864 76,854 Other income and (deductions): Allowance for equity funds used during construction 2,521 395 Interest income 522 568 Benefit/(provision) for other income taxes 12 (251) Other – non-operating expense, net (912) (703) 2,143 9 Interest charges: Long-term debt 30,243 30,242 Short-term debt 59 175 Allowance for borrowed funds used during construction (1,383) (410) Other 805 802 29,724 30,809 Net income $ 48,283 $ 46,054 Weighted average number of common shares outstanding - basic 42,715 42,197 Weighted average number of common shares outstanding - diluted 42,737 42,220 Total earnings per weighted average share of common stock – basic and diluted
$ 1.13
$ 1.09
Dividends declared per share of common stock $ 0.75 $ 0.75 See accompanying Notes to Consolidated Financial Statements.

6
THE EMPIRE DISTRICT ELECTRIC COMPANY CONSOLIDATED STATEMENTS OF INCOME (UNAUDITED) Twelve Months Ended
September 30,
2013 2012
(000’s except per share amounts) amounts) Operating revenues:
Electric $ 520,265 $ 514,515 Gas 46,585 39,571 Other 7,542 6,657 574,392 560,743 Operating revenue deductions: Fuel and purchased power 172,283 183,288 Cost of natural gas sold and transported 23,262 18,384 Regulated operating expenses 104,024 93,572 Other operating expenses 3,056 2,763 Maintenance and repairs 39,315 42,261 Loss on plant disallowance 2,409 - Depreciation and amortization 66,807 59,669 Provision for income taxes 34,603 33,727 Other taxes 33,402 30,722 479,161 464,386 Operating income 95,231 96,357 Other income and (deductions): Allowance for equity funds used during construction 3,273 537 Interest income 926 1,055 Benefit/(provision) for other income taxes 201 (531) Other – non-operating expense, net (2,119) (1,005) 2,281 56 Interest charges: Long-term debt 40,194 40,896 Short-term debt 71 192 Allowance for borrowed funds used during construction (1,754) (470) Other 1,091 1,050 39,602 41,668 Net income $ 57,910 $ 54,745 - - Weighted average number of common shares outstanding – basic 42,644 42,141 Weighted average number of common shares outstanding – diluted 42,665 42,163 Total earnings per weighted average share of common stock – basic and diluted
$ 1.36
$ 1.30
Dividends declared per share of common stock $ 1.00 $ 0.75 See accompanying Notes to Consolidated Financial Statements.

7
THE EMPIRE DISTRICT ELECTRIC COMPANY CONSOLIDATED BALANCE SHEETS (UNAUDITED)
September 30, 2013 December 31, 2012 ($-000’s) Assets Plant and property, at original cost: Electric $ 2,207,736 $ 2,176,188 Gas 72,127 69,851 Other 39,095 37,983 Construction work in progress 129,219 56,347
2,448,177 2,340,369 Accumulated depreciation and amortization 718,492 682,737
1,729,685 1,657,632 Current assets: Cash and cash equivalents 16,383 3,375 Restricted cash 1,773 4,357 Accounts receivable – trade, net of allowance $988 and $1,388, respectively 51,485 38,874 Accrued unbilled revenues 16,335 23,254 Accounts receivable – other 14,900 13,277 Fuel, materials and supplies 53,050 61,870 Prepaid expenses and other 20,360 21,806 Unrealized gain in fair value of derivative contracts 333 96 Regulatory assets 6,398 6,377 181,017 173,286
Noncurrent assets and deferred charges: Regulatory assets 231,950 243,958 Goodwill 39,492 39,492 Unamortized debt issuance costs 8,722 7,606 Unrealized gain in fair value of derivative contracts - 191 Other 4,942 4,204
285,106 295,451 Total Assets $ 2,195,808 $ 2,126,369
(Continued)
See accompanying Notes to Consolidated Financial Statements.

8
THE EMPIRE DISTRICT ELECTRIC COMPANY CONSOLIDATED BALANCE SHEETS (UNAUDITED) (Continued)
September 30, 2013 December 31, 2012 ($-000’s) Capitalization and Liabilities Common stock, $1 par value, 42,939,207 and 42,484,363 shares issued and outstanding, respectively $ 42,939 $ 42,484
Capital in excess of par value 637,003 628,199 Retained earnings 63,350 47,115 Total common stockholders' equity 743,292 717,798
Long-term debt (net of current portion): Obligations under capital lease 4,237 4,441 First mortgage bonds and secured debt 637,569 487,541 Unsecured debt 101,680 199,644
Total long-term debt 743,486 691,626 Total long-term debt and common stockholders’ equity 1,486,778 1,409,424
Current liabilities: Accounts payable and accrued liabilities 55,281 66,559 Current maturities of long-term debt 327 714 Short-term debt - 24,000 Regulatory liabilities 4,295 6,303 Customer deposits 12,518 12,001 Interest accrued 13,766 5,902 Other current liabilities 1,894 - Unrealized loss in fair value of derivative contracts 3,078 3,403 Taxes accrued 16,781 2,992 107,940 121,874
Commitments and contingencies (Note 7) Noncurrent liabilities and deferred credits: Regulatory liabilities 134,531 131,055 Deferred income taxes 320,042 301,967 Unamortized investment tax credits 18,708 18,897 Pension and other postretirement benefit obligations 107,299 120,808 Unrealized loss in fair value of derivative contracts 3,089 3,819 Other 17,421 18,525 601,090 595,071 Total Capitalization and Liabilities $ 2,195,808 $ 2,126,369 See accompanying Notes to Consolidated Financial Statements.
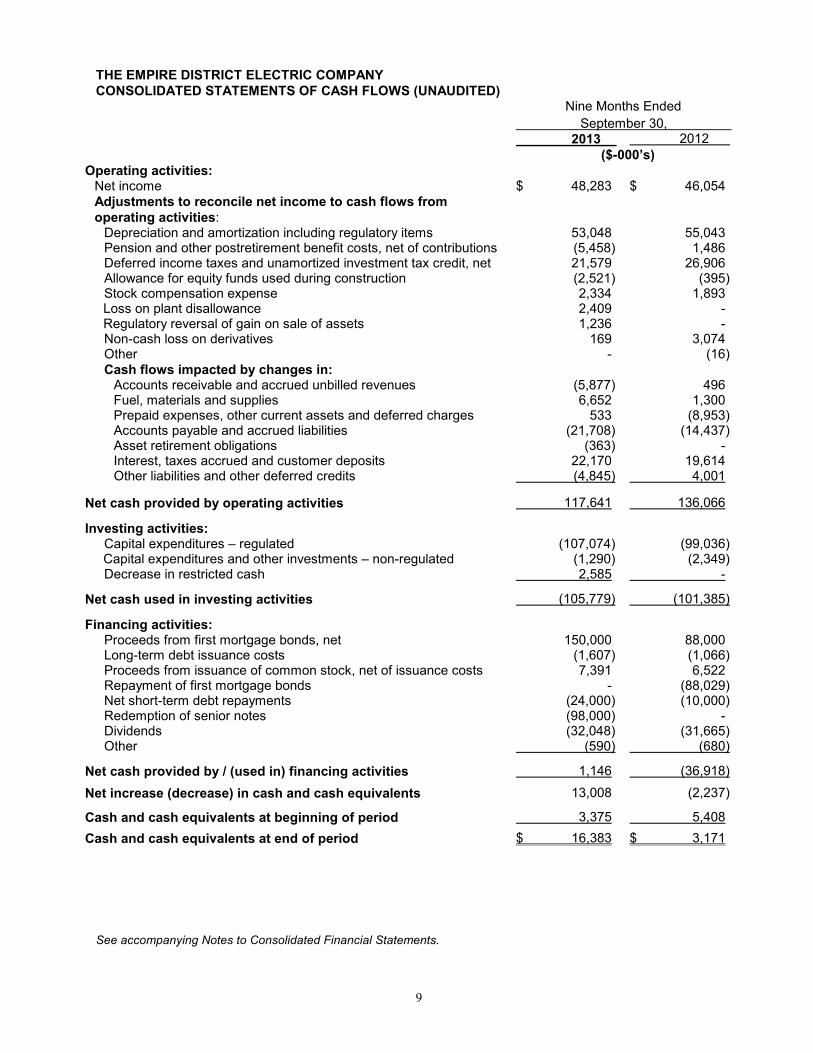
9
THE EMPIRE DISTRICT ELECTRIC COMPANY CONSOLIDATED STATEMENTS OF CASH FLOWS (UNAUDITED)
Nine Months Ended
September 30, 2013 2012 ($-000’s) Operating activities: Net income $ 48,283 $ 46,054 Adjustments to reconcile net income to cash flows from
operating activities:
Depreciation and amortization including regulatory items 53,048 55,043 Pension and other postretirement benefit costs, net of contributions (5,458) 1,486 Deferred income taxes and unamortized investment tax credit, net 21,579 26,906 Allowance for equity funds used during construction (2,521) (395) Stock compensation expense 2,334 1,893 Loss on plant disallowance 2,409 - Regulatory reversal of gain on sale of assets 1,236 - Non-cash loss on derivatives 169 3,074 Other - (16) Cash flows impacted by changes in: Accounts receivable and accrued unbilled revenues (5,877) 496 Fuel, materials and supplies 6,652 1,300 Prepaid expenses, other current assets and deferred charges 533 (8,953) Accounts payable and accrued liabilities (21,708) (14,437) Asset retirement obligations (363) - Interest, taxes accrued and customer deposits 22,170 19,614 Other liabilities and other deferred credits (4,845) 4,001 Net cash provided by operating activities 117,641 136,066 Investing activities: Capital expenditures – regulated (107,074) (99,036) Capital expenditures and other investments – non-regulated (1,290) (2,349) Decrease in restricted cash 2,585 - Net cash used in investing activities (105,779) (101,385) Financing activities: Proceeds from first mortgage bonds, net 150,000 88,000 Long-term debt issuance costs (1,607) (1,066) Proceeds from issuance of common stock, net of issuance costs 7,391 6,522 Repayment of first mortgage bonds - (88,029) Net short-term debt repayments (24,000) (10,000) Redemption of senior notes (98,000) - Dividends (32,048) (31,665) Other (590) (680) Net cash provided by / (used in) financing activities 1,146 (36,918) Net increase (decrease) in cash and cash equivalents 13,008 (2,237) Cash and cash equivalents at beginning of period 3,375 5,408 Cash and cash equivalents at end of period $ 16,383 $ 3,171
See accompanying Notes to Consolidated Financial Statements.

10
NOTES TO CONSOLIDATED FINANCIAL STATEMENTS (UNAUDITED)
Note 1 - Summary of Significant Accounting Policies We operate our businesses as three segments: electric, gas and other. The Empire District Electric Company (EDE), a Kansas corporation organized in 1909, is an operating public utility engaged in the generation, purchase, transmission, distribution and sale of electricity in parts of Missouri, Kansas, Oklahoma and Arkansas. As part of our electric segment, we also provide water service to three towns in Missouri. The Empire District Gas Company (EDG) is our wholly-owned subsidiary which provides natural gas distribution to customers in 48 communities in northwest, north central and west central Missouri. Our other segment consists of our fiber optics business. The accompanying interim financial statements do not include all disclosures included in the annual financial statements and therefore should be read in conjunction with the financial statements and notes thereto included in our Annual Report on Form 10-K for the fiscal year ended December 31, 2012. The information furnished reflects all adjustments which are in our opinion necessary to state fairly the results for the interim periods as well as present these periods on a consistent basis with the financial statements for the fiscal year ended December 31, 2012.
Note 2 - Recently Issued and Proposed Accounting Standards
Balance Sheet Offsetting: The FASB amended the guidance governing the offsetting, or netting, of assets and liabilities on the balance sheet. Under the revised guidance, an entity is required to disclose both the gross and net information about instruments and transactions that are eligible for offset on the balance sheet, as well as instruments or transactions subject to a master netting agreement. This standard was effective for annual periods beginning after January 1, 2013. We implemented this standard in the first quarter of 2013 and it did not have a material impact on our results of operations, financial position or liquidity.
Note 3– Regulatory Matters
On February 27, 2013, the MPSC approved a joint settlement agreement for our 2012 Missouri rate case. The agreement provided for an annual increase in base revenues for our Missouri electric customers in the amount of approximately $27.5 million, effective April 1, 2013, and the continuation of the current fuel adjustment mechanism. The agreement also included an increase in depreciation rates, recovery of deferred tornado costs over the next ten years and the continuation of tracking mechanisms for expenses related to employee pension, retiree health care, vegetation management, and Iatan 2, Iatan Common and Plum Point operating and maintenance costs. In addition, the agreement included a write-off of approximately $3.6 million, consisting of a $2.4 million disallowance for the prudency of certain construction expenditures for Iatan 2 and a $1.2 million regulatory reversal of a prior period gain on sale of our Asbury unit train, which is included in regulated operating expenses. We also agreed not to implement a Missouri general rate increase prior to October 1, 2014.
The following table sets forth the components of our regulatory assets and liabilities on our consolidated balance sheet (in thousands).

11
Regulatory Assets and Liabilities
September 30, 2013 December 31, 2012 Regulatory Assets: Current: Under recovered fuel costs(1) $ 302 $ 2,885 Current portion of long-term regulatory assets(1) 6,096 3,492 Regulatory assets, current(1) 6,398 6,377 Long-term: Pension and other postretirement benefits
(2) 129,110 136,480
Income taxes 48,418 48,759 Deferred construction accounting costs 16,385 16,717 Unamortized loss on reacquired debt 11,246 12,142 Unsettled derivative losses – electric segment 5,613 6,557 System reliability – vegetation management 7,783 9,002 Storm costs
(3) 5,084 4,828
Asset retirement obligation 4,616 4,430 Customer programs 4,785 4,356 Unamortized loss on interest rate derivative 1,001 1,147 Deferred operating and maintenance expense 1,863 2,049 Under recovered fuel costs 1,212 314 Current portion of long-term regulatory assets (6,096) (3,492) Other 930 669 Regulatory assets, long-term 231,950 243,958 Total Regulatory Assets $ 238,348 $ 250,335
September 30, 2013 December 31, 2012 Regulatory Liabilities: Current: Over recovered fuel costs(1) $ 556 $ 3,214 Current portion of long-term regulatory liabilities(1) 3,739 3,089 Regulatory liabilities, current(1) 4,295 6,303 Long-term: Costs of removal 92,058 83,368 SWPA payment for Ozark Beach lost generation 20,105 22,242 Income taxes 11,736 11,972 Deferred construction accounting costs – fuel 8,047 8,156 Unamortized gain on interest rate derivative 3,414 3,541 Pension and other postretirement benefits
(4) 2,377 2,007
Over recovered fuel costs 533 2,858 Current portion of long-term regulatory liabilities
(1) (3,739) (3,089)
Regulatory liabilities, long-term 134,531 131,055 Total Regulatory Liabilities $ 138,826 $ 137,358
(1) Reflects over and under recovered costs of the current portion of regulatory assets or liabilities detailed in the long term sections below expected to be returned or recovered, as applicable, within the next 12 months in rates.
(2) Includes the effect of costs incurred that are more or less than those allowed in rates for Missouri (EDE and EDG) and Kansas (EDE) portion of pension and other postretirement benefit costs.
(3) Reflects ice storm costs incurred in 2007 and costs incurred as a result of the May 2011 tornado.
(4) Includes the effect of costs incurred that are more or less than those allowed in rates for the Missouri (EDE and EDG) and Kansas (EDE) portion of pension and other postretirement benefit costs.
Note 4– Risk Management and Derivative Financial Instruments
We engage in hedging activities in an effort to minimize our risk from volatile natural gas prices. We enter into both physical and financial contracts with counterparties relating to our future natural gas requirements that lock in prices (with respect to a range of predetermined percentages of our expected future natural gas needs) in an attempt to lessen the volatility in our fuel expenditures and gain predictability. We recognize that if risk is not timely and adequately balanced or if counterparties fail to perform contractual obligations, actual results could differ materially from intended results.
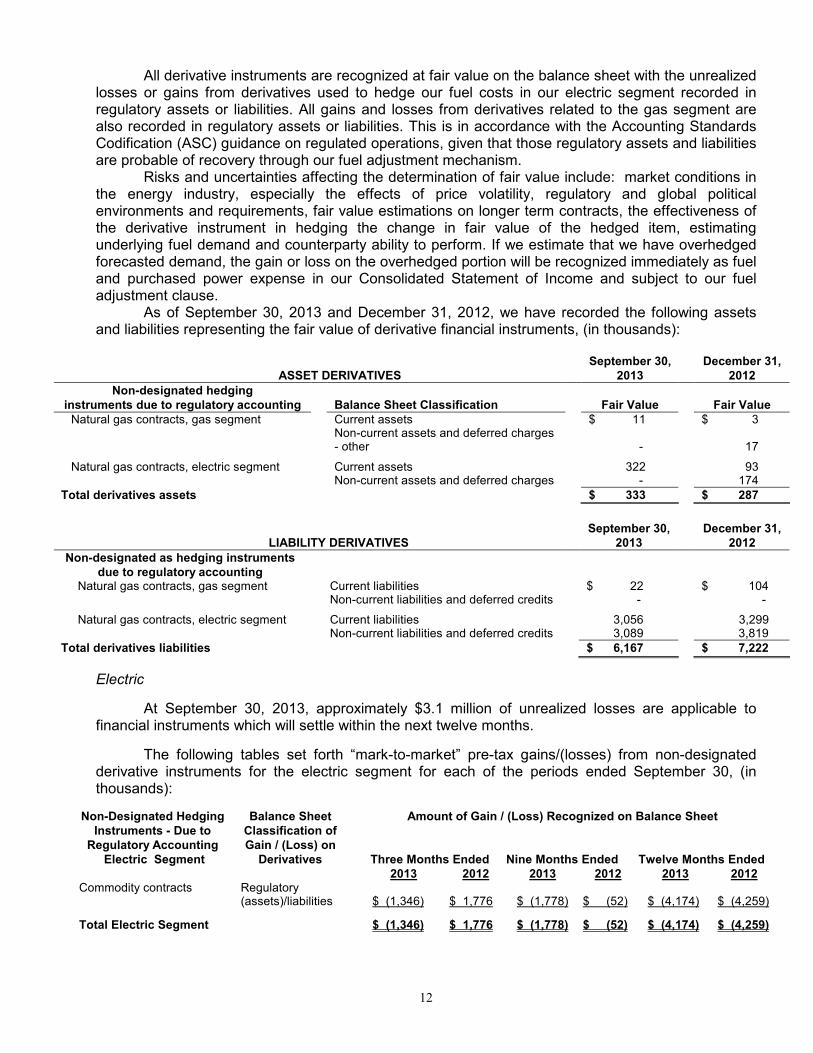
12
All derivative instruments are recognized at fair value on the balance sheet with the unrealized losses or gains from derivatives used to hedge our fuel costs in our electric segment recorded in regulatory assets or liabilities. All gains and losses from derivatives related to the gas segment are also recorded in regulatory assets or liabilities. This is in accordance with the Accounting Standards Codification (ASC) guidance on regulated operations, given that those regulatory assets and liabilities are probable of recovery through our fuel adjustment mechanism. Risks and uncertainties affecting the determination of fair value include: market conditions in the energy industry, especially the effects of price volatility, regulatory and global political environments and requirements, fair value estimations on longer term contracts, the effectiveness of the derivative instrument in hedging the change in fair value of the hedged item, estimating underlying fuel demand and counterparty ability to perform. If we estimate that we have overhedged forecasted demand, the gain or loss on the overhedged portion will be recognized immediately as fuel and purchased power expense in our Consolidated Statement of Income and subject to our fuel adjustment clause. As of September 30, 2013 and December 31, 2012, we have recorded the following assets and liabilities representing the fair value of derivative financial instruments, (in thousands):
September 30, December 31, ASSET DERIVATIVES 2013 2012
Non-designated hedging instruments due to regulatory accounting
Balance Sheet Classification
Fair Value
Fair Value
Natural gas contracts, gas segment Current assets $ 11 $ 3 Non-current assets and deferred charges
- other
-
17 Natural gas contracts, electric segment Current assets 322 93 Non-current assets and deferred charges - 174 Total derivatives assets $ 333 $ 287
September 30, December 31,
LIABILITY DERIVATIVES 2013 2012
Non-designated as hedging instruments due to regulatory accounting
Natural gas contracts, gas segment Current liabilities $ 22 $ 104 Non-current liabilities and deferred credits - - Natural gas contracts, electric segment Current liabilities 3,056 3,299 Non-current liabilities and deferred credits 3,089 3,819 Total derivatives liabilities $ 6,167 $ 7,222
Electric
At September 30, 2013, approximately $3.1 million of unrealized losses are applicable to financial instruments which will settle within the next twelve months.
The following tables set forth “mark-to-market” pre-tax gains/(losses) from non-designated derivative instruments for the electric segment for each of the periods ended September 30, (in thousands):
Non-Designated Hedging Instruments - Due to Regulatory Accounting Electric Segment
Balance Sheet Classification of Gain / (Loss) on Derivatives
Amount of Gain / (Loss) Recognized on Balance Sheet
Three Months Ended Nine Months Ended Twelve Months Ended 2013 2012 2013 2012 2013 2012 Commodity contracts Regulatory
(assets)/liabilities
$ (1,346) $ 1,776
$ (1,778)
$ (52)
$ (4,174)
$ (4,259)
Total Electric Segment $ (1,346) $ 1,776 $ (1,778) $ (52) $ (4,174) $ (4,259)
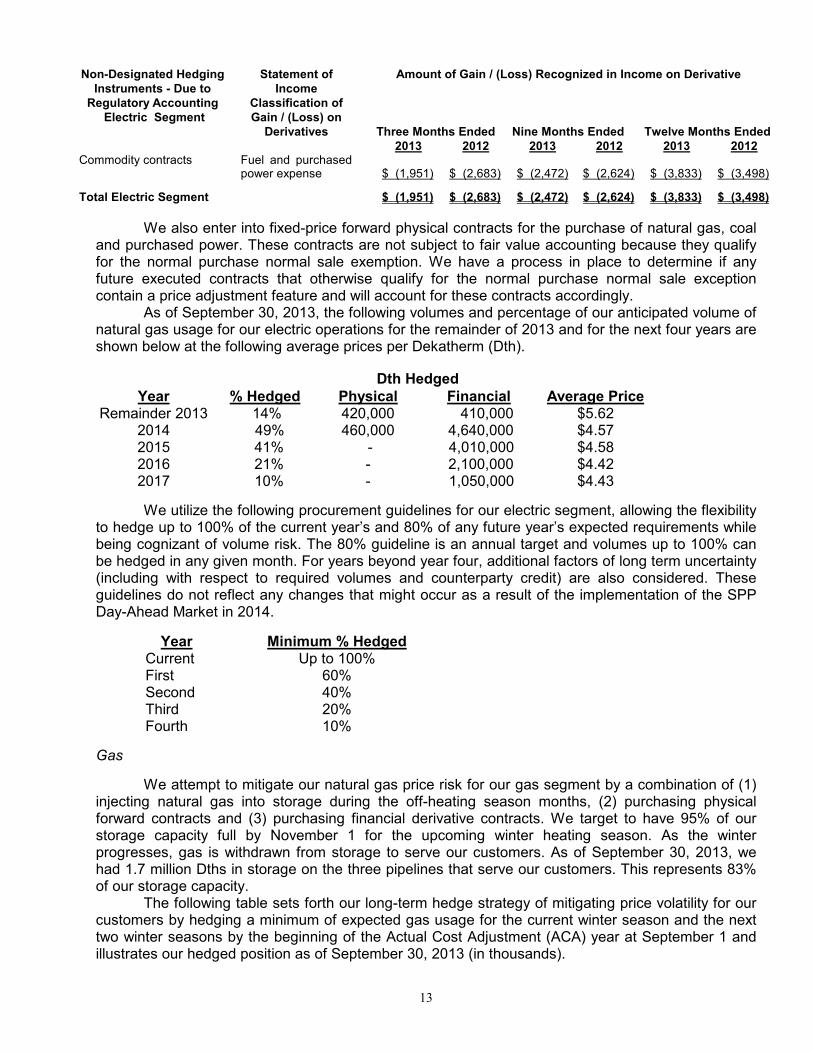
13
Non-Designated Hedging Instruments - Due to Regulatory Accounting Electric Segment
Statement of Income
Classification of Gain / (Loss) on Derivatives
Amount of Gain / (Loss) Recognized in Income on Derivative
Three Months Ended Nine Months Ended Twelve Months Ended 2013 2012 2013 2012 2013 2012 Commodity contracts Fuel and purchased
power expense
$ (1,951) $ (2,683)
$ (2,472)
$ (2,624)
$ (3,833)
$ (3,498)
Total Electric Segment $ (1,951) $ (2,683) $ (2,472) $ (2,624) $ (3,833) $ (3,498)
We also enter into fixed-price forward physical contracts for the purchase of natural gas, coal and purchased power. These contracts are not subject to fair value accounting because they qualify for the normal purchase normal sale exemption. We have a process in place to determine if any future executed contracts that otherwise qualify for the normal purchase normal sale exception contain a price adjustment feature and will account for these contracts accordingly. As of September 30, 2013, the following volumes and percentage of our anticipated volume of natural gas usage for our electric operations for the remainder of 2013 and for the next four years are shown below at the following average prices per Dekatherm (Dth).
Dth Hedged Year % Hedged Physical Financial Average Price
Remainder 2013 14% 420,000 410,000 $5.62 2014 49% 460,000 4,640,000 $4.57 2015 41% - 4,010,000 $4.58 2016 21% - 2,100,000 $4.42 2017 10% - 1,050,000 $4.43
We utilize the following procurement guidelines for our electric segment, allowing the flexibility to hedge up to 100% of the current year’s and 80% of any future year’s expected requirements while being cognizant of volume risk. The 80% guideline is an annual target and volumes up to 100% can be hedged in any given month. For years beyond year four, additional factors of long term uncertainty (including with respect to required volumes and counterparty credit) are also considered. These guidelines do not reflect any changes that might occur as a result of the implementation of the SPP Day-Ahead Market in 2014.
Year Minimum % Hedged Current Up to 100% First 60% Second 40% Third 20% Fourth 10%
Gas
We attempt to mitigate our natural gas price risk for our gas segment by a combination of (1) injecting natural gas into storage during the off-heating season months, (2) purchasing physical forward contracts and (3) purchasing financial derivative contracts. We target to have 95% of our storage capacity full by November 1 for the upcoming winter heating season. As the winter progresses, gas is withdrawn from storage to serve our customers. As of September 30, 2013, we had 1.7 million Dths in storage on the three pipelines that serve our customers. This represents 83% of our storage capacity.
The following table sets forth our long-term hedge strategy of mitigating price volatility for our customers by hedging a minimum of expected gas usage for the current winter season and the next two winter seasons by the beginning of the Actual Cost Adjustment (ACA) year at September 1 and illustrates our hedged position as of September 30, 2013 (in thousands).
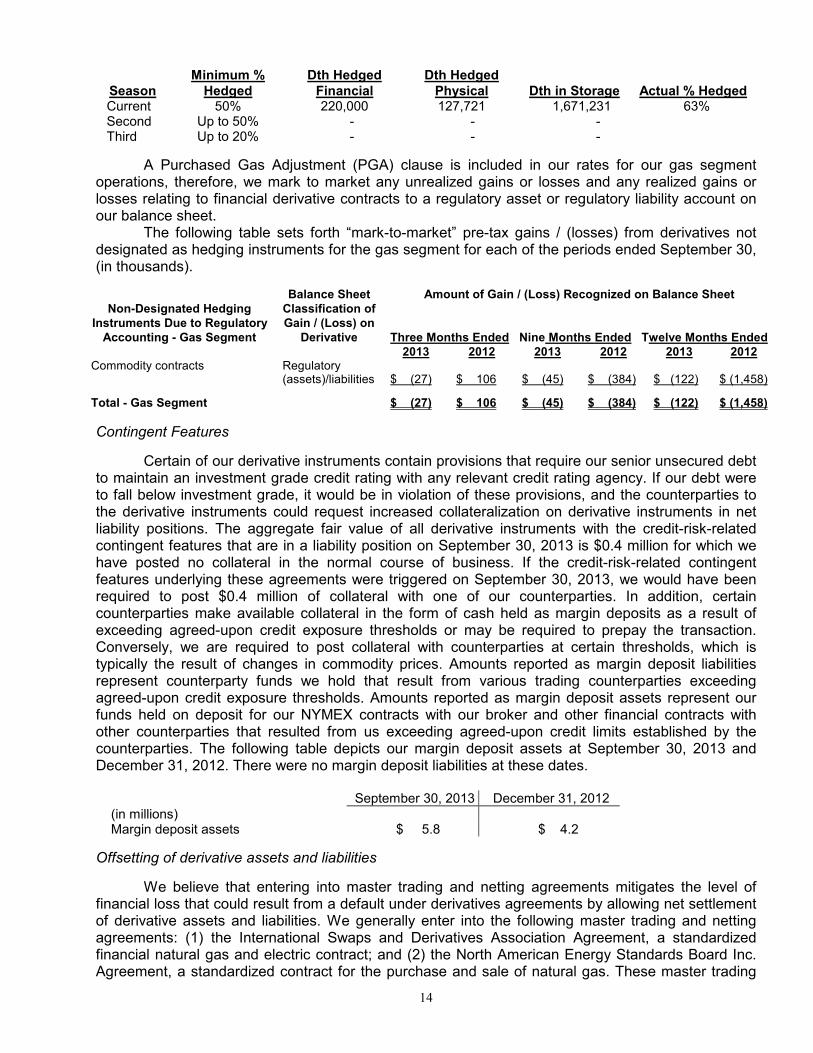
14
Season
Minimum % Hedged
Dth Hedged Financial
Dth Hedged Physical
Dth in Storage
Actual % Hedged
Current 50% 220,000 127,721 1,671,231 63% Second Up to 50% - - - Third Up to 20% - - -
A Purchased Gas Adjustment (PGA) clause is included in our rates for our gas segment operations, therefore, we mark to market any unrealized gains or losses and any realized gains or losses relating to financial derivative contracts to a regulatory asset or regulatory liability account on our balance sheet.
The following table sets forth “mark-to-market” pre-tax gains / (losses) from derivatives not designated as hedging instruments for the gas segment for each of the periods ended September 30, (in thousands).
Non-Designated Hedging
Instruments Due to Regulatory Accounting - Gas Segment
Balance Sheet Classification of Gain / (Loss) on
Derivative
Amount of Gain / (Loss) Recognized on Balance Sheet
Three Months Ended Nine Months Ended Twelve Months Ended
2013 2012 2013 2012 2013 2012 Commodity contracts Regulatory
(assets)/liabilities $ (27)
$ 106
$ (45)
$ (384)
$ (122)
$ (1,458)
Total - Gas Segment $ (27) $ 106 $ (45) $ (384) $ (122) $ (1,458)
Contingent Features
Certain of our derivative instruments contain provisions that require our senior unsecured debt to maintain an investment grade credit rating with any relevant credit rating agency. If our debt were to fall below investment grade, it would be in violation of these provisions, and the counterparties to the derivative instruments could request increased collateralization on derivative instruments in net liability positions. The aggregate fair value of all derivative instruments with the credit-risk-related contingent features that are in a liability position on September 30, 2013 is $0.4 million for which we have posted no collateral in the normal course of business. If the credit-risk-related contingent features underlying these agreements were triggered on September 30, 2013, we would have been required to post $0.4 million of collateral with one of our counterparties. In addition, certain counterparties make available collateral in the form of cash held as margin deposits as a result of exceeding agreed-upon credit exposure thresholds or may be required to prepay the transaction. Conversely, we are required to post collateral with counterparties at certain thresholds, which is typically the result of changes in commodity prices. Amounts reported as margin deposit liabilities represent counterparty funds we hold that result from various trading counterparties exceeding agreed-upon credit exposure thresholds. Amounts reported as margin deposit assets represent our funds held on deposit for our NYMEX contracts with our broker and other financial contracts with other counterparties that resulted from us exceeding agreed-upon credit limits established by the counterparties. The following table depicts our margin deposit assets at September 30, 2013 and December 31, 2012. There were no margin deposit liabilities at these dates.
September 30, 2013 December 31, 2012 (in millions) Margin deposit assets $ 5.8 $ 4.2
Offsetting of derivative assets and liabilities
We believe that entering into master trading and netting agreements mitigates the level of financial loss that could result from a default under derivatives agreements by allowing net settlement of derivative assets and liabilities. We generally enter into the following master trading and netting agreements: (1) the International Swaps and Derivatives Association Agreement, a standardized financial natural gas and electric contract; and (2) the North American Energy Standards Board Inc. Agreement, a standardized contract for the purchase and sale of natural gas. These master trading

15
and netting agreements allow the counterparties to net settle sale and purchase transactions. Further, collateral requirements are calculated at the master trading and netting agreement level by the counterparty.
As shown above, our asset and liability commodity contract derivatives are reported at gross on the balance sheet. ASC guidance permits companies to offset fair value amounts recognized for the right to reclaim cash collateral (a receivable) or the obligation to return cash collateral (a liability) against fair value amounts recognized for derivative instruments that are executed with the same counterparty under the same master netting arrangement. For the periods ended September 30, 2013 and December 31, 2012, we did not hold any collateral posted by our counterparties. The only collateral we have posted is our margin deposit assets described above. We have elected not to offset our margin deposit assets against any of our eligible commodity contracts.
Note 5– Fair Value Measurements
The accounting guidance on fair value measurements establishes a three-tier fair value hierarchy, which prioritizes the inputs used in measuring fair value. These tiers include: (i) Level 1, defined as quoted prices in active markets for identical instruments; (ii) Level 2, defined as inputs other than quoted prices in active markets that are either directly or indirectly observable; and (iii) Level 3, defined as unobservable inputs in which little or no market data exists, therefore requiring an entity to develop its own assumptions. Our Level 2 fair value measurements consist of both quoted price inputs and inputs that are derived principally from or corroborated by observable market data. The guidance also requires that the fair value measurements of assets and liabilities reflect the nonperformance risk of counterparties and the reporting entity, as applicable. Therefore, using credit default spreads, we factored the impact of our own credit standing and the credit standing of our counterparties, as well as any potential credit enhancements (e.g. collateral) into the consideration of nonperformance risk for both derivative assets and liabilities. The results of this analysis were not material to the financial statements. The following fair value hierarchy table presents information about our assets measured at fair value using the market value approach on a recurring basis as of September 30, 2013 and December 31, 2012.
Fair Value Measurements at Reporting Date Using ($ in 000’s)
Description
Assets/(Liabilities) at Fair Value
Quoted Prices in Active Markets for Identical Liabilities
(Level 1)
Significant Other Observable
Inputs (Level 2)
Significant Unobservable
Inputs (Level 3)
September 30, 2013
Derivative assets $ 333 $ 333 $ - $ - Derivative liabilities $ (6,167) $ (6,167) $ - $ -
December 31, 2012 Derivative assets $ 287 $ 287 $ - $ - Derivative liabilities $ (7,222) $ (7,222) $ - $ -
Our cash and cash equivalents approximate fair value because of the short-term nature of these instruments, and are classified as Level 1 in the fair value hierarchy. The carrying amount of our short-term debt, which is composed of Empire issued commercial paper or revolving credit borrowings, also approximates fair value because of their short-term nature. These instruments are classified as Level 2 in the fair value hierarchy as they are valued based on market rates for similar market transactions. The carrying amount of our total long-term debt exclusive of capital leases at September 30, 2013, was $739.3 million as compared to $687.6 million at December 31, 2012. The fair market value at September 30, 2013 was approximately $716.5 million as compared to $747.2 million at December 31, 2012. These estimates were based on a bond pricing model, utilizing inputs classified as Level 2 in the fair value hierarchy, which include the quoted market prices for the same or similar issues or on the current rates offered to us for debt of the same remaining maturities. The

16
estimated fair market value may not represent the actual value that could have been realized as of September 30, 2013 or that will be realizable in the future.
Note 6– Financing
On October 30, 2012, we entered into a Bond Purchase Agreement for a private placement of $30.0 million of 3.73% First Mortgage Bonds due May 30, 2033 and $120.0 million of 4.32% First Mortgage Bonds due May 30, 2043. The delayed settlement of both series of bonds occurred on May 30, 2013. Interest is payable semi-annually on the bonds on each May 30 and November 30, commencing November 30, 2013. The bonds may be redeemed at our option, at any time prior to maturity, at par plus a make whole premium, together with accrued and unpaid interest, if any, to the redemption date. The bonds have not been registered under the Securities Act of 1933, as amended. The bonds were issued under the EDE Mortgage. The principal amount of all series of first mortgage bonds outstanding at any one time under the EDE Mortgage is limited by terms of the mortgage to $1 billion. Substantially all of the property, plant and equipment of The Empire District Electric Company (but not its subsidiaries) is subject to the lien of the EDE Mortgage.
We used a portion of the proceeds from the sale of these bonds to redeem all $98.0 million aggregate principal amount of our Senior Notes, 4.50% Series due June 15, 2013. The remaining proceeds were used for general corporate purposes.
We have an unsecured revolving credit facility of $150 million in place through January 17, 2017. The facility is used for working capital, general corporate purposes and to back-up our use of commercial paper. This facility requires our total indebtedness to be less than 62.5% of our total capitalization at the end of each fiscal quarter and our EBITDA (defined as net income plus interest, taxes, depreciation and amortization) to be at least two times our interest charges for the trailing four fiscal quarters at the end of each fiscal quarter. Failure to maintain these ratios will result in an event of default under the credit facility and will prohibit us from borrowing funds thereunder. As of September 30, 2013, we are in compliance with these ratios. Our total indebtedness is 50.0% of our total capitalization as of September 30, 2013 and our EBITDA is 5.0 times our interest charges. This credit facility is also subject to cross-default if we default on in excess of $10 million in the aggregate on our other indebtedness. This arrangement does not serve to legally restrict the use of our cash in the normal course of operations. There were no outstanding borrowings under this agreement and no outstanding commercial paper at September 30, 2013.
Note 7– Commitments and Contingencies
Legal Proceedings
We are a party to various claims and legal proceedings arising out of the normal course of our business. Management regularly analyzes this information, and has provided accruals for any liabilities, in accordance with the guidelines presented in the ASC on accounting for contingencies. In the opinion of management, it is not probable, given the company’s defenses, that the ultimate outcome of these claims and lawsuits will have a material adverse effect upon our financial condition, or results of operations or cash flows.
A lawsuit was filed in Jasper County Circuit Court (the Court) against us by three of our residential customers, purporting to act on behalf of all Empire customers. These customers were seeking a refund of certain amounts paid for service provided by Empire between January 1, 2007, and December 13, 2007. At all times, we charged the three plaintiffs, and all of our customers, the rates approved by and on file with the MPSC from our 2006 rate case. We filed a motion asking the Court to dismiss the case. On October 1, 2013, the Missouri Supreme Court denied the plaintiff’s appeal affirming the Court’s dismissal with prejudice which finalizes the case.
Coal, Natural Gas and Transportation Contracts
The following table sets forth our firm physical gas, coal and transportation contracts for the periods indicated as of September 30, 2013 (in millions).
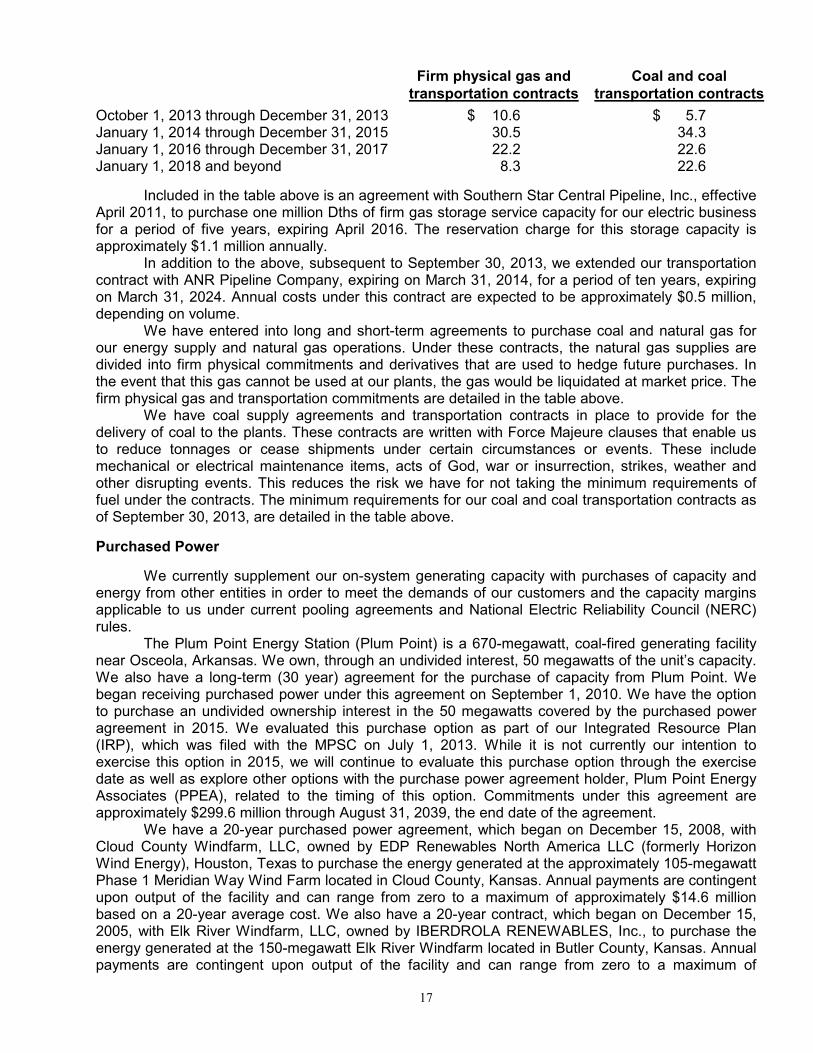
17
Firm physical gas and transportation contracts
Coal and coal transportation contracts
October 1, 2013 through December 31, 2013 $ 10.6 $ 5.7 January 1, 2014 through December 31, 2015 30.5 34.3 January 1, 2016 through December 31, 2017 22.2 22.6 January 1, 2018 and beyond 8.3 22.6
Included in the table above is an agreement with Southern Star Central Pipeline, Inc., effective April 2011, to purchase one million Dths of firm gas storage service capacity for our electric business for a period of five years, expiring April 2016. The reservation charge for this storage capacity is approximately $1.1 million annually.
In addition to the above, subsequent to September 30, 2013, we extended our transportation contract with ANR Pipeline Company, expiring on March 31, 2014, for a period of ten years, expiring on March 31, 2024. Annual costs under this contract are expected to be approximately $0.5 million, depending on volume. We have entered into long and short-term agreements to purchase coal and natural gas for our energy supply and natural gas operations. Under these contracts, the natural gas supplies are divided into firm physical commitments and derivatives that are used to hedge future purchases. In the event that this gas cannot be used at our plants, the gas would be liquidated at market price. The firm physical gas and transportation commitments are detailed in the table above. We have coal supply agreements and transportation contracts in place to provide for the delivery of coal to the plants. These contracts are written with Force Majeure clauses that enable us to reduce tonnages or cease shipments under certain circumstances or events. These include mechanical or electrical maintenance items, acts of God, war or insurrection, strikes, weather and other disrupting events. This reduces the risk we have for not taking the minimum requirements of fuel under the contracts. The minimum requirements for our coal and coal transportation contracts as of September 30, 2013, are detailed in the table above.
Purchased Power
We currently supplement our on-system generating capacity with purchases of capacity and energy from other entities in order to meet the demands of our customers and the capacity margins applicable to us under current pooling agreements and National Electric Reliability Council (NERC) rules.
The Plum Point Energy Station (Plum Point) is a 670-megawatt, coal-fired generating facility near Osceola, Arkansas. We own, through an undivided interest, 50 megawatts of the unit’s capacity. We also have a long-term (30 year) agreement for the purchase of capacity from Plum Point. We began receiving purchased power under this agreement on September 1, 2010. We have the option to purchase an undivided ownership interest in the 50 megawatts covered by the purchased power agreement in 2015. We evaluated this purchase option as part of our Integrated Resource Plan (IRP), which was filed with the MPSC on July 1, 2013. While it is not currently our intention to exercise this option in 2015, we will continue to evaluate this purchase option through the exercise date as well as explore other options with the purchase power agreement holder, Plum Point Energy Associates (PPEA), related to the timing of this option. Commitments under this agreement are approximately $299.6 million through August 31, 2039, the end date of the agreement.
We have a 20-year purchased power agreement, which began on December 15, 2008, with Cloud County Windfarm, LLC, owned by EDP Renewables North America LLC (formerly Horizon Wind Energy), Houston, Texas to purchase the energy generated at the approximately 105-megawatt Phase 1 Meridian Way Wind Farm located in Cloud County, Kansas. Annual payments are contingent upon output of the facility and can range from zero to a maximum of approximately $14.6 million based on a 20-year average cost. We also have a 20-year contract, which began on December 15, 2005, with Elk River Windfarm, LLC, owned by IBERDROLA RENEWABLES, Inc., to purchase the energy generated at the 150-megawatt Elk River Windfarm located in Butler County, Kansas. Annual payments are contingent upon output of the facility and can range from zero to a maximum of

18
approximately $16.9 million based on a 20-year average cost. Although these agreements are considered operating leases under Generally Accepted Accounting Principles (GAAP), payments for these wind agreements are recorded as purchased power expenses, and, because of the contingent nature of these payments, are not included in our operating lease obligations. We do not own any portion of these windfarms.
New Construction
On July 9, 2013, we signed a contract with a third party vendor to complete engineering, procurement, and construction activities at our Riverton plant to convert Riverton Unit 12 from a simple cycle combustion turbine to a combined cycle unit. The conversion will include the installation of a heat recovery steam generator (HRSG), steam turbine generator, auxiliary boiler, cooling tower, and other auxiliary equipment. The Air Emission Source Construction Permit necessary for this project was issued by Kansas Department of Health and Environment on July 11, 2013. See “Environmental Matters” below for additional information about this project and associated compliance measures.
On January 16, 2012, we signed a contract with a third party vendor to complete environmental retrofits at our Asbury plant. The retrofits include the installation of a pulse-jet fabric filter (baghouse), circulating dry scrubber and powder activated carbon injection system. This equipment will enable us to comply with the Mercury and Air Toxics Standard (MATS). See “Environmental Matters” below for more information and for project costs.
Leases
We have purchased power agreements with Cloud County Windfarm, LLC and Elk River Windfarm, LLC, which are considered operating leases for GAAP purposes. Details of these agreements are disclosed in the Purchased Power section of this note. We also currently have short-term operating leases for two unit trains to meet coal delivery demands, for garage and office facilities for our electric segment and for one office facility related to our gas segment. In addition, we have capital leases for certain office equipment and 108 railcars to provide coal delivery for our ownership and purchased power agreement shares of the Plum Point generating facility.
Environmental Matters
We are subject to various federal, state, and local laws and regulations with respect to air and water quality and with respect to hazardous and toxic materials and hazardous and other wastes, including their identification, transportation, disposal, record-keeping and reporting, as well as remediation of contaminated sites and other environmental matters. We believe that our operations are in material compliance with present environmental laws and regulations. Environmental requirements have changed frequently and become more stringent over time. We expect this trend to continue. While we are not in a position to accurately estimate compliance costs for any new requirements, we expect any such costs to be material, although recoverable in rates.
Electric Segment
The Federal Clean Air Act (CAA) and comparable state laws regulate air emissions from stationary sources such as electric power plants through permitting and/or emission control and related requirements. These requirements include maximum emission limits on our facilities for sulfur dioxide (SO2), particulate matter, nitrogen oxides (NOx) and hazardous air pollutants including mercury. In the future they will include limits on greenhouse gases (GHG) such as carbon dioxide (CO2).
19
Permits
Under the CAA we have obtained, and renewed as necessary, site operating permits, which are valid for five years, for each of our plants. As stated above, on July 11, 2013, we received the Air Emission Source Construction Permit necessary to begin construction on the Riverton 12 Combined Cycle Conversion project.
Compliance Plan
In order to comply with forthcoming environmental regulations, Empire is taking actions to implement its compliance plan and strategy (Compliance Plan). While the Cross State Air Pollution Rule (CSAPR – formerly the Clean Air Transport Rule, or CATR) that was set to take effect on January 1, 2012 was stayed in late December 2011 then vacated in August 2012 by the District of Columbia Circuit Court of Appeals, the Mercury Air Toxics Standard (MATS) was signed by the Environmental Protection Agency (EPA) Administrator on December 16, 2011 and became effective on April 16, 2012. MATS requires compliance by April 2015 (with flexibility for extensions for reliability reasons). Our Compliance Plan largely follows the preferred plan presented in our 2010 Integrated Resource Plan (IRP) and is further supported by our recent IRP filing. As described above under New Construction, we have begun the installation of a scrubber, fabric filter, and powder activated carbon injection system at our Asbury plant. The addition of this air quality control equipment is expected to be completed by early 2015 at a cost ranging from $112.0 million to $130.0 million, excluding AFUDC. Construction costs through September 30, 2013 were $43.2 million for 2013 and $73.5 million for the project to date, excluding AFUDC. The addition of this air quality control equipment will require the retirement of Asbury Unit 2, a steam turbine currently rated at 14 megawatts that is used for peaking purposes.
In September 2012, we completed the transition of our Riverton Units 7 and 8 from operation on coal to operating completely on natural gas. Riverton Units 7 and 8, along with Riverton Unit 9, a small combustion turbine that requires steam from Unit 7 or 8 for start-up, will be retired upon the conversion of Riverton Unit 12, a simple cycle combustion turbine, to a combined cycle unit. This conversion is currently scheduled to be completed in mid-2016 at a cost estimated to range from $165 million to $175 million, excluding AFUDC. This amount is included in our updated five-year capital expenditure plan disclosed in our 2013 third quarter 10-Q. Construction costs, consisting of pre-engineering and site preparation activities thus far, through September 30, 2013 were $5.3 million for 2013 and $5.9 million for the project to date, excluding AFUDC.
SO2 Emissions
The CAA regulates the amount of SO2 an affected unit can emit. Currently SO2 emissions are regulated by the Title IV Acid Rain Program and the Clean Air Interstate Rule (CAIR). On January 1, 2012, CAIR was to have been replaced by the Cross-State Air Pollution Rule (CSAPR). But, as discussed above, CSAPR was subsequently vacated, and CAIR will remain in effect until the EPA develops a valid replacement.
On October 5, 2012, the Department of Justice, on behalf of the EPA, requested that the Court of Appeals grant a request for a re-hearing of CSAPR. On January 24, 2013, the request was denied by the Court of Appeals and on March 29, 2013, the EPA petitioned the United States Supreme Court (the Supreme Court) to review the D.C. Circuit Court’s decision. On June 24, 2013 the Supreme Court agreed to review the D.C. Circuit court’s decision with a hearing date set for December 6, 2013 and a decision expected by June 30, 2014. In the meantime, both the Title IV Acid Rain Program and CAIR will remain in effect.
The Mercury Air Toxics Standards (MATS), discussed further below, was signed on December 16, 2011, and will affect SO2 emission rates at our facilities. In addition, the compliance date for the revised SO2 National Ambient Air Quality Standards (NAAQS) is August of 2017; this could also affect SO2 emissions at our facilities. The SO2 NAAQS is discussed in more detail below.

20
Title IV Acid Rain Program:
Under the Title IV Acid Rain Program, each existing affected unit has been allocated a specific number of emission allowances by the U.S. Environmental Protection Agency (EPA). Each allowance entitles the holder to emit one ton of SO2. Covered utilities, such as Empire, must have emission allowances equal to the number of tons of SO2 emitted during a given year by each of their affected units. Allowances in excess of the annual emissions are banked for future use. In 2012, our SO2 emissions exceeded the annual allocations. This deficit was covered by our banked allowances. We estimate our Title IV Acid Rain Program SO2 allowance bank plus annual allocations will be more than our projected emissions through 2017. Long-term compliance with this program will be met by the Compliance Plan detailed above along with possible procurement of additional SO2 allowances. We expect the cost of compliance to be fully recoverable in our rates.
CAIR:
In 2005, the EPA promulgated CAIR under the CAA. CAIR generally calls for fossil-fueled power plants greater than 25 megawatts to reduce emission levels of SO2 and/or NOx in 28 eastern states and the District of Columbia, including Missouri, where our Asbury, Energy Center, State Line and Iatan Units No. 1 and No. 2 are located. Kansas was not included in CAIR and our Riverton Plant was not affected. Arkansas, where our Plum Point Plant is located, was included for ozone season NOx but not for SO2.
In 2008, the U.S. Court of Appeals for the District of Columbia vacated CAIR and remanded it back to EPA for further consideration, but also stayed its vacatur. As a result, CAIR became effective for NOx on January 1, 2009 and for SO2 on January 1, 2010 and required covered states to develop State Implementation Plans (SIPs) to comply with specific SO2 state-wide annual budgets.
SO2 allowance allocations under the Title IV Acid Rain Program are used for compliance in the CAIR SO2 Program. For our Missouri units, beginning in 2010, CAIR required the SO2 allowances to be utilized at a 2:1 ratio and, beginning in 2015, will require the SO2 allowances to be utilized at a 2.86:1 ratio. As a result, based on current SO2 allowance usage projections, we expect to have sufficient allowances to take us through 2017.
In order to meet CAIR requirements for SO2 and NOx emissions (NOx is discussed below in more detail) and as a requirement for the air permit for Iatan 2, a Selective Catalytic Reduction system (SCR), a Flue-Gas Desulfurization (FGD) scrubber system and baghouse were installed at our jointly-owned Iatan 1 plant and a SCR was placed in service at our Asbury plant in 2008. Our jointly-owned Iatan 2 and Plum Point plants were originally constructed with the above technology.
CSAPR- formerly the Clean Air Transport Rule:
On July 6, 2010, the EPA published a proposed CAIR replacement rule entitled the Clean Air Transport Rule (CATR). As proposed and supplemented, the CATR included Missouri and Kansas under both the annual and ozone season for NOx as well as the SO2 program while Arkansas remained in the ozone season NOx program only. The final CATR was released on July 7, 2011 under the name of the CSAPR, and was set to become effective January 1, 2012. However, as mentioned above, the District of Columbia Circuit Court of Appeals vacated CSAPR on August 21, 2012, and the EPA has subsequently petitioned the Supreme Court to review the D.C. Circuit Court’s decision. On June 24, 2013 the Supreme Court agreed to review the D.C. Circuit court’s decision, which is set to occur December 6, 2013. The CAIR will be in effect until a valid replacement is developed by the EPA.
When it was published, the final CSAPR required a 73% reduction in SO2 from 2005 levels by 2014. The SO2 allowances allocated under the EPA’s Title IV Acid Rain Program could not be used for compliance with CSAPR but would continue to be used for compliance with the Title IV Acid Rain Program. Therefore, new SO2 allowances would be allocated under CSAPR and retired at one allowance per ton of SO2 emissions emitted. Based on current projections, we would receive more SO2 allowances than would be emitted. Long-term compliance with this Rule will be met by the Compliance Plan detailed above along with possible procurement of additional SO2 allowances. We
21
anticipate compliance costs associated with CAIR or its subsequent replacement to be recoverable in our rates.
Mercury Air Toxics Standard (MATS):
The MATS standard was fully implemented and effective as of April 16, 2012, thus requiring compliance by April 16, 2015 (with flexibility for extensions for reliability reasons). The MATS regulation does not include allowance mechanisms. Rather, it establishes alternative standards for certain pollutants, including SO2 (as a surrogate for hydrogen chloride (HCI)), which must be met to show compliance with hazardous air pollutant limits (see additional discussion in the MATS section below).
SO2 National Ambient Air Quality Standard (NAAQS):
In June 2010, the EPA finalized a new 1-hour SO2 NAAQS which, for areas with no ambient SO2 monitor, originally required modeling to determine attainment and non-attainment areas within each state. In April 2012, the EPA announced that it is reconsidering this approach. The modeling of emission sources was to have been completed by June 2013 with compliance with the SO2 NAAQS required by August 2017. Because the EPA is reconsidering the compliance determination approach for areas without ambient SO2 monitors, the compliance time-frame may be pushed back. Draft guidance for 1-hour SO2 NAAQS has been published by the EPA to assist states as they prepare their SIP submissions. The EPA is also planning a rulemaking called the Data Requirements Rule (DRR) to address some of the 1-hour SO2 NAAQS implementation program elements. It is likely that coal-fired generating units will need scrubbers to be capable of meeting the new 1-hour SO2 NAAQS. In addition, units will be required to include SO2 emissions limits in their Title V permits or execute consent decrees to assure attainment and future compliance.
NOx Emissions
The CAA regulates the amount of NOx an affected unit can emit. As currently operated, each of our affected units is in compliance with the applicable NOx limits. Currently, revised NOx emissions are limited by the CAIR as a result of the vacated CSPAR rule and by ozone NAAQS rules (discussed below) which were established in 1997 and in 2008.
CAIR:
The CAIR required covered states to develop SIPs to comply with specific annual NOx state-wide allowance allocation budgets. Based on existing SIPs, we had excess NOx allowances during 2012 which were banked for future use and will be sufficient for compliance through at least the end of 2017. The CAIR NOx program also was to have been replaced by the CSAPR program January 1, 2012 but because the D.C. Circuit Court vacated CSAPR and the case is being re-heard by the Supreme Court, CAIR will remain in effect until the EPA develops a valid replacement.
CSAPR:
As published, the CSAPR would have required a 54% reduction in NOx from 2005 levels by 2014. The NOx annual and ozone season allowances that were allocated and banked under CAIR could not be used for compliance under CSAPR. New allowances would have been issued under CSAPR. However, as discussed above, CSPAR was vacated by the District of Columbia Circuit Court of Appeals on August 21, 2012 and the case is set to be re-heard by the Supreme Court on December 6, 2013.
Ozone NAAQS:
Ozone, also called ground level smog, is formed by the mixing of NOx and Volatile Organic Compounds (VOCs) in the presence of sunlight. On January 6, 2010, to protect public health, the
22
EPA proposed to lower the primary NAAQS for ozone to a range between 60 and 70 ppb and to set a separate secondary NAAQS for ozone to protect sensitive vegetation and ecosystems.
On September 2, 2011, President Obama ordered the EPA to withdraw proposed air quality standards lowering the 2008 ozone standard pending the CAA 2013 scheduled reconsideration of the ozone NAAQS (the normal 5 year reconsideration period). States moved forward with area designations based on the 2008 75 ppb standard using 2008-2010 quality assured monitoring data. Our service territory is designated as attainment, meaning that it is in compliance with the standard.
A revised Ozone NAAQS is expected to be proposed by the EPA early 2014 and is anticipated to be between 60 and 70 ppb.
PM NAAQS:
Particulate matter (PM) is the term for particles found in the air which comes from a variety of sources. On January 15, 2013, the EPA finalized the PM 2.5 primary annual standard at 12 ug/m
3
(micrograms per cubic meter of air). States are required to meet the primary standard in 2020. The standard should have no impact on our existing generating fleet because the PM 2.5
ambient monitor results are below the required level. However, the proposed standards could impact future major modifications/construction projects that require a Prevention of Significant Deterioration (PSD) permit.
Mercury Air Toxics Standard (MATS)
In 2005, the EPA issued the Clean Air Mercury Rule (CAMR) under the CAA. It set limits on mercury emissions by power plants and created a market-based cap and trade system expected to reduce nationwide mercury emissions in two phases. New mercury emission limits for Phase 1 were to go into effect January 1, 2010. On February 8, 2008, the U.S. Court of Appeals for the District of Columbia vacated CAMR. This decision was appealed to the U.S. Supreme Court which denied the appeal on February 23, 2009.
The EPA issued Information Collection Requests (ICR) for determining the National Emission Standards for Hazardous Air Pollutants (NESHAP), including mercury, for coal and oil-fired electric steam generating units on December 24, 2009. The ICRs included our Iatan, Asbury and Riverton plants. All responses to the ICRs were submitted as required. The EPA ICRs were intended for use in developing regulations under Section 112(r) of the CAA maximum achievable emission standards for the control of the emission of hazardous air pollutants (HAPs), including mercury. The EPA proposed the national mercury and air toxics standards (MATS) in March 2011, which became effective April 16, 2012. MATS establishes numerical emission limits to reduce emissions of heavy metals, including mercury (Hg), arsenic, chromium, and nickel, and acid gases, including HCl and hydrogen fluoride (HF). For all existing and new coal-fired electric utility steam generating units (EGUs), the proposed standard will be phased in over three years, and allows states the ability to give facilities a fourth year to comply. On March 28, 2013, the EPA finalized updates to certain emission limits for new power plants under the MATS. The new standards affect only new coal and oil-fired power plants that will be built in the future. The update does not change the final emission limits or other requirements for existing power plants. On June 25, 2013, the startup, shutdown portion of the MATS was proposed for reconsideration in order to better define startup and shutdown periods (instances when the emission unit is on but the pollution control equipment is not in full operation) that will be excluded from emissions averaging for compliance purposes.
The MATS regulation of HAPs in combination with CSAPR is the driving regulation behind our Compliance Plan and its implementation schedule. We expect compliance costs to be recoverable in our rates.
Greenhouse Gases
Our coal and gas plants, vehicles and other facilities, including EDG (our gas segment), emit CO2 and/or other Greenhouse Gases (GHGs) which are measured in Carbon Dioxide Equivalents (CO2e).

23
On September 22, 2009, the EPA issued the final Mandatory Reporting of Greenhouse Gases Rule under the CAA which requires power generating and certain other facilities that equal or exceed an emission threshold of 25,000 metric tons of CO2e to report GHGs to the EPA annually commencing in September 2011. EDE and EDG’s GHG emissions for 2011 and 2012 have been reported as required to the EPA.
On December 7, 2009, responding to a 2007 U.S. Supreme Court decision that determined that GHGs constitute “air pollutants” under the CAA, the EPA issued its final finding that GHGs threaten both the public health and the public welfare. This “endangerment” finding did not itself trigger any EPA regulations, but was a necessary predicate for the EPA to proceed with regulations to control GHGs. Since that time, a series of rules including the Prevention of Significant Deterioration and Title V Greenhouse Gas Tailoring Rule (Tailoring Rule) have been issued by the EPA. Several parties have filed petitions with the EPA and lawsuits have been filed challenging these rules. On June 26, 2012, the D.C. Circuit Court issued its opinion in the principal litigation of the EPA GHG rules (Endangerment, the Tailoring Rule, GHG emission standards for light-duty vehicles, and the EPA's rule on reconsideration of the PSD Interpretive Memorandum). The three-judge panel upheld the EPA’s interpretation of the Clean Air Act provisions as unambiguously correct. This opinion solidifies the EPA’s position that the CAA requires PSD and Title V permits for major emitters of greenhouse gases, such as Empire. Our ongoing projects are currently being evaluated for the projected increase or decrease of CO2e emissions as required by the Tailoring Rule.
As the result of an agreement to settle litigation pending in the U.S. Court of Appeals, on April 13, 2012, the EPA proposed a Carbon Pollution Standard for new power plants to limit the amount of carbon emitted by electric utility generating units (EGUs). In light of the more than 2.5 million comments received by the EPA, this standard was rescinded, and a re-proposal of standards of performance for affected fossil fuel-fired EGUs was issued on September 20, 2013 as required by President Obama. The proposed rule sets separate standards for natural gas-fired combustion turbines and for fossil fuel-fired utility boilers. Limiting CO2 output to 1,000 or 1,100 pounds per megawatt hour based on size and fuel type, the standards apply only to new EGUs. It is expected that most new natural gas-fired combined cycle units will meet the new standard. The EPA believes fossil-fuel fired boilers can meet the standard through efficient technology or some level of carbon capture and sequestration, but the high cost, technical feasibility, and long term liability of stored carbon are issues that have not been resolved and limit this option for Empire and all electric utilities.
The proposal would not apply to existing units including modifications such as those required to meet other air pollution standards which are currently being undertaken at our Asbury facility and at the Riverton facility with the conversion of simple cycle Unit 12 to combined cycle. In response to President Obama’s June 25, 2013 memorandum to the EPA Administrator, the EPA is engaging states and stakeholders in a process to identify approaches to establish carbon pollution standards for currently operating power plants.
President Obama’s memorandum to the EPA Administrator requested the EPA issue proposed carbon pollution standards, regulations, or guidelines for modified, reconstructed, and existing power plants by no later than June 1, 2014; issue final standards, regulations, or guidelines, for modified, reconstructed, and existing power plants by no later than June 1, 2015; and include in the guidelines addressing existing power plants a requirement that states submit to the EPA implementation plans by no later than June 30, 2016. As of October 15, 2013, the U.S. Supreme Court agreed to review an appeals court decision that said the EPA could regulate greenhouse gas emissions from fixed sources based on a previous decision based on green house emissions from cars.
In addition, a variety of proposals have been and are likely to continue to be considered by Congress to reduce GHGs. Proposals are also being considered in the House and Senate that would delay, limit or eliminate the EPA’s authority to regulate GHGs. At this time, it is not possible to predict what legislation, if any, will ultimately emerge from Congress regarding control of GHGs.
Certain states have taken steps to develop cap and trade programs and/or other regulatory systems which may be more stringent than federal requirements. For example, Kansas is a participating member of the Midwestern Greenhouse Gas Reduction Accord (MGGRA), one purpose of which is to develop a market-based cap and trade mechanism to reduce GHG emissions. The
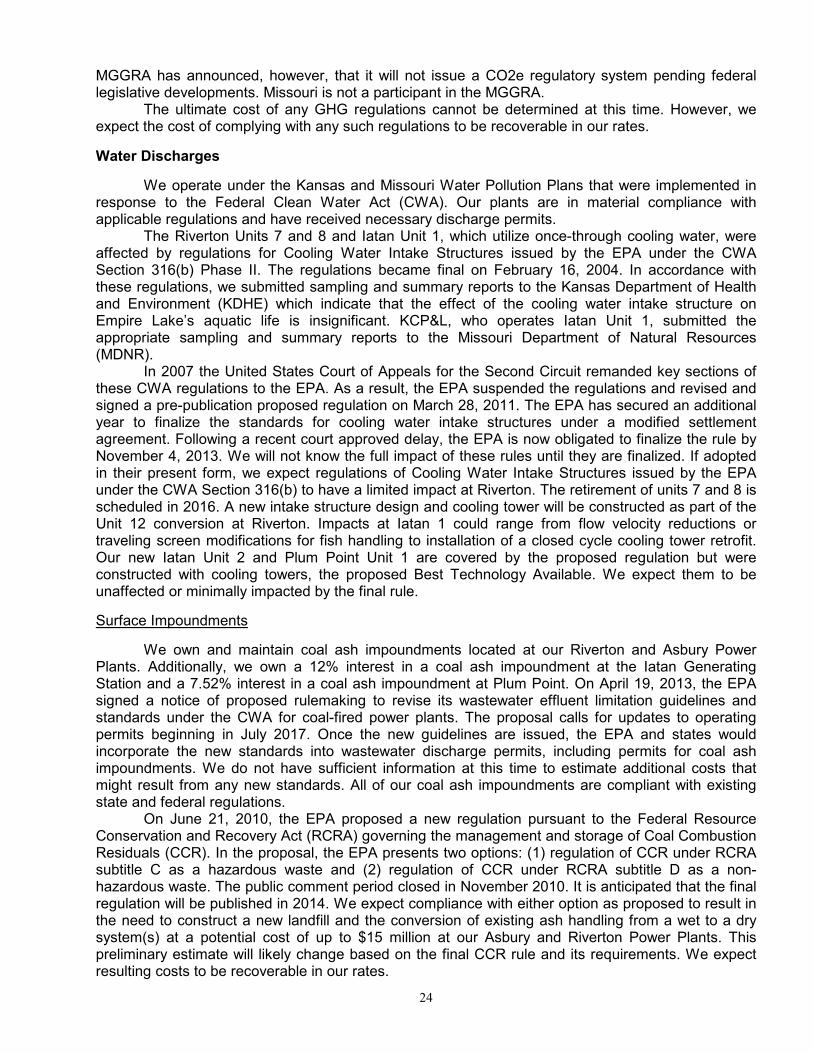
24
MGGRA has announced, however, that it will not issue a CO2e regulatory system pending federal legislative developments. Missouri is not a participant in the MGGRA.
The ultimate cost of any GHG regulations cannot be determined at this time. However, we expect the cost of complying with any such regulations to be recoverable in our rates.
Water Discharges
We operate under the Kansas and Missouri Water Pollution Plans that were implemented in response to the Federal Clean Water Act (CWA). Our plants are in material compliance with applicable regulations and have received necessary discharge permits.
The Riverton Units 7 and 8 and Iatan Unit 1, which utilize once-through cooling water, were affected by regulations for Cooling Water Intake Structures issued by the EPA under the CWA Section 316(b) Phase II. The regulations became final on February 16, 2004. In accordance with these regulations, we submitted sampling and summary reports to the Kansas Department of Health and Environment (KDHE) which indicate that the effect of the cooling water intake structure on Empire Lake’s aquatic life is insignificant. KCP&L, who operates Iatan Unit 1, submitted the appropriate sampling and summary reports to the Missouri Department of Natural Resources (MDNR).
In 2007 the United States Court of Appeals for the Second Circuit remanded key sections of these CWA regulations to the EPA. As a result, the EPA suspended the regulations and revised and signed a pre-publication proposed regulation on March 28, 2011. The EPA has secured an additional year to finalize the standards for cooling water intake structures under a modified settlement agreement. Following a recent court approved delay, the EPA is now obligated to finalize the rule by November 4, 2013. We will not know the full impact of these rules until they are finalized. If adopted in their present form, we expect regulations of Cooling Water Intake Structures issued by the EPA under the CWA Section 316(b) to have a limited impact at Riverton. The retirement of units 7 and 8 is scheduled in 2016. A new intake structure design and cooling tower will be constructed as part of the Unit 12 conversion at Riverton. Impacts at Iatan 1 could range from flow velocity reductions or traveling screen modifications for fish handling to installation of a closed cycle cooling tower retrofit. Our new Iatan Unit 2 and Plum Point Unit 1 are covered by the proposed regulation but were constructed with cooling towers, the proposed Best Technology Available. We expect them to be unaffected or minimally impacted by the final rule.
Surface Impoundments
We own and maintain coal ash impoundments located at our Riverton and Asbury Power Plants. Additionally, we own a 12% interest in a coal ash impoundment at the Iatan Generating Station and a 7.52% interest in a coal ash impoundment at Plum Point. On April 19, 2013, the EPA signed a notice of proposed rulemaking to revise its wastewater effluent limitation guidelines and standards under the CWA for coal-fired power plants. The proposal calls for updates to operating permits beginning in July 2017. Once the new guidelines are issued, the EPA and states would incorporate the new standards into wastewater discharge permits, including permits for coal ash impoundments. We do not have sufficient information at this time to estimate additional costs that might result from any new standards. All of our coal ash impoundments are compliant with existing state and federal regulations.
On June 21, 2010, the EPA proposed a new regulation pursuant to the Federal Resource Conservation and Recovery Act (RCRA) governing the management and storage of Coal Combustion Residuals (CCR). In the proposal, the EPA presents two options: (1) regulation of CCR under RCRA subtitle C as a hazardous waste and (2) regulation of CCR under RCRA subtitle D as a non-hazardous waste. The public comment period closed in November 2010. It is anticipated that the final regulation will be published in 2014. We expect compliance with either option as proposed to result in the need to construct a new landfill and the conversion of existing ash handling from a wet to a dry system(s) at a potential cost of up to $15 million at our Asbury and Riverton Power Plants. This preliminary estimate will likely change based on the final CCR rule and its requirements. We expect resulting costs to be recoverable in our rates.
25
On September 23, 2010 and on November 4, 2010 EPA consultants conducted on-site inspections of our Riverton and Asbury coal ash impoundments, respectively. The consultants performed a visual inspection of the impoundments to assess the structural integrity of the berms surrounding the impoundments, requested documentation related to construction of the impoundments, and reviewed recently completed engineering evaluations of the impoundments and their structural integrity. In response to the inspection comments, the recommended geotechnical studies have been completed and new flow monitoring devices and settlement monuments at both coal ash impoundments have been installed. As a result of the transition from coal to natural gas, closure of the Riverton impoundment is in progress in compliance with KDHE Bureau of Waste Management regulations. We expect to complete the closure by late 2013. The final design for additional recommendations that will improve safety for slope stability at the Asbury impoundment is under review. We have received preliminary approval by the MDNR for the site permitting of a new utility waste landfill adjacent to the Asbury plant. Additionally, the work plan for the detailed site investigation (DSI) to include geologic and hydrologic investigations has been approved by the MDNR Division of Geology and Land Survey. Construction of the new landfill is expected in 2016.
Renewable Energy
As previously discussed, we have purchased power agreements with Cloud County Windfarm, LLC, located in Cloud County, Kansas and Elk River Windfarm, LLC, located in Butler County, Kansas. We do not own any portion of either windfarm. More than 15% of the energy we put into the grid comes from these long-term Purchased Power Agreements (PPAs). Through these PPAs, we generate about 900,000 renewable energy certificates (RECs) each year. A REC represents one megawatt-hour of renewable energy that has been delivered into the bulk power grid and “unbundles” the renewable attributes from the associated energy. This unbundling is important because it cannot be determined where the renewable energy is ultimately delivered once it enters the bulk power grid. As a result, RECs provide an avenue for renewable energy tracking and compliance purposes. Missouri regulations currently require us and other investor-owned utilities in Missouri to generate or purchase electricity from renewable energy sources, such as solar, wind, biomass and hydro power, or purchase RECs, at the rate of at least 2% of retail sales in 2012, increasing to at least 5% by 2014 and ultimately to at least 15% by 2021. We are currently in compliance with this regulatory requirement. The regulations require that 2% of the renewable energy source must be solar; however, we believe we are exempted from the solar requirement. A challenge to our exemption, brought by two of our customers and Power Source Solar, Inc., was dismissed on May 31, 2011 by the Missouri Western District Court of Appeals. The plaintiffs filed in the Missouri Supreme Court for transfer of the case from the Missouri Western District to the Missouri Supreme Court. The transfer was denied. On January 30, 2013, a complaint was filed with the MPSC by Renew Missouri and others regarding several points of our 2011 RES Compliance Report and the 2012-2014 Compliance Plan. The complaint, which was lodged against four investor-owned utilities (Ameren Missouri, Kansas City Power & Light Company (KCP&L), KCP&L Greater Missouri Operations, and Empire), is currently under consideration by the MPSC. On October 3, 2013, the MPSC issued an order denying motions for summary determination of Renew Missouri and KCP&L/GMO, but granting motion for summary determination of Empire. In this order, the MPSC determined the provisions of the rule exempt Empire from the obligation to provide a detailed explanation of the calculation of the RES retail impact limit for its 2012 Plan. By granting Empire’s motion, the MPSC unconsolidated the complaint against Empire and ordered that it would proceed independently. Items remaining under consideration from the original complaint include the qualification of Empire’s Ozark Beach facility as a hydropower renewable energy resource, the use of early RECs for compliance and Empire’s exemption from the use of solar RECs for compliance. Renewable energy standard compliance rules were published by the MPSC on July 7, 2010. Missouri investor-owned utilities and others initiated litigation to challenge these rules. On June 30, 2011, a Cole County Circuit Court judge ruled that portions of the MPSC rules were unlawful and unreasonable, in conflict with Missouri statute and in violation of the Missouri Constitution. Subsequent to that decision, a portion of the appeal was dropped and the entire order was stayed. On December 27, 2011 the judge issued another order identical to the one that was stayed except
26
that the rulings with regard to the constitutionality issue had been omitted. The MPSC appealed this decision and in November of 2012 the court dismissed lawsuits brought against the RES and affirmed the MPSC rules that were finalized in July 2010. Kansas established a renewable portfolio standard (RPS), effective November 19, 2010. It requires 10% of our Kansas retail customer peak capacity requirements to be sourced from renewables in 2012, increasing to 15% by 2016, and 20% by 2020. In addition, there are several proposals currently before the U.S. Congress to adopt a nationwide RPS. We have been selling the majority of our RECs and plan to continue to sell all or a portion of them in the future. As a result of these REC sales, we cannot claim the underlying energy is renewable. Once a REC has been claimed or retired, it cannot be used for any other purpose. At the end of 2012, sufficient RECs, including hydro, were retired to comply with the Missouri and Kansas requirements through the end of November 2012. Additional RECs were retired in January of 2013 to complete the process for 2012. In the future, we will continue to retain a sufficient amount of RECs to meet any current or future requirements.
Gas Segment
The acquisition of Missouri Gas in June 2006 involved the property transfer of two former manufactured gas plant (FMGP) sites owned by predecessors. Site #1 in Chillicothe, Missouri is listed in the MDNR Registry of Confirmed Abandoned or Uncontrolled Hazardous Waste Disposal Sites in Missouri. No remediation of this site is expected to be required in the near term. We have received a letter stating no further action is required from the MDNR with respect to Site #2 in Marshall, Missouri. We have incurred $0.2 million in remediation costs and estimate further remediation costs at these two FMGP sites to be minimal.
Note 8 – Retirement Benefits
Net periodic benefit cost, some of which is capitalized as a component of labor cost and some of which is deferred as a regulatory asset, is comprised of the following components and is shown for our noncontributory defined benefit pension plan, our supplemental retirement program (SERP) and other postretirement benefits (OPEB) (in thousands):
Three months ended September 30, Pension Benefits SERP OPEB 2013 2012 2013 2012 2013 2012 Service cost $ 1,863 $ 1,439 $ 34 $ 23 $ 735 $ 671 Interest cost 2,516 2,591 78 86 957 962 Expected return on plan assets (3,107) (3,080) - - (1,088) (1,018)
Amortization of prior service cost (1) 133 133 (2) (2) (253) (253)
Amortization of net actuarial loss (1) 2,611 2,052 142 139 565 311
Net periodic benefit cost $ 4,016 $ 3,135 $ 252 $ 246 $ 916 $ 673
Nine months ended September 30, Pension Benefits SERP OPEB 2013 2012 2013 2012 2013 2012 Service cost $ 5,590 $ 4,696 $ 101 $ 39 $ 2,206 $ 1,801 Interest cost 7,547 7,693 236 197 2,870 3,027 Expected return on plan assets (9,321) (9,232) - - (3,265) (3,101)
Amortization of prior service cost (1) 399 398 (6) (6) (758) (758)
Amortization of net actuarial loss (1) 7,834 5,952 426 291 1,696 1,246
Net periodic benefit cost $ 12,049 $ 9,507 $ 757 $ 521 $ 2,749 $ 2,215

27
Twelve months ended September 30, Pension Benefits SERP OPEB 2013 2012 2013 2012 2013 2012 Service cost $ 7,156 $ 6,094 $ 114 $ 62 $ 2,806 $ 2,367 Interest cost 10,111 10,295 301 243 3,879 4,123 Expected return on plan assets (12,398) (12,017) - - (4,299) (4,140)
Amortization of prior service cost (1) 531 532 (8) (8) (1,011) (1,011)
Amortization of net actuarial loss (1) 9,818 7,325 523 334 2,112 1,687
Net periodic benefit cost $ 15,218 $ 12,229 $ 930 $ 631 $ 3,487 $ 3,026
(1) Amounts are amortized from our regulatory asset originally recorded upon recognizing our net pension liability on the balance sheet.
In accordance with our regulatory agreements, our pension funding policy is to make contributions that are at least equal to the greater of either the minimum funding requirements of ERISA or the accrued cost of the plan. We made pension contributions of approximately $16.2 million in July 2013, which are expected to satisfy our funding requirements for the year. The actual minimum funding requirements will be determined based on the results of the actuarial valuations. Our OPEB funding policy is to contribute annually an amount at least equal to the actuarial cost of postretirement benefits.
Note 9– Stock-Based Awards and Programs
Our performance-based restricted stock awards, stock options and their related dividend equivalents and time-vested restricted stock awards are valued as liability awards, in accordance with fair value guidelines. We allow employees to elect to have taxes in excess of the minimum statutory requirements withheld from their awards and, therefore, the awards are classified as liability instruments under the ASC guidance on share based payment. Awards treated as liability instruments must be revalued each period until settled, and cost is accrued over the requisite service period and adjusted to fair value at each reporting period until settlement or expiration of the award. Grants were made in the first quarter of 2013 (the effect of which is included in the table below) but did not have a material impact on our results of operations. We had unrecognized compensation expense of $0.7 million as of September 30, 2013.
We recognized the following amounts in compensation expense and tax benefits for all of our stock-based awards and programs for the applicable periods ended September 30 (in thousands):
Three Months Ended Nine Months Ended Twelve Months Ended 2013 2012 2013 2012 2013 2012
Compensation Expense $ 363 $ 431 $ 2,057 $ 1,629 $ 2,305 $ 2,077
Tax Benefit Recognized 127 148 743 575 821 730
Performance-Based Restricted Stock Awards
Performance-based restricted stock awards consisting of the right to receive a number of shares of common stock at the end of the restricted period (assuming performance criteria are met) are granted to qualified individuals. We estimate the fair value of outstanding restricted stock awards using a Monte Carlo option valuation model.
Time-Vested Restricted Stock Awards
Beginning in 2011, we began granting time-vested restricted stock awards that vest after a three-year period, to qualified individuals in lieu of stock options. No dividend rights accumulate during the vesting period. Time-vested restricted stock is valued at an amount equal to the fair market value of our common stock on the date of grant. If employment terminates during the vesting period because of death, retirement, or disability, the participant is entitled to a pro-rata portion of the time-vested restricted stock awards such participant would otherwise have earned, which is distributed six months following the date of termination, with the remainder of the award forfeited. If employment is
28
terminated during the vesting period for reasons other than those listed above, the time-vested restricted stock awards will be forfeited on the date of the termination, unless the Board of Directors Compensation Committee determines, in its sole discretion, that the participant is entitled to a pro-rata portion of the award.
Stock Options
Stock option grants vest upon satisfaction of service conditions. The cost of the awards is generally recognized over the requisite (explicit) service period. The fair value of the outstanding options was estimated as of September 30, 2013 and 2012, under a Black-Scholes methodology.
Note 10- Regulated Operating Expenses
The following table sets forth the major components comprising “regulated operating expenses” under “Operating Revenue Deductions” on our consolidated statements of income (in thousands) for all periods presented ended September 30:
Three Months Ended
Three Months Ended
Nine Months Ended
Nine Months Ended
Twelve Months Ended
Twelve Months Ended
2013 2012 2013 2012 2013 2012 Electric transmission and distribution expense $ 5,530 $ 4,392 $ 16,509 $ 12,764 $ 20,828 $ 16,784 Natural gas transmission and distribution expense 681 554 1,803 1,870 2,376 2,463 Power operation expense (other than fuel) 3,942 4,129 11,953 11,232 15,766 14,898 Customer accounts and assistance expense 3,124 2,621 8,322 7,639 10,894 10,304 Employee pension expense (1) 2,662 2,562 8,062 7,637 10,605 10,118 Employee healthcare expense (1) 2,662 2,442 7,857 7,004 10,678 9,108 General office supplies and expense 2,997 2,530 9,589 7,805 12,560 10,445 Administrative and general expense 3,375 3,675 11,292 11,466 14,917 15,521 Allowance for uncollectible accounts 975 968 2,765 2,313 3,489 3,245 Regulatory reversal of gain on sale of assets - - 1,236 - 1,236 - Miscellaneous expense 152 165 496 500 675 686 Total $ 26,100 $ 24,038 $ 79,884 $ 70,230 $104,024 $ 93,572
(1) Does not include capitalized portion of costs, but reflects the GAAP expensed cost plus or minus costs deferred to and amortized from a regulatory asset and/or a regulatory liability for Missouri, Kansas and Oklahoma jurisdictions.
Note 11– Segment Information
We operate our business as three segments: electric, gas and other. As part of our electric segment, we also provide water service to three towns in Missouri. The other segment consists of our fiber optics business. The tables below present statement of income information, balance sheet information and capital expenditures of our business segments.
For the quarter ended September 30, 2013
Electric Gas Other Eliminations Total ($-000’s)
Statement of Income Information
Revenues $ 150,370 $ 4,952 $ 2,819 $ (655) $ 157,486
Depreciation and amortization 16,328 928 479 - 17,735
Federal and state income taxes 13,939 (369) 580 - 14,150
Operating income 31,589 364 943 - 32,896
Interest income 1 4 - 0 5
Interest expense 9,380 973 - 0 10,353
Income from AFUDC (debt and equity) 1,722 12 - - 1,734
Net income 23,652 (599) 943 - 23,996
Capital Expenditures
$ 45,164 $ 628 $ 334 $ 46,126
29
For the quarter ended September 30, 2012
Electric Gas Other Eliminations Total
($-000’s)
Statement of Income Information
Revenues $ 152,730 $ 4,999 $ 1,621 $ (148) $ 159,202
Depreciation and amortization 13,757 895 456 - 15,108
Federal and state income taxes 15,564 (232) 145 - 15,477
Operating income 34,517 532 233 - 35,282
Interest income 261 88 2 (86) 265
Interest expense 9,328 975 - (86) 10,217
Income from AFUDC (debt and equity) 532 3 - - 535
Net income 25,705 (399) 236 - 25,542
Capital Expenditures
$ 39,794 $ 783 $ 715 $ 41,292
For the nine months ended September 30, 2013
Electric Gas Other Eliminations Total ($-000’s)
Statement of Income Information
Revenues $ 406,158 $ 33,222 $ 6,844 $ (952) $ 445,272
Depreciation and amortization 47,216 2,778 1,477 - 51,471
Federal and state income taxes 26,882 707 1,092 - 28,681
Operating income 70,097 4,004 1,763 - 75,864
Interest income 498 109 7 (92) 522
Interest expense 28,273 2,926 - (92) 31,107
Income from AFUDC (debt and equity) 3,883 21 - - 3,904
Net income 45,373 1,136 1,774 - 48,283
Capital Expenditures
$ 114,734 $ 2,824 $ 1,276 $ 118,834
For the nine months ended September 30, 2012
Electric Gas Other Eliminations Total ($-000’s)
Statement of Income Information
Revenues $ 396,546 $ 26,486 $ 5,389 $ (444) $ 427,977
Depreciation and amortization 41,086 2,675 1,350 - 45,111
Federal and state income taxes 27,497 226 713 - 28,436
Operating income 72,594 3,120 1,140 - 76,854
Interest income 549 255 3 (239) 568
Interest expense 28,530 2,928 - (239) 31,219
Income from AFUDC (debt and equity) 800 5 - - 805
Net income 44,569 326 1,159 - 46,054
Capital Expenditures
$ 103,361 $ 2,352 $ 2,253 $ 107,966
30
For the twelve months ended September 30, 2013
Electric Gas Other Eliminations Total ($-000’s)
Statement of Income Information
Revenues $ 520,265 $ 46,585 $ 8,641 $ (1,099) $ 574,392
Depreciation and amortization 61,441 3,702 1,664 - 66,807
Federal and state income taxes 31,651 1,269 1,482 - 34,402
Operating income 86,948 5,889 2,394 - 95,231
Interest income 895 177 10 (156) 926
Interest expense 37,610 3,902 - (156) 41,356
Income from AFUDC (debt and equity) 5,002 25 - - 5,027
Net income 53,435 2,066 2,409 - 57,910
Capital Expenditures
$ 151,490 $ 4,043 $ 1,622 $ 157,155
For the twelve months ended September 30, 2012
Electric Gas Other Eliminations Total ($-000’s)
Statement of Income Information
Revenues $ 514,515 $ 39,571 $ 7,249 $ (592) $ 560,743
Depreciation and amortization 54,295 3,552 1,822 - 59,669
Federal and state income taxes 32,464 791 1,003 - 34,258
Operating income 89,754 4,995 1,608 - 96,357
Interest income 1,035 310 4 (294) 1,055
Interest expense 38,525 3,906 2 (294) 42,139
Income from AFUDC (debt and equity) 1,000 7 - - 1,007
Net Income 51,870 1,244 1,631 - 54,745
Capital Expenditures
$ 126,176 $ 3,599 $ 2,909 $ 132,684
As of September 30, 2013
($-000’s) Electric Gas
(1) Other Elimination
s Total
Balance Sheet Information
Total assets $ 2,085,805 $ 120,608 $ 30,295 $ (40,900) $ 2,195,808
(1) Includes goodwill of $39,492 and reflects the payment of a dividend and return of capital from the EDG subsidiary to
the parent in the third quarter of 2013.
As of December 31, 2012
($-000’s) Electric Gas(1) Other Elimination
s Total
Balance Sheet Information
Total assets $ 2,034,399 $ 148,814 $ 28,871 $ (85,715) $ 2,126,369
(1) Includes goodwill of $39,492.
31
Note 12– Income Taxes
The following table shows our provision for income taxes (in millions) and our consolidated effective federal and state income tax rates for the applicable periods ended September 30:
Three Months Ended Nine Months Ended Twelve Months Ended 2013 2012 2013 2012 2013 2012 Consolidated provision for income taxes $ 14.1 $ 15.5 $ 28.7 $ 28.4 $ 34.4 $ 34.3 Consolidated effective federal and state income tax rates
37.1%
37.7%
37.3%
38.2%
37.3%
38.5%
The effective income tax rate for the three, nine and twelve month periods ended September 30, 2013 is lower than comparable periods in 2012 primarily due to higher equity AFUDC income in 2013 compared with 2012. On September 13, 2013, the Internal Revenue Service and the Treasury Department released final regulations under Code Sections 162(a) and 263(a) on the deduction and capitalization of expenditures related to tangible property. These regulations apply to tax years beginning on or after January 1, 2014. We are currently analyzing their impact on our financial statements. We do not expect the regulations to have a material impact to our effective tax rate.
We do not have any unrecognized tax benefits as of September 30, 2013. We did not recognize any significant interest or penalties in any of the periods presented. We do not expect any significant changes to our unrecognized tax benefits over the next twelve months.
Item 2. Management's Discussion and Analysis of Financial Condition and Results of Operations
EXECUTIVE SUMMARY
We operate our businesses as three segments: electric, gas and other. The Empire District Electric Company (EDE) is an operating public utility engaged in the generation, purchase, transmission, distribution and sale of electricity in parts of Missouri, Kansas, Oklahoma and Arkansas, including the sale of wholesale energy to four towns in Missouri and Kansas. As part of our electric segment, we also provide water service to three towns in Missouri. The Empire District Gas Company (EDG) is our wholly owned subsidiary which provides natural gas distribution to customers in 48 communities in northwest, north central and west central Missouri. Our other segment consists of our fiber optics business. During the twelve months ended September 30, 2013, our gross operating revenues were derived as follows:
Electric segment sales* 90.6% Gas segment sales 8.1 Other segment sales 1.3
*Sales from our electric segment include 0.4% from the sale of water.
Earnings
The following table represents our basic and diluted earnings per weighted average share of common stock for the applicable periods ended September 30 (in dollars):
Three Months Ended Nine Months Ended Twelve Months Ended 2013 2012 2013 2012 2013 2012 Basic and diluted earnings per weighted average share of common stock
$ 0.56
$ 0.60
$ 1.13
$ 1.09
$ 1.36
$ 1.30

32
Increased electric and gas gross margins positively impacted net income for all three periods presented as of September 30, 2013. We define electric gross margins as electric revenues less fuel and purchased power costs. We define gas gross margins as gas operating revenues less cost of gas in rates.
Increases in electric customer rates resulting from the April 1, 2013 Missouri rate increase (see “Recent Activities – Regulatory Matters” below) and higher period over period customer counts drove increases in revenue and margin in each of the periods presented. AFUDC also increased during each of the periods due to higher levels of construction activity, positively impacting results.
Weather was a negative driver in each period. Weather that was cooler than normal and significantly cooler than the 2012 quarter offset the impact of increased customer rates during the 2013 quarter. The impact of favorable weather during the 2012-2013 winter cooling season was offset by the cooler third quarter 2013 weather discussed above. As a result, revenue and gross margin were negatively affected during the nine and twelve month periods. A change in our unbilled revenue estimate made in the third quarter of 2012 negatively impacted revenue and margin in all three periods ended September 30, 2013.
Increased regulatory operating expenses and depreciation and amortization expenses negatively impacted results in each period presented. In addition, a regulatory write off of approximately $3.6 million (see “Recent Activities – Regulatory Matters” below) negatively impacted nine and twelve month results. Factors impacting gross margin and net income for the quarter, nine months and twelve months ended September 30, 2013, are presented on a segment basis under “Results of Operations” below.
The table below sets forth a reconciliation of basic and diluted earnings per share between the three months, nine months and twelve months ended September 30, 2012 and September 30, 2013, which is a non-GAAP presentation. The economic substance behind our non-GAAP earnings per share (EPS) measure is to present the after tax impact of significant items and components of the statement of income on a per share basis before the impact of additional stock issuances.
We believe this presentation is useful to investors because the statement of income does not readily show the EPS impact of the various components. This could limit the readers’ understanding of the reasons for the EPS change from the previous year’s EPS. This information is useful to management, and we believe this information is useful to investors, to better understand the reasons for the fluctuation in EPS between the prior and current years on a per share basis.
This reconciliation may not be comparable to other companies or more useful than the GAAP presentation included in the statement of income. We also note that this presentation does not purport to be an alternative to earnings per share determined in accordance with GAAP as a measure of operating performance or any other measure of financial performance presented in accordance with GAAP. Management compensates for the limitations of using non-GAAP financial measures by using them to supplement GAAP results to provide a more complete understanding of the factors and trends affecting the business than GAAP results alone. The dilutive effect of additional shares issued included in the table reflects the estimated impact of all shares issued during the periods ended September 30.
33
Three Months Ended
Nine Months Ended
Twelve Months Ended
Earnings Per Share – 2012 $ 0.60 $ 1.09 $ 1.30 Revenues Electric segment $ (0.04) $ 0.14 $ 0.09 Gas segment 0.00 0.10 0.10 Other segment 0.01 0.01 0.01 Total Revenue (0.03) 0.25 0.20 Electric fuel and purchased power 0.05 0.10 0.16 Cost of natural gas sold and transported 0.00 (0.07) (0.07) Margin 0.02 0.28 0.29 Operating – electric segment (0.03) (0.15) (0.16) Operating –gas segment 0.00 0.01 0.00 Operating –other segment 0.00 (0.01) 0.00 Maintenance and repairs 0.00 0.02 0.04 Depreciation and amortization (0.04) (0.10) (0.10) Loss on plant disallowance 0.00 (0.03) (0.03) Other taxes (0.01) (0.03) (0.04) Interest charges 0.00 0.00 0.01 AFUDC 0.02 0.04 0.06 Change in effective income tax rates 0.01 0.02 0.03 Other income and deductions 0.00 0.00 (0.02) Dilutive effect of additional shares issued (0.01) (0.01) (0.02) Earnings Per Share – 2013 $ 0.56 $ 1.13 $ 1.36
Recent Activities
Regulatory Matters
On September 17, 2013, we advised the Arkansas Public Service Commission of the intention to file an application for a general change or modification in our rates, charges and tariffs no sooner than 60 days and no later than 90 days from the date of notice.
On February 22, 2013, we filed a Nonunanimous Stipulation and Agreement (Agreement) with the Missouri Public Service Commission (MPSC) which issued an order approving the Agreement on February 27, 2013, effective March 6, 2013. The Agreement provided for an annual increase in base revenues for our Missouri electric customers in the amount of approximately $27.5 million, effective April 1, 2013, and the continuation of the current fuel adjustment mechanism. The Agreement also included an increase in depreciation rates, recovery of deferred tornado costs over the next ten years and the continuation of tracking mechanisms for expenses related to employee pension, retiree health care, vegetation management, and Iatan 2, Iatan Common and Plum Point operating and maintenance costs. In addition, the Agreement included a write-off of approximately $3.6 million, consisting of a $2.4 million disallowance for the prudency of certain construction expenditures for Iatan 2 and a $1.2 million regulatory reversal of a prior period gain on sale of our Asbury unit train, which is included in regulated operating expenses. We also agreed not to implement a Missouri general rate increase prior to October 1, 2014. As initially filed on July 6, 2012, we had requested an annual increase in base rates for our Missouri electric customers in the amount of $30.7 million, or 7.56%, the continuation of the fuel adjustment clause, new depreciation rates and the recovery of various expenses. On May 18, 2012, we filed a request with the Federal Energy Regulatory Commission (FERC) to implement a cost-based transmission formula rate (TFR) to be effective August 1, 2012. On July 31, 2012, the FERC suspended the TFR for five months and set the filing for hearing and settlement procedures. On June 13, 2013, we, the Kansas Corporation Commission and the cities of Monett, Mt. Vernon and Lockwood, Missouri and Chetopa, Kansas, filed a unanimous Settlement Agreement (Agreement) with the FERC. The Agreement includes a TFR that establishes an ROE of 10.0%. The
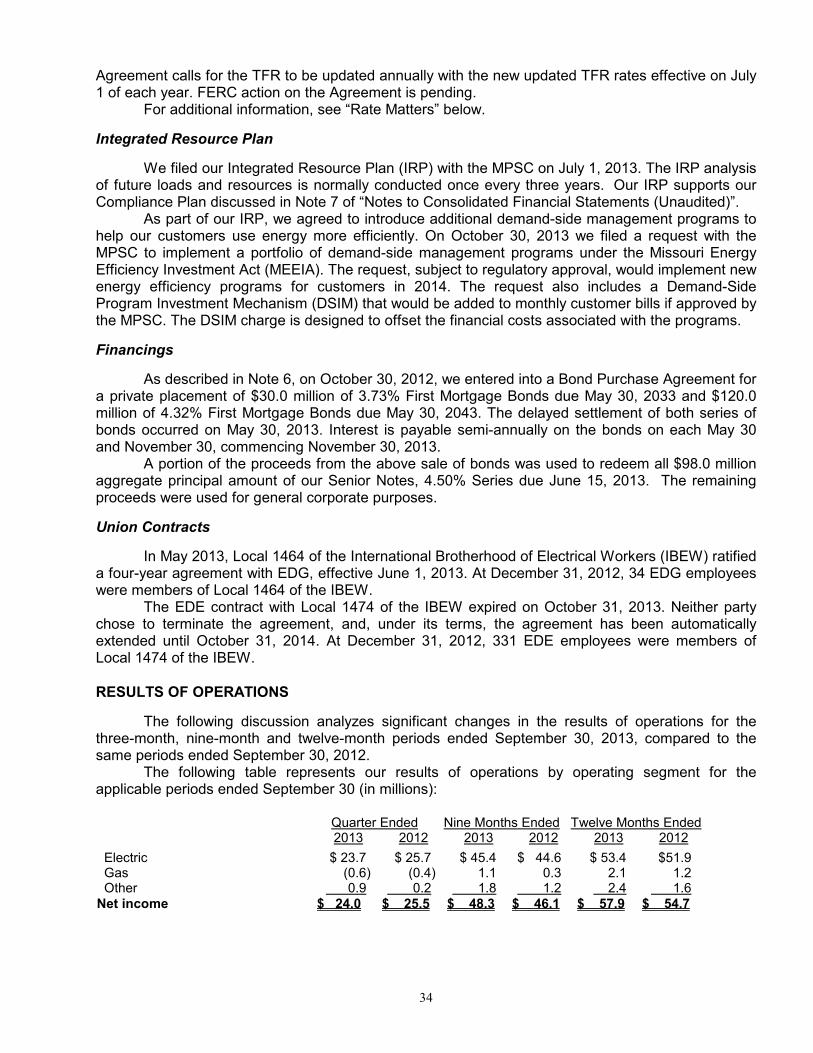
34
Agreement calls for the TFR to be updated annually with the new updated TFR rates effective on July 1 of each year. FERC action on the Agreement is pending. For additional information, see “Rate Matters” below.
Integrated Resource Plan
We filed our Integrated Resource Plan (IRP) with the MPSC on July 1, 2013. The IRP analysis of future loads and resources is normally conducted once every three years. Our IRP supports our Compliance Plan discussed in Note 7 of “Notes to Consolidated Financial Statements (Unaudited)”.
As part of our IRP, we agreed to introduce additional demand-side management programs to help our customers use energy more efficiently. On October 30, 2013 we filed a request with the MPSC to implement a portfolio of demand-side management programs under the Missouri Energy Efficiency Investment Act (MEEIA). The request, subject to regulatory approval, would implement new energy efficiency programs for customers in 2014. The request also includes a Demand-Side Program Investment Mechanism (DSIM) that would be added to monthly customer bills if approved by the MPSC. The DSIM charge is designed to offset the financial costs associated with the programs.
Financings
As described in Note 6, on October 30, 2012, we entered into a Bond Purchase Agreement for a private placement of $30.0 million of 3.73% First Mortgage Bonds due May 30, 2033 and $120.0 million of 4.32% First Mortgage Bonds due May 30, 2043. The delayed settlement of both series of bonds occurred on May 30, 2013. Interest is payable semi-annually on the bonds on each May 30 and November 30, commencing November 30, 2013.
A portion of the proceeds from the above sale of bonds was used to redeem all $98.0 million aggregate principal amount of our Senior Notes, 4.50% Series due June 15, 2013. The remaining proceeds were used for general corporate purposes.
Union Contracts
In May 2013, Local 1464 of the International Brotherhood of Electrical Workers (IBEW) ratified a four-year agreement with EDG, effective June 1, 2013. At December 31, 2012, 34 EDG employees were members of Local 1464 of the IBEW.
The EDE contract with Local 1474 of the IBEW expired on October 31, 2013. Neither party chose to terminate the agreement, and, under its terms, the agreement has been automatically extended until October 31, 2014. At December 31, 2012, 331 EDE employees were members of Local 1474 of the IBEW.
RESULTS OF OPERATIONS
The following discussion analyzes significant changes in the results of operations for the three-month, nine-month and twelve-month periods ended September 30, 2013, compared to the same periods ended September 30, 2012.
The following table represents our results of operations by operating segment for the applicable periods ended September 30 (in millions):
Quarter Ended Nine Months Ended Twelve Months Ended 2013 2012 2013 2012 2013 2012 Electric $ 23.7 $ 25.7 $ 45.4 $ 44.6 $ 53.4 $51.9 Gas (0.6) (0.4) 1.1 0.3 2.1 1.2 Other 0.9 0.2 1.8 1.2 2.4 1.6 Net income $ 24.0 $ 25.5 $ 48.3 $ 46.1 $ 57.9 $ 54.7

35
Electric Segment
Gross Margin
As shown in the table below, electric segment gross margin increased approximately $0.8 million, $16.3 million and $16.8 million for the quarter, nine months ended and twelve months ended September 30, 2013 periods, respectively, as compared to the corresponding periods in 2012. Increased electric rates for our Missouri customers and an increase in average customer counts positively impacted revenues and gross margin for all periods presented. These increases were offset in the third quarter of 2013 and partially offset in the nine months ended and twelve months ended September 30, 2013 periods by weather impacts. A change in our estimate for unbilled revenues made during the third quarter of 2012 also negatively impacted margin in all three periods.
The table below represents our electric gross margins for the applicable periods ended September 30 (dollars in millions):
Three Months Ended Nine Months Ended Twelve Months Ended
2013 2012 2013 2012 2013 2012
Electric segment revenues $ 150.4 $ 152.7 $ 406.2 $ 396.5 $ 520.3 $ 514.5 Fuel and purchased power 44.9 48.0 132.2 138.8 172.3 183.3 Electric segment gross margins $ 105.5 $ 104.7 $ 274.0 $ 257.7 $ 348.0 $ 331.2
Margin as % of total electric segment revenues 70.2 % 68.5 % 67.5 % 65.0 % 66.9 % 64.4 %
Although a non-GAAP presentation, we believe the presentation of gross margin is useful to investors and others in understanding and analyzing changes in our electric operating performance from one period to the next, and have included the analysis as a complement to the financial information we provide in accordance with GAAP. However, these margins may not be comparable to other companies’ presentations or more useful than the GAAP information we provide elsewhere in this report.
Sales and Revenues
Electric operating revenues comprised approximately 95.5% of our total operating revenues during the third quarter of 2013.
The amounts and percentage changes from the prior periods in kilowatt-hour ("kWh") sales by major customer class for on-system sales and for off-system sales for the applicable periods ended September 30, were as follows:
kWh Sales (in millions)
3 Months 3 Months 9 Months 9 Months 12 Months 12 Months
Ended Ended % Ended Ended % Ended Ended %
Customer Class 2013 2012 Change(1) 2013 2012 Change
(1) 2013 2012 Change
(1)
Residential 495.2 573.3 (13.6)% 1,453.5 1,438.9 1.0% 1,865.4 1,852.0 0.7% Commercial 414.1 447.3 (7.4) 1,150.8 1,184.5 (2.8) 1,524.5 1,558.0 (2.1) Industrial 270.0 274.2 (1.5) 775.0 785.5 (1.3) 1,018.0 1,030.8 (1.2) Wholesale on-system 93.9 98.6 (4.7) 262.3 272.1 (3.6) 343.3 355.1 (3.3)
Other(2) 33.6 33.6 (0.1) 98.1 93.9 4.5 128.4 124.3 3.3
Total on-system sales 1,306.8 1,427.0 (8.4) 3,739.7 3,774.9 (0.9) 4,879.6 4,920.2 (0.8) Off-system 144.4 217.6 (33.7) 479.7 525.8 (8.8) 657.9 679.9 (3.2) Total KWh Sales 1,451.2 1,644.6 (11.8) 4,219.4 4,300.7 (1.9) 5,537.5 5,600.1 (1.1)
(1)Percentage changes are based on actual kWh sales and may not agree to the rounded amounts shown above.
(2)Other kWh sales include street lighting, other public authorities and interdepartmental usage.
KWh sales for our on-system customers decreased 8.4% during the quarter ended September 30, 2013, mainly due to milder weather as compared to the third quarter of 2012. Total cooling degree days (the cumulative number of degrees that the daily average temperature for each day during that period was above 65° F) for the third quarter of 2013 were 15.5% less than the same period last year and 1.9% less than the 30-year average. KWh sales for our residential and
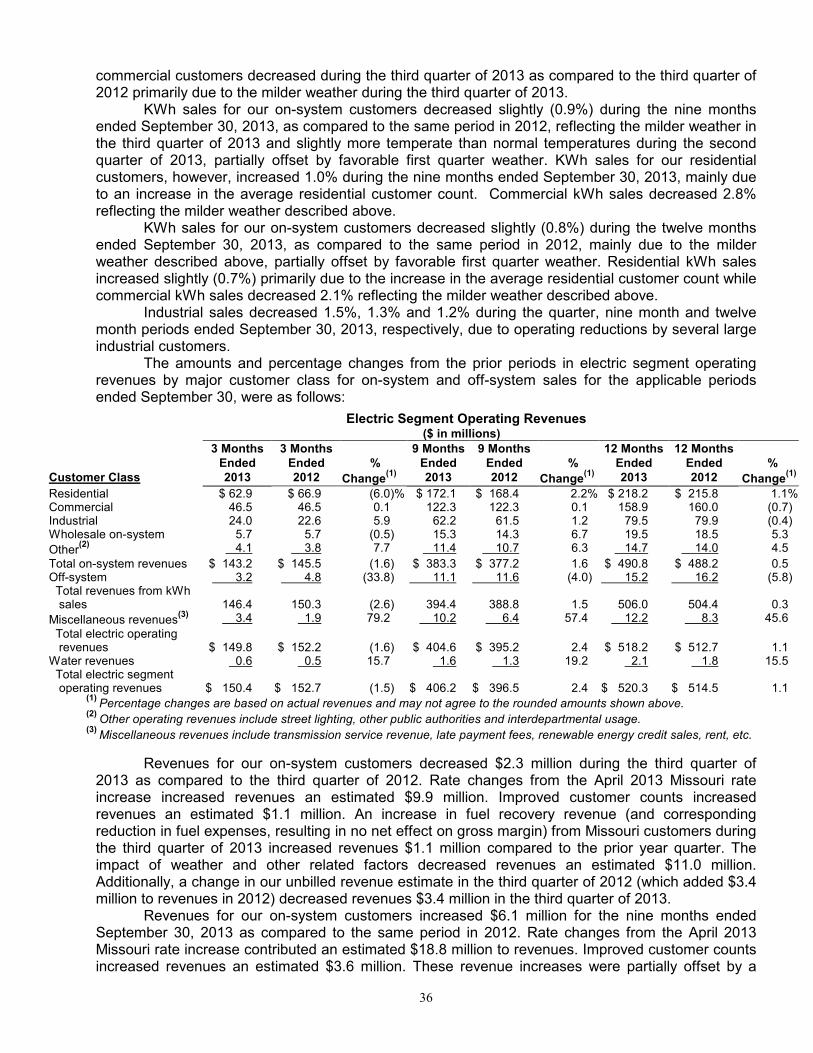
36
commercial customers decreased during the third quarter of 2013 as compared to the third quarter of 2012 primarily due to the milder weather during the third quarter of 2013. KWh sales for our on-system customers decreased slightly (0.9%) during the nine months ended September 30, 2013, as compared to the same period in 2012, reflecting the milder weather in the third quarter of 2013 and slightly more temperate than normal temperatures during the second quarter of 2013, partially offset by favorable first quarter weather. KWh sales for our residential customers, however, increased 1.0% during the nine months ended September 30, 2013, mainly due to an increase in the average residential customer count. Commercial kWh sales decreased 2.8% reflecting the milder weather described above. KWh sales for our on-system customers decreased slightly (0.8%) during the twelve months ended September 30, 2013, as compared to the same period in 2012, mainly due to the milder weather described above, partially offset by favorable first quarter weather. Residential kWh sales increased slightly (0.7%) primarily due to the increase in the average residential customer count while commercial kWh sales decreased 2.1% reflecting the milder weather described above.
Industrial sales decreased 1.5%, 1.3% and 1.2% during the quarter, nine month and twelve month periods ended September 30, 2013, respectively, due to operating reductions by several large industrial customers. The amounts and percentage changes from the prior periods in electric segment operating revenues by major customer class for on-system and off-system sales for the applicable periods ended September 30, were as follows:
Electric Segment Operating Revenues ($ in millions)
3 Months 3 Months 9 Months 9 Months 12 Months 12 Months Ended Ended % Ended Ended % Ended Ended % Customer Class 2013 2012 Change
(1) 2013 2012 Change
(1) 2013 2012 Change
(1)
Residential $ 62.9 $ 66.9 (6.0)% $ 172.1 $ 168.4 2.2% $ 218.2 $ 215.8 1.1% Commercial 46.5 46.5 0.1 122.3 122.3 0.1 158.9 160.0 (0.7) Industrial 24.0 22.6 5.9 62.2 61.5 1.2 79.5 79.9 (0.4) Wholesale on-system 5.7 5.7 (0.5) 15.3 14.3 6.7 19.5 18.5 5.3
Other(2) 4.1 3.8 7.7 11.4 10.7 6.3 14.7 14.0 4.5
Total on-system revenues $ 143.2 $ 145.5 (1.6) $ 383.3 $ 377.2 1.6 $ 490.8 $ 488.2 0.5 Off-system 3.2 4.8 (33.8) 11.1 11.6 (4.0) 15.2 16.2 (5.8) Total revenues from kWh sales 146.4 150.3 (2.6) 394.4 388.8 1.5 506.0 504.4 0.3
Miscellaneous revenues(3) 3.4 1.9 79.2 10.2 6.4 57.4 12.2 8.3 45.6
Total electric operating revenues $ 149.8 $ 152.2 (1.6) $ 404.6 $ 395.2 2.4 $ 518.2 $ 512.7 1.1 Water revenues 0.6 0.5 15.7 1.6 1.3 19.2 2.1 1.8 15.5 Total electric segment operating revenues $ 150.4 $ 152.7 (1.5) $ 406.2 $ 396.5 2.4 $ 520.3 $ 514.5 1.1
(1) Percentage changes are based on actual revenues and may not agree to the rounded amounts shown above.
(2) Other operating revenues include street lighting, other public authorities and interdepartmental usage.
(3) Miscellaneous revenues include transmission service revenue, late payment fees, renewable energy credit sales, rent, etc.
Revenues for our on-system customers decreased $2.3 million during the third quarter of 2013 as compared to the third quarter of 2012. Rate changes from the April 2013 Missouri rate increase increased revenues an estimated $9.9 million. Improved customer counts increased revenues an estimated $1.1 million. An increase in fuel recovery revenue (and corresponding reduction in fuel expenses, resulting in no net effect on gross margin) from Missouri customers during the third quarter of 2013 increased revenues $1.1 million compared to the prior year quarter. The impact of weather and other related factors decreased revenues an estimated $11.0 million. Additionally, a change in our unbilled revenue estimate in the third quarter of 2012 (which added $3.4 million to revenues in 2012) decreased revenues $3.4 million in the third quarter of 2013. Revenues for our on-system customers increased $6.1 million for the nine months ended September 30, 2013 as compared to the same period in 2012. Rate changes from the April 2013 Missouri rate increase contributed an estimated $18.8 million to revenues. Improved customer counts increased revenues an estimated $3.6 million. These revenue increases were partially offset by a

37
$6.8 million decrease in fuel recovery revenue (and corresponding reduction in fuel expenses, resulting in no net effect on gross margin) from Missouri customers during the nine months ended September 30, 2013 compared to the same period in 2012. Weather and other related factors decreased revenues an estimated $6.1 million during the nine months ended September 30, 2013. The change in our unbilled revenue estimate in the third quarter of 2012 decreased revenues $3.4 million during the nine months ended September 30, 2013. The cumulative effect of the revenue changes mentioned above had a favorable impact in gross margin for the nine months ended 2013 period. Revenues for our on-system customers increased $2.6 million for the twelve months ended September 30, 2013 as compared to the same period in 2012. Rate changes, primarily the April 2013 Missouri rate increase and the January 2012 Kansas rate increase, contributed an estimated $18.4 million to revenues. Improved customer counts increased revenues an estimated $5.4 million. These revenue increases were partially offset by a $9.4 million decrease in fuel recovery revenue (and corresponding reduction in fuel expenses, resulting in no net effect on gross margin) from Missouri customers during the twelve months ended September 30, 2013 compared to the same period in 2012. Weather and other related factors decreased revenues an estimated $8.4 million. The change in our unbilled revenue estimate in the third quarter of 2012 decreased revenues $3.4 million during the twelve months ended September 30, 2013. The cumulative year over year revenue changes mentioned above impacted gross margin positively.
Off-System Electric Transactions.
In addition to sales to our own customers, we also sell power to other utilities as available, including through the Southwest Power Pool (SPP) Energy Imbalance Services (EIS) market. See “— Competition and Markets” below. The majority of our off-system sales margins are included as a component of the fuel adjustment clause in our Missouri, Kansas and Oklahoma jurisdictions and our transmission rider in our Arkansas jurisdiction and generally adjust the fuel and purchased power expense. As a result, nearly all of the off-system sales margin flows back to the customer and has little effect on margin or net income.
Miscellaneous Revenues
Our miscellaneous revenues increased approximately $1.5 million, $3.7 million and $3.8 million during the quarter, nine month and twelve month periods ended September 30, 2013, respectively, primarily due to increased Southwest Power Pool (SPP) transmission revenues. These miscellaneous revenues are comprised mainly of transmission revenues, late payment fees and renewable energy credit sales.
Operating Revenue Deductions – Fuel and Purchased Power
The table below is a reconciliation of our actual fuel and purchased power expenditures (netted with the regulatory adjustments) to the fuel and purchased power expense shown on our statements of income for the applicable periods ended September 30, 2013 and 2012.

38
Three Months Nine Months Twelve Months Ended Ended Ended
(in millions) 2013 2012 2013 2012 2013 2012 Actual fuel and purchased power expenditures $ 46.0 $ 51.3 $ 137.5 $ 131.9 $ 179.2 $ 172.5 Missouri fuel adjustment recovery (1) (1.1) (2.2) (1.9) 4.8 (3.3) 6.1 Missouri fuel adjustment deferral(2) 0.6 (0.3) (1.2) 4.7 (0.6) 6.9 Kansas and Oklahoma regulatory adjustments(2) 0.1 0.4 0.0 1.2 (0.2) 1.4 SWPA amortization(3) (0.7) (0.8) (2.1) (2.1) (2.8) (2.8) Unrealized (gain)/loss on derivatives (0.0) (0.4) (0.1) (1.7) 0.0 (0.8) Total fuel and purchased power expense per income statement $ 44.9 $ 48.0 $ 132.2 $ 138.8 $ 172.3 $ 183.3
(1)A positive amount indicates costs recovered from customers from under recovery in prior deferral periods. A negative amount indicates costs refunded to customers from over recovery in prior deferral periods.
(2)A negative amount indicates costs have been under recovered from customers and a positive amount indicates costs have been over recovered from customers.
(3) Missouri ten year amortization of the $26.6 million payment received from the SWPA in September, 2010.
Operating Revenue Deductions – Other Than Fuel and Purchased Power
The table below shows regulated operating expense increases/(decreases) for the applicable periods ended September 30, 2013 as compared to the same periods in 2012.
Three Months Nine Months Twelve Months Ended Ended Ended (in millions) 2013 vs. 2012 2013 vs. 2012 2013 vs. 2012 Transmission and distribution expense $ 1.1 $ 3.7 $ 4.0 General labor costs 0.6 1.6 1.9 Employee health care expense 0.2 0.7 1.5 Steam power other operating expense 0.0 0.6 0.8 Employee pension expense 0.1 0.4 0.5 Customer accounts expense 0.3 0.8 0.6 Other power supply expenses 0.5 0.5 0.5 Property insurance 0.1 0.4 0.6 Injuries and damages expense (0.3) 0.1 0.2 Customer assistance expense 0.1 0.2 0.1 Regulatory commission expense 0.1 0.2 (0.4) Banking fees (0.1) (0.6) (0.8) General office expense (0.1) 0.2 0.3 Professional services (0.1) (0.4) (0.3) Regulatory reversal of gain on prior period sale of assets(1) 0.0 1.2 1.2 Other miscellaneous accounts (netted) (0.2) 0.4 0.2 TOTAL $ 2.3 $ 10.0 $ 10.9
(1)Regulatory reversal of a prior period gain on the sale of our Asbury unit train as part of our 2013 rate case Agreement with the MPSC.
The table below shows maintenance and repairs expense increases/(decreases) for the applicable periods ended September 30, 2013 as compared to the same periods in 2012.
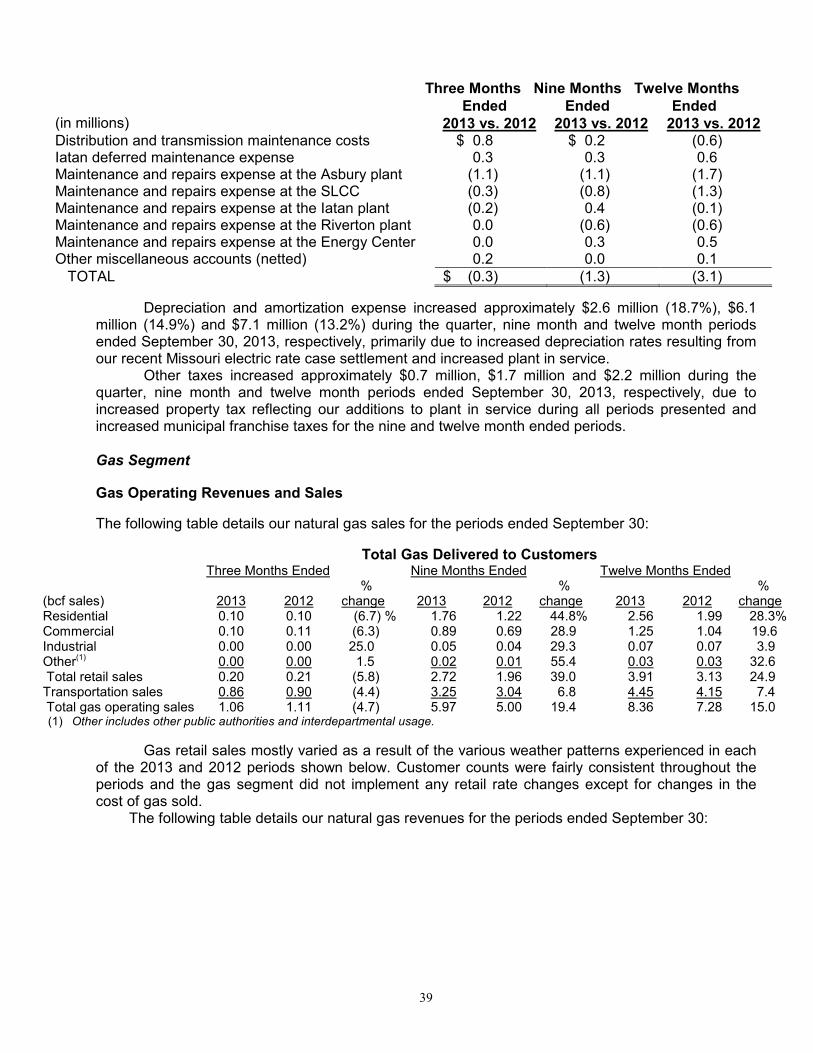
39
Three Months Nine Months Twelve Months Ended Ended Ended
(in millions) 2013 vs. 2012 2013 vs. 2012 2013 vs. 2012 Distribution and transmission maintenance costs $ 0.8 $ 0.2 (0.6) Iatan deferred maintenance expense 0.3 0.3 0.6 Maintenance and repairs expense at the Asbury plant (1.1) (1.1) (1.7) Maintenance and repairs expense at the SLCC (0.3) (0.8) (1.3) Maintenance and repairs expense at the Iatan plant (0.2) 0.4 (0.1) Maintenance and repairs expense at the Riverton plant 0.0 (0.6) (0.6) Maintenance and repairs expense at the Energy Center 0.0 0.3 0.5 Other miscellaneous accounts (netted) 0.2 0.0 0.1 TOTAL $ (0.3) (1.3) (3.1)
Depreciation and amortization expense increased approximately $2.6 million (18.7%), $6.1 million (14.9%) and $7.1 million (13.2%) during the quarter, nine month and twelve month periods ended September 30, 2013, respectively, primarily due to increased depreciation rates resulting from our recent Missouri electric rate case settlement and increased plant in service. Other taxes increased approximately $0.7 million, $1.7 million and $2.2 million during the quarter, nine month and twelve month periods ended September 30, 2013, respectively, due to increased property tax reflecting our additions to plant in service during all periods presented and increased municipal franchise taxes for the nine and twelve month ended periods. Gas Segment
Gas Operating Revenues and Sales
The following table details our natural gas sales for the periods ended September 30:
Total Gas Delivered to Customers Three Months Ended Nine Months Ended Twelve Months Ended
% % % (bcf sales) 2013 2012 change 2013 2012 change 2013 2012 change Residential 0.10 0.10 (6.7) % 1.76 1.22 44.8% 2.56 1.99 28.3% Commercial 0.10 0.11 (6.3) 0.89 0.69 28.9 1.25 1.04 19.6 Industrial 0.00 0.00 25.0 0.05 0.04 29.3 0.07 0.07 3.9 Other(1) 0.00 0.00 1.5 0.02 0.01 55.4 0.03 0.03 32.6 Total retail sales 0.20 0.21 (5.8) 2.72 1.96 39.0 3.91 3.13 24.9 Transportation sales 0.86 0.90 (4.4) 3.25 3.04 6.8 4.45 4.15 7.4 Total gas operating sales 1.06 1.11 (4.7) 5.97 5.00 19.4 8.36 7.28 15.0 (1) Other includes other public authorities and interdepartmental usage.
Gas retail sales mostly varied as a result of the various weather patterns experienced in each of the 2013 and 2012 periods shown below. Customer counts were fairly consistent throughout the periods and the gas segment did not implement any retail rate changes except for changes in the cost of gas sold. The following table details our natural gas revenues for the periods ended September 30:
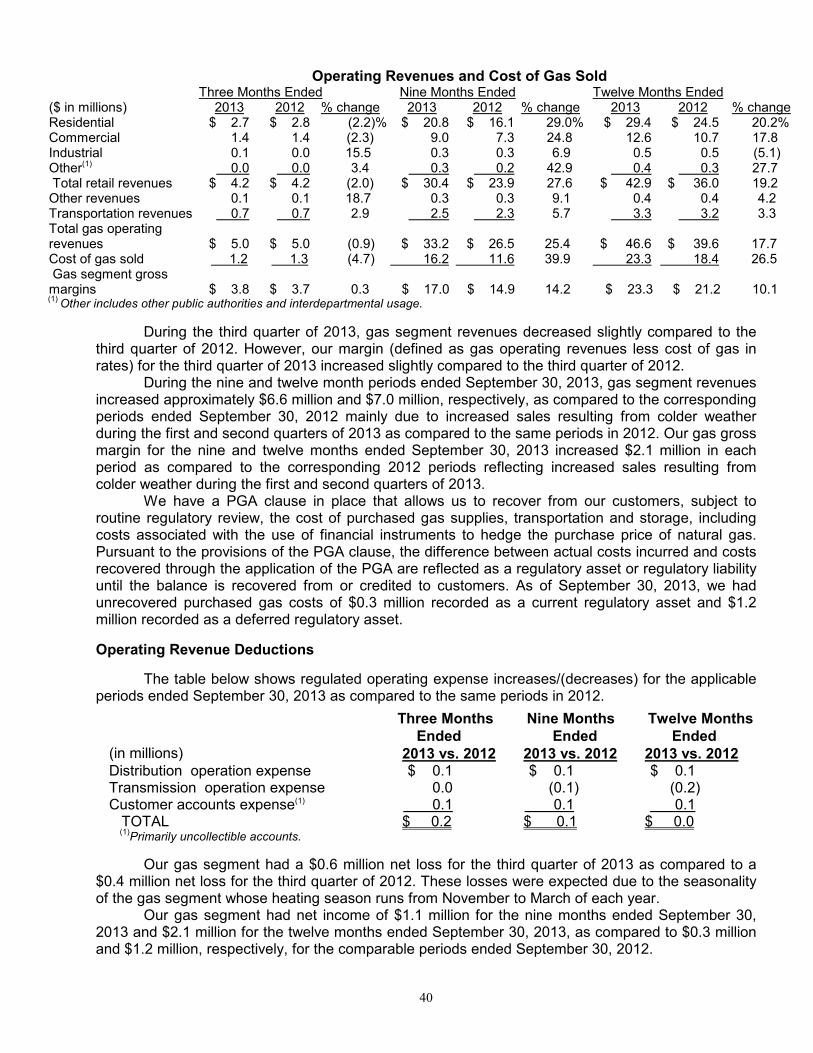
40
Operating Revenues and Cost of Gas Sold Three Months Ended Nine Months Ended Twelve Months Ended
($ in millions) 2013 2012 % change 2013 2012 % change 2013 2012 % change Residential $ 2.7 $ 2.8 (2.2)% $ 20.8 $ 16.1 29.0% $ 29.4 $ 24.5 20.2% Commercial 1.4 1.4 (2.3) 9.0 7.3 24.8 12.6 10.7 17.8 Industrial 0.1 0.0 15.5 0.3 0.3 6.9 0.5 0.5 (5.1) Other(1) 0.0 0.0 3.4 0.3 0.2 42.9 0.4 0.3 27.7 Total retail revenues $ 4.2 $ 4.2 (2.0) $ 30.4 $ 23.9 27.6 $ 42.9 $ 36.0 19.2 Other revenues 0.1 0.1 18.7 0.3 0.3 9.1 0.4 0.4 4.2 Transportation revenues 0.7 0.7 2.9 2.5 2.3 5.7 3.3 3.2 3.3 Total gas operating revenues
$ 5.0
$ 5.0
(0.9)
$ 33.2
$ 26.5
25.4
$ 46.6
$ 39.6
17.7
Cost of gas sold 1.2 1.3 (4.7) 16.2 11.6 39.9 23.3 18.4 26.5 Gas segment gross margins
$ 3.8
$ 3.7
0.3
$ 17.0
$ 14.9
14.2
$ 23.3
$ 21.2
10.1
(1) Other includes other public authorities and interdepartmental usage.
During the third quarter of 2013, gas segment revenues decreased slightly compared to the third quarter of 2012. However, our margin (defined as gas operating revenues less cost of gas in rates) for the third quarter of 2013 increased slightly compared to the third quarter of 2012. During the nine and twelve month periods ended September 30, 2013, gas segment revenues increased approximately $6.6 million and $7.0 million, respectively, as compared to the corresponding periods ended September 30, 2012 mainly due to increased sales resulting from colder weather during the first and second quarters of 2013 as compared to the same periods in 2012. Our gas gross margin for the nine and twelve months ended September 30, 2013 increased $2.1 million in each period as compared to the corresponding 2012 periods reflecting increased sales resulting from colder weather during the first and second quarters of 2013.
We have a PGA clause in place that allows us to recover from our customers, subject to routine regulatory review, the cost of purchased gas supplies, transportation and storage, including costs associated with the use of financial instruments to hedge the purchase price of natural gas. Pursuant to the provisions of the PGA clause, the difference between actual costs incurred and costs recovered through the application of the PGA are reflected as a regulatory asset or regulatory liability until the balance is recovered from or credited to customers. As of September 30, 2013, we had unrecovered purchased gas costs of $0.3 million recorded as a current regulatory asset and $1.2 million recorded as a deferred regulatory asset.
Operating Revenue Deductions
The table below shows regulated operating expense increases/(decreases) for the applicable periods ended September 30, 2013 as compared to the same periods in 2012.
Three Months Nine Months Twelve Months Ended Ended Ended (in millions) 2013 vs. 2012 2013 vs. 2012 2013 vs. 2012 Distribution operation expense $ 0.1 $ 0.1 $ 0.1 Transmission operation expense 0.0 (0.1) (0.2) Customer accounts expense(1) 0.1 0.1 0.1 TOTAL $ 0.2 $ 0.1 $ 0.0
(1)Primarily uncollectible accounts.
Our gas segment had a $0.6 million net loss for the third quarter of 2013 as compared to a $0.4 million net loss for the third quarter of 2012. These losses were expected due to the seasonality of the gas segment whose heating season runs from November to March of each year.
Our gas segment had net income of $1.1 million for the nine months ended September 30, 2013 and $2.1 million for the twelve months ended September 30, 2013, as compared to $0.3 million and $1.2 million, respectively, for the comparable periods ended September 30, 2012.

41
Consolidated Company
Income Taxes
The following table shows our provision for income taxes (in millions) and our consolidated effective federal and state income tax rates for the applicable periods ended September 30:
Three Months Ended Nine Months Ended Twelve Months Ended 2013 2012 2013 2012 2013 2012 Consolidated provision for income taxes $ 14.1 $ 15.5 $ 28.7 $ 28.4 $ 34.4 $ 34.3 Consolidated effective federal and state income tax rates
37.1%
37.7%
37.3%
38.2%
37.3%
38.5%
See Note 12 of “Notes to Consolidated Financial Statements (Unaudited)” for more information and discussion concerning our income tax provision and effective tax rates.
Nonoperating Items
The following table shows the total allowance for funds used during construction (AFUDC) for the applicable periods ended September 30. AFUDC increased during all periods presented in 2013 reflecting the environmental retrofit project at our Asbury plant.
Three Months Ended Nine Months Ended Twelve Months Ended ($ in millions) 2013 2012 2013 2012 2013 2012 Allowance for equity funds used during construction $ 1.1 $ 0.3 $ 2.5 $ 0.4 $ 3.3 $ 0.5 Allowance for borrowed funds used during construction 0.6 0.2 1.4 0.4 1.7 0.5 Total AFUDC $ 1.7 $ 0.5 $ 3.9 $ 0.8 $ 5.0 $ 1.0
Total interest charges on long-term and short-term debt for the periods ended September 30, are shown below. The changes in long-term debt interest for all periods reflect the financing discussed in Note 6 of “Notes to Consolidated Financial Statements (Unaudited)” and under “Liquidity and Capital Resources - Financing Activities” below. The change in the twelve months ended interest charges also reflects the redemption on April 1, 2012 of all $74.8 million aggregate principal amount of our First Mortgage Bonds, 7.00% Series due 2024, the redemption of all $5.2 million of our First Mortgage Bonds, 5.20% Pollution Control Series due 2013, and all $8.0 million of our First Mortgage Bonds, 5.30% Pollution Control Series due 2013. These bonds were replaced by a private placement of $88.0 million aggregate principal amount of 3.58% First Mortgage Bonds due April 2, 2027. The first settlement of $38.0 million occurred on April 2, 2012 and the second settlement of $50.0 million occurred on June 1, 2012. The changes in short-term debt interest primarily reflect lower levels of borrowing during all comparative periods presented.
Interest Charges ($ in millions)
Third Third 9 Months 9 Months 12 Months 12 Months
Quarter Quarter % Ended Ended % Ended Ended %
2013 2012 Change 2013 2012 Change 2013 2012 Change
Long-term debt interest $ 10.1 $ 9.9 1.5% $ 30.2 $ 30.2 0.0% $ 40.2 $ 40.9 (1.7)% Short-term debt interest - 0.0 (100.0) 0.1 0.2 (66.5) 0.1 0.2 (63.3) Other interest* 0.3 0.3 (0.1) 0.8 0.8 0.5 1.1 1.0 3.9 Total interest charges $ 10.4 $ 10.2 1.3 $ 31.1 $ 31.2 (0.4) $ 41.4 $ 42.1 (1.9)
*Includes deferred Iatan 1 and Iatan 2 carrying charges to reflect construction accounting in accordance with our agreement with the MPSC. Deferral ended when the plants were placed in rates. See Note 3 and Rate Matters below for additional information regarding carrying charges.

42
RATE MATTERS
We continually assess the need for rate relief in all of the jurisdictions we serve and file for such relief when necessary. Our rates for retail electric and natural gas services (other than specially negotiated retail rates for industrial or large commercial customers, which are subject to regulatory review and approval) are determined on a “cost of service” basis. Rates are designed to provide, after recovery of allowable operating expenses, an opportunity for us to earn a reasonable return on “rate base.” “Rate base” is generally determined by reference to the original cost (net of accumulated depreciation and amortization) of utility plant in service, subject to various adjustments for deferred taxes and other items. Over time, rate base is increased by additions to utility plant in service and reduced by depreciation, amortization and retirement of utility plant or write-off's as ordered by the utility commissions. In general, a request of new rates is made on the basis of a “rate base” as of a date prior to the date of the request and allowable operating expenses for a 12-month test period ended prior to the date of the request. Although the current rate making process provides recovery of some future changes in rate base and operating costs, it does not reflect all changes in costs for the period in which new retail rates will be in place. This results in a lag (commonly referred to as “regulatory lag”) between the time we incur costs and the time when we can start recovering the costs through rates.
The following table sets forth information regarding electric and water rate increases since January 1, 2010:
Jurisdiction
Date Requested
Annual Increase Granted
Percent Increase Granted
Date Effective
Missouri – Electric July 6, 2012 $ 27,500,000 6.78% April 1, 2013 Missouri – Water May 21, 2012 $ 450,000 25.5% November 23, 2012 Missouri – Electric September 28, 2010 $ 18,700,000 4.70% June 15, 2011 Missouri – Electric October 29, 2009 $ 46,800,000 13.40% September 10, 2010 Kansas – Electric June 17, 2011 $ 1,250,000 5.20% January 1, 2012 Kansas – Electric November 4, 2009 $ 2,800,000 12.40% July 1, 2010 Oklahoma – Electric June 30, 2011 $ 240,722 1.66% January 4, 2012 Oklahoma – Electric January 28, 2011 $ 1,063,100 9.32% March 1, 2011 Oklahoma – Electric March 25, 2010 $ 1,456,979 15.70% September 1, 2010 Arkansas - Electric August 19, 2010 $ 2,104,321 19.00% April 13, 2011 Missouri – Gas June 5, 2009 $ 2,600,000 4.37% April 1, 2010
On February 22, 2013, we filed a Nonunanimous Stipulation and Agreement (Agreement) with the MPSC which issued an order approving the Agreement on February 27, 2013. The Agreement provided for an annual increase in base revenues for our Missouri electric customers in the amount of approximately $27.5 million, effective April 1, 2013, and the continuation of the current fuel adjustment mechanism. The Agreement also included an increase in depreciation rates, recovery of deferred tornado costs over the next ten years and the continuation of tracking mechanisms for expenses related to employee pension, retiree health care, vegetation management, and Iatan 2, Iatan Common and Plum Point operating and maintenance costs. In addition, the Agreement included a write-off of approximately $3.6 million, consisting of a $2.4 million disallowance for the prudency of certain construction expenditures for Iatan 2 and a $1.2 million regulatory reversal of a prior period gain on sale of our Asbury unit train, which is included in regulated operating expenses. We also agreed not to implement a Missouri general rate increase prior to October 1, 2014.
As initially filed on July 6, 2012, we requested an annual increase in base rates for our Missouri electric customers in the amount of $30.7 million, or 7.56%, and the continuation of the fuel adjustment clause. This request was primarily designed to recover operation and maintenance expenses and capital costs associated with the May 22, 2011 tornado, Southwest Power Pool transmission charges allocated to us, operating systems replacement costs for new software systems, vegetation management costs, new depreciation rates and amortization of a regulatory asset related to the tax benefits of cost of removal, the balance of which was approximately $9.6 million at December 31, 2012.
43
On May 18, 2012, we filed a request with the FERC to implement a TFR to be effective August 1, 2012. On July 31, 2012, the FERC suspended the TFR for five months and set the filing for hearing and settlement procedures. On June 13, 2013, we, the Kansas Corporation Commission and the cities of Monett, Mt. Vernon and Lockwood, Missouri and Chetopa, Kansas, filed a unanimous Settlement Agreement (Agreement) with the FERC. The Agreement includes a TFR that establishes an ROE of 10.0%. The Agreement calls for the TFR to be updated annually with the new updated TFR rates effective on July 1 of each year. FERC action on the Agreement is pending. Our other rate cases, as we reported in our Annual Report on Form 10-K for the year ended December 31, 2012, remain unchanged. See Note 3, “Regulatory Matters” in our Annual Report on Form 10-K for the year ended December 31, 2012 for additional information. On September 17, 2013, we advised the Arkansas Public Service Commission of the intention to file an application for a general change or modification in our rates, charges and tariffs no sooner than 60 days and no later than 90 days from the date of notice. COMPETITION AND MARKETS
Electric Segment
SPP Regional Transmission Development: On June 17, 2010, the FERC approved the new highway/byway cost allocation method, a new transmission cost allocation method to replace the existing FERC accepted cost allocation method for new transmission facilities needed to continue to reliably and economically serve SPP customers, including ours, well into the future. To date, the SPP’s Board of Directors (BOD) has approved over $8 billion in transmission projects for the 2006 through 2022 time period of which over $4 billion is in planned highway/byway transmission projects. As these projects are constructed, we will be allocated a share of the costs of the projects pursuant to the FERC accepted highway/byway regional costs allocation method. We expect that these operating costs will be material, but that they will be recoverable in future rates. On September 11, 2013, the MPSC unanimously approved a stipulation and agreement regarding our continued participation in the SPP through 2019, including the scheduled Day 2 organized markets in April 2014, This agreement requires us to file a report in May 2018 regarding whether or not continued participation in the SPP or stand alone operations beyond 2019 is in the public interest.
Other FERC Activity
On April 23, 2012, we intervened in the SPP’s Petition for Review (Case No. 12-1158) of FERC’s Orders on Declaratory Order and Rehearing (Docket No. EL11-34-000) on the interpretation of the SPP/MISO Joint Operating Agreement (JOA) at the United States Court of Appeals for the District of Columbia. We are in agreement with SPP and other SPP members that the FERC was incorrect in its determination that MISO’s interpretation of the Joint Operating Agreement appropriately enables MISO and Entergy to utilize ours and other SPP members transmission systems to integrate Entergy into the MISO RTO without compensation or consideration of the negative impacts to us and the other SPP members. On June 25, 2012, the SPP interveners made a joint intervention filing at the DC court, a joint brief in October 2012, reply brief on January 14, 2013, and oral arguments on October 18, 2013. The decision of the DC Court is expected by or before the end of the first quarter of 2014. It is in our best interests that the review of the Joint Operating Agreement between SPP and MISO be remanded back to the FERC to reevaluate its Orders. Based on the current terms and conditions of MISO membership, Entergy’s participation in MISO will not be beneficial to our customers as it will increase transmission delivery costs for our Plum Point power station as well as utilize our transmission system without compensation. In late 2012, ITC Holdings and Entergy announced the sale of transmission assets to ITC and formation of new ITC transmission only companies. Subsequently, ITC, Entergy, and MISO made multiple filings at the FERC and various state Commissions, including the MPSC, for the transfer of ownership of Entergy’s transmission facilities as well as full integration into the MISO RTO. We and several other SPP members jointly filed in protest of the filings on January 11, 2013, based on Entergy and MISO’s planned utilization of our and the other SPP members’ system without mitigation or resolution of the

44
current and expected harm of MISO’s interpretation/use of the joint operating agreement to implement the integration. On June 20, 2013, the FERC issued several Orders, with some conditions, approving Entergy joining MISO and the purchase of Entergy transmission assets by a newly created subsidiary of ITC Holdings, ITC South. Many of the SPP joint protestors made joint filings at the FERC for clarification and/or rehearing of the FERC’s orders on ITC/Entergy/MISO with an emphasis on the FERC’s lack of requirement for SPP and MISO to resolve their JOA issues of dispute prior to Entergy joining MISO in late December 2013. FERC’s ITC/Energy Order is subject to Entergy securing all necessary state and federal regulatory approvals.
We and several other SPP members intervened at the Missouri and Arkansas commissions in opposition to the transfer of control of Entergy Arkansas transmission assets to MISO, as well as the sale/transfer of transmission assets of Entergy Arkansas (EAI) to ITC South. We believe the sale of Entergy’s transmission facilities to ITC and joining MISO has not been shown to be in the public interest and will negatively impact and increase cost to our customers. The transfer of transmission asset cases were delayed by the Arkansas and the Missouri commissions pending rulings from Entergy’s other commissions, specifically Texas. Entergy has refiled those transfer requests in Texas. On October 9, 2013, the MPSC conditionally approved EAI’s transfer of transmission assets and participation in MISO based upon development and FERC approval of a revised Joint Operating Agreement between SPP and MISO that addresses at a minimum, loop flow issues and other altered flows related to the Missouri seams between SPP/MISO and upon a requirement that EAI and/or ITC hold harmless non-MISO Missouri retail customers from “all” increased costs due to Entergy’s potential transfer of functional control of its transmission assets to MISO. We believe this is a very positive order for our customers but anticipate an EAI, MISO, and ITC appeal of the MPSC order or other regulatory efforts to challenge such action by the MPSC.
See Note 3, “Regulatory Matters - Competition” in our Annual Report on Form 10-K for the year ended December 31, 2012 for additional information.
LIQUIDITY AND CAPITAL RESOURCES
Overview. Our primary sources of liquidity are cash provided by operating activities, short-term borrowings under our commercial paper program (which is supported by our credit facilities) and borrowings from our unsecured revolving credit facility. As needed, we raise funds from the debt and equity capital markets to fund our liquidity and capital resource needs. Our issuance of various securities, including equity, long-term and short-term debt, is subject to customary approval or authorization by state and federal regulatory bodies including state public service commissions and the SEC. We estimate that internally generated funds (funds provided by operating activities less dividends paid) will provide approximately 39% to 44% of the funds required for the remainder of our budgeted 2013 capital expenditures (as discussed in “Capital Requirements and Investing Activities” below). We believe the amounts available to us under our credit facilities and the issuance of debt and equity securities together with this cash provided by operating activities will allow us to meet our needs for working capital, pension contributions, our continuing construction expenditures, anticipated debt redemptions, interest payments on debt obligations, dividend payments and other cash needs through the next several years. We will continue to evaluate our need to increase available liquidity based on our view of working capital requirements, including the timing of our construction programs and other factors. See Item 1A, “Risk Factors” in our Annual Report on Form 10-K for the year ended December 31, 2012 for additional information on items that could impact our liquidity and capital resource requirements. The following table provides a summary of our operating, investing and financing activities for the nine months ended September 30:
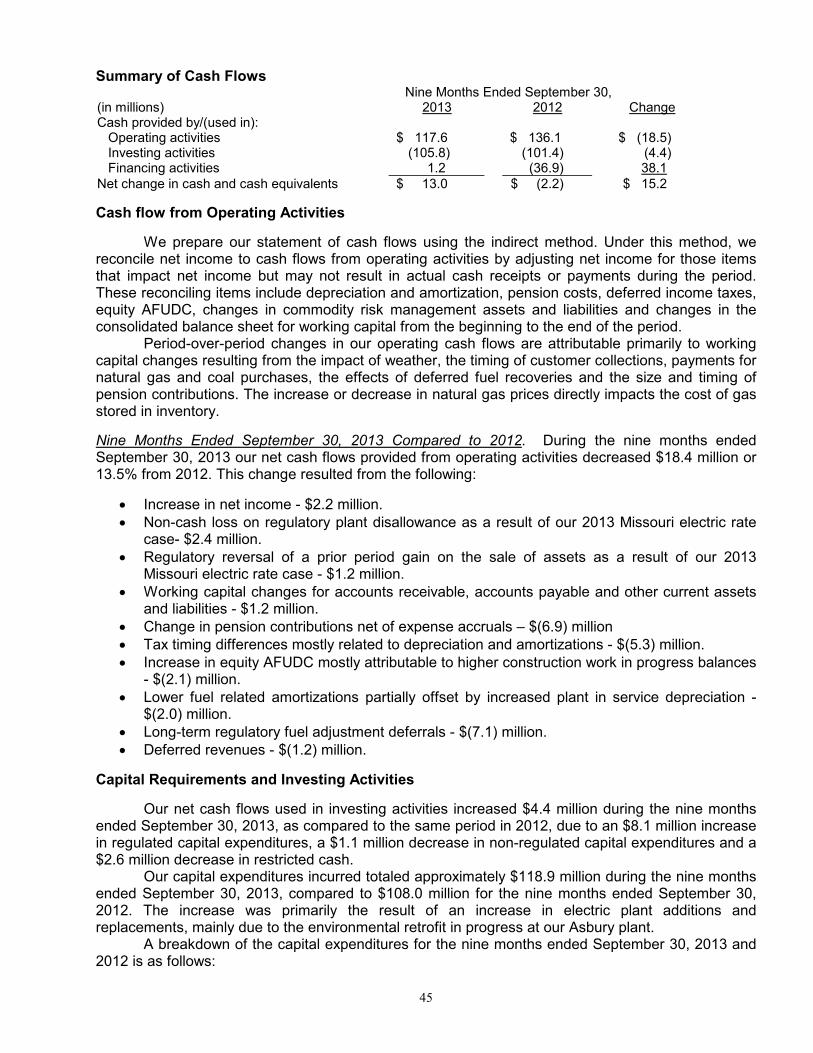
45
Summary of Cash Flows Nine Months Ended September 30, (in millions) 2013 2012 Change Cash provided by/(used in): Operating activities $ 117.6 $ 136.1 $ (18.5) Investing activities (105.8) (101.4) (4.4) Financing activities 1.2 (36.9) 38.1 Net change in cash and cash equivalents $ 13.0 $ (2.2) $ 15.2
Cash flow from Operating Activities
We prepare our statement of cash flows using the indirect method. Under this method, we reconcile net income to cash flows from operating activities by adjusting net income for those items that impact net income but may not result in actual cash receipts or payments during the period. These reconciling items include depreciation and amortization, pension costs, deferred income taxes, equity AFUDC, changes in commodity risk management assets and liabilities and changes in the consolidated balance sheet for working capital from the beginning to the end of the period. Period-over-period changes in our operating cash flows are attributable primarily to working capital changes resulting from the impact of weather, the timing of customer collections, payments for natural gas and coal purchases, the effects of deferred fuel recoveries and the size and timing of pension contributions. The increase or decrease in natural gas prices directly impacts the cost of gas stored in inventory.
Nine Months Ended September 30, 2013 Compared to 2012. During the nine months ended September 30, 2013 our net cash flows provided from operating activities decreased $18.4 million or 13.5% from 2012. This change resulted from the following:
• Increase in net income - $2.2 million. • Non-cash loss on regulatory plant disallowance as a result of our 2013 Missouri electric rate
case- $2.4 million. • Regulatory reversal of a prior period gain on the sale of assets as a result of our 2013
Missouri electric rate case - $1.2 million. • Working capital changes for accounts receivable, accounts payable and other current assets
and liabilities - $1.2 million. • Change in pension contributions net of expense accruals – $(6.9) million • Tax timing differences mostly related to depreciation and amortizations - $(5.3) million. • Increase in equity AFUDC mostly attributable to higher construction work in progress balances
- $(2.1) million. • Lower fuel related amortizations partially offset by increased plant in service depreciation -
$(2.0) million. • Long-term regulatory fuel adjustment deferrals - $(7.1) million. • Deferred revenues - $(1.2) million.
Capital Requirements and Investing Activities
Our net cash flows used in investing activities increased $4.4 million during the nine months ended September 30, 2013, as compared to the same period in 2012, due to an $8.1 million increase in regulated capital expenditures, a $1.1 million decrease in non-regulated capital expenditures and a $2.6 million decrease in restricted cash. Our capital expenditures incurred totaled approximately $118.9 million during the nine months ended September 30, 2013, compared to $108.0 million for the nine months ended September 30, 2012. The increase was primarily the result of an increase in electric plant additions and replacements, mainly due to the environmental retrofit in progress at our Asbury plant. A breakdown of the capital expenditures for the nine months ended September 30, 2013 and 2012 is as follows:

46
Capital Expenditures (in millions) 2013 2012 Distribution and transmission system additions $ 43.5 $ 43.9 New Generation – Iatan 2 0.2 1.0 Storms 0.3 4.6 Additions and replacements – electric plant 59.9 35.1 Gas segment additions and replacements 2.6 2.1 Transportation 1.9 2.9 Other (including retirements, insurance proceeds and salvage -net)
(1) 9.2 16.0
Subtotal 117.6 105.6 Non-regulated capital expenditures (primarily fiber optics) 1.3 2.4 Subtotal capital expenditures incurred
(2) 118.9 108.0
Adjusted for capital expenditures payable (3) (10.5) (6.6)
Total cash outlay $ 108.4 $ 101.4 (1)
Other includes equity AFUDC of $(2.5) million and $(0.4) million for 2013 and 2012, respectively. (2)
Expenditures incurred represent the total cost for work completed for the projects during the reporting period. Discussion of capital expenditures throughout this 10-Q is presented on this basis. These capital expenditures include AFUDC, capital expenditures to retire assets and benefits from salvage. (3)
The amount of expenditures paid/(unpaid) at the end of the reporting period to adjust to actual cash outlay reflected in the Investing Activities section of the Statement of Cash Flows.
All of our cash requirements for capital expenditures during the nine months ended September 30, 2013 were satisfied from internally generated funds (funds provided by operating activities less dividends paid).
We estimate that our capital expenditures (excluding AFUDC) for the remainder of 2013 will range from approximately $40.0 million to $45.0 million and for 2014 through 2018 will be as follows (in millions):
2014 2015 2016 2017 2018 Estimated capital expenditures $ 213.7 $ 175.9 $ 110.1 $ 99.2 $ 95.9
As noted in the Purchased Power section of Note 7, it is not currently our intention to exercise the Plum Point ownership option and, as such, no expenditures are included for such purpose in the 2015 projection.
We estimate that internally generated funds will provide approximately 39% to 44% of the funds required for the remainder of our budgeted 2013 capital expenditures. We intend to utilize short-term debt to finance any additional amounts needed beyond those provided by operating activities for such capital expenditures. If additional financing is needed, we intend to utilize a combination of debt and equity securities. For further information see Note 6 of “Notes to Consolidated Financial Statements (Unaudited).”
Financing Activities
Nine Months Ended September 30, 2013 Compared to 2012.
Our net cash flows provided by financing activities was $1.2 million in the nine months ended September 30, 2013, an increase of $38.1 million as compared to a $36.9 million use of cash during the nine months ended September 30, 2012, primarily due to the following:
• Issuance of $150.0 million of first mortgage bonds in the nine months ended September 30, 2013 compared to $88.0 million in the nine months ended September 30, 2012
• Repayment of $98.0 million of senior notes in the nine months ended September 30, 2013 compared to $88.0 million of first mortgage bonds in the nine months ended September 30, 2012.
• Repayment of $24.0 million in short-term debt in the nine months ended September 30, 2013 as compared to repayment of $10.0 million in the nine months ended September 30, 2012.
47
See the financing discussion in Note 6 of “Notes to Consolidated Financial Statements (Unaudited).”
Shelf Registration
We have a $400.0 million shelf registration statement with the SEC, effective for a three-year period beginning February 7, 2011, covering our common stock, unsecured debt securities, preference stock, and first mortgage bonds. We have received regulatory approval for the issuance of securities under this shelf from all four states in our electric service territory, but we may only issue up to $250.0 million of such securities in the form of first mortgage bonds, of which $12.0 million remains available after giving effect to the $150.0 million of new first mortgage bonds issued on May 30, 2013. We plan to use proceeds from offerings made pursuant to this shelf to fund capital expenditures, refinancings of existing debt or general corporate needs.
Credit Agreements
On January 17, 2012, we entered into the Third Amended and Restated Unsecured Credit Agreement which amended and restated our Second Amended and Restated Unsecured Credit Agreement dated January 26, 2010. This agreement extended the termination date of the revolving credit facility from January 26, 2013 to January 17, 2017. The agreement also removed the letter of credit facility and includes a swingline loan facility with a $15 million swingline loan sublimit. The aggregate amount of the revolving credit commitments remains $150 million, inclusive of the $15 million swingline loan sublimit. In addition, the pricing and fees under the facility were amended. Interest on borrowings under the facility accrues at a rate equal to, at our option, (i) the highest of (A) the bank’s prime commercial rate, (B) the federal funds effective rate plus 0.5% or (C) one month LIBOR plus 1.0%, plus a margin or (ii) one month, two month or three month LIBOR, in each case, plus a margin. Each margin is based on our current credit ratings and the pricing schedule in the facility. As of the date hereof, and based on our current credit ratings, the LIBOR margin under the facility is 1.25%. A facility fee is payable quarterly on the full amount of the commitments under the facility based on our current credit ratings, which fee is currently 0.25%. In addition, upon entering into the amended and restated facility, we paid an upfront fee to the revolving credit banks of $262,500 in the aggregate. There were no other material changes to the terms of the facility.
The facility is used for working capital, general corporate purposes and to back-up our use of commercial paper. This facility requires our total indebtedness to be less than 62.5% of our total capitalization at the end of each fiscal quarter and our EBITDA (defined as net income plus interest, taxes, depreciation and amortization) to be at least two times our interest charges for the trailing four fiscal quarters at the end of each fiscal quarter. Failure to maintain these ratios will result in an event of default under the credit facility and will prohibit us from borrowing funds thereunder. As of September 30, 2013, we are in compliance with these ratios. Our total indebtedness is 50.0% of our total capitalization as of September 30, 2013 and our EBITDA is 5.0 times our interest charges. This credit facility is also subject to cross-default if we default on in excess of $10 million in the aggregate on our other indebtedness. This arrangement does not serve to legally restrict the use of our cash in the normal course of operations. There were no outstanding borrowings under this agreement at September 30, 2013 and no outstanding commercial paper.
EDE Mortgage Indenture
The principal amount of all series of first mortgage bonds outstanding at any one time under the EDE Mortgage is limited by terms of the mortgage to $1.0 billion. Substantially all of the property, plant and equipment of The Empire District Electric Company (but not its subsidiaries) is subject to the lien of the EDE Mortgage. Restrictions in the EDE mortgage bond indenture could affect our liquidity. The EDE Mortgage contains a requirement that for new first mortgage bonds to be issued, our net earnings (as defined in the EDE Mortgage) for any twelve consecutive months within the fifteen months preceding issuance must be two times the annual interest requirements (as defined in the EDE Mortgage) on all first mortgage bonds then outstanding and on the prospective issue of new first mortgage bonds. Our earnings for the twelve months ended September 30, 2013 would permit us
48
to issue approximately $511.9 million of new first mortgage bonds based on this test with an assumed interest rate of 5.5%. In addition to the interest coverage requirement, the EDE Mortgage provides that new bonds must be issued against, among other things, retired bonds or 60% of net property additions. At September 30, 2013, we had retired bonds and net property additions which would enable the issuance of at least $837.3 million principal amount of bonds if the annual interest requirements are met. As of September 30, 2013, we are in compliance with all restrictive covenants of the EDE Mortgage.
EDG Mortgage Indenture
The principal amount of all series of first mortgage bonds outstanding at any one time under the EDG Mortgage is limited by terms of the mortgage to $300.0 million. Substantially all of the property, plant and equipment of The Empire District Gas Company is subject to the lien of the EDG Mortgage. The EDG Mortgage contains a requirement that for new first mortgage bonds to be issued, the amount of such new first mortgage bonds shall not exceed 75% of the cost of property additions acquired after the date of the Missouri Gas acquisition. The mortgage also contains a limitation on the issuance by EDG of debt (including first mortgage bonds, but excluding short-term debt incurred in the ordinary course under working capital facilities) unless, after giving effect to such issuance, EDG’s ratio of EBITDA (defined as net income plus interest, taxes, depreciation, amortization and certain other non-cash charges) to interest charges for the most recent four fiscal quarters is at least 2.0 to 1.0. As of September 30, 2013, this test would allow us to issue approximately $14.7 million principal amount of new first mortgage bonds at an assumed interest rate of 5.5%.
Currently, our corporate credit ratings and the ratings for our securities are as follows: Fitch Moody’s Standard & Poor’s Corporate Credit Rating n/r* Baa2 BBB EDE First Mortgage Bonds BBB+ A3 A- Senior Notes BBB Baa2 BBB Commercial Paper F3 P-2 A-2 Outlook Stable Stable Stable
*Not rated
On March 6, 2013, Standard & Poor’s upgraded our corporate credit rating to BBB from BBB-, senior secured debt to A- from BBB+, senior unsecured debt to BBB from BBB- and our commercial paper rating to A-2 from A-3. Standard & Poor’s outlook for Empire is stable. On May 26, 2011 after the May 22, 2011 tornado, and again on April 25, 2012, Moody’s reaffirmed all of our ratings. On March 24, 2011, Fitch revised our commercial paper rating from F2 to F3 and reaffirmed our other ratings. The rating action was not based on a specific action or event on our part, but reflected their traditional linkage of long-term and short-term Issuer Default Ratings. On May 24, 2013, Fitch reaffirmed our ratings. A security rating is not a recommendation to buy, sell or hold securities. Each rating is subject to revision or withdrawal at any time by the assigning rating organization. Each security rating agency has its own methodology for assigning ratings, and, accordingly, each rating should be considered independently of all other ratings.
CONTRACTUAL OBLIGATIONS
Material changes to our contractual obligations at September 30, 2013, compared to December 31, 2012, consist of the following:
• On October 30, 2012, we entered into a Bond Purchase Agreement for a private placement of $30.0 million of 3.73% First Mortgage Bonds due May 30, 2033 and $120.0 million of 4.32% First Mortgage Bonds due May 30, 2043. The delayed settlement of both series of bonds occurred on May 30, 2013.
• On June 15, 2013, we redeemed all $98.0 million aggregate principal amount of our Senior Notes, 4.50% Series due June 15, 2013.
49
• On July 9, 2013, we signed a contract with a third party vendor to complete engineering, procurement, and construction activities at our Riverton plant to convert Riverton Unit 12 from a simple cycle combustion turbine to a combined cycle unit. This conversion is currently scheduled to be completed in 2016 at a cost estimated to range from $165 million to $175 million, excluding AFUDC.
See “Financing Activities” above and Note 7 of “Notes to Consolidated Financial Statements (Unaudited)” under “Environmental” for details.
In addition, on October 1, 2013, we extended our transportation contract with ANR Pipeline Company, expiring on March 31, 2014, for a period of ten years, expiring on March 31, 2024. Annual costs under this contract are expected to be approximately $0.5 million, depending on volume.
DIVIDENDS
Our diluted earnings per share were $1.13 for the nine months ended September 30, 2013 and were $1.32 and $1.31 for the years ended December 31, 2012 and 2011, respectively. Dividends paid per share were $0.75 for the nine months ended September 30, 2013, $1.00 for the year ended December 31, 2012 and $0.64 for the year ended December 31, 2011.
Holders of our common stock are entitled to dividends if, as, and when declared by the Board of Directors, out of funds legally available therefore, subject to the prior rights of holders of any outstanding cumulative preferred stock and preference stock. Payment of dividends is determined by our Board of Directors after considering all relevant factors, including the amount of our retained earnings (which is essentially our accumulated net income less dividend payouts). A reduction of our dividend per share, partially or in whole, could have an adverse effect on our common stock price.
In response to the expected loss of revenues resulting from the May 22, 2011 tornado, our level of retained earnings and other relevant factors, our Board of Directors suspended our quarterly dividend for the third and fourth quarters of 2011. On February 2, 2012, the Board of Directors re-established the dividend and declared a quarterly dividend of $0.25 per share on common stock payable on March 15, 2012 to holders of record as of March 1, 2012. Dividends were paid during all four quarters of 2012. As of September 30, 2013, our retained earnings balance was $63.4 million, compared to $48.1 million as of September 30, 2012 and a retained earnings balance of $47.1 million as of December 31, 2012, after paying out $32.0 million in dividends during the first nine months of 2013. On October 31, 2013, the Board of Directors declared a quarterly dividend of $0.255 per share on common stock payable on December 16, 2013 to holders of record as of December 2, 2013, reflecting a 2.0% increase over the previous quarter’s dividend. Under Kansas corporate law, our Board of Directors may only declare and pay dividends out of our surplus or, if there is no surplus, out of our net profits for the fiscal year in which the dividend is declared or the preceding fiscal year, or both. Our surplus, under Kansas law, is equal to our retained earnings plus accumulated other comprehensive income/(loss), net of income tax. However, Kansas law does permit, under certain circumstances, our Board of Directors to transfer amounts from capital in excess of par value to surplus. In addition, Section 305(a) of the Federal Power Act (FPA) prohibits the payment by a utility of dividends from any funds "properly included in capital account". There are no additional rules or regulations issued by the FERC under the FPA clarifying the meaning of this limitation. However, several decisions by the FERC on specific dividend proposals suggest that any determination would be based on a fact-intensive analysis of the specific facts and circumstances surrounding the utility and the dividend in question, with particular focus on the impact of the proposed dividend on the liquidity and financial condition of the utility.
In addition, the EDE Mortgage and our Restated Articles contain certain dividend restrictions. The most restrictive of these is contained in the EDE Mortgage, which provides that we may not declare or pay any dividends (other than dividends payable in shares of our common stock) or make any other distribution on, or purchase (other than with the proceeds of additional common stock financing) any shares of, our common stock if the cumulative aggregate amount thereof after August 31, 1944 (exclusive of the first quarterly dividend of $98,000 paid after said date) would exceed the sum of $10.75 million and the earned surplus (as defined in the EDE Mortgage) accumulated subsequent to August 31, 1944, or the date of succession in the event that another corporation

50
succeeds to our rights and liabilities by a merger or consolidation. The EDE Mortgage permits the payment of any dividend or distribution on, or purchase of, shares of its common stock within 60 days after the related date of declaration or notice of such dividend, distribution or purchase if (i) on the date of declaration or notice, such dividend, distribution or purchase would have complied with the provisions of the EDE Mortgage and (ii) as of the last day of the calendar month ended immediately preceding the date of such payment, our ratio of total indebtedness to total capitalization (after giving pro forma effect to the payment of such dividend, distribution, or purchase) was not more than 0.625 to 1.
OFF-BALANCE SHEET ARRANGEMENTS
We have no off-balance sheet arrangements that have or are reasonably likely to have a current or future effect on our financial condition, changes in financial condition, revenues or expenses, results of operations, liquidity, capital expenditures or capital resources, other than operating leases entered into in the normal course of business.
CRITICAL ACCOUNTING POLICIES AND ESTIMATES
See “Item 7 – Management’s Discussion and Analysis of Financial Condition and Results of Operations” in our Annual Report on Form 10-K for the year ended December 31, 2012 for a discussion of additional critical accounting policies. There were no changes in these policies in the quarter ended September 30, 2013.
RECENTLY ISSUED ACCOUNTING STANDARDS
See Note 2 of “Notes to Consolidated Financial Statements (Unaudited)”.
Item 3. Quantitative and Qualitative Disclosures about Market Risk
Our fuel procurement activities involve primary market risk exposures, including commodity price risk and credit risk. Commodity price risk is the potential adverse price impact related to the fuel procurement for our generating units. Credit risk is the potential adverse financial impact resulting from non-performance by a counterparty of its contractual obligations. Additionally, we are exposed to interest rate risk which is the potential adverse financial impact related to changes in interest rates.
Market Risk and Hedging Activities. Prices in the wholesale power markets often are extremely volatile. This volatility impacts our cost of power purchased and our participation in energy trades. If we were unable to generate an adequate supply of electricity for our customers, we would attempt to purchase power from others. Such supplies are not always available. In addition, congestion on the transmission system can limit our ability to make purchases from (or sell into) the wholesale markets. We engage in physical and financial trading activities with the goals of reducing risk from market fluctuations. In accordance with our established Energy Risk Management Policy, which typically includes entering into various derivative transactions, we attempt to mitigate our commodity market risk. Derivatives are utilized to manage our gas commodity market risk and to help manage our exposure resulting from purchasing most of our natural gas on the volatile spot market for the generation of power for our native-load customers. See Note 4 of "Notes to Consolidated Financial Statements (Unaudited)" for further information.
Commodity Price Risk. We are exposed to the impact of market fluctuations in the price and transportation costs of coal, natural gas, and electricity and employ established policies and procedures to manage the risks associated with these market fluctuations, including utilizing derivatives.
We satisfied 65.6% of our 2012 generation fuel supply need through coal. This includes the remaining coal used at Riverton as part of its transition to natural gas. Approximately 96% of our 2012 coal supply was Western coal. We have contracts and binding proposals to supply a portion of the fuel for our coal plants through 2015. These contracts satisfy approximately 100% of our
51
anticipated fuel requirements for 2013, 58% for 2014 and 26% for our 2015 requirements for our Asbury coal plant. In order to manage our exposure to fuel prices, future coal supplies will be acquired using a combination of short-term and long-term contracts. We are exposed to changes in market prices for natural gas we must purchase to run our combustion turbine generators. Our natural gas procurement program is designed to manage our costs to avoid volatile natural gas prices. We enter into physical forward and financial derivative contracts with counterparties relating to our future natural gas requirements that lock in prices (with respect to predetermined percentages of our expected future natural gas needs) in an attempt to lessen the volatility in our fuel expenditures and improve predictability. As of September 30, 2013, 14%, or 0.8 million Dths, of our anticipated volume of natural gas usage for our electric operations for the remainder of 2013 is hedged. Based on our expected natural gas purchases for our electric operations for the next twelve months, if average natural gas prices should increase 10% more than the price at September 30, 2013, our natural gas cost would increase by approximately $1.7 million based on our September 30, 2013 total hedged positions for the next twelve months. However, this is probable of recovery through fuel adjustment mechanisms in all of our jurisdictions, which significantly reduces the impact of fluctuating fuel costs.
We attempt to mitigate a portion of our natural gas price risk associated with our gas segment using physical forward purchase agreements, storage and derivative contracts. As of September 30, 2013, we have 1.7 million Dths in storage on the three pipelines that serve our customers. This represents 83% of our storage capacity.
See Note 4 of “Notes to Consolidated Financial Statements (Unaudited)” for further information.
Credit Risk. In order to minimize overall credit risk, we maintain credit policies, including the evaluation of counterparty financial condition and the use of standardized agreements that facilitate the netting of cash flows associated with a single counterparty. See Note 4 of “Notes to Consolidated Financial Statements (Unaudited)” regarding agreements containing credit risk contingent features. In addition, certain counterparties make available collateral in the form of cash held as margin deposits as a result of exceeding agreed-upon credit exposure thresholds or may be required to prepay the transaction. Conversely, we are required to post collateral with counterparties at certain thresholds, which is typically the result of changes in commodity prices. Amounts reported as margin deposit liabilities represent counterparty funds we hold that result from various trading counterparties exceeding agreed-upon credit exposure thresholds. Amounts reported as margin deposit assets represent our funds held on deposit for our NYMEX contracts with our broker and other financial contracts with other counterparties that resulted from us exceeding agreed-upon credit limits established by the counterparties. The following table depicts our margin deposit assets at September 30, 2013 and December 31, 2012. There were no margin deposit liabilities at these dates.
September 30, 2013 December 31, 2012 (in millions) Margin deposit assets $ 5.8 $ 4.2
Our exposure to credit risk is concentrated primarily within our fuel procurement process, as we transact with a small group of counterparties and transactions may involve large notional volumes and potentially volatile commodity prices. Below is a table showing our net credit exposure at September 30, 2013, reflecting that our counterparties are exposed to Empire for the net unrealized mark-to-market losses for physical forward and financial natural gas contracts carried at fair value.
(in millions) Net unrealized mark-to-market losses for physical forward natural gas contracts $ 2.1 Net unrealized mark-to-market losses for financial natural gas contracts 6.0 Net credit exposure $ 8.1

52
The $6.0 million net unrealized mark-to-market loss for financial natural gas contracts is comprised of $6.0 million that our counterparties are exposed to Empire for unrealized losses. We are holding no collateral from any counterparty since they are below the $10.0 million mark-to-market collateral threshold in our agreements. As noted above, as of September 30, 2013, we have $5.8 million on deposit for NYMEX contract exposure to Empire, of which $5.6 million represents our collateral requirement. In addition, if NYMEX gas prices decreased 25% from their September 30,
2013 levels, we would be required to post an additional $10.0 million in collateral. If these prices increased 25%, our collateral requirement would decrease $4.4 million. Our other counterparties would not be required to post collateral with Empire.
We sell electricity and gas and provide distribution and transmission services to a diverse group of customers, including residential, commercial and industrial customers. Credit risk associated with trade accounts receivable from energy customers is limited due to the large number of customers. In addition, we enter into contracts with various companies in the energy industry for purchases of energy-related commodities, including natural gas in our fuel procurement process.
Interest Rate Risk. We are exposed to changes in interest rates as a result of financing through our issuance of commercial paper and other short-term debt. We manage our interest rate exposure by limiting our variable-rate exposure (applicable to commercial paper and borrowings under our unsecured credit agreement) to a certain percentage of total capitalization, as set by policy, and by monitoring the effects of market changes in interest rates. If market interest rates average 1% more in 2013 than in 2012, our interest expense would increase, and income before taxes would decrease by less than $0.6 million. This amount has been determined by considering the impact of the hypothetical interest rates on our highest month-end commercial paper balance for 2012. These analyses do not consider the effects of the reduced level of overall economic activity that could exist in such an environment. In the event of a significant change in interest rates, management would likely take actions to further mitigate its exposure to the change. However, due to the uncertainty of the specific actions that would be taken and their possible effects, the sensitivity analysis assumes no changes in our financial structure.
Item 4. Controls and Procedures
As of the end of the period covered by this report, an evaluation was carried out, under the supervision and with the participation of our management, including our Chief Executive Officer and Chief Financial Officer, of the effectiveness of the design and operation of our disclosure controls and procedures (as such term is defined in Rule 13a-15(e) of the Securities Exchange Act of 1934). Based upon that evaluation, the Chief Executive Officer and Chief Financial Officer concluded that our disclosure controls and procedures were effective as of September 30, 2013. There have been no changes in our internal control over financial reporting that occurred during the third quarter of 2013 that have materially affected, or are reasonably likely to materially affect, our internal control over financial reporting.
PART II. OTHER INFORMATION Item 1. Legal Proceedings
See Note 7 of “Notes to Consolidated Financial Statements (Unaudited)” under “Legal Proceedings”, which description is incorporated herein by reference. Item 1A. Risk Factors.
There have been no material changes to the factors disclosed in Part I, Item 1-A. Risk Factors in our Annual Report on Form 10-K for the year ended December 31, 2012.
53
Item 5. Other Information. For the twelve months ended September 30, 2013, our ratio of earnings to fixed charges was 2.84x. See Exhibit (12) hereto. Item 6. Exhibits. (a) Exhibits.
(12) Computation of Ratio of Earnings to Fixed Charges.
(31)(a) Certification of Chief Executive Officer pursuant to Section 302 of the Sarbanes-Oxley Act of 2002.
(31)(b) Certification of Chief Financial Officer pursuant to Section 302 of the Sarbanes-Oxley Act of 2002.
(32)(a) Certification of Chief Executive Officer pursuant to 18 U.S.C. Section 1350, as adopted pursuant to Section 906 of the Sarbanes-Oxley Act of 2002.*
(32)(b) Certification of Chief Financial Officer pursuant to 18 U.S.C. Section 1350, as adopted pursuant to Section 906 of the Sarbanes-Oxley Act of 2002.*
(101) The following financial information from The Empire District Electric Company’s Quarterly Report on Form 10-Q for the period ended September 30, 2013, filed with the SEC on November 8, 2013, formatted in Extensible Business Reporting Language (XBRL): (i) the Consolidated Statements of Income for the three, nine and twelve month periods ended September 30, 2013 and 2012, (ii) the Consolidated Balance Sheets at September 30, 2013 and December 31, 2012, (iii) the Consolidated Statements of Cash Flows for the nine-month periods ended September 30, 2013 and 2012, and (iv) Notes to Consolidated Financial Statements.**
*This certification accompanies this Report pursuant to Section 906 of the Sarbanes-Oxley Act of 2002 and shall not be deemed filed by the Company for purposes of Section 18 or any other provision of the Securities Exchange Act of 1934, as amended.
**Pursuant to Rule 406T of Regulation S-T, the XBRL related information in Exhibit 101 to this Quarterly Report on Form 10-Q shall not be deemed to be “filed” for purposes of Section 18 of the Exchange Act, or otherwise subject to the liability of that section, and shall not be deemed incorporated by reference into, or part of a registration statement, prospectus or other document filed under the Securities Act of 1933, as amended or the Exchange Act of 1934, as amended except as shall be expressly set forth by specific reference in such filings.
54
SIGNATURES
Pursuant to the requirements of the Securities Exchange Act of 1934, the Registrant has duly caused this report to be signed on its behalf by the undersigned thereunto duly authorized.
THE EMPIRE DISTRICT ELECTRIC COMPANY Registrant
By /s/ Laurie A. Delano Laurie A. Delano
Vice President – Finance and Chief Financial Officer
By /s/ Robert W. Sager Robert W. Sager
Controller, Assistant Secretary and Assistant Treasurer November 8, 2013
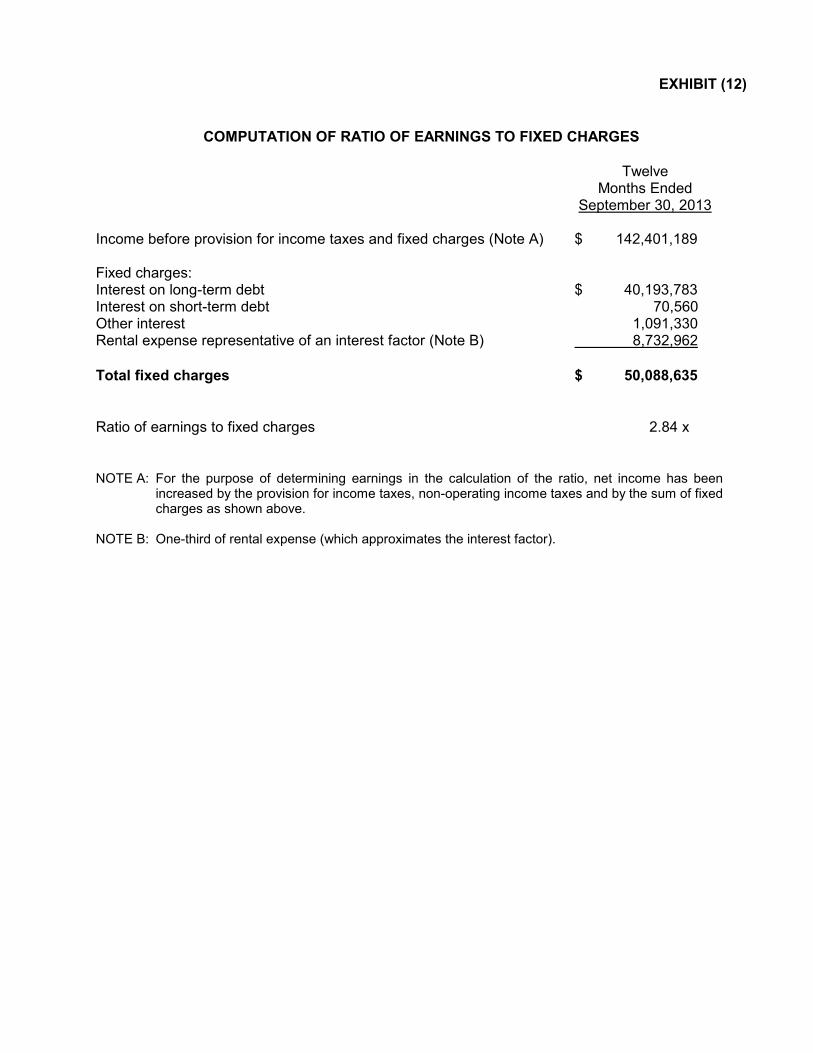
EXHIBIT (12)
COMPUTATION OF RATIO OF EARNINGS TO FIXED CHARGES
Twelve Months Ended September 30, 2013 Income before provision for income taxes and fixed charges (Note A) $ 142,401,189 Fixed charges: Interest on long-term debt $ 40,193,783 Interest on short-term debt 70,560 Other interest 1,091,330 Rental expense representative of an interest factor (Note B) 8,732,962 Total fixed charges $ 50,088,635 Ratio of earnings to fixed charges 2.84 x
NOTE A: For the purpose of determining earnings in the calculation of the ratio, net income has been
increased by the provision for income taxes, non-operating income taxes and by the sum of fixed charges as shown above.
NOTE B: One-third of rental expense (which approximates the interest factor).
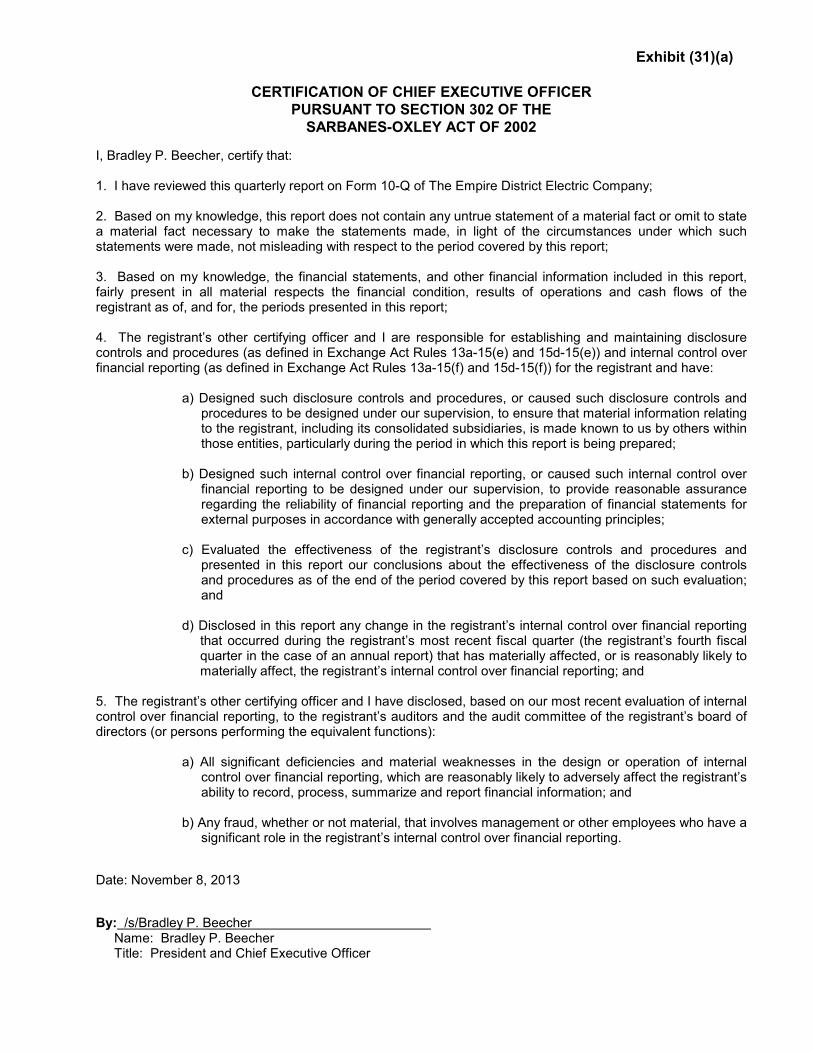
Exhibit (31)(a)
CERTIFICATION OF CHIEF EXECUTIVE OFFICER PURSUANT TO SECTION 302 OF THE SARBANES-OXLEY ACT OF 2002
I, Bradley P. Beecher, certify that: 1. I have reviewed this quarterly report on Form 10-Q of The Empire District Electric Company; 2. Based on my knowledge, this report does not contain any untrue statement of a material fact or omit to state a material fact necessary to make the statements made, in light of the circumstances under which such statements were made, not misleading with respect to the period covered by this report; 3. Based on my knowledge, the financial statements, and other financial information included in this report, fairly present in all material respects the financial condition, results of operations and cash flows of the registrant as of, and for, the periods presented in this report; 4. The registrant’s other certifying officer and I are responsible for establishing and maintaining disclosure controls and procedures (as defined in Exchange Act Rules 13a-15(e) and 15d-15(e)) and internal control over financial reporting (as defined in Exchange Act Rules 13a-15(f) and 15d-15(f)) for the registrant and have:
a) Designed such disclosure controls and procedures, or caused such disclosure controls and procedures to be designed under our supervision, to ensure that material information relating to the registrant, including its consolidated subsidiaries, is made known to us by others within those entities, particularly during the period in which this report is being prepared;
b) Designed such internal control over financial reporting, or caused such internal control over
financial reporting to be designed under our supervision, to provide reasonable assurance regarding the reliability of financial reporting and the preparation of financial statements for external purposes in accordance with generally accepted accounting principles;
c) Evaluated the effectiveness of the registrant’s disclosure controls and procedures and
presented in this report our conclusions about the effectiveness of the disclosure controls and procedures as of the end of the period covered by this report based on such evaluation; and
d) Disclosed in this report any change in the registrant’s internal control over financial reporting
that occurred during the registrant’s most recent fiscal quarter (the registrant’s fourth fiscal quarter in the case of an annual report) that has materially affected, or is reasonably likely to materially affect, the registrant’s internal control over financial reporting; and
5. The registrant’s other certifying officer and I have disclosed, based on our most recent evaluation of internal control over financial reporting, to the registrant’s auditors and the audit committee of the registrant’s board of directors (or persons performing the equivalent functions):
a) All significant deficiencies and material weaknesses in the design or operation of internal
control over financial reporting, which are reasonably likely to adversely affect the registrant’s ability to record, process, summarize and report financial information; and
b) Any fraud, whether or not material, that involves management or other employees who have a
significant role in the registrant’s internal control over financial reporting.
Date: November 8, 2013
By: /s/Bradley P. Beecher Name: Bradley P. Beecher Title: President and Chief Executive Officer

Exhibit (31)(b)
CERTIFICATION OF CHIEF FINANCIAL OFFICER PURSUANT TO SECTION 302 OF THE SARBANES-OXLEY ACT OF 2002
I, Laurie A. Delano, certify that: 1. I have reviewed this quarterly report on Form 10-Q of The Empire District Electric Company; 2. Based on my knowledge, this report does not contain any untrue statement of a material fact or omit to state a material fact necessary to make the statements made, in light of the circumstances under which such statements were made, not misleading with respect to the period covered by this report; 3. Based on my knowledge, the financial statements, and other financial information included in this report, fairly present in all material respects the financial condition, results of operations and cash flows of the registrant as of, and for, the periods presented in this report; 4. The registrant’s other certifying officer and I are responsible for establishing and maintaining disclosure controls and procedures (as defined in Exchange Act Rules 13a-15(e) and 15d-15(e)) and internal control over financial reporting (as defined in Exchange Act Rules 13a-15(f) and 15d-15(f)) for the registrant and have:
a) Designed such disclosure controls and procedures, or caused such disclosure controls and
procedures to be designed under our supervision, to ensure that material information relating to the registrant, including its consolidated subsidiaries, is made known to us by others within those entities, particularly during the period in which this report is being prepared;
b) Designed such internal control over financial reporting, or caused such internal control over
financial reporting to be designed under our supervision, to provide reasonable assurance regarding the reliability of financial reporting and the preparation of financial statements for external purposes in accordance with generally accepted accounting principles;
c) Evaluated the effectiveness of the registrant’s disclosure controls and procedures and
presented in this report our conclusions about the effectiveness of the disclosure controls and procedures as of the end of the period covered by this report based on such evaluation; and
d) Disclosed in this report any change in the registrant’s internal control over financial reporting
that occurred during the registrant’s most recent fiscal quarter (the registrant’s fourth fiscal quarter in the case of an annual report) that has materially affected, or is reasonably likely to materially affect, the registrant’s internal control over financial reporting; and
5. The registrant’s other certifying officer and I have disclosed, based on our most recent evaluation of internal control over financial reporting, to the registrant’s auditors and the audit committee of the registrant’s board of directors (or persons performing the equivalent functions):
a) All significant deficiencies and material weaknesses in the design or operation of internal
control over financial reporting which are reasonably likely to adversely affect the registrant’s ability to record, process, summarize and report financial information; and
b) Any fraud, whether or not material, that involves management or other employees who have a
significant role in the registrant’s internal control over financial reporting.
Date: November 8, 2013
By: /s/ Laurie A. Delano Name: Laurie A. Delano Title: Vice President - Finance and Chief Financial Officer
Exhibit (32)(a)
Certification Pursuant to 18 U.S.C. Section 1350, As Adopted Pursuant to Section 906 of the Sarbanes-Oxley Act of 2002
In connection with the Quarterly Report of The Empire District Electric Company (the “Company”) on Form 10-Q for the period ending September 30, 2013 as filed with the Securities and Exchange Commission on the date hereof (the “Report”), Bradley P. Beecher, as Chief Executive Officer of the Company, certifies, pursuant to 18 U.S.C. Section 1350, as adopted pursuant to Section 906 of the Sarbanes-Oxley Act of 2002, that: (1) The Report fully complies with the requirements of section 13(a) of the Securities Exchange Act of 1934; and (2) The information contained in the Report fairly presents, in all material respects, the financial condition and result of operations of the Company. By /s/ Bradley P. Beecher Name: Bradley P. Beecher Title: President and Chief Executive Officer Date: November 8, 2013 A signed original of this written statement required by Section 906 or other document authenticating, acknowledging or otherwise adopting the signature that appears in typed form within the electronic version of this written statement required by Section 906, has been provided to The Empire District Electric Company and will be retained by The Empire District Electric Company and furnished to the Securities and Exchange Commission or its staff upon request.
Exhibit (32)(b)
Certification Pursuant to 18 U.S.C. Section 1350,
As Adopted Pursuant to Section 906 of the Sarbanes-Oxley Act of 2002 In connection with the Quarterly Report of The Empire District Electric Company (the “Company”) on Form 10-Q for the period ending September 30, 2013 as filed with the Securities and Exchange Commission on the date hereof (the “Report”), Laurie A. Delano, as Chief Financial Officer of the Company, certifies, pursuant to 18 U.S.C. Section 1350, as adopted pursuant to Section 906 of the Sarbanes-Oxley Act of 2002, that: (1) The Report fully complies with the requirements of section 13(a) of the Securities Exchange Act of 1934; and (2) The information contained in the Report fairly presents, in all material respects, the financial condition and result of operations of the Company. By /s/ Laurie A. Delano Name: Laurie A. Delano Title: Vice President - Finance and Chief Financial Officer Date: November 8, 2013 A signed original of this written statement required by Section 906 or other document authenticating, acknowledging or otherwise adopting the signature that appears in typed form within the electronic version of this written statement required by Section 906, has been provided to The Empire District Electric Company and will be retained by The Empire District Electric Company and furnished to the Securities and Exchange Commission or its staff upon request.

UNITED STATES SECURITIES AND EXCHANGE COMMISSION WASHINGTON, D.C. 20549
FORM 10-K (Mark One)
Annual report pursuant to Section 13 or 15(d) of the Securities Exchange Act of 1934
For the fiscal year ended December 31, 2013 or
Transition report pursuant to Section 13 or 15(d) of the Securities Exchange Act of 1934 For the transition period from to .
Commission file number: 1-3368
THE EMPIRE DISTRICT ELECTRIC COMPANY (Exact name of registrant as specified in its charter)
Kansas 44-0236370 (State of Incorporation) (I.R.S. Employer Identification No.)
602 S. Joplin Avenue, Joplin, Missouri 64801 (Address of principal executive offices) (zip code)
Registrant’s telephone number: (417) 625-5100
Securities registered pursuant to Section 12(b) of the Act:
Title of each class Name of each exchange on which registered Common Stock ($1 par value) New York Stock Exchange
Securities registered pursuant to Section 12(g) of the Act: None Indicate by check mark if the registrant is a well-known seasoned issuer, as defined in Rule 405 of the Securities Act. Yes_√_ No___ Indicate by check mark if the registrant is not required to file reports pursuant to Section 13 or Section 15(d) of the Act. Yes___ No_√_ Indicate by check mark whether the registrant (1) has filed all reports required to be filed by Section 13 or 15(d) of the Securities Exchange Act of 1934 during the preceding 12 months (or for such shorter period that the registrant was required to file such reports), and (2) has been subject to such filing requirements for the past 90 days. Yes_√_ No___ Indicate by check mark whether the registrant has submitted electronically and posted on its corporate Web site, if any, every Interactive Data File required to be submitted and posted pursuant to Rule 405 of Regulation S-T during the preceding 12 months (or for such shorter period that the registrant was required to submit and post such files). Yes _√_No ___ Indicate by check mark if disclosure of delinquent filers pursuant to Item 405 of Regulation S-K is not contained herein, and will not be contained, to the best of registrant’s knowledge, in definitive proxy or information statements incorporated by reference in Part III of this Form 10-K or any amendment to this Form 10-K. _√_ Indicate by check mark whether the registrant is a large accelerated filer, an accelerated filer, a non-accelerated filer, or a smaller reporting company. See the definitions of “large accelerated filer,” “accelerated filer” and “smaller reporting company” in Rule 12b-2 of the Exchange Act. (Check one):
Large accelerated filer _√_ Accelerated filer ___ Non-accelerated filer ___ (Do not check if a smaller reporting company) Smaller reporting company __
Indicate by check mark whether the registrant is a shell company (as defined in Rule 12b-2 of the Exchange Act). Yes___ No_√_
The aggregate market value of the registrant’s voting common stock held by nonaffiliates of the registrant, based on the closing price on the New York Stock Exchange on June 30, 2013, was approximately $955,552,315.
As of February 3, 2014, 43,093,133 shares of common stock were outstanding.
The following documents have been incorporated by reference into the parts of the Form 10-K as indicated:
The Company’s proxy statement, filed pursuant Part of Item 10 of Part III to Regulation 14A under the Securities Exchange All of Item 11 of Part III Act of 1934, for its Annual Meeting of Part of Item 12 of Part III Stockholders to be held on May 1, 2014 All of Item 13 of Part III All of Item 14 of Part III

TABLE OF CONTENTS Page
Forward Looking Statements@@@@@@@@@@@@@@@@@@@@@@@@@@@@@@ 3
PART I
ITEM 1. BUSINESS@@@@@@@@@@@@@@@@@@@@@@@@@@@@@@@@.@@@@ 4 General@@@@@@@@@@@@@@@@@@@@@@@@@@@@@@@@@@@@.@@@. 4 Electric Generating Facilities and Capacity@@@@@@@@@@@@@@@@@@@@@@@@. 5 Gas Facilities@@@@@@@@@@@@@@@@@@@@@@@@@@@@@@@@@..@.@@ 6 Construction Program@@@@@@@@@@@@@@@@@@@@@@@@@@@@@@@@@. 6 Fuel and Natural Gas Supply@@@@@@@@@@@@@@@@@@@@@@@@@@@@.@@ 7 Employees@@@@@@@@@@@@@@@@@@@@@@@@@@@@@@@@@.@@@@. 10 Electric Operating Statistics@@@@@@@@@@@@@@@@@@@@@@@@@@@@@.@@ 10 Gas Operating Statistics@@@@@@@@@@@@@@@@@@@@@@@@@@@@@@@@. 11 Executive Officers and other Officers of Empire@@@@@@@@@@@@@@@@@@@@@@. 12 Regulation@@@@@@@@@@@@@@@@@@@@@@@@@@@@@@@@@@@@@@. 12 Environmental Matters@@@@@@@@@@@@@@@@@@@@@@@@@@@@@@@@@ 13 Conditions Respecting Financing@@@@@@@@@@@@@@@@@@@@@@@@@@@@. 13 Our Web Site@@@@@@@@@@@@@@@@@@@@@@@@@@@@@@@@@@...@@. 14 ITEM 1A. RISK FACTORS@@@@@@@@@@@@@@@@@@@@@@@@@@@@@@@@@@@.. 14 ITEM 1B. UNRESOLVED STAFF COMMENTS@@@@@@@@@@@@@@@@@@@@@@@@@@.. 17 ITEM 2. PROPERTIES@@@@@@@@@@@@@@@@@@@@@@@@@@@@@@@@@@. 17 Electric Segment Facilities@@@@@@@@@@@@@@@@@@@@@@@@@@@@@@@ 17 Gas Segment Facilities@@@@@@@@@@@@@@@@@@@@@@@@@@@@@@@@.. 19 Other Segment @@@@.@@@@@@@@@@@@@@@@@@@@@@@@@@@@@@.. 19 ITEM 3. LEGAL PROCEEDINGS@@@@@@@@@@@@@@@@@@@@@@@@@@@@@ 19 ITEM 4. MINE SAFETY DISCLOSURES@@@@@@@@@@@@@@@@@@@@@@@@@@ 19 PART II
ITEM 5. MARKET FOR REGISTRANT’S COMMON EQUITY, RELATED STOCKHOLDER MATTERS
AND ISSUER PURCHASES OF EQUITY SECURITIES@@@@@@@@@@@@@@@@@. 19 ITEM 6. SELECTED FINANCIAL DATA@@@@@@@@@@@@@@@@@@@@@@@@@@. 21 ITEM 7. MANAGEMENT’S DISCUSSION AND ANALYSIS OF FINANCIAL CONDITION AND RESULTS OF OPERATIONS@@@@@@@@@@@@@@@@@@@@@@@@@@@@@@@@@. 21 Executive Summary@@@@@@@@@@@@@@@@@@@@@@@@@@@@@@@@@@ 21 Results of Operations@@@@@@@@@@@@@@@@@@@@@@@@@@@@@@@@@. 24 Rate Matters@@@@@@@@@@@@@@@@@@@@@@@@@@@@@@@@@@@@@. 31 Markets and Transmission@..@@@@@@@@@@@@@@@@@@@@@@@@@@@@.. 32 Liquidity and Capital Resources@@@@@@@@@@@@@@@@@@@@@@@@@@@@... 32 Contractual Obligations@@@@@@@@@@@@@@@@@@@@@@@@@@@@@@@@.. 36 Dividends@@@@@@@@@@@@@@@@@@@@@@@@@@@@@@@@@@@@@@.. 37 Off-Balance Sheet Arrangements@@@@@@@@@@@@@@@@@@@@@@@@@@@@ 37 Critical Accounting Policies@@@@@@@@@@@@@@@@@@@@@@@@@@@@@@@ 38 Recently Issued Accounting Standards@@@@@@@@@@@@@@@@@@@@@@@@@... 40 ITEM 7A QUANTITATIVE AND QUALITATIVE DISCLOSURES ABOUT MARKET RISK@@@@@ @@ 40 ITEM 8. FINANCIAL STATEMENTS AND SUPPLEMENTARY DATA@@@@@@@@@@@..@@. 43 ITEM 9. CHANGES IN AND DISAGREEMENTS WITH ACCOUNTANTS ON ACCOUNTING AND FINANCIAL DISCLOSURE@@@@@@@@@@@@@@@@@@@@@@@@@@@@@ 104 ITEM 9A. CONTROLS AND PROCEDURES@@@@@@@@@@@@@@@@@@@@@@@@@@.. 104 ITEM 9B. OTHER INFORMATION@@@@@@@@@@@@@@@@@@@@@@@@@@@@@@@. 104
PART III
ITEM 10. DIRECTORS, EXECUTIVE OFFICERS AND CORPORATE GOVERNANCE@@@@@@@@ 105 ITEM 11. EXECUTIVE COMPENSATION@@@@@@@@@@@@@@@@@@@@@@@@@@ 106 ITEM 12. SECURITY OWNERSHIP OF CERTAIN BENEFICIAL OWNERS AND MANAGEMENT AND
RELATED STOCKHOLDER MATTERS@@@@@@@@@@@@@@@@@@@..@@ 106 ITEM 13. CERTAIN RELATIONSHIPS AND RELATED TRANSACTIONS, AND DIRECTOR . INDEPENDENCE @@@@@@@@@@@@@@@@@@@@@@@@@@@@@@@@...@. 106
ITEM 14. PRINCIPAL ACCOUNTANT FEES AND SERVICES@@@@@@@@@@@@@@@@@@@ 106
PART IV
ITEM 15. EXHIBITS AND FINANCIAL STATEMENT SCHEDULES@@@@@@@@@@@@@@@@@ 107 SIGNATURES@@@@@@@@@@@@@@@@@@@@@@@@@@@@@@@@@@@.. 110
3
FORWARD LOOKING STATEMENTS
Certain matters discussed in this annual report are “forward-looking statements” intended to qualify for the safe harbor from liability established by the Private Securities Litigation Reform Act of 1995. Such statements address or may address future plans, objectives, expectations and events or conditions concerning various matters such as capital expenditures, earnings, pension and other costs, competition, litigation, our construction program, our generation plans, our financing plans, potential acquisitions, rate and other regulatory matters, liquidity and capital resources and accounting matters. Forward-looking statements may contain words like “anticipate”, “believe”, “expect”, “project”, “objective” or similar expressions to identify them as forward-looking statements. Factors that could cause actual results to differ materially from those currently anticipated in such statements include:
• weather, business and economic conditions and other factors which may impact sales volumes and customer growth;
• the costs and other impacts resulting from natural disasters, such as tornados and ice storms;
• the amount, terms and timing of rate relief we seek and related matters;
• the results of prudency and similar reviews by regulators of costs we incur, including capital expenditures and fuel and purchased power costs, including any regulatory disallowances that could result from prudency reviews;
• unauthorized physical or virtual access to our facilities and systems and acts of terrorism, including, but not limited to, cyber-terrorism;
• legislation and regulation, including environmental regulation (such as NOx, SO2, mercury, ash and CO2) and health care regulation;
• the periodic revision of our construction and capital expenditure plans and cost and timing estimates;
• costs and activities associated with markets and transmission, including the Southwest Power Pool (SPP) Energy Imbalance Services Market, SPP regional transmission organization (RTO) transmission development, and SPP Day-Ahead Market;
• the impact of energy efficiency and alternative energy sources;
• electric utility restructuring, including ongoing federal activities and potential state activities;
• rate regulation, growth rates, discount rates, capital spending rates, terminal value calculations and other factors integral to the calculations utilized to test the impairment of goodwill, in addition to market and economic conditions which could adversely affect the analysis and ultimately negatively impact earnings;
• volatility in the credit, equity and other financial markets and the resulting impact on short term debt costs and our ability to issue debt or equity securities, or otherwise secure funds to meet our capital expenditure, dividend and liquidity needs;
• the effect of changes in our credit ratings on the availability and cost of funds;
• the performance of our pension assets and other post employment benefit plan assets and the resulting impact on our related funding commitments;
• our exposure to the credit risk of our hedging counterparties;
• performance of acquired businesses;
• the cost and availability of purchased power and fuel, including costs and activities associated with the transition to the SPP Day-Ahead Market, and the results of our activities (such as hedging) to reduce the volatility of such costs;
• interruptions or changes in our coal delivery, gas transportation or storage agreements or arrangements;
• operation of our electric generation facilities and electric and gas transmission and distribution systems, including the performance of our joint owners;
• changes in accounting requirements;
• costs and effects of legal and administrative proceedings, settlements, investigations and claims; and
• other circumstances affecting anticipated rates, revenues and costs.
All such factors are difficult to predict, contain uncertainties that may materially affect actual results, and may be beyond our control. New factors emerge from time to time and it is not possible for management to predict all such factors or to assess the impact of each such factor on us. Any forward-looking statement speaks only as of the date on which such statement is made, and we do not undertake any obligation to update any forward-looking statement to
reflect events or circumstances after the date on which such statement is made. We caution you that any forward-looking statements are not guarantees of future performance and involve known and unknown risk, uncertainties and other factors which may cause our actual results, performance or achievements to differ materially from the facts, results, performance or achievements we have anticipated in such forward-looking statements.
4
PART I ITEM 1. BUSINESS General
We operate our businesses as three segments: electric, gas and other. The Empire District Electric Company (EDE), a Kansas corporation organized in 1909, is an operating public utility engaged in the generation, purchase, transmission, distribution and sale of electricity in parts of Missouri, Kansas, Oklahoma and Arkansas. As part of our electric segment, we also provide water service to three towns in Missouri. The Empire District Gas Company (EDG) is our wholly owned subsidiary engaged in the distribution of natural gas in Missouri. Our other segment consists of our fiber optics business.
Our gross operating revenues in 2013 were derived as follows:
Electric segment sales* 90.3% Gas segment sales 8.4 Other segment sales 1.3
*Sales from our electric segment include 0.4% from the sale of water.
The territory served by our electric operations embraces an area of about 10,000 square miles, located principally in southwestern Missouri, and also includes smaller areas in southeastern Kansas, northeastern Oklahoma and northwestern Arkansas. The principal economic activities of these areas include light industry, agriculture and tourism. As of December 31, 2013, our electric operations served approximately 168,800 customers.
Our retail electric revenues for 2013 by jurisdiction were derived as follows:
Missouri 89.8% Kansas 4.8 Arkansas 2.5 Oklahoma 2.9
We supply electric service at retail to 119 incorporated communities as of December 31, 2013, and to various unincorporated areas and at wholesale to four municipally owned distribution systems. The largest urban area we serve is the city of Joplin, Missouri, and its immediate vicinity, with a population of approximately 160,000. We operate under franchises having original terms of twenty years or longer in virtually all of the incorporated communities. Approximately 49% of our electric operating revenues in 2013 were derived from incorporated communities with franchises having at least ten years remaining and approximately 21% were derived from incorporated communities in which our franchises have remaining terms of ten years or less. Although our franchises contain no renewal provisions, in recent years we have obtained renewals of all of our expiring electric franchises prior to the expiration dates.
Our three largest classes of on-system customers are residential, commercial and industrial, which provided 42.6%, 30.4%, and 15.1%, respectively, of our electric operating revenues in 2013.
Our largest single on-system wholesale customer is the city of Monett, Missouri, which in 2013 accounted for approximately 2.7% of electric revenues. No single retail customer accounted for more than 1.6% of electric revenues in 2013.
Our gas operations serve customers in northwest, north central and west central Missouri. As of December 31, 2013, our gas operations served approximately 44,000 customers. We provide natural gas distribution to 48 communities and 377 transportation customers as of December 31, 2013. The largest urban area we serve is the city of Sedalia with a population of over 20,000. We operate under franchises having original terms of twenty years in virtually all of the incorporated communities. Eighteen of the franchises have 10 years or more remaining on their term and 26 of the franchises have less than 10 years remaining on their term. Although our franchises contain no renewal provisions, since our acquisition we have obtained renewals of all our expiring gas franchises prior to the expiration dates.
Our gas operating revenues in 2013 were derived as follows:
Residential 63.1% Commercial 27.3 Industrial 1.0 Miscellaneous 8.6
No single retail customer accounted for more than 1% of gas revenues in 2013.
Our other segment consists of our fiber optics business. As of December 31, 2013, we have 118 fiber customers.

5
Electric Generating Facilities and Capacity
At December 31, 2013, our generating plants consisted of:
Plant Capacity (megawatts) (1)
Primary Fuel
Asbury 189(2)
Coal Riverton – Natural Gas 279 Natural Gas Iatan (12% ownership) 190
(3) Coal
Plum Point Energy Station (7.52% ownership) 50(3)
Coal State Line Combined Cycle (60% ownership) 297
(3) Natural Gas
Empire Energy Center 262 Natural Gas State Line Unit No. 1 94 Natural Gas Ozark Beach 16 Hydro TOTAL 1,377 (1)
Based on summer rating conditions as utilized by Southwest Power Pool. (2) Does not include Asbury unit 2 (14 megawatts) which was retired at the end of 2013. (3)
Capacity reflects our allocated shares of the capacity of these plants.
See Item 2, “Properties – Electric Segment Facilities” for further information about these plants.
We, and most other electric utilities with interstate transmission facilities, have placed our facilities under the Federal Energy Regulatory Commission (FERC) regulated open access tariffs that provide all wholesale buyers and sellers of electricity the opportunity to procure transmission services (at the same rates) that the utilities provide themselves. We are a member of the Southwest Power Pool Regional Transmission Organization (SPP RTO). See Item 7, “Management’s Discussion and Analysis of Financial Condition and Results of Operations – Markets and Transmission.”
We currently supplement our on-system generating capacity with purchases of capacity and energy from other sources in order to meet the demands of our customers and the capacity margins applicable to us under current pooling agreements and National Electric Reliability Council rules. The SPP requires its members to maintain a minimum 12% capacity margin.
We have a long-term (30 year) agreement for the purchase of 50 megawatts of capacity from the Plum Point Energy Station (Plum Point), a 670-megawatt, coal-fired generating facility near Osceola, Arkansas. We began receiving purchased power under this agreement on September 1, 2010. We also own, through an undivided interest, 50 megawatts of the unit’s capacity. We have the option to purchase an undivided ownership interest in the 50 megawatts covered by the purchased power agreement in 2015. We evaluated this purchase option as part of our Integrated Resource Plan (IRP), which was filed with the Missouri Public Service Commission (MPSC) in mid-2013. While it is not currently our intention to exercise this option in 2015, we will continue to evaluate this purchase option through the exercise date as well as explore other options with the purchase power agreement holder, Plum Point Energy Associates (PPEA), related to this option.
We have a 20-year purchased power agreement, which began on December 15, 2008, with Cloud County Windfarm, LLC, owned by EDP Renewables North America LLC, Houston, Texas to purchase the energy generated at the approximately 105-megawatt Phase 1 Meridian Way Wind Farm located in Cloud County, Kansas. We also have a 20-year contract, which began on December 15, 2005, with Elk River Windfarm, LLC, owned by IBERDROLA RENEWABLES, Inc., to purchase the energy generated at the 150-megawatt Elk River Windfarm located in Butler County, Kansas. We do not own any portion of either windfarm.
The following chart sets forth our purchase commitments and our anticipated owned capacity (in megawatts) during the indicated years. The capacity ratings we use for our generating units are based on summer rating conditions under SPP guidelines. The portion of the purchased power that may be counted as capacity from the Elk River Windfarm, LLC and the Cloud County Windfarm, LLC is included in this chart. Because the wind power is an intermittent, non-firm resource, SPP rating criteria does not allow us to count a substantial amount of the wind power as capacity. See Item 7, “Managements’ Discussion and Analysis of Financial Condition and Results of Operations – Liquidity and Capital Resources.”
Year
Purchased Power
Commitment(1)
Anticipated Owned
Capacity
Total
Megawatts 2014 62 1377 1439(2) 2015 62 1381 1443(3) 2016 62 1384 1446(4) 2017 62 1384 1446 2018 62 1384 1446
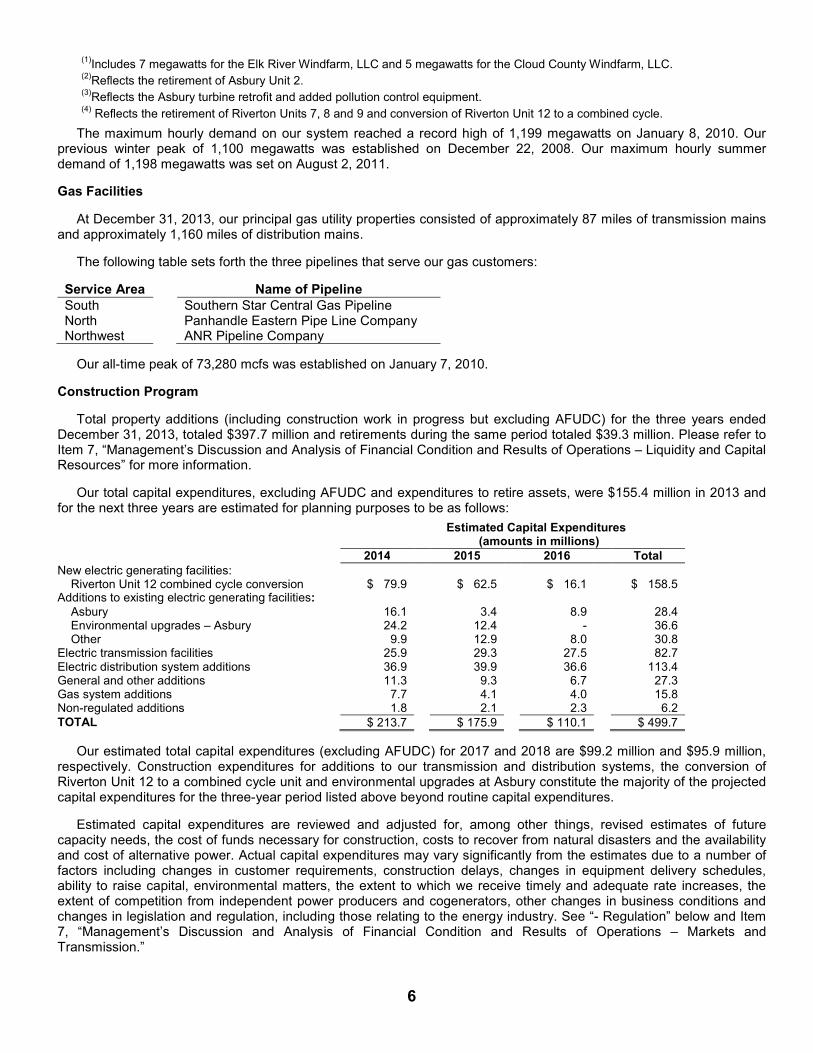
6
(1)Includes 7 megawatts for the Elk River Windfarm, LLC and 5 megawatts for the Cloud County Windfarm, LLC.
(2)Reflects the retirement of Asbury Unit 2.
(3)Reflects the Asbury turbine retrofit and added pollution control equipment.
(4) Reflects the retirement of Riverton Units 7, 8 and 9 and conversion of Riverton Unit 12 to a combined cycle.
The maximum hourly demand on our system reached a record high of 1,199 megawatts on January 8, 2010. Our previous winter peak of 1,100 megawatts was established on December 22, 2008. Our maximum hourly summer demand of 1,198 megawatts was set on August 2, 2011.
Gas Facilities
At December 31, 2013, our principal gas utility properties consisted of approximately 87 miles of transmission mains and approximately 1,160 miles of distribution mains.
The following table sets forth the three pipelines that serve our gas customers:
Service Area Name of Pipeline South Southern Star Central Gas Pipeline North Panhandle Eastern Pipe Line Company Northwest ANR Pipeline Company
Our all-time peak of 73,280 mcfs was established on January 7, 2010.
Construction Program
Total property additions (including construction work in progress but excluding AFUDC) for the three years ended December 31, 2013, totaled $397.7 million and retirements during the same period totaled $39.3 million. Please refer to Item 7, “Management’s Discussion and Analysis of Financial Condition and Results of Operations – Liquidity and Capital Resources” for more information.
Our total capital expenditures, excluding AFUDC and expenditures to retire assets, were $155.4 million in 2013 and for the next three years are estimated for planning purposes to be as follows:
Estimated Capital Expenditures (amounts in millions)
2014 2015 2016 Total New electric generating facilities: Riverton Unit 12 combined cycle conversion $ 79.9 $ 62.5 $ 16.1 $ 158.5 Additions to existing electric generating facilities: Asbury 16.1 3.4 8.9 28.4 Environmental upgrades – Asbury 24.2 12.4 - 36.6 Other 9.9 12.9 8.0 30.8 Electric transmission facilities 25.9 29.3 27.5 82.7 Electric distribution system additions 36.9 39.9 36.6 113.4 General and other additions 11.3 9.3 6.7 27.3 Gas system additions 7.7 4.1 4.0 15.8 Non-regulated additions 1.8 2.1 2.3 6.2 TOTAL $ 213.7 $ 175.9 $ 110.1 $ 499.7
Our estimated total capital expenditures (excluding AFUDC) for 2017 and 2018 are $99.2 million and $95.9 million, respectively. Construction expenditures for additions to our transmission and distribution systems, the conversion of Riverton Unit 12 to a combined cycle unit and environmental upgrades at Asbury constitute the majority of the projected capital expenditures for the three-year period listed above beyond routine capital expenditures.
Estimated capital expenditures are reviewed and adjusted for, among other things, revised estimates of future capacity needs, the cost of funds necessary for construction, costs to recover from natural disasters and the availability and cost of alternative power. Actual capital expenditures may vary significantly from the estimates due to a number of factors including changes in customer requirements, construction delays, changes in equipment delivery schedules, ability to raise capital, environmental matters, the extent to which we receive timely and adequate rate increases, the extent of competition from independent power producers and cogenerators, other changes in business conditions and changes in legislation and regulation, including those relating to the energy industry. See “- Regulation” below and Item 7, “Management’s Discussion and Analysis of Financial Condition and Results of Operations – Markets and Transmission.”
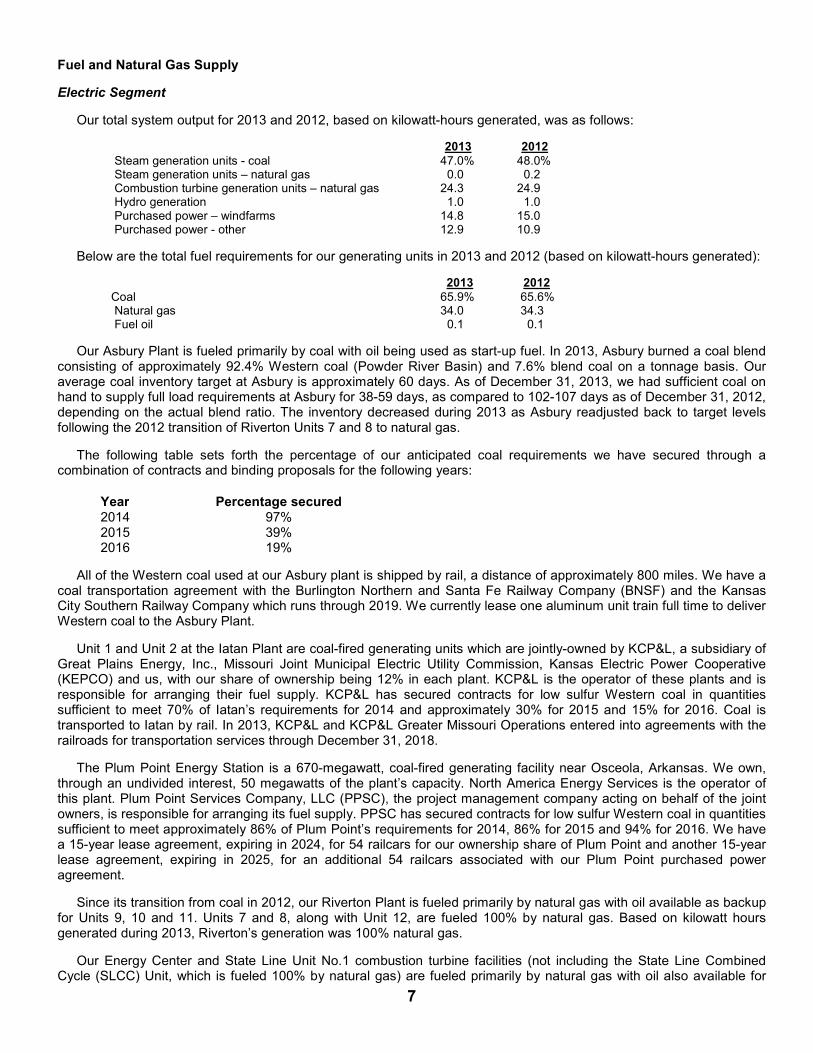
7
Fuel and Natural Gas Supply
Electric Segment
Our total system output for 2013 and 2012, based on kilowatt-hours generated, was as follows:
2013 2012 Steam generation units - coal 47.0% 48.0% Steam generation units – natural gas 0.0 0.2 Combustion turbine generation units – natural gas 24.3 24.9 Hydro generation 1.0 1.0 Purchased power – windfarms 14.8 15.0 Purchased power - other 12.9 10.9
Below are the total fuel requirements for our generating units in 2013 and 2012 (based on kilowatt-hours generated):
2013 2012 Coal 65.9% 65.6% Natural gas 34.0 34.3 Fuel oil 0.1 0.1
Our Asbury Plant is fueled primarily by coal with oil being used as start-up fuel. In 2013, Asbury burned a coal blend consisting of approximately 92.4% Western coal (Powder River Basin) and 7.6% blend coal on a tonnage basis. Our average coal inventory target at Asbury is approximately 60 days. As of December 31, 2013, we had sufficient coal on hand to supply full load requirements at Asbury for 38-59 days, as compared to 102-107 days as of December 31, 2012, depending on the actual blend ratio. The inventory decreased during 2013 as Asbury readjusted back to target levels following the 2012 transition of Riverton Units 7 and 8 to natural gas.
The following table sets forth the percentage of our anticipated coal requirements we have secured through a combination of contracts and binding proposals for the following years:
Year Percentage secured 2014 97% 2015 39% 2016 19%
All of the Western coal used at our Asbury plant is shipped by rail, a distance of approximately 800 miles. We have a coal transportation agreement with the Burlington Northern and Santa Fe Railway Company (BNSF) and the Kansas City Southern Railway Company which runs through 2019. We currently lease one aluminum unit train full time to deliver Western coal to the Asbury Plant.
Unit 1 and Unit 2 at the Iatan Plant are coal-fired generating units which are jointly-owned by KCP&L, a subsidiary of Great Plains Energy, Inc., Missouri Joint Municipal Electric Utility Commission, Kansas Electric Power Cooperative (KEPCO) and us, with our share of ownership being 12% in each plant. KCP&L is the operator of these plants and is responsible for arranging their fuel supply. KCP&L has secured contracts for low sulfur Western coal in quantities sufficient to meet 70% of Iatan’s requirements for 2014 and approximately 30% for 2015 and 15% for 2016. Coal is transported to Iatan by rail. In 2013, KCP&L and KCP&L Greater Missouri Operations entered into agreements with the railroads for transportation services through December 31, 2018.
The Plum Point Energy Station is a 670-megawatt, coal-fired generating facility near Osceola, Arkansas. We own, through an undivided interest, 50 megawatts of the plant’s capacity. North America Energy Services is the operator of this plant. Plum Point Services Company, LLC (PPSC), the project management company acting on behalf of the joint owners, is responsible for arranging its fuel supply. PPSC has secured contracts for low sulfur Western coal in quantities sufficient to meet approximately 86% of Plum Point’s requirements for 2014, 86% for 2015 and 94% for 2016. We have a 15-year lease agreement, expiring in 2024, for 54 railcars for our ownership share of Plum Point and another 15-year lease agreement, expiring in 2025, for an additional 54 railcars associated with our Plum Point purchased power agreement.
Since its transition from coal in 2012, our Riverton Plant is fueled primarily by natural gas with oil available as backup for Units 9, 10 and 11. Units 7 and 8, along with Unit 12, are fueled 100% by natural gas. Based on kilowatt hours generated during 2013, Riverton’s generation was 100% natural gas.
Our Energy Center and State Line Unit No.1 combustion turbine facilities (not including the State Line Combined Cycle (SLCC) Unit, which is fueled 100% by natural gas) are fueled primarily by natural gas with oil also available for
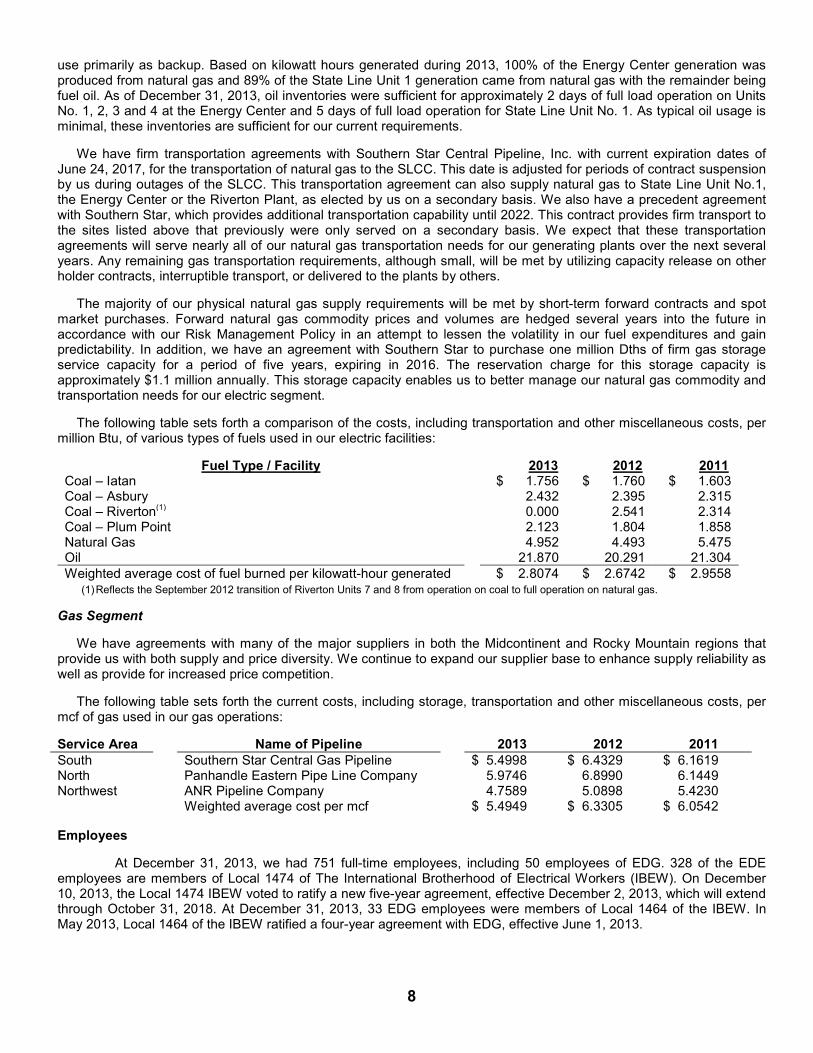
8
use primarily as backup. Based on kilowatt hours generated during 2013, 100% of the Energy Center generation was produced from natural gas and 89% of the State Line Unit 1 generation came from natural gas with the remainder being fuel oil. As of December 31, 2013, oil inventories were sufficient for approximately 2 days of full load operation on Units No. 1, 2, 3 and 4 at the Energy Center and 5 days of full load operation for State Line Unit No. 1. As typical oil usage is minimal, these inventories are sufficient for our current requirements.
We have firm transportation agreements with Southern Star Central Pipeline, Inc. with current expiration dates of June 24, 2017, for the transportation of natural gas to the SLCC. This date is adjusted for periods of contract suspension by us during outages of the SLCC. This transportation agreement can also supply natural gas to State Line Unit No.1, the Energy Center or the Riverton Plant, as elected by us on a secondary basis. We also have a precedent agreement with Southern Star, which provides additional transportation capability until 2022. This contract provides firm transport to the sites listed above that previously were only served on a secondary basis. We expect that these transportation agreements will serve nearly all of our natural gas transportation needs for our generating plants over the next several years. Any remaining gas transportation requirements, although small, will be met by utilizing capacity release on other holder contracts, interruptible transport, or delivered to the plants by others.
The majority of our physical natural gas supply requirements will be met by short-term forward contracts and spot market purchases. Forward natural gas commodity prices and volumes are hedged several years into the future in accordance with our Risk Management Policy in an attempt to lessen the volatility in our fuel expenditures and gain predictability. In addition, we have an agreement with Southern Star to purchase one million Dths of firm gas storage service capacity for a period of five years, expiring in 2016. The reservation charge for this storage capacity is approximately $1.1 million annually. This storage capacity enables us to better manage our natural gas commodity and transportation needs for our electric segment.
The following table sets forth a comparison of the costs, including transportation and other miscellaneous costs, per million Btu, of various types of fuels used in our electric facilities:
Fuel Type / Facility 2013 2012 2011 Coal – Iatan $ 1.756 $ 1.760 $ 1.603 Coal – Asbury 2.432 2.395 2.315 Coal – Riverton(1) 0.000 2.541 2.314 Coal – Plum Point 2.123 1.804 1.858 Natural Gas 4.952 4.493 5.475 Oil 21.870 20.291 21.304 Weighted average cost of fuel burned per kilowatt-hour generated $ 2.8074 $ 2.6742 $ 2.9558
(1) Reflects the September 2012 transition of Riverton Units 7 and 8 from operation on coal to full operation on natural gas.
Gas Segment
We have agreements with many of the major suppliers in both the Midcontinent and Rocky Mountain regions that provide us with both supply and price diversity. We continue to expand our supplier base to enhance supply reliability as well as provide for increased price competition.
The following table sets forth the current costs, including storage, transportation and other miscellaneous costs, per mcf of gas used in our gas operations:
Service Area Name of Pipeline 2013 2012 2011 South Southern Star Central Gas Pipeline $ 5.4998 $ 6.4329 $ 6.1619 North Panhandle Eastern Pipe Line Company 5.9746 6.8990 6.1449 Northwest ANR Pipeline Company 4.7589 5.0898 5.4230 Weighted average cost per mcf $ 5.4949 $ 6.3305 $ 6.0542
Employees
At December 31, 2013, we had 751 full-time employees, including 50 employees of EDG. 328 of the EDE employees are members of Local 1474 of The International Brotherhood of Electrical Workers (IBEW). On December 10, 2013, the Local 1474 IBEW voted to ratify a new five-year agreement, effective December 2, 2013, which will extend through October 31, 2018. At December 31, 2013, 33 EDG employees were members of Local 1464 of the IBEW. In May 2013, Local 1464 of the IBEW ratified a four-year agreement with EDG, effective June 1, 2013.

9
ELECTRIC OPERATING STATISTICS (1)
2013 2012 2011 2010 2009
Electric Operating Revenues (000’s): Residential $ 227,656 $ 214,526 $ 221,687 $ 204,900 $ 180,404 Commercial 162,444 158,837 157,435 146,310 135,800 Industrial 80,497 78,786 78,925 69,684 65,983 Public authorities
(2) 14,707 13,755 13,653 12,099 11,411
Wholesale on-system 20,036 18,555 19,140 19,254 18,199 Miscellaneous
(3) 13,223 8,520 8,194 7,573 6,814
Interdepartmental 229 197 201 199 178 Total system 518,792 493,176 499,235 460,019 418,789 Wholesale off-system 15,488 15,687 23,271 22,891 14,344 Total electric operating revenues
(4) 534,280 508,863 522,506 482,910 433,133
Electricity generated and purchased (000’s of kWh): Steam 2,813,441 2,865,037 2,805,744 2,650,042 2,259,304 Hydro 57,449 57,719 48,898 88,104 76,733 Combustion turbine 1,452,936 1,486,643 1,484,472 1,566,074 926,934 Total generated 4,323,826 4,409,399 4,339,114 4,304,220 3,262,971 Purchased 1,660,193 1,545,327 1,870,901 2,085,550 2,516,702 Total generated and purchased 5,984,019 5,954,726 6,210,015 6,389,770 5,779,673 Interchange (net) 432 (87) (1,298) (1,716) (568) Total system output 5,984,451 5,954,639 6,208,717 6,388,054 5,779,105 Transmission by others losses
(5) (15,817) (17,300) (16,597) (5,688) -
Total system input 5,968,634 5,937,339 6,192,120 6,382,366 5,779,105
Maximum hourly system demand (Kw) 1,080,000 1,142,000 1,198,000 1,199,000 1,085,000 Owned capacity (end of period) (Kw) 1,377,000 1,391,000 1,392,000 1,409,000 1,257,000 Annual load factor (%) 56.18 52.17 51.95 53.17 55.38 Electric sales (000’s of kWh): Residential 1,936,603 1,850,813 1,982,704 2,060,368 1,866,473 Commercial 1,541,717 1,558,297 1,576,342 1,644,917 1,579,832 Industrial 1,015,492 1,028,416 1,022,765 1,007,033 992,165 Public authorities
(2) 127,370 122,369 126,724 124,554 121,816
Wholesale on-system 343,045 353,075 364,866 355,807 332,061 Total system 4,964,227 4,912,970 5,073,401 5,192,679 4,892,347 Wholesale off-system 653,996 704,028 740,009 798,084 515,899 Total Electric Sales 5,618,223 5,616,998 5,813,410 5,990,763 5,408,246 Company use (000’s of kWh)
(6) 9,049 9,066 9,371 9,598 9,088
kWh losses (000’s of kWh) (7) 341,362 311,275 369,339 382,005 361,771
Total System Input 5,968,634 5,937,339 6,192,120 6,382,366 5,779,105
Customers (average number): Residential 141,376 140,602 139,641 141,693 141,206 Commercial 24,080 24,036 24,155 24,505 24,412 Industrial 345 353 357 358 355 Public authorities
(2) 2,214 2,124 2,021 2,003 1,995
Wholesale on-system 4 4 4 4 4 Total System 168,019 167,119 166,178 168,563 167,972 Wholesale off-system 22 22 25 22 19 Total 168,041 167,141 166,203 168,585 167,991
Average annual sales per residential customer (kWh) 13,698 13,163 14,199 14,541 13,218 Average annual revenue per residential customer $ 1,610 $ 1,526 $ 1,588 $ 1,446 $ 1,278 Average residential revenue per kWh 11.76¢ 11.59¢ 11.18¢ 9.94¢ 9.67¢ Average commercial revenue per kWh 10.54¢ 10.19¢ 9.99¢ 8.89¢ 8.60¢ Average industrial revenue per kWh 7.93¢ 7.66¢ 7.72¢ 6.92¢ 6.65¢ (1)
See Item 6, “Selected Financial Data” for additional financial information regarding Empire. (2)
Includes Public Street & Highway Lighting and Public Authorities. (3)
Includes transmission service revenues, late payment fees, renewable energy credit sales, rent, etc. (4)
Before intercompany eliminations. (5)
Energy provided in-kind to third party transmission providers to compensate for transmission losses associated with delivery of capacity and energy under their transmission tariffs. (6)
Includes kWh used by Company and Interdepartmental. (7)
2012 includes the effect of our unbilled revenue adjustment.

10
GAS OPERATING STATISTICS(1)
2013 2012 2011 2010 2009
Gas Operating Revenues (000’s): Residential $ 31,561 $ 24,744 $ 28,999 $ 32,245 $ 36,176
Commercial 13,673 10,797 12,506 13,336 15,552 Industrial 515 464 682 812 2,066 Public authorities 342 247 324 342 365 Total retail sales revenues 46,091 36,252 42,511 46,735 54,159 Miscellaneous
(2) 435 400 464 436 221
Transportation revenues 3,515 3,197 3,455 3,714 2,934 Total Gas Operating Revenues 50,041 39,849 46,430 50,885 57,314
Maximum Daily Flow (mcf) 60,118 58,281 67,789 73,280 70,046
Gas delivered to customers (000’s of mcf sales)
(3)
Residential 2,744 2,012 2,560 2,675 2,687 Commercial 1,349 1,050 1,268 1,265 1,278 Industrial 72 58 102 108 218 Public authorities 35 23 33 33 30 Total retail sales 4,200 3,143 3,963 4,081 4,213 Transportation sales 4,528 4,249 4,528 4,829 4,330 Total gas operating and transportation sales 8,728 7,392 8,491 8,910 8,543 Company use
(3) 2 2 4 4 3 Transportation sales (cash outs) - - - - - Mcf losses 96 27 (47) 70 36 Total system sales 8,826 7,421 8,448 8,984 8,582
Customers (average number): Residential 37,777 37,897 38,051 38,277 38,621 Commercial 4,917 4,921 4,951 4,968 5,038 Industrial 24 23 26 26 25 Public authorities 140 138 136 137 131 Total retail customers 42,858 42,979 43,164 43,408 43,815 Transportation customers 340 326 311 313 296 Total gas customers 43,198 43,305 43,475 43,721 44,111 (1)
See Item 6, “Selected Financial Data” for additional financial information regarding Empire. (2)
Primarily includes miscellaneous service revenue and late fees. (3)
Includes mcf used by Company and Interdepartmental mcf.

11
Executive Officers and Other Officers of Empire
The names of our officers, their ages and years of service with Empire as of December 31, 2013, positions held during the past five years and effective dates of such positions are presented below. All of our officers have been employed by Empire for at least the last five years.
Name
Age at
12/31/13
Positions With the Company
With the Company
Since
Officer Since
Bradley P. Beecher
48 President and Chief Executive Officer (2011). Executive Vice President (2011), Executive Vice President and Chief Operating Officer – Electric (2010), Vice President and Chief Operating Officer – Electric (2006)
2001 2001
Laurie A. Delano
58 Vice President – Finance and Chief Financial Officer,
(2011), Controller, Assistant Secretary and Assistant Treasurer and Principal Accounting Officer (2005)
2002 2005
Ronald F. Gatz
63 Vice President and Chief Operating Officer – Gas (2006) 2001 2001
Blake Mertens 36 Vice President – Energy Supply (2011), General
Manager – Energy Supply (2010), Director of Strategic Projects, Safety and Environmental Services (2010), Associate Director of Strategic Projects (2009), Manager of Strategic Projects (2006)
2001 2011
Michael E. Palmer
(1) 57 Vice President – Transmission Policy and Corporate
Services (2011), Vice President – Commercial Operations (2001)
1986 2001
Martin O. Penning
58 Vice President – Commercial Operations, (2011),
Director of Commercial Operations (2006) 1980 2011
Kelly S. Walters
48 Vice President and Chief Operating Officer – Electric
(2011), Vice President – Regulatory and Services (2006) 2001 2006
Janet S. Watson 61 Secretary – Treasurer (1995) 1994 1995 Robert W. Sager
39 Controller, Assistant Secretary and Assistant Treasurer
and Principal Accounting Officer (2011), Director of Financial Services (2006)
2006 2011
(1) Michael E. Palmer will retire from his position as Vice-President – Transmission Policy and Corporate Services effective March 31, 2014. Regulation
Electric Segment
General. As a public utility, our electric segment operations are subject to the jurisdiction of the Missouri Public Service Commission (MPSC), the State Corporation Commission of the State of Kansas (KCC), the Corporation Commission of Oklahoma (OCC) and the Arkansas Public Service Commission (APSC) with respect to services and facilities, rates and charges, regulatory accounting, valuation of property, depreciation and various other matters. Each such Commission has jurisdiction over the creation of liens on property located in its state to secure bonds or other securities. The KCC also has jurisdiction over the issuance of all securities because we are a regulated utility incorporated in Kansas. Our transmission and sale at wholesale of electric energy in interstate commerce and our facilities are also subject to the jurisdiction of the FERC, under the Federal Power Act. FERC jurisdiction extends to, among other things, rates and charges in connection with such transmission and sale; the sale, lease or other disposition of such facilities and accounting matters. See discussion in Item 7, “Management’s Discussion and Analysis of Financial Condition and Results of Operations – Markets and Transmission.”
Electric operating revenues received during 2013 were comprised of the following:
Retail customers 90.9% Sales subject to FERC jurisdiction 8.3 Miscellaneous sources 0.8

12
The percentage of retail regulated revenues derived from each state follows:
Missouri 89.8% Kansas 4.8 Oklahoma 2.9 Arkansas 2.5
Rates. See Item 7, “Management’s Discussion and Analysis of Financial Condition and Results of Operations – Rate Matters” for information concerning recent electric rate proceedings.
Fuel Adjustment Clauses. Typical fuel adjustment clauses permit the distribution to customers of changes in fuel costs, subject to routine regulatory review, without the need for a general rate proceeding. Fuel adjustment clauses are presently applicable to our retail electric sales in Missouri, Oklahoma and Kansas and system wholesale kilowatt-hour sales under FERC jurisdiction. We have an Energy Cost Recovery Rider in Arkansas that adjusts for changing fuel and purchased power costs on an annual basis.
Gas Segment
General. As a public utility, our gas segment operations are subject to the jurisdiction of the MPSC with respect to services and facilities, rates and charges, regulatory accounting, valuation of property, depreciation and various other matters. The MPSC also has jurisdiction over the creation of liens on property to secure bonds or other securities.
Purchased Gas Adjustment (PGA). The PGA clause allows EDG to recover from our customers, subject to routine regulatory review, the cost of purchased gas supplies, transportation and storage costs, including costs associated with our use of natural gas financial instruments to hedge the purchase price of natural gas and related carrying costs. This PGA clause allows us to make rate changes periodically (up to four times) throughout the year in response to weather conditions and supply demands, rather than in one possibly extreme change per year. Environmental Matters See Note 11 of “Notes to Consolidated Financial Statements” under Item 8 for information regarding environmental matters. Conditions Respecting Financing
Our EDE Indenture of Mortgage and Deed of Trust, dated as of September 1, 1944, as amended and supplemented (the EDE Mortgage), and our Restated Articles of Incorporation (Restated Articles), specify earnings coverage and other conditions which must be complied with in connection with the issuance of additional first mortgage bonds or cumulative preferred stock, or the incurrence of unsecured indebtedness. The principal amount of all series of first mortgage bonds outstanding at any one time under the EDE Mortgage is limited by terms of the mortgage to $1.0 billion. Substantially all of the property, plant and equipment of The Empire District Electric Company (but not its subsidiaries) is subject to the lien of the EDE Mortgage. Restrictions in the EDE mortgage bond indenture could affect our liquidity. The EDE Mortgage contains a requirement that for new first mortgage bonds to be issued, our net earnings (as defined in the EDE Mortgage) for any twelve consecutive months within the fifteen months preceding issuance must be two times the annual interest requirements (as defined in the EDE Mortgage) on all first mortgage bonds then outstanding and on the prospective issue of new first mortgage bonds. Our earnings for the year ended December 31, 2013, would permit us to issue approximately $599.1 million of new first mortgage bonds based on this test at an assumed interest rate of 5.5%. In addition to the interest coverage requirement, the EDE Mortgage provides that new bonds must be issued against, among other things, retired bonds or 60% of net property additions. At December 31, 2013, we had retired bonds and net property additions which would enable the issuance of at least $856.7 million principal amount of bonds if the annual interest requirements are met. As of December 31, 2013, we are in compliance with all restrictive covenants of the EDE Mortgage.
Under our Restated Articles, (a) cumulative preferred stock may be issued only if our net income available for interest and dividends (as defined in our Restated Articles) for a specified twelve-month period is at least 1-1/2 times the sum of the annual interest requirements on all indebtedness and the annual dividend requirements on all cumulative preferred stock to be outstanding immediately after the issuance of such additional shares of cumulative preferred stock, and (b) so long as any preferred stock is outstanding, the amount of unsecured indebtedness outstanding may not exceed 20% of the sum of the outstanding secured indebtedness plus our capital and surplus. We have no outstanding preferred stock. Accordingly, the restriction in our Restated Articles does not currently restrict the amount of unsecured indebtedness that we may have outstanding.

13
The EDG Indenture of Mortgage and Deed of Trust, dated as of June 1, 2006, as amended and supplemented (the EDG Mortgage) contains a requirement that for new first mortgage bonds to be issued, the amount of such new first mortgage bonds shall not exceed 75% of the cost of property additions acquired after the date of the Missouri Gas acquisition. The principal amount of all series of first mortgage bonds outstanding at any one time under the EDG Mortgage is limited by terms of the mortgage to $300.0 million. Substantially all of the property, plant and equipment of The Empire District Gas Company is subject to the lien of the EDG Mortgage. The mortgage also contains a limitation on the issuance by EDG of debt (including first mortgage bonds, but excluding short-term debt incurred in the ordinary course under working capital facilities) unless, after giving effect to such issuance, EDG’s ratio of EBITDA (defined as net income plus interest, taxes, depreciation, amortization and certain other non-cash charges) to interest charges for the most recent four fiscal quarters is at least 2.0 to 1.0. As of December 31, 2013, this test would allow us to issue approximately $15.8 million principal amount of new first mortgage bonds at an assumed interest rate of 5.5%.
See Item 7, “Management’s Discussion and Analysis of Financial Condition and Results of Operations - Liquidity and Capital Resources.”
Our Web Site
We maintain a web site at www.empiredistrict.com. Our annual report on Form 10-K, quarterly reports on Form 10-Q, current reports on form 8-K and related amendments are available free of charge through our web site as soon as reasonably practicable after such reports are filed with or furnished to the SEC electronically. Our Corporate Governance Guidelines, our Code of Business Conduct and Ethics, our Code of Ethics for the Chief Executive Officer and Senior Financial Officers, the charters for our Audit Committee, Compensation Committee and Nominating/Corporate Governance Committee, our Procedures for Reporting Complaints on Accounting, Internal Accounting Controls and Auditing Matters, our Procedures for Communicating with Non-Management Directors and our Policy and Procedures with Respect to Related Person Transactions can also be found on our web site. All of these documents are available in print to any interested party who requests them. Our web site and the information contained in it and connected to it shall not be deemed incorporated by reference into this Form 10-K.
ITEM 1A. RISK FACTORS
Investors should review carefully the following risk factors and the other information contained in this Form 10-K. The risks we face are not limited to those in this section. There may be additional risks and uncertainties (either currently unknown or not currently believed to be material) that could adversely affect our financial position, results of operations and liquidity.
Readers are cautioned that the risks and uncertainties described in this Form 10-K are not the only ones facing Empire. Additional risks and uncertainties that we are not presently aware of, or that we currently consider immaterial, may also affect our business operations. Our business, financial condition or results of operations (including our ability to pay dividends on our common stock) could suffer if the concerns set forth below are realized.
We are exposed to increases in costs and reductions in revenue which we cannot control and which may adversely affect our business, financial condition and results of operations.
The primary drivers of our electric operating revenues in any period are: (1) rates we can charge our customers, (2) weather, (3) customer growth and usage and (4) general economic conditions. Of the factors driving revenues, weather has the greatest short-term effect on the demand for electricity for our regulated business. Mild weather reduces demand and, as a result, our electric operating revenues. In addition, changes in customer demand due to downturns in the economy or energy efficiency could reduce our revenues.
The primary drivers of our electric operating expenses in any period are: (1) fuel and purchased power expenses, (2) operating, maintenance and repairs expense, including repairs following severe weather and plant outages, (3) taxes and (4) non-cash items such as depreciation and amortization expense. Although we generally recover these expenses through our rates, there can be no assurance that we will recover all, or any part of, such increased costs in future rate cases.
The primary drivers of our gas operating revenues in any period are: (1) rates we can charge our customers, (2) weather, (3) customer growth, (4) the cost of natural gas and interstate pipeline transportation charges and (5) general economic conditions. Because natural gas is heavily used for residential and commercial heating, the demand for this product depends heavily upon weather patterns throughout our natural gas service territory and a significant amount of our natural gas revenues are recognized in the first and fourth quarters related to the heating seasons. Accordingly, our natural gas operations have historically generated less revenues and income when weather conditions are warmer in the winter.

14
The primary driver of our gas operating expense in any period is the price of natural gas.
Significant increases in electric and gas operating expenses or reductions in electric and gas operating revenues may occur and result in a material adverse effect on our business, financial condition and results of operations. We are exposed to factors that can increase our fuel and purchased power expenditures, including disruption in deliveries of coal or natural gas, decreased output from our power plants, failure of performance by purchased power counterparties and market risk in our fuel procurement strategy.
Fuel and purchased power costs are our largest expenditures. Increases in the price of coal, natural gas or the cost of purchased power will result in increased electric operating expenditures. Given we have a fuel cost recovery mechanism in all of our jurisdictions, our net income exposure to the impact of the risks discussed above is significantly reduced. However, cash flow could still be impacted by these increased expenditures. We are also subject to prudency reviews which could negatively impact our net income if a regulatory commission would conclude our costs were incurred imprudently.
We depend upon regular deliveries of coal as fuel for our Asbury, Iatan and Plum Point plants. Substantially all of this coal comes from mines in the Powder River Basin of Wyoming and is delivered to the plants by train. Production problems in these mines, railroad transportation or congestion problems, or unavailability of trains could affect delivery cycle times required to maintain plant inventory levels, causing us to implement coal conservation and supply replacement measures to retain adequate reserve inventories at our facilities. These measures could include some or all of the following: reducing the output of our coal plants, increasing the utilization of our gas-fired generation facilities, purchasing power from other suppliers, adding additional leased trains to our supply system and purchasing locally mined coal which can be delivered without using the railroads. Such measures could result in increased fuel and purchased power expenditures.
We have also established a risk management practice of purchasing contracts for future fuel needs to meet underlying customer needs and manage cost and pricing uncertainty. Within this activity, we may incur losses from these contracts. By using physical and financial instruments, we are exposed to credit risk and market risk. Market risk is the exposure to a change in the value of commodities caused by fluctuations in market variables, such as price. The fair value of derivative financial instruments we hold is adjusted cumulatively on a monthly basis until prescribed determination periods. At the end of each determination period, which is the last day of each calendar month in the period, any realized gain or loss for that period related to the contract will be reclassified to fuel expense and recovered or refunded to the customer through our fuel adjustment mechanisms. Credit risk is the risk that the counterparty might fail to fulfill its obligations under contractual terms.
We are subject to regulation in the jurisdictions in which we operate.
We are subject to comprehensive regulation by federal and state utility regulatory agencies, which significantly influences our operating environment and our ability to recover our costs from utility customers. The utility commissions in the states where we operate regulate many aspects of our utility operations, including the rates that we can charge customers, siting and construction of facilities, pipeline safety and compliance, customer service and our ability to recover costs we incur, including capital expenditures and fuel and purchased power costs.
The FERC has jurisdiction over wholesale rates for electric transmission service and electric energy sold in interstate commerce. Federal, state and local agencies also have jurisdiction over many of our other activities.
Information concerning recent filings requesting increases in rates and related matters is set forth under Item 7, “Management’s Discussion and Analysis of Financial Condition and Results of Operations – Rate Matters.”
We are also subject to prudency and similar reviews by regulators of costs we incur, including capital expenditures, fuel and purchased power costs and other operating costs.
We are unable to predict the impact on our operating results from the regulatory activities of any of these agencies, including any regulatory disallowances that could result from prudency reviews. Despite our requests, these regulatory commissions have sole discretion to leave rates unchanged, grant increases or order decreases in the base rates we charge our utility customers. They have similar authority with respect to our recovery of increases in our fuel and purchased power costs. If our costs increase and we are unable to recover increased costs through base rates or fuel adjustment clauses, or if we are unable to fully recover our investments in new facilities, our results of operations could be materially adversely affected. Changes in regulations or the imposition of additional regulations could also have a material adverse effect on our results of operations.

15
Operations risks may adversely affect our business and financial results.
The operation of our electric generation, and electric and gas transmission and distribution systems involves many risks, including breakdown or failure of expensive and sophisticated equipment, processes and personnel performance; inability to attract and retain management and other key personnel; workplace and public safety; operating limitations that may be imposed by workforce issues, equipment conditions, environmental or other regulatory requirements; fuel supply or fuel transportation reductions or interruptions; transmission scheduling constraints; unauthorized physical access to our facilities; and catastrophic events such as fires, explosions, severe weather, acts of terrorism or other similar occurrences.
In addition, our power generation and delivery systems, information technology systems and network infrastructure may be vulnerable to internal or external cyber attack, physical attack, unauthorized physical or virtual access, computer viruses or other attempts to harm our systems or misuse our confidential information.
We have implemented training and preventive maintenance programs and have security systems and related protective infrastructure in place, but there is no assurance that these programs will prevent or minimize future breakdowns, outages or failures of our generation facilities or related business processes. In those cases, we would need to either produce replacement power from our other facilities or purchase power from other suppliers at potentially volatile and higher cost in order to meet our sales obligations, or implement emergency back-up business system processing procedures.
The SPP RTO is mandated by the FERC to ensure a reliable power supply, an adequate transmission infrastructure and competitive wholesale electricity prices. The SPP RTO functions as reliability coordination, tariff administration and regional scheduler for its member utilities, including us. Essentially, the SPP RTO independently operates our transmission system as it interfaces and coordinates with the regional power grid. SPP RTO activities directly impact our control of owned generating assets and the development and cost of transmission infrastructure projects within the SPP RTO region. The cost allocation methodology applied to these transmission infrastructure projects will increase our operating expenses.
The SPP RTO expects to implement a Day-Ahead Market, or Integrated Marketplace, in March 2014. The SPP Integrated Marketplace will function as a centralized dispatch, where we and other members will submit offers to sell power and bids to purchase power. The SPP will match offers and bids to supply our and other members’ next day generation needs. It is expected that 90%-95% of all next day generation needed throughout the SPP territory will be cleared through this Integrated Marketplace. This change could impact our fuel costs, however, the net financial effect of these Integrated Marketplace transactions will be processed through our fuel adjustment mechanisms.
These and other operating events and conditions may reduce our revenues, increase costs, or both, and may materially affect our results of operations, financial position and cash flows.
Information concerning recent and pending SPP RTO and other FERC activities can be found under Note 3 of “Notes to Consolidated Financial Statements” under Item 8.
We may be unable to recover increases in the cost of natural gas from our natural gas utility customers, or may lose customers as a result of any price increases.
In our natural gas utility business, we are permitted to recover the cost of gas directly from our customers through the use of a purchased gas adjustment provision. Our purchased gas adjustment provision is regularly reviewed by the MPSC. In addition to reviewing our adjustments to customer rates, the MPSC reviews our costs for prudency as well. To the extent the MPSC may determine certain costs were not incurred prudently, it could adversely affect our gas segment earnings and cash flows. In addition, increases in natural gas costs affect total prices to our customers and, therefore, the competitive position of gas relative to electricity and other forms of energy. Increases in natural gas costs may also result in lower usage by customers unable to switch to alternate fuels. Such disallowed costs or customer losses could have a material adverse effect on our business, financial condition and results of operations.
Any reduction in our credit ratings could materially and adversely affect our business, financial condition and results of operations.
Currently, our corporate credit ratings and the ratings for our securities are as follows:
Fitch Moody’s Standard & Poor's Corporate Credit Rating n/r* Baa1 BBB EDE First Mortgage Bonds BBB+ A2 A- Senior Notes BBB Baa1 BBB Commercial Paper F3 P-2 A-2 Outlook Stable Stable Stable
*Not rated.

16
The ratings indicate the agencies’ assessment of our ability to pay the interest and principal of these securities. A rating is not a recommendation to purchase, sell or hold securities and each rating should be evaluated independently of any other rating. The lower the rating, the higher the interest cost of the securities when they are sold. In addition, a downgrade in our senior unsecured long-term debt rating would result in an increase in our borrowing costs under our bank credit facility. If any of our ratings fall below investment grade (investment grade is defined as Baa3 or above for Moody’s and BBB- or above for Standard & Poor’s and Fitch), our ability to issue short-term debt, commercial paper or other securities or to market those securities would be impaired or made more difficult or expensive. Therefore, any such downgrades could have a material adverse effect on our business, financial condition and results of operations. In addition, any actual downgrade of our commercial paper rating from Moody’s or Fitch, may make it difficult for us to issue commercial paper. To the extent we are unable to issue commercial paper, we will need to meet our short-term debt needs through borrowings under our revolving credit facilities, which may result in higher costs.
We cannot assure you that any of our current ratings will remain in effect for any given period of time or that a rating will not be lowered or withdrawn entirely by a rating agency if, in its judgment, circumstances in the future so warrant.
We are subject to environmental laws and the incurrence of environmental liabilities which may adversely affect our business, financial condition and results of operations.
We are subject to extensive federal, state and local regulation with regard to air and other environmental matters. Failure to comply with these laws and regulations could have a material adverse effect on our results of operations and financial position. In addition, new environmental laws and regulations, and new interpretations of existing environmental laws and regulations, have been adopted and may in the future be adopted which may substantially increase our future environmental expenditures for both new facilities and our existing facilities. Compliance with current and potential future air emission standards (such as those limiting emission levels of sulfur dioxide (SO2), emissions of mercury, other hazardous pollutants (HAPS), nitrogen oxide (NOx), and carbon dioxide (CO2)) has required, and may in the future require, significant environmental expenditures. Although we have historically recovered such costs through our rates, there can be no assurance that we will recover all, or any part of, such increased costs in future rate cases. The incurrence of additional material environmental costs which are not recovered in our rates may result in a material adverse effect on our business, financial condition and results of operations.
The cost and schedule of construction projects may materially change.
Our capital expenditure budget for the next three years is estimated to be $499.7 million. This includes expenditures for environmental upgrades to our existing facilities and additions to our transmission and distribution systems. There are risks that actual costs may exceed budget estimates, delays may occur in obtaining permits and materials, suppliers and contractors may not perform as required under their contracts, there may be inadequate availability, productivity or increased cost of qualified craft labor, start-up activities may take longer than planned, the scope and timing of projects may change, and other events beyond our control may occur that may materially affect the schedule, budget, cost and performance of projects. To the extent the completion of projects is delayed, we expect that the timing of receipt of increases in base rates reflecting our investment in such projects will be correspondingly delayed. Costs associated with these projects will also be subject to prudency review by regulators as part of future rate case filings and all costs may not be allowed recovery.
Financial market disruptions may increase financing costs, limit access to the credit markets or cause reductions in investment values in our pension plan assets.
We estimate our capital expenditures to be $213.7 million in 2014. Although we believe it is unlikely we will have difficulty accessing the markets for the capital needed to complete these projects (if such a need arises), financing costs could fluctuate. Financial market disruptions can also cause reductions in investment value in our pension plan assets, which could lead to increased funding obligations. We expect to fund approximately $15.0 million during 2014 for pension and OPEB liabilities. Although positive asset performance in 2013 led to decreased liabilities in 2013, future market changes could result in increased pension and OPEB liabilities and funding obligations.
ITEM 1B. UNRESOLVED STAFF COMMENTS
None.
ITEM 2. PROPERTIES
Electric Segment Facilities
Our generating facilities consist of three coal-fired generating plants, two natural gas generating plants and one hydroelectric generating plant. At December 31, 2013, we owned generating facilities with an aggregate generating

17
capacity of 1,377 megawatts. We retired the 14-megawatt Unit 2 at our Asbury Plant on December 31, 2013, as required by the addition of air quality control equipment being installed at our Asbury plant (discussed below) in order to comply with forthcoming environmental regulations.
The Asbury Plant, located near Asbury, Missouri, is a coal-fired generating station. The plant consisted of two steam turbine generating units with 203 megawatts of generating capacity until the end of 2013 when we retired Unit 2. In 2013, the plant accounted for approximately 14% of our owned generating capacity and accounted for approximately 29.9% of the energy generated by us. As part of our environmental Compliance Plan, discussed in Note 11 of “Notes to Consolidated Financial Statements” under Item 8, we are in the process of installing a scrubber, fabric filter and powder activated carbon injection system at our Asbury plant. The addition of this air quality control equipment is expected to be completed in early 2015 and required the retirement of Asbury Unit 2 at the end of 2013, reducing the plant’s capacity to 189 megawatts. This reduces our owned generating facilities aggregate generating capacity to 1,377 megawatts in 2014. Routine plant maintenance, during which the entire plant is taken out of service, is scheduled annually, normally for approximately three to four weeks in the spring. Approximately every fifth year, the maintenance outage is scheduled to be extended to approximately six weeks to permit inspection of the Unit No. 1 turbine. The next such outage is scheduled to take place in the fall of 2014. When the Asbury Plant is out of service, we typically experience increased purchased power and fuel expenditures associated with replacement energy, which is likely to be recovered through our fuel adjustment clauses.
We own a 12% undivided interest in the coal-fired Unit No. 1 and Unit No. 2 at the Iatan Generating Station located near Weston, Missouri, 35 miles northwest of Kansas City, Missouri, as well as a 3% interest in the site and a 12% interest in certain common facilities. Unit No. 2 entered commercial operation on December 31, 2010. We are entitled to 12% of the units’ available capacity, currently 85 megawatts for Unit No. 1 and 105 megawatts for Unit No. 2, and are obligated to pay for that percentage of the operating costs of the units. KCP&L operates the units for the joint owners.
We own a 7.52% undivided interest in the coal-fired Plum Point Energy Station located near Osceola, Arkansas. We are entitled to 50 megawatts, or 7.52% of the unit’s available capacity. The Plum Point Energy Station entered commercial operation on September 1, 2010.
Our generating plant located at Riverton, Kansas, has four gas-fired combustion turbine units (Units 9, 10, 11 and 12) and two gas-fired steam generating units (Units 7 and 8) with an aggregate generating capacity of 279 megawatts. In September 2012, Units 7 and 8 were transitioned from operation on coal to full operation on natural gas. Unit 12 began commercial operation on April 10, 2007 and is scheduled to be converted from a simple cycle combustion turbine to a combined cycle unit, with scheduled completion in mid-2016.
Our State Line Power Plant, which is located west of Joplin, Missouri, consists of Unit No. 1, a combustion turbine unit with generating capacity of 94 megawatts and a Combined Cycle Unit with generating capacity of 495 megawatts of which we are entitled to 60%, or 297 megawatts. The Combined Cycle Unit consists of the combination of two combustion turbines, two heat recovery steam generators, a steam turbine and auxiliary equipment. The Combined Cycle Unit is jointly owned with Westar Generating Inc., a subsidiary of Westar Energy, Inc., which owns the remaining 40% of the unit. We are the operator of the Combined Cycle Unit and Westar reimburses us for a percentage of the operating costs per our joint ownership agreement. All units at our State Line Power Plant burn natural gas as a primary fuel with Unit No. 1 having the additional capability of burning oil.
We have four combustion turbine peaking units at the Empire Energy Center in Jasper County, Missouri, with an aggregate generating capacity of 262 megawatts. These peaking units operate on natural gas, as well as oil.
Our hydroelectric generating plant (FERC Project No. 2221), located on the White River at Ozark Beach, Missouri, has a generating capacity of 16 megawatts. We have a long-term license from FERC to operate this plant which forms Lake Taneycomo in southwestern Missouri. As part of the Energy and Water Development Appropriations Act of 2006 (the Appropriations Act), a new minimum flow pattern was established with the intent of increasing minimum flows on recreational streams in Arkansas. To accomplish this, the level of Bull Shoals Lake was increased an average of 5 feet. The increase at Bull Shoals will decrease the net head waters available for generation at Ozark Beach by 5 feet and, thus, reduce our electrical output. We estimate the lost production to be up to 16% of our average annual energy production for this unit. The loss in this facility will require us to replace it with additional generation from our gas-fired and coal-fired units or with purchased power. The Appropriations Act required the Southwest Power Administration (SWPA), in coordination with us and our relevant public service commissions, to determine our economic detriment assuming a January 1, 2011 implementation date. On September 16, 2010, we received a $26.6 million payment from the SWPA, which was deferred and recorded as a noncurrent liability. The SWPA payment, net of taxes, is being used to reduce fuel expense for our customers in all our jurisdictions. It is our understanding that the lake level change for Bull Shoals was implemented in July of 2013.

18
At December 31, 2013, our transmission system consisted of approximately 22 miles of 345 kV lines, 441 miles of 161 kV lines, 745 miles of 69 kV lines and 81 miles of 34.5 kV lines. Our distribution system consisted of approximately 6,882 miles of line at December 31, 2013 and December 31, 2012.
Our electric generation stations, other than Plum Point Energy Station, are located on land owned in fee. We own a 3% undivided interest as tenant in common in the land for the Iatan Generating Station. We own a similar interest in 60% of the land used for the State Line Combined Cycle Unit. Substantially all of our electric transmission and distribution facilities are located either (1) on property leased or owned in fee; (2) over streets, alleys, highways and other public places, under franchises or other rights; or (3) over private property by virtue of easements obtained from the record holders of title. Substantially all of our electric segment property, plant and equipment are subject to the EDE Mortgage.
We also own and operate water pumping facilities and distribution systems consisting of a total of approximately 89 miles of water mains in three communities in Missouri.
Gas Segment Facilities
At December 31, 2013, our principal gas utility properties consisted of approximately 87 miles of transmission mains and approximately 1,160 miles of distribution mains.
Substantially all of our gas transmission and distribution facilities are located either (1) on property leased or owned in fee; (2) under streets, alleys, highways and other public places, under franchises or other rights; or (3) under private property by virtue of easements obtained from the record holders of title. Substantially all of our gas segment property, plant and equipment are subject to the EDG Mortgage.
Other Segment
Our other segment consists of our leasing of fiber optics cable and equipment (which we also use in our own utility operations).
ITEM 3. LEGAL PROCEEDINGS
See Note 11 of “Notes to Consolidated Financial Statements” under Item 8, which description is incorporated herein by reference.
ITEM 4. MINE SAFETY DISCLOSURES
Not applicable. PART II
ITEM 5. MARKET FOR REGISTRANT’S COMMON EQUITY, RELATED STOCKHOLDER MATTERS AND ISSUER PURCHASES OF EQUITY SECURITIES
Our common stock is listed on the New York Stock Exchange (ticker symbol: EDE). On February 3, 2014, there were 4,379 record holders and 28,500 individual participants in security position listings. The following table presents the high and low sales prices (and quarter end closing sales prices) for our common stock as reported by the New York Stock Exchange for composite transactions, and the amount per share of quarterly dividends declared and paid on the common stock for each quarter during 2013 and 2012.
High Low Close Dividends Paid Per Share
2013 Quarter Ended: March 31 $ 22.41 $ 20.57 $ 22.40 $ 0.250 June 30 23.35 21.26 22.31 0.250 September 30 24.32 20.77 21.66 0.250 December 31 23.26 21.27 22.69 0.255 2012 Quarter Ended: March 31 $ 21.34 $ 19.55 $ 20.35 $ 0.250 June 30 21.24 19.51 21.10 0.250 September 30 21.94 21.02 21.55 0.250 December 31 22.04 19.59 20.38 0.250
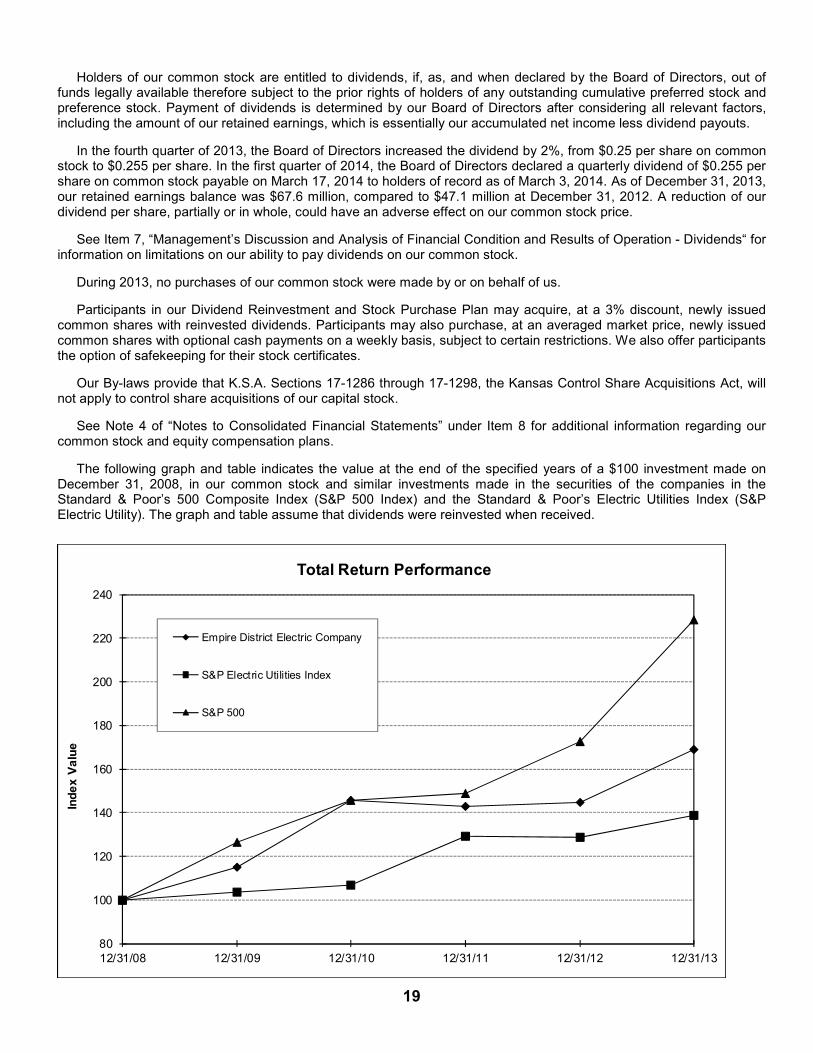
19
Holders of our common stock are entitled to dividends, if, as, and when declared by the Board of Directors, out of funds legally available therefore subject to the prior rights of holders of any outstanding cumulative preferred stock and preference stock. Payment of dividends is determined by our Board of Directors after considering all relevant factors, including the amount of our retained earnings, which is essentially our accumulated net income less dividend payouts.
In the fourth quarter of 2013, the Board of Directors increased the dividend by 2%, from $0.25 per share on common stock to $0.255 per share. In the first quarter of 2014, the Board of Directors declared a quarterly dividend of $0.255 per share on common stock payable on March 17, 2014 to holders of record as of March 3, 2014. As of December 31, 2013, our retained earnings balance was $67.6 million, compared to $47.1 million at December 31, 2012. A reduction of our dividend per share, partially or in whole, could have an adverse effect on our common stock price.
See Item 7, “Management’s Discussion and Analysis of Financial Condition and Results of Operation - Dividends“ for information on limitations on our ability to pay dividends on our common stock.
During 2013, no purchases of our common stock were made by or on behalf of us.
Participants in our Dividend Reinvestment and Stock Purchase Plan may acquire, at a 3% discount, newly issued common shares with reinvested dividends. Participants may also purchase, at an averaged market price, newly issued common shares with optional cash payments on a weekly basis, subject to certain restrictions. We also offer participants the option of safekeeping for their stock certificates.
Our By-laws provide that K.S.A. Sections 17-1286 through 17-1298, the Kansas Control Share Acquisitions Act, will not apply to control share acquisitions of our capital stock.
See Note 4 of “Notes to Consolidated Financial Statements” under Item 8 for additional information regarding our common stock and equity compensation plans.
The following graph and table indicates the value at the end of the specified years of a $100 investment made on December 31, 2008, in our common stock and similar investments made in the securities of the companies in the Standard & Poor’s 500 Composite Index (S&P 500 Index) and the Standard & Poor’s Electric Utilities Index (S&P Electric Utility). The graph and table assume that dividends were reinvested when received.
80
100
120
140
160
180
200
220
240
12/31/08 12/31/09 12/31/10 12/31/11 12/31/12 12/31/13
Ind
ex
Va
lue
Total Return Performance
Empire District Electric Company
S&P Electric Utilities Index
S&P 500

20
Total Return Analysis 12/31/2008 12/31/2009 12/31/2010 12/31/2011 12/31/2012 12/31/2013 The Empire District Electric Company $100.00 $ 114.96 $ 145.53 $ 142.70 $ 144.79 $ 168.77 S&P Electric Utilities Index $100.00 $ 103.38 $ 106.93 $ 129.35 $ 128.63 $ 138.66 S&P 500 Index $100.00 $ 126.46 $ 145.51 $ 148.59 $ 172.37 $ 228.19
ITEM 6. SELECTED FINANCIAL DATA
(in thousands, except per share amounts)
2013 2012
2011
2010
2009 Operating revenues $ 594,330 $ 557,097 $ 576,870 $ 541,276 $ 497,168 Operating income $ 99,663 $ 96,221 $ 96,934 $ 80,495 $ 74,495 Total allowance for funds used during construction $ 5,940 $ 1,928 $ 512 $ 10,174 $ 14,133 Net income $ 63,445 $ 55,681 $ 54,971 $ 47,396 $ 41,296 Weighted average number of common shares outstanding - basic 42,781 42,257 41,852 40,545 34,924 Weighted average number of common shares outstanding - diluted 42,803 42,284 41,887 40,580 34,956 Earnings from continuing operations per weighted average share of common stock – basic and diluted $ 1.48 $ 1.32 $ 1.31 $ 1.17 $ 1.18 Total earnings per weighted average share of common stock – basic and diluted $ 1.48 $ 1.32 $ 1.31 $ 1.17 $ 1.18 Cash dividends per share $ 1.005 $ 1.00 $ 0.64 $ 1.28 $ 1.28 Common dividends paid as a percentage of net income 67.8% 75.9% 48.6% 109.7% 108.5% Allowance for funds used during construction as a percentage of net income 9.4% 3.5% 0.9% 21.5% 34.2% Book value per common share (actual) outstanding at end of year $ 17.43 $ 16.90 $ 16.53 $ 15.82 $ 15.75 Capitalization: Common equity $ 750,124 $ 717,798 $ 693,989 $ 657,624 $ 600,150 Long-term debt $ 743,428 $ 691,626 $ 692,259 $ 693,072 $ 640,156 Ratio of earnings to fixed charges 2.97X 2.89X 2.87X 2.63X 2.15X Total assets
$2,145,045 $2,126,369 $2,021,835 $1,921,311 $1,839,846
Plant in service at original cost $2,332,341 $2,284,022 $2,176,650 $2,108,115 $1,718,584 Capital expenditures (including AFUDC)
$ 160,196 $ 146,287 $ 101,177 $ 108,157 $ 148,804
ITEM 7. MANAGEMENT’S DISCUSSION AND ANALYSIS OF FINANCIAL CONDITION AND RESULTS OF OPERATIONS EXECUTIVE SUMMARY
Electric Segment
As a traditional, vertically integrated regulated utility, the primary drivers of our electric operating revenues in any period are: (1) rates we can charge our customers, (2) weather, (3) customer growth and usage and (4) general economic conditions. The utility commissions in the states in which we operate, as well as the Federal Energy Regulatory Commission (FERC), set the rates which we can charge our customers. In order to offset expenses, we depend on our ability to receive adequate and timely recovery of our costs (primarily fuel and purchased power) and/or rate relief. We assess the need for rate relief in all of the jurisdictions we serve and file for such relief when necessary. The effects of timing of rate relief are discussed in detail in Note 3 of “Notes to the Consolidated Financial Statements” under Item 8. Of the factors driving revenues, weather has the greatest short-term effect on the demand for electricity for our regulated business. Very hot summers and very cold winters increase electric demand, while mild weather reduces demand. Residential and commercial sales are impacted more by weather than industrial sales, which are mostly affected by business needs for electricity and by general economic conditions.
Customer growth, which is the growth in the number of customers, contributes to the demand for electricity. We expect our electric customer and sales growth to be less than 1.0% annually over the next several years. Our electric customer growth for the year ended December 31, 2013 was 0.5%. We define electric sales growth to be growth in kWh
21
sales period over period excluding the estimated impact of weather. The primary drivers of electric sales growth are customer growth, customer usage and general economic conditions.
The primary drivers of our electric operating expenses in any period are: (1) fuel and purchased power expense, (2) operating maintenance and repairs expense, including repairs following severe weather and plant outages, (3) taxes and (4) non-cash items such as depreciation and amortization expense. We have a fuel cost recovery mechanism in all of our jurisdictions, which significantly reduces the impact of fluctuating fuel and purchased power costs on our net income.
Gas Segment
The primary drivers of our gas operating revenues in any period are: (1) rates we can charge our customers, (2) weather, (3) customer growth and usage, (4) the cost of natural gas and interstate pipeline transportation charges and (5) general economic conditions. The MPSC sets the rates which we can charge our customers. In order to offset expenses, we depend on our ability to receive adequate and timely recovery of our costs (primarily commodity natural gas) and/or rate relief. We assess the need for rate relief and file for such relief when necessary. A Purchased Gas Adjustment (PGA) clause is included in our gas rates, which allows us to recover our actual cost of natural gas from customers through rate changes, which are made periodically (up to four times) throughout the year in response to weather conditions, natural gas costs and supply demands. Weather affects the demand for natural gas. Very cold winters increase demand for gas, while mild weather reduces demand. Due to the seasonal nature of the gas business, revenues and earnings are typically concentrated in the November through March period, which generally corresponds with the heating season.
Customer growth, which is the growth in the number of customers, contributes to the demand for gas. Our annual customer growth is calculated by comparing the number of customers at the end of a year to the number of customers at the end of the prior year. Our gas segment customer contraction for the year ended December 31, 2013 was 0.1%, which we believe was due to depressed economic conditions. We expect gas customer growth to be flat during the next several years. We define gas sales growth to be growth in mcf sales excluding the impact of weather. The primary drivers of gas sales growth are customer growth and general economic conditions.
The primary driver of our gas operating expense in any period is the price of natural gas. However, because gas purchase costs for our gas utility operations are normally recovered from our customers, any change in gas prices does not have a corresponding impact on income unless such costs are deemed imprudent or cause customers to reduce usage.
Earnings
For the year ended December 31, 2013, basic and diluted earnings per weighted average share of common stock were $1.48 on $63.4 million of net income compared to $1.32 on $55.7 million of net income for the year ended December 31, 2012. Increased electric gross margins (defined as electric revenues less fuel and purchased power costs) positively impacted net income for 2013 as compared to 2012, reflecting an increase in electric revenues of approximately $25.7 million, mainly due to increased electric rates for our Missouri customers effective April 1, 2013. Improved electric customer counts, favorable winter weather and increased AFUDC due to higher levels of construction activity during 2013 also positively impacted results. Increased regulatory operating expense and depreciation and amortization expense negatively impacted 2013 results.
The table below sets forth a reconciliation of basic and diluted earnings per share between 2012 and 2013, which is a non-GAAP presentation. The economic substance behind our non-GAAP earnings per share (EPS) measure is to present the after tax impact of significant items and components of the statement of income, including segment revenues and operating expenses, on a per share basis before the impact of additional stock issuances. The dilutive effect of additional shares issued included in the table reflects the estimated impact of all shares issued during the period.
We believe this presentation is useful to investors because the statement of income does not readily show the EPS impact of the various components, including the effect of new stock issuances. This could limit the readers’ understanding of the reasons for the EPS change from the previous year’s EPS. This information is useful to management, and we believe this information is useful to investors, to better understand the reasons for the fluctuation in EPS between the prior and current years on a per share basis.
In addition, although a non-GAAP presentation, we believe the presentation of gross margin (in the table below and elsewhere in this report) is useful to investors and others in understanding and analyzing changes in our electric operating performance from one period to the next, and have included the analysis as a complement to the financial information we provide in accordance with GAAP. This reconciliation and margin information may not be comparable to

22
other companies’ presentations or more useful than the GAAP presentation included in the statements of income or elsewhere in this report. We also note that this presentation does not purport to be an alternative to earnings per share determined in accordance with GAAP as a measure of operating performance or any other measure of financial performance presented in accordance with GAAP. Management compensates for the limitations of using non-GAAP financial measures by using them to supplement GAAP results to provide a more complete understanding of the factors and trends affecting the business than GAAP results alone.
Earnings Per Share – 2012 $ 1.32 Revenues Electric segment 0.38 Gas segment 0.15 Other segment 0.02 Total Revenue 0.55 Electric fuel and purchased power 0.05 Cost of natural gas sold and transported (0.11) Gross Margin 0.49 Operating – electric segment (0.15) Operating – gas segment (0.01) Operating – other segment (0.01) Maintenance and repairs (0.01) Depreciation and amortization (0.13) Loss on plant disallowance (0.03) Other taxes (0.05) AFUDC 0.06 Change in effective income tax rates 0.02 Other income and deductions (0.02)
Earnings Per Share – 2013 $ 1.48
Fourth Quarter Results
Earnings for the fourth quarter of 2013 were $15.2 million, or $0.35 per share, as compared to $9.6 million, or $0.23 per share, in the fourth quarter of 2012. Electric segment gross margins increased during the quarter ending December 31, 2013 compared to the 2012 quarter, reflecting the impact of colder weather experienced during the fourth quarter of 2013 as compared to the same period in 2012 and the April 2013 Missouri electric rate increase, partially offset by increased electric operating and maintenance expenses.
2013 Activities
Regulatory Matters
On December 3, 2013, we filed a request with the Arkansas Public Service Commission for changes in rates for our Arkansas electric customers. We are seeking an annual increase in total revenue of approximately $2.2 million, or approximately 18%. The rate increase was requested to recover costs incurred to ensure continued reliable service for our customers, including capital investments, operating systems replacement costs and ongoing increases in other operation and maintenance expenses and capital costs.
On February 22, 2013, we filed a Nonunanimous Stipulation and Agreement (Agreement) with the Missouri Public Service Commission (MPSC) which issued an order approving the Agreement on February 27, 2013, effective March 6, 2013. The Agreement provided for an annual increase in base revenues for our Missouri electric customers in the amount of approximately $27.5 million, effective April 1, 2013, and the continuation of the current fuel adjustment mechanism.
On May 18, 2012, we filed a request with the Federal Energy Regulatory Commission (FERC) to implement a cost-based transmission formula rate (TFR). On June 13, 2013, we, the Kansas Corporation Commission and the cities of Monett, Mt. Vernon and Lockwood, Missouri and Chetopa, Kansas, filed a unanimous Settlement Agreement (Agreement) with the FERC. The Agreement includes a TFR that establishes an ROE of 10.0%. The FERC conditionally approved the Agreement on November 18, 2013, and we made a compliance filing with the FERC on December 18, 2013 in connection with this conditional approval. Final FERC action on our compliance filing is pending.
For additional information on all these cases, see Note 3 of “Notes to Consolidated Financial Statements” under Item 8 for information regarding regulatory matters.
23
Integrated Resource Plan
We filed our Integrated Resource Plan (IRP) with the MPSC on July 1, 2013. The IRP analysis of future loads and resources is normally conducted once every three years. Our IRP supports our Compliance Plan discussed in Note 11 of “Notes to Consolidated Financial Statements” under Item 8.
As part of our IRP, we agreed to introduce additional demand-side management programs to help our customers use energy more efficiently. On October 30, 2013 we filed a request with the MPSC to implement a portfolio of demand-side management programs under the Missouri Energy Efficiency Investment Act (MEEIA). The request, subject to regulatory approval, would implement new energy efficiency programs for customers in 2014. The request also includes a Demand-Side Program Investment Mechanism (DSIM) that would be added to monthly customer bills if approved by the MPSC. The DSIM charge is designed to offset the financial costs associated with the programs. On January 14, 2014, the MPSC granted a motion to suspend the procedural schedule to allow the parties to the case more time to hold additional technical conferences and perform additional financial analysis on our proposed demand-side management portfolio.
Financings
On October 30, 2012, we entered into a Bond Purchase Agreement for a private placement of $30.0 million of 3.73% First Mortgage Bonds due May 30, 2033 and $120.0 million of 4.32% First Mortgage Bonds due May 30, 2043. The delayed settlement of both series of bonds occurred on May 30, 2013. Interest is payable semi-annually on the bonds on each May 30 and November 30, commencing November 30, 2013.
A portion of the proceeds from the above sale of bonds was used to redeem all $98.0 million aggregate principal amount of our Senior Notes, 4.50% Series due June 15, 2013. The remaining proceeds were used for general corporate purposes.
For additional information, see Note 6 of “Notes to Consolidated Financial Statements” under Item 8.
RESULTS OF OPERATIONS
The following discussion analyzes significant changes in the results of operations for the years 2013, 2012 and 2011.
The following table represents our results of operations by operating segment for the applicable years ended December 31 (in millions):
2013 2012 2011 Electric $ 58.6 $ 52.6 $ 50.6 Gas 2.3 1.3 2.7 Other 2.5 1.8 1.6 Net income $ 63.4 $ 55.7 $ 54.9
Electric Segment Overview
Our electric segment income for 2013 was $58.6 million as compared to $52.6 million and $50.6 million for 2012 and 2011, respectively.
Electric operating revenues comprised approximately 89.9% of our total operating revenues during 2013. Electric operating revenues for 2013, 2012, and 2011 were comprised of the following:
2013 2012 2011 Residential 42.6% 42.2% 42.4% Commercial 30.4 31.2 30.1 Industrial 15.1 15.5 15.1 Wholesale on-system 3.7 3.6 3.7 Wholesale off-system 2.9 3.1 4.5 Miscellaneous sources* 2.8 2.7 2.6 Other electric revenues 2.5 1.7 1.6
*Primarily other public authorities
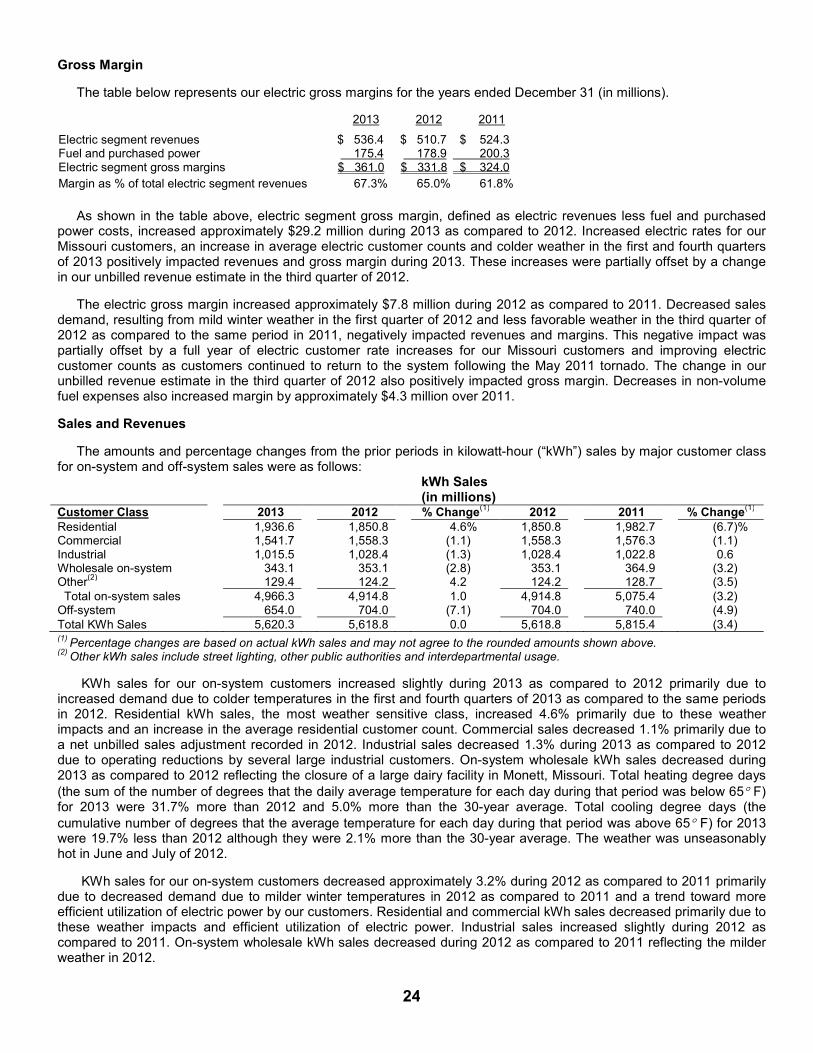
24
Gross Margin
The table below represents our electric gross margins for the years ended December 31 (in millions).
2013 2012 2011
Electric segment revenues $ 536.4 $ 510.7 $ 524.3 Fuel and purchased power 175.4 178.9 200.3 Electric segment gross margins $ 361.0 $ 331.8 $ 324.0
Margin as % of total electric segment revenues 67.3% 65.0% 61.8%
As shown in the table above, electric segment gross margin, defined as electric revenues less fuel and purchased
power costs, increased approximately $29.2 million during 2013 as compared to 2012. Increased electric rates for our Missouri customers, an increase in average electric customer counts and colder weather in the first and fourth quarters of 2013 positively impacted revenues and gross margin during 2013. These increases were partially offset by a change in our unbilled revenue estimate in the third quarter of 2012.
The electric gross margin increased approximately $7.8 million during 2012 as compared to 2011. Decreased sales demand, resulting from mild winter weather in the first quarter of 2012 and less favorable weather in the third quarter of 2012 as compared to the same period in 2011, negatively impacted revenues and margins. This negative impact was partially offset by a full year of electric customer rate increases for our Missouri customers and improving electric customer counts as customers continued to return to the system following the May 2011 tornado. The change in our unbilled revenue estimate in the third quarter of 2012 also positively impacted gross margin. Decreases in non-volume fuel expenses also increased margin by approximately $4.3 million over 2011.
Sales and Revenues
The amounts and percentage changes from the prior periods in kilowatt-hour (“kWh”) sales by major customer class for on-system and off-system sales were as follows: kWh Sales (in millions) Customer Class 2013 2012 % Change
(1) 2012 2011 % Change
(1)
Residential 1,936.6 1,850.8 4.6% 1,850.8 1,982.7 (6.7)% Commercial 1,541.7 1,558.3 (1.1) 1,558.3 1,576.3 (1.1) Industrial 1,015.5 1,028.4 (1.3) 1,028.4 1,022.8 0.6 Wholesale on-system 343.1 353.1 (2.8) 353.1 364.9 (3.2) Other
(2) 129.4 124.2 4.2 124.2 128.7 (3.5)
Total on-system sales 4,966.3 4,914.8 1.0 4,914.8 5,075.4 (3.2) Off-system 654.0 704.0 (7.1) 704.0 740.0 (4.9) Total KWh Sales 5,620.3 5,618.8 0.0 5,618.8 5,815.4 (3.4) (1)
Percentage changes are based on actual kWh sales and may not agree to the rounded amounts shown above. (2)
Other kWh sales include street lighting, other public authorities and interdepartmental usage.
KWh sales for our on-system customers increased slightly during 2013 as compared to 2012 primarily due to increased demand due to colder temperatures in the first and fourth quarters of 2013 as compared to the same periods in 2012. Residential kWh sales, the most weather sensitive class, increased 4.6% primarily due to these weather impacts and an increase in the average residential customer count. Commercial sales decreased 1.1% primarily due to a net unbilled sales adjustment recorded in 2012. Industrial sales decreased 1.3% during 2013 as compared to 2012 due to operating reductions by several large industrial customers. On-system wholesale kWh sales decreased during 2013 as compared to 2012 reflecting the closure of a large dairy facility in Monett, Missouri. Total heating degree days (the sum of the number of degrees that the daily average temperature for each day during that period was below 65° F) for 2013 were 31.7% more than 2012 and 5.0% more than the 30-year average. Total cooling degree days (the cumulative number of degrees that the average temperature for each day during that period was above 65° F) for 2013 were 19.7% less than 2012 although they were 2.1% more than the 30-year average. The weather was unseasonably hot in June and July of 2012.
KWh sales for our on-system customers decreased approximately 3.2% during 2012 as compared to 2011 primarily due to decreased demand due to milder winter temperatures in 2012 as compared to 2011 and a trend toward more efficient utilization of electric power by our customers. Residential and commercial kWh sales decreased primarily due to these weather impacts and efficient utilization of electric power. Industrial sales increased slightly during 2012 as compared to 2011. On-system wholesale kWh sales decreased during 2012 as compared to 2011 reflecting the milder weather in 2012.
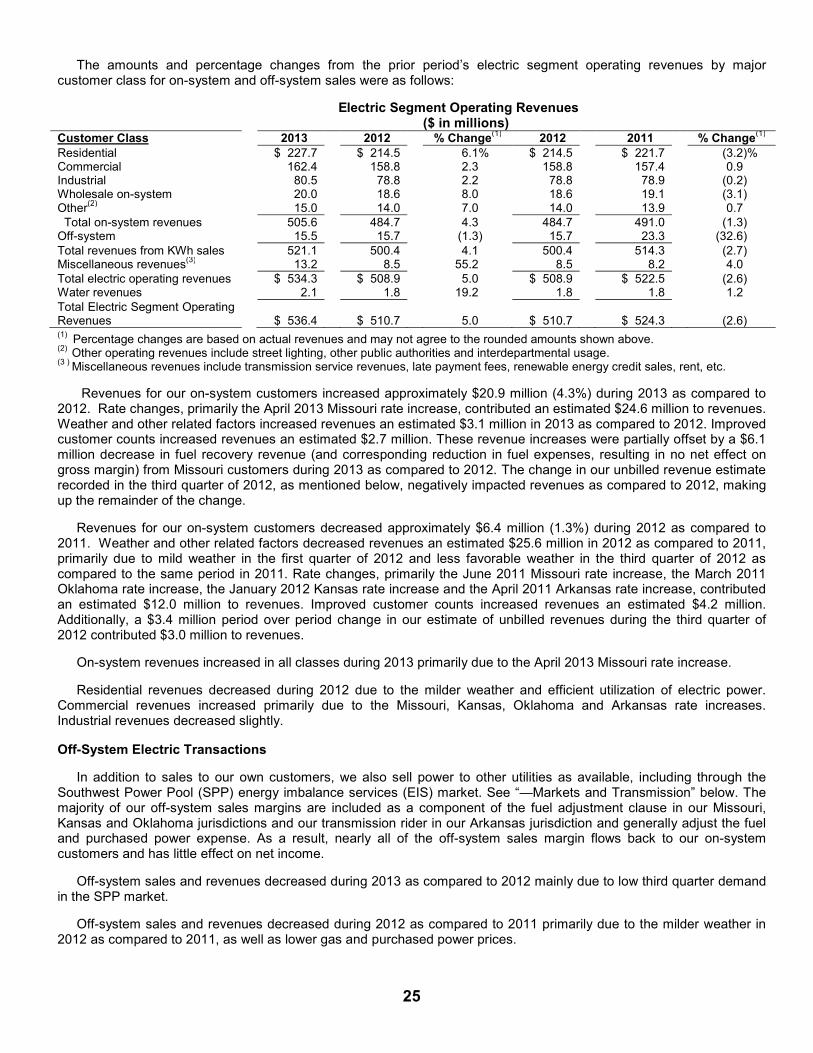
25
The amounts and percentage changes from the prior period’s electric segment operating revenues by major customer class for on-system and off-system sales were as follows:
Electric Segment Operating Revenues ($ in millions) Customer Class 2013 2012 % Change
(1) 2012 2011 % Change
(1)
Residential $ 227.7 $ 214.5 6.1% $ 214.5 $ 221.7 (3.2)% Commercial 162.4 158.8 2.3 158.8 157.4 0.9 Industrial 80.5 78.8 2.2 78.8 78.9 (0.2) Wholesale on-system 20.0 18.6 8.0 18.6 19.1 (3.1) Other
(2) 15.0 14.0 7.0 14.0 13.9 0.7
Total on-system revenues 505.6 484.7 4.3 484.7 491.0 (1.3) Off-system 15.5 15.7 (1.3) 15.7 23.3 (32.6) Total revenues from KWh sales 521.1 500.4 4.1 500.4 514.3 (2.7) Miscellaneous revenues
(3) 13.2 8.5 55.2 8.5 8.2 4.0
Total electric operating revenues $ 534.3 $ 508.9 5.0 $ 508.9 $ 522.5 (2.6) Water revenues 2.1 1.8 19.2 1.8 1.8 1.2 Total Electric Segment Operating Revenues
$ 536.4
$ 510.7
5.0
$ 510.7
$ 524.3
(2.6)
(1) Percentage changes are based on actual revenues and may not agree to the rounded amounts shown above.
(2) Other operating revenues include street lighting, other public authorities and interdepartmental usage.
(3 ) Miscellaneous revenues include transmission service revenues, late payment fees, renewable energy credit sales, rent, etc.
Revenues for our on-system customers increased approximately $20.9 million (4.3%) during 2013 as compared to 2012. Rate changes, primarily the April 2013 Missouri rate increase, contributed an estimated $24.6 million to revenues. Weather and other related factors increased revenues an estimated $3.1 million in 2013 as compared to 2012. Improved customer counts increased revenues an estimated $2.7 million. These revenue increases were partially offset by a $6.1 million decrease in fuel recovery revenue (and corresponding reduction in fuel expenses, resulting in no net effect on gross margin) from Missouri customers during 2013 as compared to 2012. The change in our unbilled revenue estimate recorded in the third quarter of 2012, as mentioned below, negatively impacted revenues as compared to 2012, making up the remainder of the change.
Revenues for our on-system customers decreased approximately $6.4 million (1.3%) during 2012 as compared to 2011. Weather and other related factors decreased revenues an estimated $25.6 million in 2012 as compared to 2011, primarily due to mild weather in the first quarter of 2012 and less favorable weather in the third quarter of 2012 as compared to the same period in 2011. Rate changes, primarily the June 2011 Missouri rate increase, the March 2011 Oklahoma rate increase, the January 2012 Kansas rate increase and the April 2011 Arkansas rate increase, contributed an estimated $12.0 million to revenues. Improved customer counts increased revenues an estimated $4.2 million. Additionally, a $3.4 million period over period change in our estimate of unbilled revenues during the third quarter of 2012 contributed $3.0 million to revenues.
On-system revenues increased in all classes during 2013 primarily due to the April 2013 Missouri rate increase.
Residential revenues decreased during 2012 due to the milder weather and efficient utilization of electric power. Commercial revenues increased primarily due to the Missouri, Kansas, Oklahoma and Arkansas rate increases. Industrial revenues decreased slightly.
Off-System Electric Transactions
In addition to sales to our own customers, we also sell power to other utilities as available, including through the Southwest Power Pool (SPP) energy imbalance services (EIS) market. See “—Markets and Transmission” below. The majority of our off-system sales margins are included as a component of the fuel adjustment clause in our Missouri, Kansas and Oklahoma jurisdictions and our transmission rider in our Arkansas jurisdiction and generally adjust the fuel and purchased power expense. As a result, nearly all of the off-system sales margin flows back to our on-system customers and has little effect on net income.
Off-system sales and revenues decreased during 2013 as compared to 2012 mainly due to low third quarter demand in the SPP market.
Off-system sales and revenues decreased during 2012 as compared to 2011 primarily due to the milder weather in 2012 as compared to 2011, as well as lower gas and purchased power prices.

26
Miscellaneous Revenues
Our miscellaneous revenues increased approximately $4.7 million during 2013 as compared to 2012 and approximately $0.3 million in 2012 as compared to 2011, primarily due to increased Southwest Power Pool (SPP) transmission revenues. These miscellaneous revenues are comprised mainly of transmission revenues, late payment fees and renewable energy credit sales.
Operating Revenue Deductions – Fuel and Purchased Power The table below is a reconciliation of our actual fuel and purchased power expenditures (netted with the regulatory adjustments) to the fuel and purchased power expense shown on our statements of income for 2013, 2012 and 2011.
(in millions) 2013 2012 2011 Actual fuel and purchased power expenditures $ 182.1 $ 173.6 $ 196.5
Missouri fuel adjustment recovery(1) (2.7) 3.4 7.3 Missouri fuel adjustment deferral(2) (0.6) 5.3 (2.7) Kansas and Oklahoma regulatory adjustments(2) (0.3) 1.0 (0.6) SWPA amortization(3) (2.8) (2.8) (1.5) Unrealized (gain)/loss on derivatives (0.3) (1.6) 1.3 Total fuel and purchased power expense per income statement $ 175.4 $ 178.9 $ 200.3
(1)
A positive amount indicates costs recovered from customers from under recovery in prior deferral periods. A negative amount indicates costs refunded to customers from over recovery in prior deferral periods.
(2)
A negative amount indicates costs have been under recovered from customers and a positive amount indicates costs have been over recovered from customers.
(3)
Missouri ten year amortization of the $26.6 million payment received from the SWPA in September, 2010.
Operating Revenue Deductions – Other Than Fuel and Purchased Power
The table below shows regulated operating expense increases/(decreases) during 2013 as compared to 2012 and during 2012 as compared to 2011.
(in millions) 2013 vs. 2012 2012 vs. 2011 Transmission and distribution expense(1) $ 4.8 $ 1.7 General labor expense 2.0 0.4 Regulatory reversal of gain on prior period sale of assets(2) 1.2 0.0 Customer accounts expense 0.9 (0.5) Steam power other operating expense 0.6 2.0 Regulatory commission expense 0.5 (0.5) Other power supply expense 0.7 0.1 Employee pension expense 0.5 1.4 Employee health care expense 0.2 2.4 Property insurance 0.5 0.6 Customer assistance expense 0.4 0.0 Injuries and damages expense 0.0 (0.7) Professional services (0.5) 2.1 Banking fees (0.7) (0.6) Other miscellaneous accounts (netted) 0.0 0.4 TOTAL $ 11.1 $ 8.8
(1)Mainly due to increased SPP transmission charges.
(2)Regulatory reversal of a prior period gain on the sale of our Asbury unit train as part of our 2013 rate case Agreement
with the MPSC.
The table below shows maintenance and repairs expense increases/(decreases) during 2013 as compared to 2012 and during 2012 as compared to 2011.

27
(in millions) 2013 vs. 2012 2012 vs. 2011 Distribution maintenance expense $ 0.4 $ (1.1) Transmission maintenance expense 0.7 (0.3) Maintenance and repairs expense at the Asbury plant (0.9) 0.9 Maintenance and repairs expense to SLCC (1.1) 0.6 Maintenance and repairs expense at the State Line plant 0.5 (0.2) Maintenance and repairs expense at the Iatan plant 0.4 (0.8) Maintenance and repairs expense at the Plum Point plant 0.4 (0.1) Maintenance and repairs expense at the Riverton plant – steam (0.2) (0.1) Maintenance and repairs expense at the Riverton plant – gas (0.5) 0.5 Iatan deferred maintenance expense 0.5 (0.1) Other miscellaneous accounts (netted) 0.2 0.1 TOTAL $ 0.4 $ (0.6)
Depreciation and amortization expense increased approximately $8.3 million (15.1%) during 2013 as compared to 2012, primarily due to increased depreciation rates resulting from our recent Missouri rate case settlement and increased plant in service.
Depreciation and amortization expense decreased approximately $2.9 million (5.0%) during 2012 as compared to 2011. This reflects a decrease in regulatory amortization expense of $6.6 million during 2012 due to the termination of construction accounting as of June 15, 2011, the effective date of rates for our 2010 Missouri rate case, offset by increased plant in service.
Other taxes increased approximately $3.3 million in 2013 and $0.9 million in 2012 due to increased property tax reflecting our additions to plant in service and increased municipal franchise taxes.
Gas Segment Gas Operating Revenues and Sales
The following table details our natural gas sales for the years ended December 31:
Total Gas Delivered to Customers
(bcf sales) 2013 2012 % Change 2012 2011 % Change Residential 2.74 2.01 36.4% 2.01 2.56 (21.4)% Commercial 1.35 1.05 28.5 1.05 1.27 (17.2) Industrial 0.07 0.06 23.9 0.06 0.10 (42.9) Other(1) 0.04 0.02 44.8 0.02 0.03 (29.5) Total retail sales 4.20 3.14 33.6 3.14 3.96 (20.7) Transportation sales(1) 4.53 4.25 6.6 4.25 4.53 (6.2) Total gas operating sales 8.73 7.39 18.1 7.39 8.49 (13.0) (1)
Other includes other public authorities and interdepartmental usage.
The following table details our natural gas revenues for the years ended December 31:
Operating Revenues and Cost of Gas Sold ($ in millions) 2013 2012 % Change 2012 2011 % Change Residential $ 31.6 $ 24.7 27.6% $ 24.7 $ 29.0 (14.7)% Commercial 13.7 10.8 26.6 10.8 12.5 (13.7) Industrial 0.5 0.5 11.0 0.5 0.7 (31.9) Other(1) 0.3 0.3 38.7 0.3 0.3 (23.9) Total retail revenues $ 46.1 $ 36.3 27.1 $ 36.3 $ 42.5 (14.7) Other revenues 0.4 0.3 7.5 0.3 0.4 (13.4) Transportation revenues(1) 3.5 3.2 10.0 3.2 3.5 (7.5) Total gas operating revenues $ 50.0 $ 39.8 25.6 $ 39.8 $ 46.4 (14.2) Cost of gas sold 25.8 18.6 38.4 18.6 22.8 (18.1) Gas segment gross margins $ 24.2 $ 21.2 14.3 $ 21.2 $ 23.6 (10.4) (1)
Other includes other public authorities and interdepartmental usage.

28
Gas retail sales and revenues increased during 2013 as compared to 2012 reflecting colder weather in 2013 as compared to 2012. Heating degree days were 38.1% higher in 2013 than 2012 and 8.3% higher than the 30-year average. Sales increased in all classes during 2013, reflecting the colder weather. As a result, our gas gross margin (defined as gas operating revenues less cost of gas in rates) for 2013 increased $3.0 million compared to 2012.
Gas retail sales and revenues decreased during 2012 as compared to 2011 reflecting mild weather in 2012 and customer contraction of 0.2%. Heating degree days were 22.9% lower in 2012 than 2011 and 23.2% lower than the 30-year average. Residential and commercial sales decreased during 2012 due to the mild weather and customer contraction. Industrial sales decreased 42.9% during 2012 reflecting the transfer of customers from industrial sales to transportation during the first quarter of 2012. As a result, our gas gross margin for 2012 decreased $2.4 million compared to 2011.
We have a PGA clause in place that allows us to recover from our customers, subject to routine regulatory review, the cost of purchased gas supplies, transportation and storage, including costs associated with the use of financial instruments to hedge the purchase price of natural gas. Pursuant to the provisions of the PGA clause, the difference between actual costs incurred and costs recovered through the application of the PGA are reflected as a regulatory asset or regulatory liability until the balance is recovered from or credited to customers. As of December 31, 2013, we had unrecovered purchased gas costs of $1.0 million recorded as a current regulatory asset and $1.2 million recorded as a non-current regulatory liability as compared to unrecovered purchased gas costs of $1.7 million recorded as a current regulatory asset and $0.2 million recorded as a non-current regulatory liability as of December 31, 2012.
Operating Revenue Deductions
The table below shows regulated operating expense increases/(decreases) for the years ended December 31:
(in millions) 2013 vs. 2012 2012 vs. 2011 Distribution operation expense $ 0.2 $ 0.1 Transmission operation expense (0.1) 0.0 Customer accounts expense
(1) 0.3 0.0
Miscellaneous 0.1 0.0 TOTAL $ 0.5 $ 0.1 (1)Primarily uncollectible accounts.
Depreciation and amortization expense increased approximately $0.1 million (3.1%) during 2013 and increased approximately $0.1 million (3.0%) during 2012.
Our gas segment had net income of $2.3 million in 2013 as compared to $1.3 million in 2012 and $2.7 million in 2011.
Consolidated Company Income Taxes
The following table shows our consolidated provision for income taxes (in millions) and our consolidated effective federal and state income tax rates for the applicable years ended December 31:
2013 2012 2011 Consolidated provision for income taxes $ 37.5 $ 34.2 $ 34.3 Consolidated effective federal and state income tax rates 37.1% 38.0% 38.4%
The effective tax rate for 2013 is lower than 2012 and 2011 primarily due to higher equity AFUDC income in 2013 compared with 2012 and 2011.
See Note 9 of “Notes to Consolidated Financial Statements” under Item 8 for information and discussion concerning our income tax provision and effective tax rates.
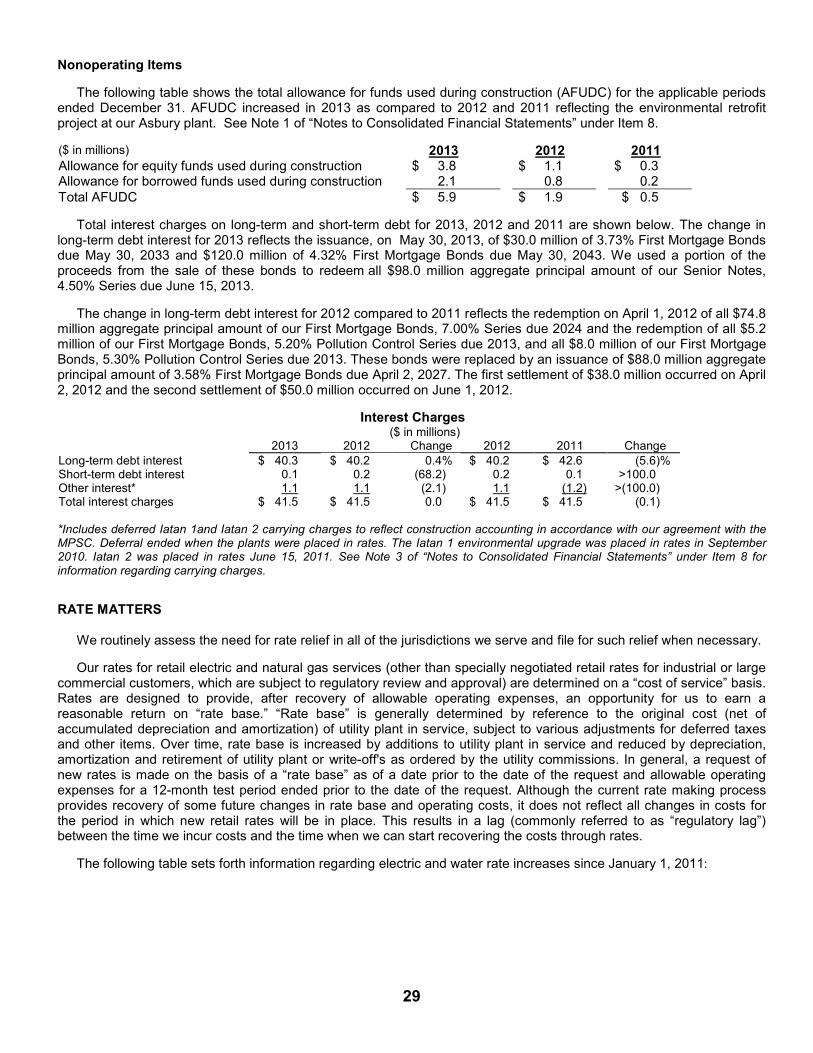
29
Nonoperating Items
The following table shows the total allowance for funds used during construction (AFUDC) for the applicable periods ended December 31. AFUDC increased in 2013 as compared to 2012 and 2011 reflecting the environmental retrofit project at our Asbury plant. See Note 1 of “Notes to Consolidated Financial Statements” under Item 8.
($ in millions) 2013 2012 2011 Allowance for equity funds used during construction $ 3.8 $ 1.1 $ 0.3 Allowance for borrowed funds used during construction 2.1 0.8 0.2 Total AFUDC $ 5.9 $ 1.9 $ 0.5
Total interest charges on long-term and short-term debt for 2013, 2012 and 2011 are shown below. The change in long-term debt interest for 2013 reflects the issuance, on May 30, 2013, of $30.0 million of 3.73% First Mortgage Bonds due May 30, 2033 and $120.0 million of 4.32% First Mortgage Bonds due May 30, 2043. We used a portion of the proceeds from the sale of these bonds to redeem all $98.0 million aggregate principal amount of our Senior Notes, 4.50% Series due June 15, 2013.
The change in long-term debt interest for 2012 compared to 2011 reflects the redemption on April 1, 2012 of all $74.8 million aggregate principal amount of our First Mortgage Bonds, 7.00% Series due 2024 and the redemption of all $5.2 million of our First Mortgage Bonds, 5.20% Pollution Control Series due 2013, and all $8.0 million of our First Mortgage Bonds, 5.30% Pollution Control Series due 2013. These bonds were replaced by an issuance of $88.0 million aggregate principal amount of 3.58% First Mortgage Bonds due April 2, 2027. The first settlement of $38.0 million occurred on April 2, 2012 and the second settlement of $50.0 million occurred on June 1, 2012.
Interest Charges ($ in millions) 2013 2012 Change 2012 2011 Change
Long-term debt interest $ 40.3 $ 40.2 0.4% $ 40.2 $ 42.6 (5.6)% Short-term debt interest 0.1 0.2 (68.2) 0.2 0.1 >100.0 Other interest* 1.1 1.1 (2.1) 1.1 (1.2) >(100.0) Total interest charges $ 41.5 $ 41.5 0.0 $ 41.5 $ 41.5 (0.1) *Includes deferred Iatan 1and Iatan 2 carrying charges to reflect construction accounting in accordance with our agreement with the MPSC. Deferral ended when the plants were placed in rates. The Iatan 1 environmental upgrade was placed in rates in September 2010. Iatan 2 was placed in rates June 15, 2011. See Note 3 of “Notes to Consolidated Financial Statements” under Item 8 for information regarding carrying charges.
RATE MATTERS We routinely assess the need for rate relief in all of the jurisdictions we serve and file for such relief when necessary.
Our rates for retail electric and natural gas services (other than specially negotiated retail rates for industrial or large commercial customers, which are subject to regulatory review and approval) are determined on a “cost of service” basis. Rates are designed to provide, after recovery of allowable operating expenses, an opportunity for us to earn a reasonable return on “rate base.” “Rate base” is generally determined by reference to the original cost (net of accumulated depreciation and amortization) of utility plant in service, subject to various adjustments for deferred taxes and other items. Over time, rate base is increased by additions to utility plant in service and reduced by depreciation, amortization and retirement of utility plant or write-off's as ordered by the utility commissions. In general, a request of new rates is made on the basis of a “rate base” as of a date prior to the date of the request and allowable operating expenses for a 12-month test period ended prior to the date of the request. Although the current rate making process provides recovery of some future changes in rate base and operating costs, it does not reflect all changes in costs for the period in which new retail rates will be in place. This results in a lag (commonly referred to as “regulatory lag”) between the time we incur costs and the time when we can start recovering the costs through rates.
The following table sets forth information regarding electric and water rate increases since January 1, 2011:

30
Jurisdiction
Date Requested
Annual Increase Granted
Percent Increase Granted
Date Effective
Missouri – Electric July 6, 2012 $ 27,500,000 6.78% April 1, 2013 Missouri – Water May 21, 2012 $ 450,000 25.5 % November 23, 2012 Missouri – Electric September 28, 2010 $ 18,700,000 4.70% June 15, 2011 Kansas – Electric June 17, 2011 $ 1,250,000 5.20% January 1, 2012 Oklahoma – Electric June 30, 2011 $ 240,000 1.66% January 4, 2012 Oklahoma – Electric January 28, 2011 $ 1,063,100 9.32% March 1, 2011 Arkansas - Electric August 19, 2010 $ 2,104,321 19.00% April 13, 2011
See Note 3 of “Notes to Consolidated Financial Statements” under Item 8 for additional information regarding rate matters.
MARKETS AND TRANSMISSION
Electric Segment
Energy Imbalance Services: The Southwest Power Pool (SPP) regional transmission organization (RTO) energy imbalance services market (EIS) provides real time energy for most participating members within the SPP regional footprint. Imbalance energy prices are based on market bids and status/availability of dispatchable generation and transmission within the SPP market footprint. In addition to energy imbalance service, the SPP RTO performs a real time security-constrained economic dispatch of all generation voluntarily offered into the EIS market to the market participants to also serve the native load.
Day Ahead Market: The SPP RTO expects to implement a Day-Ahead Market, or Integrated Marketplace, with unit commitment and co-optimized ancillary services market, in March 2014. As part of the Integrated Marketplace, the SPP RTO will create, prior to implementation of such market, a single NERC approved balancing authority to take over balancing authority responsibilities for its members, including Empire, which is expected to provide operational and economic benefits for our customers. The SPP Integrated Marketplace will function as a centralized dispatch, where we and other members will submit offers to sell power and bids to purchase power. The SPP will match offers and bids to supply our and other members’ next day generation needs. It is expected that 90%-95% of all next day generation needed throughout the SPP territory will be cleared through this Integrated Marketplace. This change could impact our fuel costs, however, the net financial effect of these Integrated Marketplace transactions will be processed through our fuel adjustment mechanisms. Information concerning recent and pending SPP RTO and other FERC activities can be found under Note 3 of “Notes to Consolidated Financial Statements” under Item 8.
LIQUIDITY AND CAPITAL RESOURCES
Overview. Our primary sources of liquidity are cash provided by operating activities, short-term borrowings under our commercial paper program (which is supported by our credit facilities) and borrowings from our unsecured revolving credit facility. As needed, we raise funds from the debt and equity capital markets to fund our liquidity and capital resource needs.
Our issuance of various securities, including equity, long-term and short-term debt, is subject to customary approval or authorization by state and federal regulatory bodies including state public service commissions and the SEC. We estimate that internally generated funds (funds provided by operating activities less dividends paid) will provide approximately 45% of the funds required in 2014 for our budgeted capital expenditures (as discussed in “Capital Requirements and Investing Activities” below). We believe the amounts available to us under our credit facilities and the issuance of debt and equity securities, together with the cash provided by operating activities, will allow us to meet our needs for working capital, pension contributions, our continuing construction expenditures, anticipated debt redemptions, interest payments on debt obligations, dividend payments and other cash needs through the next several years.
We will continue to evaluate our need to increase available liquidity based on our view of working capital requirements, including the timing of our construction programs and other factors. See Item 1A, “Risk Factors” for additional information on items that could impact our liquidity and capital resource requirements. The following table provides a summary of our operating, investing and financing activities for the last three years.

31
Summary of Cash Flows Fiscal Year
(in millions) 2013 2012 2011 Cash provided by/(used in): Operating activities $ 157.5 $ 159.1 $ 134.6 Investing activities (153.3) (136.9) (105.1) Financing activities (4.1) (24.2) (34.6) Net change in cash and cash equivalents $ 0.1 $ (2.0) $ (5.1)
Cash flow from Operating Activities
We prepare our statement of cash flows using the indirect method. Under this method, we reconcile net income to cash flows from operating activities by adjusting net income for those items that impact net income but may not result in actual cash receipts or payments during the period. These reconciling items include depreciation and amortization, pension costs, deferred income taxes, equity AFUDC, changes in commodity risk management assets and liabilities and changes in the consolidated balance sheet for working capital from the beginning to the end of the period.
Year-over-year changes in our operating cash flows are attributable primarily to working capital changes resulting from the impact of weather, the timing of customer collections, payments for natural gas and coal purchases, the effects of deferred fuel recoveries and the size and timing of pension contributions. The increase or decrease in natural gas prices directly impacts the cost of gas stored in inventory. 2013 compared to 2012. In 2013, our net cash flows provided from operating activities remained relatively the same, decreasing only $1.6 million or 1.0% from 2012. This decrease was primarily a result of:
• Increase in net income - $7.8 million. • Non-cash loss on regulatory plant disallowance as a result of our 2013 Missouri electric rate case - $2.4 million. • Regulatory reversal of a prior period gain on the sale of assets as a result of our 2013 Missouri electric rate case
- $1.2 million. • Working capital changes for accounts receivable, accounts payable and other current assets and liabilities -
$7.2 million. • Pension contributions increased $5.1 million, partially offset by changes in pension expense accruals of $1.5
million - $(3.6) million net. • Tax timing differences mostly related to depreciation and amortizations - $(3.6) million. • Increase in equity AFUDC mostly attributable to higher construction work in progress balances - $(2.7) million. • Changes in non-cash loss on derivatives - $(4.2) million. • Long-term regulatory fuel adjustment deferrals - $(5.9) million. • Deferred revenues - $(1.4) million.
2012 compared to 2011. In 2012, our net cash flows provided from operating activities was $159.1 million, an increase of $24.5 million or 18.2% from 2011. This increase was primarily a result of:
• Changes in net income - $0.7 million. • Reduced pension contributions net of expense accruals - $22.1 million. • Changes in fuel and other inventory - $17.1 million. • Changes in fuel adjustment deferrals and regulatory trackers and amortizations reflected in prepaid or other
current assets - $13.9 million. • Return of cash from energy trading margin accounts - $3.0 million. • Changes in accruals related to interest, taxes and customer deposits - $1.9 million. • Changes in depreciation and amortization, mostly reflecting lower regulatory amortization offset by increased
plant in service and other amortizations - $(8.6) million. • Lower deferrals of income tax due to reduced tax depreciation benefits - $(13.2) million. • Changes in accounts receivable and accrued unbilled revenues - $(11.0) million. • Changes in accounts payable partially offset by lower accrued taxes - $(1.0) million.
Capital Requirements and Investing Activities
Our net cash flows used in investing activities increased $16.4 million from 2012 to 2013. The increase was primarily the result of an increase in electric plant additions and replacements, mainly due to the environmental retrofit in progress at our Asbury plant.
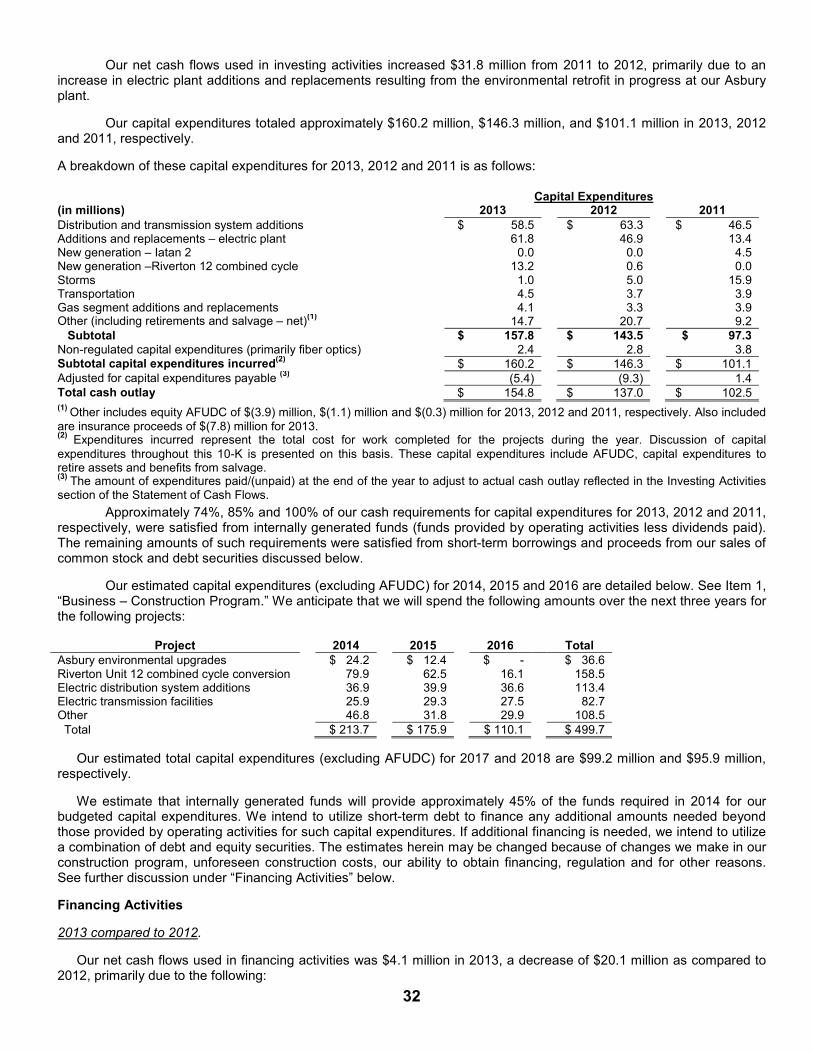
32
Our net cash flows used in investing activities increased $31.8 million from 2011 to 2012, primarily due to an increase in electric plant additions and replacements resulting from the environmental retrofit in progress at our Asbury plant.
Our capital expenditures totaled approximately $160.2 million, $146.3 million, and $101.1 million in 2013, 2012 and 2011, respectively.
A breakdown of these capital expenditures for 2013, 2012 and 2011 is as follows:
Capital Expenditures (in millions) 2013 2012 2011
Distribution and transmission system additions $ 58.5 $ 63.3 $ 46.5 Additions and replacements – electric plant 61.8 46.9 13.4 New generation – Iatan 2 0.0 0.0 4.5 New generation –Riverton 12 combined cycle 13.2 0.6 0.0 Storms 1.0 5.0 15.9 Transportation 4.5 3.7 3.9 Gas segment additions and replacements 4.1 3.3 3.9 Other (including retirements and salvage – net)
(1) 14.7 20.7 9.2
Subtotal $ 157.8 $ 143.5 $ 97.3 Non-regulated capital expenditures (primarily fiber optics) 2.4 2.8 3.8 Subtotal capital expenditures incurred
(2) $ 160.2 $ 146.3 $ 101.1
Adjusted for capital expenditures payable (3)
(5.4) (9.3) 1.4 Total cash outlay $ 154.8 $ 137.0 $ 102.5 (1)
Other includes equity AFUDC of $(3.9) million, $(1.1) million and $(0.3) million for 2013, 2012 and 2011, respectively. Also included are insurance proceeds of $(7.8) million for 2013. (2)
Expenditures incurred represent the total cost for work completed for the projects during the year. Discussion of capital expenditures throughout this 10-K is presented on this basis. These capital expenditures include AFUDC, capital expenditures to retire assets and benefits from salvage. (3)
The amount of expenditures paid/(unpaid) at the end of the year to adjust to actual cash outlay reflected in the Investing Activities section of the Statement of Cash Flows.
Approximately 74%, 85% and 100% of our cash requirements for capital expenditures for 2013, 2012 and 2011, respectively, were satisfied from internally generated funds (funds provided by operating activities less dividends paid). The remaining amounts of such requirements were satisfied from short-term borrowings and proceeds from our sales of common stock and debt securities discussed below.
Our estimated capital expenditures (excluding AFUDC) for 2014, 2015 and 2016 are detailed below. See Item 1, “Business – Construction Program.” We anticipate that we will spend the following amounts over the next three years for the following projects:
Project 2014 2015 2016 Total Asbury environmental upgrades $ 24.2 $ 12.4 $ - $ 36.6 Riverton Unit 12 combined cycle conversion 79.9 62.5 16.1 158.5 Electric distribution system additions 36.9 39.9 36.6 113.4 Electric transmission facilities 25.9 29.3 27.5 82.7 Other 46.8 31.8 29.9 108.5 Total $ 213.7 $ 175.9 $ 110.1 $ 499.7
Our estimated total capital expenditures (excluding AFUDC) for 2017 and 2018 are $99.2 million and $95.9 million, respectively.
We estimate that internally generated funds will provide approximately 45% of the funds required in 2014 for our budgeted capital expenditures. We intend to utilize short-term debt to finance any additional amounts needed beyond those provided by operating activities for such capital expenditures. If additional financing is needed, we intend to utilize a combination of debt and equity securities. The estimates herein may be changed because of changes we make in our construction program, unforeseen construction costs, our ability to obtain financing, regulation and for other reasons. See further discussion under “Financing Activities” below.
Financing Activities
2013 compared to 2012.
Our net cash flows used in financing activities was $4.1 million in 2013, a decrease of $20.1 million as compared to 2012, primarily due to the following:

33
• Issuance of $150.0 million of first mortgage bonds offset by repayment of $98.0 million of senior notes in 2013 compared to no cash impact from $88.0 million in bond refinancing in 2012.
• Repayment of $20.0 million in short-term debt in 2013 as compared to borrowing $12.0 million in 2012, which resulted in an $8.0 million net use of cash when comparing 2013 to 2012.
2012 compared to 2011.
Our net cash flows used in financing activities was $24.2 million in 2012, a decrease of $10.4 million as compared to 2011, primarily due to the following:
• Cash used to pay dividends was $42.3 million, an increase in use of cash of $(15.5) million. • Borrowings of $12.0 million in short-term debt in 2012 as compared to repaying $12.0 million in 2011, which
provided $24.0 million of cash when comparing 2012 to 2011. • Proceeds from the issuance of common stock, primarily from the dividend reinvestment plan, increased $2.2
million. • Refinancings of $88.0 million of bonds in 2012, which had almost no impact on cash flow.
Shelf Registration.
On December 13, 2013, we filed a $200.0 million shelf registration statement on Form S-3 with the SEC covering our common stock, unsecured debt securities, preference stock, and first mortgage bonds. This shelf registration statement will be effective for a three-year period beginning with the date of filing. We plan to use the proceeds under this shelf to fund capital expenditures, refinance existing debt or general corporate needs during the effective period. The issuance of securities under this shelf is subject to the receipt of state regulatory approvals. We have filed applications for such approvals in all four state jurisdictions in our electric service territory.
Credit Agreements.
On January 17, 2012, we entered into the Third Amended and Restated Unsecured Credit Agreement which amended and restated our Second Amended and Restated Unsecured Credit Agreement dated January 26, 2010. This agreement extended the termination date of the revolving credit facility from January 26, 2013 to January 17, 2017. The agreement also removed the letter of credit facility and includes a swingline loan facility with a $15 million swingline loan sublimit. The aggregate amount of the revolving credit commitments remains $150 million, inclusive of the $15 million swingline loan sublimit. There were no outstanding borrowings under this agreement at December 31, 2013. However $4.0 million was used to back up our outstanding commercial paper. See Note 7 of “Notes to Consolidated Financial Statements” under Item 8 for additional information regarding this amendment and our unsecured line of credit.
EDE Mortgage Indenture.
The principal amount of all series of first mortgage bonds outstanding at any one time under the EDE Mortgage is limited by terms of the mortgage to $1.0 billion. Substantially all of the property, plant and equipment of The Empire District Electric Company (but not its subsidiaries) is subject to the lien of the EDE Mortgage. Restrictions in the EDE mortgage bond indenture could affect our liquidity. The EDE Mortgage contains a requirement that for new first mortgage bonds to be issued, our net earnings (as defined in the EDE Mortgage) for any twelve consecutive months within the fifteen months preceding issuance must be two times the annual interest requirements (as defined in the EDE Mortgage) on all first mortgage bonds then outstanding and on the prospective issue of new first mortgage bonds. Our earnings for the year ended December 31, 2013 would permit us to issue approximately $599.1 million of new first mortgage bonds based on this test with an assumed interest rate of 5.5%. In addition to the interest coverage requirement, the EDE Mortgage provides that new bonds must be issued against, among other things, retired bonds or 60% of net property additions. At December 31, 2013, we had retired bonds and net property additions which would enable the issuance of at least $856.7 million principal amount of bonds if the annual interest requirements are met. However, based on the $1 billion limit on the principal amount of first mortgage bonds outstanding set forth by the EDE mortgage, and our current level of outstanding first mortgage bonds, we are limited to the issuance of $417 million of new first mortgage bonds. As of December 31, 2013, we are in compliance with all restrictive covenants of the EDE Mortgage.
EDG Mortgage Indenture.
The principal amount of all series of first mortgage bonds outstanding at any one time under the EDG Mortgage is limited by terms of the mortgage to $300.0 million. Substantially all of the property, plant and equipment of The Empire District Gas Company is subject to the lien of the EDG Mortgage. The EDG Mortgage contains a requirement that for

34
new first mortgage bonds to be issued, the amount of such new first mortgage bonds shall not exceed 75% of the cost of property additions acquired after the date of the Missouri Gas acquisition. The mortgage also contains a limitation on the issuance by EDG of debt (including first mortgage bonds, but excluding short-term debt incurred in the ordinary course under working capital facilities) unless, after giving effect to such issuance, EDG’s ratio of EBITDA (defined as net income plus interest, taxes, depreciation, amortization and certain other non-cash charges) to interest charges for the most recent four fiscal quarters is at least 2.0 to 1.0. As of December 31, 2013, this test would allow us to issue approximately $15.8 million principal amount of new first mortgage bonds at an assumed interest rate of 5.5%.
Corporate credit ratings and the ratings for our securities are as follows:
Fitch Moody’s Standard & Poor’s Corporate Credit Rating n/r* Baa1 BBB EDE First Mortgage Bonds BBB+ A2 A- Senior Notes BBB Baa1 BBB Commercial Paper F3 P-2 A-2 Outlook Stable Stable Stable
*Not rated.
On January 30, 2014, Moody’s upgraded our corporate credit rating to Baa1 from Baa2, senior secured debt to A2 from A3, senior unsecured debt to Baa1 from Baa2 and affirmed our commercial paper rating at P-2. Moody’s outlook for Empire is stable. On March 6, 2013, Standard & Poor’s upgraded our corporate credit rating to BBB from BBB-, senior secured debt to A- from BBB+, senior unsecured debt to BBB from BBB- and our commercial paper rating to A-2 from A-3. Standard & Poor’s outlook for Empire is stable. On March 24, 2011, Fitch revised our commercial paper rating from F2 to F3 and reaffirmed our other ratings. The rating action was not based on a specific action or event on our part, but reflected their traditional linkage of long-term and short-term Issuer Default Ratings. On May 24, 2013, Fitch reaffirmed our ratings.
A security rating is not a recommendation to buy, sell or hold securities. Each rating is subject to revision or withdrawal at any time by the assigning rating organization. Each security rating agency has its own methodology for assigning ratings, and, accordingly, each rating should be considered independently of all other ratings. CONTRACTUAL OBLIGATIONS
Set forth below is information summarizing our contractual obligations as of December 31, 2013. Other pension and postretirement benefit plans are funded on an ongoing basis to match their corresponding costs, per regulatory requirements, and have been estimated for 2014-2018 as noted below.
Payments Due By Period (in millions)
Contractual Obligations
(1)
Total Less Than
1 Year
1-3 Years
3-5 Years More Than
5 Years
Long-term debt (w/o discount) $ 740.0 $ - $ 25.0 $ 90.0 $ 625.0 Interest on long-term debt 666.1 39.2 78.2 70.9 477.8 Short-term debt 4.0 4.0 - - - Capital lease obligations 6.4 0.6 1.1 1.1 3.6 Operating lease obligations
(2) 4.0 0.8 1.4 1.3 0.5 Electric purchase obligations
(3) 469.8 49.2 66.7 59.5 294.4 Gas purchase obligations
(4) 91.5 11.3 17.8 17.8 44.6 Open purchase orders 188.7 31.7 157.0 - - Postretirement benefit obligation funding 11.7 2.2 4.2 5.3 - Pension benefit funding 48.9 12.0 21.0 15.9 - Other long-term liabilities
(5) 3.1 0.1 0.3 0.3 2.4 TOTAL CONTRACTUAL OBLIGATIONS $ 2,234.2 $ 151.1 $ 372.7 $ 262.1 $ 1,448.3 (1)Some of our contractual obligations have price escalations based on economic indices, but we do not anticipate these escalations
to be significant. (2) Excludes payments under our Elk River Wind Farm, LLC and Cloud County Wind Farm, LLC agreements, as payments are contingent upon output of the facilities. Payments under the Elk River Wind Farm, LLC agreement can run from zero up to a
maximum of approximately $16.9 million per year based on a 20 year average cost and an annual output of 550,000 megawatt hours.
Payments under the Meridian Way Wind Farm agreement can range from zero to a maximum of approximately $14.6 million per year
based on a 20-year average cost. (3)Includes a water usage contract for our SLCC facility, fuel and purchased power contracts and associated transportation costs, as
well as purchased power for 2014 through 2039 for Plum Point. (4)Represents fuel contracts and associated transportation costs of our gas segment.

35
(5)Other long-term liabilities primarily represent electric facilities charges paid to City Utilities of Springfield, Missouri of $11,000 per
month over 30 years.
DIVIDENDS
Holders of our common stock are entitled to dividends if, as, and when declared by the Board of Directors, out of funds legally available therefore, subject to the prior rights of holders of any outstanding cumulative preferred stock and preference stock. Payment of dividends is determined by our Board of Directors after considering all relevant factors, including the amount of our retained earnings (which is essentially our accumulated net income less dividend payouts). A reduction of our dividend per share, partially or in whole, could have an adverse effect on our common stock price.
The following table shows our diluted earnings per share, dividends paid per share, total dividends paid and retained earnings balance for the years ended December 31, 2013, 2012 and 2011:
(in millions, except per share amounts) 2013 2012 2011 Diluted earnings per share $ 1.48 $ 1.32 $ 1.31 Dividends paid per share
(1) $ 1.005 $ 1.00 $ 0.64
Total dividends paid $ 43.0 $ 42.3 $ 26.7 Retained earnings year-end balance $ 67.6 $ 47.1 $ 33.7
(1) In response to the expected loss of revenues resulting from the May 22, 2011 tornado, our level of retained earnings and other
relevant factors, our Board of Directors suspended our quarterly dividend for the third and fourth quarters of 2011. On February 2, 2012, the Board of Directors re-established the dividend and declared a quarterly dividend of $0.25 per share on common stock payable on March 15, 2012 to holders of record as of March 1, 2012.
Under Kansas corporate law, our Board of Directors may only declare and pay dividends out of our surplus or, if there is no surplus, out of our net profits for the fiscal year in which the dividend is declared or the preceding fiscal year, or both. Our surplus, under Kansas law, is equal to our retained earnings plus accumulated other comprehensive income/(loss), net of income tax. However, Kansas law does permit, under certain circumstances, our Board of Directors to transfer amounts from capital in excess of par value to surplus. In addition, Section 305(a) of the Federal Power Act (FPA) prohibits the payment by a utility of dividends from any funds "properly included in capital account". There are no additional rules or regulations issued by the FERC under the FPA clarifying the meaning of this limitation. However, several decisions by the FERC on specific dividend proposals suggest that any determination would be based on a fact-intensive analysis of the specific facts and circumstances surrounding the utility and the dividend in question, with particular focus on the impact of the proposed dividend on the liquidity and financial condition of the utility.
In addition, the EDE Mortgage and our Restated Articles contain certain dividend restrictions. The most restrictive of these is contained in the EDE Mortgage, which provides that we may not declare or pay any dividends (other than dividends payable in shares of our common stock) or make any other distribution on, or purchase (other than with the proceeds of additional common stock financing) any shares of, our common stock if the cumulative aggregate amount thereof after August 31, 1944 (exclusive of the first quarterly dividend of $98,000 paid after said date) would exceed the sum of $10.75 million and the earned surplus (as defined in the EDE Mortgage) accumulated subsequent to August 31, 1944, or the date of succession in the event that another corporation succeeds to our rights and liabilities by a merger or consolidation. On June 9, 2011, we amended the EDE Mortgage in order to provide us with additional flexibility to pay dividends to our shareholders by permitting the payment of any dividend or distribution on, or purchase of, shares of its common stock within 60 days after the related date of declaration or notice of such dividend, distribution or purchase if (i) on the date of declaration or notice, such dividend, distribution or purchase would have complied with the provisions of the EDE Mortgage and (ii) as of the last day of the calendar month ended immediately preceding the date of such payment, our ratio of total indebtedness to total capitalization (after giving pro forma effect to the payment of such dividend, distribution, or purchase) was not more than 0.625 to 1.
OFF-BALANCE SHEET ARRANGEMENTS
We have no off-balance sheet arrangements that have or are reasonably likely to have a current or future effect on our financial condition, changes in financial condition, revenues or expenses, results of operations, liquidity, capital expenditures or capital resources, other than operating leases entered into in the normal course of business. CRITICAL ACCOUNTING POLICIES
Set forth below are certain accounting policies that are considered by management to be critical and that typically require difficult, subjective or complex judgments, often as a result of the need to make estimates about the effect of matters that are inherently uncertain (other accounting policies may also require assumptions that could cause actual results to be different than anticipated results). A change in assumptions or judgments applied in determining the following matters, among others, could have a material impact on future financial results.
36
Pensions and Other Postretirement Benefits (OPEB). We recognize expense related to pension and other postretirement benefits as earned during the employee’s period of service. Related assets and liabilities are established based upon the funded status of the plan compared to the accumulated benefit obligation. Our pension and OPEB expense or benefit includes amortization of previously unrecognized net gains or losses. Additional income or expense may be recognized when our unrecognized gains or losses as of the most recent measurement date exceed 10% of our postretirement benefit obligation or fair value of plan assets, whichever is greater. For pension benefits and OPEB benefits, unrecognized net gains or losses as of the measurement date are amortized into actuarial expense over ten years.
We have electric rate orders in Missouri, Kansas and Oklahoma that allow us to recover pension and OPEB costs consistent with our GAAP policy noted above. In accordance with the rate orders, we prospectively calculate the value of plan assets using a market related value method as allowed by the Accounting Standard Codification (ASC) guidance on defined benefit plans disclosure. In addition, our rate orders allow us to defer any pension and OPEB costs that are different from those allowed recovery in rate cases.
In our agreement with the MPSC regarding the purchase of Missouri Gas by EDG, we were allowed to adopt this pension cost recovery methodology for EDG, as well. Also, it was agreed that the effects of purchase accounting entries related to pension and other post-retirement benefits would be recoverable in future rate proceedings. Thus the fair value adjustment acquisition entries have been recorded as regulatory assets, as these amounts are probable of recovery in future rates. The regulatory asset is reduced by an amount equal to the difference between the regulatory costs and the estimated GAAP costs. The difference between this total and the costs being recovered from customers is deferred as a regulatory asset or liability in accordance with the ASC guidance on regulated operations, and recovered over a period of 5 years.
We expect future pension expense or benefits are probable of full recovery in our rates, thus lowering our sensitivity to accounting risks and uncertainties.
Based on the regulatory treatment of pension and OPEB recovery afforded in our jurisdictions, we record the amount of unfunded defined benefit pension and postretirement plan obligation as regulatory assets on our balance sheet rather than as reductions of equity through comprehensive income.
Our funding policy is to contribute annually an amount at least equal to the actuarial cost of postretirement benefits. The actual minimum pension funding requirements will be determined based on the results of the actuarial valuations and the performance of our pension assets during the current year. See Note 8 of “Notes to Consolidated Financial Statements” under Item 8.
Risks and uncertainties affecting the application of our pension accounting policy include: future rate of return on plan assets, interest rates used in valuing benefit obligations (i.e. discount rates), demographic assumptions (i.e. mortality and retirement rates) and employee compensation trend rates. Factors that could result in additional pension expense and/or funding include: a lower discount rate than estimated, higher compensation rate increases, lower return on plan assets, and longer retirement periods.
Risks and uncertainties affecting the application of our OPEB accounting policy and related funding include: future rate of return on plan assets, interest rates used in valuing benefit obligations (i.e. discount rates), healthcare cost trend rates, Medicare prescription drug costs and demographic assumptions (i.e. mortality and retirement rates). See Note 1 and Note 8 of “Notes to Consolidated Financial Statements” under Item 8 for further information.
Regulatory Assets and Liabilities. In accordance with the ASC accounting guidance for regulated activities, our financial statements reflect ratemaking policies prescribed by the regulatory commissions having jurisdiction over us (Missouri, Kansas, Arkansas, Oklahoma and FERC).
In accordance with accounting guidance for regulated activities, we record a regulatory asset for all or part of an incurred cost that would otherwise be charged to expense in accordance with the accounting guidance, which requires that an asset be recorded if it is probable that future revenue in an amount at least equal to the capitalized cost will be allowable for costs for rate making purposes and the current available evidence indicates that future revenue will be provided to permit recovery of the cost. Additionally, we follow the accounting guidance for regulated activities which says that a liability should be recorded when a regulator has provided current recovery for a cost that is expected to be incurred in the future. We follow this guidance for incurred costs or credits that are subject to future recovery from or refund to our customers in accordance with the orders of our regulators.
37
Historically, all costs of this nature, which are determined by our regulators to have been prudently incurred, have been recoverable through rates in the course of normal ratemaking procedures. Regulatory assets and liabilities are ratably eliminated through a charge or credit, respectively, to earnings while being recovered in revenues and fully recognized if and when it is no longer probable that such amounts will be recovered through future revenues. We continually assess the recoverability of our regulatory assets. Although we believe it unlikely, should retail electric competition legislation be passed in the states we serve, we may determine that we no longer meet the criteria set forth in the ASC accounting guidance for regulated activities with respect to continued recognition of some or all of the regulatory assets and liabilities. Any regulatory changes that would require us to discontinue application of ASC accounting guidance for regulated activities based upon competitive or other events may also impact the valuation of certain utility plant investments. Impairment of regulatory assets or utility plant investments could have a material adverse effect on our financial condition and results of operations.
As of December 31, 2013, we have recorded $177.1 million in regulatory assets and $137.7 million as regulatory liabilities. See Note 3 of “Notes to Consolidated Financial Statements” under Item 8 for detailed information regarding our regulatory assets and liabilities.
Risks and uncertainties affecting the application of this accounting policy include: regulatory environment, external regulatory decisions and requirements, anticipated future regulatory decisions and their impact of deregulation and competition on ratemaking process, unexpected disallowances, possible changes in accounting standards (including as a result of adoption of IFRS) and the ability to recover costs.
Fuel Adjustment Clause. Typical fuel adjustment clauses permit the distribution to customers of changes in fuel costs, subject to routine regulatory review, without the need for a general rate proceeding. Fuel adjustment clauses are presently applicable to our retail electric sales in Missouri, Oklahoma and Kansas and system wholesale kilowatt-hour sales under FERC jurisdiction. We have an Energy Cost Recovery Rider in Arkansas that adjusts for changing fuel and purchased power costs on an annual basis.
The MPSC established a base cost in rates for the recovery of fuel and purchased power expenses used to supply energy. The fuel adjustment clause permits the distribution to our Missouri customers of 95% of the changes in fuel and purchased power costs prudently incurred above or below the base cost. Off-system sales margins are also part of the recovery of fuel and purchased power costs. As a result, nearly all of the off-system sales margin flows back to the customer.
Unbilled Revenue. At the end of each period we estimate, based on expected usage, the amount of revenue to record for energy and natural gas that has been provided to customers but not billed. Risks and uncertainties affecting the application of this accounting policy include: projecting customer energy usage, estimating the impact of weather and other factors that affect usage (such as line losses) for the unbilled period and estimating loss of energy during transmission and delivery. Assumptions such as electrical load requirements, customer billing rates, and line loss factors are used in the estimation process and are evaluated periodically. Changes to certain assumptions during the evaluation process can lead to a change in the estimate.
Contingent Liabilities. We are a party to various claims and legal proceedings arising in the ordinary course of our business, which are primarily related to workers’ compensation and public liability. We regularly assess our insurance deductibles, analyze litigation information with our attorneys and evaluate our loss experience. Based on our evaluation as of the end of 2013, we believe that we have accrued liabilities in accordance with ASC accounting guidance sufficient to meet potential liabilities that could result from these claims. This liability at December 31, 2013 and 2012 was $4.0 million and $4.2 million, respectively.
Risks and uncertainties affecting these assumptions include: changes in estimates on potential outcomes of litigation and potential litigation yet unidentified in which we might be named as a defendant.
Goodwill. As of December 31, 2013, the consolidated balance sheet included $39.5 million of goodwill. All of this goodwill was derived from our gas acquisition and recorded in our gas segment, which is also the reporting unit for goodwill testing purposes. Accounting guidance requires us to test goodwill for impairment on an annual basis or whenever events or circumstances indicate possible impairment. Absent an indication of fair value from a potential buyer or a similar specific transaction, a combination of the market and income approaches is used to estimate the fair value of goodwill.
We use the market approach which estimates fair value of the gas reporting unit by comparing certain financial metrics to comparable companies. Comparable companies whose securities are actively traded in the public market are judgmentally selected by management based on operational and economic similarities. We utilize EBITDA (earnings
38
before interest, taxes, depreciation, and amortization) multiples of the comparable companies in relation to the EBITDA results of the gas reporting unit to determine an estimate of fair value.
We also utilize a valuation technique under the income approach which estimates the discounted future cash flows of operations. Our procedures include developing a baseline test and performing sensitivity analysis to calculate a reasonable valuation range. The sensitivities are derived from altering those assumptions which are subjective in nature and inherent to a discounted cash flows calculation. Other qualitative factors and comparisons to industry peers are also used to further support the assumptions and ultimately the overall evaluation. A key qualitative assumption considered in our evaluation is the impact of regulation, including rate regulation and cost recovery for the gas reporting unit. Some of the key quantitative assumptions included in our tests involve: regulatory rate design and results; the discount rate; the growth rate; capital spending rates and terminal value calculations. If negative changes occurred to one or more key assumptions, an impairment charge could result. With the exception of the capital spending rate, the key assumptions noted are significantly determined by market factors and significant changes in market factors that impact the gas reporting unit would somewhat be mitigated by our current and future regulatory rate design to some extent. Other risks and uncertainties affecting these assumptions include: changes in business, industry, laws, technology and economic conditions. Actual results for the gas reporting unit indicate a slight decline in gas customer count and demand. A continued decline in customer count or demand coupled with an increase in the discount rate would have adverse impacts on the valuation and could result in an impairment charge in the future. Our forecasts anticipate flat customer counts over the next several years.
We weight the results of the two approaches discussed above in order to estimate the fair value of the gas reporting unit. Our annual test performed as of October 2013 indicated the estimated fair market value of the gas reporting unit to be $10-14 million higher than its carrying value at that time. While we believe the assumptions utilized in our analysis were reasonable, adverse developments in future periods could negatively impact goodwill impairment considerations, which could adversely impact earnings. Specifically, the quantitative assumptions noted previously, such as an increase to the discount rate or decline in the terminal value calculation could lead to an impairment charge in the future.
Use of Management’s Estimates. The preparation of our consolidated financial statements in conformity with generally accepted accounting principles (GAAP) requires management to make estimates and assumptions that affect the reported amounts of assets, liabilities, revenues and expenses, and related disclosure of contingent assets and liabilities at the date of the financial statements and the reported amounts of revenues and expenses during the reporting period. We evaluate our estimates on an on-going basis, including those related to unbilled utility revenues, collectibility of accounts receivable, depreciable lives, asset impairment and goodwill evaluations, employee benefit obligations, contingent liabilities, asset retirement obligations, the fair value of stock based compensation and tax provisions. Actual amounts could differ from those estimates.
RECENTLY ISSUED ACCOUNTING STANDARDS
See Note 1 of “Notes to Consolidated Financial Statements” under Item 8 for further information regarding Recently Issued and Proposed Accounting Standards.
ITEM 7A. QUANTITATIVE AND QUALITATIVE DISCLOSURES ABOUT MARKET RISK
Our fuel procurement activities involve primary market risk exposures, including commodity price risk and credit risk. Commodity price risk is the potential adverse price impact related to the fuel procurement for our generating units. Credit risk is the potential adverse financial impact resulting from non-performance by a counterparty of its contractual obligations. Additionally, we are exposed to interest rate risk which is the potential adverse financial impact related to changes in interest rates.
Market Risk and Hedging Activities. Prices in the wholesale power markets can be extremely volatile. This volatility impacts our cost of power purchased and our participation in energy trades. If we were unable to generate an adequate supply of electricity for our customers, we would attempt to purchase power from others. Such supplies are not always available. In addition, congestion on the transmission system can limit our ability to make purchases from (or sell into) the wholesale markets.
We engage in physical and financial trading activities with the goals of reducing risk from market fluctuations. In accordance with our established Energy Risk Management Policy, which typically includes entering into various derivative transactions, we attempt to mitigate our commodity market risk. Derivatives are utilized to manage our gas commodity market risk. We also acquire Transmission Congestion Rights (TCR) in an attempt to lessen the cost of power we will purchase from the SPP Integrated Market due to congestion costs. See Note 14 of “Notes to Consolidated Financial Statements” under Item 8 for further information.
39
Commodity Price Risk. We are exposed to the impact of market fluctuations in the price and transportation costs of coal, natural gas, and electricity and employ established policies and procedures to manage the risks associated with these market fluctuations, including utilizing derivatives.
We satisfied 65.8% of our 2013 generation fuel supply need through coal. Approximately 96% of our 2013 coal supply was Western coal. We have contracts and binding proposals to supply a portion of the fuel for our coal plants through 2016. These contracts satisfy approximately 97% of our anticipated fuel requirements for 2014, 39% for 2015 and 19% for 2016 for our Asbury coal plants. In order to manage our exposure to fuel prices, future coal supplies will be acquired using a combination of short-term and long-term contracts.
We are exposed to changes in market prices for natural gas we must purchase to run our combustion turbine generators. Our natural gas procurement program is designed to manage our costs to avoid volatile natural gas prices. We enter into physical forward and financial derivative contracts with counterparties relating to our future natural gas requirements that lock in prices (with respect to predetermined percentages of our expected future natural gas needs) in an attempt to lessen the volatility in our fuel expenditures and improve predictability. As of December 31, 2013, 61%, or 6.2 million Dths’s, of our anticipated volume of natural gas usage for our electric operations for 2014 is hedged. See Note 14 of “Notes to Consolidated Financial Statements” under Item 8 for further information.
Based on our expected natural gas purchases for our electric operations for 2014, if average natural gas prices should increase 10% more in 2014 than the price at December 31, 2013, our natural gas expenditures would increase by approximately $1.3 million based on our December 31, 2013 total hedged positions for the next twelve months. However, such an increase would be probable of recovery through fuel adjustment mechanisms in all of our jurisdictions, which significantly reduces the impact of fluctuating fuel costs.
We attempt to mitigate a portion of our natural gas price risk associated with our gas segment using physical forward purchase agreements, storage and derivative contracts. As of December 31, 2013, we have 0.9 million Dths in storage on the three pipelines that serve our customers. This represents 47% of our storage capacity. We have an additional 0.2 million Dths hedged through financial derivatives and physical contracts.
See Note 14 of “Notes to Consolidated Financial Statements” under Item 8 for further information.
Credit Risk. In order to minimize overall credit risk, we maintain credit policies, including the evaluation of counterparty financial condition and the use of standardized agreements that facilitate the netting of cash flows associated with a single counterparty. See Note 14 of “Notes to Consolidated Financial Statements” under Item 8 regarding agreements containing credit risk contingent features. In addition, certain counterparties make available collateral in the form of cash held as margin deposits as a result of exceeding agreed-upon credit exposure thresholds or may be required to prepay the transaction. Conversely, we are required to post collateral with counterparties at certain thresholds, which is typically the result of changes in commodity prices. Amounts reported as margin deposit liabilities represent counterparty funds we hold that result from various trading counterparties exceeding agreed-upon credit exposure thresholds. Amounts reported as margin deposit assets represent our funds held on deposit for our NYMEX contracts with our broker and other financial contracts with other counterparties that resulted from us exceeding agreed-upon credit limits established by the counterparties. The following table depicts our margin deposit assets at December 31, 2013 and December 31, 2012. There were no margin deposit liabilities at these dates.
2013 2012 (in millions) Margin deposit assets $ 5.2 $ 4.2
Our exposure to credit risk is concentrated primarily within our fuel procurement process, as we transact with a smaller, less diverse group of counterparties and transactions may involve large notional volumes and potentially volatile commodity prices. Below is a table showing our net credit exposure at December 31, 2013, reflecting that our counterparties are exposed to Empire for the net unrealized mark-to-market losses for physical forward and financial natural gas contracts carried at fair value.
(in millions)
Net unrealized mark-to-market losses for physical forward natural gas contracts $ 0.5 Net unrealized mark-to-market losses for financial natural gas contracts 4.5 Net credit exposure $ 5.0
The $4.5 million net unrealized mark-to-market loss for financial natural gas contracts is comprised entirely of $4.5 million that our counterparties are exposed to Empire for unrealized losses. We are holding no collateral from any counterparty since we are below the $10 million mark-to-market collateral threshold in our agreements. As noted above,

40
as of December 31, 2013, we have $5.2 million on deposit for NYMEX contract exposure to Empire, of which $4.5 million represents our collateral requirement. If NYMEX gas prices decreased 25% from their December 31,
2013 levels,
our collateral requirement would increase $8.9 million. If these prices increased 25%, our collateral requirement would decrease $3.4 million. Our other counterparties would not be required to post collateral with Empire.
We sell electricity and gas and provide distribution and transmission services to a diverse group of customers, including residential, commercial and industrial customers. Credit risk associated with trade accounts receivable from energy customers is limited due to the large number of customers. In addition, we enter into contracts with various companies in the energy industry for purchases of energy-related commodities, including natural gas in our fuel procurement process.
Interest Rate Risk. We are exposed to changes in interest rates as a result of financing through our issuance of commercial paper and other short-term debt. We manage our interest rate exposure by limiting our variable-rate exposure (applicable to commercial paper and borrowings under our unsecured credit agreement) to a certain percentage of total capitalization, as set by policy, and by monitoring the effects of market changes in interest rates. See Notes 6 and 7 of “Notes to Consolidated Financial Statements” under Item 8 for further information.
If market interest rates average 1% more in 2014 than in 2013, our interest expense would increase, and income before taxes would decrease by less than $0.3 million. This amount has been determined by considering the impact of the hypothetical interest rates on our highest month-end commercial paper balance for 2013. These analyses do not consider the effects of the reduced level of overall economic activity that could exist in such an environment. In the event of a significant change in interest rates, management would likely take actions to further mitigate its exposure to the change. However, due to the uncertainty of the specific actions that would be taken and their possible effects, the sensitivity analysis assumes no changes in our financial structure.
41
ITEM 8. FINANCIAL STATEMENTS AND SUPPLEMENTARY DATA
REPORT OF INDEPENDENT REGISTERED PUBLIC ACCOUNTING FIRM To the Board of Directors and Stockholders of the Empire District Electric Company:
In our opinion, the consolidated financial statements listed in the index appearing under Item 15 present fairly, in all material respects, the financial position of The Empire District Electric Company and its subsidiaries at December 31, 2013 and 2012, and the results of their operations and their cash flows for each of the three years in the period ended December 31, 2013 in conformity with accounting principles generally accepted in the United States of America. In addition, in our opinion, the financial statement schedule listed in the index appearing under Item 15
presents fairly, in all
material respects, the information set forth therein when read in conjunction with the related consolidated financial statements. Also in our opinion, the Company maintained, in all material respects, effective internal control over financial reporting as of December 31, 2013, based on criteria established in Internal Control - Integrated Framework (1992) issued by the Committee of Sponsoring Organizations of the Treadway Commission (COSO). The Company's management is responsible for these financial statements and financial statement schedule, for maintaining effective internal control over financial reporting and for its assessment of the effectiveness of internal control over financial reporting, included in the accompanying Management's Report on Internal Control Over Financial Reporting. Our responsibility is to express opinions on these financial statements, on the financial statement schedule, and on the Company's internal control over financial reporting based on our integrated audits. We conducted our audits in accordance with the standards of the Public Company Accounting Oversight Board (United States). Those standards require that we plan and perform the audits to obtain reasonable assurance about whether the financial statements are free of material misstatement and whether effective internal control over financial reporting was maintained in all material respects. Our audits of the financial statements included examining, on a test basis, evidence supporting the amounts and disclosures in the financial statements, assessing the accounting principles used and significant estimates made by management, and evaluating the overall financial statement presentation. Our audit of internal control over financial reporting included obtaining an understanding of internal control over financial reporting, assessing the risk that a material weakness exists, and testing and evaluating the design and operating effectiveness of internal control based on the assessed risk. Our audits also included performing such other procedures as we considered necessary in the circumstances. We believe that our audits provide a reasonable basis for our opinions.
A company’s internal control over financial reporting is a process designed to provide reasonable assurance regarding the reliability of financial reporting and the preparation of financial statements for external purposes in accordance with generally accepted accounting principles. A company’s internal control over financial reporting includes those policies and procedures that (i) pertain to the maintenance of records that, in reasonable detail, accurately and fairly reflect the transactions and dispositions of the assets of the company; (ii) provide reasonable assurance that transactions are recorded as necessary to permit preparation of financial statements in accordance with generally accepted accounting principles, and that receipts and expenditures of the company are being made only in accordance with authorizations of management and directors of the company; and (iii) provide reasonable assurance regarding prevention or timely detection of unauthorized acquisition, use, or disposition of the company’s assets that could have a material effect on the financial statements.
Because of its inherent limitations, internal control over financial reporting may not prevent or detect misstatements. Also, projections of any evaluation of effectiveness to future periods are subject to the risk that controls may become inadequate because of changes in conditions, or that the degree of compliance with the policies or procedures may deteriorate.
PricewaterhouseCoopers LLP St. Louis, Missouri February 21, 2014

THE EMPIRE DISTRICT ELECTRIC COMPANY Consolidated Balance Sheets
42
December 31, 2013 2012 ($-000’s) Assets Plant and property, at original cost: Electric and water $ 2,219,605 $ 2,176,188 Natural gas 72,834 69,851 Other 39,902 37,983 Construction work in progress 152,330 56,347 2,484,671 2,340,369 Accumulated depreciation and amortization 732,737 682,737 1,751,934 1,657,632 Current assets: Cash and cash equivalents 3,475 3,375 Restricted cash 2,872 4,357 Accounts receivable – trade, net of allowance of $1,025 and $1,388, respectively 50,137 38,874 Accrued unbilled revenues 26,694 23,254 Accounts receivable – other 13,101 13,277 Fuel, materials and supplies 48,811 61,870 Prepaid expenses and other 15,954 21,806 Unrealized gain in fair value of derivative contracts 2,469 96 Regulatory assets 7,743 6,377 171,256 173,286 Noncurrent assets and deferred charges: Regulatory assets 169,333 243,958 Goodwill 39,492 39,492 Unamortized debt issuance costs 8,826 7,606 Unrealized gain in fair value of derivative contracts 41 191 Other 4,163 4,204 221,855 295,451 Total assets $ 2,145,045 $ 2,126,369
(Continued)
The accompanying notes are an integral part of these consolidated financial statements.

THE EMPIRE DISTRICT ELECTRIC COMPANY Consolidated Balance Sheets
43
December 31, 2013 2012 ($-000’s) Capitalization and liabilities Common stock, $1 par value, 100,000,000 shares authorized, 43,044,185 and 42,484,363 shares issued and outstanding, respectively
$ 43,044
$ 42,484
Capital in excess of par value 639,525 628,199 Retained earnings 67,554 47,115 Total common stockholders’ equity 750,123 717,798 Long-term debt (net of current portion) Obligations under capital lease 4,167 4,441 First mortgage bonds and secured debt 637,578 487,541 Unsecured debt 101,683 199,644 Total long-term debt 743,428 691,626 Total long-term debt and common stockholders’ equity 1,493,551 1,409,424 Current liabilities: Accounts payable and accrued liabilities 71,375 66,559 Current maturities of long-term debt 274 714 Short-term debt 4,000 24,000 Regulatory liabilities 5,681 6,303 Customer deposits 12,543 12,001 Interest accrued 6,352 5,902 Unrealized loss in fair value of derivative contracts 1,889 3,403 Taxes accrued 3,386 2,992 Other current liabilities 299 - 105,799 121,874 Commitments and contingencies (Note 11) Noncurrent liabilities and deferred credits: Regulatory liabilities 132,012 131,055 Deferred income taxes 324,266 301,967 Unamortized investment tax credits 18,431 18,897 Pension and other postretirement benefit obligations 51,405 120,808 Unrealized loss in fair value of derivative contracts 2,799 3,819 Other 16,782 18,525 545,695 595,071 Total capitalization and liabilities $ 2,145,045 $ 2,126,369
The accompanying notes are an integral part of these consolidated financial statements.
THE EMPIRE DISTRICT ELECTRIC COMPANY Consolidated Statements of Income
44
Year Ended December 31, 2013 2012 2011 (000’s, except per share amounts) Operating revenues: Electric $ 536,413 $ 510,653 $ 524,275 Gas 50,041 39,849 46,430 Other 7,876 6,595 6,165 594,330 557,097 576,870 Operating revenue deductions: Fuel and purchased power 175,406 178,896 200,256 Cost of natural gas sold and transported 25,795 18,633 22,760 Regulated operating expenses 105,333 94,371 85,442 Other operating expenses 3,142 2,730 2,098 Maintenance and repairs 40,873 40,444 41,041 Loss on plant disallowance 2,409 - 150 Depreciation and amortization 69,306 60,447 63,537 Provision for income taxes 37,465 34,096 34,071 Other taxes 34,938 31,259 30,581 494,667 460,876 479,936 Operating income 99,663 96,221 96,934 Other income and (deductions): Allowance for equity funds used during construction 3,853 1,147 294 Interest income 566 972 555 Provision for other income taxes (27) (63) (227) Other – non-operating expense, net (1,218) (1,910) (1,283) 3,174 146 (661) Interest charges: Long-term debt 40,354 40,192 42,581 Short-term debt 60 187 86 Allowance for borrowed funds used during construction (2,087) (781) (218) Other 1,065 1,088 (1,147) 39,392 40,686 41,302 Net income $ 63,445 $ 55,681 $ 54,971
Weighted average number of common shares outstanding - basic 42,781 42,257 41,852 Weighted average number of common shares outstanding - diluted 42,803 42,284 41,887 Total earnings per weighted average share of common stock – basic and diluted $ 1.48 $ 1.32 $ 1.31
Dividends declared per share of common stock $ 1.005 $ 1.000 $ 0.640
The accompanying notes are an integral part of these consolidated financial statements.

THE EMPIRE DISTRICT ELECTRIC COMPANY Consolidated Statements of Common Stockholders’ Equity
45
Common Stock
Capital in
excess of Par
Retained earnings Total
($-000’s) Balance at December 31, 2010 $ 41,577 $ 610,579 $ 5,468 $ 657,624 Net income 54,971 54,971 Stock/stock units issued through: Public offering Stock purchase and reinvestment plans 401 7,725 8,126 Dividends declared (26,732) (26,732) Balance at December 31, 2011 41,978 618,304 33,707 693,989 Net income 55,681 55,681 Stock/stock units issued through: Public offering Stock purchase and reinvestment plans 506 9,895 10,401 Dividends declared (42,273) (42,273) Balance at December 31, 2012 42,484 628,199 47,115 717,798 Net income 63,445 63,445 Stock/stock units issued through: Public offering Stock purchase and reinvestment plans 560 11,326 11,886 Dividends declared (43,006) (43,006) Balance at December 31, 2013 $ 43,044 $ 639,525 $ 67,554 $ 750,123
The accompanying notes are an integral part of these consolidated financial statements.
THE EMPIRE DISTRICT ELECTRIC COMPANY Consolidated Statements of Cash Flows
46
Year Ended December 31, 2013 2012 2011 ($-000’s) Operating activities: Net income $ 63,445 $ 55,681 $ 54,971 Adjustments to reconcile net income to cash flows from operating activities:
Depreciation and amortization including regulatory items 71,734 71,160 79,751 Pension and other postretirement benefit costs, net of contributions (1,888) 1,689 (20,379) Deferred income taxes and unamortized investment tax credit, net 28,272 31,899 45,051 Allowance for equity funds used during construction (3,853) (1,147) (294) Stock compensation expense 2,984 2,285 2,147 Loss on plant disallowance 2,409 - - Non-cash loss on derivatives 14 4,174 1,187 Regulatory reversal of gain on sale of assets 1,236 - - Other - (16) 381 Cash flows impacted by changes in: Accounts receivable and accrued unbilled revenues (14,312) (688) 10,342 Fuel, materials and supplies 10,891 369 (16,682) Prepaid expenses, other current assets and deferred charges 689 (9,238) (23,163) Accounts payable and accrued liabilities (880) (1,297) (318) Asset retirement obligation (734) - - Interest, taxes accrued and customer deposits 1,386 875 (980) Other liabilities and other deferred credits (3,942) 3,360 3,172 Accumulated provision – rate refunds - - (578) Net cash provided by operating activities 157,451 159,106 134,608
(Continued)
The accompanying notes are an integral part of these consolidated financial statements.
THE EMPIRE DISTRICT ELECTRIC COMPANY Consolidated Statements of Cash Flows
47
Year Ended December 31, 2013 2012 2011 ($-000’s) Investing activities: Capital expenditures – regulated $ (152,524) $ (134,272) $ (99,162) Capital expenditures and other investments – non-regulated (2,259) (2,670) (3,375) Restricted cash 1,485 (1) (2,586) Total net cash used in investing activities (153,298) (136,943) (105,123) Financing activities: Proceeds from first mortgage bonds, net 150,000 88,000 - Long-term debt issuance costs (1,879) (1,074) - Proceeds from issuance of common stock, net of issuance costs 9,546 8,114 5,884 Repayment of first mortgage bonds - (88,029) - Redemption of senior notes (98,000) - - Net short-term borrowings (repayments) (20,000) 12,000 (12,000) Dividends (43,006) (42,273) (26,732) Other (714) (934) (1,754) Net cash used in financing activities (4,053) (24,196) (34,602) Net increase (decrease) in cash and cash equivalents 100 (2,033) (5,117) Cash and cash equivalents, beginning of year 3,375 5,408 10,525 Cash and cash equivalents, end of year $ 3,475 3,375 $ 5,408
2013 2012 2011 Supplemental cash flow information: Interest paid $ 39,033 $ 38,802 $ 41,088 Income taxes (refunded) paid, net of refund 10,584 (592) (14,300) Supplementary non-cash investing activities: Change in accrued additions to property, plant and equipment not reported above
$ 5,420
$ 9,345
$ (1,387)
Capital lease obligations for purchase of new equipment - - 29
The accompanying notes are an integral part of these consolidated financial statements.

THE EMPIRE DISTRICT ELECTRIC COMPANY Notes to Consolidated Financial Statements
48
1. SUMMARY OF SIGNIFICANT ACCOUNTING POLICIES
General
We operate our businesses as three segments: electric, gas and other. The Empire District Electric Company (EDE), a Kansas corporation organized in 1909, is an operating public utility engaged in the generation, purchase, transmission, distribution and sale of electricity in parts of Missouri, Kansas, Oklahoma and Arkansas. As part of our electric segment, we also provide water service to three towns in Missouri. The Empire District Gas Company (EDG) is our wholly owned subsidiary engaged in the distribution of natural gas in Missouri. Our other segment consists of our fiber optics business. See Note 12. Our gross operating revenues in 2013 were derived as follows: Electric segment sales* 90.3% Gas segment sales 8.4 Other segment sales 1.3 *Sales from our electric segment include 0.4% from the sale of water.
The utility portions of our business are subject to regulation by the Missouri Public Service Commission (MPSC), the State Corporation Commission of the State of Kansas (KCC), the Corporation Commission of Oklahoma (OCC), the Arkansas Public Service Commission (APSC) and the Federal Energy Regulatory Commission (FERC). Our accounting policies are in accordance with the ratemaking practices of the regulatory authorities and conform to generally accepted accounting principles as applied to regulated public utilities. Our electric operations serve approximately 168,800 customers as of December 31, 2013, and the 2013 electric operating revenues were derived as follows:
Customer % of revenue
Residential 42.6%
Commercial 30.4
Industrial 15.1
Wholesale on-system 3.7
Wholesale off-system 2.9
Miscellaneous sources, primarily public authorities 2.8
Other electric revenues 2.5
Our retail electric revenues for 2013 by jurisdiction were as follows:
Jurisdiction % of revenue
Missouri 89.8% Kansas 4.8 Arkansas 2.5 Oklahoma 2.9
Our gas operations serve approximately 44,000 customers as of December 31, 2013, and the 2013 gas operating revenues were derived as follows:
Customer % of revenue Residential 63.1% Commercial 27.3 Industrial 1.0 Other 8.6
Basis of Presentation
The consolidated financial statements include the accounts of EDE, EDG, and our other subsidiaries. The consolidated entity is referred to throughout as “we” or the “Company”. All intercompany balances and transactions have been eliminated in consolidation. See Note 12 for additional information regarding our three segments.

THE EMPIRE DISTRICT ELECTRIC COMPANY Notes to Consolidated Financial Statements
49
Use of Estimates
The preparation of financial statements in conformity with generally accepted accounting principles (GAAP) requires management to make estimates and assumptions that affect the reported amounts of assets and liabilities and disclosure of contingent assets and liabilities at the date of the financial statements. Estimates also affect the reported amounts of revenues and expenses during the period. Areas in the financial statements significantly affected by estimates and assumptions include unbilled utility revenues, collectibility of accounts receivable, depreciable lives, asset impairment and goodwill impairment evaluations, employee benefit obligations, contingent liabilities, asset retirement obligations, the fair value of stock based compensation, tax provisions and derivatives. Actual amounts could differ from those estimates.
Accounting for the Effects of Regulation
In accordance with the Accounting Standard Codification (ASC) guidance for regulated operations, our financial statements reflect ratemaking policies prescribed by the regulatory commissions having jurisdiction over our regulated generation and other utility operations (the MPSC, the KCC, the OCC, the APSC and the FERC). We record a regulatory asset for all or part of an incurred cost that would otherwise be charged to expense in accordance with the ASC guidance for regulated operations which say that an asset should be recorded if it is probable that future revenue in an amount at least equal to the capitalized cost will be allowable for costs for rate making purposes and the current available evidence indicates that future revenue will be provided to permit recovery of the cost. This guidance also indicates that a liability should be recorded when a regulator has provided current recovery for a cost that is expected to be incurred in the future. We follow this guidance for incurred costs or credits that are subject to future recovery from or refund to our customers in accordance with the orders of our regulators. Historically, all costs of this nature, which are determined by our regulators to have been prudently incurred, have been recoverable through rates in the course of normal ratemaking procedures. Regulatory assets and liabilities are ratably amortized through a charge or credit, respectively, to earnings while being recovered in revenues and fully recognized if and when it is no longer probable that such amounts will be recovered through future revenues. We continually assess the recoverability of our regulatory assets. Although we believe it unlikely, should retail electric competition legislation be passed in the states we serve, we may determine that we no longer meet the criteria set forth in the ASC guidance for regulated operations with respect to continued recognition of some or all of the regulatory assets and liabilities. Any regulatory changes that would require us to discontinue application of this guidance based upon competitive or other events may also impact the valuation of certain utility plant investments. Impairment of regulatory assets or utility plant investments could have a material adverse effect on our financial condition and results of operations. (See Note 3 for further discussion of regulatory assets and liabilities).
Revenue Recognition
For our utility operations, we use cycle billing and accrue estimated, but unbilled, revenue for services provided between the last bill date and the period end date. Unbilled revenues represent the estimate of receivables for energy and natural gas services delivered, but not yet billed to customers. The accuracy of our unbilled revenue estimate is affected by factors including fluctuations in energy demands, weather, line losses and changes in the composition of customer classes. During 2012, the Company recorded an increase in electric unbilled revenues as a result of certain changes to the assumptions used in determining estimated unbilled revenues.
Municipal Franchise Taxes
Municipal franchise taxes are collected for and remitted to their respective entities and are included in operating revenues and other taxes in the Consolidated Statements of Income. Municipal franchise taxes of $11.2 million, $10.4 million and $11.0 million were recorded for each of the years ended December 31, 2013, 2012 and 2011, respectively.
Accounts Receivable
Accounts receivable are recorded at the tariffed rates for customer usage, including applicable taxes and fees and do not bear interest. We review the outstanding accounts receivable monthly, as well as the bad debt write-offs
THE EMPIRE DISTRICT ELECTRIC COMPANY Notes to Consolidated Financial Statements
50
experienced in the past, and establish an allowance for doubtful accounts. Account balances are charged off against the allowance when management determines it is probable the receivable will not be recovered.
Property, Plant & Equipment
The costs of additions to utility property and replacements for retired property units are capitalized. Costs include labor, material, an allocation of general and administrative costs, and an allowance for funds used during construction (AFUDC). The original cost of units retired or disposed of and the costs of removal are charged to accumulated depreciation, unless the removed property constitutes an operating unit or system. In this case a gain or loss is recognized upon the disposal of the asset. Maintenance expenditures and the removal of minor property items are charged to income as incurred. A liability is created for any additions to electric or gas utility property that are paid for by advances from developers. For a period of five years the Company refunds, to the developer, a pro rata amount of the original cost of the extension for each new customer added to the extension. Nonrefundable payments at the end of the five year period are applied as a reduction to the cost of the plant in service. The liability as of December 31, 2013 and 2012 was $4.2 million and $5.2 million, respectively.
Depreciation
Provisions for depreciation are computed at straight-line rates in accordance with GAAP consistent with rates approved by regulatory authorities. These rates are applied to the various classes of utility assets on a composite basis. Provisions for depreciation for our other segment are computed at straight-line rates over the estimated useful life of the properties (See Note 2 for additional details regarding depreciation rates). As of December 31, 2013 and 2012, we had recorded accrued cost of removal of $81.3 million and $77.3 million, respectively, for our electric operating segment. This represents an estimated cost of dismantling and removing plant from service upon retirement, accrued as part of our depreciation rates. We accrue cost of removal in depreciation rates for mass property (including transmission, distribution and general plant assets). These accruals are not considered an asset retirement obligation under the guidance provided on asset retirement obligations within the ASC. We reclassify the accrued cost of dismantling and removing plant from service upon retirement from accumulated depreciation to a regulatory liability. We have a similar cost of removal regulatory liability for our gas operating segment. This amount at December 31, 2013 and 2012 was $7.2 million and $6.1 million, respectively. These amounts are net of our actual cost of removal expenditures.
Asset Retirement Obligation
We record the estimated fair value of legal obligations associated with the retirement of tangible long-lived assets in the period in which the liabilities are incurred and capitalize a corresponding amount as part of the book value of the related long-lived asset. In subsequent periods, we are required to adjust asset retirement obligations based on changes in estimated fair value, and the corresponding increases in asset book values are depreciated over the useful life of the related asset. Uncertainties as to the probability, timing or cash flows associated with an asset retirement obligation affect our estimate of fair value. We have identified asset retirement obligations associated with the future removal of certain river water intake structures and equipment at the Iatan Power Plant, in which we have a 12% ownership. We also have a solid waste land fill at the Plum Point Energy Station, and asset retirement obligations associated with the removal of asbestos located at the Riverton and Asbury Plants, and a liability for containment of the ash landfill at the Riverton Power Plant. As a result of the fuel use transition from coal to natural gas at the Riverton Power Plant, the closure of the Riverton ash landfill is underway (Note 11). In addition, we have a liability for the removal and disposal of Polychlorinated Biphenyls (PCB) contaminants associated with our transformers and substation equipment. These liabilities have been estimated based upon either third party costs or historical review of expenditures for the removal of similar past liabilities. The potential costs of these future expenditures are based on engineering estimates of third party costs to remove the assets in satisfaction of the associated obligations. This liability will be accreted over the period up to the estimated settlement date.

THE EMPIRE DISTRICT ELECTRIC COMPANY Notes to Consolidated Financial Statements
51
All of our recorded asset retirement obligations have been estimated as of the expected retirement date, or settlement date, and have been discounted using a credit adjusted risk-free rate ranging from 4.5% to 5.52% depending on the settlement date. Revisions to these liabilities could occur due to changes in the cost estimates, anticipated timing of settlement or federal or state regulatory requirements. During the 2012 year, the liabilities for both the ash landfill at the Riverton Power Plant, and PCB contaminants were re-evaluated. Changes in the cost estimates and timing resulted in cash flow revisions for these liabilities. The balances at the end of 2012 and 2013 are shown below.
(000’s)
Liability Balance 12/31/12
Liabilities Recognized
Liabilities Settled
Accretion
Cash Flow Revisions
Liability Balance at 12/31/13
Asset Retirement Obligation
$ 4,711 $ - $ (734) $ 213 $ - $ 4,190
(000’s)
Liability Balance 12/31/11
Liabilities Recognized
Liabilities Settled
Accretion
Cash Flow Revisions
Liability Balance at 12/31/12
Asset Retirement Obligation
$ 3,944 $ - $ - $ 252 $ 515 $ 4,711
Upon adoption of the standards on the retirement of long lived assets and conditional asset retirement obligations, we recorded a liability and regulatory asset because we expect to recover these costs of removal in electric and gas rates either through depreciation accruals or direct expenses. We also defer the liability accretion and depreciation expense as a regulatory asset. At December 31, 2013 and 2012, our regulatory assets relating to asset retirement obligations totaled $4.7 million and $4.4 million, respectively. Also as noted previously under property, plant and equipment, we reclassify the accrued cost of dismantling and removing plant from service upon retirement, which is not considered an asset retirement obligation under this guidance, from accumulated depreciation to a regulatory liability. This balance sheet reclassification has no impact on results of operations.
Allowance for Funds Used During Construction
As provided in the FERC regulatory Uniform System of Accounts, utility plant is recorded at original cost, including an allowance for funds used during construction (AFUDC) when first placed in service. The AFUDC is a utility industry accounting practice whereby the cost of borrowed funds and the cost of equity funds applicable to our construction program are capitalized as a cost of construction. This accounting practice offsets the effect on earnings of the cost of financing current construction, and treats such financing costs in the same manner as construction charges for labor and materials. AFUDC does not represent current cash income. Recognition of this item as a cost of utility plant is in accordance with regulatory rate practice under which such plant costs are permitted as a component of rate base and the provision for depreciation. In accordance with the methodology prescribed by the FERC, we utilized aggregate rates (on a before-tax basis) of 7.3% for 2013, 5.6% for 2012, and 5.2% for 2011, compounded semiannually.. The specific Iatan 2 AFUDC rate was a result of our Experimental Regulatory Plan approved by the MPSC on August 2, 2005, and it terminated on June 15, 2011. In this agreement, we were allowed to receive the regulatory amortization discussed above, in rates prior to the completion of Iatan 2. As a result, the equity portion of our AFUDC rate for the Iatan 2 project was reduced by 2.5 percentage points (See Note 3 for additional discussion of our regulatory plan).
THE EMPIRE DISTRICT ELECTRIC COMPANY Notes to Consolidated Financial Statements
52
Asset Impairments (excluding goodwill)
We review long-lived assets for impairment whenever events or changes in circumstances indicate that the carrying amount of an asset may not be recoverable. To the extent that certain assets may be impaired, analysis is performed based on undiscounted forecasted cash flows to assess the recoverability of the assets and, if necessary, the fair value is determined to measure the impairment amount. None of our assets were impaired as of December 31, 2013 and 2012.
Goodwill
As of December 31, 2013, the consolidated balance sheet included $39.5 million of goodwill. All of this goodwill was derived from our gas acquisition and recorded in our gas segment, which is also the reporting unit for goodwill testing purposes. Accounting guidance requires us to test goodwill for impairment on an annual basis or whenever events or circumstances indicate possible impairment. Absent an indication of fair value from a potential buyer or a similar specific transaction, a combination of the market and income approaches is used to estimate the fair value of goodwill. We use the market approach which estimates fair value of the gas reporting unit by comparing certain financial metrics to comparable companies. Comparable companies whose securities are actively traded in the public market are judgmentally selected by management based on operational and economic similarities. We utilize EBITDA (earnings before interest, taxes, depreciation, and amortization) multiples of the comparable companies in relation to the EBITDA results of the gas reporting unit to determine an estimate of fair value. We also utilize a valuation technique under the income approach which estimates the discounted future cash flows of operations. Our procedures include developing a baseline test and performing sensitivity analysis to calculate a reasonable valuation range. The sensitivities are derived from altering those assumptions which are subjective in nature and inherent to a discounted cash flows calculation. Other qualitative factors and comparisons to industry peers are also used to further support the assumptions and ultimately the overall evaluation. A key qualitative assumption considered in our evaluation is the impact of regulation, including rate regulation and cost recovery for the gas reporting unit. Some of the key quantitative assumptions included in our tests involve: regulatory rate design and results; the discount rate; the growth rate; capital spending rates and terminal value calculations. If negative changes occurred to one or more key assumptions, an impairment charge could result. With the exception of the capital spending rate, the key assumptions noted are significantly determined by market factors and significant changes in market factors that impact the gas reporting unit would somewhat be mitigated by our current and future regulatory rate design. Other risks and uncertainties affecting these assumptions include: changes in business, industry, laws, technology and economic conditions. Actual results for the gas reporting unit indicate a slight decline in gas customer count and demand. A continued decline in customer count or demand coupled with an increase in the discount rate would have adverse impacts on the valuation and could result in an impairment charge in the future. Our forecast anticipate flat customer counts over the next several years. We weight the results of the two approaches discussed above in order to estimate the fair value of the gas reporting unit. Our annual test performed as of October 2013 indicated the estimated fair market value of the gas reporting unit to be $10-14 million higher than its carrying value at that time. While we believe the assumptions utilized in our analysis were reasonable, adverse developments in future periods could negatively impact goodwill impairment considerations, which could adversely impact earnings. Specifically, the quantitative assumptions noted previously, such as an increase to the discount rate or decline in the terminal value calculation could lead to an impairment charge in the future.
Fuel and Purchased Power
Electric Segment
Fuel and purchased power costs are recorded at the time the fuel is used, or the power purchased. This amount is adjusted to reflect regulatory treatment for our Missouri and Kansas fuel adjustment mechanisms discussed below.

THE EMPIRE DISTRICT ELECTRIC COMPANY Notes to Consolidated Financial Statements
53
In our Missouri jurisdiction, the MPSC established a base cost for the recovery of fuel and purchased power expenses used to supply energy for our fuel adjustment clause (FAC). The FAC permits the distribution to customers of 95% of the changes in fuel and purchased power costs prudently incurred above or below the base cost. Off-system sales margins are also part of the recovery of fuel and purchased power costs. As a result, nearly the entire off-system sales margin flows back to the customer. Rates related to the fuel adjustment clause are modified twice a year subject to the review and approval by the MPSC. In accordance with the ASC guidance for regulated operations, 95% of the difference between the actual costs of fuel and purchased power and the base cost of fuel and purchased power recovered from our customers is recorded as an adjustment to fuel and purchased power expense with a corresponding regulatory asset or regulatory liability. If the actual fuel and purchased power costs are higher or lower than the base fuel and purchased power costs billed to customers, 95% of these amounts will be recovered or refunded to our customers when the fuel adjustment clause is modified. In our Kansas jurisdiction, the costs of fuel are recovered from customers through a fuel adjustment clause, based upon estimated fuel costs and purchased power. The adjustments are subject to audit and final determination by regulators. The difference between the costs of fuel used and the cost of fuel recovered from our Kansas customers is recorded as a regulatory asset or a regulatory liability if the actual costs are higher or lower than the costs billed to customers, in accordance with the ASC guidance for regulated operations. Similar fuel recovery mechanisms are in place for our Oklahoma, Arkansas and FERC jurisdictions. At December 31, 2013 and 2012, our Missouri, Kansas and Oklahoma fuel and purchased power costs were in a net over-recovered position by $0.6 million and $4.0 million, respectively, which are reflected in our regulatory assets and liabilities. We receive the renewable attributes associated with the power purchased through our purchased power agreements with Elk River Windfarm LLC and Cloud County Windfarm, LLC. These renewable attributes are converted into renewable energy credits, which are considered inventory, and recorded at zero cost (See Note 11). Revenue from the sale of renewable energy credits reduces fuel and purchased power expense. We have a Stipulation and Agreement with the MPSC granting us authority to manage our SO2 allowance inventory in accordance with our SO2 Allowance Management Policy (SAMP). The SAMP allows us to exchange banked allowances for future vintage allowances and/or monetary value and, in extreme market conditions, to sell SO2 allowances outright for monetary value. We have not yet exchanged or sold any allowances. We classify our allowances as inventory and they are recorded at cost, with allocated allowances being recorded at zero cost. The allowances are removed from inventory on a FIFO basis, and used allowances are considered to be a part of fuel expense (See Note 11). We had 1,834 and 5,187 SO2 allowances in inventory at December 31, 2013 and 2012, respectively. .
Gas Segment
Fuel expense for our gas segment is recognized when the natural gas is delivered to our customers, based on the current cost recovery allowed in rates. A Purchased Gas Adjustment (PGA) clause allows EDG to recover from our customers, subject to audit and final determination by regulators, the cost of purchased gas supplies and related carrying costs associated with the Company’s use of natural gas financial instruments to hedge the purchase price of natural gas. This PGA clause allows us to make rate changes periodically (up to four times) throughout the year in response to weather conditions and supply demands, rather than in one possibly extreme change per year. We calculate the PGA factor based on our best estimate of our annual gas costs and volumes purchased for resale. The calculated factor is reviewed by the MPSC staff and approved by the MPSC. Elements considered part of the PGA factor include cost of gas supply, storage costs, hedging contracts, revenue and refunds, prior period adjustments and transportation costs. Pursuant to the provisions of the PGA clause, the difference between actual costs incurred and costs recovered through the application of the PGA (including costs, cost reductions and carrying costs associated with the use of financial instruments) are reflected as a regulatory asset or liability. The balance is amortized as amounts are reflected in customer billings.
THE EMPIRE DISTRICT ELECTRIC COMPANY Notes to Consolidated Financial Statements
54
Derivatives
We utilize derivatives to help manage our natural gas commodity market risk resulting from purchasing natural gas, to be used as fuel in our electric business or sold in our natural gas business, on the spot market and to manage certain interest rate exposure. We also acquire Transmission Congestion Rights (TCR) in an attempt to mitigate congestion costs associated with the power we will purchase from the SPP Integrated Market (see Note 14).
Electric Segment
Pursuant to the ASC guidance on accounting for derivative instruments and hedging activities, derivatives are required to be recognized on the balance sheet at their fair value. On the date a derivative contract is entered into, the derivative is designated as (1) a hedge of a forecasted transaction or of the variability of cash flows to be received or paid related to a recognized asset or liability (“cash-flow” hedge); or (2) an instrument that is held for non-hedging purposes (a “non-hedging” instrument). We record the mark-to-market gains or losses on derivatives used to hedge our fuel and congestion costs as regulatory assets or liabilities. This is in accordance with the ASC guidance on regulated operations, given that those regulatory assets and liabilities are probable of recovery through our fuel adjustment mechanism. We also enter into fixed-price forward physical contracts for the purchase of natural gas, coal and purchased power. These contracts, if they meet the definition of a derivative, are not subject to derivative accounting because they are considered to be normal purchase normal sales (NPNS) transactions. If these transactions don’t qualify for NPNS treatment, they would be marked to market for each reporting period through regulatory assets or liabilities.
Gas Segment
Financial hedges for our natural gas business are recorded at fair value on our balance sheet. Because we have a commission approved natural gas cost recovery mechanism (PGA), we record the mark-to-market gain/loss on natural gas financial hedges each reporting period to a regulatory asset/liability account. The regulatory asset/liability account tracks the difference between revenues billed to customers for natural gas costs and actual natural gas expense which is trued up at the end of August each year and included in the Actual Cost Adjustment (ACA) factor to be billed to customers during the next year. This is consistent with the ASC guidance on regulated operations, in that we will be recovering our costs after the annual true up period (subject to a prudency review by the MPSC). Cash flows from hedges for both electric and gas segments are classified within cash flows from operations.
Pension and Other Postretirement Benefits
We recognize expense related to pension and other postretirement benefits as earned during the employee’s period of service. Related assets and liabilities are established based upon the funded status of the plan compared to the projected benefit obligation. Our pension and OPEB expense or benefit includes amortization of previously unrecognized net gains or losses. Additional income or expense may be recognized when our unrecognized gains or losses as of the most recent measurement date exceed 10% of our postretirement benefit obligation or fair value of plan assets, whichever is greater. For pension benefits and OPEB benefits, unrecognized net gains or losses as of the measurement date are amortized into actuarial expense over ten years.
Pensions
We have rate orders with Missouri, Kansas and Oklahoma that allow us to recover pension costs consistent with our GAAP policy noted above. In accordance with the rate orders, we prospectively calculate the value of plan assets using a market-related value method as allowed by the ASC guidance on pension benefits. As a result, we are allowed to record the Missouri, Kansas and Oklahoma portion of any costs above or below the amount included in rates as a regulatory asset or liability, respectively. The MPSC has allowed us to adopt this pension cost recovery methodology for EDG as well.
THE EMPIRE DISTRICT ELECTRIC COMPANY Notes to Consolidated Financial Statements
55
Other Postretirement Benefits (OPEB)
We have regulatory treatment for our OPEB costs similar to the treatment described above for pension costs. This includes the use of a market-related value of assets, the amortization of unrecognized gains or losses into actuarial expense over ten years and the recognition of regulatory assets and liabilities as described above. In accordance with the guidance provided in the ASC on the Medicare Prescription Drug, Improvement and Modernization Act of 2003, the accumulated postretirement benefit obligation (APBO) and net cost recognized for OPEB reflects the effects of the Medicare Prescription Drug, Improvement and Modernization Act of 2003 (the Act). The Act provides for a federal subsidy, beginning in 2006, of 28% of prescription drug costs between $250 and $5,000 for each Medicare-eligible retiree who does not join Medicare Part D, to companies whose plans provide prescription drug benefits to their retirees that are “actuarially equivalent” to the prescription drug benefits provided under Medicare. Equivalency must be certified annually by the Federal Government. Our plan provides prescription drug benefits that are “actuarially equivalent” to the prescription drug benefits provided under Medicare and have been certified as such. Additional guidance in the ASC on employers’ accounting for defined benefit pension and other postretirement plans requires an employer to recognize the over funded or underfunded status of a defined benefit postretirement plan (other than a multiemployer plan) as an asset or liability in its statement of financial position and to recognize changes in that funded status in the year in which the changes occur through comprehensive income of a business entity. The guidance also requires an employer to measure the funded status of a plan as of the date of its year-end statement of financial position, with limited exceptions. Pension and other postretirement employee benefits tracking mechanisms are utilized to allow for future rate recovery of these obligations. We record these as regulatory assets on the balance sheet rather than as reductions of equity through comprehensive income (See Note 8).
Unamortized Debt Discount, Premium and Expense
Discount, premium and expense associated with long-term debt are amortized over the lives of the related issues. Costs, including gains and losses, related to refunded long-term debt are amortized over the lives of the related new debt issues, in accordance with regulatory rate practices.
Liability Insurance
We are primarily self-insured for workers’ compensation claims, general liabilities, benefits paid under employee healthcare programs and long-term disability benefits. Accruals are primarily based on the estimated undiscounted cost of claims. We self-insure up to certain limits that vary by segment and type of risk. Periodically, we evaluate the level of insurance coverage over the self-insured limits and adjust insurance levels based on risk tolerance and premium expense. We carry excess liability insurance for workers’ compensation and public liability claims for our electric segment. In order to provide for the cost of losses not covered by insurance, an allowance for injuries and damages is maintained based on our loss experience. Our gas segment is covered by excess liability insurance for public liability claims, and workers’ compensation claims are covered by a guaranteed cost policy (See Note 11).
Other Noncurrent Liabilities
Other noncurrent liabilities are comprised of accruals and other accounting estimates not sufficiently large enough to merit individual disclosure. At December 31, 2013, the balance of other noncurrent liabilities is primarily comprised of accruals for self-insurance, customer advances for construction and asset retirement obligations.
Cash & Cash Equivalents
Cash and cash equivalents include cash on hand and temporary investments purchased with an initial maturity of three months or less. It also includes checks and electronic funds transfers that have been issued but have not cleared the bank, which are also reflected in current accrued liabilities and were $22.1 million and $19.7 million at December 31, 2013 and 2012, respectively.

THE EMPIRE DISTRICT ELECTRIC COMPANY Notes to Consolidated Financial Statements
56
Restricted Cash
As part of our Plum Point ownership agreement, we are required to have funds available in an escrow account which guarantees payment of certain operating and construction costs. The cash is held at a financial institution and restricted as to withdrawal or use. The restrictions on these funds related to construction costs, which were approximately $2.5 million at December 31, 2012, were released by all parties in January 2013. The amounts restricted for operating costs, which were $1.8 million at December 31, 2013 and 2012, may increase or decrease based on an annual review. We are required to post secured collateral with Southwest Power Pool (SPP) to participate in Transmission Congestion Rights (TCR) auctions. The cash is held at a financial institution and restricted as to withdrawal or use. The restrictions on these funds were $1.1 million at December 31, 2013.
Fuel, Materials and Supplies
Fuel, materials and supplies consist primarily of coal, natural gas in storage and materials and supplies, which are reported at average cost. These balances are as follows (in thousands): 2013 2012 Electric fuel inventory $ 17,003 $ 27,954 Natural gas inventory 3,584 4,776 Materials and supplies 28,224 29,140 TOTAL $ 48,811 $ 61,870
Income Taxes
Deferred tax assets and liabilities are recognized for the tax consequences of transactions that have been treated differently for financial reporting and tax return purposes, measured using statutory tax rates (See Note 9). Investment tax credits utilized in prior years were deferred and are being amortized over the useful lives of the properties to which they relate. The longest remaining amortization period for investment tax credits is approximately 50 years.
Accounting for Uncertainty in Income Taxes
In 2006, the FASB issued guidance which clarifies the accounting for uncertainty in income taxes recognized in an enterprise’s financial statements in accordance with the ASC guidance on accounting for income taxes. We file consolidated income tax returns in the U.S. federal and state jurisdictions. With few exceptions, we are no longer subject to U.S. federal, state and local income tax examinations by tax authorities for years before 2009. At December 31, 2013 and 2012, our balance sheet did not include any unrecognized tax benefits. We do not expect any material changes to unrecognized tax benefits within the next twelve months. We recognize interest accrued and penalties related to unrecognized tax benefits in other expenses.
Computations of Earnings Per Share
The ASC guidance on earnings per share requires dual presentation of basic and diluted earnings per share. Basic earnings per share does not include potentially dilutive securities and is computed by dividing net income by the weighted average number of common shares outstanding. Diluted earnings per share assumes the issuance of common shares pursuant to the Company’s stock-based compensation plans at the beginning of each respective period, or at the date of grant or award if later. Shares attributable to stock options are excluded from the calculation of diluted earnings per share if the effect would be antidilutive.

THE EMPIRE DISTRICT ELECTRIC COMPANY Notes to Consolidated Financial Statements
57
Weighted Average Number Of Shares 2013 2012 2011 Basic 42,781,382 42,256,641 41,851,759 Dilutive Securities: Performance-based restricted stock awards 12,142 14,500 18,222 Dividend equivalents - 6,329 9,585 Employee stock purchase plan 1,729 1,996 3,815 Stock options 61 3,160 3,240 Time-based restricted stock awards 7,907 1,820 807 Total dilutive securities 21,839 27,805 35,669
Diluted weighted average number of shares 42,803,221 42,284,446 41,887,428
Antidilutive Shares 107,100 128,500 128,500
Potentially dilutive shares are not expected to have a material impact unless significant appreciation of the Company’s stock price occurs.
Stock-Based Compensation
We have several stock-based compensation plans, which are described in more detail in Note 4. In accordance with the ASC guidance on stock-based compensation, we recognize compensation expense over the requisite service period of all stock-based compensation awards based upon the fair-value of the award as of the date of issuance.
Recently Issued and Proposed Accounting Standards
Balance Sheet Offsetting: In December 2011, the FASB amended the guidance governing the offsetting, or netting, of assets and liabilities on the balance sheet. Under the revised guidance, an entity would be required to disclose both the gross and net information about instruments and transactions that are eligible for offset on the balance sheet, as well as instruments or transactions subject to a master netting agreement. This standard is effective for annual periods beginning after January 1, 2013. The application of this standard did not have a material impact on our results of operations, financial position or liquidity. Presentation of an unrecognized tax benefit: In July 2013, The FASB issued new guidance on the presentation of unrecognized tax benefits. Under this guidance, an unrecognized tax benefit would be presented as a reduction to a deferred tax asset when a tax credit carryforward, net operating loss carryforward, or similar tax loss exists. To the extent that the loss or credit carryforward is not available at the reporting date, or the entity does not intend to use the deferred tax asset for such a purpose, the unrecognized tax benefit should be presented as a liability and not be combined with deferred tax assets. This standard is effective for annual periods beginning after December 15, 2013. The application of this standard is not expected to have a material impact on our results of operations, financial position or liquidity.
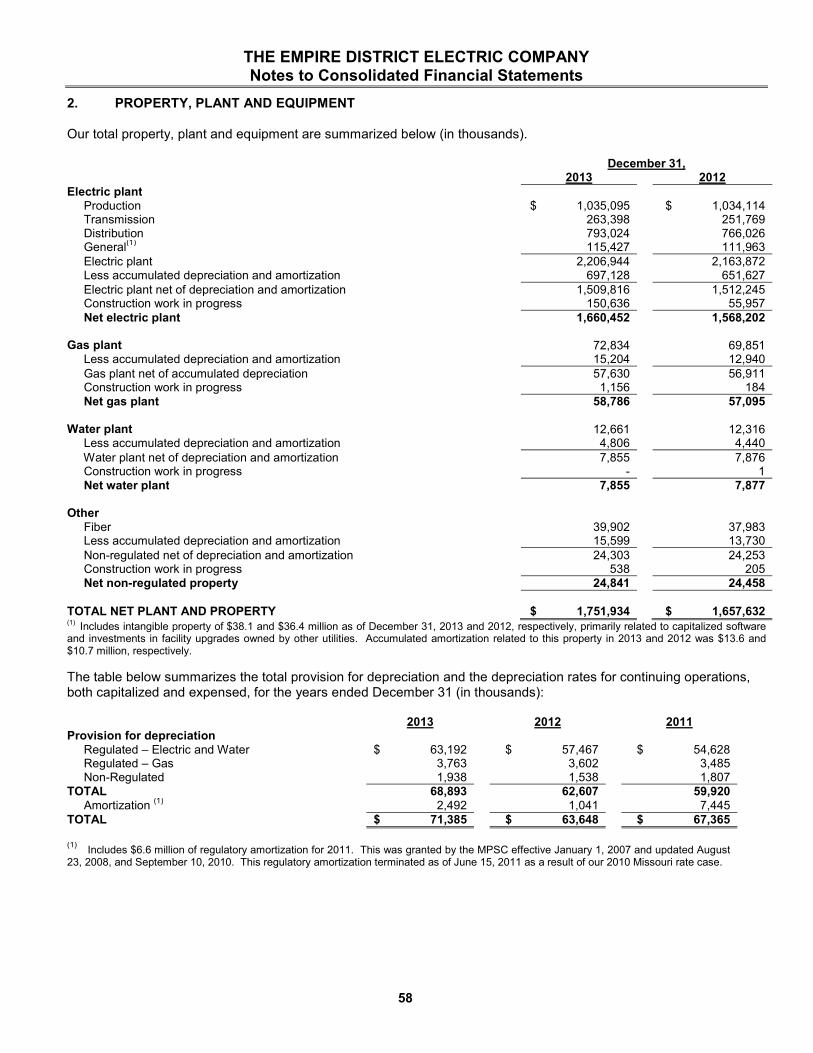
THE EMPIRE DISTRICT ELECTRIC COMPANY Notes to Consolidated Financial Statements
58
2. PROPERTY, PLANT AND EQUIPMENT Our total property, plant and equipment are summarized below (in thousands). December 31, 2013 2012 Electric plant Production $ 1,035,095 $ 1,034,114 Transmission 263,398 251,769 Distribution 793,024 766,026 General
(1) 115,427 111,963
Electric plant 2,206,944 2,163,872 Less accumulated depreciation and amortization 697,128 651,627 Electric plant net of depreciation and amortization 1,509,816 1,512,245 Construction work in progress 150,636 55,957 Net electric plant 1,660,452 1,568,202 Gas plant 72,834 69,851 Less accumulated depreciation and amortization 15,204 12,940 Gas plant net of accumulated depreciation 57,630 56,911 Construction work in progress 1,156 184 Net gas plant 58,786 57,095 Water plant 12,661 12,316 Less accumulated depreciation and amortization 4,806 4,440 Water plant net of depreciation and amortization 7,855 7,876 Construction work in progress - 1 Net water plant 7,855 7,877 Other Fiber 39,902 37,983 Less accumulated depreciation and amortization 15,599 13,730 Non-regulated net of depreciation and amortization 24,303 24,253 Construction work in progress 538 205 Net non-regulated property 24,841 24,458
TOTAL NET PLANT AND PROPERTY $ 1,751,934 $ 1,657,632 (1) Includes intangible property of $38.1 and $36.4 million as of December 31, 2013 and 2012, respectively, primarily related to capitalized software and investments in facility upgrades owned by other utilities. Accumulated amortization related to this property in 2013 and 2012 was $13.6 and $10.7 million, respectively.
The table below summarizes the total provision for depreciation and the depreciation rates for continuing operations, both capitalized and expensed, for the years ended December 31 (in thousands): 2013 2012 2011 Provision for depreciation Regulated – Electric and Water $ 63,192 $ 57,467 $ 54,628 Regulated – Gas 3,763 3,602 3,485 Non-Regulated 1,938 1,538 1,807 TOTAL 68,893 62,607 59,920 Amortization
(1) 2,492 1,041 7,445
TOTAL $ 71,385 $ 63,648 $ 67,365
(1)
Includes $6.6 million of regulatory amortization for 2011. This was granted by the MPSC effective January 1, 2007 and updated August 23, 2008, and September 10, 2010. This regulatory amortization terminated as of June 15, 2011 as a result of our 2010 Missouri rate case.
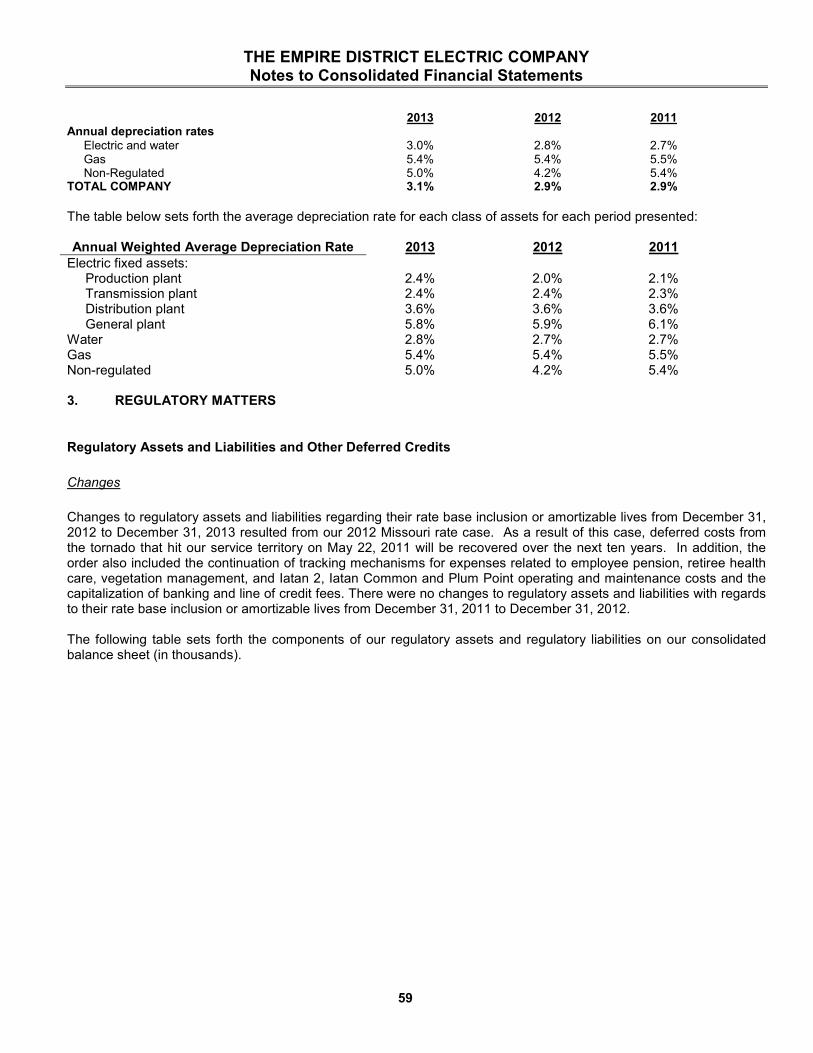
THE EMPIRE DISTRICT ELECTRIC COMPANY Notes to Consolidated Financial Statements
59
2013 2012 2011 Annual depreciation rates Electric and water 3.0% 2.8% 2.7% Gas 5.4% 5.4% 5.5% Non-Regulated 5.0% 4.2% 5.4% TOTAL COMPANY 3.1% 2.9% 2.9%
The table below sets forth the average depreciation rate for each class of assets for each period presented: Annual Weighted Average Depreciation Rate 2013 2012 2011
Electric fixed assets: Production plant 2.4% 2.0% 2.1% Transmission plant 2.4% 2.4% 2.3% Distribution plant 3.6% 3.6% 3.6% General plant 5.8% 5.9% 6.1% Water 2.8% 2.7% 2.7% Gas 5.4% 5.4% 5.5% Non-regulated 5.0% 4.2% 5.4% 3. REGULATORY MATTERS
Regulatory Assets and Liabilities and Other Deferred Credits
Changes
Changes to regulatory assets and liabilities regarding their rate base inclusion or amortizable lives from December 31, 2012 to December 31, 2013 resulted from our 2012 Missouri rate case. As a result of this case, deferred costs from the tornado that hit our service territory on May 22, 2011 will be recovered over the next ten years. In addition, the order also included the continuation of tracking mechanisms for expenses related to employee pension, retiree health care, vegetation management, and Iatan 2, Iatan Common and Plum Point operating and maintenance costs and the capitalization of banking and line of credit fees. There were no changes to regulatory assets and liabilities with regards to their rate base inclusion or amortizable lives from December 31, 2011 to December 31, 2012. The following table sets forth the components of our regulatory assets and regulatory liabilities on our consolidated balance sheet (in thousands).

THE EMPIRE DISTRICT ELECTRIC COMPANY Notes to Consolidated Financial Statements
60
December 31,
2013 2012 Regulatory Assets: Current: $ 1,411 $ 2,885 Under recovered fuel costs 6,332 3,492 Current portion of long-term regulatory assets 7,743 6,377 Regulatory assets, current Long-term: Pension and other postretirement benefits
(1) 70,035 136,480
Income taxes 48,033 48,759 Deferred construction accounting costs
(2) 16,275 16,717
Unamortized loss on reacquired debt 11,078 12,142 Unsettled derivative losses – electric segment 4,269 6,557 System reliability – vegetation management 7,539 9,002 Storm costs
(3) 4,911 4,828
Asset retirement obligation 4,673 4,430 Customer programs 4,935 4,356 Unamortized loss on interest rate derivative 989 1,147 Deferred operating and maintenance expense 2,095 2,049 Under recovered fuel costs - 314 Current portion of long-term regulatory assets (6,332) (3,492) Other 833 669 Regulatory assets, long-term 169,333 243,958 Total Regulatory Assets $ 177,076 $ 250,335
Regulatory Liabilities Current: Over recovered fuel costs $ 2,212 $ 3,214 Current portion of long-term regulatory liabilities 3,469 3,089 Regulatory liabilities, current 5,681 6,303 Long-term: Costs of removal 88,469 83,368 SWPA payment for Ozark Beach lost generation 19,405 22,242 Income taxes 11,677 11,972 Deferred construction accounting costs – fuel
(4) 8,011 8,156
Unamortized gain on interest rate derivative 3,371 3,541 Pension and other postretirement benefits 2,177 2,007 Over recovered fuel costs 2,371 2,858 Current portion of long-term regulatory liabilities (3,469) (3,089) Regulatory liabilities, long-term 132,012 131,055 Total Regulatory Liabilities $ 137,693 $ 137,358 (1) Primarily consists of unfunded pension and OPEB liability. See Note 8. (2) Reflects deferrals resulting from 2005 regulatory plan relating to Iatan 1, Iatan 2 and Plum Point. These amounts are being recovered over the life of the plants. (3) Reflects ice storm costs incurred in 2007 and costs incurred as a result of the May 2011 tornado including an accrued carrying charge and deferred depreciation totaling $3.7 million at December 31, 2013. (4) Resulting from regulatory plan requiring deferral of the fuel and purchased power impacts of Iatan 2.
Unamortized losses on debt and losses on interest rate derivatives are not included in rate base, but are included in our capital structure for rate base purposes. The remainder of our regulatory assets are not included in rate base, generally because they are not cash items. However, as of December 31, 2013, the costs of all of our regulatory assets are currently being recovered except for approximately $61.2 million of pension and other postretirement costs primarily related to the unfunded liabilities for future pension and OPEB costs. The amount and timing of recovery of this item will be based on the changing funded status of the pension and OPEB plans in future periods. The regulatory income tax assets and liabilities are generally amortized over the average depreciable life of the related assets. The loss on reacquired debt and the loss and gain on interest rate derivatives are amortized over the life of the related new debt issue, which currently ranges from 1 to 28 years. The unrecovered fuel costs are generally recovered within a year following their recognition. Severe storm costs and the Asbury maintenance outage costs are
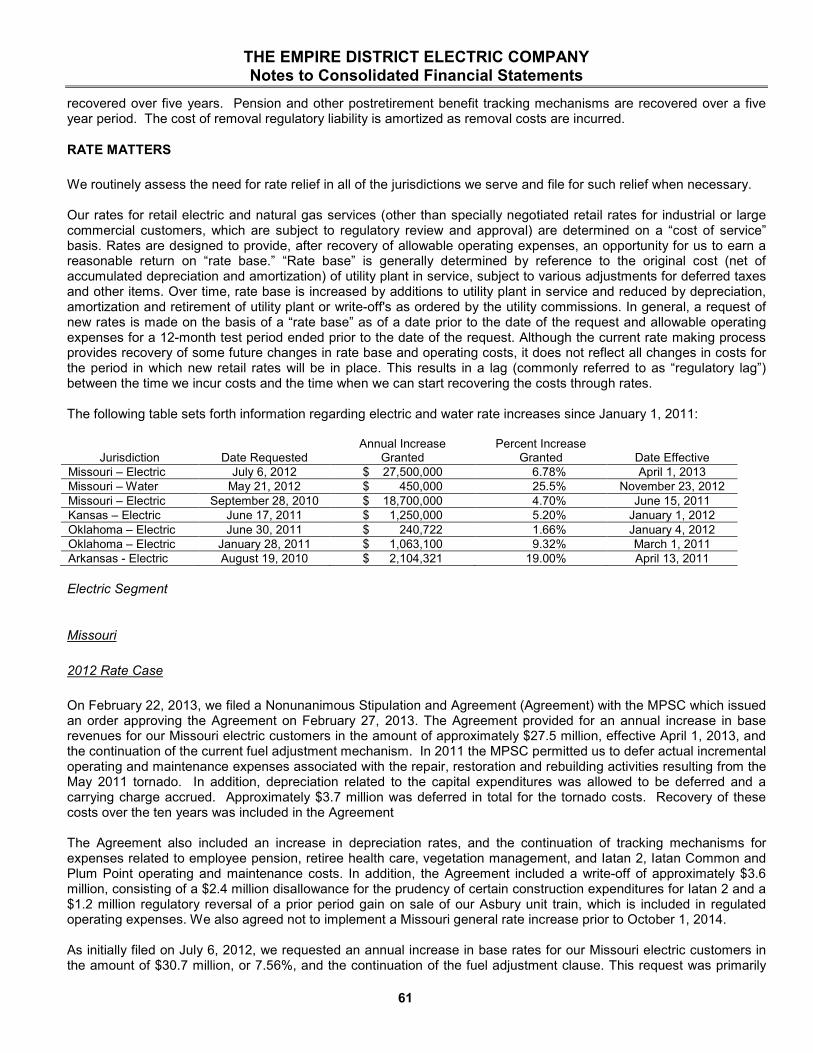
THE EMPIRE DISTRICT ELECTRIC COMPANY Notes to Consolidated Financial Statements
61
recovered over five years. Pension and other postretirement benefit tracking mechanisms are recovered over a five year period. The cost of removal regulatory liability is amortized as removal costs are incurred.
RATE MATTERS
We routinely assess the need for rate relief in all of the jurisdictions we serve and file for such relief when necessary. Our rates for retail electric and natural gas services (other than specially negotiated retail rates for industrial or large commercial customers, which are subject to regulatory review and approval) are determined on a “cost of service” basis. Rates are designed to provide, after recovery of allowable operating expenses, an opportunity for us to earn a reasonable return on “rate base.” “Rate base” is generally determined by reference to the original cost (net of accumulated depreciation and amortization) of utility plant in service, subject to various adjustments for deferred taxes and other items. Over time, rate base is increased by additions to utility plant in service and reduced by depreciation, amortization and retirement of utility plant or write-off's as ordered by the utility commissions. In general, a request of new rates is made on the basis of a “rate base” as of a date prior to the date of the request and allowable operating expenses for a 12-month test period ended prior to the date of the request. Although the current rate making process provides recovery of some future changes in rate base and operating costs, it does not reflect all changes in costs for the period in which new retail rates will be in place. This results in a lag (commonly referred to as “regulatory lag”) between the time we incur costs and the time when we can start recovering the costs through rates. The following table sets forth information regarding electric and water rate increases since January 1, 2011:
Jurisdiction
Date Requested
Annual Increase Granted
Percent Increase Granted
Date Effective
Missouri – Electric July 6, 2012 $ 27,500,000 6.78% April 1, 2013 Missouri – Water May 21, 2012 $ 450,000 25.5% November 23, 2012 Missouri – Electric September 28, 2010 $ 18,700,000 4.70% June 15, 2011 Kansas – Electric June 17, 2011 $ 1,250,000 5.20% January 1, 2012 Oklahoma – Electric June 30, 2011 $ 240,722 1.66% January 4, 2012 Oklahoma – Electric January 28, 2011 $ 1,063,100 9.32% March 1, 2011 Arkansas - Electric August 19, 2010 $ 2,104,321 19.00% April 13, 2011
Electric Segment
Missouri
2012 Rate Case
On February 22, 2013, we filed a Nonunanimous Stipulation and Agreement (Agreement) with the MPSC which issued an order approving the Agreement on February 27, 2013. The Agreement provided for an annual increase in base revenues for our Missouri electric customers in the amount of approximately $27.5 million, effective April 1, 2013, and the continuation of the current fuel adjustment mechanism. In 2011 the MPSC permitted us to defer actual incremental operating and maintenance expenses associated with the repair, restoration and rebuilding activities resulting from the May 2011 tornado. In addition, depreciation related to the capital expenditures was allowed to be deferred and a carrying charge accrued. Approximately $3.7 million was deferred in total for the tornado costs. Recovery of these costs over the ten years was included in the Agreement The Agreement also included an increase in depreciation rates, and the continuation of tracking mechanisms for expenses related to employee pension, retiree health care, vegetation management, and Iatan 2, Iatan Common and Plum Point operating and maintenance costs. In addition, the Agreement included a write-off of approximately $3.6 million, consisting of a $2.4 million disallowance for the prudency of certain construction expenditures for Iatan 2 and a $1.2 million regulatory reversal of a prior period gain on sale of our Asbury unit train, which is included in regulated operating expenses. We also agreed not to implement a Missouri general rate increase prior to October 1, 2014. As initially filed on July 6, 2012, we requested an annual increase in base rates for our Missouri electric customers in the amount of $30.7 million, or 7.56%, and the continuation of the fuel adjustment clause. This request was primarily

THE EMPIRE DISTRICT ELECTRIC COMPANY Notes to Consolidated Financial Statements
62
designed to recover operation and maintenance expenses and capital costs associated with the May 22, 2011 tornado, Southwest Power Pool transmission charges allocated to us, operating systems replacement costs for new software systems, vegetation management costs, new depreciation rates and amortization of a regulatory asset related to the tax benefits of cost of removal, the balance of which was approximately $9.6 million at December 31, 2012.
On May 21, 2012, we filed a rate increase request with the MPSC for an annual increase in revenues for our Missouri water customers in the amount of approximately $516,400, or 29.6%. On October 18, 2012, we, the MPSC staff and the Office of the Public Counsel filed a unanimous agreement with the MPSC for an increase of $450,000. The MPSC issued an order approving the agreement on October 31, 2012, with rates effective November 23, 2012.
2010 Rate Case
On September 28, 2010, we filed a rate increase request with the MPSC for an annual increase in base rates for our Missouri electric customers in the amount of $36.5 million, or 9.2% to recover the Iatan 2 costs and other cost of service items not included in our 2009 Missouri rate case, effective September 10, 2010. A settlement agreement among the parties to the case was reached and filed with the MPSC on May 27, 2011 reflecting an overall annual increase in rates of $18.7 million, or approximately 4.7% effective on June 15, 2011. Due to rate design changes, this rate increase, however, primarily impacted our winter season rates which generally run from October through May. Also as part of the settlement, regulatory amortization expense of $14.5 million annually and construction accounting terminated as of June 15, 2011. The MPSC approved the settlement agreement on June 1, 2011 and the new rates were effective on June 15, 2011. The approved settlement included authorization of a tracker mechanism for the SWPA payment associated with the capacity restrictions to be implemented for our Ozark Beach hydro facility. We agreed to flow the SWPA payment, net of tax, back to our customers over a ten year period using a tracker mechanism resulting in an annual decrease to expenses of approximately $1.4 million. The settlement agreement also allowed for a tracker mechanism related to Plum Point, Iatan 2 and Iatan common plant operating expenses. We record a regulatory asset or liability for the difference between actual expenses (excluding fuel and fuel related expenses) and the amount of expense included in base rates.
Kansas
2011 Rate Case
On June 17, 2011, we filed an application with the KCC seeking a rate increase of $1.5 million, or 6.39%. The rate increase was requested to recover the costs associated with our investment in the Iatan 1, Iatan 2 and Plum Point generating units and the depreciation and operation and maintenance costs deferred since the in-service dates of the units. The June 17, 2011 filing was made under the KCC’s abbreviated rate case rules which the KCC authorized in our 2009 Kansas rate case. The case included a request to recover the Iatan and Plum Point cost deferrals over a 3-year period. A joint settlement agreement was filed on November 10, 2011 and approved by the KCC on December 21, 2011, resulting in an increase in annual revenues of $1.25 million, or approximately 5.2%. The new rates became effective on January 1, 2012.
Oklahoma
On June 30, 2011, we filed a request with the Oklahoma Corporation Commission (OCC) for an annual increase in base rates for our Oklahoma electric customers in the amount of $0.6 million, or 4.1% over the base rate and Capital Reliability Rider (CRR) revenues that were currently in effect. A stipulation and agreement, reached by all parties participating in the case, was filed on November 16, 2011. This agreement, which was approved by the OCC on January 4, 2012, made rates previously collected under the CRR permanent, and will result in a net overall increase of total annual revenues of $0.2 million, or approximately 1.66%. The agreement also removed fuel and purchase power costs from base rates. Fuel and purchase power costs are now listed as a separate line item, identified as the Fuel Adjustment Charge, on customer bills.

THE EMPIRE DISTRICT ELECTRIC COMPANY Notes to Consolidated Financial Statements
63
Arkansas
On December 3, 2013, we filed a request with the Arkansas Public Service Commission for changes in rates for our Arkansas electric customers. We are seeking an annual increase in total revenue of approximately $2.2 million, or approximately 18%. The rate increase was requested to recover costs incurred to ensure continued reliable service for our customers, including capital investments, operating systems replacement costs and ongoing increases in other operation and maintenance expenses and capital costs.
FERC
On May 18, 2012, we filed a request with the FERC to implement a TFR to be effective August 1, 2012. On July 31, 2012, the FERC suspended the TFR for five months and set the filing for hearing and settlement procedures. On June 13, 2013, we, the Kansas Corporation Commission and the cities of Monett, Mt. Vernon and Lockwood, Missouri and Chetopa, Kansas, filed a unanimous Settlement Agreement (Agreement) with the FERC. The Agreement included a TFR that would establish an ROE of 10.0%. The Agreement calls for the TFR to be updated annually with the new updated TFR rates effective on July 1 of each year. FERC conditionally approved the Agreement on November 18, 2013, and we made a compliance filing with FERC on December 18, 2013 in connection with this conditional approval. Final FERC action on our compliance filing is pending. On March 12, 2010, we filed new annual GFR tariffs with the FERC which we propose to be utilized for our wholesale customers. On May 28, 2010, the FERC issued an order that conditionally approved our GFR filing subject to refund effective June 1, 2010. On September 15, 2010, the parties agreed to a settlement in principle and on May 24, 2011, we, the Missouri Public Utility Alliance and the cities of Monett, Mt. Vernon and Lockwood, Missouri filed a Settlement Agreement and Offer of Settlement with the FERC. We refunded approximately $1.3 million, including interest, in November 2011 as a result of this settlement. A GFR update will be completed annually for rates effective June 1.
MARKETS AND TRANSMISSION
Electric Segment
Energy Imbalance Services: The Southwest Power Pool (SPP) regional transmission organization (RTO) energy imbalance services market (EIS) provides real time energy for most participating members within the SPP regional footprint. Imbalance energy prices are based on market bids and status of dispatchable generation and transmission within the SPP market footprint. In addition to energy imbalance service, the SPP RTO performs a real time security-constrained economic dispatch of all generation voluntarily offered into the EIS market to the market participants to also serve the native load. Day-Ahead Market: We continue to prepare for a March 1, 2014 implementation of the SPP Integrated Marketplace (or Day-Ahead Market), which will replace the existing EIS market described above. Prior to implementation of the Integrated Marketplace, the SPP RTO will create a single NERC-approved balancing authority to take over balancing authority responsibilities for its members, including Empire. This action is expected to provide operational and economic benefits for our customers. As part of the Integrated Marketplace, SPP members will be able to offer their committed resources into the SPP market for a centralized dispatch. Members will submit offers to sell and bids to purchase power. SPP will match offers and bids based upon a security constrained analysis. It is expected that 90%-95% of all generation needed (for the next day) throughout the SPP territory will be cleared through this Integrated Marketplace. We also acquire Transmission Congestion Rights (TCR) in an attempt to mitigate congestion costs associated with the power we will purchase from the SPP Integrated Market (see Note 14). The net financial effect of these Integrated Marketplace transactions will be processed through our fuel adjustment mechanisms. FERC Order No. 1000: In July 2011, the FERC issued Order No. 1000 (Transmission Planning and Cost Allocation by Transmission Owning and Operating Public Utilities) which requires all public utility transmission providers to allow transmission developers outside their retail distribution service territory to participate in regional transmission planning. Order No. 1000 eliminates the federal right of first refusal for entities that develop transmission projects within their

THE EMPIRE DISTRICT ELECTRIC COMPANY Notes to Consolidated Financial Statements
64
own retail distribution service territories to construct transmission facilities selected in a regional transmission plan. This order will directly affect our rights to build 161kV and above transmission facilities within our retail service territory. Order No. 1000 also directed transmission providers to develop policy and procedures for regional and interregional transmission planning as well as regional and interregional transmission cost allocation (see “SPP Regional Transmission Development” below) for approved transmission projects. We continue to participate in the SPP processes to understand the impact of these FERC orders on our ability to construct new facilities within our service territory as well as their influence on promoting construction of transmission projects on or near our borders with our neighbors. SPP has completed and filed with the FERC a required interregional policy and procedure compliance filing, with implementation scheduled for January 2015. FERC’s decision on SPP’s Order No. 1000 interregional compliance filing is pending. SPP Regional Transmission Development: In 2010, SPP received FERC approval to implement a new highway/byway cost allocation methodology for new SPP Board of Directors (BOD) approved transmission projects, a number which are currently in progress. We are concerned with the SPP’s policy to allocate to us the costs of transmission projects from which we would receive either no benefits or benefits that are not roughly commensurate with the allocated costs. We estimate net transmission costs will increase between $2 and $3 million in 2014 as a result of SPP’s allocation methodology over what we currently recover in customer rates. We have cost recovery mechanisms in place in our Arkansas and Oklahoma jurisdictions that allow us to recover the additional SPP transmission costs outside the traditional rate case process. Currently no mechanism is in place to timely recover additional costs resulting from the portion of these transmission projects allocated to us other than through the traditional rate case process in our Missouri and Kansas jurisdictions. The highway/byway allocation methodology requires the costs of SPP approved transmission projects to be allocated to 1) members across the entire SPP region; 2) members within certain localized service territories or zones; or 3) a combination of both regional and zonal allocation. The allocation is based on project voltage, as follows: Transmission Project Voltage Regional Funding Percentage Zonal Funding Percentage
300 kV and Above 100.0% 0.0% 100kV to 299kV 33.3% 66.7% Below 100 kV 0.0% 100.0%
At the October 2013 SPP regional state committee meeting, SPP’s regional cost allocation review and imbalance analysis indicated that our projected benefits (along with five other members) compared to the allocation of transmission costs over the next several years would be below the roughly commensurate benefit to cost threshold that initiates an equity remedy review by SPP staff. SPP will evaluate potential construction equity improvement remedies during the upcoming 2014 Integrated Transmission Planning (ITP) process with any recommendations expected in January 2015 SPP/Midcontinent Independent System Operator (MISO) Joint Operating Agreement: On December 19, 2013, Entergy integrated its generation, transmission, and load into the MISO regional transmission organization. Based on the current terms and conditions of MISO membership, Entergy’s participation in MISO will not be beneficial to our customers as it will significantly increase transmission delivery costs for our Plum Point power station as well as utilize our transmission system without compensation. Prior to Entergy’s integration into MISO, the SPP filed a Petition for Review of FERC’s Orders on the interpretation of the SPP/MISO Joint Operating Agreement at the United States Court of Appeals for the District of Columbia (DC). In early December 2013, the DC Court vacated and remanded FERC’s Orders that agreed with MISO regarding interpretation of the Joint Operating Agreement to utilize SPP’s system to integrate Entergy into MISO. SPP believes MISO’s intentional and free use of ours and the other SPP transmission owners systems is unjust and unreasonable. We and other SPP members have intervened in SPP’s Petition and are actively involved in SPP stakeholder processes and other FERC dockets to address our concerns. FERC’s actions regarding the remand and review of the FERC orders are pending.
THE EMPIRE DISTRICT ELECTRIC COMPANY Notes to Consolidated Financial Statements
65
Gas Segment
Non-residential gas customers whose annual usage exceeds certain amounts may purchase natural gas from a source other than EDG. EDG does not have a non-regulated energy marketing service that sells natural gas in competition with outside sources. EDG continues to receive non-gas related revenues for distribution and other services if natural gas is purchased from another source by our eligible customers.
Other - Rate Matters
In accordance with ASC guidance on regulated operations, we currently have deferred approximately $1.2 million of expense related to rate cases under other non-current assets and deferred charges. These amounts will be amortized over varying periods based upon the completion of the specific cases. Based on past history, we expect all these expenses to be recovered in rates. 4. COMMON STOCK
Stock Based Compensation
We have several stock-based awards and programs, which are described below. Performance-based restricted stock awards, time-vested restricted stock and stock options are valued as liability awards, in accordance with fair value guidelines. We allow employees to elect to have taxes in excess of the minimum statutory requirements withheld from their awards and, therefore, the awards are classified as liability instruments under the ASC guidance on share based payment. Awards treated as liability instruments must be revalued each period until settled, and cost is accrued over the requisite service period and adjusted to fair value at each reporting period until settlement or expiration of the award. We recognized the following amounts in compensation expense and tax benefits for all of our stock-based awards and programs for the applicable years ended December 31 (in thousands): 2013 2012 2011
Compensation expense $ 2,577 $ 1,863 $ 1,765 Tax benefit recognized 929 649 614
Stock Incentive Plans
Our 2006 Stock Incentive Plan (the 2006 Incentive Plan) was adopted by shareholders at the annual meeting on April 28, 2005 and provides for grants of up to 650,000 shares of common stock through January 2016. The 2006 Stock Incentive Plan permits grants of stock options and restricted stock to qualified employees and permits Directors and, if approved by the Compensation Committee of the Board of Directors, qualified employees to receive common stock in lieu of cash. Certain executive officers and other senior managers applied to receive annual incentive awards related to 2011, 2012 and 2013 performance in the form of Empire common stock rather than cash. These requests were granted by the Compensation Committee of the Board of Directors under the terms of our 2006 Stock Incentive Plan. The terms and conditions of any option or stock grant are determined by the Board of Directors Compensation Committee, within the provisions of these Stock Incentive Plans.
Time-Vested Restricted Stock Awards
Beginning in 2011, we began granting, to qualified individuals, time-vested restricted stock awards that vest after a three-year period, in lieu of stock options. No dividend rights accumulate during the vesting period. Time-vested restricted stock is valued at an amount equal to the fair market value of our common stock on the date of grant. If employment terminates during the vesting period because of death, retirement, or disability, the participant is entitled to a pro-rata portion of the time-vested restricted stock awards such participant would otherwise have earned, which is distributed six months following the date of termination, with the remainder of the award forfeited. If employment is terminated during the vesting period for reasons other than those listed above, the time-vested restricted stock awards
THE EMPIRE DISTRICT ELECTRIC COMPANY Notes to Consolidated Financial Statements
66
will be forfeited on the date of the termination, unless the Board of Directors Compensation Committee determines, in its sole discretion, that the participant is entitled to a pro-rata portion of the award. The fair value measurements for each grant year are noted in the following table:
Fair Value of Grants Outstanding at December 31 2013 2012 Total unrecognized compensation cost (in millions) $ 0.2 less than $0.1
Recognition period 0.1 years to 2.1 years 1.6 years
Fair value $ 19.88 $ 18.38
No shares of time-vested restricted stock were granted in 2012 as a result of the limitation on incentive compensation in place in 2011. A summary of time vested restricted stock activity under the plan for 2013, 2012 and 2011 is presented in the table below: 2013 2012 2011
Number of
Shares
Weighted Average Grant
Date Fair Value
Number
of Shares
Weighted Average Grant
Date Fair Value
Number
Of Shares
Weighted Average Grant
Date Fair Value
Outstanding at January 1, 3,300 $20.38 3,433 $21.84 - - Granted 21,600 $21.36 - - 10,200 $21.84 Vested - - - - 794 $19.32 Distributed - - (133) $20.13 (661) $21.02 Forfeited - - - - (6,106) - Vested but not distributed - - - - 133 $20.13 Outstanding at December 31, 24,900 $22.69 3,300 $20.38 3,433 $21.84
All time-vested restricted stock awards are classified as liability instruments, which must be revalued each period until settled. The cost of the awards is generally recognized over the requisite (explicit) service period.
Performance-Based Restricted Stock Awards
Performance-based restricted stock awards are granted to qualified individuals consisting of the right to receive a number of shares of common stock at the end of the restricted period assuming performance criteria are met. The performance measure for the award is the total return to our shareholders over a three-year period compared with an investor-owned utility peer group. The threshold level of performance under the 2011, 2012 and 2013 grants was set at the 20th percentile level of the peer group, target at the 50th percentile level, and the maximum at the 80th percentile level. Shares would be earned at the end of the three-year performance period as follows: 100% of the target number of shares if the target level of performance is reached, 50% if the threshold is reached, and 200% if the percentile ranking is at or above the maximum, with the number of shares interpolated between these levels. However, no shares would be payable if the threshold level is not reached. As noted previously, all performance-based restricted stock awards are classified as liability instruments, which must be revalued each period until settled. The fair value of the outstanding restricted stock awards was estimated as of December 31, 2013, 2012 and 2011 using a Monte Carlo option valuation model. The assumptions used in the model for each grant year are noted in the following table: Fair Value of Grants Outstanding at December 31, 2013 2012 2011
Risk-free interest rate 0.13% to 0.38% 0.16% to 0.25% 0.12% to 0.23% Expected volatility of Empire stock 20.2% 20.6% 23.8% Expected volatility of peer group stock 12.3% to 27.5% 12.4% to 29.2% 15.7% to 57.4% Expected dividend yield on Empire stock 4.5% 4.9% 4.7% Expected forfeiture rates 3% 3% 3% Plan cycle 3 years 3 years 3 years Fair value percentage 0.0% to 108.0% 18.0% to 96.0% 51.0% to 75.0% Weighted average fair value per share $18.47 $10.94 $13.67
THE EMPIRE DISTRICT ELECTRIC COMPANY Notes to Consolidated Financial Statements
67
Non-vested performance-based restricted stock awards (based on target number) as of December 31, 2013, 2012 and 2011 and changes during the year ended December 31, 2013, 2012 and 2011 were as follows: 2013 2012 2011
Number
of Shares
Weighted Average Grant
Date Fair Value
Number
of Shares
Weighted Average Grant
Date Fair Value
Number
Of Shares
Weighted Average Grant
Date Fair Value
Outstanding at January 1, 33,900 $20.25 37,400 $19.28 47,500 $19.86 Granted 26,300 $21.36 10,000 $20.97 10,900 $21.84 Awarded (4,460) $18.36 (7,823) $18.12 (39,621) $21.92 Awarded in excess of target - $ - 18,621 $21.92 Not awarded (8,540) $18.36 (5,677) $18.12 - $ - Nonvested at December 31, 47,200 $21.39 33,900 $20.25 37,400 $19.28
At December 31, 2013 and 2012, unrecognized compensation expense related to estimated outstanding awards was $0.5 million and $0.1 million, respectively.
Stock Options
Prior to 2011 stock options were issued with an exercise price equal to the fair market value of the shares on the date of grant. They became exercisable after three years and, expire ten years after the date granted. Dividend equivalent awards, under which dividend equivalents accumulated during the vesting period, were also issued to recipients of the stock options. Participants’ options and dividend equivalents that were not vested were forfeited when participants left Empire, except for terminations of employment under certain specified circumstances. There were no stock options or dividend equivalents granted in 2013, 2012, or 2011. Beginning in 2011, we began issuing time-vested restricted stock in lieu of stock options and dividend equivalents. As noted previously, all outstanding stock option awards are classified as liability instruments, which must be revalued each period until settled. Stock option grants vest upon satisfaction of service conditions. The cost of the awards is generally recognized over the requisite (explicit) service period. The fair value of the outstanding options was estimated as of December 31, 2013, 2012 and 2011, under a Black-Scholes methodology. The assumptions used in the valuations are shown below: Fair Value of Grants Outstanding at December 31, 2013 2012 2011
Risk-free interest rate 0.10% to 0.38% 0.11% to 0.44% 0.12% to 0.72% Dividend yield 4.5% 4.9% 4.7% Expected volatility 24.0% 24.0% 25.0% Expected life in months 6.5 to 24.5 78 78 Market value $22.69 $20.38 $21.09 Weighted average fair value per option $1.57 $1.34 $2.08
A summary of option activity under the plan during the years ended December 31, 2013, 2012 and 2011 is presented below: 2013 2012 2011
Options
Weighted Average Exercise Price
Options
Weighted Average Exercise Price
Options
Weighted Average Exercise Price
Outstanding at January 1, 163,300 $ 22.13 190,300 $ 21.56 267,400 $ 21.69 Granted $ - 0 $ - 0 $ - Exercised (50,800) $ 21.78 (27,000) $ 18.12 (77,100) $ 22.02 Outstanding at December 31, 112,500 $ 23.27 163,300 $ 22.13 190,300 $ 21.56
Exercisable, end of year 112,500 $ 23.27 128,500 $ 23.15 128,500 $ 23.15
THE EMPIRE DISTRICT ELECTRIC COMPANY Notes to Consolidated Financial Statements
68
The intrinsic value of the unexercised options is the difference between the Company’s closing stock price on the last day of the period and the exercise price multiplied by the number of in-the-money options, had all option holders exercised their options on the last day of the period. The intrinsic value is zero if such closing price is less than the exercise price. The table below shows the aggregate intrinsic values at December 31, 2013, 2012, and 2011: 2013 2012 2011 Aggregate intrinsic value (in millions) Less than $0.1 $0.1 $0.2
Weighted-average remaining contractual life of outstanding options 2.1 years 3.2 years 5.1 years
Range of exercise prices $21.92 to $23.81
$18.36 to $23.81
$18.12 to $23.81
Total unrecognized compensation expense (in millions) related to non-vested options and related dividend equivalents granted under the plan
-
Less than $0.1
$0.1
Recognition period - 1 month 1 year
Employee Stock Purchase Plan
Our Employee Stock Purchase Plan (ESPP) permits the grant to eligible employees of options to purchase common stock at 90% of the lower of market value at date of grant or at date of exercise. The lookback feature of this plan is valued at 90% of the Black-Scholes methodology plus 10% of the maximum subscription price. As of December 31, 2013, there were 127,774 shares available for issuance in this plan. 2013 2012 2011 Subscriptions outstanding at December 31, 60,413 70,850 70,756 Maximum subscription price $ 19.58
(1) $ 17.95 $ 17.27
Shares of stock issued 68,099 65,919 69,229 Stock issuance price $ 17.95 $ 17.27 $ 16.06 (1)
Stock will be issued on the closing date of the purchase period, which runs from June 1, 2013 to May 31, 2014.
Assumptions for valuation of these shares are shown in the table below. 2013 2012 2011 Weighted average fair value of grants $ 2.78 $ 3.19 $ 3.17 Risk-free interest rate 0.14% 0.17% 0.18% Dividend yield 4.60% 5.00% 2.60% Expected volatility
(1) 14.00% 24.00% 22.00%
Expected life in months 12 12 12 Grant date 6/1/13 6/1/12 6/1/11 (1)
One-year historic volatility
Stock Unit Plan for Directors
Our Stock Unit Plan for directors (Stock Unit Plan) provides a stock-based compensation program for directors. This plan enhances our ability to attract and retain competent and experienced directors and allows the directors the opportunity to accumulate compensation in the form of common stock units. The Stock Unit Plan also provides directors the opportunity to convert previously earned cash retirement benefits to common stock units. All eligible directors who had benefits under the prior cash retirement plan converted their cash retirement benefits to common stock units. As of December 31, 2013, a total of 400,000 shares were authorized under this plan. Each common stock unit earns dividends in the form of common stock units and can be redeemed for shares of common stock. The number of units granted annually is computed by dividing an annual credit (determined by the Compensation Committee) by the fair market value of our common stock on January 1 of the year the units are granted. Common stock unit dividends are computed based on the fair market value of our stock on the dividend’s record date. We record the related compensation expense at the time we make the accrual for the directors’ benefits as the directors provide services.
THE EMPIRE DISTRICT ELECTRIC COMPANY Notes to Consolidated Financial Statements
69
Shares accrued to directors’ accounts and shares available for issuance under this plan at December 31 are shown in the table below: 2013 2012
Shares accrued to directors’ accounts 154,402 143,058 Shares available for issuance 236,056 258,960
Units accrued for service and dividends as well as units redeemed for common stock at December 31 are shown in the table below: 2013 2012 2011 Units accrued for service and dividends 34,252 30,426 25,287 Units redeemed for common stock 22,908 21,324 31,243
401(k) Plan and ESOP
Our Employee 401(k) Plan and ESOP (the 401(k) Plan) allows participating employees to defer up to 25% of their annual compensation up to an Internal Revenue Service specified limit. We match 50% of each employee’s deferrals by contributing shares of our common stock, with such matching contributions not to exceed 3% of the employee’s eligible compensation. We record the compensation expense at the time the quarterly matching contributions are made to the plan. At December 31, 2013 and 2012, there were 256,448 and 320,576 shares available to be issued, respectively. 2013 2012 2011
Shares contributed 64,128 65,502 68,523
Effective January 1, 2014, new employees, and on January 1, 2015, employees who have elected to convert from our average salary pension formula to a cash balance formula, will be eligible for an enhanced matching contribution. Under the enhancement, we will match 100% of the first 6% a participant defers in the 401(k) Plan. The first 3% of the match will be in shares of our common stock with the remaining portion of the match being in cash (see Note 8).
Dividends
Holders of our common stock are entitled to dividends if, as, and when declared by the Board of Directors, out of funds legally available therefore, subject to the prior rights of holders of any outstanding cumulative preferred stock and preference stock. Payment of dividends is determined by our Board of Directors after considering all relevant factors, including the amount of our retained earnings (which is essentially our accumulated net income less dividend payouts). A reduction of our dividend per share, partially or in whole, could have an adverse effect on our common stock price. The following table shows our diluted earnings per share, dividends paid per share, total dividends paid and retained earnings balance for the years ended December 31, 2013, 2012 and 2011:
(in millions, except per share amounts) 2013 2012 2011 Diluted earnings per share $ 1.48 $ 1.32 $ 1.31 Dividends paid per share
(1) $ 1.005 $ 1.00 $ 0.64
Total dividends paid $ 43.0 $ 42.3 $ 26.7 Retained earnings year-end balance $ 67.6 $ 47.1 $ 33.7
(1) In response to the expected loss of revenues resulting from the May 22, 2011 tornado, our level of retained earnings and other relevant
factors, our Board of Directors suspended our quarterly dividend for the third and fourth quarters of 2011. On February 2, 2012, the Board of Directors re-established the dividend and declared a quarterly dividend of $0.25 per share on common stock payable on March 15, 2012 to holders of record as of March 1, 2012.
Under Kansas corporate law, our Board of Directors may only declare and pay dividends out of our surplus or, if there is no surplus, out of our net profits for the fiscal year in which the dividend is declared or the preceding fiscal year, or both. Our surplus, under Kansas law, is equal to our retained earnings plus accumulated other comprehensive income/(loss), net of income tax. However, Kansas law does permit, under certain circumstances, our Board of Directors to transfer amounts from capital in excess of par value to surplus. In addition, Section 305(a) of the Federal
THE EMPIRE DISTRICT ELECTRIC COMPANY Notes to Consolidated Financial Statements
70
Power Act (FPA) prohibits the payment by a utility of dividends from any funds "properly included in capital account". There are no additional rules or regulations issued by the FERC under the FPA clarifying the meaning of this limitation. However, several decisions by the FERC on specific dividend proposals suggest that any determination would be based on a fact-intensive analysis of the specific facts and circumstances surrounding the utility and the dividend in question, with particular focus on the impact of the proposed dividend on the liquidity and financial condition of the utility. In addition, the EDE Mortgage and our Restated Articles contain certain dividend restrictions. The most restrictive of these is contained in the EDE Mortgage, which provides that we may not declare or pay any dividends (other than dividends payable in shares of our common stock) or make any other distribution on, or purchase (other than with the proceeds of additional common stock financing) any shares of, our common stock if the cumulative aggregate amount thereof after August 31, 1944 (exclusive of the first quarterly dividend of $98,000 paid after said date) would exceed the sum of $10.75 million and the earned surplus (as defined in the EDE Mortgage) accumulated subsequent to August 31, 1944, or the date of succession in the event that another corporation succeeds to our rights and liabilities by a merger or consolidation. On June 9, 2011, we amended the EDE Mortgage in order to provide us with additional flexibility to pay dividends to our shareholders by permitting the payment of any dividend or distribution on, or purchase of, shares of its common stock within 60 days after the related date of declaration or notice of such dividend, distribution or purchase if (i) on the date of declaration or notice, such dividend, distribution or purchase would have complied with the provisions of the EDE Mortgage and (ii) as of the last day of the calendar month ended immediately preceding the date of such payment, our ratio of total indebtedness to total capitalization (after giving pro forma effect to the payment of such dividend, distribution, or purchase) was not more than 0.625 to 1. 5. PREFERRED AND PREFERENCE STOCK We have 2.5 million shares of preference stock authorized, including 0.5 million shares of Series A Participating Preference Stock, none of which have been issued. We have 5 million shares of $10.00 par value cumulative preferred stock authorized. There was no preferred stock issued and outstanding at December 31, 2013 or 2012. 6. LONG-TERM DEBT At December 31, 2013 and 2012, the balance of long-term debt outstanding was as follows (in thousands): 2013 2012 First mortgage bonds (EDE): 7.20% Series due 2016 $ 25,000 $ 25,000 5.875% Series due 2037
(1) 80,000 80,000
6.375% Series due 2018 (1)
90,000 90,000 4.65% Series due 2020
(1) 100,000 100,000
5.20% Series due 2040 (1)
50,000 50,000 3.58% Series due 2027
(1) 88,000 88,000
3.73% Series due 2033 (1)
30,000 - 4.32% Series due 2043
(1) 120,000 -
First mortgage bonds (EDG): 6.82% Series due 2036
(1) 55,000 55,000
638,000 488,000 Senior Notes, 4.50% Series due 2013
(1) - 98,000
Senior Notes, 6.70% Series due 2033 (1)
62,000 62,000 Senior Notes, 5.80% Series due 2035
(1) 40,000 40,000
Other 4,441 5,155 Less unamortized net discount (739) (815) 743,702 692,340 Less current obligations of long-term debt - (415) Less current obligations under capital lease (274) (299) TOTAL LONG-TERM DEBT $ 743,428 $ 691,626
(1) We may redeem some or all of the notes at any time at 100% of their principal amount, plus a make-whole premium, plus accrued and unpaid
interest to the redemption date.

THE EMPIRE DISTRICT ELECTRIC COMPANY Notes to Consolidated Financial Statements
71
Debt Financing Activities
On October 30, 2012, we entered into a Bond Purchase Agreement for a private placement of $30.0 million of 3.73% First Mortgage Bonds due 2033 and $120.0 million of 4.32% First Mortgage Bonds due 2043. The delayed settlement occurred on May 30, 2013. A portion of the proceeds were used to redeem all $98.0 million aggregate principal amount of our Senior Notes, 4.50% Series due June 15, 2013. The remaining proceeds were used for general corporate purposes. The bonds have not been registered under the Securities Act of 1933, as amended, and may not be offered or sold in the United States absent registration or an applicable exemption from registration requirements. The bonds were issued under the EDE Mortgage. On April 2, 2012, we entered into a Bond Purchase Agreement for a private placement of $88 million aggregate principal amount of 3.58% First Mortgage Bonds due April 2, 2027. The first settlement of $38 million occurred on April 2, 2012 and the second settlement of $50 million occurred on June 1, 2012. All bonds of this new series will mature on April 2, 2027. Interest is payable semi-annually on the bonds on each April 2 and October 2, commencing October 2, 2012. The bonds may be redeemed, at our option, at any time prior to maturity, at par plus a make whole premium, together with accrued and unpaid interest, if any, to the redemption date. The bonds have not been registered under the Securities Act of 1933, as amended, and may not be offered or sold in the United States absent registration or an applicable exemption from registration requirements. We used the proceeds from the sale of these bonds to redeem the called bonds discussed above (including repaying short term debt initially used for such purpose). They were issued under the EDE Mortgage. On April 1, 2012, we redeemed all $74.8 million aggregate principal amount of our First Mortgage Bonds, 7.00% Series due 2024. All $5.2 million of our First Mortgage Bonds, 5.20% Pollution Control Series due 2013, and all $8.0 million of our First Mortgage Bonds, 5.30% Pollution Control Series due 2013 were also redeemed with payment made to the trustee prior to March 31, 2012.
Shelf Registration
On December 13, 2013, we filed a $200.0 million shelf registration statement on Form S-3 with the SEC covering our common stock, unsecured debt securities, preference stock, and first mortgage bonds. This shelf registration statement will be effective for a three-year period beginning with the date of filing. We plan to use the proceeds under this shelf to fund capital expenditures, refinance existing debt or general corporate needs during the effective period. The issuance of securities under this shelf is subject to the receipt of local regulatory approvals. We have filed applications for such approvals in all four state jurisdictions in our electric service territory.
EDE Mortgage Indenture
The principal amount of all series of first mortgage bonds outstanding at any one time under the EDE Mortgage is limited by terms of the mortgage to $1 billion. Substantially all of the property, plant and equipment of The Empire District Electric Company (but not its subsidiaries) is subject to the lien of the EDE Mortgage. Restrictions in the EDE mortgage bond indenture could affect our liquidity. The EDE Mortgage contains a requirement that for new first mortgage bonds to be issued, our net earnings (as defined in the EDE Mortgage) for any twelve consecutive months within the fifteen months preceding issuance must be two times the annual interest requirements (as defined in the EDE Mortgage) on all first mortgage bonds then outstanding and on the prospective issue of new first mortgage bonds. Our earnings for the year ended December 31, 2013 would permit us to issue approximately $599.1 million of new first mortgage bonds based on this test with an assumed interest rate of 5.5%. In addition to the interest coverage requirement, the EDE Mortgage provides that new bonds must be issued against, among other things, retired bonds or 60% of net property additions. At December 31, 2013, we had retired bonds and net property additions which would enable the issuance of at least $856.7 million principal amount of bonds if the annual interest requirements are met. However, based on the $1 billion limit on the principal amount of first mortgage bonds outstanding set forth by the EDE mortgage, and our current level of outstanding first mortgage bonds, we are limited to the issuance of $417 million of new first mortgage bonds. As of December 31, 2013, we are in compliance with all restrictive covenants of the EDE Mortgage.
THE EMPIRE DISTRICT ELECTRIC COMPANY Notes to Consolidated Financial Statements
72
EDG Mortgage Indenture
The principal amount of all series of first mortgage bonds outstanding at any one time under the EDG Mortgage is limited by terms of the mortgage to $300 million. Substantially all of the property, plant and equipment of The Empire District Gas Company is subject to the lien of the EDG Mortgage. The EDG Mortgage contains a requirement that for new first mortgage bonds to be issued, the amount of such new first mortgage bonds shall not exceed 75% of the cost of property additions acquired after the date of the Missouri Gas acquisition. The mortgage also contains a limitation on the issuance by EDG of debt (including first mortgage bonds, but excluding short-term debt incurred in the ordinary course under working capital facilities) unless, after giving effect to such issuance, EDG’s ratio of EBITDA (defined as net income plus interest, taxes, depreciation, amortization and certain other non-cash charges) to interest charges for the most recent four fiscal quarters is at least 2.0 to 1. As of December 31, 2013, this test would allow us to issue approximately $15.8 million principal amount of new first mortgage bonds at an assumed interest rate of 5.5%. Our long-term debt obligations over the next five years are as follows (in thousands):
Payments Due By Period Long-Term Debt Payout Schedule (Excluding Unamortized Discount
(in thousands)
Total
Regulated Entity Debt Obligations
Capital Lease Obligations
2014 $ 274 $ - $ 274 2015 292 - 292 2016 25,308 25,000 308 2017 325 - 325 2018 90,347 90,000 347 Thereafter 627,895 625,000 2,895 Total long-term debt obligations 744,441 $ 740,000 $ 4,441
Less current obligations and unamortized discount
1,013
TOTAL LONG-TERM DEBT $ 743,428
7. SHORT-TERM BORROWINGS At December 31, 2013, total short-term borrowings consisted of $4.0 million in commercial paper and no borrowings from our line of credit. During 2013 and 2012 our short-term borrowings outstanding averaged (in millions) 2013 2012
Average borrowings outstanding $ 8.7 $17.8 Highest month end balance $29.0 $55.7
The weighted average interest rates and the weighted average interest rate of borrowings outstanding at December 31, 2013 and 2012 were:. 2013 2012
Weighted average interest rate 0.69% 1.05% Weighted average interest rate of borrowings outstanding
0.33% 0.91%
On January 17, 2012, we entered into the Third Amended and Restated Unsecured Credit Agreement which amended and restated our Second Amended and Restated Unsecured Credit Agreement dated January 26, 2010. This agreement extended the termination date of the revolving credit facility from January 26, 2013 to January 17, 2017. The agreement also removed the letter of credit facility and included a swingline loan facility with a $15 million swingline loan sublimit. The aggregate amount of the revolving credit commitments remains $150 million, inclusive of the $15 million swingline loan sublimit. In addition, the pricing and fees under the facility were amended. Interest on borrowings under the facility accrues at a rate equal to, at our option, (i) the highest of (A) the bank’s prime commercial rate, (B) the federal funds effective rate plus 0.5% or (C) one month LIBOR plus 1.0%, plus a margin or (ii) one month, two month or three month LIBOR, in each case, plus a margin. Each margin is based on our current credit ratings and the pricing schedule in the facility. As of the date hereof, and based on our current credit ratings, the LIBOR margin under the facility is 1.25%. A facility fee is payable quarterly on the full amount of the commitments under the facility

THE EMPIRE DISTRICT ELECTRIC COMPANY Notes to Consolidated Financial Statements
73
based on our current credit ratings (the fee is currently 0.20%). In addition, upon entering into the amended and restated facility, we paid an upfront fee to the revolving credit banks of $262,500 in the aggregate. There were no other material changes to the terms of the facility. The facility is used for working capital, general corporate purposes and to back-up our use of commercial paper. This facility requires our total indebtedness to be less than 62.5% of our total capitalization at the end of each fiscal quarter and our EBITDA (defined as net income plus interest, taxes, depreciation and amortization) to be at least two times our interest charges for the trailing four fiscal quarters at the end of each fiscal quarter. Failure to maintain these ratios will result in an event of default under the credit facility and will prohibit us from borrowing funds thereunder. As of December 31, 2013, we are in compliance with these ratios. Our total indebtedness was 49.8% of our total capitalization as of December 31, 2013 and our EBITDA for 2013 was 5.3 times our interest charges. This credit facility is also subject to cross-default if we default on in excess of $10 million in the aggregate on our other indebtedness. This arrangement does not serve to legally restrict the use of our cash in the normal course of operations. There were no outstanding borrowings under this agreement at December 31, 2013. However, $4.0 million was used to back up our outstanding commercial paper. 8. RETIREMENT BENEFITS We record retirement benefits in accordance with the ASC guidance on accounting for pension and other postretirement benefits, and have recorded the appropriate liabilities to reflect the unfunded status of our benefit plans, with offsetting entries to a regulatory asset, because we believe it is probable the unfunded amount of these plans will be afforded rate recovery. Additionally, the MPSC agreed that the effects of purchase accounting entries related to pension and other post-retirement benefits would be recoverable in future rate proceedings. These amounts were recorded as regulatory assets and are being amortized. The tax effects of these entries are reflected as deferred tax assets and liabilities and regulatory liabilities. Annually we evaluate the discount rate, retirement age, compensation rate increases, expected return on plan assets and healthcare cost trend rate assumptions related to pension benefit and post-retirement medical plan. We utilize an interest rate yield curve to determine an appropriate discount rate. The yield curve is constructed based on the yields on over 500 high-quality, non-callable corporate bonds with maturities between zero and thirty years. A theoretical spot rate curve constructed from this yield curve is then used to discount the annual benefit cash flows of the Empire pension plan and develop a single point discount rate matching the plan’s payout structure. In evaluating these assumptions, many factors are considered, including, current market conditions, asset allocations, changes in demographics and the views of leading financial advisors and economists. In evaluating the expected retirement age assumption, we consider the retirement ages of past employees eligible for pension and medical benefits together with expectations of future retirement ages. It is reasonably possible that changes in these assumptions will occur in the near term and, due to the uncertainties inherent in setting assumptions, the effect of such changes could be material to the Company’s consolidated financial statements. A roll forward technique is used to value the year ending pension obligations. The roll forward technique values the year-end obligation by rolling forward the beginning-of-year obligation using the demographic assumptions shown below. The economic assumptions are updated as of the end of the year. All of the benefit plans have been measured as of December 31, 2013, consistent with previous years. See Note 1.
Pensions
Our noncontributory defined benefit pension plan includes all employees meeting minimum age and service requirements. The benefits are based on years of service and the employee’s average annual basic earnings. During 2013 changes were made to the benefits calculation for all employees hired after January 1, 2014. The benefit for employees hired after this date will accrue based on a cash balance methodology, with an enhanced 401(k) contribution. Additionally, employees hired prior to January 1, 2014 will be given the option to convert to the cash balance formula, or remain with the average annual basic earnings formula which will now allow for a lump sum distribution, with a decision to be made by December 31, 2014. Additionally, during 2013, for a limited period of time, we permitted former participants with a vested benefit in the plan, to take a lump sum distribution of their benefit. Our actuary has considered these changes in the calculations below. Annual contributions to the plan are at least equal to the greater of either minimum funding requirements of ERISA or the accrued cost of the Plan, as required by the Missouri Public Service Commission. We also have a supplemental

THE EMPIRE DISTRICT ELECTRIC COMPANY Notes to Consolidated Financial Statements
74
retirement program (“SERP”) for designated officers of the Company, which we fund from Company funds as the benefits are paid. Our net pension liability decreased $49.2 million in 2013. The decrease was recorded as a decrease in regulatory assets as we believe it is probable of recovery through customer rates based on rate orders received in our jurisdictions. Our contribution is estimated to be approximately $12 million for 2014. We expect future pension funding commitments to continue at least at the level of our accrued cost, as required by our regulator. The actual minimum funding requirements will be determined based on the results of the actuarial valuations and, in the case of 2015, the performance of our pension assets during 2014. Expected benefit payments are as follows (in millions):
Year Payments from Trust Payments from Company Funds
2014 $19.6 $0.4 2015 20.5 0.4 2016 19.8 0.4 2017 20.7 0.5 2018 19.8 0.4 2019-2023 92.4 2.5
Other Postretirement Benefits (OPEB)
We provide certain healthcare and life insurance benefits to eligible retired employees, their dependents and survivors through trusts we have established. Participants generally become eligible for retiree healthcare benefits after reaching age 55 with 5 years of service. Employees hired after January 1, 2014 will be offered unsubsidized retiree healthcare benefits upon retirement. Our net liability decreased $20.8 million in 2013. The decrease was recorded as a reduction in regulatory assets as we believe it is probable of recovery through customer rates based on rate orders received in our jurisdictions. Our funding policy is to contribute annually an amount at least equal to the actuarial cost of postretirement benefits. We expect to be required to fund approximately $3.0 million in 2014. Estimated benefit payments are as follows (in millions):
Year
Payments from Trust
Expected Federal Subsidy
Payments from Company Funds
2014 $2.5 $0.3 $0.1 2015 2.9 0.3 0.2 2016 3.2 0.4 0.2 2017 3.5 0.4 0.2 2018 3.8 0.5 0.2 2019-2023 23.2 3.2 0.9
The following tables set forth the Company’s benefit plans’ projected benefit obligations, the fair value of the plans’ assets and the funded status (in thousands). Reconciliation of Projected Benefit
Obligations: Pension SERP OPEB
2013 2012 2013 2012 2013 2012 Benefit obligation at beginning of year $ 248,004 $ 215,088 $ 6,365 $ 4,863 $ 94,738 $ 83,226 Service cost 7,454 6,261 135 51 2,941 2,401 Interest cost 10,063 10,258 315 263 3,827 4,037 Net actuarial (gain)/loss (23,300) 25,882 604 1,511 (12,767) 6,955 Plan participant’s contribution - - - - 949 910 Benefits and expenses paid (17,090) (9,485) (311) (323) (4,396) (3,156) Federal subsidy - - - - 40 365 Benefit obligation at end of year $ 225,131 $ 248,004 $ 7,108 $ 6,365 $ 85,332 $ 94,738

THE EMPIRE DISTRICT ELECTRIC COMPANY Notes to Consolidated Financial Statements
75
Reconciliation of Fair Value of Plan
Assets: Pension SERP OPEB
2013 2012 2013 2012 2013 2012 Fair value of plan assets at beginning of year
$ 160,175
$ 140,975
$ -
$ -
$ 67,667
$ 58,384
Actual return on plan assets – gain/(loss)
27,260
17,562
- - 10,361
7,148
Employer contribution 16,202 11,123 - - 4,360 3,970 Benefits paid (17,090) (9,485) - - (4,229) (3,045) Plan participant’s contribution - - - - 901 864 Federal subsidy - - - - 38 346 Fair value of plan assets at end of year
$ 186,547
$ 160,175
$ -
$ -
$ 79,098
$ 67,667
Reconciliation of Funded Status: Pension SERP OPEB 2013 2012 2013 2012 2013 2012
Fair value of plan assets $ 186,547 $ 160,175 $ - $ - $ 79,098 $ 67,667 Projected benefit obligations (225,131) (248,004) (7,108) (6,365) (85,332) (94,738) Funded status $(38,584) $(87,829) $ (7,108) $ (6,365) $ (6,234) $(27,071)
The employee pension plan accumulated benefit obligation at December 31, 2013 and 2012 is presented in the following table (in thousands):
Pension Benefits SERP 2013 2012 2013 2012
Accumulated benefit obligation $201,258 $219,659 $5,702 $6,014
Amounts recognized in the balance sheet consist of (in thousands):
Pension SERP OPEB
2013 2012 2013 2012 2013 2012 Accounts Payable and Accrued Liabilities
$ -
$ -
$ 372
$ 313
$ 147
$ 144
Pension and other postretirement benefit obligation
$ 38,584 $ 87,829 $ 6,736 $ 6,052 $ 6,087 $ 26,927
Net periodic benefit pension cost for 2013, 2012 and 2011, some of which is capitalized as a component of labor cost and some of which is deferred as a regulatory asset (see Note 3), is comprised of the following components (in thousands): Net Periodic Pension Benefit
Cost: Pension OPEB 2013 2012 2011 2013 2012 2011
Service cost $ 7,454 $ 6,261 $ 5,596 $ 2,941 $ 2,401 $ 2,266 Interest cost 10,063 10,258 10,405 3,827 4,037 4,383 Expected return on plan assets (12,428) (12,309) (11,139) (4,353) (4,135) (4,157) Amortization of prior service cost
(1) 532 531 532 (1,011) (1,011) (1,011)
Amortization of actuarial loss(1)
10,445 7,935 5,494 2,261 1,661 1,762 Net periodic benefit cost $ 16,066 $ 12,676 $ 10,888 $ 3,665 $ 2,953 $ 3,243
Net Periodic Pension Benefit
Cost:
SERP 2013 2012 2011
Service cost $ 135 $ 51 $ 93 Interest cost 315 263 183 Expected return on plan assets - - - Amortization of prior service cost
(1) (8) (8) (8)
Amortization of actuarial loss(1)
567 389 171 Net periodic benefit cost $ 1,009 $ 695 $ 439 (1)
Amounts are amortized from our regulatory asset originally recorded upon recognizing our net pension liability on the balance sheet.
THE EMPIRE DISTRICT ELECTRIC COMPANY Notes to Consolidated Financial Statements
76
The tables below present the activity in the regulatory asset accounts for the year (in thousands).
Amount Recognized
Regulatory Assets
Beginning Balance 12/31/12
Current Year Actuarial
(Gain)/Loss
Amortization of Actuarial
Loss
Amortization of Prior Service
(Cost)/Credit
Ending Balance 12/31/13
Pension $ 105,818 (38,132) (10,445) (532) $ 56,709 SERP $ 4,143 604 (567) 8 $ 4,188 OPEB $ 20,311 (18,776) (2,261) 1,011 $ 285
Amount Recognized
Regulatory Assets
Beginning Balance 12/31/11
Current Year Actuarial Loss
Amortization of Actuarial
Loss
Amortization of Prior Service
(Cost)/Credit
Ending Balance 12/31/12
Pension $ 93,656 20,628 (7,935) (531) $ 105,818 SERP $ 3,012 1,512 (389) 8 $ 4,143 OPEB $ 17,020 3,941 (1,661) 1,011 $ 20,311
The following table presents the amount of net actuarial gains / losses, transition obligations / assets and prior period service costs in regulatory assets not yet recognized as a component of net periodic benefit cost. It also shows the amounts expected to be recognized in the subsequent year. The following table presents those items for the employee pension plan and other benefits plan at December 31, 2013, and the subsequent twelve-month period (in thousands):
Pension Benefits SERP OPEB
2013 Subsequent
Period
2013 Subsequent
Period
2013 Subsequent
Period
Net actuarial loss $ 55,261 $ 6,595 $ 4,210 $ 421 $ 3,879 $ 914 Prior service cost (benefit) 1,448 418 (22) (8) (3,594) (1,011) Total $ 56,709 $ 7,013 $ 4,188 $ 413 $ 285 $ (97)
The measurement date used to determine the pension and other postretirement benefits is December 31. The assumptions used to determine the benefit obligation and the periodic costs are as follows:
Weighted-average assumptions used to determine the benefit obligation as of December 31: Pension Benefits OPEB 2013 2012 2013 2012
Discount rate 4.90% 4.00% 5.00% 4.11% Rate of compensation increase 3.50% 3.50% 3.50% 3.50%
Weighted-average assumptions used to determine the net benefit cost (income) as of January 1:
Pension Benefits OPEB 2013 2012 2011 2013 2012 2011
Discount rate 4.00% 4.70% 5.50% 4.11% 4.90% 5.50% Expected return on plan assets 7.75% 7.90% 8.00% 6.52% 6.65% 7.00% Rate of compensation increase 3.50% 3.50% 4.50% 3.50% 3.50% 4.50%
The expected long-term rate of return assumption was based on historical return and adjusted to estimate the potential range of returns for the current asset allocation. The assumed 2013 cost trend rate used to measure the expected cost of healthcare benefits and benefit obligation is 7.5%. Each trend rate decreases 0.50% through 2019 to an ultimate rate of 5.0% in 2019 and subsequent years. The healthcare cost trend rate affects projected benefit obligations. A 1% change in assumed healthcare cost growth rates would have the following effects (in thousands): 1% Increase 1% Decrease Effect on total of service and interest cost $ 1,450 $ (1,115) Effect on post-retirement benefit obligation $ 14,027 $ (11,179)
THE EMPIRE DISTRICT ELECTRIC COMPANY Notes to Consolidated Financial Statements
77
Fair value measurements of plan assets
See Note 15 for a discussion of fair value measurements. The Company believes that it is appropriate for the pension fund to assume a moderate degree of investment risk with diversification of fund assets among different classes (or types) of investments, as appropriate, as a means of reducing risk. Although the pension fund can and will tolerate some variability in market value and rates of return in order to achieve a greater long-term rate of return, primary emphasis is placed on preserving the pension fund’s principal. Full discretion is delegated to the investment managers to carry out investment policy within stated guidelines. The guidelines and performance of the managers are monitored by the Company’s Investment Committee. The following is a description of the valuation methodologies used for assets measured at fair value using significant other observable, or significant unobservable inputs.
Short-term investments: Valued at cost, which approximates fair value. Common/Collective trusts: Valued at the fair value based on audited financials of the trusts. U.S. corporate and foreign issue debt: Valued at quoted market prices when available in an active market. If quoted market prices are not available, then fair values are estimated by using pricing models, quoted prices of securities with similar characteristics, or discounted cash flows. Equity long/short hedge funds: Valued at the net asset value reported in the annual audited financial statements and updated monthly based on changes in the value of the underlying funds reported by the fund manager.
Pension
We utilize fair value in determining the market-related values for the different classes of our pension plan assets. The market-related value is determined based on smoothing actual asset returns in excess of (or less than) expected return on assets over a 5-year period. The Company’s primary investment goals for pension fund assets are based around four basic elements:
1. Preserve capital, 2. Maintain a minimum level of return equal to the actuarial interest rate assumption, 3. Maintain a high degree of flexibility and a low degree of volatility, and 4. Maximize the rate of return while operating within the confines of prudence and safety.
During 2013 we approved a change in investment strategy for the pension plan. The strategy, referred to as a de-risking glide path, seeks to increase the fixed income allocation as the plan’s funded status improves. As the pension plan reaches set funded status milestones, the plan’s assets will be rebalanced to shift more assets from equity to fixed income. The current target allocations for plan assets are approximately 70% return seeking assets, and approximately 30% long duration bonds.

THE EMPIRE DISTRICT ELECTRIC COMPANY Notes to Consolidated Financial Statements
78
The following fair value hierarchy table presents information about the pension fund assets measured at fair value as of December 31, 2013 and December 31, 2012 (in thousands): Fair Value Measurements as of December 31, 2013 Quoted
Prices in Active Markets
for Identical Assets (Level 1)
Significant Other
Observable Inputs (Level 2)
Significant Unobservable
Inputs (Level 3) Total
Percentage of Plan Assets
Short term investments $ 74 $ - $ - $ 74 0.1% Equity securities Common collective trusts - 104,713 - 104,713 56.1% Fixed income Common collective trust - 45,031 - 45,031 24.1% Other types of investments Equity long/short hedge funds - 36,729 36,729 19.7% $ 74 $ 149,744 $ 36,729 $ 186,547 100.0%
Fair Value Measurements as of December 31, 2012 Quoted
Prices in Active Markets
for Identical Assets (Level 1)
Significant Other
Observable Inputs (Level 2)
Significant Unobservable
Inputs (Level 3) Total
Percentage of Plan Assets
Short term investments $ - $ 2,398 $ - $ 2,398 1.5% Equity securities U.S. equity 63,655 - - 63,655 39.7% International equity 22,074 - - 22,074 13.8% Fixed income Common collective trust - 26,110 - 26,110 16.3% U.S. corporate debt - 15,518 - 15,518 9.7% U.S. government debt 1,535 - - 1,535 1.0% Other types of investments Equity long/short hedge funds - - 28,885 28,885 18.0% $ 87,264 $ 44,026 $ 28,885 $ 160,175 100.0%
Fair Value Measurements Using Significant Unobservable Inputs (Level 3) – December 31,
2013 2012 Equity long/short
hedge funds Equity long/short
hedge funds Beginning Balance, January 1, $ 28,885 $ 27,419 Actual return on plan assets: Relating to assets still held at the reporting date (356) 1,466 Relating to assets sold during the period 4,583 - Purchases 26,500 - Sales (22,883) - Settlements - - Transfers into and (out of) Level 3 - - Ending Balance, December 31, $ 36,729 $ 28,885
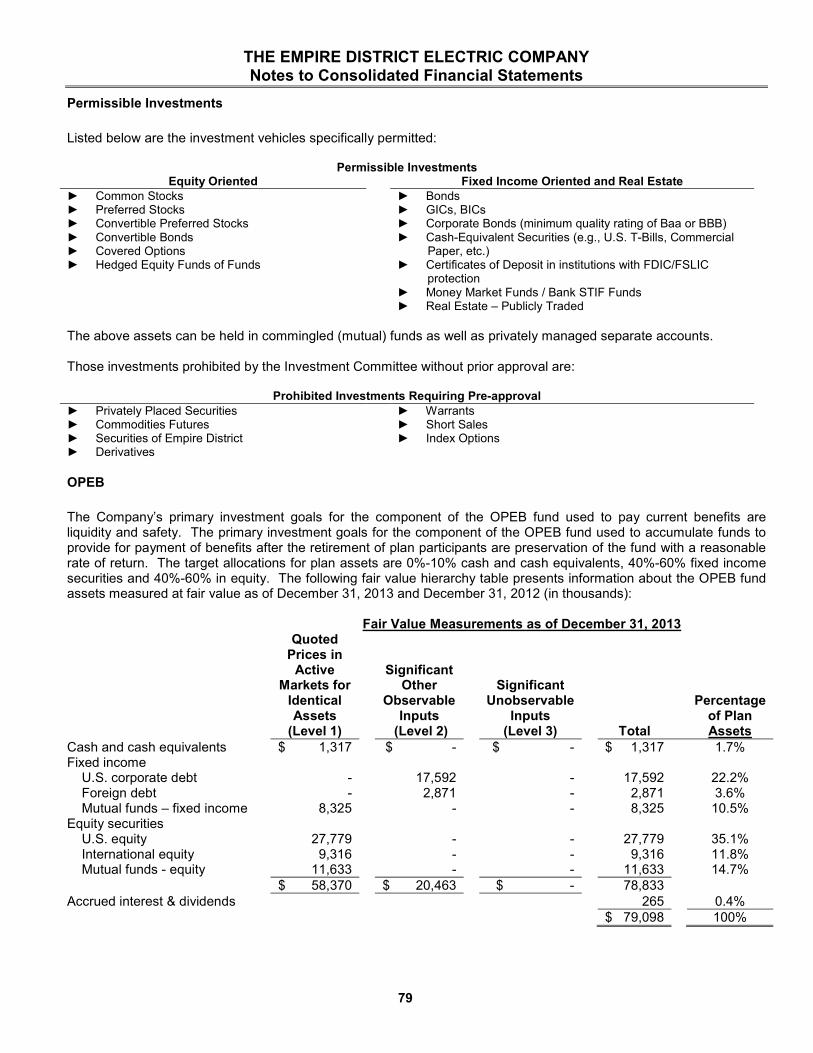
THE EMPIRE DISTRICT ELECTRIC COMPANY Notes to Consolidated Financial Statements
79
Permissible Investments
Listed below are the investment vehicles specifically permitted:
Permissible Investments Equity Oriented Fixed Income Oriented and Real Estate
► Common Stocks ► Bonds ► Preferred Stocks ► GICs, BICs ► Convertible Preferred Stocks ► Corporate Bonds (minimum quality rating of Baa or BBB) ► Convertible Bonds ► Cash-Equivalent Securities (e.g., U.S. T-Bills, Commercial ► Covered Options Paper, etc.) ► Hedged Equity Funds of Funds ► Certificates of Deposit in institutions with FDIC/FSLIC protection ► Money Market Funds / Bank STIF Funds ► Real Estate – Publicly Traded
The above assets can be held in commingled (mutual) funds as well as privately managed separate accounts. Those investments prohibited by the Investment Committee without prior approval are:
Prohibited Investments Requiring Pre-approval
► Privately Placed Securities ► Warrants ► Commodities Futures ► Short Sales ► Securities of Empire District ► Index Options ► Derivatives
OPEB
The Company’s primary investment goals for the component of the OPEB fund used to pay current benefits are liquidity and safety. The primary investment goals for the component of the OPEB fund used to accumulate funds to provide for payment of benefits after the retirement of plan participants are preservation of the fund with a reasonable rate of return. The target allocations for plan assets are 0%-10% cash and cash equivalents, 40%-60% fixed income securities and 40%-60% in equity. The following fair value hierarchy table presents information about the OPEB fund assets measured at fair value as of December 31, 2013 and December 31, 2012 (in thousands): Fair Value Measurements as of December 31, 2013 Quoted
Prices in Active
Markets for Identical Assets (Level 1)
Significant Other
Observable Inputs
(Level 2)
Significant Unobservable
Inputs (Level 3)
Total
Percentage of Plan Assets
Cash and cash equivalents $ 1,317 $ - $ - $ 1,317 1.7% Fixed income U.S. corporate debt - 17,592 - 17,592 22.2% Foreign debt - 2,871 - 2,871 3.6% Mutual funds – fixed income 8,325 - - 8,325 10.5% Equity securities U.S. equity 27,779 - - 27,779 35.1% International equity 9,316 - - 9,316 11.8% Mutual funds - equity 11,633 - - 11,633 14.7% $ 58,370 $ 20,463 $ - 78,833 Accrued interest & dividends 265 0.4% $ 79,098 100%

THE EMPIRE DISTRICT ELECTRIC COMPANY Notes to Consolidated Financial Statements
80
Fair Value Measurements as of December 31, 2012 Quoted
Prices in Active
Markets for Identical Assets (Level 1)
Significant Other
Observable Inputs
(Level 2)
Significant Unobservable
Inputs (Level 3)
Total
Percentage of Plan Assets
Cash and cash equivalents $ 895 $ - $ - $ 895 1.3% Fixed income U.S. government debt 729 - - 729 1.1% U.S. corporate debt - 19,437 - 19,437 28.7% Foreign debt - 2,250 - 2,250 3.3% Mutual funds – fixed income 3,914 - - 3,914 5.8% Equity securities U.S. equity 20,795 - - 20,795 30.7% International equity 1,548 - - 1,548 2.3% Mutual funds - equity 17,818 - - 17,818 26.3% $ 45,699 $ 21,687 $ - 67,386 Accrued interest & dividends 281 0.5% $ 67,667 100%
The Company’s guideline in the management of this fund is to endorse a long-term approach, but not expose the fund to levels of volatility that might adversely affect the value of the assets. Full discretion is delegated to the investment managers to carry out investment policy within stated guidelines. The guidelines and performance of the managers are monitored by the Company’s Investment Committee.
Permissible Investments
Listed below are the investment vehicles specifically permitted:
Permissible Investments Equity Fixed Income
► Common Stocks ► Cash-Equivalent Securities with a maturity of one-year or less ► Preferred Stocks ► Bonds ► Money Market Funds / Bank STIF Funds ► Certificates of Deposit in institutions with FDIC protection ► Corporate Bonds (minimum quality rating of A )
The above assets can be held in commingled (mutual) funds as well as privately managed separate accounts. Listed below are those investments prohibited by the Investment Committee:
Prohibited Investments ► Privately Placed Securities ► Margin Transactions ► Commodities Futures ► Short Sales ► Securities of Empire District ► Index Options ► Derivatives ► Real Estate and Real Property ► Instrumentalities in violation of the Prohibited ► Restricted Stock Transactions Standards of ERISA

THE EMPIRE DISTRICT ELECTRIC COMPANY Notes to Consolidated Financial Statements
81
9. INCOME TAXES Income tax expense components for the years ended December 31 are as follows (in thousands):
2013 2012 2011 Current income taxes: Federal $ 6,726 $ 1,552 $ (8,604) State 2,495 708 (2,120) TOTAL 9,221 2,260 (10,724) Deferred income taxes: Federal 24,954 28,210 39,096 State 3,554 4,018 6,297 TOTAL 28,508 32,228 45,393 Investment tax credit amortization (237) (329) (371) TOTAL INCOME TAX EXPENSE $ 37,492 $ 34,159 $ 34,298
Deferred Income Taxes
Deferred tax assets and liabilities are reflected on our consolidated balance sheets as follows (in thousands):
December 31, Deferred Income Taxes 2013 2012
Current deferred tax assets, net (1)
$ 7,222 $ 13,000 Non-current deferred tax liabilities, net 324,266 301,967 NET DEFERRED TAX LIABILITIES $ 317,044 $ 288,967 (1) Current deferred tax assets are included in prepaid expenses and other on the balance sheets.
Temporary differences related to deferred tax assets and deferred tax liabilities are summarized as follows (in thousands): December 31,
Temporary Differences 2013 2012 Deferred tax assets: Net operating loss $ - $ 13,000 Disallowed plant costs 1,841 1,010 Gains on hedging transactions 1,324 1,389 Plant related basis differences 23,344 21,571 Regulated liabilities related to income taxes 13,576 13,871 Pensions and other post-retirement benefits 544 693 Carry forward of income tax credit 6,374 3,722 Other 1,633 2,262 Total deferred tax assets $ 48,636 $ 57,518 Deferred tax liabilities: Depreciation, amortization and other plant related differences $ 297,175 $ 279,604 Regulated assets related to income 37,806 39,553 Loss on reacquired debt 4,085 4,489 Amortization of intangibles 8,089 7,009 Deferred construction accounting costs 6,977 7,323 Other 11,548 8,507 Total deferred tax liabilities 365,680 346,485 NET DEFERRED TAX LIABILITIES $ 317,044 $ 288,967
Effective Income Tax Rates
The difference between income taxes and amounts calculated by applying the federal legal rate to income tax expense for continuing operations were as follows:

THE EMPIRE DISTRICT ELECTRIC COMPANY Notes to Consolidated Financial Statements
82
Effective Income Tax Rates 2013 2012 2011 Federal statutory income tax rate 35.0% 35.0% 35.0% Increase (decrease) in income tax rate resulting from: State income tax (net of federal benefit) 3.1 3.1 3.1 Investment tax credit amortization (0.2) (0.4) (0.4) Effect of ratemaking on property related differences (1.1) (0.2) 0.2 Other 0.3 0.5 0.5 EFFECTIVE INCOME TAX RATE 37.1% 38.0% 38.4%
Unrecognized Tax Benefits 2013 2012 2011
Unrecognized tax benefits – January 1, $ - $ - $ 359,000 The gross amounts of increases in unrecognized tax benefits taken during prior periods
-
-
-
The gross amounts of decreases in unrecognized tax benefits taken during the period relating to positions accepted by taxing authorities
-
-
- Reductions to unrecognized tax benefits as a result of a lapse of the applicable statute of limitations
-
-
(359,000)
UNRECOGNIZED TAX BENEFITS – December 31, $ - $ - $ -
We do not expect any significant changes to our unrecognized tax benefits over the next twelve months. The reserve balance related to unrecognized tax benefits as of December 31, 2010 was $359,000. With the expiration of the statute of limitations on these unrecognized tax benefits on September 15, 2011, there are no unrecognized tax benefits at December 31, 2013, 2012 and 2011. We received $17.7 million, of investment tax credits based on our investment in Iatan 2. We utilized $0.7 million of these credits when preparing our 2012 tax return. We expect to utilize approximately $10.7 million of these credits on our 2013 tax return. We expect to use the remaining credits on our 2014 tax return. The tax credit will have no significant income statement impact as the credits will flow to our customers as we amortize the tax credits over the life of the plant. The American Taxpayer Relief Act of 2012 (the “Act”) was signed into law on January 2, 2013. The Act restored several expired business tax provisions, including bonus depreciation for 2013. The Company’s 2014 tax payments are expected to be higher than 2013 due to the expiration of bonus depreciation. However, the Company expects to utilize investment tax credits noted above to partially offset the 2014 payments. On September 13, 2013, the IRS and the Treasury Department released final regulations under Sections 162(a) and 263(a) on the deduction and capitalization of expenditures related to tangible property. These regulations apply to tax years beginning on or after January 1, 2014, and the Company plans to utilize the book capitalization method as allowable under the final regulations. The Company expects an immaterial impact to the effective tax rate. 10. COMMONLY OWNED FACILITIES We own a 12% undivided interest in the coal-fired Units No. 1 and No. 2 at the Iatan Generating Station located near Weston, Missouri, 35 miles northwest of Kansas City, Missouri, as well as a 3% interest in the site and a 12% interest in certain common facilities. At December 31, 2013 and 2012, our property, plant and equipment accounts included the amounts in the following chart (in millions): Iatan 2013 2012 Cost of ownership in plant in service $ 367.1 $ 364.1 Accumulated Depreciation $ 91.1 $ 83.2 Expenditures
(1) $ 31.6 $ 30.0
(1) Operating, maintenance, and fuel expenditures excluding depreciation expense.
We are entitled to 12% of each unit’s available capacity and are obligated to pay for that percentage of the operating costs of the units. KCP&L and KCP&L Greater Missouri Operations Co. own 70% and 18% respectively, of Unit 1, and 54% and 18%, respectively, of Unit 2. KCP&L operates the units for the joint owners.

THE EMPIRE DISTRICT ELECTRIC COMPANY Notes to Consolidated Financial Statements
83
We and Westar Generating, Inc, (“WGI”), a subsidiary of Westar Energy, Inc., share joint ownership of a nominal 500-megawatt combined cycle unit at the State Line Power Plant (the “State Line Combined Cycle Unit”). We are responsible for the operation and maintenance of the State Line Combined Cycle Unit, and are entitled to 60% of the available capacity and are responsible for approximately 60% of its costs. At December 31, 2013 and 2012, our property, plant and equipment accounts included the amounts in the following chart (in millions): State Line Combined Cycle Unit 2013 2012 Cost of ownership in plant in service $ 163.3 $164.4 Accumulated Depreciation $ 37.0 $ 36.7 Expenditures
(1) $ 52.6 $ 42.7
(1) Operating, maintenance, and fuel expenditures excluding depreciation expense.
We own a 7.52% undivided interest in the coal-fired Plum Point Energy Station located near Osceola, Arkansas. We are entitled to 7.52% of the station’s capacity, and are obligated to pay for that percentage of the station’s operating costs. At December 31, 2013 and 2012, our property, plant and equipment accounts included the amounts in the following chart (in millions): Plum Point Energy Station 2013 2012 Cost of ownership in plant in service $ 108.2 $108.0 Accumulated Depreciation $ 7.3 $ 4.9 Expenditures
(1) $ 11.3 $ 7.8
(1) Operating, maintenance and fuel expenditures excluding depreciation expense.
All of the dollar amounts listed above represent our ownership share of costs. 11. COMMITMENTS AND CONTINGENCIES We are a party to various claims and legal proceedings arising out of the normal course of our business. Management regularly analyzes this information, and has provided accruals for any liabilities, in accordance with the guidelines presented in the ASC on accounting for contingencies. In the opinion of management, it is not probable, given the company’s defenses, that the ultimate outcome of these claims and lawsuits will have a material adverse effect upon our financial condition, or results of operations or cash flows. (in millions) Firm physical gas
and transportation contracts
Coal and coal transportation contracts
January 1, 2014 through December 31, 2014 $24.9 $23.8 January 1, 2015 through December 31, 2016 $31.4 $28.8 January 1, 2017 through December 31, 2018 $30.2 $22.6 January 1, 2019 and beyond $45.9 $11.3
In addition to the above, we have an agreement with Southern Star Central Pipeline, Inc. to purchase one million Dths of firm gas storage service capacity for our electric business for a period of five years, expiring in April 2016. The reservation charge for this storage capacity is approximately $1.1 million annually. We have entered into long and short-term agreements to purchase coal and natural gas for our energy supply and natural gas operations. Under these contracts, the natural gas supplies are divided into firm physical commitments and derivatives that are used to hedge future purchases. In the event that this gas cannot be used at our plants, the gas would be liquidated at market price. The firm physical gas and transportation commitments are detailed in the table above. We have coal supply agreements and transportation contracts in place to provide for the delivery of coal to the plants. These contracts are written with Force Majeure clauses that enable us to reduce tonnages or cease shipments under certain circumstances or events. These include mechanical or electrical maintenance items, acts of God, war or insurrection, strikes, weather and other disrupting events. This reduces the risk we have for not taking the minimum requirements of fuel under the contracts.
THE EMPIRE DISTRICT ELECTRIC COMPANY Notes to Consolidated Financial Statements
84
Purchased Power
We currently supplement our on-system generating capacity with purchases of capacity and energy from other entities in order to meet the demands of our customers and the capacity margins applicable to us under current pooling agreements and National Electric Reliability Council (NERC) rules. The Plum Point Energy Station (Plum Point) is a 670-megawatt, coal-fired generating facility near Osceola, Arkansas. We own, through an undivided interest, 50 megawatts of the unit’s capacity. We also have a long-term (30 year) agreement for the purchase of capacity from Plum Point. We have the option to purchase an undivided ownership interest in the 50 megawatts covered by the purchased power agreement in 2015. At this time it is not our intention to exercise this option. Rather, we intend to continue to meet our demand and capacity requirements with the continuation of this long-term purchased power agreement. Commitments under this agreement are approximately $297.2 million through August 31, 2039, the end date of the agreement. We have a 20-year purchased power agreement, which began on December 15, 2008, with Cloud County Windfarm, LLC, owned by EDP Renewables North America LLC, Houston, Texas to purchase the energy generated at the approximately 105-megawatt Phase 1 Meridian Way Wind Farm located in Cloud County, Kansas. We do not own any portion of the windfarm. Annual payments are contingent upon output of the facility and can range from zero to a maximum of approximately $14.6 million based on a 20-year average cost. We also have a 20-year contract, which began on December 15, 2005, with Elk River Windfarm, LLC, owned by IBERDROLA RENEWABLES, Inc., to purchase the energy generated at the 150-megawatt Elk River Windfarm located in Butler County, Kansas. We do not own any portion of the windfarm. Annual payments are contingent upon output of the facility and can range from zero to a maximum of approximately $16.9 million based on a 20-year average cost. Payments for these agreements are recorded as purchased power expenses, and, because of the contingent nature of these payments, are not included in the operating lease obligations shown below.
New Construction
On July 9, 2013, we signed a contract with a third party vendor to complete engineering, procurement, and construction activities at our Riverton plant to convert Riverton Unit 12 from a simple cycle combustion turbine to a combined cycle unit. The conversion will include the installation of a heat recovery steam generator (HRSG), steam turbine generator, auxiliary boiler, cooling tower, and other auxiliary equipment. The Air Emission Source Construction Permit necessary for this project was issued by Kansas Department of Health and Environment on July 11, 2013. On January 16, 2012, we signed a contract with a third party vendor to complete environmental retrofits at our Asbury plant. The retrofits will include the installation of a pulse-jet fabric filter (baghouse), circulating dry scrubber and powder activated carbon injection system. This equipment will enable us to comply with the recently finalized Mercury and Air Toxics Standard (MATS). See “Environmental Matters” below for more information and for project costs for both of these projects.
Leases
We have purchased power agreements with Cloud County Windfarm, LLC and Elk River Windfarm, LLC, which are considered operating leases for GAAP purposes. Details of these agreements are disclosed in the Purchased Power section of this note. We also currently have short-term operating leases for two unit trains to meet coal delivery demands, for garage and office facilities for our electric segment and for one office facility related to our gas segment. In addition, we have capital leases for certain office equipment and 108 railcars to provide coal delivery for our ownership and purchased power agreement shares of the Plum Point generating facility. The gross amount of assets recorded under capital leases total $5.5 million at December 31, 2013.

THE EMPIRE DISTRICT ELECTRIC COMPANY Notes to Consolidated Financial Statements
85
Our lease obligations over the next five years are as follows (in thousands):
Capital Leases Operating Leases 2014 $ 553 $ 764 2015 553 722 2016 549 720 2017 547 681 2018 546 646 Thereafter 3,553 485 Total minimum payments 6,301 $ 4,018 Less amount representing interest 1,860 Present value of net minimum lease payments $ 4,441
Expenses incurred related to operating leases were $0.8 million, $0.9 million and $1.0 million for 2013, 2012, and 2011, respectively, excluding payments for wind generated purchased power agreements. The accumulated amount of amortization for our capital leases was $1.3 million and $1.0 million at December 31, 2013 and 2012, respectively.
Environmental Matters
We are subject to various federal, state, and local laws and regulations with respect to air and water quality and with respect to hazardous and toxic materials and hazardous and other wastes, including their identification, transportation, disposal, record-keeping and reporting, as well as remediation of contaminated sites and other environmental matters. We believe that our operations are in material compliance with present environmental laws and regulations. Environmental requirements have changed frequently and become more stringent over time. We expect this trend to continue. While we are not in a position to accurately estimate compliance costs for any new requirements, we expect any such costs to be material, although recoverable in rates.
Electric Segment
The Federal Clean Air Act (CAA) and comparable state laws regulate air emissions from stationary sources such as electric power plants through permitting and/or emission control and related requirements. These requirements include maximum emission limits on our facilities for sulfur dioxide (SO2), particulate matter, nitrogen oxides (NOx), carbon monoxide (CO), and hazardous air pollutants including mercury. In the future they will include limits on greenhouse gases (GHG) such as carbon dioxide (CO2).
Compliance Plan
In order to comply with current and forthcoming environmental regulations, Empire is taking actions to implement its compliance plan and strategy (Compliance Plan). The Mercury Air Toxic Standards (MATS) and the Clean Air Interstate Rule (CAIR) and its subsequent replacement rule, both regulations which we discuss further below, are the drivers behind our Compliance Plan and its implementation schedule. The MATS, which was published for power plants by the Environmental Protection Agency (EPA) in 2011, requires reductions in mercury, acid gases and other emissions considered hazardous air pollutants (HAPS). It became effective in April 2012 and requires full compliance by April 16, 2015 (with flexibility for extensions for reliability reasons). The Cross State Air Pollution Rule (CSAPR – formerly the Clean Air Transport Rule, or CATR) was first proposed by the EPA in July 2010 as a replacement of CAIR and was set to take effect on January 1, 2012. CSAPR was stayed in late December 2011, then vacated by court order in August 2012. Consequently, CAIR will remain in effect until a valid replacement is developed by the EPA. We anticipate compliance costs associated with the MATS and CAIR (or its subsequent replacement) regulations to be recoverable in our rates. Our Compliance Plan largely follows the preferred plan presented in our Integrated Resource Plan (IRP), filed in mid-2013 with the MPSC. As described above under New Construction, we are in the process of installing a scrubber, fabric filter, and powder activated carbon injection system at our Asbury plant. The addition of this air quality control equipment is expected to be completed by early 2015 at a cost ranging from $112.0 million to $130.0 million, excluding AFUDC. Construction costs through December 31, 2013 were $83.6 million for the project to date, excluding AFUDC. This addition required the retirement of Asbury Unit 2, a steam turbine rated at 14 megawatts that was used for peaking purposes. Asbury Unit 2 was retired on December 31, 2013.

THE EMPIRE DISTRICT ELECTRIC COMPANY Notes to Consolidated Financial Statements
86
In September 2012, we completed the transition of our Riverton Units 7 and 8 from operation on coal and natural gas to operating completely on natural gas. Riverton Units 7 and 8, along with Riverton Unit 9, a small combustion turbine that requires steam from Unit 7 or 8 for start-up, will be retired upon the conversion of Riverton Unit 12, a simple cycle combustion turbine, to a combined cycle unit. This conversion is currently scheduled to be completed in mid-2016 at a cost estimated to range from $165 million to $175 million, excluding AFUDC. This amount is included in our five-year capital expenditure plan. Construction costs, consisting of pre-engineering and site preparation activities thus far, through December 31, 2013 were $13 million for 2013 and $13.6 million for the project to date, excluding AFUDC.
Air Emissions
The CAA regulates the amount of NOx and SO2 an affected unit can emit. As currently operated, each of our affected units is in compliance with the applicable NOx and SO2 limits. Currently, NOx emissions are regulated by the CAIR and National Ambient Air Quality Standard (NAAQS) rules for ozone (discussed below). SO2 emissions are currently regulated by the Title IV Acid Rain Program and the CAIR. The EPA is expected to propose a CSAPR replacement, which if finalized and upheld, would also replace CAIR. In the meantime, both the Title IV Acid Rain Program and CAIR will remain in effect. CAIR: The CAIR generally calls for fossil-fueled power plants greater than 25 megawatts to reduce emission levels of SO2 and/or NOx in 28 eastern states and the District of Columbia, including Missouri, where our Asbury, Energy Center, State Line and Iatan Units No. 1 and No. 2 are located. Kansas was not included in CAIR and our Riverton Plant was not affected. Arkansas, where our Plum Point Plant is located, was included for ozone season NOx but not for SO2. SO2 allowance allocations under the Title IV Acid Rain Program are used for compliance in the CAIR SO2 Program. Based on current SO2 allowance usage projections, we expect to have sufficient allowances to take us through 2018. Pursuant to the CAIR regulations, we had excess NOx allowances during 2013 which were banked for future use and will be sufficient for compliance through at least the middle of 2015. Mercury Air Toxics Standard (MATS): As described above, the MATS standard became effective in April 2012, and requires compliance by April 2015 (with flexibility for extensions for reliability reasons). For all existing and new coal-fired electric utility steam generating units (EGUs), the MATS standard will be phased in over three years, and allows states the ability to give facilities a fourth year to comply. On March 28, 2013, the EPA finalized updates to certain emission limits for new power plants under the MATS. The new standards affect only new coal and oil-fired power plants that will be built in the future. The update does not change the final emission limits or other requirements for existing power plants. National Ambient Air Quality Standards (NAAQS): Under the CAA, the EPA sets NAAQS for certain emissions considered harmful to public health and the environment, including particulate matter (PM), NOx, CO, SO2, and ozone which result from fossil fuel combustion. Our facilities are currently in compliance with all applicable NAAQS. In January 2013, the EPA finalized the revised PM 2.5 primary annual standard at 12 ug/m
3 (micrograms per cubic
meter of air). States are required to meet the primary standard in 2020. The standard should have no impact on our existing generating fleet because the regional ambient monitor results are below the PM 2.5 required level. However, the PM 2.5 standards could impact future major modifications/construction projects that require additional permits. Ozone, also called ground level smog, is formed by the mixing of NOx and Volatile Organic Compounds (VOCs) in the presence of sunlight. Based on the current standard, our service territory is designated as attainment, meaning that it is in compliance with the standard. A revised Ozone NAAQS is expected to be proposed by the EPA in early 2014.

THE EMPIRE DISTRICT ELECTRIC COMPANY Notes to Consolidated Financial Statements
87
Greenhouse Gases (GHGs):
Under regulations known as the Tailoring Rule, the EPA regulates carbon dioxide and other GHG emissions from certain stationary sources. EDE and EDG’s GHG emissions for 2011, 2012, and 2013 have been reported to the EPA as required by the Tailoring Rule. In addition to the Tailoring Rule, there are a number of federal and state regulatory initiatives aimed at the regulation of GHGs. However, because of the uncertainties regarding future GHG regulation (discussed below), the ultimate cost of compliance cannot be determined at this time. In any case, we expect the cost of complying with any such regulations to be recoverable in our rates. In April 2012, the EPA proposed a Carbon Pollution Standard for new power plants to limit the amount of carbon emitted by EGUs. This standard was rescinded, and a re-proposal of standards of performance for affected fossil fuel-fired EGUs was published in January 2014. The proposed rule applies only to new EGUs and sets separate standards for natural gas-fired combustion turbines and for fossil fuel-fired utility boilers. The proposal would not apply to existing units, including modifications such as those required to meet other air pollution standards which are currently being undertaken at our Asbury facility and at the Riverton facility with the conversion of simple cycle Unit 12 to combined cycle. In response to President Obama’s June 2013 memorandum to the EPA regarding carbon pollution standards for the power industry, the EPA is undertaking a process to identify approaches to establish GHG standards for currently operating power plants. The memorandum requested that the EPA issue proposed GHG standards, for modified, reconstructed, and existing power plants by June 1, 2014; issue final standards, regulations, or guidelines, for modified, reconstructed, and existing power plants by June 1, 2015; and include in the guidelines addressing existing power plants a requirement that states submit implementation plans to the EPA by June 30, 2016. In October 2013, the U.S. Supreme Court agreed to review an appeals court decision that said the EPA could regulate GHG emissions from fixed sources based on a previous decision on GHG emissions from cars. In addition, certain states in which we have EGUs have taken steps to develop cap and trade programs and/or other regulatory systems to measure and report Carbon Dioxide Equivalent (CO2e) emissions that may or may not be more stringent than any federal requirements. However, at this time such states are not proposing regulatory systems pending federal legislative developments.
Water Discharges
We operate under the Kansas and Missouri Water Pollution Plans pursuant to the Federal Clean Water Act (CWA). Our plants are in material compliance with applicable regulations and have received all necessary discharge permits. The Riverton Units 7 and 8 and Iatan Unit 1, which utilize once-through cooling water, were affected by regulations for Cooling Water Intake Structures issued by the EPA under the CWA Section 316(b) Phase II. In 2007, the United States Court of Appeals remanded key sections of these CWA regulations to the EPA. The EPA suspended the regulations. Following a series of court approved delays; the EPA was obligated to finalize the rule by January 14, 2014, a deadline the EPA missed but which may again be extended. We will not know the full impact of these rules until they are finalized. If adopted in their present form, we expect the regulations to have a limited impact at Riverton. The retirement of units 7 and 8 is scheduled in 2016. A new intake structure design and cooling tower will be constructed as part of the Unit 12 conversion at Riverton. Impacts at Iatan 1 could range from flow velocity reductions or traveling screen modifications for fish handling to installation of a closed cycle cooling tower retrofit. Our new Iatan Unit 2 and Plum Point Unit 1 are covered by the proposed regulation, but were constructed with cooling towers, the proposed Best Technology Available. We expect them to be unaffected or minimally impacted by the final rule.
Surface Impoundments
We own and maintain coal ash impoundments located at our Riverton and Asbury Power Plants. Additionally, we own a 12% interest in a coal ash impoundment at the Iatan Generating Station and a 7.52% interest in a coal ash impoundment at Plum Point. On April 19, 2013, the EPA signed a notice of proposed rulemaking to revise its

THE EMPIRE DISTRICT ELECTRIC COMPANY Notes to Consolidated Financial Statements
88
wastewater effluent limitation guidelines and standards under the CWA for coal-fired power plants. The proposal calls for updates to operating permits beginning in July 2017. Once the new guidelines are issued, the EPA and states would incorporate the new standards into wastewater discharge permits, including permits for coal ash impoundments. We do not have sufficient information at this time to estimate additional costs that might result from any new standards. All of our coal ash impoundments are compliant with existing state and federal regulations. In June 2010, the EPA proposed to regulate coal combustion residuals (CCRs) under the Federal Resource Conservation and Recovery Act (RCRA). In the proposal, the EPA presented two options: (1) regulation of CCR under RCRA subtitle C as a hazardous waste and (2) regulation of CCR under RCRA subtitle D as a non-hazardous waste. It is anticipated that the final regulation will be published in 2014. We expect compliance with either option to result in the need to construct a new landfill and the conversion of existing ash handling from a wet to a dry system(s) at a potential cost of up to $15 million at our Asbury Power Plant. This preliminary estimate will likely change based on the final CCR rule and its requirements. We expect resulting costs to be recoverable in our rates. As a result of the transition from coal to natural gas fuel for Riverton Units 7 and 8, closure of the Riverton ash impoundment is in progress in compliance with Kansas regulations. We expect to complete the closure in early 2014. We have received preliminary permit approval in Missouri for a new utility waste landfill adjacent to the Asbury plant. Construction of the new landfill is expected in 2016.
Renewable Energy
Missouri regulations currently require Empire and other investor-owned utilities in Missouri to generate or purchase electricity from renewable energy sources, such as solar, wind, biomass and hydro power, or purchase Renewable Energy Credits (RECs), in amounts equal to at least 5% of retail sales in 2014, increasing to at least 15% by 2021. We are currently in compliance with this regulatory requirement as a result of purchased power agreements with Cloud County Windfarm, LLC, located in Cloud County, Kansas and Elk River Windfarm, LLC, located in Butler County, Kansas. The regulations also require that 2% of the energy from renewable energy sources must be solar; however, we are exempted by statute from that solar requirement. On January 30, 2013, a complaint was filed with the MPSC by Renew Missouri and others regarding several aspects of our 2011 Renewable Energy Standard (RES) Compliance Report and our 2012-2014 RES Compliance Plan. That complaint also again raised a challenge to our statutory exemption from the solar requirement. In two separate orders, in late 2013, the MPSC granted our motions to dismiss all counts of the complaint against Empire. On January 3, 2014, the Commission issued an order denying the complainants’ application for rehearing on all issues related to their challenge of the solar exemption statute. Kansas established a renewable portfolio standard (RPS), effective November 19, 2010. It requires 10% of our Kansas retail customer peak capacity requirements to be sourced from renewables in 2012, increasing to 15% by 2016, and 20% by 2020. We are currently in compliance with this regulatory requirement as a result of purchased power agreements with Cloud County Windfarm, LLC, located in Cloud County, Kansas and Elk River Windfarm, LLC, located in Butler County, Kansas. In addition, there are several proposals currently before the U.S. Congress to adopt a nationwide RPS. 12. SEGMENT INFORMATION We operate our business as three segments: electric, gas and other. As part of our electric segment, we also provide water service to three towns in Missouri. The Empire District Gas Company is our wholly owned subsidiary formed to provide gas distribution service in Missouri. The other segment consists of our non-regulated businesses which is primarily our fiber optics business.
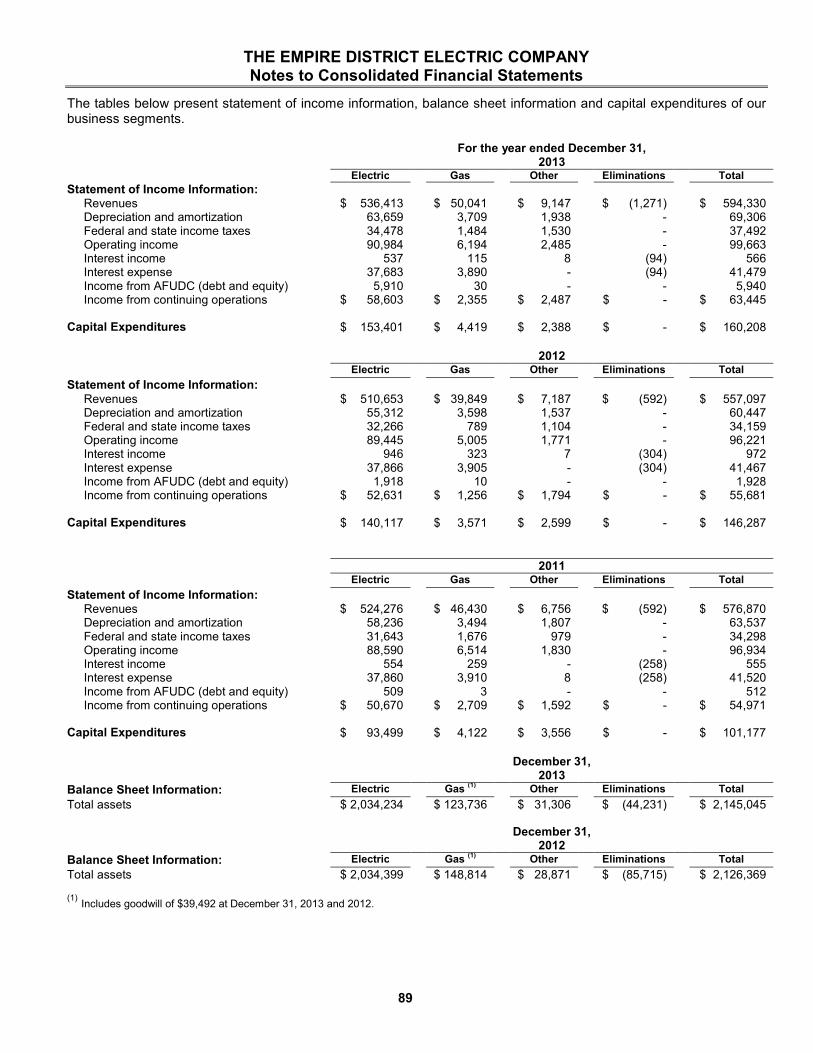
THE EMPIRE DISTRICT ELECTRIC COMPANY Notes to Consolidated Financial Statements
89
The tables below present statement of income information, balance sheet information and capital expenditures of our business segments.
For the year ended December 31, 2013 Electric Gas Other Eliminations Total
Statement of Income Information: Revenues $ 536,413 $ 50,041 $ 9,147 $ (1,271) $ 594,330 Depreciation and amortization 63,659 3,709 1,938 - 69,306 Federal and state income taxes 34,478 1,484 1,530 - 37,492 Operating income 90,984 6,194 2,485 - 99,663 Interest income 537 115 8 (94) 566 Interest expense 37,683 3,890 - (94) 41,479 Income from AFUDC (debt and equity) 5,910 30 - - 5,940 Income from continuing operations $ 58,603 $ 2,355 $ 2,487 $ - $ 63,445 Capital Expenditures $ 153,401 $ 4,419 $ 2,388 $ - $ 160,208
2012
Electric Gas Other Eliminations Total
Statement of Income Information: Revenues $ 510,653 $ 39,849 $ 7,187 $ (592) $ 557,097 Depreciation and amortization 55,312 3,598 1,537 - 60,447 Federal and state income taxes 32,266 789 1,104 - 34,159 Operating income 89,445 5,005 1,771 - 96,221 Interest income 946 323 7 (304) 972 Interest expense 37,866 3,905 - (304) 41,467 Income from AFUDC (debt and equity) 1,918 10 - - 1,928 Income from continuing operations $ 52,631 $ 1,256 $ 1,794 $ - $ 55,681 Capital Expenditures $ 140,117 $ 3,571 $ 2,599 $ - $ 146,287
2011
Electric Gas Other Eliminations Total
Statement of Income Information: Revenues $ 524,276 $ 46,430 $ 6,756 $ (592) $ 576,870 Depreciation and amortization 58,236 3,494 1,807 - 63,537 Federal and state income taxes 31,643 1,676 979 - 34,298 Operating income 88,590 6,514 1,830 - 96,934 Interest income 554 259 - (258) 555 Interest expense 37,860 3,910 8 (258) 41,520 Income from AFUDC (debt and equity) 509 3 - - 512 Income from continuing operations $ 50,670 $ 2,709 $ 1,592 $ - $ 54,971 Capital Expenditures $ 93,499 $ 4,122 $ 3,556 $ - $ 101,177
December 31, 2013 Balance Sheet Information: Electric Gas
(1) Other Eliminations Total
Total assets $ 2,034,234 $ 123,736 $ 31,306 $ (44,231) $ 2,145,045 December 31, 2012 Balance Sheet Information: Electric Gas
(1) Other Eliminations Total
Total assets $ 2,034,399 $ 148,814 $ 28,871 $ (85,715) $ 2,126,369 (1)
Includes goodwill of $39,492 at December 31, 2013 and 2012.

THE EMPIRE DISTRICT ELECTRIC COMPANY Notes to Consolidated Financial Statements
90
13. SELECTED QUARTERLY INFORMATION (UNAUDITED) The following is a summary of quarterly results for 2013 and 2012 (dollars in thousands except per share amounts): Quarters
Quarterly Results for 2013 First Second Third Fourth Operating revenues $ 151,140 $ 136,646 $ 157,486 $ 149,058 Operating income $ 21,858 $ 21,110 $ 32,896 $ 23,799 Net Income $ 12,630 $ 11,658 $ 23,996 $ 15,162 Basic and Diluted Earnings Per Share $ 0.30 $ 0.27 $ 0.56 $ 0.35
Quarters
Quarterly Results for 2012 First Second Third Fourth Operating revenues $ 137,144 $ 131,632 $ 159,202 $ 129,119 Operating income $ 20,810 $ 20,762 $ 35,282 $ 19,367 Net Income $ 9,804 $ 10,708 $ 25,542 $ 9,627 Basic and Diluted Earnings Per Share $ 0.23 $ 0.25 $ 0.60 $ 0.23
The sum of the net income and quarterly earnings per share of common stock may not equal the net income and earnings per share of common stock as computed on an annual basis due to rounding. 14. RISK MANAGEMENT AND DERIVATIVE FINANCIAL INSTRUMENTS We engage in hedging activities in an effort to minimize our risk from volatile natural gas prices and power cost risk associated with exposure to congestion costs. We enter into both physical and financial contracts with counterparties relating to our future natural gas requirements that lock in prices (with respect to a range of predetermined percentages of our expected future natural gas needs) in an attempt to lessen the volatility in our fuel expenditures and gain predictability. Beginning in 2013, we also acquire Transmission Congestion Rights (TCR) in an attempt to lessen the cost of power we will purchase from the SPP Integrated Market due to congestion costs. TCRs entitle the holder to a stream of revenues (or charges) based on the day-ahead congestion on the TCR path. TCRs can be purchased or self-converted using rights allocated based on prior investments made in the transmission system. We recognize that if risk is not timely and adequately balanced or if counterparties fail to perform contractual obligations, actual results could differ materially from intended results. All derivative instruments are recognized at fair value on the balance sheet with the unrealized losses or gains from derivatives used to hedge our fuel and purchased power costs in our electric segment recorded in regulatory assets or liabilities. All gains and losses from derivatives related to the gas segment are also recorded in regulatory assets or liabilities. This is in accordance with the ASC guidance on regulated operations, given that those regulatory assets and liabilities are probable of recovery through our fuel adjustment mechanism. Risks and uncertainties affecting the determination of fair value include: market conditions in the energy industry, especially the effects of price volatility, regulatory and global political environments and requirements, fair value estimations on longer term contracts, the effectiveness of the derivative instrument in hedging the change in fair value of the hedged item, estimating underlying fuel demand and counterparty ability to perform. If we estimate that we have overhedged forecasted demand, the gain or loss on the overhedged portion will be recognized immediately as fuel and purchased power expense in our Consolidated Statement of Income and subject to our fuel adjustment clause.

THE EMPIRE DISTRICT ELECTRIC COMPANY Notes to Consolidated Financial Statements
91
As of December 31, 2013 and 2012, we have recorded the following assets and liabilities representing the fair value of derivative financial instruments held as of December 31, (in thousands):
ASSET DERIVATIVES 2013 2012 Non-designated hedging
instruments due to regulatory accounting
Balance Sheet Classification Fair
Value Fair
Value
Natural gas contracts, gas segment Current assets $ 35 $ 3 Non-current assets and deferred
charges- Other - 17
Natural gas contracts, electric segment Current assets 467 93 Non-current assets and deferred
charges- Other 41 174
Transmission congestion rights, electric segment Current assets 1,967 - Total derivatives assets $ 2,510 $ 287
LIABILITY DERIVATIVES 2013 2012
Non-designated as hedging instruments due to regulatory accounting
Balance Sheet Classification
Fair Value
Fair Value
Natural gas contracts, gas segment Current liabilities $ 8 $ 104 Non-current liabilities and deferred
credits - -
Natural gas contracts, electric segment Current liabilities 1,881 3,299 Non-current liabilities and deferred
credits 2,799 3,819
Transmission congestion rights, electric segment Current liabilities - - Total derivatives liabilities $ 4,688 $ 7,222
Electric
At December 31, 2013, approximately $1.9 million of unrealized losses are applicable to financial instruments which will settle within the next twelve months. There were no “mark-to-market” pre-tax gains/(losses) from ineffective portions of our hedging activities for the electric segment for the years ended December 31, 2013 and 2012, respectively. The following tables set forth “mark-to-market” pre-tax gains/ (losses) from non-designated derivative instruments for the electric segment for each of the years ended December 31, (in thousands): Non-Designated Hedging Instruments –
Due to Regulatory Accounting Electric Segment
Balance Sheet Classification of Gain/(Loss) on Derivative
Amount of Gain/(Loss) Recognized on Balance
Sheet
2013 2012 Commodity contracts – electric segment Regulatory
(assets)/liabilities
$ (338)
$ (2,448) Transmission congestion rights – electric segment
Regulatory (assets)/liabilities
1,967
-
Total – Electric Segment $ 1,629 $ (2,448)

THE EMPIRE DISTRICT ELECTRIC COMPANY Notes to Consolidated Financial Statements
92
Non-Designated Hedging Instruments – Due to Regulatory Accounting
Electric Segment
Statement of Operations
Classification of Loss on Derivative
Amount of Gain/(Loss) Recognized in Income on
Derivative
2013 2012 Commodity contracts Fuel and
purchased power expense
$ (2,725)
$ (3,985) Transmission congestion rights – electric segment
Fuel and purchased power expense
81
- Total – Electric Segment $ (2,644) $ (3,985)
We also enter into fixed-price forward physical contracts for the purchase of natural gas, coal and purchased power. These contracts are not subject to fair value accounting because they qualify for the normal purchase normal sale exemption. We have a process in place to determine if any future executed contracts that otherwise qualify for the normal purchase normal sale exception contain a price adjustment feature and will account for these contracts accordingly. At December 31, 2013, the following volumes and percentages of our anticipated volume of natural gas usage for our electric operations for 2014 and the next four years are hedged at the following average prices per Dekatherm (Dth):
Year % Hedged Dth Hedged Physical
Dth Hedged Financial
Average Price
2014 61% 1,560,000 4,640,000 $4.411 2015 41% - 4,010,000 $4.578 2016 22% - 2,100,000 $4.415 2017 10% - 1,050,000 $4.430 2018 0% - - $ -
We utilize the following procurement guidelines for our electric segment, allowing the flexibility to hedge up to 100% of the current year’s and 80% of any future year’s expected requirements while being cognizant of volume risk. The 80% guideline is an annual target and volumes up to 100% can be hedged in any given month. For years beyond year four, additional factors of long term uncertainty (including with respect to required volumes and counterparty credit) are also considered.
Year End of Year Minimum % Hedged
Current Up to 100% First 60% Second 40% Third 20% Fourth 10%
At December 31, 2013, the following transmission congestion rights (TCR) have been obtained from TCR auctions to hedge congestion costs in the SPP Integrated Market:
Year Monthly MWH Hedged $ Value 2014 1,918 $ 1,966,846
Gas
We attempt to mitigate our natural gas price risk for our gas segment by a combination of (1) injecting natural gas into storage during the off-heating season months, (2) purchasing physical forward contracts and (3) purchasing financial

THE EMPIRE DISTRICT ELECTRIC COMPANY Notes to Consolidated Financial Statements
93
derivative contracts. We target to have 95% of our storage capacity full by November 1 for the upcoming winter heating season. As the winter progresses, gas is withdrawn from storage to serve our customers. As of December 31, 2013 we had 0.9 million Dths in storage on the three pipelines that serve our customers. This represents 47% of our storage capacity. The following table sets forth our long-term hedge strategy of mitigating price volatility for our customers by hedging a minimum of expected gas usage for the current winter season and the next two winter seasons by the beginning of the ACA year at September 1 and illustrates our hedged position as of December 31, 2013 (Dth in thousands).
Season
Minimum % Hedged
Dth Hedged Financial
Dth Hedged Physical
Dth in Storage
Actual % Hedged
Current 50% 240,000 - 948,850 59% Second Up to 50% - - - - Third Up to 20% - - - -
A Purchased Gas Adjustment (PGA) clause is included in our rates for our gas segment operations, therefore, we mark to market any unrealized gains or losses and any realized gains or losses relating to financial derivative contracts to a regulatory asset or regulatory liability account on our balance sheet. The following table sets forth “mark-to-market” pre-tax gains / (losses) from derivatives not designated as hedging instruments for the gas segment for the years ended December 31, (in thousands): Non-Designated Hedging Instruments Due to Regulatory Accounting – Gas
Segment
Balance Sheet Classification of Loss on Derivative
Amount of Loss Recognized on Balance Sheet
2013 2012 Commodity contracts Regulatory assets $ (5) $ (461) Total – Gas Segment $ (5) $ (461)
15. FAIR VALUE MEASUREMENTS The accounting guidance on fair value measurements establishes a three-tier fair value hierarchy, which prioritizes the inputs used in measuring fair value. These tiers include: (i) Level 1, defined as quoted prices in active markets for identical instruments; (ii) Level 2, defined as inputs other than quoted prices in active markets that are either directly or indirectly observable; and (iii) Level 3, defined as unobservable inputs in which little or no market data exists, therefore requiring an entity to develop its own assumptions. Our Level 2 fair value measurements consist of both quoted price inputs and inputs that are derived principally from or corroborated by observable market data. Our Level 3 fair value measurements consist of both quoted price inputs and unobservable quoted inputs. The guidance also requires that the fair value measurement of assets and liabilities reflect the nonperformance risk of counterparties and the reporting entity, as applicable. Therefore, using credit default spreads, we factored the impact of our own credit standing and the credit standing of our counterparties, as well as any potential credit enhancements (e.g. collateral) into the consideration of nonperformance risk for both derivative assets and liabilities. The results of this analysis were not material to the financial statements. Our Transmission congestion rights positions (TCR), which are acquired on the SPP Integrated Market, are valued using the most recent monthly auction clearing prices. Our commodity contracts are valued using the market value approach on a recurring basis. The following fair value hierarchy table presents information about our TCR and commodity contracts measured at fair value as of December 31, 2013:
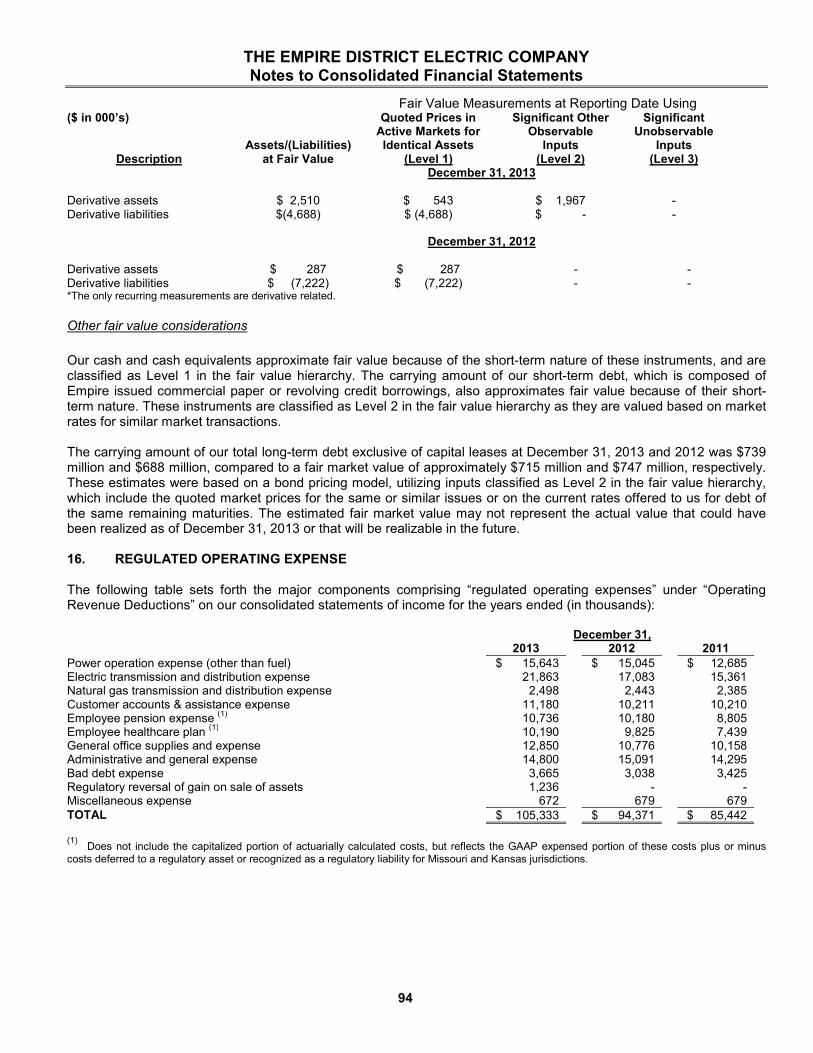
THE EMPIRE DISTRICT ELECTRIC COMPANY Notes to Consolidated Financial Statements
94
Fair Value Measurements at Reporting Date Using ($ in 000’s)
Description
Assets/(Liabilities) at Fair Value
Quoted Prices in Active Markets for Identical Assets
(Level 1)
Significant Other Observable
Inputs (Level 2)
Significant Unobservable
Inputs (Level 3)
December 31, 2013 Derivative assets $ 2,510 $ 543 $ 1,967 - Derivative liabilities $(4,688) $ (4,688) $ - - December 31, 2012 Derivative assets $ 287 $ 287 - - Derivative liabilities $ (7,222) $ (7,222) - - *The only recurring measurements are derivative related.
Other fair value considerations
Our cash and cash equivalents approximate fair value because of the short-term nature of these instruments, and are classified as Level 1 in the fair value hierarchy. The carrying amount of our short-term debt, which is composed of Empire issued commercial paper or revolving credit borrowings, also approximates fair value because of their short-term nature. These instruments are classified as Level 2 in the fair value hierarchy as they are valued based on market rates for similar market transactions. The carrying amount of our total long-term debt exclusive of capital leases at December 31, 2013 and 2012 was $739 million and $688 million, compared to a fair market value of approximately $715 million and $747 million, respectively. These estimates were based on a bond pricing model, utilizing inputs classified as Level 2 in the fair value hierarchy, which include the quoted market prices for the same or similar issues or on the current rates offered to us for debt of the same remaining maturities. The estimated fair market value may not represent the actual value that could have been realized as of December 31, 2013 or that will be realizable in the future. 16. REGULATED OPERATING EXPENSE The following table sets forth the major components comprising “regulated operating expenses” under “Operating Revenue Deductions” on our consolidated statements of income for the years ended (in thousands): December 31, 2013 2012 2011
Power operation expense (other than fuel) $ 15,643 $ 15,045 $ 12,685 Electric transmission and distribution expense 21,863 17,083 15,361 Natural gas transmission and distribution expense 2,498 2,443 2,385 Customer accounts & assistance expense 11,180 10,211 10,210 Employee pension expense
(1) 10,736 10,180 8,805
Employee healthcare plan (1)
10,190 9,825 7,439 General office supplies and expense 12,850 10,776 10,158 Administrative and general expense 14,800 15,091 14,295 Bad debt expense 3,665 3,038 3,425 Regulatory reversal of gain on sale of assets 1,236 - - Miscellaneous expense 672 679 679 TOTAL $ 105,333 $ 94,371 $ 85,442
(1)
Does not include the capitalized portion of actuarially calculated costs, but reflects the GAAP expensed portion of these costs plus or minus costs deferred to a regulatory asset or recognized as a regulatory liability for Missouri and Kansas jurisdictions.
95
ITEM 9. CHANGES IN AND DISAGREEMENTS WITH ACCOUNTANTS ON ACCOUNTING AND FINANCIAL DISCLOSURE
None. ITEM 9A. CONTROLS AND PROCEDURES
Evaluation of Disclosure Controls and Procedures
As of the end of the period covered by this report, an evaluation was carried out, under the supervision and with the participation of our management, including our Chief Executive Officer and Chief Financial Officer, of the effectiveness of the design and operation of our disclosure controls and procedures (as such term is defined in Rule 13a-15(e) of the Securities Exchange Act of 1934). Based upon that evaluation, the Chief Executive Officer and Chief Financial Officer concluded that our disclosure controls and procedures were effective as of December 31, 2013.
Management’s Report on Internal Control Over Financial Reporting
Our management is responsible for establishing and maintaining adequate internal control over financial reporting, as such term is defined in Exchange Act Rule 13a-15(f). Under the supervision and with the participation of our management, including our Chief Executive Officer and Chief Financial Officer, we conducted an evaluation of the effectiveness of our internal control over financial reporting based on the framework in the Internal Control - Integrated Framework (1992) issued by the Committee of Sponsoring Organizations of the Treadway Commission (COSO). Based on this evaluation, our management concluded that our internal control over financial reporting was effective as of December 31, 2013.
Audit of Internal Control Over Financial Reporting
The effectiveness of our internal control over financial reporting as of December 31, 2013, has been audited by PricewaterhouseCoopers LLP, an independent registered public accounting firm, as stated in their report which appears herein.
Changes in Internal Control Over Financial Reporting
There have been no changes in our internal control over financial reporting that occurred during the fourth quarter of 2013 that have materially affected, or are reasonably likely to materially affect, our internal control over financial reporting. ITEM 9B. OTHER INFORMATION
None. PART III
ITEM 10. DIRECTORS, EXECUTIVE OFFICERS AND CORPORATE GOVERNANCE
Except as set forth below, the information required by this Item may be found in our proxy statement for our Annual Meeting of Stockholders to be held May 1, 2014, which is incorporated herein by reference.
Pursuant to instruction 3 of paragraph (b) of Item 401 of Regulation S-K, the information required by this Item with respect to executive officers is set forth in Item 1 of Part I of this Form 10-K under “Executive Officers and Other Officers of Empire.”
We have adopted a Code of Ethics for the Chief Executive Officer and Senior Financial Officers. A copy of the code is available on our website at www.empiredistrict.com. Any future amendments or waivers to the code will be posted on our website at www.empiredistrict.com.
96
ITEM 11. EXECUTIVE COMPENSATION
Information required by this item may be found in our proxy statement for our Annual Meeting of Stockholders to be held May 1, 2014, which is incorporated herein by reference. ITEM 12. SECURITY OWNERSHIP OF CERTAIN BENEFICIAL OWNERS AND MANAGEMENT AND RELATED STOCKHOLDER MATTERS
Information required by this item may be found in our proxy statement for our Annual Meeting of Stockholders to be held May 1, 2014, which is incorporated herein by reference.
There are no arrangements the operation of which may at a subsequent date result in a change in control of Empire. ITEM 13. CERTAIN RELATIONSHIPS AND RELATED TRANSACTIONS, AND DIRECTOR INDEPENDENCE
The information required by this Item may be found in our proxy statement for our Annual Meeting of Stockholders to be held May 1, 2014 which is incorporated herein by reference. ITEM 14. PRINCIPAL ACCOUNTANT FEES AND SERVICES
The information required by this Item may be found in our proxy statement for our Annual Meeting of Stockholders to be held May 1, 2014 which is incorporated herein by reference.
PART IV ITEM 15. EXHIBITS AND FINANCIAL STATEMENT SCHEDULES
Index to Financial Statements and Financial Statement Schedule Covered by Report of Independent Registered Public Accounting Firm
Consolidated balance sheets at December 31, 2013 and 2012;;;;;;;;;;;;;;;;;;;;;;;;;; 42 Consolidated statements of income for each of the three years in the period ended December 31, 2013;;;;;;;; 44 Consolidated statements of common stockholders’ equity for each of the three years in the period ended December 31, 2013;;;;;;;;;;;;;;;;;;;;;;;;;;;;;;;;;;;;;;;;;;;;; 45 Consolidated statements of cash flows for each of the three years in the period ended December 31, 2013;;;;;;; 46 Notes to consolidated financial statements;;;;;;;;;;;;;;;;;;;;;;;;;;;;;;;;; ;; 48 Schedule for the years ended December 31, 2013, 2012 and 2011: Schedule II – Valuation and qualifying accounts;;;;;;;;;;;;;;;;;;;;;;;;;;;;;;;;. .. 99
All other schedules are omitted as the required information is either not present, is not present in sufficient amounts, or the information required therein is included in the financial statements or notes thereto.
List of Exhibits
(3) (a) The Restated Articles of Incorporation of Empire (Incorporated by reference to Exhibit 4(a) to Registration Statement No. 33-54539 on Form S-3).
(b) By-laws of Empire as amended February 6, 2014 (Incorporated by reference to Exhibit 3.1 to Current Report on Form 8-K dated February 6, 2014 and filed February 7, 2014, File No. 1-3368).
(4) (a) Indenture of Mortgage and Deed of Trust dated as of September 1, 1944 and First Supplemental Indenture thereto among Empire, The Bank of New York Mellon Trust Company, N.A. and UMB Bank, N.A., (Incorporated by reference to Exhibits B(1) and B(2) to Form 10, File No. 1-3368).
(b) Third Supplemental Indenture to Indenture of Mortgage and Deed of Trust (Incorporated by reference to Exhibit 2(c) to Form S-7, File No. 2-59924).
(c) Sixth through Eighth Supplemental Indentures to Indenture of Mortgage and Deed of Trust (Incorporated by reference to Exhibit 2(c) to Form S-7, File No. 2-59924).
(d) Fourteenth Supplemental Indenture to Indenture of Mortgage and Deed of Trust (Incorporated by reference to Exhibit 4(f) to Registration Statement No. 33-56635 on Form S-3).
(e) Twenty-Fourth Supplemental Indenture dated as of March 1, 1994 to Indenture of Mortgage and Deed of Trust (Incorporated by reference to Exhibit 4(m) to Annual Report on Form 10-K for the year ended December 31, 1993, File No. 1-3368).
(f) Twenty-Eighth Supplemental Indenture dated as of December 1, 1996 to Indenture of Mortgage and Deed of Trust (Incorporated by reference to Exhibit 4 to Annual Report on Form 10-K for the year ended December 31, 1996, File No. 1-3368).

97
(g) Thirty-First Supplemental Indenture dated as of March 26, 2007 to Indenture of Mortgage and Deed of Trust (Incorporated by reference to Exhibit 4.1 to Current Report on Form 8-K dated March 26, 2007 and filed March 28, 2007, File No. 1-3368).
(h) Thirty-Second Supplemental Indenture dated as of March 11, 2008 to Indenture of Mortgage and Deed of Trust (Incorporated by reference to Exhibit 10.1 to Current Report on Form 8-K dated March 11, 2008 and filed March 12, 2008, File No. 1-3368).
(i) Thirty-Third Supplemental Indenture dated as of May 16, 2008 to Indenture of Mortgage and Deed of Trust (Incorporated by reference to Exhibit 4.1 to Current Report on Form 8-K dated May 16, 2008 and filed May 16, 2008, File No. 1-3368).
(j) Thirty-Fifth Supplemental Indenture, dated as of May 28, 2010, to Indenture of Mortgage and Deed of Trust (Incorporated by reference to Exhibit 4.1 to Current Report on Form 8-K dated May 28, 2010 and filed May 28, 2010, File No. 1-3368).
(k) Thirty-Sixth Supplemental Indenture, dated as of August 25, 2010, to Indenture of Mortgage and Deed of Trust (Incorporated by reference to Exhibit 4.1 to Current Report on Form 8-K dated August 25, 2010 and filed August 26, 2010, File No. 1-3368).
(l) Thirty-Seventh Supplemental Indenture, dated as of June 9, 2011, to Indenture of Mortgage and Deed of Trust (Incorporated by reference to Exhibit 10.1 to Current Report on Form 8-K dated June 9, 2011 and filed June 10, 2011, File No. 1-3368).
(m) Thirty-Eighth Supplemental Indenture, dated as of April 2, 2012, to Indenture of Mortgage and Deed of Trust (Incorporated by reference to Exhibit 4.2 to Current Report on Form 8-K dated April 2, 2012 and filed April 2, 2012, File No. 1-3368).
(n) Thirty-Ninth Supplemental Indenture, dated as of May 30, 2013, to Indenture of Mortgage and Deed of Trust (Incorporated by reference to Exhibit 4.2 to Current Report on Form 8-K dated May 30, 2013 and filed May 30, 2013, File No. 1-3368).
(o) Bond Purchase Agreement, dated as of April 2, 2012, by and among the Company and the Purchasers named therein (Incorporated by reference to Exhibit 4.1 to Current Report on Form 8-K dated April 2, 2012 and filed April 2, 2012, File No. 1-3368).
(p) Bond Purchase Agreement, dated as of October 30, 2012, by and among the Company and the Purchasers named therein (Incorporated by reference to Exhibit 4.1 to Current Report on Form 8-K dated October 30, 2012 and filed November 2, 2012, File No. 1-3368).
(q) Indenture for Unsecured Debt Securities, dated as of September 10, 1999 between Empire and Wells Fargo Bank, National Association (Incorporated by reference to Exhibit 4(v) to Registration Statement No. 333-87015 on Form S-3).
(r) Securities Resolution No. 4, dated as of June 10, 2003, of Empire under the Indenture for Unsecured Debt Securities (Incorporated by reference to Exhibit 4 to Current Report on Form 8-K dated June 10, 2003 and filed July 29, 2003, File No. 1-3368).
(s) Securities Resolution No. 5, dated as of October 29, 2003, of Empire under the Indenture for Unsecured Debt Securities (Incorporated by reference to Exhibit 4 to Quarterly Report on Form 10-Q for quarter ended September 30, 2003), File No. 1-3368).
(t) Securities Resolution No. 6, dated as of June 27, 2005, of Empire under the Indenture for Unsecured Debt Securities (Incorporated by reference to Exhibit 4.1 to Current Report on Form 8-K dated June 27, 2005 and filed June 28, 2005, File No. 1-3368).
(u) Bond Purchase Agreement dated June 1, 2006 among The Empire District Gas Company and the purchasers party thereto (Incorporated by reference to Exhibit 4.1 to Current Report on Form 8-K dated June 1, 2006 and filed June 6, 2006, File No. 1-3368).
(v) Indenture of Mortgage and Deed of Trust dated as of June 1, 2006 by The Empire District Gas Company, as Grantor, to Spencer R. Thomson, Deed of Trust Trustee for the Benefit of The Bank of New York Trust Company, N.A., Bond Trustee, as Grantee (Incorporated by reference to Exhibit 4.2 to Current Report on Form 8-K dated June 1, 2006 and filed June 6, 2006, File No. 1-3368).
(w) First Supplemental Indenture of Mortgage and Deed of Trust dated as of June 1, 2006 by The Empire District Gas Company, as Grantor, to Spencer R. Thomson, Deed of Trust Trustee for the Benefit of The Bank of New York Trust Company, N.A., Bond Trustee, as Grantee (Incorporated by reference to Exhibit 4.3 to Current Report on Form 8-K dated June 1, 2006 and filed June 6, 2006, File No. 1-3368).
(10) (a) 1996 Stock Incentive Plan (Incorporated by reference to Exhibit 4.1 to Form S-8, File No. 33-64639).†
(b) First Amendment to 1996 Stock Incentive Plan. (Incorporated by reference to Exhibit 10(b) to Annual Report on Form 10-K for the year ended December 31, 2007, File No. 1-3368).†
(c) 2006 Stock Incentive Plan (Incorporated by reference to Exhibit 4(u) to Form S-8, File No. 333-130075).† (d) First Amendment to 2006 Stock Incentive Plan. (Incorporated by reference to Exhibit 10(d) to Annual Report on
Form 10-K for the year ended December 31, 2007, File No. 1-3368).† (e) Second Amendment to 2006 Stock Incentive Plan (Incorporated by reference to Exhibit 10(e) to Annual Report
on Form 10-K for the year ended December 31, 2008, File No. 1-3368). † (f) Deferred Compensation Plan for Directors as amended and restated effective January 1, 2008. (Incorporated by
reference to Exhibit 10(e) to Annual Report on Form 10-K for the year ended December 31, 2007). † (g) The Empire District Electric Company Change in Control Severance Pay Plan as amended and restated effective
January 1, 2008. (Incorporated by reference to Exhibit 10(f) to Annual Report on Form 10-K for the year ended December 31, 2007, File No. 1-3368).†
98
(h) Form of Severance Pay Agreement under The Empire District Electric Company Change in Control Severance Pay Plan. (Incorporated by reference to Exhibit 10(g) to Annual Report on Form 10-K for the year ended December 31, 2007, File No. 1-3368).†
(i) The Empire District Electric Company Supplemental Executive Retirement Plan as amended and restated effective January 1, 2008. (Incorporated by reference to Exhibit 10(h) to Annual Report on Form 10-K for the year ended December 31, 2007, File No. 1-3368).†
(j) Retirement Plan for Directors as amended August 1, 1998 (Incorporated by reference to Exhibit 10(a) to Form 10-Q for the quarter ended September 30, 1998, File No. 1-3368).†
(k) Stock Unit Plan for Directors of The Empire District Electric Company (Incorporated by reference to Exhibit 10(i) to Annual Report on Form 10-K for the year ended December 31, 2005, File No. 1-3368).†
(l) First Amendment to Stock Unit Plan for Directors. (Incorporated by reference to Exhibit 10(k) to Annual Report on Form 10-K for the year ended December 31, 2007, File No. 1-3368).†
(m) Summary of Annual Incentive Plan. (Incorporated by reference to Exhibit 10(l) to Annual Report on Form 10-K for the year ended December 31, 2007, File No. 1-3368).†
(n) Form of Notice of Award of Dividend Equivalents. (Incorporated by reference to Exhibit 10(n) to Annual Report on Form 10-K for the year ended December 31, 2008, File No. 1-3368)†
(o) Form of Notice of Award of Non-Qualified Stock Options. (Incorporated by reference to Exhibit 10(o) to Annual Report on Form 10-K for the year ended December 31, 2008, File No. 1-3368).†
(p) Form of Notice of Award of Performance-Based Restricted Stock. (Incorporated by reference to Exhibit 10(p) to Annual Report on Form 10-K for the year ended December 31, 2008, File No. 1-3368).†
(q) Form of Notice of Award of Time-Based Restricted Stock. (Incorporated by reference to Exhibit 10(r) to Annual Report on Form 10-K for the year ended December 31, 2012, File No. 1-3368).
(r) Summary of Compensation of Non-Employee Directors. † (Incorporated by reference to Exhibit 10(r) to Annual Report on Form 10-K for the year ended December 31, 2012, File No. 1-3368).
(s) Form of Indemnity Agreement (Incorporated by reference to Exhibit 10.1 to Current Report on Form 8-K dated February 5, 2009 and filed February 10, 2009, File No. 1-3368).†
(t) Third Amended and Restated Unsecured Credit Agreement dated as of January 17, 2012, among The Empire District Electric Company, UMB Bank, N.A. as administrative agent, Bank of America, N.A., as syndication agent, Wells Fargo Bank, N.A., as documentation agent, and the lenders named therein (Incorporated by reference to Exhibit 10.1 to Current Report on Form 8-K dated January 17, 2012 and filed January 19, 2012, File No. 1-3368).
(12) Computation of Ratios of Earnings to Fixed Charges.* (21) Subsidiaries of Empire.* (23) Consent of PricewaterhouseCoopers LLP.* (24) Powers of Attorney.* (31) (a) Certification of Chief Executive Officer pursuant to Section 302 of the Sarbanes-Oxley Act of 2002.* (31) (b) Certification of Chief Financial Officer pursuant to Section 302 of the Sarbanes-Oxley Act of 2002.* (32) (a) Certification of Chief Executive Officer pursuant to 18 U.S.C. Section 1350, as adopted pursuant to Section 906
of the Sarbanes-Oxley Act of 2002.*~ (32) (b) Certification of Chief Financial Officer pursuant to 18 U.S.C. Section 1350, as adopted pursuant to Section 906 of
the Sarbanes-Oxley Act of 2002.*~ (101)
The following financial information from The Empire District Electric Company’s Annual Report on Form 10-K for the period ended December 31, 2013, filed with the SEC on February 21, 2014, formatted in Extensible Business Reporting Language (XBRL): (i) the Consolidated Statements of Income for 2013, 2012 and 2011, (ii) the Consolidated Balance Sheets at December 31, 2013 and December 31, 2012, (iii) the Consolidated Statements of Cash Flows for 2013, 2012 and 2011, and (iv) Notes to Consolidated Financial Statements.**
†This exhibit is a compensatory plan or arrangement as contemplated by Item 15(a)(3) of Form 10-K. *Filed herewith. **Pursuant to Rule 406T of Regulation S-T, the XBRL related information in Exhibit 101 to this Annual Report on Form 10-K shall not be deemed to be “filed” by the Company for purposes of Section 18 of the Exchange Act of 1934, as amended, or otherwise subject to the liability of that section, and shall not be deemed incorporated by reference into, or part of a registration statement, prospectus or other document filed under the Securities Act of 1933, as amended or the Exchange Act except as shall be expressly set forth by specific reference in such filings.
~This certification accompanies this Report pursuant to Section 906 of the Sarbanes-Oxley Act of 2002 and shall not be deemed filed by the Company for purposes of Section 18 or any other provision of the Securities Exchange Act of 1934, as amended.

99
SCHEDULE II
Valuation and Qualifying Accounts Years ended December 31, 2013, 2012 and 2011:
Balance At Beginning Of Period
Additions Charged to Other Accounts
Charged To Income Description Amount
Deductions From Reserve
Description Amount
Balance At
Close of Period
Year ended December 31, 2013:
Reserve deducted from assets: accumulated provision for uncollectible accounts.
$1,387,673
$2,213,988
Recovery of amounts previously written off
$2,013,959
Accounts written off
$4,590,443
$ 1,025,177
Year ended December 31, 2012:
Reserve deducted from assets: accumulated provision for uncollectible accounts.
$1,137,644
$3,052,397
Recovery of amounts previously written off
$1,956,549
Accounts written off
$4,758,917
$1,387,673
Year ended December 31, 2011:
Reserve deducted from assets: accumulated provision for uncollectible accounts.
$ 865,236
$3,737,630
Recovery of amounts previously written off
$1,847,527
Accounts written off
$5,312,749
$1,137,644

100
SIGNATURES
Pursuant to the requirements of Section 13 or 15(d) of the Securities Exchange Act of 1934, the registrant has duly caused this report to be signed on its behalf by the undersigned, thereunto duly authorized.
THE EMPIRE DISTRICT ELECTRIC COMPANY
By /s/ BRADLEY P. BEECHER_____________
Bradley P. Beecher, President and Chief Executive Officer Date: February 21, 2014
Pursuant to the requirements of the Securities Exchange Act of 1934, this report has been signed below by the following persons on behalf of the registrant and in the capacities and on the date indicated.
/s/ BRADLEY P. BEECHER ;;;;;;;;;;;;;;;;;;;;;;;;;;;;;;; Date: February 21, 2014 Bradley P. Beecher, President, Chief Executive Officer, Director (Principal Executive Officer)
/s/ LAURIE A. DELANO ;;;;;;;;;;;;;;;;;;;;;;;;;;;;;;; Laurie A. Delano, Vice President- Finance (Principal Financial Officer)
/s/ ROBERT W. SAGER ;;;;;;;;;;;;;;;;;;;;;;;;;;;;;;; Robert W. Sager, Controller, Assistant Secretary and Assistant Treasurer (Principal Accounting Officer)
D. RANDY LANEY* ;;;;;;;;;;;;;;;;;;;;;;;;;;;;;;; D. Randy Laney, Director
KENNETH R. ALLEN* ;;;;;;;;;;;;;;;;;;;;;;;;;;;;;;; Kenneth R. Allen, Director PAUL R. PORTNEY* ;;;;;;;;;;;;;;;;;;;;;;;;;;;;;;; Paul R. Portney, Director
WILLIAM L. GIPSON* ;;;;;;;;;;;;;;;;;;;;;;;;;;;;;;; William L. Gipson, Director
ROSS C. HARTLEY* ;;;;;;;;;;;;;;;;;;;;;;;;;;;;;;; Ross C. Hartley, Director
HERBERT J. SCHMIDT* ;;;;;;;;;;;;;;;;;;;;;;;;;;;;;;; Herbert J. Schmidt, Director THOMAS OHLMACHER* ;;;;;;;;;;;;;;;;;;;;;;;;;;;;;;; Thomas Ohlmacher, Director
B. THOMAS MUELLER* ;;;;;;;;;;;;;;;;;;;;;;;;;;;;;;;. B. Thomas Mueller, Director
C. JAMES SULLIVAN* ;;;;;;;;;;;;;;;;;;;;;;;;;;;;;;; C. James Sullivan, Director
BONNIE C. LIND* ;;;;;;;;;;;;;;;;;;;;;;;;;;;;;;;. Bonnie C. Lind, Director
/s/ LAURIE A. DELANO *By;;;;;;;;;;;;;;;;;;;;;;;;;;;;;.. (Laurie A. Delano, as attorney in fact for each of the persons indicated)
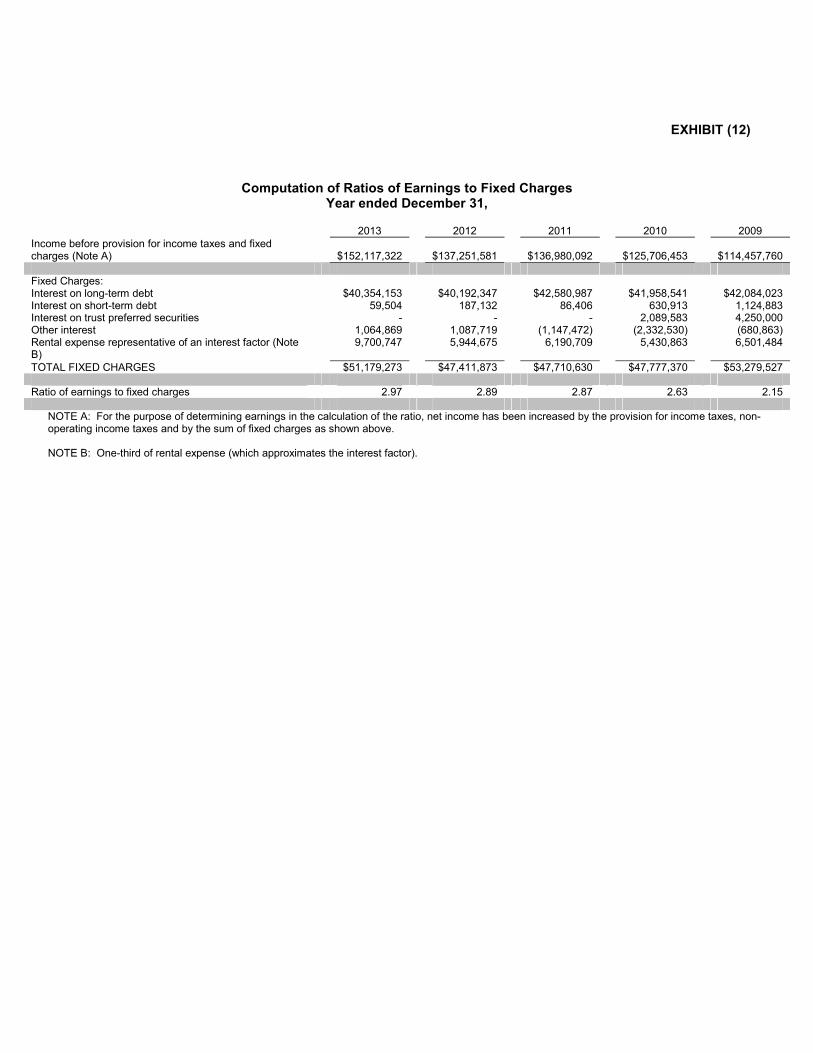
EXHIBIT (12)
Computation of Ratios of Earnings to Fixed Charges
Year ended December 31,
2013 2012 2011 2010 2009 Income before provision for income taxes and fixed charges (Note A)
$152,117,322
$137,251,581
$136,980,092
$125,706,453
$114,457,760
Fixed Charges: Interest on long-term debt $40,354,153 $40,192,347 $42,580,987 $41,958,541 $42,084,023 Interest on short-term debt 59,504 187,132 86,406 630,913 1,124,883 Interest on trust preferred securities - - - 2,089,583 4,250,000 Other interest 1,064,869 1,087,719 (1,147,472) (2,332,530) (680,863) Rental expense representative of an interest factor (Note B)
9,700,747 5,944,675 6,190,709 5,430,863 6,501,484
TOTAL FIXED CHARGES $51,179,273 $47,411,873 $47,710,630 $47,777,370 $53,279,527 Ratio of earnings to fixed charges 2.97 2.89 2.87 2.63 2.15
NOTE A: For the purpose of determining earnings in the calculation of the ratio, net income has been increased by the provision for income taxes, non-operating income taxes and by the sum of fixed charges as shown above. NOTE B: One-third of rental expense (which approximates the interest factor).

EXHIBIT (21)
Subsidiaries of Empire
Subsidiary State of Organization Empire District Industries, Inc. Delaware The Empire District Gas Company Kansas
Immaterial subsidiaries are not listed.

EXHIBIT (23)
Consent of Independent Registered Public Accounting Firm We hereby consent to the incorporation by reference in the Registration Statements on Form S-8 (Nos. 33-64639, 33-
34807, 333-130075 and 333-130076) and in the Registration Statements on Form S-3 (Nos. 333-192809, 333-193037
and 333-141452) of The Empire District Electric Company of our report dated February 21, 2014 relating to the financial
statements, financial statement schedule and the effectiveness of internal control over financial reporting, which appears
in this Form 10-K.
/s/ PricewaterhouseCoopers LLP St. Louis, Missouri February 21, 2014

EXHIBIT (24)
POWER OF ATTORNEY KNOW ALL MEN BY THESE PRESENTS, that the undersigned, a director of THE EMPIRE DISTRICT ELECTRIC COMPANY, a corporation organized and existing under the laws of the State of Kansas, does hereby constitute and appoint B. P. BEECHER and L. A. DELANO, and each of them, the true and lawful attorney-in-fact of the undersigned, in the name, place and stead of the undersigned, to sign the name of the undersigned to the Company’s Annual Report Form 10-K for the fiscal year ended December 31, 2013, File Number 1-3368, to be filed pursuant to Section 13 or 15(d) of the Securities Exchange Act of 1934, and to any amendment thereto, and to cause the same to be filed with the Securities and Exchange Commission, it being intended to give and hereby giving and granting unto said attorneys-in-fact, and each of them, full power and authority to do and perform any act and thing necessary and proper to be done in the premises as fully and to all intents and purposes as the undersigned could do if personally present; and the undersigned hereby ratifies and confirms all that said attorneys-in-fact, or any one of them, shall lawfully do or cause to be done by virtue hereof.
IN WITNESS WHEREOF, the undersigned has executed this Power of Attorney this 5th day of February 2014. /s/ D. RANDY LANEY D. RANDY LANEY

POWER OF ATTORNEY KNOW ALL MEN BY THESE PRESENTS, that the undersigned, a director of THE EMPIRE DISTRICT ELECTRIC COMPANY, a corporation organized and existing under the laws of the State of Kansas, does hereby constitute and appoint B. P. BEECHER and L. A. DELANO, and each of them, the true and lawful attorney-in-fact of the undersigned, in the name, place and stead of the undersigned, to sign the name of the undersigned to the Company’s Annual Report Form 10-K for the fiscal year ended December 31, 2013, File Number 1-3368, to be filed pursuant to Section 13 or 15(d) of the Securities Exchange Act of 1934, and to any amendment thereto, and to cause the same to be filed with the Securities and Exchange Commission, it being intended to give and hereby giving and granting unto said attorneys-in-fact, and each of them, full power and authority to do and perform any act and thing necessary and proper to be done in the premises as fully and to all intents and purposes as the undersigned could do if personally present; and the undersigned hereby ratifies and confirms all that said attorneys-in-fact, or any one of them, shall lawfully do or cause to be done by virtue hereof.
IN WITNESS WHEREOF, the undersigned has executed this Power of Attorney this 5th day of February 2014. /s/ HERBERT J. SCHMIDT HERBERT J. SCHMIDT

POWER OF ATTORNEY KNOW ALL MEN BY THESE PRESENTS, that the undersigned, a director of THE EMPIRE DISTRICT ELECTRIC COMPANY, a corporation organized and existing under the laws of the State of Kansas, does hereby constitute and appoint B. P. BEECHER and L. A. DELANO, and each of them, the true and lawful attorney-in-fact of the undersigned, in the name, place and stead of the undersigned, to sign the name of the undersigned to the Company’s Annual Report Form 10-K for the fiscal year ended December 31, 2013, File Number 1-3368, to be filed pursuant to Section 13 or 15(d) of the Securities Exchange Act of 1934, and to any amendment thereto, and to cause the same to be filed with the Securities and Exchange Commission, it being intended to give and hereby giving and granting unto said attorneys-in-fact, and each of them, full power and authority to do and perform any act and thing necessary and proper to be done in the premises as fully and to all intents and purposes as the undersigned could do if personally present; and the undersigned hereby ratifies and confirms all that said attorneys-in-fact, or any one of them, shall lawfully do or cause to be done by virtue hereof.
IN WITNESS WHEREOF, the undersigned has executed this Power of Attorney this 5th day of February 2014. /s/ BONNIE C. LIND BONNIE C. LIND

POWER OF ATTORNEY KNOW ALL MEN BY THESE PRESENTS, that the undersigned, a director of THE EMPIRE DISTRICT ELECTRIC COMPANY, a corporation organized and existing under the laws of the State of Kansas, does hereby constitute and appoint B. P. BEECHER and L. A. DELANO, and each of them, the true and lawful attorney-in-fact of the undersigned, in the name, place and stead of the undersigned, to sign the name of the undersigned to the Company’s Annual Report Form 10-K for the fiscal year ended December 31, 2013, File Number 1-3368, to be filed pursuant to Section 13 or 15(d) of the Securities Exchange Act of 1934, and to any amendment thereto, and to cause the same to be filed with the Securities and Exchange Commission, it being intended to give and hereby giving and granting unto said attorneys-in-fact, and each of them, full power and authority to do and perform any act and thing necessary and proper to be done in the premises as fully and to all intents and purposes as the undersigned could do if personally present; and the undersigned hereby ratifies and confirms all that said attorneys-in-fact, or any one of them, shall lawfully do or cause to be done by virtue hereof.
IN WITNESS WHEREOF, the undersigned has executed this Power of Attorney this 5th day of February 2014. /s/ THOMAS OHLMACHER THOMAS OHLMACHER

POWER OF ATTORNEY KNOW ALL MEN BY THESE PRESENTS, that the undersigned, a director of THE EMPIRE DISTRICT ELECTRIC COMPANY, a corporation organized and existing under the laws of the State of Kansas, does hereby constitute and appoint B. P. BEECHER and L. A. DELANO, and each of them, the true and lawful attorney-in-fact of the undersigned, in the name, place and stead of the undersigned, to sign the name of the undersigned to the Company’s Annual Report Form 10-K for the fiscal year ended December 31, 2013, File Number 1-3368, to be filed pursuant to Section 13 or 15(d) of the Securities Exchange Act of 1934, and to any amendment thereto, and to cause the same to be filed with the Securities and Exchange Commission, it being intended to give and hereby giving and granting unto said attorneys-in-fact, and each of them, full power and authority to do and perform any act and thing necessary and proper to be done in the premises as fully and to all intents and purposes as the undersigned could do if personally present; and the undersigned hereby ratifies and confirms all that said attorneys-in-fact, or any one of them, shall lawfully do or cause to be done by virtue hereof.
IN WITNESS WHEREOF, the undersigned has executed this Power of Attorney this 5th day of February 2014. /s/ WILLIAM L. GIPSON WILLIAM L. GIPSON

POWER OF ATTORNEY KNOW ALL MEN BY THESE PRESENTS, that the undersigned, a director of THE EMPIRE DISTRICT ELECTRIC COMPANY, a corporation organized and existing under the laws of the State of Kansas, does hereby constitute and appoint B. P. BEECHER and L. A. DELANO, and each of them, the true and lawful attorney-in-fact of the undersigned, in the name, place and stead of the undersigned, to sign the name of the undersigned to the Company’s Annual Report Form 10-K for the fiscal year ended December 31, 2013, File Number 1-3368, to be filed pursuant to Section 13 or 15(d) of the Securities Exchange Act of 1934, and to any amendment thereto, and to cause the same to be filed with the Securities and Exchange Commission, it being intended to give and hereby giving and granting unto said attorneys-in-fact, and each of them, full power and authority to do and perform any act and thing necessary and proper to be done in the premises as fully and to all intents and purposes as the undersigned could do if personally present; and the undersigned hereby ratifies and confirms all that said attorneys-in-fact, or any one of them, shall lawfully do or cause to be done by virtue hereof.
IN WITNESS WHEREOF, the undersigned has executed this Power of Attorney this 5th day of February 2014. /s/ ROSS C. HARTLEY ROSS C. HARTLEY
POWER OF ATTORNEY KNOW ALL MEN BY THESE PRESENTS, that the undersigned, a director of THE EMPIRE DISTRICT ELECTRIC COMPANY, a corporation organized and existing under the laws of the State of Kansas, does hereby constitute and appoint B. P. BEECHER and L. A. DELANO, and each of them, the true and lawful attorney-in-fact of the undersigned, in the name, place and stead of the undersigned, to sign the name of the undersigned to the Company’s Annual Report Form 10-K for the fiscal year ended December 31, 2013, File Number 1-3368, to be filed pursuant to Section 13 or 15(d) of the Securities Exchange Act of 1934, and to any amendment thereto, and to cause the same to be filed with the Securities and Exchange Commission, it being intended to give and hereby giving and granting unto said attorneys-in-fact, and each of them, full power and authority to do and perform any act and thing necessary and proper to be done in the premises as fully and to all intents and purposes as the undersigned could do if personally present; and the undersigned hereby ratifies and confirms all that said attorneys-in-fact, or any one of them, shall lawfully do or cause to be done by virtue hereof.
IN WITNESS WHEREOF, the undersigned has executed this Power of Attorney this 5th day of February 2014. /s/ B. THOMAS MUELLER B. THOMAS MUELLER
POWER OF ATTORNEY KNOW ALL MEN BY THESE PRESENTS, that the undersigned, a director of THE EMPIRE DISTRICT ELECTRIC COMPANY, a corporation organized and existing under the laws of the State of Kansas, does hereby constitute and appoint B. P. BEECHER and L. A. DELANO, and each of them, the true and lawful attorney-in-fact of the undersigned, in the name, place and stead of the undersigned, to sign the name of the undersigned to the Company’s Annual Report Form 10-K for the fiscal year ended December 31, 2013, File Number 1-3368, to be filed pursuant to Section 13 or 15(d) of the Securities Exchange Act of 1934, and to any amendment thereto, and to cause the same to be filed with the Securities and Exchange Commission, it being intended to give and hereby giving and granting unto said attorneys-in-fact, and each of them, full power and authority to do and perform any act and thing necessary and proper to be done in the premises as fully and to all intents and purposes as the undersigned could do if personally present; and the undersigned hereby ratifies and confirms all that said attorneys-in-fact, or any one of them, shall lawfully do or cause to be done by virtue hereof.
IN WITNESS WHEREOF, the undersigned has executed this Power of Attorney this 5th day of February 2014. /s/ C. JAMES SULLIVAN C. JAMES SULLIVAN

POWER OF ATTORNEY KNOW ALL MEN BY THESE PRESENTS, that the undersigned, a director of THE EMPIRE DISTRICT ELECTRIC COMPANY, a corporation organized and existing under the laws of the State of Kansas, does hereby constitute and appoint B. P. BEECHER and L. A. DELANO, and each of them, the true and lawful attorney-in-fact of the undersigned, in the name, place and stead of the undersigned, to sign the name of the undersigned to the Company’s Annual Report Form 10-K for the fiscal year ended December 31, 2013, File Number 1-3368, to be filed pursuant to Section 13 or 15(d) of the Securities Exchange Act of 1934, and to any amendment thereto, and to cause the same to be filed with the Securities and Exchange Commission, it being intended to give and hereby giving and granting unto said attorneys-in-fact, and each of them, full power and authority to do and perform any act and thing necessary and proper to be done in the premises as fully and to all intents and purposes as the undersigned could do if personally present; and the undersigned hereby ratifies and confirms all that said attorneys-in-fact, or any one of them, shall lawfully do or cause to be done by virtue hereof.
IN WITNESS WHEREOF, the undersigned has executed this Power of Attorney this 5th day of February 2014. /s/ KENNETH R. ALLEN KENNETH R. ALLEN

POWER OF ATTORNEY KNOW ALL MEN BY THESE PRESENTS, that the undersigned, a director of THE EMPIRE DISTRICT ELECTRIC COMPANY, a corporation organized and existing under the laws of the State of Kansas, does hereby constitute and appoint B. P. BEECHER and L. A. DELANO, and each of them, the true and lawful attorney-in-fact of the undersigned, in the name, place and stead of the undersigned, to sign the name of the undersigned to the Company’s Annual Report Form 10-K for the fiscal year ended December 31, 2013, File Number 1-3368, to be filed pursuant to Section 13 or 15(d) of the Securities Exchange Act of 1934, and to any amendment thereto, and to cause the same to be filed with the Securities and Exchange Commission, it being intended to give and hereby giving and granting unto said attorneys-in-fact, and each of them, full power and authority to do and perform any act and thing necessary and proper to be done in the premises as fully and to all intents and purposes as the undersigned could do if personally present; and the undersigned hereby ratifies and confirms all that said attorneys-in-fact, or any one of them, shall lawfully do or cause to be done by virtue hereof.
IN WITNESS WHEREOF, the undersigned has executed this Power of Attorney this 5th day of February 2014. /s/ PAUL R. PORTNEY PAUL R. PORTNEY

EXHIBIT (31)(a)
CERTIFICATION OF CHIEF EXECUTIVE OFFICER
PURSUANT TO SECTION 302 OF THE SARBANES-OXLEY ACT OF 2002
I, Bradley P. Beecher, certify that:
1. I have reviewed this annual report on Form 10-K of The Empire District Electric Company;
2. Based on my knowledge, this report does not contain any untrue statement of a material fact or omit to state a material fact necessary to make the statements made, in light of the circumstances under which such statements were made, not misleading with respect to the period covered by this report;
3. Based on my knowledge, the financial statements, and other financial information included in this report, fairly present in
all material respects the financial condition, results of operations and cash flows of the registrant as of, and for, the periods presented in this report;
4. The registrant’s other certifying officers and I are responsible for establishing and maintaining disclosure controls and
procedures (as defined in Exchange Act Rules 13a-15(e) and 15d-15(e)) and internal control over financial reporting (as defined in Exchange Act Rules 13a-15(f) and 15d-15(f)) for the registrant and we have:
a. designed such disclosure controls and procedures, or caused such disclosure controls and procedures to be
designed under our supervision, to ensure that material information relating to the registrant, including its consolidated subsidiaries, is made known to us by others within those entities, particularly during the period in which this report is being prepared;
b. designed such internal control over financial reporting, or caused such internal control over financial reporting to
be designed under our supervision, to provide reasonable assurance regarding the reliability of financial reporting and the preparation of financial statements for external purposes in accordance with generally accepted accounting principles;
c. evaluated the effectiveness of the registrant’s disclosure controls and procedures and presented in this report
our conclusions about the effectiveness of the disclosure controls and procedures, as of the end of the period covered by this report based on such evaluation; and
d. disclosed in this report any change in the registrant’s internal control over financial reporting that occurred during
the registrant’s most recent fiscal quarter (the registrant’s fourth fiscal quarter in the case of an annual report) that has materially affected, or is reasonably likely to materially affect, the registrant’s internal control over financial reporting; and
5. The registrant’s other certifying officers and I have disclosed, based on our most recent evaluation of internal control over
financial reporting, to the registrant’s auditors and the audit committee of the registrant’s board of directors (or persons performing the equivalent functions):
a. all significant deficiencies and material weaknesses in the design or operation of internal control over financial
reporting which are reasonably likely to adversely affect the registrant’s ability to record, process, summarize and report financial information; and
b. any fraud, whether or not material, that involves management or other employees who have a significant role in
the registrant’s internal control over financial reporting. Date: February 21, 2014 By: /s/ Bradley P. Beecher
Name: Bradley P. Beecher Title: President and Chief Executive Officer

EXHIBIT (31)(b)
CERTIFICATION OF CHIEF FINANCIAL OFFICER PURSUANT TO SECTION 302 OF THE SARBANES-OXLEY ACT OF 2002
I, Laurie A. Delano, certify that:
1. I have reviewed this annual report on Form 10-K of The Empire District Electric Company;
2. Based on my knowledge, this report does not contain any untrue statement of a material fact or omit to state a material fact necessary to make the statements made, in light of the circumstances under which such statements were made, not misleading with respect to the period covered by this report;
3. Based on my knowledge, the financial statements, and other financial information included in this report, fairly present in
all material respects the financial condition, results of operations and cash flows of the registrant as of, and for, the periods presented in this report;
4. The registrant’s other certifying officers and I are responsible for establishing and maintaining disclosure controls and
procedures (as defined in Exchange Act Rules 13a-15(e) and 15d-15(e)) and internal control over financial reporting (as defined in Exchange Act Rules 13a-15(f) and 15d-15(f)) for the registrant and we have:
a. designed such disclosure controls and procedures, or caused such disclosure controls and procedures to be
designed under our supervision, to ensure that material information relating to the registrant, including its consolidated subsidiaries, is made known to us by others within those entities, particularly during the period in which this report is being prepared;
b. designed such internal control over financial reporting, or caused such internal control over financial reporting to
be designed under our supervision, to provide reasonable assurance regarding the reliability of financial reporting and the preparation of financial statements for external purposes in accordance with generally accepted accounting principles;
c. evaluated the effectiveness of the registrant’s disclosure controls and procedures and presented in this report
our conclusions about the effectiveness of the disclosure controls and procedures, as of the end of the period covered by this report based on such evaluation; and
d. disclosed in this report any change in the registrant’s internal control over financial reporting that occurred during
the registrant’s most recent fiscal quarter (the registrant’s fourth fiscal quarter in the case of an annual report) that has materially affected, or is reasonably likely to materially affect, the registrant’s internal control over financial reporting; and
5. The registrant’s other certifying officers and I have disclosed, based on our most recent evaluation of internal control over
financial reporting, to the registrant’s auditors and the audit committee of the registrant’s board of directors (or persons performing the equivalent functions):
a. all significant deficiencies and material weaknesses in the design or operation of internal control over financial
reporting which are reasonably likely to adversely affect the registrant’s ability to record, process, summarize and report financial information; and
b. any fraud, whether or not material, that involves management or other employees who have a significant role in
the registrant’s internal control over financial reporting. Date: February 21, 2014 By: /s/ Laurie A. Delano
Name: Laurie A. Delano Title: Vice President – Finance and Chief Financial Officer

EXHIBIT (32)(a)
Certification of Chief Executive Officer Pursuant to 18 U.S.C. Section 1350, As Adopted Pursuant to Section 906 of the Sarbanes-Oxley Act of 2002 *
In connection with the Annual Report of The Empire District Electric Company (the “Company”) on Form 10-K for the period ending December 31, 2013 as filed with the Securities and Exchange Commission on the date hereof (the “Report”), Bradley P. Beecher, as Chief Executive Officer of the Company, certifies, pursuant to 18 U.S.C. Section 1350, as adopted pursuant to Section 906 of the Sarbanes-Oxley Act of 2002, that:
1. The Report fully complies with the requirements of section 13(a) of the Securities Exchange Act of 1934; and
2. The information contained in the Report fairly presents, in all material respects, the financial condition and result of operations of the Company.
By: /s/ Bradley P. Beecher
Name: Bradley P. Beecher Title: President and Chief Executive Officer Date: February 21, 2014 A signed original of this written statement required by Section 906 or other document authenticating, acknowledging or otherwise adopting the signature that appears in typed form within the electronic version of this written statement required by Section 906, has been provided to The Empire District Electric Company and will be retained by The Empire District Electric Company and furnished to the Securities and Exchange Commission or its staff upon request.
EXHIBIT (32)(b)
Certification of Chief Financial Officer Pursuant to 18 U.S.C. Section 1350, As Adopted Pursuant to Section 906 of the Sarbanes-Oxley Act of 2002 *
In connection with the Annual Report of The Empire District Electric Company (the “Company”) on Form 10-K for the period ending December 31, 2013 as filed with the Securities and Exchange Commission on the date hereof (the “Report”), Laurie A. Delano, as Chief Financial Officer of the Company, certifies, pursuant to 18 U.S.C. Section 1350, as adopted pursuant to Section 906 of the Sarbanes-Oxley Act of 2002, that:
1. The Report fully complies with the requirements of section 13(a) of the Securities Exchange Act of 1934; and
2. The information contained in the Report fairly presents, in all material respects, the financial condition and result of operations of the Company.
By: /s/ Laurie A. Delano
Name: Laurie A. Delano Title: Vice President – Finance and Chief Financial Officer Date: February 21, 2014 A signed original of this written statement required by Section 906 or other document authenticating, acknowledging or otherwise adopting the signature that appears in typed form within the electronic version of this written statement required by Section 906, has been provided to The Empire District Electric Company and will be retained by The Empire District Electric Company and furnished to the Securities and Exchange Commission or its staff upon request.

UNITED STATES SECURITIES AND EXCHANGE COMMISSION
WASHINGTON, D.C. 20549
FORM 10-Q
(Mark One)
Quarterly report pursuant to Section 13 or 15(d) of the Securities Exchange Act of 1934
For the quarterly period ended June 30, 2013 or
� Transition report pursuant to Section 13 or 15(d) of the Securities Exchange Act of 1934
For the transition period from ______________ to ____________.
Commission file number: 1-3368
THE EMPIRE DISTRICT ELECTRIC COMPANY (Exact name of registrant as specified in its charter)
Kansas (State of Incorporation)
44-0236370 (I.R.S. Employer Identification No.)
602 S. Joplin Avenue, Joplin, Missouri
(Address of principal executive offices)
64801
(zip code)
Registrant's telephone number: (417) 625-5100
Indicate by check mark whether the registrant (1) has filed all reports required to be filed by Section 13 or 15(d) of the Securities Exchange Act of 1934 during the preceding 12 months (or for such shorter period that the registrant was required to file such reports), and (2) has been subject to such filing requirements for the past 90 days. Yes √√√√ No ___ Indicate by check mark whether the registrant has submitted electronically and posted on its corporate Web site, if any, every Interactive Data File required to be submitted and posted pursuant to Rule 405 of Regulation S-T (§232.405 of this chapter) during the preceding 12 months (or for such shorter period that the registrant was required to submit and post such files). Yes √√√√ No ___ Indicate by check mark whether the registrant is a large accelerated filer, an accelerated filer, a non-accelerated filer, or a smaller reporting company. See the definitions of “large accelerated filer,” “accelerated filer” and “smaller reporting company” in Rule 12b-2 of the Exchange Act.
Large accelerated filer √√√√ Accelerated filer __ Non-accelerated filer __ (Do not check if a smaller reporting company) Smaller reporting company __ Indicate by check mark whether the registrant is a shell company (as defined in Rule 12b-2 of the Exchange Act). Yes___ No √√√√ As of July 30, 2013, 42,854,223 shares of common stock were outstanding.

2
THE EMPIRE DISTRICT ELECTRIC COMPANY
INDEX PAGE
Forward Looking Statements ............................................................................ 3 Part I - Financial Information: Item 1. Financial Statements: a. Consolidated Statements of Income ........................................................... 4 b. Consolidated Balance Sheets ..................................................................... 7 c. Consolidated Statements of Cash Flows..................................................... 9 d. Notes to Consolidated Financial Statements............................................... 10 Item 2. Management's Discussion and Analysis of Financial Condition and Results of
Operations 33
Executive Summary.. ........................................................................................ 33 Results of Operations.. ..................................................................................... 36 Rate Matters ..................................................................................................... 43 Competition and Markets .................................................................................. 44 Liquidity and Capital Resources........................................................................ 45 Contractual Obligations..................................................................................... 49 Dividends... ....................................................................................................... 50
Off-Balance Sheet Arrangements ..................................................................... 50 Critical Accounting Policies and Estimates........................................................ 51 Recently Issued Accounting Standards............................................................. 51 Item 3. Quantitative and Qualitative Disclosures About Market Risk............................. 51 Item 4. Controls and Procedures .................................................................................. 53 Part II- Other Information: Item 1. Legal Proceedings ........................................................................................... 53 Item 1A. Risk Factors...................................................................................................... 53 Item 2. Unregistered Sales of Equity Securities and Use of Proceeds - (none) Item 3. Defaults Upon Senior Securities - (none) Item 4. Mine Safety Disclosures - (none) Item 5. Other Information.............................................................................................. 53 Item 6. Exhibits ............................................................................................................. 54 Signatures ........................................................................................................ 55
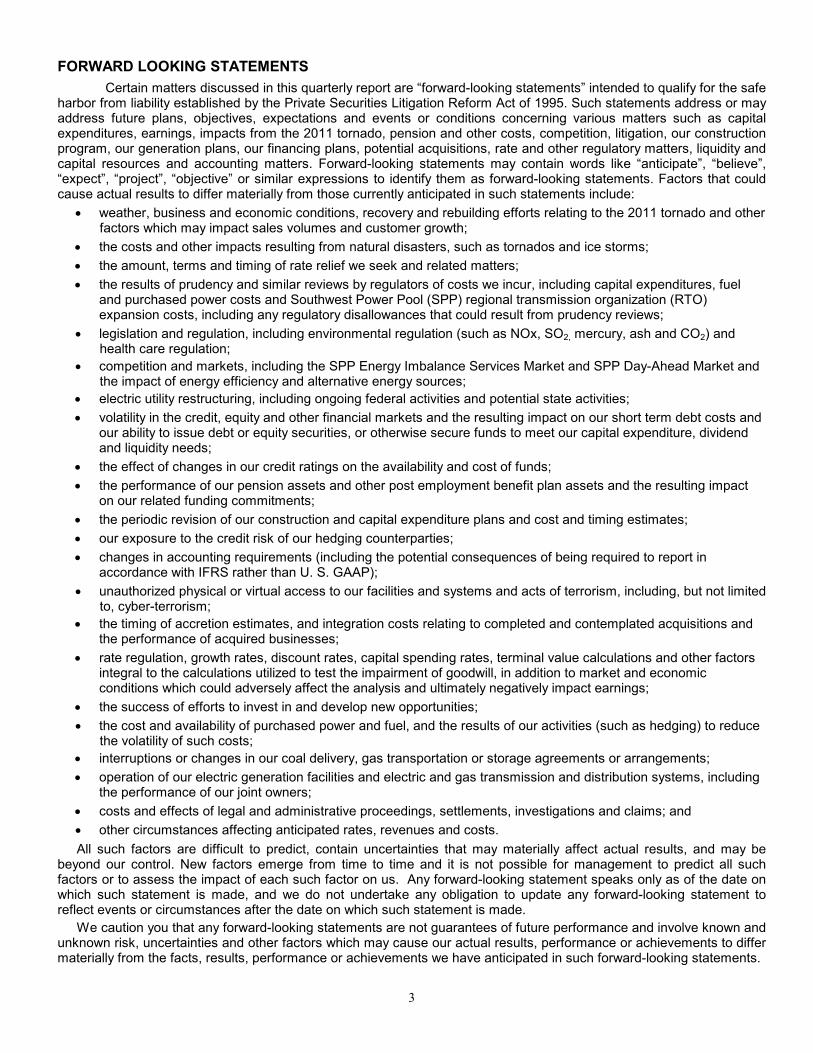
3
FORWARD LOOKING STATEMENTS
Certain matters discussed in this quarterly report are “forward-looking statements” intended to qualify for the safe harbor from liability established by the Private Securities Litigation Reform Act of 1995. Such statements address or may address future plans, objectives, expectations and events or conditions concerning various matters such as capital expenditures, earnings, impacts from the 2011 tornado, pension and other costs, competition, litigation, our construction program, our generation plans, our financing plans, potential acquisitions, rate and other regulatory matters, liquidity and capital resources and accounting matters. Forward-looking statements may contain words like “anticipate”, “believe”, “expect”, “project”, “objective” or similar expressions to identify them as forward-looking statements. Factors that could cause actual results to differ materially from those currently anticipated in such statements include:
• weather, business and economic conditions, recovery and rebuilding efforts relating to the 2011 tornado and other factors which may impact sales volumes and customer growth;
• the costs and other impacts resulting from natural disasters, such as tornados and ice storms;
• the amount, terms and timing of rate relief we seek and related matters;
• the results of prudency and similar reviews by regulators of costs we incur, including capital expenditures, fuel and purchased power costs and Southwest Power Pool (SPP) regional transmission organization (RTO) expansion costs, including any regulatory disallowances that could result from prudency reviews;
• legislation and regulation, including environmental regulation (such as NOx, SO2, mercury, ash and CO2) and health care regulation;
• competition and markets, including the SPP Energy Imbalance Services Market and SPP Day-Ahead Market and the impact of energy efficiency and alternative energy sources;
• electric utility restructuring, including ongoing federal activities and potential state activities;
• volatility in the credit, equity and other financial markets and the resulting impact on our short term debt costs and our ability to issue debt or equity securities, or otherwise secure funds to meet our capital expenditure, dividend and liquidity needs;
• the effect of changes in our credit ratings on the availability and cost of funds;
• the performance of our pension assets and other post employment benefit plan assets and the resulting impact on our related funding commitments;
• the periodic revision of our construction and capital expenditure plans and cost and timing estimates;
• our exposure to the credit risk of our hedging counterparties;
• changes in accounting requirements (including the potential consequences of being required to report in accordance with IFRS rather than U. S. GAAP);
• unauthorized physical or virtual access to our facilities and systems and acts of terrorism, including, but not limited to, cyber-terrorism;
• the timing of accretion estimates, and integration costs relating to completed and contemplated acquisitions and the performance of acquired businesses;
• rate regulation, growth rates, discount rates, capital spending rates, terminal value calculations and other factors integral to the calculations utilized to test the impairment of goodwill, in addition to market and economic conditions which could adversely affect the analysis and ultimately negatively impact earnings;
• the success of efforts to invest in and develop new opportunities;
• the cost and availability of purchased power and fuel, and the results of our activities (such as hedging) to reduce the volatility of such costs;
• interruptions or changes in our coal delivery, gas transportation or storage agreements or arrangements;
• operation of our electric generation facilities and electric and gas transmission and distribution systems, including the performance of our joint owners;
• costs and effects of legal and administrative proceedings, settlements, investigations and claims; and
• other circumstances affecting anticipated rates, revenues and costs.
All such factors are difficult to predict, contain uncertainties that may materially affect actual results, and may be beyond our control. New factors emerge from time to time and it is not possible for management to predict all such factors or to assess the impact of each such factor on us. Any forward-looking statement speaks only as of the date on which such statement is made, and we do not undertake any obligation to update any forward-looking statement to reflect events or circumstances after the date on which such statement is made.
We caution you that any forward-looking statements are not guarantees of future performance and involve known and unknown risk, uncertainties and other factors which may cause our actual results, performance or achievements to differ materially from the facts, results, performance or achievements we have anticipated in such forward-looking statements.

4
PART I. FINANCIAL INFORMATION
Item 1. Financial Statements
THE EMPIRE DISTRICT ELECTRIC COMPANY CONSOLIDATED STATEMENTS OF INCOME (UNAUDITED)
Three Months Ended
June 30, 2013 2012
(000’s except per share amounts)
Operating revenues: Electric $ 127,026 $ 124,091 Gas 7,777 5,804 Other 1,843 1,737 136,646 131,632 Operating revenue deductions: Fuel and purchased power 42,013 45,528 Cost of natural gas sold and transported 3,113 1,769 Regulated operating expenses 26,647 22,844 Other operating expenses 872 771 Maintenance and repairs 9,933 10,797 Depreciation and amortization 17,635 15,068 Provision for income taxes 7,042 6,673 Other taxes 8,281 7,420 115,536 110,870 Operating income 21,110 20,762 Other income and (deductions): Allowance for equity funds used during construction 867 53 Interest income 10 123 Provision for other income taxes (7) (87) Other - non-operating expense, net (290) (202) 580 (113) Interest charges: Long-term debt 10,190 9,637 Short-term debt 12 129 Allowance for borrowed funds used during construction (472) (118) Other 302 293 10,032 9,941 Net income $ 11,658 $ 10,708 Weighted average number of common shares outstanding - basic 42,707 42,197 Weighted average number of common shares outstanding - diluted 42,727 42,220 Total earnings per weighted average share of common stock – basic and diluted
$ 0.27 $ 0.25
Dividends declared per share of common stock $ 0.25 $ 0.25
See accompanying Notes to Consolidated Financial Statements.
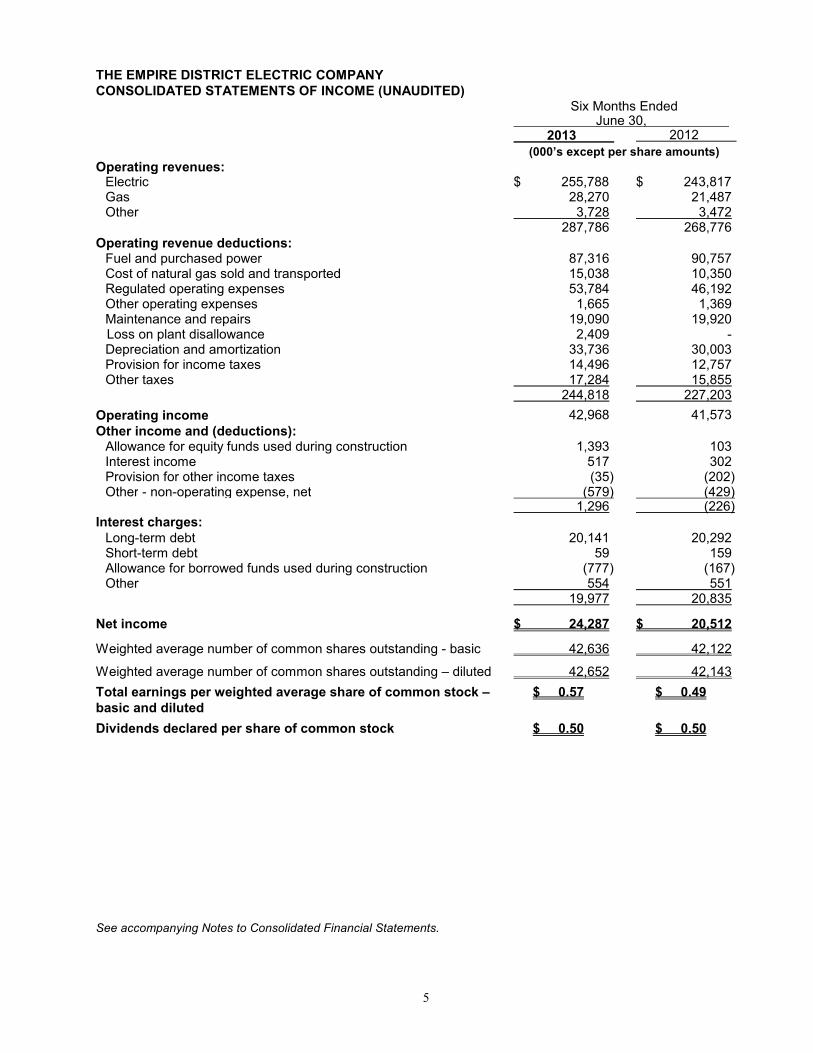
5
THE EMPIRE DISTRICT ELECTRIC COMPANY CONSOLIDATED STATEMENTS OF INCOME (UNAUDITED)
Six Months Ended
June 30, 2013 2012
(000’s except per share amounts)
Operating revenues: Electric $ 255,788 $ 243,817 Gas 28,270 21,487 Other 3,728 3,472 287,786 268,776 Operating revenue deductions: Fuel and purchased power 87,316 90,757 Cost of natural gas sold and transported 15,038 10,350 Regulated operating expenses 53,784 46,192 Other operating expenses 1,665 1,369 Maintenance and repairs 19,090 19,920 Loss on plant disallowance 2,409 - Depreciation and amortization 33,736 30,003 Provision for income taxes 14,496 12,757 Other taxes 17,284 15,855 244,818 227,203 Operating income 42,968 41,573 Other income and (deductions): Allowance for equity funds used during construction 1,393 103 Interest income 517 302 Provision for other income taxes (35) (202) Other - non-operating expense, net (579) (429) 1,296 (226) Interest charges: Long-term debt 20,141 20,292 Short-term debt 59 159 Allowance for borrowed funds used during construction (777) (167) Other 554 551 19,977 20,835 Net income $ 24,287 $ 20,512 Weighted average number of common shares outstanding - basic 42,636 42,122 Weighted average number of common shares outstanding – diluted 42,652 42,143 Total earnings per weighted average share of common stock – basic and diluted
$ 0.57 $ 0.49
Dividends declared per share of common stock $ 0.50 $ 0.50 See accompanying Notes to Consolidated Financial Statements.
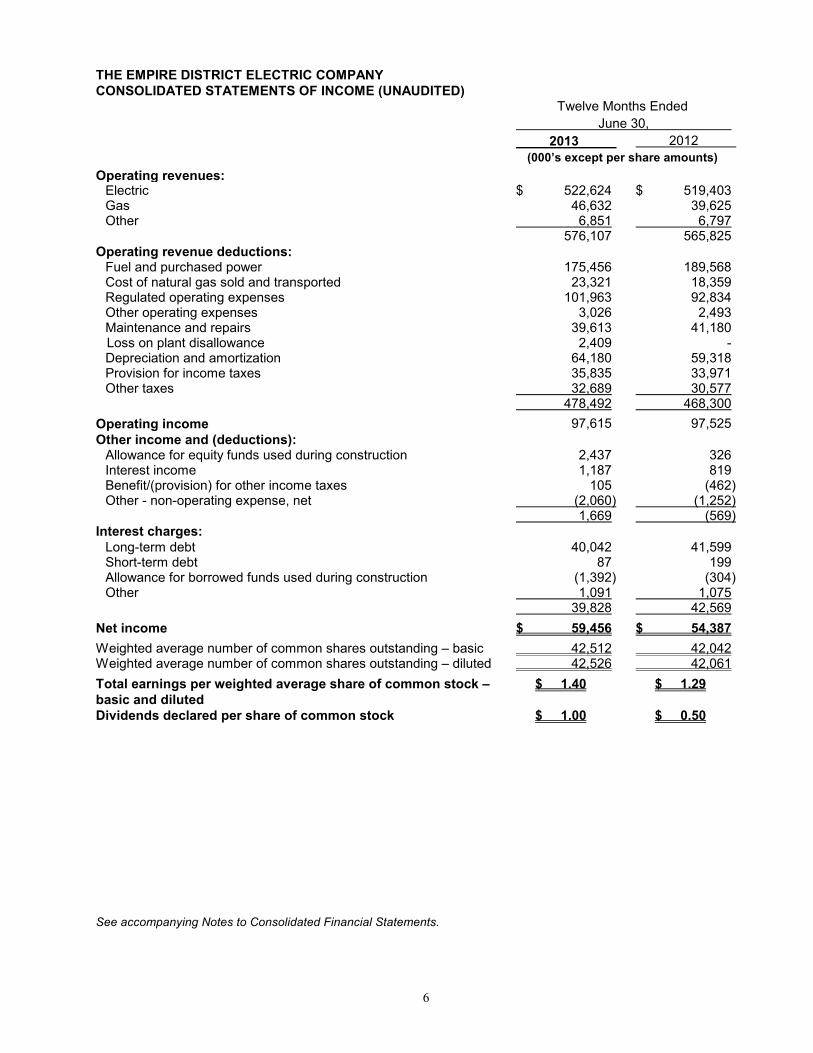
6
THE EMPIRE DISTRICT ELECTRIC COMPANY CONSOLIDATED STATEMENTS OF INCOME (UNAUDITED) Twelve Months Ended
June 30,
2013 2012
(000’s except per share amounts)
Operating revenues: Electric $ 522,624 $ 519,403 Gas 46,632 39,625 Other 6,851 6,797 576,107 565,825 Operating revenue deductions: Fuel and purchased power 175,456 189,568 Cost of natural gas sold and transported 23,321 18,359 Regulated operating expenses 101,963 92,834 Other operating expenses 3,026 2,493 Maintenance and repairs 39,613 41,180 Loss on plant disallowance 2,409 - Depreciation and amortization 64,180 59,318 Provision for income taxes 35,835 33,971 Other taxes 32,689 30,577 478,492 468,300 Operating income 97,615 97,525 Other income and (deductions): Allowance for equity funds used during construction 2,437 326 Interest income 1,187 819 Benefit/(provision) for other income taxes 105 (462) Other - non-operating expense, net (2,060) (1,252) 1,669 (569) Interest charges: Long-term debt 40,042 41,599 Short-term debt 87 199 Allowance for borrowed funds used during construction (1,392) (304) Other 1,091 1,075 39,828 42,569 Net income $ 59,456 $ 54,387 Weighted average number of common shares outstanding – basic 42,512 42,042 Weighted average number of common shares outstanding – diluted 42,526 42,061 Total earnings per weighted average share of common stock – basic and diluted
$ 1.40 $ 1.29
Dividends declared per share of common stock $ 1.00 $ 0.50 See accompanying Notes to Consolidated Financial Statements.
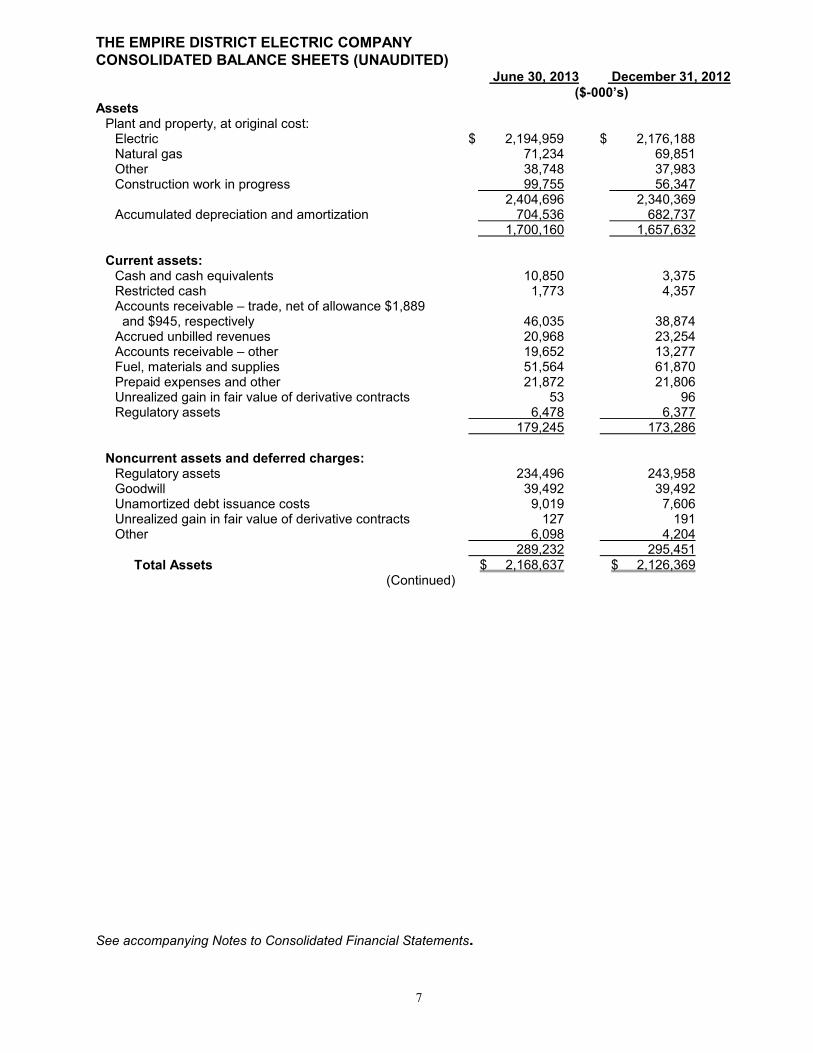
7
THE EMPIRE DISTRICT ELECTRIC COMPANY CONSOLIDATED BALANCE SHEETS (UNAUDITED)
June 30, 2013 December 31, 2012 ($-000’s) Assets Plant and property, at original cost: Electric $ 2,194,959 $ 2,176,188 Natural gas 71,234 69,851 Other 38,748 37,983 Construction work in progress 99,755 56,347 2,404,696 2,340,369 Accumulated depreciation and amortization 704,536 682,737 1,700,160 1,657,632
Current assets: Cash and cash equivalents 10,850 3,375 Restricted cash 1,773 4,357 Accounts receivable – trade, net of allowance $1,889 and $945, respectively 46,035 38,874 Accrued unbilled revenues 20,968 23,254 Accounts receivable – other 19,652 13,277 Fuel, materials and supplies 51,564 61,870 Prepaid expenses and other 21,872 21,806 Unrealized gain in fair value of derivative contracts 53 96 Regulatory assets 6,478 6,377
179,245 173,286 Noncurrent assets and deferred charges: Regulatory assets 234,496 243,958 Goodwill 39,492 39,492 Unamortized debt issuance costs 9,019 7,606 Unrealized gain in fair value of derivative contracts 127 191 Other 6,098 4,204 289,232 295,451
Total Assets $ 2,168,637 $ 2,126,369 (Continued)
See accompanying Notes to Consolidated Financial Statements.

8
THE EMPIRE DISTRICT ELECTRIC COMPANY CONSOLIDATED BALANCE SHEETS (UNAUDITED) (Continued)
June 30, 2013 December 31, 2012 ($-000’s) Capitalization and Liabilities Common stock, $1 par value, 42,830,673 and 42,484,363 shares issued and outstanding, respectively $ 42,831 $ 42,484
Capital in excess of par value 634,457 628,199 Retained earnings 50,070 47,115 Total common stockholders' equity 727,358 717,798
Long-term debt (net of current portion): Obligations under capital lease 4,306 4,441 First mortgage bonds and secured debt 637,559 487,541 Unsecured debt 101,676 199,644
Total long-term debt 743,541 691,626 Total long-term debt and common stockholders’ equity 1,470,899 1,409,424
Current liabilities: Accounts payable and accrued liabilities 46,371 66,559 Current maturities of long-term debt 418 714 Short-term debt - 24,000 Regulatory liabilities 5,003 5,470 Customer deposits 12,276 12,001 Interest accrued 6,748 5,902 Other current liabilities 1,369 - Unrealized loss in fair value of derivative contracts 2,612 3,403 Taxes accrued 11,703 2,992 86,500 121,041
Commitments and contingencies (Note 7) Noncurrent liabilities and deferred credits: Regulatory liabilities 133,895 131,888 Deferred income taxes 312,871 301,967 Unamortized investment tax credits 18,629 18,897 Pension and other postretirement benefit obligations 122,604 120,808 Unrealized loss in fair value of derivative contracts 4,362 3,819 Other 18,877 18,525 611,238 595,904 Total Capitalization and Liabilities $ 2,168,637 $ 2,126,369 See accompanying Notes to Consolidated Financial Statements.

9
THE EMPIRE DISTRICT ELECTRIC COMPANY CONSOLIDATED STATEMENTS OF CASH FLOWS (UNAUDITED)
Six Months Ended
June 30, 2013 2012 ($-000’s) Operating activities: Net income $ 24,287 $ 20,512 Adjustments to reconcile net income to cash flows from operating activities: Depreciation and amortization including regulatory items 35,268 40,561 Pension and other postretirement benefit costs, net of contributions 7,174 1,187 Deferred income taxes and unamortized investment tax credit, net 12,096 13,496 Allowance for equity funds used during construction (1,393) (103) Stock compensation expense 1,900 1,404 Loss on plant disallowance 2,409 - Regulatory reversal of gain on sale of assets 1,236 - Non-cash (gain)/loss on derivatives (67) 4 Other - (16) Cash flows impacted by changes in: Accounts receivable and accrued unbilled revenues (7,140) (2,062) Fuel, materials and supplies 8,138 2,424 Prepaid expenses, other current assets and deferred charges 542 (2,602) Accounts payable and accrued liabilities (20,639) (16,084) Interest, taxes accrued and customer deposits 9,832 8,587 Other liabilities and other deferred credits (2,638) 4,344 Net cash provided by operating activities 71,005 71,652 Investing activities: Capital expenditures – regulated (74,834) (60,760) Capital expenditures and other investments – non-regulated (934) (1,504) Decrease in restricted cash 2,585 - Net cash used in investing activities (73,183) (62,264) Financing activities: Proceeds from first mortgage bonds, net 150,000 88,000 Long-term debt issuance costs (1,744) (974) Redemption of senior notes (98,000) - Proceeds from issuance of common stock net of issuance costs 5,161 4,666 Repayment of first mortgage bonds - (88,029) Net short-term borrowings/(repayments) (24,000) 5,850 Dividends (21,332) (21,077) Other (432) (458) Net cash provided by/(used in) financing activities 9,653 (12,022) Net increase/(decrease) in cash and cash equivalents 7,475 (2,634) Cash and cash equivalents at beginning of period 3,375 5,408 Cash and cash equivalents at end of period $ 10,850 $ 2,774
See accompanying Notes to Consolidated Financial Statements.

10
NOTES TO CONSOLIDATED FINANCIAL STATEMENTS (UNAUDITED)
Note 1 - Summary of Significant Accounting Policies
We operate our businesses as three segments: electric, gas and other. The Empire District Electric Company (EDE), a Kansas corporation organized in 1909, is an operating public utility engaged in the generation, purchase, transmission, distribution and sale of electricity in parts of Missouri, Kansas, Oklahoma and Arkansas. As part of our electric segment, we also provide water service to three towns in Missouri. The Empire District Gas Company (EDG) is our wholly-owned subsidiary which provides natural gas distribution to customers in 48 communities in northwest, north central and west central Missouri. Our other segment consists of our fiber optics business. The accompanying interim financial statements do not include all disclosures included in the annual financial statements and therefore should be read in conjunction with the financial statements and notes thereto included in our Annual Report on Form 10-K for the fiscal year ended December 31, 2012. The information furnished reflects all adjustments, consisting only of normal recurring adjustments, which are in our opinion necessary to state fairly the results for the interim periods as well as present these periods on a consistent basis with the financial statements for the fiscal year ended December 31, 2012, of which there were none. Note 2 - Recently Issued and Proposed Accounting Standards
Balance Sheet Offsetting: The FASB amended the guidance governing the offsetting, or netting, of assets and liabilities on the balance sheet. Under the revised guidance, an entity is required to disclose both the gross and net information about instruments and transactions that are eligible for offset on the balance sheet, as well as instruments or transactions subject to a master netting agreement. This standard was effective for annual periods beginning after January 1, 2013. We implemented this standard in the first quarter of 2013 and it did not have a material impact on our results of operations, financial position or liquidity. Note 3– Regulatory Matters
On February 27, 2013, the MPSC approved a joint settlement agreement for our 2012 Missouri rate case. The agreement provided for an annual increase in base revenues for our Missouri electric customers in the amount of approximately $27.5 million, effective April 1, 2013, and the continuation of the current fuel adjustment mechanism. The agreement also included an increase in depreciation rates, recovery of deferred tornado costs over the next ten years and the continuation of tracking mechanisms for expenses related to employee pension, retiree health care, vegetation management, and Iatan 2, Iatan Common and Plum Point operating and maintenance costs. In addition, the agreement included a write-off of approximately $3.6 million, consisting of a $2.4 million disallowance for the prudency of certain construction expenditures for Iatan 2 and a $1.2 million regulatory reversal of a prior period gain on sale of our Asbury unit train, which is included in regulated operating expenses. We also agreed not to implement a Missouri general rate increase prior to October 1, 2014. The following table sets forth the components of our regulatory assets and liabilities on our consolidated balance sheet (in thousands).

11
Regulatory Assets and Liabilities
June 30, 2013 December 31, 2012 Regulatory Assets: Current: Under recovered fuel costs(1) $ 401 $ 2,885 Current portion of long-term regulatory assets(1) 6,077 3,492 Regulatory assets, current
(1) 6,478 6,377
Long-term: Pension and other postretirement benefits
(2) 130,626 136,480
Income taxes 47,816 48,759 Deferred construction accounting costs
(3) 16,496 16,717
Unamortized loss on reacquired debt 11,415 12,142 Unsettled derivative losses – electric segment 6,372 6,557 System reliability – vegetation management 8,235 9,002 Storm costs
(4) 5,257 4,828
Asset retirement obligation 4,554 4,430 Customer programs 4,702 4,356 Unamortized loss on interest rate derivative 1,013 1,147 Other 980 669 Deferred operating and maintenance expense 2,288 2,049 Under recovered fuel costs 819 314 Current portion of long-term regulatory assets (6,077) (3,492) Regulatory assets, long-term 234,496 243,958 Total Regulatory Assets $ 240,974 $ 250,335
June 30, 2013 December 31, 2012 Regulatory Liabilities: Current: Over recovered fuel costs $ 1,652 $ 2,381 Current portion of long-term regulatory liabilities
(1) 3,351 3,089
Regulatory liabilities, current(1) 5,003 5,470
Long-term: Costs of removal 90,278 83,368 SWPA payment for Ozark Beach lost generation 20,834 22,242 Income taxes 11,863 11,972 Deferred construction accounting costs – fuel 8,083 8,156 Unamortized gain on interest rate derivative 3,456 3,541 Pension and other postretirement benefits
(5) 1,323 2,007
Over recovered fuel costs 1,409 3,691 Current portion of long-term regulatory liabilities
(1) (3,351) (3,089)
Regulatory liabilities, long-term 133,895 131,888 Total Regulatory Liabilities $ 138,898 $ 137,358
(1) Reflects over and under recovered costs of the current portion of regulatory assets or liabilities detailed in the long term sections below expected to be returned or recovered, as applicable, within the next 12 months in rates.
(2) Includes the effect of costs incurred that are more or less than those allowed in rates for Missouri (EDE and EDG) and Kansas (EDE) portion of pension and other postretirement benefit costs. Since January 1, 2013, regulatory assets have been reduced, and corresponding expenses have increased, as a result of ratemaking treatment.
(3) Balances as of June 30, 2013 Deferred Carrying Charges Deferred O&M Depreciation Total
Iatan 1 $2,637 $1,319 $1,598 $ 5,554
Iatan 2 3,788 4,097 2,663 10,548
Plum Point 64 173 157 394
Total $ 16,496
Balances as of December 31, 2012 Deferred Carrying Charges Deferred O&M Depreciation Total
Iatan 1 $2,678 $1,339 $1,622 $ 5,639
Iatan 2 3,821 4,155 2,685 10,661
Plum Point 64 195 158 417
Total $ 16,717
(4) Reflects ice storm costs incurred in 2007 and costs incurred as a result of the May 2011 tornado.
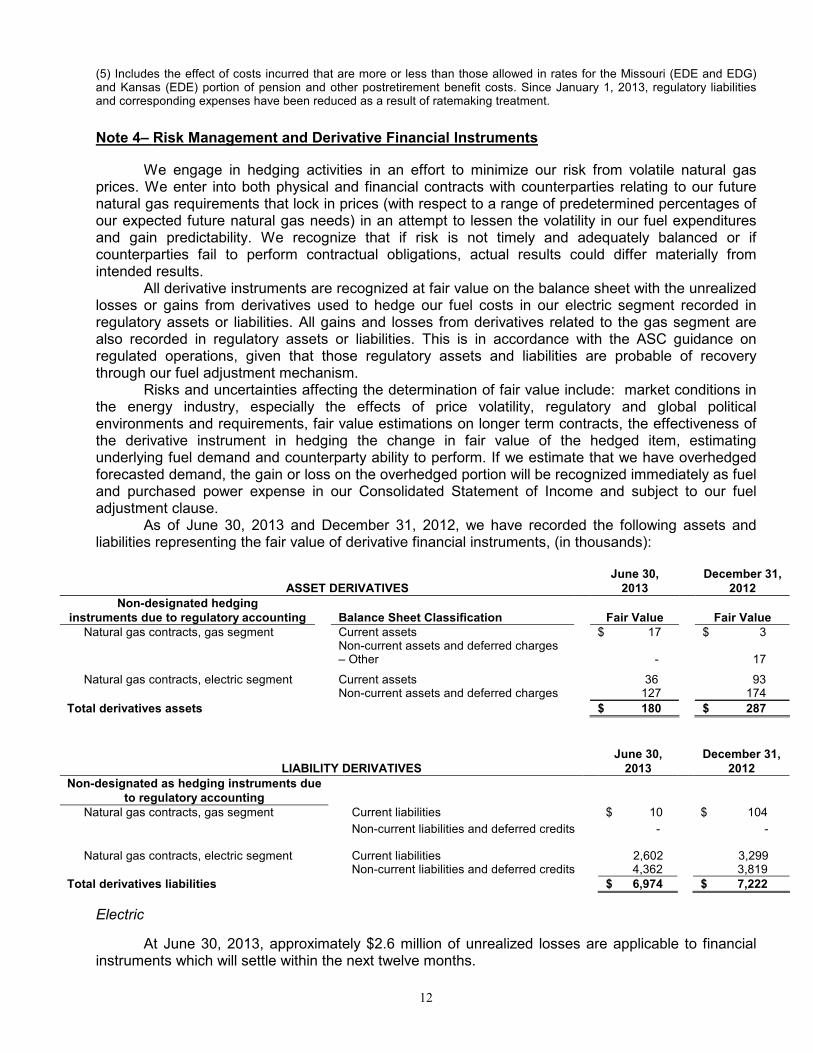
12
(5) Includes the effect of costs incurred that are more or less than those allowed in rates for the Missouri (EDE and EDG) and Kansas (EDE) portion of pension and other postretirement benefit costs. Since January 1, 2013, regulatory liabilities and corresponding expenses have been reduced as a result of ratemaking treatment.
Note 4– Risk Management and Derivative Financial Instruments
We engage in hedging activities in an effort to minimize our risk from volatile natural gas prices. We enter into both physical and financial contracts with counterparties relating to our future natural gas requirements that lock in prices (with respect to a range of predetermined percentages of our expected future natural gas needs) in an attempt to lessen the volatility in our fuel expenditures and gain predictability. We recognize that if risk is not timely and adequately balanced or if counterparties fail to perform contractual obligations, actual results could differ materially from intended results. All derivative instruments are recognized at fair value on the balance sheet with the unrealized losses or gains from derivatives used to hedge our fuel costs in our electric segment recorded in regulatory assets or liabilities. All gains and losses from derivatives related to the gas segment are also recorded in regulatory assets or liabilities. This is in accordance with the ASC guidance on regulated operations, given that those regulatory assets and liabilities are probable of recovery through our fuel adjustment mechanism. Risks and uncertainties affecting the determination of fair value include: market conditions in the energy industry, especially the effects of price volatility, regulatory and global political environments and requirements, fair value estimations on longer term contracts, the effectiveness of the derivative instrument in hedging the change in fair value of the hedged item, estimating underlying fuel demand and counterparty ability to perform. If we estimate that we have overhedged forecasted demand, the gain or loss on the overhedged portion will be recognized immediately as fuel and purchased power expense in our Consolidated Statement of Income and subject to our fuel adjustment clause. As of June 30, 2013 and December 31, 2012, we have recorded the following assets and liabilities representing the fair value of derivative financial instruments, (in thousands):
June 30, December 31, ASSET DERIVATIVES 2013 2012
Non-designated hedging instruments due to regulatory accounting
Balance Sheet Classification
Fair Value
Fair Value
Natural gas contracts, gas segment Current assets $ 17 $ 3 Non-current assets and deferred charges
– Other
-
17 Natural gas contracts, electric segment Current assets 36 93 Non-current assets and deferred charges 127 174
Total derivatives assets $ 180 $ 287
June 30, December 31, LIABILITY DERIVATIVES 2013 2012
Non-designated as hedging instruments due to regulatory accounting
Natural gas contracts, gas segment Current liabilities $ 10 $ 104
Non-current liabilities and deferred credits - -
Natural gas contracts, electric segment Current liabilities 2,602 3,299 Non-current liabilities and deferred credits 4,362 3,819 Total derivatives liabilities $ 6,974 $ 7,222
Electric
At June 30, 2013, approximately $2.6 million of unrealized losses are applicable to financial instruments which will settle within the next twelve months.
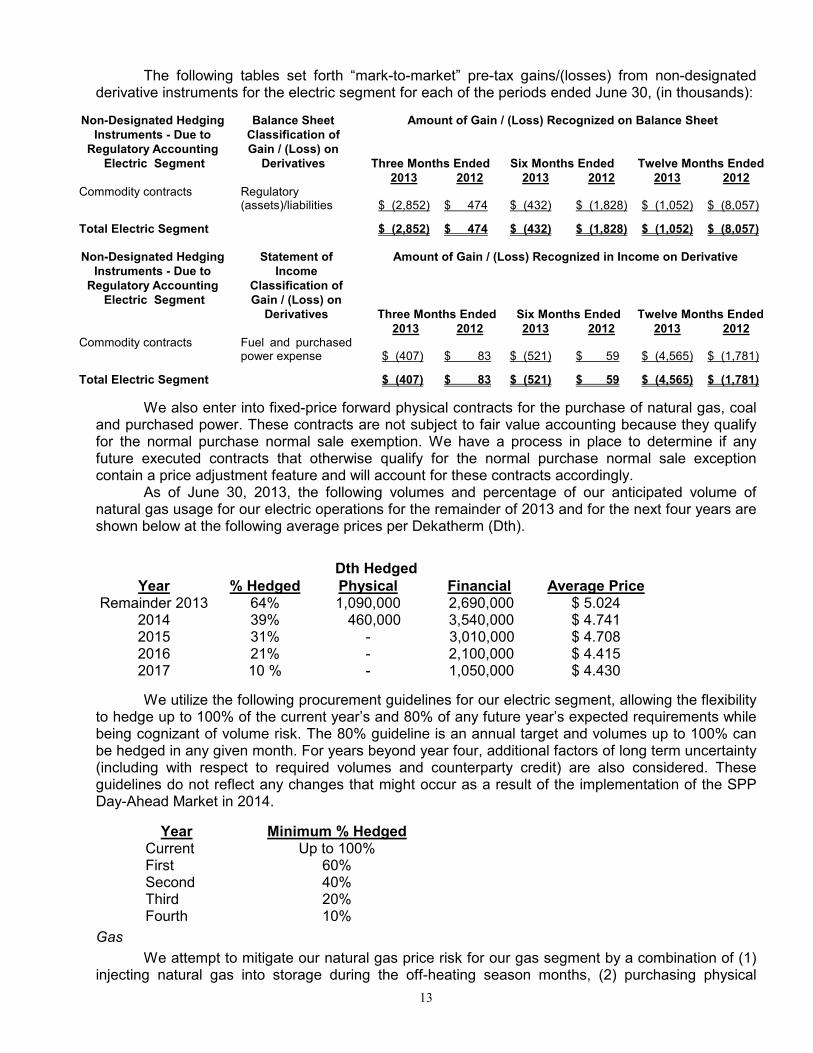
13
The following tables set forth “mark-to-market” pre-tax gains/(losses) from non-designated derivative instruments for the electric segment for each of the periods ended June 30, (in thousands):
Non-Designated Hedging Instruments - Due to Regulatory Accounting Electric Segment
Balance Sheet Classification of Gain / (Loss) on Derivatives
Amount of Gain / (Loss) Recognized on Balance Sheet
Three Months Ended Six Months Ended Twelve Months Ended 2013 2012 2013 2012 2013 2012 Commodity contracts Regulatory
(assets)/liabilities
$ (2,852) $ 474
$ (432)
$ (1,828)
$ (1,052)
$ (8,057)
Total Electric Segment $ (2,852) $ 474 $ (432) $ (1,828) $ (1,052) $ (8,057)
Non-Designated Hedging Instruments - Due to Regulatory Accounting Electric Segment
Statement of Income
Classification of Gain / (Loss) on Derivatives
Amount of Gain / (Loss) Recognized in Income on Derivative
Three Months Ended Six Months Ended Twelve Months Ended 2013 2012 2013 2012 2013 2012 Commodity contracts Fuel and purchased
power expense
$ (407) $ 83
$ (521)
$ 59
$ (4,565)
$ (1,781)
Total Electric Segment $ (407) $ 83 $ (521) $ 59 $ (4,565) $ (1,781)
We also enter into fixed-price forward physical contracts for the purchase of natural gas, coal and purchased power. These contracts are not subject to fair value accounting because they qualify for the normal purchase normal sale exemption. We have a process in place to determine if any future executed contracts that otherwise qualify for the normal purchase normal sale exception contain a price adjustment feature and will account for these contracts accordingly. As of June 30, 2013, the following volumes and percentage of our anticipated volume of natural gas usage for our electric operations for the remainder of 2013 and for the next four years are shown below at the following average prices per Dekatherm (Dth).
Dth Hedged Year % Hedged Physical Financial Average Price
Remainder 2013 64% 1,090,000 2,690,000 $ 5.024 2014 39% 460,000 3,540,000 $ 4.741 2015 31% - 3,010,000 $ 4.708 2016 21% - 2,100,000 $ 4.415 2017 10 % - 1,050,000 $ 4.430
We utilize the following procurement guidelines for our electric segment, allowing the flexibility to hedge up to 100% of the current year’s and 80% of any future year’s expected requirements while being cognizant of volume risk. The 80% guideline is an annual target and volumes up to 100% can be hedged in any given month. For years beyond year four, additional factors of long term uncertainty (including with respect to required volumes and counterparty credit) are also considered. These guidelines do not reflect any changes that might occur as a result of the implementation of the SPP Day-Ahead Market in 2014.
Year Minimum % Hedged Current Up to 100% First 60% Second 40% Third 20% Fourth 10%
Gas
We attempt to mitigate our natural gas price risk for our gas segment by a combination of (1) injecting natural gas into storage during the off-heating season months, (2) purchasing physical

14
forward contracts and (3) purchasing financial derivative contracts. We target to have 95% of our storage capacity full by November 1 for the upcoming winter heating season. As the winter progresses, gas is withdrawn from storage to serve our customers. As of June 30, 2013, we had 0.8 million Dths in storage on the three pipelines that serve our customers. This represents 38% of our storage capacity. The following table sets forth our long-term hedge strategy of mitigating price volatility for our customers by hedging a minimum of expected gas usage for the current winter season and the next two winter seasons by the beginning of the Actual Cost Adjustment (ACA) year at September 1 and illustrates our hedged position as of June 30, 2013 (in thousands).
Season
Minimum % Hedged
Dth Hedged Financial
Dth Hedged Physical
Dth in Storage
Actual % Hedged
Current 50% 220,000 239,635 757,824 38% Second Up to 50% - - - - Third Up to 20% - - - -
A Purchased Gas Adjustment (PGA) clause is included in our rates for our gas segment operations, therefore, we mark to market any unrealized gains or losses and any realized gains or losses relating to financial derivative contracts to a regulatory asset or regulatory liability account on our balance sheet. The following table sets forth “mark-to-market” pre-tax gains / (losses) from derivatives not designated as hedging instruments for the gas segment for each of the periods ended June 30, (in thousands).
Non-Designated Hedging Instruments Due to Regulatory Accounting - Gas Segment
Balance Sheet Classification of Gain / (Loss) on
Derivative
Amount of Gain/(Loss) Recognized on Balance Sheet
Three Months Ended Six Months Ended Twelve Months Ended
2013 2012 2013 2012 2013 2012 Commodity contracts Regulatory
(assets)/liabilities $ (71)
$ 164
$ (18)
$ (491)
$ 12
$ (2,136)
Total - Gas Segment $ (71) $ 164 $ (18) $ (491) $ 12 $ (2,136)
Contingent Features
Certain of our derivative instruments contain provisions that require our senior unsecured debt to maintain an investment grade credit rating with any relevant credit rating agency. If our debt were to fall below investment grade, it would be in violation of these provisions, and the counterparties to the derivative instruments could request increased collateralization on derivative instruments in net liability positions. The aggregate fair value of all derivative instruments with the credit-risk-related contingent features that are in a liability position on June 30, 2013 is $2.1 million for which we have posted no collateral in the normal course of business. If the credit-risk-related contingent features underlying these agreements were triggered on June 30, 2013, we would have been required to post $2.1 million of collateral with one of our counterparties. In addition, certain counterparties make available collateral in the form of cash held as margin deposits as a result of exceeding agreed-upon credit exposure thresholds or may be required to prepay the transaction. Conversely, we are required to post collateral with counterparties at certain thresholds, which is typically the result of changes in commodity prices. Amounts reported as margin deposit liabilities represent counterparty funds we hold that result from various trading counterparties exceeding agreed-upon credit exposure thresholds. Amounts reported as margin deposit assets represent our funds held on deposit for our NYMEX contracts with our broker and other financial contracts with other counterparties that resulted from us exceeding agreed-upon credit limits established by the counterparties. The following table depicts our margin deposit assets at June 30, 2013 and December 31, 2012. There were no margin deposit liabilities at these dates.
June 30, 2013 December 31, 2012 (in millions) Margin deposit assets $ 5.0 $ 4.2
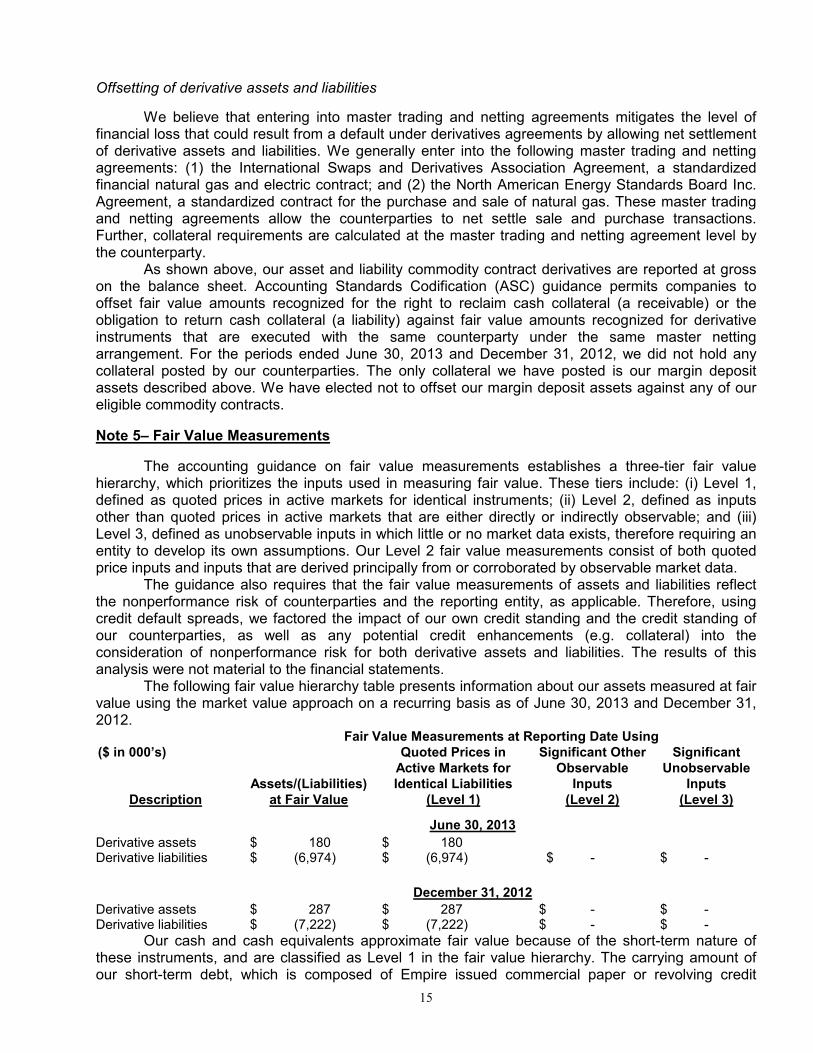
15
Offsetting of derivative assets and liabilities
We believe that entering into master trading and netting agreements mitigates the level of financial loss that could result from a default under derivatives agreements by allowing net settlement of derivative assets and liabilities. We generally enter into the following master trading and netting agreements: (1) the International Swaps and Derivatives Association Agreement, a standardized financial natural gas and electric contract; and (2) the North American Energy Standards Board Inc. Agreement, a standardized contract for the purchase and sale of natural gas. These master trading and netting agreements allow the counterparties to net settle sale and purchase transactions. Further, collateral requirements are calculated at the master trading and netting agreement level by the counterparty.
As shown above, our asset and liability commodity contract derivatives are reported at gross on the balance sheet. Accounting Standards Codification (ASC) guidance permits companies to offset fair value amounts recognized for the right to reclaim cash collateral (a receivable) or the obligation to return cash collateral (a liability) against fair value amounts recognized for derivative instruments that are executed with the same counterparty under the same master netting arrangement. For the periods ended June 30, 2013 and December 31, 2012, we did not hold any collateral posted by our counterparties. The only collateral we have posted is our margin deposit assets described above. We have elected not to offset our margin deposit assets against any of our eligible commodity contracts.
Note 5– Fair Value Measurements
The accounting guidance on fair value measurements establishes a three-tier fair value hierarchy, which prioritizes the inputs used in measuring fair value. These tiers include: (i) Level 1, defined as quoted prices in active markets for identical instruments; (ii) Level 2, defined as inputs other than quoted prices in active markets that are either directly or indirectly observable; and (iii) Level 3, defined as unobservable inputs in which little or no market data exists, therefore requiring an entity to develop its own assumptions. Our Level 2 fair value measurements consist of both quoted price inputs and inputs that are derived principally from or corroborated by observable market data. The guidance also requires that the fair value measurements of assets and liabilities reflect the nonperformance risk of counterparties and the reporting entity, as applicable. Therefore, using credit default spreads, we factored the impact of our own credit standing and the credit standing of our counterparties, as well as any potential credit enhancements (e.g. collateral) into the consideration of nonperformance risk for both derivative assets and liabilities. The results of this analysis were not material to the financial statements. The following fair value hierarchy table presents information about our assets measured at fair value using the market value approach on a recurring basis as of June 30, 2013 and December 31, 2012. Fair Value Measurements at Reporting Date Using ($ in 000’s)
Description
Assets/(Liabilities) at Fair Value
Quoted Prices in Active Markets for Identical Liabilities
(Level 1)
Significant Other Observable
Inputs (Level 2)
Significant Unobservable
Inputs (Level 3)
June 30, 2013
Derivative assets $ 180 $ 180 Derivative liabilities $ (6,974) $ (6,974) $ - $ -
December 31, 2012
Derivative assets $ 287 $ 287 $ - $ - Derivative liabilities $ (7,222) $ (7,222) $ - $ -
Our cash and cash equivalents approximate fair value because of the short-term nature of these instruments, and are classified as Level 1 in the fair value hierarchy. The carrying amount of our short-term debt, which is composed of Empire issued commercial paper or revolving credit

16
borrowings, also approximates fair value because of their short-term nature. These instruments are classified as Level 2 in the fair value hierarchy as they are valued based on market rates for similar market transactions. The carrying amount of our total long-term debt exclusive of capital leases at June 30, 2013, was $739.4 million as compared to $687.6 at December 31, 2012. The fair market value at June 30, 2013 was approximately $725.0 million as compared to $747.2 at December 31, 2012. These estimates were based on a bond pricing model, utilizing inputs classified as Level 2 in the fair value hierarchy, which include the quoted market prices for the same or similar issues or on the current rates offered to us for debt of the same remaining maturities. The estimated fair market value may not represent the actual value that could have been realized as of June 30, 2013 or that will be realizable in the future.
Note 6– Financing
On October 30, 2012, we entered into a Bond Purchase Agreement for a private placement of $30.0 million of 3.73% First Mortgage Bonds due May 30, 2033 and $120.0 million of 4.32% First Mortgage Bonds due May 30, 2043. The delayed settlement of both series of bonds occurred on May 30, 2013. Interest is payable semi-annually on the bonds on each May 30 and November 30, commencing November 30, 2013. The bonds may be redeemed at our option, at any time prior to maturity, at par plus a make whole premium, together with accrued and unpaid interest, if any, to the redemption date. The bonds have not been registered under the Securities Act of 1933, as amended. The bonds were issued under the EDE Mortgage. The principal amount of all series of first mortgage bonds outstanding at any one time under the EDE Mortgage is limited by terms of the mortgage to $1 billion. Substantially all of the property, plant and equipment of The Empire District Electric Company (but not its subsidiaries) is subject to the lien of the EDE Mortgage.
We used a portion of the proceeds from the sale of these bonds to redeem all $98.0 million aggregate principal amount of our Senior Notes, 4.50% Series due June 15, 2013. The remaining proceeds will be used for general corporate purposes.
We have an unsecured revolving credit facility of $150 million in place through January 17, 2017. The facility is used for working capital, general corporate purposes and to back-up our use of commercial paper. This facility requires our total indebtedness to be less than 62.5% of our total capitalization at the end of each fiscal quarter and our EBITDA (defined as net income plus interest, taxes, depreciation and amortization) to be at least two times our interest charges for the trailing four fiscal quarters at the end of each fiscal quarter. Failure to maintain these ratios will result in an event of default under the credit facility and will prohibit us from borrowing funds thereunder. As of June 30, 2013, we are in compliance with these ratios. Our total indebtedness is 50.6% of our total capitalization as of June 30, 2013 and our EBITDA is 5.0 times our interest charges. This credit facility is also subject to cross-default if we default on in excess of $10 million in the aggregate on our other indebtedness. This arrangement does not serve to legally restrict the use of our cash in the normal course of operations. There were no outstanding borrowings under this agreement and no outstanding commercial paper at June 30, 2013.
Note 7– Commitments and Contingencies
Legal Proceedings
We are a party to various claims and legal proceedings arising out of the normal course of our business. Management regularly analyzes this information, and has provided accruals for any liabilities, in accordance with the guidelines presented in the ASC on accounting for contingencies. In the opinion of management, it is not probable, given the company’s defenses, that the ultimate outcome of these claims and lawsuits will have a material adverse effect upon our financial condition, or results of operations or cash flows.
A lawsuit was filed in Jasper County Circuit Court (the Court) against us by three of our residential customers, purporting to act on behalf of all Empire customers. These customers were seeking a refund of certain amounts paid for service provided by Empire between January 1, 2007,

17
and December 13, 2007. At all times, we charged the three plaintiffs, and all of our customers, the rates approved by and on file with the MPSC from our 2006 rate case. While the precise circumstances of Empire’s 2006 rate case and the approval of Empire’s tariffs have not previously been addressed by Missouri’s appellate courts, we believe that case law supports the position that the MPSC may not re-determine rates already established and paid without depriving the utility, or a consumer if the rates were originally too low, of its property without due process.
We filed a motion asking the Court to dismiss the case on the basis that the plaintiffs had not stated a valid claim. A hearing on our motion was held April 18, 2012. The Court granted Empire’s motion to dismiss, and a judgment was issued by the Court on June 29, 2012, dismissing the case. The plaintiffs filed a Notice of Appeal on July 30, 2012. The Missouri Court of Appeals for the Southern District dismissed the case for failure to properly perfect the appeal. The plaintiffs moved to set aside the dismissal, and the Court of Appeals restored the case to its active docket. On June 18, 2013, the Court of Appeals affirmed the dismissal with prejudice by the Jasper County Circuit Court based on our argument that a court could not re-determine what rate Empire should have charged other than the rate on file. The plaintiffs filed a motion with the Court of Appeals seeking reconsideration of the decision or transfer to the Missouri Supreme Court. The Court of Appeals denied the motion. On July 24, 2013, the plaintiffs filed a notice with the Court of Appeals stating that the plaintiffs intend to file an Application to Transfer with the Missouri Supreme Court.
Coal, Natural Gas and Transportation Contracts
The following table sets forth our firm physical gas, coal and transportation contracts for the periods indicated as of June 30, 2013 (in millions).
Firm physical gas and transportation contracts
Coal and coal transportation contracts
July 1, 2013 through December 31, 2013 $ 18.7 $ 10.4 January 1, 2014 through December 31, 2015 30.5 32.3 January 1, 2016 through December 31, 2017 22.2 22.8 January 1, 2018 and beyond 8.3 22.8
In addition to the above, we have an agreement with Southern Star Central Pipeline, Inc. to purchase one million Dths of firm gas storage service capacity for our electric business for a period of five years, expiring April 2016. The reservation charge for this storage capacity is approximately $1.1 million annually. We have entered into long and short-term agreements to purchase coal and natural gas for our energy supply and natural gas operations. Under these contracts, the natural gas supplies are divided into firm physical commitments and derivatives that are used to hedge future purchases. In the event that this gas cannot be used at our plants, the gas would be liquidated at market price. The firm physical gas and transportation commitments are detailed in the table above. We have coal supply agreements and transportation contracts in place to provide for the delivery of coal to the plants. These contracts are written with Force Majeure clauses that enable us to reduce tonnages or cease shipments under certain circumstances or events. These include mechanical or electrical maintenance items, acts of God, war or insurrection, strikes, weather and other disrupting events. This reduces the risk we have for not taking the minimum requirements of fuel under the contracts. The minimum requirements for our coal and coal transportation contracts as of June 30, 2013, are detailed in the table above.
Purchased Power
We currently supplement our on-system generating capacity with purchases of capacity and energy from other entities in order to meet the demands of our customers and the capacity margins applicable to us under current pooling agreements and National Electric Reliability Council (NERC) rules.

18
The Plum Point Energy Station (Plum Point) is a 670-megawatt, coal-fired generating facility near Osceola, Arkansas. We own, through an undivided interest, 50 megawatts of the unit’s capacity. We also have a long-term (30 year) agreement for the purchase of capacity from Plum Point. We began receiving purchased power under this agreement on September 1, 2010. We have the option to purchase an undivided ownership interest in the 50 megawatts covered by the purchased power agreement in 2015. We evaluated this purchase option as part of our Integrated Resource Plan (IRP), which was filed with the MPSC on July 1, 2013. While it is not currently our intention to exercise this option in 2015, we will continue to evaluate this purchase option through the exercise date as well as explore other options with the purchase power agreement holder, Plum Point Energy Associates (PPEA), related to the timing of this option. Commitments under this agreement are approximately $301.9 million through August 31, 2039, the end date of the agreement.
We have a 20-year purchased power agreement, which began on December 15, 2008, with Cloud County Windfarm, LLC, owned by EDP Renewables North America LLC (formerly Horizon Wind Energy), Houston, Texas to purchase the energy generated at the approximately 105-megawatt Phase 1 Meridian Way Wind Farm located in Cloud County, Kansas. Annual payments are contingent upon output of the facility and can range from zero to a maximum of approximately $14.6 million based on a 20-year average cost. We also have a 20-year contract, which began on December 15, 2005, with Elk River Windfarm, LLC, owned by IBERDROLA RENEWABLES, Inc., to purchase the energy generated at the 150-megawatt Elk River Windfarm located in Butler County, Kansas. Annual payments are contingent upon output of the facility and can range from zero to a maximum of approximately $16.9 million based on a 20-year average cost. Although these agreements are considered operating leases under Generally Accepted Accounting Principles (GAAP), payments for these wind agreements are recorded as purchased power expenses, and, because of the contingent nature of these payments, are not included in our operating lease obligations. We do not own any portion of these windfarms.
New Construction
On July 9, 2013, we signed a contract with a third party vendor to complete engineering, procurement, and construction activities at our Riverton plant to convert Riverton Unit 12 from a simple cycle combustion turbine to a combined cycle unit. The conversion will include the installation of a heat recovery steam generator (HRSG), steam turbine generator, auxiliary boiler, cooling tower, and other auxiliary equipment. The Air Emission Source Construction Permit necessary for this project was issued by Kansas Department of Health and Environment on July 11, 2013. See “Environmental Matters” below for additional information about this project and associated compliance measures.
On January 16, 2012, we signed a contract with a third party vendor to complete environmental retrofits at our Asbury plant. The retrofits include the installation of a pulse-jet fabric filter (baghouse), circulating dry scrubber and powder activated carbon injection system. This equipment will enable us to comply with the Mercury and Air Toxics Standard (MATS). See “Environmental Matters” below for more information and for project costs.
Leases
We have purchased power agreements with Cloud County Windfarm, LLC and Elk River Windfarm, LLC, which are considered operating leases for GAAP purposes. Details of these agreements are disclosed in the Purchased Power section of this note. We also currently have short-term operating leases for two unit trains to meet coal delivery demands, for garage and office facilities for our electric segment and for one office facility related to our gas segment. In addition, we have capital leases for certain office equipment and 108 railcars to provide coal delivery for our ownership and purchased power agreement shares of the Plum Point generating facility.
19
Environmental Matters
We are subject to various federal, state, and local laws and regulations with respect to air and water quality and with respect to hazardous and toxic materials and hazardous and other wastes, including their identification, transportation, disposal, record-keeping and reporting, as well as remediation of contaminated sites and other environmental matters. We believe that our operations are in material compliance with present environmental laws and regulations. Environmental requirements have changed frequently and become more stringent over time. We expect this trend to continue. While we are not in a position to accurately estimate compliance costs for any new requirements, we expect any such costs to be material, although recoverable in rates.
Electric Segment
Air
The Federal Clean Air Act (CAA) and comparable state laws regulate air emissions from stationary sources such as electric power plants through permitting and/or emission control and related requirements. These requirements include maximum emission limits on our facilities for sulfur dioxide (SO2), particulate matter, nitrogen oxides (NOx) and mercury. In the future they are also likely to include limits on other hazardous pollutants (HAPs) and greenhouse gases (GHG) such as carbon dioxide (CO2) and methane.
Permits
Under the CAA we have obtained, and renewed as necessary, site operating permits, which are valid for five years, for each of our plants. As stated above, on July 11, 2013, we received the Air Emission Source Construction Permit necessary to begin construction on the Riverton 12 Combined Cycle Conversion project.
Compliance Plan
In order to comply with forthcoming environmental regulations, Empire is taking actions to implement its compliance plan and strategy (Compliance Plan). While the Cross State Air Pollution Rule (CSAPR – formerly the Clean Air Transport Rule, or CATR) that was set to take effect on January 1, 2012 was stayed in late December 2011 then vacated in August 2012 by the District of Columbia Circuit Court of Appeals, the Mercury Air Toxics Standard (MATS) was signed by the Environmental Protection Agency (EPA) Administrator on December 16, 2011 and became effective on April 16, 2012. MATS requires compliance by April 2015 (with flexibility for extensions for reliability reasons). Our Compliance Plan largely follows the preferred plan presented in our 2010 Integrated Resource Plan (IRP) and is further supported by our recent IRP filing. As described above under New Construction, we have begun the installation of a scrubber, fabric filter, and powder activated carbon injection system at our Asbury plant. The addition of this air quality control equipment is expected to be completed by early 2015 at a cost ranging from $112.0 million to $130.0 million, excluding AFUDC. Construction costs through June 30, 2013 were $28.6 million for 2013 and $58.9 million for the project to date, excluding AFUDC. The addition of this air quality control equipment will require the retirement of Asbury Unit 2, a steam turbine currently rated at 14 megawatts that is used for peaking purposes.
In September 2012, we completed the transition of our Riverton Units 7 and 8 from operation on coal to operating completely on natural gas. Riverton Units 7 and 8, along with Riverton Unit 9, a small combustion turbine that requires steam from Unit 7 or 8 for start-up, will be retired upon the conversion of Riverton Unit 12, a simple cycle combustion turbine, to a combined cycle unit. This conversion is currently scheduled to be completed in 2016 at a cost estimated to range from $165 million to $175 million, excluding AFUDC. This is approximately $35 million higher than the amount included in our five-year capital expenditure plan disclosed in our 2012 10-K. Construction costs, consisting of pre-engineering and site preparation activities thus far, through June 30, 2013 were $1.1 million for 2013 and $1.9 million for the project to date, excluding AFUDC. An update to the

20
Company’s overall capital expenditure estimates for 2014-2018 will be provided as part of our September 30, 2013 10-Q filing.
SO2 Emissions
The CAA regulates the amount of SO2 an affected unit can emit. Currently SO2 emissions are regulated by the Title IV Acid Rain Program and the Clean Air Interstate Rule (CAIR). On January 1, 2012, CAIR was to have been replaced by the Cross-State Air Pollution Rule (CSAPR). But, as discussed above, CSAPR was subsequently vacated, and CAIR will remain in effect until the EPA develops a valid replacement.
On October 5, 2012, the Department of Justice, on behalf of the EPA, requested that the Court of Appeals grant a request for a re-hearing of CSAPR. On January 24, 2013, the request was denied by the Court of Appeals and on March 29, 2013, the EPA petitioned the United States Supreme Court (the Supreme Court) to review the D.C. Circuit Court’s decision. On June 24, 2013 the Supreme Court agreed to review the D.C. Circuit court’s decision which is anticipated to occur in June 2014. In the meantime, both the Title IV Acid Rain Program and CAIR will remain in effect.
The Mercury Air Toxics Standards (MATS), discussed further below, was signed on December 16, 2011, and will affect SO2 emission rates at our facilities. In addition, the compliance date for the revised SO2 National Ambient Air Quality Standards (NAAQS) is August of 2017; this will also affect SO2 emissions at our facilities. The SO2 NAAQS is discussed in more detail below.
Title IV Acid Rain Program:
Under the Title IV Acid Rain Program, each existing affected unit has been allocated a specific number of emission allowances by the U.S. Environmental Protection Agency (EPA). Each allowance entitles the holder to emit one ton of SO2. Covered utilities, such as Empire, must have emission allowances equal to the number of tons of SO2 emitted during a given year by each of their affected units. Allowances in excess of the annual emissions are banked for future use. In 2012, our SO2 emissions exceeded the annual allocations. This deficit was covered by our banked allowances. We estimate our Title IV Acid Rain Program SO2 allowance bank plus annual allocations will be more than our projected emissions through 2017. Long-term compliance with this program will be met by the Compliance Plan detailed above along with possible procurement of additional SO2 allowances. We expect the cost of compliance to be fully recoverable in our rates.
CAIR:
In 2005, the EPA promulgated CAIR under the CAA. CAIR generally calls for fossil-fueled power plants greater than 25 megawatts to reduce emission levels of SO2 and/or NOx in 28 eastern states and the District of Columbia, including Missouri, where our Asbury, Energy Center, State Line and Iatan Units No. 1 and No. 2 are located. Kansas was not included in CAIR and our Riverton Plant was not affected. Arkansas, where our Plum Point Plant is located, was included for ozone season NOx but not for SO2.
In 2008, the U.S. Court of Appeals for the District of Columbia vacated CAIR and remanded it back to EPA for further consideration, but also stayed its vacatur. As a result, CAIR became effective for NOx on January 1, 2009 and for SO2 on January 1, 2010 and required covered states to develop State Implementation Plans (SIPs) to comply with specific SO2 state-wide annual budgets.
SO2 allowance allocations under the Title IV Acid Rain Program are used for compliance in the CAIR SO2 Program. Beginning in 2010, SO2 allowances were utilized at a 2:1 ratio for our Missouri units. As a result, based on current SO2 allowance usage projections, we expected to have sufficient allowances to take us through 2017.
In order to meet CAIR requirements for SO2 and NOx emissions (NOx is discussed below in more detail) and as a requirement for the air permit for Iatan 2, a Selective Catalytic Reduction system (SCR), a Flue-Gas Desulfurization (FGD) scrubber system and baghouse were installed at our jointly-owned Iatan 1 plant and a SCR was placed in service at our Asbury plant in 2008. Our jointly-owned Iatan 2 and Plum Point plants were originally constructed with the above technology.

21
CSAPR- formerly the Clean Air Transport Rule:
On July 6, 2010, the EPA published a proposed CAIR replacement rule entitled the Clean Air Transport Rule (CATR). As proposed and supplemented, the CATR included Missouri and Kansas under both the annual and ozone season for NOx as well as the SO2 program while Arkansas remained in the ozone season NOx program only. The final CATR was released on July 7, 2011 under the name of the CSAPR, and was set to become effective January 1, 2012. However, as mentioned above, the District of Columbia Circuit Court of Appeals vacated CSAPR on August 21, 2012, and the EPA has subsequently petitioned the Supreme Court to review the D.C. Circuit Court’s decision. On June 24, 2013 the Supreme Court agreed to review the D.C. Circuit court’s decision during its next term, which begins in October 2013. The CAIR will be in effect until a valid replacement is developed by the EPA.
When it was published, the final CSAPR required a 73% reduction in SO2 from 2005 levels by 2014. The SO2 allowances allocated under the EPA’s Title IV Acid Rain Program could not be used for compliance with CSAPR but would continue to be used for compliance with the Title IV Acid Rain Program. Therefore, new SO2 allowances would be allocated under CSAPR and retired at one allowance per ton of SO2 emissions emitted. Based on current projections, we would receive more SO2 allowances than would be emitted. Long-term compliance with this Rule will be met by the Compliance Plan detailed above along with possible procurement of additional SO2 allowances. We anticipate compliance costs associated with CAIR or its subsequent replacement to be recoverable in our rates.
Mercury Air Toxics Standard (MATS):
The MATS standard was fully implemented and effective as of April 16, 2012, thus requiring compliance by April 16, 2015 (with flexibility for extensions for reliability reasons). The MATS regulation does not include allowance mechanisms. Rather, it establishes alternative standards for certain pollutants, including SO2 (as a surrogate for hydrogen chloride (HCI)), which must be met to show compliance with hazardous air pollutant limits (see additional discussion in the MATS section below).
SO2 National Ambient Air Quality Standard (NAAQS):
In June 2010, the EPA finalized a new 1-hour SO2 NAAQS which, for areas with no ambient SO2 monitor, originally required modeling to determine attainment and non-attainment areas within each state. In April 2012, the EPA announced that it is reconsidering this approach. The modeling of emission sources was to have been completed by June 2013 with compliance with the SO2 NAAQS required by August 2017. Because the EPA is reconsidering the compliance determination approach for areas without ambient SO2 monitors, the compliance time-frame may be pushed back. Draft guidance for 1-hour SO2 NAAQS has been published by the EPA to assist states as they prepare their SIP submissions. The EPA is also planning a rulemaking to address some of the 1-hour SO2 NAAQS implementation program elements. It is likely that coal-fired generating units will need scrubbers to be capable of meeting the new 1-hour SO2 NAAQS. In addition, units will be required to include SO2 emissions limits in their Title V permits or execute consent decrees to assure attainment and future compliance.
NOx Emissions
The CAA regulates the amount of NOx an affected unit can emit. As currently operated, each of our affected units is in compliance with the applicable NOx limits. Currently, revised NOx emissions are limited by the CAIR as a result of the vacated CSPAR rule and by ozone NAAQS rules (discussed below) which were established in 1997 and in 2008.
CAIR:
The CAIR required covered states to develop SIPs to comply with specific annual NOx state-wide allowance allocation budgets. Based on existing SIPs, we had excess NOx allowances during

22
2012 which were banked for future use and will be sufficient for compliance at least through the end of 2017. The CAIR NOx program also was to have been replaced by the CSAPR program January 1, 2012 but because the Court vacated CSAPR, CAIR will remain in effect until the EPA develops a valid replacement.
CSAPR:
As published, the CSAPR would have required a 54% reduction in NOx from 2005 levels by 2014. The NOx annual and ozone season allowances that were allocated and banked under CAIR could not be used for compliance under CSAPR. New allowances would have been issued under CSAPR. However, as discussed above, CSPAR was vacated by the District of Columbia Circuit Court of Appeals on August 21, 2012 and the EPA subsequently petitioned the Supreme Court to review the D.C. Circuit Court’s decision. As previously mentioned, the Supreme Court agreed to review the case.
Ozone NAAQS:
Ozone, also called ground level smog, is formed by the mixing of NOx and Volatile Organic Compounds (VOCs) in the presence of sunlight. On January 6, 2010, to protect public health, the EPA proposed to lower the primary NAAQS for ozone to a range between 60 and 70 ppb and to set a separate secondary NAAQS for ozone to protect sensitive vegetation and ecosystems.
On September 2, 2011, President Obama ordered the EPA to withdraw proposed air quality standards lowering the 2008 ozone standard pending the CAA 2013 scheduled reconsideration of the ozone NAAQS (the normal 5 year reconsideration period). States will move forward with area designations based on the 2008 75 ppb standard using 2008-2010 quality assured monitoring data. Our service territory will be designated as attainment, meaning it will be in compliance with the standard. In the interim, the 1997 ozone NAAQS will remain in effect.
PM NAAQS:
Particulate matter (PM) is the term for particles found in the air which comes from a variety of sources. On January 15, 2013, the EPA finalized the PM 2.5 primary annual standard at 12 ug/m
3
(micrograms per cubic meter of air). States are required to meet the primary standard in 2020. The standard should have no impact on our existing generating fleet because the PM 2.5
ambient monitor results are below the required level. However, the proposed standards could impact future major modifications/construction projects that require a Prevention of Significant Deterioration (PSD) permit.
Mercury Air Toxics Standard (MATS)
In 2005, the EPA issued the Clean Air Mercury Rule (CAMR) under the CAA. It set limits on mercury emissions by power plants and created a market-based cap and trade system expected to reduce nationwide mercury emissions in two phases. New mercury emission limits for Phase 1 were to go into effect January 1, 2010. On February 8, 2008, the U.S. Court of Appeals for the District of Columbia vacated CAMR. This decision was appealed to the U.S. Supreme Court which denied the appeal on February 23, 2009.
The EPA issued Information Collection Requests (ICR) for determining the National Emission Standards for Hazardous Air Pollutants (NESHAP), including mercury, for coal and oil-fired electric steam generating units on December 24, 2009. The ICRs included our Iatan, Asbury and Riverton plants. All responses to the ICRs were submitted as required. The EPA ICRs were intended for use in developing regulations under Section 112(r) of the CAA maximum achievable emission standards for the control of the emission of hazardous air pollutants (HAPs), including mercury. The EPA proposed the national mercury and air toxics standards (MATS) in March 2011, which became effective April 16, 2012. MATS establishes numerical emission limits to reduce emissions of heavy metals, including mercury (Hg), arsenic, chromium, and nickel, and acid gases, including HCl and hydrogen fluoride (HF). For all existing and new coal-fired electric utility steam generating units (EGUs), the proposed

23
standard will be phased in over three years, and allows states the ability to give facilities a fourth year to comply. On March 28, 2013, the EPA finalized updates to certain emission limits for new power plants under the MATS. The new standards affect only new coal and oil-fired power plants that will be built in the future. The update does not change the final emission limits or other requirements for existing power plants.
The MATS regulation of HAPs in combination with CSAPR is the driving regulation behind our Compliance Plan and its implementation schedule. We expect compliance costs to be recoverable in our rates.
Greenhouse Gases
Our coal and gas plants, vehicles and other facilities, including EDG (our gas segment), emit CO2 and/or other Greenhouse Gases (GHGs) which are measured in Carbon Dioxide Equivalents (CO2e).
On September 22, 2009, the EPA issued the final Mandatory Reporting of Greenhouse Gases Rule under the CAA which requires power generating and certain other facilities that equal or exceed an emission threshold of 25,000 metric tons of CO2e to report GHGs to the EPA annually commencing in September 2011. EDE and EDG’s GHG emissions for 2011 and 2012 have been reported as required to the EPA.
On December 7, 2009, responding to a 2007 U.S. Supreme Court decision that determined that GHGs constitute “air pollutants” under the CAA, the EPA issued its final finding that GHGs threaten both the public health and the public welfare. This “endangerment” finding did not itself trigger any EPA regulations, but was a necessary predicate for the EPA to proceed with regulations to control GHGs. Since that time, a series of rules including the Prevention of Significant Deterioration and Title V Greenhouse Gas Tailoring Rule (Tailoring Rule) have been issued by the EPA. Several parties have filed petitions with the EPA and lawsuits have been filed challenging these rules. On June 26, 2012, the D.C. Circuit Court issued its opinion in the principal litigation of the EPA GHG rules (Endangerment, the Tailoring Rule, GHG emission standards for light-duty vehicles, and the EPA's rule on reconsideration of the PSD Interpretive Memorandum). The three-judge panel upheld the EPA’s interpretation of the Clean Air Act provisions as unambiguously correct. This opinion solidifies the EPA’s position that the CAA requires PSD and Title V permits for major emitters of greenhouse gases, such as Empire. Our ongoing projects are currently being evaluated for the projected increase or decrease of CO2e emissions as required by the Tailoring Rule.
As the result of an agreement to settle litigation pending in the U.S. Court of Appeals, on March 27, 2012, the EPA proposed a Carbon Pollution Standard for new power plants. This action is designed to limit the amount of carbon emitted by electric utility generating units. The New Source Performance Standard would require all new power plants to meet a CO2 emissions limit of 1,000 pounds per megawatt hour. This is equal to a coal-fired power plant capturing 50% or more of its emissions. The rule does offer some flexibility but would still require an average of 1,000 pounds per megawatt hour over a 30-year period. It is expected that most new natural gas-fired combined cycle units will meet the new standard. The proposed rule would apply only to new fossil-fuel-fired electric utility generating units. The proposal would not apply to existing units including modifications such as those required to meet other air pollution standards which are currently being undertaken at our Asbury facility.
In a June 25, 2013 memorandum to the EPA Administrator, President Obama directed the EPA to issue new proposed Carbon Pollution Standards for Future Power Plants by September 20, 2013 in light of the more than 2 million comments received on its initial proposed regulation. We will determine the impact, if any, on the Riverton Unit 12 conversion after the proposed rule is released. At this time, we do not expect the Riverton 12 combined cycle permit to be affected. Further, President Obama’s memorandum to the EPA Administrator requested the EPA issue proposed carbon pollution standards, regulations, or guidelines for modified, reconstructed, and existing power plants by no later than June 1, 2014; issue final standards, regulations, or guidelines, for modified, reconstructed, and existing power plants by no later than June 1, 2015; and include in the guidelines addressing existing power plants a requirement that states submit to the EPA implementation plans by no later than June 30, 2016.
24
In addition, a variety of proposals have been and are likely to continue to be considered by Congress to reduce GHGs. Proposals are also being considered in the House and Senate that would delay, limit or eliminate the EPA’s authority to regulate GHGs. At this time, it is not possible to predict what legislation, if any, will ultimately emerge from Congress regarding control of GHGs.
Certain states have taken steps to develop cap and trade programs and/or other regulatory systems which may be more stringent than federal requirements. For example, Kansas is a participating member of the Midwestern Greenhouse Gas Reduction Accord (MGGRA), one purpose of which is to develop a market-based cap and trade mechanism to reduce GHG emissions. The MGGRA has announced, however, that it will not issue a CO2e regulatory system pending federal legislative developments. Missouri is not a participant in the MGGRA.
The ultimate cost of any GHG regulations cannot be determined at this time. However, we expect the cost of complying with any such regulations to be recoverable in our rates.
Water Discharges
We operate under the Kansas and Missouri Water Pollution Plans that were implemented in response to the Federal Clean Water Act (CWA). Our plants are in material compliance with applicable regulations and have received necessary discharge permits.
The Riverton Units 7 and 8 and Iatan Unit 1, which utilize once-through cooling water, were affected by regulations for Cooling Water Intake Structures issued by the EPA under the CWA Section 316(b) Phase II. The regulations became final on February 16, 2004. In accordance with these regulations, we submitted sampling and summary reports to the Kansas Department of Health and Environment (KDHE) which indicate that the effect of the cooling water intake structure on Empire Lake’s aquatic life is insignificant. KCP&L, who operates Iatan Unit 1, submitted the appropriate sampling and summary reports to the Missouri Department of Natural Resources (MDNR).
In 2007 the United States Court of Appeals for the Second Circuit remanded key sections of these CWA regulations to the EPA. As a result, the EPA suspended the regulations and revised and signed a pre-publication proposed regulation on March 28, 2011. The EPA has secured an additional year to finalize the standards for cooling water intake structures under a modified settlement agreement. Following a recent court approved delay, the EPA is now obligated to finalize the rule by November 4, 2013. We will not know the full impact of these rules until they are finalized. If adopted in their present form, we expect regulations of Cooling Water Intake Structures issued by the EPA under the CWA Section 316(b) to have a limited impact at Riverton. The retirement of units 7 and 8 is scheduled in 2016. A new intake structure design and cooling tower will be constructed as part of the Unit 12 conversion at Riverton. Impacts at Iatan 1 could range from flow velocity reductions or traveling screen modifications for fish handling to installation of a closed cycle cooling tower retrofit. Our new Iatan Unit 2 and Plum Point Unit 1 are covered by the proposed regulation but were constructed with cooling towers, the proposed Best Technology Available. We expect them to be unaffected or minimally impacted by the final rule.
Surface Impoundments
We own and maintain coal ash impoundments located at our Riverton and Asbury Power Plants. Additionally, we own a 12% interest in a coal ash impoundment at the Iatan Generating Station and a 7.52% interest in a coal ash impoundment at Plum Point. On April 19, 2013, the EPA signed a notice of proposed rulemaking to revise its wastewater effluent limitation guidelines and standards under the CWA for coal-fired power plants. The proposal calls for updates to operating permits beginning in July 2017. Once the new guidelines are issued, the EPA and states would incorporate the new standards into wastewater discharge permits, including permits for coal ash impoundments. We do not have sufficient information at this time to estimate additional costs that might result from any new standards. All of our coal ash impoundments are compliant with existing state and federal regulations.
On June 21, 2010, the EPA proposed a new regulation pursuant to the Federal Resource Conservation and Recovery Act (RCRA) governing the management and storage of Coal Combustion

25
Residuals (CCR). In the proposal, the EPA presents two options: (1) regulation of CCR under RCRA subtitle C as a hazardous waste and (2) regulation of CCR under RCRA subtitle D as a non-hazardous waste. The public comment period closed in November 2010. It is anticipated that the final regulation will be published in 2014. We expect compliance with either option as proposed to result in the need to construct a new landfill and the conversion of existing ash handling from a wet to a dry system(s) at a potential cost of up to $15 million at our Asbury and Riverton Power Plants. This preliminary estimate will likely change based on the final CCR rule and its requirements. We expect resulting costs to be recoverable in our rates.
On September 23, 2010 and on November 4, 2010 EPA consultants conducted on-site inspections of our Riverton and Asbury coal ash impoundments, respectively. The consultants performed a visual inspection of the impoundments to assess the structural integrity of the berms surrounding the impoundments, requested documentation related to construction of the impoundments, and reviewed recently completed engineering evaluations of the impoundments and their structural integrity. In response to the inspection comments, the recommended geotechnical studies have been completed and new flow monitoring devices and settlement monuments at both coal ash impoundments have been installed. As a result of the transition from coal to natural gas, initial planning for the closure of the Riverton impoundment is in progress in coordination with the KDHE Bureau of Waste Management. We expect to close it in 2014. The final design for additional recommendations that will improve safety for slope stability at the Asbury impoundment is under review. We have received preliminary approval by the MDNR for the site permitting of a new utility waste landfill adjacent to the Asbury plant. Additionally, the work plan for the detailed site investigation (DSI) to include geologic and hydrologic investigations has been approved by the MDNR Division of Geology and Land Survey. Construction of the new landfill is expected in 2016.
Renewable Energy
As previously discussed, we have purchased power agreements with Cloud County Windfarm, LLC, located in Cloud County, Kansas and Elk River Windfarm, LLC, located in Butler County, Kansas. We do not own any portion of either windfarm. More than 15% of the energy we put into the grid comes from these long-term Purchased Power Agreements (PPAs). Through these PPAs, we generate about 900,000 renewable energy certificates (RECs) each year. A REC represents one megawatt-hour of renewable energy that has been delivered into the bulk power grid and “unbundles” the renewable attributes from the associated energy. This unbundling is important because it cannot be determined where the renewable energy is ultimately delivered once it enters the bulk power grid. As a result, RECs provide an avenue for renewable energy tracking and compliance purposes. Missouri regulations currently require us and other investor-owned utilities in Missouri to generate or purchase electricity from renewable energy sources, such as solar, wind, biomass and hydro power, or purchase RECs, at the rate of at least 2% of retail sales in 2012, increasing to at least 15% by 2021. We are currently in compliance with this regulatory requirement. The regulations require that 2% of the renewable energy source must be solar; however, we believe we are exempted from the solar requirement. A challenge to our exemption, brought by two of our customers and Power Source Solar, Inc., was dismissed on May 31, 2011 by the Missouri Western District Court of Appeals. The plaintiffs filed in the Missouri Supreme Court for transfer of the case from the Missouri Western District to the Missouri Supreme Court. The transfer was denied. On January 30, 2013, a complaint was filed with the MPSC by Renew Missouri and others regarding several points of our 2011 RES Compliance Report and the 2012-2014 Compliance Plan. The complaint is currently under consideration by the MPSC. Renewable energy standard compliance rules were published by the MPSC on July 7, 2010. Missouri investor-owned utilities and others initiated litigation to challenge these rules. On June 30, 2011, a Cole County Circuit Court judge ruled that portions of the MPSC rules were unlawful and unreasonable, in conflict with Missouri statute and in violation of the Missouri Constitution. Subsequent to that decision, a portion of the appeal was dropped and the entire order was stayed. On December 27, 2011 the judge issued another order identical to the one that was stayed except that the rulings with regard to the constitutionality issue had been omitted. The MPSC appealed this decision and in November of 2012 the court dismissed lawsuits brought against the RES and affirmed

26
the MPSC rules that were finalized in July 2010. Kansas established a renewable portfolio standard (RPS), effective November 19, 2010. It requires 10% of our Kansas retail customer peak capacity requirements to be sourced from renewables in 2012, increasing to 15% by 2016, and 20% by 2020. In addition, there are several proposals currently before the U.S. Congress to adopt a nationwide RPS. We have been selling the majority of our RECs and plan to continue to sell all or a portion of them in the future. As a result of these REC sales, we cannot claim the underlying energy is renewable. Once a REC has been claimed or retired, it cannot be used for any other purpose. At the end of 2012, sufficient RECs, including hydro, were retired to comply with the Missouri and Kansas requirements through the end of November 2012. Additional RECs were retired in January of 2013 to complete the process for 2012. In the future, we will continue to retain a sufficient amount of RECs to meet any current or future requirements.
Gas Segment
The acquisition of Missouri Gas in June 2006 involved the property transfer of two former manufactured gas plant (FMGP) sites owned by predecessors. Site #1 in Chillicothe, Missouri is listed in the MDNR Registry of Confirmed Abandoned or Uncontrolled Hazardous Waste Disposal Sites in Missouri. No remediation of this site is expected to be required in the near term. We have received a letter stating no further action is required from the MDNR with respect to Site #2 in Marshall, Missouri. We have incurred $0.2 million in remediation costs and estimate further remediation costs at these two FMGP sites to be minimal.
Note 8 – Retirement Benefits
Net periodic benefit cost, some of which is capitalized as a component of labor cost and some of which is deferred as a regulatory asset, is comprised of the following components and is shown for our noncontributory defined benefit pension plan, our supplemental retirement program (SERP) and other postretirement benefits (OPEB) (in thousands):
Three months ended June 30, Pension Benefits SERP OPEB 2013 2012 2013 2012 2013 2012 Service cost $ 1,859 $ 1,628 $ 52 $ 7 $ 715 $ 565 Interest cost 2,523 2,551 94 56 922 1,032 Expected return on plan assets (3,089) (3,076) - - (1,077) (1,041) Amortization of prior service cost
(1) 133 133 (2) (2) (253) (253)
Amortization of net actuarial loss (1) 2,632 1,950 180 76 481 468
Net periodic benefit cost $ 4,058 $ 3,186 $ 324 $ 137 $ 788 $ 771
Six months ended June 30, Pension Benefits SERP OPEB 2013 2012 2013 2012 2013 2012 Service cost $ 3,727 $ 3,256 $ 67 $ 15 $ 1,470 $ 1,129 Interest cost 5,031 5,102 157 111 1,913 2,065 Expected return on plan assets (6,214) (6,151) - - (2,176) (2,083)
Amortization of prior service cost (1) 266 266 (4) (4) (505) (505)
Amortization of net actuarial loss (1) 5,223 3,899 284 153 1,131 935
Net periodic benefit cost $ 8,033 $ 6,372 $ 504 $ 275 $ 1,833 $ 1,541
Twelve months ended June 30, Pension Benefits SERP OPEB 2013 2012 2013 2012 2013 2012 Service cost $ 6,732 $ 6,054 $ 104 $ 62 $ 2,742 $ 2,262 Interest cost 10,187 10,305 308 203 3,885 4,257 Expected return on plan assets (12,372) (11,721) - - (4,229) (4,161) Amortization of prior service cost
(1) 531 532 (8) (8) (1,011) (1,011)
Amortization of net actuarial loss (1) 9,259 6,647 520 238 1,858 1,816
Net periodic benefit cost $ 14,337 $ 11,817 $ 924 $ 495 $ 3,245 $ 3,163
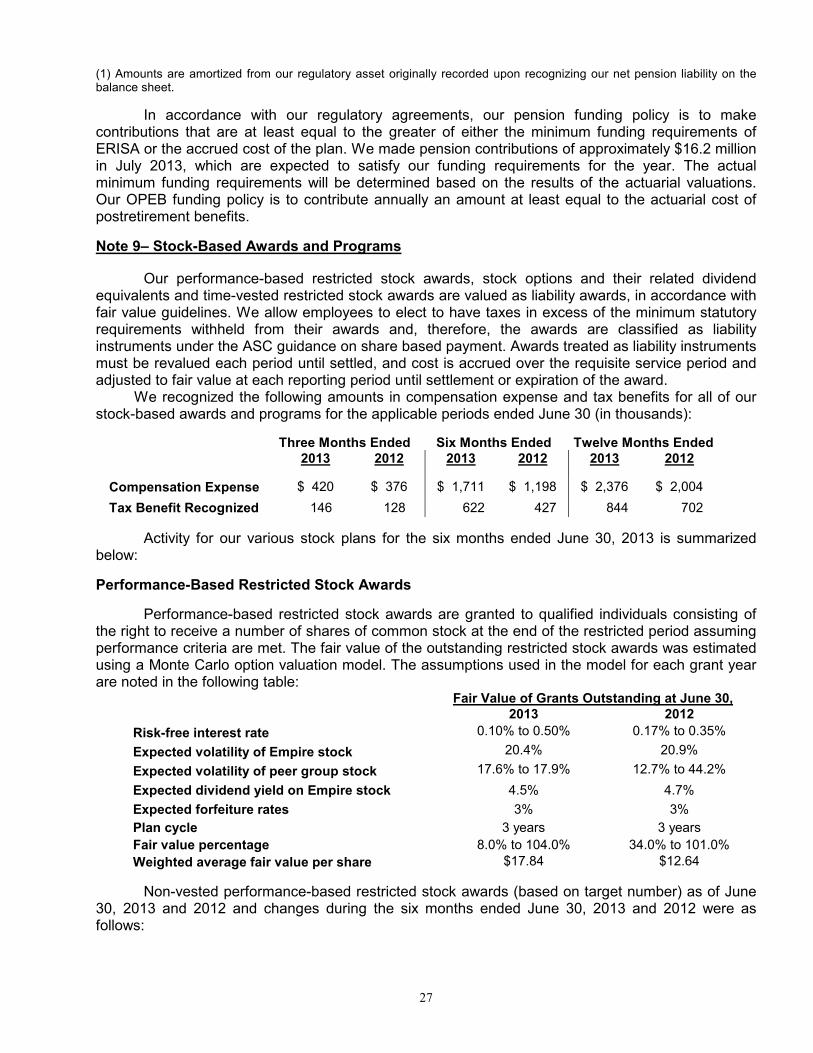
27
(1) Amounts are amortized from our regulatory asset originally recorded upon recognizing our net pension liability on the balance sheet.
In accordance with our regulatory agreements, our pension funding policy is to make contributions that are at least equal to the greater of either the minimum funding requirements of ERISA or the accrued cost of the plan. We made pension contributions of approximately $16.2 million in July 2013, which are expected to satisfy our funding requirements for the year. The actual minimum funding requirements will be determined based on the results of the actuarial valuations. Our OPEB funding policy is to contribute annually an amount at least equal to the actuarial cost of postretirement benefits.
Note 9– Stock-Based Awards and Programs
Our performance-based restricted stock awards, stock options and their related dividend equivalents and time-vested restricted stock awards are valued as liability awards, in accordance with fair value guidelines. We allow employees to elect to have taxes in excess of the minimum statutory requirements withheld from their awards and, therefore, the awards are classified as liability instruments under the ASC guidance on share based payment. Awards treated as liability instruments must be revalued each period until settled, and cost is accrued over the requisite service period and adjusted to fair value at each reporting period until settlement or expiration of the award.
We recognized the following amounts in compensation expense and tax benefits for all of our stock-based awards and programs for the applicable periods ended June 30 (in thousands):
Three Months Ended Six Months Ended Twelve Months Ended 2013 2012 2013 2012 2013 2012
Compensation Expense $ 420 $ 376 $ 1,711 $ 1,198 $ 2,376 $ 2,004
Tax Benefit Recognized 146 128 622 427 844 702
Activity for our various stock plans for the six months ended June 30, 2013 is summarized below:
Performance-Based Restricted Stock Awards
Performance-based restricted stock awards are granted to qualified individuals consisting of the right to receive a number of shares of common stock at the end of the restricted period assuming performance criteria are met. The fair value of the outstanding restricted stock awards was estimated using a Monte Carlo option valuation model. The assumptions used in the model for each grant year are noted in the following table: Fair Value of Grants Outstanding at June 30,
2013 2012
Risk-free interest rate 0.10% to 0.50% 0.17% to 0.35%
Expected volatility of Empire stock 20.4% 20.9%
Expected volatility of peer group stock 17.6% to 17.9% 12.7% to 44.2%
Expected dividend yield on Empire stock 4.5% 4.7%
Expected forfeiture rates 3% 3%
Plan cycle 3 years 3 years
Fair value percentage 8.0% to 104.0% 34.0% to 101.0%
Weighted average fair value per share $17.84 $12.64
Non-vested performance-based restricted stock awards (based on target number) as of June 30, 2013 and 2012 and changes during the six months ended June 30, 2013 and 2012 were as follows:

28
2013 2012 Number Weighted Average Number Weighted Average
of shares Grant Date Price of shares Grant Date Price
Outstanding at January 1, 33,900 $20.25 37,400 $19.28 Granted 26,300 $21.36 10,000 $20.97 Awarded (4,460) $18.36 (7,823) $18.12 Not Awarded (8,540) $18.36 (5,677) $18.12 Nonvested at June 30, 47,200 $21.39 33,900 $20.25
At June 30, 2013, there was $0.6 million of total unrecognized compensation cost related to estimated outstanding awards. This cost will be recognized over the outstanding years remaining in the vesting period.
Time-Vested Restricted Stock Awards
Beginning in 2011, we began granting, to qualified individuals, time-vested restricted stock awards that vest after a three-year period, in lieu of stock options. No dividend rights accumulate during the vesting period. Time-vested restricted stock is valued at an amount equal to the fair market value of our common stock on the date of grant. If employment terminates during the vesting period because of death, retirement, or disability, the participant is entitled to a pro-rata portion of the time-vested restricted stock awards such participant would otherwise have earned, which is distributed six months following the date of termination, with the remainder of the award forfeited. If employment is terminated during the vesting period for reasons other than those listed above, the time-vested restricted stock awards will be forfeited on the date of the termination, unless the Board of Directors Compensation Committee determines, in its sole discretion, that the participant is entitled to a pro-rata portion of the award.
The fair value measurements for each grant year are noted in the following table:
Fair Value of Grants Outstanding at June 30 2013 2012 Total unrecognized compensation cost (in millions) $ 0.2 less than $0.1
Recognition period 0.4 years to 2.6 years 1.6 years
Fair value $ 19.55 $ 18.38
No shares of time-vested restricted stock were granted in 2012 as a result of the limitation on
incentive compensation in place in 2011. A summary of time vested restricted stock activity under the plan for 2012 and 2013 is presented in the table below:
June 30, 2013 June 30, 2012 Weighted Weighted Average Fair Average Fair Number of shares Market Value Number of shares Market Value Outstanding at January 1, 3,300 $ 20.38 3,433 $ 21.84 Granted 21,600 21.36 - - Vested - - - - Distributed - - (133) $ 20.13
Forfeited - - - - Vested but not distributed - - - - Outstanding at end of period 24,900 $ 22.31 3,300 $ 20.35
All time-vested restricted stock awards are classified as liability instruments, which must be revalued each period until settled. The cost of the awards is generally recognized over the requisite (explicit) service period.
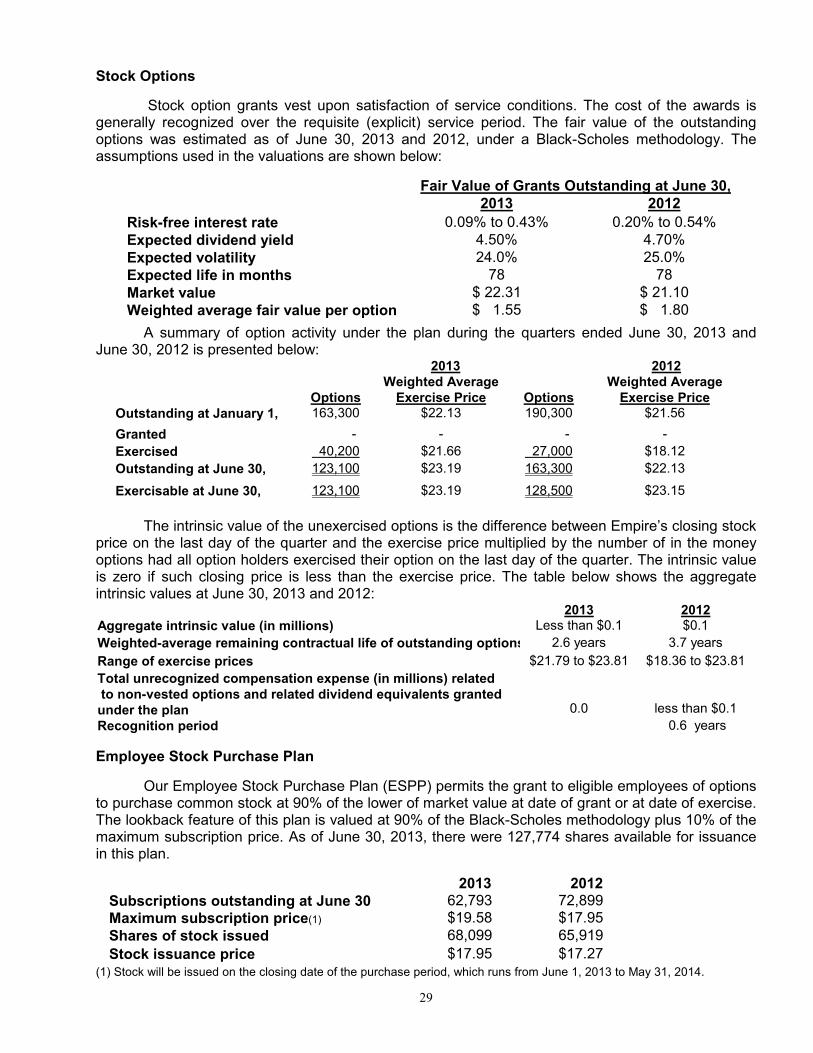
29
Stock Options
Stock option grants vest upon satisfaction of service conditions. The cost of the awards is generally recognized over the requisite (explicit) service period. The fair value of the outstanding options was estimated as of June 30, 2013 and 2012, under a Black-Scholes methodology. The assumptions used in the valuations are shown below:
Fair Value of Grants Outstanding at June 30, 2013 2012
Risk-free interest rate 0.09% to 0.43% 0.20% to 0.54% Expected dividend yield 4.50% 4.70% Expected volatility 24.0% 25.0% Expected life in months 78 78 Market value $ 22.31 $ 21.10 Weighted average fair value per option $ 1.55 $ 1.80
A summary of option activity under the plan during the quarters ended June 30, 2013 and June 30, 2012 is presented below: 2013 2012
Weighted Average Weighted Average
Options Exercise Price Options Exercise Price Outstanding at January 1, 163,300 $22.13 190,300 $21.56
Granted - - - -
Exercised 40,200 $21.66 27,000 $18.12
Outstanding at June 30, 123,100 $23.19 163,300 $22.13
Exercisable at June 30, 123,100 $23.19 128,500 $23.15
The intrinsic value of the unexercised options is the difference between Empire’s closing stock price on the last day of the quarter and the exercise price multiplied by the number of in the money options had all option holders exercised their option on the last day of the quarter. The intrinsic value is zero if such closing price is less than the exercise price. The table below shows the aggregate intrinsic values at June 30, 2013 and 2012: 2013 2012 Aggregate intrinsic value (in millions) Less than $0.1 $0.1
Weighted-average remaining contractual life of outstanding options 2.6 years 3.7 years
Range of exercise prices $21.79 to $23.81 $18.36 to $23.81
Total unrecognized compensation expense (in millions) related to non-vested options and related dividend equivalents granted under the plan
0.0
less than $0.1
Recognition period 0.6 years
Employee Stock Purchase Plan
Our Employee Stock Purchase Plan (ESPP) permits the grant to eligible employees of options to purchase common stock at 90% of the lower of market value at date of grant or at date of exercise. The lookback feature of this plan is valued at 90% of the Black-Scholes methodology plus 10% of the maximum subscription price. As of June 30, 2013, there were 127,774 shares available for issuance in this plan.
2013 2012 Subscriptions outstanding at June 30 62,793 72,899 Maximum subscription price(1) $19.58 $17.95 Shares of stock issued 68,099 65,919
Stock issuance price $17.95 $17.27 (1) Stock will be issued on the closing date of the purchase period, which runs from June 1, 2013 to May 31, 2014.

30
Assumptions for valuation of these shares are shown in the table below.
Note 10- Regulated Operating Expenses
The following table sets forth the major components comprising “regulated operating expenses” under “Operating Revenue Deductions” on our consolidated statements of income (in thousands) for all periods presented ended June 30:
Three Months Ended
Three Months Ended
Six Months Ended
Six Months Ended
Twelve Months Ended
Twelve Months Ended
2013 2012 2013 2012 2013 2012 Electric transmission and distribution expense $ 5,950 $ 4,264 $ 10,979 $ 8,372 $ 19,690 $ 16,493 Natural gas transmission and distribution expense 577 664 1,122 1,316 2,250 2,561 Power operation expense (other than fuel) 4,515 3,604 8,307 7,399 16,545 15,529 Customer accounts and assistance expense 2,619 2,584 5,198 5,018 10,391 10,297 Employee pension expense (1) 2,757 2,539 5,399 5,074 10,505 10,060 Employee healthcare plan (1) 2,408 2,324 5,195 4,562 10,458 8,664 General office supplies and expense 3,163 2,523 6,592 5,275 12,093 10,298 Administrative and general expense 3,603 3,573 7,918 7,792 15,217 15,384 Allowance for uncollectible accounts 1,044 753 1,790 1,345 3,483 3,446 Regulatory reversal of gain on sale of assets - - 1,236 - 1,236 - Miscellaneous expense 11 16 48 39 95 102 Total $ 26,647 $ 22,844 $ 53,784 $ 46,192 $101,963 $ 92,834
(1) Does not include capitalized portion of costs, but reflects the GAAP expensed cost plus or minus costs deferred to and amortized from a regulatory asset and/or a regulatory liability for Missouri, Kansas and Oklahoma jurisdictions.
Note 11– Segment Information
We operate our business as three segments: electric, gas and other. As part of our electric segment, we also provide water service to three towns in Missouri. The other segment consists of our fiber optics business. The tables below present statement of income information, balance sheet information and capital expenditures of our business segments.
For the quarter ended June 30, 2013
Electric Gas Other Eliminations Total ($-000’s)
Statement of Income Information
Revenues $ 127,026 $ 7,777 $ 1,991 $ (148) $ 136,646
Depreciation and amortization 16,205 927 503 - 17,635
Federal and state income taxes 6,948 (129) 230 - 7,049
Operating income 19,994 744 372 - 21,110
Interest income 3 34 2 (29) 10
Interest expense 9,557 976 - (29) 10,504
Income from AFUDC (debt and equity) 1,331 8 - - 1,339
Net income 11,498 (214) 374 - 11,658
Capital Expenditures $ 36,535 $ 1,463 $ 502 $ 38,500
2013 2012 Weighted average fair value of grants at June 30 $ 2.78 $ 3.19 Risk-free interest rate 0.14% 0.17% Expected dividend yield 4.60% 5.00% Expected volatility 14.00% 24.00% Expected life in months 12 12 Grant Date 6/1/13 6/1/12

31
For the quarter ended June 30, 2012
Electric Gas Other Eliminations Total
($-000’s)
Statement of Income Information
Revenues $ 124,091 $ 5,804 $ 1,885 $ (148) $ 131,632
Depreciation and amortization 13,759 861 448 - 15,068
Federal and state income taxes 6,745 (238) 253 - 6,760
Operating income 19,834 534 394 - 20,762
Interest income 118 95 1 (91) 123
Interest expense 9,174 976 - (91) 10,059
Income from AFUDC (debt and equity) 170 1 - - 171
Net income 10,691 (394) 411 - 10,708
Capital Expenditures $ 33,745 $ 844 $ 594 $ 35,183
For the six months ended June 30, 2013
Electric Gas Other Eliminations Total ($-000’s)
Statement of Income Information
Revenues $ 255,788 $ 28,270 $ 4,024 $ (296) $ 287,786
Depreciation and amortization 30,887 1,851 998 - 33,736
Federal and state income taxes 12,943 1,076 512 - 14,531
Operating income 38,509 3,639 820 - 42,968
Interest income 497 105 7 (92) 517
Interest expense 18,893 1,953 - (92) 20,754
Income from AFUDC (debt and equity) 2,161 9 - - 2,170
Net income 21,721 1,735 831 - 24,287
Capital Expenditures
$ 73,070 $ 2,196 $ 942 $ 76,208
For the six months ended June 30, 2012
Electric Gas Other Eliminations Total ($-000’s)
Statement of Income Information
Revenues $ 243,817 $ 21,487 $ 3,768 $ (296) $ 268,776
Depreciation and amortization 27,329 1,780 894 - 30,003
Federal and state income taxes 11,932 459 568 - 12,959
Operating income 38,078 2,588 907 - 41,573
Interest income 288 166 1 (153) 302
Interest expense 19,202 1,953 - (153) 21,002
Income from AFUDC (debt and equity) 268 2 - - 270
Net income 18,864 725 923 - 20,512
Capital Expenditures
$ 66,863 $ 1,569 $ 1,538 $ 69,970

32
For the twelve months ended June 30, 2013
Electric Gas Other Eliminations Total ($-000’s)
Statement of Income Information
Revenues $ 522,624 $ 46,632 $ 7,443 $ (592) $ 576,107
Depreciation and amortization 58,869 3,669 1,642 - 64,180
Federal and state income taxes 33,277 1,406 1,047 - 35,730
Operating income 89,876 6,055 1,684 - 97,615
Interest income 1,155 262 13 (243) 1,187
Interest expense 37,558 3,905 - (243) 41,220
Income from AFUDC (debt and equity) 3,811 18 - - 3,829
Net income 55,487 2,267 1,702 - 59,456
Capital Expenditures
$ 149,619 $ 4,198 $ 2,003 $ 155,820
For the twelve months ended June 30, 2012
Electric Gas Other Eliminations Total ($-000’s)
Statement of Income Information
Revenues $ 519,403 $ 39,625 $ 7,389 $ (592) $ 565,825
Depreciation and amortization 53,956 3,530 1,832 - 59,318
Federal and state income taxes 32,602 766 1,065 - 34,433
Operating income 90,596 4,980 1,949 - 97,525
Interest income 805 296 1 (283) 819
Interest expense 39,243 3,909 4 (283) 42,873
Income from AFUDC (debt and equity) 626 4 - - 630
Net Income 51,441 1,215 1,731 - 54,387
Capital Expenditures
$ 110,478 $ 4,657 $ 3,646 $ 118,781
As of June 30, 2013
($-000’s) Electric Gas
(1) Other Elimination
s Total
Balance Sheet Information
Total assets $ 2,082,513 $ 150,733 $ 29,494 $ (94,103) $ 2,168,637
(1) Includes goodwill of $39,492.
As of December 31, 2012
($-000’s) Electric Gas(1) Other Elimination
s Total
Balance Sheet Information
Total assets $ 2,034,399 $ 148,814 $ 28,871 $ (85,715) $ 2,126,369
(1) Includes goodwill of $39,492.

33
Note 12– Income Taxes
The following table shows the changes in our provision for income taxes (in millions) and our consolidated effective federal and state income tax rates for the applicable periods ended June 30,:
Three Months Ended Six-Months Ended Twelve Months Ended 2013 2012 2013 2012 2013 2012 Consolidated provision for income taxes $ 7.0 $ 6.8 $ 14.5 $ 13.0 $ 35.7 $ 34.4 Consolidated effective federal and state income tax rates
37.7%
38.7%
37.4%
38.7%
37.5%
38.8%
The effective income tax rate for the three, six and twelve month periods ended June 30, 2013 is lower than comparable periods in 2012 primarily due to higher equity AFUDC income in 2013 compared with 2012. We do not have any unrecognized tax benefits as of June 30, 2013. We did not recognize any significant interest or penalties in any of the periods presented. We do not expect any significant changes to our unrecognized tax benefits over the next twelve months. Item 2. Management's Discussion and Analysis of Financial Condition and Results of
Operations
EXECUTIVE SUMMARY
We operate our businesses as three segments: electric, gas and other. The Empire District Electric Company (EDE) is an operating public utility engaged in the generation, purchase, transmission, distribution and sale of electricity in parts of Missouri, Kansas, Oklahoma and Arkansas, including the sale of wholesale energy to four towns in Missouri and Kansas. As part of our electric segment, we also provide water service to three towns in Missouri. The Empire District Gas Company (EDG) is our wholly owned subsidiary which provides natural gas distribution to customers in 48 communities in northwest, north central and west central Missouri. Our other segment consists of our fiber optics business. During the twelve months ended June 30, 2013, our gross operating revenues were derived as follows:
Electric segment sales* 90.7% Gas segment sales 8.1 Other segment sales 1.2
*Sales from our electric segment include 0.3% from the sale of water.
Earnings
The following table represents our basic and diluted earnings per weighted average share of common stock for the applicable periods ended June 30 (in dollars):
Three Months Ended Six Months Ended Twelve Months Ended 2013 2012 2013 2012 2013 2012 Basic and diluted earnings per weighted average share of common stock
$ 0.27
$ 0.25
$ 0.57
$ 0.49
$ 1.40
$ 1.29
Increased electric and gas gross margins positively impacted net income for all three periods presented as of June 30, 2013. We define electric gross margins as electric revenues less fuel and purchased power costs. We define gas gross margins as gas operating revenues less cost of gas in rates. Increased electric customer rates resulting from our recently settled Missouri rate case (see “Recent Activities - Regulatory Matters” below) drove increases in revenue and electric gross margin during the quarter ended June 30, 2013. Average customer counts increased quarter over quarter,
34
but were tempered slightly by an increase in seasonal disconnect activity compared to the 2012 quarter. The increases in revenue and electric gross margin were partially offset by weather that was slightly more temperate than normal. June 2013 was considerably cooler than the very hot June 2012, resulting in a delay in the transition from heating to cooling season. Increases in regulated operating expense and depreciation and amortization expense also negatively impacted quarter over quarter results. Increased revenues, due to the April 1, 2013 Missouri rate increase, and weather were positive drivers for the six months ended June 30, 2013. The first quarter of 2013 was considerably colder than the first quarter of 2012, when the warmest temperatures on record were recorded. Decreased maintenance and repairs expense and increased AFUDC also positively impacted net income for the six months ended June 30, 2013 Negative drivers for the six months ended June 30, 2013 as compared to the same period last year included increased regulated operating expense, increased depreciation and amortization expense and the regulatory write off of approximately $3.6 million (see “Recent Activities - Regulatory Matters” below). Revenue and electric gross margin during the twelve months ended June 30, 2013 were positively impacted by the increased Missouri customer electric rates discussed above, improving customer counts and a change in our unbilled revenue estimate in the third quarter of 2012. A return to more normal summer and winter weather during the 2013 period negatively impacted gross margin compared to the 2012 period. Increased regulated operating expense, increased depreciation and amortization expense and the previously mentioned regulatory write off also negatively impacted year over year results. Factors impacting gross margin and net income for the quarter, six months and twelve months ended June 30, 2013, are presented on a segment basis under “Results of Operations” below.
The table below sets forth a reconciliation of basic and diluted earnings per share between the three months, six months and twelve months ended June 30, 2012 and June 30, 2013, which is a non-GAAP presentation. The economic substance behind our non-GAAP earnings per share (EPS) measure is to present the after tax impact of significant items and components of the statement of income on a per share basis before the impact of additional stock issuances.
We believe this presentation is useful to investors because the statement of income does not readily show the EPS impact of the various components. This could limit the readers’ understanding of the reasons for the EPS change from the previous year’s EPS. This information is useful to management, and we believe this information is useful to investors, to better understand the reasons for the fluctuation in EPS between the prior and current years on a per share basis.
This reconciliation may not be comparable to other companies or more useful than the GAAP presentation included in the statement of income. We also note that this presentation does not purport to be an alternative to earnings per share determined in accordance with GAAP as a measure of operating performance or any other measure of financial performance presented in accordance with GAAP. Management compensates for the limitations of using non-GAAP financial measures by using them to supplement GAAP results to provide a more complete understanding of the factors and trends affecting the business than GAAP results alone. The dilutive effect of additional shares issued included in the table reflects the estimated impact of all shares issued during the periods ended June 30.
35
Three Months Ended
Six Months Ended
Twelve Months Ended
Earnings Per Share – 2012 $ 0.25 $ 0.49 $ 1.29 Revenues Electric segment $ 0.04 $ 0.17 $ 0.04 Gas segment 0.03 0.10 0.10 Other segment 0.00 0.00 0.00 Total Revenue 0.07 0.27 0.14 Electric fuel and purchased power 0.05 0.05 0.21 Cost of natural gas sold and transported (0.02) (0.07) (0.07) Margin 0.10 0.25 0.28 Operating – electric segment (0.06) (0.11) (0.14) Operating –gas segment 0.00 0.00 0.01 Operating –other segment 0.00 0.00 (0.01) Maintenance and repairs 0.01 0.01 0.02 Depreciation and amortization (0.04) (0.05) (0.07) Loss on plant disallowance 0.00 (0.03) (0.03) Other taxes (0.01) (0.02) (0.03) Interest charges (0.01) 0.00 0.02 AFUDC 0.02 0.03 0.05 Change in effective income tax rates 0.01 0.01 0.03 Dilutive effect of additional shares issued 0.00 (0.01) (0.02) Earnings Per Share – 2013 $ 0.27 $ 0.57 $ 1.40
Recent Activities
Regulatory Matters
On February 22, 2013, we filed a Nonunanimous Stipulation and Agreement (Agreement) with the Missouri Public Service Commission (MPSC) which issued an order approving the Agreement on February 27, 2013, effective March 6, 2013. The Agreement provided for an annual increase in base revenues for our Missouri electric customers in the amount of approximately $27.5 million, effective April 1, 2013, and the continuation of the current fuel adjustment mechanism. The Agreement also included an increase in depreciation rates, recovery of deferred tornado costs over the next ten years and the continuation of tracking mechanisms for expenses related to employee pension, retiree health care, vegetation management, and Iatan 2, Iatan Common and Plum Point operating and maintenance costs. In addition, the Agreement included a write-off of approximately $3.6 million, consisting of a $2.4 million disallowance for the prudency of certain construction expenditures for Iatan 2 and a $1.2 million regulatory reversal of a prior period gain on sale of our Asbury unit train, which is included in regulated operating expenses. We also agreed not to implement a Missouri general rate increase prior to October 1, 2014. As initially filed on July 6, 2012, we had requested an annual increase in base rates for our Missouri electric customers in the amount of $30.7 million, or 7.56%, the continuation of the fuel adjustment clause, new depreciation rates and the recovery of various expenses. On May 18, 2012, we filed a request with the Federal Energy Regulatory Commission (FERC) to implement a cost-based transmission formula rate (TFR) to be effective August 1, 2012. On July 31, 2012, the FERC suspended the TFR for five months and set the filing for hearing and settlement procedures. On June 13, 2013, we, the Kansas Corporation Commission and the cities of Monett, Mt. Vernon and Lockwood, Missouri and Chetopa, Kansas, filed a unanimous Settlement Agreement (Agreement) with the FERC. The Agreement includes a TFR that establishes an ROE of 10.0%. The Agreement calls for the TFR to be updated annually with the new updated TFR rates effective on July 1 of each year. FERC action on the Agreement is pending.
For additional information, see “Rate Matters” below.

36
Integrated Resource Plan
We filed our Integrated Resource Plan (IRP) with the MPSC on July 1, 2013. The IRP analysis of future loads and resources is normally conducted once every three years. Our IRP supports our Compliance Plan discussed in Note 7 of “Notes to Consolidated Financial Statements (Unaudited)”.
Financings
As described in Note 6, on October 30, 2012, we entered into a Bond Purchase Agreement for a private placement of $30.0 million of 3.73% First Mortgage Bonds due May 30, 2033 and $120.0 million of 4.32% First Mortgage Bonds due May 30, 2043. The delayed settlement of both series of bonds occurred on May 30, 2013. Interest is payable semi-annually on the bonds on each May 30 and November 30, commencing November 30, 2013.
A portion of the proceeds from the above sale of bonds was used to redeem all $98.0 million aggregate principal amount of our Senior Notes, 4.50% Series due June 15, 2013. The remaining proceeds will be used for general corporate purposes.
Union Contract
In May 2013, Local 1464 of the International Brotherhood of Electrical Workers (IBEW) ratified a four-year agreement with EDG, effective June 1, 2013. At December 31, 2012, 34 EDG employees were members of Local 1464 of the IBEW. RESULTS OF OPERATIONS
The following discussion analyzes significant changes in the results of operations for the three month, six month and twelve month periods ended June 30, 2013, compared to the same periods ended June 30, 2012.
The following table represents our results of operations by operating segment for the applicable periods ended June 30 (in millions):
Three Months Ended Six Months Ended Twelve Months Ended 2013 2012 2013 2012 2013 2012 Electric $ 11.5 $ 10.7 $ 21.7 $ 18.9 $ 55.5 $ 51.5 Gas (0.2) (0.4) 1.8 0.7 2.3 1.2 Other 0.4 0.4 0.8 0.9 1.7 1.7 Net income $ 11.7 $ 10.7 $ 24.3 $ 20.5 $ 59.5 $ 54.4
Electric Segment
Gross Margin
As shown in the table below, electric segment gross margin increased approximately $6.4 million during the second quarter of 2013 as compared to the second quarter of 2012, mainly due to increased revenues as a result of the Missouri rate increase that became effective April 1, 2013. The electric gross margin increased approximately $15.5 million for the six months ended June 30, 2013 as compared to the same period in 2012, mainly due to increased demand resulting from favorable weather in the first quarter of 2013 and increased revenues due to the Missouri rate increase. These factors likewise impacted the twelve months ended June 30, 2013 period. Electric gross margin increased approximately $17.4 million as compared to the same period in 2012. A change in our unbilled revenue estimate in the third quarter of 2012 and improved customer counts also favorably impacted the twelve month period over period results.
The table below represents our electric gross margins for the applicable periods ended June 30 (dollars in millions):
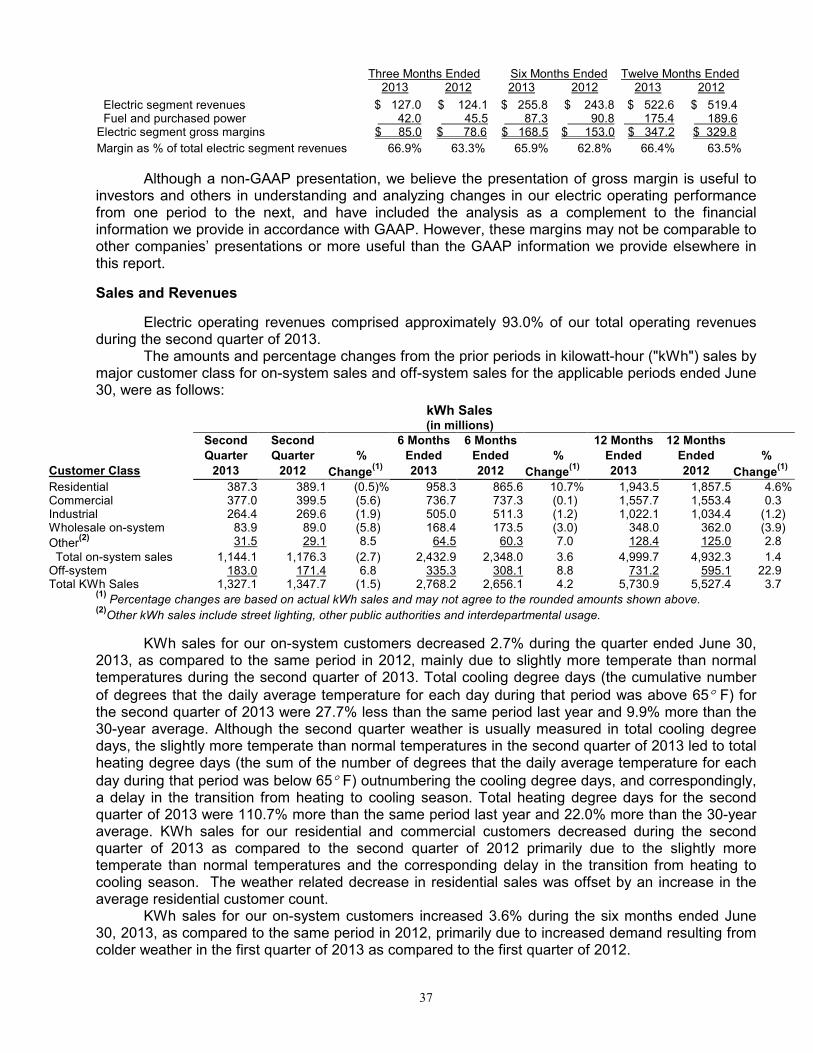
37
Three Months Ended Six Months Ended Twelve Months Ended
2013 2012 2013 2012 2013 2012
Electric segment revenues $ 127.0 $ 124.1 $ 255.8 $ 243.8 $ 522.6 $ 519.4 Fuel and purchased power 42.0 45.5 87.3 90.8 175.4 189.6 Electric segment gross margins $ 85.0 $ 78.6 $ 168.5 $ 153.0 $ 347.2 $ 329.8
Margin as % of total electric segment revenues 66.9% 63.3% 65.9% 62.8% 66.4% 63.5%
Although a non-GAAP presentation, we believe the presentation of gross margin is useful to investors and others in understanding and analyzing changes in our electric operating performance from one period to the next, and have included the analysis as a complement to the financial information we provide in accordance with GAAP. However, these margins may not be comparable to other companies’ presentations or more useful than the GAAP information we provide elsewhere in this report.
Sales and Revenues
Electric operating revenues comprised approximately 93.0% of our total operating revenues during the second quarter of 2013. The amounts and percentage changes from the prior periods in kilowatt-hour ("kWh") sales by major customer class for on-system sales and off-system sales for the applicable periods ended June 30, were as follows:
kWh Sales (in millions)
Second Second 6 Months 6 Months 12 Months 12 Months
Quarter Quarter % Ended Ended % Ended Ended %
Customer Class 2013 2012 Change(1) 2013 2012 Change
(1) 2013 2012 Change
(1)
Residential 387.3 389.1 (0.5)% 958.3 865.6 10.7% 1,943.5 1,857.5 4.6% Commercial 377.0 399.5 (5.6) 736.7 737.3 (0.1) 1,557.7 1,553.4 0.3 Industrial 264.4 269.6 (1.9) 505.0 511.3 (1.2) 1,022.1 1,034.4 (1.2) Wholesale on-system 83.9 89.0 (5.8) 168.4 173.5 (3.0) 348.0 362.0 (3.9)
Other(2) 31.5 29.1 8.5 64.5 60.3 7.0 128.4 125.0 2.8
Total on-system sales 1,144.1 1,176.3 (2.7) 2,432.9 2,348.0 3.6 4,999.7 4,932.3 1.4 Off-system 183.0 171.4 6.8 335.3 308.1 8.8 731.2 595.1 22.9 Total KWh Sales 1,327.1 1,347.7 (1.5) 2,768.2 2,656.1 4.2 5,730.9 5,527.4 3.7
(1) Percentage changes are based on actual kWh sales and may not agree to the rounded amounts shown above.
(2)Other kWh sales include street lighting, other public authorities and interdepartmental usage.
KWh sales for our on-system customers decreased 2.7% during the quarter ended June 30, 2013, as compared to the same period in 2012, mainly due to slightly more temperate than normal temperatures during the second quarter of 2013. Total cooling degree days (the cumulative number of degrees that the daily average temperature for each day during that period was above 65° F) for the second quarter of 2013 were 27.7% less than the same period last year and 9.9% more than the 30-year average. Although the second quarter weather is usually measured in total cooling degree days, the slightly more temperate than normal temperatures in the second quarter of 2013 led to total heating degree days (the sum of the number of degrees that the daily average temperature for each day during that period was below 65° F) outnumbering the cooling degree days, and correspondingly, a delay in the transition from heating to cooling season. Total heating degree days for the second quarter of 2013 were 110.7% more than the same period last year and 22.0% more than the 30-year average. KWh sales for our residential and commercial customers decreased during the second quarter of 2013 as compared to the second quarter of 2012 primarily due to the slightly more temperate than normal temperatures and the corresponding delay in the transition from heating to cooling season. The weather related decrease in residential sales was offset by an increase in the average residential customer count.
KWh sales for our on-system customers increased 3.6% during the six months ended June 30, 2013, as compared to the same period in 2012, primarily due to increased demand resulting from colder weather in the first quarter of 2013 as compared to the first quarter of 2012.

38
KWh sales for our on-system customers increased 1.4% during the twelve months ended June 30, 2013, as compared to the same period in 2012, mainly due to improved customer counts. Residential and commercial kWh sales increased primarily due to the improved customer count.
Industrial sales decreased 1.9%, 1.2% and 1.2% during the quarter, six month and twelve month periods ended June 30, 2013, respectively, due to reductions by several large industrial customers.
We are not modifying our near and longer-term growth estimates disclosed in our 2012 10-K, although, on a weather-normalized basis, kWh sales were relatively flat in the first six months of 2013. The amounts and percentage changes from the prior periods in electric segment operating revenues by major customer class for on-system and off-system sales for the applicable periods ended June 30, were as follows:
Electric Segment Operating Revenues ($ in millions)
3 Months 3 Months 6 Months 6 Months 12 Months 12 Months Ended Ended % Ended Ended % Ended Ended % Customer Class 2013 2012 Change
(1) 2013 2012 Change
(1) 2013 2012 Change
(1)
Residential $ 47.9 $ 47.3 1.4% $ 109.2 $ 101.5 7.6% $ 222.2 $ 217.7 2.1% Commercial 41.0 41.4 (0.9) 75.8 75.8 0.0 158.8 160.9 (1.3) Industrial 21.1 20.8 1.5 38.2 38.8 (1.5) 78.2 81.2 (3.8) Wholesale on-system 4.9 4.7 4.1 9.6 8.6 11.5 19.6 19.0 2.9
Other(2) 3.7 3.4 9.0 7.3 6.9 5.6 14.3 14.1 1.6
Total on-system revenues $ 118.6 $ 117.6 0.9 $ 240.1 $ 231.6 3.7 $ 493.1 $ 492.9 0.1 Off-system 4.3 3.6 19.0 8.0 6.8 16.7 16.8 16.1 4.3 Total revenues from kWh sales 122.9 121.2 1.5 248.1 238.4 4.0 509.9 509.0 0.2
Miscellaneous revenues(3) 3.6 2.5 43.1 6.7 4.6 48.2 10.7 8.6 24.0
Total electric operating revenues $ 126.5 $ 123.7 2.3 $ 254.8 $ 243.0 4.9 $ 520.6 $ 517.6 0.6 Water revenues 0.5 0.4 18.1 1.0 0.8 21.3 2.0 1.8 11.6 Total electric segment operating revenues $ 127.0 $ 124.1 2.4 $ 255.8 $ 243.8 4.9 $ 522.6 $ 519.4 0.6
(1) Percentage changes are based on actual revenues and may not agree to the rounded amounts shown above.
(2) Other operating revenues include street lighting, other public authorities and interdepartmental usage.
(3) Miscellaneous revenues include transmission service revenue, late payment fees, renewable energy credit sales, rent,
etc.
Revenues for our on-system customers increased $1.1 million during the second quarter of 2013 as compared to the second quarter of 2012. Rate changes from the April 2013 Missouri rate increase, increased revenues an estimated $7.8 million. Improved customer counts increased revenues an estimated $1.1 million. These revenue increases were partially offset by a $3.2 million decrease in fuel recovery revenue (and corresponding reduction in fuel expenses, resulting in no net effect on gross margin) from Missouri customers during the second quarter of 2013 compared to the prior year quarter. The impact of weather and other related factors decreased revenues an estimated $4.6 million. The cumulative effect of these revenue changes had a favorable impact on gross margin quarter over quarter. Revenues for our on-system customers increased $8.5 million for the six months ended June 30, 2013 as compared to the same period in 2012. Rate changes from the April 2013 Missouri rate increase, contributed an estimated $8.8 million to revenues. Weather and other related factors increased revenues an estimated $5.0 million during the six months ended June 30, 2013. Improved customer counts increased revenues an estimated $2.5 million. These revenue increases were partially offset by a $7.8 million decrease in fuel recovery revenue (and corresponding reduction in fuel expenses, resulting in no net effect on gross margin) from Missouri customers during the six months ended June 30, 2013 compared to the same period in 2012. The cumulative effect of the revenue changes mentioned above had a favorable impact on gross margin for the six months ended 2013 period. Revenues for our on-system customers increased $0.2 million for the twelve months ended June 30, 2013 as compared to the same period in 2012. Rate changes, primarily the April 2013

39
Missouri rate increase and the January 2012 Kansas rate increase, contributed an estimated $8.2 million to revenues. Improved customer counts increased revenues an estimated $7.4 million. Additionally, a change in our unbilled revenue estimate in the third quarter of 2012 added $3.4 million to revenues. These revenue increases were offset by a $13.7 million decrease in fuel recovery revenue (and corresponding reduction in fuel expenses, resulting in no net effect on gross margin) from Missouri customers during the twelve months ended June 30, 2013 compared to the same period in 2012. Weather and other related factors decreased revenues an estimated $5.1 million. The cumulative year over year revenue changes mentioned above impacted gross margin positively.
Off-System Electric Transactions.
In addition to sales to our own customers, we also sell power to other utilities as available, including through the Southwest Power Pool (SPP) Energy Imbalance Services (EIS) market. See “— Competition and Markets” below. The majority of our off-system sales margins are included as a component of the fuel adjustment clause in our Missouri, Kansas and Oklahoma jurisdictions and our transmission rider in our Arkansas jurisdiction and generally adjust the fuel and purchased power expense. As a result, nearly all of the off-system sales margin flows back to the customer and has little effect on margin or net income.
Miscellaneous Revenues
Our miscellaneous revenues increased approximately $1.1 million, $2.1 million and $2.1 million during the quarter, six month and twelve month periods ended June 30, 2013, respectively, primarily due to increased transmission revenues. These miscellaneous revenues are comprised mainly of transmission revenues, late payment fees and renewable energy credit sales.
Operating Revenue Deductions – Fuel and Purchased Power
The table below is a reconciliation of our actual fuel and purchased power expenditures (netted with the regulatory adjustments) to the fuel and purchased power expense shown on our statements of income for the applicable periods ended June 30, 2013 and 2012.
Three Months Six Months Twelve Months Ended Ended Ended (in millions) 2013 2012 2013 2012 2013 2012 Actual fuel and purchased power expenditures $ 43.7 $ 39.9 $ 91.5 $ 80.6 $ 184.5 $ 181.1 Missouri fuel adjustment recovery (1) (0.4) 2.7 (0.9) 7.0 (4.4) 9.3 Missouri fuel adjustment deferral(2) (0.7) 3.2 (1.9) 5.0 (1.6) 1.7 Kansas and Oklahoma regulatory adjustments(2) (0.1) 0.5 - 0.8 0.1 0.4 SWPA amortization(3) (0.7) (0.7) (1.4) (1.3) (2.9) (2.7) Unrealized (gain)/loss on derivatives 0.2 (0.1) - (1.3) (0.3) (0.2) Total fuel and purchased power expense per income statement $ 42.0 $ 45.5 $ 87.3 $ 90.8 $ 175.4 $ 189.6
(1)A positive amount indicates costs recovered from customers from under recovery in prior deferral periods. A negative amount indicates costs refunded to customers from over recovery in prior deferral periods.
(2)A negative amount indicates costs have been under recovered from customers and a positive amount indicates costs have been over recovered from customers.
(3) Missouri ten year amortization of the $26.6 million payment received from the SWPA in September, 2010.
Operating Revenue Deductions – Other Than Fuel and Purchased Power
The table below shows regulated operating expense increases/(decreases) for the applicable periods ended June 30, 2013 as compared to the same periods in 2012.

40
Three Months Six Months Twelve Months Ended Ended Ended (in millions) 2013 vs. 2012 2013 vs. 2012 2013 vs. 2012 Employee pension expense $ 0.2 $ 0.3 $ 0.5 Steam power other operating expense 0.8 0.7 0.8 Transmission expense 1.5 2.5 3.2 Distribution expense 0.2 0.1 0.0 Regulatory reversal of gain on prior period sale of assets 0.0 1.2 1.2 Employee health care expense 0.1 0.6 1.7 Customer accounts expense(1) 0.3 0.4 0.0 Banking fees (0.1) (0.5) (0.9) Regulatory commission expense 0.0 0.1 (0.5) Property insurance 0.1 0.3 0.6 Injuries and damages expense 0.1 0.5 0.4 General labor costs 0.4 1.1 1.4 Professional services (0.1) (0.3) 0.3 General office expense 0.2 0.2 0.7 Other miscellaneous accounts (netted) 0.2 0.5 0.1 TOTAL $ 3.9 $ 7.7 $ 9.5
(1) Primarily uncollectible accounts.
The table below shows maintenance and repairs expense increases/(decreases) for the applicable periods ended June 30, 2013 as compared to the same periods in 2012.
Three Months Six Months Twelve Months Ended Ended Ended
(in millions) 2013 vs. 2012 2013 vs. 2012 2013 vs. 2012 Distribution and transmission maintenance costs $ 0.5 $ (0.6) $ (1.9) Maintenance and repairs expense at the Asbury plant (0.7) (0.1) 0.7 Maintenance and repairs expense at the SLCC (1.2) (0.5) (0.5) Maintenance and repairs expense at the Iatan plant, Energy Center, Plum Point plant and Riverton plant 0.4 0.2 0.0 Other miscellaneous accounts (netted) 0.0 0.1 0.1 TOTAL $ (1.0) $ (0.9) $ (1.6)
Depreciation and amortization expense increased approximately $2.4 million (17.8%), $3.6 million (13.0%) and $4.9 million (9.1%) during the quarter, six month and twelve month periods ended June 30, 2013, respectively, primarily due to increased depreciation rates resulting from our recent Missouri electric rate case settlement and increased plant in service. Other taxes increased approximately $0.6 million, $1.0 million and $1.7 million during the quarter, six month and twelve month periods ended June 30, 2013, respectively, due to increased property tax reflecting our additions to plant in service and increased municipal franchise taxes.

41
Gas Segment
Gas Operating Revenues and Sales
The following table details our natural gas sales for the periods ended June 30:
Total Gas Delivered to Customers Three Months Ended Six months ended Twelve months ended
(bcf sales) 2013 2012 % change 2013 2012 % change 2013 2012 % change Residential 0.33 0.15 117.5 % 1.67 1.12 49.6 % 2.56 1.99 28.8 % Commercial 0.18 0.14 34.2 0.79 0.58 35.2 1.26 1.05 19.6 Industrial(1) 0.01 0.01 39.7 0.05 0.04 29.8 0.07 0.07 (2.8) Other(2) 0.01 0.00 390.5 0.02 0.01 58.3 0.03 0.03 31.8 Total retail sales 0.53 0.30 77.7 2.53 1.75 44.5 3.92 3.14 25.1 Transportation sales(1) 0.98 0.92 6.1 2.39 2.14 11.5 4.50 4.11 9.3 Total gas operating sales 1.51 1.22 23.7 4.92 3.89 26.3 8.42 7.25 16.1 (1)
The twelve month ended percentage change reflects the transfer of customers from industrial sales to transportation during the first quarter of 2012. (2)
Other includes other public authorities and interdepartmental usage.
Gas retail sales increased 77.7% during the second quarter of 2013 as compared to the second quarter of 2012 primarily due to cooler than normal temperatures during the second quarter of 2013. Heating degree days were 150.6% more in the second quarter of 2013 as compared to the second quarter of 2012 and 43.4% more than the 30-year average.
Gas retail sales increased 44.5% during the six months ended June 30, 2013 as compared to the same period in 2012 primarily due to colder weather during the first and second quarters of 2013 as compared to the same periods in 2012.
Gas retail sales increased 25.1% during the twelve months ended June 30, 2013 as compared to the same period in 2012 reflecting the colder weather during the first and second quarters of 2013 as compared to the same periods in 2012. Industrial sales decreased slightly, reflecting the transfer of customers from industrial sales to transportation during the first quarter of 2012.
The following table details our natural gas revenues for the periods ended June 30:
Operating Revenues and Cost of Gas Sold Three Months Ended Six months ended Twelve months ended
($ in millions) 2013 2012 % change 2013 2012 % change 2013 2012 % change Residential $ 4.8 $ 3.3 46.9% $ 18.1 $ 13.3 35.6% $ 29.5 $ 24.5 20.5% Commercial 2.1 1.6 26.8 7.7 5.9 31.1 12.6 10.7 17.4 Industrial(1) 0.0 0.1 (40.4) 0.3 0.3 5.3 0.5 0.5 (7.4) Other(2) 0.0 0.0 136.4 0.2 0.2 48.0 0.3 0.3 26.9 Total retail revenues $ 6.9 $ 5.0 39.4 $ 26.3 $ 19.7 33.9 $ 42.9 $ 36.0 19.2 Other revenues 0.2 0.1 24.8 0.2 0.2 4.7 0.4 0.4 (6.2) Transportation revenues(1) 0.7 0.7 (2.9) 1.7 1.6 6.9 3.3 3.2 3.7 Total gas operating revenues
$ 7.8
$ 5.8
34.0
$ 28.2
$ 21.5
31.6
$ 46.6
$ 39.6
17.7
Cost of gas sold 3.1 1.8 76.0 15.0 10.4 45.3 23.3 18.3 27.0 Gas operating revenues over cost of gas in rates (margin)
$ 4.7
$ 4.0
15.6
$ 13.2
$ 11.1
18.8
$ 23.3
$ 21.3
9.6 (1)
The twelve month ended percentage change reflects the transfer of customers from industrial sales to transportation during the first quarter of 2012. (2)
Other includes other public authorities and interdepartmental usage.
During the second quarter of 2013, gas segment revenues increased approximately $2.0 million, mainly due to increased sales resulting from the cooler than normal weather previously discussed. Our gas gross margin (defined as gas operating revenues less cost of gas in rates) for the second quarter of 2013 increased $0.7 million as compared to the second quarter of 2012 due to the weather impact.
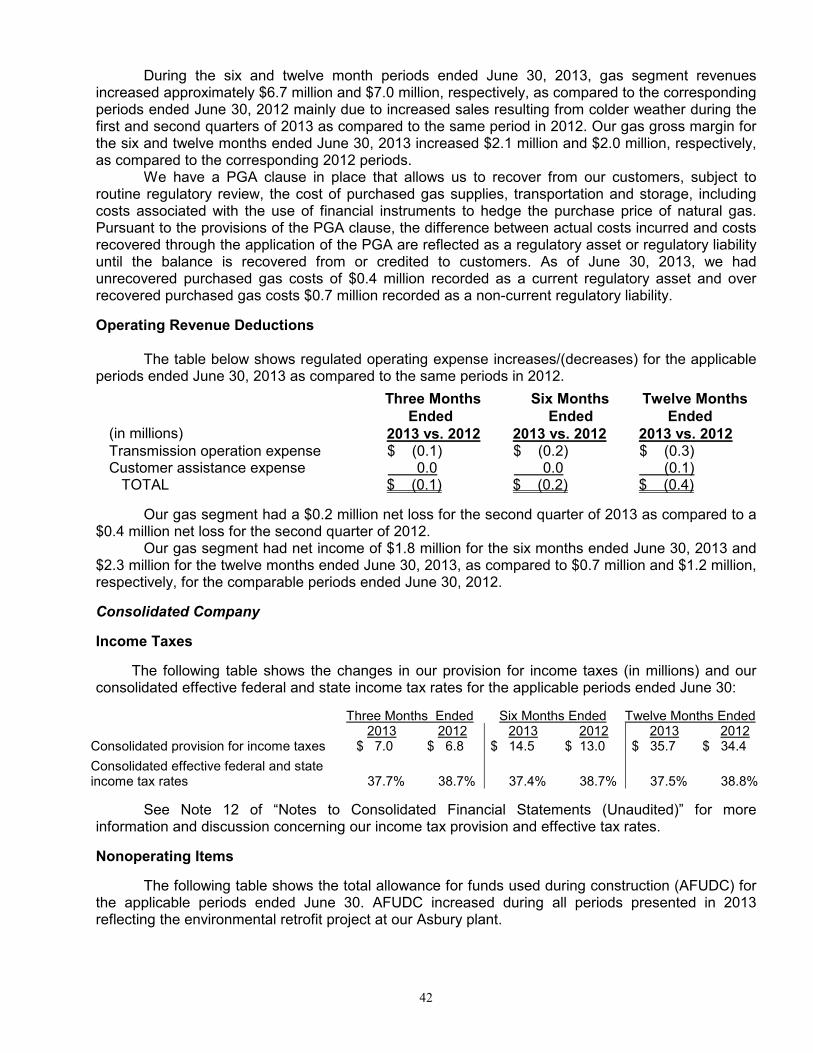
42
During the six and twelve month periods ended June 30, 2013, gas segment revenues increased approximately $6.7 million and $7.0 million, respectively, as compared to the corresponding periods ended June 30, 2012 mainly due to increased sales resulting from colder weather during the first and second quarters of 2013 as compared to the same period in 2012. Our gas gross margin for the six and twelve months ended June 30, 2013 increased $2.1 million and $2.0 million, respectively, as compared to the corresponding 2012 periods.
We have a PGA clause in place that allows us to recover from our customers, subject to routine regulatory review, the cost of purchased gas supplies, transportation and storage, including costs associated with the use of financial instruments to hedge the purchase price of natural gas. Pursuant to the provisions of the PGA clause, the difference between actual costs incurred and costs recovered through the application of the PGA are reflected as a regulatory asset or regulatory liability until the balance is recovered from or credited to customers. As of June 30, 2013, we had unrecovered purchased gas costs of $0.4 million recorded as a current regulatory asset and over recovered purchased gas costs $0.7 million recorded as a non-current regulatory liability.
Operating Revenue Deductions
The table below shows regulated operating expense increases/(decreases) for the applicable periods ended June 30, 2013 as compared to the same periods in 2012.
Three Months Six Months Twelve Months Ended Ended Ended (in millions) 2013 vs. 2012 2013 vs. 2012 2013 vs. 2012 Transmission operation expense $ (0.1) $ (0.2) $ (0.3) Customer assistance expense 0.0 0.0 (0.1) TOTAL $ (0.1) $ (0.2) $ (0.4)
Our gas segment had a $0.2 million net loss for the second quarter of 2013 as compared to a $0.4 million net loss for the second quarter of 2012.
Our gas segment had net income of $1.8 million for the six months ended June 30, 2013 and $2.3 million for the twelve months ended June 30, 2013, as compared to $0.7 million and $1.2 million, respectively, for the comparable periods ended June 30, 2012.
Consolidated Company
Income Taxes
The following table shows the changes in our provision for income taxes (in millions) and our consolidated effective federal and state income tax rates for the applicable periods ended June 30:
Three Months Ended Six Months Ended Twelve Months Ended 2013 2012 2013 2012 2013 2012 Consolidated provision for income taxes $ 7.0 $ 6.8 $ 14.5 $ 13.0 $ 35.7 $ 34.4 Consolidated effective federal and state income tax rates
37.7%
38.7%
37.4%
38.7%
37.5%
38.8%
See Note 12 of “Notes to Consolidated Financial Statements (Unaudited)” for more information and discussion concerning our income tax provision and effective tax rates.
Nonoperating Items
The following table shows the total allowance for funds used during construction (AFUDC) for the applicable periods ended June 30. AFUDC increased during all periods presented in 2013 reflecting the environmental retrofit project at our Asbury plant.
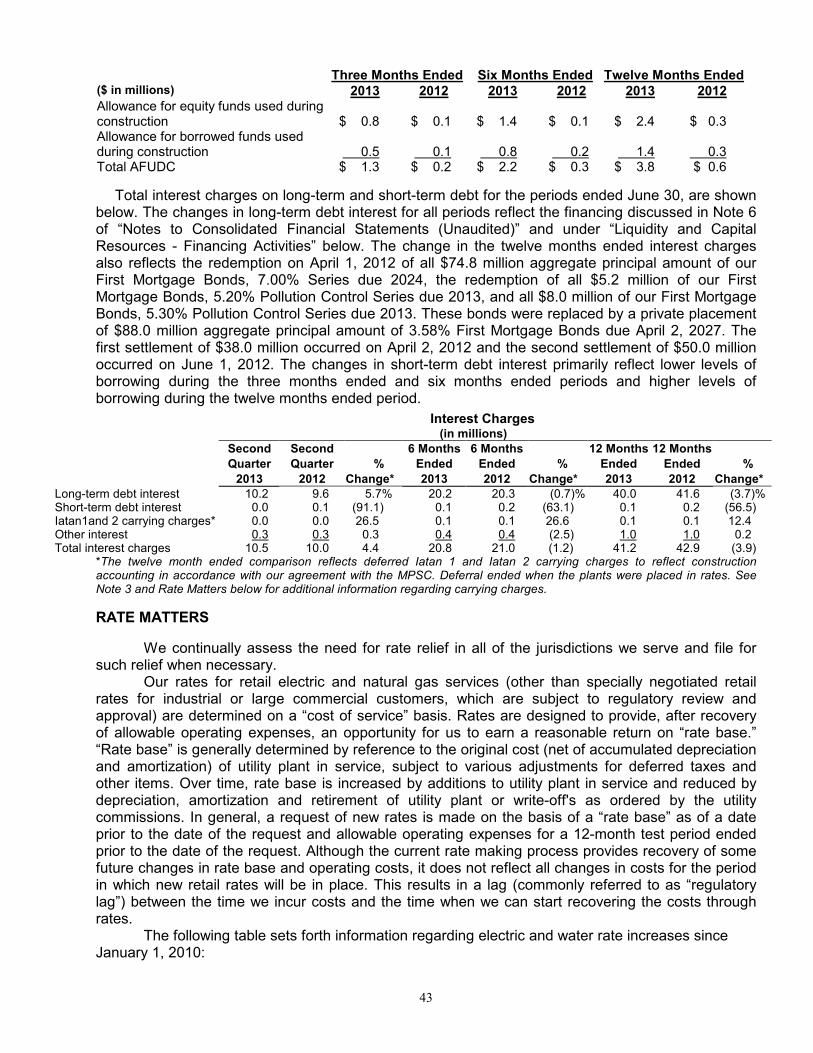
43
Three Months Ended Six Months Ended Twelve Months Ended ($ in millions) 2013 2012 2013 2012 2013 2012 Allowance for equity funds used during construction
$ 0.8
$ 0.1
$ 1.4
$ 0.1
$ 2.4
$ 0.3
Allowance for borrowed funds used during construction
0.5
0.1
0.8
0.2
1.4
0.3
Total AFUDC $ 1.3 $ 0.2 $ 2.2 $ 0.3 $ 3.8 $ 0.6
Total interest charges on long-term and short-term debt for the periods ended June 30, are shown below. The changes in long-term debt interest for all periods reflect the financing discussed in Note 6 of “Notes to Consolidated Financial Statements (Unaudited)” and under “Liquidity and Capital Resources - Financing Activities” below. The change in the twelve months ended interest charges also reflects the redemption on April 1, 2012 of all $74.8 million aggregate principal amount of our First Mortgage Bonds, 7.00% Series due 2024, the redemption of all $5.2 million of our First Mortgage Bonds, 5.20% Pollution Control Series due 2013, and all $8.0 million of our First Mortgage Bonds, 5.30% Pollution Control Series due 2013. These bonds were replaced by a private placement of $88.0 million aggregate principal amount of 3.58% First Mortgage Bonds due April 2, 2027. The first settlement of $38.0 million occurred on April 2, 2012 and the second settlement of $50.0 million occurred on June 1, 2012. The changes in short-term debt interest primarily reflect lower levels of borrowing during the three months ended and six months ended periods and higher levels of borrowing during the twelve months ended period.
Interest Charges (in millions)
Second Second 6 Months 6 Months 12 Months 12 Months
Quarter Quarter % Ended Ended % Ended Ended %
2013 2012 Change* 2013 2012 Change* 2013 2012 Change*
Long-term debt interest 10.2 9.6 5.7% 20.2 20.3 (0.7)% 40.0 41.6 (3.7)% Short-term debt interest 0.0 0.1 (91.1) 0.1 0.2 (63.1) 0.1 0.2 (56.5) Iatan1and 2 carrying charges* 0.0 0.0 26.5 0.1 0.1 26.6 0.1 0.1 12.4 Other interest 0.3 0.3 0.3 0.4 0.4 (2.5) 1.0 1.0 0.2 Total interest charges 10.5 10.0 4.4 20.8 21.0 (1.2) 41.2 42.9 (3.9)
*The twelve month ended comparison reflects deferred Iatan 1 and Iatan 2 carrying charges to reflect construction accounting in accordance with our agreement with the MPSC. Deferral ended when the plants were placed in rates. See Note 3 and Rate Matters below for additional information regarding carrying charges.
RATE MATTERS
We continually assess the need for rate relief in all of the jurisdictions we serve and file for such relief when necessary. Our rates for retail electric and natural gas services (other than specially negotiated retail rates for industrial or large commercial customers, which are subject to regulatory review and approval) are determined on a “cost of service” basis. Rates are designed to provide, after recovery of allowable operating expenses, an opportunity for us to earn a reasonable return on “rate base.” “Rate base” is generally determined by reference to the original cost (net of accumulated depreciation and amortization) of utility plant in service, subject to various adjustments for deferred taxes and other items. Over time, rate base is increased by additions to utility plant in service and reduced by depreciation, amortization and retirement of utility plant or write-off's as ordered by the utility commissions. In general, a request of new rates is made on the basis of a “rate base” as of a date prior to the date of the request and allowable operating expenses for a 12-month test period ended prior to the date of the request. Although the current rate making process provides recovery of some future changes in rate base and operating costs, it does not reflect all changes in costs for the period in which new retail rates will be in place. This results in a lag (commonly referred to as “regulatory lag”) between the time we incur costs and the time when we can start recovering the costs through rates.
The following table sets forth information regarding electric and water rate increases since January 1, 2010:

44
Jurisdiction
Date Requested
Annual Increase Granted
Percent Increase Granted
Date Effective
Missouri – Electric July 6, 2012 $ 27,500,000 6.78% April 1, 2013 Missouri – Water May 21, 2012 $ 450,000 25.5% November 23, 2012 Missouri – Electric September 28, 2010 $ 18,700,000 4.70% June 15, 2011 Missouri – Electric October 29, 2009 $ 46,800,000 13.40% September 10, 2010 Kansas – Electric June 17, 2011 $ 1,250,000 5.20% January 1, 2012 Kansas – Electric November 4, 2009 $ 2,800,000 12.40% July 1, 2010 Oklahoma – Electric June 30, 2011 $ 240,722 1.66% January 4, 2012 Oklahoma – Electric January 28, 2011 $ 1,063,100 9.32% March 1, 2011 Oklahoma – Electric March 25, 2010 $ 1,456,979 15.70% September 1, 2010 Arkansas - Electric August 19, 2010 $ 2,104,321 19.00% April 13, 2011 Missouri – Gas June 5, 2009 $ 2,600,000 4.37% April 1, 2010
On February 22, 2013, we filed a Nonunanimous Stipulation and Agreement (Agreement) with the MPSC which issued an order approving the Agreement on February 27, 2013, effective March 6, 2013. The Agreement provided for an annual increase in base revenues for our Missouri electric customers in the amount of approximately $27.5 million, effective April 1, 2013, and the continuation of the current fuel adjustment mechanism. The Agreement also included an increase in depreciation rates, recovery of deferred tornado costs over the next ten years and the continuation of tracking mechanisms for expenses related to employee pension, retiree health care, vegetation management, and Iatan 2, Iatan Common and Plum Point operating and maintenance costs. In addition, the Agreement included a write-off of approximately $3.6 million, consisting of a $2.4 million disallowance for the prudency of certain construction expenditures for Iatan 2 and a $1.2 million regulatory reversal of a prior period gain on sale of our Asbury unit train, which is included in regulated operating expenses. We also agreed not to implement a Missouri general rate increase prior to October 1, 2014.
As initially filed on July 6, 2012, we requested an annual increase in base rates for our Missouri electric customers in the amount of $30.7 million, or 7.56%, and the continuation of the fuel adjustment clause. This request was primarily designed to recover operation and maintenance expenses and capital costs associated with the May 22, 2011 tornado, Southwest Power Pool transmission charges allocated to us, operating systems replacement costs for new software systems, vegetation management costs, new depreciation rates and amortization of a regulatory asset related to the tax benefits of cost of removal, the balance of which was approximately $9.6 million at December 31, 2012. On May 18, 2012, we filed a request with the FERC to implement a TFR to be effective August 1, 2012. On July 31, 2012, the FERC suspended the TFR for five months and set the filing for hearing and settlement procedures. On June 13, 2013, we, the Kansas Corporation Commission and the cities of Monett, Mt. Vernon and Lockwood, Missouri and Chetopa, Kansas, filed a unanimous Settlement Agreement (Agreement) with the FERC. The Agreement includes a TFR that establishes an ROE of 10.0%. The Agreement calls for the TFR to be updated annually with the new updated TFR rates effective on July 1 of each year. FERC action on the Agreement is pending. Our other rate cases, as we reported in our Annual Report on Form 10-K for the year ended December 31, 2012, remain unchanged. See Note 3, “Regulatory Matters” in our Annual Report on Form 10-K for the year ended December 31, 2012 for additional information COMPETITION AND MARKETS
Electric Segment
SPP Regional Transmission Development: On June 17, 2010, the FERC approved the new highway/byway cost allocation method, a new transmission cost allocation method to replace the existing FERC accepted cost allocation method for new transmission facilities needed to continue to reliably and economically serve Southwest Power Pool (SPP) customers, including ours, well into the future. To date, the SPP’s Board of Directors (BOD) has approved over $8 billion in transmission projects for the 2006 through 2022 time period of which over $4 billion is in planned highway/byway

45
transmission projects. As these projects are constructed, we will be allocated a share of the costs of the projects pursuant to the FERC accepted highway/byway regional costs allocation method. We expect that these operating costs will be material, but that they will be recoverable in future rates.
Other FERC Activity On April 23, 2012, we intervened in the SPP’s Petition for Review (Case No. 12-1158) of FERC’s Orders on Declaratory Order and Rehearing (Docket No. EL11-34-000) on the interpretation of the SPP/MISO Joint Operating Agreement (JOA) at the United States Court of Appeals for the District of Columbia. We are in agreement with SPP and other SPP members that FERC was incorrect in its determination that MISO’s interpretation of the Joint Operating Agreement appropriately enables MISO and Entergy to utilize ours and other SPP members transmission systems to integrate Entergy into the MISO RTO without compensation or consideration of the negative impacts to us and the other SPP members. On June 25, 2012, the SPP interveners made a joint intervention filing at the DC court and a joint brief in October 2012 and reply brief on January 14, 2013. It is in our best interests that the review of the Joint Operating Agreement between SPP and MISO be remanded back to FERC to reevaluate its Orders. Based on the current terms and conditions of MISO membership, Entergy’s participation in MISO will not be beneficial to our customers as it will increase transmission delivery costs for our Plum Point power station as well as utilize our transmission system without compensation. In late 2012, ITC Holdings and Entergy announced the sale of transmission assets to ITC and formation of new ITC transmission only companies. Subsequently, ITC, Entergy, and MISO made multiple filings at the FERC for the transfer of ownership of Entergy’s transmission facilities as well as full integration into the MISO RTO. We and several other SPP members jointly filed in protest of the filings on January 11, 2013, based on Entergy and MISO’s planned utilization of our and the other SPP members’ system without mitigation or resolution of the current and expected harm of MISO’s interpretation/use of the joint operating agreement to implement the integration. On June 20, 2013, FERC issued several Orders, with some conditions, approving Entergy joining MISO and the purchase of Entergy transmission assets by a newly created subsidiary of ITC Holdings, ITC South. Many of the SPP joint protestors will be making a joint filing at FERC for clarification and/or rehearing of FERC’s orders on ITC/Entergy/MISO with an emphasis on FERC’s lack of requirement for SPP and MISO to resolve their JOA issues of dispute prior to Entergy joining MISO in late December 2013.
We and several other SPP members have intervened at the Missouri and Arkansas commissions in opposition to the sale/transfer of transmission assets of Entergy Arkansas to ITC South. We believe the sale of Entergy’s transmission facilities and joining MISO has not been shown to be in the public interest and will negatively impact and increase cost to our customers. Those transfer of transmission asset cases are pending before those commissions with rulings expected in early fall 2013. The transaction between ITC and Entergy is conditional upon Entergy securing all necessary state and federal regulatory approvals.
See Note 3, “Regulatory Matters - Competition” in our Annual Report on Form 10-K for the year ended December 31, 2012 for additional information.
LIQUIDITY AND CAPITAL RESOURCES
Overview. Our primary sources of liquidity are cash provided by operating activities, short-term borrowings under our commercial paper program (which is supported by our credit facilities) and borrowings from our unsecured revolving credit facility. As needed, we raise funds from the debt and equity capital markets to fund our liquidity and capital resource needs. Our issuance of various securities, including equity, long-term and short-term debt, is subject to customary approval or authorization by state and federal regulatory bodies including state public service commissions and the SEC. We estimate that internally generated funds (funds provided by operating activities less dividends paid) will provide approximately 66% of the funds required for the remainder of our budgeted 2013 capital expenditures (as discussed in “Capital Requirements and Investing Activities” below). We believe the amounts available to us under our credit facilities and the

46
issuance of debt and equity securities together with this cash provided by operating activities, will allow us to meet our needs for working capital, pension contributions, our continuing construction expenditures, anticipated debt redemptions, interest payments on debt obligations, dividend payments and other cash needs through the next several years. We will continue to evaluate our need to increase available liquidity based on our view of working capital requirements, including the timing of our construction programs and other factors. See Item 1A, “Risk Factors” in our Annual Report on Form 10-K for the year ended December 31, 2012 for additional information on items that could impact our liquidity and capital resource requirements. The following table provides a summary of our operating, investing and financing activities for the six months ended June 30:
Summary of Cash Flows Six Months Ended June 30, (in millions) 2013 2012 Change
Cash provided by/(used in): Operating activities $ 71.0 $ 71.7 $ (0.7) Investing activities (73.2) (62.3) (10.9) Financing activities 9.7 (12.0) 21.7 Net change in cash and cash equivalents $ 7.5 $ (2.6) $ 10.1
Cash flow from Operating Activities
We prepare our statement of cash flows using the indirect method. Under this method, we reconcile net income to cash flows from operating activities by adjusting net income for those items that impact net income but may not result in actual cash receipts or payments during the period. These reconciling items include depreciation and amortization, pension costs, deferred income taxes, equity AFUDC, changes in commodity risk management assets and liabilities and changes in the consolidated balance sheet for working capital from the beginning to the end of the period. Period-over-period changes in our operating cash flows are attributable primarily to working capital changes resulting from the impact of weather, the timing of customer collections, payments for natural gas and coal purchases, the effects of deferred fuel recoveries and the size and timing of pension contributions. The increase or decrease in natural gas prices directly impacts the cost of gas stored in inventory.
Six Months Ended June 30, 2013 Compared to 2012. During the six months ended June 30, 2013, our net cash flows provided from operating activities decreased $0.7 million or 0.9% from 2012. This change resulted primarily from the following:
• Increase in net income - $3.8 million. • Change in pension contributions net of expense accruals - $6.0 million. • Non-cash loss on regulatory plant disallowance as a result of our 2013 Missouri electric rate
case- $2.4 million. • Regulatory reversal of a prior period gain on the sale of assets as a result of our 2013
Missouri electric rate case - $1.2 million. • Changes related to fuel inventories for both electric and gas segments - $5.8 million. • 2012 asset retirement obligation adjustments - $0.9 million. • Tax timing differences mostly related to depreciation and amortizations - $(1.4) million. • Increase in equity AFUDC mostly attributable to higher construction work in progress balances
- $(1.3) million. • Lower fuel related amortizations partially offset by increased plant in service depreciation -
$(5.3) million. • Increase in customer accounts receivable - $(7.7) million. • Increased change in fuel adjustment balances - $(5.2) million.
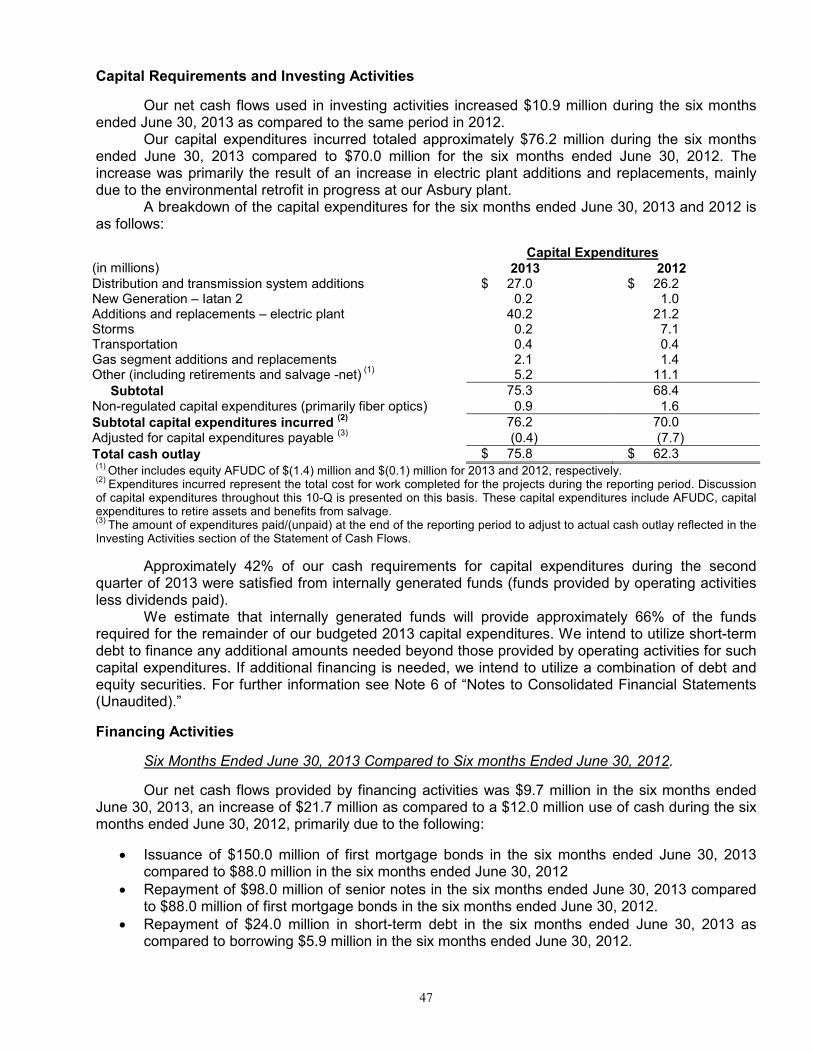
47
Capital Requirements and Investing Activities
Our net cash flows used in investing activities increased $10.9 million during the six months ended June 30, 2013 as compared to the same period in 2012. Our capital expenditures incurred totaled approximately $76.2 million during the six months ended June 30, 2013 compared to $70.0 million for the six months ended June 30, 2012. The increase was primarily the result of an increase in electric plant additions and replacements, mainly due to the environmental retrofit in progress at our Asbury plant. A breakdown of the capital expenditures for the six months ended June 30, 2013 and 2012 is as follows:
Capital Expenditures (in millions) 2013 2012 Distribution and transmission system additions $ 27.0 $ 26.2 New Generation – Iatan 2 0.2 1.0 Additions and replacements – electric plant 40.2 21.2 Storms 0.2 7.1 Transportation 0.4 0.4 Gas segment additions and replacements 2.1 1.4 Other (including retirements and salvage -net)
(1) 5.2 11.1
Subtotal 75.3 68.4 Non-regulated capital expenditures (primarily fiber optics) 0.9 1.6 Subtotal capital expenditures incurred
(2) 76.2 70.0
Adjusted for capital expenditures payable (3) (0.4) (7.7)
Total cash outlay $ 75.8 $ 62.3 (1)
Other includes equity AFUDC of $(1.4) million and $(0.1) million for 2013 and 2012, respectively. (2)
Expenditures incurred represent the total cost for work completed for the projects during the reporting period. Discussion of capital expenditures throughout this 10-Q is presented on this basis. These capital expenditures include AFUDC, capital expenditures to retire assets and benefits from salvage. (3)
The amount of expenditures paid/(unpaid) at the end of the reporting period to adjust to actual cash outlay reflected in the Investing Activities section of the Statement of Cash Flows.
Approximately 42% of our cash requirements for capital expenditures during the second quarter of 2013 were satisfied from internally generated funds (funds provided by operating activities less dividends paid). We estimate that internally generated funds will provide approximately 66% of the funds required for the remainder of our budgeted 2013 capital expenditures. We intend to utilize short-term debt to finance any additional amounts needed beyond those provided by operating activities for such capital expenditures. If additional financing is needed, we intend to utilize a combination of debt and equity securities. For further information see Note 6 of “Notes to Consolidated Financial Statements (Unaudited).”
Financing Activities
Six Months Ended June 30, 2013 Compared to Six months Ended June 30, 2012.
Our net cash flows provided by financing activities was $9.7 million in the six months ended June 30, 2013, an increase of $21.7 million as compared to a $12.0 million use of cash during the six months ended June 30, 2012, primarily due to the following:
• Issuance of $150.0 million of first mortgage bonds in the six months ended June 30, 2013 compared to $88.0 million in the six months ended June 30, 2012
• Repayment of $98.0 million of senior notes in the six months ended June 30, 2013 compared to $88.0 million of first mortgage bonds in the six months ended June 30, 2012.
• Repayment of $24.0 million in short-term debt in the six months ended June 30, 2013 as compared to borrowing $5.9 million in the six months ended June 30, 2012.

48
See the financing discussion in Note 6 of “Notes to Consolidated Financial Statements (Unaudited).”
Shelf Registration
We have a $400.0 million shelf registration statement with the SEC, effective for a three-year period beginning February 7, 2011, covering our common stock, unsecured debt securities, preference stock, and first mortgage bonds. We have received regulatory approval for the issuance of securities under this shelf from all four states in our electric service territory, but we may only issue up to $250.0 million of such securities in the form of first mortgage bonds, of which $12.0 million remains available after giving effect to the $150.0 million of new first mortgage bonds issued on May 30, 2013. We plan to use proceeds from offerings made pursuant to this shelf to fund capital expenditures, refinancings of existing debt or general corporate needs.
Credit Agreements
On January 17, 2012, we entered into the Third Amended and Restated Unsecured Credit Agreement which amended and restated our Second Amended and Restated Unsecured Credit Agreement dated January 26, 2010. This agreement extended the termination date of the revolving credit facility from January 26, 2013 to January 17, 2017. The agreement also removed the letter of credit facility and includes a swingline loan facility with a $15 million swingline loan sublimit. The aggregate amount of the revolving credit commitments remains $150 million, inclusive of the $15 million swingline loan sublimit. In addition, the pricing and fees under the facility were amended. Interest on borrowings under the facility accrues at a rate equal to, at our option, (i) the highest of (A) the bank’s prime commercial rate, (B) the federal funds effective rate plus 0.5% or (C) one month LIBOR plus 1.0%, plus a margin or (ii) one month, two month or three month LIBOR, in each case, plus a margin. Each margin is based on our current credit ratings and the pricing schedule in the facility. As of the date hereof, and based on our current credit ratings, the LIBOR margin under the facility is 1.25%. A facility fee is payable quarterly on the full amount of the commitments under the facility based on our current credit ratings, which fee is currently 0.25%. In addition, upon entering into the amended and restated facility, we paid an upfront fee to the revolving credit banks of $262,500 in the aggregate. There were no other material changes to the terms of the facility.
The facility is used for working capital, general corporate purposes and to back-up our use of commercial paper. This facility requires our total indebtedness to be less than 62.5% of our total capitalization at the end of each fiscal quarter and our EBITDA (defined as net income plus interest, taxes, depreciation and amortization) to be at least two times our interest charges for the trailing four fiscal quarters at the end of each fiscal quarter. Failure to maintain these ratios will result in an event of default under the credit facility and will prohibit us from borrowing funds thereunder. As of June 30, 2013, we are in compliance with these ratios. Our total indebtedness is 50.6% of our total capitalization as of June 30, 2013 and our EBITDA is 5.0 times our interest charges. This credit facility is also subject to cross-default if we default on in excess of $10 million in the aggregate on our other indebtedness. This arrangement does not serve to legally restrict the use of our cash in the normal course of operations. There were no outstanding borrowings under this agreement at June 30, 2013 and no outstanding commercial paper.
EDE Mortgage Indenture
The principal amount of all series of first mortgage bonds outstanding at any one time under the EDE Mortgage is limited by terms of the mortgage to $1.0 billion. Substantially all of the property, plant and equipment of The Empire District Electric Company (but not its subsidiaries) is subject to the lien of the EDE Mortgage. Restrictions in the EDE mortgage bond indenture could affect our liquidity. The EDE Mortgage contains a requirement that for new first mortgage bonds to be issued, our net earnings (as defined in the EDE Mortgage) for any twelve consecutive months within the fifteen months preceding issuance must be two times the annual interest requirements (as defined in the EDE Mortgage) on all first mortgage bonds then outstanding and on the prospective issue of new first mortgage bonds. Our earnings for the twelve months ended June 30, 2013 would permit us to

49
issue approximately $530.9 million of new first mortgage bonds based on this test with an assumed interest rate of 5.5%. In addition to the interest coverage requirement, the EDE Mortgage provides that new bonds must be issued against, among other things, retired bonds or 60% of net property additions. At June 30, 2013, we had retired bonds and net property additions which would enable the issuance of at least $812.7 million principal amount of bonds if the annual interest requirements are met. As of June 30, 2013, we are in compliance with all restrictive covenants of the EDE Mortgage.
EDG Mortgage Indenture
The principal amount of all series of first mortgage bonds outstanding at any one time under the EDG Mortgage is limited by terms of the mortgage to $300.0 million. Substantially all of the property, plant and equipment of The Empire District Gas Company is subject to the lien of the EDG Mortgage. The EDG Mortgage contains a requirement that for new first mortgage bonds to be issued, the amount of such new first mortgage bonds shall not exceed 75% of the cost of property additions acquired after the date of the Missouri Gas acquisition. The mortgage also contains a limitation on the issuance by EDG of debt (including first mortgage bonds, but excluding short-term debt incurred in the ordinary course under working capital facilities) unless, after giving effect to such issuance, EDG’s ratio of EBITDA (defined as net income plus interest, taxes, depreciation, amortization and certain other non-cash charges) to interest charges for the most recent four fiscal quarters is at least 2.0 to 1.0. As of June 30, 2013, this test would allow us to issue approximately $14.3 million principal amount of new first mortgage bonds at an assumed interest rate of 5.5%.
Currently, our corporate credit ratings and the ratings for our securities are as follows: Fitch Moody’s Standard & Poor’s Corporate Credit Rating n/r* Baa2 BBB EDE First Mortgage Bonds BBB+ A3 A- Senior Notes BBB Baa2 BBB Commercial Paper F3 P-2 A-2 Outlook Stable Stable Stable
*Not rated
On March 6, 2013, Standard & Poor’s upgraded our corporate credit rating to BBB from BBB-, senior secured debt to A- from BBB+, senior unsecured debt to BBB from BBB- and our commercial paper rating to A-2 from A-3. Standard & Poor’s outlook for Empire is stable. On May 26, 2011 after the May 22, 2011 tornado, and again on April 25, 2012, Moody’s reaffirmed all of our ratings. On March 24, 2011, Fitch revised our commercial paper rating from F2 to F3 and reaffirmed our other ratings. The rating action was not based on a specific action or event on our part, but reflected their traditional linkage of long-term and short-term Issuer Default Ratings. On May 24, 2013, Fitch reaffirmed our ratings. A security rating is not a recommendation to buy, sell or hold securities. Each rating is subject to revision or withdrawal at any time by the assigning rating organization. Each security rating agency has its own methodology for assigning ratings, and, accordingly, each rating should be considered independently of all other ratings.
CONTRACTUAL OBLIGATIONS
Material changes to our contractual obligations at June 30, 2013, compared to December 31, 2012, consist of the following:
• On October 30, 2012, we entered into a Bond Purchase Agreement for a private placement of $30.0 million of 3.73% First Mortgage Bonds due May 30, 2033 and $120.0 million of 4.32% First Mortgage Bonds due May 30, 2043. The delayed settlement of both series of bonds occurred on May 30, 2013.
• On June 15, 2013, we redeemed all $98.0 million aggregate principal amount of our Senior Notes, 4.50% Series due June 15, 2013.
See “Financing Activities” above for details.
50
DIVIDENDS
Holders of our common stock are entitled to dividends if, as, and when declared by the Board of Directors, out of funds legally available therefore, subject to the prior rights of holders of any outstanding cumulative preferred stock and preference stock. Payment of dividends is determined by our Board of Directors after considering all relevant factors, including the amount of our retained earnings (which is essentially our accumulated net income less dividend payouts). A reduction of our dividend per share, partially or in whole, could have an adverse effect on our common stock price.
In response to the expected loss of revenues resulting from the May 22, 2011 tornado, our level of retained earnings and other relevant factors, our Board of Directors suspended our quarterly dividend for the third and fourth quarters of 2011. On February 2, 2012, the Board of Directors re-established the dividend and declared a quarterly dividend of $0.25 per share on common stock payable on March 15, 2012 to holders of record as of March 1, 2012. Dividends were paid during all four quarters of 2012. As of June 30, 2013, our retained earnings balance was $50.1 million, compared to $33.1 million as of June 30, 2012 and $47.1 million as of December 31, 2012. On July 25, 2013, the Board of Directors declared a quarterly dividend of $0.25 per share on common stock payable September 16, 2013 to holders of record as of September 3, 2013.
Our diluted earnings per share were $0.57 for the six months ended June 30, 2013 and were $1.32 and $1.31 for the years ended December 31, 2012 and 2011, respectively. Dividends paid per share were $0.50 for the six months ended June 30, 2013, $1.00 for the year ended December 31, 2012 and $0.64 for the year ended December 31, 2011. Under Kansas corporate law, our Board of Directors may only declare and pay dividends out of our surplus or, if there is no surplus, out of our net profits for the fiscal year in which the dividend is declared or the preceding fiscal year, or both. Our surplus, under Kansas law, is equal to our retained earnings plus accumulated other comprehensive income/(loss), net of income tax. However, Kansas law does permit, under certain circumstances, our Board of Directors to transfer amounts from capital in excess of par value to surplus. In addition, Section 305(a) of the Federal Power Act (FPA) prohibits the payment by a utility of dividends from any funds "properly included in capital account". There are no additional rules or regulations issued by the FERC under the FPA clarifying the meaning of this limitation. However, several decisions by the FERC on specific dividend proposals suggest that any determination would be based on a fact-intensive analysis of the specific facts and circumstances surrounding the utility and the dividend in question, with particular focus on the impact of the proposed dividend on the liquidity and financial condition of the utility.
In addition, the EDE Mortgage and our Restated Articles contain certain dividend restrictions. The most restrictive of these is contained in the EDE Mortgage, which provides that we may not declare or pay any dividends (other than dividends payable in shares of our common stock) or make any other distribution on, or purchase (other than with the proceeds of additional common stock financing) any shares of, our common stock if the cumulative aggregate amount thereof after August 31, 1944 (exclusive of the first quarterly dividend of $98,000 paid after said date) would exceed the sum of $10.75 million and the earned surplus (as defined in the EDE Mortgage) accumulated subsequent to August 31, 1944, or the date of succession in the event that another corporation succeeds to our rights and liabilities by a merger or consolidation. The EDE Mortgage permits the payment of any dividend or distribution on, or purchase of, shares of our common stock within 60 days after the related date of declaration or notice of such dividend, distribution or purchase if (i) on the date of declaration or notice, such dividend, distribution or purchase would have complied with the provisions of the EDE Mortgage and (ii) as of the last day of the calendar month ended immediately preceding the date of such payment, our ratio of total indebtedness to total capitalization (after giving pro forma effect to the payment of such dividend, distribution, or purchase) was not more than 0.625 to 1.
OFF-BALANCE SHEET ARRANGEMENTS
We have no off-balance sheet arrangements that have or are reasonably likely to have a current or future effect on our financial condition, changes in financial condition, revenues or

51
expenses, results of operations, liquidity, capital expenditures or capital resources, other than operating leases entered into in the normal course of business.
CRITICAL ACCOUNTING POLICIES AND ESTIMATES
See “Item 7 – Management’s Discussion and Analysis of Financial Condition and Results of Operations” in our Annual Report on Form 10-K for the year ended December 31, 2012 for a discussion of additional critical accounting policies. There were no changes in these policies in the quarter ended June 30, 2013.
RECENTLY ISSUED ACCOUNTING STANDARDS
See Note 2 of “Notes to Consolidated Financial Statements (Unaudited)”.
Item 3. Quantitative and Qualitative Disclosures about Market Risk
Our fuel procurement activities involve primary market risk exposures, including commodity price risk and credit risk. Commodity price risk is the potential adverse price impact related to the fuel procurement for our generating units. Credit risk is the potential adverse financial impact resulting from non-performance by a counterparty of its contractual obligations. Additionally, we are exposed to interest rate risk which is the potential adverse financial impact related to changes in interest rates.
Market Risk and Hedging Activities. Prices in the wholesale power markets often are extremely volatile. This volatility impacts our cost of power purchased and our participation in energy trades. If we were unable to generate an adequate supply of electricity for our customers, we would attempt to purchase power from others. Such supplies are not always available. In addition, congestion on the transmission system can limit our ability to make purchases from (or sell into) the wholesale markets. We engage in physical and financial trading activities with the goals of reducing risk from market fluctuations. In accordance with our established Energy Risk Management Policy, which typically includes entering into various derivative transactions, we attempt to mitigate our commodity market risk. Derivatives are utilized to manage our gas commodity market risk and to help manage our exposure resulting from purchasing most of our natural gas on the volatile spot market for the generation of power for our native-load customers. See Note 4 of "Notes to Consolidated Financial Statements (Unaudited)" for further information.
Commodity Price Risk. We are exposed to the impact of market fluctuations in the price and transportation costs of coal, natural gas, and electricity and employ established policies and procedures to manage the risks associated with these market fluctuations, including utilizing derivatives.
We satisfied 65.6% of our 2012 generation fuel supply need through coal. This includes the remaining coal used at Riverton as part of its transition to natural gas. Approximately 96% of our 2012 coal supply was Western coal. We have contracts and binding proposals to supply a portion of the fuel for our coal plants through 2015. These contracts satisfy approximately 100% of our anticipated fuel requirements for 2013, 58% for 2014 and 26% for our 2015 requirements for our Asbury coal plant. In order to manage our exposure to fuel prices, future coal supplies will be acquired using a combination of short-term and long-term contracts. We are exposed to changes in market prices for natural gas we must purchase to run our combustion turbine generators. Our natural gas procurement program is designed to manage our costs to avoid volatile natural gas prices. We enter into physical forward and financial derivative contracts with counterparties relating to our future natural gas requirements that lock in prices (with respect to predetermined percentages of our expected future natural gas needs) in an attempt to lessen the volatility in our fuel expenditures and improve predictability. As of June 30, 2013, 64%, or 3.8 million Dths’s, of our anticipated volume of natural gas usage for our electric operations for the remainder of 2013 is hedged.
52
Based on our expected natural gas purchases for our electric operations for the next twelve months, if average natural gas prices should increase 10% more than the price at June 30, 2013, our natural gas cost would increase by approximately $1.4 million based on our June 30, 2013 total hedged positions for the next twelve months. However, this is probable of recovery through fuel adjustment mechanisms in all of our jurisdictions, which significantly reduces the impact of fluctuating fuel costs.
We attempt to mitigate a portion of our natural gas price risk associated with our gas segment using physical forward purchase agreements, storage and derivative contracts. As of June 30, 2013, we have 0.8 million Dths in storage on the three pipelines that serve our customers. This represents 38% of our storage capacity.
See Note 4 of “Notes to Consolidated Financial Statements (Unaudited)” for further information.
Credit Risk. In order to minimize overall credit risk, we maintain credit policies, including the evaluation of counterparty financial condition and the use of standardized agreements that facilitate the netting of cash flows associated with a single counterparty. See Note 4 of “Notes to Consolidated Financial Statements (Unaudited)” regarding agreements containing credit risk contingent features. In addition, certain counterparties make available collateral in the form of cash held as margin deposits as a result of exceeding agreed-upon credit exposure thresholds or may be required to prepay the transaction. Conversely, we are required to post collateral with counterparties at certain thresholds, which is typically the result of changes in commodity prices. Amounts reported as margin deposit liabilities represent counterparty funds we hold that result from various trading counterparties exceeding agreed-upon credit exposure thresholds. Amounts reported as margin deposit assets represent our funds held on deposit for our NYMEX contracts with our broker and other financial contracts with other counterparties that resulted from us exceeding agreed-upon credit limits established by the counterparties. The following table depicts our margin deposit assets at June 30, 2013 and December 31, 2012. There were no margin deposit liabilities at these dates.
June 30, 2013 December 31, 2012 (in millions) Margin deposit assets $ 5.0 $ 4.2
Our exposure to credit risk is concentrated primarily within our fuel procurement process, as we transact with a small group of counterparties and transactions may involve large notional volumes and potentially volatile commodity prices. Below is a table showing our net credit exposure at June 30, 2013, reflecting that our counterparties are exposed to Empire for the net unrealized mark-to-market losses for physical forward and financial natural gas contracts carried at fair value.
(in millions) Net unrealized mark-to-market losses for physical forward natural gas contracts $ 4.2 Net unrealized mark-to-market losses for financial natural gas contracts 6.8 Net credit exposure $ 11.0
The $6.8 million net unrealized mark-to-market loss for financial natural gas contracts is comprised of $6.8 million that our counterparties are exposed to Empire for unrealized losses. We are holding no collateral from any counterparty since they are below the $10.0 million mark-to-market collateral threshold in our agreements. As noted above, as of June 30, 2013, we have $5.0 million on deposit for NYMEX contract exposure to Empire, of which $4.9 million represents our collateral requirement. In addition, if NYMEX gas prices decreased 25% from their June 30,
2013 levels, we
would be required to post an additional $10.7 million in collateral. If these prices increased 25%, our collateral requirement would decrease $3.4 million. Our other counterparties would not be required to post collateral with Empire.
We sell electricity and gas and provide distribution and transmission services to a diverse group of customers, including residential, commercial and industrial customers. Credit risk associated with trade accounts receivable from energy customers is limited due to the large number of
53
customers. In addition, we enter into contracts with various companies in the energy industry for purchases of energy-related commodities, including natural gas in our fuel procurement process.
Interest Rate Risk. We are exposed to changes in interest rates as a result of financing through our issuance of commercial paper and other short-term debt. We manage our interest rate exposure by limiting our variable-rate exposure (applicable to commercial paper and borrowings under our unsecured credit agreement) to a certain percentage of total capitalization, as set by policy, and by monitoring the effects of market changes in interest rates. If market interest rates average 1% more in 2013 than in 2012, our interest expense would increase, and income before taxes would decrease by less than $0.6 million. This amount has been determined by considering the impact of the hypothetical interest rates on our highest month-end commercial paper balance for 2012. These analyses do not consider the effects of the reduced level of overall economic activity that could exist in such an environment. In the event of a significant change in interest rates, management would likely take actions to further mitigate its exposure to the change. However, due to the uncertainty of the specific actions that would be taken and their possible effects, the sensitivity analysis assumes no changes in our financial structure.
Item 4. Controls and Procedures
As of the end of the period covered by this report, an evaluation was carried out, under the supervision and with the participation of our management, including our Chief Executive Officer and Chief Financial Officer, of the effectiveness of the design and operation of our disclosure controls and procedures (as such term is defined in Rule 13a-15(e) of the Securities Exchange Act of 1934). Based upon that evaluation, the Chief Executive Officer and Chief Financial Officer concluded that our disclosure controls and procedures were effective as of June 30, 2013. There have been no changes in our internal control over financial reporting that occurred during the second quarter of 2013 that have materially affected, or are reasonably likely to materially affect, our internal control over financial reporting.
PART II. OTHER INFORMATION Item 1. Legal Proceedings
See Note 7 of “Notes to Consolidated Financial Statements (Unaudited)” under “Legal Proceedings”, which description is incorporated herein by reference. Item 1A. Risk Factors. There have been no material changes to the factors disclosed in Part I, Item 1-A. Risk Factors in our Annual Report on Form 10-K for the year ended December 31, 2012.
Item 5. Other Information. For the twelve months ended June 30, 2013, our ratio of earnings to fixed charges was 2.94x. See Exhibit (12) hereto.

54
Item 6. Exhibits. (a) Exhibits.
(4) Thirty-Ninth Supplemental Indenture, dated May 30, 2013, to the Indenture of Mortgage and Deed of Trust dated as of September 1, 1944, as amended and supplemented, by and among the Company, The Bank of New York Mellon Trust Company, N.A. and UMB Bank & Trust, N. A. (Incorporated by reference to Exhibit 4.2 to Current Report on Form 8-K dated May 30, 2013 and filed May 30, 2013, File No. 001-03368).
(12) Computation of Ratio of Earnings to Fixed Charges.
(31)(a) Certification of Chief Executive Officer pursuant to Section 302 of the Sarbanes-Oxley Act of 2002.
(31)(b) Certification of Chief Financial Officer pursuant to Section 302 of the Sarbanes-Oxley Act of 2002.
(32)(a) Certification of Chief Executive Officer pursuant to 18 U.S.C. Section 1350, as adopted pursuant to Section 906 of the Sarbanes-Oxley Act of 2002.*
(32)(b) Certification of Chief Financial Officer pursuant to 18 U.S.C. Section 1350, as adopted pursuant to Section 906 of the Sarbanes-Oxley Act of 2002.*
(101) The following financial information from The Empire District Electric Company’s Quarterly Report on Form 10-Q for the period ended June 30, 2013, filed with the SEC on August 7, 2013, formatted in Extensible Business Reporting Language (XBRL): (i) the Consolidated Statements of Income for the three, six and twelve month periods ended June 30, 2013 and 2012, (ii) the Consolidated Balance Sheets at June 30, 2013 and December 31, 2012, (iii) the Consolidated Statements of Cash Flows for the six-month periods ended June 30, 2013 and 2012, and (iv) Notes to Consolidated Financial Statements.**
*This certification accompanies this Report pursuant to Section 906 of the Sarbanes-Oxley Act of 2002 and shall not be deemed filed by the Company for purposes of Section 18 or any other provision of the Securities Exchange Act of 1934, as amended.
**Pursuant to Rule 406T of Regulation S-T, the XBRL related information in Exhibit 101 to this Quarterly Report on Form 10-Q shall not be deemed to be “filed” for purposes of Section 18 of the Exchange Act, or otherwise subject to the liability of that section, and shall not be deemed incorporated by reference into, or part of a registration statement, prospectus or other document filed under the Securities Act of 1933, as amended or the Exchange Act of 1934, as amended except as shall be expressly set forth by specific reference in such filings.

55
SIGNATURES
Pursuant to the requirements of the Securities Exchange Act of 1934, the Registrant has duly caused this report to be signed on its behalf by the undersigned thereunto duly authorized.
THE EMPIRE DISTRICT ELECTRIC COMPANY Registrant
By /s/ Laurie A. Delano Laurie A. Delano
Vice President – Finance and Chief Financial Officer
By /s/ Robert W. Sager Robert W. Sager
Controller, Assistant Secretary and Assistant Treasurer August 7, 2013

EXHIBIT (12)
COMPUTATION OF RATIO OF EARNINGS TO FIXED CHARGES
Twelve Months Ended June 30, 2013 Income before provision for income taxes and fixed charges (Note A) $ 144,156,576 Fixed charges: Interest on long-term debt $ 40,041,915 Interest on short-term debt 86,681 Other interest 1,091,560 Rental expense representative of an interest factor (Note B) 7,750,400 Total fixed charges $ 48,970,556 Ratio of earnings to fixed charges 2.94x NOTE A: For the purpose of determining earnings in the calculation of the ratio, net income has been
increased by the provision for income taxes, non-operating income taxes, and by the sum of fixed charges as shown above.
NOTE B: One-third of rental expense (which approximates the interest factor).

Exhibit (31)(a)
CERTIFICATION OF CHIEF EXECUTIVE OFFICER PURSUANT TO SECTION 302 OF THE SARBANES-OXLEY ACT OF 2002
I, Bradley P.Beecher, certify that: 1. I have reviewed this quarterly report on Form 10-Q of The Empire District Electric Company; 2. Based on my knowledge, this report does not contain any untrue statement of a material fact or omit to state a material fact necessary to make the statements made, in light of the circumstances under which such statements were made, not misleading with respect to the period covered by this report; 3. Based on my knowledge, the financial statements, and other financial information included in this report, fairly present in all material respects the financial condition, results of operations and cash flows of the registrant as of, and for, the periods presented in this report; 4. The registrant’s other certifying officer and I are responsible for establishing and maintaining disclosure controls and procedures (as defined in Exchange Act Rules 13a-15(e) and 15d-15(e)) and internal control over financial reporting (as defined in Exchange Act Rules 13a-15(f) and 15d-15(f)) for the registrant and have:
a) Designed such disclosure controls and procedures, or caused such disclosure controls and procedures to be designed under our supervision, to ensure that material information relating to the registrant, including its consolidated subsidiaries, is made known to us by others within those entities, particularly during the period in which this report is being prepared;
b) Designed such internal control over financial reporting, or caused such internal control over
financial reporting to be designed under our supervision, to provide reasonable assurance regarding the reliability of financial reporting and the preparation of financial statements for external purposes in accordance with generally accepted accounting principles;
c) Evaluated the effectiveness of the registrant’s disclosure controls and procedures and
presented in this report our conclusions about the effectiveness of the disclosure controls and procedures as of the end of the period covered by this report based on such evaluation; and
d) Disclosed in this report any change in the registrant’s internal control over financial reporting
that occurred during the registrant’s most recent fiscal quarter (the registrant’s fourth fiscal quarter in the case of an annual report) that has materially affected, or is reasonably likely to materially affect, the registrant’s internal control over financial reporting; and
5. The registrant’s other certifying officer and I have disclosed, based on our most recent evaluation of internal control over financial reporting, to the registrant’s auditors and the audit committee of the registrant’s board of directors (or persons performing the equivalent functions):
a) All significant deficiencies and material weaknesses in the design or operation of internal
control over financial reporting, which are reasonably likely to adversely affect the registrant’s ability to record, process, summarize and report financial information; and
b) Any fraud, whether or not material, that involves management or other employees who have a
significant role in the registrant’s internal control over financial reporting.
Date: August 7, 2013
By: /s/ Bradley P. Beecher Name: Bradley P.Beecher Title: President and Chief Executive Officer

Exhibit (31)(b)
CERTIFICATION OF CHIEF FINANCIAL OFFICER PURSUANT TO SECTION 302 OF THE SARBANES-OXLEY ACT OF 2002
I, Laurie A. Delano, certify that: 1. I have reviewed this quarterly report on Form 10-Q of The Empire District Electric Company; 2. Based on my knowledge, this report does not contain any untrue statement of a material fact or omit to state a material fact necessary to make the statements made, in light of the circumstances under which such statements were made, not misleading with respect to the period covered by this report; 3. Based on my knowledge, the financial statements, and other financial information included in this report, fairly present in all material respects the financial condition, results of operations and cash flows of the registrant as of, and for, the periods presented in this report; 4. The registrant’s other certifying officer and I are responsible for establishing and maintaining disclosure controls and procedures (as defined in Exchange Act Rules 13a-15(e) and 15d-15(e)) and internal control over financial reporting (as defined in Exchange Act Rules 13a-15(f) and 15d-15(f)) for the registrant and have:
a) Designed such disclosure controls and procedures, or caused such disclosure controls and
procedures to be designed under our supervision, to ensure that material information relating to the registrant, including its consolidated subsidiaries, is made known to us by others within those entities, particularly during the period in which this report is being prepared;
b) Designed such internal control over financial reporting, or caused such internal control over
financial reporting to be designed under our supervision, to provide reasonable assurance regarding the reliability of financial reporting and the preparation of financial statements for external purposes in accordance with generally accepted accounting principles;
c) Evaluated the effectiveness of the registrant’s disclosure controls and procedures and
presented in this report our conclusions about the effectiveness of the disclosure controls and procedures as of the end of the period covered by this report based on such evaluation; and
d) Disclosed in this report any change in the registrant’s internal control over financial reporting
that occurred during the registrant’s most recent fiscal quarter (the registrant’s fourth fiscal quarter in the case of an annual report) that has materially affected, or is reasonably likely to materially affect, the registrant’s internal control over financial reporting; and
5. The registrant’s other certifying officer and I have disclosed, based on our most recent evaluation of internal control over financial reporting, to the registrant’s auditors and the audit committee of the registrant’s board of directors (or persons performing the equivalent functions):
a) All significant deficiencies and material weaknesses in the design or operation of internal
control over financial reporting which are reasonably likely to adversely affect the registrant’s ability to record, process, summarize and report financial information; and
b) Any fraud, whether or not material, that involves management or other employees who have a
significant role in the registrant’s internal control over financial reporting.
Date: August 7, 2013
By: /s/ Laurie A. Delano Name: Laurie A. Delano Title: Vice President - Finance and Chief Financial Officer

Exhibit (32)(a)
Certification Pursuant to 18 U.S.C. Section 1350, As Adopted Pursuant to Section 906 of the Sarbanes-Oxley Act of 2002
In connection with the Quarterly Report of The Empire District Electric Company (the “Company”) on Form 10-Q for the period ending June 30, 2013 as filed with the Securities and Exchange Commission on the date hereof (the “Report”), Bradley P. Beecher, as Chief Executive Officer of the Company, certifies, pursuant to 18 U.S.C. Section 1350, as adopted pursuant to Section 906 of the Sarbanes-Oxley Act of 2002, that: (1) The Report fully complies with the requirements of section 13(a) of the Securities Exchange Act of 1934; and (2) The information contained in the Report fairly presents, in all material respects, the financial condition and result of operations of the Company. By /s/ Bradley P. Beecher Name: Bradley P. Beecher Title: President and Chief Executive Officer Date: August 7, 2013 A signed original of this written statement required by Section 906 or other document authenticating, acknowledging or otherwise adopting the signature that appears in typed form within the electronic version of this written statement required by Section 906, has been provided to The Empire District Electric Company and will be retained by The Empire District Electric Company and furnished to the Securities and Exchange Commission or its staff upon request.

Exhibit (32)(b)
Certification Pursuant to 18 U.S.C. Section 1350,
As Adopted Pursuant to Section 906 of the Sarbanes-Oxley Act of 2002 In connection with the Quarterly Report of The Empire District Electric Company (the “Company”) on Form 10-Q for the period ending June 30, 2013 as filed with the Securities and Exchange Commission on the date hereof (the “Report”), Laurie A. Delano, as Chief Financial Officer of the Company, certifies, pursuant to 18 U.S.C. Section 1350, as adopted pursuant to Section 906 of the Sarbanes-Oxley Act of 2002, that: (1) The Report fully complies with the requirements of section 13(a) of the Securities Exchange Act of 1934; and (2) The information contained in the Report fairly presents, in all material respects, the financial condition and result of operations of the Company. By /s/ Laurie A. Delano Name: Laurie A. Delano Title: Vice President - Finance and Chief Financial Officer Date: August 7, 2013 A signed original of this written statement required by Section 906 or other document authenticating, acknowledging or otherwise adopting the signature that appears in typed form within the electronic version of this written statement required by Section 906, has been provided to The Empire District Electric Company and will be retained by The Empire District Electric Company and furnished to the Securities and Exchange Commission or its staff upon request.
Related Documents