DEFICIT ELIMINATION PLAN FLINT COMMUNITY SCHOOL DISTRICT APPROVED FEBRUARY 4, 2014 BY MICHIGAN DEPARTMENT OF EDUCATION

Welcome message from author
This document is posted to help you gain knowledge. Please leave a comment to let me know what you think about it! Share it to your friends and learn new things together.
Transcript

DEFICIT ELIMINATION PLAN
FLINT COMMUNITY SCHOOL DISTRICT
APPROVED FEBRUARY 4, 2014 BYMICHIGAN DEPARTMENT OF EDUCATION

NO
YES
NO
YES
NO
YES
Step 1: Complete Contact Worksheet.
Step 2: Input Local Revenue data for deficit year and estimates for current and subsequent years to calculate effect on
General Fund.
Step 4: Input membership, foundation, taxable value, and Spec. Ed. Data for 2013-2014 to calculate 2013-14 State Foundation effect on General Fund.
Step 7: Input applicable State funded program data for deficit year and estimates for current year and subsequent years to calculate Total State Revenue effect on
General Fund.
Step 8: Input applicable Federal funded program data for deficit year and
estimates for current year and subsequent years to calculate Federal Revenue effect
on General Fund.
Step 9: Input Instruction expenditure data for deficit year and target expenditure data for current year and subsequent years to calculate Instruction effect on General
Fund.
Step 11: Input Support expenditure data for deficit year and target expenditure data for current year and subsequent years to
calculate Support effect on General Fund.
Step 10: Input details of change in instruction expenditures to calculate
Instruction Change.
Do totals from Instruction Change equal difference column from Instruction?
Step 12: Input details of change in support expenditures to calculate Support
Change.
Do totals from Support Change equal difference column from Support?
Step 13: Input all missing items on DEP, including beginning fund balance, Revenue
from Other Political Subdivisions, and Incoming Transfers.
Step 5: Input estimated membership, foundation, taxable value, and Spec. Ed. Data for 2014-2015 to calculate 2014-15
State Foundation effect on General Fund.
Is the ending fund balance (Line 29) (Cell Q32) a non-
negative number?
Step 13b: Return to previous steps and establish revenue increases or
expenditure reductions in order to yield non-negative ending fund balance. Step 14: Complete a Budgetary Control
Report for each Month until the deficit elimination process is completed or a new
plan is approved by MDE.
Step 3: Input membership, foundation, taxable value, and Spec. Ed. Data for 2012-2013 to calculate 2012-13 State Foundation effect on General Fund.
Step 6: Input estimated membership, foundation, taxable value, and Spec. Ed. Data for 2015-2016 to calculate 2015-16
State Foundation effect on General Fund. Continue as needed.

FCS DEP (2014.0204).xls Page 3 of 26 2/9/2015
District InformationDistrict Name School District City of FlintDistrict Code 25010Address 923 E Kearsley St., Flint MI 48503Superintendent InformationName Larry Watkins, Interim SuperintendentEmail Address [email protected] Phone (810) 760-1249 Cell Business Manager InformationName Jawun Nelson, BBA, MBA, Acting CFOEmail Address [email protected] Phone (810) 767-6138 Cell Board President InformationName Antoinette LockettEmail Address [email protected] Phone (810) 760-1249 Cell Union President InformationName Ethel Johnson-UTF PresidentEmail Address [email protected] Phone (810) 733-7800 Cell

Local Revenue Worksheet Table I
FCS DEP (2014.0204).xls Page 4 of 26 2/9/2015
1 Local Revenue WorksheetPreliminary Actual
2012-13 Budgeted 2013-14 Diff Estimated 2014-15 Diff Estimated 2015-16 Diff Estimated 2016-17 Diff Estimated 2017-18 Diff Explanations for Variance > 20%2 General Millage (111)(114)(12x) 8,061,684.00 7,458,145.00 -7.49% 7,458,145.00 0.00% 7,458,145.00 0.00% 7,458,145.00 0.00% 7,458,145.00 0.00%
3 Penalties and Int Earned on Tax (119) 53,192.00 0.00 -100.00% 0.00 NA 0.00 NA 0.00 NA 0.00 NA4 Tuition from Individuals (13x) 17,827.00 11,905.00 -33.22% 11,905.00 0.00% 11,905.00 0.00% 11,905.00 0.00% 11,905.00 0.00%5 Transport from Individuals (14x) 0.00 800.00 NA 800.00 0.00% 800.00 0.00% 800.00 0.00% 800.00 0.00%6 Earnings on Investments (15x) 73,209.00 73,209.00 0.00% 73,209.00 0.00% 73,209.00 0.00% 73,209.00 0.00% 73,209.00 0.00%7 Revenue from Student Activities (17x) 83,199.00 72,000.00 -13.46% 50,000.00 -30.56% 50,000.00 0.00% 50,000.00 0.00% 50,000.00 0.00%8 Community Service Revenue (18x) 584,472.00 446,429.00 -23.62% 308,387.00 -30.92% 308,387.00 0.00% 308,387.00 0.00% 308,387.00 0.00%9 Rentals (191) 87,287.00 73,844.00 -15.40% 70,330.00 -4.76% 70,330.00 0.00% 70,330.00 0.00% 70,330.00 0.00%
10 Private Donations (192) 279,391.00 279,391.00 0.00% 279,391.00 0.00% 279,391.00 0.00% 279,391.00 0.00% 279,391.00 0.00%11 Other Misc, Local (16x, 199) 1,254,516.00 704,102.00 -43.87% 598,516.00 -15.00% 598,516.00 0.00% 598,516.00 0.00% 598,516.00 0.00%
12Total Local (1xx) This will populate the DEP Line 3 10,494,777.00 9,119,825.00 8,850,683.00 8,850,683.00 0.00% 8,850,683.00 0.00% 8,850,683.00 0.00%
13 Other School District Tuition (511) 0.00 0.00 NA 0.00 NA 0.00 NA 0.00 NA 0.00 NA14 Other School District Transport (512) 0 0.00 -100.00% 0.00 NA 0.00 NA 0.00 NA 0.00 NA15 ISD Collected Millage (513) 2,842,802.00 2,797,879.00 #REF! 2,797,879.00 0.00% 2,797,879.00 0.00% 2,797,879.00 0.00% 2,797,879.00 0.00%
16Compensation for Services Provided to Other Public Schools (518) -100.00% 0.00 NA 0.00 NA 0.00 NA 0.00 NA
17Other Distributions from Other Public Schools (519) 331,365.00 600,000.00 #REF! 608,803.00 1.47% 608,803.00 0.00% 608,803.00 0.00% 608,803.00 0.00%
18Total from other Public Sch (51x) This will populate the DEP line 4 3,174,167.00 3,397,879.00 3,406,682.00 3,406,682.00 0.00% 3,406,682.00 0.00% 3,406,682.00 0.00%
19 Other - Please Explain 0.00 0.00 NA NA NA 0.00 NA 0.00 NA
20
Total General Fund*This should be consistent with GF DEP Local and Other Public School Revenue 13,668,944.00 12,517,704.00 -8.42% 12,257,365.00 -2.08% 12,257,365.00 0.00% 12,257,365.00 0.00% 12,257,365.00 0.00%
Notes:Line 11 Other Misc includes:Printing services 211,033 105,516Misc receipts 598,516 598,516 598,516 598,516 598,516 598,516Indirect costs 444,484 Line 8 includes:Sarvis Center income 276,085 138,042Child care revenue 308,387 308,387 308,387 308,387 308,387 308,387

FCS DEP (2014.0204).xls Page 5 of 26 2/9/2015
State Aid Calculation 2012-13Membership:
Spring 2012 GE FTE 8,642.34 (A1) SRSD Spring GE Membership FTEFall 2012 GE FTE 7,907.29 (A2) SRSD Fall GE Membership FTE Blended GE FTE 7,980.80 (A3) 10% Spring GE FTE(A1) + 90% Fall GE FTE(A2)Spring 2012 SE FTE 452.63 (B1) SRSD Spring SE Membership FTEFall 2012 SE FTE 365.90 (B2) SRSD Fall SE Membership FTE Blended SE FTE 374.57 (B3) 10% Spring SE FTE(B1) + 90% Fall SE FTE(B2)Total FTE BLEND 8,355.37 C Add GE blend (A3) + SE blend (B3)
Taxable Value InformationNon-PRE Taxable Value 457,482,062.00$ (D1) Enter Current Non-PRE Value from Status ReportMillage Rate 0.018 EComm. PP Taxable Value $44,173,600.00 (D2) Enter Current Comm PP Value from Status ReportMillage Rate 0.006 F
Local Revenue From Millage 8,499,718.716 G
This should be consistent with amount reported on the Local Revenue Worksheet under Major Class 111 (Line 2, Column F)
Foundation Information2013 Foundation Allowance $7,465.00 (H1)Maximum 2013 Fdtn 8,019.00$ (H2)State Share ((lesser of H1,H2)-(G/A3))) 6,399.98$ (I)
Foundation Allowance - Local Share of Foundation Allowance
Local Share (G/A3) 1,065.02$ (J)NH Property Value times Millage Rate divided by GE FTE Blend
1995 Foundation Allowance $5,751.79 (K1)Maximum 1995 Fdtn. 6,500.00$ (K2)State Share of 1995 ((lesser of K1, K2)-(G/C))) 4,734.51$ (L)
NH Property Value times Millage Rate divided by Total FTE Blend
SE ObligationSE Costs $18,199,323.00 (M1) Estimated SE4096SE Transportation Costs $2,403,182.00 (M2) Estimated SE4094
1997 Section 52 $1,455,401.36 (M3)Information Available on State Aid Aid Website http://www.michigan.gov/documents/sehh_79613_7.xls
1997 Section 58 $454,287.89 (M4)Information Available on State Aid Aid Website http://www.michigan.gov/documents/sehh_79613_7.xls
Original SE Hold Harmless Amt. 1,909,689.25 (M5) Original SE Hold Harmless Amt.
Current SE Costs (M1) x.0633359998 1,152,672.32 (M6) Current cost x rate used to determine FY97 amountAdjusted Sect. 52 HH level 1,152,672.32 (M7) lesser of M3 & M6
Current SE trans cost (M2) x .704165 1,692,236.65 (M8) Current cost x rate used to determine FY97 amountAdjusted Sect. 58 HH level 454,287.89 (M9) lesser of M4 & M8Adjusted SEHH level 1,606,960.21 (M10) SE Hold Harmless Amt.
Calculations:CY Calculation Info:Section 20 (L x A3) 51,076,928.38 N1 CY State Share Times GE Blend FTEAdj for GE Non Residents -6,712.87 N2 Estimated Adj. For Non ResidentTotal Section 20 GE Fndtn. 51,070,215.51 N3 (N1+N2)SE Fdtn. (lesser of H1, H2 xB3) 2,796,187.45 O1 CY Foundation Times SE Blend FTEAdj for SE Non Residents -1,426.91 O2 Estimated Adj. For Non ResidentTotal SE Fndtn. 2,794,760.54 O3 (O1+O2)
51a Special Ed Costs *.286138 5,207,517.88 P1 State Obligation for Special Education Costs
51a Special Ed Trans Cost *.704165 1,692,236.65 P2 State Obligation for Special Education Transportation
State Obligation for SE Costs 6,899,754.54 P3 Total of P1 + P2
Section 51.a3 Hold HarmlessDifference between (M5- (P3-O3)) or 0 if negative $0.00 P4Total CY State Fdtn & SE Oblig.((N3+O3)+(P3-O1)+(P4) 57,969,970.05 Q
Breakdown of Foundation and SE Obligation
Section 22a - Proposal A (L*C) 39,558,573.35 R Proposal A ObligationSection 51c (P3) 6,899,754.54 (P3) Special Education Obligation based on SE CostsSection 22b (Q-R-P3) 11,511,642.16 S Discretionary Payment
Notes:

FCS DEP (2014.0204).xls Page 6 of 26 2/9/2015
State Aid Calculation 2013-14Membership:
Fall 2013 GE FTE 6,711.00 (A1) SRSD Fall GE Membership FTESpring 2014 GE FTE 6,711.00 (A2) SRSD Spring GE Membership FTE Blended GE FTE 6,711.00 (A3) 90% Fall GE FTE(A1) + 10% Spring GE FTE(A2)Fall 2013 SE FTE 338.00 (B1) SRSD Fall SE Membership FTESpring 2014 SE FTE 338.00 (B2) SRSD Spring SE Membership FTE Blended SE FTE 338.00 (B3) 90% Fall SE FTE(B1) + 10% Spring SE FTE(B2)Total FTE BLEND 7,049.00 C Add GE blend (A3) + SE blend (B3)
Taxable Value InformationNon-PRE Taxable Value 399,869,372.00$ (D1) Enter Current Non-PRE Value from Status ReportMillage Rate 0.018 EComm. PP Taxable Value 43,416,000.00$ (D2) Enter Current Comm PP Value from Status ReportMillage Rate 0.006 F
Local Revenue From Millage 7,458,144.696 G
This should be consistent with amount reported on the Local Revenue Worksheet under Major Class 111 (Line 2, Column H)
Foundation Information2014 Foundation Allowance 7,516.00$ (H1) 2011 Foundation AllowanceMaximum 2014 Fdtn 8,019.00$ (H2) Maximum 2011 FdtnState Share ((lesser of H1,H2)-(G/A3))) 6,404.67$ (I)
Foundation Allowance - Local Share of Foundation Allowance
Local Share (G/A3) 1,111.33$ (J)NH Property Value times Millage Rate (D1*E+D2*F) divided by GE FTE Blend
1995 Foundation Allowance 5,751.79$ (K1) 1995 Foundation AllowanceMaximum 1995 Fdtn. 6,500.00$ (K2) Maximum 1995 Fdtn.State Share of 1995 ((lesser of K1, K2)-(G/C))) 4,693.75$ (L)
NH Property Value times Millage Rate (D1*E+D2*F) divided by Total FTE Blend
SE ObligationSE Costs 18,199,323.00$ (M1) Estimated SE4096SE Transportation Costs 2,403,182.00$ (M2) Estimated SE4094
1997 Section 52 1,455,401.36$ (M3)Information Available on State Aid Aid Website http://www.michigan.gov/documents/sehh_79613_7.xls
1997 Section 58 454,287.89$ (M4)Information Available on State Aid Aid Website http://www.michigan.gov/documents/sehh_79613_7.xls
Original SE Hold Harmless Amt. 1,909,689.25 (M5) Original SE Hold Harmless Amt.
Current SE Costs (M1) x.0633359998 1,152,672.32 (M6) Current cost x rate used to determine FY97 amountAdjusted Sect. 52 HH level 1,152,672.32 (M7) lesser of M3 & M6
Current SE trans cost (M2) x .704165 1,692,236.65 (M8) Current cost x rate used to determine FY97 amountAdjusted Sect. 58 HH level 454,287.89 (M9) lesser of M4 & M8Adjusted SEHH level 1,606,960.21 (M10) SE Hold Harmless Amt.
Calculations:CY Calculation Info:Section 20 (L x A3) 42,981,740.37 N1 CY State Share Times GE Blend FTEAdj for GE Non Residents -10,735.06 N2 Estimated Adj. For Non ResidentTotal Section 20 GE Fndtn. 42,971,005.31 N3 (N1+N2)SE Fdtn. (lesser of H1, H2 xB3) 2,540,408.00 O1 CY Foundation Times SE Blend FTEAdj for SE Non Residents -2,378.48 O2 Estimated Adj. For Non ResidentTotal SE Fndtn. 2,538,029.52 O3 (O1+O2)
51a Special Ed Costs *.286138 5,207,517.88 P1 State Obligation for Special Education Costs
51a Special Ed Trans Cost *.704165 1,692,236.65 P2 State Obligation for Special Education Transportation
State Obligation for SE Costs 6,899,754.54 P3 Total of P1 + P2
Section 51.a3 Hold HarmlessDifference between (M5- (P3-O3)) or 0 if negative $0.00 P4Total CY State Fdtn & SE Oblig.((N3+O3)+(P3-O1)+(P4) 49,870,759.85 Q
Breakdown of Foundation and SE Obligation
Section 22a - Proposal A (L*C) 33,086,243.75 R Proposal A ObligationSection 51c (P3) 6,899,754.54 (P3) Special Education Obligation based on SE CostsSection 22b (Q-R-P3) 9,884,761.56 S Discretionary Payment
Notes:

FCS DEP (2014.0204).xls Page 7 of 26 2/9/2015
State Aid Calculation 2014-15Membership:
Fall 2014 GE FTE 6,420.00 (A1) SRSD Fall GE Membership FTESpring 2015 GE FTE 6,420.00 (A2) SRSD Spring GE Membership FTE Blended GE FTE 6,420.00 (A3) 90% Fall GE FTE(A1) + 10% Spring GE FTE(A2)Fall 2014 SE FTE 306.00 (B1) SRSD Fall SE Membership FTESpring 2015 SE FTE 306.00 (B2) SRSD Spring SE Membership FTE Blended SE FTE 306.00 (B3) 90% Fall SE FTE(B1) + 10% Spring SE FTE(B2)Total FTE BLEND 6,726.00 C Add GE blend (A3) + SE blend (B3)
Taxable Value InformationNon-PRE Taxable Value 399,869,372.00$ (D1) Enter Current Non-PRE Value from Status ReportMillage Rate 0.018 EComm. PP Taxable Value 43,416,000.00$ (D2) Enter Current Comm PP Value from Status ReportMillage Rate 0.006 F
Local Revenue From Millage 7,458,144.696 GThis should be consistent with amount reported on the Local Revenue Worksheet under Major Class 111 (Line 2, Column H)
Foundation Information2015 Foundation Allowance 7,516.00$ (H1) 2012 Foundation AllowanceMaximum 2015 Fdtn 8,019.00$ (H2) Maximum 2012 FdtnState Share ((lesser of H1,H2)-(G/A3))) 6,354.30$ (I) Foundation Allowance - Local Share of Foundation Allowance
Local Share (G/A3) 1,161.70$ (J)NH Property Value times Millage Rate (D1*E+D2*F) divided by GE FTE Blend
1995 Foundation Allowance 5,751.79$ (K1) 1995 Foundation AllowanceMaximum 1995 Fdtn. 6,500.00$ (K2) Maximum 1995 Fdtn.State Share of 1995 ((lesser of K1, K2)-(G/C))) 4,642.94$ (L)
NH Property Value times Millage Rate (D1*E+D2*F) divided by Total FTE Blend
SE ObligationSE Costs 18,199,323.00$ (M1) Estimated from Prior Year SE4096SE Transportation Costs 2,403,182.00$ (M2) Estimated from Prior Year SE4094
1997 Section 52 1,455,401.36$ (M3)Information Available on State Aid Aid Website http://www.michigan.gov/documents/sehh_79613_7.xls
1997 Section 58 454,287.89$ (M4)Information Available on State Aid Aid Website http://www.michigan.gov/documents/sehh_79613_7.xls
Original SE Hold Harmless Amt. 1,909,689.25 (M5) Original SE Hold Harmless Amt.
Current SE Costs (M1) x.0633359998 1,152,672.32 (M6) Current cost x rate used to determine FY97 amountAdjusted Sect. 52 HH level 1,152,672.32 (M7) lesser of M3 & M6
Current SE trans cost (M2) x .704165 1,692,236.65 (M8) Current cost x rate used to determine FY97 amountAdjusted Sect. 58 HH level 454,287.89 (M9) lesser of M4 & M8Adjusted SEHH level 1,606,960.21 (M10) SE Hold Harmless Amt.
Calculations:CY Calculation Info:Section 20 (L x A3) 40,794,606.00 N1 CY State Share Times GE Blend FTEAdj for GE Non Residents -10,735.06 N2 Estimated Adj. For Non ResidentTotal Section 20 GE Fndtn. 40,783,870.94 N3 (N1+N2)SE Fdtn. (lesser of H1, H2 xB3) 2,299,896.00 O1 CY Foundation Times SE Blend FTEAdj for SE Non Residents -2,378.48 O2 Estimated Adj. For Non ResidentTotal SE Fndtn. 2,297,517.52 O3 (O1+O2)
51a Special Ed Costs *.286138 5,207,517.88 P1 State Obligation for Special Education Costs
51a Special Ed Trans Cost *.704165 1,692,236.65 P2 State Obligation for Special Education Transportation
State Obligation for SE Costs 6,899,754.54 P3 Total of P1 + P2
Section 51.a3 Hold HarmlessDifference between (M5- (P3-O3)) or 0 if negative $0.00 P4Total CY State Fdtn & SE Oblig.((N3+O3)+(P3-O1)+(P4) 47,683,625.48 Q
Breakdown of Foundation and SE Obligation
Section 22a - Proposal A (L*C) 31,228,414.44 R Proposal A ObligationSection 51c (P3) 6,899,754.54 (P3) Special Education Obligation based on SE CostsSection 22b (Q-R-P3) 9,555,456.50 S Discretionary Payment
Notes:
FCS DEP (2014.0204).xls Page 8 of 26 2/9/2015
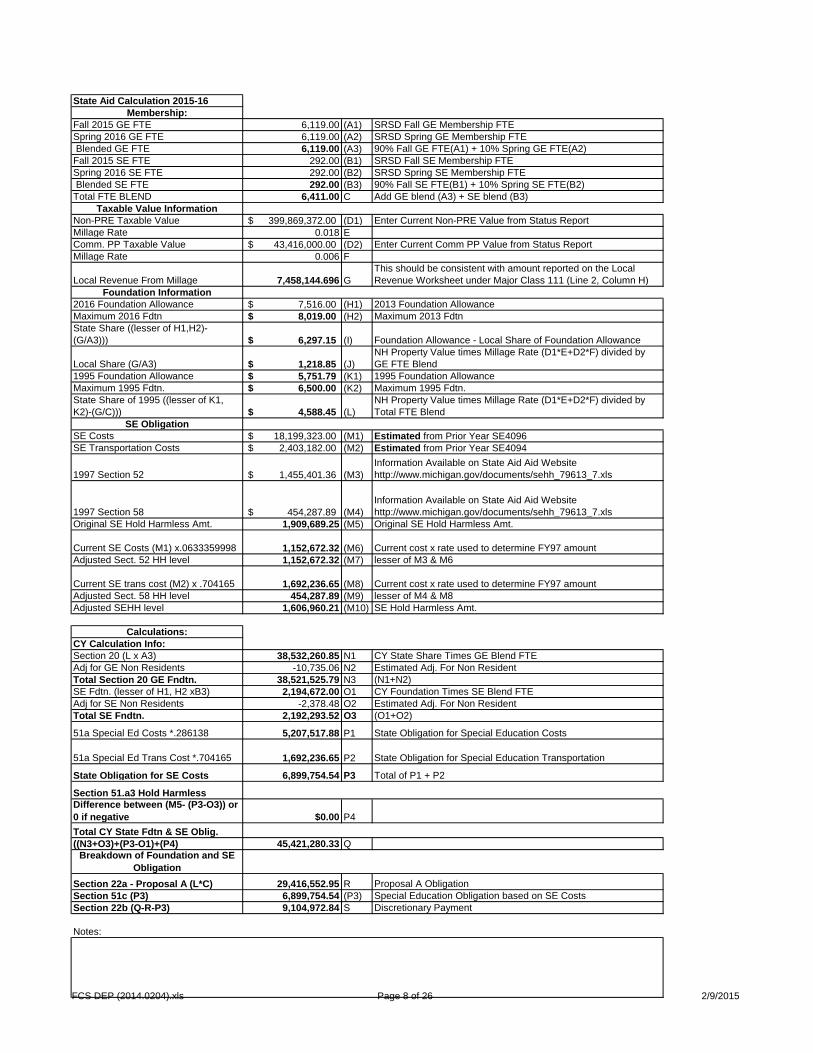
State Aid Calculation 2015-16Membership:
Fall 2015 GE FTE 6,119.00 (A1) SRSD Fall GE Membership FTESpring 2016 GE FTE 6,119.00 (A2) SRSD Spring GE Membership FTE Blended GE FTE 6,119.00 (A3) 90% Fall GE FTE(A1) + 10% Spring GE FTE(A2)Fall 2015 SE FTE 292.00 (B1) SRSD Fall SE Membership FTESpring 2016 SE FTE 292.00 (B2) SRSD Spring SE Membership FTE Blended SE FTE 292.00 (B3) 90% Fall SE FTE(B1) + 10% Spring SE FTE(B2)Total FTE BLEND 6,411.00 C Add GE blend (A3) + SE blend (B3)
Taxable Value InformationNon-PRE Taxable Value 399,869,372.00$ (D1) Enter Current Non-PRE Value from Status ReportMillage Rate 0.018 EComm. PP Taxable Value 43,416,000.00$ (D2) Enter Current Comm PP Value from Status ReportMillage Rate 0.006 F
Local Revenue From Millage 7,458,144.696 GThis should be consistent with amount reported on the Local Revenue Worksheet under Major Class 111 (Line 2, Column H)
Foundation Information2016 Foundation Allowance 7,516.00$ (H1) 2013 Foundation AllowanceMaximum 2016 Fdtn 8,019.00$ (H2) Maximum 2013 FdtnState Share ((lesser of H1,H2)-(G/A3))) 6,297.15$ (I) Foundation Allowance - Local Share of Foundation Allowance
Local Share (G/A3) 1,218.85$ (J)NH Property Value times Millage Rate (D1*E+D2*F) divided by GE FTE Blend
1995 Foundation Allowance 5,751.79$ (K1) 1995 Foundation AllowanceMaximum 1995 Fdtn. 6,500.00$ (K2) Maximum 1995 Fdtn.State Share of 1995 ((lesser of K1, K2)-(G/C))) 4,588.45$ (L)
NH Property Value times Millage Rate (D1*E+D2*F) divided by Total FTE Blend
SE ObligationSE Costs 18,199,323.00$ (M1) Estimated from Prior Year SE4096SE Transportation Costs 2,403,182.00$ (M2) Estimated from Prior Year SE4094
1997 Section 52 1,455,401.36$ (M3)Information Available on State Aid Aid Website http://www.michigan.gov/documents/sehh_79613_7.xls
1997 Section 58 454,287.89$ (M4)Information Available on State Aid Aid Website http://www.michigan.gov/documents/sehh_79613_7.xls
Original SE Hold Harmless Amt. 1,909,689.25 (M5) Original SE Hold Harmless Amt.
Current SE Costs (M1) x.0633359998 1,152,672.32 (M6) Current cost x rate used to determine FY97 amountAdjusted Sect. 52 HH level 1,152,672.32 (M7) lesser of M3 & M6
Current SE trans cost (M2) x .704165 1,692,236.65 (M8) Current cost x rate used to determine FY97 amountAdjusted Sect. 58 HH level 454,287.89 (M9) lesser of M4 & M8Adjusted SEHH level 1,606,960.21 (M10) SE Hold Harmless Amt.
Calculations:CY Calculation Info:Section 20 (L x A3) 38,532,260.85 N1 CY State Share Times GE Blend FTEAdj for GE Non Residents -10,735.06 N2 Estimated Adj. For Non ResidentTotal Section 20 GE Fndtn. 38,521,525.79 N3 (N1+N2)SE Fdtn. (lesser of H1, H2 xB3) 2,194,672.00 O1 CY Foundation Times SE Blend FTEAdj for SE Non Residents -2,378.48 O2 Estimated Adj. For Non ResidentTotal SE Fndtn. 2,192,293.52 O3 (O1+O2)
51a Special Ed Costs *.286138 5,207,517.88 P1 State Obligation for Special Education Costs
51a Special Ed Trans Cost *.704165 1,692,236.65 P2 State Obligation for Special Education Transportation
State Obligation for SE Costs 6,899,754.54 P3 Total of P1 + P2
Section 51.a3 Hold HarmlessDifference between (M5- (P3-O3)) or 0 if negative $0.00 P4Total CY State Fdtn & SE Oblig.((N3+O3)+(P3-O1)+(P4) 45,421,280.33 Q
Breakdown of Foundation and SE Obligation
Section 22a - Proposal A (L*C) 29,416,552.95 R Proposal A ObligationSection 51c (P3) 6,899,754.54 (P3) Special Education Obligation based on SE CostsSection 22b (Q-R-P3) 9,104,972.84 S Discretionary Payment
Notes:

FCS DEP (2014.0204).xls Page 9 of 26 2/9/2015
State Aid Calculation 2016-17Membership:
Fall 2016 GE FTE 5,848.00 (A1) SRSD Fall GE Membership FTESpring 2017 GE FTE 5,848.00 (A2) SRSD Spring GE Membership FTE Blended GE FTE 5,848.00 (A3) 90% Fall GE FTE(A1) + 10% Spring GE FTE(A2)Fall 2016 SE FTE 279.00 (B1) SRSD Fall SE Membership FTESpring 2017 SE FTE 279.00 (B2) SRSD Spring SE Membership FTE Blended SE FTE 279.00 (B3) 90% Fall SE FTE(B1) + 10% Spring SE FTE(B2)Total FTE BLEND 6,127.00 C Add GE blend (A3) + SE blend (B3)
Taxable Value InformationNon-PRE Taxable Value 399,869,372.00$ (D1) Enter Current Non-PRE Value from Status ReportMillage Rate 0.018 EComm. PP Taxable Value 43,416,000.00$ (D2) Enter Current Comm PP Value from Status ReportMillage Rate 0.006 F
Local Revenue From Millage 7,458,144.696 GThis should be consistent with amount reported on the Local Revenue Worksheet under Major Class 111 (Line 2, Column H)
Foundation Information2017 Foundation Allowance 7,516.00$ (H1) 2014 Foundation AllowanceMaximum 2017 Fdtn 8,019.00$ (H2) Maximum 2014 FdtnState Share ((lesser of H1,H2)-(G/A3))) 6,240.67$ (I) Foundation Allowance - Local Share of Foundation Allowance
Local Share (G/A3) 1,275.33$ (J)NH Property Value times Millage Rate (D1*E+D2*F) divided by GE FTE Blend
1995 Foundation Allowance 5,751.79$ (K1) 1995 Foundation AllowanceMaximum 1995 Fdtn. 6,500.00$ (K2) Maximum 1995 Fdtn.State Share of 1995 ((lesser of K1, K2)-(G/C))) 4,534.53$ (L)
NH Property Value times Millage Rate (D1*E+D2*F) divided by Total FTE Blend
SE ObligationSE Costs 18,199,323.00$ (M1) Estimated from Prior Year SE4096SE Transportation Costs 2,403,182.00$ (M2) Estimated from Prior Year SE4094
1997 Section 52 1,455,401.36$ (M3)Information Available on State Aid Aid Website http://www.michigan.gov/documents/sehh_79613_7.xls
1997 Section 58 454,287.89$ (M4)Information Available on State Aid Aid Website http://www.michigan.gov/documents/sehh_79613_7.xls
Original SE Hold Harmless Amt. 1,909,689.25 (M5) Original SE Hold Harmless Amt.
Current SE Costs (M1) x.0633359998 1,152,672.32 (M6) Current cost x rate used to determine FY97 amountAdjusted Sect. 52 HH level 1,152,672.32 (M7) lesser of M3 & M6
Current SE trans cost (M2) x .704165 1,692,236.65 (M8) Current cost x rate used to determine FY97 amountAdjusted Sect. 58 HH level 454,287.89 (M9) lesser of M4 & M8Adjusted SEHH level 1,606,960.21 (M10SE Hold Harmless Amt.
Calculations:CY Calculation Info:Section 20 (L x A3) 36,495,438.16 N1 CY State Share Times GE Blend FTEAdj for GE Non Residents -10,735.06 N2 Estimated Adj. For Non ResidentTotal Section 20 GE Fndtn. 36,484,703.10 N3 (N1+N2)SE Fdtn. (lesser of H1, H2 xB3) 2,096,964.00 O1 CY Foundation Times SE Blend FTEAdj for SE Non Residents -2,378.48 O2 Estimated Adj. For Non ResidentTotal SE Fndtn. 2,094,585.52 O3 (O1+O2)
51a Special Ed Costs *.286138 5,207,517.88 P1 State Obligation for Special Education Costs
51a Special Ed Trans Cost *.704165 1,692,236.65 P2 State Obligation for Special Education Transportation
State Obligation for SE Costs 6,899,754.54 P3 Total of P1 + P2
Section 51.a3 Hold HarmlessDifference between (M5- (P3-O3)) or 0 if negative $0.00 P4Total CY State Fdtn & SE Oblig.((N3+O3)+(P3-O1)+(P4) 43,384,457.64 Q
Breakdown of Foundation and SE Obligation
Section 22a - Proposal A (L*C) 27,783,065.31 R Proposal A ObligationSection 51c (P3) 6,899,754.54 (P3) Special Education Obligation based on SE CostsSection 22b (Q-R-P3) 8,701,637.79 S Discretionary Payment
Notes:

FCS DEP (2014.0204).xls Page 10 of 26 2/9/2015
State Aid Calculation 2017-18Membership:
Fall 2017 GE FTE 5,630.00 (A1) SRSD Fall GE Membership FTESpring 2018 GE FTE 5,630.00 (A2) SRSD Spring GE Membership FTE Blended GE FTE 5,630.00 (A3) 90% Fall GE FTE(A1) + 10% Spring GE FTE(A2)Fall 2017 SE FTE 269.00 (B1) SRSD Fall SE Membership FTESpring 2018 SE FTE 269.00 (B2) SRSD Spring SE Membership FTE Blended SE FTE 269.00 (B3) 90% Fall SE FTE(B1) + 10% Spring SE FTE(B2)Total FTE BLEND 5,899.00 C Add GE blend (A3) + SE blend (B3)
Taxable Value InformationNon-PRE Taxable Value 399,869,372.00$ (D1) Enter Current Non-PRE Value from Status ReportMillage Rate 0.018 EComm. PP Taxable Value 43,416,000.00$ (D2) Enter Current Comm PP Value from Status ReportMillage Rate 0.006 F
Local Revenue From Millage 7,458,144.696 GThis should be consistent with amount reported on the Local Revenue Worksheet under Major Class 111 (Line 2, Column H)
Foundation Information2018 Foundation Allowance 7,516.00$ (H1) 2015 Foundation AllowanceMaximum 2018 Fdtn 8,019.00$ (H2) Maximum 2015 FdtnState Share ((lesser of H1,H2)-(G/A3))) 6,191.29$ (I) Foundation Allowance - Local Share of Foundation Allowance
Local Share (G/A3) 1,324.71$ (J)NH Property Value times Millage Rate (D1*E+D2*F) divided by GE FTE Blend
1995 Foundation Allowance 5,751.79$ (K1) 1995 Foundation AllowanceMaximum 1995 Fdtn. 6,500.00$ (K2) Maximum 1995 Fdtn.State Share of 1995 ((lesser of K1, K2)-(G/C))) 4,487.48$ (L)
NH Property Value times Millage Rate (D1*E+D2*F) divided by Total FTE Blend
SE ObligationSE Costs 18,199,323.00$ (M1) Estimated from Prior Year SE4096SE Transportation Costs 2,403,182.00$ (M2) Estimated from Prior Year SE4094
1997 Section 52 1,455,401.36$ (M3)Information Available on State Aid Aid Website http://www.michigan.gov/documents/sehh_79613_7.xls
1997 Section 58 454,287.89$ (M4)Information Available on State Aid Aid Website http://www.michigan.gov/documents/sehh_79613_7.xls
Original SE Hold Harmless Amt. 1,909,689.25 (M5) Original SE Hold Harmless Amt.
Current SE Costs (M1) x.0633359998 1,152,672.32 (M6) Current cost x rate used to determine FY97 amountAdjusted Sect. 52 HH level 1,152,672.32 (M7) lesser of M3 & M6
Current SE trans cost (M2) x .704165 1,692,236.65 (M8) Current cost x rate used to determine FY97 amountAdjusted Sect. 58 HH level 454,287.89 (M9) lesser of M4 & M8Adjusted SEHH level 1,606,960.21 (M10SE Hold Harmless Amt.
Calculations:CY Calculation Info:Section 20 (L x A3) 34,856,962.70 N1 CY State Share Times GE Blend FTEAdj for GE Non Residents -10,735.06 N2 Estimated Adj. For Non ResidentTotal Section 20 GE Fndtn. 34,846,227.64 N3 (N1+N2)SE Fdtn. (lesser of H1, H2 xB3) 2,021,804.00 O1 CY Foundation Times SE Blend FTEAdj for SE Non Residents -2,378.48 O2 Estimated Adj. For Non ResidentTotal SE Fndtn. 2,019,425.52 O3 (O1+O2)
51a Special Ed Costs *.286138 5,207,517.88 P1 State Obligation for Special Education Costs
51a Special Ed Trans Cost *.704165 1,692,236.65 P2 State Obligation for Special Education Transportation
State Obligation for SE Costs 6,899,754.54 P3 Total of P1 + P2
Section 51.a3 Hold HarmlessDifference between (M5- (P3-O3)) or 0 if negative $0.00 P4Total CY State Fdtn & SE Oblig.((N3+O3)+(P3-O1)+(P4) 41,745,982.18 Q
Breakdown of Foundation and SE Obligation
Section 22a - Proposal A (L*C) 26,471,644.52 R Proposal A ObligationSection 51c (P3) 6,899,754.54 (P3) Special Education Obligation based on SE CostsSection 22b (Q-R-P3) 8,374,583.12 S Discretionary Payment
Notes:

Total State Revenue Table
FCS DEP (2014.0204).xls Page 11 of 26 2/9/2015
Other State Worksheet
2012-13 Per Most Recent State Aid
Status Report2013-14 Estimate SA Status Report Diff
Explanation for Difference > than 20%
2014-15 Estimate SA Status Report Diff
Explanation for Difference > than 20%
2015-16 Estimate SA Status
Report DiffExplanation for Difference > than 20%
2016-17 Estimate SA Status
Report DiffExplanation for Difference > than 20%
2017-18 Estimate SA Status
Report DiffExplanation for Difference > than 20%
1 School Lunch Related 254,399.00 260,009.00 2.21% 260,009.00 0.00% 260,009.00 0.00% 260,009.26 0.00% 0.00 260,009.26 0.00%
2Foundation (from SA Calc Worksheet Line R + Line S) 51,070,215.51 42,971,005.31 -15.86% 40,783,870.94 -5.09% 38,521,525.79 -5.55% 36,484,703.10 -5.29% 34,846,227.64 -4.49%
3Special Education (From SA Calc Worksheet Line P3 ) 6,899,754.54 6,899,754.54 0.00% 6,899,754.54 0.00% 6,899,754.54 0.00% 6,899,754.54 0.00% 6,899,754.54 0.00%
4 At Risk 4,177,338.00 3,901,830.00 -6.60% 3,658,944.00 -6.22% 3,487,584.00 -4.68% 3,333,088.00 -4.43% 3,209,056.00 -3.72%5 Math/Science 0.00 0.00 NA 0.00 NA 0.00 NA 0.00 NA 0.00 NA6 Renaissance Zone 330,663.00 363,055.96 9.80% 363,055.96 0.00% 363,055.96 0.00% 363,055.96 0.00% 363,055.96 0.00%7 Durant 0.00 0.00 NA 0.00 NA 0.00 NA 0.00 NA 0.00 NA8 Adult 481,287.00 509,751.98 5.91% 0.00 -100.00% 0.00 NA 0.00 NA 0.00 NA9 Career Tech 781,741.00 103,176.83 -86.80% 103,176.83 0.00% 103,176.83 0.00% 103,176.83 0.00% 103,176.83 0.00%
10 Headlee Obl./Data collection 204,855.00 177,339.00 -13.43% 203,265.64 14.62% 203,265.64 0.00% 203,265.64 0.00% 203,265.64 0.00%11 MPSERS Cost offset 1,639,834.00 809,798.00 -50.62% 809,798.00 0.00% 809,798.00 0.00% 809,798.00 0.00% 809,798.00 0.00%12 Best Practices incentive 455,597.00 367,692.00 -19.29% 349,752.00 -4.88% 333,372.00 -4.68% 318,604.00 -4.43% 306,748.00 -3.72%13 Other- Explain 5,460,091.00 4,072,854.00 -25.41% 4,072,854.00 0.00% 4,072,854.00 0.00% 4,072,854.00 0.00% 4,072,854.00 0.00%14 PY ADJ 0.00 0.00 NA 0.00 NA 0.00 NA 0.00 NA 0.00 NA
15Deferred State Revenue Utilized this Year 0.00 266,086.00 NA 0.00 -100.00% 0.00 NA 0.00 NA 0.00 0.00 NA
16
State Revenue Rec'd This Year,Deferred to future Year (Enter as negative) 0.00 0.00 NA 0.00 NA 0.00 NA 0.00 NA 0.00 NA
17
Total General Fund*This line will populate the DEP State Revenue Line 6 71,501,376.05 60,442,343.62 -2.02 57,244,471.91 -2.02 54,794,386.76 -0.04 52,588,300.07 -0.04 50,813,936.61 -0.03
18
Total All Funds*This should be consistent with the Audited Financial Statements 71,755,775.05 60,702,352.62 -15.40% 57,504,480.91 -5.27% 55,054,395.76 -4.26% 52,848,309.33 -4.01% 51,073,945.87 -3.36%
Notes:Line 13:Court placed 384,638Robotics 1,500Hold Harmless 447,616147© 2,980,628Special ed rule change 57,265GSRP 201,207

Federal Revenue Table
FCS DEP (2014.0204).xls Page 12 of 26 2/9/2015
Federal Revenues Preliminary
Actual 2012-13Budgeted 2013-
14 Diff Explanation for Difference > 20%Projected2014-15 Diff Explanation for Difference > 20%
Projected2015-16 Diff Explanation for Difference > 20%
Projected2016-17 Diff Explanation for Difference > 20%
Projected2017-18 Diff Explanation for Difference > 20%
1 School Lunch Related 4,194,689.00 4,075,447.00 -2.84% Decrease in students 3,337,019.00 -18.12% 3,337,019.00 0.00% 3,337,019.00 0.00% 3,337,019.00 0.00%2 Special Education 2,454,286.00 2,063,548.00 -15.92% 2,454,286.00 18.94% 2,454,286.00 0.00% 2,454,286.00 0.00% 2,454,286.00 0.00%3 IDEA Pre-School 122,141.00 102,352.00 -16.20% 122,141.00 19.33% 122,141.00 0.00% 122,141.00 0.00% 122,141.00 0.00%4 Medicaid 15,800.00 38,761.00 145.32% 38,761.00 0.00% 38,761.00 0.00% 38,761.00 0.00% 38,761.00 0.00%5 Non-Cluster Direct 88,309.00 0.00 -100.00% 0.00 NA 0.00 NA 0.00 NA 0.00 NA6 Title 1 11,616,334.00 14,938,688.00 28.60% 15,250,145.00 2.08% 15,250,145.00 0.00% 15,250,145.00 0.00% 15,250,145.00 0.00%7 Migrant 0.00 0.00 NA 0.00 NA 0.00 NA 0.00 NA 0.00 NA8 Title III 39,621.00 43,891.00 10.78% 83,513.00 90.27% 83,513.00 0.00% 83,513.00 0.00% 83,513.00 0.00%9 Title VI 0.00 0.00 NA 0.00 NA 0.00 NA 0.00 NA 0.00 NA
10 Safe and Drug-Free 0.00 0.00 NA 0.00 NA 0.00 NA 0.00 NA 0.00 NA11 Homeless 0.00 0.00 NA 0.00 NA 0.00 NA 0.00 NA 0.00 NA12 Emergency Immigration 0.00 0.00 NA 0.00 NA 0.00 NA 0.00 NA 0.00 NA13 Adult 186,975.00 750.00 -99.60% 0.00 -100.00% 0.00 NA 0.00 NA 0.00 NA14 Comprehensive School Reform 0.00 0.00 NA 0.00 NA 0.00 NA 0.00 NA 0.00 NA15 Vocational Education 0.00 296,092.00 NA 261,341.00 -11.74% 261,341.00 0.00% 261,341.00 0.00% 261,341.00 0.00%16 Technology Literacy 0.00 0.00 NA 0.00 NA 0.00 NA 0.00 NA 0.00 NA17 Reading First 0.00 0.00 NA 0.00 NA 0.00 NA 0.00 NA 0.00 NA18 Title II 2,417,204.00 3,962,302.00 63.92% 2,860,198.00 -27.81% 2,860,198.00 0.00% 2,860,198.00 0.00% 2,860,198.00 0.00%19 Headstart 5,302,324.00 1,425,864.00 -73.11% 1,425,864.00 0.00% 699,074.00 -50.97% 699,074.00 0.00% 699,074.00 0.00%20 Various Federal 1,861,404.00 1,477,818.00 -20.61% 1,477,818.00 0.00% 1,477,818.00 0.00% 1,477,818.00 0.00% 1,477,818.00 0.00%21 21st Century 1,612,771.00 1,672,907.00 3.73% 1,685,786.00 0.77% 1,685,786.00 0.00% 1,685,786.00 0.00% 1,685,786.00 0.00%22 Other 0.00 0.00 NA 230,945.00 NA 230,945.00 0.00% 230,945.00 0.00% 230,945.00 0.00%23 Deferred Federal Revenue 0.00 0.00 NA 0.00 NA 0.00 NA 0.00 NA 0.00 NA
24
Total General Fund*This will populate the DEP Federal Revenue Line 7 25,717,169.00 26,022,973.00 1.19% 25,890,798.00 -0.51% 25,164,008.00 -2.81% 25,164,008.00 0.00% 25,164,008.00 0.00%
25
Total All Funds*This should be consistent with SEFA Revenues 29,911,858.00 30,098,420.00 0.62% 29,227,817.00 -2.89% 28,501,027.00 -2.49% 28,501,027.00 0.00% 28,501,027.00 0.00%**Differences greater than 10% need to be explainedExplain - Breakdown to Various large grants in the Other Categories
Notes:

Instructional Summary
FCS DEP (2014.0204).xls Page 13 of 26 2/9/2015
Function Code
Preliminary Actual 2012-13
Budgeted2013-14 Difference
% Change
Estimated2014-15 Difference
% Change
Estimated2015-16 Difference
% Change
Estimated2016-17 Difference
% Change
Estimated2017-18 Difference
% Change
Basic Inst. 111-113 $33,838,765 $30,162,627 ($3,676,138) -10.9% $22,248,744 ($7,913,883) -26.2% $20,347,363 ($1,901,381) -8.5% $19,289,349 ($1,058,014) -5.2% $18,426,375 ($862,974) -4.5%Pre-School 118 $4,465,957 $1,865,022 ($2,600,935) -58.2% $1,766,989 ($98,033) -5.3% $1,758,291 ($8,698) -0.5% $1,743,069 ($15,222) -0.9% $1,734,371 ($8,698) -0.5%Summer School 119 $1,083,688 $746,078 ($337,610) -31.2% $751,122 $5,044 0.7% $747,454 ($3,668) -0.5% $741,034 ($6,420) -0.9% $737,366 ($3,668) -0.5%Special Ed. 122 $10,304,034 $9,715,740 ($588,294) -5.7% $8,646,102 ($1,069,638) -11.0% $8,601,477 ($44,625) -0.5% $8,523,383 ($78,094) -0.9% $8,478,758 ($44,625) -0.5%Othr Add Needs 125, 127 $9,057,594 $9,911,755 $854,161 9.4% $9,096,293 ($815,462) -8.2% $9,050,958 ($45,335) -0.5% $8,961,613 ($89,345) -1.0% $8,910,559 ($51,054) -0.6%Adult Ed. 13x $1,578,985 $1,215,183 ($363,802) -23.0% $5,719 ($1,209,464) -99.5% $0 ($5,719) -100.0% $0 $0 #DIV/0! $0 $0 #DIV/0!Total 1XX $60,329,023 $53,616,405 ($6,712,618) $42,514,969 ($11,101,436) $40,505,543 ($2,009,426) $39,258,448 ($1,247,095) $38,287,429 ($971,019)
Notes:

Details of Changes in the Isntruction Function from Prior Year
FCS DEP (2014.0204).xls Page 14 of 26 2/9/2015
2012-13 to 2013-14
Impact of Changes In Instructional SpendingBasic Inst
111-113,119 Pre School 118Summer School
119 Special Ed 122Other Added
Needs 125,127 Adult Ed 13x TotalLines 1-4 below refer to staffing cuts and should be entered as negative numbers
1 Staffing Decrease - # of Teaching FTE lost due to Attrition/Retirement -46.00 -4.00 -8.00 -58.002 Staffing Decrease - # of Teaching FTE lost due to Layoff -12.00 -50.50 -3.00 -65.503 Staffing Decrease - # of Other Non Teaching Classroom FTE Reduced 0.004 Salary Savings From Staffing Decrease -$3,832,976 -$2,563,086 -$284,262 -$636,489 $0 -$240,000 -$7,556,813
Lines 5-6 below refer to staffing additions and should be entered as positive numbers5 Staffing Increase - # of Teaching FTE added 0.00 0.00 0.00 0.00 10.00 0.00 10.006 Additional Salaries From Staffing Increase $0 $0 $0 $0 $803,515 $0 $803,5157 Change in MSPERS $0 $0 $0 $0 $0 $0 $08 Change in Health Care Insurance $0 $0 $0 $0 $0 $0 $09 Wage Increment $0 $0 $0 $0 $0 $0 $0
10 Unemployment Costs $156,838 $9,394 $3,962 $48,195 $50,646 $4,493 $273,52811 Workers Compensation $0 $0 $0 $0 $0 $0 $012 Wage Concessions $0 $0 $0 $0 $0 $0 $013 One Time School Closure Allocation $0 $0 $0 $0 $0 $0 $014 Change in Purchased Services, Supplies and Textbooks $0 -$47,243 -$57,310 $0 $0 $0 -$104,55315 Change in Capital Outlay $0 $0 $0 $0 $0 $0 $016 Program Costs $0 $0 $0 $0 $0 -$128,295 -$128,29517 Dual Enrollment $0 $0 $0 $0 $0 $0 $018 Second Chance Alternative Program $0 $0 $0 $0 $0 $0 $019 Other $0 $020 Other $0 $021 Other $0 $022 Other $0 $023 Other $0 $024 Total -$3,676,138 -$2,600,935 -$337,610 -$588,294 $854,161 -$363,802 -$6,712,618
Check Figure from Instruction tab Column E -$3,676,138 -$2,600,935 -$337,610 -$588,294 $854,161 -$363,802 -$6,712,618Difference (needs to be zero) $0 $0 $0 $0 $0 $0 $0
Notes:Savings from staffing decrease: Salaries -2645432 (1,768,983.00) -214635 (439,290.00) -165643FICA & Retirement -859209 (574,548.00) -69627 (142,677.00) -53799Insurances -328335 (219,555.00) (54,522.00) -20558Total budgeted unemployment expense = $1,050,000 (billed and paid on a calendar year basis)
* Narrative Section should explain any partial year implementation disparities.

Details of Changes in the Isntruction Function from Prior Year
FCS DEP (2014.0204).xls Page 15 of 26 2/9/2015
2013-14 to 2014-15
Impact of Changes In Instructional SpendingBasic Inst
111-113,119 Pre School 118Summer School
119 Special Ed 122Other Added
Needs 125,127 Adult Ed 13x TotalLines 1-4 below refer to staffing cuts and should be entered as negative numbers
1 Staffing Decrease - # of Teaching FTE lost due to Attrition/Retirement 0.00 0.00 0.00 0.00 0.00 0.00 0.002 Staffing Decrease - # of Teaching FTE lost due to Layoff -55.00 0.00 0.00 0.00 0.00 -10.00 -65.003 Staffing Decrease - # of Other Non Teaching Classroom FTE Reduced 0.00 0.00 0.00 0.00 0.00 0.00 0.004 Salary Savings From Staffing Decrease -$4,398,815 $0 $0 $0 $0 -$800,000 -$5,198,815
Lines 5-6 below refer to staffing additions and should be entered as positive numbers5 Staffing Increase - # of Teaching FTE added 0.00 0.00 0.00 0.00 0.00 0.00 0.006 Additional Salaries From Staffing Increase $0 $0 $0 $0 $0 $0 $07 Change in MSPERS $0 $0 $0 $0 $0 $0 $08 Change in Health Care Insurance $0 $0 $0 $0 $0 $0 $09 Wage Increment $0 $0 $0 $0 $0 $0 $0
10 Unemployment Costs $199,678 $11,960 $5,044 $61,360 $64,480 $5,719 $348,24111 Workers Compensation $0 $0 $0 $0 $0 $0 $012 Wage Concessions -$3,464,746 -$109,993 $0 -$1,130,998 -$879,942 $0 -$5,585,67913 One Time School Closure Allocation $0 $0 $0 $0 $0 $0 $014 Change in Purchased Services, Supplies and Textbooks $0 $0 $0 $0 $0 $0 $015 Change in Capital Outlay $0 $0 $0 $0 $0 $0 $016 Program Costs $0 $0 $0 $0 $0 -$415,183 -$415,18317 Dual Enrollment $0 $0 $0 $0 $0 $0 $018 Second Chance Alternative Program $0 $0 $0 $0 $0 $0 $019 Other - Part-Time and Temporary Salaries -$250,000 $0 $0 $0 $0 $0 -$250,00020 Other - FICA $0 $0 $021 Other $0 $0 $022 Other $0 $023 Other $0 $0 $0 $0 $0 $0 $024 Total -$7,913,883 -$98,033 $5,044 -$1,069,638 -$815,462 -$1,209,464 -$11,101,436
Check Figure from Instruction tab Column H -$7,913,883 -$98,033 $5,044 -$1,069,638 -$815,462 -$1,209,464 -$11,101,436Difference (needs to be zero) $0 $0 $0 $0 $0 $0 $0
Notes:Savings from staffing decrease and 19% concession: Salaries -5379122 (80,493.00) (827,660.00) -643939FICA & Retirement -1971448 (29,500.00) (303,338.00) -236003Insurances -512991Total budgeted unemployment expense = $1,600,000

Details of Changes in the Isntruction Function from Prior Year
FCS DEP (2014.0204).xls Page 16 of 26 2/9/2015
2014-15 to 2015-16
Impact of Changes In Instructional SpendingBasic Inst
111-113,119 Pre School 118Summer School
119 Special Ed 122Other Added
Needs 125,127 Adult Ed 13x TotalLines 1-4 below refer to staffing cuts and should be entered as negative numbers
1 Staffing Decrease - # of Teaching FTE lost due to Attrition/Retirement 0.00 0.00 0.00 0.00 0.00 0.00 0.002 Staffing Decrease - # of Teaching FTE lost due to Layoff -26.00 0.00 0.00 0.00 0.00 0.00 -26.003 Staffing Decrease - # of Other Non Teaching Classroom FTE Reduced 0.00 0.00 0.00 0.00 0.00 0.00 0.004 Salary Savings From Staffing Decrease -$1,756,161 $0 $0 $0 $0 $0 -$1,756,161
Lines 5-6 below refer to staffing additions and should be entered as positive numbers5 Staffing Increase - # of Teaching FTE added 0.00 0.00 0.00 0.00 0.00 0.00 0.006 Additional Salaries From Staffing Increase $0 $0 $0 $0 $0 $0 $07 Change in MSPERS $0 $0 $0 $0 $0 $0 $08 Change in Health Care Insurance $0 $0 $0 $0 $0 $0 $09 Wage Increment $0 $0 $0 $0 $0 $0 $0
10 Unemployment Costs -$145,220 -$8,698 -$3,668 -$44,625 -$45,335 -$5,719 -$253,26511 Workers Compensation $0 $0 $0 $0 $0 $0 $012 Wage Concessions $0 $0 $0 $0 $0 $0 $013 One Time School Closure Allocation $0 $0 $0 $0 $0 $0 $014 Change in Purchased Services, Supplies and Textbooks $0 $0 $0 $0 $0 $0 $015 Change in Capital Outlay $0 $0 $0 $0 $0 $0 $016 Program Costs $0 $0 $0 $0 $0 $0 $017 Dual Enrollment $0 $0 $0 $0 $0 $0 $018 Second Chance Alternative Program $0 $0 $0 $0 $0 $0 $019 Other - Part-Time and Temporary Salaries $0 $0 $0 $0 $0 $0 $020 Other - FICA $0 $0 $0 $0 $0 $0 $021 Other $0 $0 $0 $022 Other $0 $0 $0 $023 Other $0 $0 $0 $0 $0 $0 $024 Total -$1,901,381 -$8,698 -$3,668 -$44,625 -$45,335 -$5,719 -$2,009,426
Check Figure from Instruction tab Column K -$1,901,381 -$8,698 -$3,668 -$44,625 -$45,335 -$5,719 -$2,009,426Difference (needs to be zero) $0 $0 $0 $0 $0 $0 $0
Notes:Savings from staffing decrease: Salaries -1135278FICA & Retirement -416079Insurances -204804Total budgeted unemployment expense = $1,200,000

Support Services Summary
FCS DEP (2014.0204).xls Page 17 of 26 2/9/2015
Function CodePreliminary
Actual 2012-13Budgeted2013-14 Difference % Change
Estimated2014-15 Difference % Change
Estimated2015-16 Difference
% Change
Estimated2016-17 Difference
% Change
Estimated2017-18 Difference
% Change
Pupil 21X $8,251,815 $8,110,131 ($141,684) -1.72% $8,159,011 $48,880 0.60% $8,123,462 ($35,549) -0.44% $8,061,252 ($62,210) -0.77% $8,025,703 ($35,549) -0.44%Instructional 22X $9,658,295 $11,787,565 $2,129,270 22.05% $11,820,575 $33,010 0.28% $11,772,168 ($48,407) -0.41% $11,687,456 ($84,712) -0.72% $11,639,049 ($48,407) -0.41%General 23X $1,687,903 $1,448,683 ($239,220) -14.17% $1,352,271 ($96,412) -6.66% $1,349,662 ($2,609) -0.19% $1,345,095 ($4,567) -0.34% $1,342,486 ($2,609) -0.19%School 24X $5,217,117 $4,220,173 ($996,944) -19.11% $2,917,538 ($1,302,635) -30.87% $2,895,982 ($21,556) -0.74% $2,858,259 ($37,723) -1.30% $2,642,303 ($215,956) -7.56%Business 25X $4,856,496 $3,415,095 ($1,441,401) -29.68% $3,286,335 ($128,760) -3.77% $3,281,797 ($4,538) -0.14% $3,273,855 ($7,942) -0.24% $3,269,317 ($4,538) -0.14%Ops./Maint. 26X $13,592,620 $10,886,280 ($2,706,340) -19.91% $10,493,000 ($393,280) -3.61% $10,479,386 ($13,614) -0.13% $10,455,561 ($23,825) -0.23% $10,294,747 ($160,814) -1.54%Transportation 27X $3,466,437 $3,206,474 ($259,963) -7.50% $3,207,046 $572 0.02% $3,206,630 ($416) -0.01% $3,205,902 ($728) -0.02% $3,205,486 ($416) -0.01%Central 28X $3,377,043 $3,509,831 $132,788 3.93% $3,006,241 ($503,590) -14.35% $2,994,896 ($11,345) -0.38% $2,975,042 ($19,854) -0.66% $2,963,697 ($11,345) -0.38%Other 29X $1,264,559 $567,475 ($697,084) -55.12% $370,075 ($197,400) -34.79% $361,377 ($8,698) -2.35% $358,068 ($3,309) -0.92% $356,177 ($1,891) -0.53%Community Svc. 3XX $2,726,731 $2,782,555 $55,824 2.05% $2,791,915 $9,360 0.34% $2,791,915 $0 0.00% $2,780,002 ($11,913) -0.43% $2,773,195 ($6,807) -0.24%Outgoing 41X, 42X, 43X $722,381 $3,000 ($719,381) -99.58% $3,000 $0 0.00% $3,000 $0 0.00% $3,000 $0 0.00% $3,000 $0 0.00%Facilities Acq. 45X $0 $0 $0 #DIV/0! $0 $0 #DIV/0! $0 $0 #DIV/0! $0 $0 #DIV/0! $0 $0 #DIV/0!Debt Service 51X $946,631 $480,755 ($465,876) -49.21% $680,755 $200,000 41.60% $680,755 $0 0.00% $680,755 $0 0.00% $680,755 $0 0.00%Fund Mod. 6XX $1,008,648 $0 ($1,008,648) -100.00% $0 $0 #DIV/0! $0 $0 #DIV/0! $0 $0 #DIV/0! $0 $0 #DIV/0!
$56,776,676 $50,418,017 ($6,358,659) $48,087,762 ($2,330,255) $47,941,030 ($146,732) $47,684,247 ($256,783) $47,195,915 ($488,332)
Notes:

Detail of Changes in Support Functions From Prior Year
FCS DEP (2014.0204).xls Page 18 of 26 2/9/2015
Note: On this tab, enter increased expenditures as positive and decreased expenditures as negative.
Reconciliation from 2012-13 to 2013-14 FacilitiesPupil Instructional General School Business Ops./Maint. Trans. Central Other Comm Outgoing Acquisition Debt Serv. Fund Mod Total21x 22x 23x 24x 25x 26x 27x 28x 29x 3xx 4xx 45x 51x 6xx
Lines 1-4 below refer to staffing cuts and should be entered as negative numbers1 Staffing Decrease due to Attrition/Retirement 0.00 0.00 0.00 0.00 0.00 0.00 0.00 0.00 0.00 - 2 Staffing Decrease due to Layoff -2.00 0.00 -3.00 -14.00 0.00 -30.00 0.00 -1.00 -5.00 0.00 0.00 0.00 0.00 (55.00) 3 Funded Vacancies (FTE) Included Above 0.00 0.00 0.00 0.00 0.00 0.00 - 4 Savings from Staff Decrease ($141,684) $0 ($239,220) ($996,944) -$ ($1,506,724) -$ (40,494)$ ($311,796) $0 -$ -$ -$ (3,236,862)$
Lines 5-6 below refer to staffing additions and should be entered as positive numbers5 Staffing Increase - # of Teaching FTE added 0.00 0.00 0.00 0.00 0.00 0.00 0.00 0.00 0.00 0.00 0.00 0.00 - 6 Additional Salaries From Staffing Increase $ - $ - $ - $ - $ - $ - $ - $ - $ - -$ -$ -$ -$ 7 Change in MSPERS -$ -$ -$ -$ 8 Change in Health Care Insurance -$ -$ -$ -$ 9 Wage Increment - Support Services $ - $ - $ - $ - $ - $ - $ - $ - -$ -$ -$ -$
10 Wage Concessions $ - $ - $ - $ - $ - $ - $ - $ - $ - -$ -$ -$ -$ 11 Unemployment Costs -$ -$ -$ -$ 12 Change in Worker's Compensation / Risk Management -$ -$ -$ -$ 13 Part-Time Support Staff $ - $ - $ - $ - $ - $ - $ - $ - $ - -$ -$ -$ -$ 14 Change in Temporary Salaries $429,270 $ - -$ -$ -$ 429,270$ 15 Change in Compliance Workers $ - $ - $ - $ - $ - $ - $ - $ - $ - -$ -$ -$ -$ 16 Change Purchased Services, Supplies, Dues and Fees $1,700,000 ($1,441,401) ($1,147,774) (259,963)$ $173,282 ($385,288) $55,824 -$ -$ -$ (1,305,320)$ 17 Change in Capital Outlay $ - $ - $ - ($51,842) -$ -$ -$ (51,842)$ 18 Utilities $0 -$ 19 School Closure Costs -$ -$ -$ -$ -$ -$ -$ -$ -$ -$ -$ -$ -$ 20 School Closure Savings # of Buildings -$ -$ -$ -$ -$ -$ -$ -$ -$ -$ -$ -$ -$ 21 Increase in Transportation due to No Child Left Behind -$ -$ 22 -$ -$ -$ -$ -$ 23 -$ -$ -$ -$ -$ -$ -$ -$ -$ -$ -$ -$ -$ 24 -$ -$ -$ -$ -$ -$ -$ -$ -$ -$ ($719,381) -$ (465,876)$ (1,008,648)$ (2,193,905)$ 25 -$ -$ -$ -$ -$ -$ -$ -$ -$ -$ -$ -$ -$ 26 Total (S/B Consistent with Change in DEP) (141,684)$ 2,129,270$ (239,220)$ (996,944)$ (1,441,401)$ (2,706,340)$ (259,963)$ 132,788$ (697,084)$ 55,824$ (719,381)$ -$ (465,876)$ (1,008,648)$ (6,358,659)$
Check Figure from Support tab Column E -$141,684 $2,129,270 -$239,220 -$996,944 -$1,441,401 -$2,706,340 -$259,963 $132,788 -$697,084 $55,824 -$719,381 $0 -$465,876 -$1,008,648 -$6,358,659Difference (needs to be zero) $0 $0 $0 $0 $0 $0 $0 $0 $0 $0 $0 $0 $0 $0 $0
Notes:Savings from staffing decrease: Salaries -97787 -165090 -688102 (215,194.00) -42941 Skill Center Transfer MTT PaymentFICA & Retirement -31760 -53620 -223489 (69,893.00) -12883Insurances -12137 -20490 -85403 (26,709.00)

Detail of Changes in Support Functions From Prior Year
FCS DEP (2014.0204).xls Page 19 of 26 2/9/2015
Reconciliation from 2013-14 to 2014-15 FacilitiesPupil Instructional General School Business Ops./Maint. Trans. Central Other Comm Outgoing Acquisition Debt Serv. Fund Mod Total21x 22x 23x 24x 25x 26x 27x 28x 29x 3xx 4xx 45x 51x 6xx
Lines 1-4 below refer to staffing cuts and should be entered as negative numbers1 Staffing Decrease due to Attrition/Retirement 0.00 0.00 0.00 0.00 0.00 0.00 0.00 0.00 0.00 0.00 0.00 0.00 0.00 -$ 2 Staffing Decrease due to Layoff 0.00 0.00 0.00 -9.00 -3.00 -1.00 0.00 -6.00 0.00 0.00 0.00 0.00 0.00 (19)$ 3 Funded Vacancies (FTE) Included Above 0.00 -0.50 0.00 0.00 0.00 0.00 0.00 0.00 0.00 0.00 0.00 0.00 0.00 (1)$ 4 Savings from Staff Decrease 0.00 -33550.00 0.00 -698755.00 -135000.00 -50000.00 0.00 -255000.00 0.00 0.00 0.00 0.00 0.00 (1,172,305)$
Lines 5-6 below refer to staffing additions and should be entered as positive numbers5 Staffing Increase - # of Teaching FTE added 0.00 0.00 0.00 0.00 0.00 0.00 0.00 0.00 0.00 0.00 0.00 0.00 0.00 - 6 Additional Salaries From Staffing Increase 0.00 0.00 0.00 0.00 0.00 0.00 0.00 0.00 0.00 0.00 0.00 0.00 0.00 -$ 7 Change in MSPERS 0.00 0.00 0.00 0.00 0.00 0.00 0.00 0.00 0.00 0.00 0.00 0.00 0.00 -$ 8 Change in Health Care Insurance 0.00 0.00 0.00 0.00 0.00 0.00 0.00 0.00 0.00 0.00 0.00 0.00 0.00 -$ 9 Wage Increment - Support Services 0.00 0.00 0.00 0.00 0.00 0.00 0.00 0.00 0.00 0.00 0.00 0.00 0.00 -$
10 Wage Concessions 0.00 0.00 0.00 -633520.00 0.00 0.00 0.00 0.00 0.00 0.00 0.00 0.00 0.00 (633,520)$ 11 Unemployment Costs 48880.00 66560.00 3588.00 29640.00 6240.00 18720.00 572.00 15600.00 2600.00 9360.00 0.00 0.00 0.00 201,760$ 12 Change in Worker's Compensation / Risk Management 0.00 0.00 0.00 0.00 0.00 0.00 0.00 0.00 0.00 0.00 0.00 0.00 0.00 -$ 13 Part-Time Support Staff 0.00 0.00 0.00 0.00 0.00 0.00 0.00 0.00 0.00 0.00 0.00 0.00 0.00 -$ 14 Change in Temporary Salaries 0.00 0.00 0.00 0.00 0.00 0.00 0.00 0.00 0.00 0.00 0.00 0.00 0.00 -$ 15 Change in Compliance Workers 0.00 0.00 0.00 0.00 0.00 0.00 0.00 0.00 0.00 0.00 0.00 0.00 0.00 -$ 16 Change Purchased Services, Supplies, Dues and Fees 0.00 0.00 -100000.00 0.00 0.00 -362000.00 0.00 -264190.00 0.00 0.00 0.00 0.00 0.00 (726,190)$ 17 Change in Capital Outlay 0.00 0.00 0.00 0.00 0.00 0.00 0.00 0.00 0.00 0.00 0.00 0.00 0.00 -$ 18 Utilities $0 -$ 19 School Closure Costs -$ -$ -$ -$ -$ $ - -$ -$ -$ -$ -$ -$ -$ -$ 20 School Closure Savings # of Buildings -$ -$ -$ -$ -$ $0 -$ -$ -$ -$ -$ -$ -$ -$ 21 Increase in Transportation due to No Child Left Behind -$ -$ 22 Other - Good faith estimate of GASC debt service set-aside $0 $0 $0 $0 $0 $0 -$ $0 -$ $0 -$ -$ 200,000$ 200,000$ 23 Other - Closure of Sarvis Center -$ -$ -$ -$ -$ -$ -$ -$ (200,000)$ -$ -$ -$ -$ (200,000)$ 24 Other -$ -$ -$ -$ -$ -$ -$ -$ -$ -$ -$ -$ -$ -$ 25 Other -$ -$ -$ -$ -$ -$ -$ -$ -$ -$ -$ -$ -$ -$ 26 Total (S/B Consistent with Change in DEP) 48,880$ 33,010$ (96,412)$ (1,302,635)$ (128,760)$ (393,280)$ 572$ (503,590)$ (197,400)$ 9,360$ -$ -$ 200,000$ -$ (2,330,255)$
Check Figure from Instruction tab Column H $48,880 $33,010 -$96,412 -$1,302,635 -$128,760 -$393,280 $572 -$503,590 -$197,400 $9,360 $0 $0 $200,000 $0 -$2,330,255Difference (needs to be zero) $0 $0 $0 $0 $0 $0 $0 $0 $0 $0 $0 $0 $0 $0 $0
Notes:Savings from staffing decrease and wage concession: Salaries -21689 -915321 -32323 -164846FICA & Retirement -7949 -335465 -11846 -60416Insurances -3912 -81489 -5831 -29738

Detail of Changes in Support Functions From Prior Year
FCS DEP (2014.0204).xls Page 20 of 26 2/9/2015
Reconciliation from 2014-15 to 2015-16 FacilitiesPupil Instructional General School Business Ops./Maint. Trans. Central Other Comm Outgoing Acquisition Debt Serv. Fund Mod Total21x 22x 23x 24x 25x 26x 27x 28x 29x 3xx 4xx 45x 51x 6xx
Lines 1-4 below refer to staffing cuts and should be entered as negative numbers1 Staffing Decrease due to Attrition/Retirement 0.00 0.00 0.00 0.00 0.00 0.00 0.00 0.00 0.00 0.00 0.00 0.00 0.00 -$ 2 Staffing Decrease due to Layoff 0.00 0.00 0.00 0.00 0.00 0.00 0.00 0.00 0.00 0.00 0.00 0.00 0.00 -$ 3 Funded Vacancies (FTE) Included Above 0.00 0.00 0.00 0.00 0.00 0.00 0.00 0.00 0.00 0.00 0.00 0.00 0.00 -$ 4 Savings from Staff Decrease 0.00 0.00 0.00 0.00 0.00 0.00 0.00 0.00 0.00 0.00 0.00 0.00 0.00 -$
Lines 5-6 below refer to staffing additions and should be entered as positive numbers5 Staffing Increase - # of Teaching FTE added 0.00 0.00 0.00 0.00 0.00 0.00 0.00 0.00 0.00 0.00 0.00 0.00 0.00 - 6 Additional Salaries From Staffing Increase 0.00 0.00 0.00 0.00 0.00 0.00 0.00 0.00 0.00 0.00 0.00 0.00 0.00 -$ 7 Change in MSPERS 0.00 0.00 0.00 0.00 0.00 0.00 0.00 0.00 0.00 0.00 0.00 0.00 0.00 -$ 8 Change in Health Care Insurance 0.00 0.00 0.00 0.00 0.00 0.00 0.00 0.00 0.00 0.00 0.00 0.00 0.00 -$ 9 Wage Increment - Support Services 0.00 0.00 0.00 0.00 0.00 0.00 0.00 0.00 0.00 0.00 0.00 0.00 0.00 -$
10 Wage Concessions 0.00 0.00 0.00 0.00 0.00 0.00 0.00 0.00 0.00 0.00 0.00 0.00 0.00 -$ 11 Unemployment Costs -35549.00 -48407.00 -2609.00 -21556.00 -4538.00 -13614.00 -416.00 -11345.00 -8698.00 0.00 0.00 0.00 0.00 (146,732)$ 12 Change in Worker's Compensation / Risk Management 0.00 0.00 0.00 0.00 0.00 0.00 0.00 0.00 0.00 0.00 0.00 0.00 0.00 -$ 13 Part-Time Support Staff 0.00 0.00 0.00 0.00 0.00 0.00 0.00 0.00 0.00 0.00 0.00 0.00 0.00 -$ 14 Change in Temporary Salaries 0.00 0.00 0.00 0.00 0.00 0.00 0.00 0.00 0.00 0.00 0.00 0.00 0.00 -$ 15 Change in Compliance Workers 0.00 0.00 0.00 0.00 0.00 0.00 0.00 0.00 0.00 0.00 0.00 0.00 0.00 -$ 16 Change Purchased Services, Supplies, Dues and Fees 0.00 0.00 0.00 0.00 0.00 0.00 0.00 0.00 0.00 0.00 0.00 0.00 0.00 -$ 17 Change in Capital Outlay 0.00 0.00 0.00 0.00 0.00 0.00 0.00 0.00 0.00 0.00 0.00 0.00 0.00 -$ 18 Utilities -$ -$ 19 School Closure Costs -$ -$ -$ -$ -$ -$ -$ -$ -$ -$ -$ -$ -$ -$ 20 School Closure Savings # of Buildings -$ -$ -$ -$ -$ $0 -$ -$ -$ -$ -$ -$ -$ -$ 21 Increase in Transportation due to No Child Left Behind -$ -$ 22 Other - FICA $0 $0 $0 $0 $ - $0 $ - $0 -$ -$ -$ -$ -$ -$ 23 Other $ - $ - $ - $0 $ - $ - -$ -$ -$ -$ -$ -$ 24 Other -$ -$ -$ -$ -$ -$ 25 Other $ - $ - $ - $ - $ - $ - $ - $ - -$ -$ -$ -$ -$ -$ 26 Total (S/B Consistent with Change in DEP) (35,549)$ (48,407)$ (2,609)$ (21,556)$ (4,538)$ (13,614)$ (416)$ (11,345)$ (8,698)$ -$ -$ -$ -$ -$ (146,732)$
Check Figure from Instruction tab Column K -$35,549 -$48,407 -$2,609 -$21,556 -$4,538 -$13,614 -$416 -$11,345 -$8,698 $0 $0 $0 $0 $0 -$146,732Difference (needs to be zero) $0 $0 $0 $0 $0 $0 $0 $0 $0 $0 $0 $0 $0 $0 $0
Notes:

Deficit Elimination Plan
FCS DEP (2014.0204).xls Page 21 of 26 2/9/2015
School District City of Flint
AccountPreliminary
Actual 2012-13Board Adopted Budget 2013-14
Yearly Increase (Decrease)
% Increase (Decrease)
Target Budget 2014-15
Yearly Increase (Decrease)
% Increase (Decrease)
Target Budget 2015-16
Yearly Increase (Decrease)
% Increase (Decrease)
Target Budget 2016-17
Yearly Increase (Decrease)
% Increase (Decrease)
Target Budget 2017-18
Yearly Increase (Decrease)
% Increase (Decrease)
1 Beginning Fund Equity: ($6,950,895) ($10,403,723) ($12,705,124) ($7,915,220) ($4,146,034) ($1,079,056)2 Add: Revenues3 11x Local Sources $10,494,777 $9,119,825 ($1,374,952) -13.10% $8,850,683 ($269,142) -2.95% $8,850,683 $0 0.00% $8,850,683 $0 0.00% $8,850,683 $0 0.00%4 51x Local Rec'd Thru Another Public Sch. $3,174,167 $3,397,879 $223,712 7.05% $3,406,682 $8,803 0.26% $3,406,682 $0 0.00% $3,406,682 $0 0.00% $3,406,682 $0 0.00%5 2xx Other Political Sub. $0 $0 $0 0.00% $0 $0 0.00% $0 $0 0.00% $0 $0 0.00% $0 $0 0.00%6 3xx State Sources $71,501,376 $60,442,344 ($11,059,032) -15.47% $57,244,472 ($3,197,872) -5.29% $54,794,387 ($2,450,085) -4.28% $52,588,300 ($2,206,087) -4.03% $50,813,937 ($1,774,363) -3.37%7 4xx Federal Sources $25,717,169 $26,022,973 $305,804 1.19% $25,890,798 ($132,175) -0.51% $25,164,008 ($726,790) -2.81% $25,164,008 $0 0.00% $25,164,008 $0 0.00%8 52x-6xx Incoming Transfers & Other $2,765,382 $2,750,000 ($15,382) -0.56% $0 ($2,750,000) -100.00% $0 $0 0.00% $0 $0 0.00% $0 $0 0.00%9 TOTAL REVENUES,ETC. $113,652,871 $101,733,021 ($11,919,850) -10.49% $95,392,635 ($6,340,386) -6.23% $92,215,760 ($3,176,875) -3.33% $90,009,673 ($2,206,087) -2.39% $88,235,310 ($1,774,363) -1.97%
10 TOTAL RESOURCES AVAILABLE $106,701,976 $91,329,298 ($15,372,678) -14.41% $82,687,511 ($8,641,787) -9.46% $84,300,539 $1,613,029 1.95% $85,863,639 $1,563,100 1.85% $87,156,254 $1,292,615 1.51%11 Less: Expenditures12 1xx Classroom Inst. $60,329,023 $53,616,405 ($6,712,618) -11.13% $42,514,969 ($11,101,436) -20.71% $40,505,543 ($2,009,426) -4.73% $39,258,448 ($1,247,095) -3.08% $38,287,429 ($971,019) -2.47%13 Support Services:14 21x Pupil $8,251,815 $8,110,131 ($141,684) -1.72% $8,159,011 $48,880 0.60% $8,123,462 ($35,549) -0.44% $8,061,252 ($62,210) -0.77% $8,025,703 ($35,549) -0.44%15 22x Inst. Staff $9,658,295 $11,787,565 $2,129,270 22.05% $11,820,575 $33,010 0.28% $11,772,168 ($48,407) -0.41% $11,687,456 ($84,712) -0.72% $11,639,049 ($48,407) -0.41%16 23x Gen. Adm. $1,687,903 $1,448,683 ($239,220) -14.17% $1,352,271 ($96,412) -6.66% $1,349,662 ($2,609) -0.19% $1,345,095 ($4,567) -0.34% $1,342,486 ($2,609) -0.19%17 24x Sch. Adm. $5,217,117 $4,220,173 ($996,944) -19.11% $2,917,538 ($1,302,635) -30.87% $2,895,982 ($21,556) -0.74% $2,858,259 ($37,723) -1.30% $2,642,303 ($215,956) -7.56%18 25x Business $4,856,496 $3,415,095 ($1,441,401) -29.68% $3,286,335 ($128,760) -3.77% $3,281,797 ($4,538) -0.14% $3,273,855 ($7,942) -0.24% $3,269,317 ($4,538) -0.14%19 26x Operation & Maintenance $13,592,620 $10,886,280 ($2,706,340) -19.91% $10,493,000 ($393,280) -3.61% $10,479,386 ($13,614) -0.13% $10,455,561 ($23,825) -0.23% $10,294,747 ($160,814) -1.54%20 27x Transportation $3,466,437 $3,206,474 ($259,963) -7.50% $3,207,046 $572 0.02% $3,206,630 ($416) -0.01% $3,205,902 ($728) -0.02% $3,205,486 ($416) -0.01%21 28x Central $3,377,043 $3,509,831 $132,788 3.93% $3,006,241 ($503,590) -14.35% $2,994,896 ($11,345) -0.38% $2,975,042 ($19,854) -0.66% $2,963,697 ($11,345) -0.38%22 29X Other $1,264,559 $567,475 ($697,084) -55.12% $370,075 ($197,400) -34.79% $361,377 ($8,698) -2.35% $358,068 ($3,309) -0.92% $356,177 ($1,891) -0.53%23 3xx Community Services $2,726,731 $2,782,555 $55,824 2.05% $2,791,915 $9,360 0.34% $2,791,915 $0 0.00% $2,780,002 ($11,913) -0.43% $2,773,195 ($6,807) -0.24%24 41,42,43 Outgoing Transfers $722,381 $3,000 ($719,381) -99.58% $3,000 $0 0.00% $3,000 $0 0.00% $3,000 $0 0.00% $3,000 $0 0.00%25 45x Facilities Acq $0 $0 $0 0.00% $0 $0 0.00% $0 $0 0.00% $0 $0 0.00% $0 $0 0.00%26 51x Debt Service $946,631 $480,755 ($465,876) -49.21% $680,755 $200,000 41.60% $680,755 $0 0.00% $680,755 $0 0.00% $680,755 $0 0.00%27 6xx Fund Modifications $1,008,648 $0 ($1,008,648) -100.00% $0 $0 0.00% $0 $0 0.00% $0 $0 0.00% $0 $0 0.00%28 TOTAL EXP. & OUTGOING TRANSFERS $117,105,699 $104,034,422 ($13,071,277) -11.16% $90,602,731 ($13,431,691) -12.91% $88,446,573 ($2,156,158) -2.38% $86,942,695 ($1,503,878) -1.70% $85,483,344 ($1,459,351) -1.68%29 ENDING FUND BALANCE ($10,403,723) ($12,705,124) ($2,301,401) 22.12% ($7,915,220) $4,789,904 -37.70% ($4,146,034) $3,769,187 -47.62% ($1,079,056) $3,066,978 -73.97% $1,672,910 $2,751,966 -255.03%
Notes:

NARRATIVE SECTION
FCS DEP (2014.0204).xls Page 22 of 26 2/9/2015
1.Answer: All contracts have been completed
2.Answer: None
3.Answer: All groups except teachers
4.Answer: Teachers
5.Answer: Teachers contract will be open 8/31/2014. Service Employees International Union (SEIU) will be open
6/30/2015. Congress of Administrators will be open 6/30/2015. MEA/NEA (Vocational-Technical and Safety Advocates) will be open 6/30/2016. Teacher bargaining group (assisted by National Education Association and National Education Association Foundation) is working with administration to accelerate reductions to reduce costs on an immediate basis. All groups except instruction and administration will be contracted services by fiscal year 2014-15.
6.Answer: Yes; amount for teaching supplies was reduced from $15/student to $12/student district-wide.
7.Answer: Yes; wage concessions of 19% effective for 2014-15; contract substitute teachers
8.Answer: Loss of state funding due to student FTE reductions, flat foundation allowance, fixed overhead from closed
schools, low student to teacher ratios, increases in MPSER rates. Unfunded mandates such extensive reporting requirements, increased building maintenance costs due to aging buildings (some as old as 80 years); vandalism to vacated buildings, lack of accounts payable integration with the financial management system which led to lack of adequate budget oversight and management.
9.Answer: 1) Closed 2 elementary schools at the end of FY 2012-13 and will close 2 more at the end of FY 2013-14;
closed 1 high school (Northern) in FY 2013-14 and repurposed that building for an alternative high school and special programs for 2013-14 only. Plan to close two additional buildings at the end of FY 2016-17 if student loss continues. 2) Mount aggressive plan to dispose of all unoccupied buildings through sale or demolition (no sales revenues except for the Skill Center have been included in the DEP) 3) Close Print Center; 4) Close Sarvis Center by the end of January 2014 and sell building; 5) Phase in an increase in the ratio of students to instructors through better allocation of staff; 6) Reorganize and merge central office, general administration (professional non-teaching staff), building administration, and administrative departments reducing the number of directors, assistant principals, administrative staff and secretaries; 7) review increase in ratio of students to guidance counselors, 8) eliminate warehouse function, better manage supplies and materials by upgrading purchasing processes, more competitive pricing, decreasing shipping costs and JIT for supplies; 9) Improve cash management to take advantage of timely pay discounts; 10) increased scrutiny of part time, supplemental pay, and independent contractor costs, 11) upgrade financial management software to integrate accounts payable and provide budgetary information and controls. 12) Transportation, grounds and custodial services have been outsourced and administration is tasked to provide oversight such that expected savings are realized. 13) Negotiate revised custodial contract and decrease scope of custodial duties 14) Outsource food service, maintenance, and clerical services; 15) Reduce unemployment cost over time as result of outsourcing and time.
10.Answer: Transferred the operation of Head Start and Skill Center to another provider; will transfer adult education to
another provider for the 2014-15 FY.
11.Answer: Audit fees, restructure business office and human resource departments
12.
For which employee groups have negotiations been completed for 2013-14?
For which employee groups have negotiations not been completed for 2013-14?
For which employee groups have negotiations been completed for 2014-15?
For which employee groups have negotiations not been completed for 2014-15?
What is the school district's plan to eliminate the deficit?
What subjects or instructional programs is the district proposing to discontinue or curtail?
What support services would be reduced or eliminated?
What specific steps have been initiated to carry out the plan?
When is the next year employee negotiations will be open?
Are projected savings from employee negotiations included in 2013-14?
Are projected savings from employee negotiations included in 2014-15?
What factors caused the school district's deficit?

NARRATIVE SECTION
FCS DEP (2014.0204).xls Page 23 of 26 2/9/2015
Answer: The district reduced all non-teaching, non-clerical staff salaries for the 2012-13 fiscal year (Executive Cabinet 10%, professionals 8%, technical and executive secretaries 5%, administrators 7%, those decreases to stay in effect. Outsourcing non-teaching and administrative services. Broker has been hired to dispose of properties. Layoffs have been processed for FY 2013-2014, 2 Executive Cabinet positions have been eliminated. The district sold the Genesee Area Skills Center building and personal property to the GISD. Support through the C.S. Mott Foundation in the form of turnaround consulting in the areas of finance, enrollment projections, legal services and instructional design and implementation. Support provided by the C.S. Mott Foundation is expected to continue. The National Education Association and the National Education Association Foundation are providing technical assistance to the district that will be critical to plan implementation.
13.Answer: The board has approved the closure of 4 school buildings and the consolidation of 3 highschool/middle schools
into 2 as of 6/30/2013. Zimmerman School was closed, relocating Mott Adult High School and alternative middle school programs to the former Northern High School building. Significant salary/fringe benefit cost reductions and building maintenance/utility costs are associated with these actions. Reductions are in the 2014 budget and in the following two years.
14.
Answer: The school liaison group no longer eligible for benefits, 19% wage concession for 2014-15.
15.
Answer: http://www.flintschools.org/Download.asp?L=1&LMID=508500&PN=DocumentUploads&DivisionID=11970&DepartmentID=&SubDepartmentID=&SubP=&Act=Download&T=1&I=275414
16.Answer: Attached
17.Answer: District is reducing staffing in Athletic Department, reducing Community Services, closing the district's Sarvis
conference center.
18.Answer: Yes. Designated for building major repairs and bonded debt service. Although not an established Sinking
Fund and not a part of General Fund deficit, as a show of good faith, beginning annually in 2014 the DEP includes a $200,000 debt service set aside for a potential payment of the unassigned Skill Center deficit. The Skill Center deficit is currently under financial and legal review. As a result, the District is setting aside $200,000 annually should some amount be found owing.
19.Answer: Not current on MPSERS payments; plan to get current with State Aid Note proceeds.
List expected savings to be achieved by eliminating specific extra-curricular activities.
Do you have a sinking fund? If so, what is it designated for?
Please give the details of staff reductions for instruction, support services, and community services.
Please give the details of any proposed employee wage concessions. Have any of those concessions been adopted?
Please submit the most recent board approved budget along with the board resolution with which it was adopted or provide the URL at which it is located.
Please submit the Board Resolution showing approval of this Deficit Elimination Plan.
Are you current on payments to MPSERS, health insurance premiums, etc.?

Monthly Budgetary Control Report Guidance
The Michigan Department of Education (MDE) Monthly Budgetary Control Report can be a valuable tool for monitoring the financial health of a school district if the report is completed using actual to-date and realistic projections of revenues and expenditures over the balance of the year. It is expected that the board/district would regularly review this report in order to determine the need for mid-year budget amendments. The procedures for analysis of this report are intended to encourage the board/district to monitor the Deficit Elimination Plan (DEP) vs. actual revenues and expenditures in a timely fashion.
These monthly reports are due by the end of the following month. For example, the November report is due by December 31st. The district should begin sending these reports immediately after the DEP has been approved. For example, if the MDE approved the DEP in November, we would expect a November report by the end of December. The local school board does not have to approve the reports. These monthly reports should be sent to Chad Urchike at [email protected] and to Jeff Kolb at [email protected].
The following is a breakdown of the Monthly Budgetary Control Report. The guidelines help explain what information the MDE is looking for in these reports. An example of a completed report follows this guidance.
Column AThis column will automatically fill in with information from the DEP tab. It will always be based on your most current MDE approved DEP. Even if you submit a revised DEP, these monthly reports will still be based on your existing approved DEP. Therefore, it is important to create a new DEP worksheet when submitting a revised plan, as opposed to overwriting the numbers on your existing file. The only time column A will change is when the MDE approves a revised DEP. It is important to remember that this column represents your plan to eliminate the deficit. The information you provide in columns B and C will show how the district is performing relative to their approved DEP on a monthly basis.
Column BThis column represents monies the district has spent/collected, thus far, in the fiscal year. For example, the Budgetary Control Report for December would show how much the district has spent/collected from July 1st through December 31st. These numbers should always reflect the most current data for the accounts. This column starts with Beginning Fund Equity, which should be your audited fund balance as of July 1st. Until the audit is complete, the amount would come from the adopted budget for the current year.
Column CThis column represents monies the district projects to spend/collect during the rest of the fiscal year. For example, the Budgetary Control Report for December would show how much the district expects to spend/collect from January 1st through June 30th. Your DEP was developed using certain assumptions for revenues and expenditures. As the year progresses, these assumptions will be modified based on new information, such as more accurate pupil counts and staff concessions. After each monthly report is created, column C projections should become more accurate and certain adjustments may be needed in other areas. This detailed analysis can be a time consuming process, but it is essential for staying on the path to deficit elimination.
Column DColumns B and C are added, totaling what the district expects to spend for the year.
Column E
This column will calculate the difference between column A (your DEP/Budget) and column D (what the district expects to spend). As the school year progresses, the MDE fully expects to see some variations in this column. One example is the variation between the Beginning Fund Equity balances. It is the difference between your projected fund balance and your audited fund balance. No variation within this column shows that the district is simply forcing the numbers in Column C to coincide with the DEP, as opposed to using authentic numbers that come from detailed budget analysis.
Column FThis column will calculate the percentage difference between columns E and A.
Variance Explanation ColumnThis column is used to explain the differences between the DEP and total projected expenditures. These explanations provide the MDE with some insight as to what is happening at the district.
Home Town School District
A B C D(B+C) E(D-A) F(E/A)DEFICIT ACTUAL PROJECTED TOTAL VARIANCE % VARIANCE
Acct Codes
ELIMINATION PLAN 2012-2013
Year-to Date To-Year-End PROJECTED
1 Beginning Fund Equity ($5,941,851) ($5,001,310) ($5,001,310) $940,541 -15.83% Audited Number2 Add: Revenues3 11X Local Sources $12,068,089 $2,569,423 $9,401,678 $11,971,101 ($96,988) -0.80% Property Tax Decrease4 51X Local Rec'd Thru Other Public Schl $615,000 $346,582 $268,418 $615,000 $0 0.00%5 2xx Local Thru Other Political Sub $0 $0 $0 $0 $0 0.00%
6 3xx State Sources $49,670,674 $18,579,025 $31,640,589 $50,219,614 $548,940 1.11%Student Count Adjustment
7 4xx Federal Sources $130,000 $56,234 $80,856 $137,090 $7,090 5.45%Title I Revenue From Last Year
8 52x-6xx Incoming Transfers & Other $440,364 $0 $440,364 $440,364 $0 0.00%9 Total Current Year Revenues $62,924,127 $21,551,264 $41,831,905 $63,383,169 $459,042 0.73%
10 TOTAL RESOURCES AVAILABLE $56,982,276 $58,381,859 $1,399,583 2.46%11 Less: Expenditures
12 1xx Classroom Instruction $36,833,607 $17,652,364 $20,564,210 $38,216,574 $1,382,967 3.75%
Assumed 8% Concessions - Only Received 4%
13 Support Services:
14 21x Pupil Support $3,920,723 $1,589,652 $2,440,214 $4,029,866 $109,143 2.78% Higher Social Work Cost
15 22x Instructional Staff Supp $1,623,839 $752,321 $890,456 $1,642,777 $18,938 1.17%Additional Title II Training Expense
16 23x General Admin. $778,675 $356,894 $418,236 $775,130 ($3,545) -0.46%17 24x School Admin. $3,986,820 $1,895,671 $1,645,231 $3,540,902 ($445,918) -11.18% Changed Insurance Plan18 25x Business Admin. $1,482,068 $789,634 $727,125 $1,516,759 $34,691 2.34% Data Software Upgrade
19 26x Oper/Maintenance $8,748,989 $4,785,367 $3,875,259 $8,660,626 ($88,363) -1.01%Custodial Retirement - No Replacement
20 27x Transportation $4,393,771 $2,569,578 $2,156,812 $4,726,390 $332,619 7.57% Purchase New Busses21 28x Central Admin. $1,448,768 $759,246 $729,367 $1,488,613 $39,845 2.75% New Secretary22 29x Other $742,899 $358,210 $386,941 $745,151 $2,252 0.30%23 3xx Community Services $0 $0 $0 $0 $0 0.00%24 41,42,43 Outgoing Transfers $0 $0 $0 $0 $0 0.00%25 45x Facilities Acquisition $0 $0 $0 $0 $0 0.00%26 51x Debt Service $0 $0 $0 $0 $0 0.00%27 6xx Fund Modifications $0 $0 $0 $0 $0 0.00%28 TOTAL EXPEND. & OUTGOING TRNSFRS $63,960,159 $31,508,937 $33,833,851 $65,342,788 $1,382,629 2.16%29 ENDING FUND BALANCE ($6,977,883) ($6,960,929) $16,954 -0.24%
Notes:
SUMMARY MONTHLY DEP RECONCILIATION REPORTFOR THE MONTH ENDING DECEMBER 31, 2013
SCHOOL DISTRICT NAME:
Variance Explanation

School District City of Flint
A B C D(B+C) E(D-A) F(E/A)DEFICIT ACTUAL PROJECTED TOTAL VARIANCE % VARIANCE
Acct Codes
ELIMINATION PLAN 2013-2014
Year-to Date To-Year-End PROJECTED
1 Beginning Fund Equity ($10,403,723) ($15,781,011) ($15,781,011) ($5,377,288) 51.69%2 Add: Revenues3 11X Local Sources $9,119,825 $105,328 $9,014,497 $9,119,825 $0 0.00%4 51X Local Rec'd Thru Other Public Schl $3,397,879 $263,840 $3,134,039 $3,397,879 $0 0.00%5 2xx Local Thru Other Political Sub $0 $0 $0 $0 $0 0.00%6 3xx State Sources $60,442,344 $0 $60,442,344 $60,442,344 $0 0.00%7 4xx Federal Sources $26,022,973 $169,884 $25,853,089 $26,022,973 $0 0.00%8 52x-6xx Incoming Transfers & Other $2,750,000 $0 $2,750,000 $2,750,000 $0 0.00%9 Total Current Year Revenues $101,733,021 $539,053 $101,193,968 $101,733,021 $0 0.00%
10 TOTAL RESOURCES AVAILABLE $91,329,298 $85,952,010 ($5,377,288) -5.89%11 Less: Expenditures12 1xx Classroom Instruction $53,616,405 $1,108,464 $52,507,941 $53,616,405 $0 0.00%13 Support Services:14 21x Pupil Support $8,110,131 $137,725 $7,972,406 $8,110,131 $0 0.00%15 22x Instructional Staff Supp $11,787,565 $328,469 $11,459,096 $11,787,565 $0 0.00%16 23x General Admin. $1,448,683 $34,186 $1,414,497 $1,448,683 $0 0.00%17 24x School Admin. $4,220,173 $92,909 $4,127,264 $4,220,173 $0 0.00%18 25x Business Admin. $3,415,095 $77,450 $3,337,645 $3,415,095 $0 0.00%19 26x Oper/Maintenance $10,886,280 $1,030,070 $9,856,210 $10,886,280 $0 0.00%20 27x Transportation $3,206,474 ($8,392) $3,214,866 $3,206,474 $0 0.00%21 28x Central Admin. $3,509,831 $163,445 $3,346,386 $3,509,831 $0 0.00%22 29x Other $567,475 $2,242 $565,233 $567,475 $0 0.00%23 3xx Community Services $2,782,555 $185,881 $2,596,674 $2,782,555 $0 0.00%24 41,42,43 Outgoing Transfers $3,000 $0 $3,000 $3,000 $0 0.00%25 45x Facilities Acquisition $0 $0 $0 $0 $0 0.00%26 51x Debt Service $480,755 $218 $480,537 $480,755 $0 0.00%27 6xx Fund Modifications $0 $0 $0 $0 $0 0.00%28 TOTAL EXPEND. & OUTGOING TRNSFRS $104,034,422 $3,152,667 $100,881,755 $104,034,422 $0 0.00%29 ENDING FUND BALANCE ($12,705,124) ($18,082,412) ($5,377,288) 42.32%
Notes:
SUMMARY MONTHLY DEP RECONCILIATION REPORTFOR THE MONTH ENDING _JULY________
SCHOOL DISTRICT NAME:
Variance Explanation

School District City of Flint
A B C D(B+C) E(D-A) F(E/A)DEFICIT ACTUAL PROJECTED TOTAL VARIANCE % VARIANCE
Acct Codes
ELIMINATION PLAN 2014-2015
Year-to Date To-Year-End PROJECTED
1 Beginning Fund Equity ($12,705,124) $0 $0 $12,705,124 -100.00%2 Add: Revenues3 11X Local Sources $8,850,683 $0 $0 $0 ($8,850,683) -100.00%4 51X Local Rec'd Thru Other Public Schl $3,406,682 $0 $0 $0 ($3,406,682) -100.00%5 2xx Local Thru Other Political Sub $0 $0 $0 $0 $0 0.00%6 3xx State Sources $57,244,472 $0 $0 $0 ($57,244,472) -100.00%7 4xx Federal Sources $25,890,798 $0 $0 $0 ($25,890,798) -100.00%8 52x-6xx Incoming Transfers & Other $0 $0 $0 $0 $0 0.00%9 Total Current Year Revenues $95,392,635 $0 $0 $0 ($95,392,635) -100.00%
10 TOTAL RESOURCES AVAILABLE $82,687,511 $0 ($82,687,511) -100.00%11 Less: Expenditures12 1xx Classroom Instruction $42,514,969 $0 $0 $0 ($42,514,969) -100.00%13 Support Services:14 21x Pupil Support $8,159,011 $0 $0 $0 ($8,159,011) -100.00%15 22x Instructional Staff Supp $11,820,575 $0 $0 $0 ($11,820,575) -100.00%16 23x General Admin. $1,352,271 $0 $0 $0 ($1,352,271) -100.00%17 24x School Admin. $2,917,538 $0 $0 $0 ($2,917,538) -100.00%18 25x Business Admin. $3,286,335 $0 $0 $0 ($3,286,335) -100.00%19 26x Oper/Maintenance $10,493,000 $0 $0 $0 ($10,493,000) -100.00%20 27x Transportation $3,207,046 $0 $0 $0 ($3,207,046) -100.00%21 28x Central Admin. $3,006,241 $0 $0 $0 ($3,006,241) -100.00%22 29x Other $370,075 $0 $0 $0 ($370,075) -100.00%23 3xx Community Services $2,791,915 $0 $0 $0 ($2,791,915) -100.00%24 41,42,43 Outgoing Transfers $3,000 $0 $0 $0 ($3,000) -100.00%25 45x Facilities Acquisition $0 $0 $0 $0 $0 0.00%26 51x Debt Service $680,755 $0 $0 $0 ($680,755) -100.00%27 6xx Fund Modifications $0 $0 $0 $0 $0 0.00%28 TOTAL EXPEND. & OUTGOING TRNSFRS $90,602,731 $0 $0 $0 ($90,602,731) -100.00%29 ENDING FUND BALANCE ($7,915,220) $0 $7,915,220 -100.00%
Notes:
SUMMARY MONTHLY DEP RECONCILIATION REPORTFOR THE MONTH ENDING __________
SCHOOL DISTRICT NAME:
Variance Explanation
Related Documents