DeepStomata 1 DeepStomata: Facial Recognition Technology for Automated Stomatal Aperture Measurement Yosuke Toda 1,2† , Shigeo Toh 3 , Gildas Bourdais 4 , Silke Robatzek 4 , Dan Maclean 4 , and Toshinori Kinoshita 2,5† 1 Japan Science and Technology Agency, 4-1-8 Honcho, Kawaguchi, Saitama, 332-0012, Japan 2 Institute of Transformative Bio-Molecules (WPI-ITbM), Nagoya University, Chikusa, Nagoya 464- 8602 Japan 3 Department of Life Sciences, School of Agriculture, Meiji University, Higashimita 1-1-1, Tama-ku, Kawasaki 214-8571, Japan 4 The Sainsbury Laboratory, Norwich Research Park, Norwich NR4 UH, UK 5 Division of Biological Science, Graduate School of Science, Nagoya University, Chikusa Nagoya 464-8602 Japan † Correspondence: Yosuke Toda, [email protected]; Toshinori Kinoshita, [email protected] Stomata are an attractive model for studying the physiological responses of plants to various environmental stimuli 1–3 . Of the morphological parameters that represent the degree of stomatal opening, the length of the minor axis of the stomatal pore (the stomatal aperture) has been most commonly used to dissect the molecular basis of its regulation. Measuring stomatal apertures is time consuming and labour intensive, preventing their use in large-scale studies. Here, we completely automated this process by developing a program called DeepStomata, which combines stomatal region detection and pore isolation by image segmentation. The former, which comprises histograms of oriented gradients (HOG)-based stomatal detection and the convolutional neural network (CNN)- based classification of open/closed-state stomata, acts as an efficient conditional branch in the workflow to selectively quantify the pores of open stomata. An analysis of batches of images showed that the accuracy of our automated aperture measurements was equivalent to that of manual measurements, however had higher sensitivity (i,e., lower false negative rate ) and the process speed was at least 80 times faster. The outstanding performance of our proposed method for automating a laborious and repetitive task will allow researchers to focus on deciphering complex phenomena. To fully understand the molecular mechanisms underlying the regulation of stomatal movement, sufficient numbers of stomata must be analysed under a range of experimental conditions. To date, ocular . CC-BY-NC 4.0 International license author/funder. It is made available under a The copyright holder for this preprint (which was not peer-reviewed) is the . https://doi.org/10.1101/365098 doi: bioRxiv preprint . CC-BY-NC 4.0 International license author/funder. It is made available under a The copyright holder for this preprint (which was not peer-reviewed) is the . https://doi.org/10.1101/365098 doi: bioRxiv preprint . CC-BY-NC 4.0 International license author/funder. It is made available under a The copyright holder for this preprint (which was not peer-reviewed) is the . https://doi.org/10.1101/365098 doi: bioRxiv preprint

Welcome message from author
This document is posted to help you gain knowledge. Please leave a comment to let me know what you think about it! Share it to your friends and learn new things together.
Transcript

DeepStomata
1
DeepStomata: Facial Recognition Technology for Automated
Stomatal Aperture Measurement
Yosuke Toda1,2†, Shigeo Toh3, Gildas Bourdais4, Silke Robatzek4, Dan Maclean4, and Toshinori
Kinoshita2,5†
1Japan Science and Technology Agency, 4-1-8 Honcho, Kawaguchi, Saitama, 332-0012, Japan
2Institute of Transformative Bio-Molecules (WPI-ITbM), Nagoya University, Chikusa, Nagoya 464-
8602 Japan
3Department of Life Sciences, School of Agriculture, Meiji University, Higashimita 1-1-1, Tama-ku,
Kawasaki 214-8571, Japan
4The Sainsbury Laboratory, Norwich Research Park, Norwich NR4 UH, UK
5Division of Biological Science, Graduate School of Science, Nagoya University, Chikusa Nagoya
464-8602 Japan
†Correspondence:
Yosuke Toda, [email protected]; Toshinori Kinoshita, [email protected]
Stomata are an attractive model for studying the physiological responses of plants to various
environmental stimuli1–3. Of the morphological parameters that represent the degree of stomatal
opening, the length of the minor axis of the stomatal pore (the stomatal aperture) has been most
commonly used to dissect the molecular basis of its regulation. Measuring stomatal apertures is time
consuming and labour intensive, preventing their use in large-scale studies. Here, we completely
automated this process by developing a program called DeepStomata, which combines stomatal
region detection and pore isolation by image segmentation. The former, which comprises histograms
of oriented gradients (HOG)-based stomatal detection and the convolutional neural network (CNN)-
based classification of open/closed-state stomata, acts as an efficient conditional branch in the
workflow to selectively quantify the pores of open stomata. An analysis of batches of images showed
that the accuracy of our automated aperture measurements was equivalent to that of manual
measurements, however had higher sensitivity (i,e., lower false negative rate ) and the process speed
was at least 80 times faster. The outstanding performance of our proposed method for automating a
laborious and repetitive task will allow researchers to focus on deciphering complex phenomena.
To fully understand the molecular mechanisms underlying the regulation of stomatal movement,
sufficient numbers of stomata must be analysed under a range of experimental conditions. To date, ocular
.CC-BY-NC 4.0 International licenseauthor/funder. It is made available under aThe copyright holder for this preprint (which was not peer-reviewed) is the. https://doi.org/10.1101/365098doi: bioRxiv preprint
.CC-BY-NC 4.0 International licenseauthor/funder. It is made available under aThe copyright holder for this preprint (which was not peer-reviewed) is the. https://doi.org/10.1101/365098doi: bioRxiv preprint
.CC-BY-NC 4.0 International licenseauthor/funder. It is made available under aThe copyright holder for this preprint (which was not peer-reviewed) is the. https://doi.org/10.1101/365098doi: bioRxiv preprint

DeepStomata
2
micrometer-assisted visual estimation has been widely used to measure stomatal apertures; however, as
stomatal movements are highly sensitive to their environment, the number of stomata that can be analysed
before their apertures change is very limited using this method. Imaging intact or replica leaf surfaces
enables the analysis to be deferred, alleviating the possibility of aperture changes during observation;
however, aperture measurements are still labour intensive. Recent technical advances in computer vision
can assist the quantification process. CARTA, an ImageJ plugin that utilizes a self-organizing map
algorithm, allowed the semi-automatic classification of open/closed-state stomata4. More recently, a script
that automatically quantifies stomatal apertures has been developed
(https://github.com/TeamMacLean/stomatameasurer); however, it requires that images be taken using a
confocal scanning laser microscope with a high-contrast background. In many studies, images are acquired
using an optical camera with bright-field microscopy, which contains dense and complex pixel
information. To the best of our knowledge, no methods currently facilitate the automatic measurement of
stomatal apertures from such images.
As a solution to these issues, phenotypes that can serve as a proxy for stomatal opening have been
used to identify factors that regulate stomatal movement. Thermal imaging of leaves or monitoring their
water loss can reflect the stomatal aperture-dependent transpiration rate5,6, while immunostaining can
detect the degree of H+-ATPase phosphorylation that provides the motive force for stomatal opening7,8.
These approaches have been successfully used to isolate genetic factors or compounds involved in
stomatal regulation; however, these proxies do not always reflect the true status of the stomatal aperture.
Recently, we isolated compounds that regulate stomatal movements (stomatal closing compounds; SCLs)
in a chemical screen focussed on stomatal apertures9. Limiting to include only chemicals for quantification
that altered stomatal aperture greatly enhanced the screening throughput to 150 compounds per day, which
resulted in the successful identification of 9 candidates from over 20,000 chemicals. However, we could
not exclude the possibility of overlooking false negatives due to technical error or a gradual effect of the
compound. Automating the quantification process would not only ensure high throughput, but would also
provide uniform quality and higher sensitivity in various analyses. Here, we propose a complete
automation of this process, enabling the batch processing of bright-field images containing both open and
closed stomata (Fig. 1).
During conceptualization, we were inspired by the principle of facial recognition10,11 (Fig. 2A), or
more broadly region proposal algorithms. First, the position of the face within the image is isolated either
using a predefined threshold, or by a machine learning-based method such as histograms of oriented
gradients (HOG), local binary patterns, or Haar-like cascades. Next, using the cropped face image as an
input, high-context information such as age, biological sex, emotion, and identity are further qualitatively
or quantitatively evaluated using a convolutional neural network (CNN). CNNs are a type of neural
network used in deep learning, and are powerful tools for image recognition and classification12. Since
deep learning enables the neural network itself to learn the most suitable feature, it generally prevails over
conventional machine learning in various situations. In this report, we propose a method for stomatal
.CC-BY-NC 4.0 International licenseauthor/funder. It is made available under aThe copyright holder for this preprint (which was not peer-reviewed) is the. https://doi.org/10.1101/365098doi: bioRxiv preprint
DeepStomata
3
aperture measurement that partially follows facial recognition: (1) Detection of the stomatal candidate
regions within the image using a HOG; (2) Classification of whether the detected stomata are open or
closed using the CNN; and (3) Selective quantification of the apertures of open stomata by pore region
isolation using binary based image segmentation.
The pipeline of the proposed method is summarized in Fig. 2b. The details of the respective
processes are provided in the Methods section of this paper. For stomatal detection, we combined HOG
with a max-margin object detection method13,14. The constructed HOG detector scans the input image and
the HOGs are compared within the sub-region of images for stomatal detection (Supplementary Fig. 1a).
We constructed a detector that can accept any orientation and degree of stomatal aperture (Supplementary
Fig. 1b). The precision and recall value of the detector on the test dataset were 0.954 and 0.940,
respectively (Supplementary Fig. 1c). In addition to stomata, the detector was found to collect false
positives, images containing a background non-stomata region; therefore, we categorized the collected
images into four classes: open, partially open, or closed stomata, or false positives. We then trained a CNN
that takes these images as an input and infers the probability of each belonging to the four separate classes
(Supplementary Fig. 2a). After training, the classification accuracy reached an average of 92.9% on the test
dataset (Supplementary Fig. 2b). Images classified as false positives were discarded, and closed stomata
were assigned a stomatal aperture of 0 µm. Regions containing open and partially open stomata were
further analysed to isolate the stomatal pore. This was done by combining region segmentation with the
filtering out of non-pore regions using manually defined geometrical shape parameters. Finally, the minor
axis length of the stomatal pore was retrieved as the stomatal aperture.
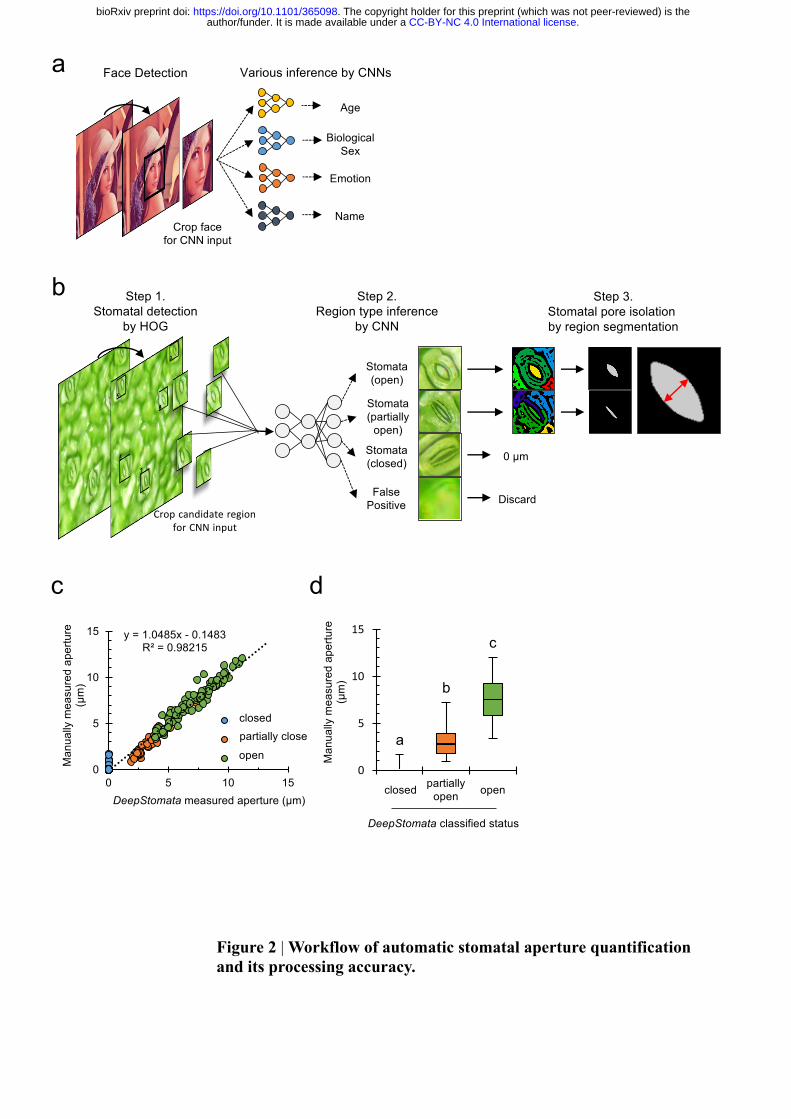
To evaluate the accuracy of the proposed method, the automatically measured stomatal apertures were
compared with manually measured values. The slope (1.048) and the R-squared value (0.982) of the
regression line revealed a negligible difference between the two datasets (Fig. 2c). In addition, the status of
the stomata inferred by the CNN showed a clear segregation between open, partially open, and closed
stomata, based on their stomatal apertures. The maximum aperture of the closed stomata was 1.7 µm. The
minimum and maximum values of the partially open stomata were 0.9 µm and 3.4 µm, respectively, while
for the open stomata they were 7.2 µm and 12 µm, respectively (Fig. 2d). This suggests that deep learning
not only functions as an efficient conditional branch, but also enables a human-like qualitative decision to
be embedded in the image analysis pipeline.
Based on the proposed method, we built a program (DeepStomata) that enables batch image
processing. We first analysed the effect of the plant hormone abscisic acid (ABA) and the fungal toxin
fusicoccin (FC) on stomatal movement, which are known to inhibit and induce stomatal opening,
respectively1,2,15. We determined their half-maximal active concentration by treating stomata with various
concentrations of the compounds, followed by image acquisition and automatic quantification (Fig. 3a and
3b). The calculated half-maximal inhibitory concentration (IC50) of ABA and the half-maximal effective
concentration (EC50) of FC against stomatal opening were 474 nM and 4.46 µM, respectively. Our
.CC-BY-NC 4.0 International licenseauthor/funder. It is made available under aThe copyright holder for this preprint (which was not peer-reviewed) is the. https://doi.org/10.1101/365098doi: bioRxiv preprint

DeepStomata
4
calculated IC50 of ABA was close to a previously reported value, 0.36 µM9. Next, we reanalysed 715
images acquired from our recent chemical screen to identify compounds that alter stomatal movement9. In
addition to the stomatal apertures, we also calculated the percentage of open, partially open, and closed
stomata classified by the CNN. Of the 82 compounds evaluated (Fig. 3c,e and Supplementary Fig. 3), two
(SCL1 and SCL1-2) inhibited light-induced stomatal opening (mean stomatal aperture below 50% of
DMSO-treated plants; Student’s t-test p < 0.05) (Fig. 3d, dark blue). We further confirmed that the
stomatal apertures measured by our program were identical to those measured manually following
treatment with these compounds (Fig. 3e). SCL1 and SCL1-2 were the only bioactive compounds
identified in the previous study9; however, with a more marginal threshold (mean stomatal aperture below
80% of the DMSO-treated plants; Student’s t-test p < 0.05), eight other compounds were also found to
have an inhibitory effect on stomatal opening (Fig. 3d, light blue). These compounds were overlooked in
the qualitative evaluation used in our previous screen. Moreover, the total time required to process the
dataset was 12.3 minutes in the present study, while it was estimated to take over 16 hours for a single
worker to manually measure the apertures in the 715 images at a constant speed without any breaks (Fig.
3f). Collectively, these results suggest that introducing automation by DeepStomata enables a higher
sensitivity (i.e., a lower false negative rate) and a dramatically faster analysis.
As reviewed by Grys et al.16, the phenotypic analysis of biological images first requires that the object
of interest be isolated from the background. Thresholding or edge-detection algorithms followed by region
segmentation have often been used to isolate cells or cellular components; however, the input previously
had to be free of background noise, such as an image acquired using a confocal laser scanning microscope.
Such approaches were not suitable for evaluating stomatal pores in our images, which depict complex leaf
surfaces and contain rich information in the non-stomatal regions (Fig. 1). Moreover, the lack of apparent
pores in the closed stomata made their automated quantification difficult. In this study, we utilized HOG-
based stomata detection with a CNN-based object classifier, which was inspired by a region proposal
method. This allowed us not only to count the closed stomata, but also to crop the sub-regions containing
open stomata, making the pore isolation more straightforward using region segmentation.
In the present study, we established a method that enables the complete automation of stomatal
aperture measurement. To the best of our knowledge, this is the first approach that can process stomata
images obtained using a bright-field ocular microscope. Our study also demonstrates that techniques used
in the field of computer vision and pattern recognition can have powerful applications in plant image
analysis. Moreover, recent technical advances in deep learning have enabled the direct detection of object
positions17–20 and segment regions at a pixel level21,22, in addition to their classification. Since such
methods are capable of learning and processing more complex tasks than conventional machine learning
approaches, we expect that programs incorporating these techniques will further broaden the versatility of
automated tasks used for laborious and repetitive plant image analyses, such as chemical/genetic
screening, thus freeing researchers to focus on deciphering complex phenomena.
.CC-BY-NC 4.0 International licenseauthor/funder. It is made available under aThe copyright holder for this preprint (which was not peer-reviewed) is the. https://doi.org/10.1101/365098doi: bioRxiv preprint
DeepStomata
5
Methods
Code Availability
DeepStomata was written in Python with open source libraries. The source code is available in github
repository (https://github.com/totti0223/deepstomata/) under MIT license.
Stomatal Detection by HOG
Stomatal detection by HOG was performed using the simple_object_detector module of the dlib library
(http://dlib.net), based on the developer’s tutorial (http://dlib.net/train_object_detector.py.html). Greyscaled
images were used for training and detection. Notably, upon detector training and detection, the input image
was down-sampled (2448×1920 px to 512×402 px) to eliminate some of the minor noise within the
original image, which could affect the detection accuracy, and to enhance the detection speed. The co-
ordinates of the detected objects in the down-sampled image were then converted for mapping to the
original image by multiplying by the scaling factor, 4.78 (2448 px / 512 px). Sub-regions were cropped
according to the co-ordinates and passed to the following classifier.
Region Classification by CNN
A TensorFlow library (https://www.tensorflow.org/) was used to construct the CNN classifier, the
architecture of which is described in Supplementary Fig. 2a. A dataset containing, respectively, 590, 480,
and 799 images of open, partially open, and closed stomata and 99 false positives was prepared for training
the network. Images were collected by manually classifying the images obtained by the HOG detector.
Since the primary objective was to discriminate between open and closed stomata and exclude the false
positives, no stringent criteria were introduced to discriminate between open and partially open stomata.
The partially open class was defined to examine whether the CNN could learn a human-like classification.
Stomata were defined as open if their stomatal apertures were larger than about 4 µm, and defined as
partially open if they had smaller apertures.
The classified images were resized to 56×56 px to train the CNN. Training was performed by minimizing
the loss value using the Adam optimizer algorithm with the following parameters: 6% drop out rate;
0.0001 learning rate; 5000 iterations; and 200 batch size. If the maximum probability value of the classifier
showed that the image depicted an open or partially open stoma, the image was passed to the final
quantification step. In the case of images classified as closed, the stomatal apertures of the objects were
assigned a value of 0 µm. False positives were discarded.
Stomatal Pore Quantification
The apertures of the stomatal pores were quantified using the image processing modules of scikit-image
(http://scikit-image.org). The input image, the cropped image generated by the detector, was first converted
.CC-BY-NC 4.0 International licenseauthor/funder. It is made available under aThe copyright holder for this preprint (which was not peer-reviewed) is the. https://doi.org/10.1101/365098doi: bioRxiv preprint
DeepStomata
6
to greyscale, Gaussian blurred, and binarized using an adaptive threshold. Erosion and dilation followed by
dilation and erosion were applied to remove minor noise and fill gaps. Next, the ndimage.label module of
scipy (https://www.scipy.org) and the measure.regionprops module of scikit-image were used to label and
retrieve the geometric properties of the segmented regions. To discriminate the stomatal pore, manually
defined criteria (area, solidity, and major axis length) were introduced to filter out non-stomatal pore
regions. The x,y co-ordinates of the centroid of the respective regions were also introduced as filtering
criteria because the pore tended to be located at the centre of the detected region. The optimized
parameters for filtering were: 100 px < area < 6000 px, solidity > 0.8, major axis length < 40 px, and an
x,y co-ordinate of 0.2 × (X,Y) < (x,y) < 0.8 ± (X,Y) for the centroid, where (X,Y) is the width and height
of the cropped sub-region. The minor axis length of the remaining region was retrieved as the value of the
stomatal aperture.
Image Acquisition
Dayflower (Commelina benghalensis) plants were grown in soil in a glasshouse at 25°C, under a natural
photoperiod of 10 h light/14 h dark. Dayflower leaf discs were treated with chemical compounds for
screening as described previously9. Briefly, plants were incubated in darkness overnight to ensure the
complete closure of their stomata. Using a biopsy punch (Kai Medical), 4-mm leaf discs were excised from
fully expanded leaves under dim light. The discs were emerged in buffer (50 mM KCl, 0.1 mM CaCl2, 0.4
M mannitol, 5 mM MES-KOH, pH 6.5) with or without a screening compound and with or without light
irradiation [150 µmol m–2 s–1 red light (LED-R; Eyela), 50 µmol m–2 s–1 blue light (Stick-B-32; Eyela), or
white light (LED unit of BX43 microscope; Olympus)]. Images of the leaf disc were taken using a
stereomicroscope (BX43; Olympus) with a 10× objective lens (UPlanFL N; Olympus) and a CCD camera
(DP27; Olympus). Upon acquisition, the “Extended Focus Imaging” function of the cellSens standard
software (Olympus) was used to maximize the number of fully focused stomata within each image. The
stomatal apertures were manually quantified using cellSens standard software. Closed stomata were
assigned an aperture of 0 µm, and the stomatal apertures of the open stomata were quantified by measuring
the minor axis length of the stomatal pore.
References
1. Shimazaki, K., Doi, M., Assmann, S. M. & Kinoshita, T. Light Regulation of Stomatal Movement.
Annu. Rev. Plant Biol. 58, 219–247 (2007).
2. Negin, B. & Moshelion, M. The evolution of the role of ABA in the regulation of water-use efficiency:
From biochemical mechanisms to stomatal conductance. Plant Sci. 251, 82–89 (2016).
3. Zeng, W., Melotto, M. & He, S. Y. Plant stomata: A checkpoint of host immunity and pathogen
virulence. Curr. Opin. Biotechnol. 21, 599–603 (2010).
4. Kutsuna, N. et al. Active learning framework with iterative clustering for bioimage classification. Nat.
Commun. 3, 1032 (2012).
.CC-BY-NC 4.0 International licenseauthor/funder. It is made available under aThe copyright holder for this preprint (which was not peer-reviewed) is the. https://doi.org/10.1101/365098doi: bioRxiv preprint

DeepStomata
7
5. Tomiyama, M. et al. Mg-chelatase I subunit 1 and Mg-protoporphyrin IX methyltransferase affect the
stomatal aperture in Arabidopsis thaliana. J. Plant Res. 127, 553–563 (2014).
6. Tsuzuki, T. et al. Mg-chelatase H subunit affects ABA signaling in stomatal guard cells, but is not an
ABA receptor in Arabidopsis thaliana. J. Plant Res. 124, 527–38 (2011).
7. Hayashi, M., Inoue, S.-I., Takahashi, K. & Kinoshita, T. Immunohistochemical detection of blue light-
induced phosphorylation of the plasma membrane H+-ATPase in stomatal guard cells. Plant Cell
Physiol. 52, 1238–48 (2011).
8. Hayashi, M., Inoue, S., Ueno, Y. & Kinoshita, T. A Raf-like protein kinase BHP mediates blue light-
dependent stomatal opening. Sci. Rep. 7, 45586 (2017).
9. Toh, S. et al. Identification and Characterization of Compounds that Affect Stomatal Movements. Plant
Cell Physiol. (2018). doi:10.1093/pcp/pcy061
10. Amos, B., Ludwiczuk, B. & Satyanarayanan, M. OpenFace: A general-purpose face recognition library
with mobile applications. C. Sch. Comput. Sci. Tech. Rep. C. 16, (2016).
11. Taigman, Y., Yang, M., Ranzato, M. & Wolf, L. DeepFace: Closing the gap to human-level
performance in face verification. Proc. IEEE Comput. Soc. Conf. Comput. Vis. Pattern Recognit. 1701–
1708 (2014). doi:10.1109/CVPR.2014.220
12. Cireşan, D. C., Meier, U., Masci, J., Gambardella, L. M. & Schmidhuber, J. ImageNet Classification
with Deep Convolutional Neural Networks. Lancet (London, England) 346, 1501 (2011).
13. King, D. E. Max-Margin Object Detection. (2015).
14. Dalal, N. & Triggs, B. Histograms of Oriented Gradients for Human Detection. in 2005 IEEE Computer
Society Conference on Computer Vision and Pattern Recognition (CVPR’05) 1, 886–893 (IEEE, 1994).
15. Schroeder, J. I., Allen, G. J., Hugouvieux, V., Kwak, J. M. & Waner, D. GUARD CELL SIGNAL
TRANSDUCTION. Annu. Rev. Plant Physiol. Plant Mol. Biol. 52, 627–658 (2001).
16. Grys, B. T. et al. Machine learning and computer vision approaches for phenotypic profiling. 1–7
(2016). doi:10.1083/jcb.201610026
17. Girshick, R., Donahue, J., Darrell, T. & Malik, J. Rich feature hierarchies for accurate object detection
and semantic segmentation. (2013).
18. Girshick, R. Fast R-CNN. (2015).
19. Ren, S., He, K., Girshick, R. & Sun, J. Faster R-CNN: Towards Real-Time Object Detection with
Region Proposal Networks. (2015).
20. Liu, W. et al. SSD: Single Shot MultiBox Detector. (2015). doi:10.1007/978-3-319-46448-0_2
21. Long, J., Shelhamer, E. & Darrell, T. Fully Convolutional Networks for Semantic Segmentation. (2014).
22. Chen, L.-C., Papandreou, G., Kokkinos, I., Murphy, K. & Yuille, A. L. DeepLab: Semantic Image
Segmentation with Deep Convolutional Nets, Atrous Convolution, and Fully Connected CRFs. (2016).
Acknowledgements
We would like to thank M. Uchida (Nagoya University) and E. Asai (Nagoya University) for their
assistance in acquiring the images used in part of this study, and W. Ye (Nagoya University) for critically
reading the manuscript. We thank A. Sato (Chemical Library Center of ITbM, Nagoya University) for
providing information of chemical library compounds. We thank T. Suzuki (Chubu University) and the
.CC-BY-NC 4.0 International licenseauthor/funder. It is made available under aThe copyright holder for this preprint (which was not peer-reviewed) is the. https://doi.org/10.1101/365098doi: bioRxiv preprint

DeepStomata
8
Global COE program “Advanced Systems-Biology” of Nagoya University for the intensive bioinformatics
seminar. This research was supported by a Japan Science and Technology Agency (JST) PRESTO grant
(Y.T., JPMJPR1705); the Advanced Low Carbon Technology Research and Development Program of JST;
the Ministry of Education, Culture, Sports, Science and Technology of Japan [Scientific Research on
Priority Areas (T.K., 15H059556; 15K21750)].
Author contributions
Y.T. and T.K. directed the study and wrote the manuscript. Y.T. designed and wrote the program code with
assistance from D.M. G.B., S.R., and D.M. conceptualized the image analysis. Y.T. and S.T. collected and
directed the manual quantification of stomatal apertures from the microscopy images.
Additional information
Supplementary information is available online. Correspondence and requests for materials should be
addressed to Y.T. and T.K.
Competing interests
The authors declare no competing financial interests.
Figure Legends
Figure 1 | Automatic quantification of stomatal aperture by DeepStomata. a, Taking bright-field
images as an input, our proposed method enables the automation of stomatal aperture measurement. The
detected stomata and their open, partially open, or closed states are marked as red, orange, and blue boxes,
respectively. Enlarged views of representative stomata from each image are shown in b. For each stoma, its
open, partially open, or closed status, and its quantified aperture are shown. The detected stomatal pore
regions of the open stomata are coloured red or orange.
Figure 2 | Workflow and processing accuracy of automatic stomatal aperture quantification. a,
Schematic diagram of facial detection. First, the sub-region of an image that contains a face is detected and
cropped (Face Detection) using predefined features or machine learning. Next, the cropped images are
passed to the trained convolutional neural networks (CNNs) to infer complex factors such as age,
biological sex, emotions, or identity (name). b, Schematic diagram of our proposed method. First, the sub-
regions that contain stomata are obtained by the HOG detector (Step 1; See Supplementary Figure 1a for
details of the constructed HOG detector). Next, cropped images are processed by the CNN to infer whether
the respective input image is an open, partially open, or closed stoma, or a false positive that does not
contain a stoma (Step 2; See Supplementary Figure 2a for details of the CNN architecture). Images
classified as false positives are discarded from the analysis. Closed stomata are assigned a 0-µm stomatal
aperture. Open and partially open stomata are passed to the pore quantification step (Step 3), in which the
images are processed to create and label their segmented regions. To discriminate the stomatal pore,
.CC-BY-NC 4.0 International licenseauthor/funder. It is made available under aThe copyright holder for this preprint (which was not peer-reviewed) is the. https://doi.org/10.1101/365098doi: bioRxiv preprint

DeepStomata
9
manually set criteria were introduced to filter out non-pore regions (See Methods for details). c, Scatter
plot of automatically quantified stomatal apertures versus manually quantified apertures. The
classifications denoted by the CNN are displayed in different colours. The equation and R-squared value of
the regression line are displayed. Data categorized by classification are summarized in d. d, Box plots
showing the stomatal apertures of the closed, partially open, and open stomata classified by the CNN.
Statistical differences were determined using a one-way ANOVA followed by a Tukey post-hoc analysis;
different letters indicate significant differences (p < 0.01).
Figure 3 | Examples of applications in the characterization and screening of compounds that control
stomatal movements. a–b, Dose-response curves of the inhibition of light-induced stomatal opening by
abscisic acid (ABA) (a) or promotion of stomatal opening in the dark by fusicoccin (FC) (b). The IC50 or
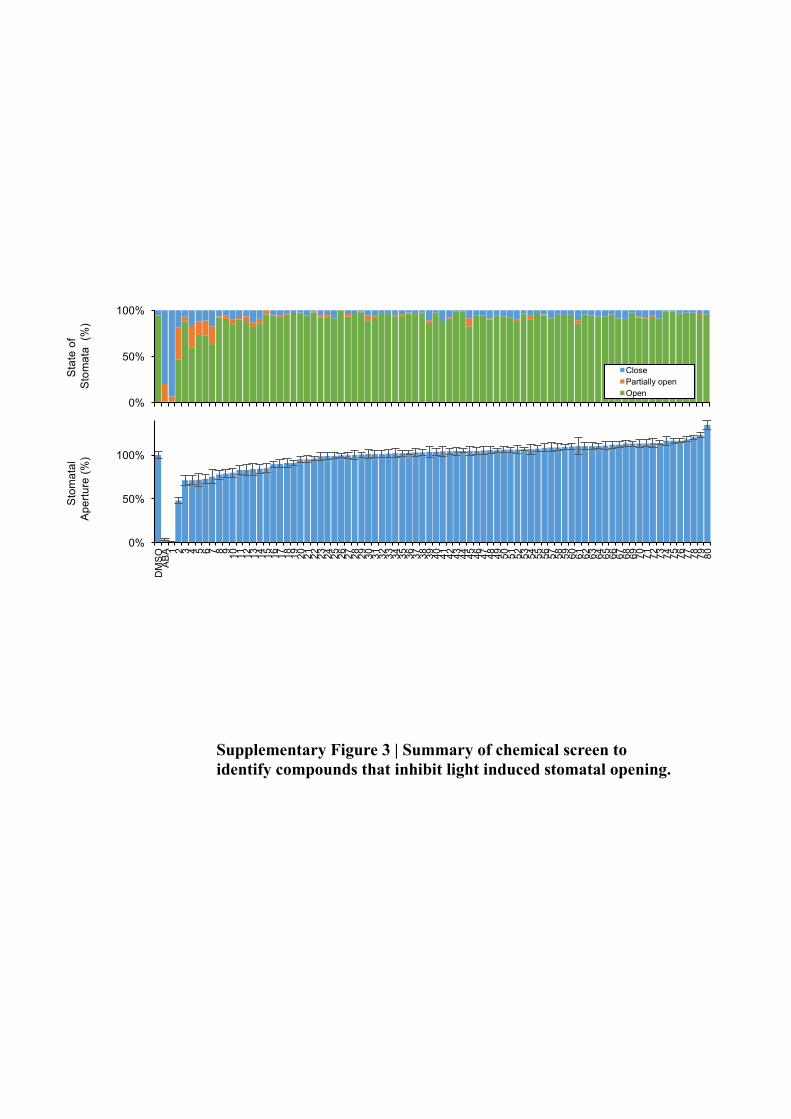
EC50 value and the R-squared value of the sigmoid curves are displayed. c–e, Summary of the chemical
screen performed to identify compounds that inhibit light-induced stomatal opening, analysed using
DeepStomata. Dayflower leaf discs were treated with either DMSO, 10 µM ABA, or 50 µM of a
compound from the chemical library, and then irradiated under red light and blue light for four hours9. For
clarity, some of the results have been omitted. Refer to Supplementary Fig. 3 for the complete set of
results. c, Stacked bar graph representing the ratio of open (green), partially open (blue), and closed
(orange) stomata classified by the CNN. d–e, Values of stomatal apertures relative to those following
DMSO treatment. Asterisks indicate significant differences to the DMSO treatment (Student’s t-test, p <
0.05). Two compounds that caused more than a 50% inhibition of stomatal opening (SCL1 and SCL1-2; p
< 0.05) are coloured dark blue, while eight compounds that caused more than a 20% inhibition of stomatal
opening (p < 0.05) are coloured light blue. e, Manually and automatically measured stomatal apertures of
plants treated with SCL1 and SCL1-2. Means ± SE (n ≥ 60 stomata). f, Comparison of the time required to
quantify the 715 images in this analysis using either DeepStomata (Automation) or manual quantification
(Manual). For the manual quantification, the time was estimated from the average time taken to analyse 10
images multiplied by the number of images in the dataset.
Supplementary Figure 1 | Details of the histogram of oriented gradient (HOG)-based stomatal
detection. a, The trained HOG detector (left) was used to locate the coordinates of the stomata within the
image (right) using a sliding window (red box). The detected stomata are marked with black boxes. b,
Example of images retrieved by the HOG detector, including two regions that do not contain stomata (false
positives). c, Precision and recall values of the HOG detector against the training and test data. Training
data were used to construct the detector, while the test data were independently prepared to evaluate the
detector’s accuracy.
Supplementary Figure 2 | Details of convolutional neural network (CNN)-based object classification.
a, Architecture of the convolutional neural network (CNN) classifier used in this study. Here, one image is
processed through the CNN classifier, resulting in a four-vector variable in layer No. 11. The softmax
function is next applied to truncate the sum of the values to 1, which represents the probability values that
.CC-BY-NC 4.0 International licenseauthor/funder. It is made available under aThe copyright holder for this preprint (which was not peer-reviewed) is the. https://doi.org/10.1101/365098doi: bioRxiv preprint

DeepStomata
10
the image contains an open, closed, or partially open stoma, or a false positive. In this example, the input
image is converted to [1,0,0,0], indicating that the input image is most probably an open stoma. In each of
the convolutional layers, input images are convoluted using a weight with a kernel size of 3 × 3 px and a
stride of 1 × 1 px, bias addition, followed by truncation using a rectified linear unit function. Max pooling
was performed using a stride of 2 × 2 px and a kernel size of 3 × 3 px. The input image, intermediate
images, and the variables produced within the CNN are displayed. Layer No. and Layer Type [Conv,
convolutional layer; Max Pool, max pooling layer; Dense, fully connected layer] are displayed above each
image. The pixel size of the input image, the intermediate data, and the number of weights or variables
used in each layer are displayed below each image. b, Example of images classified using the CNN. c,
Multi-class confusion matrix for the classification results obtained with CNN in the test dataset.
Supplementary Figure 3 | Summary of chemical screen to identify compounds that inhibit light-
induced stomatal opening. Annotation follows that of Fig. 3d and 3e.
.CC-BY-NC 4.0 International licenseauthor/funder. It is made available under aThe copyright holder for this preprint (which was not peer-reviewed) is the. https://doi.org/10.1101/365098doi: bioRxiv preprint
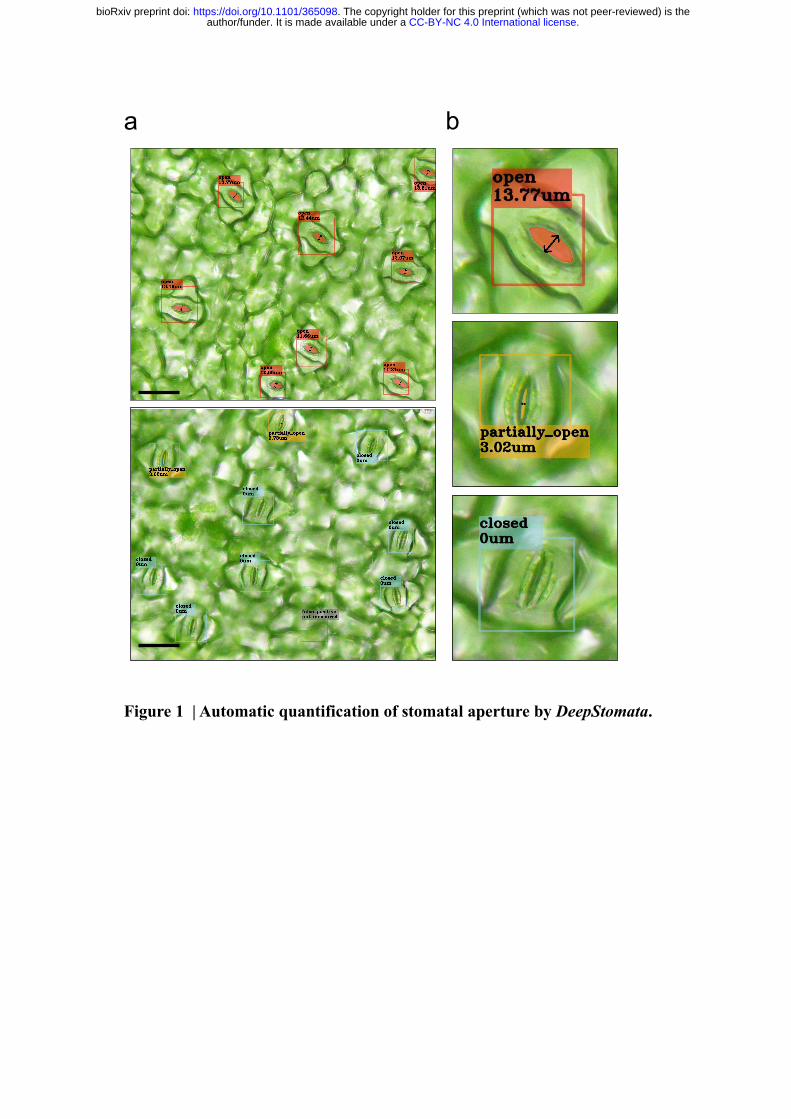
Figure 1 | Automatic quantification of stomatal aperture by DeepStomata.
a b
.CC-BY-NC 4.0 International licenseauthor/funder. It is made available under aThe copyright holder for this preprint (which was not peer-reviewed) is the. https://doi.org/10.1101/365098doi: bioRxiv preprint
Step 2.Region type inference
by CNN
Step 1.Stomatal detection
by HOG
Step 3.Stomatal pore isolation by region segmentation
Stomata(open)
Stomata(partially
open)
Stomata(closed)
FalsePositive Discard
0 µm
Crop candidate regionfor CNN input
b
a
Crop facefor CNN input
Face Detection Various inference by CNNs
Age
BiologicalSex
Emotion
Name
y = 1.0485x - 0.1483R² = 0.98215
0
5
10
15
0 5 10 15
Man
ually
mea
sure
d ap
ertu
re
(µm
)
DeepStomata measured aperture (µm)
closed
partially open
open0
5
10
15
Man
ually
mea
sure
d ap
ertu
re
(µm
)
c d
closed partiallyopen open
DeepStomata classified status
closedpartially close
opena
b
c
Figure 2 | Workflow of automatic stomatal aperture quantification and its processing accuracy.
.CC-BY-NC 4.0 International licenseauthor/funder. It is made available under aThe copyright holder for this preprint (which was not peer-reviewed) is the. https://doi.org/10.1101/365098doi: bioRxiv preprint

0%
50%
100%
DM
SO ABA 1 2 3 4 5 6 7 8 9 10 11 12 13 14 15 16 17 18 19 20 21 22 23 24 25 26 27 28 29 71 72 73 74 75 76 77 78 79 80
0
10
20
Manual (Estimate)
DeepStomata
16.3 hours
0.2 hours(12.3 min)
Stom
atal
Aper
ture
(%)
Stat
e of
St
omat
a (%
)
Stom
atal
Aper
ture
(%)
0%
50%
100%
DMSO ABA SCL1 SCL1-2
DeepStomataManual
Proc
essi
ng T
ime
(hou
rs)e
c
f
ba
ABA concentration (nM)
Stom
atal
Ape
rture
(µm
)
0
5
10
0.001 0.1 10 10000
IC50= 474 nMR2 = 0.904
0
5
10
0.0010.01 0.1 1 10 100
FC concentration (µM)
EC50= 4.46 µMR2 = 0.938
Stom
atal
Ape
rture
(µm
)
0
d
* * * *
* *
80%
0%
50%
100%
1 3 5 7 9 11 13 15 17 19 21 23 25 27 29 31 1 3 5 7 9
Figure 3 | Application examples in characterization and screening of compounds that control stomatal movements.
.CC-BY-NC 4.0 International licenseauthor/funder. It is made available under aThe copyright holder for this preprint (which was not peer-reviewed) is the. https://doi.org/10.1101/365098doi: bioRxiv preprint

TrainData
TestData
Total No. of Images analyzed 43 32
Total No. of Stomata evaluated 567 329
Precision 99.8% 95.4%
Recall 90.9% 94.0%
c
a
b
Supplementary Figure 1 | Details of histogram of oriented gradient (HOG) based stomatal detection.

a
c
197 4 1 0 199(97.5%)
9 266 33 0 308(86.3%)
5 7 228 0 240(95.0%)
2 0 1 52 55(94.5%)
213(92.4%)
277(96.2%)
263(86.7%)
52(100.0%) 802
Ope
n
Parti
ally
Ope
n
Clo
se
Fals
ePo
sitiv
e
Predicted
Open
Partially Open
Close
False Positive
Actu
al
Total(Precision)
Tota
l(R
ecal
l)
Accuracy = 92.6%Average Precision = 93.8%
Average Recall = 93.3%
b
[24.1, -37.3, -19.3, -19.5]
[1, 0, 0, 0]
56 x 56 px
32 feature maps56 x 56 px
28 x 28 px
64 feature maps28 x 28 px
14 x 14 px
128 feature maps14 x 14 px
7 x 7 px 4 x 4 px
1028variables
512variables
256 feature maps7 x 7 px
4variables
Low HighIntensity
Layer No. 1 2 3 4 5 6 7 8 9 10 11Softm
ax
Layer Type Conv MaxPool Conv Max
PoolConv Max
Pool Conv MaxPool Dense Dense Dense
[Open, C
lose, Partially Open, False Positive]=
Open
PartiallyOpen
Close
FalsePositive
Supplementary Figure 2 | Details of convolutional
neural network (CNN) based object classification.
0%
50%
100%
1 3 5 7 9 111315171921232527293133353739414345474951535557596163656769717375777981
ClosePartially openOpen
Stom
atal
Aper
ture
(%)
Stat
e of
St
omat
a (%
)
Supplementary Figure 3 | Summary of chemical screen to identify compounds that inhibit light induced stomatal opening.
0%
50%
100%
DM
SO ABA 1 2 3 4 5 6 7 8 9 10 11 12 13 14 15 16 17 18 19 20 21 22 23 24 25 26 27 28 29 30 31 32 33 34 35 36 37 38 39 40 41 42 43 44 45 46 47 48 49 50 51 52 53 54 55 56 57 58 59 60 61 62 63 64 65 66 67 68 69 70 71 72 73 74 75 76 77 78 79 80
Related Documents