Astron. Astrophys. 319, 7–17 (1997) ASTRONOMY AND ASTROPHYSICS Deep radio observations of the “Lockman Hole” H.R. de Ruiter 1,2 , G. Zamorani 1,2 , P. Parma 2 , G. Hasinger 3 , G. Hartner 4 , J. Tr¨ umper 4 , R. Burg 5 , R. Giacconi 6 , and M. Schmidt 7 1 Osservatorio Astronomico di Bologna, Via Zamboni 33, I-40126 Bologna, Italy 2 Istituto di Radioastronomia del CNR, Via Gobetti, 101, I-40129 Bologna, Italy 3 Astrophysikalisches Institut, An der Sternwarte 16, D-14482 Potsdam, Germany 4 Max Planck Institut f ¨ ur Extra-terrestrische Physik, D-8046 Garching, Germany 5 Space Telescope Science Institute, 3700 San Martin Drive, Baltimore, MD 21218, USA 6 European Southern Observatory, Karl Schwarzschildstr. 2, D-8046 Garching, Germany 7 California Institute of Technology, 105-24 Robinson Lab., Pasadena, CA 91125, USA Received 1 March 1996 / Accepted 27 June 1996 Abstract. A deep radio image of the “Lockman Hole” is pre- sented. The observations, done with the C-configuration of the Very Large Array at a wavelength of 20 cm, are part of a wider study of this field in X-rays with the ROSAT satellite. Optical follow up will provide a sample of objects observed down to very faint flux limits in all three wavelength windows. The radio data reduction is described and a catalog of 149 radio sources with peak flux densities at least four times the local RMS noise is presented. The limiting peak flux density in the central part of the field is ∼120 μJy. The sources have been extracted from a circular area of 20 0 radius around the field center. Radio source counts are briefly discussed and shown to be in good agreement with previous results at similar flux densities. All radio sources have been searched for optical counter- parts on POSS prints and an optical candidate has been found for ∼30 % of the radio sources. The optical identification rate increases at fluxes S < ∼ 0.5 mJy and the increase is mainly due to identifications with relatively bright galaxies (m r < 17.5). Cross correlation with the X-ray source list, which contains 135 sources in the same area, yields 16 possible radio/X-ray as- sociations. After correcting for expected spurious associations, we estimate that ∼ 10 % of the X-ray sources are associated with radio sources at these fluxes. Deep CCD frames provide optical counterparts for most of the radio/X-ray sources. On the basis of partial spectroscopy, optical morphology and cor- relations between radio, optical and X-ray fluxes, we conclude that although the majority ( > ∼ 60 %) of the radio/X-ray asso- ciations are identified with AGNs, a non-negligible fraction of them ( < ∼ 40 %) appears to be associated with normal galaxies. Most of these galaxies have low fluxes, both in radio and in X- rays and they may partly represent the bright X-ray tail of the Send offprint requests to: H.R. de Ruiter same population that is responsible for the upturn in the radio source counts below 1 mJy. Key words: radio continuum: general – X-rays: general 1. Introduction A very deep X-ray survey has recently been carried out with the ROSAT satellite in the “Lockman Hole”, a region of excep- tionally low HI absorption (Lockman et al. 1986). Details of the X-ray observation can be found in Hasinger et al. (1993). The 193 ksec observation reaches an unprecedented X-ray flux level of about 2 × 10 -15 erg cm -2 s -1 , and as a result the sur- face density of X-ray sources is very high, of the order of 400 objects per square degree. In the inner part of the ROSAT field a region with a radius of 20 arcmin was used to obtain a complete sample of X-ray sources; moreover this region is almost completely covered by CCD images in blue and red colors. Optical identification of the X-ray sources can therefore be attempted down to magnitudes around 24 or slightly fainter. Deep observations in other wavelength regions, for exam- ple in the radio, are a logical follow up. Such radio observations were done with the Very Large Array and we report on them in this paper. Our aim was twofold. First, to reach faint radio flux levels and high source densities, while covering the entire cen- tral region of the ROSAT field (about a third of a square degree). Second, to use a sufficiently high angular resolution such that confusion due to the high source density would not constitute a major problem. The ideal combination is an observing wave- length of 20 cm and the C-configuration of the VLA, for which these conditions are best fullfilled.

Welcome message from author
This document is posted to help you gain knowledge. Please leave a comment to let me know what you think about it! Share it to your friends and learn new things together.
Transcript
Astron. Astrophys. 319, 7–17 (1997) ASTRONOMYAND
ASTROPHYSICS
Deep radio observations of the “Lockman Hole”H.R. de Ruiter1,2, G. Zamorani1,2, P. Parma2, G. Hasinger3, G. Hartner4, J. Trumper4, R. Burg5, R. Giacconi6,and M. Schmidt7
1 Osservatorio Astronomico di Bologna, Via Zamboni 33, I-40126 Bologna, Italy2 Istituto di Radioastronomia del CNR, Via Gobetti, 101, I-40129 Bologna, Italy3 Astrophysikalisches Institut, An der Sternwarte 16, D-14482 Potsdam, Germany4 Max Planck Institut fur Extra-terrestrische Physik, D-8046 Garching, Germany5 Space Telescope Science Institute, 3700 San Martin Drive, Baltimore, MD 21218, USA6 European Southern Observatory, Karl Schwarzschildstr. 2, D-8046 Garching, Germany7 California Institute of Technology, 105-24 Robinson Lab., Pasadena, CA 91125, USA
Received 1 March 1996 / Accepted 27 June 1996
Abstract. A deep radio image of the “Lockman Hole” is pre-sented. The observations, done with the C-configuration of theVery Large Array at a wavelength of 20 cm, are part of a widerstudy of this field in X-rays with the ROSAT satellite. Opticalfollow up will provide a sample of objects observed down tovery faint flux limits in all three wavelength windows.
The radio data reduction is described and a catalog of 149radio sources with peak flux densities at least four times thelocal RMS noise is presented. The limiting peak flux densityin the central part of the field is ∼120 µJy. The sources havebeen extracted from a circular area of 20′ radius around the fieldcenter.
Radio source counts are briefly discussed and shown to be ingood agreement with previous results at similar flux densities.
All radio sources have been searched for optical counter-parts on POSS prints and an optical candidate has been foundfor ∼30 % of the radio sources. The optical identification rateincreases at fluxes S <∼ 0.5 mJy and the increase is mainly dueto identifications with relatively bright galaxies (mr < 17.5).
Cross correlation with the X-ray source list, which contains135 sources in the same area, yields 16 possible radio/X-ray as-sociations. After correcting for expected spurious associations,we estimate that ∼ 10 % of the X-ray sources are associatedwith radio sources at these fluxes. Deep CCD frames provideoptical counterparts for most of the radio/X-ray sources. Onthe basis of partial spectroscopy, optical morphology and cor-relations between radio, optical and X-ray fluxes, we concludethat although the majority (>∼ 60 %) of the radio/X-ray asso-ciations are identified with AGNs, a non-negligible fraction ofthem (<∼ 40 %) appears to be associated with normal galaxies.Most of these galaxies have low fluxes, both in radio and in X-rays and they may partly represent the bright X-ray tail of the
Send offprint requests to: H.R. de Ruiter
same population that is responsible for the upturn in the radiosource counts below 1 mJy.
Key words: radio continuum: general – X-rays: general
1. Introduction
A very deep X-ray survey has recently been carried out withthe ROSAT satellite in the “Lockman Hole”, a region of excep-tionally low HI absorption (Lockman et al. 1986). Details ofthe X-ray observation can be found in Hasinger et al. (1993).The 193 ksec observation reaches an unprecedented X-ray fluxlevel of about 2× 10⁻¹⁵ erg cm −2s−1, and as a result the sur-face density of X-ray sources is very high, of the order of 400objects per square degree.
In the inner part of the ROSAT field a region with a radiusof 20 arcmin was used to obtain a complete sample of X-raysources; moreover this region is almost completely covered byCCD images in blue and red colors. Optical identification of theX-ray sources can therefore be attempted down to magnitudesaround 24 or slightly fainter.
Deep observations in other wavelength regions, for exam-ple in the radio, are a logical follow up. Such radio observationswere done with the Very Large Array and we report on them inthis paper. Our aim was twofold. First, to reach faint radio fluxlevels and high source densities, while covering the entire cen-tral region of the ROSAT field (about a third of a square degree).Second, to use a sufficiently high angular resolution such thatconfusion due to the high source density would not constitutea major problem. The ideal combination is an observing wave-length of 20 cm and the C-configuration of the VLA, for whichthese conditions are best fullfilled.
8 H.R. de Ruiter et al.: Deep radio observations of the “Lockman Hole”
In Sect. 2 we give a general discussion of the VLA obser-vations. First we describe the reduction of the radio data andhow we arrived at the final radio-mosaic that covers the entireX-ray field. From the radio image we extracted a sample of radiosources, which we present in the form of a table that lists someobservational parameters like position, flux density and angularextent.
The search for radio counterparts of X-ray sources is de-scribed in Sect. 3, together with a preliminary search for opticalcounterparts of all radio sources.
Finally, in Sect. 4, we discuss the counts and sky distributionof the radio sources, and the optical and X-ray counterparts.For shortness we will denote radio sources detected only in theoptical as RO, only in X-rays as RX and in the optical as wellas X-rays as ROX objects.
2. The radio observations
2.1. Data reduction
The central part of the ROSAT field has a size of about 20 ar-cmin in radius; CCD images of a large fraction of that wholearea already exist. Our aim was to cover the ROSAT area also inthe radio band, without making unduly heavy demands on VLAobserving time, and without complicating the reduction proce-dure of the radio data unnecessarily. As an optimum solutionwe chose for 20 cm continuum observations with the C con-figuration of the VLA: the A and B configurations would havedrastically limited the field of view and thus many differentpointings would have been necessary, while the D configura-tion would have provided too low a resolution. On the contrary,with the C configuration the synthesized beam is ∼ 12 − 13arcsec, which is adequate for our purposes. By using only fourdifferent pointing positions the flux density limit can be madereasonably uniform over the whole ROSAT field.
The observations were done in two pieces of eight hourseach on November 8 and December 18, 1990 at the frequenciesof 1465 and 1515 MHz with bandwidth 50 MHz. The data atthe two different frequencies were kept separate in the entirereduction procedure and were combined only at the very end.Taking into account the time spent on calibrator sources the ef-fective observing time of the ROSAT field was about twelvehours. We used four different pointing positions separated by15 arcmin either in Right Ascension or in Declination, and sit-uated symmetrically around the ROSAT field center, which isα(J2000) = 10h52m, δ(J2000) = 57o21′36′′. Each pointing po-sition was therefore observed for three hours. This particularchoice of pointing positions was adopted in order to obtain areasonably uniform RMS noise level over the inner 10 arcminof the ROSAT field and a slow increase out to the ROSAT bor-der at 20 arcmin. As will be seen below this goal was indeedachieved.
The four different pointings were calibrated separately, us-ing 3C 286 as primary flux calibrator. The flux densities as-sumed for 3C 286 were 14.635 Jy at 1465 MHz and 14.399 Jyat 1515 MHz. 1031+567 was selected as secondary calibrator
for the amplitudes and phases. The standard calibration proce-dure of the AIPS reduction package was followed. Obviouslybad data were edited out first, while a check on amplitude de-viations was done also after the calibration.
For each of the four fields an image of 1024× 1024 pixelswas constructed, using the AIPS-task MX. Since there are novery strong sources in the immediate vicinity of the LockmanHole area it was not necessary to make the images larger than1024 × 1024. A pixel-size of 2.5 × 2.5 arcsec was used. Theimages were CLEANed with the procedure built in in MX, usinga restoring beam of ∼12 arcsec. The RMS noise levels in theeight cleaned images are uniform and of the order of 0.07 mJy(no primary beam correction applied yet), both at 1465 and 1515MHz.
Before combining the four individual images into one mo-saic, we had to take into account an effect described before byMitchell & Condon (1985) and Kollgaard et al. (1995), whoused exactly the same combination of frequency, bandwidthand VLA configuration (C) as we did. Source positions are ra-dially squeezed towards the field center and the position shift isa function of and increases with distance from the field center.We measured a radial compression of 0.47 % by comparing thepositions of sources observed in different fields. A linear cor-rection is sufficiently accurate for the combination of the fourfields, because we are using only the inner part of each radiofield. Correcting for the compression reduced the discrepanciesbetween the positions of the same sources in different fieldsbelow 1 arcsec.
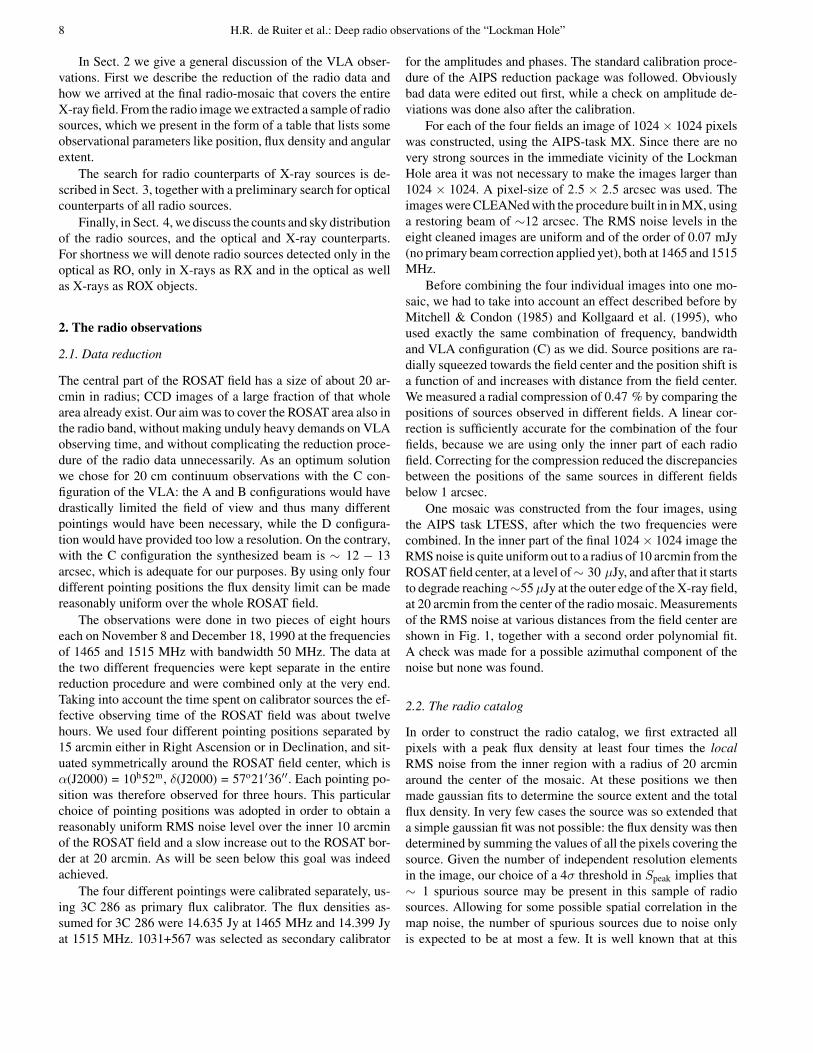
One mosaic was constructed from the four images, usingthe AIPS task LTESS, after which the two frequencies werecombined. In the inner part of the final 1024× 1024 image theRMS noise is quite uniform out to a radius of 10 arcmin from theROSAT field center, at a level of∼ 30 µJy, and after that it startsto degrade reaching∼55µJy at the outer edge of the X-ray field,at 20 arcmin from the center of the radio mosaic. Measurementsof the RMS noise at various distances from the field center areshown in Fig. 1, together with a second order polynomial fit.A check was made for a possible azimuthal component of thenoise but none was found.
2.2. The radio catalog
In order to construct the radio catalog, we first extracted allpixels with a peak flux density at least four times the localRMS noise from the inner region with a radius of 20 arcminaround the center of the mosaic. At these positions we thenmade gaussian fits to determine the source extent and the totalflux density. In very few cases the source was so extended thata simple gaussian fit was not possible: the flux density was thendetermined by summing the values of all the pixels covering thesource. Given the number of independent resolution elementsin the image, our choice of a 4σ threshold in Speak implies that∼ 1 spurious source may be present in this sample of radiosources. Allowing for some possible spatial correlation in themap noise, the number of spurious sources due to noise onlyis expected to be at most a few. It is well known that at this
H.R. de Ruiter et al.: Deep radio observations of the “Lockman Hole” 9
Fig. 1. The RMS noise (in µJy) as a function of distance from theimage center. No azimuthal component was found. The broken line isa quadratic best fit, which, however, slightly exaggerates the increaseof the noise towards the field center. The actual measurements show aplateau with σ ∼ 30 µJy all the way to the center.
level an accurate determination of completeness and reliabilityof a sample of radio sources is problematic, due to the presenceof faint (< 4σ) sources, whose flux densities may be boostedby noise-fluctuations above the 4σ limit. Therefore, when e.g.constructing source counts one should use a higher limit (atleast, say, 5σ, see in particular Sect. 4).
The resulting list of radio sources has 149 entries, and isgiven in Table 1. Column 1 gives a running number. In columns2 and 3 right ascension and declination for epoch J2000 aregiven, followed by the total flux density at 1.5 GHz in column4. An asterisk after the flux density indicates that the peak fluxdensity is between 4 and 5 times the local RMS noise. Thelargest angular size and its position angle are given in columns5 and 6. The errors in position and flux density were determinedfollowing the recipe given by Kollgaard et al (1995). Note thatthe internal position errors do not account for absolute errorswhich may be of the order of 1 to 2 arcsec. We therefore addedan error of 1.5 arcsec in quadrature, and this is the total positionerror given in Table 1.
We do not give an error estimate of the angular size andposition angle: while the formal uncertainties of the gaussianfits are usually of the order of one arcsec, other errors, e.g.due to bandwidth smearing, may be more important but hard toestimate.
Some sources in Table 1 are listed as double or triple. Thedecision to consider two or three components as belonging toa single source is somewhat ambiguous. In a few cases (seee.g. sources 57 and 71) the probability that we deal with gen-uine double or triple sources is quite high, but in other casesthe classification as double source is purely based on the smallseparation between the components and the approximate equal-ity of their flux densities (e.g. source 99). Considering the high
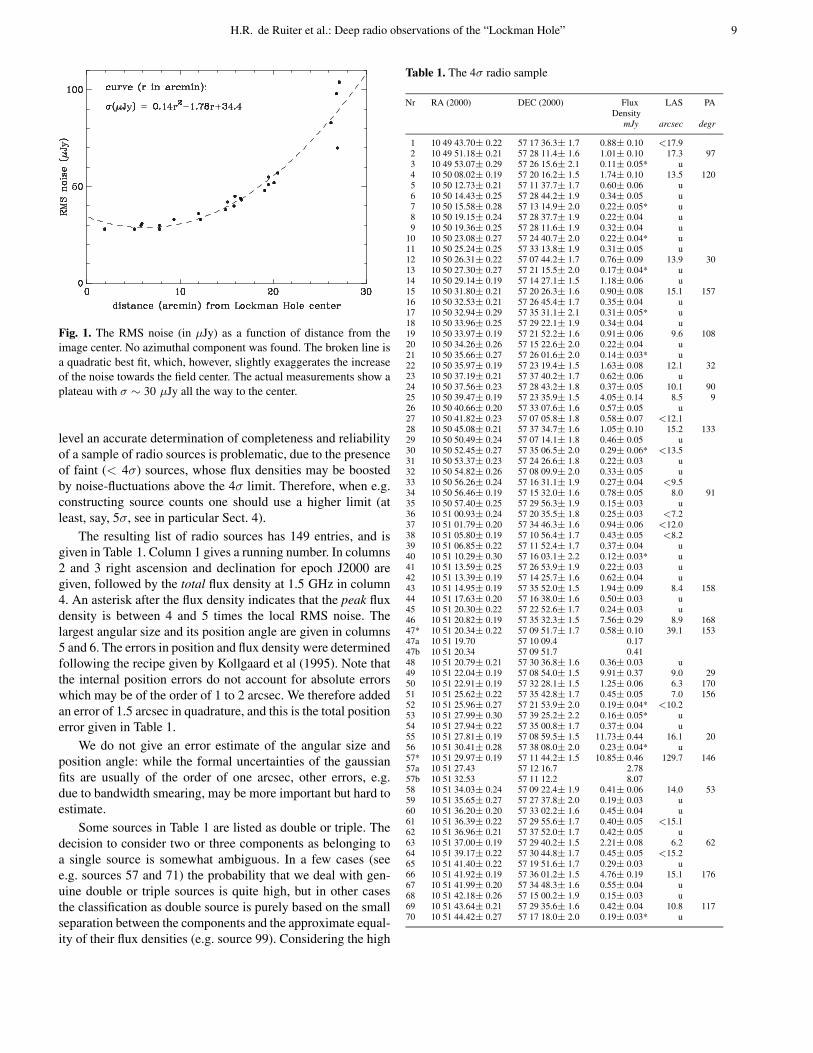
Table 1. The 4σ radio sample
Nr RA (2000) DEC (2000) Flux LAS PADensity
mJy arcsec degr
1 10 49 43.70± 0.22 57 17 36.3± 1.7 0.88± 0.10 <17.92 10 49 51.18± 0.21 57 28 11.4± 1.6 1.01± 0.10 17.3 973 10 49 53.07± 0.29 57 26 15.6± 2.1 0.11± 0.05* u4 10 50 08.02± 0.19 57 20 16.2± 1.5 1.74± 0.10 13.5 1205 10 50 12.73± 0.21 57 11 37.7± 1.7 0.60± 0.06 u6 10 50 14.43± 0.25 57 28 44.2± 1.9 0.34± 0.05 u7 10 50 15.58± 0.28 57 13 14.9± 2.0 0.22± 0.05* u8 10 50 19.15± 0.24 57 28 37.7± 1.9 0.22± 0.04 u9 10 50 19.36± 0.25 57 28 11.6± 1.9 0.32± 0.04 u
10 10 50 23.08± 0.27 57 24 40.7± 2.0 0.22± 0.04* u11 10 50 25.24± 0.25 57 33 13.8± 1.9 0.31± 0.05 u12 10 50 26.31± 0.22 57 07 44.2± 1.7 0.76± 0.09 13.9 3013 10 50 27.30± 0.27 57 21 15.5± 2.0 0.17± 0.04* u14 10 50 29.14± 0.19 57 14 27.1± 1.5 1.18± 0.06 u15 10 50 31.80± 0.21 57 20 26.3± 1.6 0.90± 0.08 15.1 15716 10 50 32.53± 0.21 57 26 45.4± 1.7 0.35± 0.04 u17 10 50 32.94± 0.29 57 35 31.1± 2.1 0.31± 0.05* u18 10 50 33.96± 0.25 57 29 22.1± 1.9 0.34± 0.04 u19 10 50 33.97± 0.19 57 21 52.2± 1.6 0.91± 0.06 9.6 10820 10 50 34.26± 0.26 57 15 22.6± 2.0 0.22± 0.04 u21 10 50 35.66± 0.27 57 26 01.6± 2.0 0.14± 0.03* u22 10 50 35.97± 0.19 57 23 19.4± 1.5 1.63± 0.08 12.1 3223 10 50 37.19± 0.21 57 37 40.2± 1.7 0.62± 0.06 u24 10 50 37.56± 0.23 57 28 43.2± 1.8 0.37± 0.05 10.1 9025 10 50 39.47± 0.19 57 23 35.9± 1.5 4.05± 0.14 8.5 926 10 50 40.66± 0.20 57 33 07.6± 1.6 0.57± 0.05 u27 10 50 41.82± 0.23 57 07 05.8± 1.8 0.58± 0.07 <12.128 10 50 45.08± 0.21 57 37 34.7± 1.6 1.05± 0.10 15.2 13329 10 50 50.49± 0.24 57 07 14.1± 1.8 0.46± 0.05 u30 10 50 52.45± 0.27 57 35 06.5± 2.0 0.29± 0.06* <13.531 10 50 53.37± 0.23 57 24 26.6± 1.8 0.22± 0.03 u32 10 50 54.82± 0.26 57 08 09.9± 2.0 0.33± 0.05 u33 10 50 56.26± 0.24 57 16 31.1± 1.9 0.27± 0.04 <9.534 10 50 56.46± 0.19 57 15 32.0± 1.6 0.78± 0.05 8.0 9135 10 50 57.40± 0.25 57 29 56.3± 1.9 0.15± 0.03 u36 10 51 00.93± 0.24 57 20 35.5± 1.8 0.25± 0.03 <7.237 10 51 01.79± 0.20 57 34 46.3± 1.6 0.94± 0.06 <12.038 10 51 05.80± 0.19 57 10 56.4± 1.7 0.43± 0.05 <8.239 10 51 06.85± 0.22 57 11 52.4± 1.7 0.37± 0.04 u40 10 51 10.29± 0.30 57 16 03.1± 2.2 0.12± 0.03* u41 10 51 13.59± 0.25 57 26 53.9± 1.9 0.22± 0.03 u42 10 51 13.39± 0.19 57 14 25.7± 1.6 0.62± 0.04 u43 10 51 14.95± 0.19 57 35 52.0± 1.5 1.94± 0.09 8.4 15844 10 51 17.63± 0.20 57 16 38.0± 1.6 0.50± 0.03 u45 10 51 20.30± 0.22 57 22 52.6± 1.7 0.24± 0.03 u46 10 51 20.82± 0.19 57 35 32.3± 1.5 7.56± 0.29 8.9 16847* 10 51 20.34± 0.22 57 09 51.7± 1.7 0.58± 0.10 39.1 15347a 10 51 19.70 57 10 09.4 0.1747b 10 51 20.34 57 09 51.7 0.4148 10 51 20.79± 0.21 57 30 36.8± 1.6 0.36± 0.03 u49 10 51 22.04± 0.19 57 08 54.0± 1.5 9.91± 0.37 9.0 2950 10 51 22.91± 0.19 57 32 28.1± 1.5 1.25± 0.06 6.3 17051 10 51 25.62± 0.22 57 35 42.8± 1.7 0.45± 0.05 7.0 15652 10 51 25.96± 0.27 57 21 53.9± 2.0 0.19± 0.04* <10.253 10 51 27.99± 0.30 57 39 25.2± 2.2 0.16± 0.05* u54 10 51 27.94± 0.22 57 35 00.8± 1.7 0.37± 0.04 u55 10 51 27.81± 0.19 57 08 59.5± 1.5 11.73± 0.44 16.1 2056 10 51 30.41± 0.28 57 38 08.0± 2.0 0.23± 0.04* u57* 10 51 29.97± 0.19 57 11 44.2± 1.5 10.85± 0.46 129.7 14657a 10 51 27.43 57 12 16.7 2.7857b 10 51 32.53 57 11 12.2 8.0758 10 51 34.03± 0.24 57 09 22.4± 1.9 0.41± 0.06 14.0 5359 10 51 35.65± 0.27 57 27 37.8± 2.0 0.19± 0.03 u60 10 51 36.20± 0.20 57 33 02.2± 1.6 0.45± 0.04 u61 10 51 36.39± 0.22 57 29 55.6± 1.7 0.40± 0.05 <15.162 10 51 36.96± 0.21 57 37 52.0± 1.7 0.42± 0.05 u63 10 51 37.00± 0.19 57 29 40.2± 1.5 2.21± 0.08 6.2 6264 10 51 39.17± 0.22 57 30 44.8± 1.7 0.45± 0.05 <15.265 10 51 41.40± 0.22 57 19 51.6± 1.7 0.29± 0.03 u66 10 51 41.92± 0.19 57 36 01.2± 1.5 4.76± 0.19 15.1 17667 10 51 41.99± 0.20 57 34 48.3± 1.6 0.55± 0.04 u68 10 51 42.18± 0.26 57 15 00.2± 1.9 0.15± 0.03 u69 10 51 43.64± 0.21 57 29 35.6± 1.6 0.42± 0.04 10.8 11770 10 51 44.42± 0.27 57 17 18.0± 2.0 0.19± 0.03* u
10 H.R. de Ruiter et al.: Deep radio observations of the “Lockman Hole”
Table 1. (continued)
Nr RA (2000) DEC (2000) Flux LAS PADensity
mJy arcsec degr
71* 10 51 48.72± 0.19 57 32 48.2± 1.5 15.39± 0.58 137.5 12771a 10 51 44.28 57 33 13.6 11.6571b 10 51 48.72 57 32 48.2 0.7571c 10 51 55.54 57 32 07.0 2.9872 10 51 49.88± 0.26 57 26 36.1± 2.0 0.22± 0.06 25.0 9073 10 51 52.36± 0.19 57 09 49.6± 1.5 2.96± 0.11 8.0 8074 10 51 58.93± 0.24 57 23 30.9± 1.9 0.19± 0.03 u75 10 52 00.29± 0.30 57 24 20.3± 2.2 0.13± 0.03* u76 10 52 01.62± 0.30 57 40 49.4± 2.2 0.21± 0.05* u77 10 52 06.41± 0.19 57 41 09.3± 1.5 10.25± 0.50 15.3 578 10 52 07.05± 0.25 57 07 44.0± 1.9 0.20± 0.04 u79 10 52 07.49± 0.22 57 19 02.7± 1.7 0.29± 0.04 <9.480 10 52 10.52± 0.26 57 12 02.8± 2.0 0.16± 0.03 u81 10 52 11.01± 0.19 57 29 07.6± 1.5 1.46± 0.06 9.4 9182 10 52 12.08± 0.30 57 15 48.0± 2.2 0.10± 0.03* u83 10 52 12.40± 0.23 57 24 49.7± 1.8 0.27± 0.03 u84 10 52 13.30± 0.22 57 16 04.5± 1.7 0.31± 0.03 u85 10 52 17.12± 0.27 57 35 29.3± 2.0 0.21± 0.04* u86 10 52 17.68± 0.26 57 21 25.0± 1.9 0.18± 0.03 u87 10 52 24.27± 0.19 57 08 38.4± 1.5 2.52± 0.11 14.4 11388 10 52 25.10± 0.26 57 11 30.5± 2.0 0.12± 0.03 u89 10 52 25.59± 0.19 57 33 22.1± 1.5 4.51± 0.16 9.9 9090 10 52 25.64± 0.29 57 22 47.0± 2.2 0.10± 0.03* u91 10 52 26.64± 0.29 57 27 59.3± 2.1 0.16± 0.03* u92 10 52 29.41± 0.27 57 12 40.0± 2.0 0.19± 0.03* u93 10 52 30.49± 0.22 57 13 10.6± 1.7 0.31± 0.03 u94 10 52 30.47± 0.23 57 08 52.2± 1.8 0.26± 0.04 u95 10 52 31.01± 0.27 57 34 58.1± 2.0 0.20± 0.04* u96 10 52 31.78± 0.19 57 06 49.7± 1.6 1.23± 0.08 10.4 3897 10 52 32.35± 0.28 57 08 42.3± 2.1 0.26± 0.05* 11.4 6898 10 52 35.34± 0.23 57 26 49.0± 1.8 0.35± 0.05 <18.099* 10 52 37.17± 0.19 57 31 02.7± 1.5 59.45± 1.91 63.7 2699a 10 52 36.44 57 30 48.8 34.1599b 10 52 38.02 57 31 16.2 25.30
100 10 52 39.42± 0.27 57 24 29.8± 2.0 0.14± 0.03* u101 10 52 41.43± 0.19 57 23 19.8± 1.5 1.72± 0.07 9.4 88102 10 52 42.27± 0.22 57 24 43.2± 1.8 0.22± 0.03 u103 10 52 42.55± 0.22 57 19 14.8± 1.7 0.25± 0.03 u104 10 52 45.01± 0.23 57 36 16.4± 1.8 0.46± 0.06 14.3 84105 10 52 52.39± 0.23 57 28 58.8± 1.8 0.20± 0.03 u106 10 52 52.62± 0.24 57 07 53.1± 1.9 0.28± 0.04 u107 10 52 53.30± 0.28 57 27 00.8± 2.0 0.13± 0.03* u108 10 52 53.80± 0.27 57 18 23.6± 2.0 0.17± 0.03* u109 10 52 55.27± 0.19 57 19 49.8± 1.5 2.69± 0.09 8.7 28110 10 52 56.34± 0.24 57 23 59.7± 1.9 0.19± 0.03 u111* 10 52 57.20± 0.21 57 08 29.9± 1.7 0.60± 0.07 19.5 40111a 10 52 56.73 57 08 25.0 0.30111b 10 52 57.67 57 08 34.9 0.30112 10 52 57.77± 0.27 57 15 15.6± 2.0 0.18± 0.03* u113 10 52 59.47± 0.23 57 32 23.9± 1.8 0.28± 0.04 <8.7114 10 53 01.72± 0.26 57 25 20.8± 1.9 0.15± 0.03 u115 10 53 01.34± 0.20 57 05 42.7± 1.6 0.93± 0.06 u116 10 53 03.78± 0.22 57 35 32.0± 1.8 0.37± 0.04 u117 10 53 03.71± 0.22 57 12 05.5± 1.7 0.36± 0.04 u118 10 53 04.16± 0.25 57 15 46.0± 1.9 0.19± 0.03 u119 10 53 04.80± 0.20 57 30 55.6± 1.6 0.44± 0.04 u120 10 53 07.75± 0.28 57 15 03.2± 2.0 0.18± 0.03* u121 10 53 08.12± 0.22 57 22 22.9± 1.7 0.34± 0.03 u122 10 53 08.26± 0.22 57 16 57.8± 1.7 0.43± 0.05 15.4 106123 10 53 09.25± 0.30 57 37 11.3± 2.2 0.17± 0.05* u124 10 53 09.34± 0.22 57 06 36.7± 1.7 0.56± 0.05 u125 10 53 12.09± 0.22 57 11 05.4± 1.7 0.59± 0.07 16.9 127126 10 53 12.53± 0.23 57 31 12.1± 1.8 0.23± 0.04 u127 10 53 14.01± 0.22 57 30 18.7± 1.7 0.29± 0.04 u128 10 53 16.62± 0.29 57 35 50.4± 2.1 0.25± 0.05* u129 10 53 18.84± 0.21 57 21 41.1± 1.6 0.35± 0.03 u130 10 53 19.08± 0.20 57 18 51.4± 1.6 0.61± 0.04 7.6 39131 10 53 19.53± 0.27 57 12 45.0± 2.0 0.17± 0.04* u132 10 53 22.95± 0.21 57 15 01.2± 1.7 0.50± 0.05 12.6 74133 10 53 24.60± 0.20 57 16 57.7± 1.6 0.56± 0.04 6.8 97134 10 53 25.18± 0.20 57 29 10.7± 1.6 0.55± 0.04 6.4 20135 10 53 26.47± 0.23 57 14 04.3± 1.8 0.30± 0.04 <5.9136 10 53 27.45± 0.28 57 09 31.7± 2.1 0.35± 0.07* u137 10 53 27.91± 0.24 57 11 14.6± 1.8 0.23± 0.04 u
Table 1. (continued)
Nr RA (2000) DEC (2000) Flux LAS PADensity
mJy arcsec degr
138 10 53 35.10± 0.24 57 29 20.0± 1.8 0.21± 0.04 u139 10 53 40.67± 0.28 57 26 27.0± 2.0 0.13± 0.04* u140 10 53 40.75± 0.27 57 19 19.3± 2.0 0.18± 0.04* u141 10 53 40.87± 0.19 57 19 52.7± 1.5 1.46± 0.07 7.9 30142 10 53 42.02± 0.23 57 30 25.4± 1.8 0.27± 0.04 u143 10 53 43.60± 0.27 57 25 31.1± 2.0 0.22± 0.04* u144 10 53 47.94± 0.25 57 17 36.6± 1.9 0.39± 0.06 <17.2145 10 53 56.31± 0.27 57 22 41.7± 2.0 0.18± 0.04* u146 10 54 00.50± 0.19 57 33 20.8± 1.5 2.86± 0.15 u147 10 54 05.97± 0.28 57 24 13.6± 2.0 0.21± 0.04* u148 10 54 06.65± 0.19 57 12 56.6± 1.5 1.76± 0.11 13.4 120149 10 54 21.05± 0.20 57 25 43.7± 1.6 0.80± 0.07 7.2 98
density of sources in the Lockman Hole field it is possible thatfor one or two sources the components are in reality unrelatedradio sources.
A “u” in column 5 stands for “unresolved”. For faint sources(S1.5 < 0.2 mJy) this means that the source may in reality beas large as the synthesized beam (∼ 12 arcsec), while for thestrongest sources (S1.5 > 1 mJy) the implied size is smallerthan a few arcsec.
The question of the sample completeness is a highly com-plicated one, especially if the detection criterion is based on apeak flux density of less than about ten times the RMS noise.An extensive discussion of completeness, taking into accountdetection limit and angular size distribution can be found inWindhorst et al. (1984); see also Fomalont et al. (1991). Accu-rate statistical corrections can be applied to e.g. source counts.Unfortunately, when trying to identify X-ray sources with in-dividual radio sources such a statistical approach is not valid,and the problem of completeness has to be kept in mind in thefollowing when we give identification percentages of RX andROX objects – those numbers should be considered as indica-tive, and perhaps only as lower limits. Although never explicitlystated, this same problem plagues similar studies, where radiocounterparts of X-ray sources are sought down to the∼ 4− 5σlevel (e.g. Warwick & Barber 1992, Boyle et al. 1993).
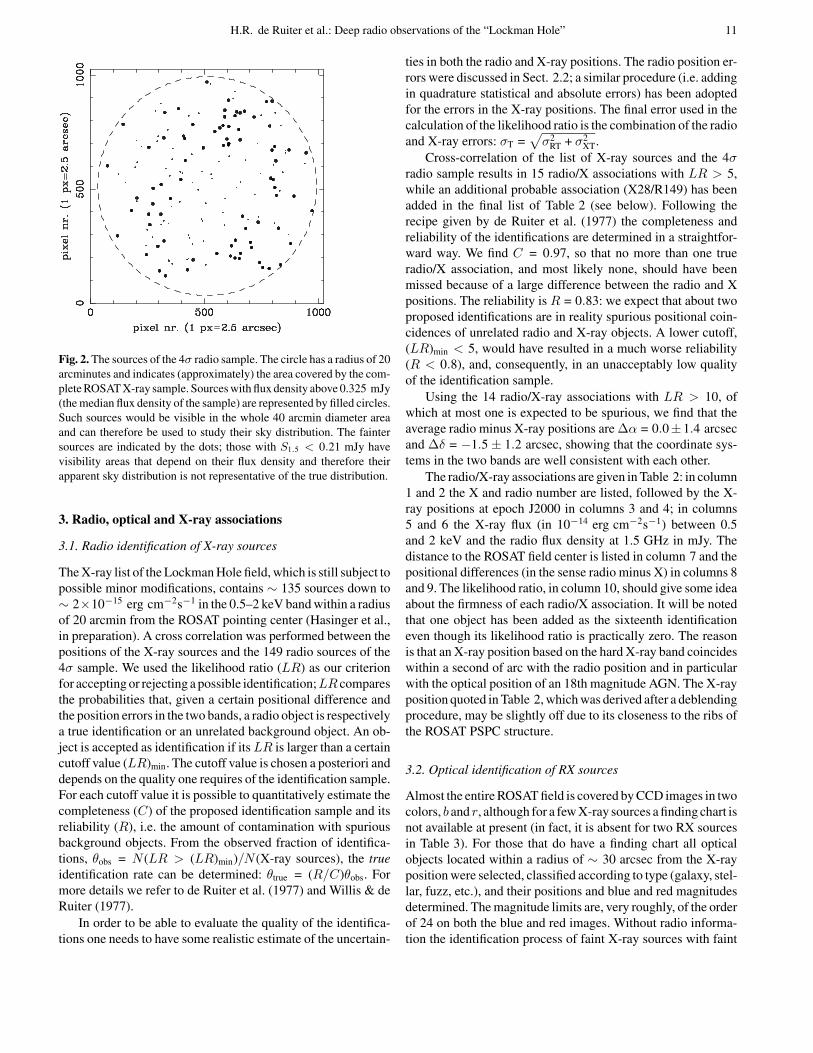
For easy reference we visualize in Fig. 2 the radio sourcesin the 4σ sample. The circle is drawn at a radius of 20 arcminfrom the field center; its interior covers the entire region of thecomplete ROSAT X-ray sample. Different symbols are usedfor faint (S1.5 < 0.325 mJy) and bright (S1.5 > 0.325 mJy)sources, where 0.325 mJy is the median flux density of the sam-ple. The latter sources would be detectable above the 4σ levelin the whole area of 20 arcmin radius and their sky distributioncan therefore be analyzed for possible clustering (see Sect. 4.1).
H.R. de Ruiter et al.: Deep radio observations of the “Lockman Hole” 11
Fig. 2. The sources of the 4σ radio sample. The circle has a radius of 20arcminutes and indicates (approximately) the area covered by the com-plete ROSAT X-ray sample. Sources with flux density above 0.325 mJy(the median flux density of the sample) are represented by filled circles.Such sources would be visible in the whole 40 arcmin diameter areaand can therefore be used to study their sky distribution. The faintersources are indicated by the dots; those with S1.5 < 0.21 mJy havevisibility areas that depend on their flux density and therefore theirapparent sky distribution is not representative of the true distribution.
3. Radio, optical and X-ray associations
3.1. Radio identification of X-ray sources
The X-ray list of the Lockman Hole field, which is still subject topossible minor modifications, contains ∼ 135 sources down to∼ 2×10⁻¹⁵ erg cm−2s−1 in the 0.5–2 keV band within a radiusof 20 arcmin from the ROSAT pointing center (Hasinger et al.,in preparation). A cross correlation was performed between thepositions of the X-ray sources and the 149 radio sources of the4σ sample. We used the likelihood ratio (LR) as our criterionfor accepting or rejecting a possible identification;LR comparesthe probabilities that, given a certain positional difference andthe position errors in the two bands, a radio object is respectivelya true identification or an unrelated background object. An ob-ject is accepted as identification if itsLR is larger than a certaincutoff value (LR)min. The cutoff value is chosen a posteriori anddepends on the quality one requires of the identification sample.For each cutoff value it is possible to quantitatively estimate thecompleteness (C) of the proposed identification sample and itsreliability (R), i.e. the amount of contamination with spuriousbackground objects. From the observed fraction of identifica-tions, θobs = N (LR > (LR)min)/N (X-ray sources), the trueidentification rate can be determined: θtrue = (R/C)θobs. Formore details we refer to de Ruiter et al. (1977) and Willis & deRuiter (1977).
In order to be able to evaluate the quality of the identifica-tions one needs to have some realistic estimate of the uncertain-
ties in both the radio and X-ray positions. The radio position er-rors were discussed in Sect. 2.2; a similar procedure (i.e. addingin quadrature statistical and absolute errors) has been adoptedfor the errors in the X-ray positions. The final error used in thecalculation of the likelihood ratio is the combination of the radioand X-ray errors: σT =
√σ2
RT + σ2XT.
Cross-correlation of the list of X-ray sources and the 4σradio sample results in 15 radio/X associations with LR > 5,while an additional probable association (X28/R149) has beenadded in the final list of Table 2 (see below). Following therecipe given by de Ruiter et al. (1977) the completeness andreliability of the identifications are determined in a straightfor-ward way. We find C = 0.97, so that no more than one trueradio/X association, and most likely none, should have beenmissed because of a large difference between the radio and Xpositions. The reliability is R = 0.83: we expect that about twoproposed identifications are in reality spurious positional coin-cidences of unrelated radio and X-ray objects. A lower cutoff,(LR)min < 5, would have resulted in a much worse reliability(R < 0.8), and, consequently, in an unacceptably low qualityof the identification sample.
Using the 14 radio/X-ray associations with LR > 10, ofwhich at most one is expected to be spurious, we find that theaverage radio minus X-ray positions are ∆α = 0.0±1.4 arcsecand ∆δ = −1.5± 1.2 arcsec, showing that the coordinate sys-tems in the two bands are well consistent with each other.
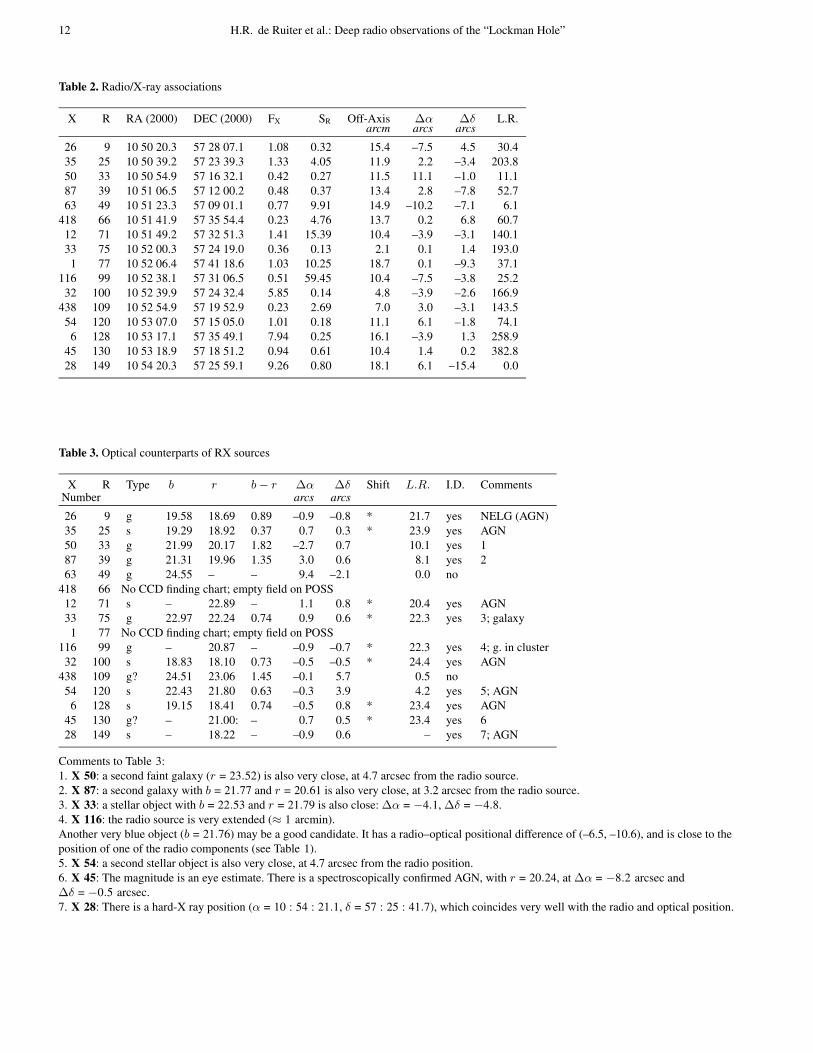
The radio/X-ray associations are given in Table 2: in column1 and 2 the X and radio number are listed, followed by the X-ray positions at epoch J2000 in columns 3 and 4; in columns5 and 6 the X-ray flux (in 10−14 erg cm−2s−1) between 0.5and 2 keV and the radio flux density at 1.5 GHz in mJy. Thedistance to the ROSAT field center is listed in column 7 and thepositional differences (in the sense radio minus X) in columns 8and 9. The likelihood ratio, in column 10, should give some ideaabout the firmness of each radio/X association. It will be notedthat one object has been added as the sixteenth identificationeven though its likelihood ratio is practically zero. The reasonis that an X-ray position based on the hard X-ray band coincideswithin a second of arc with the radio position and in particularwith the optical position of an 18th magnitude AGN. The X-rayposition quoted in Table 2, which was derived after a deblendingprocedure, may be slightly off due to its closeness to the ribs ofthe ROSAT PSPC structure.
3.2. Optical identification of RX sources
Almost the entire ROSAT field is covered by CCD images in twocolors, b and r, although for a few X-ray sources a finding chart isnot available at present (in fact, it is absent for two RX sourcesin Table 3). For those that do have a finding chart all opticalobjects located within a radius of ∼ 30 arcsec from the X-rayposition were selected, classified according to type (galaxy, stel-lar, fuzz, etc.), and their positions and blue and red magnitudesdetermined. The magnitude limits are, very roughly, of the orderof 24 on both the blue and red images. Without radio informa-tion the identification process of faint X-ray sources with faint
12 H.R. de Ruiter et al.: Deep radio observations of the “Lockman Hole”
Table 2. Radio/X-ray associations
X R RA (2000) DEC (2000) FX SR Off-Axis ∆α ∆δ L.R.arcm arcs arcs
26 9 10 50 20.3 57 28 07.1 1.08 0.32 15.4 –7.5 4.5 30.435 25 10 50 39.2 57 23 39.3 1.33 4.05 11.9 2.2 –3.4 203.850 33 10 50 54.9 57 16 32.1 0.42 0.27 11.5 11.1 –1.0 11.187 39 10 51 06.5 57 12 00.2 0.48 0.37 13.4 2.8 –7.8 52.763 49 10 51 23.3 57 09 01.1 0.77 9.91 14.9 –10.2 –7.1 6.1
418 66 10 51 41.9 57 35 54.4 0.23 4.76 13.7 0.2 6.8 60.712 71 10 51 49.2 57 32 51.3 1.41 15.39 10.4 –3.9 –3.1 140.133 75 10 52 00.3 57 24 19.0 0.36 0.13 2.1 0.1 1.4 193.0
1 77 10 52 06.4 57 41 18.6 1.03 10.25 18.7 0.1 –9.3 37.1116 99 10 52 38.1 57 31 06.5 0.51 59.45 10.4 –7.5 –3.8 25.232 100 10 52 39.9 57 24 32.4 5.85 0.14 4.8 –3.9 –2.6 166.9
438 109 10 52 54.9 57 19 52.9 0.23 2.69 7.0 3.0 –3.1 143.554 120 10 53 07.0 57 15 05.0 1.01 0.18 11.1 6.1 –1.8 74.1
6 128 10 53 17.1 57 35 49.1 7.94 0.25 16.1 –3.9 1.3 258.945 130 10 53 18.9 57 18 51.2 0.94 0.61 10.4 1.4 0.2 382.828 149 10 54 20.3 57 25 59.1 9.26 0.80 18.1 6.1 –15.4 0.0
Table 3. Optical counterparts of RX sources
X R Type b r b− r ∆α ∆δ Shift L.R. I.D. CommentsNumber arcs arcs
26 9 g 19.58 18.69 0.89 –0.9 –0.8 * 21.7 yes NELG (AGN)35 25 s 19.29 18.92 0.37 0.7 0.3 * 23.9 yes AGN50 33 g 21.99 20.17 1.82 –2.7 0.7 10.1 yes 187 39 g 21.31 19.96 1.35 3.0 0.6 8.1 yes 263 49 g 24.55 – – 9.4 –2.1 0.0 no
418 66 No CCD finding chart; empty field on POSS12 71 s – 22.89 – 1.1 0.8 * 20.4 yes AGN33 75 g 22.97 22.24 0.74 0.9 0.6 * 22.3 yes 3; galaxy
1 77 No CCD finding chart; empty field on POSS116 99 g – 20.87 – –0.9 –0.7 * 22.3 yes 4; g. in cluster32 100 s 18.83 18.10 0.73 –0.5 –0.5 * 24.4 yes AGN
438 109 g? 24.51 23.06 1.45 –0.1 5.7 0.5 no54 120 s 22.43 21.80 0.63 –0.3 3.9 4.2 yes 5; AGN
6 128 s 19.15 18.41 0.74 –0.5 0.8 * 23.4 yes AGN45 130 g? – 21.00: – 0.7 0.5 * 23.4 yes 628 149 s – 18.22 – –0.9 0.6 – yes 7; AGN
Comments to Table 3:1. X 50: a second faint galaxy (r = 23.52) is also very close, at 4.7 arcsec from the radio source.2. X 87: a second galaxy with b = 21.77 and r = 20.61 is also very close, at 3.2 arcsec from the radio source.3. X 33: a stellar object with b = 22.53 and r = 21.79 is also close: ∆α = −4.1, ∆δ = −4.8.4. X 116: the radio source is very extended (≈ 1 arcmin).Another very blue object (b = 21.76) may be a good candidate. It has a radio–optical positional difference of (–6.5, –10.6), and is close to theposition of one of the radio components (see Table 1).5. X 54: a second stellar object is also very close, at 4.7 arcsec from the radio position.6. X 45: The magnitude is an eye estimate. There is a spectroscopically confirmed AGN, with r = 20.24, at ∆α = −8.2 arcsec and∆δ = −0.5 arcsec.7. X 28: There is a hard-X ray position (α = 10 : 54 : 21.1, δ = 57 : 25 : 41.7), which coincides very well with the radio and optical position.
H.R. de Ruiter et al.: Deep radio observations of the “Lockman Hole” 13
optical candidates is rather complicated, because usually morethan one optical candidate can be found inside the X-ray errorbox. The presence of a radio position restricts the search areaconsiderably and in most cases only one good optical candidateremains. A complication, found during the optical identifica-tion process, is a systematic shift of about four arcsec in rightascension between the optical and the radio and X-ray coordi-nates. We tried to correct for the shift as follows. Using onlythe radio and optical positions, we selected a subsample of theRX sources for which a constant shift between optical and radiopositions produces unambiguous optical identifications within1.5 arcsec. These objects, identified by an asterisk in Table 3,were used to compute the shifts inα and δ, which were then sub-tracted from all the optical positions based on the CCD material.We find ∆α = 4.2 ± 0.3 arcsec, and ∆δ = 0.4 ± 0.3 arcsec,with an RMS error in the individual radio-optical differences of∼ 0.8 arcsec. This RMS error suggests that the combined (1σ)uncertainty in the radio and optical positions will on average bebetween one and two arcseconds (as the shift was based on asubset of the “best” identification candidates). We adopt a 1σuncertainty of 2 arcsec in the calculation of the likelihood ratio.The density of objects on the CCD images is estimated to be∼ 2× 10⁴ deg−2. With a search radius of four arcsec only oneoptical object unrelated to the radio source is expected to fallinside the combined search area of all the 14 RX objects withCCD finding charts; therefore the high accuracy of the radio andoptical positions limits the contamination of the identificationsample to an acceptable level.
The identifications were accepted if the likelihood ratio was> 4, a slightly lower cutoff than in the case of radio/X associa-tions. Such a choice was possible because even with this lower(LR)min the reliability is quite high. This, in turn, is due to thefact that the optical identification rate of RX objects turns out tobe very high (see Table 3). The method described by De Ruiteret al. (1977) makes use of the a posteriori knowledge of θtrue
in the determination of R and C, and the higher θtrue the morelikely it is that there are no unrelated background objects amongthe proposed identifications. In fact, we find R = 0.99, so thatnot even one spurious object is expected among the proposedidentifications listed in Table 3: although one background ob-ject is expected inside the combined search area, it will mostlikely lie at a larger distance from the radio position than atrue radio/optical association. The completeness is C = 0.95:at most one identification may have been missed, because itsLR happened to be below (LR)min. Since both R and C areclose to one, the true and observed identification rates shouldbe practically identical.
A summary of the search for optical counterparts of RXsources is given in Table 3. In columns 1 and 2 we give the X-rayand radio running number, in column 3 the optical morphologi-cal classification of the object closest to the radio position (g forgalaxy, s for stellar), in columns 4, 5 and 6 the b and rmagnitudeand the b− r color, in columns 7 and 8 the radio minus opticalposition differences in α and δ after application of the shifts inthe optical position described above. An asterisk in column 9means that the source was used for determining the shift in the
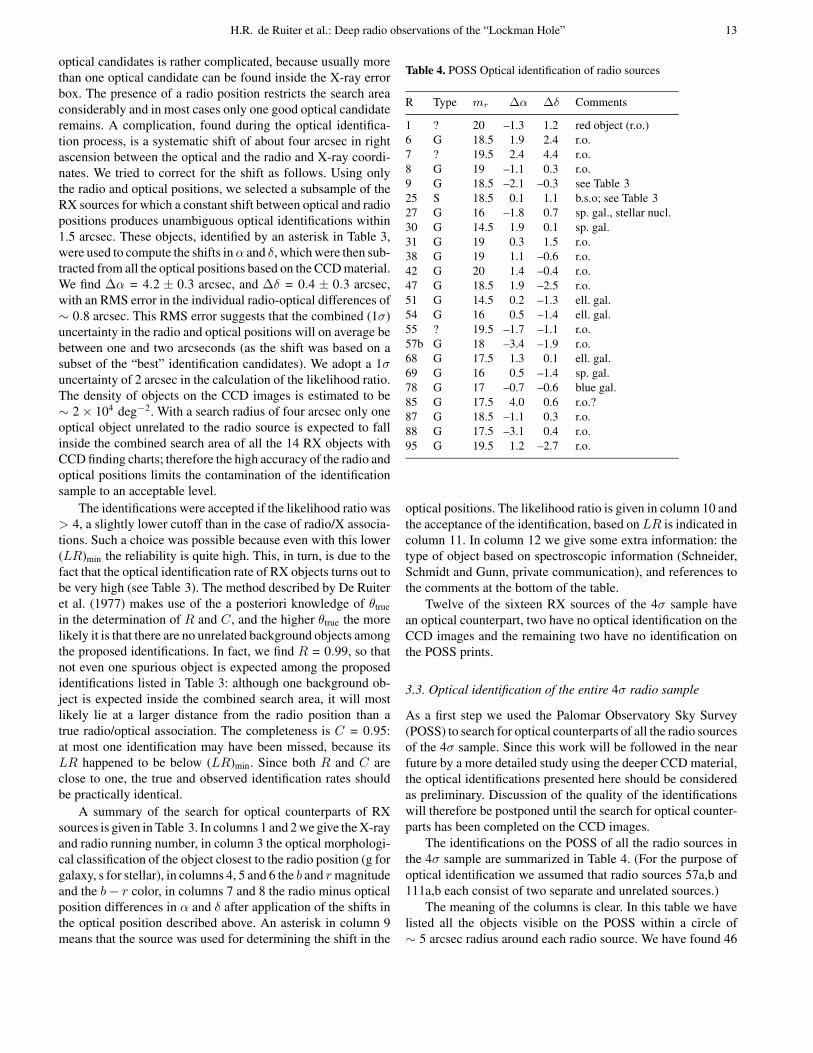
Table 4. POSS Optical identification of radio sources
R Type mr ∆α ∆δ Comments
1 ? 20 –1.3 1.2 red object (r.o.)6 G 18.5 1.9 2.4 r.o.7 ? 19.5 2.4 4.4 r.o.8 G 19 –1.1 0.3 r.o.9 G 18.5 –2.1 –0.3 see Table 325 S 18.5 0.1 1.1 b.s.o; see Table 327 G 16 –1.8 0.7 sp. gal., stellar nucl.30 G 14.5 1.9 0.1 sp. gal.31 G 19 0.3 1.5 r.o.38 G 19 1.1 –0.6 r.o.42 G 20 1.4 –0.4 r.o.47 G 18.5 1.9 –2.5 r.o.51 G 14.5 0.2 –1.3 ell. gal.54 G 16 0.5 –1.4 ell. gal.55 ? 19.5 –1.7 –1.1 r.o.57b G 18 –3.4 –1.9 r.o.68 G 17.5 1.3 0.1 ell. gal.69 G 16 0.5 –1.4 sp. gal.78 G 17 –0.7 –0.6 blue gal.85 G 17.5 4.0 0.6 r.o.?87 G 18.5 –1.1 0.3 r.o.88 G 17.5 –3.1 0.4 r.o.95 G 19.5 1.2 –2.7 r.o.
optical positions. The likelihood ratio is given in column 10 andthe acceptance of the identification, based onLR is indicated incolumn 11. In column 12 we give some extra information: thetype of object based on spectroscopic information (Schneider,Schmidt and Gunn, private communication), and references tothe comments at the bottom of the table.
Twelve of the sixteen RX sources of the 4σ sample havean optical counterpart, two have no optical identification on theCCD images and the remaining two have no identification onthe POSS prints.
3.3. Optical identification of the entire 4σ radio sample
As a first step we used the Palomar Observatory Sky Survey(POSS) to search for optical counterparts of all the radio sourcesof the 4σ sample. Since this work will be followed in the nearfuture by a more detailed study using the deeper CCD material,the optical identifications presented here should be consideredas preliminary. Discussion of the quality of the identificationswill therefore be postponed until the search for optical counter-parts has been completed on the CCD images.
The identifications on the POSS of all the radio sources inthe 4σ sample are summarized in Table 4. (For the purpose ofoptical identification we assumed that radio sources 57a,b and111a,b each consist of two separate and unrelated sources.)
The meaning of the columns is clear. In this table we havelisted all the objects visible on the POSS within a circle of∼ 5 arcsec radius around each radio source. We have found 46
14 H.R. de Ruiter et al.: Deep radio observations of the “Lockman Hole”
Table 4. (continued)
R Type mr ∆α ∆δ Comments
96 G 19 1.2 –0.6 r.o.97 ? 19 0.4 0.7 r.o.?98 S 19 0.6 –2.3 b. o.100 S 17.5 –0.6 –1.0 b.o.; see Table 3102 G 16 –0.9 –1.2 ell. gal.103 G 17 1.6 1.3 ell. gal., stellar nucl.105 G 14.5 1.3 –2.6 gal., bright stellar nucl.106 G 16.5 –1.1 0.0 compact gal.111a G 16 0.5 –0.6 sp. gal.112 G 18 0.1 1.5 round ell. gal.115 G 15.5 1.3 0.6 ell. gal.117 ? 19.5 0.8 0.6 r.o.121 G 19.5 1.0 1.3 r.o.122 S 15 –4.3 –1.1 b.o.125 G 19 0.3 –0.1 r.o.128 S 18.5 –0.3 –0.2 b.o.; see Table 3129 G 16 0.5 1.1 ell. gal.134 G 16 –0.7 1.3 b. compact gal.135 ? 19 –0.9 0.4 r.o.136 ? 20 0.5 0.6 r.o.137 G 18 –0.1 –0.7 ell. gal.140 G 16 –0.7 2.4 ell. gal.149 S 18 –1.4 0.6 see Table 3
possible optical identifications, corresponding to∼ 30 % of the4σ sample. Preliminary analysis of the CCD data suggests thatthe final number of optical identifications will be at least twiceas high.
4. Discussion
4.1. Counts and sky distribution of the radio sources
The 4σ sample contains 149 radio sources with flux density at1.5 GHzS > 120 µJy (see Sect. 2.2), in an area of∼ 0.35 deg2,corresponding to a surface density of almost 430 deg−2, quitesimilar to the density of X-ray sources in the correspondingROSAT image. Boyle et al. (1993, 1995) describe 20 cm ra-dio observations of the Durham/AAT QSO survey field QSF3,which was also observed with ROSAT. While their X-ray limitis somewhat higher than ours (∼ 4 against ∼ 2, in units10−15 erg cm−2s−1), their radio image is a bit deeper than theLockman Hole image. They detected 123 sources with a 20 cmflux density above 125 µJy within a radius of 18 arcmin, ex-cluding two regions of 8 and 2 arcmin radius respectively (seeBoyle et al. 1995). This corresponds to a surface density of∼ 550 deg−2 at a∼ 4.6σ level of 125 µJy, which is about 25 %higher than the Lockman Hole surface density. This differenceis probably due to a larger incompleteness of the 4σ LockmanHole sample (see the discussion in Sect. 2.2).
In order to reduce possible problems of incompleteness nearthe flux limit, we constructed the radio source counts consider-
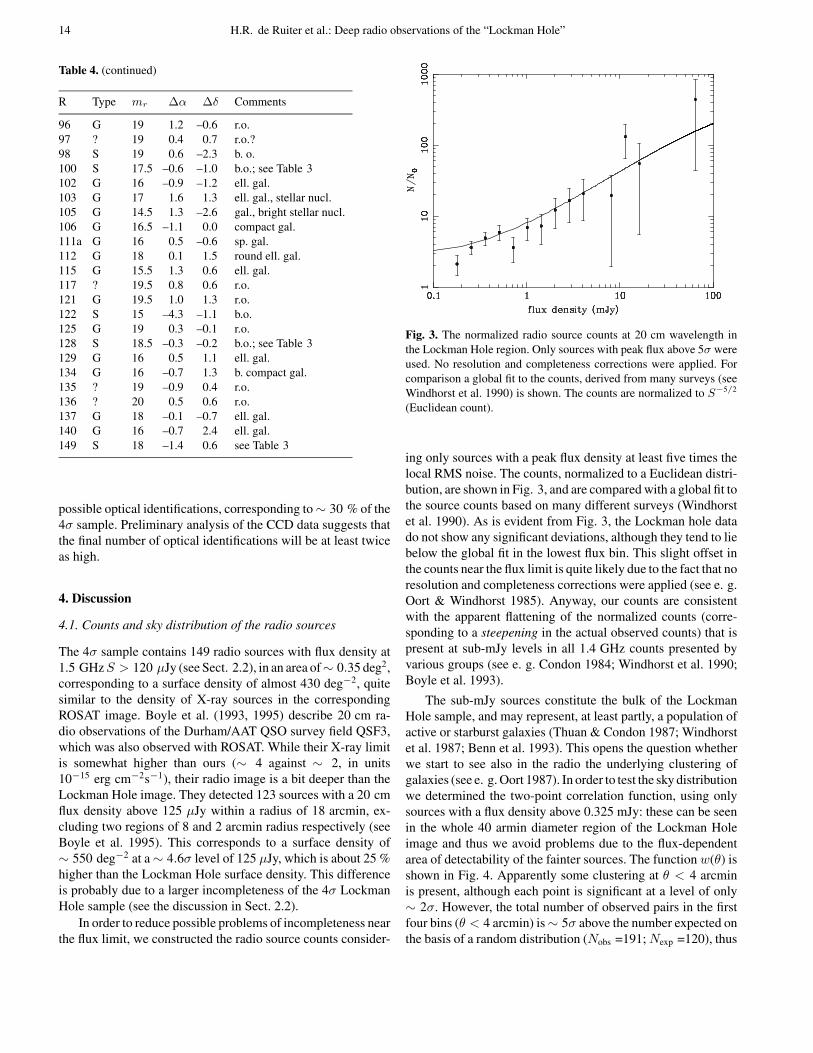
Fig. 3. The normalized radio source counts at 20 cm wavelength inthe Lockman Hole region. Only sources with peak flux above 5σ wereused. No resolution and completeness corrections were applied. Forcomparison a global fit to the counts, derived from many surveys (seeWindhorst et al. 1990) is shown. The counts are normalized to S−5/2
(Euclidean count).
ing only sources with a peak flux density at least five times thelocal RMS noise. The counts, normalized to a Euclidean distri-bution, are shown in Fig. 3, and are compared with a global fit tothe source counts based on many different surveys (Windhorstet al. 1990). As is evident from Fig. 3, the Lockman hole datado not show any significant deviations, although they tend to liebelow the global fit in the lowest flux bin. This slight offset inthe counts near the flux limit is quite likely due to the fact that noresolution and completeness corrections were applied (see e. g.Oort & Windhorst 1985). Anyway, our counts are consistentwith the apparent flattening of the normalized counts (corre-sponding to a steepening in the actual observed counts) that ispresent at sub-mJy levels in all 1.4 GHz counts presented byvarious groups (see e. g. Condon 1984; Windhorst et al. 1990;Boyle et al. 1993).
The sub-mJy sources constitute the bulk of the LockmanHole sample, and may represent, at least partly, a population ofactive or starburst galaxies (Thuan & Condon 1987; Windhorstet al. 1987; Benn et al. 1993). This opens the question whetherwe start to see also in the radio the underlying clustering ofgalaxies (see e. g. Oort 1987). In order to test the sky distributionwe determined the two-point correlation function, using onlysources with a flux density above 0.325 mJy: these can be seenin the whole 40 armin diameter region of the Lockman Holeimage and thus we avoid problems due to the flux-dependentarea of detectability of the fainter sources. The function w(θ) isshown in Fig. 4. Apparently some clustering at θ < 4 arcminis present, although each point is significant at a level of only∼ 2σ. However, the total number of observed pairs in the firstfour bins (θ < 4 arcmin) is∼ 5σ above the number expected onthe basis of a random distribution (Nobs =191;Nexp =120), thus
H.R. de Ruiter et al.: Deep radio observations of the “Lockman Hole” 15
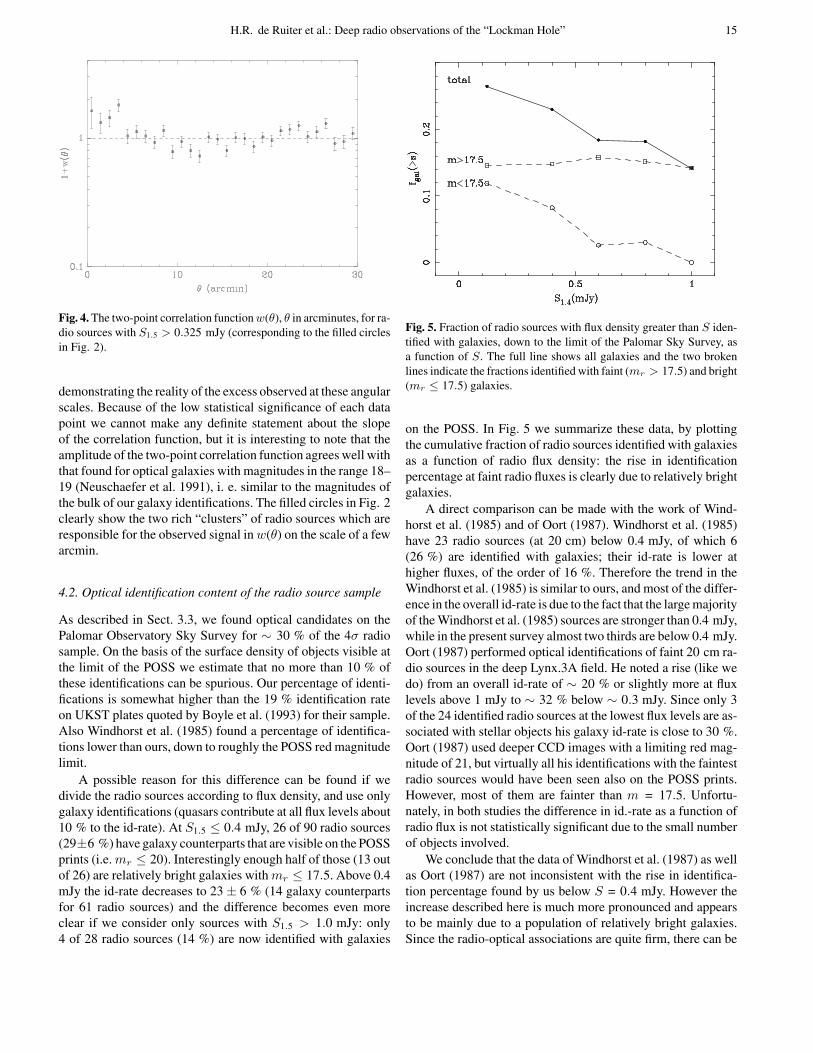
Fig. 4. The two-point correlation functionw(θ), θ in arcminutes, for ra-dio sources with S1.5 > 0.325 mJy (corresponding to the filled circlesin Fig. 2).
demonstrating the reality of the excess observed at these angularscales. Because of the low statistical significance of each datapoint we cannot make any definite statement about the slopeof the correlation function, but it is interesting to note that theamplitude of the two-point correlation function agrees well withthat found for optical galaxies with magnitudes in the range 18–19 (Neuschaefer et al. 1991), i. e. similar to the magnitudes ofthe bulk of our galaxy identifications. The filled circles in Fig. 2clearly show the two rich “clusters” of radio sources which areresponsible for the observed signal inw(θ) on the scale of a fewarcmin.
4.2. Optical identification content of the radio source sample
As described in Sect. 3.3, we found optical candidates on thePalomar Observatory Sky Survey for ∼ 30 % of the 4σ radiosample. On the basis of the surface density of objects visible atthe limit of the POSS we estimate that no more than 10 % ofthese identifications can be spurious. Our percentage of identi-fications is somewhat higher than the 19 % identification rateon UKST plates quoted by Boyle et al. (1993) for their sample.Also Windhorst et al. (1985) found a percentage of identifica-tions lower than ours, down to roughly the POSS red magnitudelimit.
A possible reason for this difference can be found if wedivide the radio sources according to flux density, and use onlygalaxy identifications (quasars contribute at all flux levels about10 % to the id-rate). At S1.5 ≤ 0.4 mJy, 26 of 90 radio sources(29±6 %) have galaxy counterparts that are visible on the POSSprints (i.e.mr ≤ 20). Interestingly enough half of those (13 outof 26) are relatively bright galaxies withmr ≤ 17.5. Above 0.4mJy the id-rate decreases to 23± 6 % (14 galaxy counterpartsfor 61 radio sources) and the difference becomes even moreclear if we consider only sources with S1.5 > 1.0 mJy: only4 of 28 radio sources (14 %) are now identified with galaxies
Fig. 5. Fraction of radio sources with flux density greater than S iden-tified with galaxies, down to the limit of the Palomar Sky Survey, asa function of S. The full line shows all galaxies and the two brokenlines indicate the fractions identified with faint (mr > 17.5) and bright(mr ≤ 17.5) galaxies.
on the POSS. In Fig. 5 we summarize these data, by plottingthe cumulative fraction of radio sources identified with galaxiesas a function of radio flux density: the rise in identificationpercentage at faint radio fluxes is clearly due to relatively brightgalaxies.
A direct comparison can be made with the work of Wind-horst et al. (1985) and of Oort (1987). Windhorst et al. (1985)have 23 radio sources (at 20 cm) below 0.4 mJy, of which 6(26 %) are identified with galaxies; their id-rate is lower athigher fluxes, of the order of 16 %. Therefore the trend in theWindhorst et al. (1985) is similar to ours, and most of the differ-ence in the overall id-rate is due to the fact that the large majorityof the Windhorst et al. (1985) sources are stronger than 0.4 mJy,while in the present survey almost two thirds are below 0.4 mJy.Oort (1987) performed optical identifications of faint 20 cm ra-dio sources in the deep Lynx.3A field. He noted a rise (like wedo) from an overall id-rate of ∼ 20 % or slightly more at fluxlevels above 1 mJy to ∼ 32 % below ∼ 0.3 mJy. Since only 3of the 24 identified radio sources at the lowest flux levels are as-sociated with stellar objects his galaxy id-rate is close to 30 %.Oort (1987) used deeper CCD images with a limiting red mag-nitude of 21, but virtually all his identifications with the faintestradio sources would have been seen also on the POSS prints.However, most of them are fainter than m = 17.5. Unfortu-nately, in both studies the difference in id.-rate as a function ofradio flux is not statistically significant due to the small numberof objects involved.
We conclude that the data of Windhorst et al. (1987) as wellas Oort (1987) are not inconsistent with the rise in identifica-tion percentage found by us below S = 0.4 mJy. However theincrease described here is much more pronounced and appearsto be mainly due to a population of relatively bright galaxies.Since the radio-optical associations are quite firm, there can be
16 H.R. de Ruiter et al.: Deep radio observations of the “Lockman Hole”
no doubt as to the reality of this new population of nearby sub-mJy galaxies. Optical follow-up will have to decide whether wehave picked up a nearby (z ∼ 0.1− 0.2) cluster, and reveal thenature of these galaxies.
4.3. The nature of the ROX sources
The 4σ radio sample produces 16 possible radio/X-ray associa-tions, corresponding to an observed radio identification rate of∼ 12 %. On the basis of the completeness and reliability of thissample of possible associations, we estimate that the true iden-tification rate is θtrue ∼ 10 %, implying that about two of theseradio/X-ray associations may be spurious. This is in agreementwith the low identification rate of 8.7±3.4 % reported by Boyleet al. (1995) and shows that there is little overlap between radioand X-ray sources at these low flux levels. A higher overlap be-tween radio and X-ray sources has been found by Hamilton andHelfand (1993). In their cross–correlation between 2σ X-raysources and VLA sources in two deep EINSTEIN fields, theyfound that about 18% of X-ray sources may be associated withradio sources. Although their radio flux limit is similar to ours,their X-ray limit, as judged by the surface density of their X-raysources, is at least a factor five higher than ours. If we con-sider in our sample only the sources with an X-ray flux largerthan 10−14 erg cm −2 s−1 (38 sources), we find that eight ofthem (corresponding to 21%) are indeed associated with radiosources. Therefore, our data are in good agreement also withthe Hamilton and Helfand result.
A similar trend of the percentage of radio/X-ray associationsis present also with the radio flux. More than half of the RXsources have a radio flux density below 1 mJy, but this merelyreflects the fact that the large majority of the radio sources inthe 4σ sample are found at those levels. Actually, we find thatof the 13 radio sources with S1.5 > 2.6 mJy seven (54 %) havean associated X-ray source, while only nine of the 136 fainterradio sources (7 %) have an X-ray counterpart.
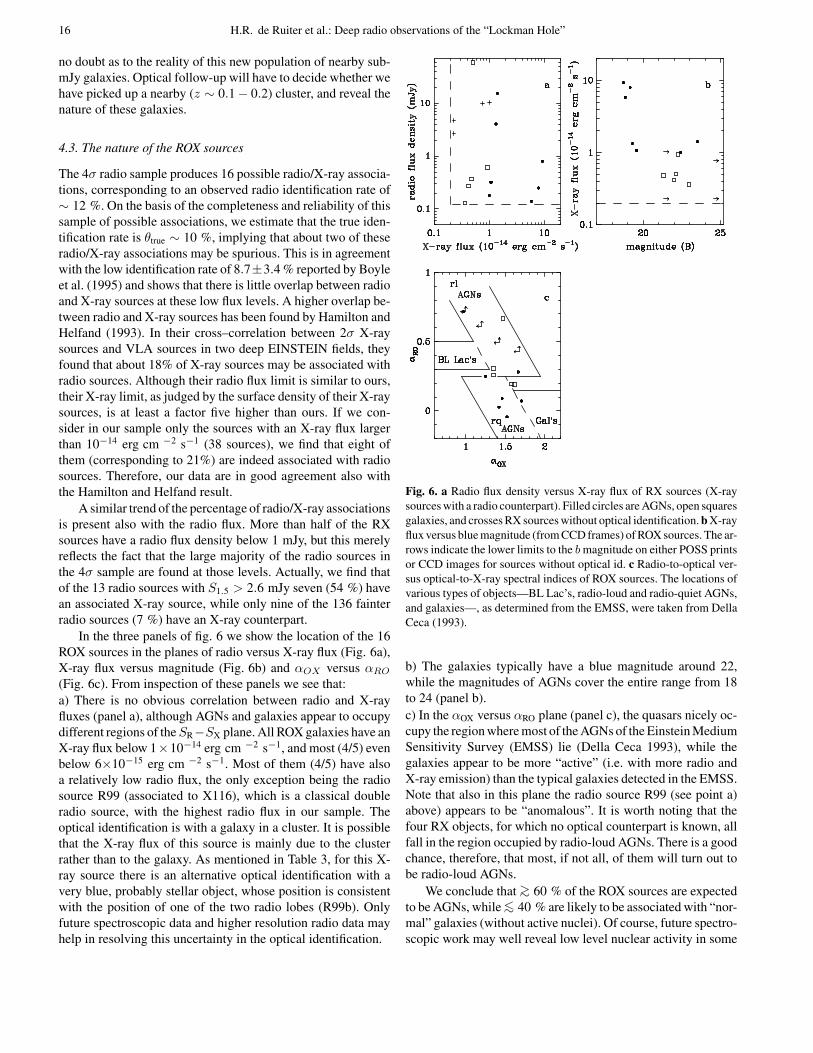
In the three panels of fig. 6 we show the location of the 16ROX sources in the planes of radio versus X-ray flux (Fig. 6a),X-ray flux versus magnitude (Fig. 6b) and αOX versus αRO(Fig. 6c). From inspection of these panels we see that:a) There is no obvious correlation between radio and X-rayfluxes (panel a), although AGNs and galaxies appear to occupydifferent regions of theSR−SX plane. All ROX galaxies have anX-ray flux below 1×10⁻¹⁴ erg cm −2 s−1, and most (4/5) evenbelow 6×10⁻¹⁵ erg cm −2 s−1. Most of them (4/5) have alsoa relatively low radio flux, the only exception being the radiosource R99 (associated to X116), which is a classical doubleradio source, with the highest radio flux in our sample. Theoptical identification is with a galaxy in a cluster. It is possiblethat the X-ray flux of this source is mainly due to the clusterrather than to the galaxy. As mentioned in Table 3, for this X-ray source there is an alternative optical identification with avery blue, probably stellar object, whose position is consistentwith the position of one of the two radio lobes (R99b). Onlyfuture spectroscopic data and higher resolution radio data mayhelp in resolving this uncertainty in the optical identification.
Fig. 6. a Radio flux density versus X-ray flux of RX sources (X-raysources with a radio counterpart). Filled circles are AGNs, open squaresgalaxies, and crosses RX sources without optical identification. b X-rayflux versus blue magnitude (from CCD frames) of ROX sources. The ar-rows indicate the lower limits to the bmagnitude on either POSS printsor CCD images for sources without optical id. c Radio-to-optical ver-sus optical-to-X-ray spectral indices of ROX sources. The locations ofvarious types of objects—BL Lac’s, radio-loud and radio-quiet AGNs,and galaxies—, as determined from the EMSS, were taken from DellaCeca (1993).
b) The galaxies typically have a blue magnitude around 22,while the magnitudes of AGNs cover the entire range from 18to 24 (panel b).c) In the αOX versus αRO plane (panel c), the quasars nicely oc-cupy the region where most of the AGNs of the Einstein MediumSensitivity Survey (EMSS) lie (Della Ceca 1993), while thegalaxies appear to be more “active” (i.e. with more radio andX-ray emission) than the typical galaxies detected in the EMSS.Note that also in this plane the radio source R99 (see point a)above) appears to be “anomalous”. It is worth noting that thefour RX objects, for which no optical counterpart is known, allfall in the region occupied by radio-loud AGNs. There is a goodchance, therefore, that most, if not all, of them will turn out tobe radio-loud AGNs.
We conclude that >∼ 60 % of the ROX sources are expectedto be AGNs, while<∼ 40 % are likely to be associated with “nor-mal” galaxies (without active nuclei). Of course, future spectro-scopic work may well reveal low level nuclear activity in some
H.R. de Ruiter et al.: Deep radio observations of the “Lockman Hole” 17
of the objects which we are currently classifying as galaxies. Asimilar conclusion, i.e. more than 50% of RX sources are likelyto be AGNs, was reached by Boyle et al. (1993) on the basis oftheir small sample of 5 RX sources in the QSF3 field. It is usefulto stress that our result does not imply that the same percentagesof AGNs and galaxies should be found in optical identificationsof the overall faint X-ray population, irrespective of the radioflux. Unfortunately, no faint ROSAT sample with complete op-tical identifications exists yet. However, the existing sampleswith a high rate of identification (Shanks et al. 1991; Griffithset al. 1995; Zamorani et al., in preparation) show that AGNsare∼ 75% and galaxies≤ 15 % of the identified X-ray sourceswith SX ≥ 5×10⁻¹⁵ erg cm−2 s−1, although the percentage ofidentifications with galaxies appears to increase at even fainterX-ray fluxes. Since the large majority of faint radio sources isassociated with galaxies, the inclusion of the radio detection inthe optical identification procedure obviously tends to increasethe percentage of galaxies.
Among the AGNs, four have a blue magnitude< 19.5. Theyrepresent an AGN density of ∼ 12 ± 6 deg−2, which is simi-lar to the average density of optically selected AGNs at thatmagnitude. Beyond b = 19.5 the surface density of ROX AGNs(∼ 25 deg−2 down to b ∼ 24) quickly falls below that of op-tically selected AGNs (∼ 110 deg−2 at b ∼ 22, see Zitelli etal. 1992, and ∼ 500 deg−2 at b ∼ 24, estimated by Zamorani1995). Assuming that, in agreement with the existing identi-fications in deep ROSAT fields, most of the X-ray sources inthe Lockman field are AGNs, on the basis of Fig. 6c we canconclude that only a few percent of these X-ray selected AGNsare radio-loud. This is true even if all the objects without opti-cal identification will turn out to be AGNs. At brighter X-rayfluxes, the percentage of radio-loud AGNs in X-ray selectedsamples is higher. For example, it is >10% in the EMSS sam-ple. The decrease of this percentage at fainter X-ray fluxes waspredicted by Della Ceca et al. (1994), on the basis of the lumi-nosity functions and cosmological evolution of the radio-quietand radio-loud AGNs in the EMSS.
In absence of spectroscopic data for the ROX sources identi-fied with galaxies, we cannot say much about their nature. Someof them have blue colors, as expected from galaxies with strongstarburst phenomena or with a Seyfert-like nucleus, but somehave colors more typical of normal elliptical galaxies. It is likelythat both types of galaxies are present in our sample, as alreadyfound by Griffiths et al. (1995) in their identification of faintROSAT sources. Roche et al. (1995), cross-correlating the posi-tions of faint galaxies with < 4σ fluctuations in the unresolvedX-ray background in five ROSAT fields, find some statisticalevidence that a significant fraction of these fluctuations are as-sociated with faint (b ∼ 23) galaxies. Extrapolating to evenfainter magnitudes, they conclude that galaxies may produce acontribution to the 1-keV background which is as large as thatof QSOs. Although this conclusion still needs independent con-firmation, the ROX galaxies discussed in this paper may be the“radio-loud” tail of these “X-ray loud” galaxies. In any case,since these ROX galaxies are also faint in the radio (with the
exception of X116), they would be moderately low luminosityradio sources even at z ≈ 1.
Acknowledgements. The National Radio Astronomy Observatory isoperated by Associated Universities, Inc., under contract with the Na-tional Science Foundation. We thank R. Primavera, who carried out theastrometric measurements on the POSS prints. This work has receivedpartial financial support from the Italian Space Agency (ASI contracts92–RS–55 and 94–RS–96).
References
Benn, C.R., Rowan-Robinson, M., McMahon, R.G., Broadhurst, T.J.,Lawrence, A. 1993, MNRAS, 263, 98
Boyle, B.J., Staveley-Smith, L., Shanks, T., G.C., Georgantopoulos, I.,Stewart, G.C., Griffiths, R.E. 1995, Observatory, February 1995
Boyle, B.J., Staveley-Smith, L., Stewart, G.C., Georgantopoulos, I.,Shanks, T., Griffiths, R.E. 1993, MNRAS, 260, 49
Condon, J.J. 1984, ApJ, 284, 44Della Ceca, R. 1993, Ph.D. Thesis, University of BolognaDella Ceca, R., Zamorani, G., Maccacaro, T., Wolter, A., Griffiths, R.,
Stocke, J.T., Setti, G. 1994, ApJ, 430, 533De Ruiter, H.R., Willis, A.G., Arp, H.C. 1977, A&AS, 28, 211Fomalont, E.B., Kellermann, K.I., Windhorst, R.A., Kristian, J.A.
1991, AJ, 102, 1258Griffiths, R.E., Georgantopoulos, I., Boyle, B.J., Stewart, G.C., Shanks,
T., Della Ceca, R. 1995, MNRAS, 275, 77Hamilton, T.T., Helfand, D.J. 1993, ApJ, 418, 55Hasinger, G., Burg, R., Giacconi, R., Hartner, G., Schmidt, M., Truem-
per, J., Zamorani, G. 1993, A&A, 275, 1Kollgaard, R.I., Brinkmann, W., Chester, M. McMath, Feigelson, E.D.,
Hertz, P., Wielebinski, R., 1995, ApJS, 93, 145Lockman, F.J., Jahoda, K., McCammon, D. 1986, ApJ, 302, 432Mitchell, K.J., Condon, J.J. 1985, AJ, 90, 1957Neuschaefer, L.W., Windhorst, R.A., Dressler, A. 1991, ApJ, 382, 32Oort, M. J. A. 1987, Ph.D. Thesis, University of LeidenOort, M.J.A., Windhorst, R.A. 1985, A&A, 145, 405Roche, N., Shanks, T., Georgantopoulos, I., Stewart, G.C., Boyle, B.J.,
Griffiths, R.E. 1995, MNRAS, 273, L15Shanks, T., Georgantopoulos, I., Stewart, G.C., Pounds, K.A., Boyle,
B.J., Griffiths, R.E. 1991, Nat, 353, 315Thuan, T.X., Condon, J.J. 1987, ApJ, 322, L9Warwick, R.S., Barber, C.R. 1992, proc. of the X-ray conference ”X-
ray emission from AGNs and the cosmic X-ray background”, ed.W. Brinkman and J. Truemper, MPE report 235, p.242
Willis, A.G., De Ruiter, H.R. 1977, A&AS, 29, 103Windhorst, R.A., Dressler, A., Koo, D.C. 1987, in IAU Symp.124
”Observational Cosmology”, eds. A. Hewitt, G. Burbidge and L.Z.Fang, Dordrecht, Reidel, p.573
Windhorst, R.A., Mathis, D., Neuschaefer, L. 1990, in ”Evolution of theUniverse of galaxies”, ASP Conference Series 10, ed. R.G. Kron,p.389
Windhorst, R.A., Miley, G.K., Owen, F.N., Kron, R.G., Koo, D.C.1985, ApJ, 289, 494
Windhorst, R.A., Van Heerde, G.M., Katgert, P. 1984, AAS, 58, 1Zamorani, G. 1995, in ESO workshop “Science with the VLT”, ed.
J.R. Walsh and I.J. Danziger, p.402Zitelli, V., Mignoli, M., Zamorani, G., Marano, B., Boyle, B.J. 1992,
MNRAS, 256, 349
Related Documents


![⃝[irwin a schiff, vic lockman] how an economy grow](https://static.cupdf.com/doc/110x72/568caa311a28ab186da098e6/irwin-a-schiff-vic-lockman-how-an-economy-grow.jpg)

