Deep Ocean Energy Harvesting Point Absorber Design Jasmine Feliciano, Nick Hernandez, Yao Long, and Julia White With the Assistance of Professor Robert Daniello 4/25/2018

Welcome message from author
This document is posted to help you gain knowledge. Please leave a comment to let me know what you think about it! Share it to your friends and learn new things together.
Transcript
Deep Ocean Energy Harvesting
Point Absorber Design
Jasmine Feliciano, Nick Hernandez, Yao Long, and Julia White
With the Assistance of Professor Robert Daniello
4/25/2018

i
Abstract
In a world where fossil fuels are being steadily depleted, new energy sources are being
sought out. Ocean energy is a renewable resource that has yet to be fully utilized. Waves are a
consistently available resource, in spite of weather changes or time of day. Wave energy has the
potential to supply power for a variety of applications ranging from supplying the grid to remote
applications such as marine research and ocean reconnaissance. The goal of this project was to use
a point absorber style wave energy converter to harvest the kinetic energy of waves. We designed
and built a 1:15 scale model to test the mooring capabilities and power output. In order to calculate
the power output, we measured the pressure output and stroke length, which could then be scaled
to estimate a full-size wave energy converter.
ii
Table of Contents Abstract i
Table of Contents ii
1. Introduction 1
2. Literature Review 2
2.1 Wave Energy 2
2.2 Wave Energy Converters 2
2.3 Power Take Off Systems 6
2.4 Energy Storage 8
2.5 Autonomous Underwater Vehicles 9
2.5 Conclusion 10
3. Methodology 12
3.1 Overview of Goals 12
3.2 Simulation of Full Scale Model 13
3.3 Prototyping Procedure 14
3.4 Testing Procedure 15
4. Results and Analysis 22
4.1 Point Absorber Prototype 22
4.2 Wave Characteristic testing 23
5. Conclusions and Recommendations 25
References 27
Appendix A: Prototype Parts 30
Appendix B: Spring Constants of Rubber Bands 33
1
1. Introduction The global demand for energy has increased significantly in recent years, depleting the
world’s supply of nonrenewable resources such as oil, gas, and coal. These types of resources
generate approximately 80 percent of the world's energy, with only 20 percent coming from
renewable resources such as solar, wind, and waves (Energy smart, n.d.) This proves to be a great
concern, as the search for efficient alternative energy systems is becoming more urgent.
For ocean-based operations, waves are readily available throughout the day and do not
heavily fluctuate. Waves consist of higher energy density flow five times more dense than wind
energy, and 20 to 30 times more dense than solar (Amir, Sharip, Muzanni, & Anuar, 2016). This
makes it a viable form of renewable energy for ocean-based applications. Through the
development of a portable wave energy converter (WEC), devices like autonomous underwater
vehicles (AUVs) have the potential to explore further ranges and perform more power-intensive
operations. The main AUV users are the Navy and large ocean research groups, both of whom
could benefit from a heavier reliance on wave energy. The portable device can be stored on a ship,
allowing it to be easily transported to the site of the AUV operation. This alleviates the common
issue of towing the AUV back to shore for charging.
There are several types of WECs on the market, ranging from overtopping devices to point
absorbers. This project focused on a point absorber design due to its size. Of all devices currently
used, it creates the most energy for the smallest mass. These devices can be floating, meaning they
could be used for deep ocean applications. These devices convert the kinetic energy of waves by
oscillating a piston vertically, which then drives a generator to create electrical energy (Voorhis,
2012).
Testing was conducted in WPI’s Sports and Recreation Center pool to measure the pressure
output and stroke length of the prototype, which could be scaled to estimate a full-size WEC.
Additionally, a small scale test was proposed to better understand wave characteristics, as well as
to determine the relationship between force and spring stiffness of the system.
2
2. Literature Review
2.1 Wave Energy
The ocean is normally associated with marine life, recreational activities, and
transportation; however, the power contained within waves is often disregarded due to the fact that
WECs are underdeveloped in comparison to other forms of alternative energies (Duggan, 2016;
Ocean Energy Council, 2017). An average coastal wave gives off 35,000 horsepower per mile of
coast. This energy could be used to power a variety of industrial and residential operations. In fact,
one coastal wave is enough to power two average U.S. homes in one month (Ocean Energy
Council, 2017).
A wave’s power generation draws back to its formation. Waves are created constantly,
formed by strong winds and the rotation of the Earth. In the open ocean, these winds create a series
of chaotic waves, leading to a regular sequence of swells. As these swells approach the coast, the
wavelengths shorten, the height of the waves increase, and the waves break on shore (Tester,
2012).
There is great potential in harvesting wave energy because waves are abundant, readily
available at all times, and have the potential to provide a vast amount of power. When compared
to the annual world energy consumption of 148,000 TWh in 2008 (Richter, Magana, Sawodny, &
Brekken, 2013), the oceans could potentially provide 10 – 20% of the Earth’s energy (Future
Marine Energy, n.d.). This shows the potential impact of wave energy on the future of the
renewable industry.
2.2 Wave Energy Converters
There are numerous types of existing WECs that attempt to harness either the potential or
kinetic energy of waves to convert it into electricity. Many of these WECs vary in size, shape,
functionality, and energy output; however, they can be divided up into four main categories:
oscillating water columns, overtopping devices, attenuators, and point absorbers, seen in Figures
2.2.1-2.2.4. Each of these WECs have their own distinguishable attributes along with advantages
and disadvantages.

3
Oscillating water columns, seen in Figure 2.2.1, are normally constructed along the
shoreline to capture energy from crashing waves. These columns function due to the pressure
differential created between air and the ocean within a partially submerged structure. The pressure
from the waves pushes air through a hollow chamber attached to a turbine. A decrease in water
pressure then pulls the air back through the turbine, generating electricity (Kempener & Neumann,
2014). The main advantage of these systems are that they are robust and fairly simple due to the
utilization of only one moving part: the air turbine (Mathew, 2013). This also allows oscillating
water columns to convert energy at low maintenance costs with a conversion efficiency of around
75% (Mathew, 2013; Nader, 2013). Although the cost of harnessing the energy can be minimized,
there are some areas of concern. These structures operate exclusively on the shoreline, meaning
they have no portability. Oscillating water columns may also pose a threat to many marine habitats
along the coast (Mathew, 2013).
Figure 2.2.1 Oscillating Water Column (Mathew, 2013)
Overtopping devices consist of a ramp leading up to an artificial reservoir with a retaining
wall. Similar to an oscillating water column, this device operates based on the pressure differential
created between the reservoir and the surrounding ocean. The potential energy, due to the height
of collected water, is then converted to power through turbines located below the reservoir, shown
in the Figure 2.2.2. As the water level rises, waves crash over the ram, creating a pressure gradient.
This results in water being forced out through the turbines within the device. Unlike oscillating
water columns, these structures can yield much greater amounts of power due to their ability to
capture a large volume of waves and generate electricity without the use of internal mechanisms.
This also minimizes costs for maintenance and repair (Tethys, n.d.). Overall, these devices
typically range in efficiency from 70-80% (Poullikkas, 2014). Despite these advantages,

4
overtopping devices lack portability. Additionally, due to their large size, they can be a hazard for
sea life in the ocean due to the possibility of fish getting trapped inside the reservoirs (Tethys,
n.d.).
Figure 2.2.2 Overtopping Device (Wave and ocean thermal energy devices, n.d.)
Surface attenuators are long, cylindrical structures with multiple floating segments that are
oriented perpendicular to incoming waves, which can be seen below in Figure 2.2.3. These
segmented regions allow the device to bob in the water, which then drives hydraulic pumps to
generate electricity. Attenuators are able to capture a wide range of waves due to their large size,
thus providing a large power output with a conversion efficiency of 40% (University of
Strathclyde, 2017) They are also very sturdy and can withstand harsh environments. The
environmental concerns are similar to those of both the overtopping devices and oscillating water
columns where marine life may possibly get trapped or entangled within the joints of the system
(Tethys n.d.).

5
Figure 2.2.3 Surface Attenuator (Ocean wave energy, 2017)
Lastly, point absorbers are buoy-like systems that float on the surface of the water. The
motion of waves causes the device to bob up and down, which in turn generates electricity. Point
absorbers depend on an internal power take-off (PTO) system that pumps air to power the
generator as the cylinder is compressed and released. They rely on a constant supply of waves and
can attain maximum efficiency by matching the optimal frequency and wave height (Voorhis,
2012). These devices have the potential to provide a large amount of power in a relatively small
system, making them ideal for portable usage. They are also a versatile technology due to their
ability to harvest energy from waves coming in all directions and can be operational for long
durations of time (Kalofotias Fillipos, 2016). Some disadvantages of point absorbers include their
struggle to adapt to the varying heights and frequencies of waves and the threat posed onto the
system by major storms, which can also greatly reduce their efficiency. An example of a point
absorber can be seen in Figure 2.2.4.

6
Figure 2.2.4 Point Absorber (Ocean Power Technologies, 2017)
This point absorber is a PowerBuoy, designed by Ocean Power Technologies, a company
based in New Jersey. Ocean Power Technologies plans to launch a series of these WECs in the
Southern Ocean, off the coast of Victoria, Australia to generate up to 10 megawatts of electricity
(Hawaii Department of Business, 2002). There are several models of PowerBuoys that have been
designed for different power ratings; the PB-3 with a 3 kW rating, the PB-15 with a 15 kW rating,
and the PB-40 with a 40 kW power rating (Ocean Power Technologies, 2017). The conversion
efficiency of the PB-3 is reported to be between 30-45% (Ocean Power Technologies, 2011). The
conversion efficiency of the PB-3 is reported to be between 30-45% (Ocean Power Technologies,
2011). PowerBuoys are one of hundreds of WECs that have been suggested for research and
implementation.
2.3 Power Take Off Systems
One of the leading components in determining the overall efficiency of WECs is the power
take off system (Têtu, 2017). This component operates by transforming energy absorbed by the
primary converter into electricity (Têtu, 2017). In addition to impacting overall efficiency, the
system is important from an economic standpoint, as it accounts for 20-30% of the initial
investment for a WEC (Têtu, 2017). Due to the impact on system performance and financial
investment, time should be spent analyzing PTO systems to determine which system will meet
both efficiency and energy conversion needs.
Hydraulic converters are a type of PTO that translate kinetic energy from the system into
electricity (Têtu, 2017). The device itself is considered simple with low investment, operation, and

7
maintenance costs (du Plessis, 2012). In addition, the system has been shown to have efficiencies
of 71-76%, and fares well in rough waters (Ulvin, Molinas, & Sjolte, 2012). While the system
seems to be highly practical, it does have some design challenges.
Figure 2.3.5: Hydraulic Power Take Off System in a Point Absorber (Têtu, 2016, pg. 211)
Point absorbers utilize a hydraulic power take off system, a schematic of which can be seen
in Figure 2.3.5. The buoy on the point absorber is attached to an actuator. The oscillating motion
of the buoy is translated to the actuator, thereby pushing fluid into the hydraulic motor through the
check valves. This motor then powers the generator, producing electricity. The high and low
pressure accumulators are in the system in order to regulate fluid flow (Têtu, 2016, pg. 211). This
system is used because it translates oscillating motion to electricity.
Hydro turbines are PTOs that convert potential energy into electricity (Têtu, 2017). The
system requires low maintenance and can achieve efficiencies in excess of 90% (Têtu, 2017). The
hydro turbine itself was designed to be the only moving part within the WEC, decreasing the need
for overall system maintenance as well as lifetime costs (Simple and robust construction - complex
design, 2005). This also minimizes disruption to marine life and damage from debris collisions
(Simple and robust construction - complex design, 2005). Hydro turbines were specifically
designed to benefit overtopping devices (Simple and robust construction - complex design, 2005),
making the system specialized, and as a result, not widely applicable.
For a PTO to achieve functionality, it needs to utilize a control system. The most simplistic
system is known as passive loading control, which uses counter-balancing techniques to limit
unwanted system movement (Têtu, 2017). This limitation serves as protection against damage in
extreme motion and works through sensing angular velocity and providing a set counter torque

8
(Têtu, 2017). This control system also levels out the power harvested by the WEC for a smaller
peak to mean power ratio (Wang & Isberg, 2015). The simplicity of the system provides a cost
effective option that allows electro-mechanical limitations to be respected through only targeting
control of the amplitude of oscillation (Ulvin et al., 2012). Passive loading works through control
of device damping and limits the maximum power extracted when faced with large waves (Ulvin
et al., 2012). These large waves are the type typically encountered in the deep ocean, where AUVs
would be travelling. However, the simplicity of the passive loading control limits its effectiveness.
When facing large waves, the system extracts limited power due to high resistance output (Ulvin
et al., 2012).
Reactive loading control works through actively adjusting the spring coefficient, inertia,
and oscillator damping of the WEC in order to maximize the energy absorption at all wave
frequencies (Hong et al., 2014; Têtu, 2017). This creates a more complex system that in turn is
more adaptive. Reactive loading, like passive loading, adapts to higher waves to prevent system
damage, limiting energy harvested from waves with large amplitudes (Ulvin et al., 2012). One
drawback to this system is that it can produce negative current when bobbing downwards (Wang
& Isberg, 2015).
PTOs generate power through harnessing the motion of wave energy. However, waves
characteristics are not constant or entirely predictable, therefore making the process inconsistent.
This unsteadiness is often combated by implementing an energy storage system.
2.4 Energy Storage
The main energy storage technique currently employed is batteries due to their high energy
density, proven effectiveness, and low standby losses (Chen et al., 2009; Raghunathan, Kansal,
Hsu, Friedman, & Srivastava, 2005). Batteries are often the preferred method because they respond
quickly to load changes, making them useful for unsteady power generation, such as the case of
renewable energy (Chen et al., 2009). Oftentimes, systems are designed around a battery, with four
main types including nickel cadmium, nickel metal hydride, lithium ion, and sealed lead acid
(Raghunathan et al., 2005).
Lead acid and nickel metal hydride both have poor low temperature performance and
therefore require external heating systems (Chen et al., 2009). Lead acid is the oldest and therefore
most proven battery, however it has low energy density and high weight (Raghunathan et al.,
9
2005). These batteries typically have a life cycle of 500-1000 cycles and an efficiency of 70-90%
(Chen et al., 2009). Nickel metal hydride batteries typically achieve 500 cycles before dropping
down to 80% efficiency, showing a longer life than lead acid (Raghunathan et al., 2005). For deep
ocean waters, where temperatures can range 12-20 (Bergman, 2011), these batteries are not
practical for ocean applications.
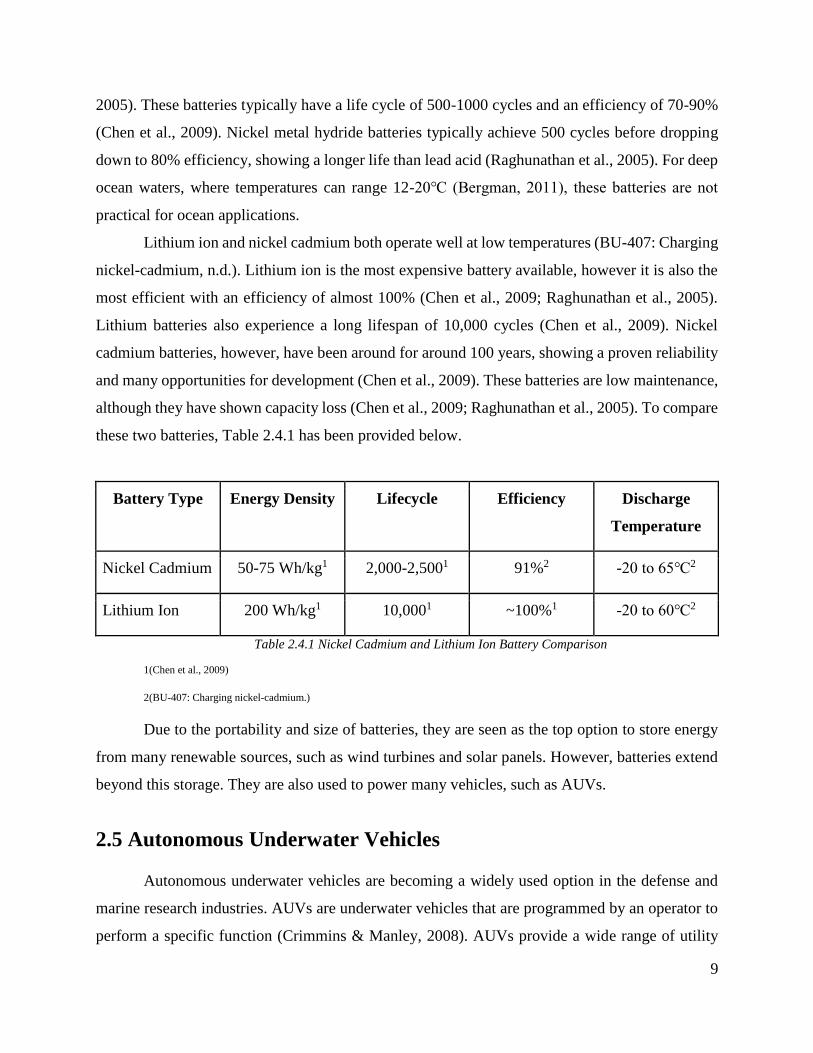
Lithium ion and nickel cadmium both operate well at low temperatures (BU-407: Charging
nickel-cadmium, n.d.). Lithium ion is the most expensive battery available, however it is also the
most efficient with an efficiency of almost 100% (Chen et al., 2009; Raghunathan et al., 2005).
Lithium batteries also experience a long lifespan of 10,000 cycles (Chen et al., 2009). Nickel
cadmium batteries, however, have been around for around 100 years, showing a proven reliability
and many opportunities for development (Chen et al., 2009). These batteries are low maintenance,
although they have shown capacity loss (Chen et al., 2009; Raghunathan et al., 2005). To compare
these two batteries, Table 2.4.1 has been provided below.
Battery Type Energy Density Lifecycle Efficiency Discharge
Temperature
Nickel Cadmium 50-75 Wh/kg1 2,000-2,5001 91%2 -20 to 652
Lithium Ion 200 Wh/kg1 10,0001 ~100%1 -20 to 602
Table 2.4.1 Nickel Cadmium and Lithium Ion Battery Comparison
1(Chen et al., 2009)
2(BU-407: Charging nickel-cadmium.)
Due to the portability and size of batteries, they are seen as the top option to store energy
from many renewable sources, such as wind turbines and solar panels. However, batteries extend
beyond this storage. They are also used to power many vehicles, such as AUVs.
2.5 Autonomous Underwater Vehicles
Autonomous underwater vehicles are becoming a widely used option in the defense and
marine research industries. AUVs are underwater vehicles that are programmed by an operator to
perform a specific function (Crimmins & Manley, 2008). AUVs provide a wide range of utility

10
achieved from their various sizes, ranging from a small, portable device under 100 pounds to a
large vehicle weighing several thousand pounds. AUVs are becoming more appealing to large-
scale marine applications due to rising fuel costs (Wynn et al., 2014). All AUVs carry a power
source onboard in order to provide energy to propellers, thrusters, and other equipment needed to
perform operation.
AUVs provide a wide variety of applications for the defense industry. Since the 1990s, the
Office of Naval Research has invested in the development of AUV technology for military
purposes such as underwater mine hunting (Hydroid, n.d.). The use of AUVs for undersea mine
detection not only provides cost savings when compared to the costs of operating a ship and
personnel, but also eliminates the risk for human divers. Aside from mine detection, the Navy has
identified 8 other capabilities that AUVs provide for naval operation: intelligence, surveillance,
and reconnaissance (ISR); anti-submarine warfare; inspection; oceanography; communication;
payload delivery; information operations; and time critical strike (U.S. Department of the Navy,
2004).
In addition to the defense industry, AUVs have made great contributions to marine studies,
including the mapping of the seafloor and water columns, along with hydrothermal vent studies.
The Lost City hydrothermal vent field was mapped by ABE, an AUV. Another AUV, SENTRY,
explored the hydrothermal venting on the Galapagos Rift (Bradley, Feezor, Singh, & Sorrell,
2001). AUVs can operate in depths of 6000 m and move at speeds of 1.5 - 2.0 m/s, depending on
extreme environments and tidal currents.
The REMUS 6000 uses up to two 12 kWh rechargeable Li-ion batteries, while the REMUS
600 uses up to two 5.4 kWh rechargeable Li-ion batteries. Other AUVs such as the MAYA AUV
uses lithium polymer cells for about 7.2 hours. Depending on AUV size, bus voltages range from
6V to 48V batteries (Bradley et al., 2001). The Odyssey and ABE are 2 - 3 m in length and use a
48V battery. It’s common for AUVs to use specialized batteries to power the system, but fuel cells
and solar energy have also been investigated for powering AUVs (Crimmins & Manley, 2008).
2.5 Conclusion
Wave energy is an actively evolving field. As it expands, there are several opportunities
for innovation and improvement. Both the kinetic and potential energies contained within a wave
can be extracted coastally or out in deep waters, making the practice highly versatile. Ocean based

11
organizations and communities such as the Navy may utilize WECs for the development of their
green energy goals. A system utilizing a combination of energy harvesting tactics may therefore
be the most effective option for power extraction.

12
3. Methodology
3.1 Overview of Goals
In order to create a usable system, a set of specifications were set forth based on the design
of Ocean Power Technologies’ PB-3 model. These specifications were determined by factors
ranging from material properties to size constraints. The project mainly focused on designing a
point absorber to create a more efficient, renewable energy based system for charging AUVs.
In order for the WEC to sufficiently provide power to charge AUVs, the system must meet
several energy requirements. To service a range of AUVs, the proposed system will store 12 kWh.
This energy storage requirement was set forth based on the research performed on pre-existing
AUVs such as the REMUS 6000 and the MBARI Dorado. These AUVs are larger vessels that are
capable of exploring depths of up to 6000 meters, therefore the energy storage requirements were
based on the power requirements of the REMUS 6000.
Once the 12 kWh requirement was set forth, Ocean Power Technologies’ PB-3 WEC was
identified to be able to produce the energy required. The dimensions for the PB-3 can be found in
Table 3.1.1. This observation provided an estimate of the size needed for a full-scale WEC.
Additionally, the dimensions of the REMUS 6000 were considered in the design of the WEC to
accommodate for a battery charging station. The system design was intended to be easily
transported and deployed such that it can be moved to a location where an AUV is operating.
Ocean Technologies PB-3 Dimensions
Height (m) 14.3
Spar Diameter (m) 1
Float Diameter (m) 2.7
Table 3.1.1 Ocean Technologies PB-3 Dimensions (Ocean Power Technologies, 2017)
Mooring will ensure that the WEC does not move with the waves by providing a resistance
so that energy can be successfully harvested while still allowing the system to oscillate vertically.
The PB-3 utilizes a heave plate at the bottom of the spar as its mooring system, but anchors are
also used in other mooring systems. For our system, we chose to forego an anchor to allow deep
ocean charging of AUVs.
13
3.2 Simulation of Full Scale Model
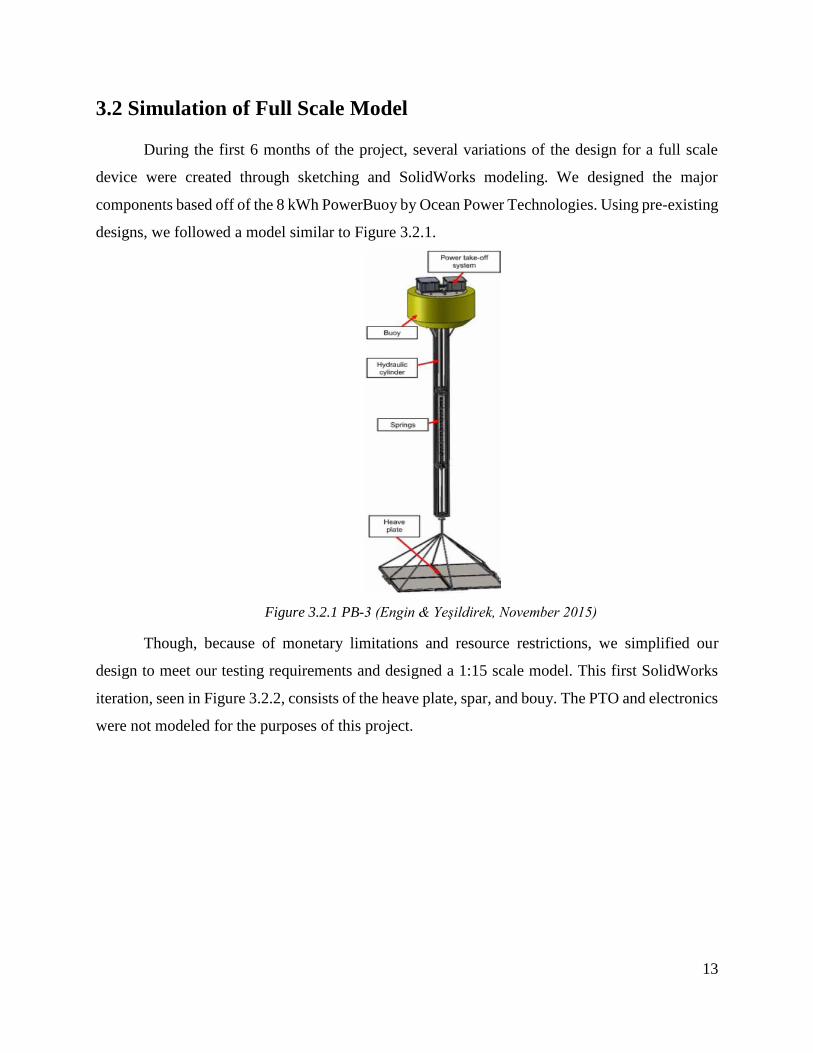
During the first 6 months of the project, several variations of the design for a full scale
device were created through sketching and SolidWorks modeling. We designed the major
components based off of the 8 kWh PowerBuoy by Ocean Power Technologies. Using pre-existing
designs, we followed a model similar to Figure 3.2.1.
Figure 3.2.1 PB-3 (Engin & Yeşildirek, November 2015)
Though, because of monetary limitations and resource restrictions, we simplified our
design to meet our testing requirements and designed a 1:15 scale model. This first SolidWorks
iteration, seen in Figure 3.2.2, consists of the heave plate, spar, and bouy. The PTO and electronics
were not modeled for the purposes of this project.

14
Figure 3.2.2 SolidWorks Model first Render
With the budget and time allocated for building and testing, a simplified prototype was
constructed. Creating the entire system following the first iteration would be out of budget and
would take longer than the time span of this project. For simplicity, the prototype consisted of off-
the-shelf parts including a copper float, a polycarbonate pipe, a pneumatic cylinder to act as a
piston, an acrylic heave plate, and air as the working fluid.
3.3 Prototyping Procedure
To effectively prototype the model, we first determined what we wanted to measure from
our prototype. The measurements desired were stroke length of the piston and the force that the
piston exerts as a response to the buoy. To measure these, a transparent tube was used to house the
piston device.
To simplify the model for testing, we chose a pneumatic cylinder rather than a hydraulic
cylinder. To scale the prototype, a feasible wave height was first determined. This was set at 3 in,
and the average ocean wave height is about 1 m. This set the scaling factor to 1:15. Table 3.3.1
shows the dimensions subsequently determined for the prototype, based on the dimensions of a
PB-3.

15
PB-3 (m) Scaled Model (m) Inches
Float Diameter 2.7 0.18 7.086618
Spar Diameter 1 0.06666666667 2.624673333
Height 14.3 0.9533333333 37.53282867
Table 3.3.1 Scaled Prototype Dimensions
This scale determined the parts ordered for the prototype. For full information on part
specifications, see Appendix A.
The float diameter was rounded up to 8 in. from 7 in. due to availability of parts. The
material of the float was copper due to part price and durability in water. The spar diameter was
also increased to a 3.5 in. outer diameter with a 3 in. inner diameter in order to house a properly
scaled pneumatic cylinder with a diameter of 2.75 in. The pneumatic cylinder was stainless steel
in order to withstand any water contact. The spar was cut to the proper height, which was rounded
to 37.5 in. The material of the pipe was polycarbonate due to its transparency and price. Finally,
the heave plate was chosen as a 12 in. x 12 in. acrylic plate for ease of drilling and additional
aluminum stock of 4 in. x 3 in. x 0.75 in. were added to provide enough weight to anchor the
system without sinking it to the pool floor.
Additionally, the bottom of the point absorber was designed to be modular such that it
would hold more weights as needed. We sealed the top of the device with all-purpose cement in
order to minimize any possible leakage.
3.4 Testing Procedure
To test the prototype, a body of water at least 4 feet deep was needed. This would provide
the proper depth for vertical oscillation of the buoy, as well as test the effectiveness of using a
heave plate for mooring. This area was identified as the WPI Sports and Recreation Center’s pool.
To create waves, a human subject oscillated two body boards to generate small-scale waves in the
pool. These waves ranged from one to two inches in height. Pictures of the prototype in the pool
can be seen in Figures 3.4.2 and 3.4.3.
In order to calculate the energy that could be harvested from a wave, the volume and
pressure changes within the pneumatic cylinder were taken into account. As the float oscillated up
and down from the waves, a GoPro Hero 4 camera was used to capture video of the displacement
16
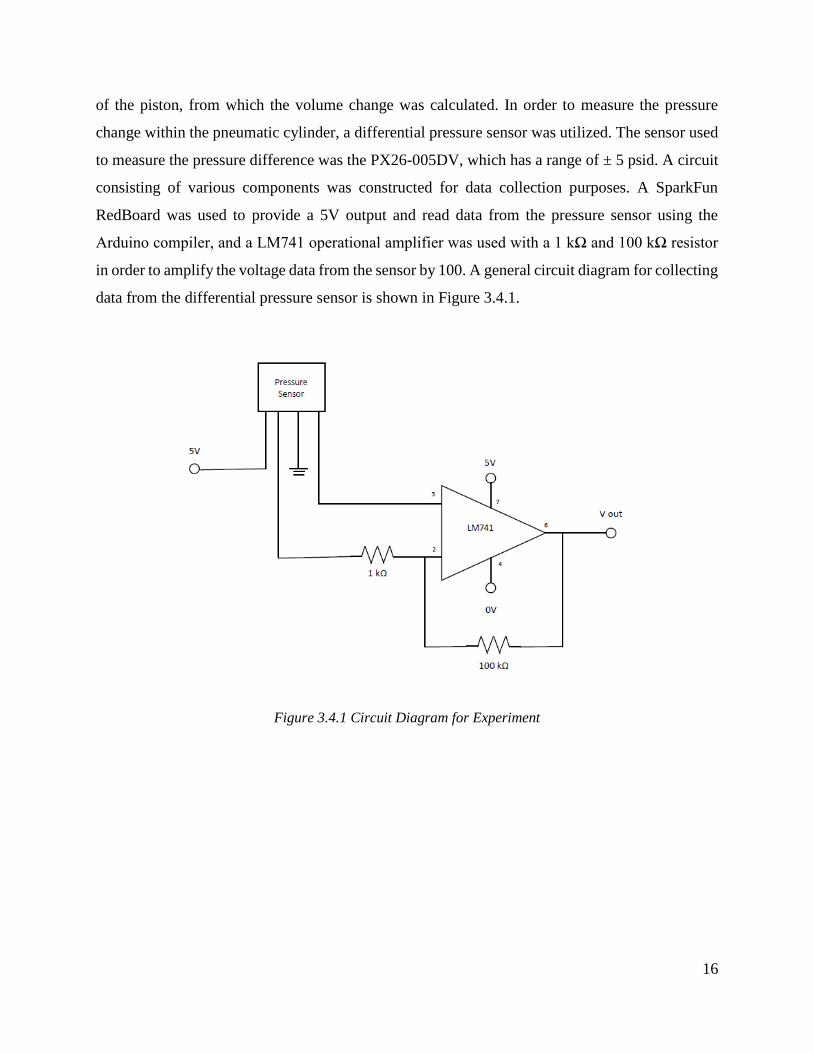
of the piston, from which the volume change was calculated. In order to measure the pressure
change within the pneumatic cylinder, a differential pressure sensor was utilized. The sensor used
to measure the pressure difference was the PX26-005DV, which has a range of ± 5 psid. A circuit
consisting of various components was constructed for data collection purposes. A SparkFun
RedBoard was used to provide a 5V output and read data from the pressure sensor using the
Arduino compiler, and a LM741 operational amplifier was used with a 1 kΩ and 100 kΩ resistor
in order to amplify the voltage data from the sensor by 100. A general circuit diagram for collecting
data from the differential pressure sensor is shown in Figure 3.4.1.
Figure 3.4.1 Circuit Diagram for Experiment

17
Figure 3.4.2 Underwater View of Prototype in Testing Environment
Figure 3.4.3 Top View of Prototype in Testing Environment
Additional aquatic floatation devices were attached to the copper float in order to increase
ease of upward motion for the buoy. These can be seen attached in Figure 3.4.2. Floatation was
increased because the copper float was smaller than ideal, therefore lacking the buoyant force

18
needed to oscillate the piston. This attachment increased the buoyancy and without any additional
suction allowed the piston to more freely oscillate with wave motion. The pressure transducer was
connected to the prototype through vinyl tubing, which extended to the poolside where data was
being collected off of a laptop. Once the prototype was attached to the pressure transducer with
vinyl tubing, additional suction was created, resulting in difficulty with oscillations in conjunction
with the small waves being generated. To overcome the suction complications, piston motion was
created by pulling on the polycarbonate tube to force oscillations. This resulted in data on pressure
output from piston strokes, however it did not generate any data on wave response. Had larger
waves been able to be generated, the initial force needed to displace the buoy would have been
met, providing data with wave response. In order to obtain this data, a second experiment was
devised.
The second experiment utilized a simplified model of the prototype in order to measure the
generated wave characteristics. This model consisted of a foam tackle for the buoy, rubber bands
of various thicknesses to act as a spring, and 50g weights to act as the mooring. A picture of the
experimental set-up can be seen below in Figure 3.4.4.
Figure 3.4.4 Wave Characteristics Experimental Set-Up

19
The spring constant of the rubber bands was determined by measuring the length of the
unstretched rubber band and then hanging a weight from the rubber band and measuring the
stretched length. By calculating the change in length and force applied, the spring constant for the
rubber band was found by using Equation 3.4.1, where 𝐹 is equal to the force, 𝑘 is equal to the
spring constant, and 𝑥 is equal to the change in length. Full calculations and results can be seen in
Appendix B.
𝐹 = −𝑘𝑥
Equation 3.4.1: Spring constant
Figure 3.4.5 Force vs. position data for rubber bands used to calculate spring constant
Once the device was assembled, it was placed in a 30-gallon container of water and waves
were generated through the oscillation of a curved piece of PVC. The device’s response was
recorded on a Nikon Coolpix B500 and the subsequent footage was uploaded to Tracker software
where the motion of the tackle was tracked and graphed over time (Version 5.0.1, 2018).
Additionally, the motion of the weight was tracked and subtracted from the position of the buoy
to determine overall change in length of the rubber band. The y displacement of the buoy was
subtracted from the initial position to determine the wave height.
These experiments provided a view into the power output of our prototypes, however there
were many limitations. Neither experiment was able to be conducted with consistent waves,
causing some gaps in data. This could have been addressed through the utilization of a wave tank
20
if the resource was available. Without the consistency, properties were still able to be empirically
determined and results were obtained.
To determine how the data collected from each experiment could be related to the
performance of a full scale WEC, a scaling factor was necessary. When scaling data from a
prototype to a full-scale model, it is necessary to account for scaling effects to achieve similarity
with the prototype. Scale effects are due to the fact that the force ratios are not identical between
the model and its prototype, and this must be taken in consideration when analyzing the
calculations for the full-size WEC. To scale from the experimental model to a full-scale WEC,
Froude number similarity was used since most free surface flows are modeled after Froude (Heller,
2012).
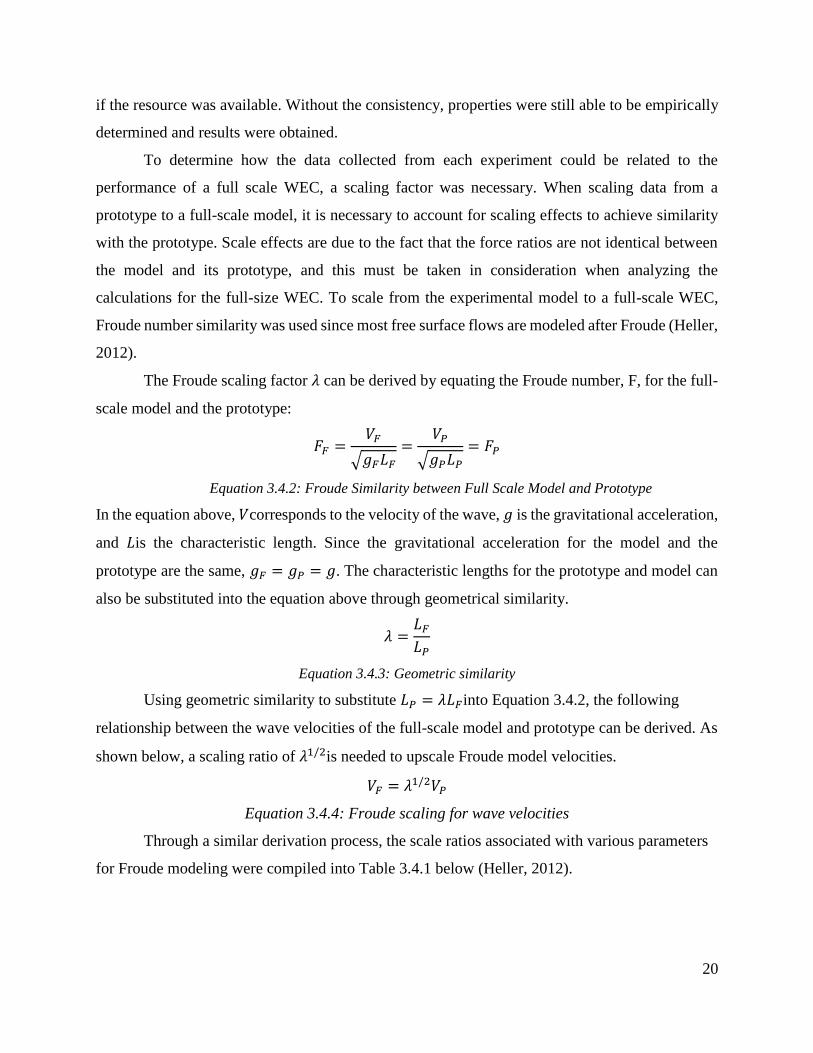
The Froude scaling factor 𝜆 can be derived by equating the Froude number, F, for the full-
scale model and the prototype:
𝐹𝐹 =𝑉𝐹
√𝑔𝐹𝐿𝐹
=𝑉𝑃
√𝑔𝑃𝐿𝑃
= 𝐹𝑃
Equation 3.4.2: Froude Similarity between Full Scale Model and Prototype
In the equation above, 𝑉corresponds to the velocity of the wave, 𝑔 is the gravitational acceleration,
and 𝐿is the characteristic length. Since the gravitational acceleration for the model and the
prototype are the same, 𝑔𝐹 = 𝑔𝑃 = 𝑔. The characteristic lengths for the prototype and model can
also be substituted into the equation above through geometrical similarity.
𝜆 =𝐿𝐹
𝐿𝑃
Equation 3.4.3: Geometric similarity
Using geometric similarity to substitute 𝐿𝑃 = 𝜆𝐿𝐹into Equation 3.4.2, the following
relationship between the wave velocities of the full-scale model and prototype can be derived. As
shown below, a scaling ratio of 𝜆1/2is needed to upscale Froude model velocities.
𝑉𝐹 = 𝜆1/2𝑉𝑃
Equation 3.4.4: Froude scaling for wave velocities
Through a similar derivation process, the scale ratios associated with various parameters
for Froude modeling were compiled into Table 3.4.1 below (Heller, 2012).

21
Parameter Dimension Froude Scaling Ratio
Length [L] 𝜆
Area [L2] 𝜆2
Volume [L3] 𝜆3
Time [T] 𝜆1/2
Velocity [LT-1] 𝜆1/2
Acceleration [LT-2] 1
Mass [M] 𝜆3
Force [MLT-2] 𝜆3
Pressure and
Stress
[ML-1T-2] 𝜆
Energy and Work [ML2T-2] 𝜆4
Power [ML2T-3] 𝜆7/2
Table 3.4.1 Froude scaling ratio

22
4. Results and Analysis
4.1 Point Absorber Prototype
A revised testing procedure was conducted to measure the pressure change associated with
piston movement. To begin, we placed the point absorber near the edge of the pool. In the initial
testing period, wave generation in the pool was a major limitation. The layout of the pool consisted
of drains located around the outer edge. These drains were slightly below water level to allow for
water filtration, and any waves that were generated by the human subject would be lost in the
drains. Without having a solid pool wall to push waves back and generate more momentum, the
generated waves were too small to move the float on the prototype and generate displacement of
the piston. As a result, the piston was manually displaced to its maximum stroke length of 6 inches
by pulling the prototype down into the water and allowing the buoyancy force to extend the piston.
When scaled up, the actual stroke length would be 7.5 ft.
Figure 4.1.1 Differential Pressure measured at maximum stroke length
When collecting data from the differential pressure sensor, voltage measurements were
collected which were then converted to differential pressure based off of the given hardware
specifications of the sensor. This graph depicts the pressure change while the piston is displaced
to its maximum stroke length over multiple iterations. By observing the data collected, it is
apparent that the sensor reports a relatively consistent pressure difference over each stroke. The

23
magnitude pressure difference was found to be 1.066 psi. For this experimental run, the average
time for one full stroke motion was 1.7 seconds.
In order to calculate the work done by the piston, Equation 4.1.1 was used where W is the
work done by the piston, P is the pressure change, and V is the change in volume of the system.
Knowing the vertical displacement of the piston, the change in volume was calculated to be 17.18
in3. With the pressure change and volume change, the work of the piston was calculated to be 2.07
Joules. The work performed by the piston can also be equated to the energy that could produced
by the prototype for each stroke.
𝑊 = 𝑃𝑉
Equation 4.1.1: Work done by the piston
𝑊 = (1.066 𝑝𝑠𝑖) ∗ (17.18 𝑖𝑛2) = (18.31 𝑙𝑏 𝑖𝑛) ∗ (0.1129 𝐽
1 𝑖𝑛 𝑙𝑏) = 2.07 𝐽
In order to calculate the work output of the full-scale WEC, the corresponding Froude
scaling ratio of 𝜆4was used to upscale the work output calculated for the prototype. Considering
that the prototype was designed to be a 1:15 scale model, 𝜆 = 15.Therefore, the estimated work
output of a full scale WEC would be approximately 104.8 kJ per maximum stroke. The estimated
time for the full-scale WEC to complete one full stroke can also be calculated using a Froude
scaling ratio of 𝜆1/2, which was calculated to be 6.6 seconds. It is important to note that these
calculations are assuming a 100% conversion efficiency of the system, whereas the actual
efficiency of the system would be approximately 30-45% due to power generation losses in the
PTO system and other losses such as distribution and transmission losses.
𝜆 = 15
𝑊𝐹 = 𝜆4𝑊𝑃 = (154) ∗ (2.07 𝐽) = 104.8 𝑘𝐽
𝑇𝐹 = 𝜆1/2𝑇𝑃 = (151/2) ∗ (1.7 𝑠) = 6.6 𝑠𝑒𝑐𝑜𝑛𝑑𝑠
4.2 Wave Characteristic testing
To understand the waves better, measurements were collected on rubber band displacement
and wave height. From these measurements, the force was calculated with Equation 4.1.1. In this
equation, 𝐹 represents the force in newtons, 𝑘 represents the spring constant of the rubber band in
kg/s2 (calculated in Appendix B), and 𝛥𝑥 represents the change in length of the rubber band in
meters.

24
𝐹 = −𝑘𝛥𝑥
Equation 4.1.1: Force of buoy
Our testing setup included a fishing tackle as the float, a rubber band as the spring, and a
weight as a mooring system. The float was anchored to the bottom of the tub with an additional
weight to limit movement in the X and Z directions. To manually create consistent waves, a curved
section of PVC pipe was used. A camera was set up in front of the testing apparatus to record the
wave and buoy motion for approximately 10 seconds. The video footage was imported into the
Tracker software, which was used to manually track the displacement of the buoy, wave height,
and weight position.
This testing did not take into account the strain of the rubber band, which is not negligible
in rubber. Additionally, there were several unknown variables when testing. The waves could not
easily be controlled, resulting in interference from waves rebounding off the sides of the tank. This
caused a large variation of lag and lead time between the maximum wave and buoy height and t.
The system was not constrained to Y motion, allowing displacement in the X and Z directions that
normally a laboratory test would have designed against. The force could not be measured and was
instead theoretically calculated. If this experiment were to be repeated, there are a number of
recommended changes for successful data collection. The unknown variables need to be limited
in order to have meaningful data.

25
5. Conclusions and Recommendations
It is important when considering the results of this project to also understand the limitations
of wave energy harvesting. While waves are consistent and always available, too harsh of a wave
can damage a system and too small of a wave will result in no movement of the piston. Waves are
inherently unpredictable, so it is impossible to design a perfect system for harvesting their energy.
Typically, wave energy conversion results in little power output because the floatation force can
only counteract so much before the force of the wave takes over and the piston is fully extended.
A buoy would have to be smaller than the height of a wave to ensure movement of the piston and
prevent riding on top of a wave.
If this project were to be repeated, an enclosed and well controlled water environment is
recommended. Ideally, this would be a wave tank in order to have consistent and controllable wave
heights and periods. This would greatly benefit any scaling models, as most calculations rely
heavily on the height of the wave.
For wave characteristic testing, constraining the buoy in only vertical motion would cause
more ideal movement. A suggestion for this is mounting the system on a rail. Two air bearings
could be used for an experiment of this size. To address the inconsistency in waves, a wave tank
could be used to create controlled, consistent waves with no destructive interference. To compare
force to the theoretical, force measurements should be taken during data collection. This could be
done with a force transducer. Considerations for water-proofing the testing apparatus should also
be made. This line of testing would be able to measure the force generated at different stiffnesses
to determine a relationship between force exerted and stiffness of the system. It would also help
determine an ideal stiffness of the system in order to obtain the the highest work output. A
schematic of the suggested experimental setup can be seen in Figure 5.1, where 1 is the tank, 2 is
the stationary slider which holds the float in place for testing, 3 is the float, 4 is the rubber band,
and 5 is the weight.

26
Figure 5.1 Wave Characteristic Experimental Setup
For future iterations of this project, we would recommend focusing on the optimal size of
the float in comparison to the stiffness of piston. This would determine the best ratio for optimal
energy harvesting. A piston with a low stiff response would result in a smaller force, limiting
power generation. A piston with a high stiff response would result in limited movement and
therefore also limit power generation. Finding the optimal stiffness would greatly benefit the field
of ocean energy harvesting. This stiffness does change in relation to buoy size, so determining the
shape of correlation would also be necessary. With a change in shape, it is also important to
perform wave characteristic testing in order to determine how the buoy shape moves in conjunction
with wave motion to prevent the overall system from being out of phase. We would recommend
testing different spring stiffnesses with different float sizes to accomplish this experiment.
Additionally, simulations of different buoy geometries would yield more insight into the system’s
response to waves and hence ability to harvest energy.

27
References
Amir, M. A. U., Sharip, R. M., Muzanni, M. A., & Anuar, H. A. (2016). Wave energy
converters (WEC): A review of the technology and power generation. AIP Conference
Proceedings, 1775(1) doi:10.1063/1.4965220
Autonomous underwater vehicles. Retrieved from http://www.whoi.edu/main/auvs
Energy smart. Retrieved from
http://www.whitehorse.vic.gov.au/IgnitionSuite/uploads/docs/Sustainable%20Living%20Guid
e%20Energy.pdf
Ewachiw, M. A., Jr. (2014). Design of an autonomous underwater vehicle (AUV) charging
system for underway, underwater recharging. ().
Bergman, J. (2011). Temperature of ocean water. Retrieved from
https://www.windows2universe.org/earth/Water/temp.html
Brown, D. (2018). Tracker (Version 5.0.1) [Computer software]. Retrieved from
https://physlets.org/tracker/
BU-407: Charging nickel-cadmium. Retrieved from
http://batteryuniversity.com/learn/article/charging_nickel_based_batteries
Chen, H., Cong, T. N., Yang, W., Tan, C., Li, Y., & Ding, Y. (2009). Progress in electrical
energy storage system: A critical review. Progress in Natural Science, 19(3), 291-312.
doi:10.1016/j.pnsc.2008.07.014
du Plessis, J. (2012). A hydraulic wave energy converter. ().
Duggan, W. (2016). wave power: The alternative energy dark horse. Retrieved from
https://money.usnews.com/investing/articles/2016-12-06/wave-power-the-alternative-energy-
dark-horse
Electricity in the United States. (2017, May 10). Retrieved April 16, 2018, from
https://www.eia.gov/energyexplained/index.cfm?page=electricity_in_the_united_states
Engin, C. D., & Yeşildirek, A. (November 2015). Designing and modeling of a point absorber
wave energy converter with hydraulic power take-off unit. Paper presented at the 1-6.
doi:10.1109/EPECS.2015.7368507
Gaspar, J. F., Calvário, M., Kamarlouei, M., & Guedes Soares, C. (2016). Power take-off
concept for wave energy converters based on oil-hydraulic transformer units. Renewable
Energy, 86(Supplement C), 1232-1246. doi:10.1016/j.renene.2015.09.035

28
Heller, V. (2012). Model-prototype similarity. Retrieved from
http://www.drvalentinheller.com/Dr%20Valentin%20Heller_files/Heller_Model-
Prototype%20Similarity.pdf
Hong, Y., Waters, R., Boström, C., Eriksson, M., Engström, J., & Leijon, M. (2014). Review
on electrical control strategies for wave energy converting systems. Renewable and
Sustainable Energy Reviews, 31(Supplement C), 329-342. doi:10.1016/j.rser.2013.11.053
Nader, J. P., Dr. (2013). Interaction of ocean waves with oscillating water column wave energy
converters (Master's thesis, University of Wollongong, 2013). University of Wollongong.
Kongsberg.Autonomous underwater vehicle, REMUS 600. Retrieved from
https://www.km.kongsberg.com/ks/web/nokbg0240.nsf/AllWeb/F0437252E45256BDC12574
AD004BDD4A?OpenDocument
Ocean Power Technologies. (2011). Company presentation Ocean Power Technologies.
Retrieved from https://oceanpowertechnologies.gcs-web.com/static-files/212d7a27-1fee-40cc-
92e2-ca600045c8a0
Ocean Power Technologies. (2017). Ocean power technologies: In the news. Retrieved from
http://www.oceanpowertechnologies.com/resources/
Ocean wave energy. Retrieved from https://www.boem.gov/Ocean-Wave-Energy/
Poullikkas, Andreas. (2014). Technology prospects of wave power systems. Electronic Journal
of Energy & Environment.
Raghunathan, V., Kansal, A., Hsu, J., Friedman, J. K., & Srivastava, M. B. (2005). Design
considerations for solar energy harvesting wireless embedded systems
. Eastern-European Journal of Enterprise Technologies, 2(12(68)), 72. doi:10.15587/1729-
4061.2014.23865
Simple and robust construction - complex design (2005). Retrieved from
http://www.wavedragon.net/index.php?option=com_content&task=view&id=6
Têtu, A. (2017). Power take-off systems for WECs Springer, Cham. doi:10.1007/978-3-319-
39889-1_8
Ulvin, J. B., Molinas, M., & Sjolte, J. (2012). Analysis of the power extraction capability for
the wave energy converter BOLT®. Energy Procedia, 20(Supplement C), 156-169.
doi:10.1016/j.egypro.2012.03.017
U. (2017). Attenuator (Pelamis - Pelamis Wave Power). Retrieved April 1, 2018, from
http://www.esru.strath.ac.uk/EandE/Web_sites/14-15/Wave_Energy/attenuator.html

29
Voorhis, R. (2012, July 25). Point Absorbers: The Technology and Innovations. Retrieved
April 24, 2018, from http://coastalenergyandenvironment.web.unc.edu/ocean-energy-
generating-technologies/wave-energy/point-absorbers/
Wang, L., & Isberg, J. (2015). Nonlinear passive control of a wave energy converter subject to
constraints in irregular waves. Energies, 8(7), 6528-6542. doi:10.3390/en8076528
Wave Energy. (n.d.). Retrieved from http://www.oceanenergycouncil.com/ocean-energy/wave-
energy/
4 Charts That Show Renewable Energy is on the Rise in America. (2016, November 14).
Retrieved April 16, 2018, from https://www.energy.gov/eere/articles/4-charts-show-
renewable-energy-rise-america

30
Appendix A: Prototype Parts
Major Components
Buoy
19.90 oz.
8" diameter
Copper
Pneumatic Cylinder
2-1/2" Air Cylinder Bore Dia with 6" Stroke
Stainless Steel
Nose Mounted Air Cylinder
Polycarbonate Tube
3-1/2 inch outside diameter x 4 ft. long
31
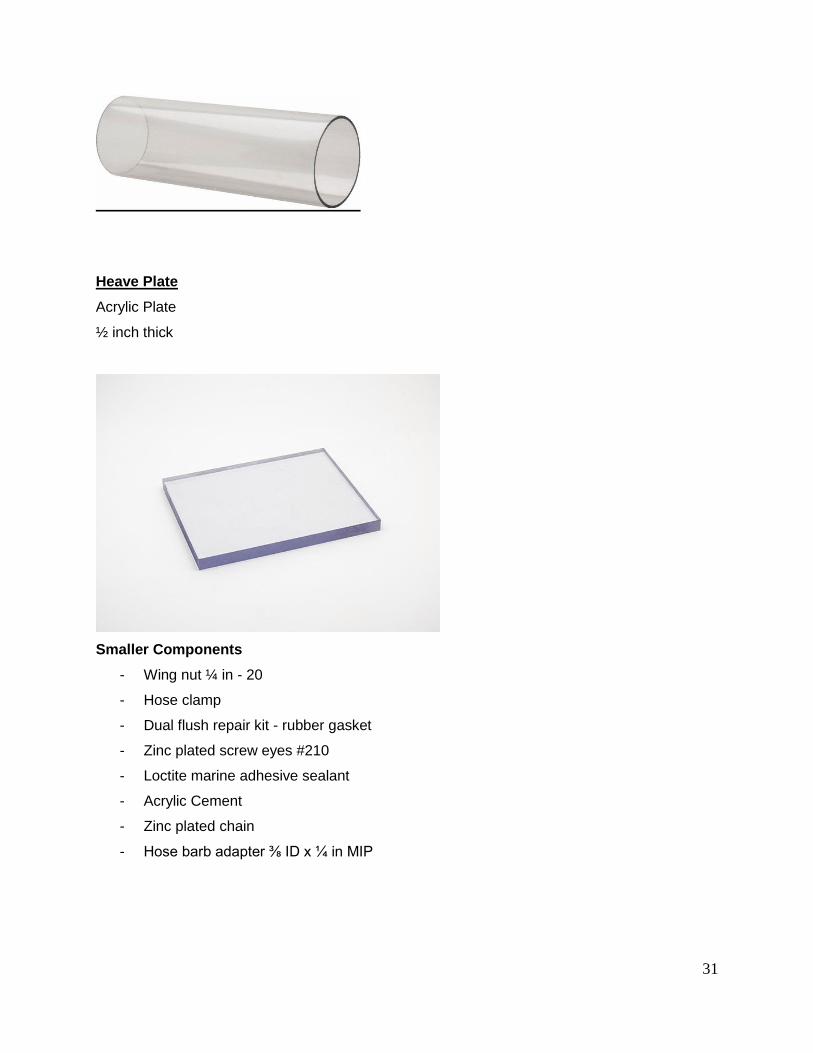
Heave Plate
Acrylic Plate
½ inch thick
Smaller Components
- Wing nut ¼ in - 20
- Hose clamp
- Dual flush repair kit - rubber gasket
- Zinc plated screw eyes #210
- Loctite marine adhesive sealant
- Acrylic Cement
- Zinc plated chain
- Hose barb adapter ⅜ ID x ¼ in MIP

32
Electronics
- Duracell 9 V batteries
- Arduino Kit
- Breadboard
- Differential gage pressure sensor
-

33
Appendix B: Spring Constants of Rubber Bands

34
Rubber Band (initial length) Weight (g) 𝛥x (in) k (kg/s2)
1 (3.5 in)
50.02 0.5 39
100.01 1.125 34
153.6 2.5 24
2 (3.25 in)
50.02 0.5 39
100.01 1.125 34
153.6 2.75 22
3 (3.25 in)
100.01 0.25 155
153.6 0.75 79
254.72 1.4375 68
4 (7.125 in)
100.01 0.375 103
153.6 0.625 95
254.72 1.25 79
Sample Calculation:
Rubber band 1:
𝐹 = −𝑘𝑥
𝐹 = 𝑚𝑎 = (50.02𝑔)(−9.81𝑚/𝑠2)(1 𝑘𝑔
1000 𝑔)
𝐹 = −0.49 𝑁
−0.49 𝑁 = −𝑘(0.5 𝑖𝑛)(2.54 𝑐𝑚
1 𝑖𝑛)(
1 𝑚
100 𝑐𝑚)
𝑘 = 39 𝑘𝑔/𝑠2
Related Documents