This article appeared in a journal published by Elsevier. The attached copy is furnished to the author for internal non-commercial research and education use, including for instruction at the authors institution and sharing with colleagues. Other uses, including reproduction and distribution, or selling or licensing copies, or posting to personal, institutional or third party websites are prohibited. In most cases authors are permitted to post their version of the article (e.g. in Word or Tex form) to their personal website or institutional repository. Authors requiring further information regarding Elsevier’s archiving and manuscript policies are encouraged to visit: http://www.elsevier.com/authorsrights

Welcome message from author
This document is posted to help you gain knowledge. Please leave a comment to let me know what you think about it! Share it to your friends and learn new things together.
Transcript
This article appeared in a journal published by Elsevier. The attachedcopy is furnished to the author for internal non-commercial researchand education use, including for instruction at the authors institution
and sharing with colleagues.
Other uses, including reproduction and distribution, or selling orlicensing copies, or posting to personal, institutional or third party
websites are prohibited.
In most cases authors are permitted to post their version of thearticle (e.g. in Word or Tex form) to their personal website orinstitutional repository. Authors requiring further information
regarding Elsevier’s archiving and manuscript policies areencouraged to visit:
http://www.elsevier.com/authorsrights

Author's personal copy
Deconvolution of overlapping cortical auditory evoked potentialsrecorded using short stimulus onset-asynchrony ranges
Fabrice Bardy a,b,c,⇑, Bram Van Dun b,c, Harvey Dillon b,c, Catherine M. McMahon a,b
a Department of Linguistics, Macquarie University, NSW, Australiab HEARing Co-operative Research Centre, Australiac National Acoustic Laboratories, NSW, Australia
a r t i c l e i n f o
Article history:Available online 24 October 2013
Keywords:ElectroencephalographyLeast-squares deconvolutionCortical auditory evoked potentialStimulus onset-asynchronyAlternating stimulus frequency
h i g h l i g h t s
� The least-squares (LS) deconvolution can effectively disentangle overlapping cortical auditory evokedpotentials (CAEPs).
� The CAEP is sensitive to the frequency of the stimulus, the length of the stimulus onset asynchrony(SOA), and the mode of presentation (fixed or alternating).
� The deconvolution of CAEPs using short SOAs in a paired paradigm provides information about thebalance of cortical excitation and inhibition for rapidly presented stimuli.
a b s t r a c t
Objective: The first aim of this study is to validate the theoretical framework of least-squares (LS) decon-volution on experimental data. The second is to investigate the waveform morphology of the corticalauditory evoked potential (CAEP) for five stimulus onset-asynchronies (SOAs) and effects of alternatingstimulus frequency in normally hearing adults.Methods: Eleven adults (19–55 years) with normal hearing were investigated using tone-burst stimuli of500 and 2000 Hz with SOAs jittered around 150, 250, 450, and 850 ms in a paired-interval paradigm withfixed or alternating stimulus frequency.Results: The LS deconvolution technique disentangled the overlapping responses, which then providedthe following insights. The CAEP amplitude reached a minimum value for SOAs jittered around450 ms, in contrast with significantly larger amplitudes for SOAs jittered around 150 and 850 ms. Despitethis, longer latencies of N1 and P2 consistently occurred for decreasing SOAs. Alternating stimulus fre-quency significantly increased the amplitude of the CAEP response and decreased latencies for SOAs jit-tered around 150 ms. Effects of SOAs and alternating stimuli on CAEP amplitude can be modelled using aquantitative model of latent inhibition.Conclusions: LS deconvolution allows correction for cortical response overlap. The amplitude of the CAEPis sensitive to SOA and stimulus frequency alternation.Significance: CAEPs are emerging as an important tool in the objective evaluation of hearing aid andcochlear implant fittings. Responses to closely spaced stimuli provide objective information about inte-gration and inhibition mechanisms in the auditory cortex.� 2013 International Federation of Clinical Neurophysiology. Published by Elsevier Ireland Ltd. All rights
reserved.
1. Introduction
Cortical auditory evoked potentials (CAEPs), also called ‘‘latelatency AEPs’’ provide valuable information about the integrity of
the auditory pathway up to the auditory cortex. Measurement ofCAEPs is increasingly used for objective clinical audiometry or toobjectively assist with the fitting of hearing aids in infants andincapacitated adults (Billings et al., 2012; Dillon, 2005; Lightfootand Kennedy, 2006; Ross et al., 2000).
The waveform morphology of CAEPs obtained for stimulus on-set-asynchronies (SOAs) between 0.5 and 10 s is well reported inthe literature. In normal hearing adults, this waveform morphologyis characterised by the P1–N1–P2 complex occurring between 30
1388-2457/$36.00 � 2013 International Federation of Clinical Neurophysiology. Published by Elsevier Ireland Ltd. All rights reserved.http://dx.doi.org/10.1016/j.clinph.2013.09.031
⇑ Corresponding author. Address: Macquarie University, Australian Hearing Hub,16 University Avenue, NSW 2109, Australia. Tel.: +61 2 94 12 68 14; fax: +61 2 9412 67 69.
E-mail address: [email protected] (F. Bardy).
Clinical Neurophysiology 125 (2014) 814–826
Contents lists available at ScienceDirect
Clinical Neurophysiology
journal homepage: www.elsevier .com/locate /c l inph

Author's personal copy
and 260 ms after stimulus onset (Alain and Tremblay, 2007). Manystudies to date have focused on the effect of SOA change in theadult CAEP waveform, using a constant interval between stimuli(fixed SOA) and a single stimulus frequency (rather than inter-leaved stimuli). Generally, for SOAs greater than 500 ms, increasedamplitude of the neural response is observed as the SOA extends toat least 10 s with minimal change to waveform latencies (Daviset al., 1966; Sussman et al., 2008; Tremblay et al., 2004; Zachariaset al., 2012a). Using a conventional averaging technique, only a fewstudies have investigated the CAEP characteristics for short SOAs.Down to 300 ms, these studies have generally shown reducedamplitudes and prolonged latencies with a decreased interval be-tween stimuli (Davis et al., 1966; Sussman et al., 2008). Suchchanges are highlighted by Sussman et al. (2008). Using adult par-ticipants, it was shown that with an SOA decrease from 800 to400 ms for tone bursts 50 ms in duration, a progressive suppres-sion in N1 peak amplitude and increase in P1 and P2 latencies oc-curs. Likewise, based on data collected from younger adults,Tremblay et al. (2004) reported similar amplitude reductions ofthe P1–N1–P2 response and small N1 and P2 latency increases asthe SOA was reduced from 1690 to 700 ms for a speech stimulus(/pa/) and tonal stimulus (1000 Hz) with 180 ms duration.
Interestingly, in a recent study focussing on the N1m recordedwith magnetoencephalography (MEG), Zacharias et al. (2012a) re-port that stimulation history had an important influence on theamplitude of the auditory response. They indicate that the ampli-tude of the response in the random design was influenced by boththe immediately preceding SOA and the time intervals between allother preceding stimuli. Further, the strength of the response wasmore affected if the SOA was fixed compared to a sequence whereSOAs occurred in a pseudorandom order. In the fixed presentationmode, the response asymptoted to a value, whereas in the randomdesign the response amplitude varied more widely. On the basis ofthese findings, the authors developed the ‘‘transient reduction ofexcitability’’ (TREX) model which accounts for the N1m amplitudechanges after preceding stimuli.
The high temporal resolution of electroencephalography en-ables the neural processing of rapidly presented acoustic stimulito be investigated. However, the recording of auditory evokedpotentials (AEPs) at fast presentation rates is not commonly usedas the neural responses overlap when the response length is longerthat the interval between two stimuli (Ozdamar and Bohorquez,2006). For SOAs shorter than 300 ms, the utilisation of normalaveraging techniques show that the CAEP waveform characteristicschange dramatically due to the overlap of two cortical responses,thereby complicating the interpretation of results (Durrant andBoston, 2007; Sable et al., 2004; Sussman et al., 2008).
The few studies investigating CAEPs using a correction tech-nique for overlapping responses for short SOAs, have used the level1 Adjacent Response (ADJAR) technique (Woldorff, 1993). Level 1of ADJAR is a non-iterative process which corrects for the immedi-ately preceding or following response by subtracting the best esti-mate of the response to the first stimulus from the overlappedresponse (Fox et al., 2010; Sable et al., 2004; Wang et al., 2008).One of the main limitations of this method is the wide SOA rangeneeded to make an accurate estimation of the correct undistortedwaveform. Budd and Michie (1994) used this method in a designwhich included a large SOA jitter and derived the CAEP morphol-ogy for different SOA ranges. Another study using paired para-digms implemented ADJAR level 1 to investigate the corticalresponse elicited by the second stimulus of the pair using shortSOAs (Fox et al., 2010). A consensus among the findings of thesestudies was that the N1 amplitude increased with SOAs shorterthan 400 ms. Similar results using the same method have also beenreported with the corresponding magnetic component, the N1m(Loveless et al., 1996).
When response overlap occurs, the goal of the deconvolution isto recreate the response as it existed before the convolution of theresponse and the stimulus timing took place. The deconvolutiontechnique, which is described and validated in an accompanyingpaper (Bardy et al., 2014), is based on a combination of mathemat-ical concepts of deconvolution and squared error minimization.The least-squares (LS) deconvolution can only be performed ifthe stimulus sequence is jittered and known for processing of thecontinuous EEG file.
There are two main assumptions underlying the use of the LSdeconvolution technique. The first assumption is that the overlap-ping responses correspond to the linear superimposition of the cor-tical responses time locked on the stimulus sequence (Burger et al.,2009). The second is that the morphology of the response to a suc-ceeding sound is identical in one jitter range. In other words, thesystem is considered to be time-invariant within each SOA rangetested. The ability to apply the LS deconvolution with a restrictedjitter range is its major advantage over ADJAR.
In this study, we investigated the adaptation of the cortical re-sponse in adults with normal hearing, used a paired paradigm gen-erated by tone-burst stimuli presented with short SOAs andalternating or non-alternating frequencies. The use of the LSdeconvolution optimizes the recovery of the overlapping CAEPsby minimizing residual errors. Finally, we implemented a physio-logical model recently developed by Zacharias et al. (2012a) thatsupports a latent inhibition principle for the increase of the re-sponse amplitude for SOAs shorter than 450 ms.
2. Hypothesis
The first hypothesis is that the LS deconvolution technique candisentangle overlapping CAEPs recorded in normal hearing adults.The second hypothesis is that the CAEP generated by the secondstimulus of the pair will be influenced by the SOA between thetwo stimuli of the pair. The third hypothesis is that pairs withchanging stimulus frequencies will evoke CAEPs larger than pairswith the same stimulus frequencies, and that the increase will belargest for the shortest SOAs.
3. Methods
The theoretical framework developed and presented in anaccompanying paper, which disentangles multiple overlapping re-sponses, was applied to recover CAEPs recorded in a paired tone-burst paradigm including very short SOAs (Bardy et al., 2014).
3.1. Subjects
Eleven healthy participants (6 females and 5 males; ages rang-ing from 19 to 55 years; mean 29 years 5 months; SD 10 years3 months) with normal hearing, and no history of hearing difficultyor neurological disorder, participated in the study. Written in-formed consent was obtained from participants and the studywas approved and conducted under the ethical supervision of theAustralian Hearing Human Research Ethics Committee and theMacquarie University Ethics Review Committee.
3.2. Stimuli
The auditory stimuli used in this experiment were two tone-burst stimuli with frequencies of 500 and 2000 Hz with an inten-sity of 50 dB nHL presented binaurally. These tone-bursts were50 ms in duration with a 10 ms rise-fall time to minimize spectralsplatter. Stimuli were acoustically calibrated in an HA-2, 2-cccoupler using a Brüel & Kjaer 4230 sound level meter. MATLAB
F. Bardy et al. / Clinical Neurophysiology 125 (2014) 814–826 815

Author's personal copy
(Mathworks) was utilized to create the sequence file and Neuro-scan Stim2 (Compumedics) to present the stimuli.
The auditory stimuli were presented in a paired-stimulus para-digm. The stimulus onset-asynchrony (SOA) of each stimulus pairwas selected from four different ranges. These SOA ranges were la-belled by their geometric SOA mean (SOA150 = 120–190 ms;SOA250 = 190–330 ms; SOA450 = 330–610 ms; SOA850 = 610–1170 ms). Sequence optimization was not required in this specificexperimental design given that the investigated overlap is alwaysonly composed of two responses. Each stimulus pair was separatedby an inter-pair interval randomly selected from 1120 to 2240 ms(SOA1650). As stated before, the introduced SOA jitter is a prere-quisite to allow a solution for the matrix algebra of the LS decon-volution method.
Both a fixed and alternating presentation mode were investi-gated (see Fig. 1). In the fixed presentation mode, the stimulus fre-quency was fixed at 500 Hz in Run 1 and at 2000 Hz in Run 2. In thealternating presentation mode, the two stimuli of the pair had dif-ferent frequencies. In Run 3, the 500 Hz stimulus was in first posi-tion and the 2000 Hz stimulus in second position of the pair. In Run4, the positions were reversed.
For the four runs of the experiment, the SOA distributions wererectangular within each SOA range with a SOA step size of 13.3 ms.All SOA ranges had the same time length of presentation which im-plies that the number of stimulus pairs depended on the SOArange. It allowed for:
– 110 stimulus pairs for SOA ranging between 610 and 1170 ms(SOA850).
– 132 stimulus pairs for SOA ranging between 330 and 610 ms(SOA450).
– 143 stimulus pairs for SOA ranging between 190 and 330 ms(SOA250).
– 152 stimulus pairs for SOA ranging between 120 and 190 ms(SOA150).
According to the properties of signal averaging, a larger numberof presentations for the short SOA ranges lead to a slight signal-to-noise ratio (SNR) increase. These differences do not affect the
results and conclusions of this study. The duration of each runwas approximately 17 min. The run’s order for each subject wasquasi-random using a Latin square design (Bradley, 1958). Record-ings were obtained over a period of approximately 2 h each for thetest and retest conditions, with a lunch break in between.
3.3. Data acquisition
The electroencephalograms were obtained with Neuroscan Syn-amps2 version 4.3 (Compumedics) by placing six gold-plated elec-trodes onto the subject’s head. The International 10–20 system(Roger and Thornton, 2007) was used with electrodes placed atvertex midline (Cz), the left (C3) and right (C4) hemispheres, atthe right (M2) and left (M1) mastoids and one on the forehead(Fpz) to act as ground.
Prior to the placement of electrodes, the subject’s skin was pre-pared using NuPrep EEG abrasive skin prepping gel. Water-solubleelectrode paste was used to ensure a good connection betweenelectrodes and skin and to achieve low impedance of less than5 kO across all electrode sites. During testing, the subjects were sit-ting comfortably in a dimmed, sound attenuated booth, while thetone-burst stimuli were delivered through insert earphones (Ety-motic ER-3A). The participants watched a muted close-captionedDVD of their choice and were instructed not to pay attention tothe stimulus.
3.4. Data analysis
For the purpose of this paper, latency and amplitude measure-ments were analyzed at the vertex midline (Cz) referenced to theright mastoid (M2) as the CAEP amplitude in this site is the largest(Hall, 2007).
All EEG channels were amplified with a gain of 2010, digitizedat a sampling rate of 1000 Hz, and online bandpass filtered be-tween 0.01 and 30 Hz. All epoched files were exported to MATLABfor off-line processing. The signal processing on the raw EEG fileswas partly conducted using EEGLAB (Delorme and Makeig, 2003).For artefact rejection, epochs composed of a pair of stimuli withsignal in excess of ±50 lV were excluded. The EEG files were offline
Fig. 1. Schematic illustration of paired stimulus trains. All stimuli are tone-bursts, 50 ms in duration, and presented binaurally at 50 dB SL through insert earphones. In fixedpresentation mode, the tone-burst has a frequency of 500 Hz in Run 1 and of 2000 Hz in Run 2. In alternating presentation mode, Run 3 uses a 500 Hz stimulus in the firstposition of the pair, whereas Run 4 has a 2000 Hz stimulus in the first position. The SOA within a pair was randomly assigned to one of four SOA ranges (SOA150 = 120–190 ms;SOA250 = 190–330 ms; SOA450 = 330–610 ms; SOA850 = 610–1170 ms). The inter-pair interval was randomly chosen from SOA1650 = 1120–2240 ms.
816 F. Bardy et al. / Clinical Neurophysiology 125 (2014) 814–826
Author's personal copy
bandpass filtered between 3 and 15 Hz using a zero-phase filter. Anepoch of 500 ms (100 ms pre- and 400 ms post-stimulus onset)was used for the study. The CAEP generated by both the first andsecond stimulus of each pair, for SOAs jittered around 150, 250,450 and 850 ms, were recovered using LS deconvolution.
P1, N1 and P2 peak latencies and amplitudes were visuallyidentified. These amplitudes and latencies were then averaged toobtain means and standard errors based on the eleven subjects.The overall magnitude of the CAEP was also expressed as the rootmean square (RMS) in a response window from 0 to 300 ms afteronset.
3.5. Statistical analysis
Repeated measures ANOVAs were performed in a 5 � 2 � 2design on the recovered waveforms. The independent variableswere 5 SOA conditions (150, 250, 450, 850, and 1650 ms), 2 stim-ulus frequencies (1000 and 2000 Hz), and 2 modes of presentation(fixed or alternating). The ANOVAs were performed on the absoluteamplitudes of peak P1, N1 and P2, the RMS amplitude, and theabsolute latency of peak P1, N1 and P2. Greenhouse–Geissercorrections for sphericity were applied, as indicated by the citede value. Post-hoc comparisons were calculated using Tukey’s test
−400 −200 0 200 400 600 800
−3
−2
−1
0
1
2
3
Time ms−400 −200 0 200 400 600 800
−3
−2
−1
0
1
2
3
Time ms−400 −200 0 200 400 600 800
−3
−2
−1
0
1
2
3
Time ms−400 −200 0 200 400 600 800
−3
−2
−1
0
1
2
3
Time ms
−400 −200 0 200 400 600 800
−3
−2
−1
0
1
2
3
Time ms−400 −200 0 200 400 600 800
−3
−2
−1
0
1
2
3
Time ms−400 −200 0 200 400 600 800
−3
−2
−1
0
1
2
3
Time ms−400 −200 0 200 400 600 800
−3
−2
−1
0
1
2
3
Time ms
Am
plitu
de (µ
V)
Am
plitu
de (µ
V)
Am
plitu
de (µ
V)
Am
plitu
de (µ
V)
1st Tone-burst = 500 Hz
1st Tone-burst = 500 Hz
1st Tone-burst = 2000 Hz
1st Tone-burst = 2000 Hz 2nd Tone-burst = 500 Hz
2nd Tone-burst = 500 Hz 2nd Tone-burst = 2000 Hz
2nd Tone-burst = 2000 Hz
RUN 1 RUN 2
RUN 3 RUN 4
Corrected Uncorrected
Corrected Uncorrected
Corrected Uncorrected
Corrected Uncorrected
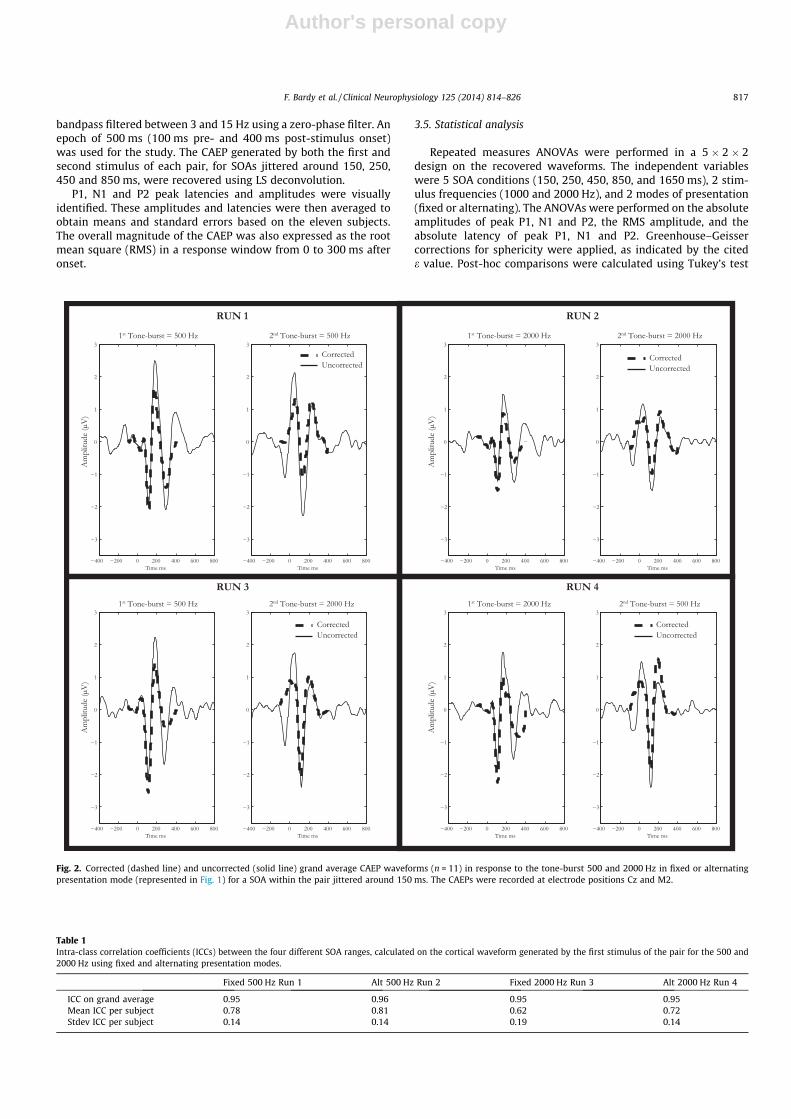
Fig. 2. Corrected (dashed line) and uncorrected (solid line) grand average CAEP waveforms (n = 11) in response to the tone-burst 500 and 2000 Hz in fixed or alternatingpresentation mode (represented in Fig. 1) for a SOA within the pair jittered around 150 ms. The CAEPs were recorded at electrode positions Cz and M2.
Table 1Intra-class correlation coefficients (ICCs) between the four different SOA ranges, calculated on the cortical waveform generated by the first stimulus of the pair for the 500 and2000 Hz using fixed and alternating presentation modes.
Fixed 500 Hz Run 1 Alt 500 Hz Run 2 Fixed 2000 Hz Run 3 Alt 2000 Hz Run 4
ICC on grand average 0.95 0.96 0.95 0.95Mean ICC per subject 0.78 0.81 0.62 0.72Stdev ICC per subject 0.14 0.14 0.19 0.14
F. Bardy et al. / Clinical Neurophysiology 125 (2014) 814–826 817

Author's personal copy
Fig. 3. CAEP waveforms (n = 11) generated by the first stimulus of the pair (always preceded by an SOA from the range 1120 to 2240 ms), recorded at electrode positions Czand M2 for 500 and 2000 Hz using fixed and alternating presentation modes for the four different succeeding SOAs, jittered around 150, 250, 450 and 850 ms. The grandaverage CAEP across SOA is displayed in the right column and labelled SOA = 1650 ms.
818 F. Bardy et al. / Clinical Neurophysiology 125 (2014) 814–826
Author's personal copy
(Keselman, 1998; Park et al., 2009). All statistical analyses wereconducted using Statistica 7.1 (StatSoft, Inc.).
3.6. The inter-class correlation coefficient (ICC)
Inter-class correlation coefficients (ICC) were calculated be-tween waveforms elicited by the first stimulus of the pair for eachSOA range. The ICC provides an objective global index of the simi-larity of amplitude and shape between the two waveforms. An ICCCase label 1 using an absolute agreement definition described byMcGraw and Wong (1996) was calculated. The ICC becomes 1when there is perfect agreement whereas a smaller value repre-sents lower similarity between two waveforms. This measure al-lows evaluation of the influence of the duration of thesucceeding SOA on the morphology of the cortical response ofthe first stimulus of the pair (for the SOA ranges 150, 250, 450,and 850 ms).
4. Results
4.1. Overlapping cortical auditory evoked responses
Fig. 2 presents the CAEP grand averages elicited by the twotone-bursts of the pair with SOAs jittered around 150 ms. This isshown for the 4 different runs, before correction (dashed line)and after correction (solid line) using LS deconvolution. The uncor-rected waveform for each run illustrates the problem of overlap-ping responses when the time interval between the stimuli ofthe pair (i.e. SOA) is shorter than the CAEP response length. In
the uncorrected waveform, averaging overlapping responses inthe presence of 70 ms jitter (120–190 ms) works as a low-pass fil-ter of about 14 Hz = (1000/70), reported previously by Woldorff(1993). Hence, jittering only cancels the high frequency compo-nents of the overlapping response. The frequency of the slowestdominant wave of the CAEP is smaller than 14 Hz. Therefore, clearoverlapping responses are still observable. For example, the lateportion of the uncorrected waveform of the 1st tone-burst of thepair still contains the response to the second tone-burst. Similarly,the baseline and early portion of the response to the second stim-ulus of the pair is contaminated by the late portion of the responseof the 1st tone-burst. This example shows the complications to la-bel, characterise and interpret the amplitudes and latencies of thecomponents of the response and the need to apply a correctiontechnique. The difference between the uncorrected and correctedwaveform shows the effect of the LS deconvolution. Waveformmorphology and statistical analysis of the corrected waveformare reported later in this paper.
4.2. Intra-class correlation coefficient (ICC) analyses
For each subject, the similarity of the CAEP (evoked by the firststimulus of the pair) for each of the four different SOA ranges wasinvestigated by calculating the ICC over the 0–350 ms time inter-val. The same calculation was then made on the waveform grandaverage over all subjects (again amongst those four SOA ranges).The subjects’ ICC means and standard deviations, and the ICC ofthe waveform grand average are summarized in Table 1.
A general observation is that the high ICC for the grand meanwaveform for all runs (P0.95) are minimally affected by variation
Table 2Statistical p-values for the SOA, the mode of presentation, and the stimulus effect for P1, N1, P2, P1–N1 and N1–P2 amplitudes and latencies. Greenhouse–Geisser corrections ofthe degrees of freedom were used where an assumption of sphericity was not appropriate.
1 SOA Mode of presentation Stimulus
P1 Amplitude F(4,40) = 10.77; p = 0.001; e = 0.46 F(1,10) = 0.10; p = 0.75; e = 1 F(1,10) = 1.70; p = 0.22; e = 1Latency F(4,40) = 3.50; p = 0.031; e = 0.69 F(1,10) = 4.21; p = 0.067; e = 1 F(1,10) = 15.76; p = 0.003; e = 1
N1 Amplitude F(4,40) = 5.18; p = 0.016; e = 0.45 F(1,10) = 21.56; p = 0.0009; e = 1 F(1,10) = 6.66; p = 0.027; e = 1Latency F(4,40) = 8.64; p = 0.0039; e = 0.41 F(1,10) = 6.51; p = 0.029; e = 1 F(1,10) = 6.75; p = 0.026; e = 1
P2 Amplitude F(4,40) = 11.85; p = 0.0002; e = 0.45 F(1,10) = 16.62; p = 0.002; e = 1 F(1,10) = 11.29; p = 0.007; e = 1Latency F(4,40) = 10.77; p = 0.000002; e = 0.60 F(1,10) = 0.12; p = 0.73; e = 1 F(1,10) = 21.28; p = 0.0009; e = 1
RMS Amplitude F(4,40) = 10.07; p = 0.0006; e = 0.87 F(1,10) = 18.15; p = 0.001; e = 1 F(1,10) = 19.55; p = 0.0012; e = 1
−2
−1.5
−1
−0.5
0
0.5
1
1.5
SOA~150 ms
Am
plitu
de (µ
V)
−2
−1.5
−1
−0.5
0
0.5
1
1.
SOA~250 ms
−2
−1.5
−1
−0.5
0
0.5
1
1.5
SOA~450 ms
−2
−1.5
−1
−0.5
0
0.5
1
1.5
SOA~850 ms
−2
−1.5
−1
−0.5
0
0.5
1
1.5
SOA~1650 ms
−2
−1.5
−1
−0.5
0
0.5
1
1.5
SOA~150 ms
−2
−1.5
−1
−0.5
0
0.5
1
1.5
SOA~250 ms
−2
−1.5
−1
−0.5
0
0.5
1
1.5
SOA~450 ms
−2
−1.5
−1
−0.5
0
0.5
1
1.5
SOA~850 ms
−2
−1.5
−1
−0.5
0
0.5
1
1.5
SOA~1650 ms
−100 0 100 200 300
−2
−1.5
−1
−0.5
0
0.5
1
1.5
Time (ms)
Am
plitu
de (µ
V)
−100 0 100 200 300
−2
−1.5
−1
−0.5
0
0.5
1
1.5
Time (ms)−100 0 100 200 300
−2
−1.5
−1
−0.5
0
0.5
1
1.5
Time (ms)−100 0 100 200 300
−2
−1.5
−1
−0.5
0
0.5
1
1.5
Time (ms)−100 0 100 200 300
−2
−1.5
−1
−0.5
0
0.5
1
1.5
Time (ms)−100 0 100 200 300
−2
−1.5
−1
−0.5
0
0.5
1
1.5
Time (ms)−100 0 100 200 300
−2
−1.5
−1
−0.5
0
0.5
1
1.5
Time (ms)−100 0 100 200 300
−2
−1.5
−1
−0.5
0
0.5
1
1.5
Time (ms)−100 0 100 200 300
−2
−1.5
−1
−0.5
0
0.5
1
1.5
Time (ms)−100 0 100 200 300
−2
−1.5
−1
−0.5
0
0.5
1
1.5
Time (ms)
Fixed Presentation Mode Alternating Presentation Mode
500 Hz
2000 Hz
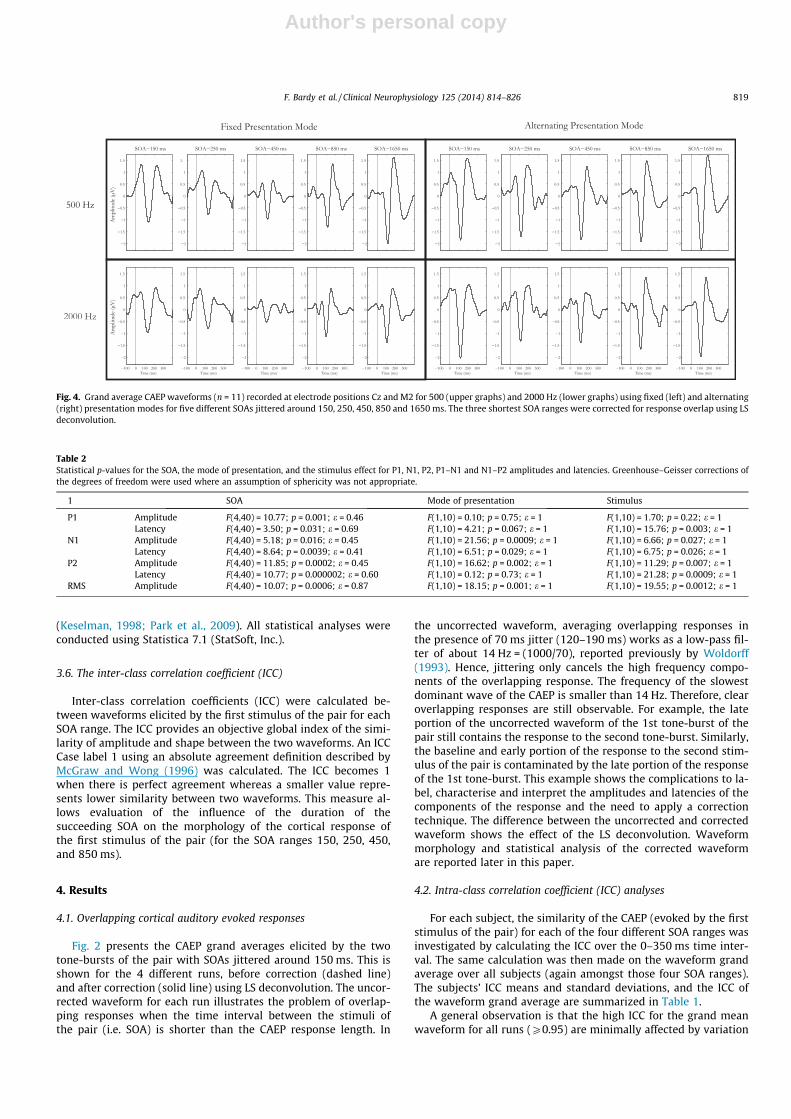
Fig. 4. Grand average CAEP waveforms (n = 11) recorded at electrode positions Cz and M2 for 500 (upper graphs) and 2000 Hz (lower graphs) using fixed (left) and alternating(right) presentation modes for five different SOAs jittered around 150, 250, 450, 850 and 1650 ms. The three shortest SOA ranges were corrected for response overlap using LSdeconvolution.
F. Bardy et al. / Clinical Neurophysiology 125 (2014) 814–826 819
Author's personal copy
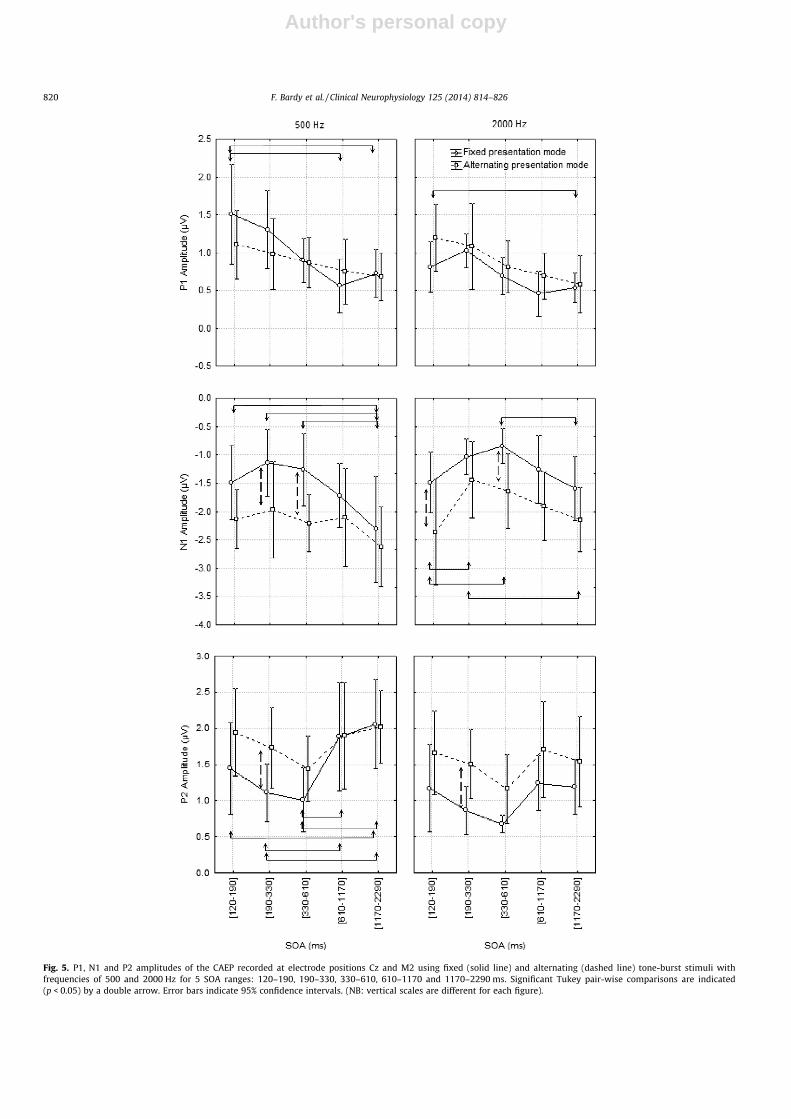
Fig. 5. P1, N1 and P2 amplitudes of the CAEP recorded at electrode positions Cz and M2 using fixed (solid line) and alternating (dashed line) tone-burst stimuli withfrequencies of 500 and 2000 Hz for 5 SOA ranges: 120–190, 190–330, 330–610, 610–1170 and 1170–2290 ms. Significant Tukey pair-wise comparisons are indicated(p < 0.05) by a double arrow. Error bars indicate 95% confidence intervals. (NB: vertical scales are different for each figure).
820 F. Bardy et al. / Clinical Neurophysiology 125 (2014) 814–826
Author's personal copy
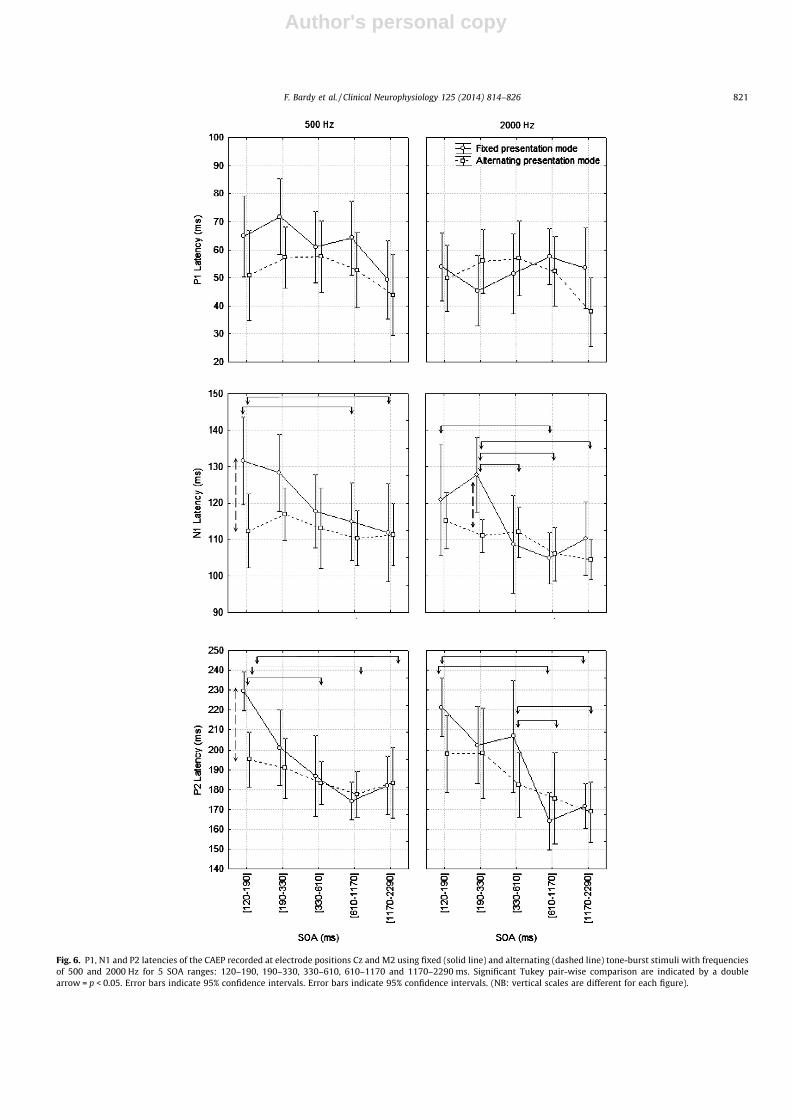
Fig. 6. P1, N1 and P2 latencies of the CAEP recorded at electrode positions Cz and M2 using fixed (solid line) and alternating (dashed line) tone-burst stimuli with frequenciesof 500 and 2000 Hz for 5 SOA ranges: 120–190, 190–330, 330–610, 610–1170 and 1170–2290 ms. Significant Tukey pair-wise comparison are indicated by a doublearrow = p < 0.05. Error bars indicate 95% confidence intervals. Error bars indicate 95% confidence intervals. (NB: vertical scales are different for each figure).
F. Bardy et al. / Clinical Neurophysiology 125 (2014) 814–826 821
Author's personal copy
in the succeeding SOAs, which indicates that CAEPs were elicitedin response to the first stimulus of the pair. The lower value ofthe ICC subject means is mainly due to a poor SNR within certainsubjects. When the waveform contains significant random noise,the level of similarity is affected. These findings can also be visu-ally confirmed in Fig. 3, which shows similar responses to thefirst stimulus of a pair over all four SOA ranges plus the grandaverage, which includes all four runs. After application of the LSdeconvolution to disentangle overlapping waveforms, the mor-phology of the cortical response of the first stimulus of the pairdid not appear to be influenced by the presence of the secondstimulus of the pair. For this reason, the CAEP average over thefour SOA ranges in response to the first stimulus of the pairwas used in the statistics as the 1650 ms preceding SOAcondition.
4.3. Cortical components analysis after overlap correction using LSdeconvolution
Fig. 4 shows the grand averages from all 11 subjects for the fourruns (500 and 2000 Hz, fixed and alternating), and five differentSOA ranges (150 to 1650 ms). Results for the amplitudes and laten-cies of the 3 components P1, N1, and P2, as well as the CAEP RMSamplitudes are reported below in more detail. The statistics are re-ported in Table 2.
4.4. P1 component
It is important to note that of the three components, P1 has thelowest amplitude. The P1 peak can therefore more easily becontaminated by noise. Repeated measures ANOVA showed asignificant main effect of the SOA on the amplitude of the P1 com-ponent (Table 2). Moreover, post hoc comparisons revealed a trendof gradual growth of the amplitude of P1 while reducing the SOAfrom 1650 to 150 ms (see Fig. 5, top).
Regarding the P1 latency, repeated measures ANOVA revealed asignificant main effect of the SOA and stimulus (Table 2), as well asa significant interaction between the factor mode of presentation
(fixed versus alternated) and the stimulus (500 Hz versus2000 Hz) (F(1,10) = 5.51; p = 0.04; e = 1). No statistically significantdifferences between the different conditions were found in thepost hoc comparisons (Fig. 6, top).
4.5. N1 and P2 components
The repeated measures ANOVA on the absolute amplitude andlatency of N1 and P2 showed a significant main effect of the stim-ulus, the mode of presentation, and the SOA, except for P2 latencywhere the effect of the stimulus was not significant. Interestingly,based on the mean values, the minimum absolute amplitude for N1and P2 components for every condition was reached for either the250 or the 450 ms SOA range (see Fig. 5, middle and bottom). Con-cerning the latency of N1 and P2 components, post hoc compari-sons showed a trend of gradual latency increase with a decreaseof the SOA range. Significant post hoc comparisons (p < 0.05) arereported in Fig. 6 (middle and bottom).
Post-hoc comparisons for the two modes of presentation re-vealed significant increases of N1 and P2 absolute amplitudes inthe alternating mode compared to the fixed mode in 6 of the 12conditions within the three shortest SOA ranges (Fig. 5, middleand bottom). Post-hoc comparisons also showed three conditionswith a significant reduction of N1 and P2 latencies in the alternat-ing presentation mode compared to the fixed presentation mode.These results suggest less adaptation of N1 and P2 generators inthe alternating presentation mode for short SOA ranges. The signif-icant planned comparisons are again shown in Fig. 6 (middle andbottom).
Finally, post hoc comparisons revealed significant larger P2amplitudes for the tone-burst with a frequency of 500 Hz in com-parison to the 2000 Hz tone-burst in the fixed presentation modefor SOA ranges 850 and 1650 ms (Fig. 5, bottom).
4.6. CAEP RMS value
The RMS value of the CAEP is convenient to investigate theglobal cortical response amplitude variation. Repeated measures
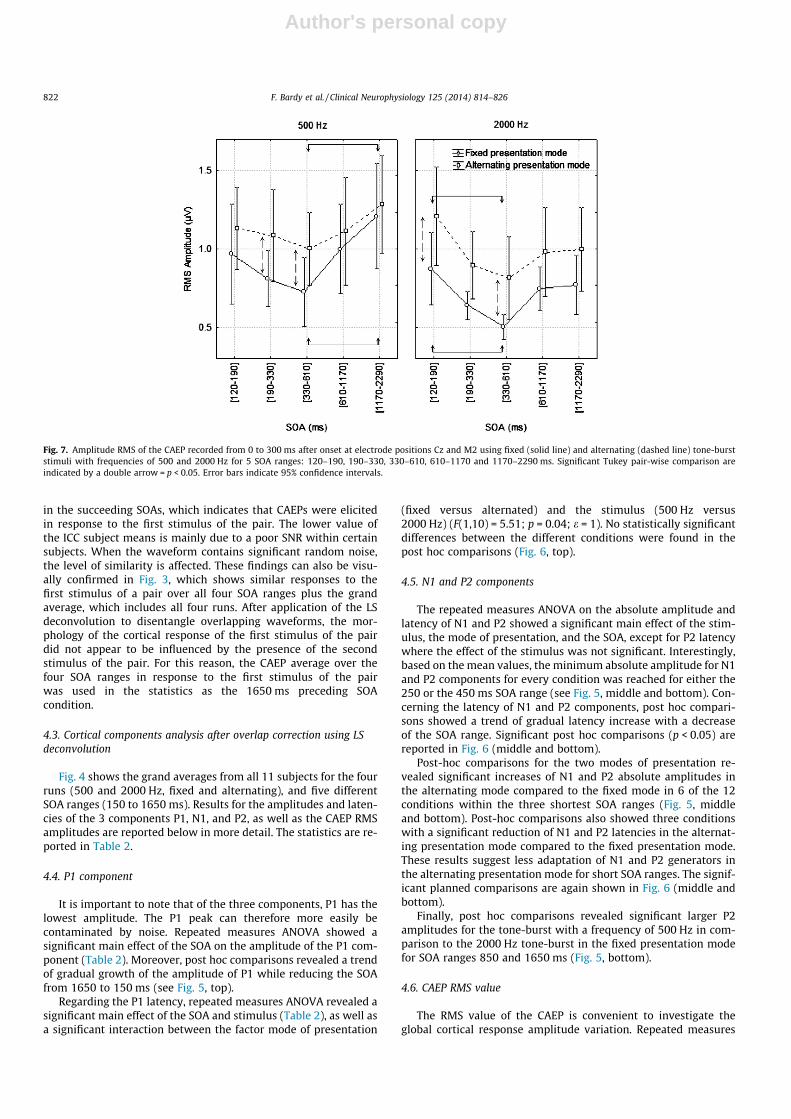
Fig. 7. Amplitude RMS of the CAEP recorded from 0 to 300 ms after onset at electrode positions Cz and M2 using fixed (solid line) and alternating (dashed line) tone-burststimuli with frequencies of 500 and 2000 Hz for 5 SOA ranges: 120–190, 190–330, 330–610, 610–1170 and 1170–2290 ms. Significant Tukey pair-wise comparison areindicated by a double arrow = p < 0.05. Error bars indicate 95% confidence intervals.
822 F. Bardy et al. / Clinical Neurophysiology 125 (2014) 814–826

Author's personal copy
ANOVA showed a significant main effect of the stimulus, the modeof presentation, and SOA on the CAEP RMS calculated over the 0–300 ms window (Table 2). Post-hoc comparisons revealed signifi-cantly larger amplitudes in the alternating presentation mode forthe tone-burst with a frequency of 500 Hz for the 250 and450 ms SOA ranges, as well as for the 2000 Hz tone-burst for the150 and 450 ms SOA range (Fig. 7).
Post-hoc comparison of the different SOAs showed a significantdecrease of the CAEP RMS amplitude for the 2000 Hz tone-burststimulus between the SOA ranges 150 and 450 ms (Fig. 7). Thistrend was not significant for the tone-burst stimulus with a fre-quency of 500 Hz. Conversely, a significant increase of the RMSamplitude was found between the SOA ranges 450 and 1650 msfor the 500 Hz tone-burst stimulus (Fig. 7).
The ANOVAs revealed significant interactions between the fac-tors of SOA and stimulus for the RMS amplitude (F(4,40) = 6.76;p = 0.0006; e = 1).
4.7. Simulation using the ‘‘transient reduction of excitability (TREX)model’’
The average RMS amplitude of the two tone-burst stimuli wascalculated for the fixed and alternating presentation and is repre-sented in Fig. 8. The RMS amplitude in the 0–300 ms window,which contains activity from the P1–N1–P2 complex, reaches aminimum value when the SOA range is jittered around 450 ms.
Zacharias et al. (2012a) developed the TREX model whichreflected the importance of history of stimulation on the amplitudeof the N1m response. The model succeeds in reliably predicting re-sponses in both random and fixed presentation rates in their study,utilizing SOAs between 250 ms and 10 s. Their study quantifies thesize of the cortical response in regard to the timing characteristicsof the stimulation sequence. The TREX model has 7 parameters,including two time constants for the reduction in excitability andfor the recovery, in addition to two delay parameters. Another pri-mary parameter of the model is the initial number of excitableneurons which gives rise to the amplitude of the neural response.
Previous studies reporting findings for the amplitude of the N1component were partly interpreted using the physiological modelof latent inhibition stating that there is a temporal lag after stimu-lus onset for the inhibition to be effective (Loveless et al., 1996;McEvoy et al., 1997; Sable et al., 2004). The analogy to the latentinhibition model in the TREX model stands on the lag Da after stim-ulus onset, before decay of the population of excitable neurons.
This interval can be taken as the timing needed before inhibitionbecomes fully effective.
At greater delay after onset, the temporal evolution of the pop-ulation of excitable neurons is described by the sum of two expo-nentials. The first is a fast exponential component corresponding tothe decrease in excitability (alteration of the percentage of neuronscapable of firing), while the second slow component represents therecovery. The amplitude of the cortical response is thus related tothe number of excitable cortical neurons available at a certainpoint in time, which is dependent on the history of stimulation.The last parameter of the model accounts for the effect of stimulusalternation on response amplitude. It is expressed as the degree ofoverlap of cortical neuronal population when stimuli of differentfrequencies are used (Zacharias et al., 2012b).
As represented in Fig. 8, there is good agreement between theamplitude measured in our experiment and the amplitude pre-dicted by the TREX model. We used the model parameters deducedby Zacharias et al. (2012a) for both the fixed and the alternatingpresentation mode (Fixed Conditions: R2 = 0.90; Alternating condi-tion: R2 = 0.99). The good fit between the experimental data andthe model suggests that the lag of inhibition with respect to exci-tation in the TREX model is sufficient to describe the relationshipbetween SOA-history and cortical response amplitude. The initialnumber (pool) of excitable neurons was adjusted to fit our datato the fixed condition and set to 7.8 in order to generate a responseamplitude measured in lV. The parameter accounting for overlapwas then adjusted to fit the alternating condition. In this paradigm,where the frequencies of the two stimuli (500 and 2000 Hz) weresystematically alternated, the best fit was obtained when the over-lap parameter was set to 80%. Such a model is not only useful forpredicting future experimental results, but also for understandinghow the auditory cortex transforms its input into neuronal activity.It indicates the applicability of the model of latent inhibition whenshort SOAs are separating pairs of stimuli. However, further inves-tigation is needed to explore whether the model can successfullypredict response amplitude when more than two stimuli are sepa-rated by short time intervals.
5. Discussion
The main purpose of this study was to present experimentaldata using the theoretical framework of LS deconvolution de-scribed in an accompanying paper on overlapping cortical re-sponses obtained by stimuli presented at short SOAs (Bardy
Fig. 8. Fit of experimental data using the transient reduction of excitability (TREX) model. The dashed line marks the average RMS amplitude for the four conditions of theexperiments plotted in Fig. 5 (2000–500 Hz for the fixed and alternating presentation mode) for 5 SOA ranges. Error bars indicate standard deviation. The simulated datamarked with diamonds and circles are obtained using the timing characteristic of the stimulus sequence. The parameters used for the simulation are those derived byZacharias et al. (2012)b with an original pool size P1 = 8.4 lV; f = 0.37; sa = 0.02 s; sb = 2.77 s; Dsa = 0.24 s; Dsb = 0.38 s and o = 80%.
F. Bardy et al. / Clinical Neurophysiology 125 (2014) 814–826 823
Author's personal copy
et al., 2014). This new analysis technique allows the extraction ofoverlapping AEPs in response to sequences composed of multiplestimuli, and optimizes the solution by minimizing squared errors.This study allows the validation of the technique for CAEPs gener-ated by two tone-burst stimuli using five SOAs and two modes ofpresentation.
5.1. Experimental application of the deconvolution on CAEPs
This study demonstrates that it is possible to separate tempo-rally superimposed components of CAEPs generated by the firstand the second tone-burst of a pair. Moreover, it allows for theinvestigation of changes in CAEP morphology for different timingsbetween the two stimuli of the pair. Firstly, we found that the CAEPelicited by the first stimulus of the pair, which was systematicallypreceded by an SOA range of 1650 ms, was not affected by the suc-ceeding SOA, despite varying across four ranges from that centredaround 150 ms to that of 850 ms. Over the four SOA ranges, thesimilarity in the morphology of the cortical waveform was notice-able both by visual inspection and by computing the ICC on thegrand average waveform (P0.95) (see Table 1 and Fig. 3). These re-sults show that the second stimulus of the pair does not apprecia-bly affect the morphology of the CAEP generated by the first, evenwhere response overlap occurs. Thus, any interaction is confirmedto be an effect of stimulus 1 on the response elicited by stimulus 2.
5.2. Effect of stimulus onset-asynchrony
After correction for response overlap, one of the interestingfindings in this study is that the overall CAEP amplitude, character-ised by the RMS amplitude, reaches a minimum for the 450 ms SOArange before rising again for shorter or longer SOA ranges. In con-trast, the latencies of the N1 and P2 components of the cortical re-sponse steadily increase with a decrease of the SOA from 1650 to150 ms.
A decrease of the cortical amplitude associated with an increaseof the presentation rate is well described in the literature for re-sponses recorded with fixed SOA larger than 500 ms (Davis et al.,1966; Picton et al., 1978; Sussman et al., 2008). The amplitude de-cays of the response have been fitted previously by the exponentialequation Pð1� e�ðt�s0Þ=sÞ, where P, s and t0 are respectivelyrepresenting amplitude, time constant and time of decay onset(Näätänen et al., 1981). Within the field, the effects of the SOAon the CAEP have been reported with different defining termsincluding habituation, refractoriness, lateral inhibition and sensorygating. To date there is no consensus about which physiologicalmechanisms explain these results. However, this study shows thatSOA affects response amplitude when randomised across a widerange (70–2240 ms). As demonstrated by Zacharias et al. (2012a)and by the good fit of the TREX model to our data, the variationof the amplitude of the cortical response is both affected by theimmediately preceding stimuli, as well by the long-term historyof stimulation which induces habituation. In this study, using apaired tone-burst paradigm, we have used the term ‘‘inhibition’’to characterise the change of CAEP amplitude for varying SOAs be-cause we have used a latent inhibition model to model our data.
Much less is known about the morphology of the cortical wave-form for cases where SOAs are less than 500 ms and responses areoverlapping. Available studies have reported results on only the N1component (Budd and Michie, 1994; Fox et al., 2010; Sable et al.,2004; Wang et al., 2008). Each of these studies have used a singlerepeated sound and have analyzed their data using the ‘‘ADJAR’’ le-vel 1 method (Woldorff, 1993) to separate the responses. Three dif-ferent paradigms were used in these studies, all of which showedan increase in N1 amplitude with reducing SOAs (shorter than400 ms). In the first stimulus paradigm, the SOA jitter was large
(900 ms) and positioned randomly in the sequence. Budd and Mi-chie (1994) and Wang et al. (2008) used tone-burst stimuli (30 msduration) presented with SOAs randomly distributed between 70and 970 ms with tone-burst frequencies of 1000 and 800 Hzrespectively. The ADJAR technique was used to disentangle theoverlapping responses.
In the second stimulus paradigm, stimuli were presented inpairs, leading to a temporal overlap of the cortical auditory re-sponses (Fox et al., 2010; Loveless et al., 1989). Fox et al. (2010)used stimuli of the same frequency (1000 Hz tone-bursts, 20 msduration) presented with different unjittered SOAs (45, 70, 170,270, 470, 870 ms). The inter-pair interval was fixed at 2 s and theSOA between the pairs was randomly assigned. In the third stimu-lus paradigm, Sable et al. (2004) used short sequences of five tonesharmonically enriched (50 ms duration) presented at fixed presen-tation rates (SOA: 100, 200, 300, 400) with 4 s intervals betweeneach sequence and evaluated changes in N1 peak amplitude forthe second stimulus of the sequence. All three paradigms demon-strate that N1 peak amplitude increases as SOAs decrease(<400 ms) when the stimulus sequence contains a large amountof SOA variation.
The present data suggest that active inhibition is maximal forSOA ranges jittered around 250 or 450 ms. However, statisticalanalysis shows different behaviours for the three components ofthe cortical response. First, the absolute amplitude of the P1 com-ponent steadily increased when the SOA was reduced from 1650 to150 ms. The enhanced amplitude of the P1 component for the shortSOA range might possibly reflect a neural facilitation process foracoustic stimuli occurring shortly after another stimulus which it-self is preceded by a relatively long silence. The P1 component can,however, be difficult to identify due to its low signal amplitude andfurther studies using a larger number of presentations to increasethe SNR of this component are needed to confirm this trend. Sec-ond, the magnitude of the N1 component reached a minimum va-lue for the SOA condition of 250 ms in 3 out of the 4 stimulusconditions before increasing for the 150 ms SOA range (Fig. 5, mid-dle). Finally, the magnitude of the P2 component was minimal inthe 450 ms SOA condition (Fig. 5, bottom). These results suggestthat, for closely spaced stimuli, each component of the cortical re-sponse is separately modulated by the underlying excitatory andinhibitory processes.
The physiological mechanisms underlying the response incre-ments with fast presentation rates of the stimuli are not yet com-pletely understood. Enhanced neural responses for pairs of stimulihave previously been observed in single- and multi-unit recordingsin the auditory cortex of lightly anaesthetised macaque monkeys(Brosch et al., 1999). Budd and Michie (1994) proposed a ‘‘specialfacilitatory activity’’ for very short SOA ranges occurring in the pri-mary auditory cortex, to explain the N1 amplitude enhancement.In contrast, Fox et al. (2010) and Sable et al. (2004) refer to an alter-native model to explain their data, based on the concept of latentinhibition which was originally proposed by McEvoy et al.(1997). According to the latent inhibition model, the enhancementof the N1 amplitude occurs in the short period of time after stim-ulus onset; as inhibitory interneurons become optimally activeafter 450 ms. Of note is the similar trend in our results for the P2component originating from Heschl’s gyrus (Eggermont and Pon-ton, 2002), which has not been reported previously.
5.3. Modeling of the SOA results
The TREX model presented by Zacharias et al. (2012a) was usedto simulate the main effect of the SOA on the CAEP amplitude usingthe timing sequence of stimulation as input. This is the first studyevaluating the fit of this model using short SOAs in a paired para-digm. A direct comparison of the predicted amplitude with the
824 F. Bardy et al. / Clinical Neurophysiology 125 (2014) 814–826
Author's personal copy
experimental data shows a good degree of agreement when usingthe simulation parameters derived by Zacharias et al. (2012a). Thiswas demonstrated in Fig. 8 where the RMS response amplitude(dashed line) is plotted with the model fitted responses (diamondsand circles) for both the fixed and alternating presentation mode.The temporal lag of inhibition with respect to excitation ismodelled here by delay Da and accounts for the latent inhibitionmodel. The results of the simulation show a similar minimumRMS amplitude for the SOA jittered around 450 ms for both pre-sentation modes. These findings suggest that an event-based mod-el, such as ‘‘TREX’’ where the potential pool of neurons available tofire is the sum of two exponentials, can be an efficient way to sim-ulate the amplitude of the cortical response as a function of tempo-ral history of the auditory stimulation. More generally, the resultsof the model are likely to reflect the balance of excitation toinhibition in the auditory cortex. An obvious advantage of thismodel concerns its simplicity using a limited number of parame-ters and its ability to predict CAEP amplitude under these condi-tions. Modelling the adaptation of each component of the CAEPwas outside the scope of this study.
5.4. Effect of stimulus frequency
Another main observation was that a significantly larger CAEPmeasured for the lower frequency tone-burst stimulus (500 Hz)in comparison to the higher frequency tone-burst stimulus(2000 Hz). This amplitude difference is consistent with findingsof previous studies (Jacobson et al., 1992; Näätänen and Picton,1987; Picton et al., 1978) and has been explained on the basis ofthe tonotopic organisation of the human auditory cortex (LiégoisChauvel et al., 2001; Pratt et al., 2009).
5.5. Effect of mode of presentation
Previous conclusions about CAEP morphology for short SOAranges have, in general, been drawn from experiments using stim-ulus sequences composed of one stimulus. On the other hand, inthis study, the stimulus frequency was systematically alternated,showing significantly larger response amplitudes. Using the phys-iological model of lateral inhibition proposed by McEvoy et al.(1997), the inhibition of the CAEP was greatest when the twotone-burst stimuli were the same frequency, resulting in smalleramplitudes. The aptitude of the auditory cortex to inhibit sensoryresponses is considered to represent our ability to habituate torepeated irrelevant sensory information such as repeated stimuli(Elden and Flaten, 2002; Grunwald et al., 2003). Conversely, vary-ing the frequency of the stimuli can lead to the activation of differ-ent neural generators and a ‘‘dishabituation’’ pattern characterisedby larger CAEP amplitudes. These results are in agreement withprevious studies (Butler, 1968, 1972; Friesen and Picton, 2010;Herrmann et al., 2013; Näätänen et al., 1988; Picton et al., 1978),suggesting that the cortical response of the second stimulus ofthe pair received the greatest release from inhibition in the alter-nating mode. The RMS amplitudes of the cortical response for fixedand alternating presentation modes were generated by combiningthe results of the two stimuli with frequencies 500 and 2000 Hz.Interestingly, a minimum absolute mean value can be observedfor the 450 ms SOA condition for both presentation modes (seeFig. 8). The effect of the mode of presentation was also modelledin the ‘‘TREX model’’ for the RMS amplitude using an overlappingparameter, which defines the proportion of common neurons firingdepending on the frequency separation of the two stimuli (seeFig. 8). The best fit to our data was obtained with an overlappingfactor of 80% of the total neurons responding to the two stimuli,suggesting that only a small proportion of the neurones activatedwere frequency-specific.
Moreover, an interesting pattern may be seen in a qualitativecomparison of the grand average waveforms generated by thetwo presentation modes for the shortest SOA ranges 150 and250 ms. Firstly, the N1 component is narrower and larger in thealternating presentation mode. Secondly, the P2 component whichwas almost abolished in the fixed presentation mode seems to re-cover in the alternating presentation mode.
Previous studies investigating CAEPs for short SOA ranges havenot reported latency variations. A striking point in this study is thesignificant decrease of the N1 and P2 latencies in the alternatingcompared to fixed presentation mode for the SOA condition of150 ms for the 500 Hz tone-burst. This finding is concordant withthe statistical analysis showing an interaction between mode ofpresentation and SOA for both N1 and P2 latency. It may reflect in-creased fatigue of neural generators when stimulated repeatedly inthe fixed presentation mode for SOA ranging between 120 and190 ms.
5.6. Methodological consideration
The LS deconvolution used for the data analysis of CAEPs in re-sponse to stimuli presented with short SOAs (Bardy et al., 2014) isan extension of the time-domain deconvolution technique intro-duced by Delgado and Ozdamar (2004). The deconvolution processis only possible through the introduction of SOA jitter and theapplication of the LS optimization method by minimizing residualerrors. The novelty in the method lies in the ability to recover indi-vidual responses for multiple stimuli and in the ability to use asmall jitter range. It is important to note that the presence of inter-actions between responses, the non-linearity of the responses fordifferent SOAs, and the presence of noise in the data can be limitingfactors in achieving an accurate estimation of the CAEP bydeconvolution.
5.7. Further investigations
This study has identified the feasibility of LS deconvolution indisentangling overlapping CAEPs measured using EEG. This meth-od could be applied to the physiological problem of interpreting in-tra-cortical recordings of AEPs (Liégois Chauvel et al., 2001;Rosburg et al., 2004; Schönwiesner and Zatorre, 2008), and to clin-ical problems where rapid stimulus presentation has neuropsycho-logical validity, such as in children with delays in developingspoken language (Choudhury and Benasich, 2011).
Acknowledgements
This work was supported in part by the HEARing CRC,established and supported under the Australian CooperativeResearch Centres Program, an Australian Government Initiative,by the Australian Government Department of Health and by theOticon Foundation. The authors gratefully thank Mark Seeto forhis support with statistical analysis.
References
Alain C, Tremblay K. The role of event-related brain potentials in assessing centralauditory processing. J Am Acad Audiol 2007;18:573–89.
Bardy F, Dillon H, Van Dun B. Least-squares deconvolution of evoked potentials 1and sequence optimization for multiple stimuli under low-jitter conditions. ClinNeurophysiol 2014;125:727–37.
Billings CJ, Papesh MA, Penman TM, Baltzell LS, Gallun FJ. Clinical use of aidedcortical auditory evoked potentials as a measure of physiological detection orphysiological discrimination. Int J Otorhinolaryngol 2012;2012:365752.
Bradley J. Complete counterbalancing of immediate sequential effects in a Latinsquare design. J Am Stat Assoc 1958;53:525–8.
Brosch M, Schulz A, Scheich H. Processing of sound sequences in macaque auditorycortex: response enhancement. J Neurophysiol 1999;82:1542–59.
F. Bardy et al. / Clinical Neurophysiology 125 (2014) 814–826 825
Author's personal copy
Budd TW, Michie PT. Facilitation of the N1 peak of the auditory ERP at shortstimulus intervals. NeuroReport 1994;5:2513–6.
Burger M, Hoppe U, Lohscheller J, Eysholdt U, Döllinger M. The influence oftemporal stimulus changes on speech-evoked potentials revealed byapproximations of tone-evoked waveforms. Ear Hear 2009;30:16–22.
Butler RA. Effect of changes in stimulus frequency and intensity on habituation ofthe human vertex potential. J Acoust Soc Am 1968;44:945–50.
Butler RA. Frequency specificity of the auditory evoked response to simultaneouslyand successively presented stimuli. Electroencephalogr Clin Neurophysiol1972;33:277–82.
Choudhury N, Benasich AA. Maturation of auditory evoked potentials from 6 to48 months: prediction to 3 and 4 year language and cognitive abilities. ClinNeurophysiol 2011;122:320–38.
Davis H, Mast T, Yoshie N, Zerlin S. The slow response of the human cortex toauditory stimuli: recovery process. Electroencephalogr Clin Neurophysiol1966;21:105–13.
Delgado RE, Ozdamar O. Deconvolution of evoked responses obtained at highstimulus rates. J Acoust Soc Am 2004;115:1242–51.
Delorme A, Makeig S. EEGLAB: an open source toolbox for analysis of single-trialEEG dynamics including independent component analysis. J Neurosci Methods2003;134:9–21.
Dillon H. So, baby, how does it sound? Cortical assessment of infants with hearingaids. Hear J 2005;58:10.
Durrant JD, Boston JR. Stimuli for auditory evoked potential assessment. In: BurkardRF, Don M, Eggermont JJ, editors. Auditory evoked potentials basic principalsand clinical applications. Baltimore, USA: Lippincott, Williams and Wilkins;2007. p. 42–73.
Eggermont JJ, Ponton CW. The neurophysiology of auditory perception: from singleunits to evoked potentials. Audiol Neurootol 2002;7:71–99.
Elden Å, Flaten MA. The relationship of automatic and controlled processing toprepulse inhibition. J Psychophysiol 2002;16:46–55.
Fox AM, Anderson M, Reid R, Smith T, Bishop DMV. Maturation of auditory temporalintegration and inhibition assessed with event-related potentials (ERPs). BMCNeurosci 2010;11:1471–2202.
Friesen LM, Picton TW. A method for removing cochlear implant artifact. Hear Res2010;259:95–106.
Grunwald T, Boutros N, Pezer N, von Oertzen J, Fernández G, Schaller C, et al.Neuronal substrates of sensory gating within the human brain. Biol Psychiatry2003;53:511–9.
Hall JW. New handbook of auditory evoked responses. Boston: Pearson; 2007.Herrmann B, Henry MJ, Obleser J. Frequency-specific adaptation in human auditory
cortex depends on the spectral variance in the acoustic stimulation. JNeurophysiol 2013;109:2086–96.
Jacobson GPP, Lombardi DMMA, Gibbens NDMA, Ahmad BKM, Newman CWP. Theeffects of stimulus frequency and recording site on the amplitude and latency ofmultichannel cortical auditory evoked potential (CAEP) component N1. EarHear 1992;13:300–6.
Keselman H. Testing treatment effects in repeated measures designs: an update forpsychophysiological researchers. Psychophysiology 1998;35:470–8.
Liégois Chauvel C, Giraud K, Badier J, Marquis P, Chauvel P. Intracerebral evokedpotentials in pitch perception reveal a functional asymmetry of the humanauditory cortex. Ann NY Acad Sci 2001;930:117–32.
Lightfoot G, Kennedy V. Cortical electric response audiometry hearing thresholdestimation: accuracy, speed, and the effects of stimulus presentation features.Ear Hear 2006;27:443–56.
Loveless N, Hari R, Tiihonen J. Evoked responses of human auditory cortex may beenhanced by preceding stimuli. Electroencephalogr Clin Neurophysiol1989;74:217–27.
Loveless N, Levänen S, Jousmäki V, Sams M, Hari R. Temporal integration in auditorysensory memory: neuromagnetic evidence. Electroencephalogr ClinNeurophysiol 1996;100:220–8.
McEvoy L, Levanen S, Loveless N. Temporal characteristics of auditory sensorymemory: neuromagnetic evidence. Psychophysiology 1997;34:308–16.
McGraw KO, Wong S. Forming inferences about some intraclass correlationcoefficients. Psychol Methods 1996;1:30.
Näätänen R, Gaillard A, Varey C. Attention effects on auditory EPs as a function ofinter-stimulus interval. Biol Psychol 1981;13:173–87.
Näätänen R, Picton TW. The N1 wave of the human electric and magnetic responseto sound: a review and an analysis of the component structure.Psychophysiology 1987;24:375–425.
Näätänen R, Sams M, Alho K, Paavilainen P, Reinikainen K, Sokolov EN. Frequencyand location specificity of the human vertex N1 wave. Electroencephalogr ClinNeurophysiol 1988;69:523–31.
Ozdamar O, Bohorquez J. Signal-to-noise ratio and frequency analysis of continuousloop averaging deconvolution (CLAD) of overlapping evoked potentials. J AcoustSoc Am 2006;119:429–38.
Park E, Cho M, Ki C. Correct use of repeated-measures analysis of variance. Korean JLab Med 2009;29:1–9.
Picton TW, Woods DL, Proulx GB. Human auditory sustained potentials II. Stimulusrelationships. Electroencephalogr Clin Neurophysiol 1978;45:198–210.
Pratt H, Starr A, Michalewski HJ, Dimitrijevic A, Bleich N, Mittelman N. Auditory-evoked potentials to frequency increase and decrease of high- and low-frequency tones. Clin Neurophysiol 2009;120:360–73.
Roger A, Thornton D. Instrumentation and recording parameters. In: Burkard RF,Don M, Eggermont JJ, editors. Auditory evoked potentials basic principles andclinical applications. Baltimore, USA: Lippincott, Williams and Wilkins; 2007. p.73–101.
Rosburg T, Trautner P, Korzyukov OA, Boutros NN, Schaller C, Elger CE, et al. Short-term habituation of the intracranially recorded auditory evoked potentials P50and N100. Neurosci Lett 2004;372:245–9.
Ross B, Lütkenhöner B, Pantev C, Hoke M. Frequency-specific thresholddetermination with the CERAgram method: basic principle and retrospectiveevaluation of data. Audiol Neurootol 2000;4:12–27.
Sable J, Low K, Maclin E, Fabiani M, Gratton G. Latent inhibition mediates N1attenuation to repeating sounds. Psychophysiology 2004;41:636–42.
Schönwiesner M, Zatorre RJ. Depth electrode recordings show double dissociationbetween pitch processing in lateral Heschl’s gyrus and sound onset processingin medial Heschl’s gyrus. Exp Brain Res 2008;187:97–105.
Sussman E, Steinschneider M, Gumenyuk V, Grushko J, Lawson K. The maturation ofhuman evoked brain potentials to sounds presented at different stimulus rates.Hear Res 2008;236:61–79.
Tremblay KL, Billings C, Rohila N. Speech evoked cortical potentials: effects of ageand stimulus presentation rate. J Am Acad Audiol 2004:226–37.
Wang A, Mouraux A, Liang M, Iannetti G. The enhancement of the N1 wave elicitedby sensory stimuli presented at very short inter-stimulus intervals is a generalfeature across sensory systems. PLoS One 2008;3.
Woldorff MG. Distortion of ERP averages due to overlap from temporally adjacentERPs: analysis and correction. Psychophysiology 1993;30:98–125.
Zacharias N, König R, Heil P. Stimulation-history effects on the M100 revealed by itsdifferential dependence on the stimulus onset interval. Psychophysiology2012a;49:909–19.
Zacharias N., König R., Heil P. The transient-reduction-of-excitability (TREX) modelaccounts for the dependence of the auditory M100-peak amplitude on stimulusonset interval, stimulus frequency, and probability of occurrence. Unpublishedposter presentation at: 4th International Conference on Auditory Cortex.Lausanne, Switzerland; 2012b.
826 F. Bardy et al. / Clinical Neurophysiology 125 (2014) 814–826
Related Documents