Discussion Papers In Economics And Business Graduate School of Economics and Osaka School of International Public Policy (OSIPP) Osaka University, Toyonaka, Osaka 560-0043, JAPAN Decision to get influenza vaccination: A behavioral economic approach Yoshiro Tsutsui, Uri Benzion, Shosh Shahrabani, Gregory Yom Din Discussion Paper 09-17

Welcome message from author
This document is posted to help you gain knowledge. Please leave a comment to let me know what you think about it! Share it to your friends and learn new things together.
Transcript
Discussion Papers In Economics And Business
Graduate School of Economics and Osaka School of International Public Policy (OSIPP)
Osaka University, Toyonaka, Osaka 560-0043, JAPAN
Decision to get influenza vaccination: A behavioral economic approach
Yoshiro Tsutsui, Uri Benzion, Shosh Shahrabani, Gregory Yom Din
Discussion Paper 09-17
June 2009
この研究は「大学院経済学研究科・経済学部記念事業」
基金より援助を受けた、記して感謝する。
Graduate School of Economics and
Osaka School of International Public Policy (OSIPP) Osaka University, Toyonaka, Osaka 560-0043, JAPAN
Decision to get influenza vaccination: A behavioral economic approach
Yoshiro Tsutsui, Uri Benzion, Shosh Shahrabani, Gregory Yom Din
Discussion Paper 09-17
1
Decision to get influenza vaccination:
A behavioral economic approach Yoshiro Tsutsuia,* , Uri Benzionb,c, 1, Shosh Shahrabanic,2, Gregory Yom Dind,e, 3 a Graduate School of Economics, Osaka University, 1-7 Machikaneyama, Toyonaka, Osaka, 560-0043 Japan b Department of Economics, Ben Gurion University, Beer Sheva 84105, Israel c Economics and Management Department, Max Stern Academic College of Emek Yezreel, Emek Yezreel 19300, Israel d Golan Research Institute, University of Haifa, P.O. Box 97, Katzrin, 12900, Israel e Ohalo College, P.O .Box 222, Katzrin, 12900 Israel * Corresponding author. Fax: +81 6 650 5223 E-mail address: [email protected] (Y. Tsutsui). 1 [email protected]. 2 [email protected]. 3 [email protected]. JEL classification: I19 Keywords: Influenza, Inoculation, Health belief model, Survey, Time preference. Abstract The aims of this study were to identify predictors regarding people’s willingness to be vaccinated against influenza and to determine how to improve the inoculation rate using our original large-scale survey in the USA in 2005. The main results are (a) a model of bounded rationality explains vaccination behavior fairly well, i.e., people evaluate the costs and benefits of vaccination by applying risk aversion and time preference, while the ‘status quo bias’ of those who received vaccinations in the past affect their decision to be vaccinated in the future, (b) it is recommended to increase people’s knowledge regarding flu vaccination, but not regarding influenza illness, (c) reducing the vaccination fee may be ineffective in raising the rate of vaccination. 1. Introduction Influenza vaccination has been shown to be cost effective in reducing morbidity and mortality in the older adult population, and in reducing morbidity, work absenteeism, and use of healthcare resources among the healthy working adult population (Bridges et al., 2000; Lee et al., 2002; Nichol et al., 2003). Vaccine prevents influenza in approximately 70%−90% of healthy adults under the age of 65 years and in 58% among persons over 60 years of age
2
(Bridges et al., 2000; Demicheli et al., 2000). Although influenza vaccination levels increased substantially during the 1990s, further improvements in vaccination coverage levels are needed. For example, in 2004, the estimated vaccination coverage among adults with high-risk conditions aged 18−49 years and 50−64 years was 26% and 46%, respectively, substantially lower than the Healthy People 2000 and Healthy People 2010 objectives of 60% (CDC, 2006). Theoretically, the socially optimal rate of inoculation should be substantially higher than an individual’s optimal rate because catching an infectious disease has great external implications on the society. Thus, raising willingness to be inoculated is socially desirable, even if it does not conform to an individual’s rational decision. In this paper, we investigate whether or not propagation of information regarding influenza and its vaccine will raise willingness to undergo inoculation.1 This is not known a priori; it could be that more information will diminish people’s willingness because they may unreasonably fear influenza and/or irrationally overestimate the effectiveness of flu inoculation. Of course the opposite might be the case, that increased information will substantially promote inoculation. This paper tries to identify what kind of information might be effective in raising the inoculation rate. In this sense, our study follows a behavioral economic approach and focuses on the bounded rationality of individuals. In addition to the effect of knowledge, we expected to find other behavioral factors, such as status quo bias and overconfidence effect, to affect the inoculation decision. Status quo bias refers to the situation in which people tend not to change an established behavior unless the incentive to change is compelling (Samuelson and Zeckhauser, 1988). The overconfidence effect is the tendency of people to underestimate “real” objective risks (Griffin and Varey, 1996). To be useful in policy planning, analyses should consider comprehensive factors as well as irrational aspects of human beings. First, bounded rationality means that people are fairly rational and can be expected to make a decision on inoculation based on its benefits and costs. In particular, it is hypothesized that beliefs regarding the probability of contracting the flu, the severity of the illness, and the effectiveness and side effects of the vaccine as well as preferences involving time and risks play important roles in assessing the costs and benefits of influenza inoculation. In addition, characteristics such as gender and age may explain the willingness to be vaccinated. The present study analyzes comprehensive factors regarding people’s willingness to be vaccinated against the flu, an approach that is possible because of our original large survey conducted across the USA. It is natural to suppose that people agree to be vaccinated based on perceived costs and benefits which, in turn, depend on subjective beliefs regarding influenza and vaccination. Indeed, the Health Belief Model (HBM) explains and predicts preventive health behavior in terms of belief patterns that focus on the relationship of health behaviors and utilization of health services (Rosenstock et al., 1988). According to the HBM, acceptance of an influenza vaccination depends on the following predictors: perception of susceptibility to influenza, 1 In an empirical study conducted in the USA, Wu (2003) found that people with more education, higher incomes, and better insurance coverage are more likely to get flu shots, as well as other types of preventive medical treatments.
3
beliefs about the severity of influenza, perceived benefits of the vaccine in preventing influenza, perceived barriers to accepting a vaccine, influence by cues (such as media information or physician recommendation) to action, and degree of motivation for other health behaviors (Blue and Valley, 2002). Indeed, cited reasons for not receiving an influenza vaccination were similar across studies with reference to perceived barriers, i.e., concern about side effects or vaccine safety, lack of effectiveness of the vaccine in preventing illness, and lack of awareness (Chapman and Coups, 1999a; Chen J.Y. et al. 2007). The HBM has been used to explore a variety of health behaviors, including vaccination (Blue and Valley, 2002; Chen J.Y. et al., 2007; Lau et al., 2008; Shahrabani et al., 2009). Our study, likewise, is partially based on the HBM. The paper is organized as follows. In section 2, we explain our model and methods, Section 3 explains our survey, and Section 4 is devoted to the results. Section 5 summarizes and concludes the study. 2. The model 2.1. Vaccination behavior model 2.1.1. The basic model As traditional economics assumes, we assume that people make a decision about being vaccinated based on perceived costs and benefits which, in turn, are based on beliefs regarding the probability of infection, the severity of the illness, the effectiveness of the vaccine, and the side effects of the vaccine, as the HBM assumes. We also assume that the decision depends on a time discount rate because the benefits of vaccination will be realized in the future while its costs are paid in the present.2 Thus, it is expected that people with a higher discount rate will be less likely to receive the vaccination. High risk aversion may affect the decision to be vaccinated in two opposing ways: while some will take the vaccine because they fear the consequences of influenza illness, others may worry about its side effects and not be vaccinated. Thus, the effect of degree of risk aversion is, a priori, ambiguous. Although we agree that traditional economics explains inoculating behavior fairy well, we also assume that rationality is bounded. Thus, we suppose that the decision to be vaccinated is biased by several factors. Previous vaccination and illness experiences affect the decision, as well as overconfidence and level of education. Socio-demographic background, economic status, and health status are known to impact an individual’s decision to be vaccinated (Shahrabani and Benzion, 2006; Chen Y. et al., 2007). Thus, we include respondents’ characteristics in our estimation. Our model is that willingness of inoculation (WTINJ) depends on (a) beliefs regarding costs and benefits of vaccination, (b) time discounting, risk aversion, and overconfidence 2 See Shahrabani et al. (2008). Chapman and Coups (1999b) provide some evidence that individuals’ time preference patterns can explain preventive health behavior; in particular, monetary time preferences predict whether people took flu shots.
4
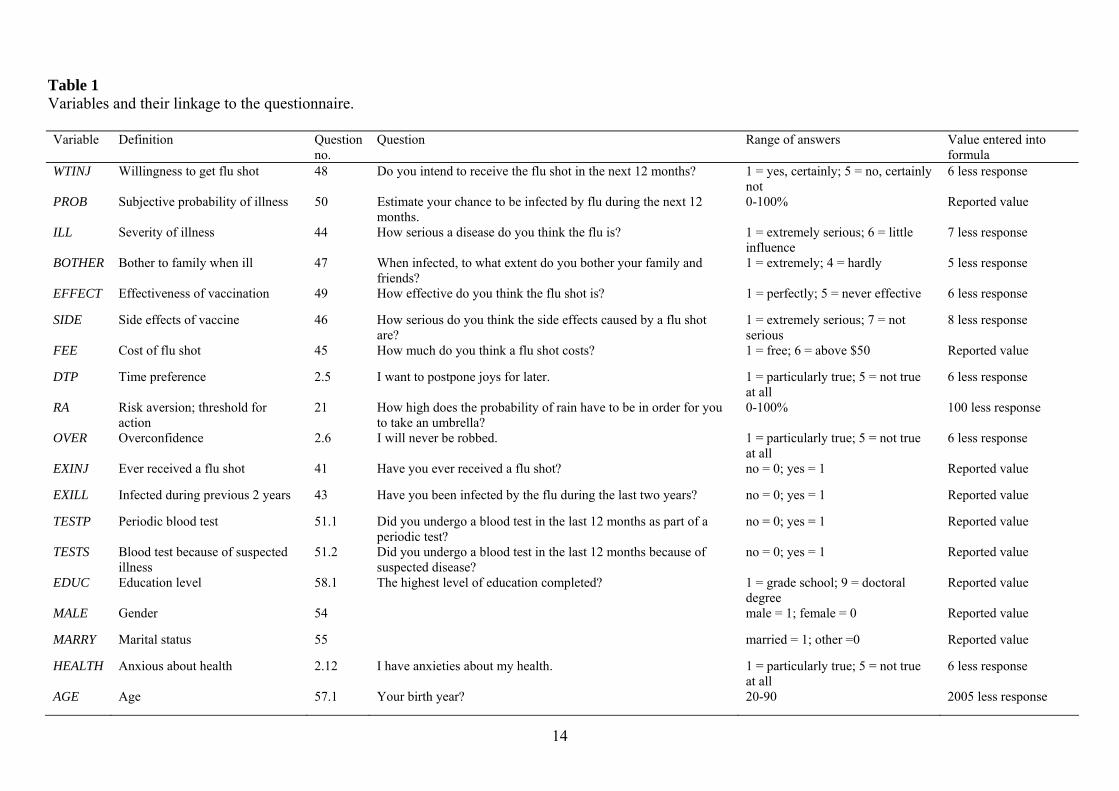
(perceived lower self-risk), (c) past experience with flu shots, preventive health, and influenza illness, and (d) education level and socio-demographic attributes. 2.1.2 The dependent variable The dependent variable, WTINJ, is the willingness to receive a flu shot within twelve months, a categorical variable from 1 = certainly to 5 = certainly not. 2.1.3. The independent variables Perceived benefits and costs of vaccination depend on perceptions of the (a) probability of infection (PROB), (b) seriousness of the illness (ILL), (c) degree to which family and friends would be bothered or inconvenienced in case the respondent contracts influenza (BOTHER), (d) effectiveness of vaccination (EFFECT), (e) side effects of the flu shot (SIDE), and (f) financial cost of the flu shot (FEE). An increase in items (a)-(d) results in an increase in benefits of the vaccination; an increase in items (e) and/or (f) results in an increase in costs. The degree of time preference (DTP) is measured by whether or not a person is willing to postpone pleasure. A person with a higher DTP (i.e., smaller time discount rate) is more future oriented. A sample question for measuring risk aversion (RA) is “how high does the probability of rain have to be for you to take an umbrella?” RA is a percent, defined as 100 less the answer to the question.3 Overconfidence (OVER) is evaluated by the answer to the question “does the statement ‘I will never be robbed’ hold true to you?” and is measured on a scale from 1 to 5. Regarding past experience, we examine: (a) whether respondents ever received a flu shot (EXINJ), (b) whether they were infected by influenza during the last two years (EXILL), (c) if they had periodic blood tests (TESTP), and (d) if they had blood tests because of a suspected illness (TESTS)4. Variable (a) is especially interesting because we expect that individuals have status quo bias, i.e., those who previously received the flu vaccination will continue to receive an annual vaccination. We expect that variables (a), (c), and (d) will have positive effects on WTINJ in the estimation of Eq. (1) with whole samples. We also speculate that status quo bias makes people automatically choose to accept the vaccine without examining it fully so that, for such respondents, the explanatory power of perceived benefits and costs of vaccination will be lower. To examine this hypothesis, we estimate Eq. (1) not only for whole samples but also for samples divided according to whether or not they previously received the vaccination. Regarding characteristics, we examine education level (EDUC), gender (MALE), marital status (MARRY), anxiety regarding health (HEALTH), and age (AGE). Special attention is paid to the level of education because it may represent acquired knowledge and the ability to 3 The variable may also be interpreted as an individual’s probability for action and precautionary motivation. 4 Evidence indicates that preventive behaviors may be highly correlated with one another (Fukunaga et al., 1997).
5
digest information, which may impact WTINJ. We include age because flu is especially dangerous to elderly people. In addition to the elderly, unhealthy people are especially vulnerable to flu, thus we include HEALTH, which represents the respondent’s degree of anxiety about his/her own health. We expect that those with higher anxiety levels will be more motivated to take the vaccine. 2.1.4. Equation for the model The equation for the model that examines factors affecting the willingness to be vaccinated is as follows:
uAGEHEALTHMARRYMALEEDUCTESTS
TESTPEXINJEXILLOVERRADTPFEESIDEEFFECTBOTHERILLPROBWTINJ
+++++++++++++++++++=
543214
3213216
54321
εεεεεδδδδγγγββββββα
(1)
The list of variables, their definitions, and a short description of the survey question for each are presented in Table 15. The constant term is indicated by α and disturbance is marked by u. 2.2. How the subjective variables are influenced by exogenous variables The variables representing costs and benefits in Eq. (1) are subjective variables that may be affected by exogenous variables such as a respondent’s characteristics. Therefore, if we want to draw policy implications from estimations of Eq. (1) and accurately evaluate the effect of exogenous variables on WTINJ, we need to weigh their indirect effect via the subjective variables. We used the equation below to analyze the effect of exogenous factors on subjective variables that, in turn, affect the willingness to be vaccinated.
vAGEMARRYMALE
HEALTHOVEREDUCEXILLSBJVAR++++
++++=
765
43210
ϕϕϕϕϕϕϕϕ (2)
Here, SBJVAR stands for PROB, ILL, BOTHER, EFFECT, SIDE, and FEE.6 The
constant term is indicated by 0ϕ and disturbance is indicated by v.7 In cases when PROB is the
dependent variable, we suppose that anxiety about one’s own health (HEALTH) has a positive effect on PROB, and that overconfidence (OVER) has a negative effect. We also suppose that MALE has a negative effect because males are more overconfident than females (Barber and Odean, 2001), a tendency that might not be fully grasped by OVER. We further suppose that 5 Expected signs for the coefficients of the factors are shown in Table 4. The signs indicate whether a factor is expected to positively or negatively affect the willingness to be vaccinated 6 However, FEE turns out to be insignificant in the estimation of Eq. (1). 7 Expected signs for the factors are shown in Table 5.
6
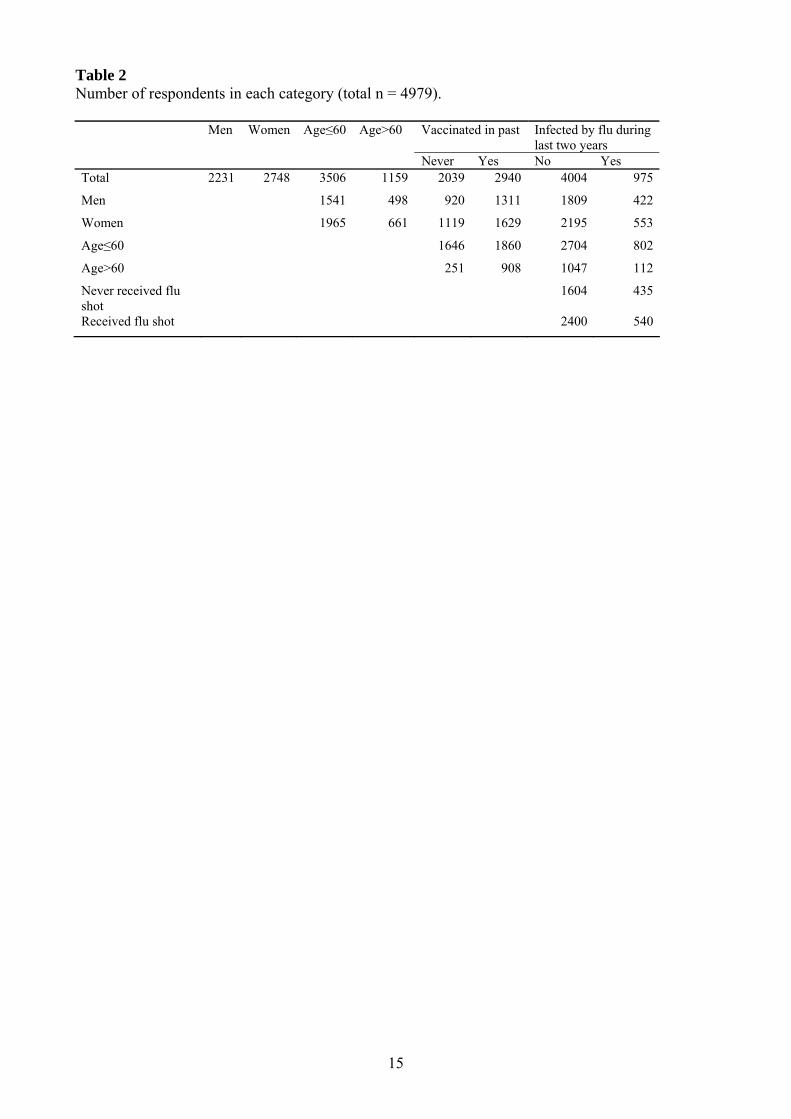
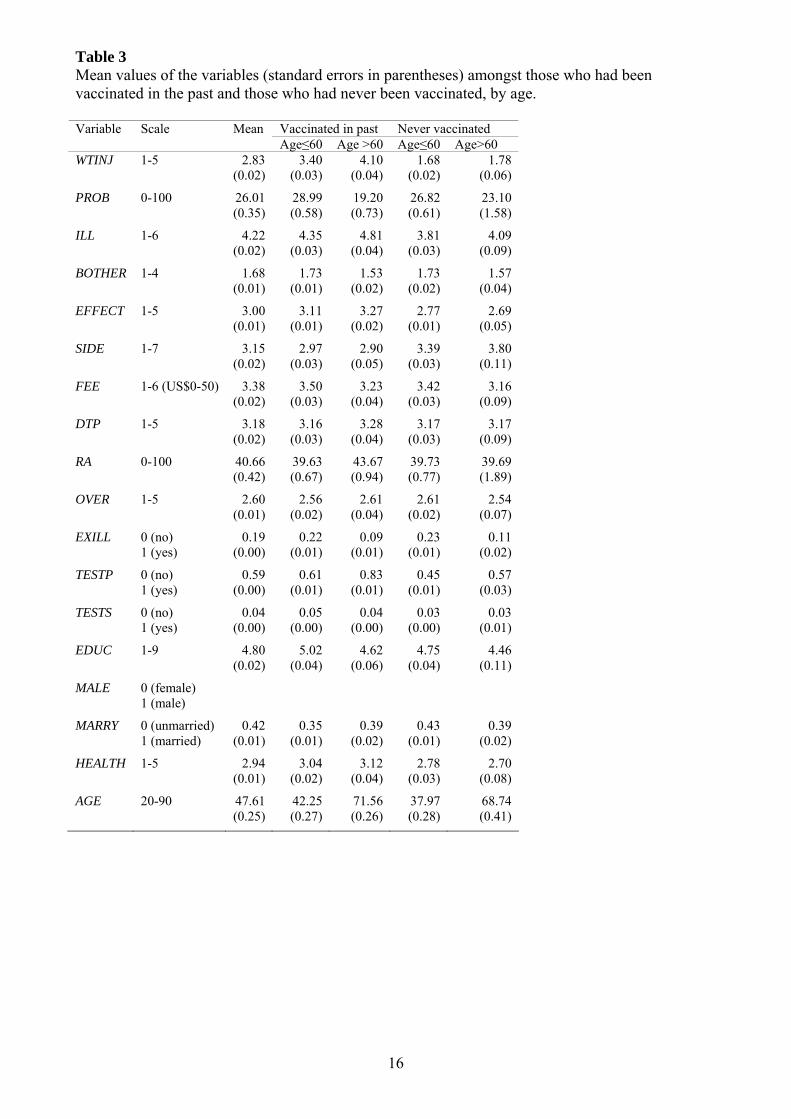
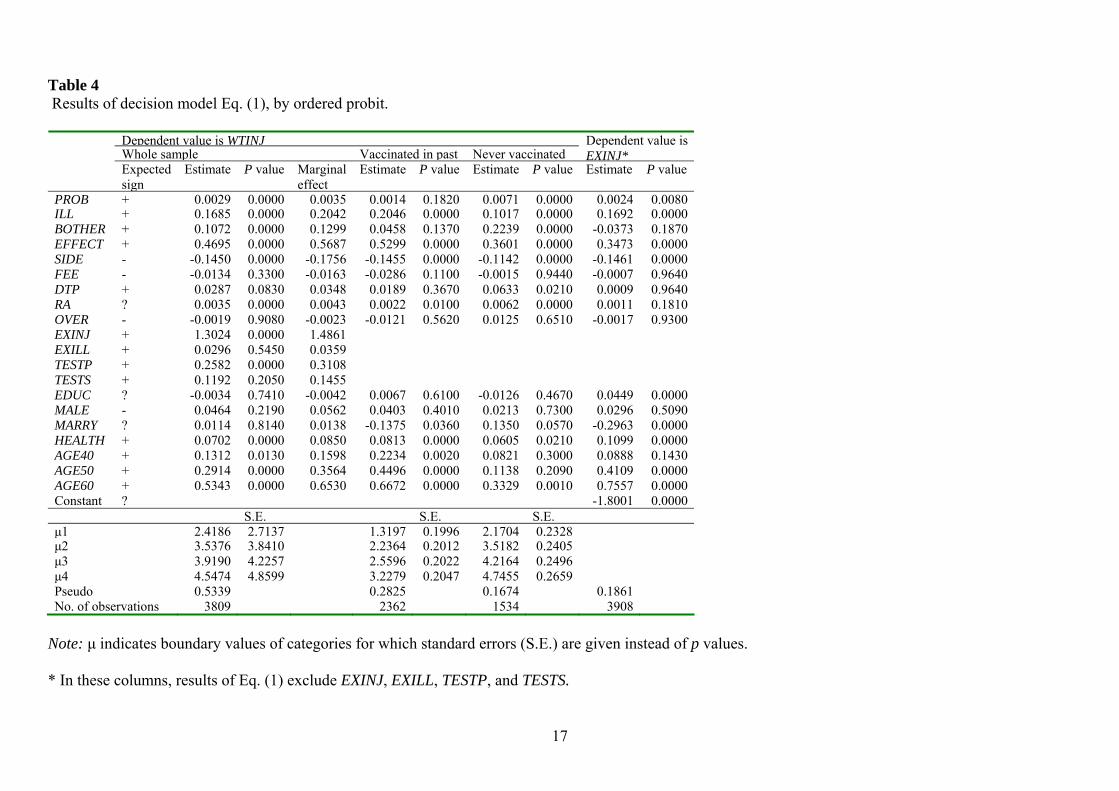
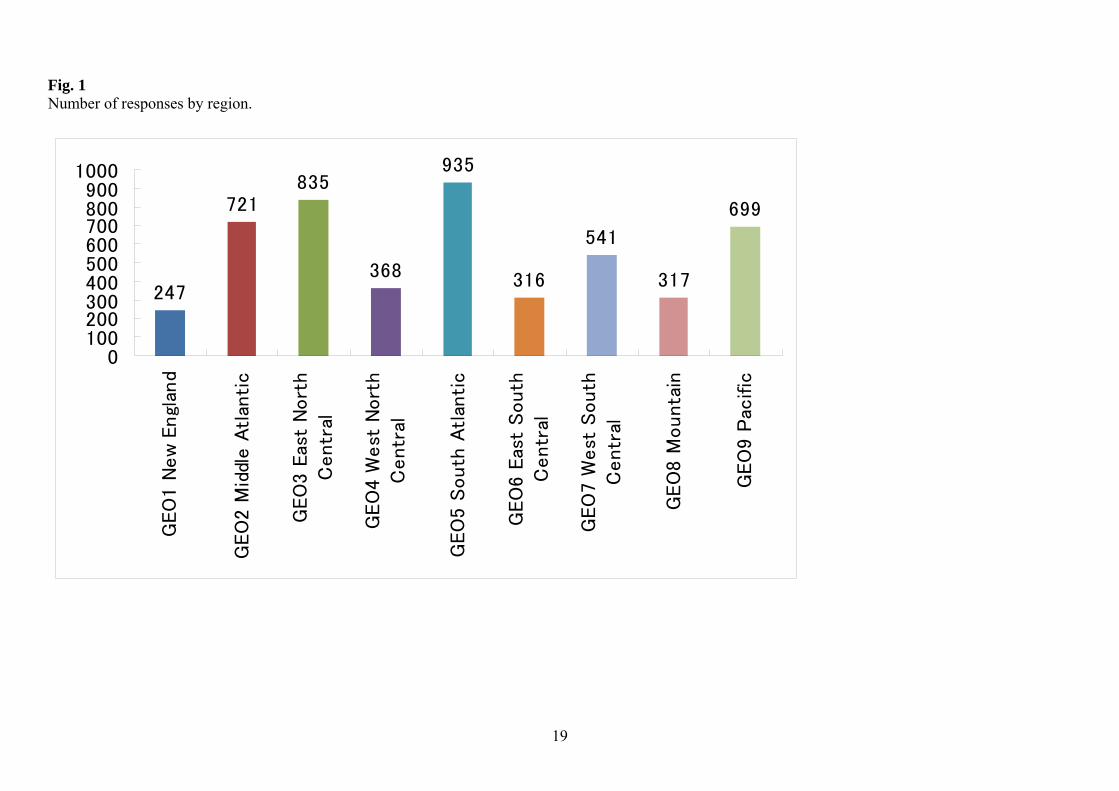
AGE has a positive effect on PROB because elderly people tend to be less healthy, a tendency that might not be fully represented by HEALTH. 3. Our survey and data The COE (Center of Excellence) project of Osaka University in Japan, which was funded by the Japanese government, conducted a large survey in the USA in 2005. 8 We extracted a sample of 12,338 subjects from the study based on region, gender, race, and age, balanced according to census division demographics. Questionnaires were sent to the subjects in January and 4979 responses (40%) were received. The number of respondents from each region is shown in Fig. 1. The survey questionnaire comprised 102 questions including eleven on attitude toward influenza and flu vaccination. The number of respondents in each category (gender, age, received flu shot in past, and had been ill with influenza) is given in Table 2. Women comprised about 55% of the respondents, over 60 years represented 23%, and those who received a flu shot in the past constituted 59%. The percentage of those who had been vaccinated in the past was much higher (78%) among subjects over 60 years than among subjects 60 years and under (53%). Table 3 summarizes the mean values of the variables used in this paper, as reported on the returned questionnaires. The intention to be vaccinated is higher for the group that was vaccinated in the past (3.40 for individuals 60 years and younger and 4.10 for individuals over 60 years) than for the group that was never vaccinated (1.68 for 60 years and younger and 1.78 for over 60). Mean values for perceived effectiveness of vaccination and degree of anxiety about health are higher for the group that received the vaccine in the past than for those who never received it, while the mean value for estimated side effects of the flu shot is higher for the second group. 4. Results 4.1. Results of the decision model Table 4 reports the results for Eq. (1) estimated by the ordered probit method. For the entire sample, most of the variables relating to costs and benefits of vaccination, including perceived probability of infection (PROB), seriousness of illness (ILL), degree of bother to family and friends in case of illness (BOTHER), effectiveness of vaccination (EFFECT), and expected side effects of flu shot (SIDE), are highly significant and have the expected positive influence on the willingness to receive the flu shot (WTINJ). The only exception is the fee (FEE), for which the influence was negative but the p value was 0.33. Therefore, we conclude that models such as the HBM, in which costs and benefits play an important role, are overwhelmingly supported.
8 The questionnaire can be seen at http://www2.econ.osaka-u.ac.jp/coe/project/survey-0502e.pdf.
7
Risk aversion (RA) positively affects the decision to be vaccinated, implying that the impact of perceived effectiveness of vaccination dominates the impact of its estimated side effects. As expected, the degree of time preference (DTP) positively affects the decision to be vaccinated, meaning that future-oriented people have greater intentions to take the flu shot. These results suggest that a traditional economic approach assuming rational agents well explains influenza vaccination behavior. Regarding characteristics of the respondents, all age dummies are significantly positive, with elderly people more willing to undergo vaccination, as expected. The degree of anxiety about one’s health (HEALTH) is significantly positive, indicating that those with greater anxiety have greater intentions to be vaccinated. Married people are more likely to get vaccinated. Gender and education were not significant. 4.2. Examination of status quo bias Among the variables concerning experience, previous flu illness (EXILL) was not significant, which is an unexpected result. However, past flu vaccination (EXINJ) had a significantly positive effect on WTINJ, clearly confirming the status quo bias. In addition, having periodic blood tests (TESTP) was significantly positive, as was having had blood tests when disease was suspected (TESTS), even though the significance was 20%. Status quo bias is also seen in Table 3: those who were vaccinated in the past are much more willing to be vaccinated than the average while those who were never vaccinated are much less willing than the average. We now examine if belief variables are less significant for those who were vaccinated in the past than for those who were never vaccinated, a second hypothesis of the status quo bias. In this estimation, the experience variables (EXINJ, EXILL, TESTP, and TESTS), were deleted from Eq. (1). Results are given in columns 6-9 of Table 4 (headed ‘Vaccinated in past’ and ‘Never vaccinated’). Focusing on the belief variables, PROB, BOTHER, and others became insignificant among those who had been vaccinated in the past but remained significant among those who were never vaccinated. So did the degree of time preference (DTP), which evaluates costs paid now versus benefits obtained in the future. These results support our hypothesis. In contrast, age dummies are more significant for those who were vaccinated in the past than for those who were never vaccinated. Although this result is not inconsistent with our hypothesis regarding status quo bias since age is not ‘a perceived variable’, it is intriguing to explore the reason behind it. One possible explanation is that this result does not reflect the influence of having been vaccinated (EXINJ) but, rather, the causality of age on acceptance of the vaccination in the past. To examine this hypothesis, we regressed EXINJ over the independent variables of Eq. (1).9 Results are shown in columns 10 and 11 of Table 4. (headed ‘Dependent value is EXINJ’). While a couple of belief variables loose their explanatory power,
9 EXINJ, of course, is deleted from the explanatory variables.
8
age dummies have significant power to explain inoculation behavior in the past, supporting our interpretation. In summary, results of the decision model confirm most of our hypotheses. Specifically, both traditional and behavioral economic approaches are valid for explaining inoculation behavior. However, a direct effect of education level on the willingness to receive vaccination was not found. Thus, we need to examine how education level indirectly affects willingness via beliefs. This was done using Eq. (2) and is discussed in the next section. 4.3. Results of the subjective variable model Results of the subjective variable model specified in Eq. (2) are summarized in Table 5. All perception variables, except PROB, are ordered categories. Thus, Eq. (2) was estimated by ordered probit except for PROB, which was estimated using ordinary least squares (OLS). All the variables are highly significant, especially EXILL whose large positive coefficient suggests representative bias. Health anxiety (HEALTH) also has a positive effect. On the other hand, overconfidence mitigates the subjective probability of infection. Women have a higher PROB value than men; married individuals have a higher PROB value than unmarried. A higher age results in a higher PROB, while higher education results in a lower PROB. As to the estimations for belief variables, two comments are in order. First, overconfidence does not directly affect vaccination behavior, as shown in Table 4, but indirectly decreases WTINJ via PROB, as shown in Table 5. This fact would have been overlooked if we did not estimate Eq. (2). Actually, consistent with our intuition, overconfidence significantly decreases ILL, FEE, and SIDE, and significantly increases EFFECT. In Table 5, the dummy variable representing gender (MALE) is negative, as is overconfidence, in the estimation of PROB, ILL, FEE, and SIDE, suggesting that males are more overconfident than females. This suggestion has been widely accepted; Barber and Odean (2001) used the male dummy as a proxy of overconfidence. Second, the finding that AGE negatively affects PROB is somewhat unexpected but probably because older people tend to accept more vaccines and think their probability of contracting influenza is lower. Effects of AGE on other dependent variables were consistent with our expectations. 4.4. How to raise inoculation rate? Our final goal was to find a means of raising the inoculation rate. Although a natural suggestion might be to lower the inoculation fee, this seems useless in the USA because the coefficient of FEE is insignificant (Table 4).10 Thus, we examined a second possibility, increasing public knowledge of the risks of influenza and the usefulness of the vaccine. The coefficient of education (EDUC) is significantly negative in the estimation of PROB (Table 5). In Eq. (1), PROB has a positive effect on the willingness to receive 10 However, for those who took vaccination, it is significant at the 10% level.
9
vaccination but EDUC is not significant, implying that higher education lowers WTINJ. Assuming that people with a higher education are better able to acquire and process information, this result suggests that conveying more information to people may lower the vaccination rate. To examine the effect of information on WTINJ, however, we need to measure its effects not only on PROB but also on the other belief variables. Results show that the coefficients of EDUC are negative in the estimation of PROB, ILL, and SIDE, but positive for FEE and EFFECT. To measure the effect of EDUC on WTINJ through these belief variables, we multiplied the marginal effects (ME) of EDUC in Table 5 by the ME of these variables in Eq. (1), shown in Table 4. Since all equations except for PROB are estimated by ordered probit, we calculated their effects as follows. First, the expectation of the dependent variable Y (which takes the value 1, 2, …, J) is defined as:
∑=
≡J
jjEY1j
)(P (3)
where P(j) stands for the probability that Y takes on the value of j. The ME of an exogenous variable (x) on the expected value is defined as:
∑= ∂
∂≡
∂∂ J
j
jjx
EY1 x
)(P .11 (4)
Therefore, for example, the ME of SIDE, is calculated as follows:
∑∑== ∂
∂×
∂∂
=∂∂ 7
1
5
1 )()2.()(P
)()1.()(
)()(
jjSIDEvia EDUCSIDEofeqofjj
SIDEeqofjPj
EDUCEWTINJ (5)
The calculated values are shown in the bottom row of Table 5. They are negative for PROB and ILL, while positive for EFFECT and SIDE.12 Considering that PROB, ILL, and BOTHER are subjective perceptions regarding the illness, while FEE, EFFECT, and SIDE are subjective perceptions regarding the vaccine, these results may suggest that increased education on the illness will lead to a decrease in willingness to be vaccinated, while increased education on the vaccine will raise this willingness. To confirm this hypothesis, we calculated the sum of indirect effects of EDUC on WTINJ through the perception variables. The sum of the indirect effects of EDUC through perception variables concerning the illness (PROB, ILL, and BOTHER) is -0.0091, while the sum concerning the vaccine (EFFECT, FEE, and SIDE) is 0.0143, resulting in a cumulative
11 For the variable PROB, the value of the estimated coefficient itself is the marginal value. 12 Those for BOTHER and FEE are insignificant.
10
positive effect of 0.0052.13 These results may be interpreted thusly: (a) people, on average, believe influenza to be more serious than it really is and (b) they do not trust the vaccination to the extent it deserves. Indeed, as shown in Table 5, having had influenza (EXILL) lowers the subjective severity of the disease (ILL), suggesting that the flu was milder than expected. To see the effect of having been vaccinated, we added a cross term of EXINJ and EXILL to Eq. (2) and estimated them (results not shown). The coefficient of the cross term is significantly positive for EFFECT, suggesting that EXINJ raises EFFECT in people that experienced the flu.14 These results suggest that dissemination of information on the vaccine may promote inoculation because people currently undervalue the effectiveness of vaccination. In contrast, dissemination of information on the illness may decrease vaccination because people believe influenza is more serious than it really is. 5. Summary and conclusions The current study identified behaviors and beliefs regarding willingness to get a flu shot. It shows that individuals who were more willing to be vaccinated had stronger beliefs (a) in the probability of contracting the disease, (b) that influenza is serious, (c) that the vaccine is effective, and (d) that side effects of the vaccine are minor. These results are compatible with the HBM approach, suggesting that people rationally assess costs and benefits before deciding to be vaccinated.15 The current study is unique in that it uses survey questions to grasp preference factors such as attitude towards risk and time preference. We found that individuals who are more future oriented (i.e., have a lower discount rate) put greater emphasis on future benefits of vaccination and lesser emphasis on immediate costs. Therefore, they are more willing to be vaccinated. We also found that individuals with greater risk aversion are more willing to be vaccinated, suggesting that the fear of influenza dominates the fear of side effects of the vaccine. Finding that costs and benefits as well as preferences have strong explanatory power indicates that traditional economics is a powerful vehicle for understanding vaccination behavior.
13 For a robustness check, we also calculated the effects (a) using the coefficients of Eq. (1) instead of ME, (b) using OLS estimates instead of estimates by ordered probit, and (c) aggregating only the statistically significant paths instead of all paths. In all cases, results were similar. 14 Following the HBM approach, Blue and Valley (2002) and Nexoe et al. (1999) found that individuals who had been vaccinated believed more strongly that influenza is a serious illness and that vaccination provides health benefits than those who had not been vaccinated. Our results are consistent with their findings. 15 The high significance of ILL is consistent with the results of Blank et al. (2008). In their study, the level of influenza vaccination in five European countries was analyzed. Perception of the flu as a serious illness was determined to be one of the principal reasons for being vaccinated.
11
Nonetheless, this paper argues that traditional economics is not sufficient to fully understand vaccination behavior. We speculated that rationality is bounded and examined whether overconfidence and past experience affect the behavior. We found that overconfidence does not directly affect willingness to be vaccinated, but indirectly affects it through subjective variables such as the probability of getting influenza, assessment of its severity, effectiveness of the vaccination, and assessment of side effects of the vaccination. We confirmed status quo bias in that previously vaccinated individuals were more willing to take the vaccine. Dividing the respondents into two groups according to whether or not they had been vaccinated in the past, we confirmed our second hypothesis of status quo bias that people who had been vaccinated in the past automatically chose to be vaccinated again without careful examination. The subjective probability of contracting influenza (PROB) and the degree that the family would be bothered (BOTHER) became insignificant in the regression using those who had previously been vaccinated, suggesting our hypothesis is accurate. Because influenza has large externalities on society, the optimal vaccination rate of society is probably higher than the optimal rate of individuals. Thus, our final goal was to find a way to raise the rate based on our results. While policy instruments may include reduction of the vaccination fee and dissemination of information regarding influenza and vaccination, our results suggest that reducing the fee will not significantly raise the vaccination rate. Then, how about disseminating information? If rationality is bounded, and usually it is, advertisement strongly influences behavior. A problem is how to grasp the magnitude of information. The variable EDUC may be a good proxy because acquisition and digestion of information are easier for those with a higher education.16 Although schooling did not directly affect willingness to be vaccinated in Eq. (1), it affected willingness indirectly through subjective variables such as PROB, EFFECT, and SIDE in Eq. (2). Closer inspection reveals that dissemination of information on the illness does not raise the vaccination rate, but information on the vaccination does. References Barber Brad M., Odean T., 2001. Boys will be boys: gender, overconfidence, and common
stock investment. The Quarterly Journal of Economics 116 (1), 261–292. Blank P., Schwenkglenks M., Szucs T., 2008. Influenza vaccination coverage rates in five
European countries during season 2006/07 and trends over six consecutive seasons. BMC Public Health 8, 272.
Blue C.L., Valley J.M., 2002. Predictors of influenza vaccine: acceptance among healthy adult workers. AAOHN Journal 50 (5), 227–235.
16 White et al. (2008) studied relationships between health literacy (based on 28 health-related items in the National Assessment of Adult Literacy) and preventive health practice in the USA. They found that low literacy was associated with a decreased likelihood of flu vaccination in adults aged 65
12
Bridges C.B., Thompson W.W., Meltzer M.I., et al., 2000. Effectiveness and cost-benefit of influenza vaccination of healthy working adults: a randomized controlled trial. The Journal of the American Medical Association 284 (13), 1655–1663.
CDC, 2006. Prevention and Control of Influenza: Recommendations of the Advisory Committee on Immunization Practices (ACIP). Centers for Disease Control and Prevention, United States Department of Health and Human Services, available at: http://www.cdc.gov/mmwr/preview/mmwrhtml/rr54e713a1.htm.
Chapman G.B., Coups E.J., 1999a. Predictors of influenza vaccine acceptance among healthy adults. Preventive Medicine 29 (4), 249–262.
Chapman G.B., Coups E.J., 1999b. Time preferences and preventive health behavior: acceptance of the influenza vaccine. Medical Decision Making 19 (3), 307–314.
Chen J.Y., Fox S.A., Cantrell C.H., Stockdale S.E., Kagawa-Singer M., 2007. Health disparities and prevention: racial/ethnic barriers to flu vaccinations. Journal of Community Health 32 (1), 5–20.
Chen Y., Yi Q. L., Wu J., Li F., 2007. Chronic disease status, self-perceived health and hospital admissions are important predictors for having a flu shot in Canada. Vaccine 25 , 7436–7440.
Demicheli V., Jefferson T., Rivetti D., Deeks J., 2000. Prevention and early treatment of influenza in healthy adults. Vaccine 18, 957–1030.
Fukunaga I., Jitsunari F., Takeda N., Asakawa F., Maruyama Y., 1997. A study of health behavior of the elderly - correlation between participation in health examinations and health behavior. Japanese Journal of Hygiene 52 (2), 490–503.
Greene W.H., 2001. Econometric Analysis. Prentice-Hall Inc. Griffin D.W., Varey C.A., 1996. Towards a consensus on overconfidence. Organizational
Behavior and Human Decision Processes 65 (3), 227–231. Lau J., Kim J., Yang X., Tsui H.Y., 2008. Cross-sectional and longitudinal factors predicting
influenza vaccination in Hong Kong Chinese elderly aged 65 and above. Journal of Infection, 56 (6), 460–468.
Lee P.Y., Matchar D.B., Clements D.A., Huber J., Hamilton J.D., Peterson E.D., 2002. Economic analysis of influenza vaccination and antiviral treatment for healthy working adults. Annals of Internal Medicine 137 (4), 225–231.
Nexoe J., Kragstrup J., Sogaard J., 1999. Decision on influenza vaccination among the elderly: a questionnaire study based on the Health Belief Model and the Multidimensional Locus of Control Theory. Scandinavian Journal of Primary Health Care 17 (2), 105–110.
Nichol K.L., Mallon K.P., Mendelman P.M., 2003. Cost benefit of influenza vaccination in healthy, working adults: an economic analysis based on the results of a clinical trial of trivalent live attenuated influenza virus vaccine. Vaccine 21 (17-18), 2207–2217.
Rosenstock L.M., Strecher V.J., Becker M.H., 1988. Social learning theory and the Health Belief Model. Health Education Quarterly 15 (2), 175–183.
Samuelson W., Zeckhauser R.J., 1988. Status quo bias in decision making. Journal of Risk and Uncertainty 1, 7–59.
13
Shahrabani S., Benzion U., 2006. The effects of socio-economic factors on the decision to be vaccinated: the case of flu-shot vaccination. The Israel Medical Association Journal (IMAJ) 8, 630–634.
Shahrabani S., Gafni A., Benzion U., 2008. Low flu shot rates puzzle - some plausible behavioral explanations. The American Economist LII (1), 66–72.
Shahrabani S., Benzion U., Yom Din G., 2009. Factors affecting nurses' decision to get the flu vaccine. European Journal of Health Economics 10 (2), 227–231.
White S., Chen J., Atchison R., 2008. Relationship of preventive health practices and health literacy: a national study. American Journal of Health Behavior 32 (3), 227–242.
Wu S., 2003. Sickness and preventive medical behavior. Journal of Health Economics 22, 675–689.
14
Table 1 Variables and their linkage to the questionnaire. Variable Definition Question
no. Question Range of answers Value entered into
formula WTINJ Willingness to get flu shot 48 Do you intend to receive the flu shot in the next 12 months? 1 = yes, certainly; 5 = no, certainly
not 6 less response
PROB Subjective probability of illness 50 Estimate your chance to be infected by flu during the next 12 months.
0-100% Reported value
ILL Severity of illness 44 How serious a disease do you think the flu is? 1 = extremely serious; 6 = little influence
7 less response
BOTHER Bother to family when ill 47 When infected, to what extent do you bother your family and friends?
1 = extremely; 4 = hardly 5 less response
EFFECT Effectiveness of vaccination 49 How effective do you think the flu shot is? 1 = perfectly; 5 = never effective 6 less response
SIDE Side effects of vaccine 46 How serious do you think the side effects caused by a flu shot are?
1 = extremely serious; 7 = not serious
8 less response
FEE Cost of flu shot 45 How much do you think a flu shot costs? 1 = free; 6 = above $50 Reported value
DTP Time preference 2.5 I want to postpone joys for later. 1 = particularly true; 5 = not true at all
6 less response
RA Risk aversion; threshold for action
21 How high does the probability of rain have to be in order for you to take an umbrella?
0-100% 100 less response
OVER Overconfidence 2.6 I will never be robbed. 1 = particularly true; 5 = not true at all
6 less response
EXINJ Ever received a flu shot 41 Have you ever received a flu shot? no = 0; yes = 1 Reported value
EXILL Infected during previous 2 years 43 Have you been infected by the flu during the last two years? no = 0; yes = 1 Reported value
TESTP Periodic blood test 51.1 Did you undergo a blood test in the last 12 months as part of a periodic test?
no = 0; yes = 1 Reported value
TESTS Blood test because of suspected illness
51.2 Did you undergo a blood test in the last 12 months because of suspected disease?
no = 0; yes = 1 Reported value
EDUC Education level 58.1 The highest level of education completed? 1 = grade school; 9 = doctoral degree
Reported value
MALE Gender 54 male = 1; female = 0 Reported value
MARRY Marital status 55 married = 1; other =0 Reported value
HEALTH Anxious about health 2.12 I have anxieties about my health. 1 = particularly true; 5 = not true at all
6 less response
AGE Age 57.1 Your birth year? 20-90 2005 less response
15
Table 2 Number of respondents in each category (total n = 4979). Men Women Age≤60 Age>60 Vaccinated in past Infected by flu during
last two years Never Yes No Yes Total 2231 2748 3506 1159 2039 2940 4004 975
Men 1541 498 920 1311 1809 422
Women 1965 661 1119 1629 2195 553
Age≤60 1646 1860 2704 802
Age>60 251 908 1047 112
Never received flu shot
1604 435
Received flu shot 2400 540
16
Table 3 Mean values of the variables (standard errors in parentheses) amongst those who had been vaccinated in the past and those who had never been vaccinated, by age.
Vaccinated in past Never vaccinated Variable Scale Mean Age≤60 Age >60 Age≤60 Age>60
WTINJ 1-5 2.83 (0.02)
3.40 (0.03)
4.10(0.04)
1.68(0.02)
1.78(0.06)
PROB 0-100 26.01 (0.35)
28.99 (0.58)
19.20(0.73)
26.82(0.61)
23.10(1.58)
ILL 1-6 4.22 (0.02)
4.35 (0.03)
4.81(0.04)
3.81(0.03)
4.09(0.09)
BOTHER 1-4 1.68 (0.01)
1.73 (0.01)
1.53(0.02)
1.73(0.02)
1.57(0.04)
EFFECT 1-5 3.00 (0.01)
3.11 (0.01)
3.27(0.02)
2.77(0.01)
2.69(0.05)
SIDE 1-7 3.15 (0.02)
2.97 (0.03)
2.90(0.05)
3.39(0.03)
3.80(0.11)
FEE 1-6 (US$0-50) 3.38 (0.02)
3.50 (0.03)
3.23(0.04)
3.42(0.03)
3.16(0.09)
DTP 1-5 3.18 (0.02)
3.16 (0.03)
3.28(0.04)
3.17(0.03)
3.17(0.09)
RA 0-100 40.66 (0.42)
39.63 (0.67)
43.67(0.94)
39.73(0.77)
39.69(1.89)
OVER 1-5 2.60 (0.01)
2.56 (0.02)
2.61(0.04)
2.61(0.02)
2.54(0.07)
EXILL 0 (no) 1 (yes)
0.19 (0.00)
0.22 (0.01)
0.09(0.01)
0.23(0.01)
0.11(0.02)
TESTP 0 (no) 1 (yes)
0.59 (0.00)
0.61 (0.01)
0.83(0.01)
0.45(0.01)
0.57 (0.03)
TESTS 0 (no) 1 (yes)
0.04 (0.00)
0.05 (0.00)
0.04(0.00)
0.03(0.00)
0.03(0.01)
EDUC 1-9 4.80 (0.02)
5.02 (0.04)
4.62(0.06)
4.75(0.04)
4.46(0.11)
MALE 0 (female) 1 (male)
MARRY 0 (unmarried) 1 (married)
0.42 (0.01)
0.35 (0.01)
0.39(0.02)
0.43(0.01)
0.39(0.02)
HEALTH 1-5 2.94 (0.01)
3.04 (0.02)
3.12(0.04)
2.78(0.03)
2.70(0.08)
AGE 20-90 47.61 (0.25)
42.25 (0.27)
71.56(0.26)
37.97(0.28)
68.74(0.41)
17
Table 4 Results of decision model Eq. (1), by ordered probit. Dependent value is WTINJ Whole sample Vaccinated in past Never vaccinated
Dependent value is EXINJ*
Expectedsign
Estimate P value Marginaleffect
Estimate P value Estimate P value Estimate P value
PROB + 0.0029 0.0000 0.0035 0.0014 0.1820 0.0071 0.0000 0.0024 0.0080 ILL + 0.1685 0.0000 0.2042 0.2046 0.0000 0.1017 0.0000 0.1692 0.0000 BOTHER + 0.1072 0.0000 0.1299 0.0458 0.1370 0.2239 0.0000 -0.0373 0.1870 EFFECT + 0.4695 0.0000 0.5687 0.5299 0.0000 0.3601 0.0000 0.3473 0.0000 SIDE - -0.1450 0.0000 -0.1756 -0.1455 0.0000 -0.1142 0.0000 -0.1461 0.0000 FEE - -0.0134 0.3300 -0.0163 -0.0286 0.1100 -0.0015 0.9440 -0.0007 0.9640 DTP + 0.0287 0.0830 0.0348 0.0189 0.3670 0.0633 0.0210 0.0009 0.9640 RA ? 0.0035 0.0000 0.0043 0.0022 0.0100 0.0062 0.0000 0.0011 0.1810 OVER - -0.0019 0.9080 -0.0023 -0.0121 0.5620 0.0125 0.6510 -0.0017 0.9300 EXINJ + 1.3024 0.0000 1.4861 EXILL + 0.0296 0.5450 0.0359 TESTP + 0.2582 0.0000 0.3108 TESTS + 0.1192 0.2050 0.1455 EDUC ? -0.0034 0.7410 -0.0042 0.0067 0.6100 -0.0126 0.4670 0.0449 0.0000 MALE - 0.0464 0.2190 0.0562 0.0403 0.4010 0.0213 0.7300 0.0296 0.5090 MARRY ? 0.0114 0.8140 0.0138 -0.1375 0.0360 0.1350 0.0570 -0.2963 0.0000 HEALTH + 0.0702 0.0000 0.0850 0.0813 0.0000 0.0605 0.0210 0.1099 0.0000 AGE40 + 0.1312 0.0130 0.1598 0.2234 0.0020 0.0821 0.3000 0.0888 0.1430 AGE50 + 0.2914 0.0000 0.3564 0.4496 0.0000 0.1138 0.2090 0.4109 0.0000 AGE60 + 0.5343 0.0000 0.6530 0.6672 0.0000 0.3329 0.0010 0.7557 0.0000 Constant ? -1.8001 0.0000 S.E. S.E. S.E. μ1 2.4186 2.7137 1.3197 0.1996 2.1704 0.2328 μ2 3.5376 3.8410 2.2364 0.2012 3.5182 0.2405 μ3 3.9190 4.2257 2.5596 0.2022 4.2164 0.2496 μ4 4.5474 4.8599 3.2279 0.2047 4.7455 0.2659 Pseudo 0.5339 0.2825 0.1674 0.1861 No. of observations 3809 2362 1534 3908
Note: μ indicates boundary values of categories for which standard errors (S.E.) are given instead of p values. * In these columns, results of Eq. (1) exclude EXINJ, EXILL, TESTP, and TESTS.
18
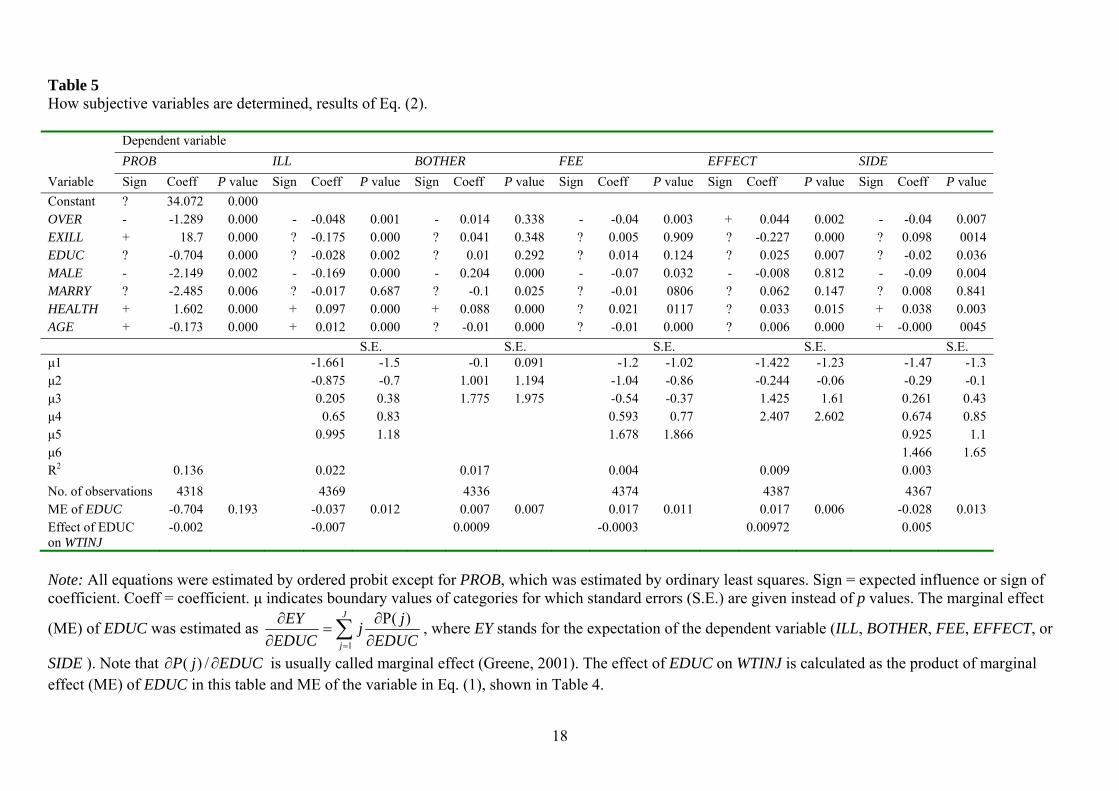
Table 5 How subjective variables are determined, results of Eq. (2). Dependent variable PROB ILL BOTHER FEE EFFECT SIDE Variable Sign Coeff P value Sign Coeff P value Sign Coeff P value Sign Coeff P value Sign Coeff P value Sign Coeff P value Constant ? 34.072 0.000 OVER - -1.289 0.000 - -0.048 0.001 - 0.014 0.338 - -0.04 0.003 + 0.044 0.002 - -0.04 0.007 EXILL + 18.7 0.000 ? -0.175 0.000 ? 0.041 0.348 ? 0.005 0.909 ? -0.227 0.000 ? 0.098 0014 EDUC ? -0.704 0.000 ? -0.028 0.002 ? 0.01 0.292 ? 0.014 0.124 ? 0.025 0.007 ? -0.02 0.036 MALE - -2.149 0.002 - -0.169 0.000 - 0.204 0.000 - -0.07 0.032 - -0.008 0.812 - -0.09 0.004 MARRY ? -2.485 0.006 ? -0.017 0.687 ? -0.1 0.025 ? -0.01 0806 ? 0.062 0.147 ? 0.008 0.841 HEALTH + 1.602 0.000 + 0.097 0.000 + 0.088 0.000 ? 0.021 0117 ? 0.033 0.015 + 0.038 0.003 AGE + -0.173 0.000 + 0.012 0.000 ? -0.01 0.000 ? -0.01 0.000 ? 0.006 0.000 + -0.000 0045 S.E. S.E. S.E. S.E. S.E. μ1 -1.661 -1.5 -0.1 0.091 -1.2 -1.02 -1.422 -1.23 -1.47 -1.3 μ2 -0.875 -0.7 1.001 1.194 -1.04 -0.86 -0.244 -0.06 -0.29 -0.1 μ3 0.205 0.38 1.775 1.975 -0.54 -0.37 1.425 1.61 0.261 0.43 μ4 0.65 0.83 0.593 0.77 2.407 2.602 0.674 0.85 μ5 0.995 1.18 1.678 1.866 0.925 1.1 μ6 1.466 1.65 R2 0.136 0.022 0.017 0.004 0.009 0.003 No. of observations 4318 4369 4336 4374 4387 4367
ME of EDUC -0.704 0.193 -0.037 0.012 0.007 0.007 0.017 0.011 0.017 0.006 -0.028 0.013 Effect of EDUC on WTINJ
-0.002 -0.007 0.0009 -0.0003 0.00972 0.005
Note: All equations were estimated by ordered probit except for PROB, which was estimated by ordinary least squares. Sign = expected influence or sign of coefficient. Coeff = coefficient. μ indicates boundary values of categories for which standard errors (S.E.) are given instead of p values. The marginal effect
(ME) of EDUC was estimated as ∑= ∂
∂=
∂∂ J
j EDUCjj
EDUCEY
1
)(P , where EY stands for the expectation of the dependent variable (ILL, BOTHER, FEE, EFFECT, or
SIDE ). Note that EDUCjP ∂∂ /)( is usually called marginal effect (Greene, 2001). The effect of EDUC on WTINJ is calculated as the product of marginal effect (ME) of EDUC in this table and ME of the variable in Eq. (1), shown in Table 4.
19
Fig. 1 Number of responses by region.
247
721835
368
935
316
541
317
699
0100200300400500600700800900
1000G
EO
1 N
ew
Engl
and
GEO
2 M
iddl
e A
tlan
tic
GEO
3 E
ast
Nort
hC
entr
al
GEO
4 W
est
Nort
hC
entr
al
GEO
5 S
outh
Atl
anti
c
GEO
6 E
ast
South
Centr
al
GEO
7 W
est
South
Centr
al
GEO
8 M
ounta
in
GEO
9 P
acific
Related Documents