Surveillance of seasonal influenza vaccination coverage among health care personnel in the United States Charles DiSogra Abt SRBI Sarah W Ball Abt Assoc. Carla L Black CDC* Stacie M Greby CDC* Xin Yue CDC* Anup Srivastav CDC* Sara MA Donahue Abt Assoc. David Izrael Abt Assoc. Rachel Martonik Abt SRBI Deborah K Walker Abt Assoc. • Immunization Services Division, National Center for Immunization and Respiratory Diseases AAPOR – May 17, 2014 – Anaheim, CA

Welcome message from author
This document is posted to help you gain knowledge. Please leave a comment to let me know what you think about it! Share it to your friends and learn new things together.
Transcript

Surveillance of
seasonal influenza vaccination
coverage among health care
personnel in the United States
Charles DiSogra Abt SRBI Sarah W Ball Abt Assoc.
Carla L Black CDC* Stacie M Greby CDC* Xin Yue CDC* Anup Srivastav CDC* Sara MA Donahue Abt Assoc. David Izrael Abt Assoc.
Rachel Martonik Abt SRBI Deborah K Walker Abt Assoc.
• Immunization Services Division, National Center for Immunization and Respiratory Diseases
AAPOR – May 17, 2014 – Anaheim, CA
Abt SRBI | pg 2
CDC uses influenza vaccination coverage data to:
Monitor impact of vaccination programs
Identify groups in need of vaccination services
Health Care Personnel (HCP) are a special population
targeted for vaccination
Routine vaccination of HCP can help reduce influenza-related
illness among HCP and in health care settings
2
Background

Abt SRBI | pg 3
Survey sample challenge
Probability-based population surveys can be costly and time-
consuming:
Low prevalence of HCP in the total U.S. population
Difficult to survey sufficient numbers in the short time frame of interest
(mid- and end-of-season)
3

Abt SRBI | pg 4
Survey sample challenge
8.8%
91.2%
4
Detailed Census Occupation by Sex and Race/Ethnicity for Residence Geography Universe: Civilian labor force . 2006-2010 (5-year ACS data)
Healthcare providers 8.8%
Physicians and surgeons 0.6%
Registered nurses 2.0%
Physician assistants <0.1%
Nurse practitioners and midwives <0.1%

Abt SRBI | pg 5
What about existing surveillance systems?
Data from existing systems are not always available before the start
of the next influenza season
Limited in-depth information for vaccine-related K-A-B-B
Knowledge
Attitudes
Behaviors
Barriers
5
Abt SRBI | pg 6
Solution: Internet panel source
Practical solution used since 2009-10 influenza season
Internet panel survey overview:
Respondents identified from internet panels with HCP members
Non-probability sample
Efficient (time and cost)
Representative sample vs. “reflective sample”
By design, looks like HCP population
6
Abt SRBI | pg 7
Methodology – Large Internet panels
Professional HCP from WebMD
>2.5 million U.S. HCP members
Other HCP occupations from Survey Sampling International
>1 million U.S. households (general population)
Participants invited using email and pop-up intercept
Some quotas imposed, no probability selection used
Physicians, nurse practitioners, physician assistants, nurses, dentists, pharmacists, allied health professionals, technicians, and technologists
Assistants, aides, administrators, clerical support workers, janitors, food service workers, and housekeepers

Abt SRBI | pg 8
Methodology – Web survey
Self-administered online questionnaire
Sample (n ~1,900) recruited from panels twice per year
Early (November) and end (April) of each influenza season
Sampled with replacement across surveys
• Duplicates possible but rare (<3% overlap)
Data used to generate coverage estimates for influenza season

Abt SRBI | pg 9
Methodology – Data weighting
Post-stratification raking procedure
National HCP benchmark estimates for each occupation category by
characteristics associated with vaccination
Bureau of Labor Statistics Occupational Employment and Wage Estimates
o HCP occupations (10 categories)
o Health care work settings (Hospital, Long-term care, Ambulatory care)
Current Population Survey
o Race/ethnicity (black non-Hisp, Hispanic, white and other non-Hisp)
o Gender (M,F)
o Age (<35, 35-44, 45-54, 55-64, ≥ 65)
o Census region (NE, MidW, S, W)

Abt SRBI | pg 10
Methodology – Limitations
No confidence intervals calculated (non-probability sample!)
Statistical testing not done
±5 percentage points used as “notable difference”
Abt SRBI | pg 11
Methodology – Comparisons
Compare Internet panel results to a probability-based survey
Reference Survey
The National Health Interview Survey (NHIS)

Abt SRBI | pg 12
Comparison: Internet Panel vs. NHIS
Internet panel survey NHIS
Recruitment method Non-probability sample from volunteer Internet panel
Complex sampling design with stratification, clustering, and multistage sampling
Survey mode Self-administered online In-person interview
Timing of vaccination During influenza season (July – April)
Within past 12 months*
Geographic level National National
Data collection schedule Nov. and April each influenza season
Monthly
Timeliness of reporting 2 weeks 16 months
Typical completion/response rate
90% completion rate 61% - 66% response rate
Approx. sample size >1,900 per survey per season 2,000 per survey (different HCP definition)
* Since 2005, can determine whether vaccinated during influenza season

Abt SRBI | pg 13
Methodology – HCP definition
Currently volunteers or works in
• Hospital
• Medical clinic
• Doctor’s office
• Dentist’s office
• Nursing home
• Some other health-care facility
Includes part-time/unpaid work in a facility
or in-home nursing care
Works* in any of the following
• Hospital
• Physician’s office or other non-hospital setting, such
as a medical clinic or other ambulatory care setting
• Dentist office or dental clinic
• Pharmacy
• Nursing home, assisted living facility, or other long-
term care facility
• Home health agency or home health care
• Other health care setting
Or does work involving direct care of patients
*Note: “volunteers” not systematically excluded but not
directly addressed
Internet panel survey NHIS

Abt SRBI | pg 14
Comparison of demographics – Internet panel survey (IPS) vs. NHIS
14
15.1
34.5
39.7
10.6
21.6
31.1 32.0
15.3
0
10
20
30
40
50
60
70
80
18-29 30-44 45-59 60+
Pe
rce
nt
of
sam
ple
IPS NHIS
Final weighted distribution of age groups in HCP sample 2011-12 influenza season,
Internet Panel Survey vs. NHIS, United States
Age group (years)

Abt SRBI | pg 15
15
51.7
26.7 21.7
63.1
20.6 16.3
0
10
20
30
40
50
60
70
80
HS or less College degree More than college
Pe
rce
nt
of
sam
ple
IPS NHIS
Education level
Final weighted distribution of education level in HCP sample 2011-12 influenza season
Internet Panel Survey vs. NHIS , United States
Comparison of demographics – Internet panel survey (IPS) vs. NHIS

Abt SRBI | pg 16
16
10.6
66.7
13.4 9.3 10.8
68.4
13.1
7.7
0
10
20
30
40
50
60
70
80
Hisp White, non-Hisp Black, non-Hisp Other
Pe
rce
nt
of
sam
ple
IPS NHIS
Race/ethnicity
Final weighted distribution of racial/ethnic groups in HCP sample 2011-12 influenza season,
Internet Panel Survey vs. NHIS , United States
Comparison of demographics – Internet panel survey (IPS) vs. NHIS
Hispanic white, non-Hisp black, non-Hisp other
Abt SRBI | pg 17
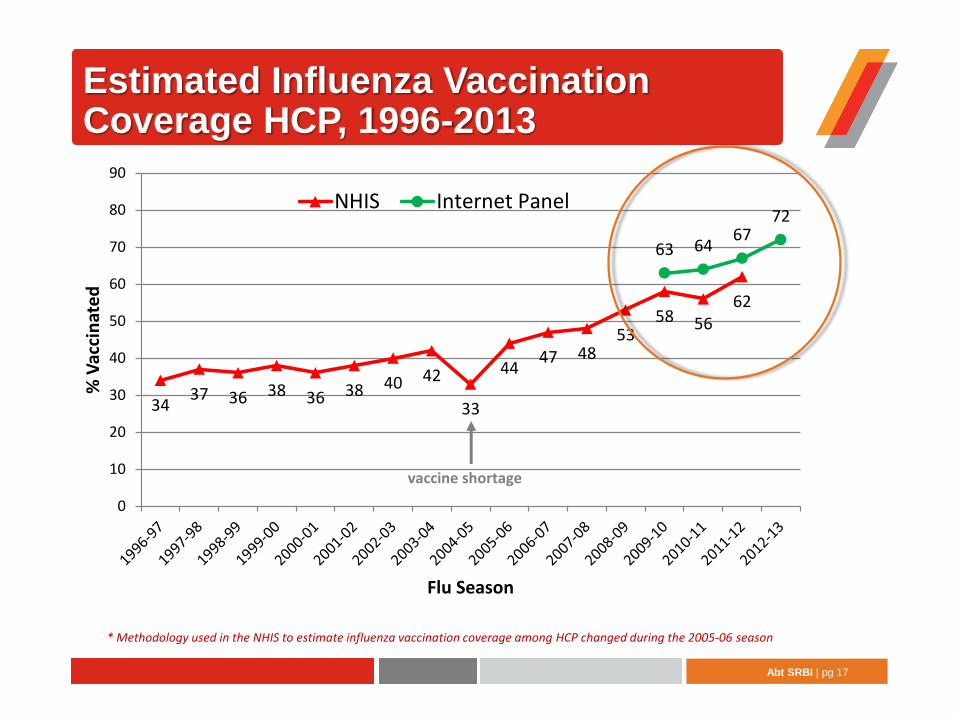
Estimated Influenza Vaccination Coverage HCP, 1996-2013
* Methodology used in the NHIS to estimate influenza vaccination coverage among HCP changed during the 2005-06 season
3437 36 38 36 38 40 42
33
4447 48
5358 56
62
63 6467
72
0
10
20
30
40
50
60
70
80
90
% V
acci
nat
ed
Flu Season
NHIS Internet Panel
vaccine shortage
Abt SRBI | pg 18
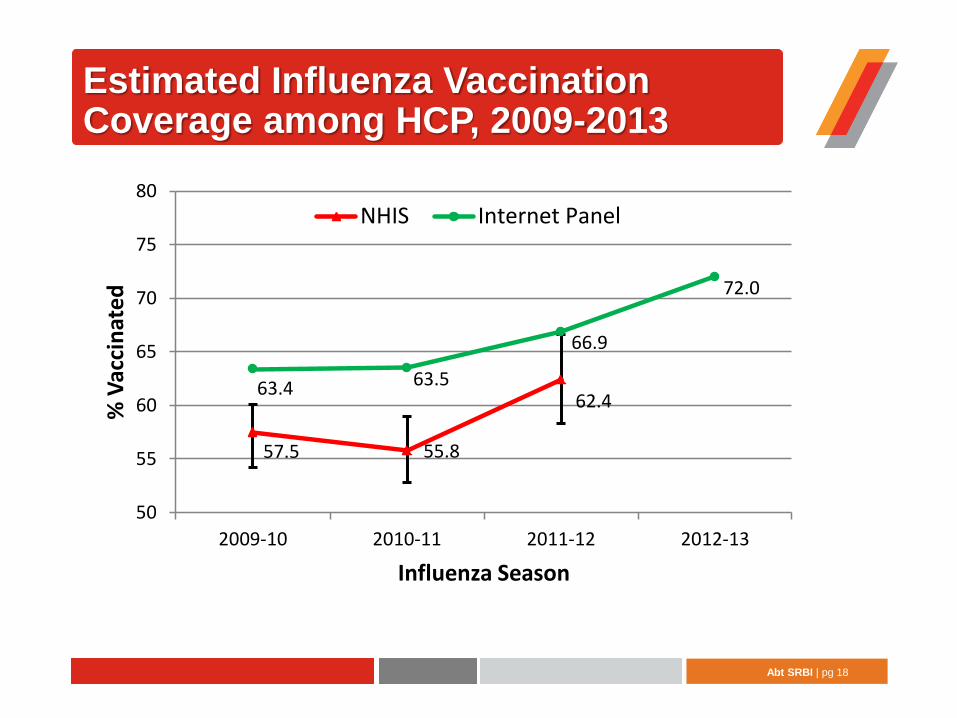
Estimated Influenza Vaccination Coverage among HCP, 2009-2013
57.5 55.8
62.463.4 63.5
66.9
72.0
50
55
60
65
70
75
80
2009-10 2010-11 2011-12 2012-13
% V
acci
nat
ed
Influenza Season
NHIS Internet Panel
Abt SRBI | pg 19
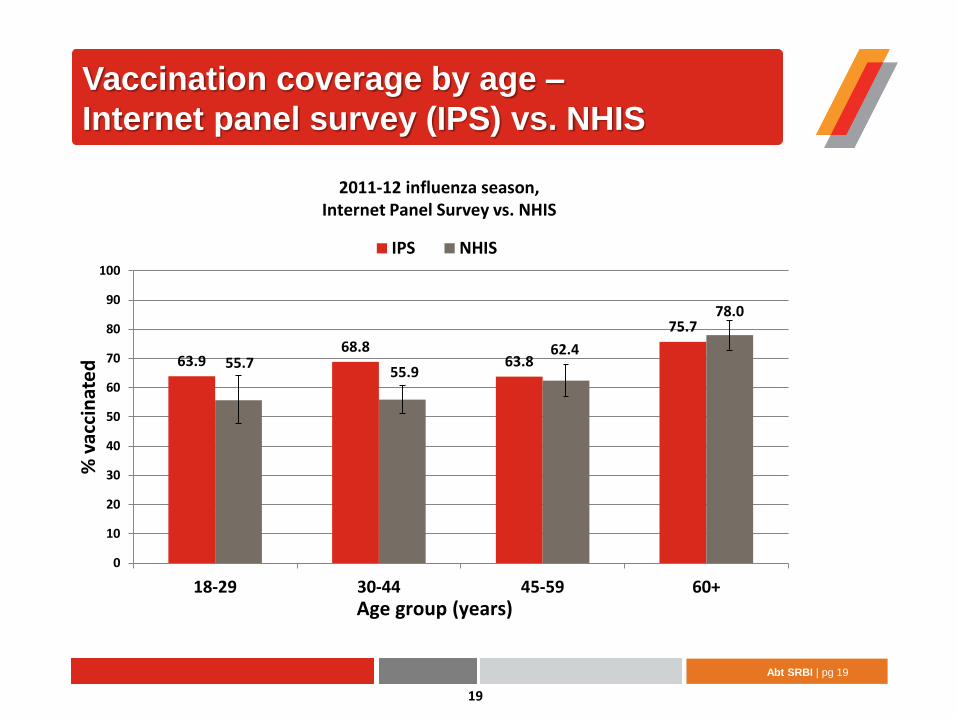
Vaccination coverage by age –
Internet panel survey (IPS) vs. NHIS
19
63.9 68.8
63.8
75.7
55.7 55.9
62.4
78.0
0
10
20
30
40
50
60
70
80
90
100
18-29 30-44 45-59 60+
% v
acci
nat
ed
IPS NHIS
2011-12 influenza season, Internet Panel Survey vs. NHIS
Age group (years)

Abt SRBI | pg 20
Vaccination coverage by race/ethnicity –
Internet panel survey (IPS) vs. NHIS
20
70.3 66.4 65.5
69.0
55.0 63.6
51.8
68.4
0
10
20
30
40
50
60
70
80
90
100
Hisp White, non-Hisp Black, non-Hisp Other
% v
acci
nat
ed
IPS NHIS
Race/ethnicity
2011-12 influenza season, Internet Panel Survey vs. NHIS
Hispanic white, non-Hisp black, non-Hisp other

Abt SRBI | pg 21
Vaccination coverage by education –
Internet panel survey (IPS) vs. NHIS
21
59.5
70.0
80.1
56.7
68.3 71.0
0
10
20
30
40
50
60
70
80
90
100
HS or less College degree More than college
% v
acci
nat
ed
IPS NHIS
Education level
2011-12 influenza season, Internet Panel Survey vs. NHIS

Abt SRBI | pg 22
Summary: Internet Panel Survey (IPS) Results vs. NHIS
IPS sample
More prime career ages (between 30 and 59)
More “college or higher” educated
IPS results appear higher vaccination coverage vs. NHIS
Overall, higher by 5-6 percentage points
Higher for persons under age 45
Higher for Hispanic and black non-Hispanic HCPs
Although higher, overall vaccination coverage trend over time tracks
similar to NHIS
22
Abt SRBI | pg 23
Summary: Internet Panel Survey (IPS) Results vs. NHIS
Higher IPS estimates may be attributable to:
More educated sample
More information seekers being online – more informed
Exclusion of HCPs without Internet access
Differential self-selection bias to elect to take/complete survey
23
Abt SRBI | pg 24
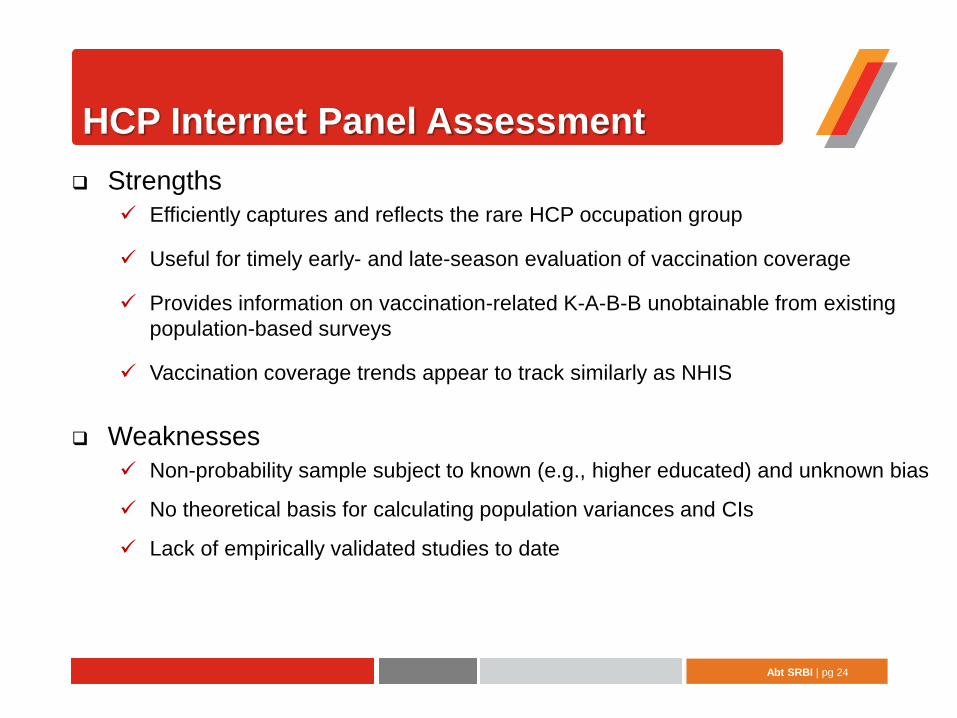
HCP Internet Panel Assessment
Strengths
Efficiently captures and reflects the rare HCP occupation group
Useful for timely early- and late-season evaluation of vaccination coverage
Provides information on vaccination-related K-A-B-B unobtainable from existing
population-based surveys
Vaccination coverage trends appear to track similarly as NHIS
Weaknesses
Non-probability sample subject to known (e.g., higher educated) and unknown bias
No theoretical basis for calculating population variances and CIs
Lack of empirically validated studies to date
Abt SRBI | pg 25
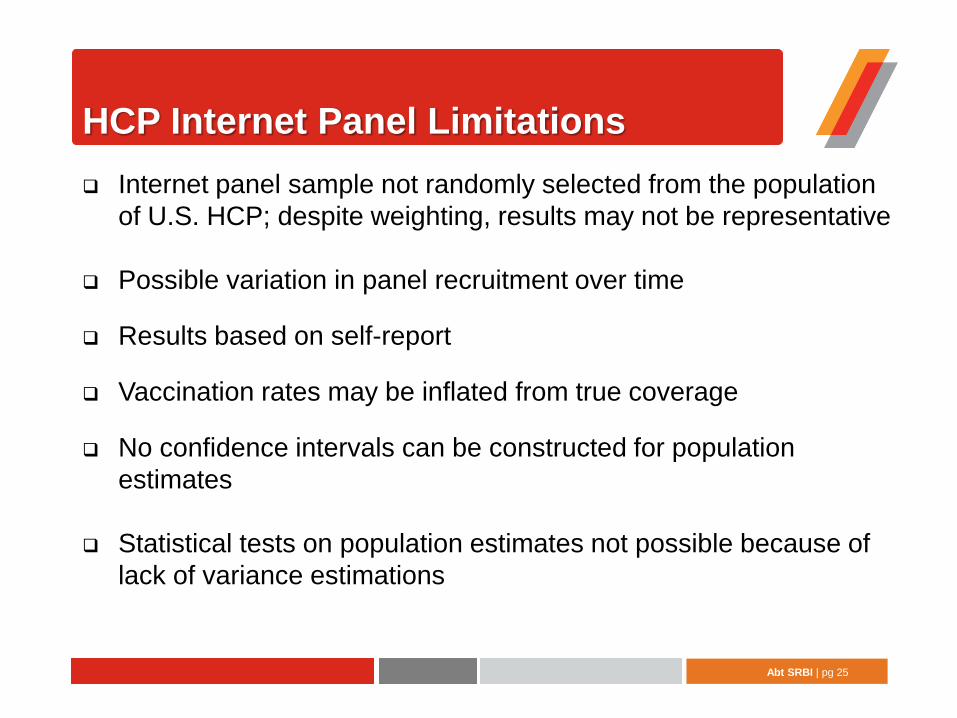
HCP Internet Panel Limitations
Internet panel sample not randomly selected from the population
of U.S. HCP; despite weighting, results may not be representative
Possible variation in panel recruitment over time
Results based on self-report
Vaccination rates may be inflated from true coverage
No confidence intervals can be constructed for population
estimates
Statistical tests on population estimates not possible because of
lack of variance estimations
Abt SRBI | pg 26
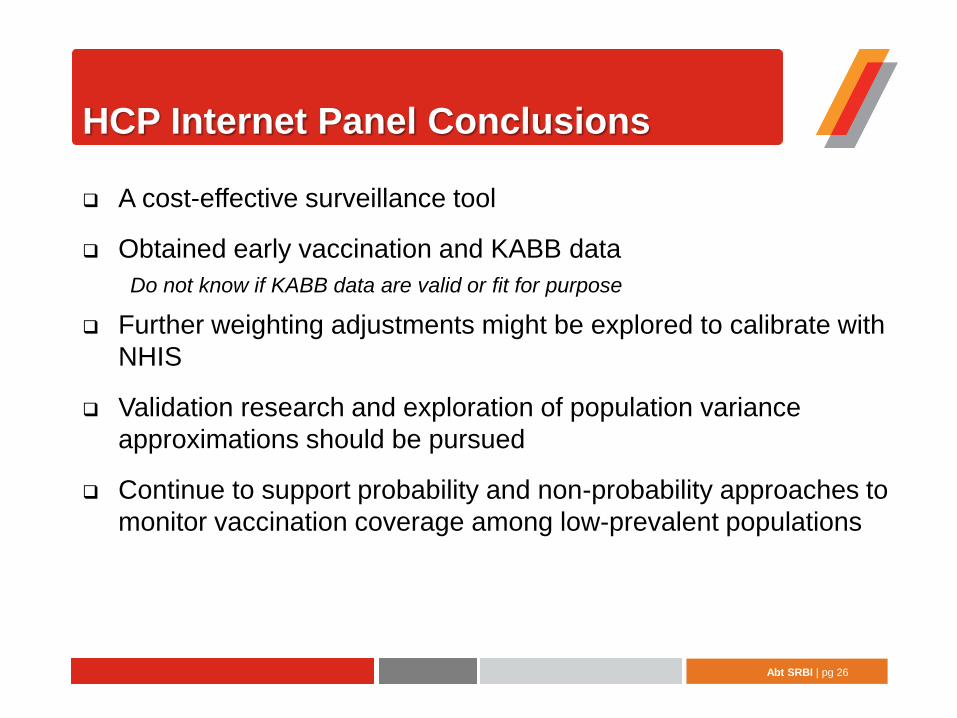
HCP Internet Panel Conclusions
A cost-effective surveillance tool
Obtained early vaccination and KABB data
Do not know if KABB data are valid or fit for purpose
Further weighting adjustments might be explored to calibrate with
NHIS
Validation research and exploration of population variance
approximations should be pursued
Continue to support probability and non-probability approaches to
monitor vaccination coverage among low-prevalent populations
Abt SRBI | pg 27
Surveillance of seasonal influenza vaccination coverage
among healthcare personnel in the United States
Thank You!
Charles DiSogra [email protected]
Special thanks to CDC staff Peng-Jun Lu and Alissa O'Halloran for the NHIS analyses The findings and conclusions in this presentation are those of the authors and do not necessarily represent the views of the Centers for Disease Control and Prevention.

Abt SRBI | pg 28
Comparison of demographics – Internet panel survey (IPS) vs. NHIS
28
10.6
31.0
43.4
15.0
20.8
32.2 29.7
17.3
0
10
20
30
40
50
60
70
80
18-29 30-44 45-59 60+
Pe
rce
nt
of
sam
ple
IPS NHIS
Final unweighted distribution of age groups in HCP sample 2011-12 influenza season,
Internet Panel Survey vs. NHIS, United States
Age group (years)
SUPPLEMENTAL SLIDE – NOT PART OF PRESENTATION – INFORMATION ONLY

Abt SRBI | pg 29
29
30.9
21.3
46.8
63.8
20.4 15.8
0
10
20
30
40
50
60
70
80
HS or less College degree More than college
Pe
rce
nt
of
sam
ple
IPS NHIS
Education level
Final unweighted distribution of education level in HCP sample 2011-12 influenza season
Internet Panel Survey vs. NHIS , United States
Comparison of demographics – Internet panel survey (IPS) vs. NHIS
SUPPLEMENTAL SLIDE – NOT PART OF PRESENTATION – INFORMATION ONLY

Abt SRBI | pg 30
30
14.2
60.7
14.7 10.5 12.4
61.4
17.3
8.9
0
10
20
30
40
50
60
70
80
Hisp white, non-Hisp black, non-Hisp other
Pe
rce
nt
of
sam
ple
IPS NHIS
Race/ethnicity
Final unweighted distribution of racial/ethnic groups in HCP sample 2011-12 influenza season,
Internet Panel Survey vs. NHIS , United States
Comparison of demographics – Internet panel survey (IPS) vs. NHIS
SUPPLEMENTAL SLIDE – NOT PART OF PRESENTATION – INFORMATION ONLY
Related Documents