Decision support system for improving wheat grain quality in the Mediterranean area of Israel David J. Bonfil a,* , A. Karnieli b , M. Raz b , I. Mufradi a , S. Asido a , H. Egozi c , A. Hoffman c , Z. Schmilovitch c a Field Crops and Natural Resources Department, Agricultural Research Organization, Gilat Research Center, 85280 MP Negev 2, Israel b The Remote Sensing Laboratory, Jacob Blaustein Institute for Desert Research, Ben Gurion University of the Negev, Sede-Boker Campus 84990, Israel c Agricultural Engineering Institute, Agricultural Research Organization, Volcani Center, P.O. Box 6, Bet Dagan 50250, Israel Received 30 July 2003; received in revised form 20 January 2004; accepted 30 January 2004 Abstract The yield of dryland wheat in semi-arid and arid areas is limited by rainfall. Nitrogen application and rainfall distribution determine biomass production, soil water depletion, and grain quality. A precise base level of nitrogen fertilization is applied according to the annual rainfall, but in case of more rain, the higher biomass production would dilute the nitrogen and a low quality wheat would be harvested. On the other hand, under drought conditions, harvesting for hay or silage provides a greater income than leaving the crop for grain production. Our objective was to establish a quick and simplified decision support system (DSS) for decision making at heading. It was found that, at heading, flag leaf water concentration (FLW) and flag leaf total N concentration (FLN) data can be used to support agronomic decision making. In particular, these data can assist a decision to harvest early for hay or silage, since water stress exists and the test weight is expected to decline. In other cases these data can help to forecast the need for late nitrogen application to ensure sufficient protein levels. Our results show that the proposed DSS correctly forecasts wheat grain quality, test weight and protein content, in more than 80% of the 344 experimental plots, by monitoring flag leaves at heading. Therefore, application of the suggested simplified DSS would reduce the harvesting of shriveled grains, on the one hand, and would lead to improved grain protein, on the other hand, thus ensuring high-quality production. # 2004 Elsevier B.V. All rights reserved. Keywords: Crop monitoring; Heading; Nitrogen; Precision agriculture; Stress; Water; Spectroscopy 1. Introduction Mediterranean areas of southern Europe and Aus- tralia are suitable for the production of high-quality bread-making wheat (Triticum aestivum L.), but to achieve a more consistent quality end product neces- sitates the simultaneous consideration of a large num- ber of quality traits that are evaluated in several different growing environments. The established mar- ket adjustments for wheat are based on protein content and test weight, with premiums commonly paid for exceeding the baseline levels, and penalties imposed for falling below them. Efficient use of N fertilizer is important for economical wheat production; it is also Field Crops Research 89 (2004) 153–163 Abbreviations: DSS, decision support system; FLN, flag leaf total N concentration; FLW, flag leaf water concentration * Corresponding author. Tel.: þ972-8-9928654; fax: þ972-8-9926485. E-mail address: bonfi[email protected] (D.J. Bonfil). 0378-4290/$ – see front matter # 2004 Elsevier B.V. All rights reserved. doi:10.1016/j.fcr.2004.01.017

Welcome message from author
This document is posted to help you gain knowledge. Please leave a comment to let me know what you think about it! Share it to your friends and learn new things together.
Transcript

Decision support system for improving wheat grain qualityin the Mediterranean area of Israel
David J. Bonfila,*, A. Karnielib, M. Razb, I. Mufradia, S. Asidoa,H. Egozic, A. Hoffmanc, Z. Schmilovitchc
aField Crops and Natural Resources Department, Agricultural Research Organization, Gilat Research Center, 85280 MP Negev 2, IsraelbThe Remote Sensing Laboratory, Jacob Blaustein Institute for Desert Research, Ben Gurion University of the Negev,
Sede-Boker Campus 84990, IsraelcAgricultural Engineering Institute, Agricultural Research Organization, Volcani Center, P.O. Box 6, Bet Dagan 50250, Israel
Received 30 July 2003; received in revised form 20 January 2004; accepted 30 January 2004
Abstract
The yield of dryland wheat in semi-arid and arid areas is limited by rainfall. Nitrogen application and rainfall distribution
determine biomass production, soil water depletion, and grain quality. A precise base level of nitrogen fertilization is applied
according to the annual rainfall, but in case of more rain, the higher biomass production would dilute the nitrogen and a low quality
wheat would be harvested. On the other hand, under drought conditions, harvesting for hay or silage provides a greater income
than leaving the crop for grain production. Our objective was to establish a quick and simplified decision support system (DSS) for
decision making at heading. It was found that, at heading, flag leaf water concentration (FLW) and flag leaf total N concentration
(FLN) data can be used to support agronomic decision making. In particular, these data can assist a decision to harvest early for hay
or silage, since water stress exists and the test weight is expected to decline. In other cases these data can help to forecast the need
for late nitrogen application to ensure sufficient protein levels. Our results show that the proposed DSS correctly forecasts wheat
grain quality, test weight and protein content, in more than 80% of the 344 experimental plots, by monitoring flag leaves at
heading. Therefore, application of the suggested simplified DSS would reduce the harvesting of shriveled grains, on the one hand,
and would lead to improved grain protein, on the other hand, thus ensuring high-quality production.
# 2004 Elsevier B.V. All rights reserved.
Keywords: Crop monitoring; Heading; Nitrogen; Precision agriculture; Stress; Water; Spectroscopy
1. Introduction
Mediterranean areas of southern Europe and Aus-
tralia are suitable for the production of high-quality
bread-making wheat (Triticum aestivum L.), but to
achieve a more consistent quality end product neces-
sitates the simultaneous consideration of a large num-
ber of quality traits that are evaluated in several
different growing environments. The established mar-
ket adjustments for wheat are based on protein content
and test weight, with premiums commonly paid for
exceeding the baseline levels, and penalties imposed
for falling below them. Efficient use of N fertilizer is
important for economical wheat production; it is also
Field Crops Research 89 (2004) 153–163
Abbreviations: DSS, decision support system; FLN, flag leaf
total N concentration; FLW, flag leaf water concentration* Corresponding author. Tel.: þ972-8-9928654;
fax: þ972-8-9926485.
E-mail address: [email protected] (D.J. Bonfil).
0378-4290/$ – see front matter # 2004 Elsevier B.V. All rights reserved.
doi:10.1016/j.fcr.2004.01.017
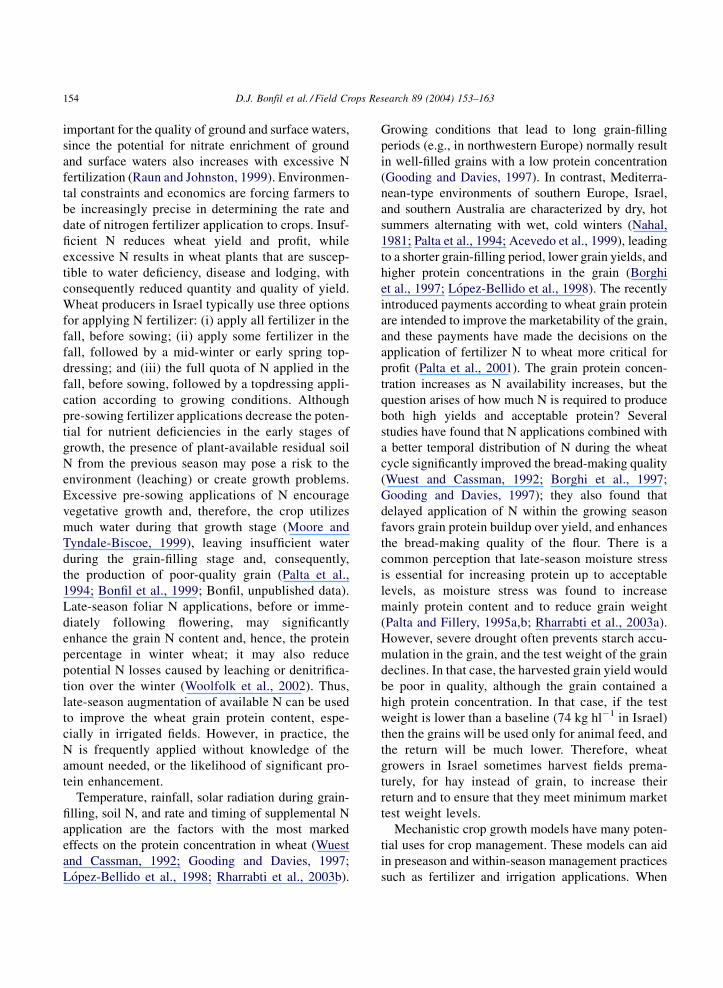
important for the quality of ground and surface waters,
since the potential for nitrate enrichment of ground
and surface waters also increases with excessive N
fertilization (Raun and Johnston, 1999). Environmen-
tal constraints and economics are forcing farmers to
be increasingly precise in determining the rate and
date of nitrogen fertilizer application to crops. Insuf-
ficient N reduces wheat yield and profit, while
excessive N results in wheat plants that are suscep-
tible to water deficiency, disease and lodging, with
consequently reduced quantity and quality of yield.
Wheat producers in Israel typically use three options
for applying N fertilizer: (i) apply all fertilizer in the
fall, before sowing; (ii) apply some fertilizer in the
fall, followed by a mid-winter or early spring top-
dressing; and (iii) the full quota of N applied in the
fall, before sowing, followed by a topdressing appli-
cation according to growing conditions. Although
pre-sowing fertilizer applications decrease the poten-
tial for nutrient deficiencies in the early stages of
growth, the presence of plant-available residual soil
N from the previous season may pose a risk to the
environment (leaching) or create growth problems.
Excessive pre-sowing applications of N encourage
vegetative growth and, therefore, the crop utilizes
much water during that growth stage (Moore and
Tyndale-Biscoe, 1999), leaving insufficient water
during the grain-filling stage and, consequently,
the production of poor-quality grain (Palta et al.,
1994; Bonfil et al., 1999; Bonfil, unpublished data).
Late-season foliar N applications, before or imme-
diately following flowering, may significantly
enhance the grain N content and, hence, the protein
percentage in winter wheat; it may also reduce
potential N losses caused by leaching or denitrifica-
tion over the winter (Woolfolk et al., 2002). Thus,
late-season augmentation of available N can be used
to improve the wheat grain protein content, espe-
cially in irrigated fields. However, in practice, the
N is frequently applied without knowledge of the
amount needed, or the likelihood of significant pro-
tein enhancement.
Temperature, rainfall, solar radiation during grain-
filling, soil N, and rate and timing of supplemental N
application are the factors with the most marked
effects on the protein concentration in wheat (Wuest
and Cassman, 1992; Gooding and Davies, 1997;
Lopez-Bellido et al., 1998; Rharrabti et al., 2003b).
Growing conditions that lead to long grain-filling
periods (e.g., in northwestern Europe) normally result
in well-filled grains with a low protein concentration
(Gooding and Davies, 1997). In contrast, Mediterra-
nean-type environments of southern Europe, Israel,
and southern Australia are characterized by dry, hot
summers alternating with wet, cold winters (Nahal,
1981; Palta et al., 1994; Acevedo et al., 1999), leading
to a shorter grain-filling period, lower grain yields, and
higher protein concentrations in the grain (Borghi
et al., 1997; Lopez-Bellido et al., 1998). The recently
introduced payments according to wheat grain protein
are intended to improve the marketability of the grain,
and these payments have made the decisions on the
application of fertilizer N to wheat more critical for
profit (Palta et al., 2001). The grain protein concen-
tration increases as N availability increases, but the
question arises of how much N is required to produce
both high yields and acceptable protein? Several
studies have found that N applications combined with
a better temporal distribution of N during the wheat
cycle significantly improved the bread-making quality
(Wuest and Cassman, 1992; Borghi et al., 1997;
Gooding and Davies, 1997); they also found that
delayed application of N within the growing season
favors grain protein buildup over yield, and enhances
the bread-making quality of the flour. There is a
common perception that late-season moisture stress
is essential for increasing protein up to acceptable
levels, as moisture stress was found to increase
mainly protein content and to reduce grain weight
(Palta and Fillery, 1995a,b; Rharrabti et al., 2003a).
However, severe drought often prevents starch accu-
mulation in the grain, and the test weight of the grain
declines. In that case, the harvested grain yield would
be poor in quality, although the grain contained a
high protein concentration. In that case, if the test
weight is lower than a baseline (74 kg hl�1 in Israel)
then the grains will be used only for animal feed, and
the return will be much lower. Therefore, wheat
growers in Israel sometimes harvest fields prema-
turely, for hay instead of grain, to increase their
return and to ensure that they meet minimum market
test weight levels.
Mechanistic crop growth models have many poten-
tial uses for crop management. These models can aid
in preseason and within-season management practices
such as fertilizer and irrigation applications. When
154 D.J. Bonfil et al. / Field Crops Research 89 (2004) 153–163

making these management decisions, maximizing the
yield and net return relative to inputs and production
costs is one of the fundamental goals. Crop growth
modeling techniques have been used to investigate the
performance of a wheat crop over ranges of weather
conditions, nitrogen application rates and soil types.
Models of response to applied N can be useful for
deriving improved N recommendations, and computer
simulations have become powerful tools for investi-
gating crop dynamics and solving practical problems.
However, the input requirements for these models
include many weather and soil conditions, plant char-
acteristics, and crop management parameters (Sinclair
and Amir, 1992; Jamieson and Semenov, 2000; Hunt
et al., 2001). The complex data handling and para-
meterization of those models discourage their use in
less monitored fields. Therefore, several indicators
have been suggested for determining the N status of
the crop. They include: the nitrate content of the stem
base extracts (Papastyliano and Puckridge, 1981;
Scaife and Stevens, 1983; Justes et al., 1997; Fox
et al., 2001); leaf color charts (LCC), leaf reflectance
(or transmittance) and crop reflectance (Raun et al.,
2002; Yang et al., 2003); and the chlorophyll content
of leaves (Yadava, 1986; Fox et al., 2001). These
methods require several crop measurements. Spectro-
scopy, the process of acquiring information about
objects from remote platforms such as ground-based
booms, aircraft, or satellites, is a potentially important
source of the data needed for decision-making (Sha-
nahan et al., 2001).
Late-season N application has increased the grain
protein content in many studies. In recent years,
intensive management studies for winter wheat have
shown that split topdressings of fertilizer N after
spring green-up may improve N efficiency and
increase yields. The chlorophyll meter and LCC based
N management in rice suggest that N can be saved
with no yield loss, by appropriately revising the
blanket fertilizer recommendations by means of a
simple and easily used tool (Singh et al., 2002). Plant
N concentration was predicted by measurements of
the reflectance in the red and green regions of the
spectrum, and grain yield was estimated from the
reflectance in the NIR region, with the specific wave-
lengths of importance changing with growth stage
(Osborne et al., 2002). However, measurement of
the flag leaf N at heading has not been consistently
successful in predicting protein content, or its increase
through the late-season application of N, on a com-
mercial scale.
Past research in this area has focused primarily on
N stress in crops. Other stresses and their interactions
have not been fully evaluated, although water short-
age is much more important than N content, espe-
cially in the Mediterranean region (Papastyliano and
Puckridge, 1981; Borghi et al., 1997). Thus, strate-
gies that allow decisions and expenditure on nitrogen
fertilizer applications to be delayed until later in the
season, when climatic conditions and yield potential
are clearer, are essential for the management of
grain protein in a Mediterranean-type environment
(Palta et al., 2001). Deciding on the best end use
for the crop—grain versus hay—and on the amount
of N fertilizer for the March application at heading
are more subjective, but may be more important.
The present paper discusses the development of a
novel DSS to help wheat producers in Mediterranean
areas make more informed decisions about crop
management.
2. Materials and methods
2.1. Wheat growth
The research was based on the same experimental
plots and leaves that were listed previously (Bonfil
et al., 2004). Spring wheat (T. aestivum) cv. Galil was
sown at the Gilat Research Center for all experiments,
using two fields—Gate and fixed (Fixed is a permanent
long-term experiment field with fixed sub-plots and
treatments (Bonfil et al., 1999)). In both fields, wheat
was grown as rainfed (Dry) in half of the field and
under supplemental irrigation (Irr) in the other half.
The fixed study examined wheat growth under various
crop management systems such as different soil tillage
and mulching regimes, crop rotations and fertilization
with N (0, 50, 100 or 150 kg ha�1) and phosphorus
(0 or 10 kg ha�1). The fertilization treatments were
established 27 years ago as base applications. During
the three seasons of this study (2000–2002), four rates
of N application were maintained, but were modified
from the original scheme to applications of 0 þ 0,
50 þ 0, 50 þ 50 and 100 þ 50 kg ha�1 as base and
topdressing at heading, respectively. The applied N
D.J. Bonfil et al. / Field Crops Research 89 (2004) 153–163 155

was incorporated fully into the soil by either irrigation
(in Irr plots) or natural rainfall (in Dry plots). In 2000
and 2002, solid urea was used for topdressing at
heading, whereas in 2001 the rainfed plots (Dry)
received only 24 kg N ha�1 as liquid urea and the
irrigated plot received only 42 kg N ha�1 as liquid
urea and ammonium nitrate (1:1). In 2002, another
experiment was established in the Gate experimental
field. This experiment includes six N applications prior
to heading, with N at 0 þ 0, 0 þ 50, 50 þ 0, 50 þ 50,
100 þ 0, and 100 þ 0 kg ha�1 for base/early top dres-
sing, respectively. Several sub-plots in all treatments
received an additional 50 kg ha�1 N (solid urea)
at heading. In 2002, there was no rainfall for more
than 30 days after heading, therefore rainfed plots in
both fields did not receive the late N application. A
total of 344 sub-plots were analyzed from the two
experiments in this study. Grain yield was determined
from 30 or 51 m2 area, harvested with a combine. Grain
test weight was measured on a 250 g sample and
expressed as kg hl�1. Grain protein content was deter-
mined by the Kjeldhal method; the percentage of
protein was calculated after multiplying the Kjeldhal
nitrogen by 5.7 and was expressed on a 10% water
content basis.
In addition to yield quantity and quality data, this
study used measurements of flag leaf water (FLW) and
flag leaf N (FLN) contents during heading. The devel-
opment of the decision support system was based on
the ‘‘wet determination’’ of flag leaf water content and
the total N (Kjeldhal) concentration, and on the cali-
bration of the reflectance within the NIR region
(1100–2498 nm) as measured with the Foss NIR
System model 5000 (Bonfil et al., 2004). Descriptive
statistics and ANOVA were applied by means of the
SAS statistical package.
2.2. Decision support system (DSS)—concept
Annual precipitation in the region of the study
varied between 200 and 450 mm. In addition to the
rainfall quantity variation, the starting point of the
rainy season varies from year to year, but sowing is
usually around mid-November. Since growth condi-
tions could negatively affect wheat production if they
result in later emergence, the starting point is very
important. In the northern Negev, the study region,
base nitrogen fertilization can be commercially
applied without danger of nitrogen leaching, but larger
amounts of nitrogen application encourage vegetative
growth, so that the crop utilizes much more water
during that growth stage. The main result of this is
insufficient water during the grain-filling stage and,
consequently, production of poor-quality grain. There-
fore, smaller amounts of nitrogen than would be
needed in heavy-rainfall seasons should be used for
base application. The same logic discourages the use
of topdressing in the period from tillering to elonga-
tion. Nevertheless, in case of more rain, higher bio-
mass production would dilute the nitrogen within the
plant, and a low quality of grain, containing low
protein levels, would be harvested. In such a situation
a late topdressing could be applied to ensure suitable
protein content in the grain. In the present study, after
booting-heading the rain amount varied from zero to
more than 100 mm, and in many years this is a
significant amount of rain that could be the carrier
for a late nitrogen application.
At heading the main questions that arise are:
‘‘should N be applied?’’ and ‘‘would hay/silage be
a better end use, since under water stress harvesting for
hay or silage could increase income?’’. A rapid and
simplified DSS is needed for such decision-making,
without any need for a within-field reference.
The hypothesis of the present DSS is that the plant
itself would be the best source of the information that
is needed to support decisions. The flag leaf was taken
as a model for this information, since at this growth
stage reflectance data could be collected by spectro-
scopic techniques. Furthermore, this is a simple fixed
sampling technique that could be repeated by every
farmer.
The proposed DSS requires only three input para-
meters: (1) expected rain in the next several (3–5)
days, (2) FLW and (3) FLN. The local meteorolo-
gical service as well as the various available fore-
casting models could be used by farmers to forecast
rain. Reflectance spectra analysis could represent
FLW and FLN (Bonfil et al., 2004), and were con-
sidered suitable for the DSS as well as wet proce-
dures for FLW and FLN analysis. The DSS compiles
data and provides one of three recommendations to
farmers: harvest hay (or silage); leave for grain
harvest; or leave for grain harvest but apply nitrogen
as close as possible prior to the expected rain, as
listed below.
156 D.J. Bonfil et al. / Field Crops Research 89 (2004) 153–163

3. Results
3.1. Wheat growth
Precipitation conditions varied from year to year
and from one field to another (Table 1); no rain fell
during the months June–September. The driest con-
dition occurred in the Fixed-rainfed field in 2001, with
222 mm rainfall available to the crop, and the grain-
filling period being dry. The Gate-irrigate field (2002)
reached the best condition: about 488 mm were avail-
able to the crop, and the plants received 210 mm of it
during the grain-filling period. All seasons had similar
temperature, humidity, and radiation without any
remarkable or unusual events. Since supplemental
irrigation (which varied between 95 and 210 mm,
depending on the rainfall) was used, there was no
problem in applying any N fertilizer formulation, solid
or liquid, at heading in the irrigated fields. However,
the late application of N top dressing to rainfed plots
was problematic: in 2001, in the absence of carrier
rain, these plots received smaller amounts of in the
form of a liquid for foliar application. This fertiliza-
tion caused some scorching damage to the flag leaf.
Therefore, in the following season, the topdressing
was limited to solid urea application. In 2002, the only
rain that fell after heading occurred about one month
after it, therefore the late N application could not be
done in the rainfed plots.
Variations in growing conditions resulted in differ-
ences in grain yield and quality (Table 2). Grain yield
varied from 440 to 7040 kg ha�1, which represents
almost the whole yield potential spectrum of the
growing region. The test weight of most samples
Table 1
Rain and irrigation (mm) accumulation in the experimental fields
Year Field October November December January February March April May Heada Total
2000 Fixed-Irr 2.4 4.1 83.8 118.9 7.7 30.0 70.6 0.0 95 318
2001 Fixed-Dry 20.9 1.1 77.1 72.7 58.0 4.2 4.6 5.8 10 244
2001 Fixed-Irr 20.9 56.1 107.1 72.7 73.0 54.2 4.6 5.8 120 394
2002 Fixed-Dry 5.0 15.0 57.1 98.1 25.1 35.4 7.6 0.0 40 243
2002 Fixed-Irr 5.0 45.0 57.1 98.1 65.1 120.4 7.6 0.0 130 398
2002 Gate-Dry 5.0 75.0 57.1 108.1 60.1 35.4 7.6 0.0 43 348
2002 Gate-Irr 5.0 75.0 57.1 108.1 100.1 135.4 7.6 0.0 210 488
a Rain and irrigation amounts that accumulated after heading and were relevant for late N application. In dry fields of 2002 the 40 mm of
rain fell 30 days after heading, therefore could not be used for topdressing.
Table 2
Grain yield and yield quality of the 344 sub-plots from different experiment fields that were used for DSS development
Year Field Late N Number Grain yield (kg ha�1) Test weight (kg hl�1) Protein content (%)
Mean S.E. Range Mean S.E. Range Mean S.E. Range
2000 Fixed-Irr No 37 1581 82.8 1950 82.4 0.11 2.5 13.8 0.13 3.1
2000 Fixed-Irr Yes 32 1410 92.4 1810 82.1 0.09 1.8 14.3 0.14 3.6
2001 Fixed-Dry No 36 1416 76.4 1940 73.4 0.65 14.6 14.0 0.37 8.0
2001 Fixed-Dry Yes 36 1345 80.3 1670 70.6 0.47 10.4 16.2 0.24 6.3
2001 Fixed-Irr No 39 1986 97.2 2690 80.9 0.17 4.4 10.5 0.13 3.6
2001 Fixed-Irr Yes 32 2271 118.3 2180 80.3 0.21 5.0 11.0 0.15 3.8
2002 Fixed-Dry No 48 2398 145.5 4520 82.1 0.22 5.4 10.3 0.24 5.5
2002 Fixed-Irr No 12 2676 294.7 3280 83.3 0.42 4.6 8.7 0.12 1.4
2002 Fixed-Irr Yes 12 3332 236.2 2430 83.0 0.32 3.0 10.2 0.23 2.4
2002 Gate-Dry No 10 3047 365.3 3370 79.4 0.69 5.7 12.0 0.33 2.9
2002 Gate-Dry Yes 10 3566 340.3 3290 79.0 0.55 5.8 12.3 0.40 4.2
2002 Gate-Irr No 14 5884 159.8 1810 82.5 0.16 2.1 10.0 0.15 1.9
2002 Gate-Irr Yes 26 5650 137.6 2960 82.0 0.15 2.7 10.7 0.12 3.2
D.J. Bonfil et al. / Field Crops Research 89 (2004) 153–163 157

was above 79 kg hl�1 (Fig. 2), but lower test weight of
about 63.9 kg hl�1, shows that some plots were water
deficient during the grain-filling, resulting in the pro-
duction of shriveled grains. Grain protein content
varied widely from 7.7 to 19.3%. These results show
that grain yields and quality can be greatly affected by
the variability of the weather in the Mediterranean
climate and by crop management. Experimental treat-
ment factors, crop management, and fertilization all
significantly affected grain yield and quality para-
meters in each experimental field. Since the DSS
development was based on only 344 out of 1106
sampled plots, specific treatment effects are not shown
here. However, it can be seen (Table 2) that N applica-
tion at heading could increase the yield in some cases
(Fixed-irrigated and Gate-dry 2002 fields), that it
usually had no effect on test weight, and that it
increased the grain protein content. This improvement
in protein content was limited to increases of up to 1%
in four fields, and two fields showed a greater effect.
However, in one of these two (the 2001 Fixed-dry
field) this increase must be related to the lower test
weight achieved. Flag leaf water content and N con-
centration at heading also show wide variations among
these 344 plots (Bonfil et al., 2004).
3.2. Development of decision support system
The DSS procedure was built as a hierarchical tree
of conditions (Fig. 1). The first answer needed, is
whether the field would receive rain and/or irrigation
(at least 30 mm) soon. Thereafter, FLW and FLN
values would lead to one of the three suggestions.
The leaf values that the model uses as limits differ for
each precipitation condition, and the model results are
only qualitative answers. The efficiency of late N
application is low and there is a limit to the amount
that can be applied; it is always between 30 and
50 kg N ha�1.
After FLW and FLN determination, the DSS pro-
vided a recommendation for each plot. Then, part of
the plots received a topdressing of N, application,
according to the experiment design, and irrespective
of the DSS suggestion. The relation between the
DSS suggestions (that were based on data from the
2000 and 2001 seasons) and grain quality is shown in
Fig. 2. There are three main quality groups: (1) high
quality with test weight above 79 kg hl�1 and protein
content above 11.5%; (2) low quality with test weight
under 79 kg hl�1, and especially where it is under
74 kg hl�1; (3) low quality with protein content under
No Yes
Is flag leaf nitrogen content less than Xn1%?
No
No No
No
Yes
Yes
Yes
Yes
Apply nitrogen (30-50 kg ha-1) as soon as possible prior to rain Leave for grain harvest
Is flag leaf water content more than Xw1%?
Is flag leaf water content more than Xw2%?
Harvest hay/silage
Is flag leaf nitrogen content less than Xn2%?
Will field receive at least Xr mm soon?
Fig. 1. DSS model: determining the requirement for late nitrogen fertilization and end use for wheat at harvest. X represents the coefficient
of: r, rain and irrigation; w, FLW; n, FLN.
158 D.J. Bonfil et al. / Field Crops Research 89 (2004) 153–163

11.5%, and especially where it is under 10%. The
premium or penalty for wheat grain marketing in
Israel reflects this classification. In Fig. 2, it is obvious
that many sub-plots needed the late nitrogen applica-
tion. Indeed, the late application increased the grain
protein content. However, since most plots were under
the conditions of a long-term fixed experiment, there
were some with soil nitrogen content was so low that
although late fertilization was applied the grain still
had a low protein content. According to the DSS rules
none of the irrigated plots were recommended for
early harvest for hay, and indeed all plots could fill
grains (test weight above 79 kg hl�1). Since another
rule ensured that none of the dry plots was recom-
mended to receive additional nitrogen, many plots that
could fill grains showed protein deficiency. However,
although they produced adequate test weight, many
plots were recommended to be harvested earlier for
hay.
Grain yield is the highest economic priority for
farmers, and harvesting for hay must be restricted
to fields that suffer drought and cannot fill grains.
The rain distribution (Table 1) could be one reason for
the wrong DSS recommendations. Since the fields
received at least 40 mm of rain after heading in the
2002 season, all the plants could fill grain. However,
since this rain occurred only one month later than
heading, the DSS used the option that no rain was
forecast, therefore wrong decisions were made. When
the DSS was run after the precipitation expected for
the 2002 dry field was changed from false to true, this
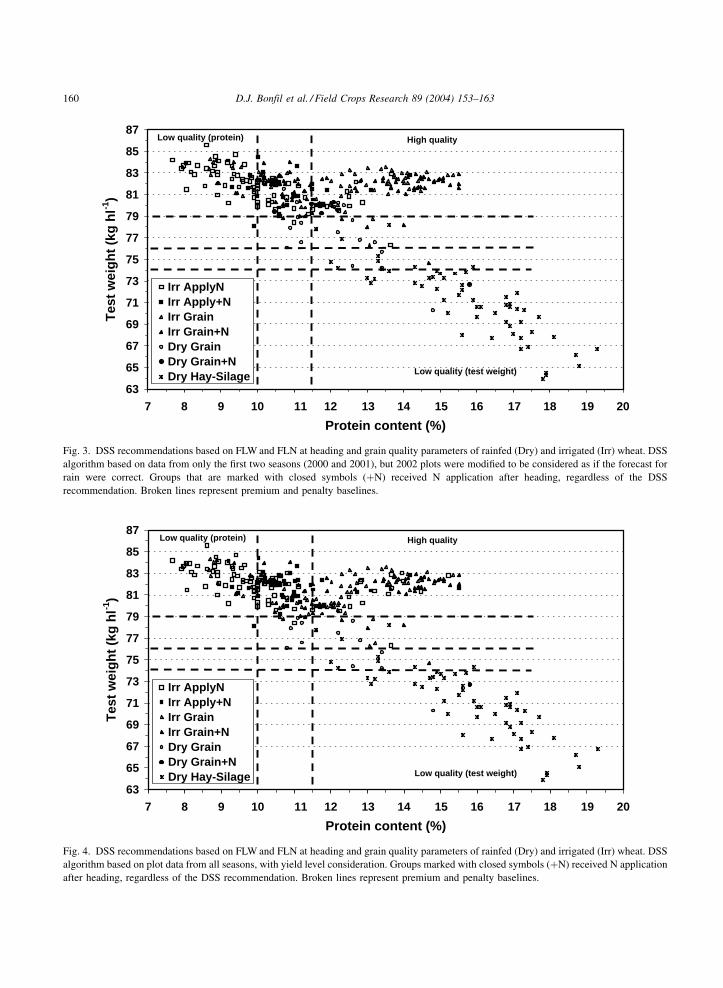
problem was solved (as shown in Fig. 3). Fig. 3 shows
that this modification indeed restricted hay harvest to
driest fields. However, the results in Fig. 3 raised a
protein problem: there were too many plots that were
recommended to be left for the grain harvest, but these
plots were N deficient and yielded grain containing
less than 11.5% protein. As the DSS must cover the
full ranges of yield quantity and quality, the DSS
procedure (Fig. 1) and wheat results (Figs. 2 and 3)
ignore grain yield quantity. Better recommendations
were achieved after the procedure had been modified
according to yield level (Fig. 4). It is difficult to
forecast the expected yield precisely, even at heading,
but it is much simpler to judge whether to expect a
high or a medium–low yield. Hence, the modified
procedure needs as input a true/false answer to the
question: is the grain yield expected to be higher than
63
65
67
69
71
73
75
77
79
81
83
85
87
7 8 9 10 11 12 13 14 15 16 17 18 19 20
Protein content (%)
Tes
t w
eig
ht
(kg
hl-1
)
Irr ApplyNIrr Apply+NIrr GrainIrr Grain+NDry GrainDry Grain+NDry Hay-Silage
Low quality (protein)
Low quality (test weight)
High quality
Fig. 2. DSS recommendations based on FLW and FLN at heading and grain quality parameters of rainfed (Dry) and irrigated (Irr) wheat. DSS
algorithm based on data from only the two seasons 2000 and 2001. Groups marked with close symbols (þN) received N application after
heading, regardless of the DSS recommendation. Broken lines represent premium and penalty baselines.
D.J. Bonfil et al. / Field Crops Research 89 (2004) 153–163 159
63
65
67
69
71
73
75
77
79
81
83
85
87
7 8 9 10 11 12 13 14 15 16 17 18 19 20
Protein content (%)
Tes
t w
eig
ht
(kg
hl-1
)
Irr ApplyNIrr Apply+NIrr GrainIrr Grain+NDry GrainDry Grain+NDry Hay-Silage
Low quality (protein)
Low quality (test weight)
High quality
Fig. 3. DSS recommendations based on FLW and FLN at heading and grain quality parameters of rainfed (Dry) and irrigated (Irr) wheat. DSS
algorithm based on data from only the first two seasons (2000 and 2001), but 2002 plots were modified to be considered as if the forecast for
rain were correct. Groups that are marked with closed symbols (þN) received N application after heading, regardless of the DSS
recommendation. Broken lines represent premium and penalty baselines.
63
65
67
69
71
73
75
77
79
81
83
85
87
7 8 9 10 11 12 13 14 15 16 17 18 19 20
Protein content (%)
Tes
t w
eig
ht
(kg
hl-1
)
Irr ApplyNIrr Apply+NIrr GrainIrr Grain+NDry GrainDry Grain+NDry Hay-Silage
Low quality (protein)
Low quality (test weight)
High quality
Fig. 4. DSS recommendations based on FLW and FLN at heading and grain quality parameters of rainfed (Dry) and irrigated (Irr) wheat. DSS
algorithm based on plot data from all seasons, with yield level consideration. Groups marked with closed symbols (þN) received N application
after heading, regardless of the DSS recommendation. Broken lines represent premium and penalty baselines.
160 D.J. Bonfil et al. / Field Crops Research 89 (2004) 153–163

5000 kg ha�1? For each yield level, the DSS proce-
dure is the same as in the first version (Fig. 1), but
FLW and FLN limit values are different for each
condition.
3.3. Accuracy of the decision support system
The DSS recommendations and grain quality
(Fig. 4) showed clear differentiation among the three
main groups: high-quality grains, low-test weight
quality, and low protein quality. To test the accuracy
of the DSS recommendations for each decision, true/
false scores were assigned according to the following
three guiding principles. Hay harvest was a correct
decision if the harvested grains had a test weight less
than 75 kg hl�1, and incorrect above this limit. This
baseline (75 kg hl�1) is a little higher than for grain
(74 kg hl�1), as profit declines steeply at 74 kg hl�1,
and we would like to minimize harvest of grain from
these questionable fields as much as possible. Harvest-
ing the grain was a correct decision if the harvested
grains had a test weight above 74 kg hl�1, and their
protein content was above 11%. Leaving the field for
subsequent grain harvest but applying N fertilization
at heading was the correct decision if the harvested
grains had a test weight above 74 kg hl�1 and their
protein content was under 11.5% (or under 11.75% for
plots that did receive a late N application, since they
had increased protein content). Use of FLW and FLN
data based on wet determination results, resulted in
279 correct and 65 incorrect decisions (Table 3).
Almost the same results were achieved when DSS
was based on reflectance data: 285 correct and 59
incorrect decisions. Hence, irrespective of the FLW
and FLN determination method, more than 80% of the
recommendations produced by the DSS were correct.
4. Discussion
The DSS procedure was able to distinguish between
plots at heading and to relate their differences to
expected yield quality. This procedure requires just
a few input parameters. This DSS has a marked
advantage over any crop growth model that needs
as input many parameters that are not available for
most commercial fields. The FLW and FLN must be
determined for each field. Usual laboratory procedures
can supply these data within 48 h, and advanced
equipment can do so in less than 1 h. The possibility
of obtaining these data from reflectance spectra opens
the possibility that in the future FLW and FLN data
would be obtained by remote sensing means such as
satellite or aerial hyperspectral imaging, without the
need for field sampling. This would yield data relevant
to a wide area very quickly.
Flag leaf N content was reported to provide a
reasonable indication of the extent to which late-
season N could increase grain protein. This DSS deals
with the complicated water-nitrogen interaction that
Table 3
DSS recommendations based on FLW and FLN estimated directly or by flag leaf NIR reflectance, accuracy for each decisiona
DSS recommendation Late N application Wet estimation NIR estimation
True False True False
Harvest hay No 20 4 22 9
Yes 35 0 36 0
Harvest grain, rainfed wheat No 9 3 5 0
Yes 0 1 0 0
Harvest grain, irrigated wheat No 53 19 61 25
Yes 49 15 49 11
Harvest grain but apply N at heading No 73 15 68 6
Yes 40 8 44 8
Total 279 65 285 59
a True or false scores have been assigned according to guiding principles listed in the text.
D.J. Bonfil et al. / Field Crops Research 89 (2004) 153–163 161

affects crop growth and yield production. This inter-
action leads to different interpretations of FLN, so that
a given FLN can lead to any of the three possible DSS
recommendations. Correct data interpretations enable
correct decision making for hay harvesting, to our
knowledge, no tool that assists this decision is avail-
able yet. Therefore, among the many fields that are
harvested for hay in dry seasons are fields that could
produce good grain yields, which would provide a
higher income than hay. At heading, the farmer
receives the DSS recommendation based on FLW
and FLW for all four combinations of precipitation
and yield forecast. Therefore, farmers can delay their
decisions and finalize them according to real condi-
tions as they change for each field. This delay would
increase profitability since accurate data on heat stress,
rain, foliar disease, etc. would be involved in decision
making.
The DSS could be improved, and some important
points must be considered in the next development
stage. First, the DSS development was based on only
one cultivar growing in experimental plots, and, since
the reflectance from leaves of different cultivars may
differ, the ability to use reflectance information must
be tested. Moreover, different cultivars differ in many
parameters, such as phenology, grain-filling rate, FLN,
late N absorption and translocation to grain, that could
necessitate the designation of specific FLN and FLW
limits for each cultivar. Our hypothesis is that all
cultivars can be classified into two or three groups
according to these parameters, and this must be proved
by further work. Another point to be checked is the
effect of atmospheric interference on the option of
obtaining FLN and FLW data by spectroscopic meth-
ods. The most important work that should be done is
validation in commercial fields. It is planned to do this
in the coming growth seasons. However, since the
development of the DSS procedure was based on a
very wide range of grain yield and grain quality data,
that included yield data for regular fields, it is expected
that accuracy would be high for commercial fields as
well. At least, the suggested DSS would be suitable for
about 50% of Israeli fields that were sown with cv. Galil,
the cultivar that was used for the DSS development.
The DSS was developed for spring wheat grown
under Mediterranean-type environments of the north-
ern Negev in Israel. In about 1 out of 4 years, a
sufficient amount of rain falls after heading to enable
a late N application in dryland fields, although the total
rain quantity is low. Hence, using DSS is not restricted
to fields that receive supplemental irrigation. More-
over, in regions where rainfall occurs more frequently
during grain-filling, the DSS can be used to determine
the possibility of late fertilization in more seasons.
This DSS can be used for dryland fields and soils with
low water retention capacity; it is thus suited for
considering water shortage situations, where decision
making would be focused mainly on early harvesting
for hay instead late fertilization. These decision com-
binations make the DSS powerful and useful for
growth conditions in many regions. DSS adaptation
and tuning to other regions would be affected by
several factors, including cultivars, soil types and field
management. All these data would affect the FLN and
FLW level used by the DSS, which can be useful in
many regions with Mediterranean climates.
5. Conclusions
The ability to monitor changes in wheat plant
growth conditions according to changes in the FLW
and FLN, directly or by means of near-infrared reflec-
tance, could lead to a considerable improvement in
crop management. In the present study we demon-
strated that FLW and FLN data can be used to support
agronomic decision making. In particular, these data
can assist the decision to harvest early for hay or
silage, when water stress is detected and the test
weight is expected to decline. In other cases, these
data could help forecast the need for late nitrogen
application, in order to ensure sufficient protein levels.
This DSS provided correct forecasts of grain quality
parameters (test weight and protein) for more than
80% of 344 plots, by testing just the flag leaves at
heading. Therefore, application of the suggested sim-
plified DSS would reduce the harvesting of shriveled
grains, on the one hand, and would lead to improved
grain protein, on the other hand, thus ensuring high-
quality production.
Acknowledgements
This research was financed in part by the Chief
Scientist of the Israel Ministry of Agriculture.
162 D.J. Bonfil et al. / Field Crops Research 89 (2004) 153–163

References
Acevedo, E., Silva, P., Silva, H., Solar, B., 1999. Wheat production
in Mediterranean environments. In: Satorre, E.H., Slafer, G.A.
(Eds.), Wheat: Ecology and Physiology of Yield Determination.
Food Products Press, New York, pp. 295–331.
Bonfil, D.J., Mufradi, I., Klitman, S., Asido, S., 1999. Wheat grain
yield and soil profile water distribution in a no-till arid
environment. Agron. J. 91, 368–373.
Bonfil, D.J., Karnieli, A., Raz, M., Mufradi, I., Asido, S., Egozi, H.,
Hoffman, A., Schmilovitch, Z., 2004. Rapid assessing water
and nitrogen status in wheat flag leaves. J. Near Infrared
Spectrosc., submitted for publication.
Borghi, B., Corbellini, M., Palumbo, C., DiFonzo, N., Perenzin, M.,
1997. Effects of Mediterranean climate on wheat bread-making
quality. Eur. J. Agron. 6, 145–154.
Fox, R.H., Piekielek, W.P., Macneal, K.E., 2001. Comparison of
late-season diagnostic tests for predicting nitrogen status of
corn. Agron. J. 93, 590–597.
Gooding, M.J., Davies, W.P., 1997. Wheat Production and
Utilization. CAB International, Wallingford, UK.
Hunt, L.A., White, J.W., Hoogenboom, G., 2001. Agronomic data:
advances in documentation and protocols for exchange and use.
Agric. Syst. 70, 477–492.
Jamieson, P.D., Semenov, M.A., 2000. Modelling nitrogen uptake
and redistribution in wheat. Field Crops Res. 68, 21–29.
Justes, E., Jeuffroy, M.H., Mary, B., 1997. The nitrogen require-
ment of major agricultural crops: wheat, barley and durum
wheat. In: Lemaire, G. (Ed.), Diagnosis of the Nitrogen Status
in Crops. Springer-Verlag, Berlin, pp. 73–89.
Lopez-Bellido, L., Fuentes, M., Castillo, J.E., Lopez-Garrido, F.J.,
1998. Effects of tillage, crop rotation and nitrogen fertilization
on wheat-grain quality grown under rainfed Mediterranean
conditions. Field Crops Res. 57, 265–276.
Moore, G.A., Tyndale-Biscoe, J.P., 1999. Estimation of the impor-
tance of spatially variable nitrogen application and soil moisture
holding capacity to wheat production. Prec. Agric. 1, 27–38.
Nahal, I., 1981. The Mediterranean climate from a biological
viewpoint. In: Di Castri, F., Goodall, D.W., Specht, R.L. (Eds.),
Ecosystems of the World. Mediterranean-type Shrublands, vol.
11. Elsevier, Amsterdam, pp. 63–86.
Osborne, S.L., Schepers, J.S., Francis, D.D., Schlemmer, M.R., 2002.
Detection of phosphorus and nitrogen deficiencies in corn using
spectral radiance measurements. Agron. J. 94, 1215–1221.
Palta, J.A., Kobata, T., Turner, N.C., Fillerg, I.R., 1994.
Remobilization of carbon and nitrogen in wheat as influenced
by postanthesis water deficits. Crop Sci. 34, 118–124.
Palta, J.A., Fillery, I.R.P., 1995a. N application increases pre-
anthesis contribution of dry matter to grain yield in wheat
grown on a duplex soil. Aust. J. Agric. Res. 46, 507–518.
Palta, J.A., Fillery, I.R.P., 1995b. N application enhances
remobilization and reduces losses of pre-anthesis N in wheat
grown on a duplex soil. Aust. J. Agric. Res. 46, 519–531.
Palta, J.A., Bowden, J.W., Asseng, S., 2001. The impact of late
applications of nitrogen fertilizer on the yield and grain protein
content of wheat in the Mediterranean-type environment of
western Australia. In: Proceedings of the ASA Meeting
Symposium on Wheat Protein Enhancement with N Interven-
tion, Charlotte, NC.
Papastyliano, I., Puckridge, D.W., 1981. Nitrogen nutrition of
cereals in a short-term rotation. II. Stem nitrate as an indicator
of nitrogen availability. Aust. J. Agric. Res. 32, 713–723.
Raun, W., Johnston, G., 1999. Improving nitrogen use efficiency
for cereal production. Agron. J. 91, 357–363.
Raun, W.R., Solie, J.B., Johnson, G.V., Stone, M.L., Mullen,
R.W., Freeman, K.W., Thomason, W.E., Lukina, E.V., 2002.
Improving nitrogen use efficiency in cereal grain production
with optical sensing and variable rate application. Agron. J. 94,
815–820.
Rharrabti, Y., Royo, C., Villegas, D., Aparicio, N., Garcıa del
Moral, L.F., 2003a. Durum wheat quality in Mediterranean
environments. I. Quality expression under different zones,
latitudes and water regimes across Spain. Field Crops Res. 80,
123–131.
Rharrabti, Y., Villegas, D., Royo, C., Martos-Nunez, V., Garcıa del
Moral, L.F., 2003b. Durum wheat quality in Mediterranean
environments. II. Influence of climatic variables and rela-
tionships between quality parameters. Field Crops Res. 80,
133–140.
Scaife, A., Stevens, K.L., 1983. Monitoring sap nitrate in vegetable
crops: comparison of test strips with electrode methods, and
effects of time of day and leaf position. Commun. Soil Sci.
Plant Anal. 14, 761–771.
Shanahan, J.F., Schepers, J.S., Francis, D.D., Varvel, G.E.,
Wilhelm, W.W., Tringe, J.M., Schlemmer, M.R., Major, D.J.,
2001. Use of remote-sensing imagery to estimate corn grain
yield. Agron. J. 93, 583–589.
Sinclair, T.R., Amir, J., 1992. A model to assess nitrogen
limitations on the growth and yield of spring wheat. Field
Crops Res. 30, 63–78.
Singh, B., Singh, Y., Ladha, J.K., Bronson, K.F., Balasubramanian,
V., Singh, J., Khind, C.S., 2002. Chlorophyll meter and leaf
color chart based nitrogen management for rice and wheat in
northwestern India. Agron. J. 94, 821–829.
Woolfolk, C.W., Raun, W.R., Johnson, G.V., Thomason, W.E.,
Mullen, R.W., Wynn, K.J., Freeman, K.W., 2002. Influence of
late-season foliar nitrogen applications on yield and grain
nitrogen in winter wheat. Agron. J. 94, 429–434.
Wuest, S.B., Cassman, K.G., 1992. Fertilizer nitrogen use
efficiency of irrigated wheat. I. Uptake efficiency of preplant
versus late-season application. Agron. J. 84, 682–688.
Yadava, U., 1986. A rapid and nondestructive method to determine
chlorophyll in intact leaves. HortScience 21, 1449–1450.
Yang, W.H., Peng, S., Huang, J., Sanico, A.L., Buresh, R.J., Witt,
C., 2003. Using leaf color charts to estimate leaf nitrogen status
of rice. Agron. J. 95, 212–217.
D.J. Bonfil et al. / Field Crops Research 89 (2004) 153–163 163
Related Documents