& PPIC STATEWIDE SURVEY Californians Mark Baldassare Dean Bonner Sonja Petek Jui Shrestha in collaboration with S.D. Bechtel, Jr. Foundation and The San Francisco Foundation CONTENTS About the Survey 2 Press Release 3 Planning for the Future 6 Fiscal and Governance Reforms 15 Regional Map 24 Methodology 25 Questionnaire and Results 27 the future DECEMBER 2012

Welcome message from author
This document is posted to help you gain knowledge. Please leave a comment to let me know what you think about it! Share it to your friends and learn new things together.
Transcript
&
ppic statewide survey
Californians Mark Baldassare
Dean Bonner
Sonja Petek
Jui Shrestha
in collaboration with
S.D. Bechtel, Jr. Foundation and The San Francisco Foundation
CONTENTS
About the Survey 2
Press Release 3
Planning for the Future 6
Fiscal and Governance Reforms 15
Regional Map 24
Methodology 25
Questionnaire and Results 27
the future
D E C E M B E R 2 0 1 2

December 2012 Californians and the Future 2
ABOUT THE SURVEY
The PPIC Statewide Survey provides policymakers, the media, and the public with objective, advocacy-free information on the perceptions, opinions, and public policy preferences of California residents. This is the 130th PPIC Statewide Survey in a series that was inaugurated in April 1998 and has generated a database of responses from more than 274,000 Californians.
The current survey, Californians and the Future, is a special survey examining residents’ outlook on the future, including recent electoral reforms, potential fiscal, governance, and initiative reforms, the passage of Proposition 30, the state’s public higher education system, water policy, and elected officials’ handling of plans and policies for the state’s future. The survey is supported with funding from the S.D. Bechtel, Jr. Foundation, The San Francisco Foundation, The David and Susan Coulter Family Foundation, and the Walter S. Johnson Foundation.
This survey began the week after the presidential election, in a decidedly changed political and fiscal atmosphere. Voters had just passed a tax increase (Proposition 30, promoted by Governor Brown) and another measure that will likely increase the income taxes paid by multistate corporations (Proposition 39). It was the first general election that involved the “top two” candidate system and voting districts drawn by a citizens’ commission. And, importantly, voters ushered in a two-thirds majority for Democrats in the state assembly and state senate. How Democrats will use this new power remains to be seen. On the second day of interviewing, the state’s legislative analyst announced a much improved fiscal outlook for the state, thanks to the expected revenues from Proposition 30 and a recovering economy, but still projected a budget deficit of $1.9 billion for the next fiscal year.
This survey presents the responses of 2,001 adult residents throughout the state, interviewed in English or Spanish by landline or cell phone. It includes findings on these topics:
Planning for the future, including Californians’ future and current outlook; approval ratings of the governor and legislature overall and on their handling of plans and policies for the state’s future; how the passage of Proposition 30 affects residents’ budget outlook; perceptions of the state’s public higher education system and the importance of educating California’s future workforce; and perceptions of water supply and preferences for water policy.
Fiscal and governance reforms, including perceived effects of recent electoral reforms (the top-two primary system and independent redistricting); attitudes toward legislative reforms (part-time legislature, single-house legislature, larger legislature), spending reforms (state spending limit, increasing the rainy day fund, requiring new programs and tax reductions to identify a funding source); and fiscal reforms (two-year budget, simple legislative majority to pass state taxes, 55 percent majority to pass local special taxes); attitudes toward Proposition 13; support for expanding the tax base (split-roll property tax, assessing sales tax on services, increasing the vehicle license fee); and attitudes toward the citizens’ initiative process, including support for reforms.
Time trends and the extent to which Californians may differ in their perceptions, attitudes, and preferences based on political party affiliation, likelihood of voting, region of residence, race/ethnicity, and other demographics.
This report may be downloaded free of charge from our website (www.ppic.org). If you have questions about the survey, please contact [email protected]. Try our PPIC Statewide Survey interactive tools online at http://www.ppic.org/main/survAdvancedSearch.asp.

December 2012 Californians and the Future 3
PPIC
Statewide
Survey
CONTACT
Linda Strean 415-291-4412
Andrew Hattori 415-291-4417
NEWS RELEASE
EMBARGOED: Do not publish or broadcast until 9:00 p.m. PST on Wednesday, December 5, 2012.
Para ver este comunicado de prensa en español, por favor visite nuestra página de internet: http://www.ppic.org/main/pressreleaseindex.asp
PPIC STATEWIDE SURVEY: CALIFORNIANS AND THE FUTURE
Optimism Rises About State’s Outlook, Leaders AFTER PROPOSITION 30, NEW HIGH FOR BROWN’S JOB APPROVAL—BUT LITTLE SUPPORT FOR MORE TAXES
SAN FRANCISCO, December 5, 2012—In the wake of Governor Jerry Brown’s successful campaign to pass Proposition 30, his job approval rating hit a record-high 48 percent among Californians, according to a survey released today by the Public Policy Institute of California (PPIC). Passage of the measure to increase taxes changed the feelings of most Californians about the state budget situation—and many are feeling more positive: 46 percent say the initiative’s approval has made them more optimistic, 23 percent say it has made them more pessimistic, and 28 percent say it has not changed their views.
The governor’s current approval rating surpasses his high of 46 percent in January 2012. Still, 35 percent disapprove of his job performance and 17 percent are uncertain. Likely voters are more likely to approve than disapprove of the governor (49% approve, 40% disapprove, 11% don’t know). Brown isn’t the only state officeholder with improved ratings. The legislature’s job approval rating among all adults—34 percent—tops 30 percent for the first time since January 2008 (34%). But likely voters are less positive: 61 percent disapprove.
This post-election PPIC survey also looks broadly at Californians’ views of their state. It finds that, after years of recession, their optimism is on the rise. The percentage of adults who say things in California are generally going in the right direction is 44 percent—the highest level since June 2007 and up 30 points since a low of 14 percent in July 2009. Across age groups, this favorable view is highest among adults age 18–34 (50%) and declines with age. It is also much higher among Latinos (54%) and Asians (51%) than whites (36%). A majority of whites (60%) say the state is heading in the wrong direction. Although 53 percent of Californians name the economy and jobs as the most important issue facing the state, their views about California’s economic outlook have improved. Today, 41 percent say they expect good economic times in the next year—the highest level since January 2007 (50%) and up from a low of 15 percent in July 2008. More Latinos today expect good times (51%) than do Asians (36%) or whites (34%). The expectation of good times decreases as age and income levels increase.
When Californians look ahead to 2025, 42 percent say the state will be a better place to live than it is now—a 17 point increase since this question was asked in June 2004 (25%). Just 28 percent say the state will be a worse place to live, and 23 percent predict no change. Since 2004, there have been double-digit increases across regions, demographic groups, and parties in the view that California will be a better place. Republicans are the exceptions, with a majority (54%) saying the state will be a worse place to live.
Despite Californians’ increased optimism, nearly all continue to call the state budget situation a problem (68% big problem, 26% somewhat of a problem). But their approval of Proposition 30 does not mean they

PPIC Statewide Survey
December 2012 Californians and the Future 4
are willing to raise taxes on themselves again. Record-high majorities of adults (65%) and likely voters (68%) oppose extending the sales tax to services that are not currently taxed. Majorities—also at record levels—oppose raising the vehicle license fee (79% adults, 78% likely voters). Across parties, regions, and demographic groups, majorities oppose each idea.
“Many Californians are feeling positive about the state’s outlook now and optimistic about the future,” says Mark Baldassare, PPIC president and CEO. “But they are also feeling fiscally frugal. They are strongly opposed to raising their state taxes and strongly in favor of spending limits.”
STRONG SUPPORT FOR SPENDING REFORMS
The survey examines attitudes about reform—electoral, fiscal, and governance—and finds that Californians support spending changes, as they have in previous surveys. Strong majorities favor:
Strictly limiting the amount of money that state spending can increase each year (65% adults, 65% likely voters)
Increasing the size of the state’s rainy day fund and requiring that above-average revenues be deposited there for use in economic downturns (72% adults, 70% likely voters)
Requiring any major new or expanded state program or tax reductions to identify a specific funding source (79% adults, 82% likely voters)
Smaller majorities of Californians—and even fewer likely voters—support three fiscal reforms that have been proposed to address structural issues in the state budget and local budget issues:
Establishing a two-year state budget cycle in place of the current one-year cycle (56% adults, 49% likely voters)
Replacing the two-thirds majority vote requirement with a simple majority vote for the state legislature to pass state taxes (51% adults, 45% likely voters)
Replacing the two-thirds vote requirement with a 55-percent majority vote for voters to pass local special taxes (54% adults, 50% likely voters)
PROPOSITION 13—POPULARITY ENDURES
Now that Californians have approved the Proposition 30 tax initiative and Democrats have gained a two-thirds majority in the legislature, there is renewed discussion about changing Proposition 13, the 1978 initiative that limits both residential and commercial property taxes. Asked about Proposition 13, Californians remain highly positive about its overall impact. Solid majorities (60% adults, 64% likely voters) say it has been mostly a good thing for the state. Fewer (31% adults, 29% likely voters) say it has been mostly bad. Across political groups, regions, and demographic groups, majorities consider it a good thing for the state. However, Californians’ views are mixed when asked about the effect of Proposition 13’s tax limitations on local government services: 29 percent say the effect has been good, 25 percent say it has been bad, and 36 percent say there has been no effect.
There is support for one change to Proposition 13—a “split roll” property tax. Majorities (57% adults, 58% likely voters) favor taxing commercial properties—now protected under Proposition 13—according to their current market value. Most Democrats (66%) and independents (58%) favor the proposal, while Republicans are divided (47% favor, 48% oppose).
SATISFIED WITH REDISTRICTING, PRIMARY REFORMS
This election year saw the test of two electoral reforms passed by voters. Proposition 11 (passed in 2008) established a citizens’ commission to handle redistricting, and Proposition 14 (passed in 2010) changed the state’s partially closed primary to a top-two system. Asked about the impact of these

PPIC Statewide Survey
December 2012 Californians and the Future 5
reforms, 58 percent say Proposition 11 turned out to be mostly a good thing for the state (21% mostly a bad thing, 18% don’t know) and 63 percent say this about Proposition 14 (23% mostly a bad thing, 13% don’t know). The results underscore Californians’ faith in their own decisionmaking, Baldassare notes:
“Most Californians are happy with the initiative process and the outcomes of the fiscal and governance changes that voters enacted at the ballot box—from Proposition 13 in 1978 to legislative redistricting, the top-two primary system, and Proposition 30 in November.”
In another indication of their view of initiatives, majorities (59% adults, 59% likely voters) say the public policy decisions voters make through this process are probably better than those made by the governor and state legislature. Most have held this view since PPIC began asking the question in 2000.
There is, however, support for two proposed reforms to the initiative process. Overwhelming majorities (76% adults, 86% likely voters) favor requiring the “yes” and “no” campaigns for initiatives to increase disclosure of their contributors. Strong majorities (69% adults, 66% likely voters) favor requiring voters to renew initiatives after a certain number of years by voting on them again. Both of these proposals have majority support across parties, regions, and demographic groups. A third proposed reform fares less well: allowing the legislature, with the governor’s approval, to amend initiatives after a certain number of years. About half of adults (48%) favor this idea, while more than half of likely voters (55%) are opposed.
There is much less enthusiasm for three proposals to change the legislative structure. Adults are divided on whether to change the legislature from full-time to part-time status, with 48 percent calling it a good idea and 45 percent saying it’s a bad one. They oppose changing the legislature from two houses to a single house of 120 members (36% good idea, 51% bad idea). Residents also oppose simply increasing the number of legislators so that each represents fewer constituents (40% good idea, 53% bad idea).
CONCERNED ABOUT COLLEGE COSTS, ACCESSIBILITY
Nearly all Californians say the state’s public higher education system is very important (85%) or somewhat important (11%) to the quality of life and economic vitality of the state over the next 20 years. Yet they express growing concern about the system. The share of adults who say affordability is a big problem is at a new high of 65 percent, up 13 points since 2008. And 43 percent say overall accessibility is a big problem, an increase of 19 points since 2007. Despite passage of Proposition 30—which averted trigger cuts to higher education—64 percent say the state budget situation is a big problem for higher education. These concerns come at a time when a record-high 51 percent of parents of children age 18 or younger say they hope their youngest child will attain a graduate degree. How much confidence do residents have in the state government to plan for the future of higher education? Half have at least some confidence (13% a great deal of confidence, 37% only some confidence). The other half have very little (34%) or none (15%).
DIVIDED ON WATER POLICY PRIORITIES
Most Californians think that the supply of water is a big problem (31%) or somewhat of one (28%) in their part of the state. The share of those calling this a big problem has declined 13 points since December 2009 (44%), when the state was in a drought. Residents of the Central Valley (38%) are the most likely to say the supply in their area is a big problem, while those in the San Francisco Bay Area (20%) are the least likely. When presented with two approaches to manage the water supply, 47 percent say the focus should be on building new water storage systems and increasing supply, while 50 percent say it should be on conservation and using the current water supply more efficiently. And, with declining fish populations a contentious topic, 61 percent of Californians favor increasing state spending to improve conditions for native fish. But that support drops to 39 percent if this would mean an increase in residential water bills.

December 2012 Californians and the Future 6
PLANNING FOR THE FUTURE
KEY FINDINGS
Looking ahead to 2025, a plurality of Californians (42%) say the state will be a better place to live than it is now. This is a remarkable increase in optimism since June 2004 (25%). (page 7)
Despite ongoing economic concerns, the sense that the state is headed in the right direction (44%) is at its highest level since before the recession. (page 8)
In the wake of a successful Proposition 30 campaign, Governor Brown’s job approval ratings are at a record high among all adults (48%) and likely voters (49%). The legislature receives its highest marks (34%) since January 2008. (page 9)
A plurality of all adults and likely voters (46% each) say that the passage of Proposition 30 makes them more optimistic about the budget situation. About one in four are more pessimistic. Voters are divided along party lines. (page 10)
Concerns about college affordability in California continue to grow, and the share saying accessibility is a big problem has jumped 19 points since 2007. (page 11)
Most parents want their children to attend college, with a record 51 percent hoping for graduate school. Californians consider the state’s public higher education system very important and anticipate a shortage of college-educated workers in the future. Half are confident that state leaders can plan for the system’s future. (pages 12, 13)
On water policy, six in 10 say water supply in their part of the state is at least somewhat of a problem. On water supply management, Californians are divided between storage and conservation. (page 14)
34
42 41 42 40 39 41
48
24 2326 25 25 25
3034
0
20
40
60
80
Mar11
May11
Sep11
Dec11
Mar12
May12
Sep12
Dec12
Per
cent
all
adul
ts
Governor Brown
California Legislature
Approval Ratings of State Elected Officials
25
42
49
28
2023
0
20
40
60
80
June2004
Dec2012
Per
cent
all
adul
ts
Better place
Worse place
No change
California as a Place to Live in 2025
53 5257 60 61
65
24
43
0
20
40
60
80
100
Oct07
Nov08
Nov09
Nov10
Nov11
Dec12
Per
cent
all
adul
ts
Affordability
Accessibility
Percent saying "Big Problem" for the Public Higher Education System

PPIC Statewide Survey
December 2012 Californians and the Future 7
FUTURE OUTLOOK
How do Californians view the future? Four in 10 adults (42%), likely voters (40%), and parents of children age 18 or younger (40%) say that California will be a better place to live in 2025 than it is now. Fewer say it will be a worse place (28% adults, 35% likely voters, 26% parents). In June 2004, positive perceptions about the future were held by fewer California adults (25%), likely voters (24%), and parents (28%).
Across parties, Democrats (57%) and independents (43%) think California in 2025 will be a better place, but a majority of Republicans (54%) say it will be worse. Across regions and demographic groups, optimists clearly outweigh pessimists—except among whites, those age 55 and older, and those with household incomes of $80,000 or more. Since 2004 there have been double-digit increases across party, region, and demographic groups (except Republicans) in the view that California will be a better place in 2025. This perception has increased 34 points among Democrats and 17 points among independents, while Republican views are relatively unchanged (down 2 points). Other notable increases have occurred among those with incomes of $40,000 to $80,000 (up 22 points since 2004), residents in the San Francisco Bay Area (up 21 points), those age 18 to 34 (up 21 points), college graduates (up 20 points), and women (up 19 points). Among those who think California is currently heading in the right direction, 61 percent say it will be a better place in 2025; among those who think California is going in the wrong direction, 23 percent are optimistic about 2025.
“Overall, do you think that in 2025 California will be a better place to live than it is now or a worse place to live than it is now or will there be no change?”
Better place Worse place No change Don’t know
All adults 42% 28% 23% 8%
Likely voters 40 35 18 8
Parents of children 18 or younger 40 26 25 9
Party
Democrats 57 17 17 9
Republicans 23 54 17 6
Independents 43 26 25 7
Gender Men 39 30 21 9
Women 44 25 25 6
Race/ethnicity
Asians 41 28 20 11
Latinos 47 18 30 5
Whites 37 37 18 8
Region
Central Valley 41 27 24 8
San Francisco Bay Area 45 24 23 8
Los Angeles 42 25 26 7
Other Southern California 39 31 20 10
Age
18–34 48 20 28 5
35–54 40 29 22 9
55 and older 36 35 19 10
Household income
Under $40,000 44 21 29 6
$40,000 to under $80,000 46 30 19 5
$80,000 or more 35 34 18 12

PPIC Statewide Survey
December 2012 Californians and the Future 8
CURRENT OUTLOOK
Given Californians’ optimism about the future, how do they view the direction the state is currently heading? Forty-four percent of Californians say the state is going in the right direction, while half say it is headed in the wrong direction. The percentage saying the state is heading in the right direction today is similar to October 2012 (39%) and is the highest it has been since June 2007 (44%). Across parties, this view is held by 61 percent of Democrats; 80 percent of Republicans and 55 percent of independents say the state is headed in the wrong direction. Just over half of Latinos (54%) and Asians (51%) think the state is headed in the right direction, while six in 10 whites (60%) say it is headed in the wrong direction. Optimism about the direction of the state is higher among those with household incomes under $40,000 (50%) than among others (42% $40,000 to $80,000; 39% $80,000 or more). Optimism declines with age.
“Do you think things in California are generally going in the right direction or the wrong direction?”
All adults
Age Race/ethnicity
18–34 35–54 55 and older Asians Latinos Whites
Right direction 44% 50% 45% 37% 51% 54% 36%
Wrong direction 50 44 50 57 43 38 60
Don’t know 6 6 5 6 6 8 4
When asked what they think is the most important issue facing people in California today, 53 percent of Californians mention the economy and jobs. Far fewer mention education or schools (13%) or the state budget, deficit, or taxes (10%). The economy is the top issue mentioned across all political, regional, and demographic groups. Education and schools is named by twice as many Californians ages 18 to 34 as by those ages 35 and older. Whites (16%) and Asians (12%) are more likely than Latinos (3%) to mention the state budget as the top issue. Concerns about the economy are much higher among lower- and middle-income residents (58% each) than among higher-income residents (43%).
“Thinking about the state as a whole, what do you think is the most important issue facing people in California today?
Top three issues mentioned All adults
Age Race/ethnicity
18–34 35–54 55 and older Asians Latinos Whites
Economy, jobs 53% 47% 58% 54% 55% 57% 48%
Education, schools 13 20 9 10 12 12 14
State budget, deficit, taxes
10 7 12 12 12 3 16
Californians’ views of the state’s economic outlook mirror their views of the general direction of the state, with 41 percent saying they expect good economic times in the next 12 months and 50 percent saying they expect bad times. Today’s expectation of good times is similar to October 2012 (37%), but is at its highest point since January 2007 (50%). A majority of Democrats (56%) expect good times, while nearly eight in 10 Republicans (78%) and half of independents expect bad times (36% good times, 52% bad times). The expectation of good times is higher among Latinos (51%) than among Asians (36%) or whites (34%); this expectation decreases as age and income levels increase. Residents in the Other Southern California region (61%) are the most likely to say the state can expect bad times economically, followed by residents in the Central Valley (47%), Los Angeles (46%), and the San Francisco Bay Area (43%).

PPIC Statewide Survey
December 2012 Californians and the Future 9
APPROVAL RATINGS OF STATE ELECTED OFFICIALS
Approval of Governor Jerry Brown (48%) has reached a high point after the passage of Proposition 30, a tax initiative that he promoted. This rating marks a slight increase since October (42%) and surpasses his previous high of 46 percent in January 2012. Still, 35 percent disapprove of his job performance and 17 percent are unsure. Likely voters are more likely to approve than disapprove (49% approve, 40% disapprove, 11% unsure). Partisans are divided, with seven in 10 Democrats (70%) approving, seven in 10 Republicans (68%) disapproving, and independents more likely to approve (44%) than disapprove (36%). Asians (63%) and Latinos (50%) are more likely than whites (41%) to approve.
Approval of the California Legislature has reached 34 percent among all adults; 51 percent disapprove. Approval has increased slightly since October (28%) and surpasses 30 percent for the first time since January 2008 (34%). Today, likely voters are more disapproving (26% approve, 61% disapprove) than are all adults. Republicans (80%) and independents (52%) disapprove of the legislature, while Democrats are divided (39% approve, 43% disapprove). Approval is much higher among Latinos (47%) and Asians (40%) than among whites (24%). But it declines with age and is lower among those with at least some college education than among those with only a high school degree or less. Californians with household incomes of less than $40,000 are far more likely than more-affluent Californians to approve of the legislature.
“Overall, do you approve or disapprove of the way that…”
All adults
Party Likely voters
Dem Rep Ind
Jerry Brown is handling his job as governor of California?
Approve 48% 70% 20% 44% 49%
Disapprove 35 18 68 36 40
Don’t know 17 12 12 20 11
The California Legislature is handling its job?
Approve 34 39 11 34 26
Disapprove 51 43 80 52 61
Don’t know 15 18 9 14 13
Approval of the governor’s handling of plans and policies for California’s future is similar to his overall approval, with 46 percent approving and 38 percent disapproving. Two in three Democrats (67%) approve, seven in 10 Republicans (70%) disapprove, and independents are divided (43% approve, 38% disapprove). Ratings of the California Legislature on handling California’s future (32% approve, 53% disapprove) are also similar to its overall approval. Republicans (78%) are the most disapproving, followed by independents (58%) and Democrats (44%). Approval of the legislature on this issue is similar to our findings the last time we asked this question in August 2006 (28% approve, 54% disapprove).
“Overall, from what you know, do you approve or disapprove of the way that … is handling plans and policies for California’s future?”
All adults
Age Race/ethnicity
18–34 35–54 55 and older
Asians Latinos Whites
Governor Brown
Approve 46% 51% 46% 41% 56% 50% 40%
Disapprove 38 31 40 44 23 33 46
Don’t know 16 19 14 15 20 17 14
The California Legislature
Approve 32 41 33 21 32 50 21
Disapprove 53 40 54 65 46 38 64
Don’t know 15 18 13 14 22 12 15
PPIC Statewide Survey
December 2012 Californians and the Future 10
STATE BUDGET SITUATION
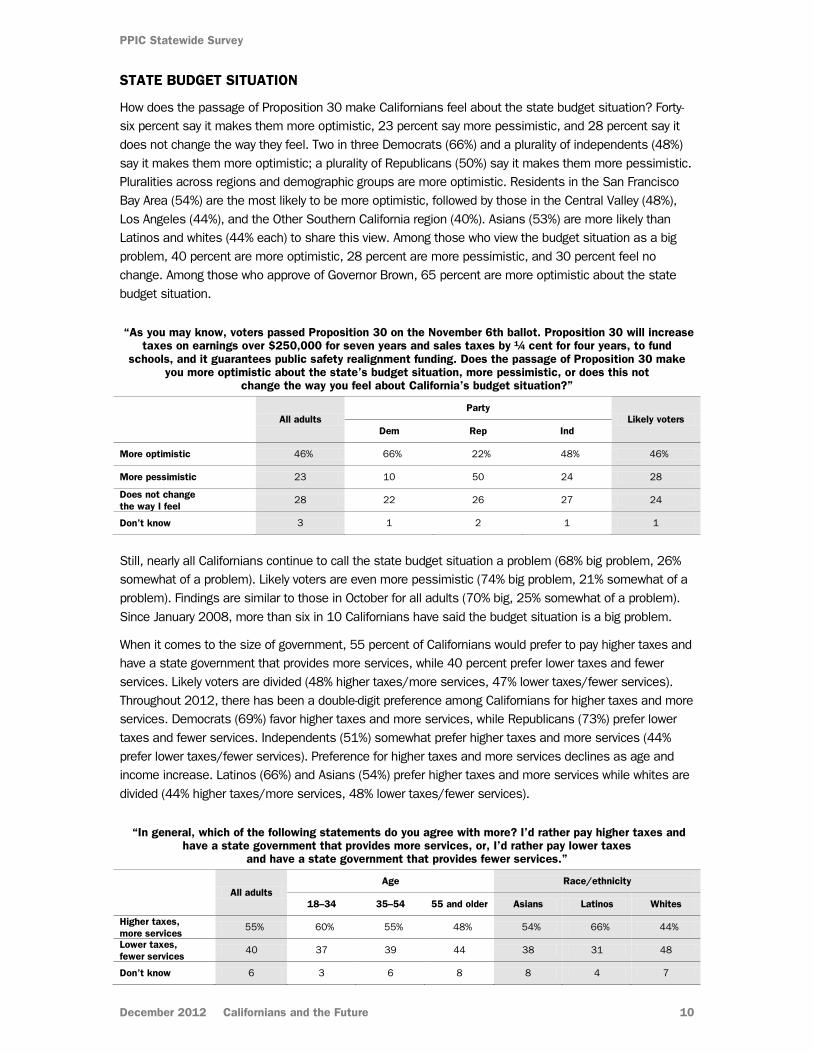
How does the passage of Proposition 30 make Californians feel about the state budget situation? Forty-six percent say it makes them more optimistic, 23 percent say more pessimistic, and 28 percent say it does not change the way they feel. Two in three Democrats (66%) and a plurality of independents (48%) say it makes them more optimistic; a plurality of Republicans (50%) say it makes them more pessimistic. Pluralities across regions and demographic groups are more optimistic. Residents in the San Francisco Bay Area (54%) are the most likely to be more optimistic, followed by those in the Central Valley (48%), Los Angeles (44%), and the Other Southern California region (40%). Asians (53%) are more likely than Latinos and whites (44% each) to share this view. Among those who view the budget situation as a big problem, 40 percent are more optimistic, 28 percent are more pessimistic, and 30 percent feel no change. Among those who approve of Governor Brown, 65 percent are more optimistic about the state budget situation.
“As you may know, voters passed Proposition 30 on the November 6th ballot. Proposition 30 will increase taxes on earnings over $250,000 for seven years and sales taxes by ¼ cent for four years, to fund
schools, and it guarantees public safety realignment funding. Does the passage of Proposition 30 make you more optimistic about the state’s budget situation, more pessimistic, or does this not
change the way you feel about California’s budget situation?”
All adults
Party Likely voters
Dem Rep Ind
More optimistic 46% 66% 22% 48% 46%
More pessimistic 23 10 50 24 28
Does not change the way I feel
28 22 26 27 24
Don’t know 3 1 2 1 1
Still, nearly all Californians continue to call the state budget situation a problem (68% big problem, 26% somewhat of a problem). Likely voters are even more pessimistic (74% big problem, 21% somewhat of a problem). Findings are similar to those in October for all adults (70% big, 25% somewhat of a problem). Since January 2008, more than six in 10 Californians have said the budget situation is a big problem.
When it comes to the size of government, 55 percent of Californians would prefer to pay higher taxes and have a state government that provides more services, while 40 percent prefer lower taxes and fewer services. Likely voters are divided (48% higher taxes/more services, 47% lower taxes/fewer services). Throughout 2012, there has been a double-digit preference among Californians for higher taxes and more services. Democrats (69%) favor higher taxes and more services, while Republicans (73%) prefer lower taxes and fewer services. Independents (51%) somewhat prefer higher taxes and more services (44% prefer lower taxes/fewer services). Preference for higher taxes and more services declines as age and income increase. Latinos (66%) and Asians (54%) prefer higher taxes and more services while whites are divided (44% higher taxes/more services, 48% lower taxes/fewer services).
“In general, which of the following statements do you agree with more? I’d rather pay higher taxes and have a state government that provides more services, or, I’d rather pay lower taxes
and have a state government that provides fewer services.”
All adults
Age Race/ethnicity
18–34 35–54 55 and older Asians Latinos Whites
Higher taxes, more services
55% 60% 55% 48% 54% 66% 44%
Lower taxes, fewer services
40 37 39 44 38 31 48
Don’t know 6 3 6 8 8 4 7

PPIC Statewide Survey
December 2012 Californians and the Future 11
PERCEPTIONS OF CALIFORNIA’S HIGHER EDUCATION SYSTEM
Solid majorities of Californians think that affordability (65%) and the overall state budget situation (64%) are big problems for California’s higher education system today. The share saying affordability is a big problem is at its highest today (53% 2007, 52% 2008, 57% 2009, 60% 2010, 61% 2011, 65% today). The share saying the overall state budget situation is a big problem for higher education peaked in 2010 (70% 2009, 74% 2010, 69% 2011, 64% today). However, the share holding this view today remains high despite passage of Proposition 30, which averted trigger cuts to higher education. Forty-three percent say accessibility is a big problem, a 19-point increase since 2007 (24%) when this question was last asked.
“I’m going to read you a list of issues people have mentioned when talking about California’s higher education system today. For each one, please tell me if you
think it is a big problem, somewhat of a problem, or not much of a problem. How about…”
The overall affordability of education for students?
The overall state budget situation?
The overall accessibility of education for students?
Big problem 65% 64% 43%
Somewhat of a problem 23 23 31
Not much of a problem 12 11 24
Don’t know 1 2 1
Democrats (73%) are more likely than Republicans (60%) and independents (63%) to say affordability is a big problem. Residents in the Central Valley (72%) and the San Francisco Bay Area (70%) are the most likely to say affordability is a big problem, followed by those in the Other Southern California region (64%) and Los Angeles (60%). Latinos (59%) are less likely than whites (67%) and Asians (70%) to say this. And those earning $80,000 or more are less likely than those with lower incomes to say this.
Majorities of Democrats, independents (73% each), and Republicans (61%) say the overall state budget situation is a big problem for the higher education system. Asians (78%) are much more likely than whites (66%) and far more likely than Latinos (53%) to say this. Seven in 10 Californians earning $40,000 or more hold this view, compared to six in 10 earning less than $40,000. Seven in 10 with at least some college education express this view, compared to 55 percent of those with a high school education only.
Democrats (48%) are more likely than independents (42%) and Republicans (39%) to say accessibility is a big problem. Between 38 and 48 percent across regions and demographic groups hold this view.
Percent saying big problem Overall affordability Overall state budget situation
Overall accessibility
All adults 65% 64% 43%
Likely voters 68 70 45
Parents of children 18 or younger 63 59 41
Age
18–34 69 65 42
35–54 61 60 42
55 and older 67 69 47
Race/ethnicity
Asians 70 78 48
Latinos 59 53 40
Whites 67 66 43
Household income
Under $40,000 67 59 47
$40,000 to under $80,000 72 70 42
$80,000 or more 59 70 42

PPIC Statewide Survey
December 2012 Californians and the Future 12
EDUCATING CALIFORNIA’S FUTURE WORKFORCE
A record-high 51 percent of parents of children age 18 or younger hope that their youngest child will attain a graduate degree, and another 36 percent hope for a four-year college degree. Fewer parents hope that their youngest achieves a high school education or less (4%), or completes a two-year college degree or career technical training (6%). Strong majorities of parents across income and racial/ethnic groups hope their youngest obtains at least a four-year degree; hopes for completing a graduate degree increase with income. Latino and white parents express similar views regarding college attainment. The share of Latino parents hoping for a graduate degree is up 17 points from November 2011 (from 29% to 46% today). (The sample size for Asian parents is too small for separate analysis.) Parents who are college graduates (60%) are more likely than those without a college degree (47%) to hope that their youngest child gets a graduate degree.
“What do you hope will be the highest grade level that your youngest child will achieve: some high school; high school graduate; two-year community college graduate or career technical training;
four-year college graduate; or a graduate degree after college?”
Parents of children 18 or younger
All parents of children 18 or
younger
Income Race/ethnicity
Under $40,000
$40,000 to $80,000
$80,000 or more
Latinos Whites
Some high school or high school graduate
4% 6% 7% 1% 7% –
Two-year college or career technical training
6 10 4 2 8 7%
Four-year college graduate 36 37 36 35 37 38
Graduate degree after college 51 44 51 63 46 51
Don’t know 2 2 2 1 1 3
Nearly all Californians say the state’s public higher education system is very (85%) or somewhat (11%) important to the quality of life and economic vitality of the state over the next 20 years. The share saying it is very important is at a record high today, although at least seven in 10 have held this view in previous surveys. Today, Democrats (92%) are much more likely than independents (79%) or Republicans (74%) to say the public higher education system is very important. Eighty-eight percent of parents with children age 18 or younger hold this view, as do 91 percent of public school parents. More than eight in 10 adults across regions, racial/ethnic, age, education, and income groups say the public higher education system is very important to the quality of life and economic vitality of the state over the next 20 years.
Among those who think California will be a better place to live in 2025, 91 percent say the public higher education system is very important. Among those who say the state will be a worse place to live, 76 percent say it is very important.
“In general, how important is California’s public higher education system to the quality of life and economic vitality of the state over the next 20 years?”
All adults
Party Likely voters
Dem Rep Ind
Very important 85% 92% 74% 79% 84%
Somewhat important 11 7 18 17 12
Not too important 1 1 4 2 2
Not at all important 1 – 3 1 2
Don’t know 1 – 1 1 –

PPIC Statewide Survey
December 2012 Californians and the Future 13
EDUCATING CALIFORNIA’S FUTURE WORKFORCE (CONTINUED)
A majority of Californians (56%) think that if current trends continue California will not have enough college-educated residents needed for the jobs and skills likely to be in demand in 20 years. Twenty-eight percent say there will be just enough and 14 percent say there will be more than enough college-educated residents in the state. The share who say the state will face a shortage is up slightly from last year but is the same as it was in 2010 (56% today, 49% 2011, 56% 2010, 49% 2009, 47% 2008, 52% 2007).
Majorities across parties anticipate a shortage of college graduates (57% Democrats, 56% independents, 51% Republicans). San Francisco Bay Area residents (48%) are less likely to hold this view than those in other areas (55% Los Angeles, 56% Central Valley, 59% Other Southern California). Women (60%) are somewhat more likely than men (52%) to say there will be a shortage. Majorities across income, education, and racial/ethnic groups agree. Naturalized citizens (63%) and non-citizens (60%) are somewhat more likely to see a shortage than are U.S. natives (53%). Among those saying the higher education system is very important to the future vitality of the state, 59 percent see a future shortage.
“In thinking ahead 20 years, if current trends continue, do you think California will have more than enough, not enough, or just enough college-educated
residents needed for the jobs and skills likely to be in demand?”
All adults
Party Likely voters
Dem Rep Ind
Not enough 56% 57% 51% 56% 55%
Just enough 28 28 30 29 28
More than enough 14 11 16 11 13
Don’t know 2 3 3 3 3
Half of Californians have at least some confidence in the state government’s ability to plan for the future of California’s higher education system: 13 percent say they have a great deal of confidence and 37 percent have only some. The other half express very little (34%) or no confidence (15%). Confidence was highest when we first asked this question in 2007 (57% great deal/only some). It dropped as low as 40 percent in 2010 but has increased since then (57% 2007, 52% 2008, 41% 2009, 40% 2010, 47% 2011, 50% today).
A solid majority of Democrats (61%) express confidence in the state’s ability to handle this issue, compared to 47 percent of independents and 33 percent of Republicans. Asians (58%) and Latinos (54%) have more confidence than whites (44%). About half of those in other demographic groups and regions are at least somewhat confident, including public school parents and parents with children age 18 or younger (53% each). Among those who anticipate a shortage of college-educated workers, 45 percent have confidence and 54 percent do not.
“How much confidence do you have in the state government’s ability to plan for the future of California’s higher education system—a great deal, only some, very little, or none?”
All adults
Party Likely voters
Dem Rep Ind
A great deal 13% 19% 5% 5% 10%
Only some 37 42 28 42 38
Very little 34 30 33 35 32
None 15 8 33 17 19
Don’t know 1 1 1 1 –

PPIC Statewide Survey
December 2012 Californians and the Future 14
WATER SYSTEMS
Six in 10 Californians think that the water supply in their part of California is a big (31%) or somewhat (28%) of a problem; 39 percent say it is not a problem. The share saying it is a big problem has declined 13 points since December 2009 (44%) when the state was in a drought. Those in the Central Valley (38%) and the Other Southern California region (35%) are more likely than residents in Los Angeles (27%) and the San Francisco Bay Area (20%) to say that the water supply in their area is a big problem.
“Would you say that the supply of water is a big problem, somewhat of a problem, or not much of a problem in your part of California?”
All adults
Region Likely voters
Central Valley San Francisco Bay Area
Los Angeles Other Southern California
Big problem 31% 38% 20% 27% 35% 35%
Somewhat of a problem 28 23 31 30 28 30
Not much of a problem 39 36 48 41 35 34
Don’t know 2 4 1 2 1 2
When presented with two approaches to managing the state’s water supply, 47 percent of Californians say the focus should be on building new water storage systems and increasing supply while 50 percent say it should be on conservation and using the current water supply more efficiently. Since this question was first asked in 2004, the margin of preference for conservation has narrowed (2004: 55% conservation vs. 41% storage; 2006: 54% vs. 41%; 2009: 50% vs. 43%; today: 50% vs. 47%). Six in 10 San Francisco Bay Area residents prefer conservation, while residents in other regions are more divided. Looked at another way, 60 percent of those living along the state’s north-central coast prefer conservation while those on the southern coast and inland are divided. Majorities of Democrats (54%) and independents (52%) prefer conservation, while Republicans (56%) prefer storage. Six in 10 Asians (59%) prefer conservation; whites and Latinos are divided. Those saying water supply is a big problem prefer building new storage (55%) to conservation (41%). Those who say it is not a problem prefer conservation (57%) to storage (41%).
“Which of the following statements is closer to your views about planning for the future in your part of California? We should focus on building new water storage systems and increasing the
water supply; or, We should focus on water conservation, user allocation, pricing, and other strategies to more efficiently use the current water supply.”
All adults
Region Likely voters
Central Valley San Francisco Bay Area
Los Angeles Other Southern California
New storage, increase supply
47% 49% 36% 51% 52% 45%
Conservation, efficiency 50 46 61 48 46 50
Don’t know 3 5 3 2 2 5
Declining native fish populations have been a point of contention in the debate about water management. A solid majority of Californians (61%) favor increasing state spending to improve conditions for native fish; 34 percent oppose this idea. Support drops to 39 percent if increased spending means an increase in residents’ water bills. Solid majorities of Democrats and independents favor increased spending (with support dropping to 41% for Democrats and 44% for independents if it means higher water bills), while Republicans (52%) are opposed outright. Four in 10 across income groups are in favor even with increased water bills. San Francisco Bay Area residents (48%) are the most likely, and Central Valley residents (29%) the least likely, to be in favor even with higher bills. North-central coast residents (50%) are more likely to be in favor even if water bills increase than south coast (39%) and inland (30%) residents. Latinos (40%) and whites (43%) are much more likely than Asians (23%) to favor this idea.
December 2012 Californians and the Future 15
FISCAL AND GOVERNANCE REFORMS
KEY FINDINGS
The 2012 elections were the first to use new voting districts drawn by a citizens’ commission and the top-two primary system. Majorities of Californians and likely voters say these reforms have had a positive effect. (page 16)
Californians are not enthusiastic about proposals to alter the legislative structure. They are divided about having a part-time legislature and slim majorities oppose a unicameral or larger legislature. (page 17)
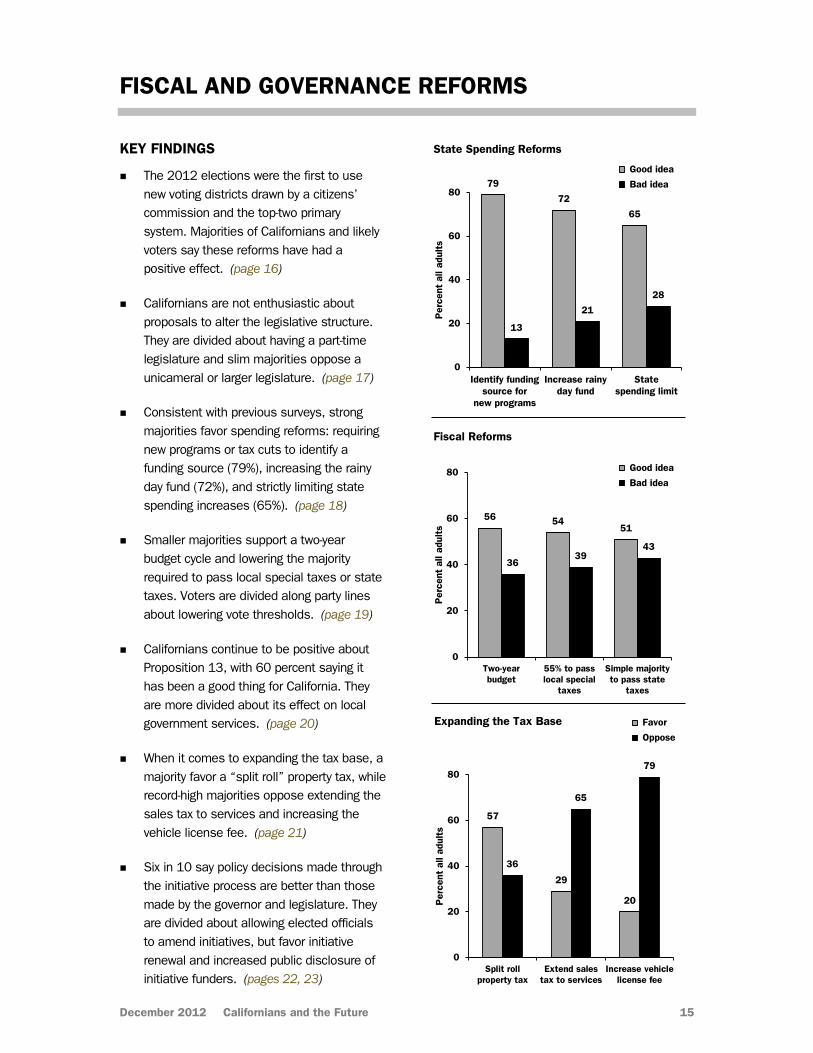
Consistent with previous surveys, strong majorities favor spending reforms: requiring new programs or tax cuts to identify a funding source (79%), increasing the rainy day fund (72%), and strictly limiting state spending increases (65%). (page 18)
Smaller majorities support a two-year budget cycle and lowering the majority required to pass local special taxes or state taxes. Voters are divided along party lines about lowering vote thresholds. (page 19)
Californians continue to be positive about Proposition 13, with 60 percent saying it has been a good thing for California. They are more divided about its effect on local government services. (page 20)
When it comes to expanding the tax base, a majority favor a “split roll” property tax, while record-high majorities oppose extending the sales tax to services and increasing the vehicle license fee. (page 21)
Six in 10 say policy decisions made through the initiative process are better than those made by the governor and legislature. They are divided about allowing elected officials to amend initiatives, but favor initiative renewal and increased public disclosure of initiative funders. (pages 22, 23)
57
29
20
36
65
79
0
20
40
60
80
Split rollproperty tax
Extend salestax to services
Increase vehiclelicense fee
Per
cent
all
adul
ts
Favor
Oppose
Expanding the Tax Base
56 5451
3639
43
0
20
40
60
80
Two-yearbudget
55% to passlocal special
taxes
Simple majorityto pass state
taxes
Per
cent
all
adul
ts
Good idea
Bad idea
Fiscal Reforms
79
72
65
13
21
28
0
20
40
60
80
Identify fundingsource for
new programs
Increase rainyday fund
Statespending limit
Per
cent
all
adul
ts
Good idea
Bad idea
State Spending Reforms
PPIC Statewide Survey
December 2012 Californians and the Future 16
RECENT ELECTORAL REFORMS
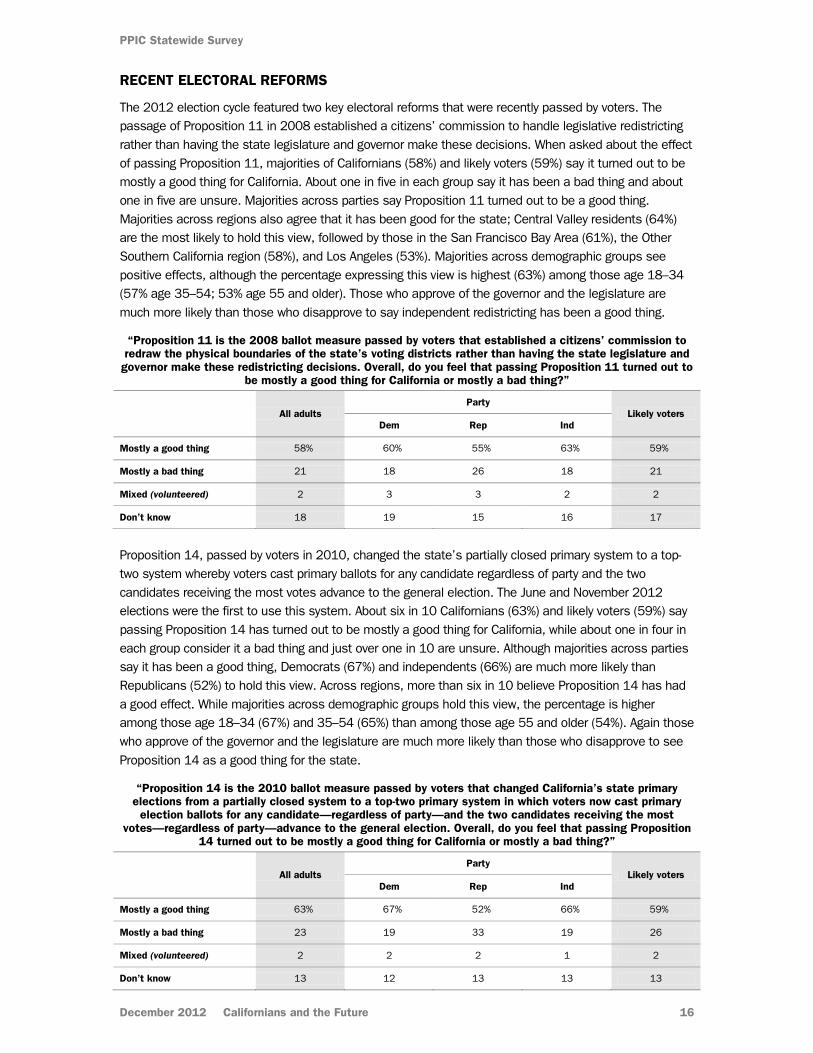
The 2012 election cycle featured two key electoral reforms that were recently passed by voters. The passage of Proposition 11 in 2008 established a citizens’ commission to handle legislative redistricting rather than having the state legislature and governor make these decisions. When asked about the effect of passing Proposition 11, majorities of Californians (58%) and likely voters (59%) say it turned out to be mostly a good thing for California. About one in five in each group say it has been a bad thing and about one in five are unsure. Majorities across parties say Proposition 11 turned out to be a good thing. Majorities across regions also agree that it has been good for the state; Central Valley residents (64%) are the most likely to hold this view, followed by those in the San Francisco Bay Area (61%), the Other Southern California region (58%), and Los Angeles (53%). Majorities across demographic groups see positive effects, although the percentage expressing this view is highest (63%) among those age 18–34 (57% age 35–54; 53% age 55 and older). Those who approve of the governor and the legislature are much more likely than those who disapprove to say independent redistricting has been a good thing.
“Proposition 11 is the 2008 ballot measure passed by voters that established a citizens’ commission to redraw the physical boundaries of the state’s voting districts rather than having the state legislature and governor make these redistricting decisions. Overall, do you feel that passing Proposition 11 turned out to
be mostly a good thing for California or mostly a bad thing?”
All adults
Party Likely voters
Dem Rep Ind
Mostly a good thing 58% 60% 55% 63% 59%
Mostly a bad thing 21 18 26 18 21
Mixed (volunteered) 2 3 3 2 2
Don’t know 18 19 15 16 17
Proposition 14, passed by voters in 2010, changed the state’s partially closed primary system to a top-two system whereby voters cast primary ballots for any candidate regardless of party and the two candidates receiving the most votes advance to the general election. The June and November 2012 elections were the first to use this system. About six in 10 Californians (63%) and likely voters (59%) say passing Proposition 14 has turned out to be mostly a good thing for California, while about one in four in each group consider it a bad thing and just over one in 10 are unsure. Although majorities across parties say it has been a good thing, Democrats (67%) and independents (66%) are much more likely than Republicans (52%) to hold this view. Across regions, more than six in 10 believe Proposition 14 has had a good effect. While majorities across demographic groups hold this view, the percentage is higher among those age 18–34 (67%) and 35–54 (65%) than among those age 55 and older (54%). Again those who approve of the governor and the legislature are much more likely than those who disapprove to see Proposition 14 as a good thing for the state.
“Proposition 14 is the 2010 ballot measure passed by voters that changed California’s state primary elections from a partially closed system to a top-two primary system in which voters now cast primary
election ballots for any candidate—regardless of party—and the two candidates receiving the most votes—regardless of party—advance to the general election. Overall, do you feel that passing Proposition
14 turned out to be mostly a good thing for California or mostly a bad thing?”
All adults
Party Likely voters
Dem Rep Ind
Mostly a good thing 63% 67% 52% 66% 59%
Mostly a bad thing 23 19 33 19 26
Mixed (volunteered) 2 2 2 1 2
Don’t know 13 12 13 13 13

PPIC Statewide Survey
December 2012 Californians and the Future 17
LEGISLATIVE REFORM PROPOSALS
Several ideas about changing the legislative structure in California have been discussed over the years. One idea is to change the legislature from full-time to part-time status. Californians are divided about this idea (48% good idea, 45% bad idea), as are likely voters (48% good idea, 43% bad idea). Californians were much more likely to say this was a bad idea (31% good, 58% bad) when this question was last asked in September 2011. Opinions diverge across parties: Republicans (67%) are far more likely than independents (43%) and Democrats (38%) to say a part-time legislature would be a good idea. Central Valley (54%) and Other Southern California (53%) residents are more likely to consider a part-time legislature a good idea than Los Angeles (42%) and San Francisco Bay Area (41%) residents. Whites (53%) are more likely than either Latinos (45%) or Asians (31%) to say this is a good idea, and the share holding this view increases with age. Among those who disapprove of the legislature, 57 percent say part-time status is a good idea, compared with 42 percent of those who approve of the legislature.
“Other reforms have been proposed to address state governance issues. For each of the following, please say if you think the proposal is a good idea or a bad idea. How about changing
the California Legislature from full-time status to part-time status?”
All adults
Party Likely voters
Dem Rep Ind
Good idea 48% 38% 67% 43% 48%
Bad idea 45 53 26 48 43
Don’t know 7 9 7 9 9
Californians (36% good idea, 51% bad idea) and likely voters (28% good, 58% bad) are more likely to say changing the legislature from two houses to a single house of 120 members is a bad idea than a good idea. Voters across parties are more likely to say this is a bad idea than a good idea. Central Valley residents are divided about a unicameral legislature (45% good, 42% bad); residents in the San Francisco Bay Area (32% good, 50% bad), Los Angeles (35% good, 53% bad), and the Other Southern California region (34% good, 56% bad) are more likely to consider it a bad idea than a good one. Latinos (46%) are more likely than whites (33%) or Asians (30%) to say a single house is a good idea. About four in 10 of both those who approve of the legislature and those who disapprove say this is a good idea.
“How about changing the California Legislature from two houses—the 80-member state assembly and 40-member state senate—to a single house with 120 members?”
All adults
Party Likely voters
Dem Rep Ind
Good idea 36% 36% 27% 30% 28%
Bad idea 51 50 60 57 58
Don’t know 13 14 13 12 15
Another reform idea is to increase the number of legislators so that each one represents fewer people. Californians are also more likely to say this is a bad idea (53%) than a good idea (40%). And among likely voters, nearly two in three consider this a bad idea (30% good, 64% bad). Majorities of Republicans (64%), Democrats (61%), and independents (59%) say increasing the number of legislators is a bad idea. Other Southern California (45%), Central Valley (43%), and Los Angeles (40%) residents are more likely than San Francisco Bay Area residents (34%) to say this is a good idea. A majority of Latinos (53%) say good idea, while majorities of Asians (55%) and whites (59%) say bad idea. Among those who disapprove of the legislature, 59 percent say this is a bad idea.

PPIC Statewide Survey
December 2012 Californians and the Future 18
STATE SPENDING REFORM PROPOSALS
Strong majorities of Californians express support for a number of proposed state spending reforms. Two in three Californians and likely voters (65% each) say it is a good idea to strictly limit the amount by which state spending could increase each year. Since first asked about this idea in June 2003, majorities of Californians (ranging from a low of 53% in May 2007 to a high of 72% in May 2011) have said a state spending limit is a good idea. Across parties today, majorities consider a strict state spending limit a good idea, although Republicans (77%) are more likely to hold this view than independents (67%) or Democrats (56%). Majorities across regions and demographic groups say this is a good idea. Support is highest among those in the Other Southern California region (71%), followed by those in the Central Valley (66%), Los Angeles (63%), and the San Francisco Bay Area (57%). Among those who generally prefer paying lower taxes and having a state government that provides fewer services, 74 percent say a spending limit is a good idea. Those who disapprove of Governor Brown are much more likely than those who approve to consider a spending limit a good idea (77% to 59%), while among both those who approve (66%) and disapprove (70%) of the legislature, strong majorities say it is a good idea.
Seven in 10 Californians (72%) and likely voters (70%) say it is a good idea to increase the size of the state’s rainy day fund and require above-average revenues to be deposited into it for use during economic downturns. Since we first asked this question in May 2010, at least 70 percent of adults have said increasing the rainy day fund is a good idea. Majorities across parties consider this a good idea, but Democrats and independents (74% each) are much more likely than Republicans (61%) to hold this view. At least two in three across regions and demographic groups support increasing the rainy day fund. Those who prefer paying higher taxes for more state services are more likely than those who prefer smaller government to say a bigger rainy day fund is a good idea (77% to 66%). Those who approve of the governor and the legislature are more likely than those who disapprove to support a larger rainy day fund.
Strong majorities of Californians (79%) and likely voters (82%) also support requiring any major new or expanded state programs or tax reductions to identify a specific funding source. Results among all adults were similar the previous time we asked this question in May 2010 (78% good idea). At least eight in 10 across parties say this “pay as you go” idea is a good one and more than seven in 10 across regions and demographic groups agree. Among both those who prefer a larger state government and those who prefer a smaller one, eight in 10 say it is a good idea. (The idea, known as “pay-go,” was a component of Proposition 31 on the November ballot, a measure that also included a two-year budget and other fiscal and governance reforms. Our pre-election surveys found a lack of understanding about Proposition 31—with high percentages of “don’t knows”—and the measure ultimately failed.)
“Fiscal reforms have been proposed to address the structural issues in the state budget and local budget issues. For each of the following, please say if you think the proposal is a good idea or a bad idea.”
All adults
Party Likely voters Dem Rep Ind
How about strictly limiting the amount of money that state spending could increase each year?
Good idea 65% 56% 77% 67% 65%
Bad idea 28 35 20 29 28
Don't know 7 9 3 5 7
How about increasing the size of the state's rainy day fund and requiring above-average revenues to be deposited into it for use during economic downturns?
Good idea 72 74 61 74 70
Bad idea 21 19 31 20 23
Don't know 7 7 8 6 7
How about requiring that any major new or expanded state programs or tax reductions identify a specific funding source?
Good idea 79 80 86 81 82
Bad idea 13 11 9 13 10
Don't know 8 10 5 6 7

PPIC Statewide Survey
December 2012 Californians and the Future 19
FISCAL REFORM PROPOSALS
Smaller majorities of Californians—and even fewer likely voters—support three fiscal reforms that have been proposed to address structural issues in the state budget and local budget issues. A majority of adults (56%) and 49 percent of likely voters think it is a good idea to establish a two-year state budget cycle in place of the current one-year cycle (again, this was an element of Proposition 31). Majorities of Democrats (55%) and independents (54%) say a two-year budget cycle is a good idea; Republicans are evenly divided (44% good, 45% bad). Across regions, between 53 percent and 57 percent say it is a good idea. There is a considerable difference of opinion among racial/ethnic groups: 67 percent of Latinos say a two-year budget cycle is a good idea, compared with 51 percent of whites and 47 percent of Asians. Majorities of those with only a high school education (65%) and household incomes under $40,000 (61%) say this is a good idea, compared with fewer who have more education and household income.
A proposal to lower the two-thirds vote requirement to a simple majority for the state legislature to pass state taxes is considered a good idea by 51 percent of Californians (43% bad idea). (The two-thirds requirement was a component of Proposition 13, which passed in 1978; many wonder if the legislature, with a new supermajority of Democrats, will seek to change this rule.) Among likely voters, 45 percent say a simple majority is a good idea and 51 percent think it is a bad idea. Partisans are divided about lowering the vote to pass taxes: 59 percent of Democrats say good idea while 66 percent of Republicans say bad idea. Independents are split (44% good, 50% bad). Opposition to lowering the share of votes required to pass taxes is higher among older residents and increases with higher income. Six in 10 who favor smaller government think it is a bad idea, while six in 10 who favor larger government say it is a good idea. Those who approve of the governor and legislature are more likely to support this idea than those who disapprove.
A third proposal would lower the majority required for voters to pass local special taxes from two-thirds to 55 percent. (The two-thirds vote requirement was another component of Proposition 13.) This would match the share of votes required to pass local school bonds (which voters lowered from two-thirds by approving Proposition 39 in 2000). A majority of adults (54%) say lowering the vote threshold to pass local special taxes is a good idea (39% say bad idea). Likely voters are more divided (50% good, 45% bad). The share of adults saying good idea (54%) matches the previous finding in May 2011 and is a record high since this question was first asked in June 2003 (46% good, 45% bad). Voters today are divided along party lines (Democrats, 60% good; Republicans, 57% bad), with independents split. Across regions, between 53 percent and 58 percent support lowering the share of votes required to pass local special taxes. Support is higher among lower-income residents (61%) compared with middle- (53%) and higher-income (49%) residents and among Latinos (62%) compared with Asians (52%) and whites (50%).
“Fiscal reforms have been proposed to address the structural issues in the state budget and local budget issues. For each of the following, please say if you think the proposal is a good idea or a bad idea.”
All adults
Party Likely voters Dem Rep Ind
How about establishing a two-year state budget cycle rather than the one-year cycle we currently have?
Good idea 56% 55% 44% 54% 49%
Bad idea 36 36 45 37 41
Don't know 9 9 11 9 9
How about replacing the two-thirds vote requirement with a simple majority vote for the state legislature to pass state taxes?
Good idea 51 59 31 44 45
Bad idea 43 34 66 50 51
Don't know 6 7 3 6 4
How about replacing the two-thirds vote requirement with a 55-percent majority vote for voters to pass local special taxes?
Good idea 54 60 39 47 50
Bad idea 39 34 57 48 45
Don't know 6 6 5 5 5

PPIC Statewide Survey
December 2012 Californians and the Future 20
PROPOSITION 13
There is talk periodically of changing the Proposition 13 property tax limits that voters approved in 1978. These discussions have resurfaced in the wake of the November election, which gave Democrats a two-thirds majority in the legislature and resulted in the passage of the Proposition 30 tax initiative. Californians remain highly positive in their assessment of the overall impact of Proposition 13. Six in 10 adults (60%) and 64 percent of likely voters say Proposition 13 has been mostly a good thing for California, while three in 10 adults (31%) and likely voters (29%) say Proposition 13 has been mostly a bad thing. Since we began asking this question in February 2003, majorities of adults have considered Proposition 13 mostly a good thing in all but one survey (May 2005)—and even then a plurality (47%) said good thing. Majorities across political groups today say that Proposition 13 is mostly a good thing, with Democrats (55%) less likely than independents (63%) and Republicans (79%) to hold this view. Majorities across political ideologies, regions, and demographic groups have a positive view, including most whites (68%), Asians (59%), and Latinos (55%).
“Proposition 13 is the 1978 ballot measure that limits the property tax rate to 1 percent of assessed value at time of purchase and annual tax increases to no more than 2 percent
until the property is sold. Overall, do you feel passing Proposition 13 turned out to be mostly a good thing for California or mostly a bad thing?”
All adults
Party Likely voters
Dem Rep Ind
Mostly a good thing 60% 55% 79% 63% 64%
Mostly a bad thing 31 36 13 28 29
Mixed (volunteered) 1 2 1 1 1
Don’t know 7 7 6 9 6
Overall perceptions of the local impacts of Proposition 13 are mixed. A plurality of adults (36%) say that Proposition 13 has had no effect on local government services provided to residents in California; similar proportions say that Proposition 13 has had a good effect (29%) and a bad effect (25%). While Democrats are more likely to say there have been bad effects than good effects, Republicans and independents are most likely to say there have been no effects (and they are more likely to say that the effects have been good than bad). Whites (33%) are more likely than Asians (26%) and Latinos (25%) to say that Proposition 13 has had a good effect on local government services provided to California residents. Among those who say that Proposition 13 has been mostly a good thing, 41 percent say it has had no effect on local government services, 41 percent say it has had a good effect, and 12 percent say it has had a bad effect. Californians gave similarly mixed reviews of the local effect of Proposition 13 in March 2011, May 2008, and February 2003. In September 1998, 38 percent said its effect was good, 23 percent said bad, and 27 percent said it had no effect on local government services. In every survey, fewer than four in 10 adults have said its effect on local government services has been good.
“Overall, do you think the property tax limitations imposed by Proposition 13 have had a good effect or a bad effect or no effect on local government services provided to residents in the state of California?”
All adults
Party Likely voters
Dem Rep Ind
Good effect 29% 24% 37% 29% 30%
Bad effect 25 35 12 22 26
No effect 36 28 42 40 32
Don’t know 10 13 9 9 11

PPIC Statewide Survey
December 2012 Californians and the Future 21
EXPANDING THE TAX BASE
Proposition 13 limits both residential and commercial property taxes. Among the Proposition 13 reforms that have been proposed is the so-called split roll property tax, which would change the way commercial property taxes are assessed. This reform may be considered, given legislative Democrats’ new two-thirds majority. Majorities of adults (57%) and likely voters (58%) favor having commercial properties taxed according to their current market value. The results were similar in January 2012 (60% of adults and likely voters were in favor). In response to a similar question, majorities of adults said it is a good idea to tax commercial properties at their current value in five surveys conducted between February 2003 and September 2009. Today, majorities of Democrats and independents favor the proposal to change the taxes on commercial properties while Republicans are divided. Majorities across regions and demographic groups are in favor, but support varies widely between liberals (70%), moderates (57%), and conservatives (47%). Of those who say that Proposition 13 has been mostly a bad thing for California, 59 percent favor and 36 percent oppose taxing commercial properties according to their current market value. Even among those who say Proposition 13 has been a good thing, 56 percent favor this change (39% oppose).
“Under Proposition 13, residential and commercial property taxes are both strictly limited. What do you think about having commercial properties taxed according to their current market value?
Do you favor or oppose this proposal?”
All adults
Party Likely voters
Dem Rep Ind
Favor 57% 66% 47% 58% 58%
Oppose 36 26 48 36 36
Don’t know 7 8 6 5 6
In the wake of the passage of the Proposition 30 tax initiative, how receptive are Californians to raising other taxes on themselves? Strong majorities of adults (65%) and likely voters (68%) oppose extending the sales tax to services that are not currently taxed, while fewer than three in 10 are in favor. Nearly eight in 10 adults (79%) and likely voters (78%) are opposed to increasing the vehicle license fee while just two in 10 are in favor. Majorities across parties, regions, and demographic groups are opposed to extending the sales tax to services that are not currently taxed and increasing the vehicle license fee.
Previous surveys have consistently shown that majorities of adults are opposed to extending the sales tax to services and increasing the vehicle license fee. Since these questions were last asked in May 2011, there has been a sharp increase in opposition to extending the sales tax (from 54% to 65%) and increasing the vehicle license fee (from 64% to 79%). In fact, current opposition to taxing services matches the record high from May 2007 and opposition to increasing the vehicle license fee is at an historic high. Opposition to both proposals is also at record highs among likely voters.
“New revenue sources have been proposed to address the state budget situation. For each of the following, please say if you favor or oppose the proposal.”
All adults Party Likely
voters Dem Rep Ind
How about extending the state sales tax to services that are not currently taxed?
Favor 29% 36% 14% 27% 26%
Oppose 65 56 83 64 68
Don't know 6 8 3 9 6
How about increasing the vehicle license fee?
Favor 20 24 8 24 20
Oppose 79 74 91 74 78
Don't know 1 2 1 2 2

PPIC Statewide Survey
December 2012 Californians and the Future 22
INITIATIVE PROCESS
The November 6 election in California included 11 state propositions that went to the ballot through the citizens’ initiative process. We asked the November election voters in our survey to assess the information they had to make ballot choices. Eight in 10 election voters say they were very (37%) or somewhat (43%) satisfied with the amount of information that they had about the propositions. Only two in 10 election voters report that they were not too (13%) or not at all (6%) satisfied. Most election voters across regions and demographic groups were at least somewhat satisfied with the information they had to make decisions. More Democrats than Republicans (43% to 30%) and more liberals than conservatives (41% to 34%) say they were very satisfied.
We also asked this question after the November 2008 election, when there were 12 state propositions on the ballot. A similar 84 percent of November election voters were either very (34%) or somewhat (50%) satisfied with the information they had in making decisions on ballot propositions. At least eight in 10 across political, regional, and demographic groups reported that they were at least somewhat satisfied.
“Overall, how satisfied were you with the information you had to make choices on the ballot propositions?”
Nov. 6 election voters only All Nov. 6 election voters
Party
Dem Rep Ind
Very satisfied 37% 43% 30% 32%
Somewhat satisfied 43 40 45 47
Not too satisfied 13 13 15 13
Not at all satisfied 6 4 9 7
Don’t know 1 1 1 –
Another indication of Californians’ general satisfaction with the initiative process is their overall perception of its public policy consequences. About six in 10 adults (59%) and likely voters (59%) say that the public policy decisions made by California voters are probably better than those made by the governor and state legislature. Only one in four adults (26%) and likely voters (24%) say that California voters’ public policy decisions are probably worse than those made by the governor and state legislature. Majorities across political, regional, and demographic groups believe that the public policy decisions of California voters are probably better than those made by the governor and state legislature.
Californians gave similarly positive responses in the May 2011 survey (62% better, 23% worse) as well as in every survey since we began asking this question in October 2000 (56% better, 24% worse).
“Overall, do you think public policy decisions made through the initiative process by California voters are probably better or probably worse than public policy
decisions made by the governor and state legislature?”
All adults
Party Likely voters
Dem Rep Ind
Probably better 59% 64% 58% 61% 59%
Probably worse 26 22 27 23 24
Same (volunteered) 4 2 7 6 6
Don’t know 11 12 8 10 11

PPIC Statewide Survey
December 2012 Californians and the Future 23
INITIATIVE REFORMS
While the initiative process is consistently popular with Californians, some say that improvements are needed and a number of changes have been proposed over the past few years. We asked about three initiative reforms, and two had very strong support.
Overwhelming majorities of adults (76%) and likely voters (86%) are in favor of requiring the yes and no campaigns for initiatives to increase disclosure of their contributors. Eight in 10 or more Democrats, Republicans, and independents support this type of initiative reform. Strong majorities across regional and demographic groups favor more disclosure of initiative contributors. When we asked a similar question in recent surveys, more than seven in 10 Californians favored increased public disclosure of funding sources for signature gathering and initiative campaigns.
Strong majorities of adults (69%) and likely voters (66%) favor requiring voters to renew initiatives after a certain number of years by voting on them again. The level of support is similar among Democrats (68%), Republicans (66%), and independents (71%). Strong majorities across regions and demographic groups favor the idea of requiring voters to renew initiatives after a certain number of years by voting on them again.
Fewer than half of adults (48%) are in favor and 45 percent are opposed to allowing the legislature, with the governor’s approval, to amend initiatives after a certain number of years. More than half of likely voters are opposed (40% favor, 55% oppose). While a majority of Democrats (54%) are in favor of this reform, a strong majority of Republicans (68%) are opposed, and independents are divided (46% favor, 48% oppose). This proposal to allow the legislature to amend initiatives after a certain number of years receives majority support among the following groups: adults under 35 (58%), liberals (57%), San Francisco Bay Area residents (55%), Latinos (53%), renters (53%), those with annual household incomes below $40,000 (52%), those with a high school education or less (52%), and Asians (51%). A majority of those who approve of the job performance of the governor (55%) and the legislature (61%) support this change, while majorities of those who disapprove of the governor (61%) and the state legislature (58%) oppose it. When we asked a similar question about the legislature amending initiatives after six years, half of Californians were opposed in both October 2005 (37% favor, 51% oppose) and October 1998 (44% favor, 49% oppose).
“Reforms have been suggested to address issues that arise in California’s initiative process. Please say whether you would favor or oppose each of the following reform proposals. How about…”
All adults Party Likely
voters Dem Rep Ind
Requiring the yes and no campaigns for initiatives to increase disclosure of their contributors?
Favor 76% 83% 80% 85% 86%
Oppose 18 13 16 10 11
Don't know 6 4 4 4 4
Requiring voters to renew initiatives after a certain number of years, by voting on them again?
Favor 69 68 66 71 66
Oppose 27 28 31 28 30
Don't know 4 4 3 1 3
Allowing the legislature, with the governor’s approval, to amend initiatives after a certain number of years?
Favor 48 54 28 46 40
Oppose 45 39 68 48 55
Don't know 7 7 4 5 5

December 2012 Californians and the Future 24
REGIONAL MAP

December 2012 Californians and the Future 25
METHODOLOGY
The PPIC Statewide Survey is directed by Mark Baldassare, president and CEO and survey director at the Public Policy Institute of California, with assistance from Sonja Petek, project manager for this survey, and survey research associates Dean Bonner and Jui Shrestha. This survey, Californians and the Future, was supported with funding from the S.D. Bechtel, Jr. Foundation, The San Francisco Foundation, The David and Susan Coulter Family Foundation, and the Walter S. Johnson Foundation. We benefit from discussions with PPIC staff, foundation staff, and other policy experts, but the methods, questions, and content of this report were determined solely by Mark Baldassare and the survey team.
Findings in this report are based on a survey of 2,001 California adult residents, including 1,601 interviewed on landline telephones and 400 interviewed on cell phones. Interviews took an average of 20 minutes to complete. Interviewing took place on weekend days and weekday nights from November 13–20, 2012.
Landline interviews were conducted using a computer-generated random sample of telephone numbers that ensured that both listed and unlisted numbers were called. All landline telephone exchanges in California were eligible for selection, and the sample telephone numbers were called as many as six times to increase the likelihood of reaching eligible households. Once a household was reached, an adult respondent (age 18 or older) was randomly chosen for interviewing using the “last birthday method” to avoid biases in age and gender.
Cell phones were included in this survey to account for the growing number of Californians who use them. These interviews were conducted using a computer-generated random sample of cell phone numbers. All cell phone numbers with California area codes were eligible for selection, and the sample telephone numbers were called as many as eight times to increase the likelihood of reaching an eligible respondent. Once a cell phone user was reached, it was verified that this person was age 18 or older, a resident of California, and in a safe place to continue the survey (e.g., not driving).
Cell phone respondents were offered a small reimbursement to help defray the cost of the call. Cell phone interviews were conducted with adults who have cell phone service only and with those who have both cell phone and landline service in the household.
Live landline and cell phone interviews were conducted by Abt SRBI, Inc., in English and Spanish, according to respondents’ preferences. Accent on Languages, Inc., translated new survey questions into Spanish, with assistance from Renatta DeFever.
With assistance from Abt SRBI we used data from the U.S. Census Bureau’s 2007–2009 American Community Survey (ACS) through the University of Minnesota’s Integrated Public Use Microdata Series for California to compare certain demographic characteristics of the survey sample—region, age, gender, race/ethnicity, and education—with the characteristics of California’s adult population. The survey sample was closely comparable to the ACS figures. Abt SRBI used data from the 2008 National Health Interview Survey and data from the 2007–2009 ACS for California both to estimate landline and cell phone service in California and to compare the data against landline and cell phone service reported in this survey. We also used voter registration data from the California Secretary of State to compare the party registration of registered voters in our sample to party registration statewide. The landline and cell phone samples were then integrated using a frame integration weight, while sample balancing adjusted for differences across regional, age, gender, race/ethnicity, education, telephone service, and party registration groups.

PPIC Statewide Survey
December 2012 Californians and the Future 26
The sampling error, taking design effects from weighting into consideration, is ±3.5 percent at the 95 percent confidence level for the total sample of 2,001 adults. This means that 95 times out of 100, the results will be within 3.5 percentage points of what they would be if all adults in California were interviewed. The sampling error for subgroups is larger: For the 1,334 registered voters, it is ±3.7 percent; for the 1,025 likely voters, it is ±4 percent; for the 1,172 registered voters who say they voted in the November 6th election, it is ±3.8%; for the 778 parents of children 18 or younger, it is ±5.9 percent. Sampling error is only one type of error to which surveys are subject. Results may also be affected by factors such as question wording, question order, and survey timing.
We present results for four geographic regions, accounting for approximately 90 percent of the state population. “Central Valley” includes Butte, Colusa, El Dorado, Fresno, Glenn, Kern, Kings, Madera, Merced, Placer, Sacramento, San Joaquin, Shasta, Stanislaus, Sutter, Tehama, Tulare, Yolo, and Yuba Counties. “San Francisco Bay Area” includes Alameda, Contra Costa, Marin, Napa, San Francisco, San Mateo, Santa Clara, Solano, and Sonoma Counties. “Los Angeles” refers to Los Angeles County, and “Other Southern California” includes Orange, Riverside, San Bernardino, and San Diego Counties. Residents of other geographic areas are included in the results reported for all adults, registered voters, likely voters, November 6 voters, and parents, but sample sizes for these less populated areas are not large enough to report separately. Within coastal counties, the “north/central coast” region refers to the counties along the California coast northward from San Luis Obispo County to Del Norte County and includes all the San Francisco Bay Area counties. The “south coast” region includes Santa Barbara, Ventura, Los Angeles, Orange, and San Diego Counties. All other counties are included in the “inland” region.
We present specific results for non-Hispanic whites and for Latinos, who account for about a third of the state’s adult population and constitute one of the fastest-growing voter groups. We also present results for non-Hispanic Asians, who make up about 14 percent of the state’s adult population. Results for other racial/ethnic groups—such as non-Hispanic blacks and Native Americans—are included in the results reported for all adults, registered voters, likely voters, November 6 voters, and parents, but sample sizes are not large enough for separate analysis. We compare the opinions of those who report they are registered Democrats, registered Republicans, and decline-to-state or independent voters; the results for those who say they are registered to vote in other parties are not large enough for separate analysis. We also analyze the responses of likely voters—so designated by their responses to voter registration survey questions, previous election participation, and current interest in politics.
The percentages presented in the report tables and in the questionnaire may not add to 100 due to rounding.
We compare current PPIC Statewide Survey results to those in our earlier surveys. Additional details about our methodology can be found at www.ppic.org/content/other/SurveyMethodology.pdf and are available upon request through [email protected].
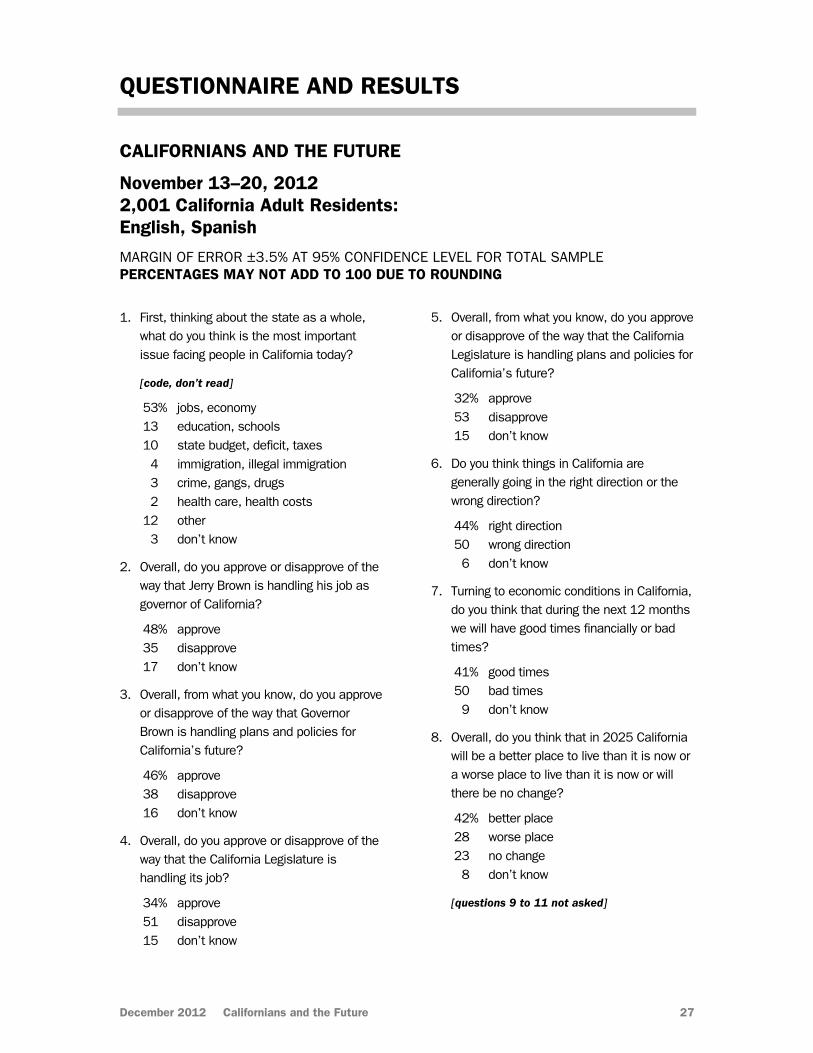
December 2012 Californians and the Future 27
QUESTIONNAIRE AND RESULTS
CALIFORNIANS AND THE FUTURE
November 13–20, 2012 2,001 California Adult Residents: English, Spanish
MARGIN OF ERROR ±3.5% AT 95% CONFIDENCE LEVEL FOR TOTAL SAMPLE PERCENTAGES MAY NOT ADD TO 100 DUE TO ROUNDING
1. First, thinking about the state as a whole, what do you think is the most important issue facing people in California today?
[code, don’t read]
53% jobs, economy 13 education, schools 10 state budget, deficit, taxes 4 immigration, illegal immigration 3 crime, gangs, drugs 2 health care, health costs 12 other 3 don’t know
2. Overall, do you approve or disapprove of the way that Jerry Brown is handling his job as governor of California?
48% approve 35 disapprove 17 don’t know
3. Overall, from what you know, do you approve or disapprove of the way that Governor Brown is handling plans and policies for California’s future?
46% approve 38 disapprove 16 don’t know
4. Overall, do you approve or disapprove of the way that the California Legislature is handling its job?
34% approve 51 disapprove 15 don’t know
5. Overall, from what you know, do you approve or disapprove of the way that the California Legislature is handling plans and policies for California’s future?
32% approve 53 disapprove 15 don’t know
6. Do you think things in California are generally going in the right direction or the wrong direction?
44% right direction 50 wrong direction 6 don’t know
7. Turning to economic conditions in California, do you think that during the next 12 months we will have good times financially or bad times?
41% good times 50 bad times 9 don’t know
8. Overall, do you think that in 2025 California will be a better place to live than it is now or a worse place to live than it is now or will there be no change?
42% better place 28 worse place 23 no change 8 don’t know
[questions 9 to 11 not asked]

PPIC Statewide Survey
December 2012 Californians and the Future 28
12. Next, do you think the state budget situation in California—that is, the balance between government spending and revenues—is a big problem, somewhat of a problem, or not a problem for the people of California today?
68% big problem 26 somewhat of a problem 4 not a problem 2 don’t know
12a.As you may know, voters passed Proposition 30 on the November 6th ballot. Proposition 30 will increase taxes on earnings over $250,000 for seven years and sales taxes by ¼ cent for four years, to fund schools, and it guarantees public safety realignment funding. Does the passage of Proposition 30 make you more optimistic about the state’s budget situation, more pessimistic, or does this not change the way you feel about California’s budget situation?
46% more optimistic 23 more pessimistic 28 does not change the way I feel 3 don’t know
13. In general, which of the following statements do you agree with more—[rotate] (1) I’d rather pay higher taxes and have a state government that provides more services, [or] (2) I’d rather pay lower taxes and have a state government that provides fewer services?
55% higher taxes and more services 40 lower taxes and fewer services 6 don’t know
Fiscal reforms have been proposed to address the structural issues in the state budget and local budget issues. For each of the following, please say if you think the proposal is a good idea or a bad idea.
[rotate questions 14 to 19]
14. How about strictly limiting the amount of money that state spending could increase each year?
65% good idea 28 bad idea 7 don’t know
15. How about increasing the size of the state's rainy day fund and requiring above-average revenues to be deposited into it for use during economic downturns?
72% good idea 21 bad idea 7 don’t know
16. How about replacing the two-thirds vote requirement with a simple majority vote for the state legislature to pass state taxes?
51% good idea 43 bad idea 6 don’t know
17. How about establishing a two-year state budget cycle rather than the one-year cycle we currently have?
56% good idea 36 bad idea 9 don’t know
18. How about requiring that any major new or expanded state programs or tax reductions identify a specific funding source?
79% good idea 13 bad idea 8 don’t know
19. How about replacing the two-thirds vote requirement with a 55-percent majority vote for voters to pass local special taxes?
54% good idea 39 bad idea 6 don’t know

PPIC Statewide Survey
December 2012 Californians and the Future 29
Other reforms have been proposed to address state governance issues. For each of the following, please say if you think the proposal is a good idea or a bad idea.
[rotate questions 20 to 22]
20. How about changing the California Legislature from full-time status to part-time status?
48% good idea 45 bad idea 7 don’t know
21. How about changing the California Legislature from two houses—the 80-member state assembly and 40-member state senate—to a single house with 120 members?
36% good idea 51 bad idea 13 don’t know
22. How about increasing the number of legislators in the California Legislature so that each member represents fewer people?
40% good idea 53 bad idea 7 don’t know
On another topic…
[rotate questions 23 and 24]
23. Proposition 11 is the 2008 ballot measure passed by voters that established a citizens’ commission to redraw the physical boundaries of the state’s voting districts rather than having the state legislature and governor make these redistricting decisions. Overall, do you feel that passing Proposition 11 turned out to be mostly a good thing for California or mostly a bad thing?
58% mostly a good thing 21 mostly a bad thing 2 mixed (volunteered) 18 don’t know
24. Proposition 14 is the 2010 ballot measure passed by voters that changed California’s state primary elections from a partially closed system to a top-two primary system in which voters now cast primary election ballots for any candidate—regardless of party—and the two candidates receiving the most votes—regardless of party—advance to the general election. Overall, do you feel that passing Proposition 14 turned out to be mostly a good thing for California or mostly a bad thing?
63% mostly a good thing 23 mostly a bad thing 2 mixed (volunteered) 13 don’t know
[questions 25 and 26 not asked]
New revenue sources have been proposed to address the state budget situation. For each of the following, please say if you favor or oppose the proposal.
[rotate questions 27 and 28]
27. How about extending the state sales tax to services that are not currently taxed?
29% favor 65 oppose 6 don’t know
28. How about increasing the vehicle license fee?
20% favor 79 oppose 1 don’t know

PPIC Statewide Survey
December 2012 Californians and the Future 30
29. Next, Proposition 13 is the 1978 ballot measure that limits the property tax rate to 1 percent of assessed value at time of purchase and annual tax increases to no more than 2 percent until the property is sold. Overall, do you feel passing Proposition 13 turned out to be mostly a good thing for California or mostly a bad thing?
60% mostly a good thing 31 mostly a bad thing 1 mixed (volunteered) 7 don’t know
30. And, overall, do you think the property tax limitations imposed by Proposition 13 have had a good effect or a bad effect or no effect on local government services provided to residents in the state of California?
29% good effect 25 bad effect 36 no effect 10 don’t know
31. Under Proposition 13, residential and commercial property taxes are both strictly limited. What do you think about having commercial properties taxed according to their current market value? Do you favor or oppose this proposal?
57% favor 36 oppose 7 don’t know
Changing topics, I’m going to read you a list of issues people have mentioned when talking about California’s public higher education system today. For each one, please tell me if you think it is a big problem, somewhat of a problem, or not much of a problem. First…
[rotate questions 32 to 34]
32. How about the overall accessibility of education for students in California’s public colleges and universities today?
43% big problem 31 somewhat of a problem 24 not much of a problem 1 don’t know
33. How about the overall affordability of education for students in California’s public colleges and universities today?
65% big problem 23 somewhat of a problem 12 not much of a problem 1 don’t know
34. How about the overall state budget situation for California’s public colleges and universities today?
64% big problem 23 somewhat of a problem 11 not much of a problem 2 don’t know
35. In general, how important is California’s public higher education system to the quality of life and economic vitality of the state over the next 20 years—very important, somewhat important, not too important, or not at all important?
85% very important 11 somewhat important 1 not too important 1 not at all important 1 don’t know
36. In thinking ahead 20 years, if current trends continue, do you think California will have [rotate 1 and 2] (1) more than enough, (2) not enough, [or] just enough college-educated residents needed for the jobs and skills likely to be in demand?
14% more than enough 56 not enough 28 just enough 2 don’t know
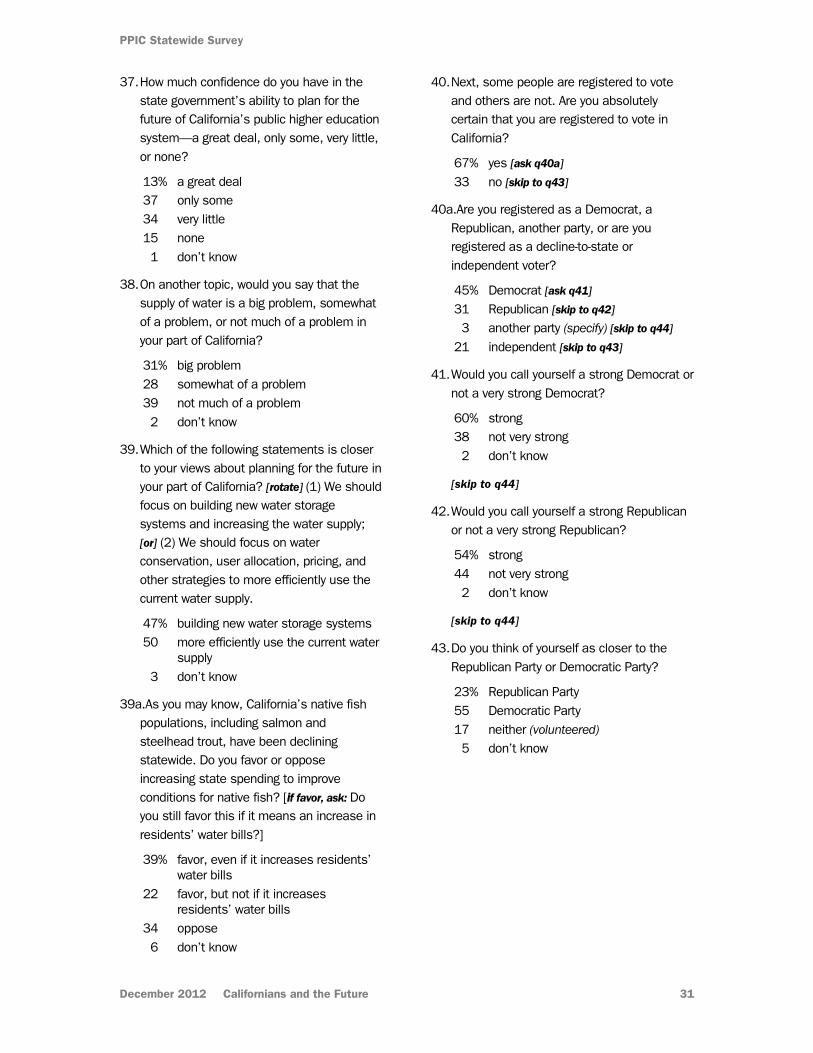
PPIC Statewide Survey
December 2012 Californians and the Future 31
37. How much confidence do you have in the state government’s ability to plan for the future of California’s public higher education system—a great deal, only some, very little, or none?
13% a great deal 37 only some 34 very little 15 none 1 don’t know
38. On another topic, would you say that the supply of water is a big problem, somewhat of a problem, or not much of a problem in your part of California?
31% big problem 28 somewhat of a problem 39 not much of a problem 2 don’t know
39. Which of the following statements is closer to your views about planning for the future in your part of California? [rotate] (1) We should focus on building new water storage systems and increasing the water supply; [or] (2) We should focus on water conservation, user allocation, pricing, and other strategies to more efficiently use the current water supply.
47% building new water storage systems 50 more efficiently use the current water
supply 3 don’t know
39a.As you may know, California’s native fish populations, including salmon and steelhead trout, have been declining statewide. Do you favor or oppose increasing state spending to improve conditions for native fish? [if favor, ask: Do you still favor this if it means an increase in residents’ water bills?]
39% favor, even if it increases residents’ water bills
22 favor, but not if it increases residents’ water bills
34 oppose 6 don’t know
40. Next, some people are registered to vote and others are not. Are you absolutely certain that you are registered to vote in California?
67% yes [ask q40a] 33 no [skip to q43]
40a.Are you registered as a Democrat, a Republican, another party, or are you registered as a decline-to-state or independent voter?
45% Democrat [ask q41]
31 Republican [skip to q42]
3 another party (specify) [skip to q44] 21 independent [skip to q43]
41. Would you call yourself a strong Democrat or not a very strong Democrat?
60% strong 38 not very strong 2 don’t know
[skip to q44]
42. Would you call yourself a strong Republican or not a very strong Republican?
54% strong 44 not very strong 2 don’t know
[skip to q44]
43. Do you think of yourself as closer to the Republican Party or Democratic Party?
23% Republican Party 55 Democratic Party 17 neither (volunteered)
5 don’t know

PPIC Statewide Survey
December 2012 Californians and the Future 32
Now, thinking about the November 6th election, the ballot included 11 state propositions.
44. [Nov. 6 election voters only] Overall, how satisfied were you with the information you had to make choices on the ballot propositions—very satisfied, somewhat satisfied, not too satisfied, or not at all satisfied?
37% very satisfied 43 somewhat satisfied 13 not too satisfied 6 not at all satisfied 1 don’t know
45. Overall, do you think public policy decisions made through the initiative process by California voters are probably better or probably worse than public policy decisions made by the governor and state legislature?
59% probably better 26 probably worse 4 same (volunteered) 11 don’t know
Reforms have been suggested to address issues that arise in California’s initiative process. Please say whether you would favor or oppose each of the following reform proposals.
[rotate questions 46 to 47a]
46. How about requiring voters to renew initiatives after a certain number of years, by voting on them again?
69% favor 27 oppose 4 don’t know
47. How about allowing the legislature, with the governor’s approval, to amend initiatives after a certain number of years?
48% favor 45 oppose 7 don’t know
47a.How about requiring the yes and no campaigns for initiatives to increase disclosure of their contributors?
76% favor 18 oppose 6 don’t know
48. Next, would you consider yourself to be politically: [read list, rotate order top to bottom]
11% very liberal 20 somewhat liberal 29 middle-of-the-road 23 somewhat conservative 14 very conservative 2 don’t know
49. Generally speaking, how much interest would you say you have in politics—a great deal, a fair amount, only a little, or none?
24% great deal 38 fair amount 33 only a little 5 none – don’t know
[d1-d4a: demographic questions]
d4b. [parents of children 18 or younger only] What do you hope will be the highest grade level that your youngest child will achieve: some high school; high school graduate; two-year community college graduate or career technical training; four-year college graduate; or a graduate degree after college?
2% some high school 2 high school graduate 6 two-year community college graduate
or career technical training 36 four-year college graduate 51 a graduate degree after college 2 don’t know
[d5-d16: demographic questions]

PPIC STATEWIDE SURVEY ADVISORY COMMITTEE
Ruben Barrales President and CEO San Diego Regional Chamber of Commerce
Angela Blackwell Founder and CEO PolicyLink
Mollyann Brodie Senior Vice President Kaiser Family Foundation
Bruce E. Cain Director Bill Lane Center for the American West Stanford University
James E. Canales President The James Irvine Foundation
Jon Cohen Director of Polling The Washington Post
Russell Hancock President and CEO Joint Venture Silicon Valley Network
Sherry Bebitch Jeffe Senior Scholar School of Policy, Planning, and Development University of Southern California
Robert Lapsley President California Business Roundtable
Carol S. Larson President and CEO The David and Lucile Packard Foundation
Monica Lozano Publisher and CEO La Opinión
Donna Lucas Chief Executive Officer Lucas Public Affairs
Lisa Pitney Vice President, Government Relations The Walt Disney Company
Dan Rosenheim News Director KPIX-TV
Robert K. Ross, M.D. President and CEO The California Endowment
Most Reverend Jaime Soto Bishop of Sacramento Roman Catholic Diocese of Sacramento
Cathy Taylor Vice President and Editorial Commentary Director Orange County Register
Carol Whiteside President Emeritus Great Valley Center
The PPIC Statewide Survey Advisory Committee is a diverse group of experts who provide advice on survey issues.
However, survey methods, questions, content, and timing are determined solely by PPIC.

PPIC BOARD OF DIRECTORS
Gary K. Hart, Chair Former State Senator and Secretary of Education State of California
Mark Baldassare President and CEO Public Policy Institute of California
Ruben Barrales President and CEO San Diego Regional Chamber of Commerce
María Blanco Vice President, Civic Engagement California Community Foundation
Brigitte Bren Attorney
Robert M. Hertzberg Vice Chairman Mayer Brown, LLP
Walter B. Hewlett Chair, Board of Directors William and Flora Hewlett Foundation
Donna Lucas Chief Executive Officer Lucas Public Affairs
David Mas Masumoto Author and Farmer
Steven A. Merksamer Senior Partner Nielsen, Merksamer, Parrinello, Gross & Leoni, LLP
Kim Polese Chairman ClearStreet, Inc.
Thomas C. Sutton Retired Chairman and CEO Pacific Life Insurance Company

The Public Policy Institute of California is dedicated to informing and improving public policy in California through independent, objective, nonpartisan research on major economic, social, and political issues. The institute’s goal is to raise public awareness and to give elected representatives and other decisionmakers a more informed basis for developing policies and programs.
The institute’s research focuses on the underlying forces shaping California’s future, cutting across a wide range of public policy concerns, including economic development, education, environment and resources, governance, population, public finance, and social and health policy.
PPIC is a private operating foundation. It does not take or support positions on any ballot measures or on any local, state, or federal legislation, nor does it endorse, support, or oppose any political parties or candidates for public office. PPIC was established in 1994 with an endowment from William R. Hewlett.
Mark Baldassare is President and CEO of PPIC. Gary K. Hart is Chair of the Board of Directors.
Short sections of text, not to exceed three paragraphs, may be quoted without written permission provided that full attribution is given to the source and the copyright notice below is included. Copyright © 2012 Public Policy Institute of California All rights reserved. San Francisco, CA PUBLIC POLICY INSTITUTE OF CALIFORNIA 500 Washington Street, Suite 600 San Francisco, California 94111 phone: 415.291.4400 fax: 415.291.4401
PPIC SACRAMENTO CENTER Senator Office Building 1121 L Street, Suite 801 Sacramento, California 95814 phone: 916.440.1120 fax: 916.440.1121
www.ppic.org [email protected]
Related Documents