& PPIC STATEWIDE SURVEY Californians Mark Baldassare Dean Bonner Jennifer Paluch Sonja Petek CONTENTS About the Survey 1 Press Release 3 State Issues 7 National Issues 19 Regional Map 26 Methodology 27 Questionnaire and Results 29 in collaboration with The James Irvine Foundation their government SEPTEMBER 2009

Welcome message from author
This document is posted to help you gain knowledge. Please leave a comment to let me know what you think about it! Share it to your friends and learn new things together.
Transcript
&
ppic statewide sur vey
Californians Mark Baldassare
Dean Bonner
Jennifer Paluch
Sonja Petek
CONTENTS
About the Survey 1
Press Release 3
State Issues 7
National Issues 19
Regional Map 26
Methodology 27
Questionnaire and Results 29
in collaboration with
The James Irvine Foundation
their government
s e p t e m b e r 2 0 0 9
Copyright © 2009 Public Policy Institute of California
All rights reserved.
San Francisco, CA
Short sections of text not to exceed three paragraphs may be quoted without written permission provided that full attribution is given to the source and the above copyright notice is included.
The Public Policy Institute of California is dedicated to informing and improving public policy in California through independent, objective, nonpartisan research on major economic, social, and political issues. The institute’s goal is to raise public awareness and to give elected representatives and other decisionmakers a more informed basis for developing policies and programs.
The institute’s research focuses on the underlying forces shaping California’s future, cutting across a wide range of public policy concerns, including economic development, education, environment and resources, governance, population, public finance, and social and health policy.
PPIC is a private operating foundation. It does not take or support positions on any ballot measures or on any local, state, or federal legislation, nor does it endorse, support, or oppose any political parties or candidates for public office. PPIC was established in 1994 with an endowment from William R. Hewlett.
Mark Baldassare is President and Chief Executive Officer of PPIC. Walter B. Hewlett is Chair of the Board of Directors.
PUBLIC POLICY INSTITUTE OF CALIFORNIA 500 Washington Street, Suite 600 San Francisco, California 94111 phone: 415.291.4400 fax: 415.291.4401 PPIC SACRAMENTO CENTER Senator Office Building 1121 L Street, Suite 801 Sacramento, California 95814 phone: 916.440.1120 fax: 916.440.1121 www.ppic.org
1
ABOUT THE SURVEY
The PPIC Statewide Survey series provides policymakers, the media, and the public with objective, advocacy-free information on the perceptions, opinions, and public policy preferences of California residents. Inaugurated in April 1998, this is the 101st PPIC Statewide Survey in a series that has generated a database that includes the responses of more than 216,000 Californians.
This survey is the 37th in the Californians and Their Government series, which is conducted periodically to examine the social, economic, and political trends that influence public policy preferences and ballot choices. The series is supported with funding from The James Irvine Foundation. This survey seeks to raise public awareness, inform decisionmakers about public opinions, and stimulate public discussion and debate about important state and national issues.
The context for the survey is the continuing weakness in the state and national economies—-including high unemployment rates, lower housing prices, lower consumer spending, and declines in state and local tax revenues—amidst signs of recovery in the financial markets; a recent state budget agreement by the governor and legislature that led to significant reductions in state and local government spending; calls for fiscal and political reforms in California state government; and at the federal level, Congressional debate over proposals for health care reform.
This survey presents the responses of 2,006 adult residents throughout the state, interviewed in multiple languages and reached by landline and cell phone. It includes their opinions on the following topics:
State issues, including perceptions of the most important issue facing California today; opinions about the general direction and economic outlook for the state; personal concerns about housing costs, and perceptions of the recession’s severity; approval ratings for Governor Schwarzenegger, the state legislature, and respondents’ individual legislative representatives. The survey also looks at Californians’ levels of trust in Sacramento; their perceptions of the seriousness of the state budget situation and their concern about the effects of spending cuts on local government services; preference for size of government; support for structural fiscal reform, including changing the two-thirds legislative vote requirement for passing a budget, as well as opinions about changing Proposition 13; and legislative reform such as changes to term limits. We examine residents’ perceptions of policy made by voters directly at the ballot box, of initiative reforms, and whether changes are needed in the California Constitution.
National issues, including approval ratings for President Obama, Congress, Senators Barbara Boxer and Dianne Feinstein, House Speaker Nancy Pelosi, and respondents’ own congressional representatives; attitudes toward the federal stimulus plan, health care reform, immigration policy, and homeland security and terrorism.
Time trends, and the extent to which Californians—based on their political party affiliation, region of residence, race/ethnicity, and other demographics—may differ with regard to perceptions, attitudes, and preferences involving state and national issues.
This report may be downloaded free of charge from our website (www.ppic.org). For questions about the survey, please contact [email protected]. View our searchable PPIC Statewide Survey database online at http://www.ppic.org/main/survAdvancedSearch.asp.

3
NEWS RELEASE
EMBARGOED: Do not publish or broadcast until 10:00 p.m. PDT on Thursday, September 10, 2009
Para ver este comunicado de prensa en español,por favor visite nuestra página de internet: http://www.ppic.org/main/pressreleaseindex.asp
PPIC STATEWIDE SURVEY: CALIFORNIANS AND THEIR GOVERNMENT
Fed Up With State Leadership, Californians Want Change But Approach Reform Cautiously THEY FAVOR OPEN PRIMARY BUT OPPOSE PART-TIME LEGISLATURE
SAN FRANCISCO, California, September 10, 2009—Californians’ trust in their state government has reached a record low, and their desire for change is high. But they are cautious about what kind of reform they are willing to support. When asked about two ideas that may reach the ballot, 70 percent support a shift to an open primary system, but only 23 percent favor changing the legislature to part-time status.
Californians’ distrust in state government runs deep. Nearly three-fourths (73%) say it is pretty much run by a few big interests looking out for themselves, a new high in the 11-year history of the PPIC Statewide Survey. Just 20 percent say that state government is run for the benefit of all of the people. A strong majority (62%) say state government wastes a lot of the money Californians pay in taxes, close to the record-high 63 percent who held this view in May.
Residents have more confidence in their own abilities to make policy decisions. A majority (56%) say that decisions made through the initiative process are probably better than those made by the governor and legislature and far fewer (28%) say they are probably worse. And Californians continue to feel that Proposition 13 and term limits—two constitutional changes made by initiative—have mainly been good for the state.
“Change is in the air, but Californians are proceeding with caution,” says Mark Baldassare, president and CEO of PPIC. “They are generally satisfied with the changes they’ve made to the constitution, and most do not think it needs major revisions.”
WORRYING ABOUT BUDGET, WANTING REFORM
The state’s protracted budget negotiations have made a strong impression on Californians. Nearly all (96%) view the budget situation as a problem, with 78 percent seeing it as a big problem and 18 percent calling it somewhat of a problem. The 78 percent figure matches a record high first reached in September 2008. A majority (60%) are very concerned about the effect of spending cuts on local government services—far more than when PPIC asked a similar but less detailed question five years ago (35% August 2004).
Most (80%) Californians say the state budget process is in need of major changes, a steady increase since March 2008 (65% March 2008, 65% May 2008, 76% September 2008, 78% May 2009). This view is held across political parties, demographic groups, and regions. Californians were asked to consider three fiscal reform ideas under discussion:
Spending cap: Most (65%) say it would be a good idea to strictly limit increases in state spending each year (28% bad idea).
CONTACT
Andrew Hattori 415-291-4417
Linda Strean 415-291-4412
PPIC
Statewide
Survey
Californians and Their Government
4 PPIC Statewide Survey
Two-thirds vote to pass a budget: A majority (53%) say it would be a good idea to lower the threshold needed for budget passage to 55 percent of the legislature (38% bad idea).
Two-thirds vote for local special taxes: Half (50%) say it would be a good idea to lower this requirement to 55 percent of voters (42% bad idea).
California’s bruising budget battles have brought calls to review the constitution. But only 33 percent of Californians say major changes to the constitution are needed, while 36 percent say minor changes are needed and 24 percent say the constitution is fine as it is.
SPLIT-ROLL, TERM LIMIT CHANGE DRAWS SUPPORT
Majorities continue to view two landmark initiatives as being good for California: Proposition 13 (55% mostly a good thing, 30% mostly a bad thing, 12% don’t know), which limits property taxes on both residential and commercial buildings, and term limits (59% good thing, 15% a bad thing, 23% no difference), which limits state legislators’ terms to six years in the assembly and eight in the senate.
But residents also support changes to these measures. A majority (58%) say it would be a good idea to tax commercial properties according to current market value, known as a “split roll.” A majority (65%) also say it would be a good idea to modify term limits by reducing the total number of years lawmakers could serve—from 14 to 12—but allowing years of service to be in either house or a combination of both.
Even though residents are pleased with direct democracy, overwhelming majorities favor two possible reforms to the initiative process:
Increasing public disclosure of funding sources for signature gathering and campaigns (81% favor, 14% oppose)
Having a period of time in which the initiative sponsor and the legislature could meet to see if a compromise is possible before putting the measure on the ballot (80% favor, 15% oppose)
TWO LEGISLATIVE REFORMS, TWO DIFFERENT RESULTS
Support has grown since March for a change in the state’s primary system that would allow voters to cast ballots for any candidate, with the top two vote-getters advancing to the general election regardless of party. Today a strong majority (70%) say that the proposal is a good idea (23% bad idea), a 9-point increase from March (61% good idea, 27% bad idea). More than two in three voters across parties and majorities across regions and demographic groups agree.
But residents’ negative views of their full-time legislature do not mean they see a shift to a part-time legislature as a solution: 44 percent say it would be a bad thing, 23 percent a good thing, and 27 percent say it would make no difference.
PESSIMISM ABOUT STATE’S DIRECTION, LOW RATINGS FOR LEADERS
Californians’ perception of the economy has improved since July, perhaps in response to recent positive economic indicators. But residents’ views are far from positive: 67 percent say the state can expect bad times financially in the next 12 months, compared to 26 percent who expect good times (75% bad times, 18% good times in July). Slightly fewer say the state is heading in the wrong direction this month than in July (72% today, 79% July), although at least 60 percent have held this negative view since March 2008.
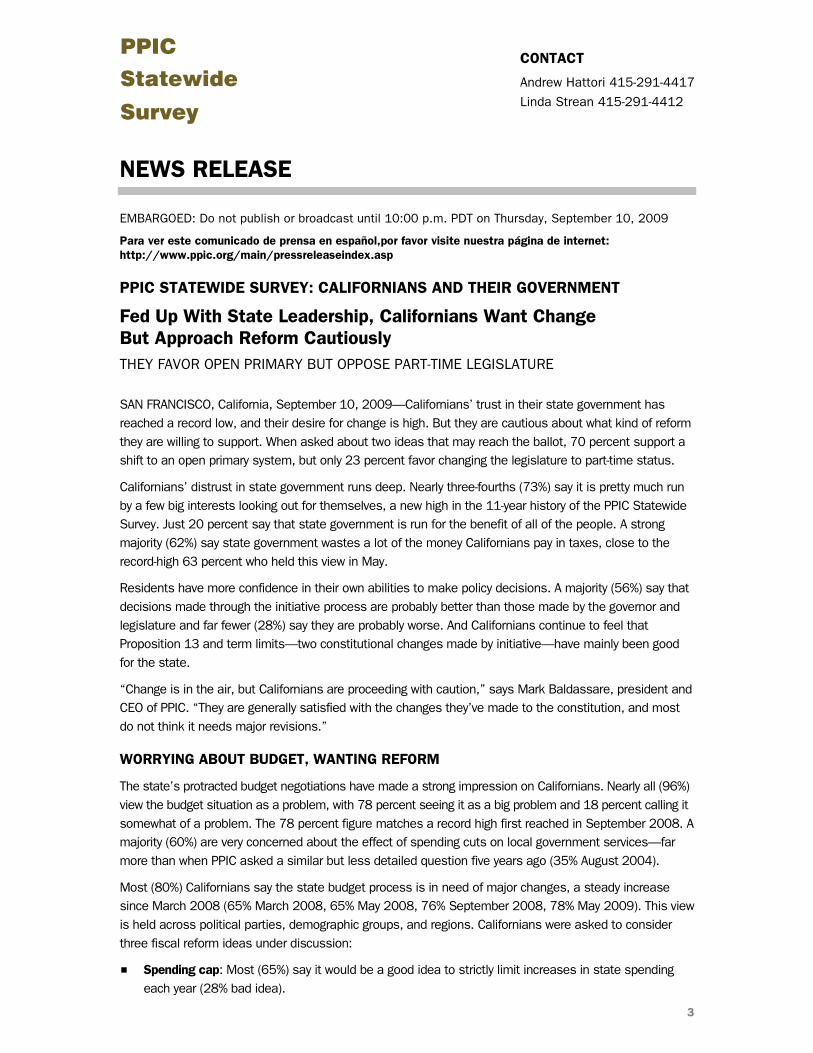
The negative views about the direction of the state are reflected in views about state leaders. Governor Arnold Schwarzenegger’s approval rating (30%) is near his record low in July (28%), and his disapproval rating has hit a new high of 61 percent. The legislature’s rating (21%) inched up from its low (17% July). Californians’ approval of their own legislators (34%) remains near its lowest level (32% March 2009).
Press Release
September 2009 5
A ROSIER VIEW OF WASHINGTON—51% FAVOR HEALTH CARE CHANGES
Californians’ opinions of their elected officials in Washington are markedly higher. A solid majority (63% approve, 32% disapprove) approve of President Barack Obama’s performance, similar to his approval rating in July (65%) but a decline from May (72%). While disapproval of the president has increased in both parties, it rose a steep 18 points among Republicans (68% today, 50% May).
California’s U.S. senators each get majority support. Both have seen increases in approval since September 2008, with 54 percent approving of Sen. Dianne Feinstein’s job performance today (48% September 2008) and 53 percent approving of Sen. Barbara Boxer’s (44% September 2008). House Speaker Nancy Pelosi has a 49 percent approval rating, also up from September 2008 (40%).
Although just 39 percent approve of the job Congress is doing—a decline from 47 percent approval in May—Californians rate their own representatives higher. A majority (56%) approve of the way their own House members handle the job, up 7 points from September 2008 (49% approve).
How do Californians feel about Washington’s impact on the state’s economy? Half (50%) say the federal government’s actions in dealing with the financial crisis will help and 43 percent say they will not. The percentage saying that federal actions will help has increased 11 points since the PPIC Statewide Survey first asked this question in October 2008 (39% yes, 47% no), and is up 6 points from January 2009 (44% yes, 43% no). However, 56 percent oppose additional federal spending to stimulate the economy, while 38 percent support it.
When asked generally about the major federal policy issue of health care, 51 percent say they support proposed changes to the system being developed by Congress and the Obama administration, while 38 percent are opposed. The state’s residents are somewhat more likely to support the proposed changes than adults are nationwide, according to an ABC News/Washington Post poll in August (45% support, 50% oppose). California’s likely voters are more divided (46% support, 42% oppose) than residents overall. And the state’s partisan differences are stark: 69 percent of Democrats support and 71 percent of Republicans oppose the proposed changes. Californians are more supportive when asked whether the government should create an insurance plan to compete with private insurers: 62 percent are in favor and 33 percent are opposed.
MORE KEY FINDINGS
Nearly half concerned about job loss—pages 8, 9
Jobs and the economy top the list of issues that Californians consider most important, and nearly half say they are very (30%) or somewhat concerned (19%) that they or someone in their family will lose a job in the next year. Another 9 percent volunteer that they have had a job loss in the family. Concern about job loss has declined since January (58%) but is about the same as in May (47%).
Recession or not, Californians see immigrants as a benefit—page 24
A majority (58%) say immigrants are a benefit to the state because of their hard work and job skills rather than a burden (35%) because they use public services. Although there are deep partisan and racial/ethnic divisions on this issue, the percentage of residents who see immigrants as a benefit has remained near 60 percent since February 2004.
Eight years after 9/11: More confidence that U.S. can prevent terrorism at home—page 25
Strong majorities are somewhat (48%) or very (21%) confident that U.S. intelligence and law enforcement agencies will be able to prevent terrorist attacks in the nation, an increase of 14 points since August 2004 (43% somewhat, 12% very).

STATE ISSUES
KEY FINDINGS
Half of Californians name the economy as the state’s most important issue. Solid majorities think California is headed in the wrong direction, expect bad times financially, and say California is in a serious recession. About half are concerned about job loss in their own families. (pages 8, 9)
Californians continue to express low overall job performance ratings for the governor (30%), the legislature (21%), and their own state legislators (34%). Trust in state government remains low. (pages 10, 11)
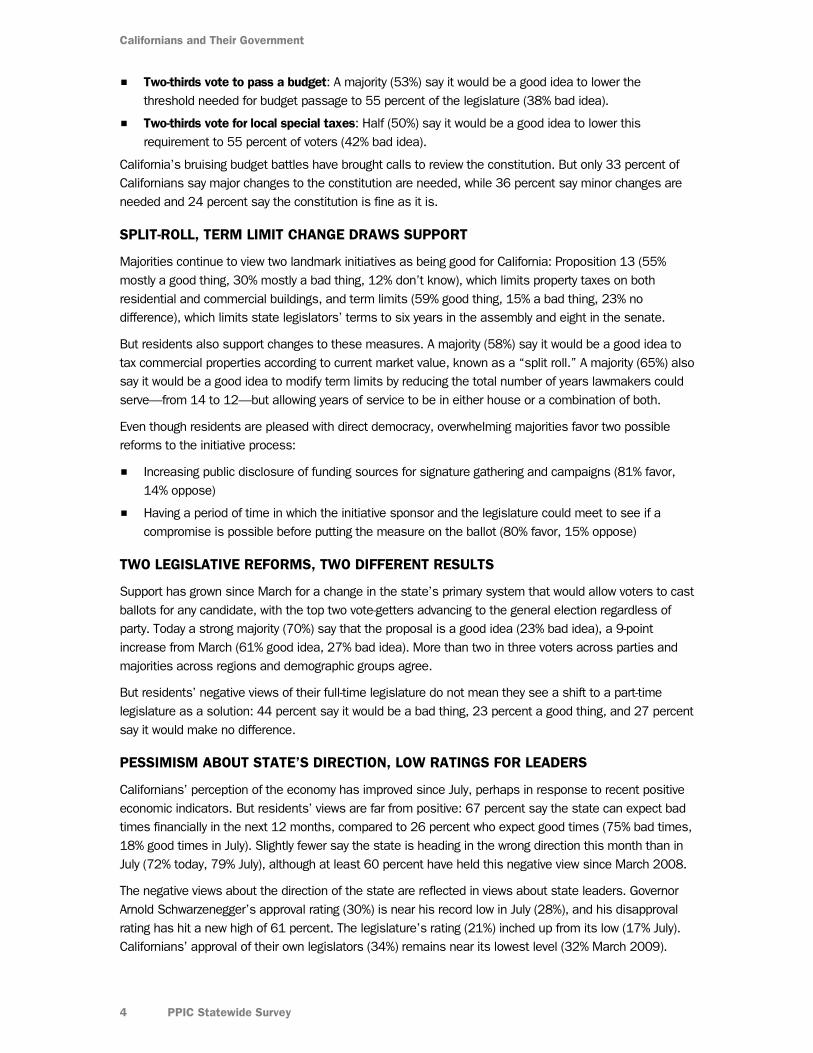
Strong majorities say that the state budget is a big problem and are concerned about cuts to local government services. Most Californians think the state budget process needs major changes, while a majority say that Proposition 13 has been mostly a good thing. Voters are divided along party lines on several fiscal reforms. (pages 12–14)
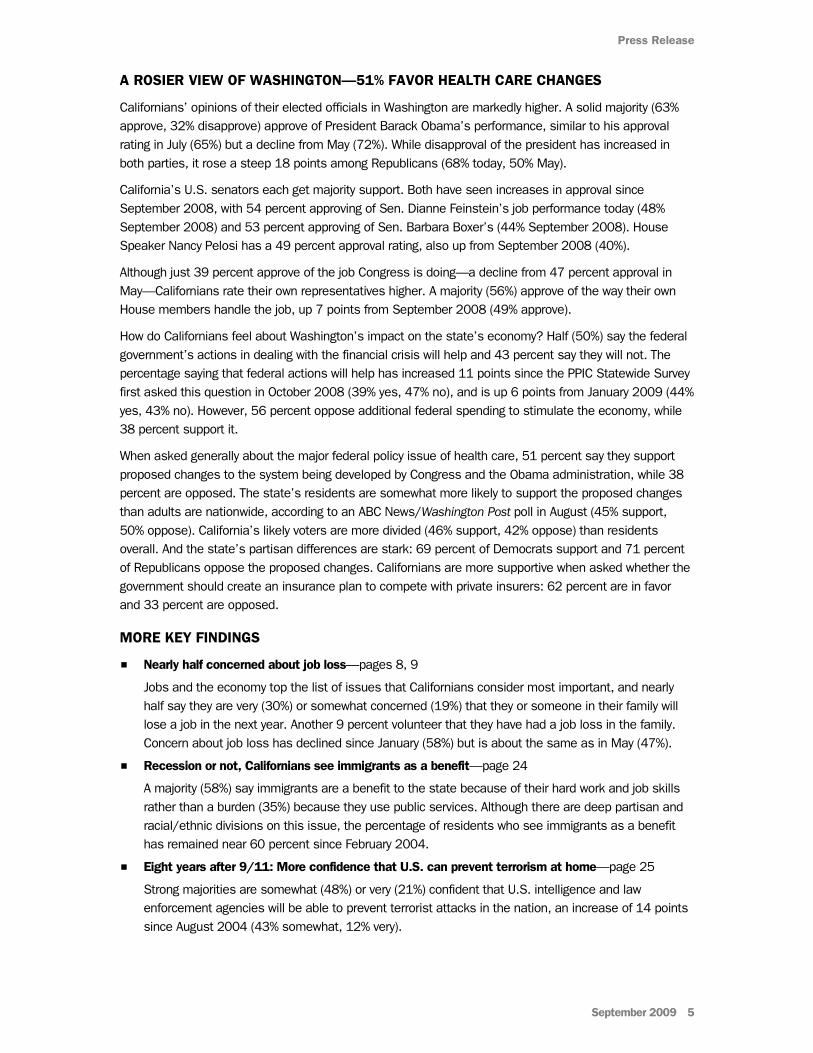
Two in three likely voters say term limits are a good thing, but nearly two in three also support altering them to let a person serve 12 years in one or both legislative chambers. Strong majorities think a top-two-vote-getter primary system is a good thing, but just one in four think a part-time legislature is. (pages 15, 16)
Strong majorities think ballot box policy decisions are better than those made by the governor and legislature. Strong majorities also favor initiative reforms. Many think the California Constitution is in need of changes. (pages 17, 18)
61
33
4650
3834
3040
32 34 34
21 21 21
0
20
40
60
80
Sep04
Sep05
Sep06
Sep07
Sep08
May09
Sep09
Per
cent
all
adul
ts
Governor
Legislature
Approval Ratings of State Elected Officials
41 40 41 39
535453 52 53 53
41 40
0
20
40
60
80
Jan05
May06
May07
May08
Jan09
Sep09
Per
cent
like
ly v
oter
s
Good idea
Bad idea
Change Budget Passage Vote from Two-thirds to 55 Percent
67
49
65 6367 68 66 64
19 17 20 18 18 16 15 17
0
20
40
60
80
100
Oct98
Dec01
Sep04
Oct05
May06
Mar07
Dec07
Sep09
Per
cent
like
ly v
oter
s
Good thing for California
Bad thing for California
Perceptions of Existing Legislative Term Limits
7
Californians and Their Government
8 PPIC Statewide Survey
OVERALL MOOD
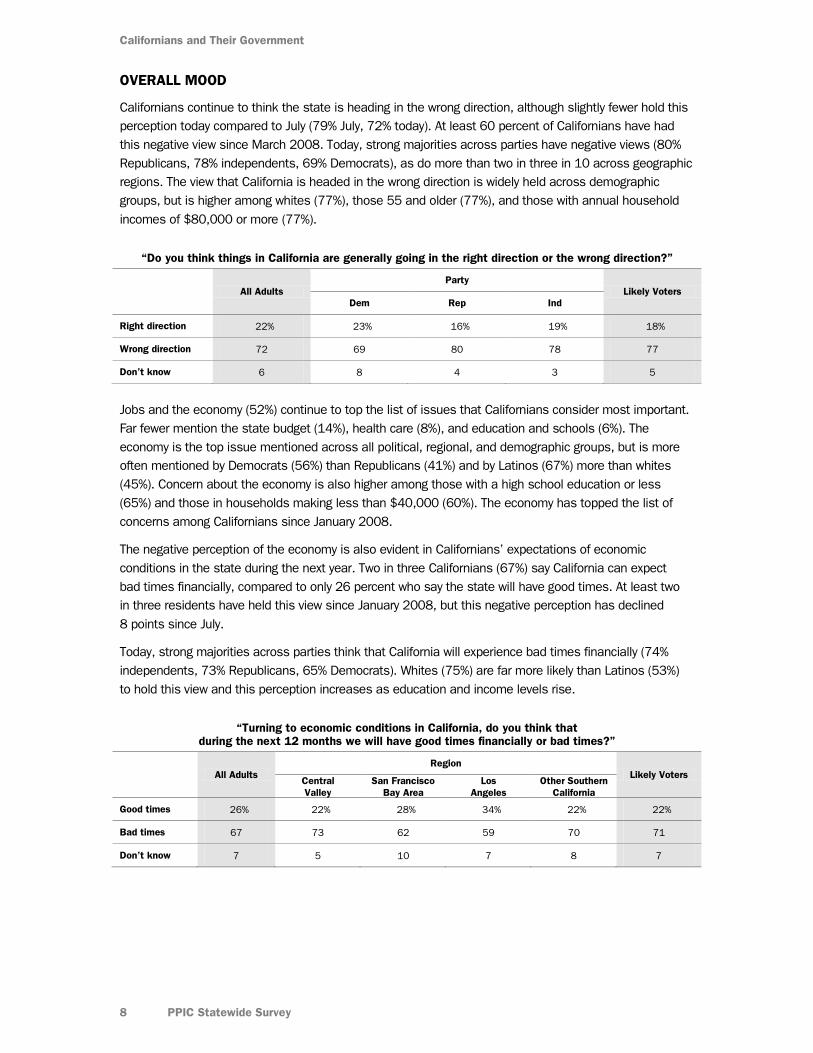
Californians continue to think the state is heading in the wrong direction, although slightly fewer hold this perception today compared to July (79% July, 72% today). At least 60 percent of Californians have had this negative view since March 2008. Today, strong majorities across parties have negative views (80% Republicans, 78% independents, 69% Democrats), as do more than two in three in 10 across geographic regions. The view that California is headed in the wrong direction is widely held across demographic groups, but is higher among whites (77%), those 55 and older (77%), and those with annual household incomes of $80,000 or more (77%).
“Do you think things in California are generally going in the right direction or the wrong direction?”
All Adults Party
Likely Voters Dem Rep Ind
Right direction 22% 23% 16% 19% 18%
Wrong direction 72 69 80 78 77
Don’t know 6 8 4 3 5
Jobs and the economy (52%) continue to top the list of issues that Californians consider most important. Far fewer mention the state budget (14%), health care (8%), and education and schools (6%). The economy is the top issue mentioned across all political, regional, and demographic groups, but is more often mentioned by Democrats (56%) than Republicans (41%) and by Latinos (67%) more than whites (45%). Concern about the economy is also higher among those with a high school education or less (65%) and those in households making less than $40,000 (60%). The economy has topped the list of concerns among Californians since January 2008.
The negative perception of the economy is also evident in Californians’ expectations of economic conditions in the state during the next year. Two in three Californians (67%) say California can expect bad times financially, compared to only 26 percent who say the state will have good times. At least two in three residents have held this view since January 2008, but this negative perception has declined 8 points since July.
Today, strong majorities across parties think that California will experience bad times financially (74% independents, 73% Republicans, 65% Democrats). Whites (75%) are far more likely than Latinos (53%) to hold this view and this perception increases as education and income levels rise.
“Turning to economic conditions in California, do you think that during the next 12 months we will have good times financially or bad times?”
All Adults Region
Likely Voters Central Valley
San Francisco Bay Area
Los Angeles
Other Southern California
Good times 26% 22% 28% 34% 22% 22%
Bad times 67 73 62 59 70 71
Don’t know 7 5 10 7 8 7
State Issues
September 2009 9
ECONOMY
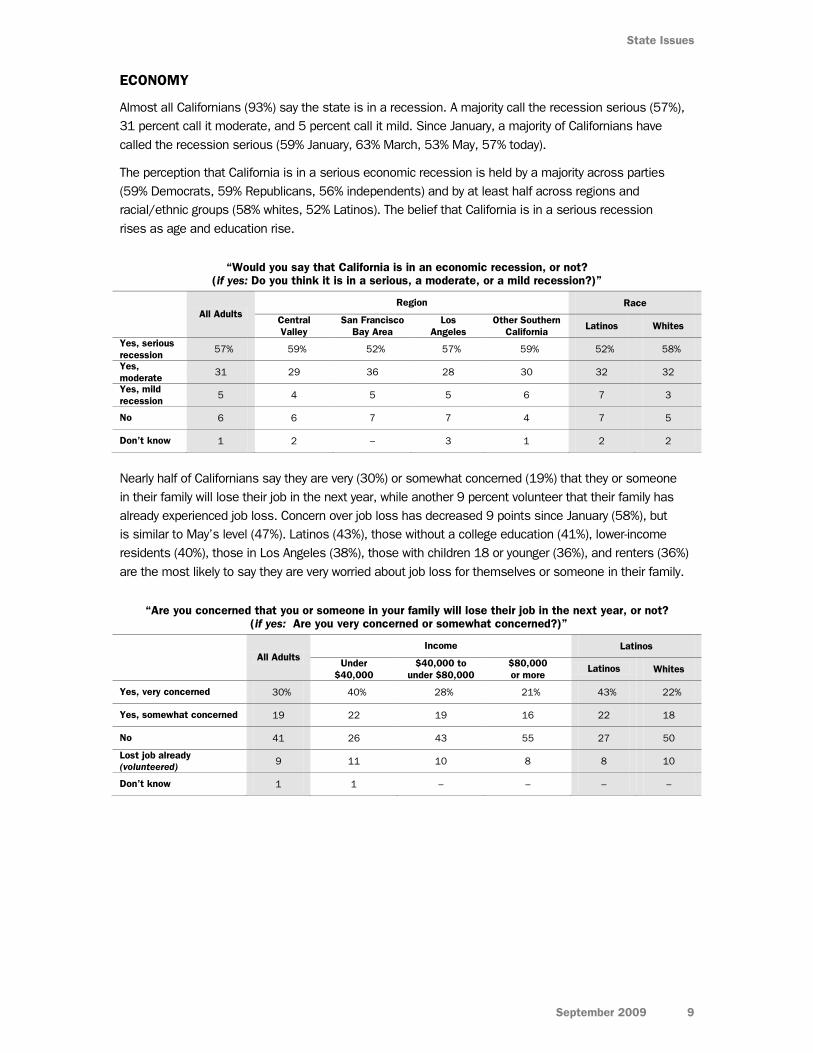
Almost all Californians (93%) say the state is in a recession. A majority call the recession serious (57%), 31 percent call it moderate, and 5 percent call it mild. Since January, a majority of Californians have called the recession serious (59% January, 63% March, 53% May, 57% today).
The perception that California is in a serious economic recession is held by a majority across parties (59% Democrats, 59% Republicans, 56% independents) and by at least half across regions and racial/ethnic groups (58% whites, 52% Latinos). The belief that California is in a serious recession rises as age and education rise.
“Would you say that California is in an economic recession, or not? (if yes: Do you think it is in a serious, a moderate, or a mild recession?)”
All Adults Region Race
Central Valley
San Francisco Bay Area
Los Angeles
Other Southern California Latinos Whites
Yes, serious recession 57% 59% 52% 57% 59% 52% 58%
Yes, moderate
31 29 36 28 30 32 32
Yes, mild recession 5 4 5 5 6 7 3
No 6 6 7 7 4 7 5
Don’t know 1 2 – 3 1 2 2
Nearly half of Californians say they are very (30%) or somewhat concerned (19%) that they or someone in their family will lose their job in the next year, while another 9 percent volunteer that their family has already experienced job loss. Concern over job loss has decreased 9 points since January (58%), but is similar to May’s level (47%). Latinos (43%), those without a college education (41%), lower-income residents (40%), those in Los Angeles (38%), those with children 18 or younger (36%), and renters (36%) are the most likely to say they are very worried about job loss for themselves or someone in their family.
“Are you concerned that you or someone in your family will lose their job in the next year, or not? (if yes: Are you very concerned or somewhat concerned?)”
All Adults Income Latinos
Under $40,000
$40,000 to under $80,000
$80,000 or more
Latinos Whites
Yes, very concerned 30% 40% 28% 21% 43% 22%
Yes, somewhat concerned 19 22 19 16 22 18
No 41 26 43 55 27 50
Lost job already (volunteered) 9 11 10 8 8 10
Don’t know 1 1 – – – –
Californians and Their Government
10 PPIC Statewide Survey
STATE ELECTED OFFICIALS
Californians’ negative views about the direction of the state and economic conditions are reflected in their assessments of the state’s elected officials.
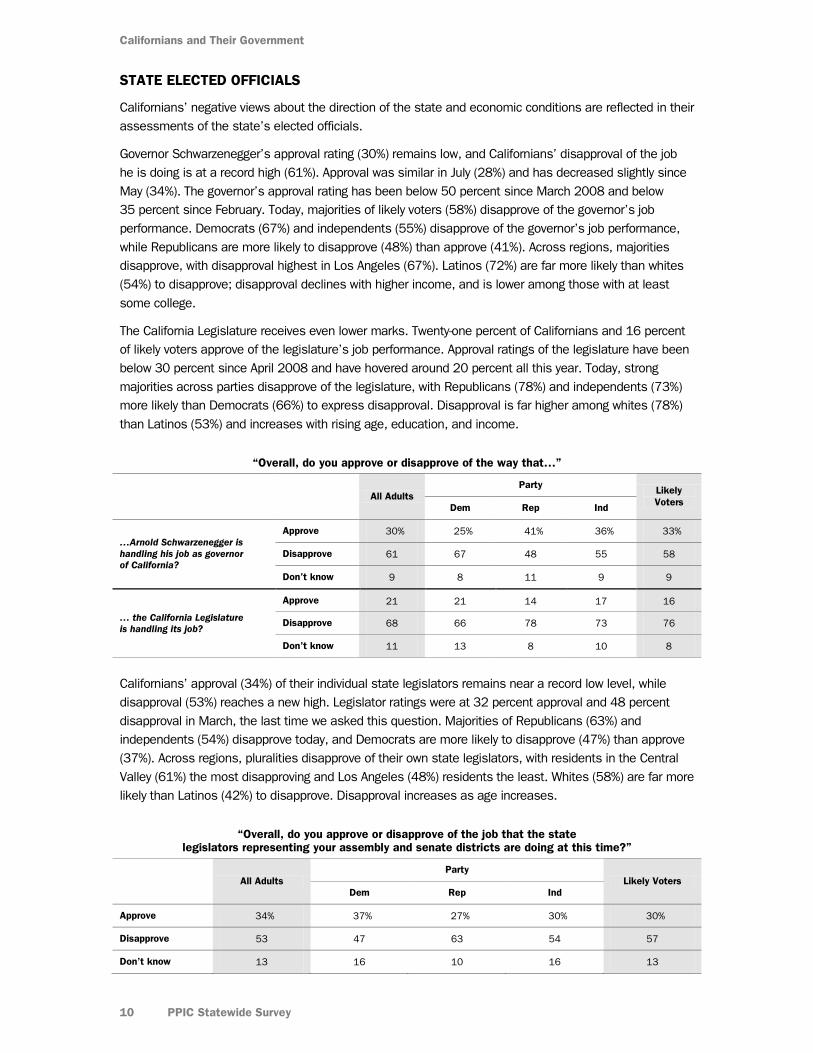
Governor Schwarzenegger’s approval rating (30%) remains low, and Californians’ disapproval of the job he is doing is at a record high (61%). Approval was similar in July (28%) and has decreased slightly since May (34%). The governor’s approval rating has been below 50 percent since March 2008 and below 35 percent since February. Today, majorities of likely voters (58%) disapprove of the governor’s job performance. Democrats (67%) and independents (55%) disapprove of the governor’s job performance, while Republicans are more likely to disapprove (48%) than approve (41%). Across regions, majorities disapprove, with disapproval highest in Los Angeles (67%). Latinos (72%) are far more likely than whites (54%) to disapprove; disapproval declines with higher income, and is lower among those with at least some college.
The California Legislature receives even lower marks. Twenty-one percent of Californians and 16 percent of likely voters approve of the legislature’s job performance. Approval ratings of the legislature have been below 30 percent since April 2008 and have hovered around 20 percent all this year. Today, strong majorities across parties disapprove of the legislature, with Republicans (78%) and independents (73%) more likely than Democrats (66%) to express disapproval. Disapproval is far higher among whites (78%) than Latinos (53%) and increases with rising age, education, and income.
“Overall, do you approve or disapprove of the way that…”
All Adults Party Likely
Voters Dem Rep Ind
…Arnold Schwarzenegger is handling his job as governor of California?
Approve 30% 25% 41% 36% 33%
Disapprove 61 67 48 55 58
Don’t know 9 8 11 9 9
… the California Legislature is handling its job?
Approve 21 21 14 17 16
Disapprove 68 66 78 73 76
Don’t know 11 13 8 10 8
Californians’ approval (34%) of their individual state legislators remains near a record low level, while disapproval (53%) reaches a new high. Legislator ratings were at 32 percent approval and 48 percent disapproval in March, the last time we asked this question. Majorities of Republicans (63%) and independents (54%) disapprove today, and Democrats are more likely to disapprove (47%) than approve (37%). Across regions, pluralities disapprove of their own state legislators, with residents in the Central Valley (61%) the most disapproving and Los Angeles (48%) residents the least. Whites (58%) are far more likely than Latinos (42%) to disapprove. Disapproval increases as age increases.
“Overall, do you approve or disapprove of the job that the state legislators representing your assembly and senate districts are doing at this time?”
All Adults Party
Likely Voters Dem Rep Ind
Approve 34% 37% 27% 30% 30%
Disapprove 53 47 63 54 57
Don’t know 13 16 10 16 13
State Issues
September 2009 11
TRUST IN GOVERNMENT
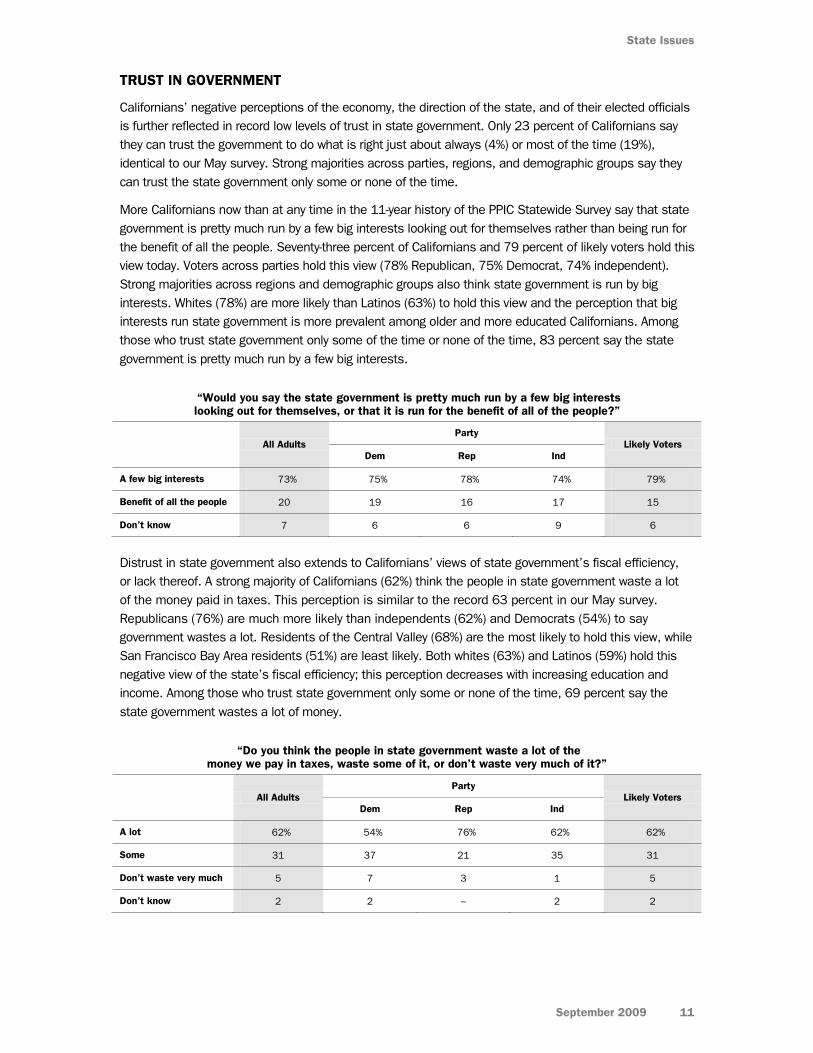
Californians’ negative perceptions of the economy, the direction of the state, and of their elected officials is further reflected in record low levels of trust in state government. Only 23 percent of Californians say they can trust the government to do what is right just about always (4%) or most of the time (19%), identical to our May survey. Strong majorities across parties, regions, and demographic groups say they can trust the state government only some or none of the time.
More Californians now than at any time in the 11-year history of the PPIC Statewide Survey say that state government is pretty much run by a few big interests looking out for themselves rather than being run for the benefit of all the people. Seventy-three percent of Californians and 79 percent of likely voters hold this view today. Voters across parties hold this view (78% Republican, 75% Democrat, 74% independent). Strong majorities across regions and demographic groups also think state government is run by big interests. Whites (78%) are more likely than Latinos (63%) to hold this view and the perception that big interests run state government is more prevalent among older and more educated Californians. Among those who trust state government only some of the time or none of the time, 83 percent say the state government is pretty much run by a few big interests.
“Would you say the state government is pretty much run by a few big interests looking out for themselves, or that it is run for the benefit of all of the people?”
All Adults Party
Likely Voters Dem Rep Ind
A few big interests 73% 75% 78% 74% 79%
Benefit of all the people 20 19 16 17 15
Don’t know 7 6 6 9 6
Distrust in state government also extends to Californians’ views of state government’s fiscal efficiency, or lack thereof. A strong majority of Californians (62%) think the people in state government waste a lot of the money paid in taxes. This perception is similar to the record 63 percent in our May survey. Republicans (76%) are much more likely than independents (62%) and Democrats (54%) to say government wastes a lot. Residents of the Central Valley (68%) are the most likely to hold this view, while San Francisco Bay Area residents (51%) are least likely. Both whites (63%) and Latinos (59%) hold this negative view of the state’s fiscal efficiency; this perception decreases with increasing education and income. Among those who trust state government only some or none of the time, 69 percent say the state government wastes a lot of money.
“Do you think the people in state government waste a lot of the money we pay in taxes, waste some of it, or don’t waste very much of it?”
All Adults Party
Likely Voters Dem Rep Ind
A lot 62% 54% 76% 62% 62%
Some 31 37 21 35 31
Don’t waste very much 5 7 3 1 5
Don’t know 2 2 – 2 2
Californians and Their Government
12 PPIC Statewide Survey
STATE BUDGET SITUATION
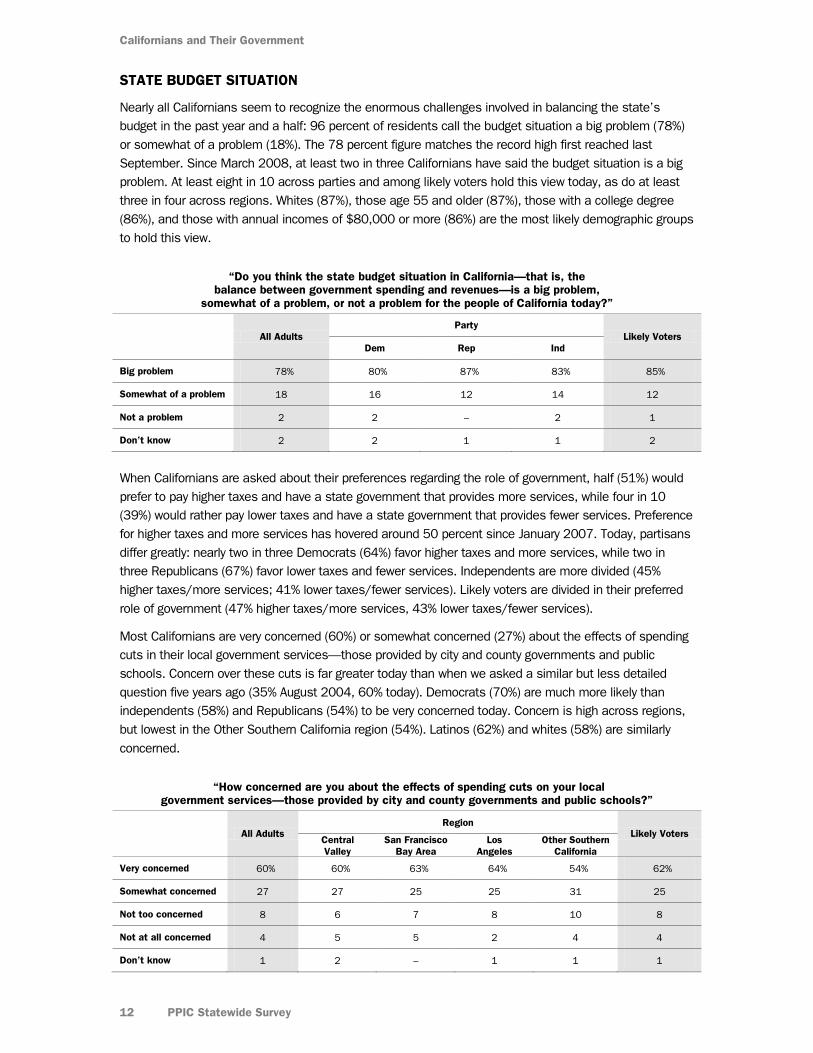
Nearly all Californians seem to recognize the enormous challenges involved in balancing the state’s budget in the past year and a half: 96 percent of residents call the budget situation a big problem (78%) or somewhat of a problem (18%). The 78 percent figure matches the record high first reached last September. Since March 2008, at least two in three Californians have said the budget situation is a big problem. At least eight in 10 across parties and among likely voters hold this view today, as do at least three in four across regions. Whites (87%), those age 55 and older (87%), those with a college degree (86%), and those with annual incomes of $80,000 or more (86%) are the most likely demographic groups to hold this view.
“Do you think the state budget situation in California—that is, the balance between government spending and revenues—is a big problem,
somewhat of a problem, or not a problem for the people of California today?”
All Adults Party
Likely Voters Dem Rep Ind
Big problem 78% 80% 87% 83% 85%
Somewhat of a problem 18 16 12 14 12
Not a problem 2 2 – 2 1
Don’t know 2 2 1 1 2
When Californians are asked about their preferences regarding the role of government, half (51%) would prefer to pay higher taxes and have a state government that provides more services, while four in 10 (39%) would rather pay lower taxes and have a state government that provides fewer services. Preference for higher taxes and more services has hovered around 50 percent since January 2007. Today, partisans differ greatly: nearly two in three Democrats (64%) favor higher taxes and more services, while two in three Republicans (67%) favor lower taxes and fewer services. Independents are more divided (45% higher taxes/more services; 41% lower taxes/fewer services). Likely voters are divided in their preferred role of government (47% higher taxes/more services, 43% lower taxes/fewer services).
Most Californians are very concerned (60%) or somewhat concerned (27%) about the effects of spending cuts in their local government services—those provided by city and county governments and public schools. Concern over these cuts is far greater today than when we asked a similar but less detailed question five years ago (35% August 2004, 60% today). Democrats (70%) are much more likely than independents (58%) and Republicans (54%) to be very concerned today. Concern is high across regions, but lowest in the Other Southern California region (54%). Latinos (62%) and whites (58%) are similarly concerned.
“How concerned are you about the effects of spending cuts on your local government services—those provided by city and county governments and public schools?”
All Adults Region
Likely Voters Central Valley
San Francisco Bay Area
Los Angeles
Other Southern California
Very concerned 60% 60% 63% 64% 54% 62%
Somewhat concerned 27 27 25 25 31 25
Not too concerned 8 6 7 8 10 8
Not at all concerned 4 5 5 2 4 4
Don’t know 1 2 – 1 1 1
State Issues
September 2009 13
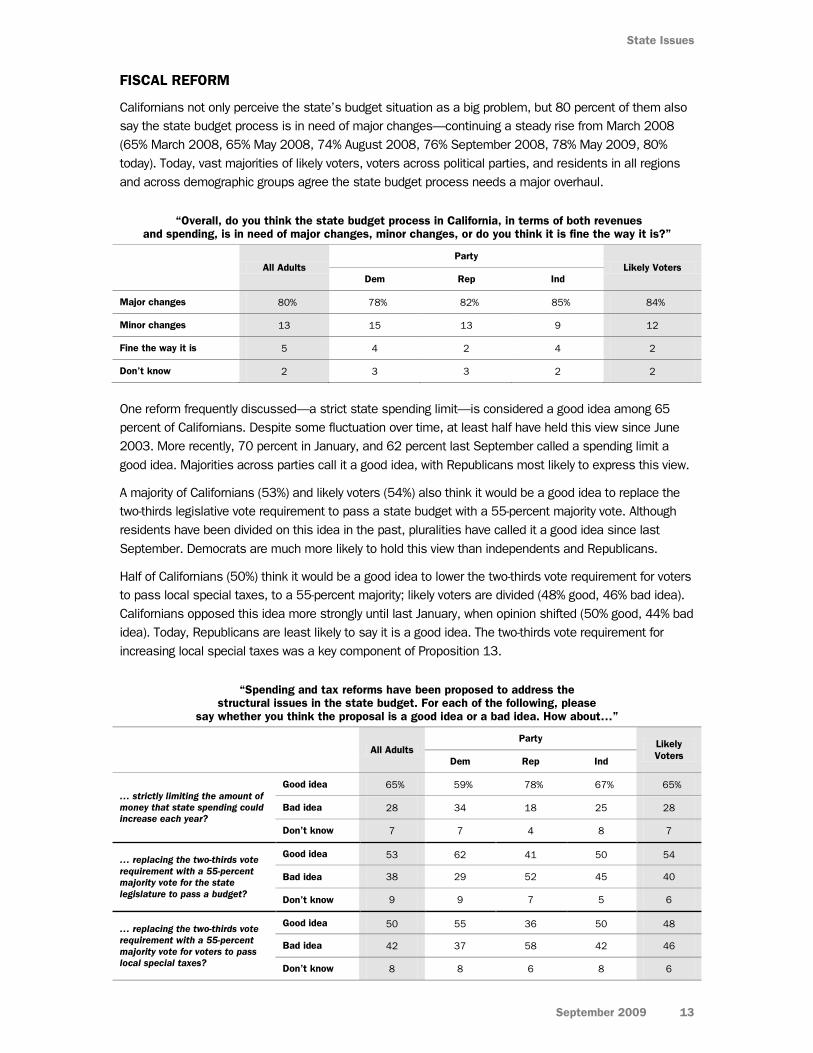
FISCAL REFORM
Californians not only perceive the state’s budget situation as a big problem, but 80 percent of them also say the state budget process is in need of major changes—continuing a steady rise from March 2008 (65% March 2008, 65% May 2008, 74% August 2008, 76% September 2008, 78% May 2009, 80% today). Today, vast majorities of likely voters, voters across political parties, and residents in all regions and across demographic groups agree the state budget process needs a major overhaul.
“Overall, do you think the state budget process in California, in terms of both revenues and spending, is in need of major changes, minor changes, or do you think it is fine the way it is?”
All Adults Party
Likely Voters Dem Rep Ind
Major changes 80% 78% 82% 85% 84%
Minor changes 13 15 13 9 12
Fine the way it is 5 4 2 4 2
Don’t know 2 3 3 2 2
One reform frequently discussed—a strict state spending limit—is considered a good idea among 65 percent of Californians. Despite some fluctuation over time, at least half have held this view since June 2003. More recently, 70 percent in January, and 62 percent last September called a spending limit a good idea. Majorities across parties call it a good idea, with Republicans most likely to express this view.
A majority of Californians (53%) and likely voters (54%) also think it would be a good idea to replace the two-thirds legislative vote requirement to pass a state budget with a 55-percent majority vote. Although residents have been divided on this idea in the past, pluralities have called it a good idea since last September. Democrats are much more likely to hold this view than independents and Republicans.
Half of Californians (50%) think it would be a good idea to lower the two-thirds vote requirement for voters to pass local special taxes, to a 55-percent majority; likely voters are divided (48% good, 46% bad idea). Californians opposed this idea more strongly until last January, when opinion shifted (50% good, 44% bad idea). Today, Republicans are least likely to say it is a good idea. The two-thirds vote requirement for increasing local special taxes was a key component of Proposition 13.
“Spending and tax reforms have been proposed to address the structural issues in the state budget. For each of the following, please
say whether you think the proposal is a good idea or a bad idea. How about…”
All Adults Party Likely
Voters Dem Rep Ind
… strictly limiting the amount of money that state spending could increase each year?
Good idea 65% 59% 78% 67% 65%
Bad idea 28 34 18 25 28
Don’t know 7 7 4 8 7
… replacing the two-thirds vote requirement with a 55-percent majority vote for the state legislature to pass a budget?
Good idea 53 62 41 50 54
Bad idea 38 29 52 45 40
Don’t know 9 9 7 5 6
… replacing the two-thirds vote requirement with a 55-percent majority vote for voters to pass local special taxes?
Good idea 50 55 36 50 48
Bad idea 42 37 58 42 46
Don’t know 8 8 6 8 6
Californians and Their Government
14 PPIC Statewide Survey
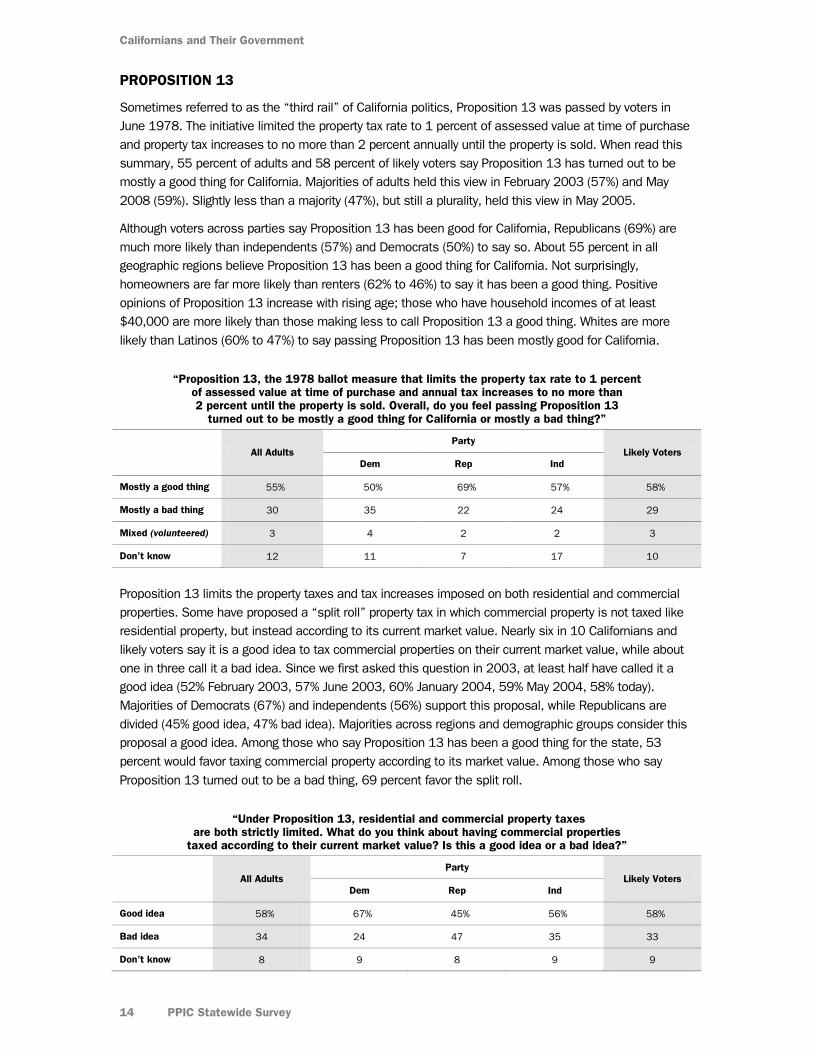
PROPOSITION 13
Sometimes referred to as the “third rail” of California politics, Proposition 13 was passed by voters in June 1978. The initiative limited the property tax rate to 1 percent of assessed value at time of purchase and property tax increases to no more than 2 percent annually until the property is sold. When read this summary, 55 percent of adults and 58 percent of likely voters say Proposition 13 has turned out to be mostly a good thing for California. Majorities of adults held this view in February 2003 (57%) and May 2008 (59%). Slightly less than a majority (47%), but still a plurality, held this view in May 2005.
Although voters across parties say Proposition 13 has been good for California, Republicans (69%) are much more likely than independents (57%) and Democrats (50%) to say so. About 55 percent in all geographic regions believe Proposition 13 has been a good thing for California. Not surprisingly, homeowners are far more likely than renters (62% to 46%) to say it has been a good thing. Positive opinions of Proposition 13 increase with rising age; those who have household incomes of at least $40,000 are more likely than those making less to call Proposition 13 a good thing. Whites are more likely than Latinos (60% to 47%) to say passing Proposition 13 has been mostly good for California.
“Proposition 13, the 1978 ballot measure that limits the property tax rate to 1 percent of assessed value at time of purchase and annual tax increases to no more than 2 percent until the property is sold. Overall, do you feel passing Proposition 13
turned out to be mostly a good thing for California or mostly a bad thing?”
All Adults Party
Likely Voters Dem Rep Ind
Mostly a good thing 55% 50% 69% 57% 58%
Mostly a bad thing 30 35 22 24 29
Mixed (volunteered) 3 4 2 2 3
Don’t know 12 11 7 17 10
Proposition 13 limits the property taxes and tax increases imposed on both residential and commercial properties. Some have proposed a “split roll” property tax in which commercial property is not taxed like residential property, but instead according to its current market value. Nearly six in 10 Californians and likely voters say it is a good idea to tax commercial properties on their current market value, while about one in three call it a bad idea. Since we first asked this question in 2003, at least half have called it a good idea (52% February 2003, 57% June 2003, 60% January 2004, 59% May 2004, 58% today). Majorities of Democrats (67%) and independents (56%) support this proposal, while Republicans are divided (45% good idea, 47% bad idea). Majorities across regions and demographic groups consider this proposal a good idea. Among those who say Proposition 13 has been a good thing for the state, 53 percent would favor taxing commercial property according to its market value. Among those who say Proposition 13 turned out to be a bad thing, 69 percent favor the split roll.
“Under Proposition 13, residential and commercial property taxes are both strictly limited. What do you think about having commercial properties
taxed according to their current market value? Is this a good idea or a bad idea?”
All Adults Party
Likely Voters Dem Rep Ind
Good idea 58% 67% 45% 56% 58%
Bad idea 34 24 47 35 33
Don’t know 8 9 8 9 9
State Issues
September 2009 15
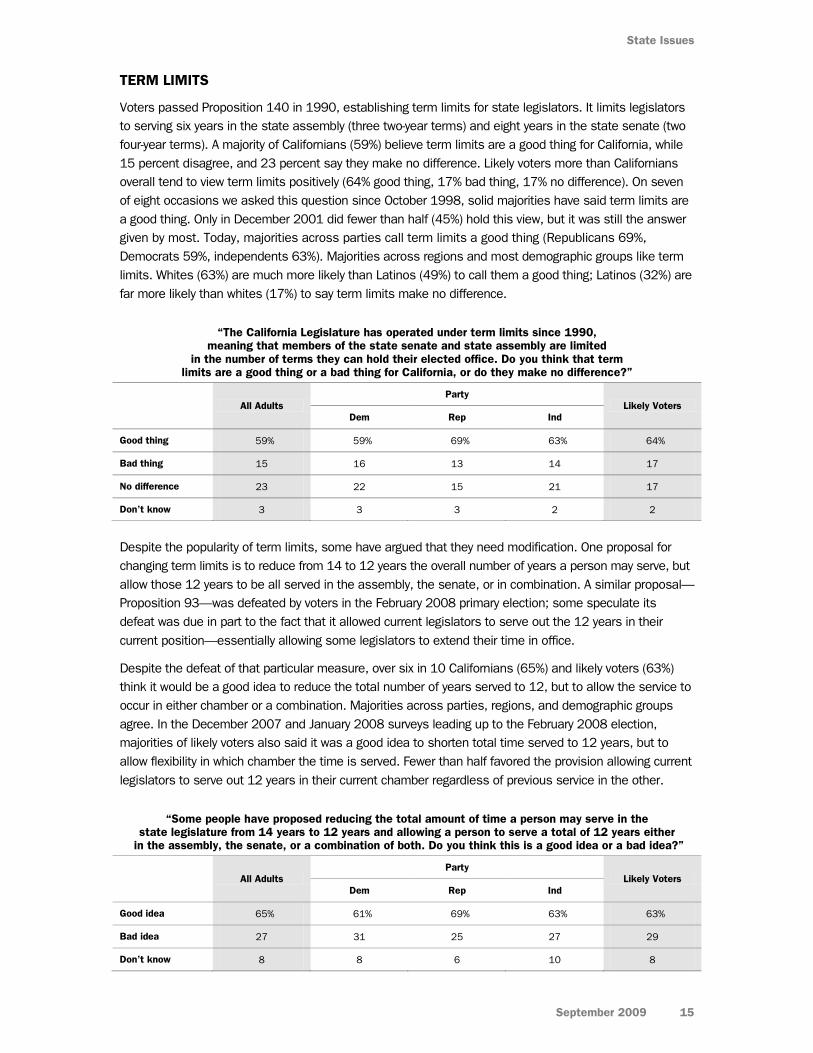
TERM LIMITS
Voters passed Proposition 140 in 1990, establishing term limits for state legislators. It limits legislators to serving six years in the state assembly (three two-year terms) and eight years in the state senate (two four-year terms). A majority of Californians (59%) believe term limits are a good thing for California, while 15 percent disagree, and 23 percent say they make no difference. Likely voters more than Californians overall tend to view term limits positively (64% good thing, 17% bad thing, 17% no difference). On seven of eight occasions we asked this question since October 1998, solid majorities have said term limits are a good thing. Only in December 2001 did fewer than half (45%) hold this view, but it was still the answer given by most. Today, majorities across parties call term limits a good thing (Republicans 69%, Democrats 59%, independents 63%). Majorities across regions and most demographic groups like term limits. Whites (63%) are much more likely than Latinos (49%) to call them a good thing; Latinos (32%) are far more likely than whites (17%) to say term limits make no difference.
“The California Legislature has operated under term limits since 1990, meaning that members of the state senate and state assembly are limited
in the number of terms they can hold their elected office. Do you think that term limits are a good thing or a bad thing for California, or do they make no difference?”
All Adults Party
Likely Voters Dem Rep Ind
Good thing 59% 59% 69% 63% 64%
Bad thing 15 16 13 14 17
No difference 23 22 15 21 17
Don’t know 3 3 3 2 2
Despite the popularity of term limits, some have argued that they need modification. One proposal for changing term limits is to reduce from 14 to 12 years the overall number of years a person may serve, but allow those 12 years to be all served in the assembly, the senate, or in combination. A similar proposal—Proposition 93—was defeated by voters in the February 2008 primary election; some speculate its defeat was due in part to the fact that it allowed current legislators to serve out the 12 years in their current position—essentially allowing some legislators to extend their time in office.
Despite the defeat of that particular measure, over six in 10 Californians (65%) and likely voters (63%) think it would be a good idea to reduce the total number of years served to 12, but to allow the service to occur in either chamber or a combination. Majorities across parties, regions, and demographic groups agree. In the December 2007 and January 2008 surveys leading up to the February 2008 election, majorities of likely voters also said it was a good idea to shorten total time served to 12 years, but to allow flexibility in which chamber the time is served. Fewer than half favored the provision allowing current legislators to serve out 12 years in their current chamber regardless of previous service in the other.
“Some people have proposed reducing the total amount of time a person may serve in the state legislature from 14 years to 12 years and allowing a person to serve a total of 12 years either
in the assembly, the senate, or a combination of both. Do you think this is a good idea or a bad idea?”
All Adults Party
Likely Voters Dem Rep Ind
Good idea 65% 61% 69% 63% 63%
Bad idea 27 31 25 27 29
Don’t know 8 8 6 10 8
Californians and Their Government
16 PPIC Statewide Survey
GOVERNANCE REFORM
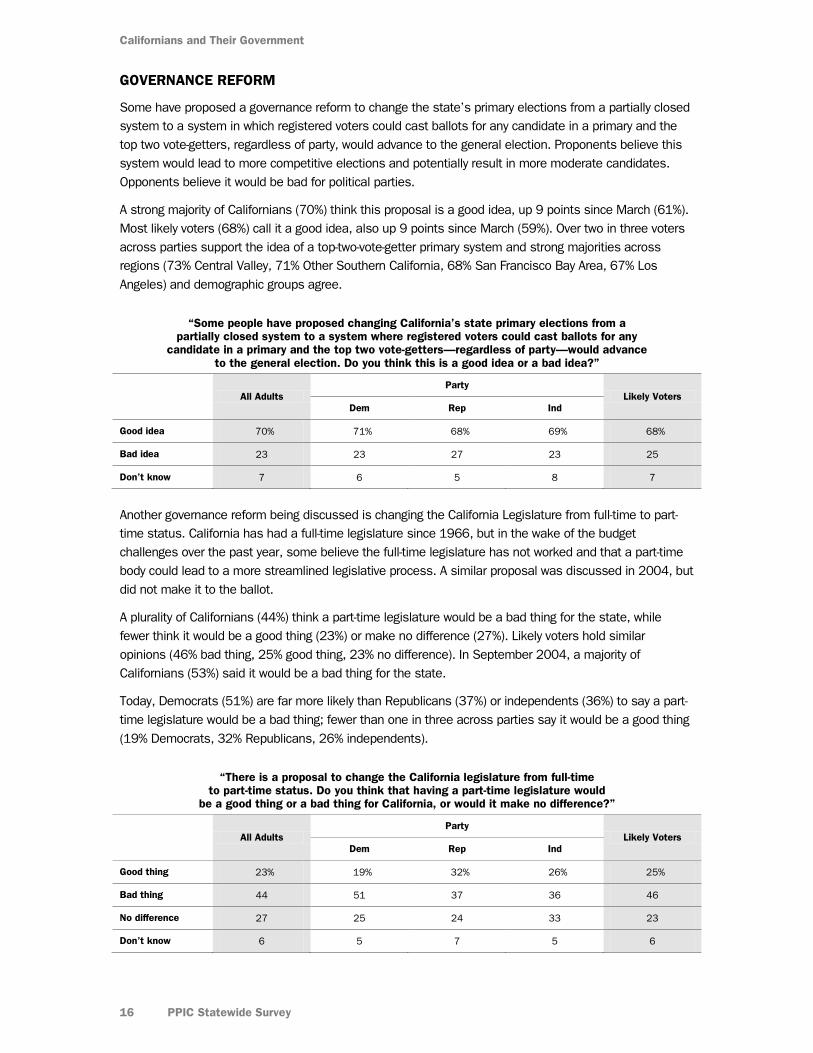
Some have proposed a governance reform to change the state’s primary elections from a partially closed system to a system in which registered voters could cast ballots for any candidate in a primary and the top two vote-getters, regardless of party, would advance to the general election. Proponents believe this system would lead to more competitive elections and potentially result in more moderate candidates. Opponents believe it would be bad for political parties.
A strong majority of Californians (70%) think this proposal is a good idea, up 9 points since March (61%). Most likely voters (68%) call it a good idea, also up 9 points since March (59%). Over two in three voters across parties support the idea of a top-two-vote-getter primary system and strong majorities across regions (73% Central Valley, 71% Other Southern California, 68% San Francisco Bay Area, 67% Los Angeles) and demographic groups agree.
“Some people have proposed changing California’s state primary elections from a partially closed system to a system where registered voters could cast ballots for any
candidate in a primary and the top two vote-getters—regardless of party—would advance to the general election. Do you think this is a good idea or a bad idea?”
All Adults Party
Likely Voters Dem Rep Ind
Good idea 70% 71% 68% 69% 68%
Bad idea 23 23 27 23 25
Don’t know 7 6 5 8 7
Another governance reform being discussed is changing the California Legislature from full-time to part-time status. California has had a full-time legislature since 1966, but in the wake of the budget challenges over the past year, some believe the full-time legislature has not worked and that a part-time body could lead to a more streamlined legislative process. A similar proposal was discussed in 2004, but did not make it to the ballot.
A plurality of Californians (44%) think a part-time legislature would be a bad thing for the state, while fewer think it would be a good thing (23%) or make no difference (27%). Likely voters hold similar opinions (46% bad thing, 25% good thing, 23% no difference). In September 2004, a majority of Californians (53%) said it would be a bad thing for the state.
Today, Democrats (51%) are far more likely than Republicans (37%) or independents (36%) to say a part-time legislature would be a bad thing; fewer than one in three across parties say it would be a good thing (19% Democrats, 32% Republicans, 26% independents).
“There is a proposal to change the California legislature from full-time to part-time status. Do you think that having a part-time legislature would
be a good thing or a bad thing for California, or would it make no difference?”
All Adults Party
Likely Voters Dem Rep Ind
Good thing 23% 19% 32% 26% 25%
Bad thing 44 51 37 36 46
No difference 27 25 24 33 23
Don’t know 6 5 7 5 6
State Issues
September 2009 17
INITIATIVE REFORM
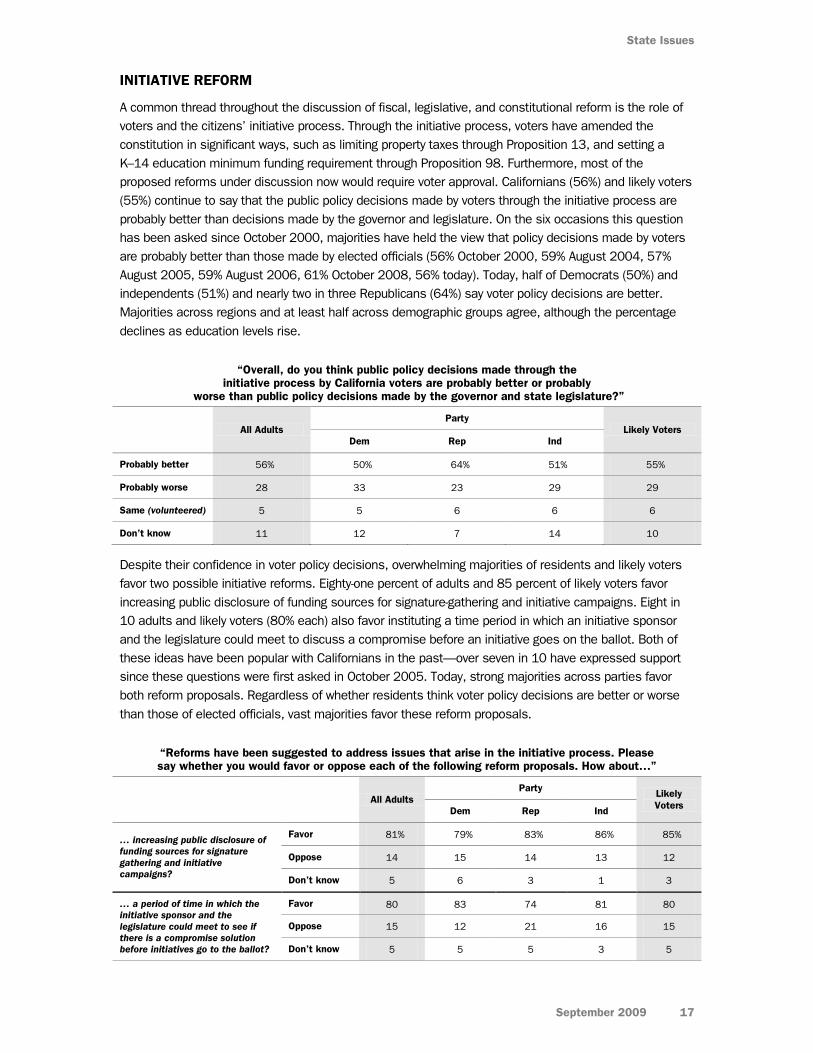
A common thread throughout the discussion of fiscal, legislative, and constitutional reform is the role of voters and the citizens’ initiative process. Through the initiative process, voters have amended the constitution in significant ways, such as limiting property taxes through Proposition 13, and setting a K–14 education minimum funding requirement through Proposition 98. Furthermore, most of the proposed reforms under discussion now would require voter approval. Californians (56%) and likely voters (55%) continue to say that the public policy decisions made by voters through the initiative process are probably better than decisions made by the governor and legislature. On the six occasions this question has been asked since October 2000, majorities have held the view that policy decisions made by voters are probably better than those made by elected officials (56% October 2000, 59% August 2004, 57% August 2005, 59% August 2006, 61% October 2008, 56% today). Today, half of Democrats (50%) and independents (51%) and nearly two in three Republicans (64%) say voter policy decisions are better. Majorities across regions and at least half across demographic groups agree, although the percentage declines as education levels rise.
“Overall, do you think public policy decisions made through the initiative process by California voters are probably better or probably
worse than public policy decisions made by the governor and state legislature?”
All Adults Party
Likely Voters Dem Rep Ind
Probably better 56% 50% 64% 51% 55%
Probably worse 28 33 23 29 29
Same (volunteered) 5 5 6 6 6
Don’t know 11 12 7 14 10
Despite their confidence in voter policy decisions, overwhelming majorities of residents and likely voters favor two possible initiative reforms. Eighty-one percent of adults and 85 percent of likely voters favor increasing public disclosure of funding sources for signature-gathering and initiative campaigns. Eight in 10 adults and likely voters (80% each) also favor instituting a time period in which an initiative sponsor and the legislature could meet to discuss a compromise before an initiative goes on the ballot. Both of these ideas have been popular with Californians in the past—over seven in 10 have expressed support since these questions were first asked in October 2005. Today, strong majorities across parties favor both reform proposals. Regardless of whether residents think voter policy decisions are better or worse than those of elected officials, vast majorities favor these reform proposals.
“Reforms have been suggested to address issues that arise in the initiative process. Please say whether you would favor or oppose each of the following reform proposals. How about…”
All Adults Party Likely
Voters Dem Rep Ind
… increasing public disclosure of funding sources for signature gathering and initiative campaigns?
Favor 81% 79% 83% 86% 85%
Oppose 14 15 14 13 12
Don’t know 5 6 3 1 3
… a period of time in which the initiative sponsor and the legislature could meet to see if there is a compromise solution before initiatives go to the ballot?
Favor 80 83 74 81 80
Oppose 15 12 21 16 15
Don’t know 5 5 5 3 5
Californians and Their Government
18 PPIC Statewide Survey
CONSTITUTIONAL REFORM
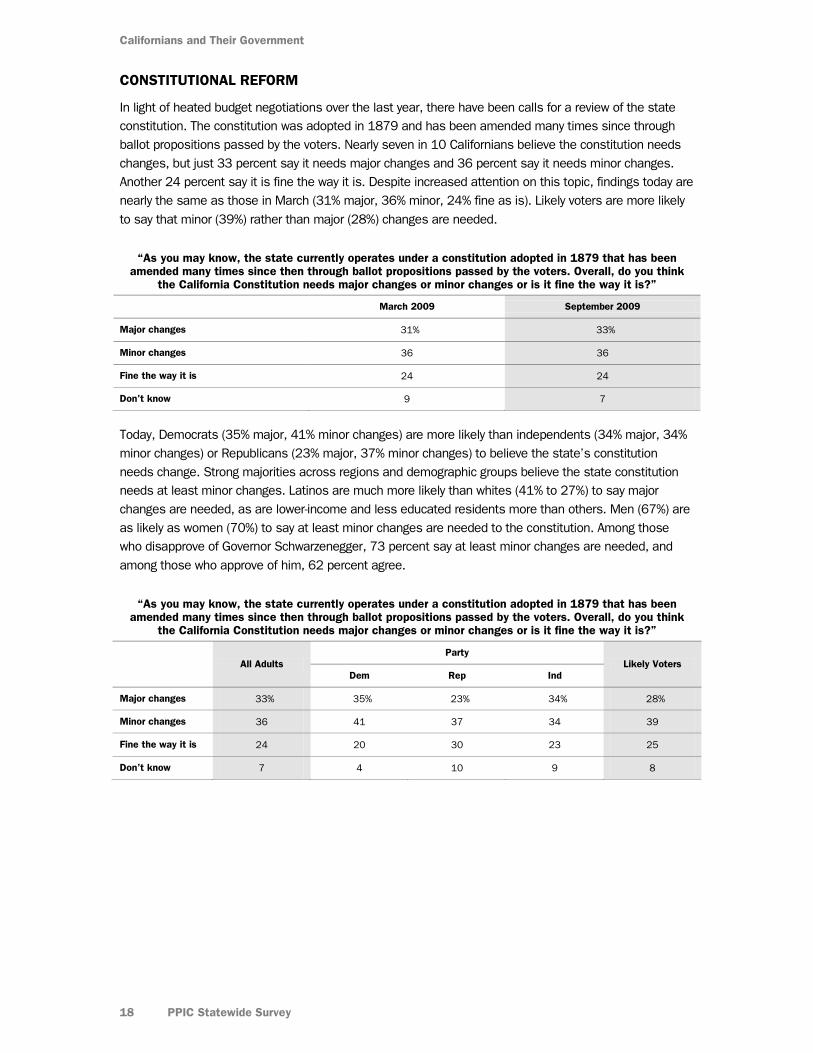
In light of heated budget negotiations over the last year, there have been calls for a review of the state constitution. The constitution was adopted in 1879 and has been amended many times since through ballot propositions passed by the voters. Nearly seven in 10 Californians believe the constitution needs changes, but just 33 percent say it needs major changes and 36 percent say it needs minor changes. Another 24 percent say it is fine the way it is. Despite increased attention on this topic, findings today are nearly the same as those in March (31% major, 36% minor, 24% fine as is). Likely voters are more likely to say that minor (39%) rather than major (28%) changes are needed.
“As you may know, the state currently operates under a constitution adopted in 1879 that has been amended many times since then through ballot propositions passed by the voters. Overall, do you think
the California Constitution needs major changes or minor changes or is it fine the way it is?”
March 2009 September 2009
Major changes 31% 33%
Minor changes 36 36
Fine the way it is 24 24
Don't know 9 7
Today, Democrats (35% major, 41% minor changes) are more likely than independents (34% major, 34% minor changes) or Republicans (23% major, 37% minor changes) to believe the state’s constitution needs change. Strong majorities across regions and demographic groups believe the state constitution needs at least minor changes. Latinos are much more likely than whites (41% to 27%) to say major changes are needed, as are lower-income and less educated residents more than others. Men (67%) are as likely as women (70%) to say at least minor changes are needed to the constitution. Among those who disapprove of Governor Schwarzenegger, 73 percent say at least minor changes are needed, and among those who approve of him, 62 percent agree.
“As you may know, the state currently operates under a constitution adopted in 1879 that has been amended many times since then through ballot propositions passed by the voters. Overall, do you think
the California Constitution needs major changes or minor changes or is it fine the way it is?”
All Adults Party
Likely Voters Dem Rep Ind
Major changes 33% 35% 23% 34% 28%
Minor changes 36 41 37 34 39
Fine the way it is 24 20 30 23 25
Don’t know 7 4 10 9 8
NATIONAL ISSUES
KEY FINDINGS
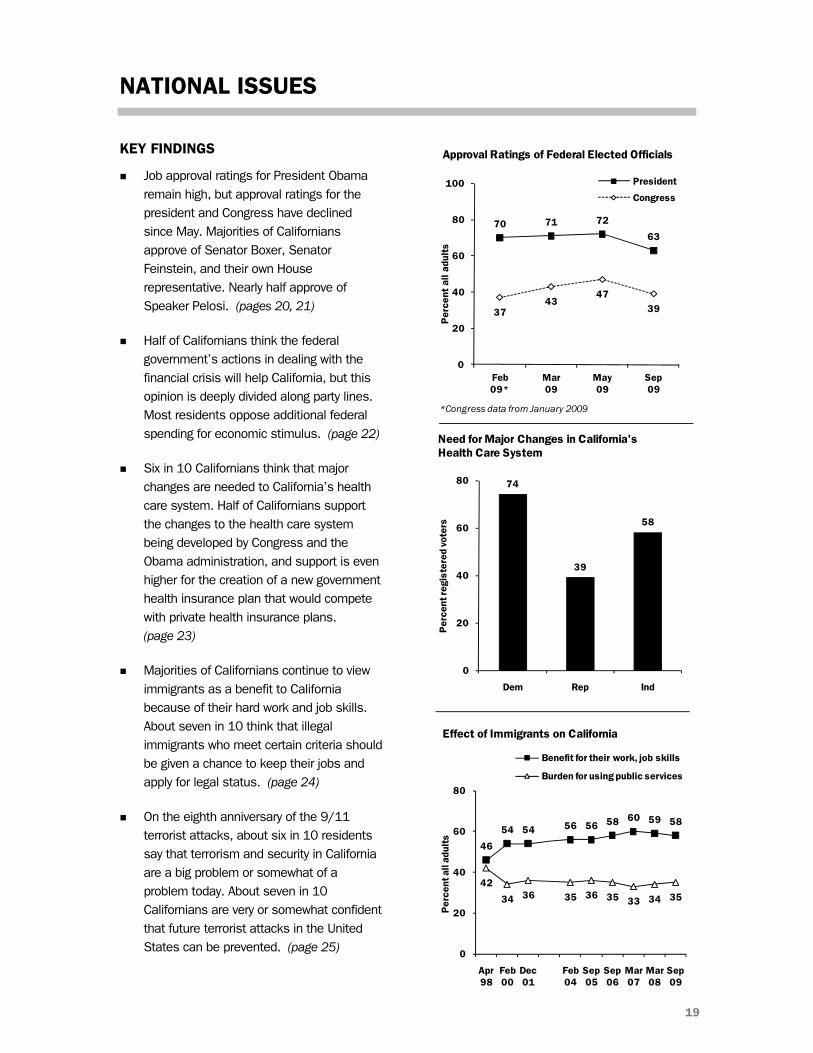
Job approval ratings for President Obama remain high, but approval ratings for the president and Congress have declined since May. Majorities of Californians approve of Senator Boxer, Senator Feinstein, and their own House representative. Nearly half approve of Speaker Pelosi. (pages 20, 21)
Half of Californians think the federal government’s actions in dealing with the financial crisis will help California, but this opinion is deeply divided along party lines. Most residents oppose additional federal spending for economic stimulus. (page 22)
Six in 10 Californians think that major changes are needed to California’s health care system. Half of Californians support the changes to the health care system being developed by Congress and the Obama administration, and support is even higher for the creation of a new government health insurance plan that would compete with private health insurance plans. (page 23)
Majorities of Californians continue to view immigrants as a benefit to California because of their hard work and job skills. About seven in 10 think that illegal immigrants who meet certain criteria should be given a chance to keep their jobs and apply for legal status. (page 24)
On the eighth anniversary of the 9/11 terrorist attacks, about six in 10 residents say that terrorism and security in California are a big problem or somewhat of a problem today. About seven in 10 Californians are very or somewhat confident that future terrorist attacks in the United States can be prevented. (page 25)
46
54 54 56 56 58 60 59 58
42
34 36 35 36 35 33 34 35
0
20
40
60
80
Apr 98
Feb 00
Dec 01
Feb 04
Sep 05
Sep 06
Mar 07
Mar 08
Sep 09
Per
cent
all
adul
ts
Benefit for their work, job skills
Burden for using public services
Effect of Immigrants on California
70 71 72
63
3743
4739
0
20
40
60
80
100
Feb09*
Mar09
May09
Sep09
Per
cent
all
adul
ts
President
Congress
Approval Ratings of Federal Elected Officials
*Congress data from January 2009
74
39
58
0
20
40
60
80
Dem Rep Ind
Per
cent
regi
ster
ed v
oter
sNeed for Major Changes in California's Health Care System
19
Californians and Their Government
20 PPIC Statewide Survey
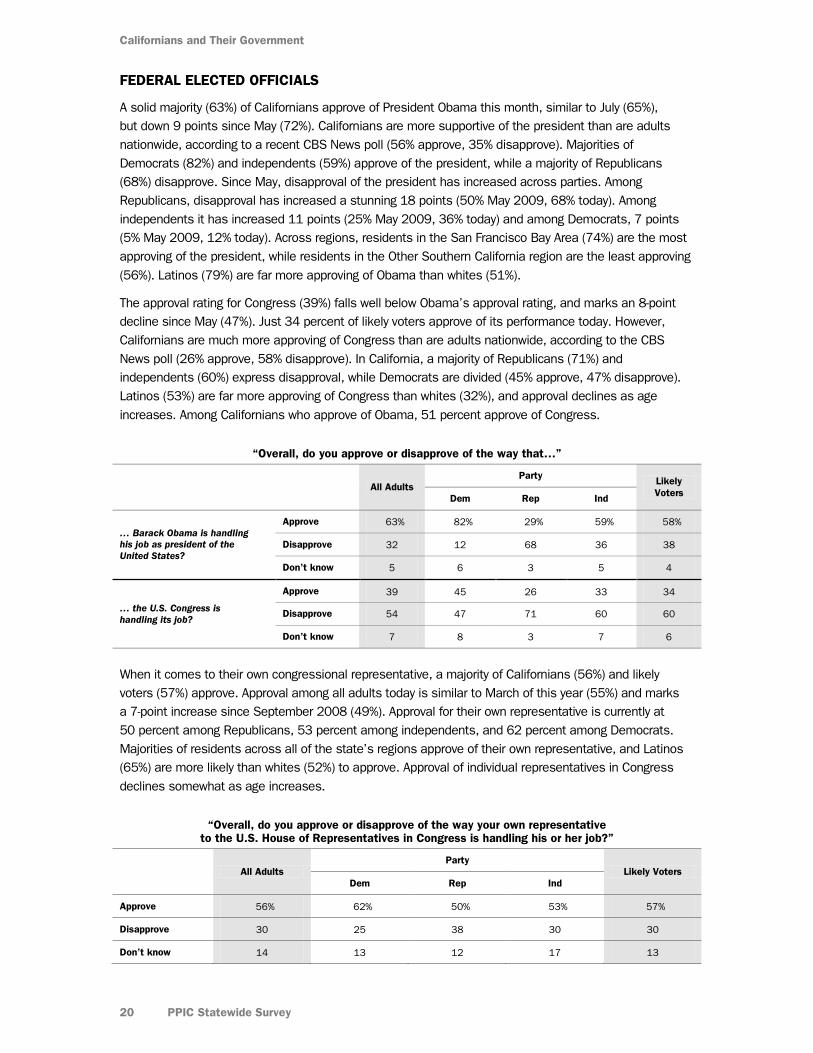
FEDERAL ELECTED OFFICIALS
A solid majority (63%) of Californians approve of President Obama this month, similar to July (65%), but down 9 points since May (72%). Californians are more supportive of the president than are adults nationwide, according to a recent CBS News poll (56% approve, 35% disapprove). Majorities of Democrats (82%) and independents (59%) approve of the president, while a majority of Republicans (68%) disapprove. Since May, disapproval of the president has increased across parties. Among Republicans, disapproval has increased a stunning 18 points (50% May 2009, 68% today). Among independents it has increased 11 points (25% May 2009, 36% today) and among Democrats, 7 points (5% May 2009, 12% today). Across regions, residents in the San Francisco Bay Area (74%) are the most approving of the president, while residents in the Other Southern California region are the least approving (56%). Latinos (79%) are far more approving of Obama than whites (51%).
The approval rating for Congress (39%) falls well below Obama’s approval rating, and marks an 8-point decline since May (47%). Just 34 percent of likely voters approve of its performance today. However, Californians are much more approving of Congress than are adults nationwide, according to the CBS News poll (26% approve, 58% disapprove). In California, a majority of Republicans (71%) and independents (60%) express disapproval, while Democrats are divided (45% approve, 47% disapprove). Latinos (53%) are far more approving of Congress than whites (32%), and approval declines as age increases. Among Californians who approve of Obama, 51 percent approve of Congress.
“Overall, do you approve or disapprove of the way that…”
All Adults Party Likely
Voters Dem Rep Ind
… Barack Obama is handling his job as president of the United States?
Approve 63% 82% 29% 59% 58%
Disapprove 32 12 68 36 38
Don’t know 5 6 3 5 4
… the U.S. Congress is handling its job?
Approve 39 45 26 33 34
Disapprove 54 47 71 60 60
Don’t know 7 8 3 7 6
When it comes to their own congressional representative, a majority of Californians (56%) and likely voters (57%) approve. Approval among all adults today is similar to March of this year (55%) and marks a 7-point increase since September 2008 (49%). Approval for their own representative is currently at 50 percent among Republicans, 53 percent among independents, and 62 percent among Democrats. Majorities of residents across all of the state’s regions approve of their own representative, and Latinos (65%) are more likely than whites (52%) to approve. Approval of individual representatives in Congress declines somewhat as age increases.
“Overall, do you approve or disapprove of the way your own representative to the U.S. House of Representatives in Congress is handling his or her job?”
All Adults Party
Likely Voters Dem Rep Ind
Approve 56% 62% 50% 53% 57%
Disapprove 30 25 38 30 30
Don’t know 14 13 12 17 13
National Issues
September 2009 21
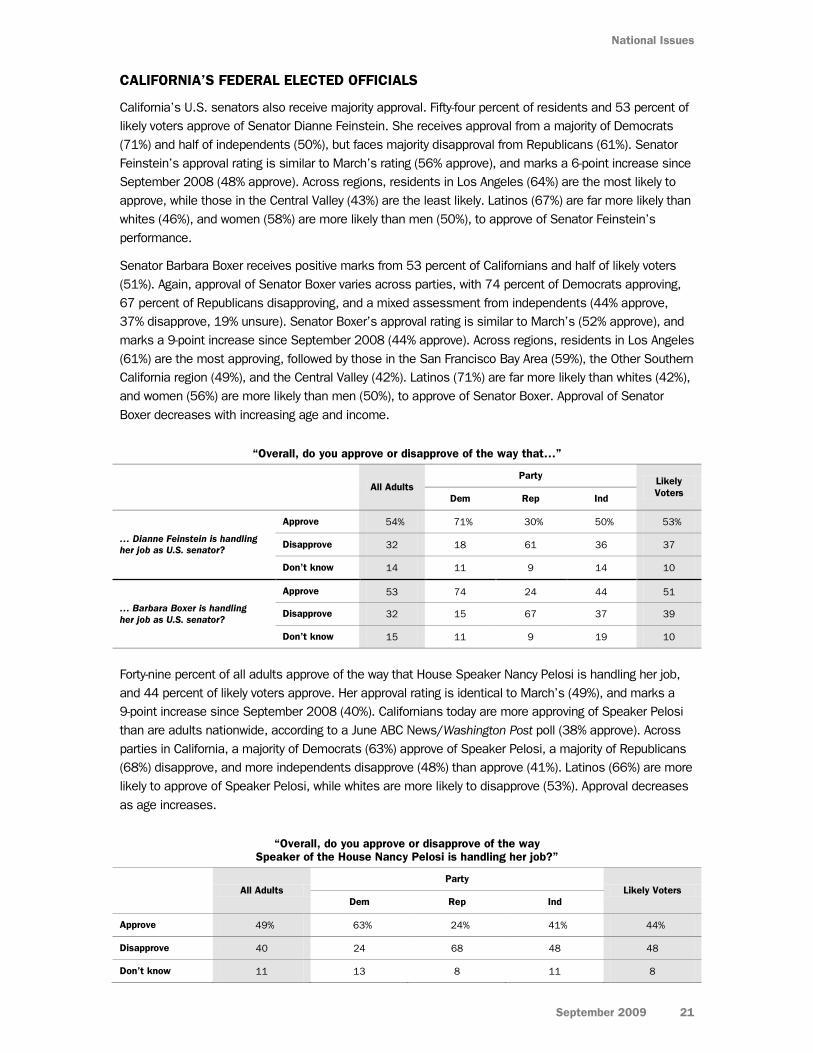
CALIFORNIA’S FEDERAL ELECTED OFFICIALS
California’s U.S. senators also receive majority approval. Fifty-four percent of residents and 53 percent of likely voters approve of Senator Dianne Feinstein. She receives approval from a majority of Democrats (71%) and half of independents (50%), but faces majority disapproval from Republicans (61%). Senator Feinstein’s approval rating is similar to March’s rating (56% approve), and marks a 6-point increase since September 2008 (48% approve). Across regions, residents in Los Angeles (64%) are the most likely to approve, while those in the Central Valley (43%) are the least likely. Latinos (67%) are far more likely than whites (46%), and women (58%) are more likely than men (50%), to approve of Senator Feinstein’s performance.
Senator Barbara Boxer receives positive marks from 53 percent of Californians and half of likely voters (51%). Again, approval of Senator Boxer varies across parties, with 74 percent of Democrats approving, 67 percent of Republicans disapproving, and a mixed assessment from independents (44% approve, 37% disapprove, 19% unsure). Senator Boxer’s approval rating is similar to March’s (52% approve), and marks a 9-point increase since September 2008 (44% approve). Across regions, residents in Los Angeles (61%) are the most approving, followed by those in the San Francisco Bay Area (59%), the Other Southern California region (49%), and the Central Valley (42%). Latinos (71%) are far more likely than whites (42%), and women (56%) are more likely than men (50%), to approve of Senator Boxer. Approval of Senator Boxer decreases with increasing age and income.
“Overall, do you approve or disapprove of the way that…”
All Adults Party Likely
Voters Dem Rep Ind
… Dianne Feinstein is handling her job as U.S. senator?
Approve 54% 71% 30% 50% 53%
Disapprove 32 18 61 36 37
Don’t know 14 11 9 14 10
… Barbara Boxer is handling her job as U.S. senator?
Approve 53 74 24 44 51
Disapprove 32 15 67 37 39
Don’t know 15 11 9 19 10
Forty-nine percent of all adults approve of the way that House Speaker Nancy Pelosi is handling her job, and 44 percent of likely voters approve. Her approval rating is identical to March’s (49%), and marks a 9-point increase since September 2008 (40%). Californians today are more approving of Speaker Pelosi than are adults nationwide, according to a June ABC News/Washington Post poll (38% approve). Across parties in California, a majority of Democrats (63%) approve of Speaker Pelosi, a majority of Republicans (68%) disapprove, and more independents disapprove (48%) than approve (41%). Latinos (66%) are more likely to approve of Speaker Pelosi, while whites are more likely to disapprove (53%). Approval decreases as age increases.
“Overall, do you approve or disapprove of the way Speaker of the House Nancy Pelosi is handling her job?”
All Adults Party
Likely Voters Dem Rep Ind
Approve 49% 63% 24% 41% 44%
Disapprove 40 24 68 48 48
Don’t know 11 13 8 11 8
Californians and Their Government
22 PPIC Statewide Survey
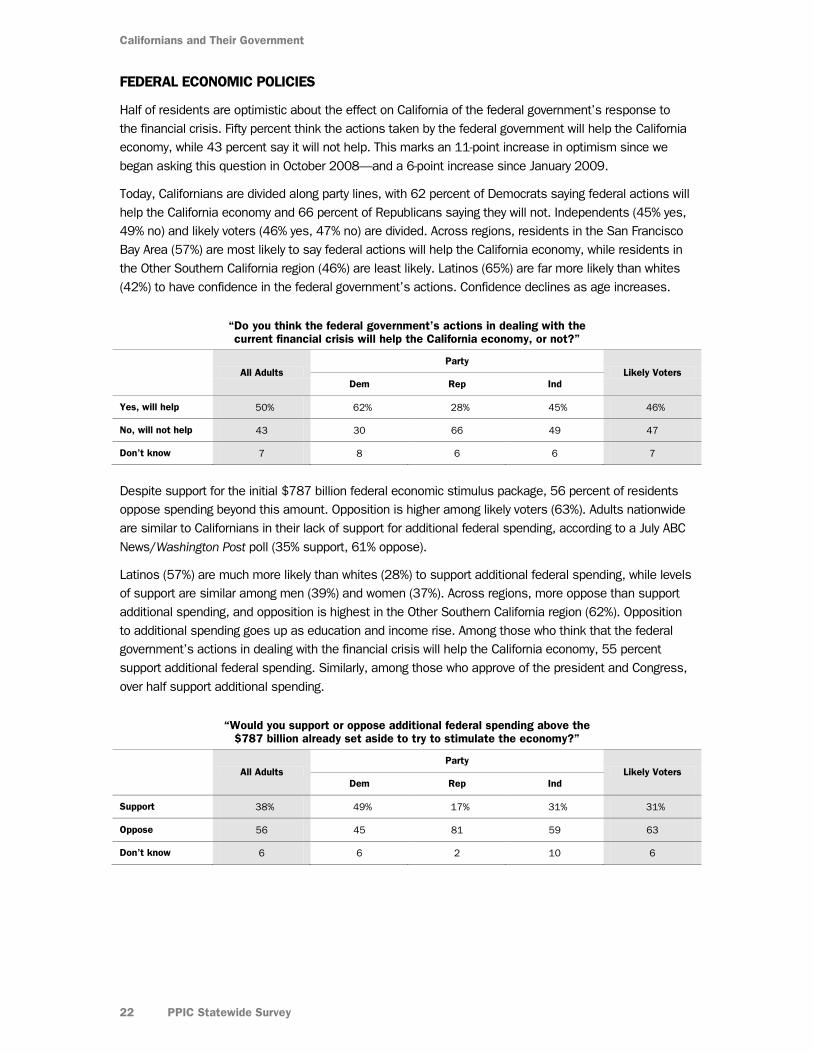
FEDERAL ECONOMIC POLICIES
Half of residents are optimistic about the effect on California of the federal government’s response to the financial crisis. Fifty percent think the actions taken by the federal government will help the California economy, while 43 percent say it will not help. This marks an 11-point increase in optimism since we began asking this question in October 2008—and a 6-point increase since January 2009.
Today, Californians are divided along party lines, with 62 percent of Democrats saying federal actions will help the California economy and 66 percent of Republicans saying they will not. Independents (45% yes, 49% no) and likely voters (46% yes, 47% no) are divided. Across regions, residents in the San Francisco Bay Area (57%) are most likely to say federal actions will help the California economy, while residents in the Other Southern California region (46%) are least likely. Latinos (65%) are far more likely than whites (42%) to have confidence in the federal government’s actions. Confidence declines as age increases.
“Do you think the federal government’s actions in dealing with the current financial crisis will help the California economy, or not?”
All Adults Party
Likely Voters Dem Rep Ind
Yes, will help 50% 62% 28% 45% 46%
No, will not help 43 30 66 49 47
Don’t know 7 8 6 6 7
Despite support for the initial $787 billion federal economic stimulus package, 56 percent of residents oppose spending beyond this amount. Opposition is higher among likely voters (63%). Adults nationwide are similar to Californians in their lack of support for additional federal spending, according to a July ABC News/Washington Post poll (35% support, 61% oppose).
Latinos (57%) are much more likely than whites (28%) to support additional federal spending, while levels of support are similar among men (39%) and women (37%). Across regions, more oppose than support additional spending, and opposition is highest in the Other Southern California region (62%). Opposition to additional spending goes up as education and income rise. Among those who think that the federal government’s actions in dealing with the financial crisis will help the California economy, 55 percent support additional federal spending. Similarly, among those who approve of the president and Congress, over half support additional spending.
“Would you support or oppose additional federal spending above the $787 billion already set aside to try to stimulate the economy?”
All Adults Party
Likely Voters Dem Rep Ind
Support 38% 49% 17% 31% 31%
Oppose 56 45 81 59 63
Don’t know 6 6 2 10 6
National Issues
September 2009 23
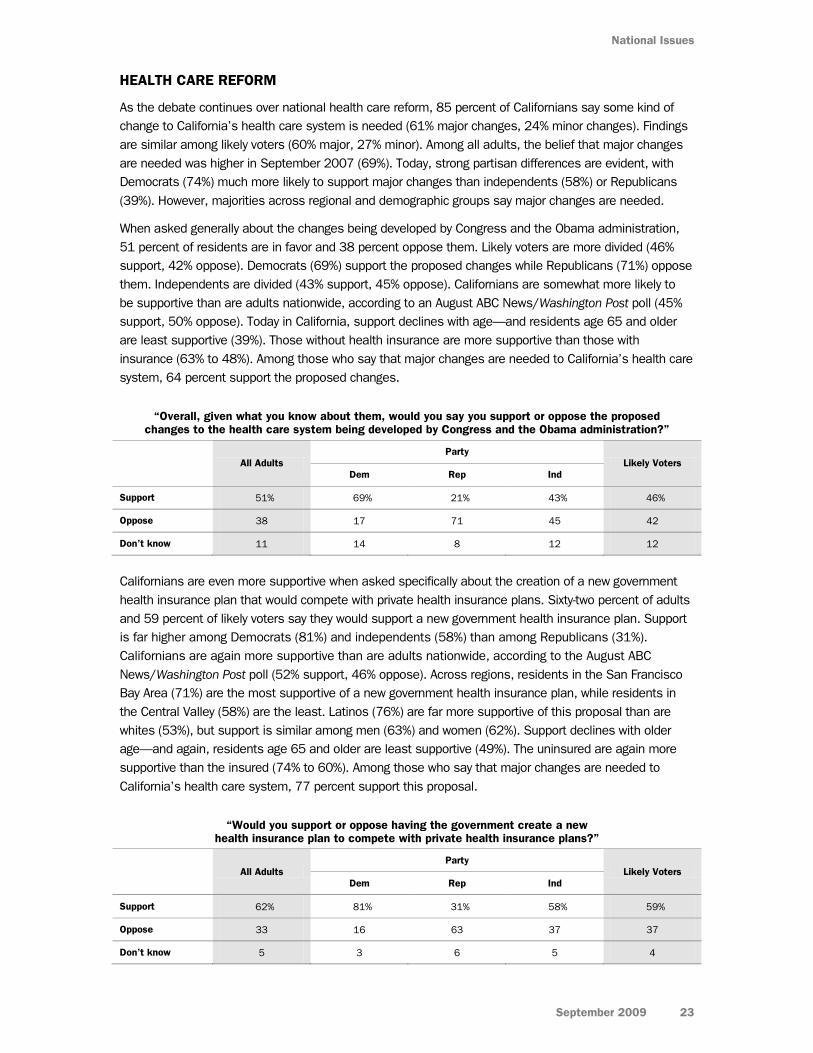
HEALTH CARE REFORM
As the debate continues over national health care reform, 85 percent of Californians say some kind of change to California’s health care system is needed (61% major changes, 24% minor changes). Findings are similar among likely voters (60% major, 27% minor). Among all adults, the belief that major changes are needed was higher in September 2007 (69%). Today, strong partisan differences are evident, with Democrats (74%) much more likely to support major changes than independents (58%) or Republicans (39%). However, majorities across regional and demographic groups say major changes are needed.
When asked generally about the changes being developed by Congress and the Obama administration, 51 percent of residents are in favor and 38 percent oppose them. Likely voters are more divided (46% support, 42% oppose). Democrats (69%) support the proposed changes while Republicans (71%) oppose them. Independents are divided (43% support, 45% oppose). Californians are somewhat more likely to be supportive than are adults nationwide, according to an August ABC News/Washington Post poll (45% support, 50% oppose). Today in California, support declines with age—and residents age 65 and older are least supportive (39%). Those without health insurance are more supportive than those with insurance (63% to 48%). Among those who say that major changes are needed to California’s health care system, 64 percent support the proposed changes.
“Overall, given what you know about them, would you say you support or oppose the proposed changes to the health care system being developed by Congress and the Obama administration?”
All Adults Party
Likely Voters Dem Rep Ind
Support 51% 69% 21% 43% 46%
Oppose 38 17 71 45 42
Don’t know 11 14 8 12 12
Californians are even more supportive when asked specifically about the creation of a new government health insurance plan that would compete with private health insurance plans. Sixty-two percent of adults and 59 percent of likely voters say they would support a new government health insurance plan. Support is far higher among Democrats (81%) and independents (58%) than among Republicans (31%). Californians are again more supportive than are adults nationwide, according to the August ABC News/Washington Post poll (52% support, 46% oppose). Across regions, residents in the San Francisco Bay Area (71%) are the most supportive of a new government health insurance plan, while residents in the Central Valley (58%) are the least. Latinos (76%) are far more supportive of this proposal than are whites (53%), but support is similar among men (63%) and women (62%). Support declines with older age—and again, residents age 65 and older are least supportive (49%). The uninsured are again more supportive than the insured (74% to 60%). Among those who say that major changes are needed to California’s health care system, 77 percent support this proposal.
“Would you support or oppose having the government create a new health insurance plan to compete with private health insurance plans?”
All Adults Party
Likely Voters Dem Rep Ind
Support 62% 81% 31% 58% 59%
Oppose 33 16 63 37 37
Don’t know 5 3 6 5 4
Californians and Their Government
24 PPIC Statewide Survey
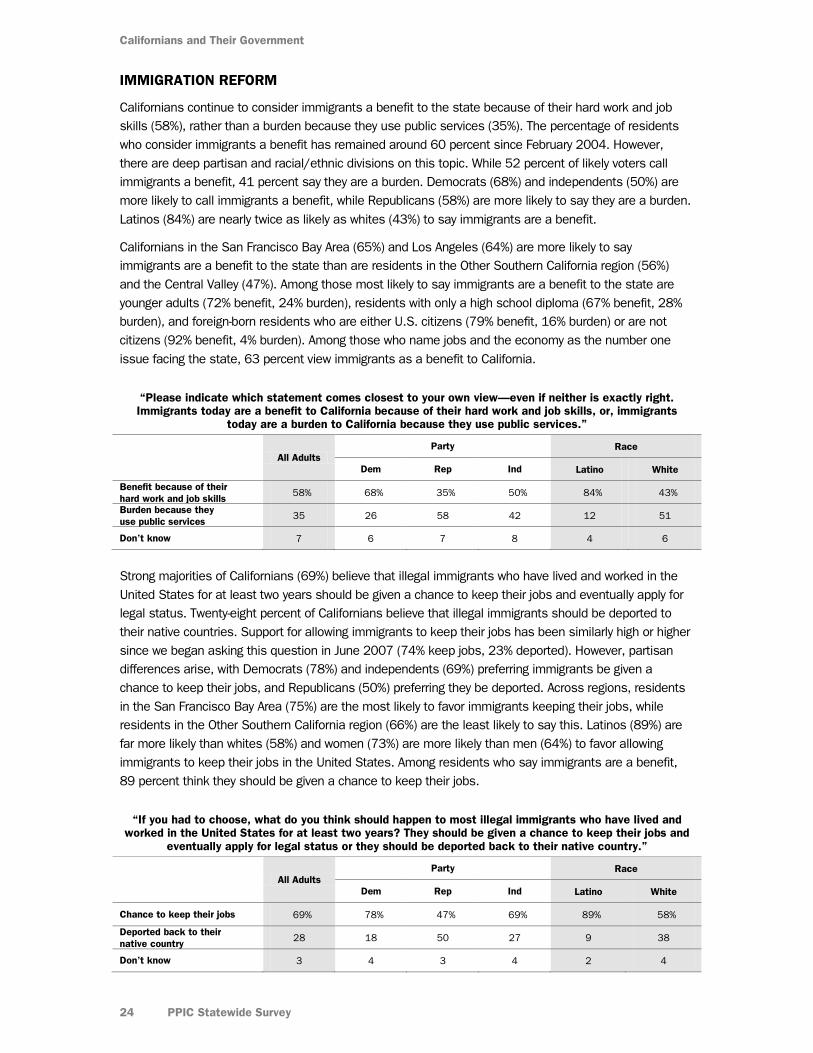
IMMIGRATION REFORM
Californians continue to consider immigrants a benefit to the state because of their hard work and job skills (58%), rather than a burden because they use public services (35%). The percentage of residents who consider immigrants a benefit has remained around 60 percent since February 2004. However, there are deep partisan and racial/ethnic divisions on this topic. While 52 percent of likely voters call immigrants a benefit, 41 percent say they are a burden. Democrats (68%) and independents (50%) are more likely to call immigrants a benefit, while Republicans (58%) are more likely to say they are a burden. Latinos (84%) are nearly twice as likely as whites (43%) to say immigrants are a benefit.
Californians in the San Francisco Bay Area (65%) and Los Angeles (64%) are more likely to say immigrants are a benefit to the state than are residents in the Other Southern California region (56%) and the Central Valley (47%). Among those most likely to say immigrants are a benefit to the state are younger adults (72% benefit, 24% burden), residents with only a high school diploma (67% benefit, 28% burden), and foreign-born residents who are either U.S. citizens (79% benefit, 16% burden) or are not citizens (92% benefit, 4% burden). Among those who name jobs and the economy as the number one issue facing the state, 63 percent view immigrants as a benefit to California.
“Please indicate which statement comes closest to your own view—even if neither is exactly right. Immigrants today are a benefit to California because of their hard work and job skills, or, immigrants
today are a burden to California because they use public services.”
All Adults Party Race
Dem Rep Ind Latino White
Benefit because of their hard work and job skills 58% 68% 35% 50% 84% 43%
Burden because they use public services
35 26 58 42 12 51
Don’t know 7 6 7 8 4 6
Strong majorities of Californians (69%) believe that illegal immigrants who have lived and worked in the United States for at least two years should be given a chance to keep their jobs and eventually apply for legal status. Twenty-eight percent of Californians believe that illegal immigrants should be deported to their native countries. Support for allowing immigrants to keep their jobs has been similarly high or higher since we began asking this question in June 2007 (74% keep jobs, 23% deported). However, partisan differences arise, with Democrats (78%) and independents (69%) preferring immigrants be given a chance to keep their jobs, and Republicans (50%) preferring they be deported. Across regions, residents in the San Francisco Bay Area (75%) are the most likely to favor immigrants keeping their jobs, while residents in the Other Southern California region (66%) are the least likely to say this. Latinos (89%) are far more likely than whites (58%) and women (73%) are more likely than men (64%) to favor allowing immigrants to keep their jobs in the United States. Among residents who say immigrants are a benefit, 89 percent think they should be given a chance to keep their jobs.
“If you had to choose, what do you think should happen to most illegal immigrants who have lived and worked in the United States for at least two years? They should be given a chance to keep their jobs and
eventually apply for legal status or they should be deported back to their native country.”
All Adults Party Race
Dem Rep Ind Latino White
Chance to keep their jobs 69% 78% 47% 69% 89% 58%
Deported back to their native country 28 18 50 27 9 38
Don’t know 3 4 3 4 2 4
National Issues
September 2009 25
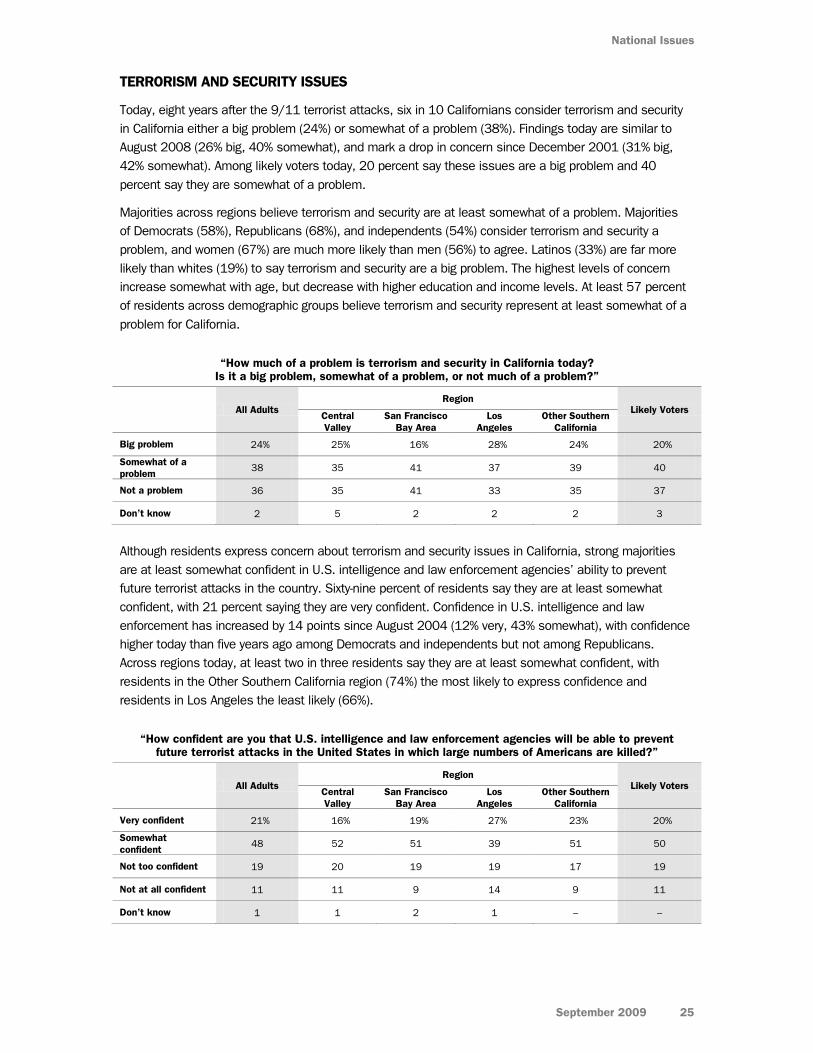
TERRORISM AND SECURITY ISSUES
Today, eight years after the 9/11 terrorist attacks, six in 10 Californians consider terrorism and security in California either a big problem (24%) or somewhat of a problem (38%). Findings today are similar to August 2008 (26% big, 40% somewhat), and mark a drop in concern since December 2001 (31% big, 42% somewhat). Among likely voters today, 20 percent say these issues are a big problem and 40 percent say they are somewhat of a problem.
Majorities across regions believe terrorism and security are at least somewhat of a problem. Majorities of Democrats (58%), Republicans (68%), and independents (54%) consider terrorism and security a problem, and women (67%) are much more likely than men (56%) to agree. Latinos (33%) are far more likely than whites (19%) to say terrorism and security are a big problem. The highest levels of concern increase somewhat with age, but decrease with higher education and income levels. At least 57 percent of residents across demographic groups believe terrorism and security represent at least somewhat of a problem for California.
“How much of a problem is terrorism and security in California today? Is it a big problem, somewhat of a problem, or not much of a problem?”
All Adults Region
Likely Voters Central Valley
San Francisco Bay Area
Los Angeles
Other Southern California
Big problem 24% 25% 16% 28% 24% 20%
Somewhat of a problem 38 35 41 37 39 40
Not a problem 36 35 41 33 35 37
Don’t know 2 5 2 2 2 3
Although residents express concern about terrorism and security issues in California, strong majorities are at least somewhat confident in U.S. intelligence and law enforcement agencies’ ability to prevent future terrorist attacks in the country. Sixty-nine percent of residents say they are at least somewhat confident, with 21 percent saying they are very confident. Confidence in U.S. intelligence and law enforcement has increased by 14 points since August 2004 (12% very, 43% somewhat), with confidence higher today than five years ago among Democrats and independents but not among Republicans. Across regions today, at least two in three residents say they are at least somewhat confident, with residents in the Other Southern California region (74%) the most likely to express confidence and residents in Los Angeles the least likely (66%).
“How confident are you that U.S. intelligence and law enforcement agencies will be able to prevent future terrorist attacks in the United States in which large numbers of Americans are killed?”
All Adults Region
Likely Voters Central Valley
San Francisco Bay Area
Los Angeles
Other Southern California
Very confident 21% 16% 19% 27% 23% 20%
Somewhat confident 48 52 51 39 51 50
Not too confident 19 20 19 19 17 19
Not at all confident 11 11 9 14 9 11
Don’t know 1 1 2 1 – –
26 PPIC Statewide Survey
REGIONAL MAP
27
METHODOLOGY
The PPIC Statewide Survey is directed by Mark Baldassare, president and CEO and survey director at the Public Policy Institute of California, with assistance from Dean Bonner, project manager for this survey, and from survey research associates Jennifer Paluch and Sonja Petek. The Californians and Their Government series is supported with funding from The James Irvine Foundation. We benefit from discussions with PPIC staff, foundation staff, and other policy experts; however, the methods, questions, and content of this report were solely determined by Mark Baldassare and the survey staff.
Findings in this report are based on a telephone survey of 2,006 California adult residents, including landline telephones and cell phones. Interviewing took place on weekday nights and weekend days from August 26–September 2, 2009. Interviews took an average of 18 minutes to complete.
Landline interviews were conducted using a computer-generated random sample of telephone numbers that ensured that both listed and unlisted numbers were called. All landline telephone exchanges in California were eligible for selection and the sample telephone numbers were called as many as six times to increase the likelihood of reaching eligible households. Once a household was reached, an adult respondent (age 18 or older) was randomly chosen for interviewing using the “last birthday method” to avoid biases in age and gender. A total of 201 cell phone interviews were included in this survey to account for the growing number of Californians who use them. These interviews were conducted using a computer-generated random sample of cell phone numbers. All cell phone numbers with California area codes were eligible for selection and the sample telephone numbers were called as many as eight times to increase the likelihood of reaching an eligible respondent. Once a cell phone user was reached, it was verified that this person was age 18 or older, a resident of California, and in a safe place to continue the survey (e.g., not driving). Cell phone respondents were offered a small reimbursement for their time to help defray the potential cost of the call. Cell phone interviews were conducted with adults who have cell phone service only and with those who have both cell phone and landline service in the household.
Landline and cell phone interviewing was conducted in English and Spanish according to respondents’ preferences. Accent on Languages, Inc. translated the survey into Spanish, with assistance from Renatta DeFever. Abt SRBI conducted the telephone interviewing.
With assistance from Abt SRBI, we used recent U.S. Census and state figures to compare the demo-graphic characteristics of the survey sample with characteristics of California’s adult population. The survey sample was closely comparable to the census and state figures. Abt SRBI used data from the 2007 and 2008 National Health Interview Survey and data from the 2005–2007 American Community Survey for California, both to estimate landline and cell phone service in California and to compare it against landline and cell phone service reported in the survey. The survey data in this report were statistically weighted to account for any differences in demographics and telephone service.
The sampling error for the total of 2,006 adults is ±2 percent at the 95 percent confidence level. This means that 95 times out of 100, the results will be within 2 percentage points of what they would be if all adults in California were interviewed. The sampling error for subgroups is larger: For the 1,689 registered voters, it is ±2.4 percent; for the 1,291 likely voters, it is ±2.7 percent. Sampling error is only one type of error to which surveys are subject. Results may also be affected by factors such as question wording, question order, and survey timing.
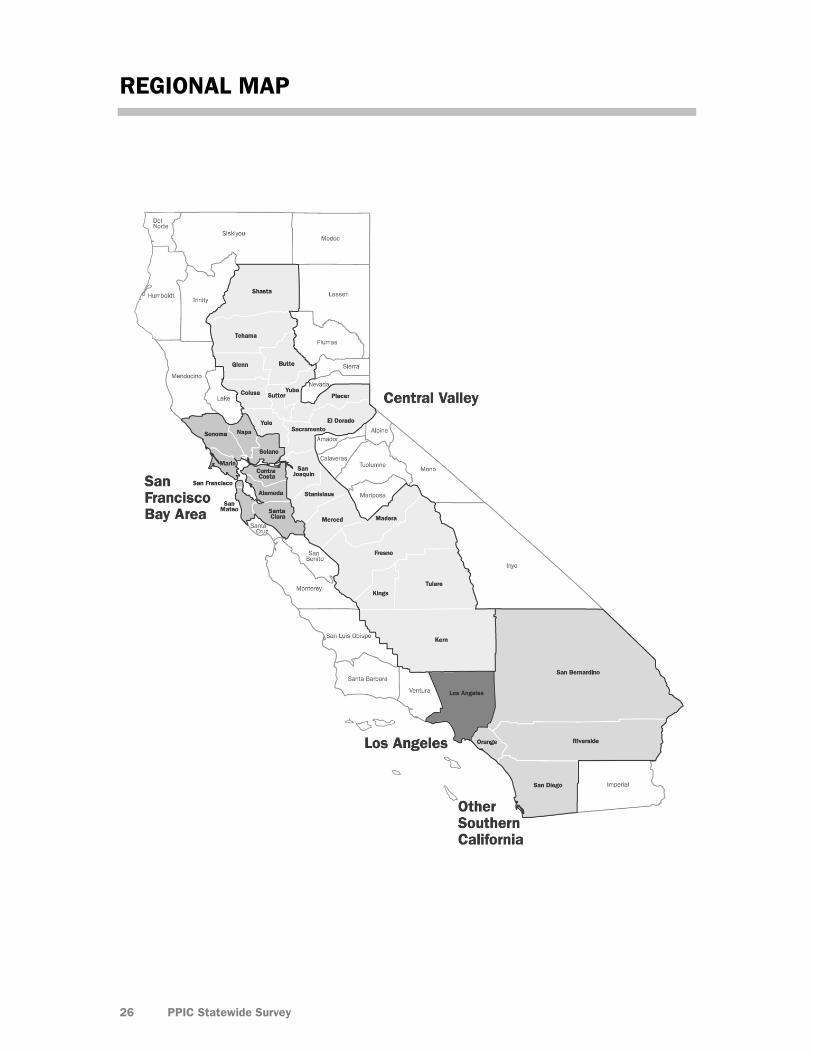
We present results for four geographic regions, accounting for approximately 90 percent of the state population. “Central Valley” includes Butte, Colusa, El Dorado, Fresno, Glenn, Kern, Kings, Madera, Merced, Placer, Sacramento, San Joaquin, Shasta, Stanislaus, Sutter, Tehama, Tulare, Yolo, and Yuba
Californians and Their Government
28 PPIC Statewide Survey
Counties. “San Francisco Bay Area” includes Alameda, Contra Costa, Marin, Napa, San Francisco, San Mateo, Santa Clara, Solano, and Sonoma Counties. “Los Angeles” refers to Los Angeles County, and “Other Southern California” includes Orange, Riverside, San Bernardino, and San Diego Counties. Residents from other geographic areas are included in the results reported for all adults, registered voters, and likely voters, but sample sizes for these less populated areas are not large enough to report separately.
We present specific results for Latinos because they account for about 30 percent of the state’s adult population and constitute one of the fastest growing voter groups. Sample sizes for African Americans and Asian Americans are not large enough for separate analysis. We compare the opinions of registered Democrats, Republicans, and independents (those who are registered as “decline to state”). We also include the responses of “likely voters”— those who are most likely to vote in the state’s elections based on their past voting, current interest, and voting intentions.
We compare current PPIC Statewide Survey results to those in our earlier surveys and to those in national surveys by ABC News/Washington Post, and CBS News.
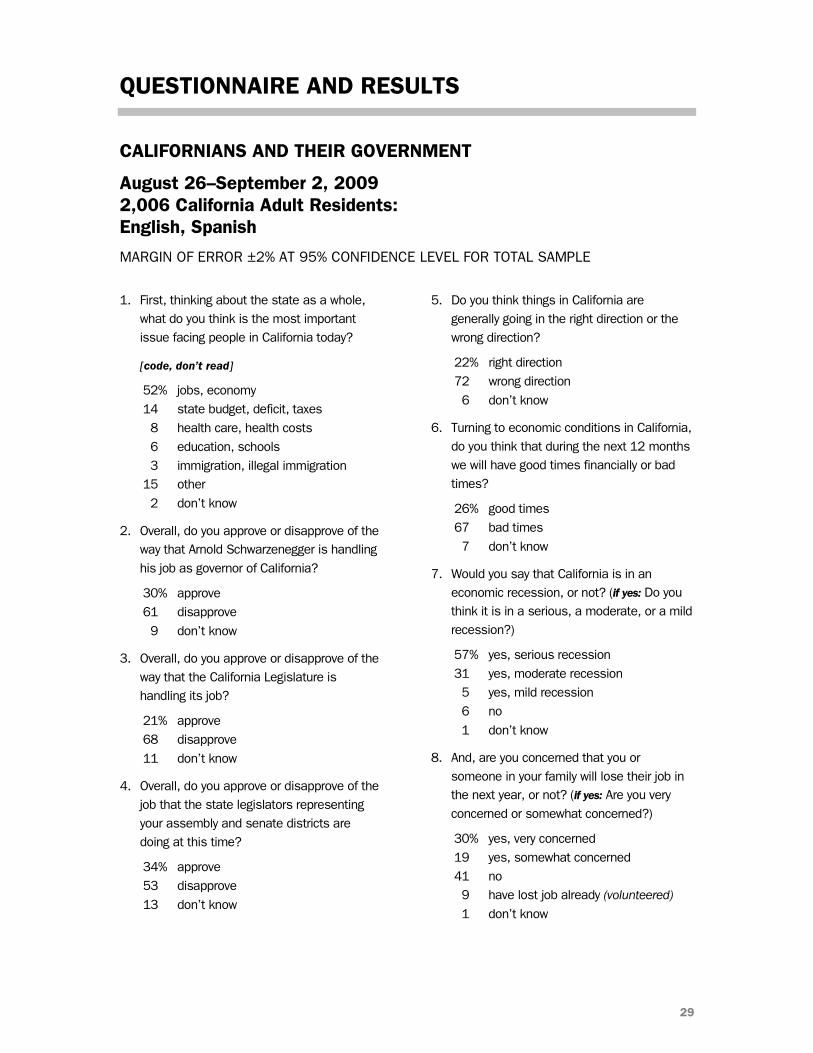
29
QUESTIONNAIRE AND RESULTS
CALIFORNIANS AND THEIR GOVERNMENT
August 26–September 2, 2009 2,006 California Adult Residents: English, Spanish
MARGIN OF ERROR ±2% AT 95% CONFIDENCE LEVEL FOR TOTAL SAMPLE
1. First, thinking about the state as a whole, what do you think is the most important issue facing people in California today?
[code, don’t read]
52% jobs, economy 14 state budget, deficit, taxes 8 health care, health costs 6 education, schools 3 immigration, illegal immigration 15 other 2 don’t know
2. Overall, do you approve or disapprove of the way that Arnold Schwarzenegger is handling his job as governor of California?
30% approve 61 disapprove 9 don’t know
3. Overall, do you approve or disapprove of the way that the California Legislature is handling its job?
21% approve 68 disapprove 11 don’t know
4. Overall, do you approve or disapprove of the job that the state legislators representing your assembly and senate districts are doing at this time?
34% approve 53 disapprove 13 don’t know
5. Do you think things in California are generally going in the right direction or the wrong direction?
22% right direction 72 wrong direction 6 don’t know
6. Turning to economic conditions in California, do you think that during the next 12 months we will have good times financially or bad times?
26% good times 67 bad times 7 don’t know
7. Would you say that California is in an economic recession, or not? (if yes: Do you think it is in a serious, a moderate, or a mild recession?)
57% yes, serious recession 31 yes, moderate recession 5 yes, mild recession 6 no 1 don’t know
8. And, are you concerned that you or someone in your family will lose their job in the next year, or not? (if yes: Are you very concerned or somewhat concerned?)
30% yes, very concerned 19 yes, somewhat concerned 41 no 9 have lost job already (volunteered)
1 don’t know
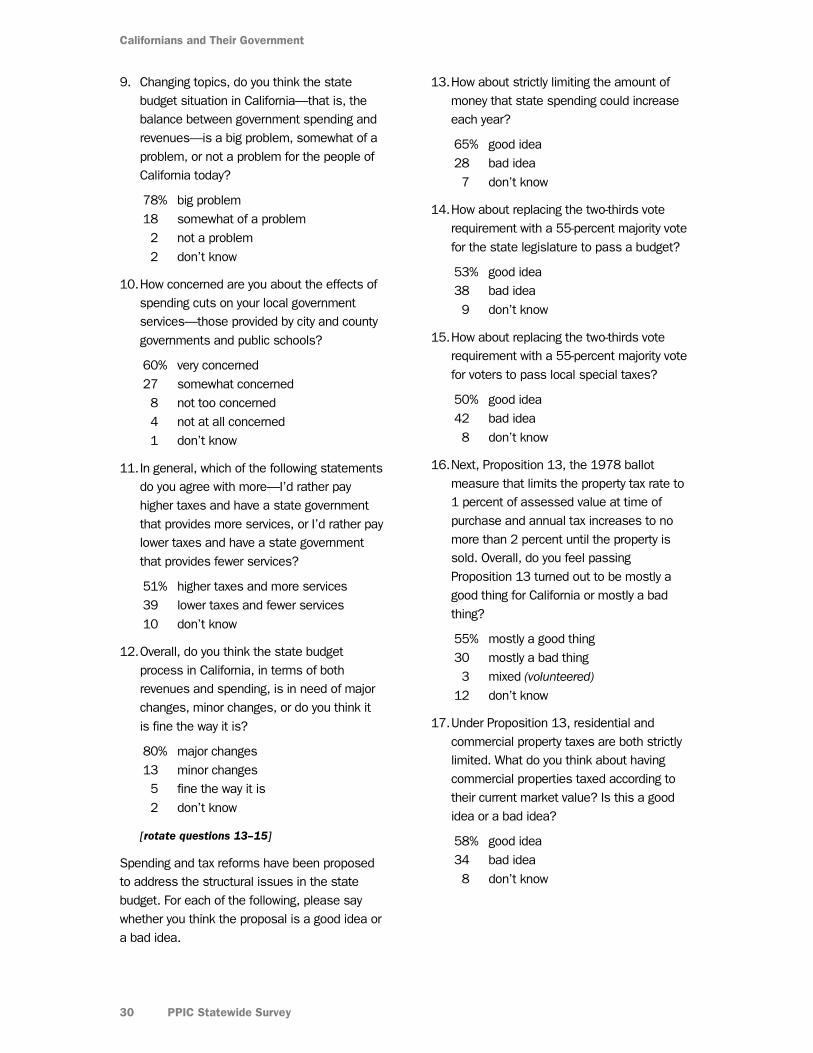
Californians and Their Government
30 PPIC Statewide Survey
9. Changing topics, do you think the state budget situation in California—that is, the balance between government spending and revenues—is a big problem, somewhat of a problem, or not a problem for the people of California today?
78% big problem 18 somewhat of a problem 2 not a problem 2 don’t know
10. How concerned are you about the effects of spending cuts on your local government services—those provided by city and county governments and public schools?
60% very concerned 27 somewhat concerned 8 not too concerned 4 not at all concerned 1 don’t know
11. In general, which of the following statements do you agree with more—I’d rather pay higher taxes and have a state government that provides more services, or I’d rather pay lower taxes and have a state government that provides fewer services?
51% higher taxes and more services 39 lower taxes and fewer services 10 don’t know
12. Overall, do you think the state budget process in California, in terms of both revenues and spending, is in need of major changes, minor changes, or do you think it is fine the way it is?
80% major changes 13 minor changes 5 fine the way it is 2 don’t know
[rotate questions 13–15]
Spending and tax reforms have been proposed to address the structural issues in the state budget. For each of the following, please say whether you think the proposal is a good idea or a bad idea.
13. How about strictly limiting the amount of money that state spending could increase each year?
65% good idea 28 bad idea 7 don’t know
14. How about replacing the two-thirds vote requirement with a 55-percent majority vote for the state legislature to pass a budget?
53% good idea 38 bad idea 9 don’t know
15. How about replacing the two-thirds vote requirement with a 55-percent majority vote for voters to pass local special taxes?
50% good idea 42 bad idea 8 don’t know
16. Next, Proposition 13, the 1978 ballot measure that limits the property tax rate to 1 percent of assessed value at time of purchase and annual tax increases to no more than 2 percent until the property is sold. Overall, do you feel passing Proposition 13 turned out to be mostly a good thing for California or mostly a bad thing?
55% mostly a good thing 30 mostly a bad thing 3 mixed (volunteered)
12 don’t know
17. Under Proposition 13, residential and commercial property taxes are both strictly limited. What do you think about having commercial properties taxed according to their current market value? Is this a good idea or a bad idea?
58% good idea 34 bad idea 8 don’t know
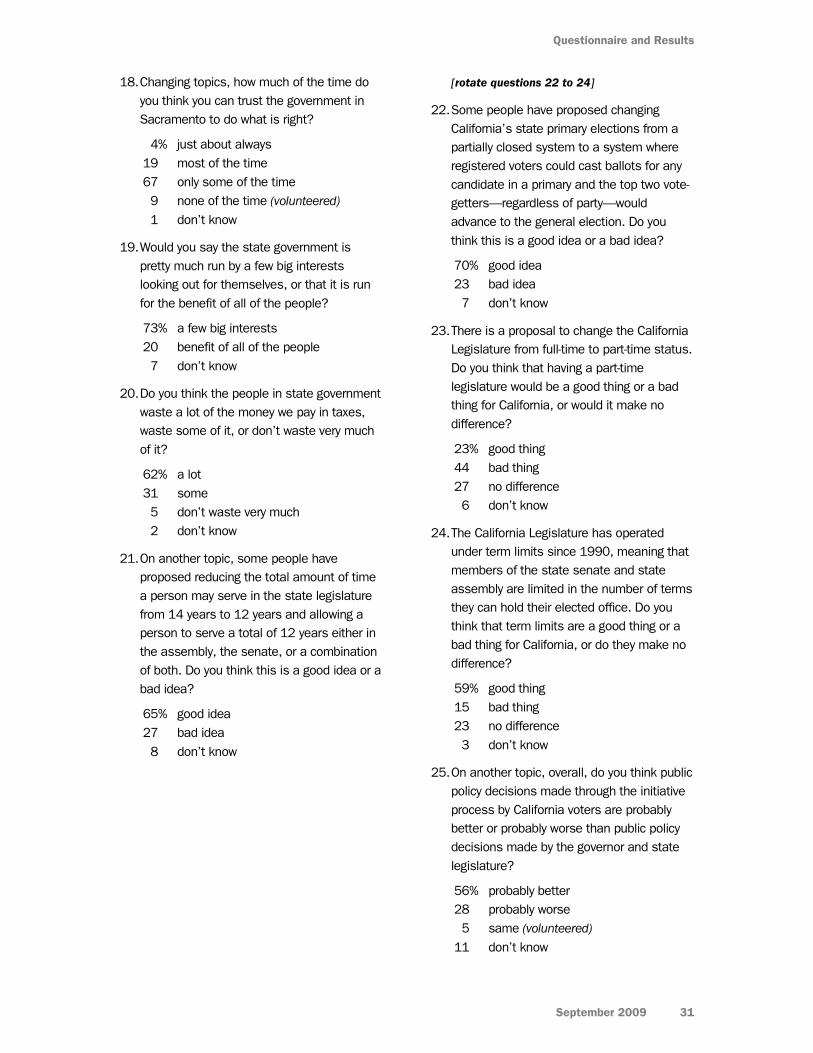
Questionnaire and Results
September 2009 31
18. Changing topics, how much of the time do you think you can trust the government in Sacramento to do what is right?
4% just about always 19 most of the time 67 only some of the time 9 none of the time (volunteered)
1 don’t know
19. Would you say the state government is pretty much run by a few big interests looking out for themselves, or that it is run for the benefit of all of the people?
73% a few big interests 20 benefit of all of the people 7 don’t know
20. Do you think the people in state government waste a lot of the money we pay in taxes, waste some of it, or don’t waste very much of it?
62% a lot 31 some 5 don’t waste very much 2 don’t know
21. On another topic, some people have proposed reducing the total amount of time a person may serve in the state legislature from 14 years to 12 years and allowing a person to serve a total of 12 years either in the assembly, the senate, or a combination of both. Do you think this is a good idea or a bad idea?
65% good idea 27 bad idea 8 don’t know
[rotate questions 22 to 24]
22. Some people have proposed changing California’s state primary elections from a partially closed system to a system where registered voters could cast ballots for any candidate in a primary and the top two vote-getters—regardless of party—would advance to the general election. Do you think this is a good idea or a bad idea?
70% good idea 23 bad idea 7 don’t know
23. There is a proposal to change the California Legislature from full-time to part-time status. Do you think that having a part-time legislature would be a good thing or a bad thing for California, or would it make no difference?
23% good thing 44 bad thing 27 no difference 6 don’t know
24. The California Legislature has operated under term limits since 1990, meaning that members of the state senate and state assembly are limited in the number of terms they can hold their elected office. Do you think that term limits are a good thing or a bad thing for California, or do they make no difference?
59% good thing 15 bad thing 23 no difference 3 don’t know
25. On another topic, overall, do you think public policy decisions made through the initiative process by California voters are probably better or probably worse than public policy decisions made by the governor and state legislature?
56% probably better 28 probably worse 5 same (volunteered)
11 don’t know
Californians and Their Government
32 PPIC Statewide Survey
Reforms have been suggested to address issues that arise in the initiative process. Please say whether you would favor or oppose each of the following reform proposals.
[rotate questions 26 and 27]
26. How about increasing public disclosure of funding sources for signature-gathering and initiative campaigns?
81% favor 14 oppose 5 don’t know
27. How about a period of time in which the initiative sponsor and the legislature could meet to see if there is a compromise solution before initiatives go to the ballot?
80% favor 15 oppose 5 don’t know
28. Next, as you may know, the state currently operates under a constitution adopted in 1879 that has been amended many times since then through ballot propositions passed by the voters. Overall, do you think the California Constitution needs major changes or minor changes or is it fine the way it is?
33% major changes 36 minor changes 24 fine the way it is 7 don’t know
[question 29 deleted]
30. Changing topics, overall, do you approve or disapprove of the way that Barack Obama is handling his job as president of the United States?
63% approve 32 disapprove 5 don’t know
[rotate questions 31 and 32]
31. Overall, do you approve or disapprove of the way that Dianne Feinstein is handling her job as U.S. senator?
54% approve 32 disapprove 14 don’t know
32. Overall, do you approve or disapprove of the way that Barbara Boxer is handling her job as U.S. senator?
53% approve 32 disapprove 15 don’t know
33. Overall, do you approve or disapprove of the way the U.S. Congress is handling its job?
39% approve 54 disapprove 7 don’t know
34. Overall, do you approve or disapprove of the way Speaker of the House Nancy Pelosi is handling her job?
49% approve 40 disapprove 11 don’t know
35. Overall, do you approve or disapprove of the way your own representative to the U.S. House of Representatives in Congress is handling his or her job?
56% approve 30 disapprove 14 don’t know
36. Changing topics, do you think the federal government’s actions in dealing with the current financial crisis will help the California economy, or not?
50% yes, will help 43 no, will not help 7 don’t know
Questionnaire and Results
September 2009 33
37. Would you support or oppose additional federal spending above the $787 billion already set aside to try to stimulate the economy?
38% support 56 oppose 6 don’t know
38. On another topic, do you think California’s health care system is in need of major changes or minor changes or that it is basically fine the way it is?
61% major changes 24 minor changes 13 fine the way it is 2 don’t know
39. Overall, given what you know about them, would you say you support or oppose the proposed changes to the health care system being developed by [rotate] [1] Congress [and] [2] the Obama administration?
51% support 38 oppose 11 don’t know
39a. Would you support or oppose having the government create a new health insurance plan to compete with private health insurance plans?
62% support 33 oppose 5 don’t know
40. On another topic, please indicate which statement comes closest to your own view—even if neither is exactly right. [rotate] [1] Immigrants today are a benefit to California because of their hard work and job skills [or] [2] Immigrants today are a burden to California because they use public services.
58% benefit 35 burden 7 don’t know
41. If you had to choose, what do you think should happen to most illegal immigrants who have lived and worked in the United States for at least two years? [rotate] [1] They should be given a chance to keep their jobs and eventually apply for legal status [or] [2] They should be deported back to their native country.
69% chance to keep their jobs 28 deported back to their native country 3 don’t know
42. On another topic, how much of a problem is terrorism and security in California today? Is it a big problem, somewhat of a problem, or not much of a problem?
24% big problem 38 somewhat of a problem 36 not much of a problem 2 don’t know
43. How confident are you that U.S. intelligence and law enforcement agencies will be able to prevent future terrorist attacks in the United States in which large numbers of Americans are killed?
21% very confident 48 somewhat confident 19 not too confident 11 not at all confident 1 don’t know
44. Next, some people are registered to vote and others are not. Are you absolutely certain that you are registered to vote in California?
85% yes [ask q44a] 15 no [skip to q45b]
44a. Are you registered as a Democrat, a Republican, another party, or as an independent?
45% Democrat [ask q45] 32 Republican [skip to q45a]
2 another party (specify) [skip to q46]
21 independent [skip to q45b]
Californians and Their Government
34 PPIC Statewide Survey
45. Would you call yourself a strong Democrat or not a very strong Democrat?
52% strong 45 not very strong 3 don’t know
[skip to q46]
45a. Would you call yourself a strong Republican or not a very strong Republican?
51% strong 46 not very strong 3 don’t know
[skip to q46]
45b. Do you think of yourself as closer to the Republican Party or Democratic Party?
26% Republican Party 49 Democratic Party 20 neither (volunteered)
5 don’t know
46. Next, would you consider yourself to be politically: [read list, rotate order top to bottom]
10% very liberal 22 somewhat liberal 30 middle-of-the-road 25 somewhat conservative 11 very conservative 2 don’t know
47. Generally speaking, how much interest would you say you have in politics?
26% great deal 42 fair amount 27 only a little 5 none
[d1 to d16: demographic questions]
PPIC STATEWIDE SURVEY ADVISORY COMMITTEE
Ruben Barrales President and Chief Executive Officer San Diego Regional Chamber of Commerce
Angela Blackwell Founder and Chief Executive Officer PolicyLink
Paul Brest President The William and Flora Hewlett Foundation
Mollyann Brodie Vice President Kaiser Family Foundation
Bruce E. Cain Executive Director University of California Washington Center
James E. Canales President The James Irvine Foundation
Jon Cohen Director of Polling The Washington Post
Matthew K. Fong Special Counsel Sheppard, Mullin, Richter & Hampton, LLP
Russell Hancock President and Chief Executive Officer Joint Venture Silicon Valley Network
William Hauck President California Business Roundtable
Sherry Bebitch Jeffe Senior Scholar School of Policy, Planning, and Development University of Southern California
Carol S. Larson President and Chief Executive Officer The David and Lucile Packard Foundation
Monica Lozano Publisher and Chief Executive Officer La Opinión
Donna Lucas Chief Executive Officer Lucas Public Affairs
Dan Rosenheim News Director KPIX-TV
Robert K. Ross, M.D. President and Chief Executive Officer The California Endowment
Most Reverend Jaime Soto Bishop of Sacramento Roman Catholic Diocese of Sacramento
Cathy Taylor Vice President and Editorial Commentary Director Orange County Register
Raymond L. Watson Vice Chairman of the Board Emeritus The Irvine Company
Carol Whiteside President Emeritus Great Valley Center
The PPIC Statewide Survey Advisory Committee is a diverse group of experts who provide advice on survey issues.
However, survey methods, questions, content, and timing are determined solely by PPIC.
PPIC BOARD OF DIRECTORS
Walter B. Hewlett, Chair Director Center for Computer Assisted Research in the Humanities
Mark Baldassare President and Chief Executive Officer Public Policy Institute of California
Ruben Barrales President and Chief Executive Officer San Diego Regional Chamber of Commerce
John E. Bryson Retired Chairman and CEO Edison International
Gary K. Hart Former State Senator and Secretary of Education State of California
Robert M. Hertzberg Partner Mayer Brown, LLP
Donna Lucas Chief Executive Officer Lucas Public Affairs
David Mas Masumoto Author and farmer
Steven A. Merksamer Senior Partner Nielsen, Merksamer, Parrinello, Mueller & Naylor, LLP
Constance L. Rice Co-Director The Advancement Project
Thomas C. Sutton Retired Chairman and Chief Executive Officer Pacific Life Insurance Company
Carol Whiteside President Emeritus Great Valley Center
Related Documents