® IBM Software Group Jon Sayles, IBM z Development Tools - [email protected] @ Copyright June 2021 DevOps IBM Developer for z Systems – for ISPF Developers Module 9 – Debugging COBOL & Code Coverage

Welcome message from author
This document is posted to help you gain knowledge. Please leave a comment to let me know what you think about it! Share it to your friends and learn new things together.
Transcript

®
IBM Software Group
®
IBM Software Group
®
IBM Software Group
®
IBM Software Group
Jon Sayles, IBM z Development Tools [email protected]
@Copyright June 2021
DevOps
IBM Developer for z Systems – for ISPF Developers
Module 9 – Debugging COBOL & Code Coverage
2
Notices and disclaimers© 2021 International Business Machines Corporation. No part of
this document may be reproduced or transmitted in any form
without written permission
from IBM.
U.S. Government Users Restricted Rights — use, duplication or
disclosure restricted by GSA ADP Schedule Contract with IBM.
Information in these presentations (including information relating
to products that have not yet been announced by IBM) has been
reviewed for accuracy as of the date of initial publication
and could include unintentional technical or typographical
errors. IBM shall have no responsibility to update this information.
This document is distributed “as is” without any warranty, either
express or implied. In no event, shall IBM be liable for any damage
arising from the use of this information, including but not limited
to, loss of data, business interruption, loss of profit or loss of
opportunity. IBM products and services are warranted per the
terms and conditions of the agreements under which they are
provided.
IBM products are manufactured from new parts or new and used
parts.
In some cases, a product may not be new and may have been
previously installed. Regardless, our warranty terms apply.”
Any statements regarding IBM's future direction, intent or
product plans are subject to change or withdrawal without
notice.
Performance data contained herein was generally obtained in a
controlled, isolated environments. Customer examples are
presented as illustrations of how those customers have used
IBM products and the results they may have achieved. Actual
performance, cost, savings or other results in other
operating environments may vary.
References in this document to IBM products, programs, or
services does not imply that IBM intends to make such products,
programs or services available in all countries in which
IBM operates or does business.
Workshops, sessions and associated materials may have been
prepared by independent session speakers, and do not necessarily
reflect the views of IBM. All materials and discussions
are provided for informational purposes only, and are neither
intended to, nor shall constitute legal or other guidance or advice
to any individual participant or their specific situation.
It is the customer’s responsibility to insure its own compliance
with legal requirements and to obtain advice of competent legal
counsel as to the identification and interpretation of any
relevant laws and regulatory requirements that may affect the
customer’s business and any actions the customer may need to
take to comply with such laws. IBM does not provide legal advice
or represent or warrant that its services or products will ensure
that the customer follows any law.

3
Notices and disclaimers continued
Information concerning non-IBM products was
obtained from the suppliers of those products, their
published announcements or other publicly
available sources. IBM has not tested
those products about this publication and cannot
confirm the accuracy of performance, compatibility
or any other claims related to non-IBM products.
Questions on the capabilities of non-IBM products
should be addressed to the suppliers of those
products. IBM does not warrant the quality of any
third-party products, or the ability of any such third-
party products to interoperate with IBM’s products.
IBM expressly disclaims all warranties, expressed or
implied, including but not limited to, the implied
warranties of merchantability and fitness for a
purpose.
The provision of the information contained herein is
not intended to, and does not, grant any right or
license under any IBM patents, copyrights,
trademarks or other intellectual property right.
IBM, the IBM logo, ibm.com and [names of other
referenced IBM products and services used in the
presentation] are trademarks of International
Business Machines Corporation, registered in many
jurisdictions worldwide. Other product and service
names might be trademarks of IBM or other
companies. A current list of IBM trademarks is
available on the Web at “Copyright and trademark
information” at:
www.ibm.com/legal/copytrade.shtml.
4
Please Note
IBM’s statements regarding its plans, directions, and intent are subject to change
or withdrawal without notice and at IBM’s sole discretion.
Information regarding potential future products is intended to outline our general
product direction and it should not be relied on in making a purchasing decision.
The information mentioned regarding potential future products is not a commitment,
promise, or legal obligation to deliver any material, code or functionality. Information
about potential future products may not be incorporated into any contract.
The development, release, and timing of any future features or functionality described
for our products remains at our sole discretion.
Performance is based on measurements and projections using standard IBM
benchmarks in a controlled environment. The actual throughput or performance that
any user will experience will vary depending upon many factors, including
considerations such as the amount of multiprogramming in the user’s job stream,
the I/O configuration, the storage configuration, and the workload processed. Therefore,
no assurance can be given that an individual user will achieve results similar to those
stated here.

5
The IDz Workbench Curriculum
▪ Module 1 – IDz Terms, Concepts and Navigation
▪ Module 2 – Editing Your COBOL Programs
▪ Module 3 – Analyzing COBOL Programs
▪ Module 4 – Remote Systems – Connect, Navigate and Search
▪ Module 5 – Remote Systems – Dataset Access and Organization
▪ Module 6 – Remote Systems – ISPF 3.x, Batch Jobs and Job Management
▪ Module 7 – MVS Subprojects – Organizing PDS Members and SCM Checkout
▪ Module 8 - The Data Tools – SQL Code/Test and DB2 Table Access
▪ Module 9 - Debugging z/OS COBOL Applications
Optional Modules▪ IDz/Endevor Integration Through CARMA
▪ zUnit – Unit Test
▪ Code Coverage – Test quality feature
▪ Code Review – Application quality feature
▪ Menu Manager – Integrate ISPF REXX Execs and CLISTs
▪ Web Services – SOA development

6
Course Assumptions
1. You know ISPF and have used it for at least two years, doing production work on z/OS with COBOL, PL/I or Assembler
Note that all of the workshops in this course are in COBOL – although files exist that are Assembler and other languages for you to experiment with – as time permits
2. You have:
No experience with Eclipse or IDz
Some experience with PC tools
▪ You have used MS-Windows applications for at least one year
IDz installed and running on your workstation at version 8.0 or later
▪ Note that all ISPF discussion/examples and screen captures assume IBM-installed ISPF product defaults – not any 3rd party or custom Dialog Manager applications you may have installed on your mainframe
7
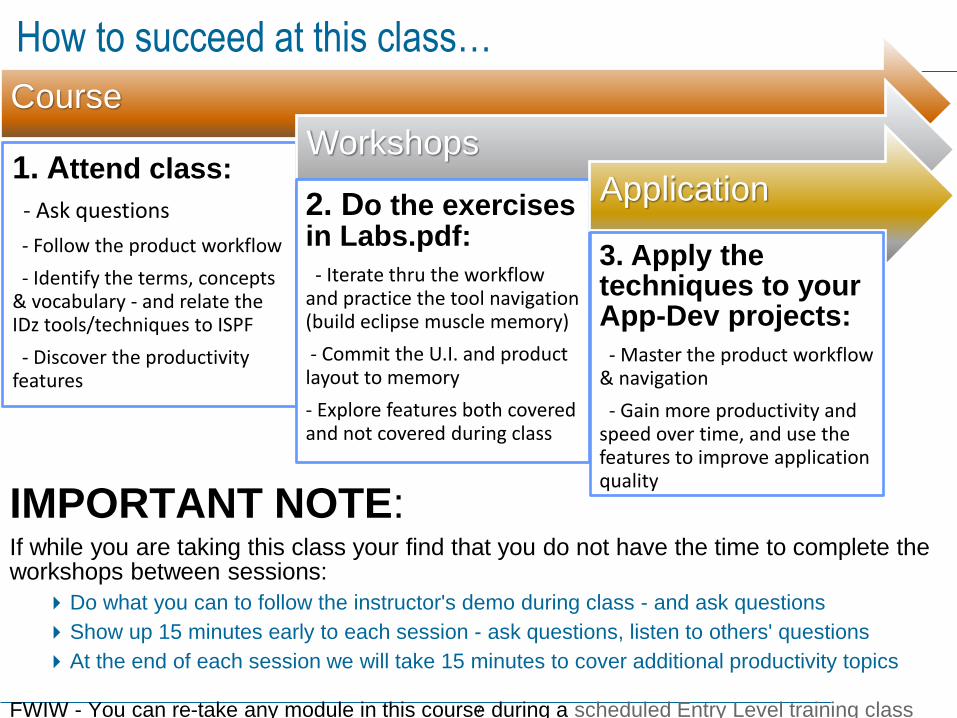
How to succeed at this class…
IMPORTANT NOTE:If while you are taking this class your find that you do not have the time to complete the workshops between sessions:
Do what you can to follow the instructor's demo during class - and ask questions
Show up 15 minutes early to each session - ask questions, listen to others' questions
At the end of each session we will take 15 minutes to cover additional productivity topics
FWIW - You can re-take any module in this course during a scheduled Entry Level training class
Course
1. Attend class:
- Ask questions
- Follow the product workflow
- Identify the terms, concepts & vocabulary - and relate the IDz tools/techniques to ISPF
- Discover the productivity features
Workshops
2. Do the exercises in Labs.pdf:
- Iterate thru the workflow and practice the tool navigation (build eclipse muscle memory)
- Commit the U.I. and product layout to memory
- Explore features both covered and not covered during class
Application
3. Apply the techniques to your App-Dev projects:
- Master the product workflow & navigation
- Gain more productivity and speed over time, and use the features to improve application quality
8
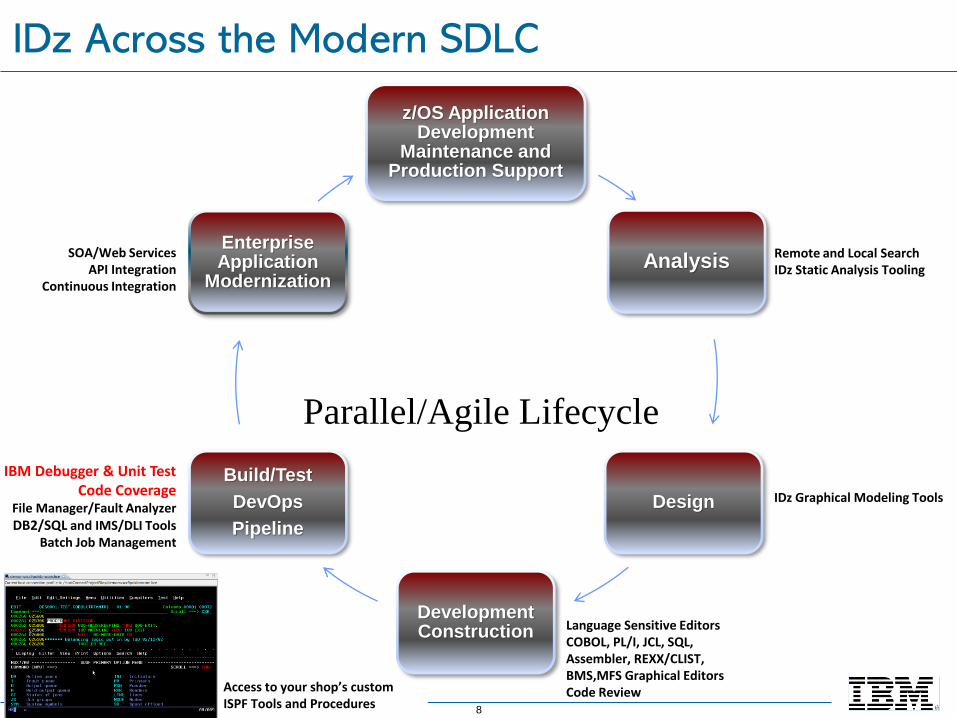
Access to your shop’s custom ISPF Tools and Procedures
z/OS Application Development
Maintenance and Production Support
Analysis
Design
Development Construction
Build/Test
DevOps
Pipeline
Enterprise Application
Modernization
Parallel/Agile Lifecycle
IDz Graphical Modeling Tools
Language Sensitive EditorsCOBOL, PL/I, JCL, SQL, Assembler, REXX/CLIST,BMS,MFS Graphical EditorsCode Review
IBM Debugger & Unit TestCode Coverage
File Manager/Fault AnalyzerDB2/SQL and IMS/DLI Tools
Batch Job Management
SOA/Web ServicesAPI Integration
Continuous Integration
Remote and Local SearchIDz Static Analysis Tooling
IDz Across the Modern SDLC
9
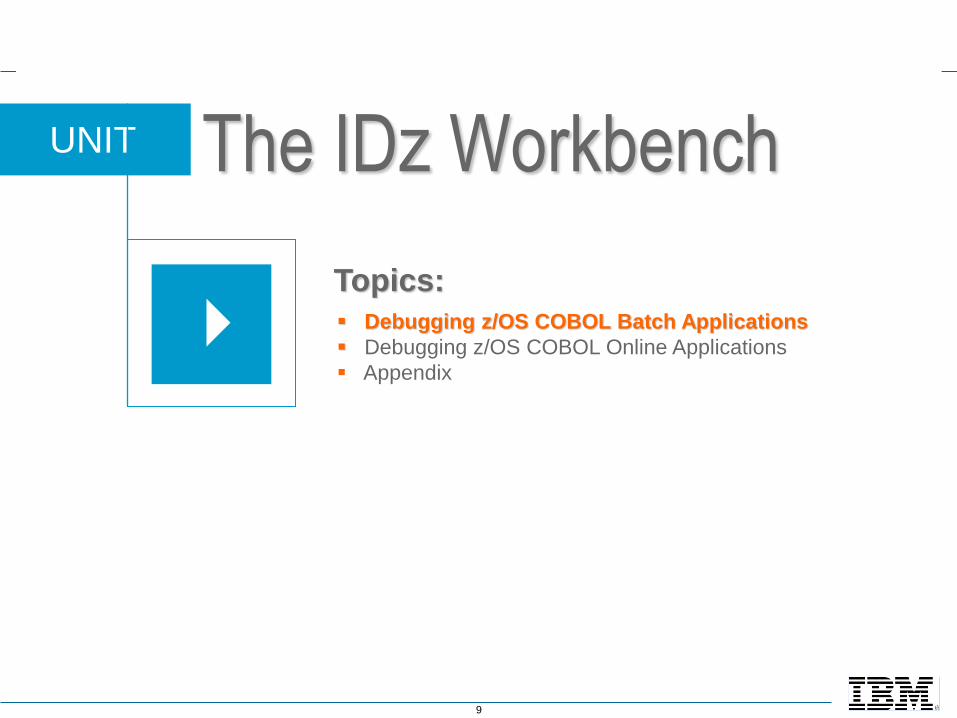
UNIT
Topics:
The IDz Workbench
▪ Debugging z/OS COBOL Batch Applications
▪ Debugging z/OS COBOL Online Applications
▪ Appendix

10
Topic Considerations
Note: In this topic you will learn how to debug a COBOL program running
on a z/OS mainframe. The screen captures all describe connecting to a public
z/OS machine that IBM makes available – during classes.
If you are taking this course through standard IBM services delivery you should
be able to use the properties (I/P address, port#s, etc.), logon IDs and passwords
that your instructor provides you with.
But you may also be taking this course standalone – and in that case, you will
need to speak to your company's Systems Programming staff to learn how to
connect and logon.
It goes without saying that the actual file names in the screen captures of
mainframe libraries and datasets will vary. So you should focus on the process
and steps and "how to" – and don't be perplexed at differences in screen
captures.
You also may be using your company's own Source Control Management system
– to do things like builds, compiles, etc. In that case much of the remote
functionality in IDz will be customized and tailored to your company's unique and
idiosyncratic procedures and protocols.
11
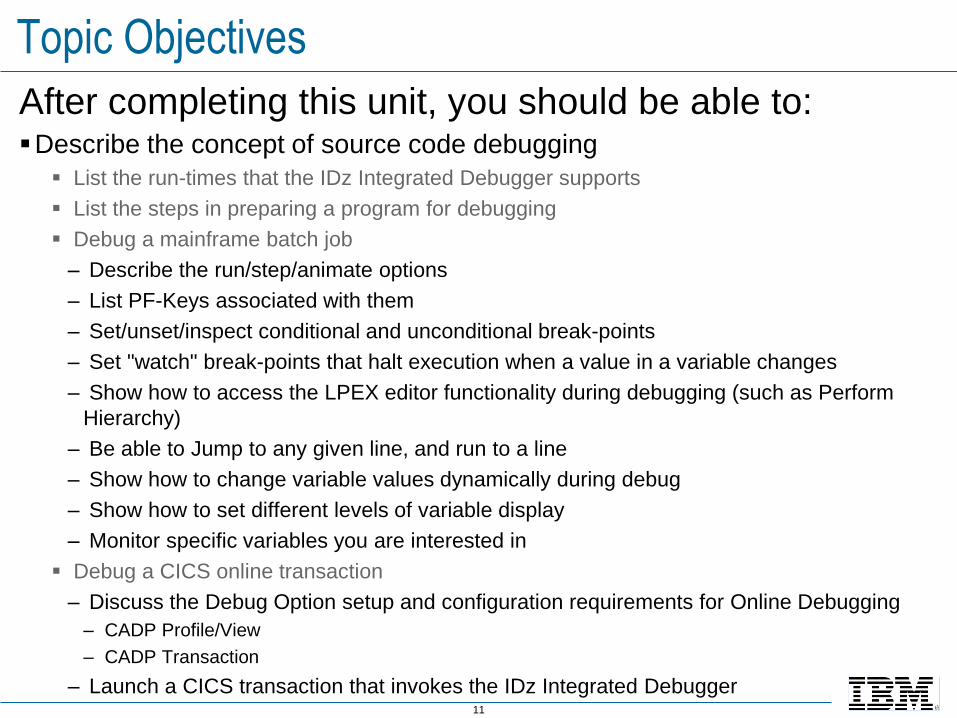
Topic Objectives
After completing this unit, you should be able to:▪Describe the concept of source code debugging
▪ List the run-times that the IDz Integrated Debugger supports
▪ List the steps in preparing a program for debugging
▪ Debug a mainframe batch job
– Describe the run/step/animate options
– List PF-Keys associated with them
– Set/unset/inspect conditional and unconditional break-points
– Set "watch" break-points that halt execution when a value in a variable changes
– Show how to access the LPEX editor functionality during debugging (such as Perform
Hierarchy)
– Be able to Jump to any given line, and run to a line
– Show how to change variable values dynamically during debug
– Show how to set different levels of variable display
– Monitor specific variables you are interested in
▪ Debug a CICS online transaction
– Discuss the Debug Option setup and configuration requirements for Online Debugging
– CADP Profile/View
– CADP Transaction
– Launch a CICS transaction that invokes the IDz Integrated Debugger

12
Debugging Overview
Face facts: No one gets it right the first time.
Not at the level of production business logic
That's why IBM invented source-level application debuggers, so that you can:
View program execution, line-by-line
Verify the value of a variable – during program execution
Stop and start program execution, and analyze results at the speed that our procedural understanding of the application's execution flow can handle

13
Debug Product Packaging Options
1. IBM Debug Tool:
Became IBM Debug for z Systems with IDz v14 and later
Integrated with ADFz and Standalone as PD Tools Replacement
Must own IBM Debug Tool on the host
Includes Green-Screen (3270 Debugging)
2. Compuware’s Xpeditor product line:
Requires Xpeditor host software + plug-ins to IDz (from Compuware)
3. CA-Intertest:
Requires Intertest host software + plug-ins to IDz (from Computer Associates)
4. ASG SmartTest:
Requires Intertest host software + plug-ins to IDz (from Allen Systems Group)
It is up to you to find out which of the above debugging products is installed on your mainframe. Typically a tech-lead or Project Manager knows – but your Systems Programming staff? Always know what’s installed.
14
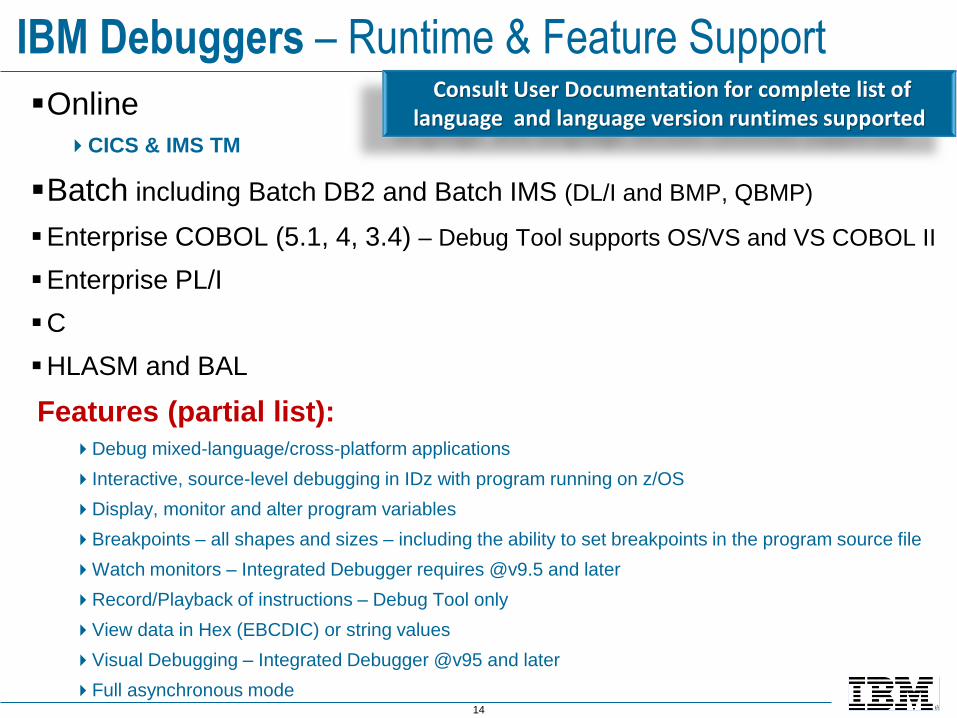
IBM Debuggers – Runtime & Feature Support
▪Online
CICS & IMS TM
▪Batch including Batch DB2 and Batch IMS (DL/I and BMP, QBMP)
▪Enterprise COBOL (5.1, 4, 3.4) – Debug Tool supports OS/VS and VS COBOL II
▪Enterprise PL/I
▪C
▪HLASM and BAL
Features (partial list):Debug mixed-language/cross-platform applications
Interactive, source-level debugging in IDz with program running on z/OS
Display, monitor and alter program variables
Breakpoints – all shapes and sizes – including the ability to set breakpoints in the program source file
Watch monitors – Integrated Debugger requires @v9.5 and later
Record/Playback of instructions – Debug Tool only
View data in Hex (EBCDIC) or string values
Visual Debugging – Integrated Debugger @v95 and later
Full asynchronous mode
Consult User Documentation for complete list of language and language version runtimes supported
15
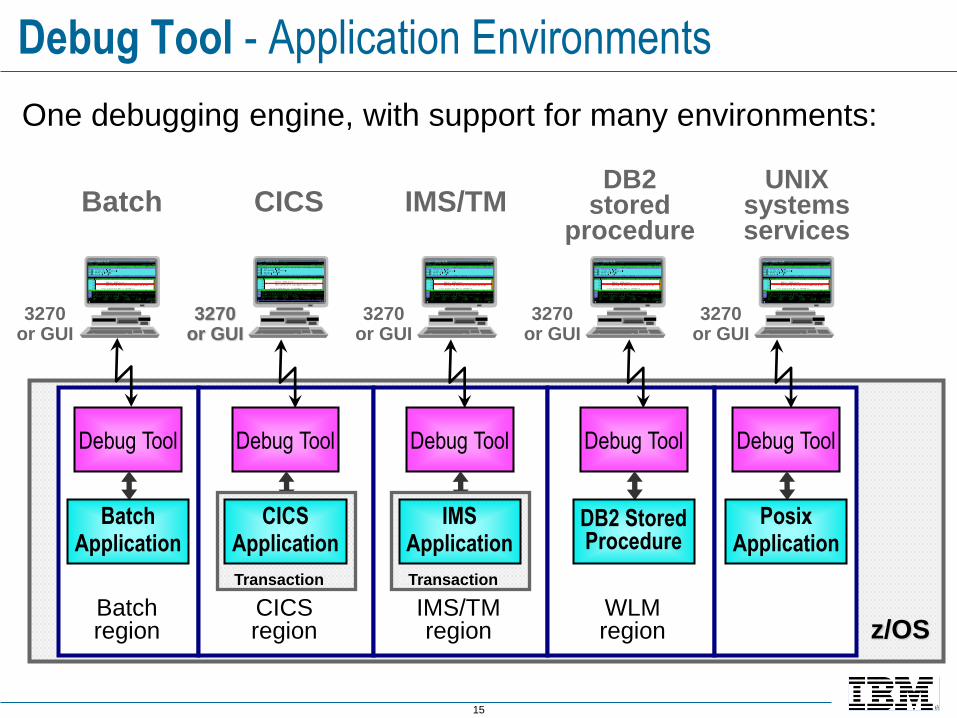
Debug Tool - Application Environments
One debugging engine, with support for many environments:
z/OS
3270 or GUI
3270or GUI
Debug Tool
BatchApplication
Batch region
Debug Tool
Transaction
CICSApplication
CICS region
Debug Tool
Transaction
IMSApplication
IMS/TM region
Debug Tool
DB2 Stored Procedure
WLM region
Batch
Debug Tool
PosixApplication
3270or GUI
3270or GUI
3270or GUI
CICS IMS/TMDB2
stored procedure
UNIX systems services

16
z/OS
Interfacing IDz Client with the Server/Debug Software
Architectures: Client software is installed with IDz on your workstation
Communicates with the Debugger run-time engine on the mainframe
▪ Establishes handshake using combination of: TCP/IP address + Port#
▪ You can “reuse” IDz Remote Systems connection
TCP/IP
Remote
Debugger
Run-Time
Engine
Data
Source
Your
Application
Load Module
Debugger
Client
Port#
17
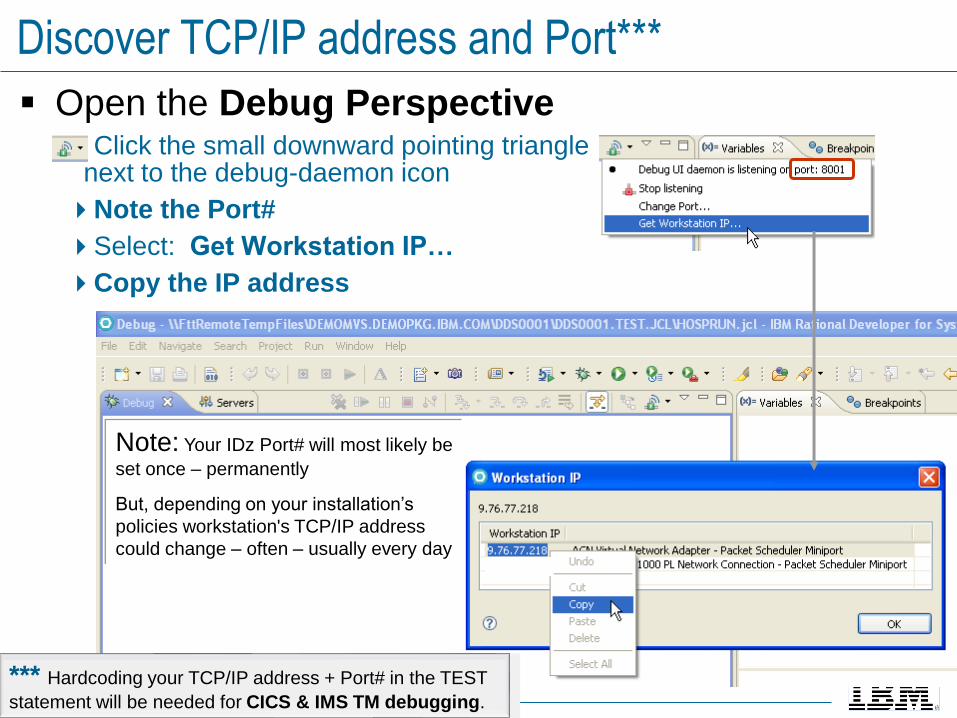
Discover TCP/IP address and Port***
▪ Open the Debug PerspectiveClick the small downward pointing triangle
next to the debug-daemon icon
Note the Port#
Select: Get Workstation IP…
Copy the IP address
Note: Your IDz Port# will most likely be
set once – permanently
But, depending on your installation’s
policies workstation's TCP/IP address
could change – often – usually every day
*** Hardcoding your TCP/IP address + Port# in the TEST
statement will be needed for CICS & IMS TM debugging.
18
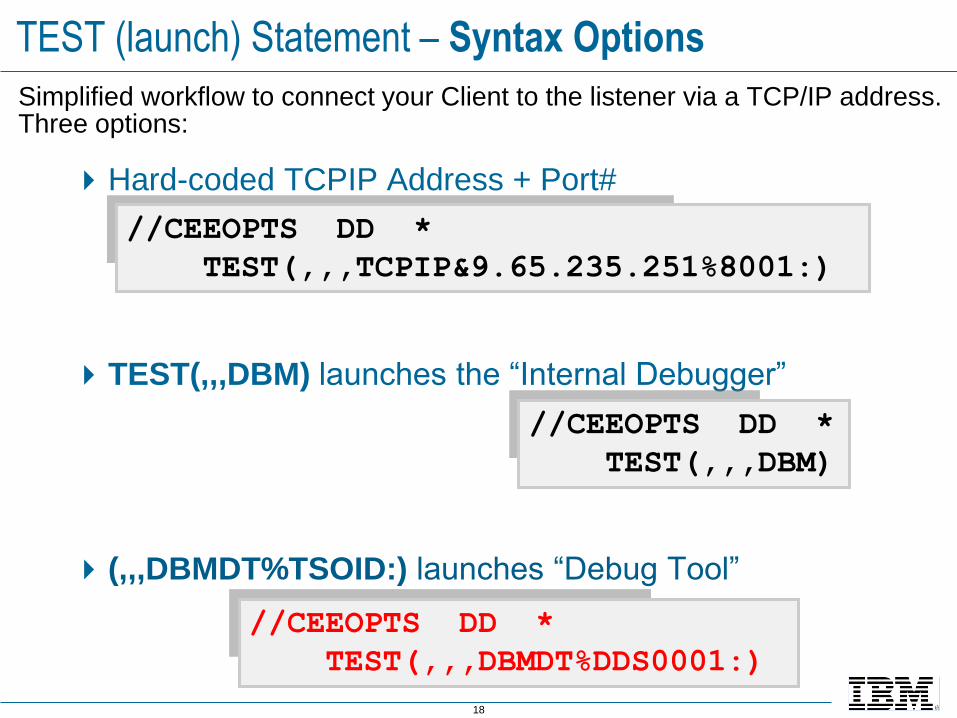
TEST (launch) Statement – Syntax Options
Simplified workflow to connect your Client to the listener via a TCP/IP address. Three options:
Hard-coded TCPIP Address + Port#
TEST(,,,DBM) launches the “Internal Debugger”
(,,,DBMDT%TSOID:) launches “Debug Tool”
//CEEOPTS DD *
TEST(,,,TCPIP&9.65.235.251%8001:)
//CEEOPTS DD *
TEST(,,,DBMDT%DDS0001:)
//CEEOPTS DD *
TEST(,,,DBM)
19
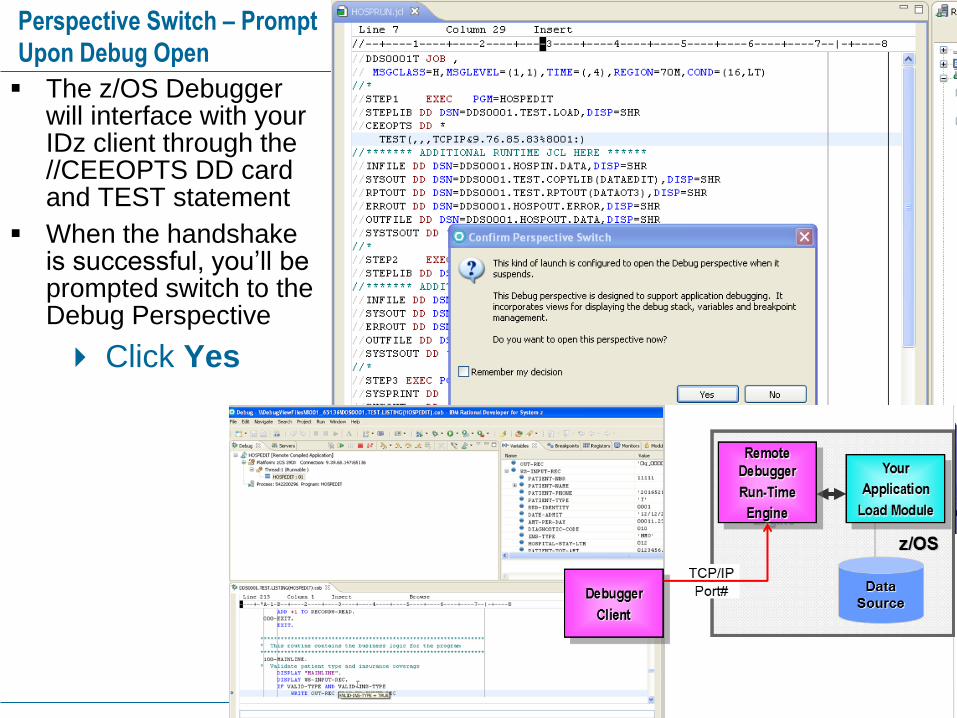
Perspective Switch – Prompt
Upon Debug Open
▪ The z/OS Debugger will interface with your IDz client through the //CEEOPTS DD card and TEST statement
▪ When the handshake is successful, you’ll be prompted switch to the Debug Perspective
Click Yes

20
Ready to Debug
After you click YES at the Confirm Perspective switch prompt:
▪ The Debug Perspective opens
▪ A Read-Only copy of your source is copied down from z/OS to your IDz client & workstation
▪ A copy of your load module is NOT placed into an Address Space
The Current Instruction Pointer is not in the PROCEDURE DIVISION
▪ To open your Load Module into an Address Space and begin debugging you press F5 or click the Step or Resume action icons
21
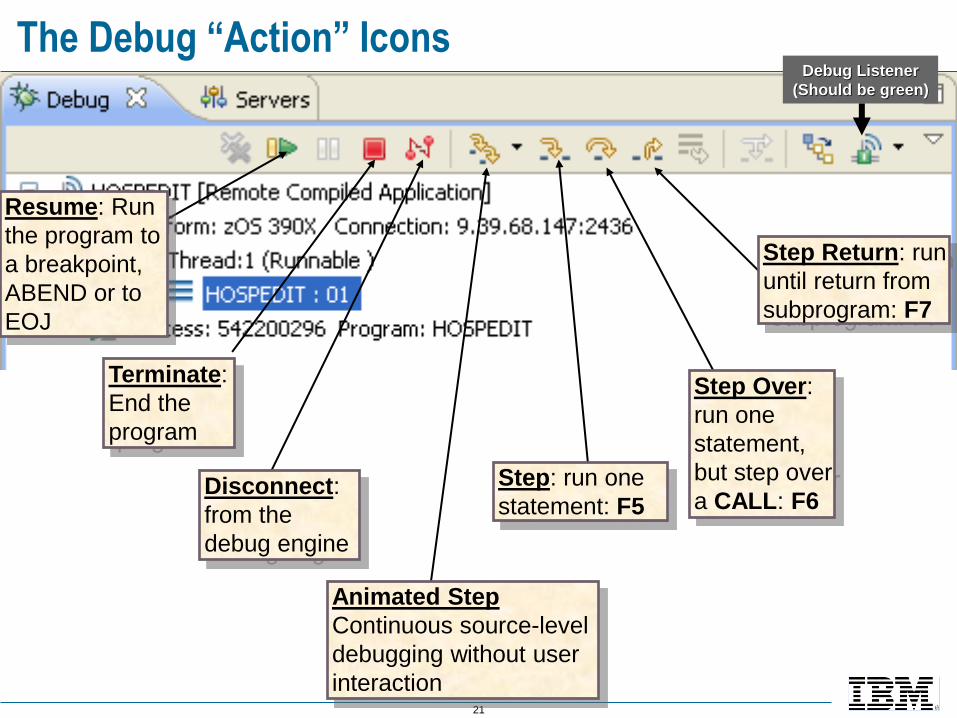
The Debug “Action” Icons
Resume: Run
the program to
a breakpoint,
ABEND or to
EOJ
Terminate:
End the
program
Step: run one
statement: F5
Step Over:
run one
statement,
but step over
a CALL: F6
Step Return: run
until return from
subprogram: F7
Disconnect:
from the
debug engine
Animated Step
Continuous source-level
debugging without user
interaction
Debug Listener
(Should be green)

22
The Debug Perspective and Views
Read-only copy of source code
VariablesBreakpoints& Monitors
Views
ProgramOutlineView
The Debug action Icons

23
The Debug Perspective and Views – IDz v14.1.x and Later
Read-only copy of your program source Outline, VariablesBreakpoints & Monitors Views
The Debug action Icons
Visual DebuggingDisplays
Paragraphs/Sections in your Procedural logic

24
Debugging your code
Actions to execute program statements:
Step (F5)▪ Executes the current
instruction
▪ Positions the pointer at the Next Sequential Instruction
Step Over (F6)▪ Executes the current
instruction
▪ Except on a CALL statement – where Step Over runs (executes) all of the logic in the Called subroutine stack
▪ Positions the pointer at the Next Sequential Instruction
Step Return (F7)▪ Executes all of the
statements thru to the end (GOBACK) of the program
Resume (F8)▪ Executes (runs) all
statements until:
ABEND
Breakpoint
Normal EOJ
Additional Debug actions:Terminate (Ctrl+F2)▪ Halts the Debug session
Open Visual Debug▪ Opens a view that keeps a running visual depiction of the program’s
business logic procedural flow
The Action Icons

25
Additional Debug Actions – Jump to & Run to Cursor Location
▪ Jump to Location - skip over sections of code to avoid executing certain
statements or move to a position where certain statements can be executed again. Useful:
▪ To avoid called programs or I/OS to a not available dataset
▪ Or to iteratively execute some statements of interest
▪ Run to Location - executes all statements between the current location and the
run-to location.

26
Returning to the “Current Instruction”
▪ To get back to the Current Instruction Pointer (the "next sequential
instruction") – if you've navigated away within the source:
Click the small blue rectangle in the right-hand margin of your source code
Note that this icon can be hard to
see – especially in large source files
27
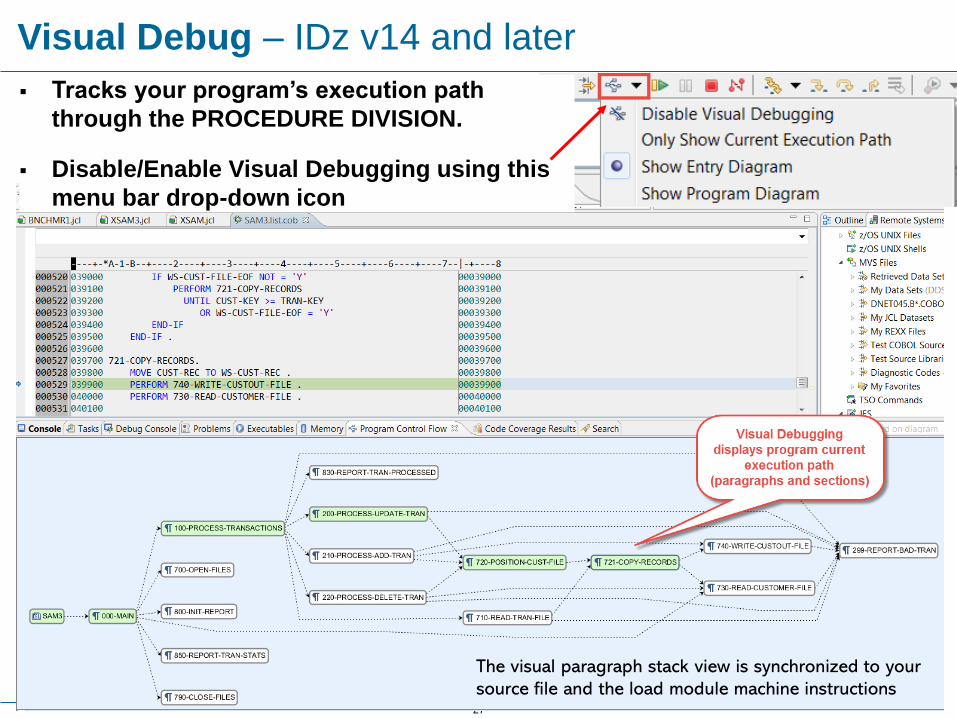
Visual Debug – IDz v14 and later
▪ Tracks your program’s execution path
through the PROCEDURE DIVISION.
▪ Disable/Enable Visual Debugging using this
menu bar drop-down icon
The visual paragraph stack view is synchronized to your
source file and the load module machine instructions

28
Statement Breakpoints
▪ A statement breakpoint stops the program when it reaches a statement:
It stops before the statement runs
▪ A breakpoint can optionally be made conditional
A simple condition may be specified such as:
▪ VariableX > 999
…or…
▪ VariableY = 'Abc'
▪ A breakpoint can be based on a frequency:
Stop the Nth time a statement runs
▪ A breakpoint can stop at the Entry to a Load Module

29
Setting Statement Breakpoints
dbl
click
Set a statement breakpoint by
double-clicking in the gray area
next to a statement

30
Run to a Statement Breakpoint
A breakpoint icon is shown…
and the breakpoint is also
shown in the Breakpoints view.
click
Resume
See Slide Notes

31
Edit/Create Conditional Statement Breakpoints
A breakpoint can trigger the
Nth time the statement runs…
… and breakpoints
can be conditional.
Select the Breakpoint.
Right-click and select: Edit Breakpoint…
Can set to different statement/line
Or click Next > to specify
conditional breakpoint logic

32
Additional Breakpoint Options
The program ran to the
breakpoint
… or by deleting it from
the Breakpoints view
You can remove the
breakpoint by double
clicking again here…
33
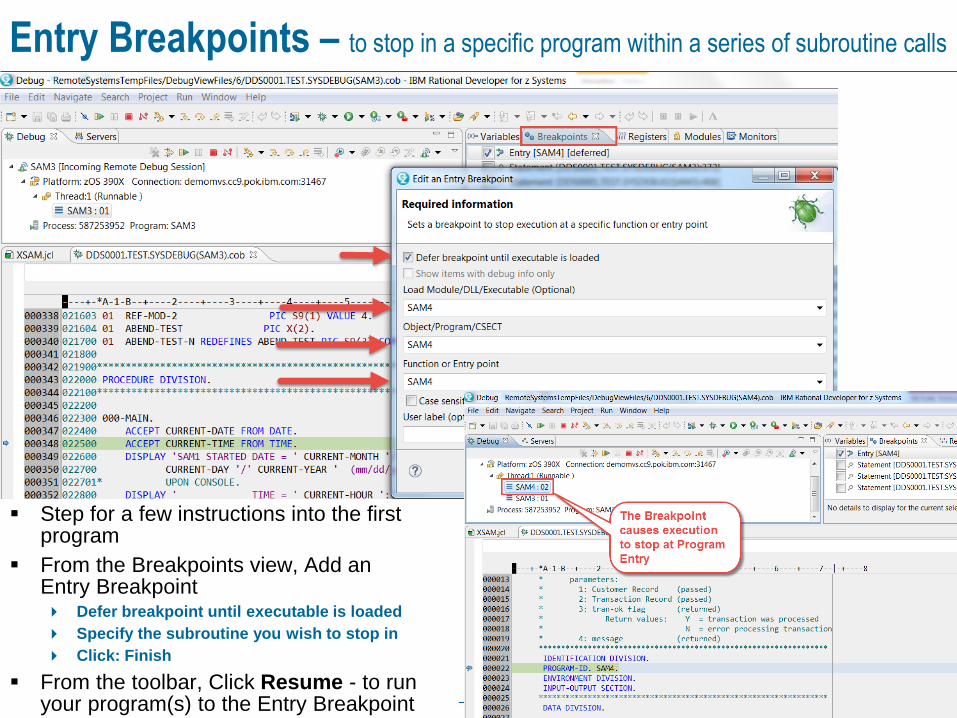
Entry Breakpoints – to stop in a specific program within a series of subroutine calls
▪ Step for a few instructions into the first program
▪ From the Breakpoints view, Add an Entry Breakpoint Defer breakpoint until executable is loaded
Specify the subroutine you wish to stop in
Click: Finish
▪ From the toolbar, Click Resume - to run your program(s) to the Entry Breakpoint

34
Stopping on a line in a SubroutineSteps:
Set a Statement Breakpoint
Over-ride the Load Module/CSECT values
Ad the Statement line# to break at
You need to select the “Defer breakpoint until executable is loaded" if the subroutine is in a different load mod
35
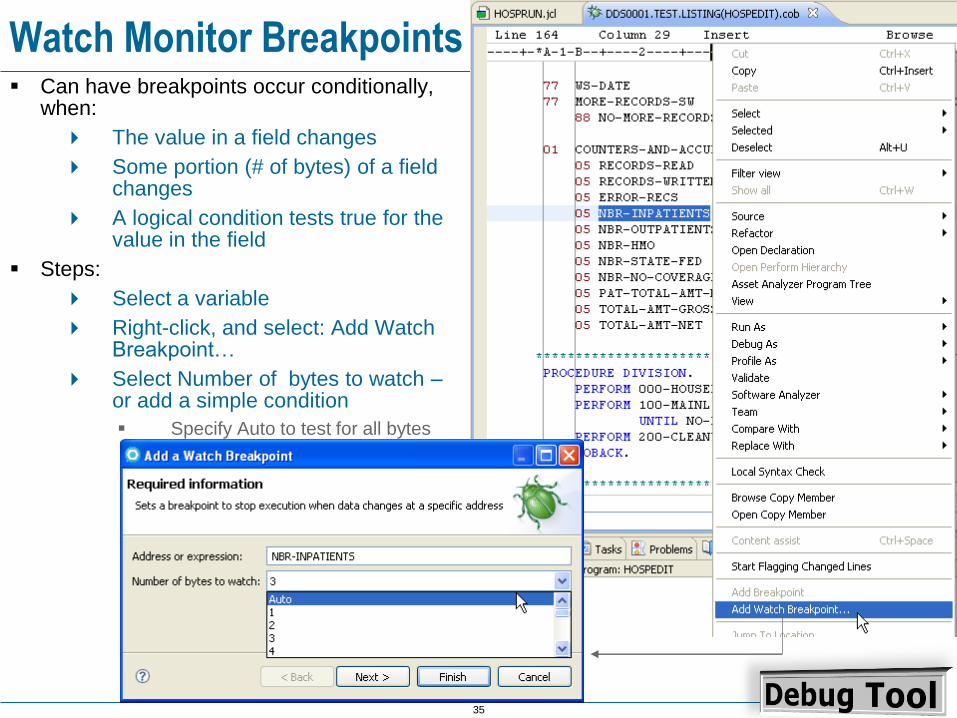
Watch Monitor Breakpoints▪ Can have breakpoints occur conditionally,
when:
The value in a field changes
Some portion (# of bytes) of a field changes
A logical condition tests true for the value in the field
▪ Steps:
Select a variable
Right-click, and select: Add Watch Breakpoint…
Select Number of bytes to watch –or add a simple condition
▪ Specify Auto to test for all bytes

36
Variables View During Remote Debug – Additional Options
With large COBOL
programs can "filter" and
display only certain
categories of variables
Many options for
working with variables
Add to Monitor – for permanent viewing
Monitor internal memory values
Show value in hex – (EBCDIC internal) or string
value representation
Copy variable and value to Notepad
Find specific variable in filtered Locals
Show specific variables in the view

37
Variables View – EBCDIC (Hex) Data Representation
Value – in string or numeric display format
Value in EBCDIC internal display ➔
very useful for debugging data
exceptions
You can create invalid binary values in numeric fields for type-check (0C7) testing1. Change representation to Hex. 2. Type invalid numeric EBCDIC values3. Save

38
Monitors View – Options
Monitored variable value – in EBCDIC
internal display ➔ very useful for
debugging data exceptions
Add datatype prefix to variable data-name
displayed – still retain variable value)
39
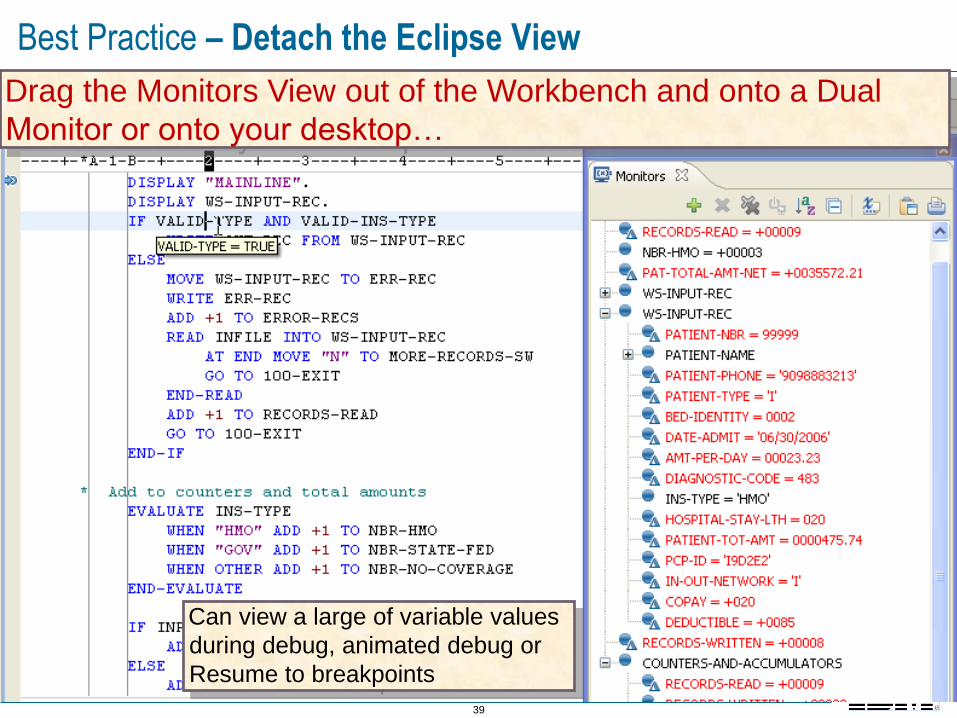
Best Practice – Detach the Eclipse View
Can view a large of variable values
during debug, animated debug or
Resume to breakpoints
Drag the Monitors View out of the Workbench and onto a Dual
Monitor or onto your desktop…

40
The Debug Console
Rational Developer for
System z messagesYou can enter a subset of
commands from the
Debug Tool 3270
interface, a list of Debug
Tool commands that are
valid for use in IDz can be
found in the Appendix of
the Debug Tool Reference
and Messages Guide.
The Debug Console view shows IDz
messages and lets you enter some
Debug Tool commands
Place your cursor in the Command area and press Ctrl+Spacebar – to see a list of available commands

41
Debug Console Commands – Tracing Statement Execution
This is another very popular
command:
SET AUTOMONITOR ON LOG
It forces Debug Tool to track
each statement as it's executed
and write it to the Debug
Console
Using this technique you can copy
and paste your program's
dynamic execution and trace
forward and backward through
any portion of your code
You can also copy all of the
statements to hard-copy :
1. Right-click
2. Select Export History
3. Specify a file – preferably an
RTF or MS-Word doc, as
formatting will be retained
42
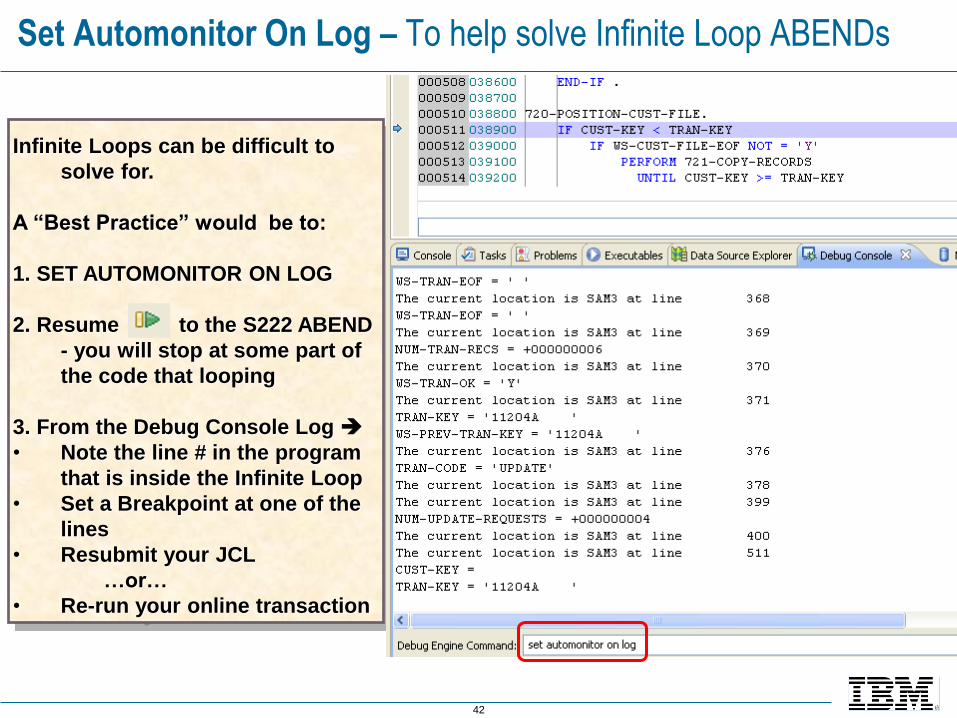
Set Automonitor On Log – To help solve Infinite Loop ABENDs
Infinite Loops can be difficult to
solve for.
A “Best Practice” would be to:
1. SET AUTOMONITOR ON LOG
2. Resume to the S222 ABEND
- you will stop at some part of
the code that looping
3. From the Debug Console Log ➔
• Note the line # in the program
that is inside the Infinite Loop
• Set a Breakpoint at one of the
lines
• Resubmit your JCL
…or…
• Re-run your online transaction
43
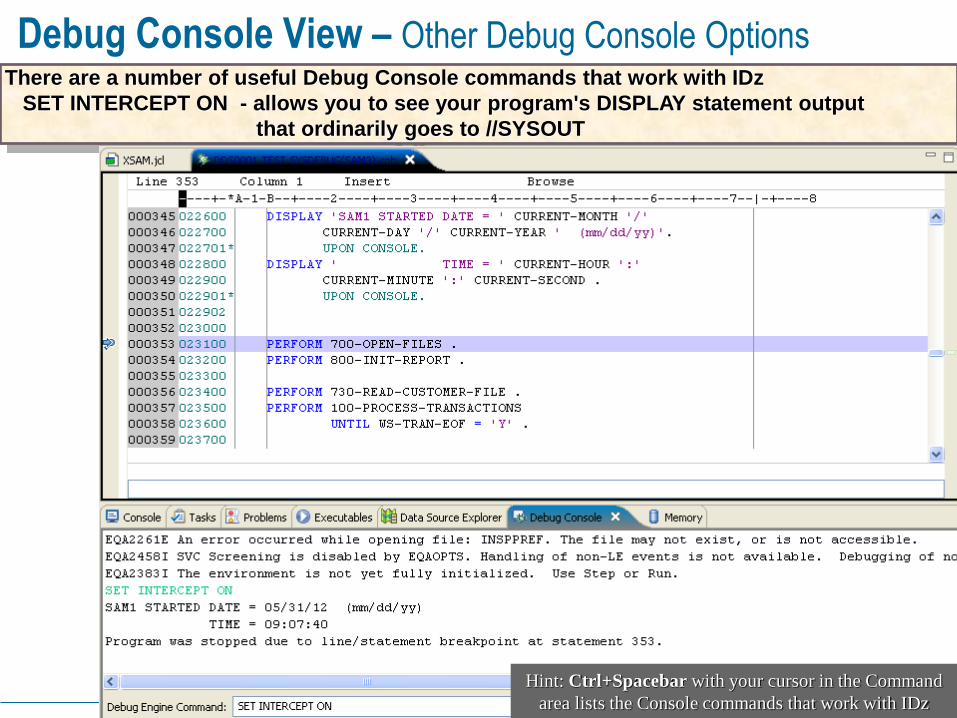
Debug Console View – Other Debug Console OptionsThere are a number of useful Debug Console commands that work with IDz
SET INTERCEPT ON - allows you to see your program's DISPLAY statement output
that ordinarily goes to //SYSOUT
Hint: Ctrl+Spacebar with your cursor in the Command
area lists the Console commands that work with IDz

44
Copy the contents of a monitor to the Windows-Clipboard
Sometimes you’ll want to save the contents of a variable
(including a File/Record) to some external source –
like an ASCII/Notepad file, spreadsheet, etc.
1. Monitor the variable – and from the Monitors View
2. Expand the “nodes” (Group fields)
3. Click Copy view to Clipboard
• This copies the contents of the View to your
Windows paste buffer
4. Paste the copied contents ➔
Ctrl+V
(Paste)

45
Using Automonitor to Capture Test Run “State”
• Automonitor captures both executed lines and variable “state” (value changes over time)
• Use Automonitor in combination with Statement Recording (next topic) to solve ABENDs
• Note that Automonitor does not function during Resume• Use Step or Animated Step in conjunction with
Automonitor + Recording (next topic)
46
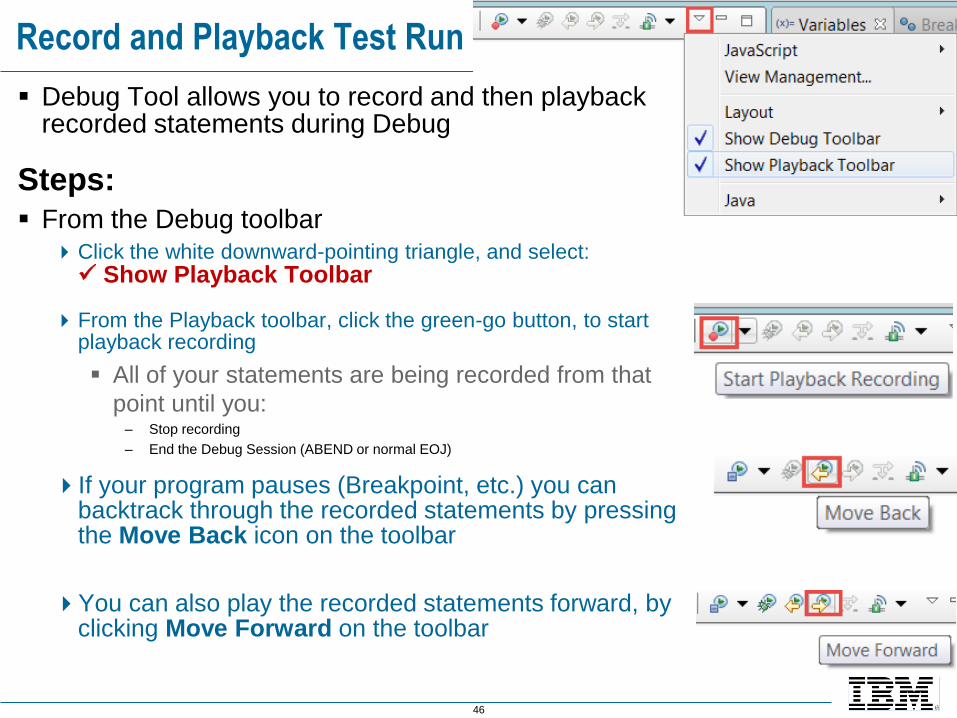
Record and Playback Test Run
▪ Debug Tool allows you to record and then playback recorded statements during Debug
Steps:
▪ From the Debug toolbarClick the white downward-pointing triangle, and select: ✓ Show Playback Toolbar
From the Playback toolbar, click the green-go button, to start playback recording
▪ All of your statements are being recorded from that
point until you:– Stop recording
– End the Debug Session (ABEND or normal EOJ)
If your program pauses (Breakpoint, etc.) you can backtrack through the recorded statements by pressing the Move Back icon on the toolbar
You can also play the recorded statements forward, by clicking Move Forward on the toolbar

47
Handling Program ABENDs – Best Practice
▪ Debug Tool can receive control back from the system after an ABEND occurs
The program will be stopped at the ABENDING statement
▪ You can:
Allow the application to ABEND and terminate
▪ Capture ABEND info with a product such as Fault
Analyzer
▪ Terminate the application and prevent further processing
Or continue running the program
▪ Usage note:
The LE TRAP(ON) option must be active

48
Bookmarks – During DebugBookmarks can be used to:
▪ Set points-of-interest inside your *.cob file during Debug
▪ Create annotations/points-of-interest in your source file - for work outside of Debug
▪ Side by side view of Debug(read-only) source with actual program source Note that you will have to manually align the file content

49
Source Context Menu Options – During DebugDuring Debug (and without interrupting/influencing your running executable) you can stop at any moment and use the Context menu to access source navigation tools and program understanding tools such as:
Perform Hierarchy, Program Control Flow, Data Element analysis, Filtering, Code Review, Show unreachable code, Occurrences in Compilation Unit, etc.
▪ Combining Static Analytics using the Context Menu options and Dynamic Analysis (from Debugging) you can get a very complete picture of your program’s semantics - its operations and business logic

50
Integrating Context Menu options – Data Flow
▪ The Static Analysis tools that you learned about in Module 3 – Analyzing Your COBOL Programs are all available while Debugging
▪ Show In > Data Flow can be extremely useful during Debug

51
Integrating Editor Features – Bookmarks
▪ It can be useful to set Bookmarks (and/or Tasks) into your code as:
Reminders of something to do
Navigation labels of where certain processing is
▪ To do this:
Navigate to the line you’re interested in
▪ Note – you can just scroll, you don’t have to
execute code
From the Edit menu, select:
▪ Add Bookmark…
▪ Note that the Bookmarks are temporary – and only available during your Debug session
52
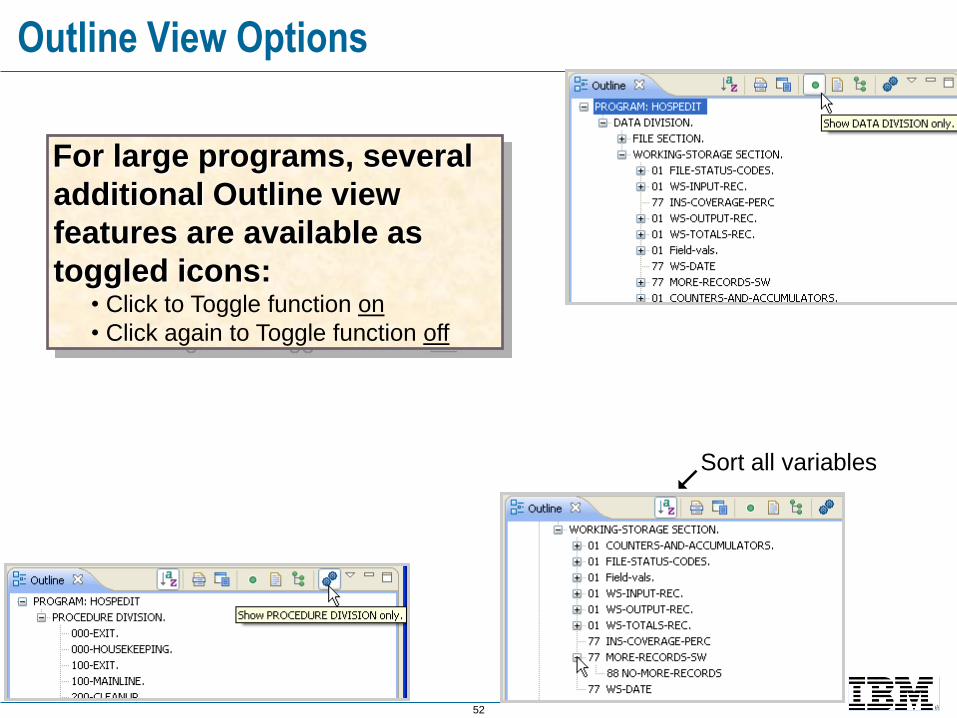
Outline View Options
For large programs, several
additional Outline view
features are available as
toggled icons:• Click to Toggle function on
• Click again to Toggle function off
Sort all variables

53
Outline View – Code Sync OptionWhile debugging through
PROCEDURE DIVISION Outline view
synchronizes with code in paragraphs
and sections
But if you scroll in the code while stepping, the Outline View syncs with
your browsing activity
54
If your program ABENDS during Debug
▪ The Debugger can receive control back from the system after an ABEND occurs
The program will be stopped at the ABENDING statement
▪ You can:
Allow the application to ABEND and terminate
▪ Capture ABEND info with a product such as Fault
Analyzer
▪ Terminate the application and prevent further processing
Or continue running the program – to examine & research the ABEND situation with access to variable values at the time of the ABEND
▪ Usage notes:
The LE TRAP(ON) option must be active
Check out the Lookup View
55
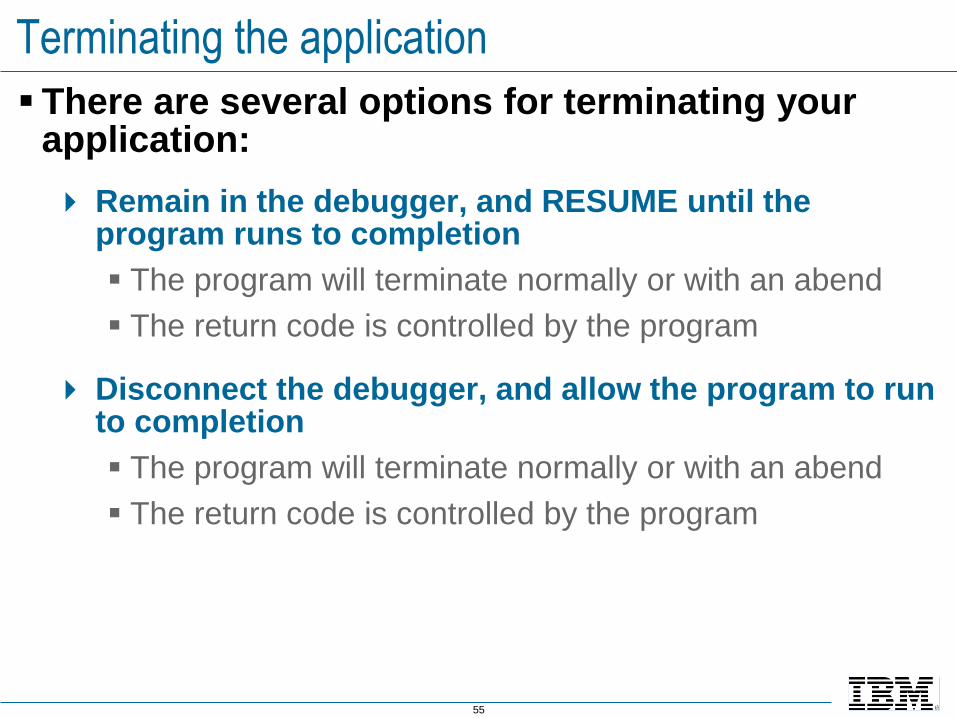
Terminating the application
▪ There are several options for terminating your application:
Remain in the debugger, and RESUME until the program runs to completion
▪ The program will terminate normally or with an abend
▪ The return code is controlled by the program
Disconnect the debugger, and allow the program to run to completion
▪ The program will terminate normally or with an abend
▪ The return code is controlled by the program
56
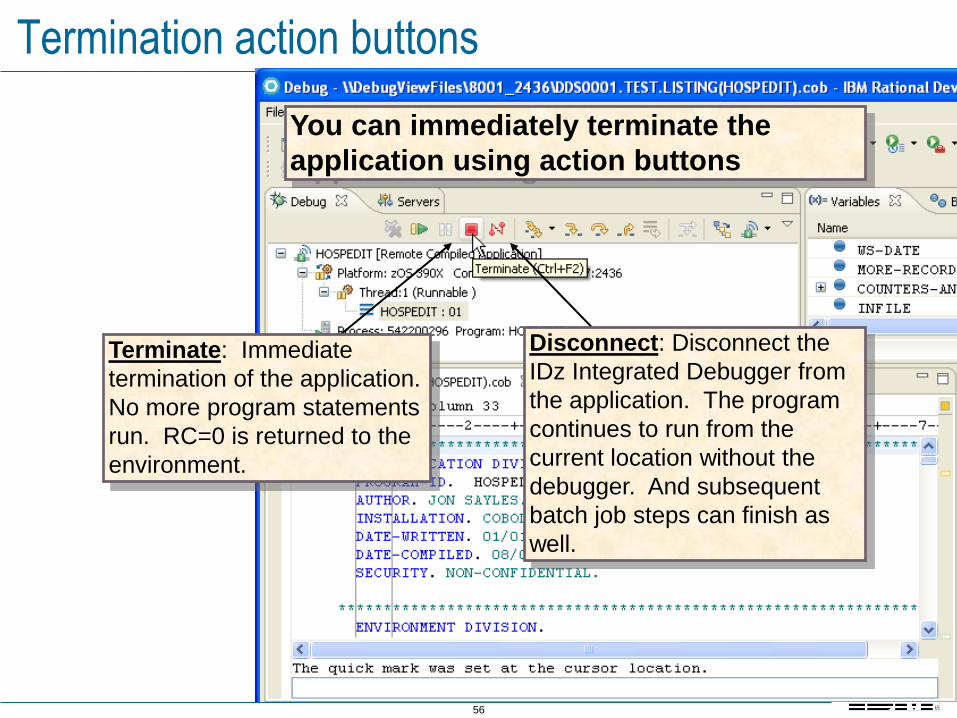
Termination action buttons
You can immediately terminate the
application using action buttons
Terminate: Immediate
termination of the application.
No more program statements
run. RC=0 is returned to the
environment.
Disconnect: Disconnect the
IDz Integrated Debugger from
the application. The program
continues to run from the
current location without the
debugger. And subsequent
batch job steps can finish as
well.

57
Force an immediate termination with abend
right
click
1
click2 click
3
Right click in the Debug view
Options
Terminate and abend

58
Restart Your Debugging Session
For batch debugging
If your submitted JCL is still in the code (Content) area▪ No need to return to the z/OS
Projects perspective
Right-click
Select: Submit

59
Debug and the COBOL Optimize Compiler Directive Warnings
Compiling with the EJPD sub option of the TEST compilation parameter for COBOL 4 and above will eliminate the JUMPTO warning messages.
EJPD allows optimization within statements. NOEJPD will allow full optimization, if optimization is specified. NOEJPD may remove statements.
If you happen to jump to one of these areas, unpredictable results may occur. (0C4 or 0C1 or something)
With COBOL 3 and 4, the JUMPTO and GOTO statements will issue a warning and not allow the statement unless you issue the command SET WARN OFF. Then it will work.
The EQAJCL Debugger JCL wizard for the 3270 interface allows you to turn this with a selection.
COBOL 6 will issue a warning but allow the command without the SET WARN OFF statement.
Thanks to Jim Rice/IBM for the above details
60
Summary
Having completed this unit, you should now be able to:
Describe where the debug engines are located
Show how to set the workbench preferences for running and debugging
Show how to invoke the debugger for local programs
Describe the views of the Debug perspective
Demonstrate how to set breakpoints in COBOL code
Explain how to set up the COBOL compile options for remote debugging
Show how to debug a remote batch COBOL program

61
UNIT
Topics:
The IDz Workbench
▪ Debugging z/OS COBOL Batch Applications
▪ Debugging z/OS COBOL Online Applications
▪ Code Coverage/Appendix

62
Topic Objectives
After completing this unit, you should be able to:
Using the Problem Determination Tools, Debug Option and IDz:
▪Debug a mainframe online transaction
Describe the online transaction features for configuring your 3270 sessions with Debug Option
Debug a CICS 3270 Application

63
Online Debugging Overview
▪ Guess what? No one gets it right the first time coding online programs either ☺
▪ Lucky for you:
Debug tool handles:
▪CICS 3270 online transactions
▪ IMS TM online transactions
Without any different debugging techniques▪ The only difference from batch is the debug setup procedure for the online
environment

64
Steps for Online (CICS) Application Debug Session
1. Ensure that your compile proc has the necessary TEST parameter, and
Compile/Link to create load module – and that your CICS application is setup
for Debug Option testing
2. Discover workstation TCP/IP parameters:
▪ IP Address
▪ Listener port#
3. Access and login to your CICS region – Green Screen
4. Use the DTCN view, or execute the DTCN transaction and specify:
▪ Terminal ID
▪ Transaction code and programs – to put under Debug control
▪ User-ID
▪ TCP/IP parameters:
▪ IP Address
▪ Port#
▪ Save the DTCN transaction specification
5. Debug your CICS application
65
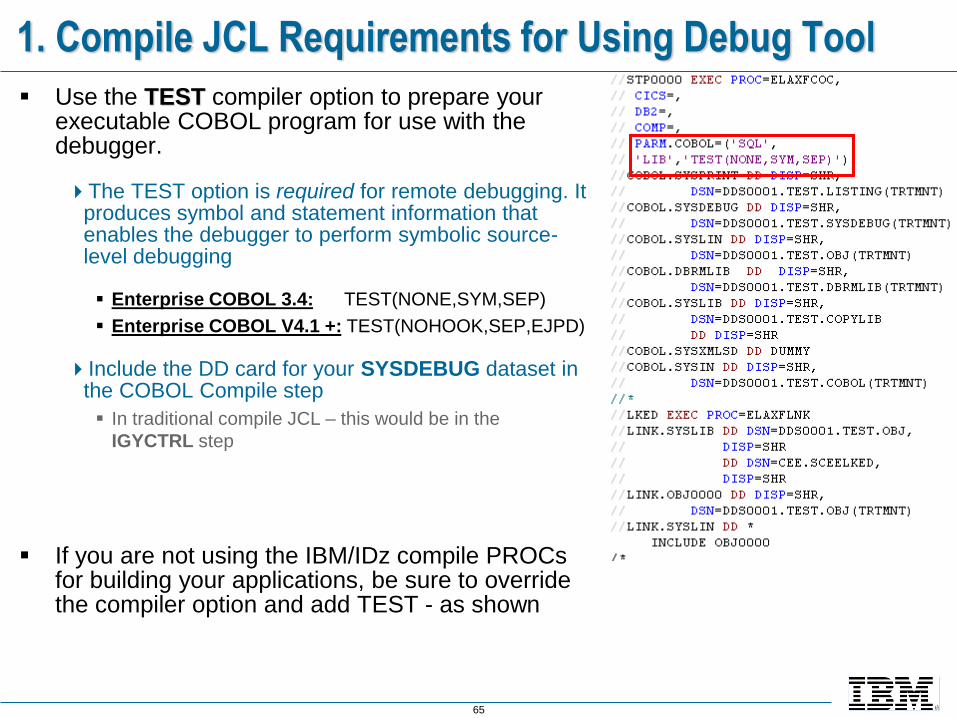
1. Compile JCL Requirements for Using Debug Tool
▪ Use the TEST compiler option to prepare your executable COBOL program for use with the debugger.
The TEST option is required for remote debugging. It produces symbol and statement information that enables the debugger to perform symbolic source-level debugging
▪ Enterprise COBOL 3.4: TEST(NONE,SYM,SEP)
▪ Enterprise COBOL V4.1 +: TEST(NOHOOK,SEP,EJPD)
Include the DD card for your SYSDEBUG dataset in the COBOL Compile step
▪ In traditional compile JCL – this would be in the
IGYCTRL step
▪ If you are not using the IBM/IDz compile PROCs for building your applications, be sure to override the compiler option and add TEST - as shown

66
2. Discover TCP/IP address and IDz Port - Review
▪ Open the Debug PerspectiveClick the small downward pointing triangle
next to the debug-daemon icon
Note the Port#
Select: Get Workstation IP…
Copy the IP address
Either paste the IP address into Notepad, or write it down
Note: Your IDz Port# will most likely be set
once, and will change infrequently.
However, depending on your installation's
setup, your workstation's TCP/IP address
could change - often
67
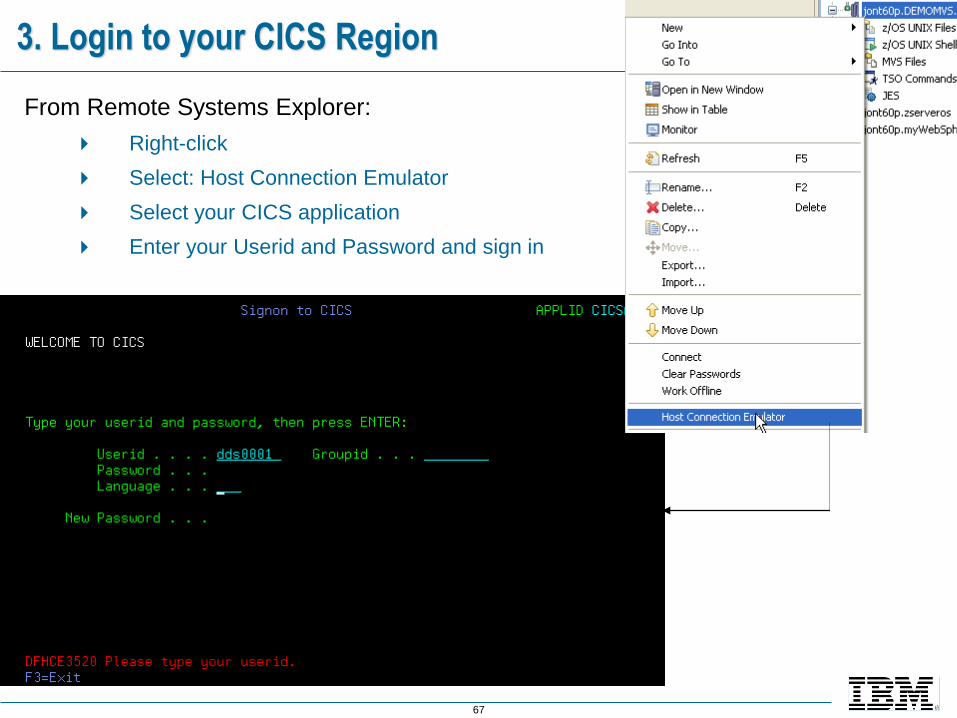
3. Login to your CICS Region
From Remote Systems Explorer:
Right-click
Select: Host Connection Emulator
Select your CICS application
Enter your Userid and Password and sign in

68
3. Setup the Debug Option Parameters using DTCN Transaction – 1 of 3
If you did NOT use the DTCN view to enter your DTCN properties
you can do so using a CICS Transaction (green screen)
From CICS (after signing in):
Clear the screen, Enter: DTCN – and press Enter
From the DTCN screen
Press F10 – this will fill in the Terminal Id for your workstation
Note that you can also
type an asterisk: *…as the Terminal Id
Note: You would
only use the DTCN transaction to specify your Debug Option properties if you could not use the DTCN view (prior slides)

69
3. Setup the Debug Option Parameters using DTCN Transaction – 2 of 3
DTCN transaction data entry screen
Enter the Tran-code
▪ Transaction ID
Enter up to eight specific Program Id(s) you wish to debug through …or…
Enter wildcard text for the Program Id(s)
▪ Ex. CD*
Enter your User-ID
Session Type: TCP
Port Number:
from your Debugger look-up
Display ID:
Your TCP/IP address,
from your Debugger look-up (note that you can not paste into this 3270, screen)
▪ Press F4 to save your debug profile
▪ Press F3 to clear the screen

70
3. Setup the Debug Option Parameters using DTC Session Type – 3 of 3
DTC Session Type – Assumes that IDz’s DBGMGR started task is running
Press F10 to generate a unique Terminal ID
(Optionally) Enter a Tran-code
Enter up to eight specific load modules you’d like to debug
User Id ➔ TSO-ID
Session Type ➔ DTC
Display Id ➔ TSO-ID
▪ Press F4 to save your debug profile
▪ Press F3 to clear the screen
71
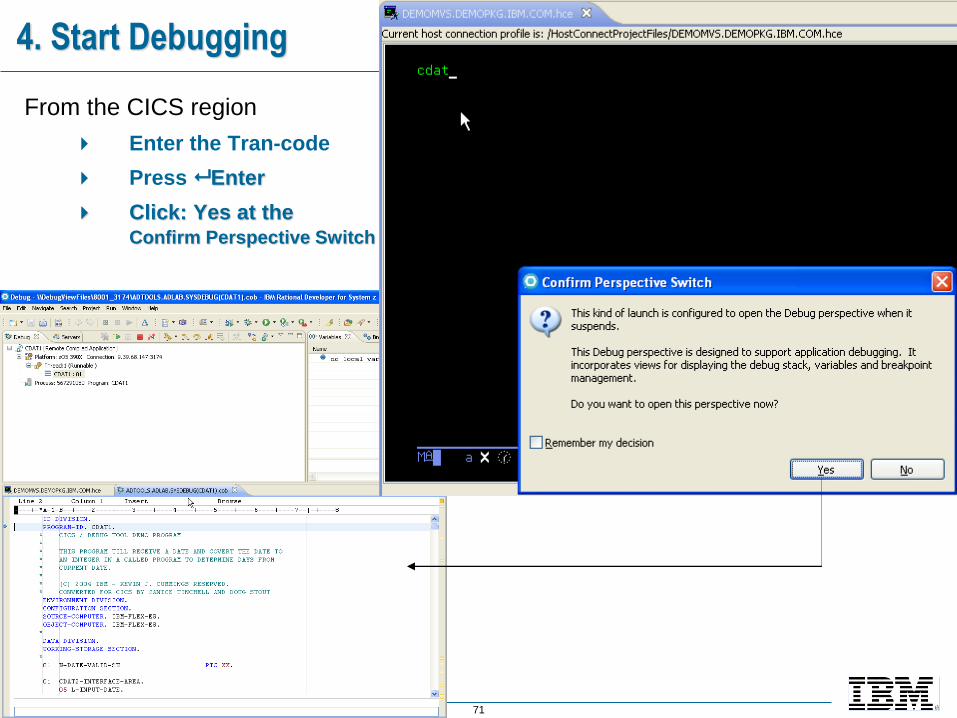
4. Start Debugging
From the CICS region
Enter the Tran-code
Press Enter
Click: Yes at the Confirm Perspective Switch

72
4. Start Debugging
Debug as previously learned in the batch/remote and Local debug units.

73
What Happens during CICS calls and screen-io – 1 of 2
You will be
prompted,
and
presented
with debug-
run-time
options

74
What Happens during CICS calls and screen-io – 2 of 2
If your current transaction ends, and a BMS or 3270 screen is sent:
▪ You will be notified (prompted) by the debug engine
▪ If a screen is sent, the 3270 will display in the content area

75
What About PF-Keys and Other Data Entry?
▪ You can resize the screen portion of the debugger
▪ And use the PF-Key emulation options in the Host Connection
76
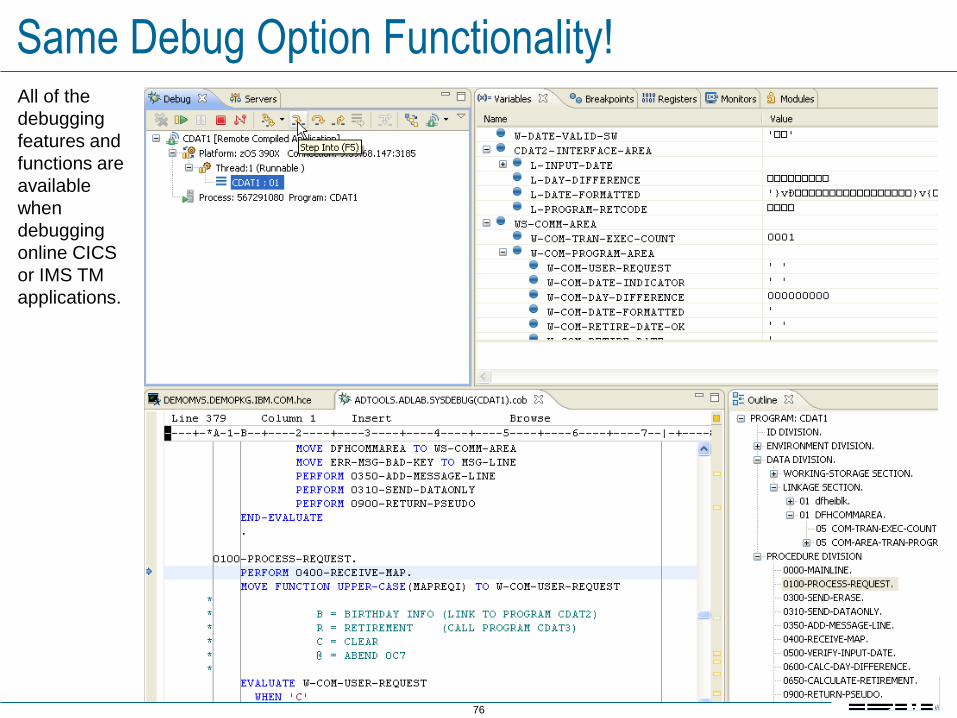
Same Debug Option Functionality!All of the
debugging
features and
functions are
available
when
debugging
online CICS
or IMS TM
applications.

77
Topic Objectives
After having completed this unit, you now should be able to:
Using the Problem Determination Tools, Debug Option and IDz:
▪Debug a mainframe online transaction
Describe the online transaction features for configuring your 3270 sessions with Debug Option
Debug a CICS 3270 Application
®
IBM Software Group
®
IBM Software Group
®
IBM Software Group
®
IBM Software Group
Code Coverage and IDz▪ IDz Integrated Debugger

79
Code Coverage – OverviewExtension to Debugging:
Tracks lines of code that have been executed during test
Improves application testing quality
Focuses testing resource usage
Numerous reports on tested code and trends
Supports: Batch, CICS and IMS TM
Many options:▪ Exclude/Include specific modules
▪ Filter and Export Reports
▪ Integrates with ADDi
Detailed/Source Line Coverage
Module Level Code Coverage
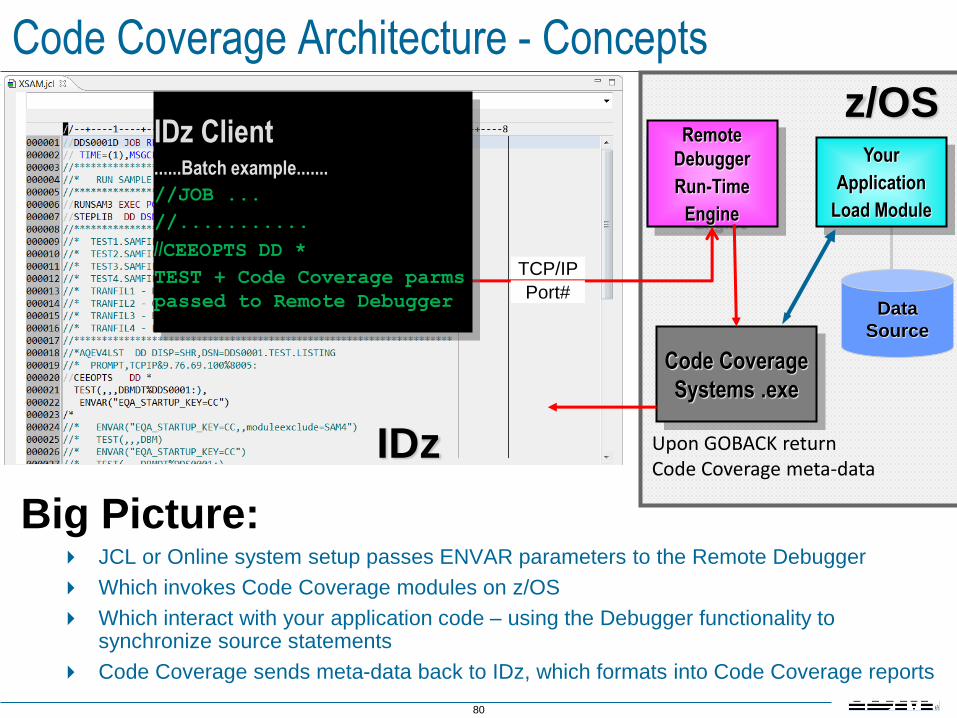
80
Big Picture: JCL or Online system setup passes ENVAR parameters to the Remote Debugger
Which invokes Code Coverage modules on z/OS
Which interact with your application code – using the Debugger functionality to synchronize source statements
Code Coverage sends meta-data back to IDz, which formats into Code Coverage reports
z/OS
Code Coverage Architecture - Concepts
TCP/IP
Remote
Debugger
Run-Time
Engine
Data
Source
Your
Application
Load Module
Port#
Code Coverage
Systems .exe
IDz Upon GOBACK return Code Coverage meta-data
IDz Client......Batch example.......
//JOB ...
//...........
//CEEOPTS DD *
TEST + Code Coverage parms
passed to Remote Debugger
81
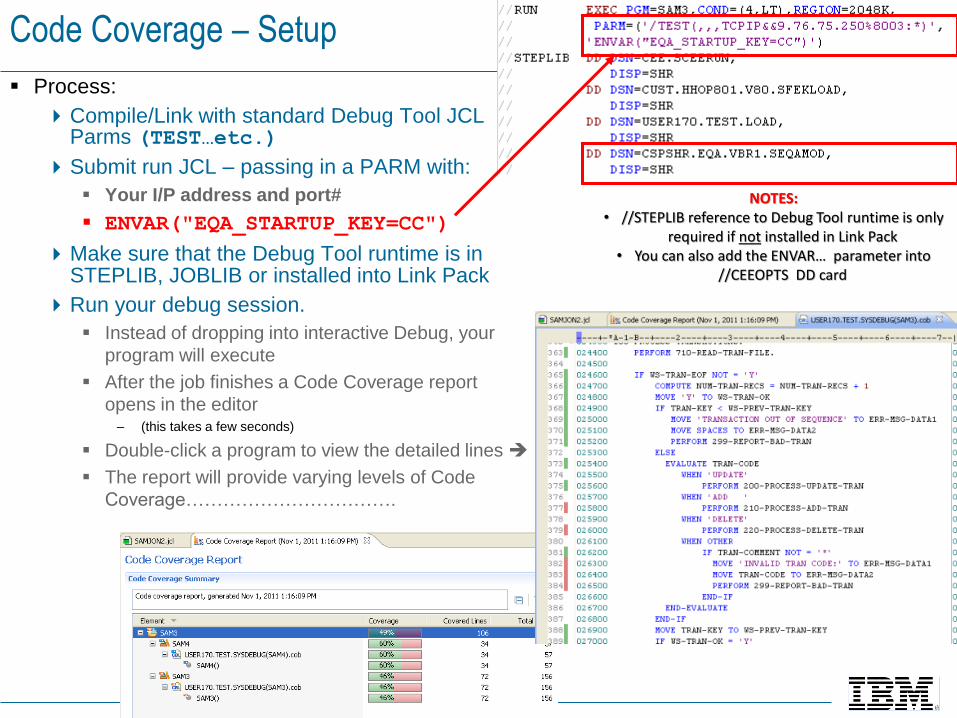
Code Coverage – Setup
▪ Process:
Compile/Link with standard Debug Tool JCL Parms (TEST…etc.)
Submit run JCL – passing in a PARM with:
▪ Your I/P address and port#
▪ ENVAR("EQA_STARTUP_KEY=CC")
Make sure that the Debug Tool runtime is in STEPLIB, JOBLIB or installed into Link Pack
Run your debug session.
▪ Instead of dropping into interactive Debug, your
program will execute
▪ After the job finishes a Code Coverage report
opens in the editor – (this takes a few seconds)
▪ Double-click a program to view the detailed lines ➔
▪ The report will provide varying levels of Code
Coverage…………………………….
NOTES:• //STEPLIB reference to Debug Tool runtime is only
required if not installed in Link Pack• You can also add the ENVAR… parameter into
//CEEOPTS DD card

82
Code Coverage – Specifying ENVAR
▪ Specifying the ENVAR parameter
Batch:
▪ PARM card
▪ //CEEOPTS DD card TEST parameter
Online
▪ DTCN Profile
▪ PF9 to Debug Tool options
▪ Same ENVAR…. parameter

83
Code Coverage – Reports 1 of 2
▪ When the Code Coverage batch job or transaction finishes – and you’re running IDz interactively: The current Code Coverage report
opens in the editor window
The Compiled Code Coverage Results view is opened
▪ Code Coverage Reports present: Coverage Totals
▪ The lines that were executed
A warning symbol to let you know of any modules and/or paragraphs that were accessed at below a specified coverage threshold▪ You set the threshold for coverage warnings
in Preferences
Individual program paragraph coverage statistics
Program Entry
Para
grap
h
cove
rage
Compiled Code Coverage Results view allows
you to see previous Code Coverage Reports.
These are stored in your Workspace
Opens…
84
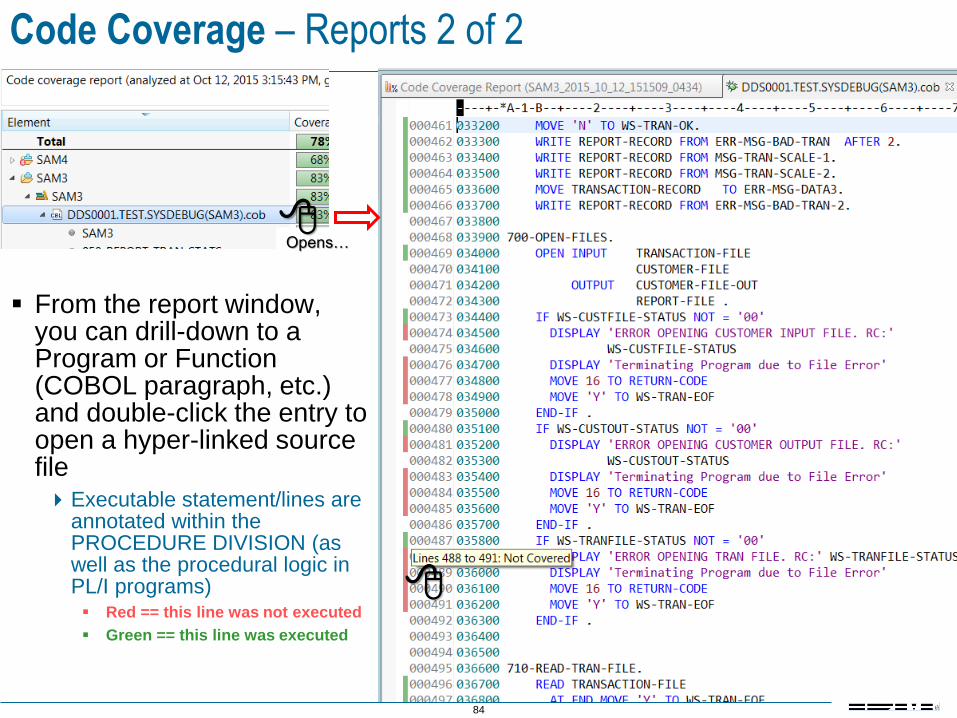
Code Coverage – Reports 2 of 2
▪ From the report window, you can drill-down to a Program or Function (COBOL paragraph, etc.) and double-click the entry to open a hyper-linked source fileExecutable statement/lines are
annotated within the PROCEDURE DIVISION (as well as the procedural logic in PL/I programs)▪ Red == this line was not executed
▪ Green == this line was executed
Opens…
85
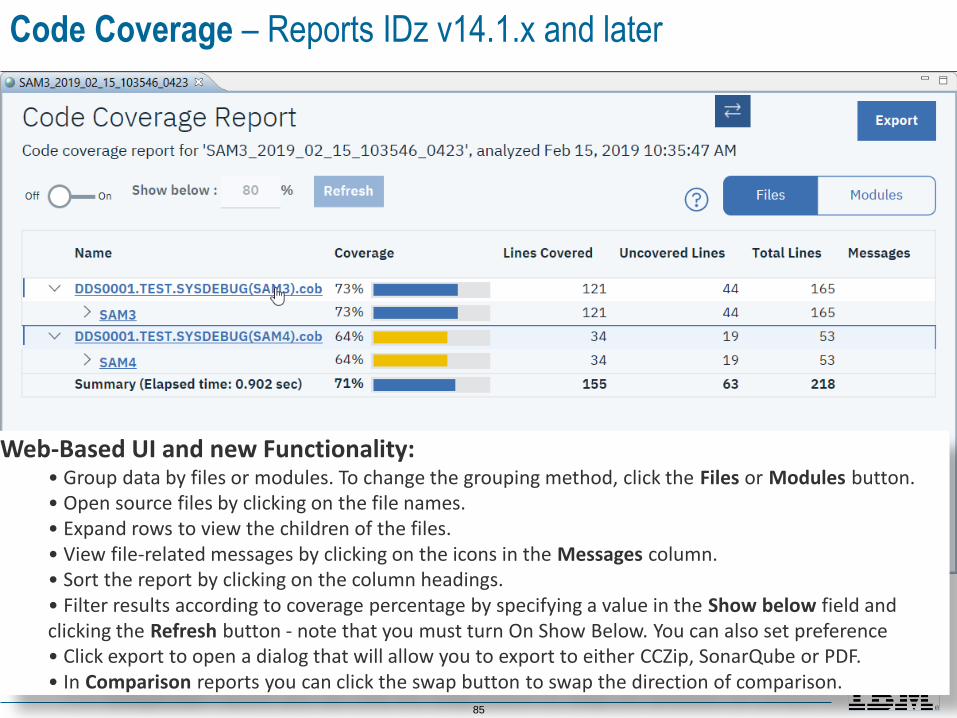
Code Coverage – Reports IDz v14.1.x and later
Web-Based UI and new Functionality:• Group data by files or modules. To change the grouping method, click the Files or Modules button.• Open source files by clicking on the file names.• Expand rows to view the children of the files.• View file-related messages by clicking on the icons in the Messages column.• Sort the report by clicking on the column headings.• Filter results according to coverage percentage by specifying a value in the Show below field and clicking the Refresh button - note that you must turn On Show Below. You can also set preference• Click export to open a dialog that will allow you to export to either CCZip, SonarQube or PDF.• In Comparison reports you can click the swap button to swap the direction of comparison.

86
Code Coverage – Reports 2 of 2 – Paragraph list

87
Compare Reports
▪ Can compare two Code Coverage Reports
▪ Later (Date/Timestamped)
report is compared to
earlier selected report– Colored deltas highlight
differences
▪ Deltas are calculated at
various levels– Totals
– Module
– Paragraph
In this example a batch job is run twice
using two different input datasets
Reports are compared…
88
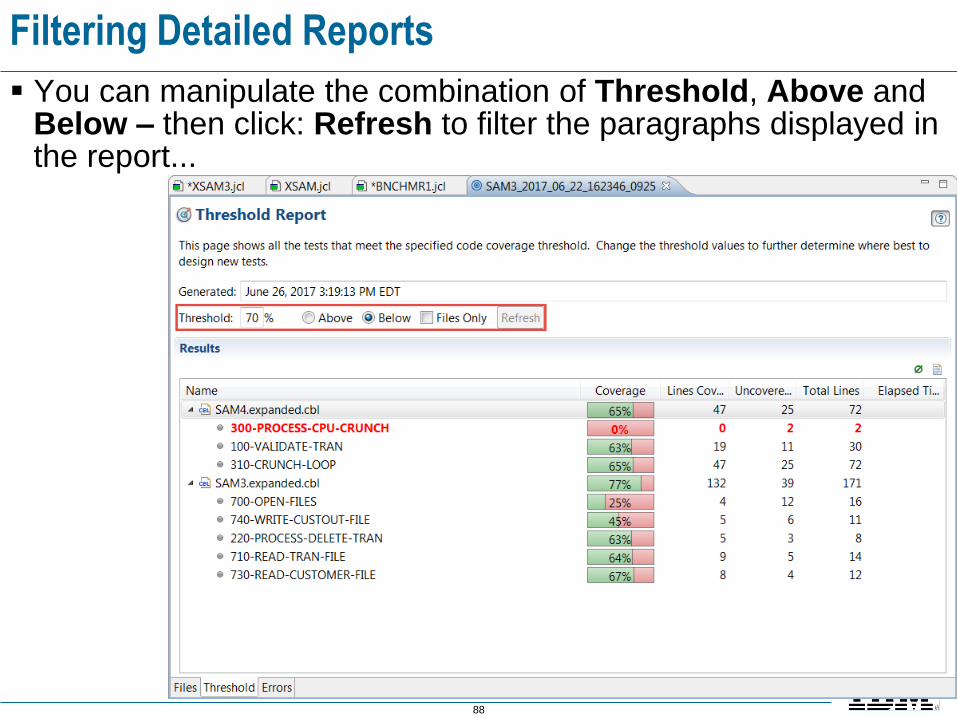
Filtering Detailed Reports
▪ You can manipulate the combination of Threshold, Above and Below – then click: Refresh to filter the paragraphs displayed in the report...
89
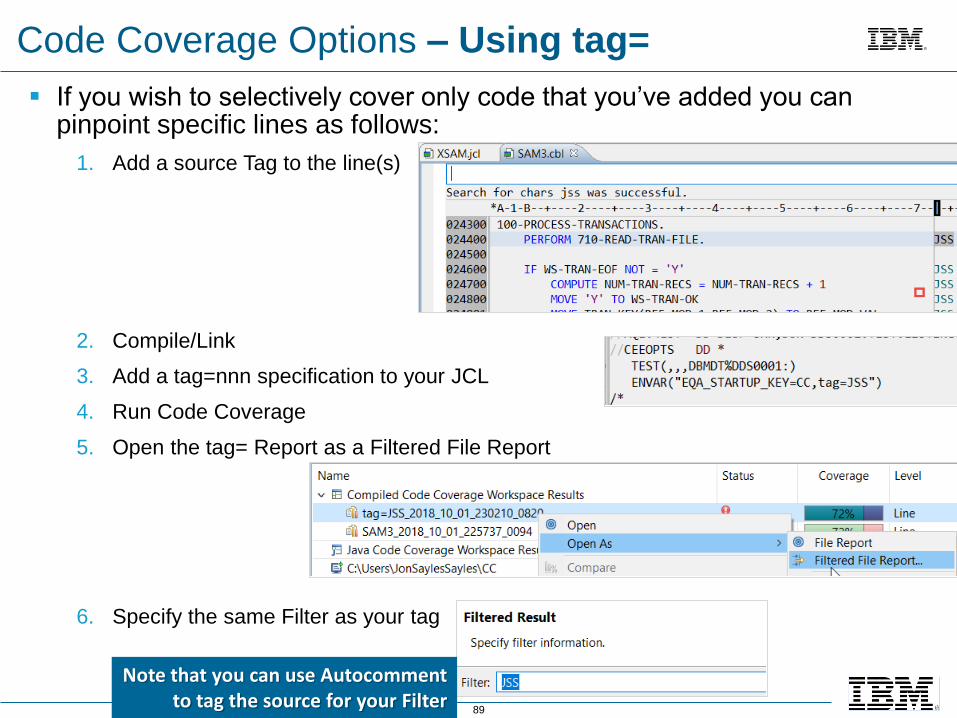
Code Coverage Options – Using tag=
▪ If you wish to selectively cover only code that you’ve added you can pinpoint specific lines as follows:
1. Add a source Tag to the line(s)
2. Compile/Link
3. Add a tag=nnn specification to your JCL
4. Run Code Coverage
5. Open the tag= Report as a Filtered File Report
6. Specify the same Filter as your tag
Note that you can use Autocomment to tag the source for your Filter
90
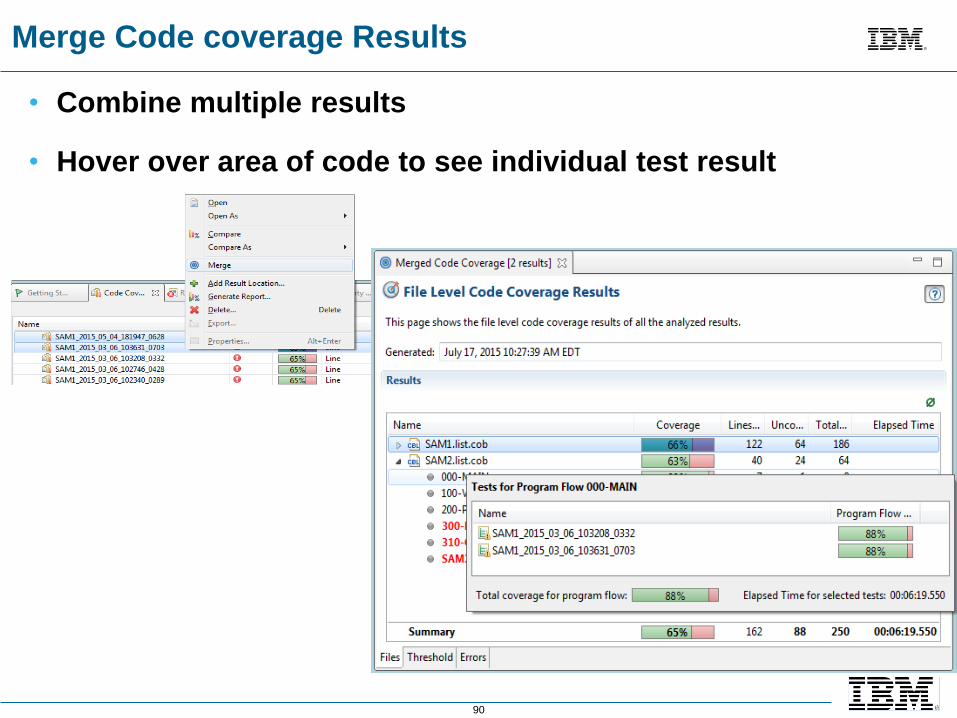
Merge Code coverage Results
• Combine multiple results
• Hover over area of code to see individual test result
91
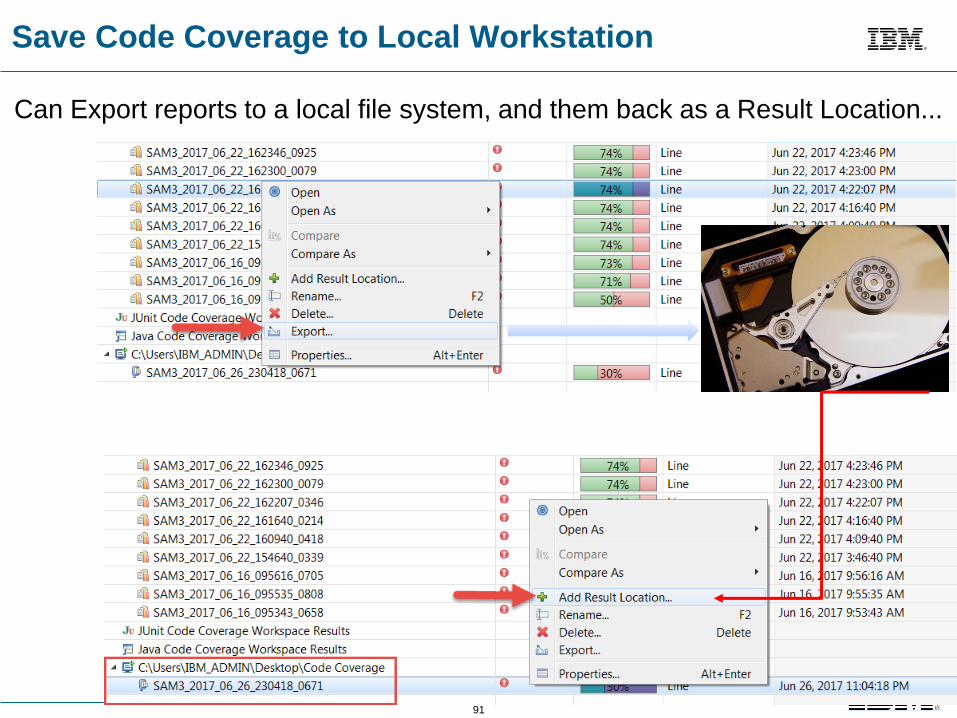
Save Code Coverage to Local Workstation
Can Export reports to a local file system, and them back as a Result Location...
92
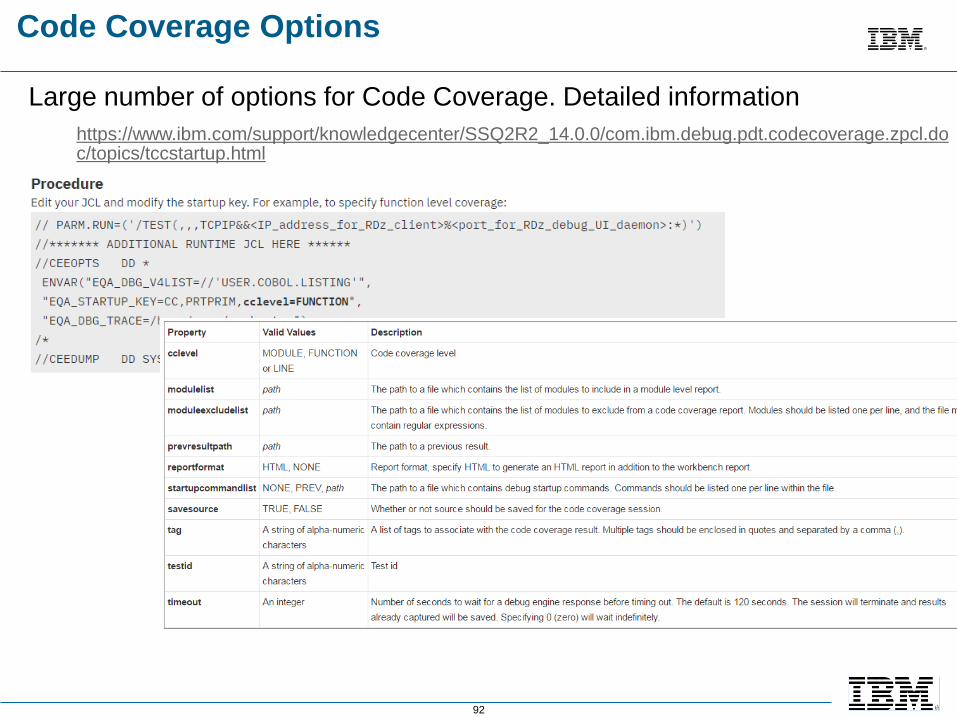
Code Coverage Options
Large number of options for Code Coverage. Detailed information
https://www.ibm.com/support/knowledgecenter/SSQ2R2_14.0.0/com.ibm.debug.pdt.codecoverage.zpcl.doc/topics/tccstartup.html

93
Running Code Coverage in Batch (UNIX) Mode - 1 of 6
• Run AKGCC PROC
• Output to z/OS Unix
• Import Unix clcoverage file(s) to Code Coverage Results view
• Runstream JCL AKGCC PROC
94
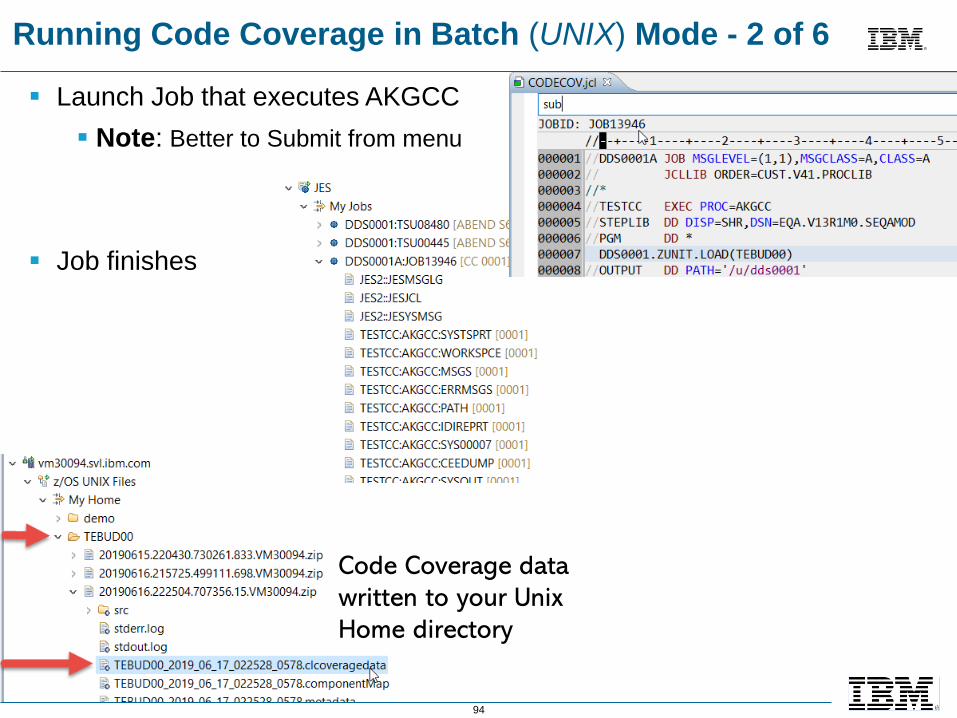
▪ Launch Job that executes AKGCC
▪ Note: Better to Submit from menu
▪ Job finishes
Running Code Coverage in Batch (UNIX) Mode - 2 of 6
Code Coverage data
written to your Unix
Home directory
95
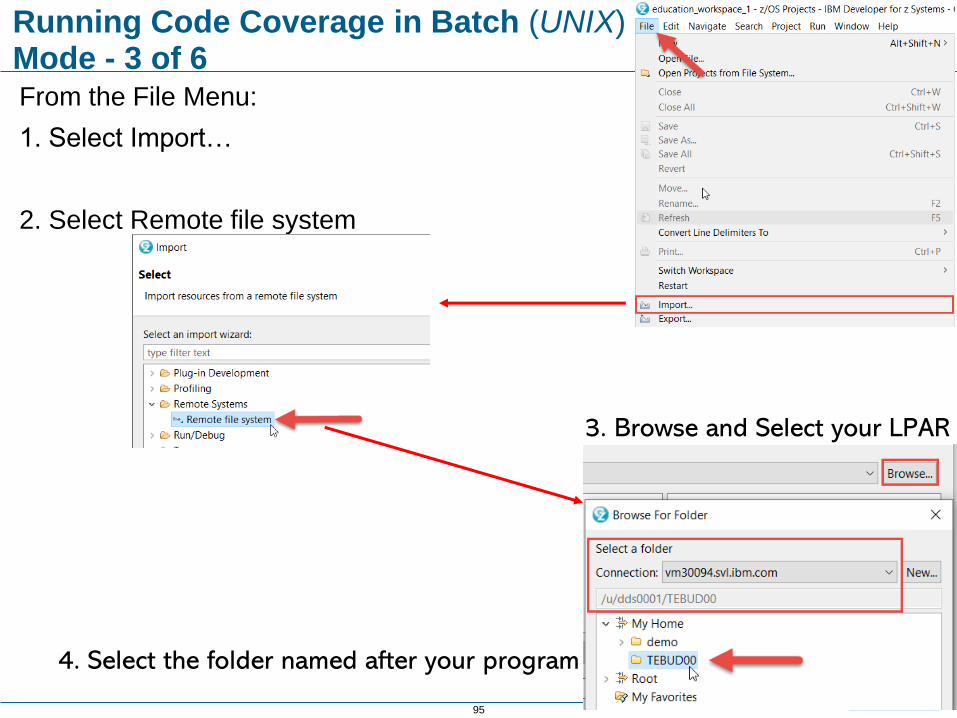
From the File Menu:
1. Select Import…
2. Select Remote file system
Running Code Coverage in Batch (UNIX)Mode - 3 of 6
3. Browse and Select your LPAR
4. Select the folder named after your program
96
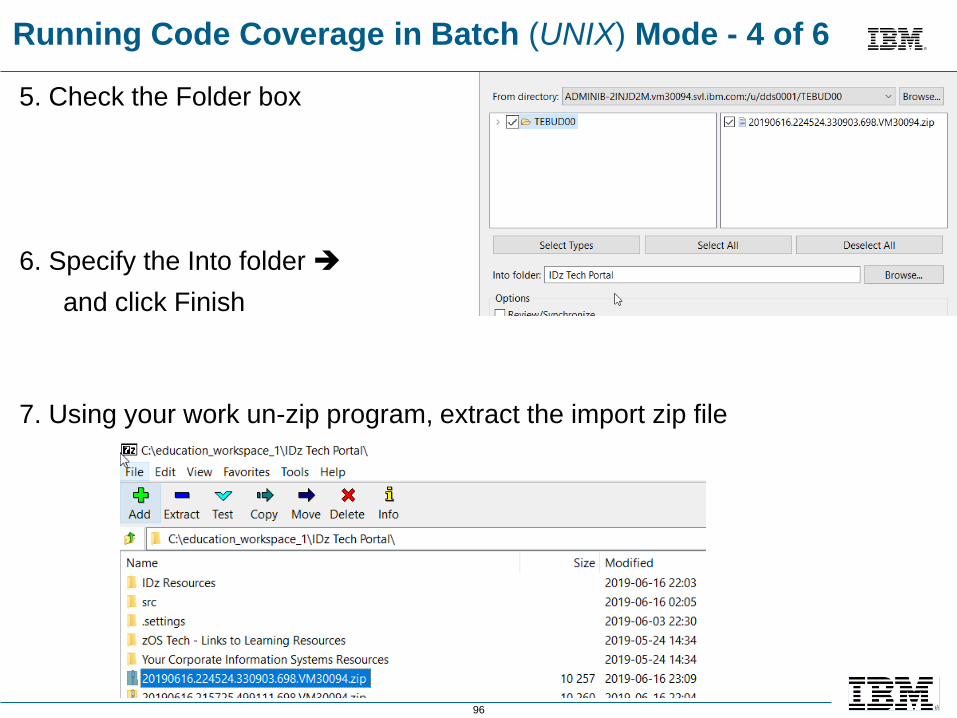
5. Check the Folder box
6. Specify the Into folder ➔
and click Finish
7. Using your work un-zip program, extract the import zip file
Running Code Coverage in Batch (UNIX) Mode - 4 of 6
97
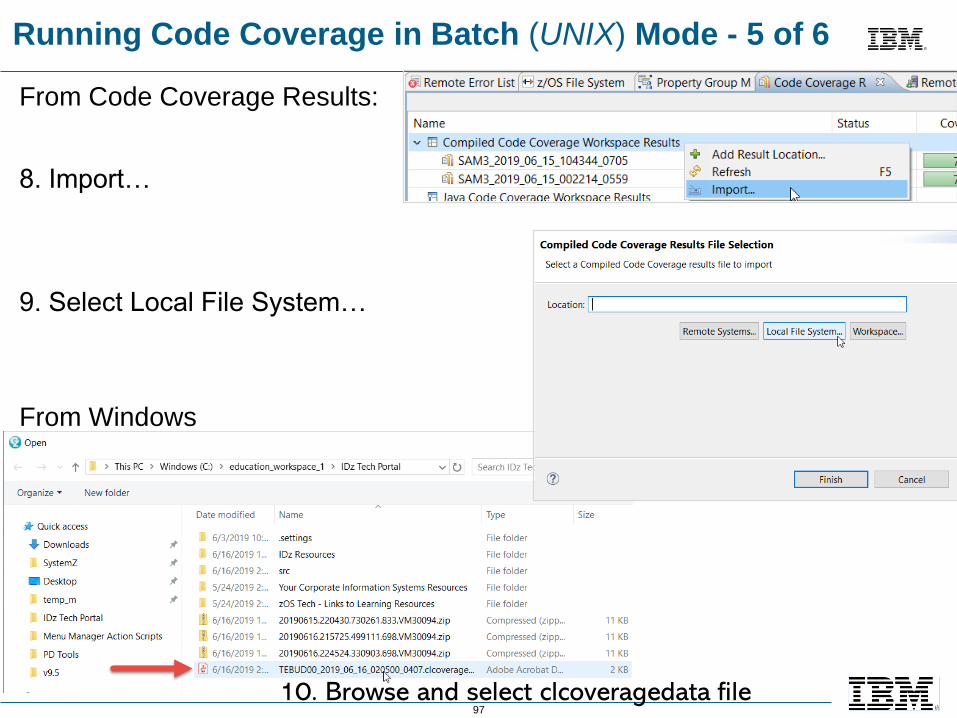
From Code Coverage Results:
8. Import…
9. Select Local File System…
From Windows
Running Code Coverage in Batch (UNIX) Mode - 5 of 6
10. Browse and select clcoveragedata file
98
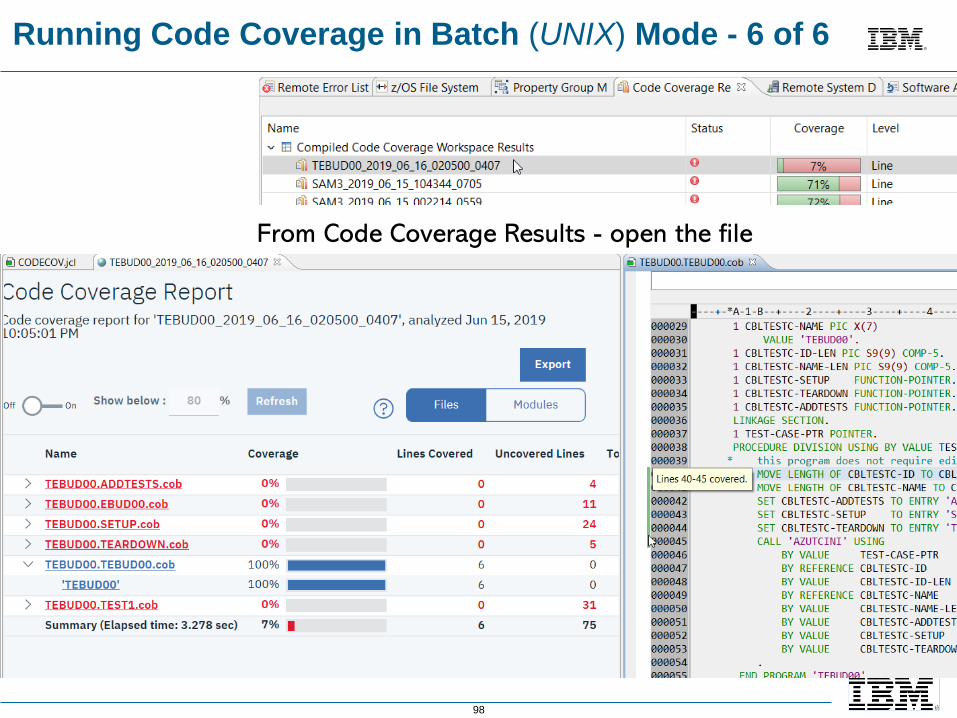
Running Code Coverage in Batch (UNIX) Mode - 6 of 6
From Code Coverage Results - open the file

99
Running Code Coverage in Batch (headless) Mode
▪ Small footprint non-gui code coverage collector
▪ Runs native on target system
• Requires Java 6 or higher
▪ Collects CC results and optionally generates
• Source that matches CC results
• HTML reports
• Zip of results
▪ Results can be imported into IDz for further analysis
• Comparisons
• View source lines annotated with hit information
▪ Integrate into automated builds and testing
• Run as continuous daemon that collects all data
• OR Run instance per build/test
▪ Can be invoked from JCL
▪ Supports adding “tags” for future reference
•e.g. testcase ID
100
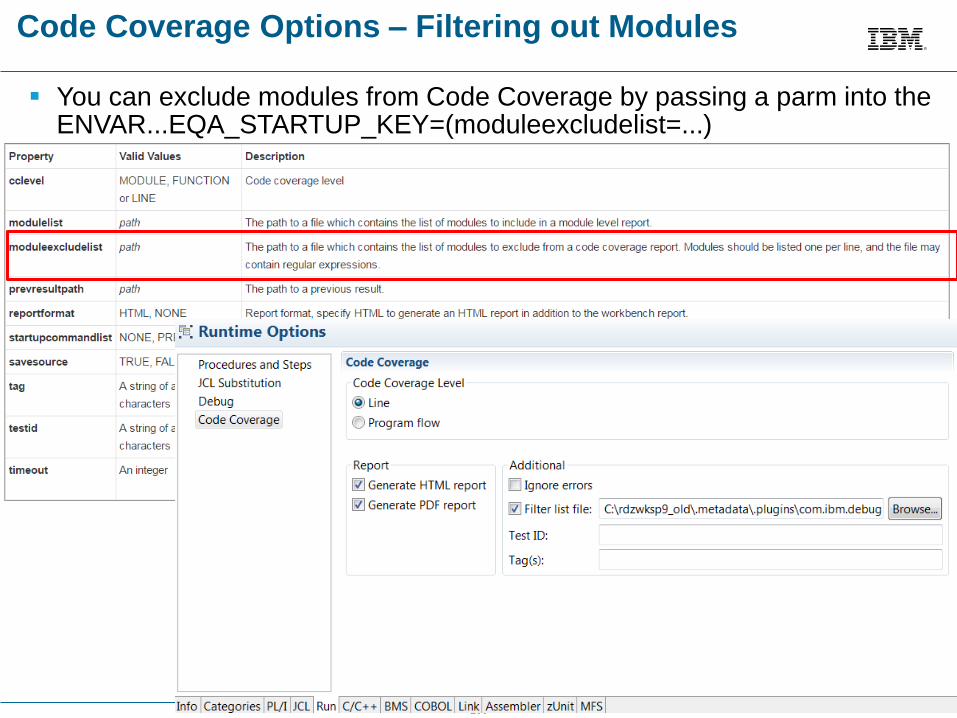
Code Coverage Options – Filtering out Modules
▪ You can exclude modules from Code Coverage by passing a parm into the ENVAR...EQA_STARTUP_KEY=(moduleexcludelist=...)

101
//GYOUNGG JOB XXXXXXXX,CLASS=A,MSGCLASS=H,MSGLEVEL=(1,1),
// REGION=256M,NOTIFY=&SYSUID,TIME=1
//STEP1 EXEC PGM=COB01
//STEPLIB DD DISP=SHR,DSN=GYOUNG.CC5.LOADPDSE ➔
//SYSOUT DD SYSOUT=*
//CEEOPTS DD *
TEST(ALL,*,PROMPT,TCPIP&9.76.69.100%8005:*),
ENVAR("EQA_STARTUP_KEY=CC,COB01A,
CCLEVEL=LINE,MODULEINCLUDE=COB01A")
1. Start daemon ➔
Running Code Coverage in Batch Mode – Example JCL
GYOUNG.CC5.LOADPDSE
(Load library)
COB01 – Load Module
COB01A - Subroutine
Windows Server
Code Cover console messages ➔
4. Coverage Report ➔
Much easier than it looks!
2. Customize TEST card w/PC IP address & Port#
3. Submit the JCL
102

103
Obtaining the Source Listing for Debugging
Below is the list of the other mechanism. You can use with IDZ debugger except Set Source command.
ZOS Debugger obtains the source file from one of the following sources:
Default data set name
SET SOURCE command
SET DEFAULT LISTINGS command
EQAUEDAT user exit (specifying function code 3)
EQADEBUG DD name
EQA_SRC_PATH environment variable
The above are use to automate finding the debug file but assuming you don't set that up ahead of time, then when starting a debug session the debugger will prompt you to provide the location of the file.
104
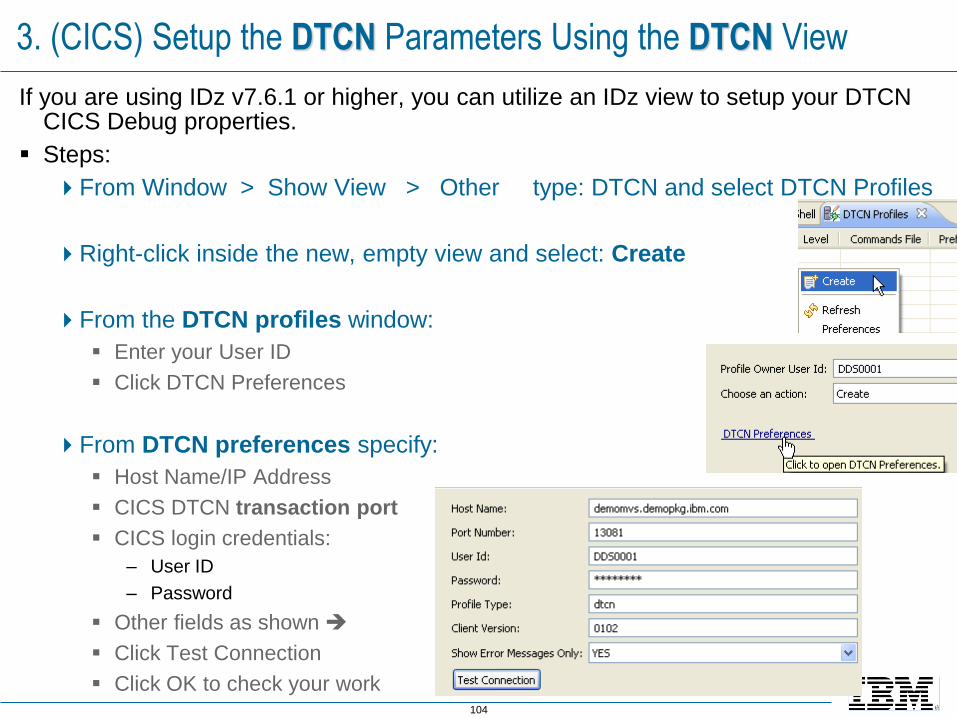
3. (CICS) Setup the DTCN Parameters Using the DTCN View
If you are using IDz v7.6.1 or higher, you can utilize an IDz view to setup your DTCN CICS Debug properties.
▪ Steps:
From Window > Show View > Other type: DTCN and select DTCN Profiles
Right-click inside the new, empty view and select: Create
From the DTCN profiles window:
▪ Enter your User ID
▪ Click DTCN Preferences
From DTCN preferences specify:
▪ Host Name/IP Address
▪ CICS DTCN transaction port
▪ CICS login credentials:
– User ID
– Password
▪ Other fields as shown ➔
▪ Click Test Connection
▪ Click OK to check your work
105
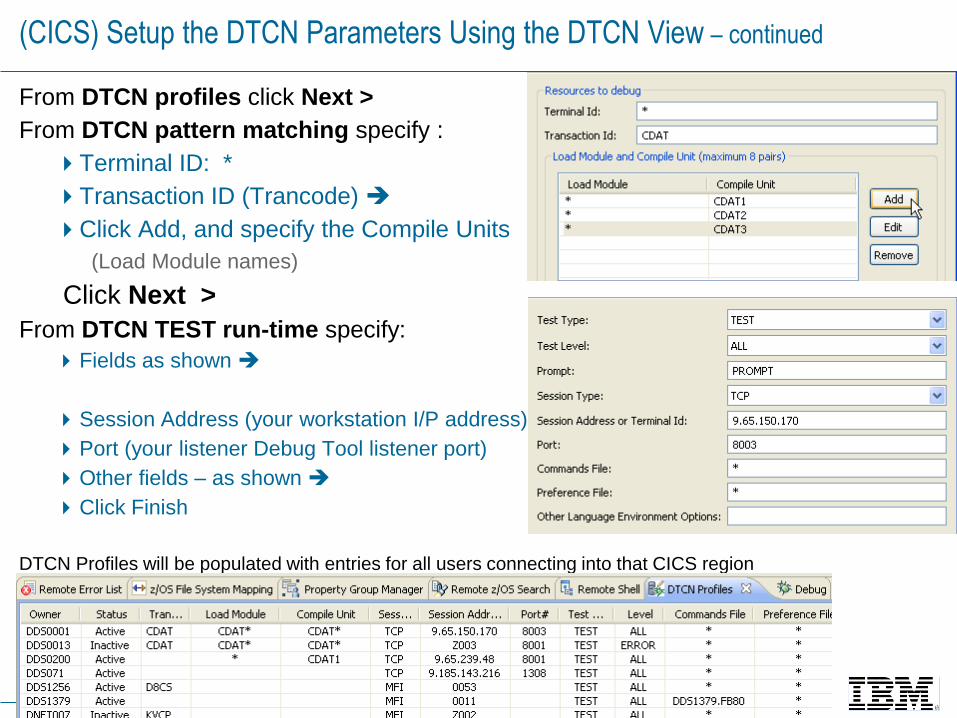
(CICS) Setup the DTCN Parameters Using the DTCN View – continued
From DTCN profiles click Next >
From DTCN pattern matching specify :
Terminal ID: *
Transaction ID (Trancode) ➔
Click Add, and specify the Compile Units
(Load Module names)
Click Next >
From DTCN TEST run-time specify:
Fields as shown ➔
Session Address (your workstation I/P address)
Port (your listener Debug Tool listener port)
Other fields – as shown ➔
Click Finish
DTCN Profiles will be populated with entries for all users connecting into that CICS region

106
(CICS) Using the DTCN View
Once you have setup the DTCN View, you can:
▪ Activate the profile
This modifies the CICS System Tables dynamically, through the Debug Tool facilities – and allows you to debug CICS transactions
▪ Other options include:Edit the profile – and change your I/P address
▪ After you reboot your machine
Delete the profile
Create a new profile
Refresh the display of DTCN entries in the region
Note: In order to debug CICS programs you will have to launch a 3270 emulation session (next slides) to kick off the transaction

107
CEEOPTS TEST Statement – IDz/IDz Options
▪ TEST parameter syntaxTEST(test_level,cmd_file,prompt_level,preference_file)
▪ Standard Mode Test preference file parameters:TEST(,,,DIRECT&1.2.3.4%8001:)
TEST(,,,DBM:*)
TEST(,,,DBM%TSS14:*)
▪ Compatibility Mode Test preference file parameters:TEST(,,,TCPIP&1.2.3.4%8001:)
TEST(,,,DBMDT:*)
TEST(,,,DBMDT%TSS14:*)

108
Product Options Details – Up to IDz v14
Client Host Product/Feature
Name
TEST Runtime option
IDz 9.0.1x -9.5.0x IDz 9.01x -9.5.0x Integrated Debugger TEST(,,,DBM)
TEST(,,,DIRECT&ip_addr%port
IDz 9.0.1x -9.5.0x IDz 9.01x9.5.0x + Debug Tool v12 or v13 Debug Tool TEST(,,,TCPIP&ip_addr%port:*)
IDz 9.5.1x IDz 9.01x9.5.0x + Debug Tool v12, v13 Debug Tool TEST(,,,TCPIP&ip_addr%port:*)
IDz 9.5.1x IDz 9.01x -9.5.1x Integrated Debugger TEST(,,,DBM)
TEST(,,,DIRECT&ip_addr%port)
IDz 9.5.1x IDz 9.5.1x + Debug Tool v13 Debug Tool TEST(,,,DBMDT%TSO_ID:)
TEST(,,,TCPIP&ip_addr%port:*)
IDz v14.0x IDz 9.01x -9.5.0x Standard Mode (previously Integrated Debugger)
TEST(,,,DBM)
TEST(,,,DIRECT&ip_addr%port)
IDz v14.0x IDz 9.01x -9.5.0x + Debug Tool v13 Debug Tool Compatibility Mode TEST(,,,TCPIP&ip_addr%port:*)
IDz v14.0x IDz 9.5.1x Standard Mode
(previously Integrated Debugger)
TEST(,,,DBM)
TEST(,,,DIRECT&ip_addr%port)
IDz v14.0x IDz 9.5.1x + Debug Tool v13 Debug Tool Compatibility Mode TEST(,,,DBMDT%TSO_ID:)
TEST(,,,TCPIP&ip_addr%port:*)
IDz v14.0x IDz v14.0x Standard Mode TEST(,,,DBM)
TEST(,,,DIRECT&ip_addr%port)
IDz v14.0x IDz v14.0x Debug Tool Compatibility Mode TEST(,,,DBMDT)
TEST(,,,TCPIP&ip_addr%port:*)
Details on the above product options: • https://www.ibm.com/support/knowledgecenter/SSQ2R2_14.0.0/com.ibm.debugtool.doc/common/dcompo.html

109
Monitor Memory
▪ Monitor Memory option(s)▪ The memory content can be shown (or “rendered”) in several different formats:
▪ Raw HEX, EDBCDIC or ASCII
▪ Tree structure using customized XML mappings.
▪ Primarily used during Assembler debugging – or in handling ABEND (Dump) situations

110
Run Menu▪ Shows same + additional
debugging functionality as icons on toolbar
However, not all Run menu functionality enabled for COBOL/PL1
▪ Also shows hot-keys
Your PC's function keys
▪ Context-sensitive:
Options are grayed in current debug session if not applicable
111
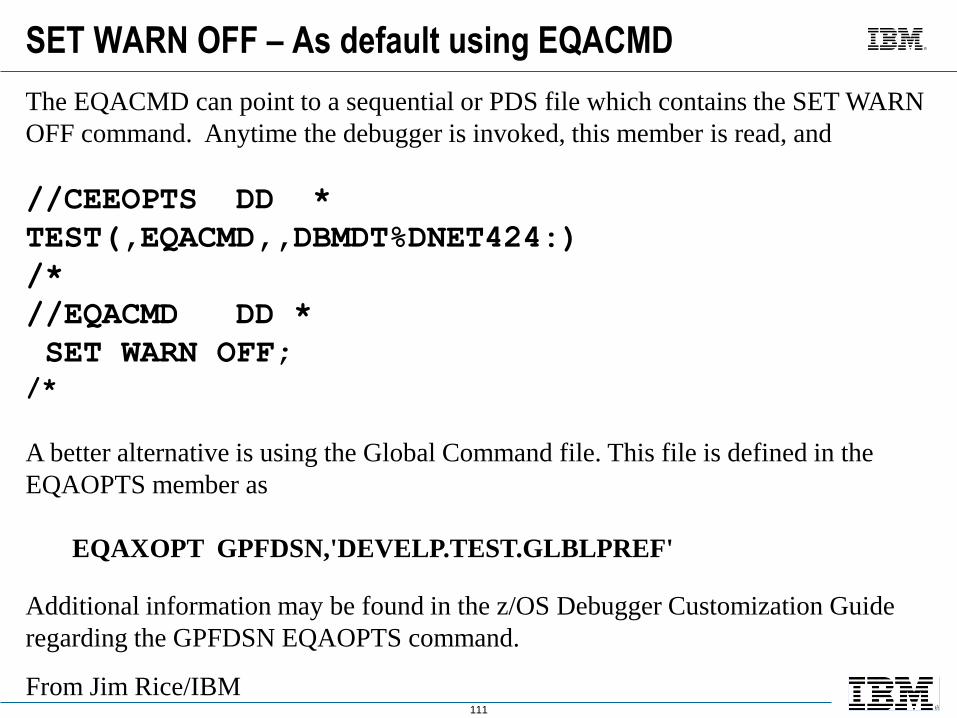
SET WARN OFF – As default using EQACMD
The EQACMD can point to a sequential or PDS file which contains the SET WARN
OFF command. Anytime the debugger is invoked, this member is read, and
//CEEOPTS DD *
TEST(,EQACMD,,DBMDT%DNET424:)
/*
//EQACMD DD *
SET WARN OFF;
/*
A better alternative is using the Global Command file. This file is defined in the
EQAOPTS member as
EQAXOPT GPFDSN,'DEVELP.TEST.GLBLPREF'
Additional information may be found in the z/OS Debugger Customization Guide
regarding the GPFDSN EQAOPTS command.
From Jim Rice/IBM

112
SYSPROG Information
There are a number of Debug Tool Reference Guides – both for Users and for Administrators. It would be smart to bookmark URLs to them
Compiler Releases and the TEST(SEP) ParmFor COBOL V4 - Debug Tool doesn't need the source but it needs a "SYSDEBUG" file - created out of the Compile step.
For COBOL V5 and above the debug information including a copy of the source is imbedded into the load module(object) so the answer to your question will be yes, you can debug a COBOL application where the object contains the source if compiled TEST(NOSEPARATE)
The latest version of COBOL V6.2 enhances the TEST compile option with by adding an approach similar to what Jon describes for COBOL V4 above, in which you need a SYSDEBUG file created by the compiler. The option is now TEST(NOSEPARATE/SEPARATE).
SYSPROG Info – on Debug Sessions that are left unattendedIf a debug session is left alone it ends up being in a wait on z/OS. The setting for PARMLIB(SMFPRMxx) JWT [max job wait time] comes into play. This parmlib setting just sets the default, this can be overridden in various places, like on the JOB and EXEC cards of a JCL.https://www.ibm.com/support/knowledgecenter/SSLTBW_2.3.0/com.ibm.zos.v2r3.ieae200/smfparm.htm
113
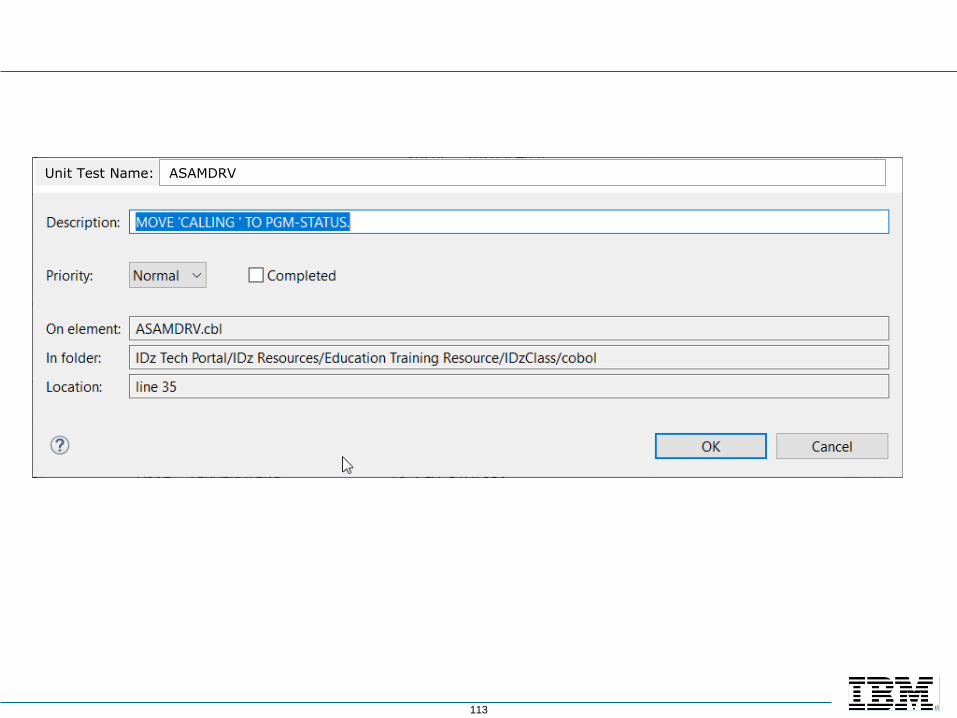
Unit Test Name: ASAMDRV
Related Documents