z/OS 2.4 Language Environment Debugging Guide IBM GA32-0908-40

Welcome message from author
This document is posted to help you gain knowledge. Please leave a comment to let me know what you think about it! Share it to your friends and learn new things together.
Transcript
z/OS2.4
Language EnvironmentDebugging Guide
IBM
GA32-0908-40
Note
Before using this information and the product it supports, read the information in “Notices” on page487.
This edition applies to Version 2 Release 4 of z/OS (5650-ZOS) and to all subsequent releases and modifications untilotherwise indicated in new editions.
Last updated: 2021-06-21© Copyright International Business Machines Corporation 1991, 2020.US Government Users Restricted Rights – Use, duplication or disclosure restricted by GSA ADP Schedule Contract withIBM Corp.
Contents
Figures................................................................................................................. xi
Tables...............................................................................................................xxiii
About this document........................................................................................ xxviiUsing your documentation......................................................................................................................xxviiHow to read syntax diagrams................................................................................................................ xxviii
Symbols............................................................................................................................................ xxviiiSyntax items..................................................................................................................................... xxviiiSyntax examples................................................................................................................................ xxix
z/OS information.......................................................................................................................................xxx
How to send your comments to IBM................................................................... xxxiIf you have a technical problem.............................................................................................................. xxxi
Summary of changes....................................................................................... xxxiiiSummary of changes for z/OS Language Environment Debugging Guide for Version 2 Release 4
(V2R4)............................................................................................................................................... xxxiiiSummary of changes for Language Environment for z/OS Version 2 Release 3 (V2R3)......................xxxiiiSummary of changes for Language Environment for z/OS Version 2 Release 2 (V2R2)......................xxxiv
What Language Environment supports.............................................................. xxxv
Part 1. Introduction to debugging in Language Environment................................... 1
Chapter 1. Preparing your routine for debugging........................................................................................3Setting compiler options........................................................................................................................ 3
XL C and XL C++ compiler options....................................................................................................3COBOL compiler options...................................................................................................................5Fortran compiler options.................................................................................................................. 5PL/I compiler options....................................................................................................................... 6Enterprise PL/I for z/OS compiler options....................................................................................... 7
Using Language Environment runtime options......................................................................................8Determining the runtime options in effect....................................................................................... 9Understanding the HEAPZONES and HEAPCHK runtime options................................................. 10Using the CLER CICS transaction to display and set runtime options.......................................... 11
Controlling storage allocation.............................................................................................................. 11Stack storage statistics...................................................................................................................16Heap storage statistics................................................................................................................... 18HEAPPOOLS storage statistics....................................................................................................... 19
Modifying condition handling behavior................................................................................................20Language Environment callable services.......................................................................................20Language Environment runtime options........................................................................................ 20Customizing condition handlers..................................................................................................... 22Invoking the assembler user exit................................................................................................... 22Establishing enclave termination behavior for unhandled conditions.......................................... 23
Using messages in your routine........................................................................................................... 24C/C++.............................................................................................................................................. 24COBOL............................................................................................................................................. 24
iii
Fortran.............................................................................................................................................24PL/I..................................................................................................................................................24
Using condition information.................................................................................................................24Using the feedback code parameter.............................................................................................. 25Using the symbolic feedback code.................................................................................................26
Chapter 2. Classifying errors..................................................................................................................... 27Identifying problems in routines..........................................................................................................27
Language Environment module names..........................................................................................27Common errors in routines.............................................................................................................27
Interpreting runtime messages........................................................................................................... 28Message prefix................................................................................................................................ 29Message number.............................................................................................................................29Severity code...................................................................................................................................29Message text................................................................................................................................... 30
Understanding abend codes................................................................................................................ 30User abends.................................................................................................................................... 30System abends................................................................................................................................30
Using edcmtext to obtain information about errno2 values............................................................... 30Format............................................................................................................................................. 30Description...................................................................................................................................... 31Usage notes.....................................................................................................................................31Message returns..............................................................................................................................31Examples.........................................................................................................................................31Exit Values.......................................................................................................................................32
Chapter 3. Using Language Environment debugging facilities................................................................. 33Debug tools...........................................................................................................................................33Language Environment dump service, CEE3DMP............................................................................... 33
Generating a Language Environment dump with CEE3DMP......................................................... 33Generating a Language Environment dump with TERMTHDACT...................................................36Generating a Language Environment dump with language-specific functions.............................40Understanding the Language Environment dump......................................................................... 40Debugging with specific sections of the Language Environment dump........................................62
Multiple enclave dumps....................................................................................................................... 79Generating a system dump.................................................................................................................. 81
Steps for generating a system dump in a batch runtime environment......................................... 81Steps for generating a system dump in an IMS runtime environment..........................................82Steps for generating a system dump in a CICS runtime environment.......................................... 82Steps for generating a Language Environment U4039 abend.......................................................83Steps for generating a system dump in a z/OS UNIX shell............................................................83
Formatting and analyzing system dumps............................................................................................ 84Preparing to use the Language Environment support for IPCS.....................................................84Understanding Language Environment IPCS VERBEXIT – LEDATA.............................................. 84Understanding the Language Environment IPCS VERBEXIT LEDATA output............................... 88Understanding the HEAP LEDATA output.................................................................................... 107Understanding the heap pools LEDATA output............................................................................111Understanding the heap pools trace LEDATA output.................................................................. 115
Understanding the C/C++-specific LEDATA output...........................................................................118Understanding the COBOL-specific LEDATA output......................................................................... 138Understanding the PL/I-specific LEDATA output.............................................................................. 141Formatting individual control blocks................................................................................................. 147Controlling access to CEEDUMPs and DYNDUMPs........................................................................... 149Requesting a Language Environment trace for debugging............................................................... 150
Locating the trace dump...............................................................................................................151Using the Language Environment trace table format in a dump report......................................151Understanding the trace table entry (TTE).................................................................................. 151Sample dump for the trace table entry........................................................................................ 159
iv
Requesting a UNIX System Services syscall trace for debugging.................................................... 160
Part 2. Debugging language-specific routines..................................................... 161
Chapter 4. Debugging C/C++ routines.................................................................................................... 163Debugging C/C++ programs...............................................................................................................163
Using the __amrc and __amrc2 structures to debug input/output.............................................163Using file I/O tracing to debug C/C++ file I/O problems............................................................. 169Displaying an error message with the perror() function..............................................................169Using __errno2() to diagnose application problems................................................................... 169
Diagnosing DLL problems.................................................................................................................. 171Using C/C++ listings........................................................................................................................... 171
Finding variables...........................................................................................................................171Generating a Language Environment dump of a C/C++ routine....................................................... 178
cdump().........................................................................................................................................178csnap().......................................................................................................................................... 179ctrace()..........................................................................................................................................179Sample C routine that calls cdump()............................................................................................179Sample C++ routine that generates a Language Environment dump......................................... 180Sample Language Environment dump with C/C++-specific information....................................181Finding C/C++ information in a Language Environment dump....................................................185Sample Language Environment dump with XPLINK-specific information..................................191Finding XPLINK information in a Language Environment dump................................................. 194
C/C++ contents of the Language Environment trace tables............................................................. 195Debugging examples of C/C++ routines............................................................................................ 203
Divide-by-zero error..................................................................................................................... 203Calling a nonexistent non-XPLINK function.................................................................................206Calling a nonexistent XPLINK function........................................................................................ 210
Handling dumps written to the z/OS UNIX file system..................................................................... 213Multithreading consideration.............................................................................................................214Understanding C/C++ heap information in storage reports..............................................................214
Language Environment storage report with heap pools statistics.............................................. 214C function __uheapreport() storage report..................................................................................216
MEMCHECK VHM memory leak analysis tool....................................................................................218Invoking MEMCHECK VHM........................................................................................................... 218MEMCHECK VHM environment variables.....................................................................................218MEMCHECK VHM report sample scenario................................................................................... 219MEMCHECK VHM report examples.............................................................................................. 220
Chapter 5. Debugging COBOL programs.................................................................................................223Determining the source of error.........................................................................................................223
Tracing program logic................................................................................................................... 223Finding input/output errors.......................................................................................................... 223Handling input/output errors....................................................................................................... 224Validating data (class test)........................................................................................................... 224Assessing switch problems.......................................................................................................... 224Generating information about procedures.................................................................................. 224
Using COBOL listings..........................................................................................................................225Generating a Language Environment dump of a COBOL program....................................................226
COBOL program that calls another COBOL program................................................................... 226COBOL program that calls the Language Environment CEE3DMP callable service....................227Sample Language Environment dump with COBOL-specific information...................................227Finding COBOL information in a dump.........................................................................................228
Debugging example COBOL programs.............................................................................................. 233Subscript range error....................................................................................................................233Calling a nonexistent subroutine..................................................................................................235Divide-by-zero error..................................................................................................................... 239
v
Chapter 6. Debugging Fortran routines...................................................................................................245Determining the source of errors in Fortran routines....................................................................... 245
Identifying runtime errors............................................................................................................ 245Using Fortran compiler listings.......................................................................................................... 246Generating a Language Environment dump of a Fortran routine......................................................247
DUMP/PDUMP subroutines.......................................................................................................... 247CDUMP/CPDUMP subroutines......................................................................................................249SDUMP subroutine........................................................................................................................249
Finding Fortran information in a Language Environment dump....................................................... 252Examples of debugging Fortran routines.......................................................................................... 254
Calling a nonexistent routine........................................................................................................254Divide-by-zero error..................................................................................................................... 255
Chapter 7. Debugging PL/I for MVS & VM routines.................................................................................259Determining the source of errors in PL/I for MVS & VM routines..................................................... 259
Logic errors in the source routine................................................................................................ 259Invalid use of PL/I for MVS & VM................................................................................................. 259Unforeseen errors.........................................................................................................................260Invalid input data..........................................................................................................................260Compiler or runtime routine malfunction.................................................................................... 260System malfunction......................................................................................................................260Unidentified routine malfunction................................................................................................. 260Storage overlay problems.............................................................................................................261
Using PL/I for MVS & VM compiler listings........................................................................................262Generating PL/I for MVS & VM listings and maps........................................................................262Finding information in PL/I for MVS & VM listings....................................................................... 262
Generating a Language Environment dump of a PL/I for MVS & VM routine................................... 268PLIDUMP syntax and options....................................................................................................... 268PLIDUMP usage notes.................................................................................................................. 270
Finding PL/I for MVS & VM information in a dump............................................................................270Traceback......................................................................................................................................271Control blocks for active routines................................................................................................ 273Control blocks associated with the thread.................................................................................. 275
PL/I for MVS & VM contents of the Language Environment trace table........................................... 277Debugging example of PL/I for MVS & VM routines..........................................................................277
Subscript range error....................................................................................................................277Calling a nonexistent subroutine..................................................................................................281Divide-by-zero error..................................................................................................................... 283
Chapter 8. Debugging Enterprise PL/I routines......................................................................................287Determining the source of errors in Enterprise PL/I routines...........................................................287
Logic errors in the source routine................................................................................................ 287Invalid use of Enterprise PL/I.......................................................................................................287Unforeseen errors.........................................................................................................................288Invalid input data..........................................................................................................................288Compiler or runtime routine malfunction.................................................................................... 288System malfunction......................................................................................................................288Unidentified routine malfunction................................................................................................. 288Storage overlay problems.............................................................................................................289
Using Enterprise PL/I compiler listings............................................................................................. 290Generating Enterprise PL/I listings and maps.............................................................................290Finding information in Enterprise PL/I listings............................................................................ 290
Generating a Language Environment dump of an Enterprise PL/I routine.......................................296PLIDUMP syntax and options....................................................................................................... 296PLIDUMP usage notes.................................................................................................................. 298
Finding Enterprise PL/I information in a dump................................................................................. 298Traceback......................................................................................................................................299
vi
Control blocks for active routines................................................................................................ 299Control blocks associated with the thread.................................................................................. 301
Enterprise PL/I contents of the Language Environment trace table................................................ 302Debugging example of Enterprise PL/I routines............................................................................... 303
Subscript range error....................................................................................................................303Calling a nonexistent subroutine..................................................................................................306Divide-by-zero error..................................................................................................................... 307
Chapter 9. Debugging under CICS.......................................................................................................... 313Accessing debugging information......................................................................................................313
Locating Language Environment runtime messages................................................................... 313Locating the Language Environment traceback...........................................................................313Locating the Language Environment dump................................................................................. 314Using CICS transaction dump...................................................................................................... 314Using CICS register and program status word contents............................................................. 314Using Language Environment abend and reason codes..............................................................315Using Language Environment return codes to CICS....................................................................315
Activating Language Environment feature trace records under CICS.............................................. 315Ensuring transaction rollback............................................................................................................ 317Finding data when Language Environment returns a nonzero return code......................................317Finding data when Language Environment abends internally.......................................................... 318Finding data when Language Environment abends from an EXEC CICS command.........................318Displaying and modifying runtime options with the CLER transaction.............................................319
Part 3. Debugging Language Environment AMODE 64 applications...................... 321
Chapter 10. Preparing your AMODE 64 application for debugging........................................................323Setting compiler options....................................................................................................................323
XL C and XL C++ compiler options for AMODE 64 applications.................................................. 323Using Language Environment runtime options................................................................................. 323
Determining the runtime options in effect for AMODE 64 applications......................................324Understanding the HEAPZONES and HEAPCHK runtime options...............................................325
Controlling storage allocation for AMODE 64 applications...............................................................326Storage statistics for AMODE 64 applications............................................................................. 329
Modifying exception handling behavior.............................................................................................331Language Environment application program interfaces (API).................................................... 331Language Environment runtime options......................................................................................331Customizing exception handlers.................................................................................................. 332
Using condition information...............................................................................................................332Using the feedback code parameter............................................................................................ 333Using the symbolic feedback code...............................................................................................334
Chapter 11. Classifying AMODE 64 application errors........................................................................... 335Identifying problems in routines....................................................................................................... 335
Language Environment module names........................................................................................335Common errors in routines...........................................................................................................335
Interpreting runtime messages......................................................................................................... 336Message prefix..............................................................................................................................337Message number.......................................................................................................................... 337Severity code................................................................................................................................ 337Message text.................................................................................................................................337
Understanding abend codes.............................................................................................................. 337User abends.................................................................................................................................. 338System abends............................................................................................................................. 338
Chapter 12. Using Language Environment AMODE 64 debugging facilities.......................................... 339Debugging tools..................................................................................................................................339
vii
Language Environment dumps.......................................................................................................... 339Generating a Language Environment dump with TERMTHDACT................................................ 339Generating a Language Environment dump with language-specific functions.......................... 341Understanding the Language Environment dump....................................................................... 341
Generating a system dump................................................................................................................ 356Steps for generating a system dump in a batch runtime environment....................................... 357Steps for generating a system dump in a z/OS UNIX shell..........................................................357
Formatting and analyzing system dumps..........................................................................................358Preparing to use the Language Environment support for IPCS...................................................358Understanding Language Environment IPCS VERBEXIT – LEDATA............................................ 358Understanding the Language Environment IPCS VERBEXIT LEDATA output............................. 362Understanding the HEAP LEDATA output.................................................................................... 376Understanding the heap pool LEDATA output............................................................................. 386Understanding the heap pools trace LEDATA output.................................................................. 392
Understanding the C/C++-specific LEDATA output...........................................................................396C/C++-specific sections of the LEDATA output............................................................................406
Understanding the PL/I-specific LEDATA output.............................................................................. 408PL/I-specific sections of the LEDATA output............................................................................... 413
Understanding the AUTH LEDATA output..........................................................................................413Sections of the AUTH LEDATA VERBEXIT formatted output....................................................... 417
Formatting individual control blocks................................................................................................. 419Requesting a Language Environment trace for debugging............................................................... 421
Locating the trace dump...............................................................................................................421Using the Language Environment trace table format in a dump report......................................422Understanding the trace table entry (TTE).................................................................................. 422Sample dump for the trace table entry........................................................................................ 429Requesting a UNIX System Services syscall trace for debugging...............................................430
Chapter 13. Debugging AMODE 64 C/C++ routines............................................................................... 431Debugging C/C++ programs...............................................................................................................431
Using the __amrc and __amrc2 structures to debug input/output.............................................431Using file I/O tracing to debug C/C++ file I/O problems............................................................. 437Displaying an error message with the perror() function..............................................................437Using __errno2() to diagnose application problems................................................................... 438
Using C/C++ listings........................................................................................................................... 439Finding variables...........................................................................................................................439
Generating a Language Environment dump of a C/C++ routine....................................................... 442cdump().........................................................................................................................................442csnap().......................................................................................................................................... 442ctrace()..........................................................................................................................................442Sample C routine that calls cdump()............................................................................................442Sample C++ routine that generates a Language Environment dump......................................... 444Sample Language Environment dump with C/C++-specific information....................................445
C/C++ contents of the Language Environment trace tables............................................................. 449Debugging examples of C/C++ routines............................................................................................ 452
Divide-by-zero error..................................................................................................................... 452Calling a nonexistent function......................................................................................................458
Handling dumps written to the z/OS UNIX file system..................................................................... 462Multithreading consideration.............................................................................................................463Understanding C/C++ heap information in storage reports..............................................................463
Language Environment storage report with heap pools statistics.............................................. 463C function __uheapreport() storage report..................................................................................466
Part 4. Debugging Language Environment AMODE 31 and AMODE 64interoperability applications.......................................................................... 469
Chapter 14. Using Language Environment debugging facilities and Language Environment dumps .. 471
viii
Generating a dump for Language Environment AMODE 31 and AMODE 64 interoperabilityapplications...................................................................................................................................471Generating a system dump.......................................................................................................... 471Formatting and analyzing the AMODE 31 and AMODE 64 interoperability report in system
dumps...................................................................................................................................... 471Sections of the AMODE 31 and AMODE 64 interoperability report of the Language
Environment LEDATA VERBEXIT formatted output................................................................474
Appendix A. Diagnosing problems with Language Environment...........................475Diagnosis checklist.................................................................................................................................. 475
Locating the name of the failing routine for a non-XPLINK application........................................... 476Searching the IBM Software Support Database..................................................................................... 478Preparing documentation for an authorized program analysis report (APAR)...................................... 479
Appendix B. Accessibility...................................................................................483Accessibility features.............................................................................................................................. 483Consult assistive technologies................................................................................................................ 483Keyboard navigation of the user interface.............................................................................................. 483Dotted decimal syntax diagrams.............................................................................................................483
Notices..............................................................................................................487Terms and conditions for product documentation................................................................................. 488IBM Online Privacy Statement................................................................................................................ 489Policy for unsupported hardware............................................................................................................489Minimum supported hardware................................................................................................................489Programming interface information........................................................................................................490Trademarks.............................................................................................................................................. 490
Index................................................................................................................ 491
ix

x
Figures
1. Options report example produced by runtime option RPTOPTS(ON)........................................................10
2. Storage report produced by runtime option RPTSTG(ON)......................................................................... 12
3. Storage report produced by runtime option RPTSTG(ON) (continued)..................................................... 13
4. Storage report produced by RPTSTG(ON) with XPLINK.............................................................................14
5. Storage report produced by RPTSTG(ON) with XPLINK (continued).........................................................15
6. Storage report produced by RPTSTG(ON) with XPLINK (continued).........................................................16
7. Language Environment condition token..................................................................................................... 26
8. The C program CELSAMP............................................................................................................................ 41
9. The C program CELSAMP (continued)........................................................................................................ 42
10. The C program CELSAMP (continued)...................................................................................................... 43
11. The C DLL CELDLL..................................................................................................................................... 44
12. Upward-growing (non-XPLINK) stack frame format................................................................................63
13. Downward-growing (XPLINK) stack frame format...................................................................................64
14. Condition information block (Part A)........................................................................................................ 76
15. Condition information block (Part B)........................................................................................................ 77
16. Machine state information block.............................................................................................................. 79
17. Language Environment dump of multiple enclaves................................................................................. 80
18. Example of formatted output from LEDATA VERBEXIT (Part 1 of 18).....................................................88
19. Example of formatted output from LEDATA VERBEXIT (Part 2 of 18).....................................................89
20. Example of formatted output from LEDATA VERBEXIT (Part 3 of 18).....................................................90
21. Example of formatted output from LEDATA VERBEXIT (Part 4 of 18).....................................................91
22. Example of formatted output from LEDATA VERBEXIT (Part 5 of 18).....................................................92
23. Example of formatted output from LEDATA VERBEXIT (Part 6 of 18).....................................................93
xi
24. Example of formatted output from LEDATA VERBEXIT (Part 7 of 18).....................................................94
25. Example of formatted output from LEDATA VERBEXIT (Part 8 of 18).....................................................95
26. Example of formatted output from LEDATA VERBEXIT (Part 11 of 18)...................................................96
27. Example of formatted output from LEDATA VERBEXIT (Part 12 of 18)...................................................97
28. Example of formatted output from LEDATA VERBEXIT (Part 13 of 18)...................................................98
29. Example of formatted output from LEDATA VERBEXIT (Part 14 of 18)...................................................99
30. Example of formatted output from LEDATA VERBEXIT (Part 15 of 18)................................................ 100
31. Example of formatted output from LEDATA VERBEXIT (Part 16 of 18)................................................ 101
32. Example of formatted output from LEDATA VERBEXIT (Part 17 of 18)................................................ 102
33. Example of formatted output from LEDATA VERBEXIT (Part 18 of 18)................................................ 103
34. CAA formatted by the CBFORMAT IPCS command............................................................................... 148
35. Format of the trace table entry...............................................................................................................152
36. __amrc structure.....................................................................................................................................164
37. __amrc2 structure.................................................................................................................................. 164
38. Example of a routine using perror()........................................................................................................169
39. Example of a routine using __errno2()...................................................................................................170
40. Sample output of a routine using __errno2()......................................................................................... 170
41. Example of a routine using _EDC_ADD_ERRNO2.................................................................................. 170
42. Sample output of a routine using _EDC_ADD_ERRNO2........................................................................ 170
43. Example of a routine using __err2ad() in combination with __errno2() .............................................. 171
44. Sample output of routine using __err2ad() in combination with __errno2()........................................ 171
45. Writable static map produced by prelinker............................................................................................173
46. Location of RENT static variable in storage............................................................................................174
47. Writable static map produced by prelinker............................................................................................174
48. Location of NORENT static variable in storage...................................................................................... 175
xii
49. Example code for parameter variable.................................................................................................... 175
50. Example code for parameter variable.................................................................................................... 176
51. Partial storage offset listing....................................................................................................................176
52. Example code for structure variable...................................................................................................... 176
53. Example of aggregate map..................................................................................................................... 177
54. Writable static map produced by prelinker............................................................................................177
55. Fetched module for C routine.................................................................................................................180
56. Example C++ routine with protection exception generating a dump....................................................180
57. Template file STACK.C............................................................................................................................ 181
58. Header file STACK.H............................................................................................................................... 181
59. Memory file control block....................................................................................................................... 188
60. Registers on entry to CEE3DMP............................................................................................................. 188
61. Parameters, registers, and variables for active routines....................................................................... 189
62. Condition information for active routines.............................................................................................. 189
63. Registers on entry to CEE3DMP............................................................................................................. 190
64. Parameters, registers, and variables for active routines....................................................................... 190
65. Condition information for active routines.............................................................................................. 191
66. Sample XPLINK-compiled program (tranmain) which calls a NOXPLINK-compiled program ............ 192
67. Sample NOXPLINK-compiled program (trandll) which calls an XPLINK-compiled program .............. 192
68. Trace table with trace table entry types 7 and 8................................................................................... 200
69. C routine with a divide-by-zero error..................................................................................................... 203
70. Sections of the dump from example C/C++ routine (divide-by-zero error).......................................... 204
71. Pseudo assembly listing (C/C++ routine divide-by-zero error)............................................................. 205
72. C/C++ CAA information in dump (C/C++ routine divide-by-zero error)................................................ 205
73. Writable static map (C/C++ routine divide-by-zero error).....................................................................206
xiii
74. Enclave storage section of dump (C/C++ routine divide-by-zero error)............................................... 206
75. C/C++example of calling a nonexistent subroutine...............................................................................207
76. Sections of the dump from example C routine (calling a nonexistent subroutine)...............................208
77. Pseudo assembly listing (calling a nonexistent subroutine)................................................................. 209
78. Writable static map (calling a nonexistent subroutine)......................................................................... 210
79. Enclave control blocks and storage sections in dump (calling a nonexistent subroutine)...................210
80. C/C++example of calling a nonexistent XPLINK function......................................................................211
81. Pseudo assembly listing (calling a nonexistent XPLINK function)........................................................ 211
82. Writable static map (calling a nonexistent XPLINK function)................................................................212
83. Enclave control blocks and storage sections in dump (calling a nonexistent XPLINK function)......... 212
84. IPCS panel for entering data set information........................................................................................ 214
85. Storage report generated by __uheapreport().......................................................................................216
86. Heap Leak Report generated by MEMCHECK VHM................................................................................222
87. Example of using the WITH DEBUGGING MODE clause....................................................................... 225
88. COBOL program COBDUMP1 calling COBDUMP2..................................................................................226
89. COBOL program COBDUMP2 calling the Language Environment dump service CEE3DMP................. 227
90. Control block information for active COBOL routines............................................................................230
91. Enclave-level data for COBOL programs................................................................................................232
92. Process-level control blocks for COBOL programs................................................................................233
93. COBOL example of moving a value outside an array range................................................................... 233
94. COBOL listing for COBOLX...................................................................................................................... 234
95. COBOL example of calling a nonexistent subroutine.............................................................................235
96. Sections of Language Environment dump for COBOLY..........................................................................237
97. Portion of traceback of Language Environment dump for COBOLY (when compiled with EnterpriseCOBOL V5.1 or later)................................................................................................................................238
98. Parameters, registers, and variables for active routines section of dump for COBOLY........................239
xiv
99. Main COBOL program, COBOL subroutine, and assembler routine.......................................................240
100. COBOL listing for COBOLZ2..................................................................................................................241
101. Listing for ASSEMZ3..............................................................................................................................242
102. Variables section of Language Environment dump for COBOLZ2....................................................... 242
103. Listing for COBOLZ2..............................................................................................................................243
104. Variables section of Language Environment dump for COBOLZ1....................................................... 243
105. Example program that calls SDUMP.................................................................................................... 251
106. Example program that calls SDUMP (continued).................................................................................251
107. Language Environment dump generated using SDUMP...................................................................... 252
108. Sections of the Language Environment dump..................................................................................... 253
109. Example of calling a nonexistent routine.............................................................................................254
110. Sections of the Language Environment dump resulting from a call to a nonexistent routine............255
111. Fortran routine with a divide-by-zero error......................................................................................... 256
112. Language Environment dump from divide-by-zero Fortran example................................................. 257
113. PL/I for MVS & VM routine compiled with LIST and MAP....................................................................263
114. Compiler-generated listings from example PL/I for MVS & VM routine..............................................264
115. Compiler-generated listings from example PL/I for MVS & VM routine (continued)..........................265
116. Traceback section of dump.................................................................................................................. 271
117. Task traceback section......................................................................................................................... 272
118. Task traceback section (continued)..................................................................................................... 272
119. Control blocks for active routines section of the dump (Part 1 of 3).................................................. 273
120. Control blocks for active routines section of the dump (Part 2 of 3).................................................. 274
121. Control blocks for active routines section of the dump (Part 3 of 3).................................................. 274
122. Control blocks associated with the thread section of the dump (Part 1 of 2).................................... 276
123. Control blocks associated with the thread section of the dump (Part 2 of 2).................................... 276
xv
124. Sections of the Language Environment dump (Part 1 of 2).................................................................279
125. Sections of the Language Environment dump (Part 2 of 2).................................................................279
126. Example of calling a nonexistent subroutine.......................................................................................281
127. Sections of the Language Environment dump (Part 1 of 2).................................................................282
128. Sections of the Language Environment dump (Part 2 of 2).................................................................283
129. PL/I for MVS & VM routine with a divide-by-zero error....................................................................... 284
130. Variables from routine SAMPLE............................................................................................................284
131. Object code listing from example PL/I for MVS & VM routine.............................................................284
132. Language Environment dump from example PL/I for MVS & VM routine (Part 1 of 3).......................285
133. Language Environment dump from example PL/I for MVS & VM routine (Part 2 of 3).......................285
134. Language Environment dump from example PL/I for MVS & VM routine (Part 3 of 3).......................286
135. Enterprise PL/I routine compiled with LIST, MAP, and SOURCE.........................................................291
136. Compiler-generated listings from example Enterprise PL/I routine (Part 1 of 4).............................. 292
137. Compiler-generated listings from example Enterprise PL/I routine (Part 2 of 4).............................. 293
138. Compiler-generated listings from example Enterprise PL/I routine (Part 3 of 4).............................. 294
139. Compiler-generated listings from example Enterprise PL/I routine (Part 4 of 4).............................. 295
140. Traceback section of dump (Enterprise PL/I)...................................................................................... 299
141. Control blocks for active routines section of the dump (Enterprise PL/I).......................................... 300
142. Control blocks associated with the thread section of the dump (Enterprise PL/I) (Part 1 of 2)........ 301
143. Control blocks associated with the thread section of the dump (Enterprise PL/I) (Part 2 of 2)........ 302
144. Example of moving a value outside an array range (Enterprise PL/I).................................................303
145. Sections of the Language Environment dump (Part 1 of 2).................................................................304
146. Sections of the Language Environment dump (Part 2 of 2).................................................................305
147. Example of calling a nonexistent subroutine (Enterprise PL/I).......................................................... 306
148. Enterprise PL/I routine with a divide-by-zero error.............................................................................308
xvi
149. Variables from routine SAMPLE (Enterprise PL/I)............................................................................... 309
150. Object code listing from example Enterprise PL/I routine.................................................................. 309
151. Language Environment dump from example Enterprise PL/I routine (Part 1 of 2)............................ 310
152. Language Environment dump from example Enterprise PL/I routine (Part 2 of 2)............................ 311
153. Language Environment traceback written to the CESE transient data queue.................................... 314
154. CICS trace output in the ABBREV format.............................................................................................316
155. CICS trace output in the FULL format.................................................................................................. 317
156. Sample 64-bit options report...............................................................................................................325
157. 64-bit storage report (Part 1 of 4)........................................................................................................327
158. 64-bit storage report (Part 2 of 4)........................................................................................................328
159. 64-bit storage report (Part 3 of 4)........................................................................................................329
160. 64-bit storage report (Part 4 of 4)........................................................................................................329
161. Language Environment condition token...............................................................................................333
162. The C program CELQSAMP (AMODE 64) (Part 1 of 2)..........................................................................342
163. The C program CELQSAMP (AMODE 64) (Part 2 of 2)..........................................................................343
164. The C DLL CELQDLL (AMODE 64)......................................................................................................... 343
165. Example dump using CEE3DMP (AMODE 64) (Part 1 of 9)................................................................. 344
166. Example dump using CEE3DMP (AMODE 64) (Part 2 of 9)................................................................. 345
167. Example dump using CEE3DMP (AMODE 64) (Part 3 of 9)................................................................. 346
168. Example dump using CEE3DMP (AMODE 64) (Part 4 of 9)................................................................. 347
169. Example dump using CEE3DMP (AMODE 64) (Part 5 of 9)................................................................. 348
170. Example dump using CEE3DMP (AMODE 64) (Part 6 of 9)................................................................. 349
171. Example dump using CEE3DMP (AMODE 64) (Part 7 of 9)................................................................. 350
172. Example dump using CEE3DMP (AMODE 64) (Part 8 of 9)................................................................. 351
173. Example dump using CEE3DMP (AMODE 64) (Part 9 of 9)................................................................. 352
xvii
174. Example of formatted output from LEDATA VERBEXIT (AMODE 64) (Part 1 of 10)........................... 363
175. Example of formatted output from LEDATA VERBEXIT (AMODE 64) (Part 2 of 10)........................... 364
176. Example of formatted output from LEDATA VERBEXIT (AMODE 64) (Part 3 of 10)........................... 365
177. Example of formatted output from LEDATA VERBEXIT (AMODE 64) (Part 4 of 10)........................... 366
178. Example of formatted output from LEDATA VERBEXIT (AMODE 64) (Part 5 of 10)........................... 367
179. Example of formatted output from LEDATA VERBEXIT (AMODE 64) (Part 6 of 10)........................... 368
180. Example of formatted output from LEDATA VERBEXIT (AMODE 64) (Part 7 of 10)........................... 369
181. Example of formatted output from LEDATA VERBEXIT (AMODE 64) (Part 8 of 10)........................... 370
182. Example of formatted output from LEDATA VERBEXIT (AMODE 64) (Part 9 of 10)........................... 371
183. Example of formatted output from LEDATA VERBEXIT (AMODE 64) (Part 10 of 10).........................372
184. Example of formatted PTBL output from LEDATA VERBEXIT (Part 1 of 2)......................................... 375
185. Example of formatted PTBL output from LEDATA VERBEXIT (Part 2 of 2)......................................... 376
186. Example formatted detailed heap segment report from LEDATA VERBEXIT (AMODE 64) (Part 1of 8).......................................................................................................................................................... 377
187. Example formatted detailed heap segment report from LEDATA VERBEXIT (AMODE 64) (Part 2of 8).......................................................................................................................................................... 378
188. Example formatted detailed heap segment report from LEDATA VERBEXIT (AMODE 64) (Part 3of 8).......................................................................................................................................................... 379
189. Example formatted detailed heap segment report from LEDATA VERBEXIT (AMODE 64) (Part 4of 8).......................................................................................................................................................... 380
190. Example formatted detailed heap segment report from LEDATA VERBEXIT (AMODE 64) (Part 5of 8).......................................................................................................................................................... 381
191. Example formatted detailed heap segment report from LEDATA VERBEXIT (AMODE 64) (Part 6of 8).......................................................................................................................................................... 382
192. Example formatted detailed heap segment report from LEDATA VERBEXIT (AMODE 64) (Part 7of 8).......................................................................................................................................................... 383
193. Example formatted detailed heap segment report from LEDATA VERBEXIT (AMODE 64) (Part 8of 8).......................................................................................................................................................... 384
194. Example formatted detailed heap pool report from LEDATA VERBEXIT (AMODE 64) (Part 1 of 5)...387
195. Example formatted detailed heap pool report from LEDATA VERBEXIT (AMODE 64) (Part 2 of 5)...388
xviii
196. Example formatted detailed heap pool report from LEDATA VERBEXIT (AMODE 64) (Part 3 of 5)...389
197. Example formatted detailed heap pool report from LEDATA VERBEXIT (AMODE 64) (Part 4 of 5)...390
198. Example formatted detailed heap pool report from LEDATA VERBEXIT (AMODE 64) (Part 5 of 5)...391
199. Example of formatted detailed heap pools trace report from LEDATA VERBEXIT (AMODE 64)(Part 1 of 5).............................................................................................................................................. 392
200. Example of formatted detailed heap pools trace report from LEDATA VERBEXIT (AMODE 64)(Part 2 of 5).............................................................................................................................................. 393
201. Example of formatted detailed heap pools trace report from LEDATA VERBEXIT (AMODE 64)(Part 3 of 5).............................................................................................................................................. 394
202. Example of formatted detailed heap pools trace report from LEDATA VERBEXIT (AMODE 64)(Part 4 of 5).............................................................................................................................................. 395
203. Example of formatted detailed heap pools trace report from LEDATA VERBEXIT (AMODE 64)(Part 5 of 5).............................................................................................................................................. 396
204. Example of formatted C/C++ output from LEDATA VERBEXIT (AMODE 64) (Part 1 of 10)................ 397
205. Example of formatted C/C++ output from LEDATA VERBEXIT (AMODE 64) (Part 2 of 10)................ 398
206. Example of formatted C/C++ output from LEDATA VERBEXIT (AMODE 64) (Part 3 of 10)................ 399
207. Example of formatted C/C++ output from LEDATA VERBEXIT (AMODE 64) (Part 4 of 10)................ 400
208. Example of formatted C/C++ output from LEDATA VERBEXIT (AMODE 64) (Part 5 of 10)................ 401
209. Example of formatted C/C++ output from LEDATA VERBEXIT (AMODE 64) (Part 6 of 10)................ 402
210. Example of formatted C/C++ output from LEDATA VERBEXIT (AMODE 64) (Part 7 of 10)................ 403
211. Example of formatted C/C++ output from LEDATA VERBEXIT (AMODE 64) (Part 8 of 10)................ 404
212. Example of formatted C/C++ output from LEDATA VERBEXIT (AMODE 64) (Part 9 of 10)................ 405
213. Example of formatted C/C++ output from LEDATA VERBEXIT (AMODE 64) (Part 10 of 10)..............406
214. Example of formatted PL/I output from LEDATA VERBEXIT (AMODE 64) (Part 1 of 6)..................... 408
215. Example of formatted PL/I output from LEDATA VERBEXIT (AMODE 64) (Part 2 of 6)..................... 409
216. Example of formatted PL/I output from LEDATA VERBEXIT (AMODE 64) (Part 3 of 6)..................... 410
217. Example of formatted PL/I output from LEDATA VERBEXIT (AMODE 64) (Part 4 of 6)..................... 411
218. Example of formatted PL/I output from LEDATA VERBEXIT (AMODE 64) (Part 5 of 6)..................... 412
xix
219. Example of formatted Pl/I output from LEDATA VERBEXIT (AMODE 64) (Part 6 of 6)...................... 412
220. Example of formatted AUTH output from LEDATA VERBEXIT (AMODE 64) (Part 1 of 4)................... 414
221. Example of formatted AUTH output from LEDATA VERBEXIT (AMODE 64) (Part 2 of 4)................... 415
222. Example of formatted AUTH output from LEDATA VERBEXIT (AMODE 64) (Part 3 of 4)................... 416
223. Example of formatted AUTH output from LEDATA VERBEXIT (AMODE 64) (Part 4 of 4)................... 417
224. CAA formatted by the CBFORMAT IPCS command............................................................................. 420
225. Format of the trace table entry (AMODE 64)....................................................................................... 422
226. Trace table in dump output (LE=1 suboption)..................................................................................... 430
227. __amrc structure (AMODE 64)............................................................................................................. 432
228. __amrc2 structure (AMODE 64)........................................................................................................... 432
229. Example of a routine using perror() (AMODE 64)................................................................................ 437
230. Example of a routine using __errno2() (AMODE 64)............................................................................438
231. Sample output of routine using __errno2() (AMODE 64).................................................................... 438
232. Example of a routine using _EDC_ADD_ERRNO2 (AMODE 64)...........................................................438
233. Sample output of a routine using _EDC_ADD_ERRNO2 (AMODE 64).................................................438
234. Example of a routine using __err2ad() in combination with __errno2() (AMODE 64)........................ 439
235. Sample output of routine using __err2ad() in combination with __errno2() (AMODE 64).................439
236. Example code for structure variables (AMODE 64)............................................................................. 441
237. Example of aggregate map (AMODE 64)..............................................................................................441
238. Example C routine using cdump() to generate a dump (AMODE 64) (Part 1 of 2)..............................443
239. Example C routine using cdump() to generate a dump (AMODE 64) (Part 2 of 2)..............................443
240. Fetched module for C routine (AMODE 64)..........................................................................................444
241. Example C++ routine with protection exception generating a dump (AMODE 64)............................ 444
242. Template file STACK.C (AMODE 64)..................................................................................................... 444
243. Header file STACK.H (AMODE 64)........................................................................................................ 445
xx
244. Example dump from sample C routine (AMODE 64) (Part 1 of 4).......................................................446
245. Example dump from sample C routine (AMODE 64) (Part 2 of 4).......................................................447
246. Example dump from sample C routine (AMODE 64) (Part 3 of 4).......................................................448
247. Example dump from sample C routine (AMODE 64) (Part 4 of 4).......................................................449
248. Trace table with XPLINK trace table entries 5 and 6 (AMODE 64)..................................................... 451
249. Trace table with XPLINK trace table entries 5 and 6 (AMODE 64)..................................................... 452
250. C routine with a divide-by-zero error (AMODE 64).............................................................................. 453
251. Sections of the dump from example C/C++ routine (AMODE 64) (Part 1 of 2)...................................454
252. Sections of the dump from example C/C++ routine (AMODE 64) (Part 2 of 2)...................................454
253. Pseudo assembly listing (AMODE 64) (Part 1 of 3)............................................................................. 455
254. Pseudo assembly listing (AMODE 64) (Part 2 of 3)............................................................................. 456
255. Pseudo assembly listing (AMODE 64) (Part 3 of 3)............................................................................. 457
256. C/C++ CAA information in dump (AMODE 64)..................................................................................... 457
257. Writable static map (AMODE 64)......................................................................................................... 457
258. IPCS storage display of the writeable static area (AMODE 64)...........................................................458
259. C/C++ example of calling a nonexistent subroutine (AMODE 64).......................................................458
260. Sections of the dump from example C routine (AMODE 64) (Part 1 of 3)...........................................459
261. Sections of the dump from example C routine (AMODE 64) (Part 2 of 3)...........................................460
262. Sections of the dump from example C routine (AMODE 64) (Part 3 of 3)...........................................460
263. Pseudo assembly listing (AMODE 64) (Part 1 of 2)............................................................................. 461
264. Pseudo assembly listing (AMODE 64) (Part 2 of 2)............................................................................. 461
265. Writable static map (AMODE 64)......................................................................................................... 462
266. IPCS storage display of the writeable static area (AMODE 64)...........................................................462
267. IPCS panel for entering data set information (AMODE 64)................................................................. 463
268. Storage report generated by __uheapreport() (AMODE 64)............................................................... 467
xxi
269. C PPA1...................................................................................................................................................478
270. Nonconforming entry point type with sample dump...........................................................................478
xxii
Tables
1. How to use z/OS Language Environment publications............................................................................xxvii
2. Syntax examples....................................................................................................................................... xxix
3. TEST suboptions to simplify debugging........................................................................................................3
4. C/C++ compiler options to simplify runtime debugging...............................................................................4
5. COBOL compiler options for runtime debugging..........................................................................................5
6. Fortran compiler options for runtime debugging .........................................................................................5
7. PL/I compiler options for debugging ........................................................................................................... 6
8. Enterprise PL/I for z/OS compiler options for debugging............................................................................ 7
9. Language Environment runtime options for debugging............................................................................... 8
10. Storage report fields that display stack storage statistics.......................................................................17
11. Storage report fields that display heap storage statistics....................................................................... 18
12. Callable services that modify condition handling.................................................................................... 20
13. Runtime options that modify condition handling.....................................................................................21
14. Callable services that can convert condition tokens to routine variables, messages, or signaledconditions................................................................................................................................................... 25
15. Common error symptoms, possible causes, and programmer responses..............................................28
16. CEE3DMP options..................................................................................................................................... 34
17. TERMTHDACT suboptions, level of information, and destinations..........................................................36
18. Condition handling of 0Cx abends............................................................................................................39
19. Contents of the Language Environment dump.........................................................................................55
20. Description of CAA fields.......................................................................................................................... 65
21. Contents of the LEDATA VERBEXIT formatted output...........................................................................103
22. Contents of the Heap report sections of LEDATA output.......................................................................110
xxiii
23. Contents of heap pools report sections of LEDATA output....................................................................115
24. Contents of heap pools trace section of LEDATA output....................................................................... 117
25. Contents of C/C++-specific sections of LEDATA output........................................................................ 136
26. Contents of COBOL-specific sections of LEDATA Output.......................................................................139
27. Contents of COBOL-specific sections of LEDATA Output (Enterprise COBOL V5.1 and laterreleases)...................................................................................................................................................141
28. Contents of PL/I-specific sections of LEDATA output............................................................................147
29. Language Environment Control blocks that can be individually formatted.......................................... 148
30. TERMTHDACT runtime option settings and dump contents produced.................................................150
31. LE=1 entry records..................................................................................................................................153
32. LE=2 entry records..................................................................................................................................153
33. Format of the mutex/CV/latch records...................................................................................................158
34. LE=8 entry records..................................................................................................................................159
35. LE=20 entry records............................................................................................................................... 159
36. __last_op values and diagnosis information..........................................................................................166
37. Finding the WSA base address............................................................................................................... 172
38. Contents of the COBOL sections of Language Environment..................................................................186
39. Contents of XPLINK information in a Language Environment dump.....................................................195
40. Compiler-generated COBOL listings and their contents........................................................................226
41. Compiler-generated Fortran listings and their contents....................................................................... 246
42. Understanding the Language Environment traceback table................................................................. 253
43. Compiler-generated PL/I for MVS & VM listings and their contents..................................................... 262
44. Typical comments in a PL/I for MVS & VM static storage listing........................................................... 265
45. Comments in a PL/I for MVS & VM object code listing.......................................................................... 266
46. PL/I for MVS & VM mnemonics...............................................................................................................267
47. Compiler-generated PL/I listings and their contents............................................................................ 290
xxiv
48. Finding data when Language Environment returns a nonzero return code.......................................... 318
49. Finding data when Language Environment abends internally...............................................................318
50. Finding data when Language Environment abends from an EXEC CICS command............................. 318
51. Common error symptoms, possible causes, and programmer responses............................................335
52. TERMTHDACT suboptions, level of information, and destinations....................................................... 339
53. Contents of the Language Environment dump - AMODE 64..................................................................352
54. Contents of the Language Environment LEDATA VERBEXIT formatted output (AMODE 64)............... 373
55. Contents of Heap report sections of the LEDATA output (AMODE 64)..................................................385
56. Contents of the heap pool report sections of the LEDATA output (AMODE 64)....................................391
57. Contents of a detailed heap pools trace report from LEDATA VERBEXIT (AMODE 64)........................ 396
58. Contents of C/C++-specific sections of the LEDATA output (AMODE 64)............................................. 406
59. Contents of PL/I-specific sections of the LEDATA output (AMODE 64)................................................ 413
60. Contents of AUTH LEDATA VERBEXIT formatted output (AMODE 64)..................................................418
61. Language Environment control blocks that can be individually formatted...........................................420
62. Preinitalized Environments for Authorized Programs control blocks that can be individuallyformatted..................................................................................................................................................420
63. TERMTHDACT runtime option settings and dump contents produced (AMODE 64)............................421
64. LE=1 entry records (AMODE 64)............................................................................................................ 424
65. LE=2 entry records (AMODE 64)............................................................................................................ 424
66. Format of the mutex/CV/latch records (AMODE 64)..............................................................................428
67. LE=8 entry records (AMODE 64)............................................................................................................ 429
68. __last_op values and diagnosis information (AMODE 64).................................................................... 434
69. Contents of the LEDATA VERBEXIT formatted output...........................................................................474
70. Problem resolution documentation requirements................................................................................ 480
xxv

xxvi

About this document
z/OS Language Environment Debugging Guide provides assistance with detecting, finding, and fixingprogramming errors that occur during run time under Language Environment®. It can help you establish adebugging process to analyze data and narrow the scope and location of where an error might haveoccurred. You can read about how to prepare a routine for debugging, how to classify errors, and how touse the debugging facilities Language Environment provides. Also included are chapters on debuggingHLL-specific routines and routines that run under CICS®. Debugging for AMODE 64 applications is coveredin separate chapters, corresponding to the topics and contents that were provided.
This book is intended for application programmers who are interested in techniques for debuggingruntime programs. You should be familiar with:
• Language Environment.• Appropriate languages that use the accepted compilers.• Program storage concepts.
Using your documentationThe publications provided with Language Environment are designed to help you:
• Manage the runtime environment for applications generated with a Language Environment-conformingcompiler.
• Write applications that use the Language Environment callable services.• Develop interlanguage communication applications.• Customize Language Environment.• Debug problems in applications that run with Language Environment.• Migrate your high-level language applications to Language Environment.
Language programming information is provided in the supported high-level language programmingmanuals, which provide language definition, library function syntax and semantics, and programmingguidance information.
Each publication helps you perform different tasks, some of which are listed in Table 1 on page xxvii.
Table 1. How to use z/OS Language Environment publications
To … Use …
Evaluate Language Environment z/OS Language Environment Concepts Guide
Plan for Language Environment z/OS Language Environment Concepts Guide
z/OS Language Environment Runtime ApplicationMigration Guide
Install Language Environment z/OS Program Directory in the z/OS Internet library(www.ibm.com/servers/resourcelink/svc00100.nsf/pages/zosInternetLibrary)
Customize Language Environment z/OS Language Environment Customization
Understand Language Environmentprogram models and concepts
z/OS Language Environment Concepts Guide
z/OS Language Environment Programming Guide
z/OS Language Environment Programming Guide for 64-bit Virtual Addressing Mode
© Copyright IBM Corp. 1991, 2020 xxvii
Table 1. How to use z/OS Language Environment publications (continued)
To … Use …
Find syntax for Language Environmentruntime options and callable services
z/OS Language Environment Programming Reference
Develop applications that run withLanguage Environment
z/OS Language Environment Programming Guide andyour language programming guide
Debug applications that run with LanguageEnvironment, diagnose problems withLanguage Environment
z/OS Language Environment Debugging Guide
Get details on runtime messages z/OS Language Environment Runtime Messages
Develop interlanguage communication (ILC)applications
z/OS Language Environment Writing InterlanguageCommunication Applications and your languageprogramming guide
Migrate applications to LanguageEnvironment
z/OS Language Environment Runtime ApplicationMigration Guide and the migration guide for eachLanguage Environment-enabled language
How to read syntax diagramsThis section describes how to read syntax diagrams. It defines syntax diagram symbols, items that maybe contained within the diagrams (keywords, variables, delimiters, operators, fragment references,operands) and provides syntax examples that contain these items.
Syntax diagrams pictorially display the order and parts (options and arguments) that comprise acommand statement. They are read from left to right and from top to bottom, following the main path ofthe horizontal line.
For users accessing the IBM Documentation using a screen reader, syntax diagrams are provided indotted decimal format.
SymbolsThe following symbols may be displayed in syntax diagrams:Symbol
Definition►►───
Indicates the beginning of the syntax diagram.───►
Indicates that the syntax diagram is continued to the next line.►───
Indicates that the syntax is continued from the previous line.───►◄
Indicates the end of the syntax diagram.
Syntax itemsSyntax diagrams contain many different items. Syntax items include:
• Keywords - a command name or any other literal information.• Variables - variables are italicized, appear in lowercase, and represent the name of values you can
supply.
xxviii About this document
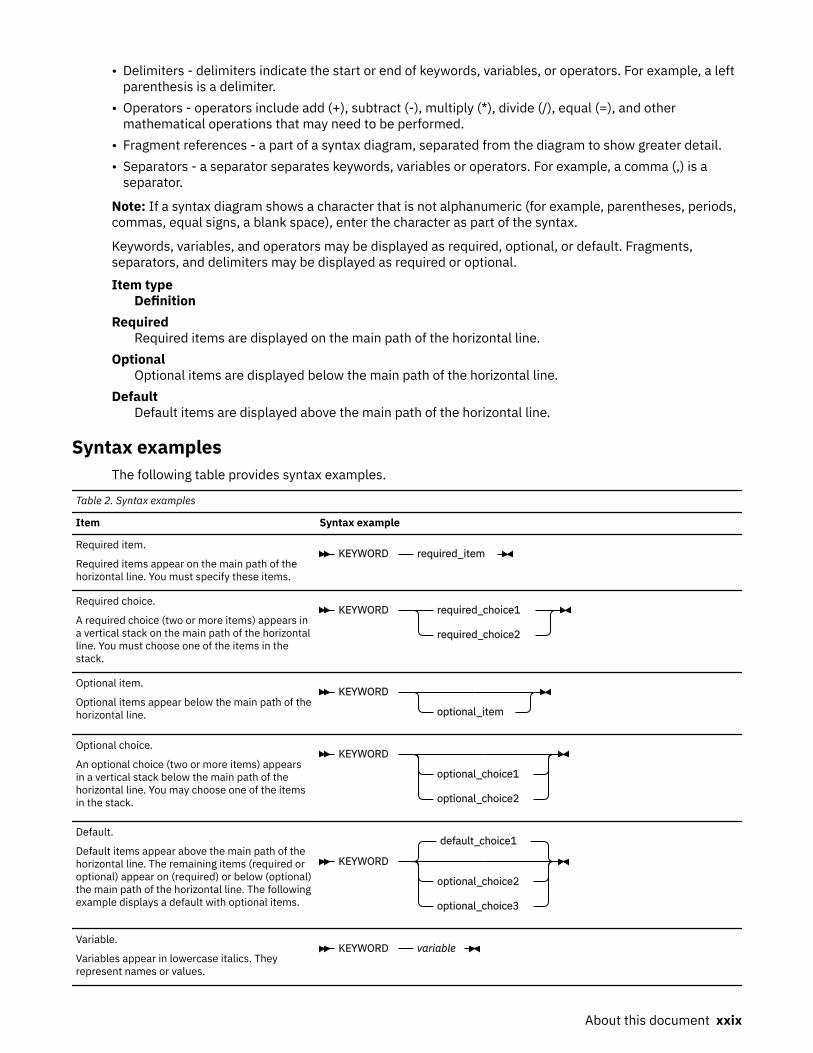
• Delimiters - delimiters indicate the start or end of keywords, variables, or operators. For example, a leftparenthesis is a delimiter.
• Operators - operators include add (+), subtract (-), multiply (*), divide (/), equal (=), and othermathematical operations that may need to be performed.
• Fragment references - a part of a syntax diagram, separated from the diagram to show greater detail.• Separators - a separator separates keywords, variables or operators. For example, a comma (,) is a
separator.
Note: If a syntax diagram shows a character that is not alphanumeric (for example, parentheses, periods,commas, equal signs, a blank space), enter the character as part of the syntax.
Keywords, variables, and operators may be displayed as required, optional, or default. Fragments,separators, and delimiters may be displayed as required or optional.Item type
DefinitionRequired
Required items are displayed on the main path of the horizontal line.Optional
Optional items are displayed below the main path of the horizontal line.Default
Default items are displayed above the main path of the horizontal line.
Syntax examplesThe following table provides syntax examples.
Table 2. Syntax examples
Item Syntax example
Required item.
Required items appear on the main path of thehorizontal line. You must specify these items.
KEYWORD required_item
Required choice.
A required choice (two or more items) appears ina vertical stack on the main path of the horizontalline. You must choose one of the items in thestack.
KEYWORD required_choice1
required_choice2
Optional item.
Optional items appear below the main path of thehorizontal line.
KEYWORD
optional_item
Optional choice.
An optional choice (two or more items) appearsin a vertical stack below the main path of thehorizontal line. You may choose one of the itemsin the stack.
KEYWORD
optional_choice1
optional_choice2
Default.
Default items appear above the main path of thehorizontal line. The remaining items (required oroptional) appear on (required) or below (optional)the main path of the horizontal line. The followingexample displays a default with optional items.
KEYWORD
default_choice1
optional_choice2
optional_choice3
Variable.
Variables appear in lowercase italics. Theyrepresent names or values.
KEYWORD variable
About this document xxix
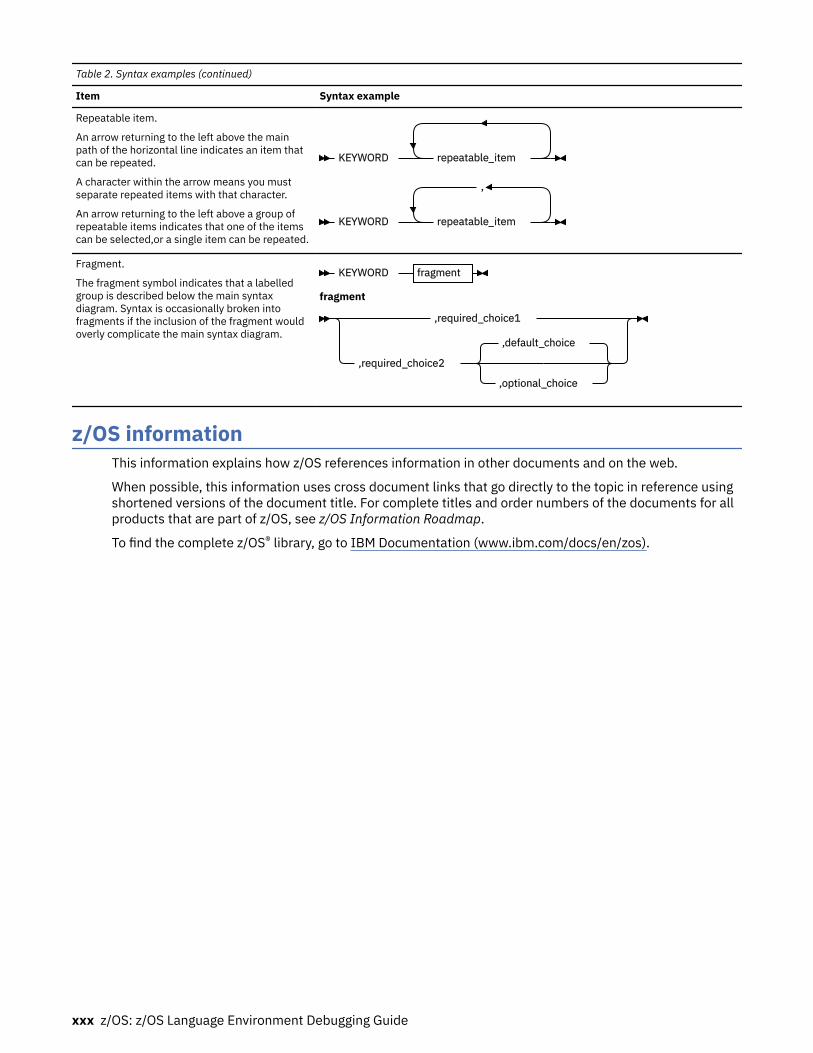
Table 2. Syntax examples (continued)
Item Syntax example
Repeatable item.
An arrow returning to the left above the mainpath of the horizontal line indicates an item thatcan be repeated.
A character within the arrow means you mustseparate repeated items with that character.
An arrow returning to the left above a group ofrepeatable items indicates that one of the itemscan be selected,or a single item can be repeated.
KEYWORD repeatable_item
KEYWORD
,
repeatable_item
Fragment.
The fragment symbol indicates that a labelledgroup is described below the main syntaxdiagram. Syntax is occasionally broken intofragments if the inclusion of the fragment wouldoverly complicate the main syntax diagram.
KEYWORD fragment
fragment
,required_choice1
,required_choice2
,default_choice
,optional_choice
z/OS informationThis information explains how z/OS references information in other documents and on the web.
When possible, this information uses cross document links that go directly to the topic in reference usingshortened versions of the document title. For complete titles and order numbers of the documents for allproducts that are part of z/OS, see z/OS Information Roadmap.
To find the complete z/OS® library, go to IBM Documentation (www.ibm.com/docs/en/zos).
xxx z/OS: z/OS Language Environment Debugging Guide
How to send your comments to IBM
We invite you to submit comments about the z/OS product documentation. Your valuable feedback helpsto ensure accurate and high-quality information.
Important: If your comment regards a technical question or problem, see instead “If you have a technicalproblem” on page xxxi.
Submit your feedback by using the appropriate method for your type of comment or question:Feedback on z/OS function
If your comment or question is about z/OS itself, submit a request through the IBM RFE Community(www.ibm.com/developerworks/rfe/).
Feedback on IBM® Documentation functionIf your comment or question is about the IBM Documentation functionality, for example searchcapabilities or how to arrange the browser view, send a detailed email to IBM Documentation Supportat [email protected].
Feedback on the z/OS product documentation and contentIf your comment is about the information that is provided in the z/OS product documentation library,send a detailed email to [email protected]. We welcome any feedback that you have, includingcomments on the clarity, accuracy, or completeness of the information.
To help us better process your submission, include the following information:
• Your name, company/university/institution name, and email address• The following deliverable title and order number: z/OS Language Environment Debugging Guide,
GA32-0908-50• The section title of the specific information to which your comment relates• The text of your comment.
When you send comments to IBM, you grant IBM a nonexclusive authority to use or distribute thecomments in any way appropriate without incurring any obligation to you.
IBM or any other organizations use the personal information that you supply to contact you only about theissues that you submit.
If you have a technical problemIf you have a technical problem or question, do not use the feedback methods that are provided forsending documentation comments. Instead, take one or more of the following actions:
• Go to the IBM Support Portal (support.ibm.com).• Contact your IBM service representative.• Call IBM technical support.
© Copyright IBM Corp. 1991, 2020 xxxi

xxxii z/OS: z/OS Language Environment Debugging Guide
Summary of changes
This information includes terminology, maintenance, and editorial changes. Technical changes oradditions to the text and illustrations for the current edition are indicated by a vertical line to the left ofthe change.
Summary of changes for z/OS Language Environment DebuggingGuide for Version 2 Release 4 (V2R4)
NewThe following content is new.June 2021 refresh
With APAR PH28966, you can debug applications that use Language Environment AMODE 31 andAMODE 64 interoperability. For more information, see Part 4, “Debugging Language EnvironmentAMODE 31 and AMODE 64 interoperability applications,” on page 469.
December 2020 refreshFor APAR 392032, the IPCS VERBEXIT LEDATA output was updated. See “Understanding theLanguage Environment IPCS VERBEXIT LEDATA output” on page 362.
ChangedThe following content is changed.Prior to December 2020 refresh
• “What Language Environment supports” on page xxxv was updated to include IBM ToolKit for Swifton z/OS in the list of compiler products.
• To enhance the security of programs, certain memory regions such as the library heap are nowmarked non-executable by default. The LEDATA VERBEXIT output was updated. For moreinformation, see “Understanding the Language Environment IPCS VERBEXIT LEDATA output” onpage 88.
• These report headers were updated for V2R3:
– The options report header (Figure 1 on page 10)– The storage report header (Figure 2 on page 12)– The options report for AMODE 64 applications (Figure 156 on page 325)– The storage report for AMODE 64 applications (Figure 157 on page 327)
DeletedThe following content is deleted.
• None.
Summary of changes for Language Environment for z/OS Version 2Release 3 (V2R3)
The most recent updates are listed at the top of the section.
© Copyright IBM Corp. 1991, 2020 xxxiii
NewBecause APAR PI91583 added support for lengths that are longer than 7 bytes, the service portion ofTraceback for both CEEDUMP and LEDATA Verbexit was updated. See “Sections of the LanguageEnvironment dump” on page 54 and “Sections of the Language Environment LEDATA VERBEXITformatted output” on page 103.
Support was provided for system times beyond 2038/2042. The following sections contain newinformation:
• Chapter 3, “Using Language Environment debugging facilities,” on page 33
– “Understanding the C/C++-specific LEDATA output” on page 118• Chapter 12, “Using Language Environment AMODE 64 debugging facilities,” on page 339
– “Understanding the C/C++-specific LEDATA output” on page 396
Support was added for stack guard. The following section contains new information for this support:
• “Common Anchor Area” on page 64
Language Environment now enforces the same security rules that are enforced by ABEND dumpprocessing. For more information, see the new section “Controlling access to CEEDUMPs and DYNDUMPs”on page 149.
Support was added to allow vector applications to run under ERTLI CICS. The following section containsnew information:
• “Common Anchor Area” on page 64
Changed• These report headers were updated for V2R3:
– The options report header (Figure 1 on page 10)– The storage report header (Figure 2 on page 12)– The options report for AMODE 64 applications (Figure 156 on page 325)– The storage report for AMODE 64 applications (Figure 157 on page 327)
• “MEMCHECK VHM memory leak analysis tool” on page 218 now indicates that the trace is limited to1024 entries and will wrap.
• Various updates were made to replace IBM Debug Tool for z/OS with IBM z/OS Debugger.
Summary of changes for Language Environment for z/OS Version 2Release 2 (V2R2)
ChangedThe following report headers were updated for V2R2:
• The options report header (Figure 1 on page 10)• The storage report header (Figure 2 on page 12)• The options report for AMODE 64 applications (Figure 156 on page 325)• The storage report for AMODE 64 applications (Figure 157 on page 327)
xxxiv z/OS: z/OS Language Environment Debugging Guide
What Language Environment supports
Language Environment supports z/OS (5650-ZOS).
IBM Language Environment (also called Language Environment) provides common services and language-specific routines in a single runtime environment for C, C++, COBOL, Fortran (z/OS only; no support forz/OS UNIX System Services or CICS), PL/I, and assembler applications. It offers consistent andpredictable results for language applications, independent of the language in which they are written.
Language Environment is the prerequisite runtime environment for applications that are generated withthe following IBM compiler products:
• z/OS XL C/C++ (feature of z/OS)• z/OS C/C++• OS/390® C/C++• C/C++ for MVS/ESA• C/C++ for z/VM®
• XL C/C++ for z/VM• AD/Cycle C/370• IBM Toolkit for Swift on z/OS• VisualAge® for Java™, Enterprise Edition for OS/390• Enterprise COBOL for z/OS• Enterprise COBOL for z/OS and OS/390• COBOL for OS/390 & VM• COBOL for MVS™ & VM (formerly COBOL/370)• Enterprise PL/I for z/OS• Enterprise PL/I for z/OS and OS/390• VisualAge PL/I• PL/I for MVS & VM (formerly PL/I MVS & VM)• VS FORTRAN and FORTRAN IV (in compatibility mode)
Although not all compilers listed are currently supported, Language Environment supports the compiledobjects that they created.
Language Environment supports, but is not required for, an interactive debug tool for debuggingapplications in your native z/OS environment. Debug Tool is also available as a stand-alone product aswell as Debug Tool Utilities and Advanced Functions. For more information, see the IBM z/OS Debugger(developer.ibm.com/mainframe/products/ibm-zos-debugger).
Language Environment supports, but is not required for, VS FORTRAN Version 2 compiled code (z/OSonly).
Language Environment consists of the common execution library (CEL) and the runtime libraries for C/C++, COBOL, Fortran, and PL/I.
For more information about IBM Toolkit for Swift on z/OS, program number 5655-SFT, see the productdocumentation.
For more information about VisualAge for Java, Enterprise Edition for OS/390, program number 5655-JAV, see the product documentation.
© Copyright IBM Corp. 1991, 2020 xxxv

xxxvi z/OS: z/OS Language Environment Debugging Guide
Part 1. Introduction to debugging in LanguageEnvironment
This part provides information about options and features you can use to prepare your routine fordebugging. It describes some common errors that occur in routines and provides methods of generatingdumps to help you get the information you need to debug your routine.
© Copyright IBM Corp. 1991, 2020 1

2 z/OS: z/OS Language Environment Debugging Guide
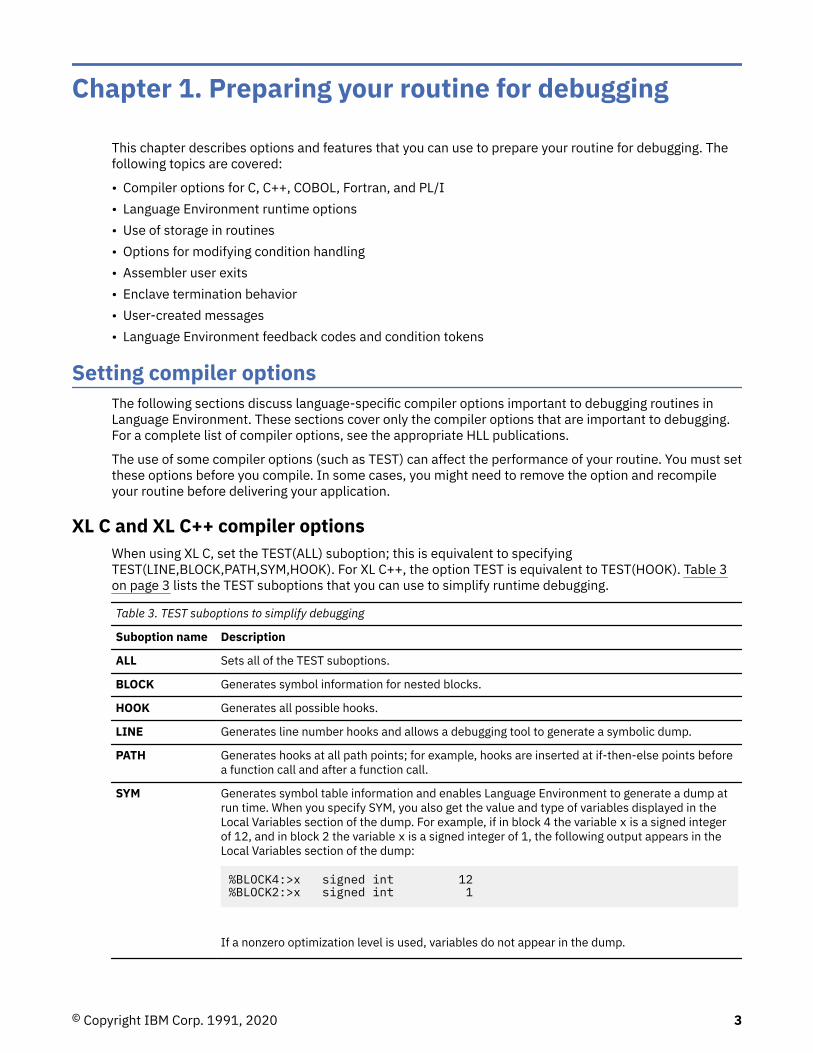
Chapter 1. Preparing your routine for debugging
This chapter describes options and features that you can use to prepare your routine for debugging. Thefollowing topics are covered:
• Compiler options for C, C++, COBOL, Fortran, and PL/I• Language Environment runtime options• Use of storage in routines• Options for modifying condition handling• Assembler user exits• Enclave termination behavior• User-created messages• Language Environment feedback codes and condition tokens
Setting compiler optionsThe following sections discuss language-specific compiler options important to debugging routines inLanguage Environment. These sections cover only the compiler options that are important to debugging.For a complete list of compiler options, see the appropriate HLL publications.
The use of some compiler options (such as TEST) can affect the performance of your routine. You must setthese options before you compile. In some cases, you might need to remove the option and recompileyour routine before delivering your application.
XL C and XL C++ compiler optionsWhen using XL C, set the TEST(ALL) suboption; this is equivalent to specifyingTEST(LINE,BLOCK,PATH,SYM,HOOK). For XL C++, the option TEST is equivalent to TEST(HOOK). Table 3on page 3 lists the TEST suboptions that you can use to simplify runtime debugging.
Table 3. TEST suboptions to simplify debugging
Suboption name Description
ALL Sets all of the TEST suboptions.
BLOCK Generates symbol information for nested blocks.
HOOK Generates all possible hooks.
LINE Generates line number hooks and allows a debugging tool to generate a symbolic dump.
PATH Generates hooks at all path points; for example, hooks are inserted at if-then-else points beforea function call and after a function call.
SYM Generates symbol table information and enables Language Environment to generate a dump atrun time. When you specify SYM, you also get the value and type of variables displayed in theLocal Variables section of the dump. For example, if in block 4 the variable x is a signed integerof 12, and in block 2 the variable x is a signed integer of 1, the following output appears in theLocal Variables section of the dump:
%BLOCK4:>x signed int 12%BLOCK2:>x signed int 1
If a nonzero optimization level is used, variables do not appear in the dump.
© Copyright IBM Corp. 1991, 2020 3
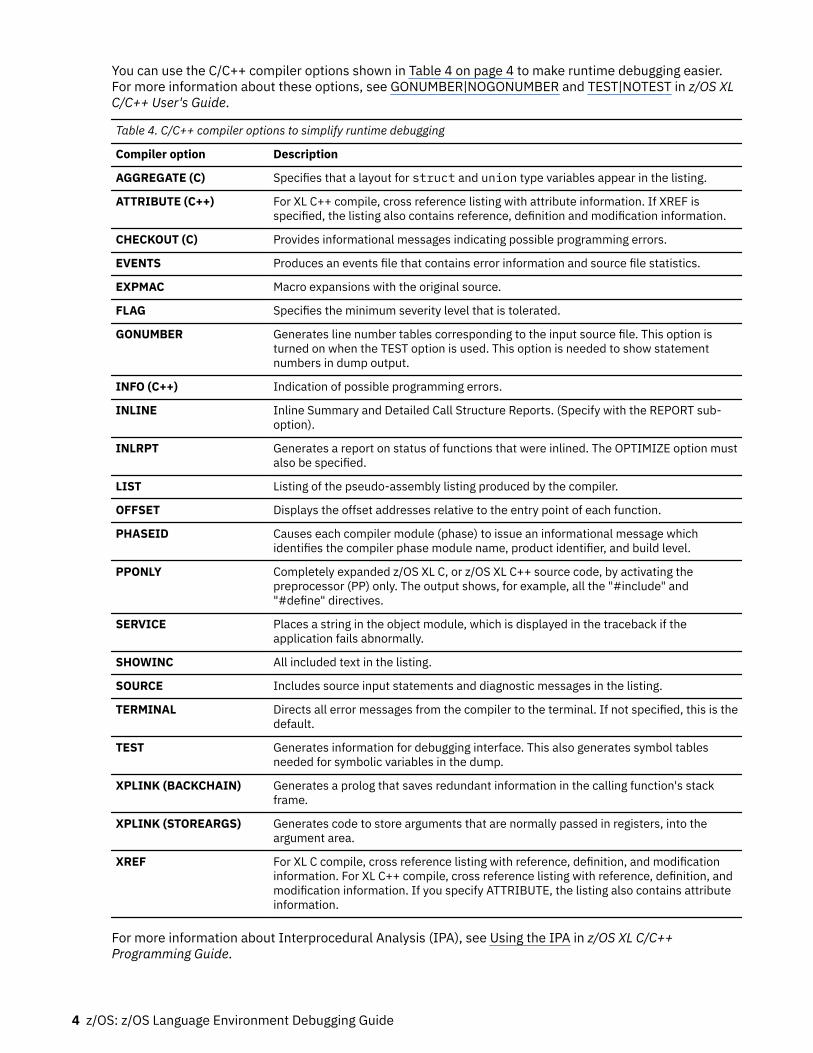
You can use the C/C++ compiler options shown in Table 4 on page 4 to make runtime debugging easier.For more information about these options, see GONUMBER|NOGONUMBER and TEST|NOTEST in z/OS XLC/C++ User's Guide.
Table 4. C/C++ compiler options to simplify runtime debugging
Compiler option Description
AGGREGATE (C) Specifies that a layout for struct and union type variables appear in the listing.
ATTRIBUTE (C++) For XL C++ compile, cross reference listing with attribute information. If XREF isspecified, the listing also contains reference, definition and modification information.
CHECKOUT (C) Provides informational messages indicating possible programming errors.
EVENTS Produces an events file that contains error information and source file statistics.
EXPMAC Macro expansions with the original source.
FLAG Specifies the minimum severity level that is tolerated.
GONUMBER Generates line number tables corresponding to the input source file. This option isturned on when the TEST option is used. This option is needed to show statementnumbers in dump output.
INFO (C++) Indication of possible programming errors.
INLINE Inline Summary and Detailed Call Structure Reports. (Specify with the REPORT sub-option).
INLRPT Generates a report on status of functions that were inlined. The OPTIMIZE option mustalso be specified.
LIST Listing of the pseudo-assembly listing produced by the compiler.
OFFSET Displays the offset addresses relative to the entry point of each function.
PHASEID Causes each compiler module (phase) to issue an informational message whichidentifies the compiler phase module name, product identifier, and build level.
PPONLY Completely expanded z/OS XL C, or z/OS XL C++ source code, by activating thepreprocessor (PP) only. The output shows, for example, all the "#include" and"#define" directives.
SERVICE Places a string in the object module, which is displayed in the traceback if theapplication fails abnormally.
SHOWINC All included text in the listing.
SOURCE Includes source input statements and diagnostic messages in the listing.
TERMINAL Directs all error messages from the compiler to the terminal. If not specified, this is thedefault.
TEST Generates information for debugging interface. This also generates symbol tablesneeded for symbolic variables in the dump.
XPLINK (BACKCHAIN) Generates a prolog that saves redundant information in the calling function's stackframe.
XPLINK (STOREARGS) Generates code to store arguments that are normally passed in registers, into theargument area.
XREF For XL C compile, cross reference listing with reference, definition, and modificationinformation. For XL C++ compile, cross reference listing with reference, definition, andmodification information. If you specify ATTRIBUTE, the listing also contains attributeinformation.
For more information about Interprocedural Analysis (IPA), see Using the IPA in z/OS XL C/C++Programming Guide.
4 z/OS: z/OS Language Environment Debugging Guide
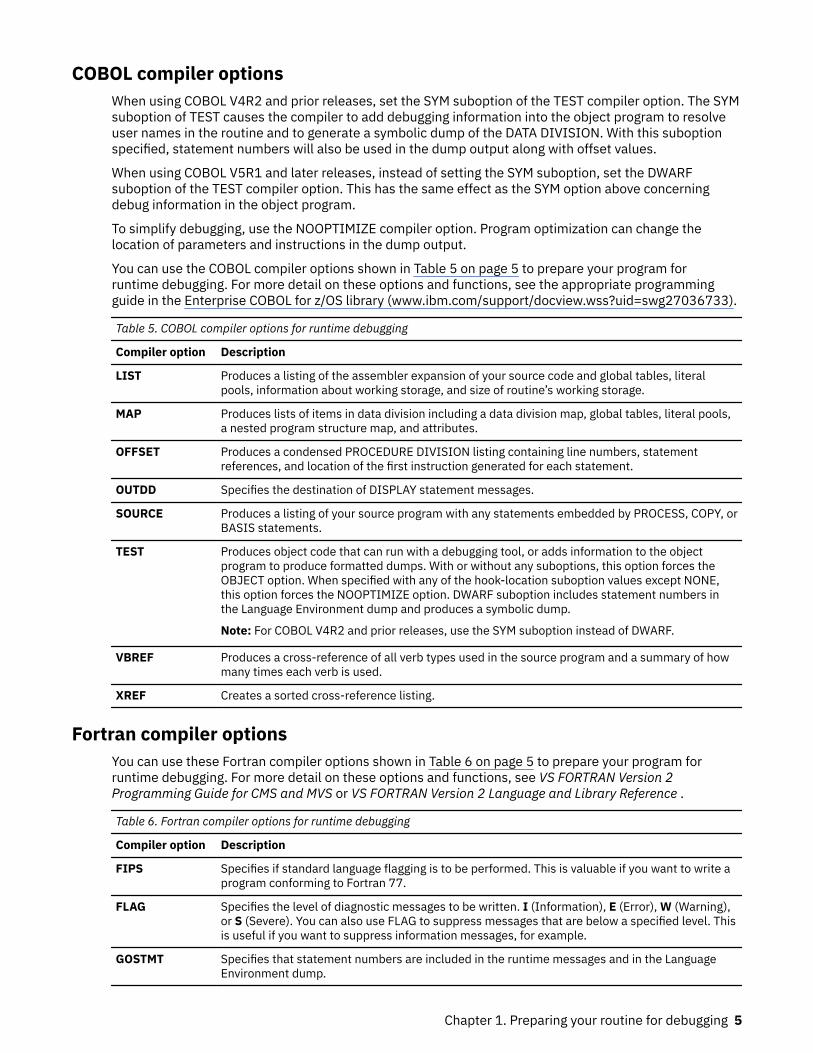
COBOL compiler optionsWhen using COBOL V4R2 and prior releases, set the SYM suboption of the TEST compiler option. The SYMsuboption of TEST causes the compiler to add debugging information into the object program to resolveuser names in the routine and to generate a symbolic dump of the DATA DIVISION. With this suboptionspecified, statement numbers will also be used in the dump output along with offset values.
When using COBOL V5R1 and later releases, instead of setting the SYM suboption, set the DWARFsuboption of the TEST compiler option. This has the same effect as the SYM option above concerningdebug information in the object program.
To simplify debugging, use the NOOPTIMIZE compiler option. Program optimization can change thelocation of parameters and instructions in the dump output.
You can use the COBOL compiler options shown in Table 5 on page 5 to prepare your program forruntime debugging. For more detail on these options and functions, see the appropriate programmingguide in the Enterprise COBOL for z/OS library (www.ibm.com/support/docview.wss?uid=swg27036733).
Table 5. COBOL compiler options for runtime debugging
Compiler option Description
LIST Produces a listing of the assembler expansion of your source code and global tables, literalpools, information about working storage, and size of routine’s working storage.
MAP Produces lists of items in data division including a data division map, global tables, literal pools,a nested program structure map, and attributes.
OFFSET Produces a condensed PROCEDURE DIVISION listing containing line numbers, statementreferences, and location of the first instruction generated for each statement.
OUTDD Specifies the destination of DISPLAY statement messages.
SOURCE Produces a listing of your source program with any statements embedded by PROCESS, COPY, orBASIS statements.
TEST Produces object code that can run with a debugging tool, or adds information to the objectprogram to produce formatted dumps. With or without any suboptions, this option forces theOBJECT option. When specified with any of the hook-location suboption values except NONE,this option forces the NOOPTIMIZE option. DWARF suboption includes statement numbers inthe Language Environment dump and produces a symbolic dump.
Note: For COBOL V4R2 and prior releases, use the SYM suboption instead of DWARF.
VBREF Produces a cross-reference of all verb types used in the source program and a summary of howmany times each verb is used.
XREF Creates a sorted cross-reference listing.
Fortran compiler optionsYou can use these Fortran compiler options shown in Table 6 on page 5 to prepare your program forruntime debugging. For more detail on these options and functions, see VS FORTRAN Version 2Programming Guide for CMS and MVS or VS FORTRAN Version 2 Language and Library Reference .
Table 6. Fortran compiler options for runtime debugging
Compiler option Description
FIPS Specifies if standard language flagging is to be performed. This is valuable if you want to write aprogram conforming to Fortran 77.
FLAG Specifies the level of diagnostic messages to be written. I (Information), E (Error), W (Warning),or S (Severe). You can also use FLAG to suppress messages that are below a specified level. Thisis useful if you want to suppress information messages, for example.
GOSTMT Specifies that statement numbers are included in the runtime messages and in the LanguageEnvironment dump.
Chapter 1. Preparing your routine for debugging 5
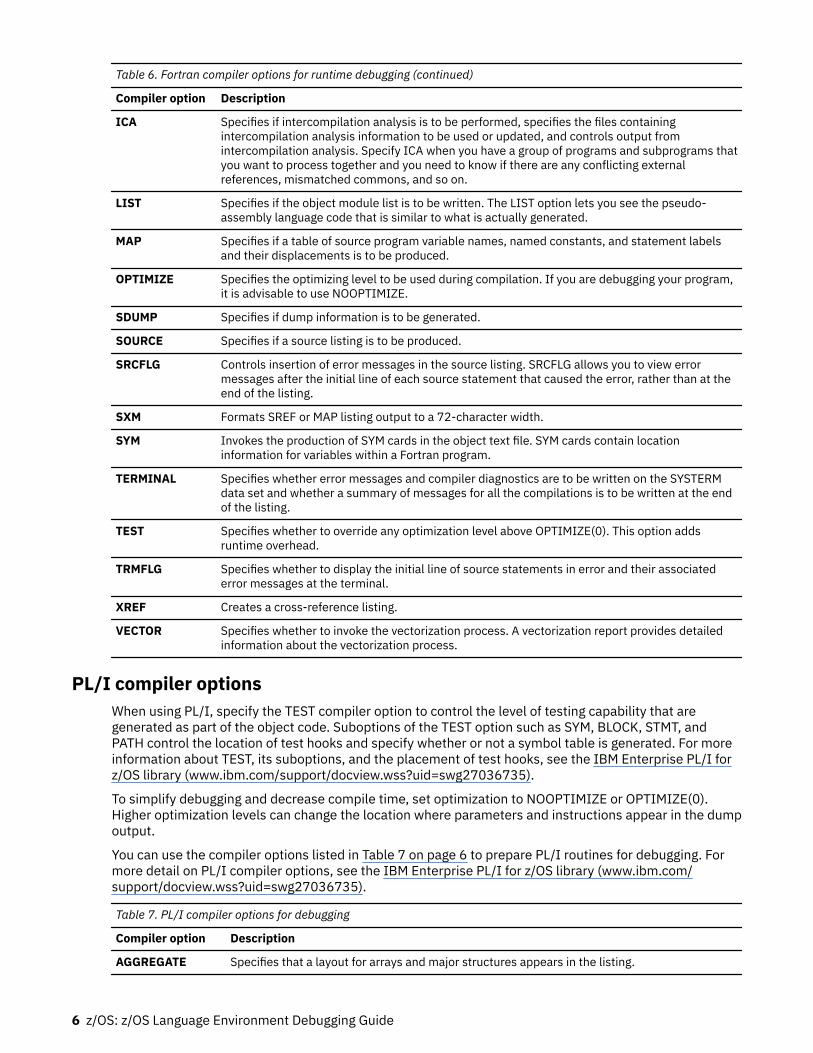
Table 6. Fortran compiler options for runtime debugging (continued)
Compiler option Description
ICA Specifies if intercompilation analysis is to be performed, specifies the files containingintercompilation analysis information to be used or updated, and controls output fromintercompilation analysis. Specify ICA when you have a group of programs and subprograms thatyou want to process together and you need to know if there are any conflicting externalreferences, mismatched commons, and so on.
LIST Specifies if the object module list is to be written. The LIST option lets you see the pseudo-assembly language code that is similar to what is actually generated.
MAP Specifies if a table of source program variable names, named constants, and statement labelsand their displacements is to be produced.
OPTIMIZE Specifies the optimizing level to be used during compilation. If you are debugging your program,it is advisable to use NOOPTIMIZE.
SDUMP Specifies if dump information is to be generated.
SOURCE Specifies if a source listing is to be produced.
SRCFLG Controls insertion of error messages in the source listing. SRCFLG allows you to view errormessages after the initial line of each source statement that caused the error, rather than at theend of the listing.
SXM Formats SREF or MAP listing output to a 72-character width.
SYM Invokes the production of SYM cards in the object text file. SYM cards contain locationinformation for variables within a Fortran program.
TERMINAL Specifies whether error messages and compiler diagnostics are to be written on the SYSTERMdata set and whether a summary of messages for all the compilations is to be written at the endof the listing.
TEST Specifies whether to override any optimization level above OPTIMIZE(0). This option addsruntime overhead.
TRMFLG Specifies whether to display the initial line of source statements in error and their associatederror messages at the terminal.
XREF Creates a cross-reference listing.
VECTOR Specifies whether to invoke the vectorization process. A vectorization report provides detailedinformation about the vectorization process.
PL/I compiler optionsWhen using PL/I, specify the TEST compiler option to control the level of testing capability that aregenerated as part of the object code. Suboptions of the TEST option such as SYM, BLOCK, STMT, andPATH control the location of test hooks and specify whether or not a symbol table is generated. For moreinformation about TEST, its suboptions, and the placement of test hooks, see the IBM Enterprise PL/I forz/OS library (www.ibm.com/support/docview.wss?uid=swg27036735).
To simplify debugging and decrease compile time, set optimization to NOOPTIMIZE or OPTIMIZE(0).Higher optimization levels can change the location where parameters and instructions appear in the dumpoutput.
You can use the compiler options listed in Table 7 on page 6 to prepare PL/I routines for debugging. Formore detail on PL/I compiler options, see the IBM Enterprise PL/I for z/OS library (www.ibm.com/support/docview.wss?uid=swg27036735).
Table 7. PL/I compiler options for debugging
Compiler option Description
AGGREGATE Specifies that a layout for arrays and major structures appears in the listing.
6 z/OS: z/OS Language Environment Debugging Guide
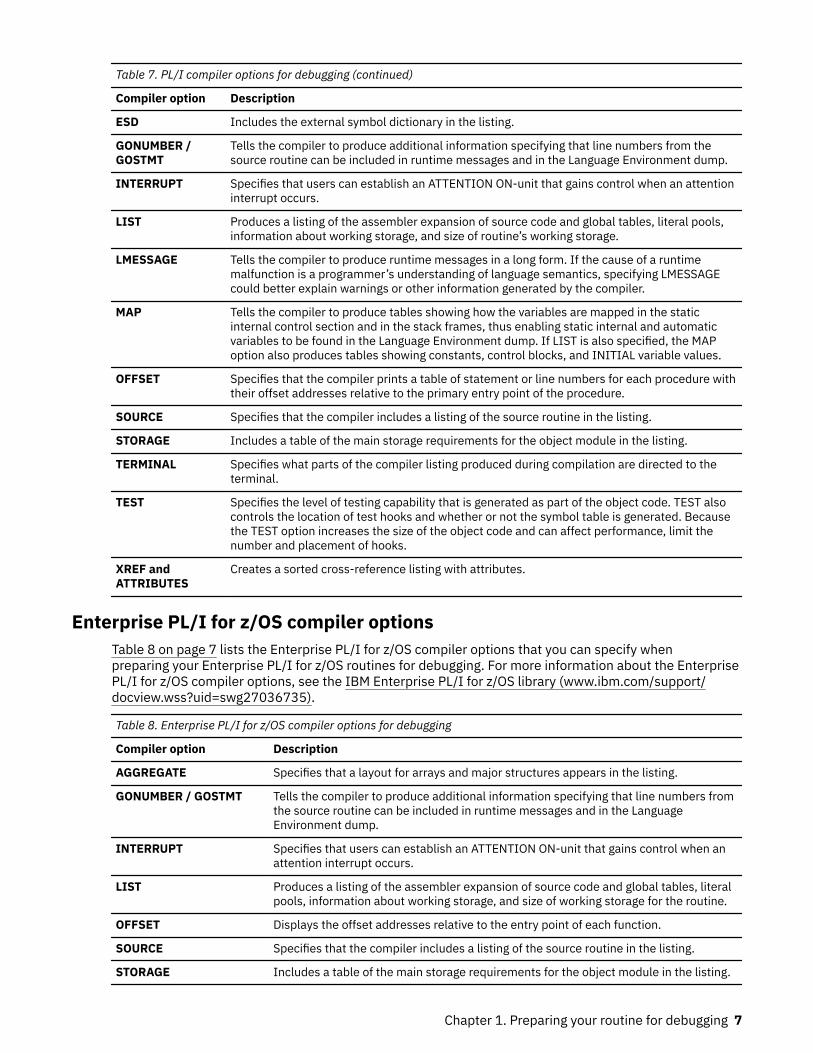
Table 7. PL/I compiler options for debugging (continued)
Compiler option Description
ESD Includes the external symbol dictionary in the listing.
GONUMBER /GOSTMT
Tells the compiler to produce additional information specifying that line numbers from thesource routine can be included in runtime messages and in the Language Environment dump.
INTERRUPT Specifies that users can establish an ATTENTION ON-unit that gains control when an attentioninterrupt occurs.
LIST Produces a listing of the assembler expansion of source code and global tables, literal pools,information about working storage, and size of routine’s working storage.
LMESSAGE Tells the compiler to produce runtime messages in a long form. If the cause of a runtimemalfunction is a programmer’s understanding of language semantics, specifying LMESSAGEcould better explain warnings or other information generated by the compiler.
MAP Tells the compiler to produce tables showing how the variables are mapped in the staticinternal control section and in the stack frames, thus enabling static internal and automaticvariables to be found in the Language Environment dump. If LIST is also specified, the MAPoption also produces tables showing constants, control blocks, and INITIAL variable values.
OFFSET Specifies that the compiler prints a table of statement or line numbers for each procedure withtheir offset addresses relative to the primary entry point of the procedure.
SOURCE Specifies that the compiler includes a listing of the source routine in the listing.
STORAGE Includes a table of the main storage requirements for the object module in the listing.
TERMINAL Specifies what parts of the compiler listing produced during compilation are directed to theterminal.
TEST Specifies the level of testing capability that is generated as part of the object code. TEST alsocontrols the location of test hooks and whether or not the symbol table is generated. Becausethe TEST option increases the size of the object code and can affect performance, limit thenumber and placement of hooks.
XREF andATTRIBUTES
Creates a sorted cross-reference listing with attributes.
Enterprise PL/I for z/OS compiler optionsTable 8 on page 7 lists the Enterprise PL/I for z/OS compiler options that you can specify whenpreparing your Enterprise PL/I for z/OS routines for debugging. For more information about the EnterprisePL/I for z/OS compiler options, see the IBM Enterprise PL/I for z/OS library (www.ibm.com/support/docview.wss?uid=swg27036735).
Table 8. Enterprise PL/I for z/OS compiler options for debugging
Compiler option Description
AGGREGATE Specifies that a layout for arrays and major structures appears in the listing.
GONUMBER / GOSTMT Tells the compiler to produce additional information specifying that line numbers fromthe source routine can be included in runtime messages and in the LanguageEnvironment dump.
INTERRUPT Specifies that users can establish an ATTENTION ON-unit that gains control when anattention interrupt occurs.
LIST Produces a listing of the assembler expansion of source code and global tables, literalpools, information about working storage, and size of working storage for the routine.
OFFSET Displays the offset addresses relative to the entry point of each function.
SOURCE Specifies that the compiler includes a listing of the source routine in the listing.
STORAGE Includes a table of the main storage requirements for the object module in the listing.
Chapter 1. Preparing your routine for debugging 7
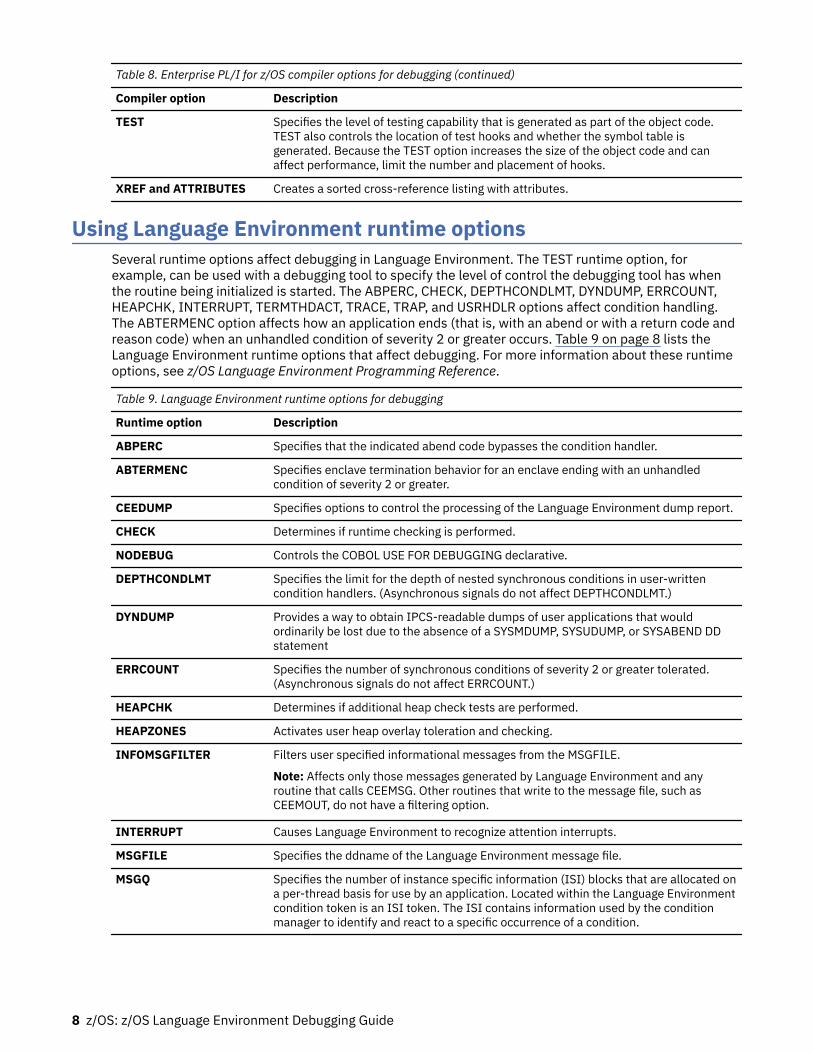
Table 8. Enterprise PL/I for z/OS compiler options for debugging (continued)
Compiler option Description
TEST Specifies the level of testing capability that is generated as part of the object code.TEST also controls the location of test hooks and whether the symbol table isgenerated. Because the TEST option increases the size of the object code and canaffect performance, limit the number and placement of hooks.
XREF and ATTRIBUTES Creates a sorted cross-reference listing with attributes.
Using Language Environment runtime optionsSeveral runtime options affect debugging in Language Environment. The TEST runtime option, forexample, can be used with a debugging tool to specify the level of control the debugging tool has whenthe routine being initialized is started. The ABPERC, CHECK, DEPTHCONDLMT, DYNDUMP, ERRCOUNT,HEAPCHK, INTERRUPT, TERMTHDACT, TRACE, TRAP, and USRHDLR options affect condition handling.The ABTERMENC option affects how an application ends (that is, with an abend or with a return code andreason code) when an unhandled condition of severity 2 or greater occurs. Table 9 on page 8 lists theLanguage Environment runtime options that affect debugging. For more information about these runtimeoptions, see z/OS Language Environment Programming Reference.
Table 9. Language Environment runtime options for debugging
Runtime option Description
ABPERC Specifies that the indicated abend code bypasses the condition handler.
ABTERMENC Specifies enclave termination behavior for an enclave ending with an unhandledcondition of severity 2 or greater.
CEEDUMP Specifies options to control the processing of the Language Environment dump report.
CHECK Determines if runtime checking is performed.
NODEBUG Controls the COBOL USE FOR DEBUGGING declarative.
DEPTHCONDLMT Specifies the limit for the depth of nested synchronous conditions in user-writtencondition handlers. (Asynchronous signals do not affect DEPTHCONDLMT.)
DYNDUMP Provides a way to obtain IPCS-readable dumps of user applications that wouldordinarily be lost due to the absence of a SYSMDUMP, SYSUDUMP, or SYSABEND DDstatement
ERRCOUNT Specifies the number of synchronous conditions of severity 2 or greater tolerated.(Asynchronous signals do not affect ERRCOUNT.)
HEAPCHK Determines if additional heap check tests are performed.
HEAPZONES Activates user heap overlay toleration and checking.
INFOMSGFILTER Filters user specified informational messages from the MSGFILE.
Note: Affects only those messages generated by Language Environment and anyroutine that calls CEEMSG. Other routines that write to the message file, such asCEEMOUT, do not have a filtering option.
INTERRUPT Causes Language Environment to recognize attention interrupts.
MSGFILE Specifies the ddname of the Language Environment message file.
MSGQ Specifies the number of instance specific information (ISI) blocks that are allocated ona per-thread basis for use by an application. Located within the Language Environmentcondition token is an ISI token. The ISI contains information used by the conditionmanager to identify and react to a specific occurrence of a condition.
8 z/OS: z/OS Language Environment Debugging Guide
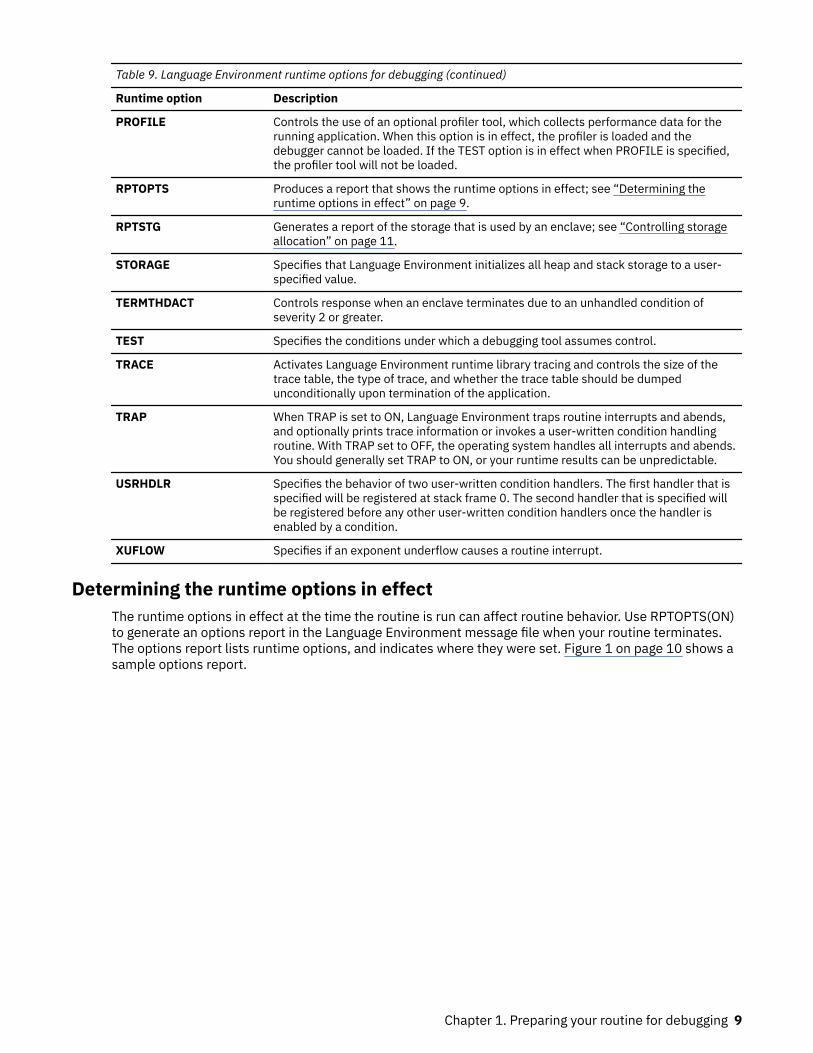
Table 9. Language Environment runtime options for debugging (continued)
Runtime option Description
PROFILE Controls the use of an optional profiler tool, which collects performance data for therunning application. When this option is in effect, the profiler is loaded and thedebugger cannot be loaded. If the TEST option is in effect when PROFILE is specified,the profiler tool will not be loaded.
RPTOPTS Produces a report that shows the runtime options in effect; see “Determining theruntime options in effect” on page 9.
RPTSTG Generates a report of the storage that is used by an enclave; see “Controlling storageallocation” on page 11.
STORAGE Specifies that Language Environment initializes all heap and stack storage to a user-specified value.
TERMTHDACT Controls response when an enclave terminates due to an unhandled condition ofseverity 2 or greater.
TEST Specifies the conditions under which a debugging tool assumes control.
TRACE Activates Language Environment runtime library tracing and controls the size of thetrace table, the type of trace, and whether the trace table should be dumpedunconditionally upon termination of the application.
TRAP When TRAP is set to ON, Language Environment traps routine interrupts and abends,and optionally prints trace information or invokes a user-written condition handlingroutine. With TRAP set to OFF, the operating system handles all interrupts and abends.You should generally set TRAP to ON, or your runtime results can be unpredictable.
USRHDLR Specifies the behavior of two user-written condition handlers. The first handler that isspecified will be registered at stack frame 0. The second handler that is specified willbe registered before any other user-written condition handlers once the handler isenabled by a condition.
XUFLOW Specifies if an exponent underflow causes a routine interrupt.
Determining the runtime options in effectThe runtime options in effect at the time the routine is run can affect routine behavior. Use RPTOPTS(ON)to generate an options report in the Language Environment message file when your routine terminates.The options report lists runtime options, and indicates where they were set. Figure 1 on page 10 shows asample options report.
Chapter 1. Preparing your routine for debugging 9
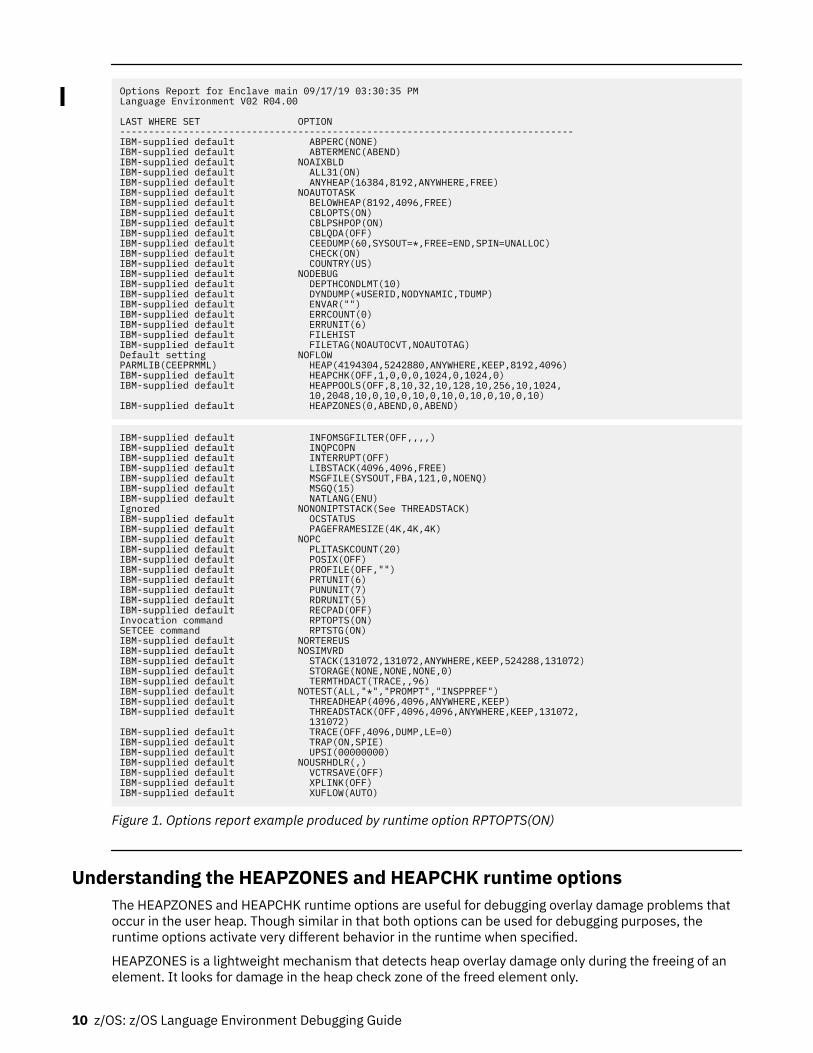
Options Report for Enclave main 09/17/19 03:30:35 PMLanguage Environment V02 R04.00
LAST WHERE SET OPTION -------------------------------------------------------------------------------IBM-supplied default ABPERC(NONE) IBM-supplied default ABTERMENC(ABEND) IBM-supplied default NOAIXBLD IBM-supplied default ALL31(ON) IBM-supplied default ANYHEAP(16384,8192,ANYWHERE,FREE) IBM-supplied default NOAUTOTASK IBM-supplied default BELOWHEAP(8192,4096,FREE) IBM-supplied default CBLOPTS(ON) IBM-supplied default CBLPSHPOP(ON) IBM-supplied default CBLQDA(OFF) IBM-supplied default CEEDUMP(60,SYSOUT=*,FREE=END,SPIN=UNALLOC) IBM-supplied default CHECK(ON) IBM-supplied default COUNTRY(US) IBM-supplied default NODEBUG IBM-supplied default DEPTHCONDLMT(10) IBM-supplied default DYNDUMP(*USERID,NODYNAMIC,TDUMP) IBM-supplied default ENVAR("") IBM-supplied default ERRCOUNT(0) IBM-supplied default ERRUNIT(6) IBM-supplied default FILEHIST IBM-supplied default FILETAG(NOAUTOCVT,NOAUTOTAG) Default setting NOFLOW PARMLIB(CEEPRMML) HEAP(4194304,5242880,ANYWHERE,KEEP,8192,4096) IBM-supplied default HEAPCHK(OFF,1,0,0,0,1024,0,1024,0) IBM-supplied default HEAPPOOLS(OFF,8,10,32,10,128,10,256,10,1024, 10,2048,10,0,10,0,10,0,10,0,10,0,10,0,10)IBM-supplied default HEAPZONES(0,ABEND,0,ABEND)
IBM-supplied default INFOMSGFILTER(OFF,,,,) IBM-supplied default INQPCOPN IBM-supplied default INTERRUPT(OFF) IBM-supplied default LIBSTACK(4096,4096,FREE) IBM-supplied default MSGFILE(SYSOUT,FBA,121,0,NOENQ) IBM-supplied default MSGQ(15) IBM-supplied default NATLANG(ENU) Ignored NONONIPTSTACK(See THREADSTACK) IBM-supplied default OCSTATUS IBM-supplied default PAGEFRAMESIZE(4K,4K,4K) IBM-supplied default NOPC IBM-supplied default PLITASKCOUNT(20) IBM-supplied default POSIX(OFF) IBM-supplied default PROFILE(OFF,"") IBM-supplied default PRTUNIT(6) IBM-supplied default PUNUNIT(7) IBM-supplied default RDRUNIT(5) IBM-supplied default RECPAD(OFF) Invocation command RPTOPTS(ON) SETCEE command RPTSTG(ON) IBM-supplied default NORTEREUS IBM-supplied default NOSIMVRD IBM-supplied default STACK(131072,131072,ANYWHERE,KEEP,524288,131072)IBM-supplied default STORAGE(NONE,NONE,NONE,0) IBM-supplied default TERMTHDACT(TRACE,,96) IBM-supplied default NOTEST(ALL,"*","PROMPT","INSPPREF") IBM-supplied default THREADHEAP(4096,4096,ANYWHERE,KEEP) IBM-supplied default THREADSTACK(OFF,4096,4096,ANYWHERE,KEEP,131072, 131072)IBM-supplied default TRACE(OFF,4096,DUMP,LE=0) IBM-supplied default TRAP(ON,SPIE) IBM-supplied default UPSI(00000000) IBM-supplied default NOUSRHDLR(,) IBM-supplied default VCTRSAVE(OFF) IBM-supplied default XPLINK(OFF) IBM-supplied default XUFLOW(AUTO)
Figure 1. Options report example produced by runtime option RPTOPTS(ON)
Understanding the HEAPZONES and HEAPCHK runtime optionsThe HEAPZONES and HEAPCHK runtime options are useful for debugging overlay damage problems thatoccur in the user heap. Though similar in that both options can be used for debugging purposes, theruntime options activate very different behavior in the runtime when specified.
HEAPZONES is a lightweight mechanism that detects heap overlay damage only during the freeing of anelement. It looks for damage in the heap check zone of the freed element only.
10 z/OS: z/OS Language Environment Debugging Guide
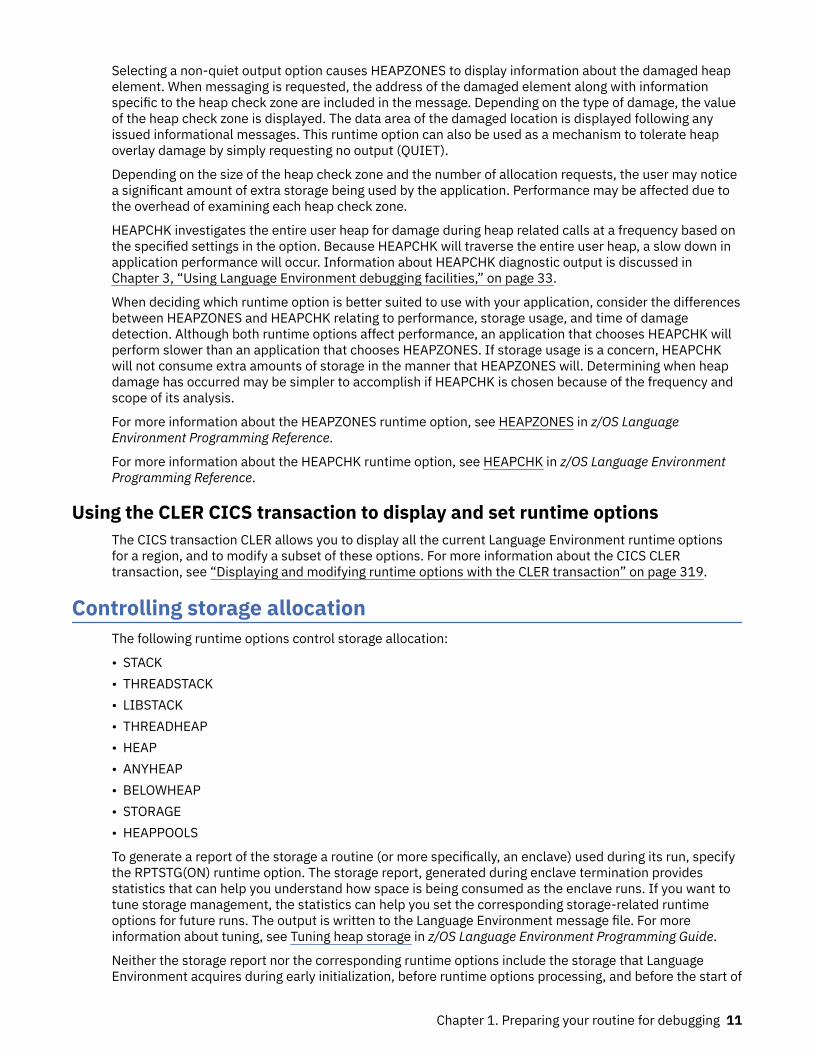
Selecting a non-quiet output option causes HEAPZONES to display information about the damaged heapelement. When messaging is requested, the address of the damaged element along with informationspecific to the heap check zone are included in the message. Depending on the type of damage, the valueof the heap check zone is displayed. The data area of the damaged location is displayed following anyissued informational messages. This runtime option can also be used as a mechanism to tolerate heapoverlay damage by simply requesting no output (QUIET).
Depending on the size of the heap check zone and the number of allocation requests, the user may noticea significant amount of extra storage being used by the application. Performance may be affected due tothe overhead of examining each heap check zone.
HEAPCHK investigates the entire user heap for damage during heap related calls at a frequency based onthe specified settings in the option. Because HEAPCHK will traverse the entire user heap, a slow down inapplication performance will occur. Information about HEAPCHK diagnostic output is discussed inChapter 3, “Using Language Environment debugging facilities,” on page 33.
When deciding which runtime option is better suited to use with your application, consider the differencesbetween HEAPZONES and HEAPCHK relating to performance, storage usage, and time of damagedetection. Although both runtime options affect performance, an application that chooses HEAPCHK willperform slower than an application that chooses HEAPZONES. If storage usage is a concern, HEAPCHKwill not consume extra amounts of storage in the manner that HEAPZONES will. Determining when heapdamage has occurred may be simpler to accomplish if HEAPCHK is chosen because of the frequency andscope of its analysis.
For more information about the HEAPZONES runtime option, see HEAPZONES in z/OS LanguageEnvironment Programming Reference.
For more information about the HEAPCHK runtime option, see HEAPCHK in z/OS Language EnvironmentProgramming Reference.
Using the CLER CICS transaction to display and set runtime optionsThe CICS transaction CLER allows you to display all the current Language Environment runtime optionsfor a region, and to modify a subset of these options. For more information about the CICS CLERtransaction, see “Displaying and modifying runtime options with the CLER transaction” on page 319.
Controlling storage allocationThe following runtime options control storage allocation:
• STACK• THREADSTACK• LIBSTACK• THREADHEAP• HEAP• ANYHEAP• BELOWHEAP• STORAGE• HEAPPOOLS
To generate a report of the storage a routine (or more specifically, an enclave) used during its run, specifythe RPTSTG(ON) runtime option. The storage report, generated during enclave termination providesstatistics that can help you understand how space is being consumed as the enclave runs. If you want totune storage management, the statistics can help you set the corresponding storage-related runtimeoptions for future runs. The output is written to the Language Environment message file. For moreinformation about tuning, see Tuning heap storage in z/OS Language Environment Programming Guide.
Neither the storage report nor the corresponding runtime options include the storage that LanguageEnvironment acquires during early initialization, before runtime options processing, and before the start of
Chapter 1. Preparing your routine for debugging 11
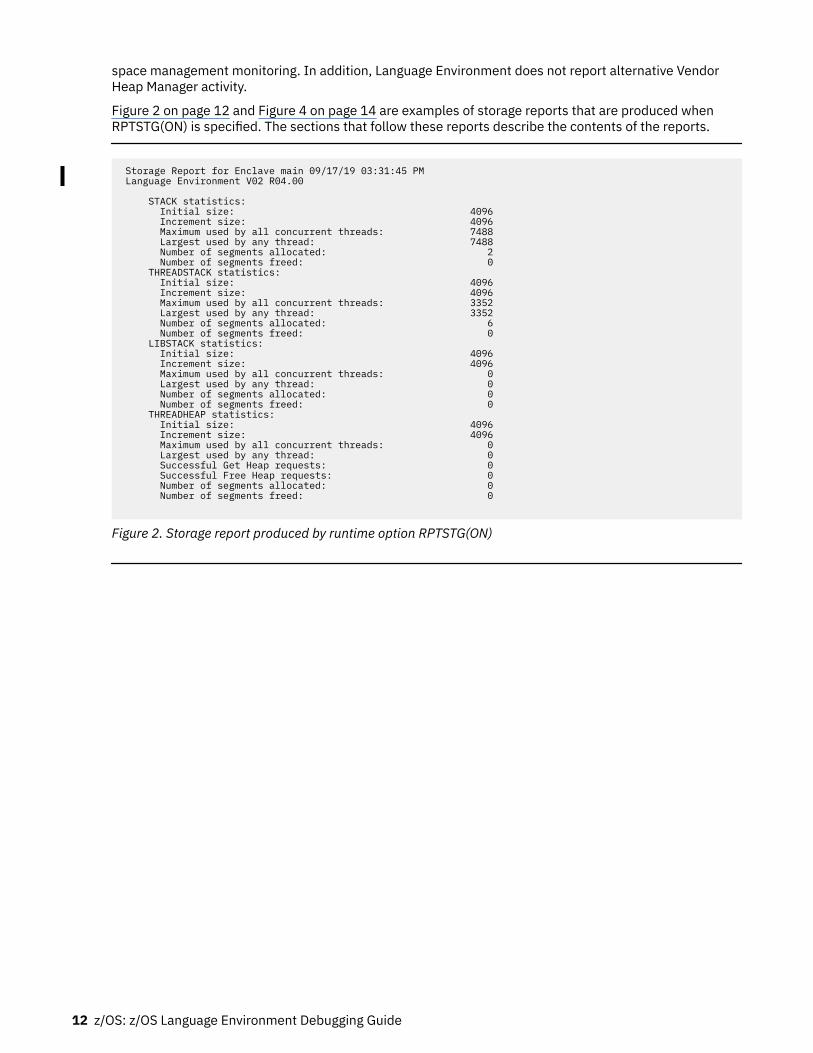
space management monitoring. In addition, Language Environment does not report alternative VendorHeap Manager activity.
Figure 2 on page 12 and Figure 4 on page 14 are examples of storage reports that are produced whenRPTSTG(ON) is specified. The sections that follow these reports describe the contents of the reports.
Storage Report for Enclave main 09/17/19 03:31:45 PM Language Environment V02 R04.00
STACK statistics: Initial size: 4096 Increment size: 4096 Maximum used by all concurrent threads: 7488 Largest used by any thread: 7488 Number of segments allocated: 2 Number of segments freed: 0 THREADSTACK statistics: Initial size: 4096 Increment size: 4096 Maximum used by all concurrent threads: 3352 Largest used by any thread: 3352 Number of segments allocated: 6 Number of segments freed: 0 LIBSTACK statistics: Initial size: 4096 Increment size: 4096 Maximum used by all concurrent threads: 0 Largest used by any thread: 0 Number of segments allocated: 0 Number of segments freed: 0 THREADHEAP statistics: Initial size: 4096 Increment size: 4096 Maximum used by all concurrent threads: 0 Largest used by any thread: 0 Successful Get Heap requests: 0 Successful Free Heap requests: 0 Number of segments allocated: 0 Number of segments freed: 0
Figure 2. Storage report produced by runtime option RPTSTG(ON)
12 z/OS: z/OS Language Environment Debugging Guide
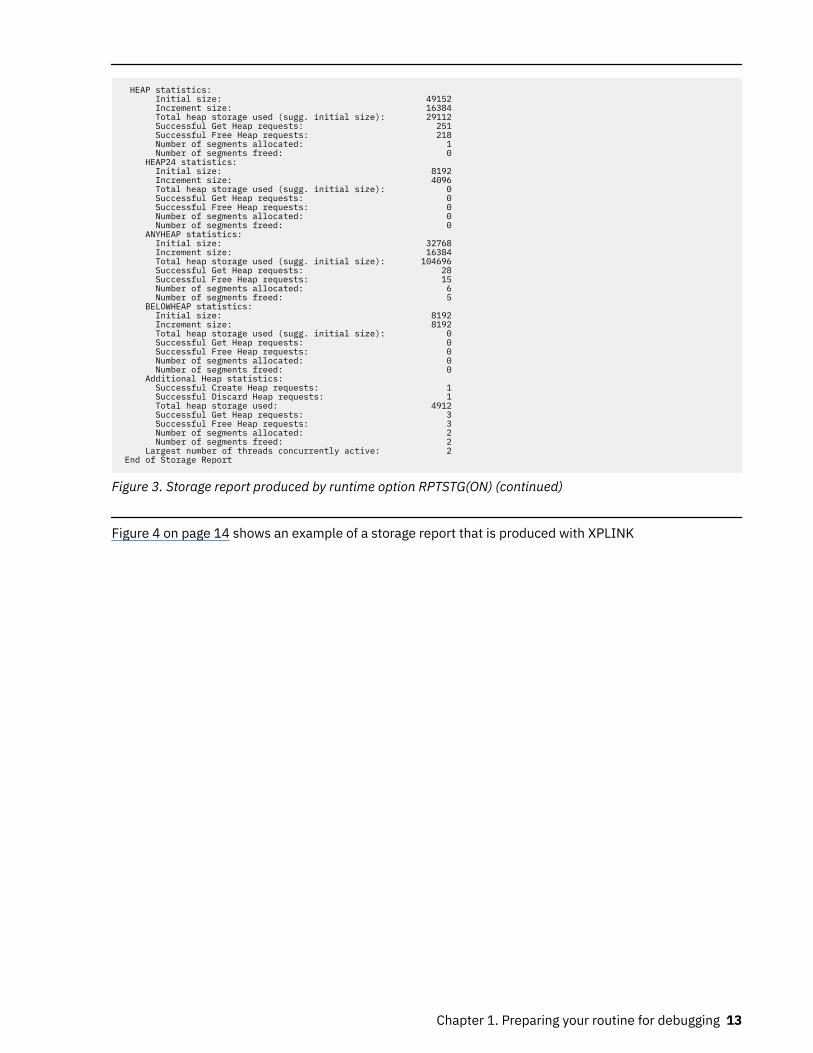
HEAP statistics: Initial size: 49152 Increment size: 16384 Total heap storage used (sugg. initial size): 29112 Successful Get Heap requests: 251 Successful Free Heap requests: 218 Number of segments allocated: 1 Number of segments freed: 0 HEAP24 statistics: Initial size: 8192 Increment size: 4096 Total heap storage used (sugg. initial size): 0 Successful Get Heap requests: 0 Successful Free Heap requests: 0 Number of segments allocated: 0 Number of segments freed: 0 ANYHEAP statistics: Initial size: 32768 Increment size: 16384 Total heap storage used (sugg. initial size): 104696 Successful Get Heap requests: 28 Successful Free Heap requests: 15 Number of segments allocated: 6 Number of segments freed: 5 BELOWHEAP statistics: Initial size: 8192 Increment size: 8192 Total heap storage used (sugg. initial size): 0 Successful Get Heap requests: 0 Successful Free Heap requests: 0 Number of segments allocated: 0 Number of segments freed: 0 Additional Heap statistics: Successful Create Heap requests: 1 Successful Discard Heap requests: 1 Total heap storage used: 4912 Successful Get Heap requests: 3 Successful Free Heap requests: 3 Number of segments allocated: 2 Number of segments freed: 2 Largest number of threads concurrently active: 2 End of Storage Report
Figure 3. Storage report produced by runtime option RPTSTG(ON) (continued)
Figure 4 on page 14 shows an example of a storage report that is produced with XPLINK
Chapter 1. Preparing your routine for debugging 13
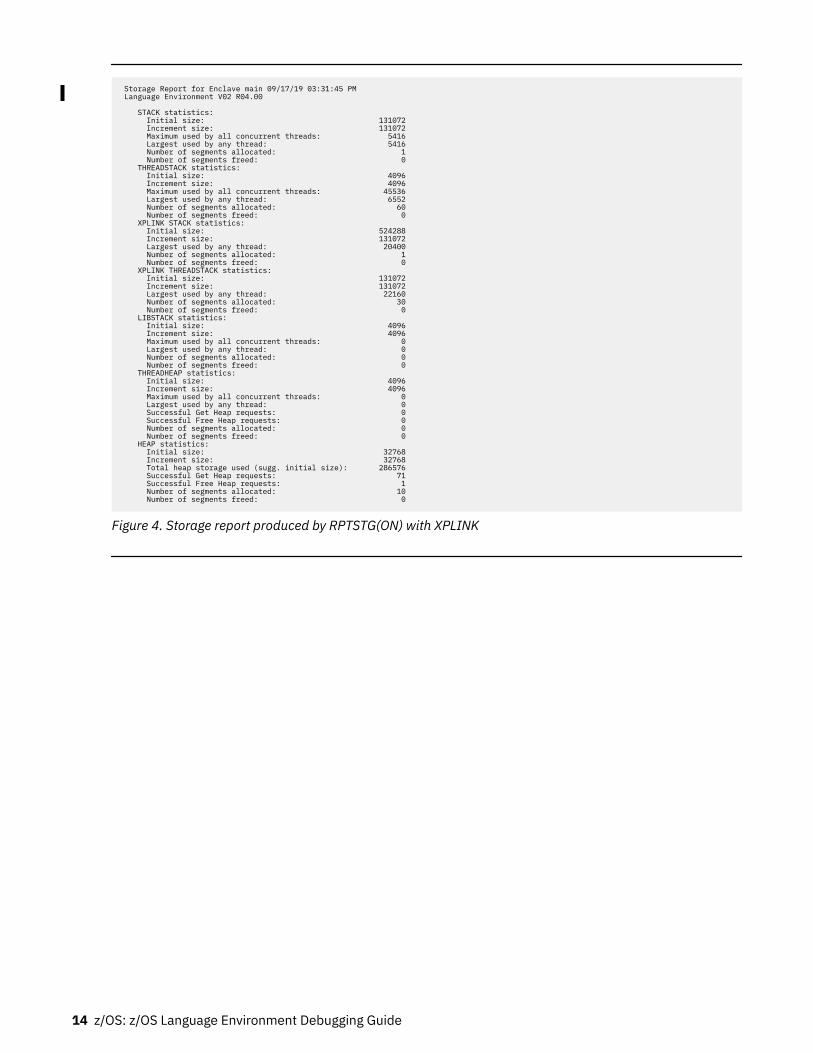
Storage Report for Enclave main 09/17/19 03:31:45 PM Language Environment V02 R04.00 STACK statistics: Initial size: 131072 Increment size: 131072 Maximum used by all concurrent threads: 5416 Largest used by any thread: 5416 Number of segments allocated: 1 Number of segments freed: 0 THREADSTACK statistics: Initial size: 4096 Increment size: 4096 Maximum used by all concurrent threads: 45536 Largest used by any thread: 6552 Number of segments allocated: 60 Number of segments freed: 0 XPLINK STACK statistics: Initial size: 524288 Increment size: 131072 Largest used by any thread: 20400 Number of segments allocated: 1 Number of segments freed: 0 XPLINK THREADSTACK statistics: Initial size: 131072 Increment size: 131072 Largest used by any thread: 22160 Number of segments allocated: 30 Number of segments freed: 0 LIBSTACK statistics: Initial size: 4096 Increment size: 4096 Maximum used by all concurrent threads: 0 Largest used by any thread: 0 Number of segments allocated: 0 Number of segments freed: 0 THREADHEAP statistics: Initial size: 4096 Increment size: 4096 Maximum used by all concurrent threads: 0 Largest used by any thread: 0 Successful Get Heap requests: 0 Successful Free Heap requests: 0 Number of segments allocated: 0 Number of segments freed: 0 HEAP statistics: Initial size: 32768 Increment size: 32768 Total heap storage used (sugg. initial size): 286576 Successful Get Heap requests: 71 Successful Free Heap requests: 1 Number of segments allocated: 10 Number of segments freed: 0
Figure 4. Storage report produced by RPTSTG(ON) with XPLINK
14 z/OS: z/OS Language Environment Debugging Guide
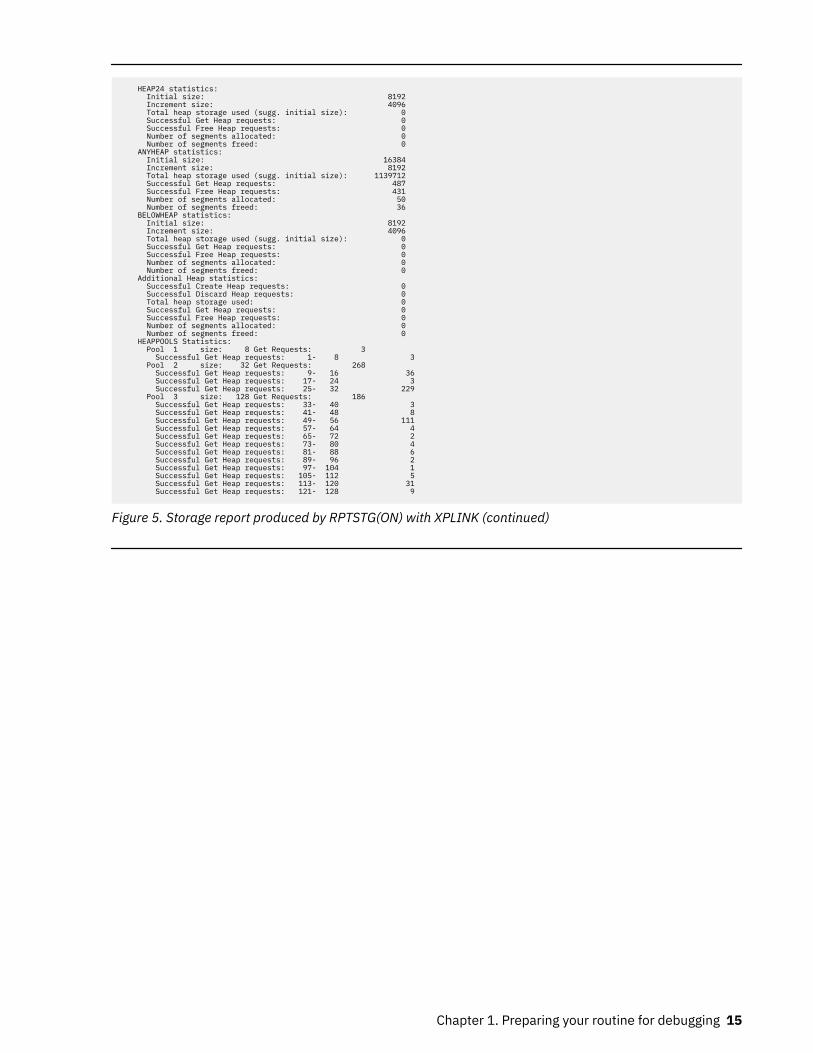
HEAP24 statistics: Initial size: 8192 Increment size: 4096 Total heap storage used (sugg. initial size): 0 Successful Get Heap requests: 0 Successful Free Heap requests: 0 Number of segments allocated: 0 Number of segments freed: 0 ANYHEAP statistics: Initial size: 16384 Increment size: 8192 Total heap storage used (sugg. initial size): 1139712 Successful Get Heap requests: 487 Successful Free Heap requests: 431 Number of segments allocated: 50 Number of segments freed: 36 BELOWHEAP statistics: Initial size: 8192 Increment size: 4096 Total heap storage used (sugg. initial size): 0 Successful Get Heap requests: 0 Successful Free Heap requests: 0 Number of segments allocated: 0 Number of segments freed: 0 Additional Heap statistics: Successful Create Heap requests: 0 Successful Discard Heap requests: 0 Total heap storage used: 0 Successful Get Heap requests: 0 Successful Free Heap requests: 0 Number of segments allocated: 0 Number of segments freed: 0 HEAPPOOLS Statistics: Pool 1 size: 8 Get Requests: 3 Successful Get Heap requests: 1- 8 3 Pool 2 size: 32 Get Requests: 268 Successful Get Heap requests: 9- 16 36 Successful Get Heap requests: 17- 24 3 Successful Get Heap requests: 25- 32 229 Pool 3 size: 128 Get Requests: 186 Successful Get Heap requests: 33- 40 3 Successful Get Heap requests: 41- 48 8 Successful Get Heap requests: 49- 56 111 Successful Get Heap requests: 57- 64 4 Successful Get Heap requests: 65- 72 2 Successful Get Heap requests: 73- 80 4 Successful Get Heap requests: 81- 88 6 Successful Get Heap requests: 89- 96 2 Successful Get Heap requests: 97- 104 1 Successful Get Heap requests: 105- 112 5 Successful Get Heap requests: 113- 120 31 Successful Get Heap requests: 121- 128 9
Figure 5. Storage report produced by RPTSTG(ON) with XPLINK (continued)
Chapter 1. Preparing your routine for debugging 15
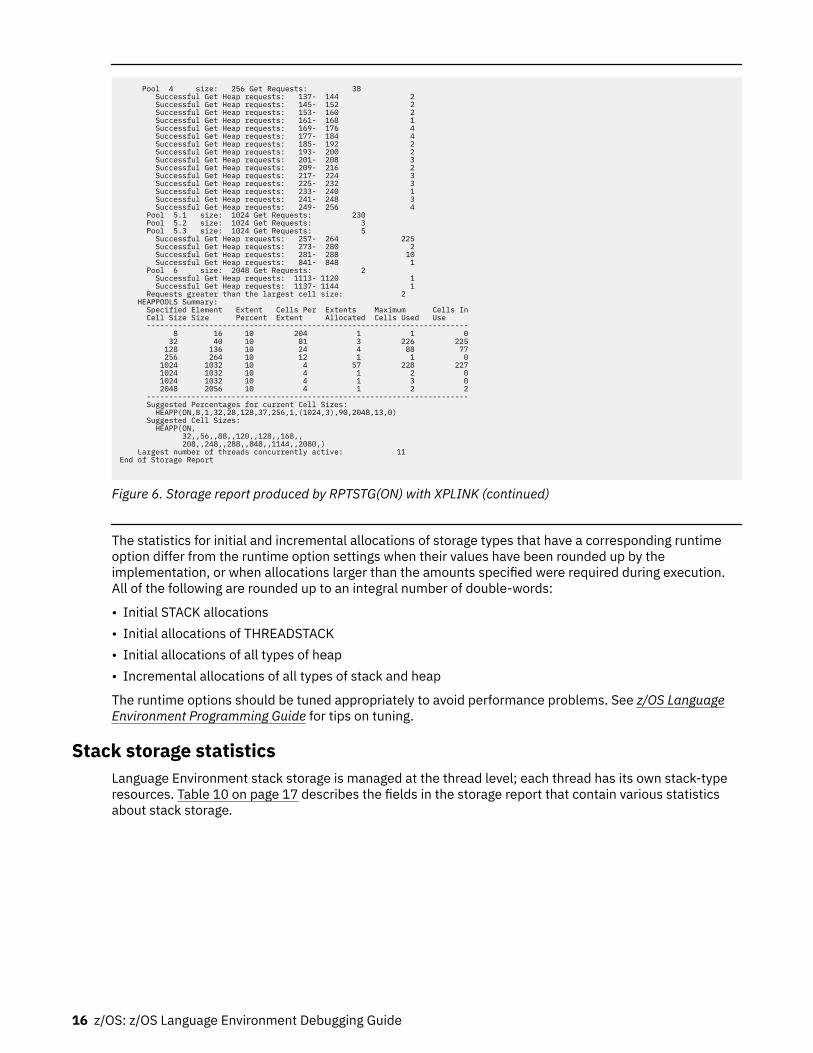
Pool 4 size: 256 Get Requests: 38 Successful Get Heap requests: 137- 144 2 Successful Get Heap requests: 145- 152 2 Successful Get Heap requests: 153- 160 2 Successful Get Heap requests: 161- 168 1 Successful Get Heap requests: 169- 176 4 Successful Get Heap requests: 177- 184 4 Successful Get Heap requests: 185- 192 2 Successful Get Heap requests: 193- 200 2 Successful Get Heap requests: 201- 208 3 Successful Get Heap requests: 209- 216 2 Successful Get Heap requests: 217- 224 3 Successful Get Heap requests: 225- 232 3 Successful Get Heap requests: 233- 240 1 Successful Get Heap requests: 241- 248 3 Successful Get Heap requests: 249- 256 4 Pool 5.1 size: 1024 Get Requests: 230 Pool 5.2 size: 1024 Get Requests: 3 Pool 5.3 size: 1024 Get Requests: 5 Successful Get Heap requests: 257- 264 225 Successful Get Heap requests: 273- 280 2 Successful Get Heap requests: 281- 288 10 Successful Get Heap requests: 841- 848 1 Pool 6 size: 2048 Get Requests: 2 Successful Get Heap requests: 1113- 1120 1 Successful Get Heap requests: 1137- 1144 1 Requests greater than the largest cell size: 2 HEAPPOOLS Summary: Specified Element Extent Cells Per Extents Maximum Cells In Cell Size Size Percent Extent Allocated Cells Used Use ------------------------------------------------------------------------ 8 16 10 204 1 1 0 32 40 10 81 3 226 225 128 136 10 24 4 88 77 256 264 10 12 1 1 0 1024 1032 10 4 57 228 227 1024 1032 10 4 1 2 0 1024 1032 10 4 1 3 0 2048 2056 10 4 1 2 2 ------------------------------------------------------------------------ Suggested Percentages for current Cell Sizes: HEAPP(ON,8,1,32,28,128,37,256,1,(1024,3),90,2048,13,0) Suggested Cell Sizes: HEAPP(ON, 32,,56,,88,,120,,128,,168,, 208,,248,,288,,848,,1144,,2080,) Largest number of threads concurrently active: 11 End of Storage Report
Figure 6. Storage report produced by RPTSTG(ON) with XPLINK (continued)
The statistics for initial and incremental allocations of storage types that have a corresponding runtimeoption differ from the runtime option settings when their values have been rounded up by theimplementation, or when allocations larger than the amounts specified were required during execution.All of the following are rounded up to an integral number of double-words:
• Initial STACK allocations• Initial allocations of THREADSTACK• Initial allocations of all types of heap• Incremental allocations of all types of stack and heap
The runtime options should be tuned appropriately to avoid performance problems. See z/OS LanguageEnvironment Programming Guide for tips on tuning.
Stack storage statisticsLanguage Environment stack storage is managed at the thread level; each thread has its own stack-typeresources. Table 10 on page 17 describes the fields in the storage report that contain various statisticsabout stack storage.
16 z/OS: z/OS Language Environment Debugging Guide
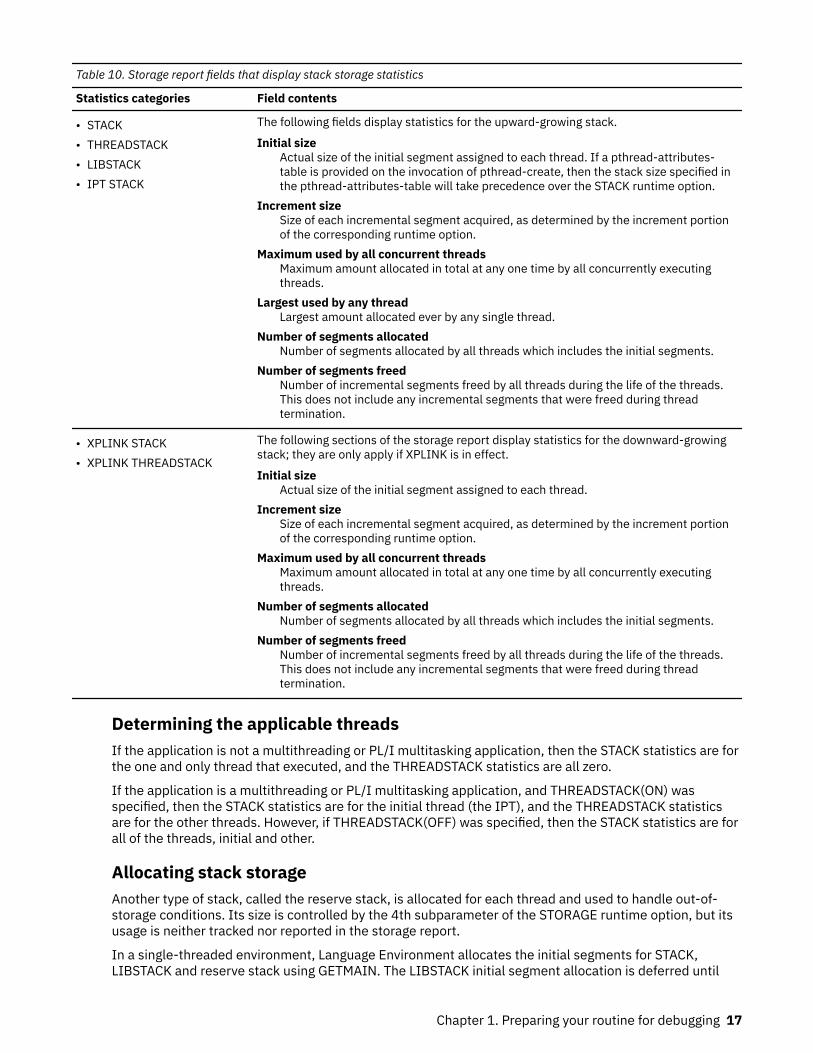
Table 10. Storage report fields that display stack storage statistics
Statistics categories Field contents
• STACK• THREADSTACK• LIBSTACK• IPT STACK
The following fields display statistics for the upward-growing stack.
Initial sizeActual size of the initial segment assigned to each thread. If a pthread-attributes-table is provided on the invocation of pthread-create, then the stack size specified inthe pthread-attributes-table will take precedence over the STACK runtime option.
Increment sizeSize of each incremental segment acquired, as determined by the increment portionof the corresponding runtime option.
Maximum used by all concurrent threadsMaximum amount allocated in total at any one time by all concurrently executingthreads.
Largest used by any threadLargest amount allocated ever by any single thread.
Number of segments allocatedNumber of segments allocated by all threads which includes the initial segments.
Number of segments freedNumber of incremental segments freed by all threads during the life of the threads.This does not include any incremental segments that were freed during threadtermination.
• XPLINK STACK• XPLINK THREADSTACK
The following sections of the storage report display statistics for the downward-growingstack; they are only apply if XPLINK is in effect.
Initial sizeActual size of the initial segment assigned to each thread.
Increment sizeSize of each incremental segment acquired, as determined by the increment portionof the corresponding runtime option.
Maximum used by all concurrent threadsMaximum amount allocated in total at any one time by all concurrently executingthreads.
Number of segments allocatedNumber of segments allocated by all threads which includes the initial segments.
Number of segments freedNumber of incremental segments freed by all threads during the life of the threads.This does not include any incremental segments that were freed during threadtermination.
Determining the applicable threadsIf the application is not a multithreading or PL/I multitasking application, then the STACK statistics are forthe one and only thread that executed, and the THREADSTACK statistics are all zero.
If the application is a multithreading or PL/I multitasking application, and THREADSTACK(ON) wasspecified, then the STACK statistics are for the initial thread (the IPT), and the THREADSTACK statisticsare for the other threads. However, if THREADSTACK(OFF) was specified, then the STACK statistics are forall of the threads, initial and other.
Allocating stack storageAnother type of stack, called the reserve stack, is allocated for each thread and used to handle out-of-storage conditions. Its size is controlled by the 4th subparameter of the STORAGE runtime option, but itsusage is neither tracked nor reported in the storage report.
In a single-threaded environment, Language Environment allocates the initial segments for STACK,LIBSTACK and reserve stack using GETMAIN. The LIBSTACK initial segment allocation is deferred until
Chapter 1. Preparing your routine for debugging 17
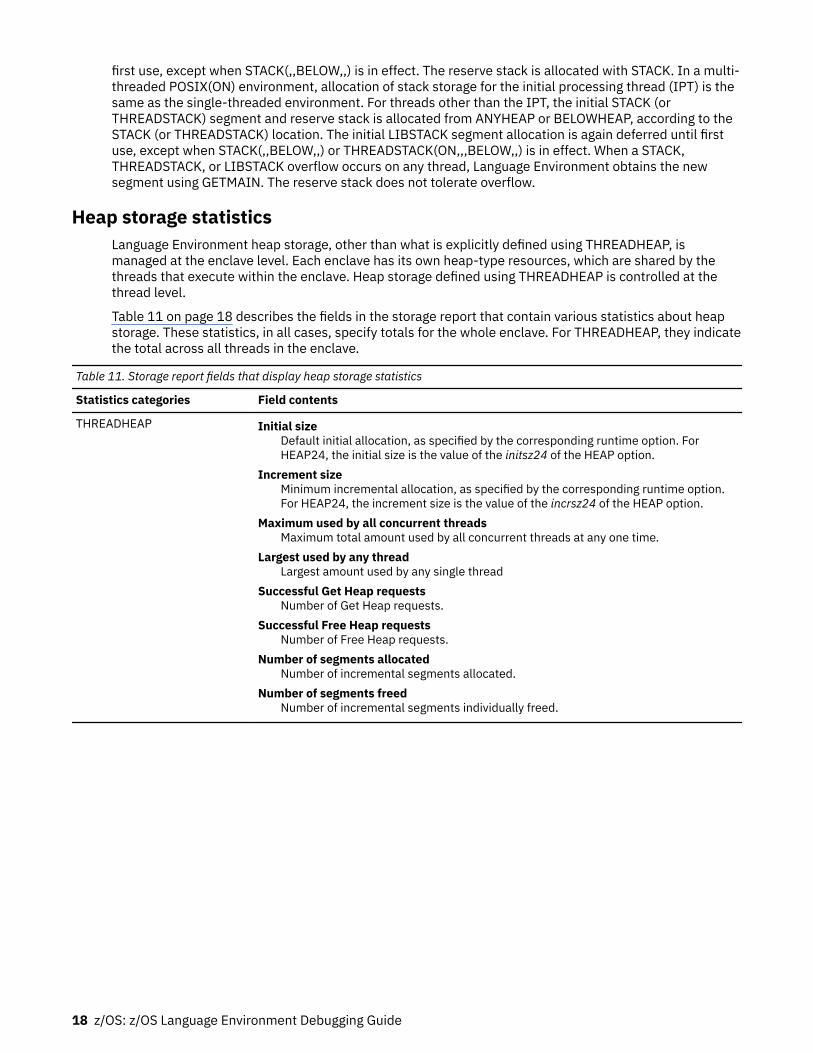
first use, except when STACK(,,BELOW,,) is in effect. The reserve stack is allocated with STACK. In a multi-threaded POSIX(ON) environment, allocation of stack storage for the initial processing thread (IPT) is thesame as the single-threaded environment. For threads other than the IPT, the initial STACK (orTHREADSTACK) segment and reserve stack is allocated from ANYHEAP or BELOWHEAP, according to theSTACK (or THREADSTACK) location. The initial LIBSTACK segment allocation is again deferred until firstuse, except when STACK(,,BELOW,,) or THREADSTACK(ON,,,BELOW,,) is in effect. When a STACK,THREADSTACK, or LIBSTACK overflow occurs on any thread, Language Environment obtains the newsegment using GETMAIN. The reserve stack does not tolerate overflow.
Heap storage statisticsLanguage Environment heap storage, other than what is explicitly defined using THREADHEAP, ismanaged at the enclave level. Each enclave has its own heap-type resources, which are shared by thethreads that execute within the enclave. Heap storage defined using THREADHEAP is controlled at thethread level.
Table 11 on page 18 describes the fields in the storage report that contain various statistics about heapstorage. These statistics, in all cases, specify totals for the whole enclave. For THREADHEAP, they indicatethe total across all threads in the enclave.
Table 11. Storage report fields that display heap storage statistics
Statistics categories Field contents
THREADHEAP Initial sizeDefault initial allocation, as specified by the corresponding runtime option. ForHEAP24, the initial size is the value of the initsz24 of the HEAP option.
Increment sizeMinimum incremental allocation, as specified by the corresponding runtime option.For HEAP24, the increment size is the value of the incrsz24 of the HEAP option.
Maximum used by all concurrent threadsMaximum total amount used by all concurrent threads at any one time.
Largest used by any threadLargest amount used by any single thread
Successful Get Heap requestsNumber of Get Heap requests.
Successful Free Heap requestsNumber of Free Heap requests.
Number of segments allocatedNumber of incremental segments allocated.
Number of segments freedNumber of incremental segments individually freed.
18 z/OS: z/OS Language Environment Debugging Guide
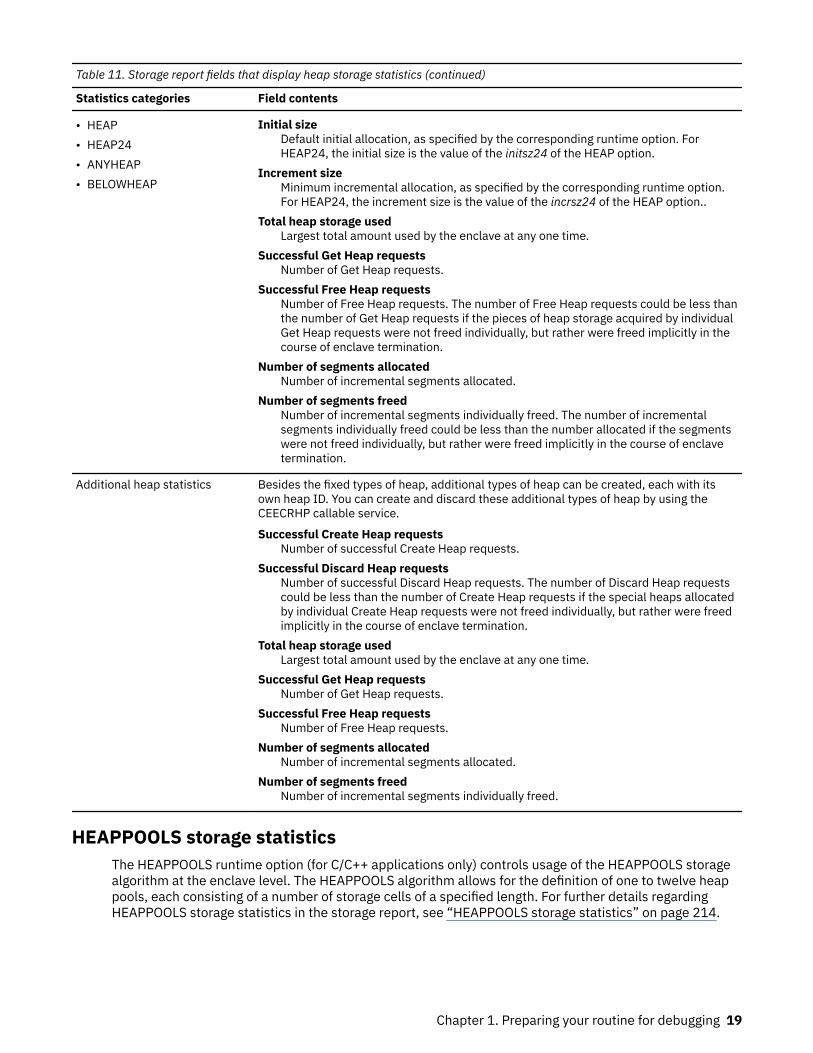
Table 11. Storage report fields that display heap storage statistics (continued)
Statistics categories Field contents
• HEAP• HEAP24• ANYHEAP• BELOWHEAP
Initial sizeDefault initial allocation, as specified by the corresponding runtime option. ForHEAP24, the initial size is the value of the initsz24 of the HEAP option.
Increment sizeMinimum incremental allocation, as specified by the corresponding runtime option.For HEAP24, the increment size is the value of the incrsz24 of the HEAP option..
Total heap storage usedLargest total amount used by the enclave at any one time.
Successful Get Heap requestsNumber of Get Heap requests.
Successful Free Heap requestsNumber of Free Heap requests. The number of Free Heap requests could be less thanthe number of Get Heap requests if the pieces of heap storage acquired by individualGet Heap requests were not freed individually, but rather were freed implicitly in thecourse of enclave termination.
Number of segments allocatedNumber of incremental segments allocated.
Number of segments freedNumber of incremental segments individually freed. The number of incrementalsegments individually freed could be less than the number allocated if the segmentswere not freed individually, but rather were freed implicitly in the course of enclavetermination.
Additional heap statistics Besides the fixed types of heap, additional types of heap can be created, each with itsown heap ID. You can create and discard these additional types of heap by using theCEECRHP callable service.
Successful Create Heap requestsNumber of successful Create Heap requests.
Successful Discard Heap requestsNumber of successful Discard Heap requests. The number of Discard Heap requestscould be less than the number of Create Heap requests if the special heaps allocatedby individual Create Heap requests were not freed individually, but rather were freedimplicitly in the course of enclave termination.
Total heap storage usedLargest total amount used by the enclave at any one time.
Successful Get Heap requestsNumber of Get Heap requests.
Successful Free Heap requestsNumber of Free Heap requests.
Number of segments allocatedNumber of incremental segments allocated.
Number of segments freedNumber of incremental segments individually freed.
HEAPPOOLS storage statisticsThe HEAPPOOLS runtime option (for C/C++ applications only) controls usage of the HEAPPOOLS storagealgorithm at the enclave level. The HEAPPOOLS algorithm allows for the definition of one to twelve heappools, each consisting of a number of storage cells of a specified length. For further details regardingHEAPPOOLS storage statistics in the storage report, see “HEAPPOOLS storage statistics” on page 214.
Chapter 1. Preparing your routine for debugging 19
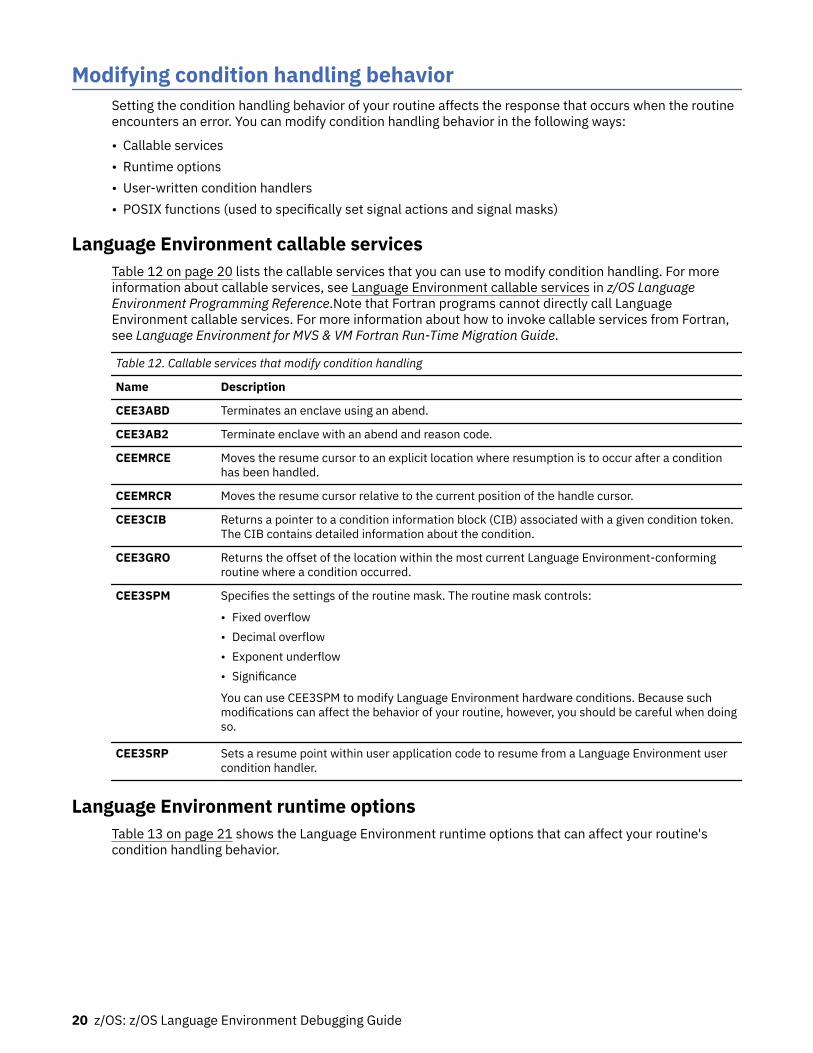
Modifying condition handling behaviorSetting the condition handling behavior of your routine affects the response that occurs when the routineencounters an error. You can modify condition handling behavior in the following ways:
• Callable services• Runtime options• User-written condition handlers• POSIX functions (used to specifically set signal actions and signal masks)
Language Environment callable servicesTable 12 on page 20 lists the callable services that you can use to modify condition handling. For moreinformation about callable services, see Language Environment callable services in z/OS LanguageEnvironment Programming Reference.Note that Fortran programs cannot directly call LanguageEnvironment callable services. For more information about how to invoke callable services from Fortran,see Language Environment for MVS & VM Fortran Run-Time Migration Guide.
Table 12. Callable services that modify condition handling
Name Description
CEE3ABD Terminates an enclave using an abend.
CEE3AB2 Terminate enclave with an abend and reason code.
CEEMRCE Moves the resume cursor to an explicit location where resumption is to occur after a conditionhas been handled.
CEEMRCR Moves the resume cursor relative to the current position of the handle cursor.
CEE3CIB Returns a pointer to a condition information block (CIB) associated with a given condition token.The CIB contains detailed information about the condition.
CEE3GRO Returns the offset of the location within the most current Language Environment-conformingroutine where a condition occurred.
CEE3SPM Specifies the settings of the routine mask. The routine mask controls:
• Fixed overflow• Decimal overflow• Exponent underflow• Significance
You can use CEE3SPM to modify Language Environment hardware conditions. Because suchmodifications can affect the behavior of your routine, however, you should be careful when doingso.
CEE3SRP Sets a resume point within user application code to resume from a Language Environment usercondition handler.
Language Environment runtime optionsTable 13 on page 21 shows the Language Environment runtime options that can affect your routine'scondition handling behavior.
20 z/OS: z/OS Language Environment Debugging Guide
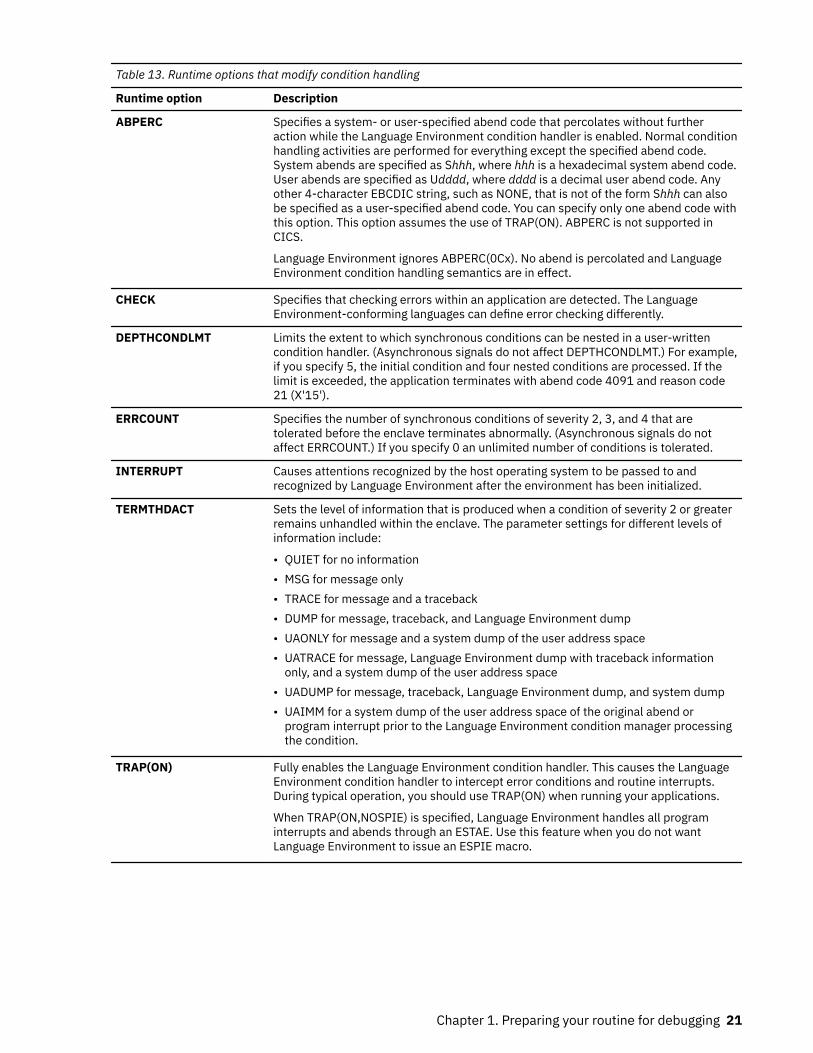
Table 13. Runtime options that modify condition handling
Runtime option Description
ABPERC Specifies a system- or user-specified abend code that percolates without furtheraction while the Language Environment condition handler is enabled. Normal conditionhandling activities are performed for everything except the specified abend code.System abends are specified as Shhh, where hhh is a hexadecimal system abend code.User abends are specified as Udddd, where dddd is a decimal user abend code. Anyother 4-character EBCDIC string, such as NONE, that is not of the form Shhh can alsobe specified as a user-specified abend code. You can specify only one abend code withthis option. This option assumes the use of TRAP(ON). ABPERC is not supported inCICS.
Language Environment ignores ABPERC(0Cx). No abend is percolated and LanguageEnvironment condition handling semantics are in effect.
CHECK Specifies that checking errors within an application are detected. The LanguageEnvironment-conforming languages can define error checking differently.
DEPTHCONDLMT Limits the extent to which synchronous conditions can be nested in a user-writtencondition handler. (Asynchronous signals do not affect DEPTHCONDLMT.) For example,if you specify 5, the initial condition and four nested conditions are processed. If thelimit is exceeded, the application terminates with abend code 4091 and reason code21 (X'15').
ERRCOUNT Specifies the number of synchronous conditions of severity 2, 3, and 4 that aretolerated before the enclave terminates abnormally. (Asynchronous signals do notaffect ERRCOUNT.) If you specify 0 an unlimited number of conditions is tolerated.
INTERRUPT Causes attentions recognized by the host operating system to be passed to andrecognized by Language Environment after the environment has been initialized.
TERMTHDACT Sets the level of information that is produced when a condition of severity 2 or greaterremains unhandled within the enclave. The parameter settings for different levels ofinformation include:
• QUIET for no information• MSG for message only• TRACE for message and a traceback• DUMP for message, traceback, and Language Environment dump• UAONLY for message and a system dump of the user address space• UATRACE for message, Language Environment dump with traceback information
only, and a system dump of the user address space• UADUMP for message, traceback, Language Environment dump, and system dump• UAIMM for a system dump of the user address space of the original abend or
program interrupt prior to the Language Environment condition manager processingthe condition.
TRAP(ON) Fully enables the Language Environment condition handler. This causes the LanguageEnvironment condition handler to intercept error conditions and routine interrupts.During typical operation, you should use TRAP(ON) when running your applications.
When TRAP(ON,NOSPIE) is specified, Language Environment handles all programinterrupts and abends through an ESTAE. Use this feature when you do not wantLanguage Environment to issue an ESPIE macro.
Chapter 1. Preparing your routine for debugging 21
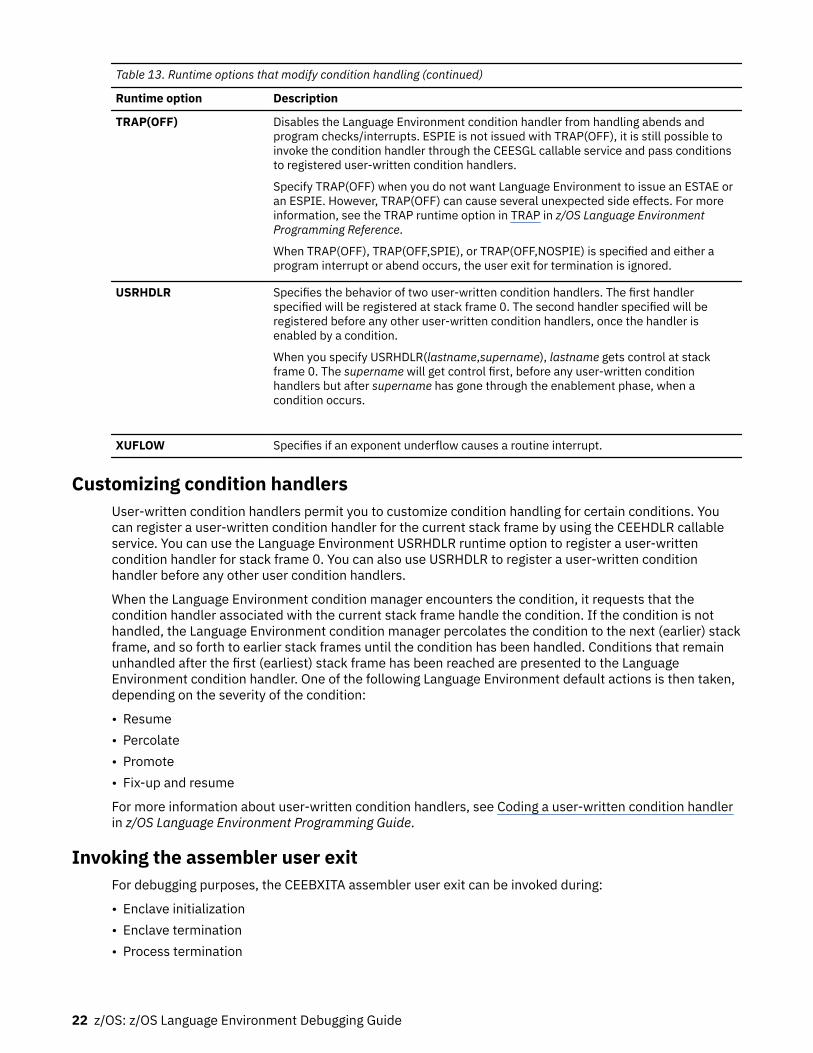
Table 13. Runtime options that modify condition handling (continued)
Runtime option Description
TRAP(OFF) Disables the Language Environment condition handler from handling abends andprogram checks/interrupts. ESPIE is not issued with TRAP(OFF), it is still possible toinvoke the condition handler through the CEESGL callable service and pass conditionsto registered user-written condition handlers.
Specify TRAP(OFF) when you do not want Language Environment to issue an ESTAE oran ESPIE. However, TRAP(OFF) can cause several unexpected side effects. For moreinformation, see the TRAP runtime option in TRAP in z/OS Language EnvironmentProgramming Reference.
When TRAP(OFF), TRAP(OFF,SPIE), or TRAP(OFF,NOSPIE) is specified and either aprogram interrupt or abend occurs, the user exit for termination is ignored.
USRHDLR Specifies the behavior of two user-written condition handlers. The first handlerspecified will be registered at stack frame 0. The second handler specified will beregistered before any other user-written condition handlers, once the handler isenabled by a condition.
When you specify USRHDLR(lastname,supername), lastname gets control at stackframe 0. The supername will get control first, before any user-written conditionhandlers but after supername has gone through the enablement phase, when acondition occurs.
XUFLOW Specifies if an exponent underflow causes a routine interrupt.
Customizing condition handlersUser-written condition handlers permit you to customize condition handling for certain conditions. Youcan register a user-written condition handler for the current stack frame by using the CEEHDLR callableservice. You can use the Language Environment USRHDLR runtime option to register a user-writtencondition handler for stack frame 0. You can also use USRHDLR to register a user-written conditionhandler before any other user condition handlers.
When the Language Environment condition manager encounters the condition, it requests that thecondition handler associated with the current stack frame handle the condition. If the condition is nothandled, the Language Environment condition manager percolates the condition to the next (earlier) stackframe, and so forth to earlier stack frames until the condition has been handled. Conditions that remainunhandled after the first (earliest) stack frame has been reached are presented to the LanguageEnvironment condition handler. One of the following Language Environment default actions is then taken,depending on the severity of the condition:
• Resume• Percolate• Promote• Fix-up and resume
For more information about user-written condition handlers, see Coding a user-written condition handlerin z/OS Language Environment Programming Guide.
Invoking the assembler user exitFor debugging purposes, the CEEBXITA assembler user exit can be invoked during:
• Enclave initialization• Enclave termination• Process termination
22 z/OS: z/OS Language Environment Debugging Guide
The functions of the CEEBXITA user exit depend on when the user exit is invoked and whether it isapplication-specific or installation-wide. Application-specific user exits must be linked with theapplication load module and run only when that application runs. Installation-wide user exits must belinked with the Language Environment initialization/termination library routines and run with all LanguageEnvironment library routines. Because an application-specific user exit has priority over any installation-wide user exit, you can customize a user exit for a particular application without affecting the user exit forany other applications.
At enclave initialization, the CEEBXITA user exit runs prior to the enclave establishment. Thus you canmodify the environment in which your application runs in the following ways:
• Specify runtime options • Allocate data sets/files in the user exit• List abend codes to be passed to the operating system • Check the values of routine arguments
At enclave termination, the CEEBXITA user exit runs prior to the termination activity. Thus, you canrequest an abend and perform specified actions based on received return and reason codes. (This doesnot apply when Language Environment terminates with an abend.)
At process termination, the CEEBXITA user exit runs after the enclave termination activity completes.Thus you can request an abend and deallocate files.
The assembler user exit must have an entry point of CEEBXITA, must be reentrant, and must be capableof running in AMODE(ANY) and RMODE(ANY).
You can use the assembler user exit to establish enclave termination behavior for an enclave ending withan unhandled condition of severity 2 or greater in the following ways:
• If you do not request an abend in the assembler user exit for the enclave termination call, LanguageEnvironment honors the setting of the ABTERMENC option to determine how to end the enclave.
• If you request an abend in the assembler user exit for the enclave termination call, LanguageEnvironment issues an abend to end the enclave.
For more information about the assembler user exit, see CEEBXITA assembler user exit interface in z/OSLanguage Environment Programming Guide.
Establishing enclave termination behavior for unhandled conditionsTo establish enclave termination behavior when an unhandled condition of severity 2 or greater occurs,use one of the following methods:
• The assembler user exit. For more information, see “Invoking the assembler user exit” on page 22.• POSIX signal default action. For more information, see Language Environment and POSIX signal
handling interactions in z/OS Language Environment Programming Guide.• The ABTERMENC runtime option. The ABTERMENC runtime option sets the enclave termination
behavior for an enclave ending with an unhandled condition of severity 2 or greater.
If you specify the IBM-supplied default suboption ABEND, Language Environment issues an abend toend the enclave regardless of the setting of the CEEAUE_ABND flag. Additionally, the assembler userexit can alter the abend code, abend reason code, abend dump attribute, and the abend task/stepattribute. For more information about using ABTERMENC, see ABTERMENC in z/OS LanguageEnvironment Programming Reference. For more information about the assembler user exit, seeCEEBXITA assembler user exit interface in z/OS Language Environment Programming Guide.
If you specify the RETCODE suboption, Language Environment uses the CEEAUE_ABND flag value set bythe assembler user exit (which is called for enclave termination) to determine whether to issue anabend to end the enclave when an unhandled condition of severity 2 or greater occurs.
Chapter 1. Preparing your routine for debugging 23
Using messages in your routineYou can create messages and use them in your routine to indicate the status and progress of the routineduring run time, and to display variable values. The process of creating messages and using them requiresthat you create a message source file, and convert the source file into loadable code for use in yourroutine.
You can use the Language Environment callable service CEEMOUT to direct user-created message outputto the Language Environment message file. To direct the message output to another destination, use theLanguage Environment MSGFILE runtime option to specify the ddname of the file.
When multiple Language Environment environments are running in the same address space and the sameMSGFILE ddname is specified, writing contention can occur. To avoid contention, use the MSGFILEsuboption ENQ. ENQ tells Language Environment to perform serialization around writes to the MSGFILEddname specified which eliminates writing contention. Writing contention can also be eliminated byspecifying unique MSGFILE ddnames.
Each Language Environment-conforming language also provides ways to display both user-created andruntime messages. (For an explanation of Language Environment runtime messages, see “Interpretingruntime messages” on page 28.)
The following sections discuss how to create messages in each of the HLLs. For a more detailedexplanation of how to create messages and use them in C, C/C++, COBOL, Fortran, or PL/I routines, seez/OS Language Environment Programming Guide.
C/C++For C/C++ routines, output from the printf function is directed to stdout, which is associated withSYSPRINT. All C/C++ runtime messages and perror() messages are directed to stderr. stderrcorresponds to the ddname associated with the Language Environment MSGFILE runtime option. Thedestination of the printf function output can be changed by using the redirection 1>&2 at routineinvocation to redirect stdout to the stderr destination. Both streams can be controlled by the MSGFILEruntime option.
COBOLFor COBOL programs, you can use the DISPLAY statement to display messages. Output from the DISPLAYstatement is directed to SYSOUT. SYSOUT is the IBM-supplied default for the Language Environmentmessage file. The OUTDD compiler option can be used to change the destination of the DISPLAYmessages.
FortranFor Fortran programs, runtime messages, output written to the print unit, and other output (such asoutput from the SDUMP callable service) are directed to the file specified by the MSGFILE runtime option.If the print unit is different than the error message unit (PRTUNIT and ERRUNIT runtime options havedifferent values), however, output from the PRINT statement won't be directed to the LanguageEnvironment message file.
PL/IUnder PL/I, runtime messages are directed to the file specified in the Language Environment MSGFILEruntime option, instead of the PL/I SYSPRINT STREAM PRINT file. User-specified output is still directed tothe PL/I SYSPRINT STREAM PRINT file. To direct this output to the Language Environment MSGFILE file,specify the runtime option MSGFILE(SYSPRINT).
Using condition informationIf a condition that might require attention occurs while an application is running, Language Environmentbuilds a condition token. The condition token contains 12 bytes (96 bits) of information about the
24 z/OS: z/OS Language Environment Debugging Guide
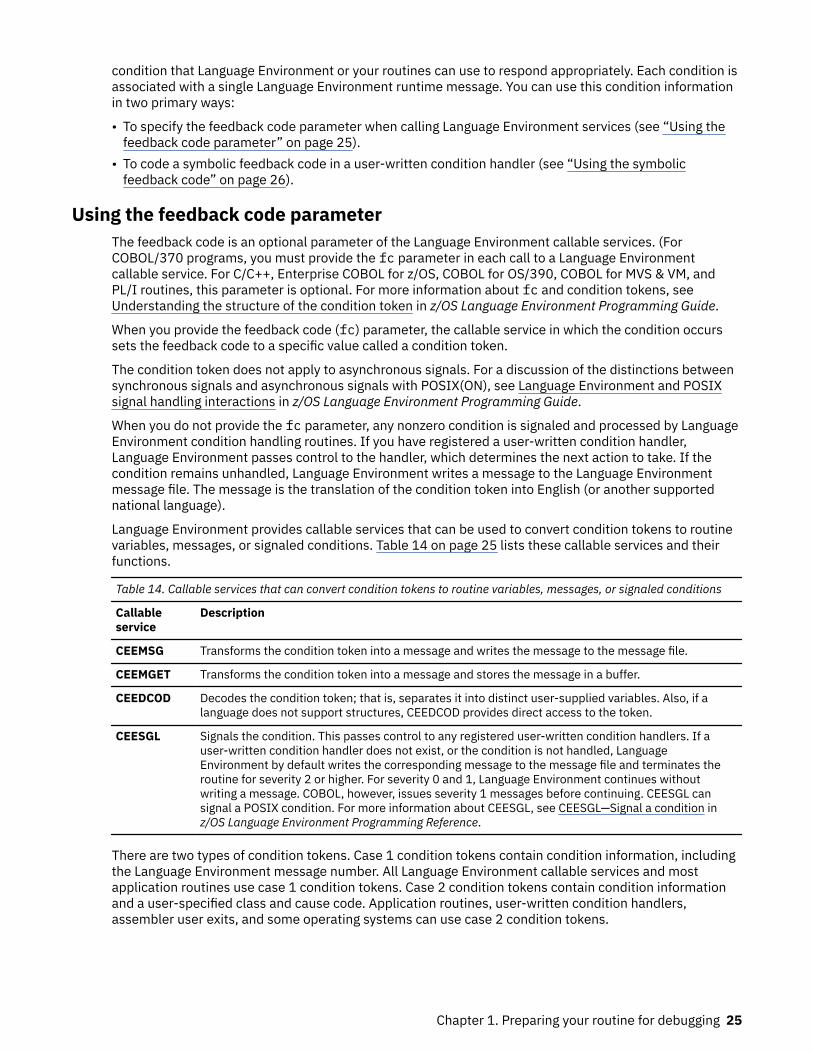
condition that Language Environment or your routines can use to respond appropriately. Each condition isassociated with a single Language Environment runtime message. You can use this condition informationin two primary ways:
• To specify the feedback code parameter when calling Language Environment services (see “Using thefeedback code parameter” on page 25).
• To code a symbolic feedback code in a user-written condition handler (see “Using the symbolicfeedback code” on page 26).
Using the feedback code parameterThe feedback code is an optional parameter of the Language Environment callable services. (ForCOBOL/370 programs, you must provide the fc parameter in each call to a Language Environmentcallable service. For C/C++, Enterprise COBOL for z/OS, COBOL for OS/390, COBOL for MVS & VM, andPL/I routines, this parameter is optional. For more information about fc and condition tokens, seeUnderstanding the structure of the condition token in z/OS Language Environment Programming Guide.
When you provide the feedback code (fc) parameter, the callable service in which the condition occurssets the feedback code to a specific value called a condition token.
The condition token does not apply to asynchronous signals. For a discussion of the distinctions betweensynchronous signals and asynchronous signals with POSIX(ON), see Language Environment and POSIXsignal handling interactions in z/OS Language Environment Programming Guide.
When you do not provide the fc parameter, any nonzero condition is signaled and processed by LanguageEnvironment condition handling routines. If you have registered a user-written condition handler,Language Environment passes control to the handler, which determines the next action to take. If thecondition remains unhandled, Language Environment writes a message to the Language Environmentmessage file. The message is the translation of the condition token into English (or another supportednational language).
Language Environment provides callable services that can be used to convert condition tokens to routinevariables, messages, or signaled conditions. Table 14 on page 25 lists these callable services and theirfunctions.
Table 14. Callable services that can convert condition tokens to routine variables, messages, or signaled conditions
Callableservice
Description
CEEMSG Transforms the condition token into a message and writes the message to the message file.
CEEMGET Transforms the condition token into a message and stores the message in a buffer.
CEEDCOD Decodes the condition token; that is, separates it into distinct user-supplied variables. Also, if alanguage does not support structures, CEEDCOD provides direct access to the token.
CEESGL Signals the condition. This passes control to any registered user-written condition handlers. If auser-written condition handler does not exist, or the condition is not handled, LanguageEnvironment by default writes the corresponding message to the message file and terminates theroutine for severity 2 or higher. For severity 0 and 1, Language Environment continues withoutwriting a message. COBOL, however, issues severity 1 messages before continuing. CEESGL cansignal a POSIX condition. For more information about CEESGL, see CEESGL—Signal a condition inz/OS Language Environment Programming Reference.
There are two types of condition tokens. Case 1 condition tokens contain condition information, includingthe Language Environment message number. All Language Environment callable services and mostapplication routines use case 1 condition tokens. Case 2 condition tokens contain condition informationand a user-specified class and cause code. Application routines, user-written condition handlers,assembler user exits, and some operating systems can use case 2 condition tokens.
Chapter 1. Preparing your routine for debugging 25
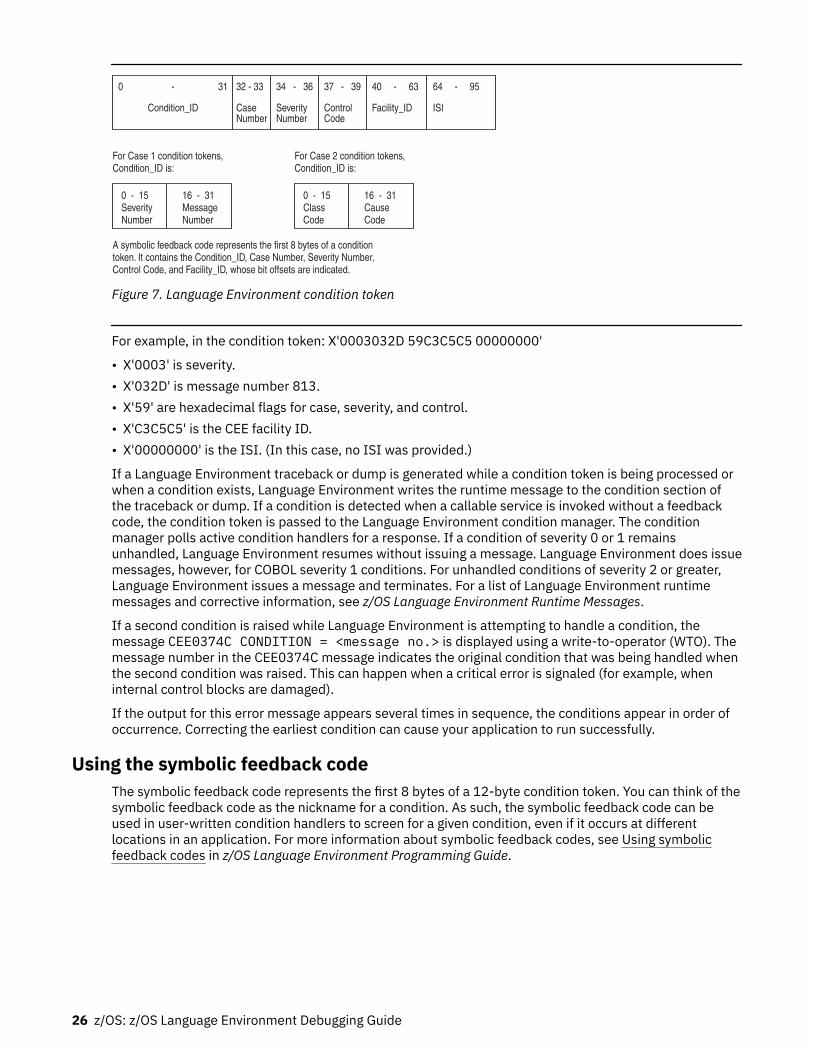
A symbolic feedback code represents the first 8 bytes of a conditiontoken. It contains the Condition_ID, Case Number, Severity Number,Control Code, and Facility_ID, whose bit offsets are indicated.
16 - 31CauseCode
0 - 15ClassCode
For Case 2 condition tokens,Condition_ID is:
16 - 31MessageNumber
0 - 15SeverityNumber
For Case 1 condition tokens,Condition_ID is:
64 - 95
ISI
40 - 63
Facility_ID
37 - 39
ControlCode
34 - 36
SeverityNumber
32 - 33
CaseNumber
0 - 31
Condition_ID
Figure 7. Language Environment condition token
For example, in the condition token: X'0003032D 59C3C5C5 00000000'
• X'0003' is severity.• X'032D' is message number 813.• X'59' are hexadecimal flags for case, severity, and control.• X'C3C5C5' is the CEE facility ID.• X'00000000' is the ISI. (In this case, no ISI was provided.)
If a Language Environment traceback or dump is generated while a condition token is being processed orwhen a condition exists, Language Environment writes the runtime message to the condition section ofthe traceback or dump. If a condition is detected when a callable service is invoked without a feedbackcode, the condition token is passed to the Language Environment condition manager. The conditionmanager polls active condition handlers for a response. If a condition of severity 0 or 1 remainsunhandled, Language Environment resumes without issuing a message. Language Environment does issuemessages, however, for COBOL severity 1 conditions. For unhandled conditions of severity 2 or greater,Language Environment issues a message and terminates. For a list of Language Environment runtimemessages and corrective information, see z/OS Language Environment Runtime Messages.
If a second condition is raised while Language Environment is attempting to handle a condition, themessage CEE0374C CONDITION = <message no.> is displayed using a write-to-operator (WTO). Themessage number in the CEE0374C message indicates the original condition that was being handled whenthe second condition was raised. This can happen when a critical error is signaled (for example, wheninternal control blocks are damaged).
If the output for this error message appears several times in sequence, the conditions appear in order ofoccurrence. Correcting the earliest condition can cause your application to run successfully.
Using the symbolic feedback codeThe symbolic feedback code represents the first 8 bytes of a 12-byte condition token. You can think of thesymbolic feedback code as the nickname for a condition. As such, the symbolic feedback code can beused in user-written condition handlers to screen for a given condition, even if it occurs at differentlocations in an application. For more information about symbolic feedback codes, see Using symbolicfeedback codes in z/OS Language Environment Programming Guide.
26 z/OS: z/OS Language Environment Debugging Guide
Chapter 2. Classifying errors
This chapter describes errors that commonly occur in Language Environment routines. It also explainshow to use runtime messages and abend codes to obtain information about errors in your routine.
Identifying problems in routinesThe following sections describe how you can identify errors in Language Environment routines. Includedare common error symptoms and solutions.
Language Environment module namesYou can identify Language Environment-supplied module elements by any of the following three-character prefixes:
• CEE (Language Environment)• CEL (Language Environment and C/C++ runtime library)• EDC (C/C++)• FOR (Fortran)• IBM (PL/I)• IGZ (COBOL)
Module elements or text files with other prefixes are not part of the Language Environment product.
Common errors in routinesThese common errors have simple solutions:
• If you do not have enough virtual storage, increase your region size or decrease your storage usage(stack size) by using the storage-related runtime options and callable services. (See “Controlling storageallocation” on page 11 for information about using storage in routines.)
• If you do not have enough disk space, increase your disk allocation.• If executable files are not available, check your executable library to ensure that they are defined. For
example, check your STEPLIB or JOBLIB definitions.
If your error is not caused by any of these items, examine your routine or routines for changes since thelast successful run. If there have been changes, review these changes for errors that might be causing theproblem. One way to isolate the problem is to branch around or comment out recent changes and rerunthe routine. If the run is successful, the error can be narrowed to the scope of the changes.
Duplicate names that are shared between Fortran routines and C library routines can produce unexpectedresults. Language Environment provides several cataloged procedures to properly resolve duplicatenames. For more information about how to avoid name conflicts, see Resolving library module nameconflicts between Fortran and C in z/OS Language Environment Programming Guide.
Changes in optimization levels, addressing modes, and input/output file formats can also causeunanticipated problems in your routine.
In most cases, generated condition tokens or runtime messages point to the nature of the error. Theruntime messages offer the most efficient corrective action. To help you analyze errors and determine themost useful method to fix the problem, Table 15 on page 28 lists common error symptoms, possiblecauses, and programmer responses.
© Copyright IBM Corp. 1991, 2020 27
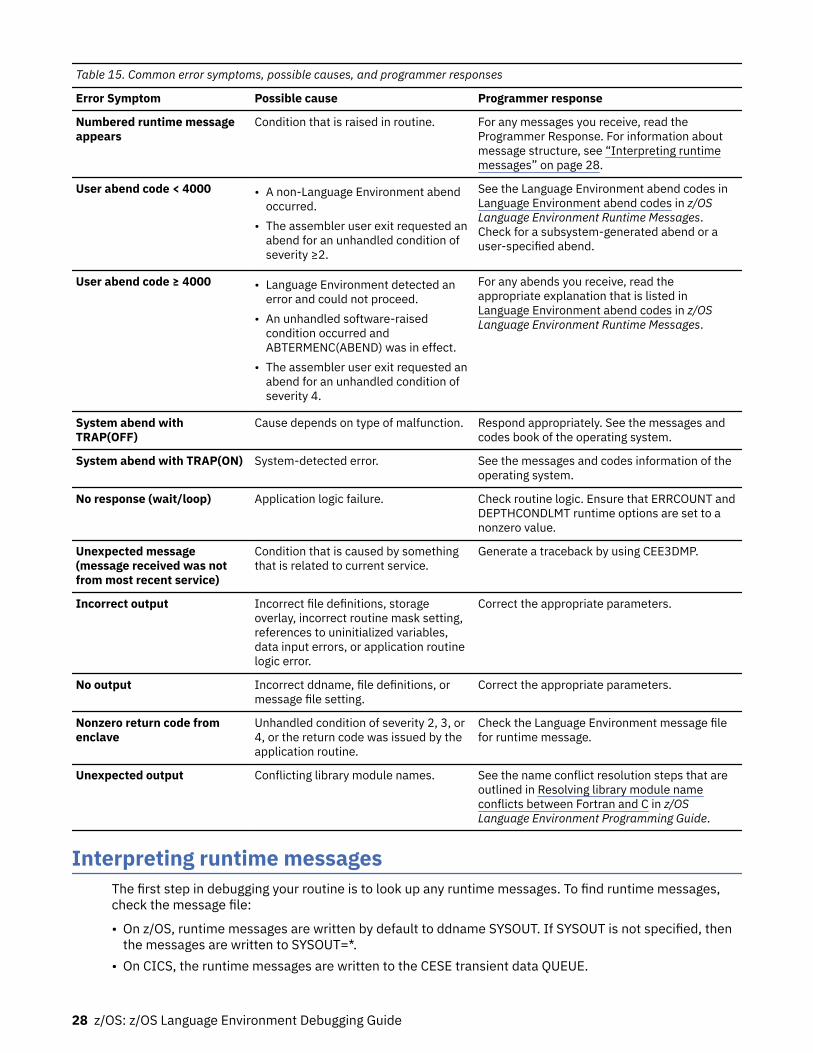
Table 15. Common error symptoms, possible causes, and programmer responses
Error Symptom Possible cause Programmer response
Numbered runtime messageappears
Condition that is raised in routine. For any messages you receive, read theProgrammer Response. For information aboutmessage structure, see “Interpreting runtimemessages” on page 28.
User abend code < 4000 • A non-Language Environment abendoccurred.
• The assembler user exit requested anabend for an unhandled condition ofseverity ≥2.
See the Language Environment abend codes inLanguage Environment abend codes in z/OSLanguage Environment Runtime Messages.Check for a subsystem-generated abend or auser-specified abend.
User abend code ≥ 4000 • Language Environment detected anerror and could not proceed.
• An unhandled software-raisedcondition occurred andABTERMENC(ABEND) was in effect.
• The assembler user exit requested anabend for an unhandled condition ofseverity 4.
For any abends you receive, read theappropriate explanation that is listed inLanguage Environment abend codes in z/OSLanguage Environment Runtime Messages.
System abend withTRAP(OFF)
Cause depends on type of malfunction. Respond appropriately. See the messages andcodes book of the operating system.
System abend with TRAP(ON) System-detected error. See the messages and codes information of theoperating system.
No response (wait/loop) Application logic failure. Check routine logic. Ensure that ERRCOUNT andDEPTHCONDLMT runtime options are set to anonzero value.
Unexpected message(message received was notfrom most recent service)
Condition that is caused by somethingthat is related to current service.
Generate a traceback by using CEE3DMP.
Incorrect output Incorrect file definitions, storageoverlay, incorrect routine mask setting,references to uninitialized variables,data input errors, or application routinelogic error.
Correct the appropriate parameters.
No output Incorrect ddname, file definitions, ormessage file setting.
Correct the appropriate parameters.
Nonzero return code fromenclave
Unhandled condition of severity 2, 3, or4, or the return code was issued by theapplication routine.
Check the Language Environment message filefor runtime message.
Unexpected output Conflicting library module names. See the name conflict resolution steps that areoutlined in Resolving library module nameconflicts between Fortran and C in z/OSLanguage Environment Programming Guide.
Interpreting runtime messagesThe first step in debugging your routine is to look up any runtime messages. To find runtime messages,check the message file:
• On z/OS, runtime messages are written by default to ddname SYSOUT. If SYSOUT is not specified, thenthe messages are written to SYSOUT=*.
• On CICS, the runtime messages are written to the CESE transient data QUEUE.
28 z/OS: z/OS Language Environment Debugging Guide
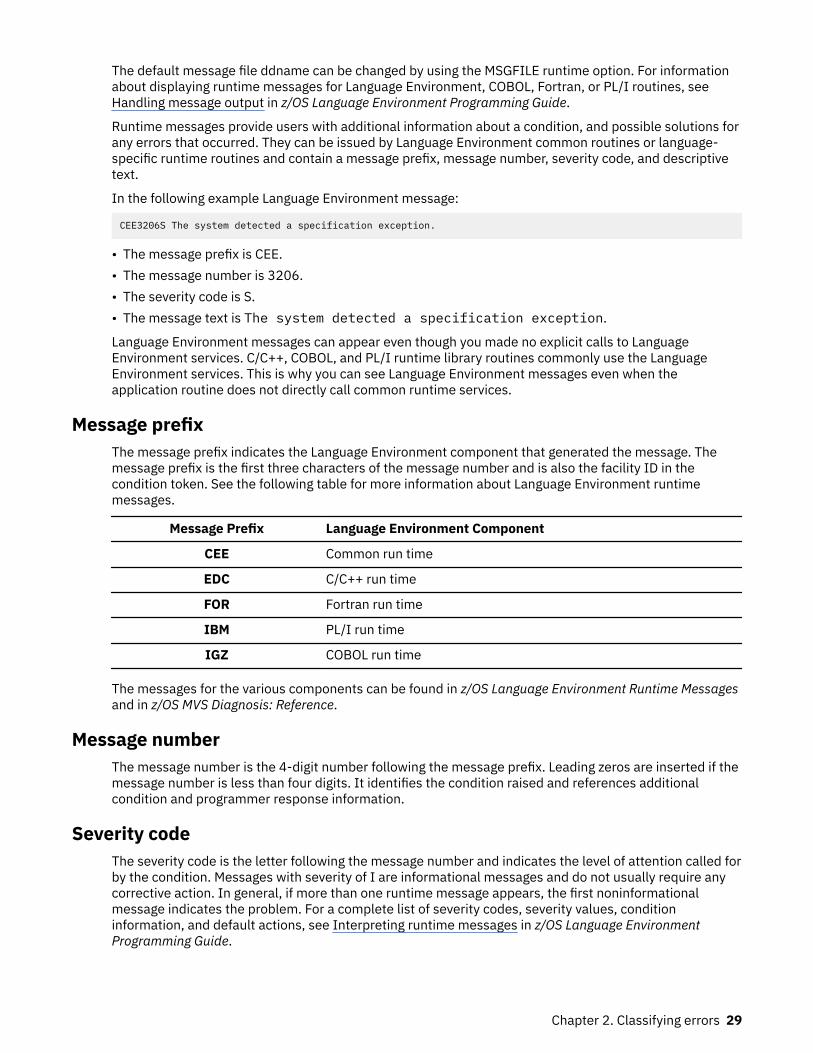
The default message file ddname can be changed by using the MSGFILE runtime option. For informationabout displaying runtime messages for Language Environment, COBOL, Fortran, or PL/I routines, seeHandling message output in z/OS Language Environment Programming Guide.
Runtime messages provide users with additional information about a condition, and possible solutions forany errors that occurred. They can be issued by Language Environment common routines or language-specific runtime routines and contain a message prefix, message number, severity code, and descriptivetext.
In the following example Language Environment message:
CEE3206S The system detected a specification exception.
• The message prefix is CEE.• The message number is 3206.• The severity code is S.• The message text is The system detected a specification exception.
Language Environment messages can appear even though you made no explicit calls to LanguageEnvironment services. C/C++, COBOL, and PL/I runtime library routines commonly use the LanguageEnvironment services. This is why you can see Language Environment messages even when theapplication routine does not directly call common runtime services.
Message prefixThe message prefix indicates the Language Environment component that generated the message. Themessage prefix is the first three characters of the message number and is also the facility ID in thecondition token. See the following table for more information about Language Environment runtimemessages.
Message Prefix Language Environment Component
CEE Common run time
EDC C/C++ run time
FOR Fortran run time
IBM PL/I run time
IGZ COBOL run time
The messages for the various components can be found in z/OS Language Environment Runtime Messagesand in z/OS MVS Diagnosis: Reference.
Message numberThe message number is the 4-digit number following the message prefix. Leading zeros are inserted if themessage number is less than four digits. It identifies the condition raised and references additionalcondition and programmer response information.
Severity codeThe severity code is the letter following the message number and indicates the level of attention called forby the condition. Messages with severity of I are informational messages and do not usually require anycorrective action. In general, if more than one runtime message appears, the first noninformationalmessage indicates the problem. For a complete list of severity codes, severity values, conditioninformation, and default actions, see Interpreting runtime messages in z/OS Language EnvironmentProgramming Guide.
Chapter 2. Classifying errors 29
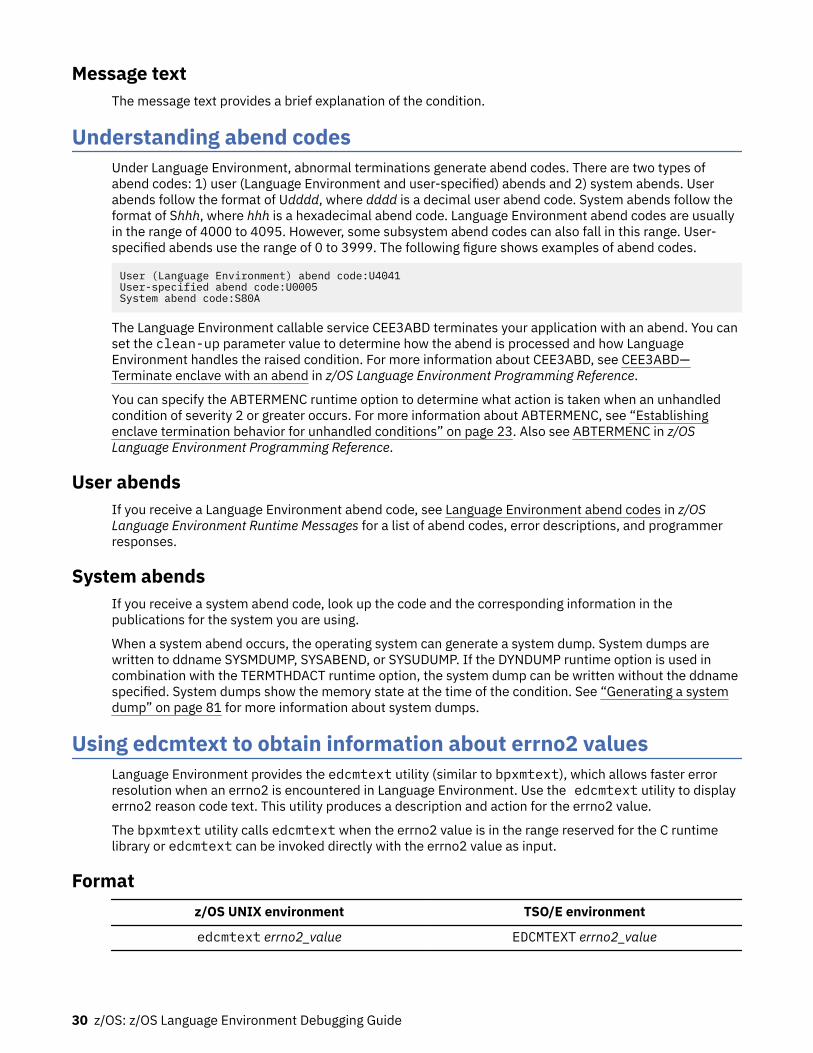
Message textThe message text provides a brief explanation of the condition.
Understanding abend codesUnder Language Environment, abnormal terminations generate abend codes. There are two types ofabend codes: 1) user (Language Environment and user-specified) abends and 2) system abends. Userabends follow the format of Udddd, where dddd is a decimal user abend code. System abends follow theformat of Shhh, where hhh is a hexadecimal abend code. Language Environment abend codes are usuallyin the range of 4000 to 4095. However, some subsystem abend codes can also fall in this range. User-specified abends use the range of 0 to 3999. The following figure shows examples of abend codes.
User (Language Environment) abend code:U4041User-specified abend code:U0005System abend code:S80A
The Language Environment callable service CEE3ABD terminates your application with an abend. You canset the clean-up parameter value to determine how the abend is processed and how LanguageEnvironment handles the raised condition. For more information about CEE3ABD, see CEE3ABD—Terminate enclave with an abend in z/OS Language Environment Programming Reference.
You can specify the ABTERMENC runtime option to determine what action is taken when an unhandledcondition of severity 2 or greater occurs. For more information about ABTERMENC, see “Establishingenclave termination behavior for unhandled conditions” on page 23. Also see ABTERMENC in z/OSLanguage Environment Programming Reference.
User abendsIf you receive a Language Environment abend code, see Language Environment abend codes in z/OSLanguage Environment Runtime Messages for a list of abend codes, error descriptions, and programmerresponses.
System abendsIf you receive a system abend code, look up the code and the corresponding information in thepublications for the system you are using.
When a system abend occurs, the operating system can generate a system dump. System dumps arewritten to ddname SYSMDUMP, SYSABEND, or SYSUDUMP. If the DYNDUMP runtime option is used incombination with the TERMTHDACT runtime option, the system dump can be written without the ddnamespecified. System dumps show the memory state at the time of the condition. See “Generating a systemdump” on page 81 for more information about system dumps.
Using edcmtext to obtain information about errno2 valuesLanguage Environment provides the edcmtext utility (similar to bpxmtext), which allows faster errorresolution when an errno2 is encountered in Language Environment. Use the edcmtext utility to displayerrno2 reason code text. This utility produces a description and action for the errno2 value.
The bpxmtext utility calls edcmtext when the errno2 value is in the range reserved for the C runtimelibrary or edcmtext can be invoked directly with the errno2 value as input.
Formatz/OS UNIX environment TSO/E environment
edcmtext errno2_value EDCMTEXT errno2_value
30 z/OS: z/OS Language Environment Debugging Guide
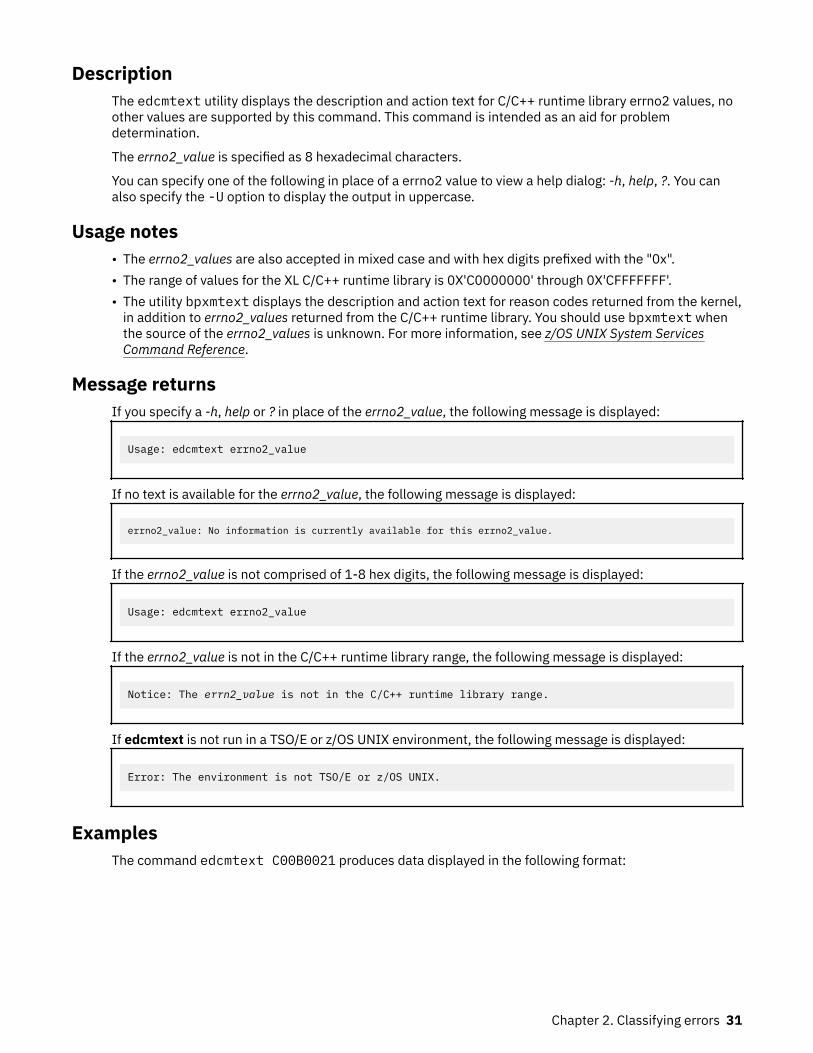
DescriptionThe edcmtext utility displays the description and action text for C/C++ runtime library errno2 values, noother values are supported by this command. This command is intended as an aid for problemdetermination.
The errno2_value is specified as 8 hexadecimal characters.
You can specify one of the following in place of a errno2 value to view a help dialog: -h, help, ?. You canalso specify the -U option to display the output in uppercase.
Usage notes• The errno2_values are also accepted in mixed case and with hex digits prefixed with the "0x".• The range of values for the XL C/C++ runtime library is 0X'C0000000' through 0X'CFFFFFFF'.• The utility bpxmtext displays the description and action text for reason codes returned from the kernel,
in addition to errno2_values returned from the C/C++ runtime library. You should use bpxmtext whenthe source of the errno2_values is unknown. For more information, see z/OS UNIX System ServicesCommand Reference.
Message returnsIf you specify a -h, help or ? in place of the errno2_value, the following message is displayed:
Usage: edcmtext errno2_value
If no text is available for the errno2_value, the following message is displayed:
errno2_value: No information is currently available for this errno2_value.
If the errno2_value is not comprised of 1-8 hex digits, the following message is displayed:
Usage: edcmtext errno2_value
If the errno2_value is not in the C/C++ runtime library range, the following message is displayed:
Notice: The errn2_value is not in the C/C++ runtime library range.
If edcmtext is not run in a TSO/E or z/OS UNIX environment, the following message is displayed:
Error: The environment is not TSO/E or z/OS UNIX.
ExamplesThe command edcmtext C00B0021 produces data displayed in the following format:
Chapter 2. Classifying errors 31
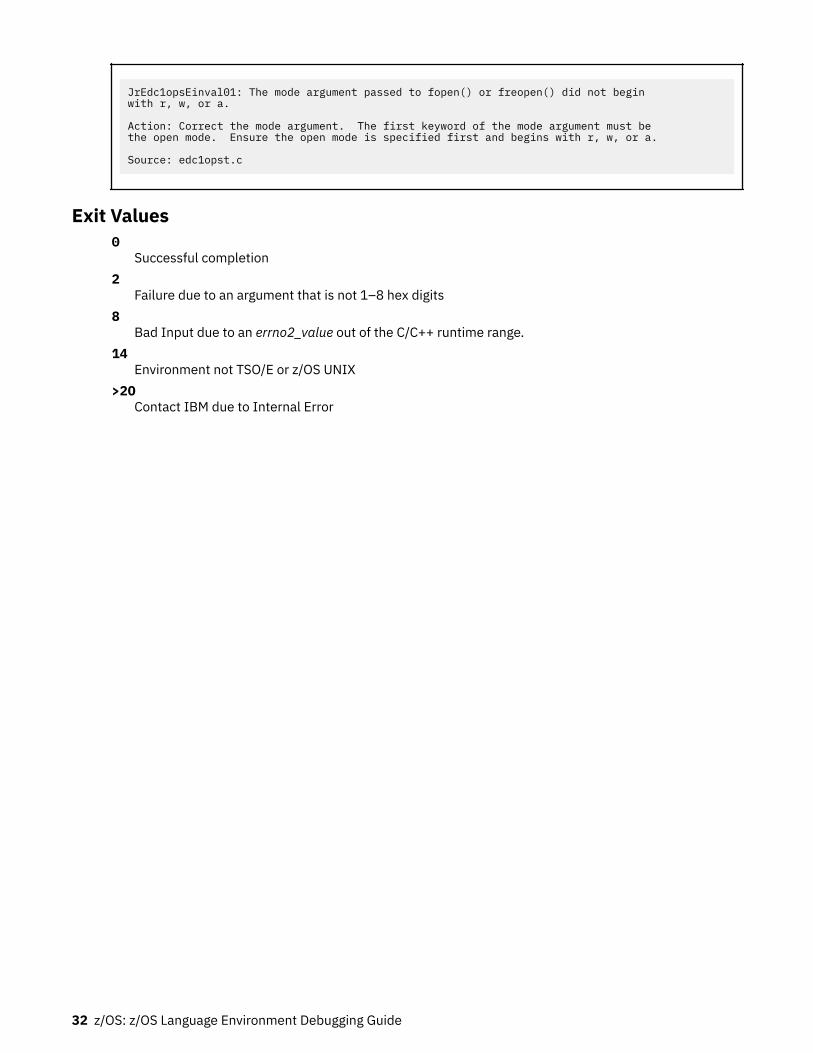
JrEdc1opsEinval01: The mode argument passed to fopen() or freopen() did not begin with r, w, or a.
Action: Correct the mode argument. The first keyword of the mode argument must be the open mode. Ensure the open mode is specified first and begins with r, w, or a.
Source: edc1opst.c
Exit Values0
Successful completion2
Failure due to an argument that is not 1–8 hex digits8
Bad Input due to an errno2_value out of the C/C++ runtime range.14
Environment not TSO/E or z/OS UNIX>20
Contact IBM due to Internal Error
32 z/OS: z/OS Language Environment Debugging Guide
Chapter 3. Using Language Environment debuggingfacilities
This chapter describes methods of debugging routines in Language Environment. Currently, mostproblems in Language Environment and member language routines can be determined through the use ofa debugging tool or through information provided in the Language Environment dump.
Debug toolsDebug tools are designed to help you detect errors early in your routine. IBM offers Debug Tool, acomprehensive compile, edit, and debug product that is provided with the C/C++ for MVS/ESA, COBOL forOS/390 & VM, COBOL for MVS & VM, PL/I for MVS & VM, and VisualAge for Java compiler products. IBMDebug Tool for z/OS is also available as a standalone product for debugging XL C/C++ applications. Formore information, see the IBM z/OS Debugger (developer.ibm.com/mainframe/products/ibm-zos-debugger).
You can use the IBM Debug Tool to examine, monitor, and control how your routines run, and debug yourroutines interactively or in batch mode. Debug Tool also provides facilities for setting breakpoints andaltering the contents and values of variables. Language Environment runtime options can be used withDebug Tool to debug or analyze your routine. See the Debug Tool publications for a detailed explanation ofhow to invoke and run Debug Tool. For more information, see the IBM z/OS Debugger(developer.ibm.com/mainframe/products/ibm-zos-debugger).
You can use dbx to debug Language Environment applications, including C/C++ programs. dbx - Use thedebugger in z/OS UNIX System Services Command Reference has information on dbx subcommands.Debugging XL C/C++ programs in z/OS UNIX System Services Programming Tools contains usageinformation.
Language Environment dump service, CEE3DMPThe following sections provide information about using the Language Environment dump service, anddescribe the contents of the Language Environment dump. The Language Environment dump service canbe invoked by the following methods:
• CEE3DMP callable service (non-64-bit only)• TERMTHDACT runtime option• HLL-specific functions
Generating a Language Environment dump with CEE3DMPFor non-64-bit, the CEE3DMP callable service generates a dump of the runtime environment for LanguageEnvironment and the member language libraries at the point of the CEE3DMP call. You can call CEE3DMPdirectly from an application routine.
Depending on the CEE3DMP options you specify, the dump can contain information about conditions,tracebacks, variables, control blocks, stack and heap storage, file status and attributes, and language-specific information.
All output from CEE3DMP is written to the default ddname CEEDUMP. CEEDUMP, by default, sends theoutput to the SDSF output queue. You can direct the output from the CEEDUMP to a specific sysout classby using the environment variable, _CEE_DMPTARG=SYSOUT(x), where x is the output class.
Under z/OS UNIX, if the application is running in an address-space created as a result of a fork(),spawn(), spawnp(), vfork(), or one of the exec family of functions, then the CEEDUMP is placed in thez/OS UNIX file system in one of the following directories in the specified order:
© Copyright IBM Corp. 1991, 2020 33
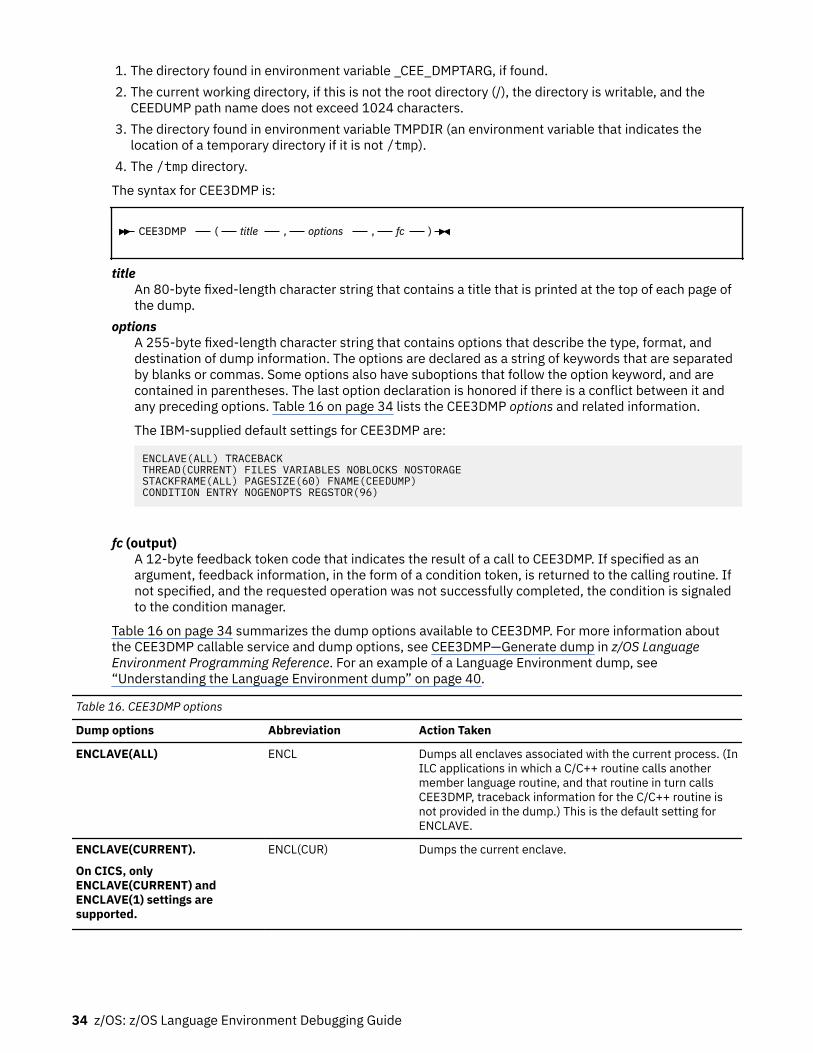
1. The directory found in environment variable _CEE_DMPTARG, if found.2. The current working directory, if this is not the root directory (/), the directory is writable, and the
CEEDUMP path name does not exceed 1024 characters.3. The directory found in environment variable TMPDIR (an environment variable that indicates the
location of a temporary directory if it is not /tmp).4. The /tmp directory.
The syntax for CEE3DMP is:
CEE3DMP ( title , options , fc )
titleAn 80-byte fixed-length character string that contains a title that is printed at the top of each page ofthe dump.
optionsA 255-byte fixed-length character string that contains options that describe the type, format, anddestination of dump information. The options are declared as a string of keywords that are separatedby blanks or commas. Some options also have suboptions that follow the option keyword, and arecontained in parentheses. The last option declaration is honored if there is a conflict between it andany preceding options. Table 16 on page 34 lists the CEE3DMP options and related information.
The IBM-supplied default settings for CEE3DMP are:
ENCLAVE(ALL) TRACEBACKTHREAD(CURRENT) FILES VARIABLES NOBLOCKS NOSTORAGESTACKFRAME(ALL) PAGESIZE(60) FNAME(CEEDUMP)CONDITION ENTRY NOGENOPTS REGSTOR(96)
fc (output)A 12-byte feedback token code that indicates the result of a call to CEE3DMP. If specified as anargument, feedback information, in the form of a condition token, is returned to the calling routine. Ifnot specified, and the requested operation was not successfully completed, the condition is signaledto the condition manager.
Table 16 on page 34 summarizes the dump options available to CEE3DMP. For more information aboutthe CEE3DMP callable service and dump options, see CEE3DMP—Generate dump in z/OS LanguageEnvironment Programming Reference. For an example of a Language Environment dump, see“Understanding the Language Environment dump” on page 40.
Table 16. CEE3DMP options
Dump options Abbreviation Action Taken
ENCLAVE(ALL) ENCL Dumps all enclaves associated with the current process. (InILC applications in which a C/C++ routine calls anothermember language routine, and that routine in turn callsCEE3DMP, traceback information for the C/C++ routine isnot provided in the dump.) This is the default setting forENCLAVE.
ENCLAVE(CURRENT).
On CICS, onlyENCLAVE(CURRENT) andENCLAVE(1) settings aresupported.
ENCL(CUR) Dumps the current enclave.
34 z/OS: z/OS Language Environment Debugging Guide
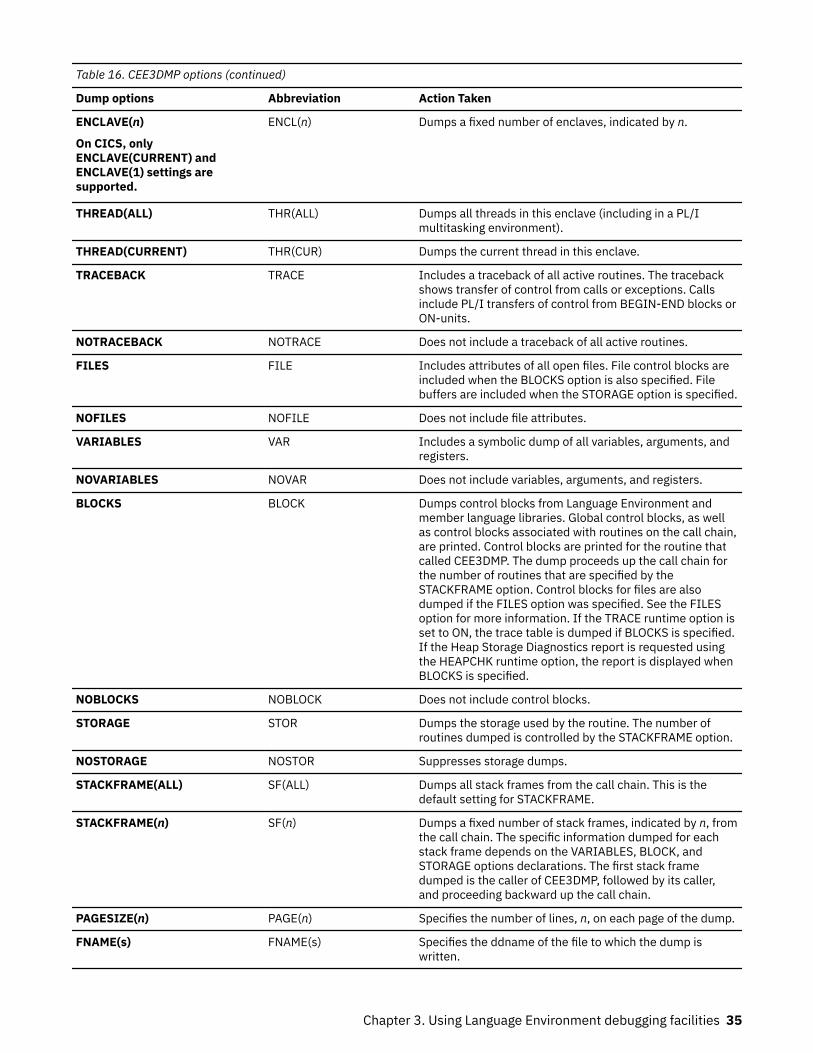
Table 16. CEE3DMP options (continued)
Dump options Abbreviation Action Taken
ENCLAVE(n)
On CICS, onlyENCLAVE(CURRENT) andENCLAVE(1) settings aresupported.
ENCL(n) Dumps a fixed number of enclaves, indicated by n.
THREAD(ALL) THR(ALL) Dumps all threads in this enclave (including in a PL/Imultitasking environment).
THREAD(CURRENT) THR(CUR) Dumps the current thread in this enclave.
TRACEBACK TRACE Includes a traceback of all active routines. The tracebackshows transfer of control from calls or exceptions. Callsinclude PL/I transfers of control from BEGIN-END blocks orON-units.
NOTRACEBACK NOTRACE Does not include a traceback of all active routines.
FILES FILE Includes attributes of all open files. File control blocks areincluded when the BLOCKS option is also specified. Filebuffers are included when the STORAGE option is specified.
NOFILES NOFILE Does not include file attributes.
VARIABLES VAR Includes a symbolic dump of all variables, arguments, andregisters.
NOVARIABLES NOVAR Does not include variables, arguments, and registers.
BLOCKS BLOCK Dumps control blocks from Language Environment andmember language libraries. Global control blocks, as wellas control blocks associated with routines on the call chain,are printed. Control blocks are printed for the routine thatcalled CEE3DMP. The dump proceeds up the call chain forthe number of routines that are specified by theSTACKFRAME option. Control blocks for files are alsodumped if the FILES option was specified. See the FILESoption for more information. If the TRACE runtime option isset to ON, the trace table is dumped if BLOCKS is specified.If the Heap Storage Diagnostics report is requested usingthe HEAPCHK runtime option, the report is displayed whenBLOCKS is specified.
NOBLOCKS NOBLOCK Does not include control blocks.
STORAGE STOR Dumps the storage used by the routine. The number ofroutines dumped is controlled by the STACKFRAME option.
NOSTORAGE NOSTOR Suppresses storage dumps.
STACKFRAME(ALL) SF(ALL) Dumps all stack frames from the call chain. This is thedefault setting for STACKFRAME.
STACKFRAME(n) SF(n) Dumps a fixed number of stack frames, indicated by n, fromthe call chain. The specific information dumped for eachstack frame depends on the VARIABLES, BLOCK, andSTORAGE options declarations. The first stack framedumped is the caller of CEE3DMP, followed by its caller,and proceeding backward up the call chain.
PAGESIZE(n) PAGE(n) Specifies the number of lines, n, on each page of the dump.
FNAME(s) FNAME(s) Specifies the ddname of the file to which the dump iswritten.
Chapter 3. Using Language Environment debugging facilities 35
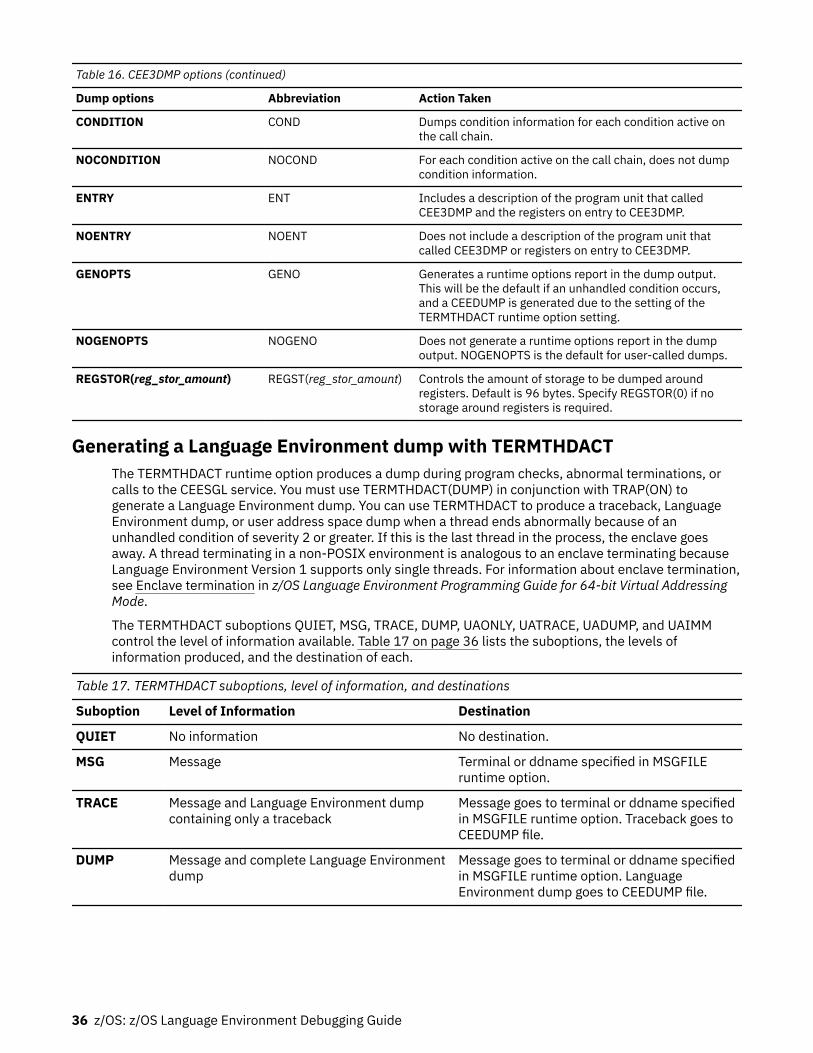
Table 16. CEE3DMP options (continued)
Dump options Abbreviation Action Taken
CONDITION COND Dumps condition information for each condition active onthe call chain.
NOCONDITION NOCOND For each condition active on the call chain, does not dumpcondition information.
ENTRY ENT Includes a description of the program unit that calledCEE3DMP and the registers on entry to CEE3DMP.
NOENTRY NOENT Does not include a description of the program unit thatcalled CEE3DMP or registers on entry to CEE3DMP.
GENOPTS GENO Generates a runtime options report in the dump output.This will be the default if an unhandled condition occurs,and a CEEDUMP is generated due to the setting of theTERMTHDACT runtime option setting.
NOGENOPTS NOGENO Does not generate a runtime options report in the dumpoutput. NOGENOPTS is the default for user-called dumps.
REGSTOR(reg_stor_amount) REGST(reg_stor_amount) Controls the amount of storage to be dumped aroundregisters. Default is 96 bytes. Specify REGSTOR(0) if nostorage around registers is required.
Generating a Language Environment dump with TERMTHDACTThe TERMTHDACT runtime option produces a dump during program checks, abnormal terminations, orcalls to the CEESGL service. You must use TERMTHDACT(DUMP) in conjunction with TRAP(ON) togenerate a Language Environment dump. You can use TERMTHDACT to produce a traceback, LanguageEnvironment dump, or user address space dump when a thread ends abnormally because of anunhandled condition of severity 2 or greater. If this is the last thread in the process, the enclave goesaway. A thread terminating in a non-POSIX environment is analogous to an enclave terminating becauseLanguage Environment Version 1 supports only single threads. For information about enclave termination,see Enclave termination in z/OS Language Environment Programming Guide for 64-bit Virtual AddressingMode.
The TERMTHDACT suboptions QUIET, MSG, TRACE, DUMP, UAONLY, UATRACE, UADUMP, and UAIMMcontrol the level of information available. Table 17 on page 36 lists the suboptions, the levels ofinformation produced, and the destination of each.
Table 17. TERMTHDACT suboptions, level of information, and destinations
Suboption Level of Information Destination
QUIET No information No destination.
MSG Message Terminal or ddname specified in MSGFILEruntime option.
TRACE Message and Language Environment dumpcontaining only a traceback
Message goes to terminal or ddname specifiedin MSGFILE runtime option. Traceback goes toCEEDUMP file.
DUMP Message and complete Language Environmentdump
Message goes to terminal or ddname specifiedin MSGFILE runtime option. LanguageEnvironment dump goes to CEEDUMP file.
36 z/OS: z/OS Language Environment Debugging Guide
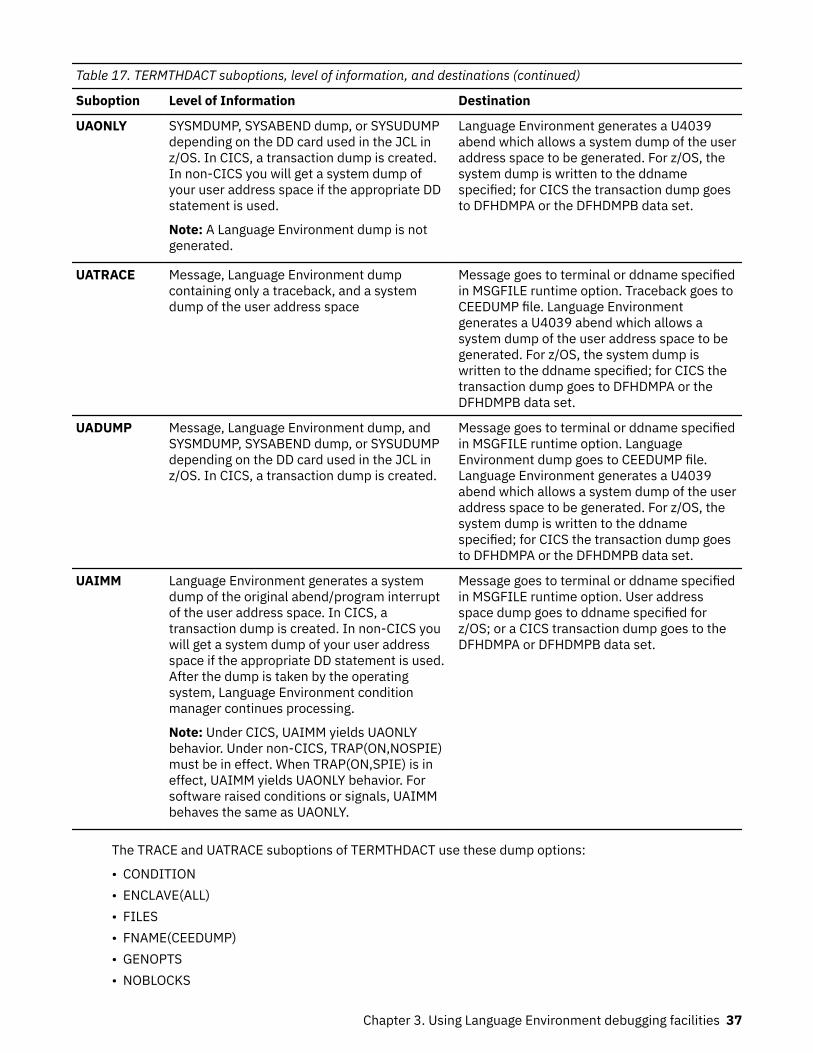
Table 17. TERMTHDACT suboptions, level of information, and destinations (continued)
Suboption Level of Information Destination
UAONLY SYSMDUMP, SYSABEND dump, or SYSUDUMPdepending on the DD card used in the JCL inz/OS. In CICS, a transaction dump is created.In non-CICS you will get a system dump ofyour user address space if the appropriate DDstatement is used.
Note: A Language Environment dump is notgenerated.
Language Environment generates a U4039abend which allows a system dump of the useraddress space to be generated. For z/OS, thesystem dump is written to the ddnamespecified; for CICS the transaction dump goesto DFHDMPA or the DFHDMPB data set.
UATRACE Message, Language Environment dumpcontaining only a traceback, and a systemdump of the user address space
Message goes to terminal or ddname specifiedin MSGFILE runtime option. Traceback goes toCEEDUMP file. Language Environmentgenerates a U4039 abend which allows asystem dump of the user address space to begenerated. For z/OS, the system dump iswritten to the ddname specified; for CICS thetransaction dump goes to DFHDMPA or theDFHDMPB data set.
UADUMP Message, Language Environment dump, andSYSMDUMP, SYSABEND dump, or SYSUDUMPdepending on the DD card used in the JCL inz/OS. In CICS, a transaction dump is created.
Message goes to terminal or ddname specifiedin MSGFILE runtime option. LanguageEnvironment dump goes to CEEDUMP file.Language Environment generates a U4039abend which allows a system dump of the useraddress space to be generated. For z/OS, thesystem dump is written to the ddnamespecified; for CICS the transaction dump goesto DFHDMPA or the DFHDMPB data set.
UAIMM Language Environment generates a systemdump of the original abend/program interruptof the user address space. In CICS, atransaction dump is created. In non-CICS youwill get a system dump of your user addressspace if the appropriate DD statement is used.After the dump is taken by the operatingsystem, Language Environment conditionmanager continues processing.
Note: Under CICS, UAIMM yields UAONLYbehavior. Under non-CICS, TRAP(ON,NOSPIE)must be in effect. When TRAP(ON,SPIE) is ineffect, UAIMM yields UAONLY behavior. Forsoftware raised conditions or signals, UAIMMbehaves the same as UAONLY.
Message goes to terminal or ddname specifiedin MSGFILE runtime option. User addressspace dump goes to ddname specified forz/OS; or a CICS transaction dump goes to theDFHDMPA or DFHDMPB data set.
The TRACE and UATRACE suboptions of TERMTHDACT use these dump options:
• CONDITION• ENCLAVE(ALL)• FILES• FNAME(CEEDUMP)• GENOPTS• NOBLOCKS
Chapter 3. Using Language Environment debugging facilities 37
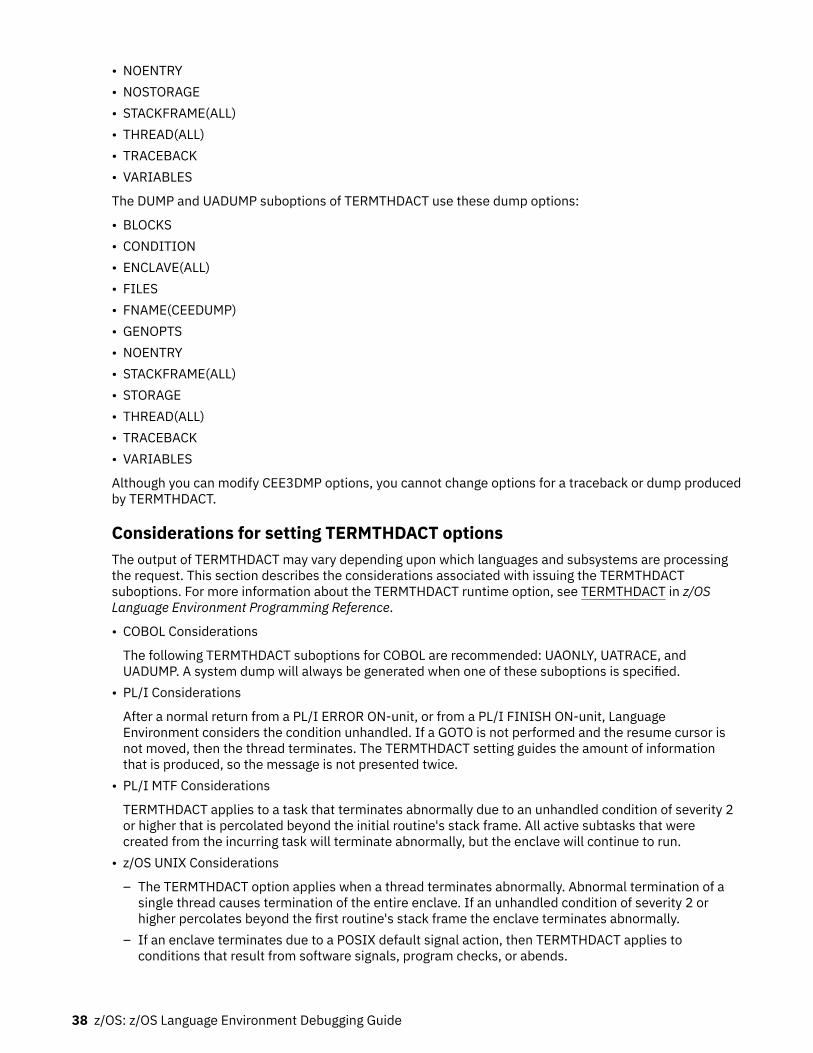
• NOENTRY• NOSTORAGE• STACKFRAME(ALL)• THREAD(ALL)• TRACEBACK• VARIABLES
The DUMP and UADUMP suboptions of TERMTHDACT use these dump options:
• BLOCKS• CONDITION• ENCLAVE(ALL)• FILES• FNAME(CEEDUMP)• GENOPTS• NOENTRY• STACKFRAME(ALL)• STORAGE• THREAD(ALL)• TRACEBACK• VARIABLES
Although you can modify CEE3DMP options, you cannot change options for a traceback or dump producedby TERMTHDACT.
Considerations for setting TERMTHDACT optionsThe output of TERMTHDACT may vary depending upon which languages and subsystems are processingthe request. This section describes the considerations associated with issuing the TERMTHDACTsuboptions. For more information about the TERMTHDACT runtime option, see TERMTHDACT in z/OSLanguage Environment Programming Reference.
• COBOL Considerations
The following TERMTHDACT suboptions for COBOL are recommended: UAONLY, UATRACE, andUADUMP. A system dump will always be generated when one of these suboptions is specified.
• PL/I Considerations
After a normal return from a PL/I ERROR ON-unit, or from a PL/I FINISH ON-unit, LanguageEnvironment considers the condition unhandled. If a GOTO is not performed and the resume cursor isnot moved, then the thread terminates. The TERMTHDACT setting guides the amount of informationthat is produced, so the message is not presented twice.
• PL/I MTF Considerations
TERMTHDACT applies to a task that terminates abnormally due to an unhandled condition of severity 2or higher that is percolated beyond the initial routine's stack frame. All active subtasks that werecreated from the incurring task will terminate abnormally, but the enclave will continue to run.
• z/OS UNIX Considerations
– The TERMTHDACT option applies when a thread terminates abnormally. Abnormal termination of asingle thread causes termination of the entire enclave. If an unhandled condition of severity 2 orhigher percolates beyond the first routine's stack frame the enclave terminates abnormally.
– If an enclave terminates due to a POSIX default signal action, then TERMTHDACT applies toconditions that result from software signals, program checks, or abends.
38 z/OS: z/OS Language Environment Debugging Guide
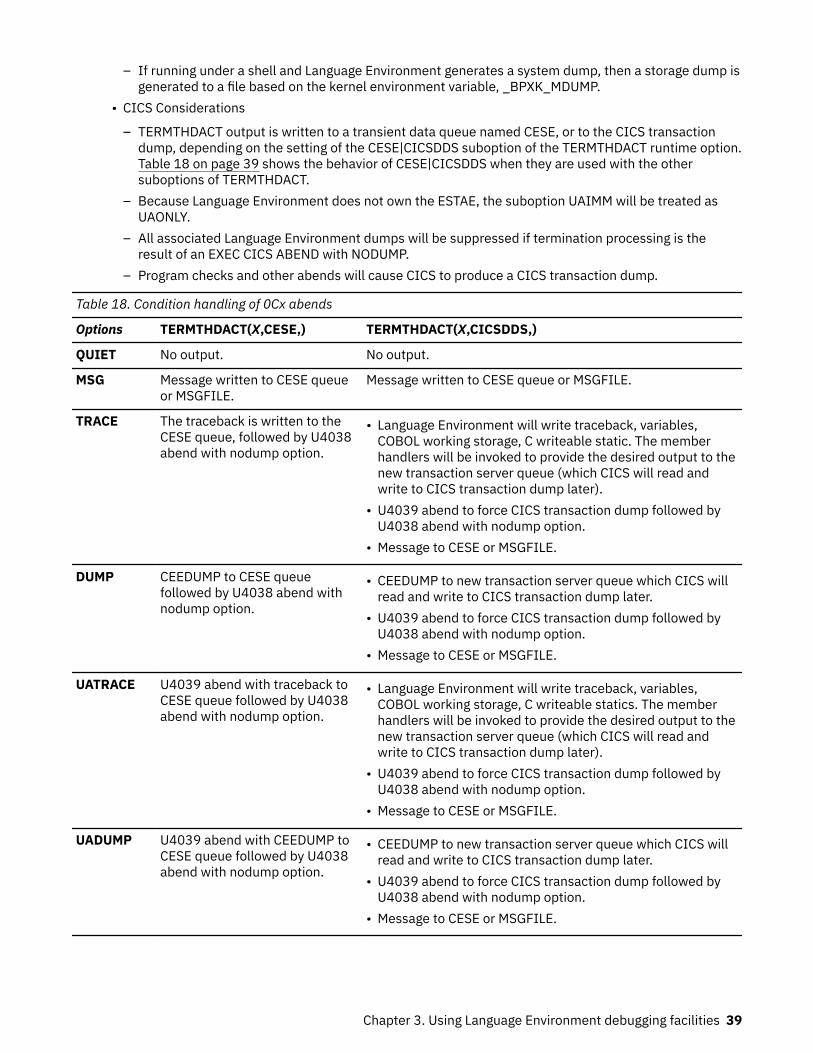
– If running under a shell and Language Environment generates a system dump, then a storage dump isgenerated to a file based on the kernel environment variable, _BPXK_MDUMP.
• CICS Considerations
– TERMTHDACT output is written to a transient data queue named CESE, or to the CICS transactiondump, depending on the setting of the CESE|CICSDDS suboption of the TERMTHDACT runtime option.Table 18 on page 39 shows the behavior of CESE|CICSDDS when they are used with the othersuboptions of TERMTHDACT.
– Because Language Environment does not own the ESTAE, the suboption UAIMM will be treated asUAONLY.
– All associated Language Environment dumps will be suppressed if termination processing is theresult of an EXEC CICS ABEND with NODUMP.
– Program checks and other abends will cause CICS to produce a CICS transaction dump.
Table 18. Condition handling of 0Cx abends
Options TERMTHDACT(X,CESE,) TERMTHDACT(X,CICSDDS,)
QUIET No output. No output.
MSG Message written to CESE queueor MSGFILE.
Message written to CESE queue or MSGFILE.
TRACE The traceback is written to theCESE queue, followed by U4038abend with nodump option.
• Language Environment will write traceback, variables,COBOL working storage, C writeable static. The memberhandlers will be invoked to provide the desired output to thenew transaction server queue (which CICS will read andwrite to CICS transaction dump later).
• U4039 abend to force CICS transaction dump followed byU4038 abend with nodump option.
• Message to CESE or MSGFILE.
DUMP CEEDUMP to CESE queuefollowed by U4038 abend withnodump option.
• CEEDUMP to new transaction server queue which CICS willread and write to CICS transaction dump later.
• U4039 abend to force CICS transaction dump followed byU4038 abend with nodump option.
• Message to CESE or MSGFILE.
UATRACE U4039 abend with traceback toCESE queue followed by U4038abend with nodump option.
• Language Environment will write traceback, variables,COBOL working storage, C writeable statics. The memberhandlers will be invoked to provide the desired output to thenew transaction server queue (which CICS will read andwrite to CICS transaction dump later).
• U4039 abend to force CICS transaction dump followed byU4038 abend with nodump option.
• Message to CESE or MSGFILE.
UADUMP U4039 abend with CEEDUMP toCESE queue followed by U4038abend with nodump option.
• CEEDUMP to new transaction server queue which CICS willread and write to CICS transaction dump later.
• U4039 abend to force CICS transaction dump followed byU4038 abend with nodump option.
• Message to CESE or MSGFILE.
Chapter 3. Using Language Environment debugging facilities 39
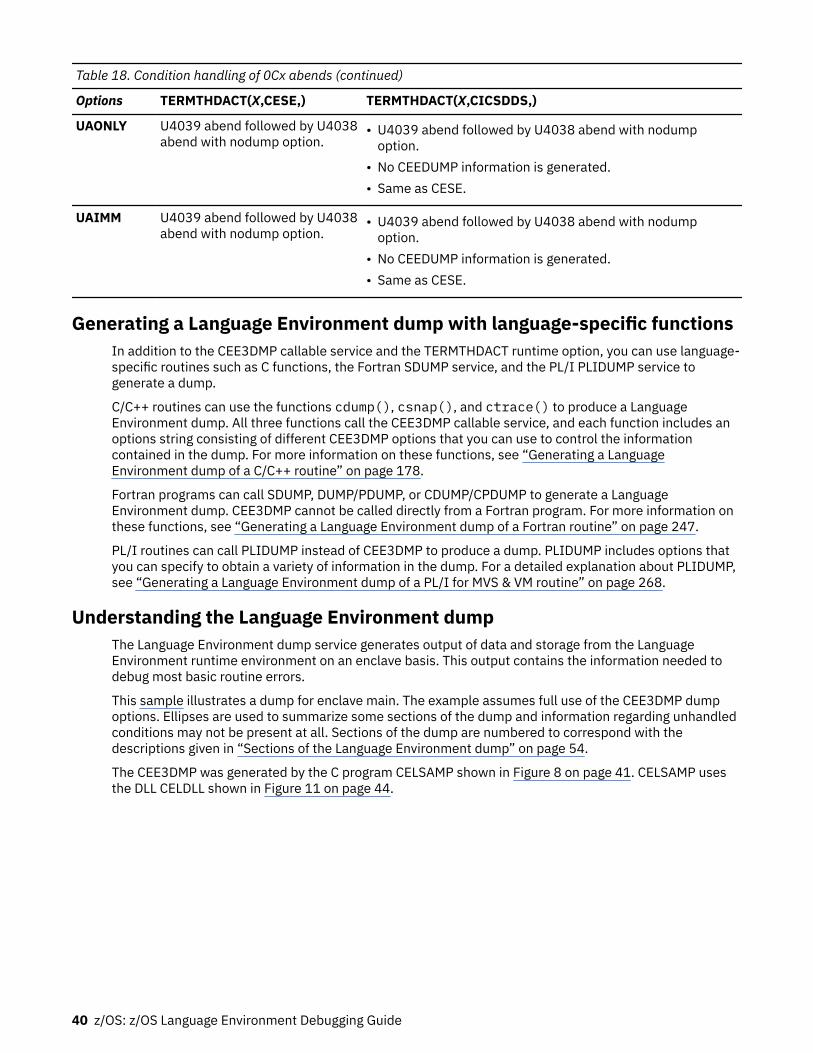
Table 18. Condition handling of 0Cx abends (continued)
Options TERMTHDACT(X,CESE,) TERMTHDACT(X,CICSDDS,)
UAONLY U4039 abend followed by U4038abend with nodump option.
• U4039 abend followed by U4038 abend with nodumpoption.
• No CEEDUMP information is generated.• Same as CESE.
UAIMM U4039 abend followed by U4038abend with nodump option.
• U4039 abend followed by U4038 abend with nodumpoption.
• No CEEDUMP information is generated.• Same as CESE.
Generating a Language Environment dump with language-specific functionsIn addition to the CEE3DMP callable service and the TERMTHDACT runtime option, you can use language-specific routines such as C functions, the Fortran SDUMP service, and the PL/I PLIDUMP service togenerate a dump.
C/C++ routines can use the functions cdump(), csnap(), and ctrace() to produce a LanguageEnvironment dump. All three functions call the CEE3DMP callable service, and each function includes anoptions string consisting of different CEE3DMP options that you can use to control the informationcontained in the dump. For more information on these functions, see “Generating a LanguageEnvironment dump of a C/C++ routine” on page 178.
Fortran programs can call SDUMP, DUMP/PDUMP, or CDUMP/CPDUMP to generate a LanguageEnvironment dump. CEE3DMP cannot be called directly from a Fortran program. For more information onthese functions, see “Generating a Language Environment dump of a Fortran routine” on page 247.
PL/I routines can call PLIDUMP instead of CEE3DMP to produce a dump. PLIDUMP includes options thatyou can specify to obtain a variety of information in the dump. For a detailed explanation about PLIDUMP,see “Generating a Language Environment dump of a PL/I for MVS & VM routine” on page 268.
Understanding the Language Environment dumpThe Language Environment dump service generates output of data and storage from the LanguageEnvironment runtime environment on an enclave basis. This output contains the information needed todebug most basic routine errors.
This sample illustrates a dump for enclave main. The example assumes full use of the CEE3DMP dumpoptions. Ellipses are used to summarize some sections of the dump and information regarding unhandledconditions may not be present at all. Sections of the dump are numbered to correspond with thedescriptions given in “Sections of the Language Environment dump” on page 54.
The CEE3DMP was generated by the C program CELSAMP shown in Figure 8 on page 41. CELSAMP usesthe DLL CELDLL shown in Figure 11 on page 44.
40 z/OS: z/OS Language Environment Debugging Guide
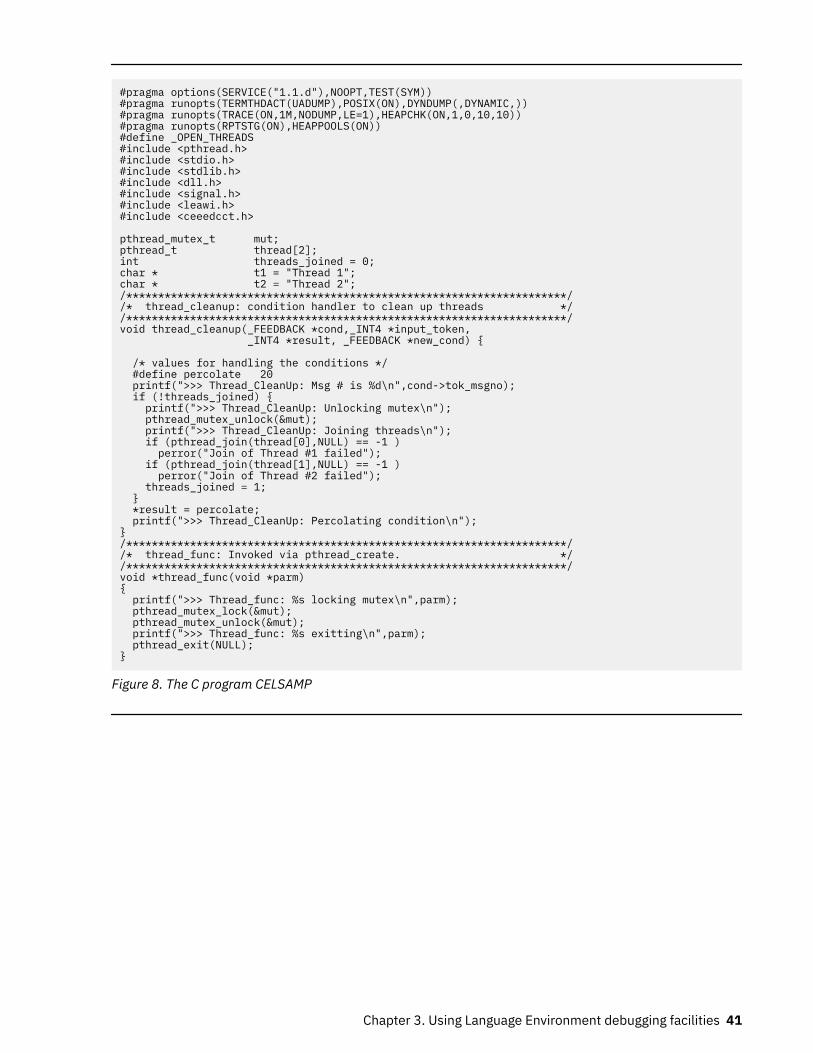
#pragma options(SERVICE("1.1.d"),NOOPT,TEST(SYM))#pragma runopts(TERMTHDACT(UADUMP),POSIX(ON),DYNDUMP(,DYNAMIC,))#pragma runopts(TRACE(ON,1M,NODUMP,LE=1),HEAPCHK(ON,1,0,10,10))#pragma runopts(RPTSTG(ON),HEAPPOOLS(ON))#define _OPEN_THREADS#include <pthread.h>#include <stdio.h>#include <stdlib.h>#include <dll.h>#include <signal.h>#include <leawi.h>#include <ceeedcct.h> pthread_mutex_t mut;pthread_t thread[2];int threads_joined = 0;char * t1 = "Thread 1";char * t2 = "Thread 2";/*********************************************************************//* thread_cleanup: condition handler to clean up threads *//*********************************************************************/void thread_cleanup(_FEEDBACK *cond,_INT4 *input_token, _INT4 *result, _FEEDBACK *new_cond) { /* values for handling the conditions */ #define percolate 20 printf(">>> Thread_CleanUp: Msg # is %d\n",cond->tok_msgno); if (!threads_joined) { printf(">>> Thread_CleanUp: Unlocking mutex\n"); pthread_mutex_unlock(&mut); printf(">>> Thread_CleanUp: Joining threads\n"); if (pthread_join(thread[0],NULL) == -1 ) perror("Join of Thread #1 failed"); if (pthread_join(thread[1],NULL) == -1 ) perror("Join of Thread #2 failed"); threads_joined = 1; } *result = percolate; printf(">>> Thread_CleanUp: Percolating condition\n");}/*********************************************************************//* thread_func: Invoked via pthread_create. *//*********************************************************************/void *thread_func(void *parm){ printf(">>> Thread_func: %s locking mutex\n",parm); pthread_mutex_lock(&mut); pthread_mutex_unlock(&mut); printf(">>> Thread_func: %s exitting\n",parm); pthread_exit(NULL);}
Figure 8. The C program CELSAMP
Chapter 3. Using Language Environment debugging facilities 41
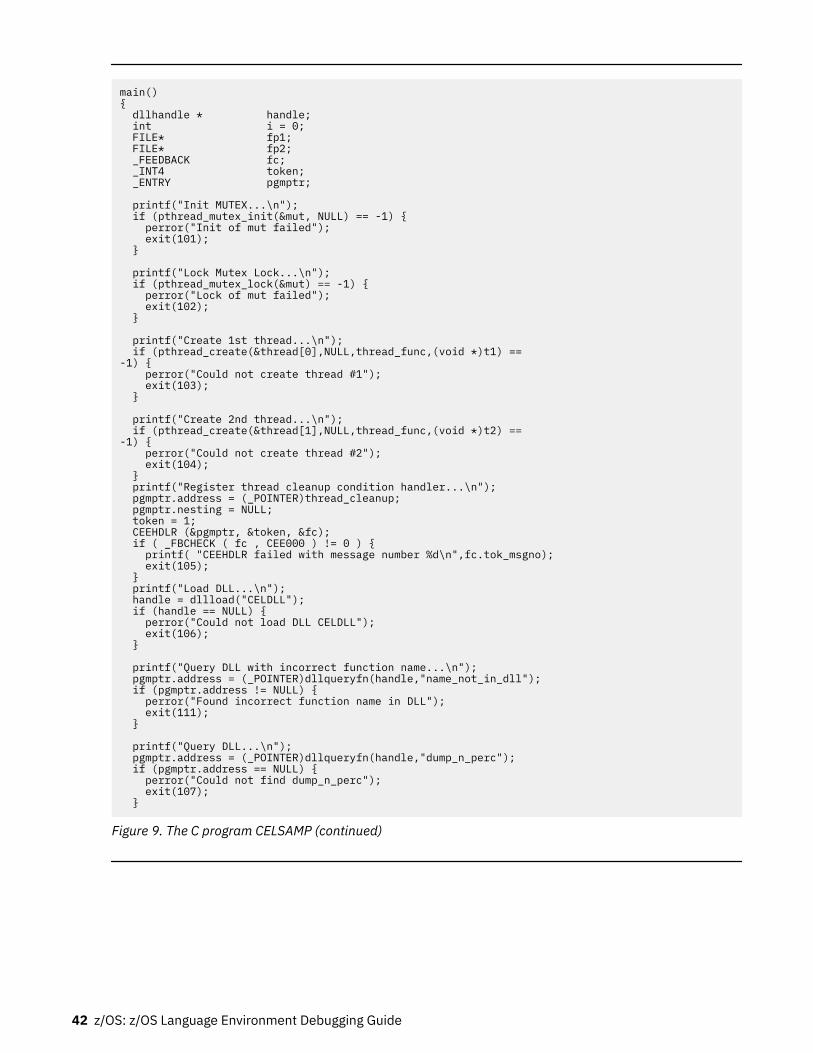
main(){ dllhandle * handle; int i = 0; FILE* fp1; FILE* fp2; _FEEDBACK fc; _INT4 token; _ENTRY pgmptr; printf("Init MUTEX...\n"); if (pthread_mutex_init(&mut, NULL) == -1) { perror("Init of mut failed"); exit(101); } printf("Lock Mutex Lock...\n"); if (pthread_mutex_lock(&mut) == -1) { perror("Lock of mut failed"); exit(102); } printf("Create 1st thread...\n"); if (pthread_create(&thread[0],NULL,thread_func,(void *)t1) ==-1) { perror("Could not create thread #1"); exit(103); } printf("Create 2nd thread...\n"); if (pthread_create(&thread[1],NULL,thread_func,(void *)t2) ==-1) { perror("Could not create thread #2"); exit(104); } printf("Register thread cleanup condition handler...\n"); pgmptr.address = (_POINTER)thread_cleanup; pgmptr.nesting = NULL; token = 1; CEEHDLR (&pgmptr, &token, &fc); if ( _FBCHECK ( fc , CEE000 ) != 0 ) { printf( "CEEHDLR failed with message number %d\n",fc.tok_msgno); exit(105); } printf("Load DLL...\n"); handle = dllload("CELDLL"); if (handle == NULL) { perror("Could not load DLL CELDLL"); exit(106); } printf("Query DLL with incorrect function name...\n"); pgmptr.address = (_POINTER)dllqueryfn(handle,"name_not_in_dll"); if (pgmptr.address != NULL) { perror("Found incorrect function name in DLL"); exit(111); } printf("Query DLL...\n"); pgmptr.address = (_POINTER)dllqueryfn(handle,"dump_n_perc"); if (pgmptr.address == NULL) { perror("Could not find dump_n_perc"); exit(107); }
Figure 9. The C program CELSAMP (continued)
42 z/OS: z/OS Language Environment Debugging Guide
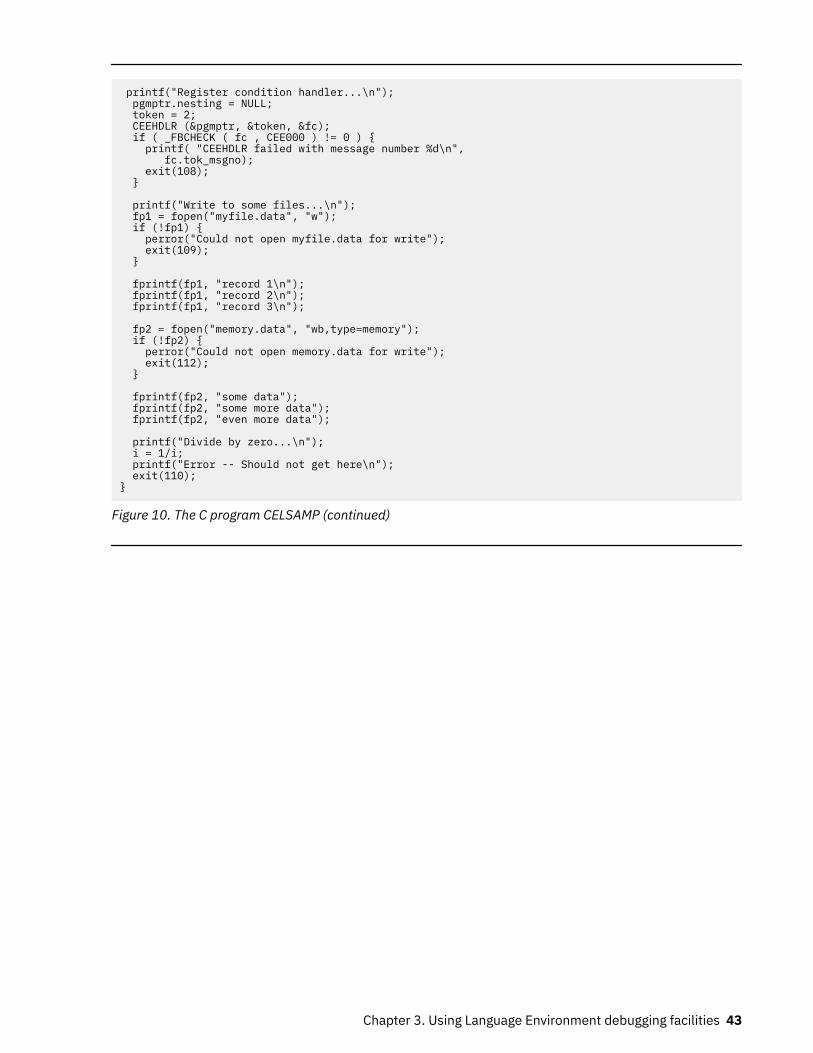
printf("Register condition handler...\n"); pgmptr.nesting = NULL; token = 2; CEEHDLR (&pgmptr, &token, &fc); if ( _FBCHECK ( fc , CEE000 ) != 0 ) { printf( "CEEHDLR failed with message number %d\n", fc.tok_msgno); exit(108); } printf("Write to some files...\n"); fp1 = fopen("myfile.data", "w"); if (!fp1) { perror("Could not open myfile.data for write"); exit(109); } fprintf(fp1, "record 1\n"); fprintf(fp1, "record 2\n"); fprintf(fp1, "record 3\n"); fp2 = fopen("memory.data", "wb,type=memory"); if (!fp2) { perror("Could not open memory.data for write"); exit(112); } fprintf(fp2, "some data"); fprintf(fp2, "some more data"); fprintf(fp2, "even more data"); printf("Divide by zero...\n"); i = 1/i; printf("Error -- Should not get here\n"); exit(110);}
Figure 10. The C program CELSAMP (continued)
Chapter 3. Using Language Environment debugging facilities 43
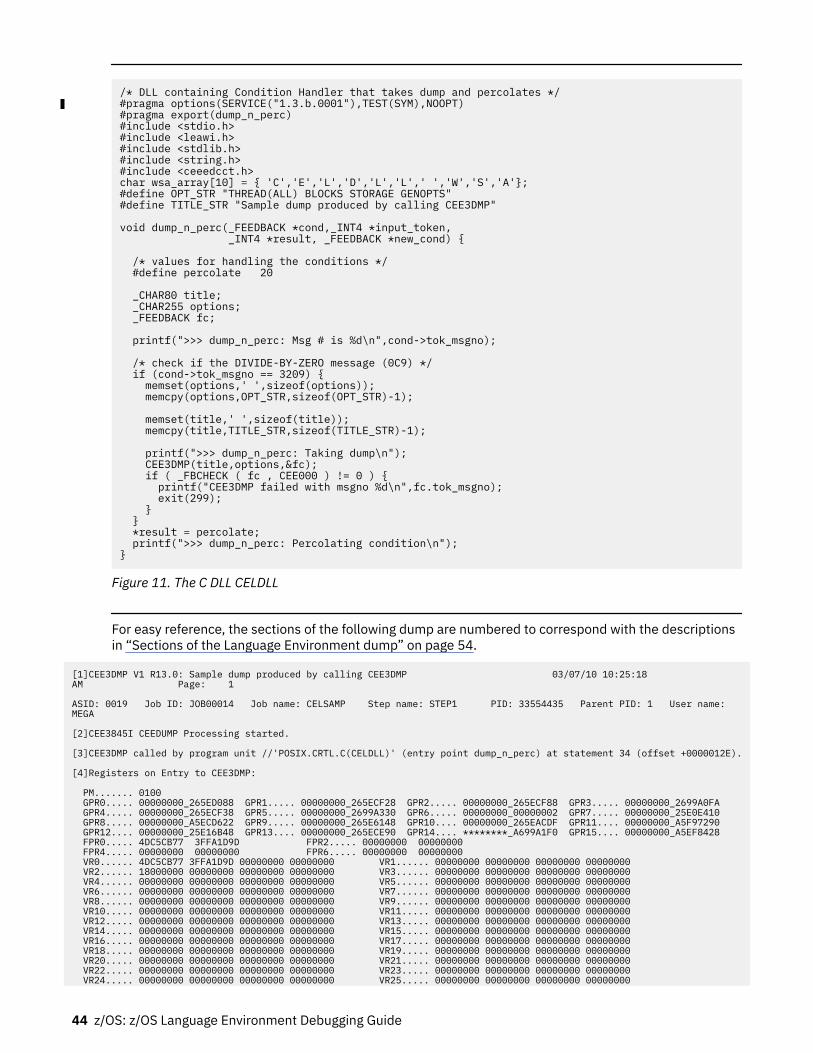
/* DLL containing Condition Handler that takes dump and percolates */#pragma options(SERVICE("1.3.b.0001"),TEST(SYM),NOOPT)#pragma export(dump_n_perc)#include <stdio.h>#include <leawi.h>#include <stdlib.h>#include <string.h>#include <ceeedcct.h>char wsa_array[10] = { 'C','E','L','D','L','L',' ','W','S','A'};#define OPT_STR "THREAD(ALL) BLOCKS STORAGE GENOPTS"#define TITLE_STR "Sample dump produced by calling CEE3DMP" void dump_n_perc(_FEEDBACK *cond,_INT4 *input_token, _INT4 *result, _FEEDBACK *new_cond) { /* values for handling the conditions */ #define percolate 20 _CHAR80 title; _CHAR255 options; _FEEDBACK fc; printf(">>> dump_n_perc: Msg # is %d\n",cond->tok_msgno); /* check if the DIVIDE-BY-ZERO message (0C9) */ if (cond->tok_msgno == 3209) { memset(options,' ',sizeof(options)); memcpy(options,OPT_STR,sizeof(OPT_STR)-1); memset(title,' ',sizeof(title)); memcpy(title,TITLE_STR,sizeof(TITLE_STR)-1); printf(">>> dump_n_perc: Taking dump\n"); CEE3DMP(title,options,&fc); if ( _FBCHECK ( fc , CEE000 ) != 0 ) { printf("CEE3DMP failed with msgno %d\n",fc.tok_msgno); exit(299); } } *result = percolate; printf(">>> dump_n_perc: Percolating condition\n");}
Figure 11. The C DLL CELDLL
For easy reference, the sections of the following dump are numbered to correspond with the descriptionsin “Sections of the Language Environment dump” on page 54.
[1]CEE3DMP V1 R13.0: Sample dump produced by calling CEE3DMP 03/07/10 10:25:18 AM Page: 1 ASID: 0019 Job ID: JOB00014 Job name: CELSAMP Step name: STEP1 PID: 33554435 Parent PID: 1 User name: MEGA [2]CEE3845I CEEDUMP Processing started. [3]CEE3DMP called by program unit //'POSIX.CRTL.C(CELDLL)' (entry point dump_n_perc) at statement 34 (offset +0000012E). [4]Registers on Entry to CEE3DMP: PM....... 0100 GPR0..... 00000000_265ED088 GPR1..... 00000000_265ECF28 GPR2..... 00000000_265ECF88 GPR3..... 00000000_2699A0FA GPR4..... 00000000_265ECF38 GPR5..... 00000000_2699A330 GPR6..... 00000000_00000002 GPR7..... 00000000_25E0E410 GPR8..... 00000000_A5ECD622 GPR9..... 00000000_265E6148 GPR10.... 00000000_265EACDF GPR11.... 00000000_A5F97290 GPR12.... 00000000_25E16B48 GPR13.... 00000000_265ECE90 GPR14.... ********_A699A1F0 GPR15.... 00000000_A5EF8428 FPR0..... 4DC5CB77 3FFA1D9D FPR2..... 00000000 00000000 FPR4..... 00000000 00000000 FPR6..... 00000000 00000000 VR0...... 4DC5CB77 3FFA1D9D 00000000 00000000 VR1...... 00000000 00000000 00000000 00000000 VR2...... 18000000 00000000 00000000 00000000 VR3...... 00000000 00000000 00000000 00000000 VR4...... 00000000 00000000 00000000 00000000 VR5...... 00000000 00000000 00000000 00000000 VR6...... 00000000 00000000 00000000 00000000 VR7...... 00000000 00000000 00000000 00000000 VR8...... 00000000 00000000 00000000 00000000 VR9...... 00000000 00000000 00000000 00000000 VR10..... 00000000 00000000 00000000 00000000 VR11..... 00000000 00000000 00000000 00000000 VR12..... 00000000 00000000 00000000 00000000 VR13..... 00000000 00000000 00000000 00000000 VR14..... 00000000 00000000 00000000 00000000 VR15..... 00000000 00000000 00000000 00000000 VR16..... 00000000 00000000 00000000 00000000 VR17..... 00000000 00000000 00000000 00000000 VR18..... 00000000 00000000 00000000 00000000 VR19..... 00000000 00000000 00000000 00000000 VR20..... 00000000 00000000 00000000 00000000 VR21..... 00000000 00000000 00000000 00000000 VR22..... 00000000 00000000 00000000 00000000 VR23..... 00000000 00000000 00000000 00000000 VR24..... 00000000 00000000 00000000 00000000 VR25..... 00000000 00000000 00000000 00000000
44 z/OS: z/OS Language Environment Debugging Guide
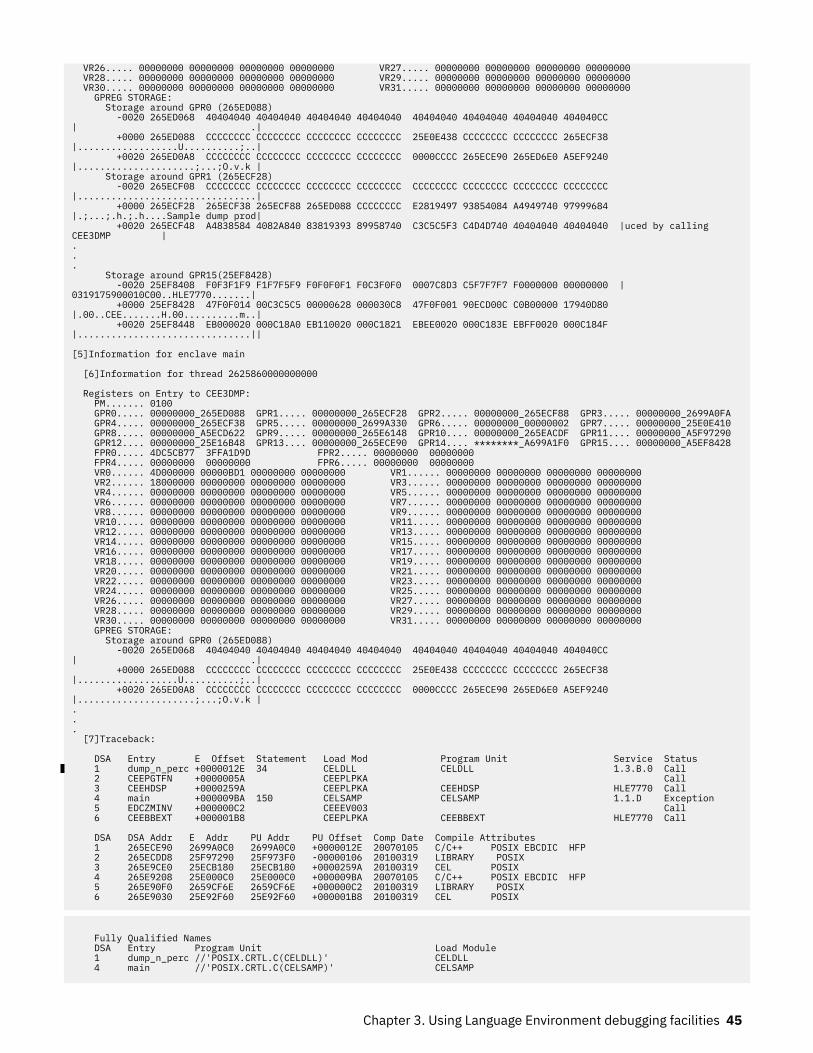
VR26..... 00000000 00000000 00000000 00000000 VR27..... 00000000 00000000 00000000 00000000 VR28..... 00000000 00000000 00000000 00000000 VR29..... 00000000 00000000 00000000 00000000 VR30..... 00000000 00000000 00000000 00000000 VR31..... 00000000 00000000 00000000 00000000 GPREG STORAGE: Storage around GPR0 (265ED088) -0020 265ED068 40404040 40404040 40404040 40404040 40404040 40404040 40404040 404040CC | .| +0000 265ED088 CCCCCCCC CCCCCCCC CCCCCCCC CCCCCCCC 25E0E438 CCCCCCCC CCCCCCCC 265ECF38 |..................U..........;..| +0020 265ED0A8 CCCCCCCC CCCCCCCC CCCCCCCC CCCCCCCC 0000CCCC 265ECE90 265ED6E0 A5EF9240 |.....................;...;O.v.k | Storage around GPR1 (265ECF28) -0020 265ECF08 CCCCCCCC CCCCCCCC CCCCCCCC CCCCCCCC CCCCCCCC CCCCCCCC CCCCCCCC CCCCCCCC |................................| +0000 265ECF28 265ECF38 265ECF88 265ED088 CCCCCCCC E2819497 93854084 A4949740 97999684 |.;...;.h.;.h....Sample dump prod| +0020 265ECF48 A4838584 4082A840 83819393 89958740 C3C5C5F3 C4D4D740 40404040 40404040 |uced by calling CEE3DMP |... Storage around GPR15(25EF8428) -0020 25EF8408 F0F3F1F9 F1F7F5F9 F0F0F0F1 F0C3F0F0 0007C8D3 C5F7F7F7 F0000000 00000000 |0319175900010C00..HLE7770.......| +0000 25EF8428 47F0F014 00C3C5C5 00000628 000030C8 47F0F001 90ECD00C C0B00000 17940D80 |.00..CEE.......H.00..........m..| +0020 25EF8448 EB000020 000C18A0 EB110020 000C1821 EBEE0020 000C183E EBFF0020 000C184F |...............................|| [5]Information for enclave main [6]Information for thread 2625860000000000 Registers on Entry to CEE3DMP: PM....... 0100 GPR0..... 00000000_265ED088 GPR1..... 00000000_265ECF28 GPR2..... 00000000_265ECF88 GPR3..... 00000000_2699A0FA GPR4..... 00000000_265ECF38 GPR5..... 00000000_2699A330 GPR6..... 00000000_00000002 GPR7..... 00000000_25E0E410 GPR8..... 00000000_A5ECD622 GPR9..... 00000000_265E6148 GPR10.... 00000000_265EACDF GPR11.... 00000000_A5F97290 GPR12.... 00000000_25E16B48 GPR13.... 00000000_265ECE90 GPR14.... ********_A699A1F0 GPR15.... 00000000_A5EF8428 FPR0..... 4DC5CB77 3FFA1D9D FPR2..... 00000000 00000000 FPR4..... 00000000 00000000 FPR6..... 00000000 00000000 VR0...... 4D000000 00000BD1 00000000 00000000 VR1...... 00000000 00000000 00000000 00000000 VR2...... 18000000 00000000 00000000 00000000 VR3...... 00000000 00000000 00000000 00000000 VR4...... 00000000 00000000 00000000 00000000 VR5...... 00000000 00000000 00000000 00000000 VR6...... 00000000 00000000 00000000 00000000 VR7...... 00000000 00000000 00000000 00000000 VR8...... 00000000 00000000 00000000 00000000 VR9...... 00000000 00000000 00000000 00000000 VR10..... 00000000 00000000 00000000 00000000 VR11..... 00000000 00000000 00000000 00000000 VR12..... 00000000 00000000 00000000 00000000 VR13..... 00000000 00000000 00000000 00000000 VR14..... 00000000 00000000 00000000 00000000 VR15..... 00000000 00000000 00000000 00000000 VR16..... 00000000 00000000 00000000 00000000 VR17..... 00000000 00000000 00000000 00000000 VR18..... 00000000 00000000 00000000 00000000 VR19..... 00000000 00000000 00000000 00000000 VR20..... 00000000 00000000 00000000 00000000 VR21..... 00000000 00000000 00000000 00000000 VR22..... 00000000 00000000 00000000 00000000 VR23..... 00000000 00000000 00000000 00000000 VR24..... 00000000 00000000 00000000 00000000 VR25..... 00000000 00000000 00000000 00000000 VR26..... 00000000 00000000 00000000 00000000 VR27..... 00000000 00000000 00000000 00000000 VR28..... 00000000 00000000 00000000 00000000 VR29..... 00000000 00000000 00000000 00000000 VR30..... 00000000 00000000 00000000 00000000 VR31..... 00000000 00000000 00000000 00000000 GPREG STORAGE: Storage around GPR0 (265ED088) -0020 265ED068 40404040 40404040 40404040 40404040 40404040 40404040 40404040 404040CC | .| +0000 265ED088 CCCCCCCC CCCCCCCC CCCCCCCC CCCCCCCC 25E0E438 CCCCCCCC CCCCCCCC 265ECF38 |..................U..........;..| +0020 265ED0A8 CCCCCCCC CCCCCCCC CCCCCCCC CCCCCCCC 0000CCCC 265ECE90 265ED6E0 A5EF9240 |.....................;...;O.v.k |... [7]Traceback: DSA Entry E Offset Statement Load Mod Program Unit Service Status 1 dump_n_perc +0000012E 34 CELDLL CELDLL 1.3.B.0 Call 2 CEEPGTFN +0000005A CEEPLPKA Call 3 CEEHDSP +0000259A CEEPLPKA CEEHDSP HLE7770 Call 4 main +000009BA 150 CELSAMP CELSAMP 1.1.D Exception 5 EDCZMINV +000000C2 CEEEV003 Call 6 CEEBBEXT +000001B8 CEEPLPKA CEEBBEXT HLE7770 Call DSA DSA Addr E Addr PU Addr PU Offset Comp Date Compile Attributes 1 265ECE90 2699A0C0 2699A0C0 +0000012E 20070105 C/C++ POSIX EBCDIC HFP 2 265ECDD8 25F97290 25F973F0 -00000106 20100319 LIBRARY POSIX 3 265E9CE0 25ECB180 25ECB180 +0000259A 20100319 CEL POSIX 4 265E9208 25E000C0 25E000C0 +000009BA 20070105 C/C++ POSIX EBCDIC HFP 5 265E90F0 2659CF6E 2659CF6E +000000C2 20100319 LIBRARY POSIX 6 265E9030 25E92F60 25E92F60 +000001B8 20100319 CEL POSIX
Fully Qualified Names DSA Entry Program Unit Load Module 1 dump_n_perc //'POSIX.CRTL.C(CELDLL)' CELDLL 4 main //'POSIX.CRTL.C(CELSAMP)' CELSAMP
Chapter 3. Using Language Environment debugging facilities 45
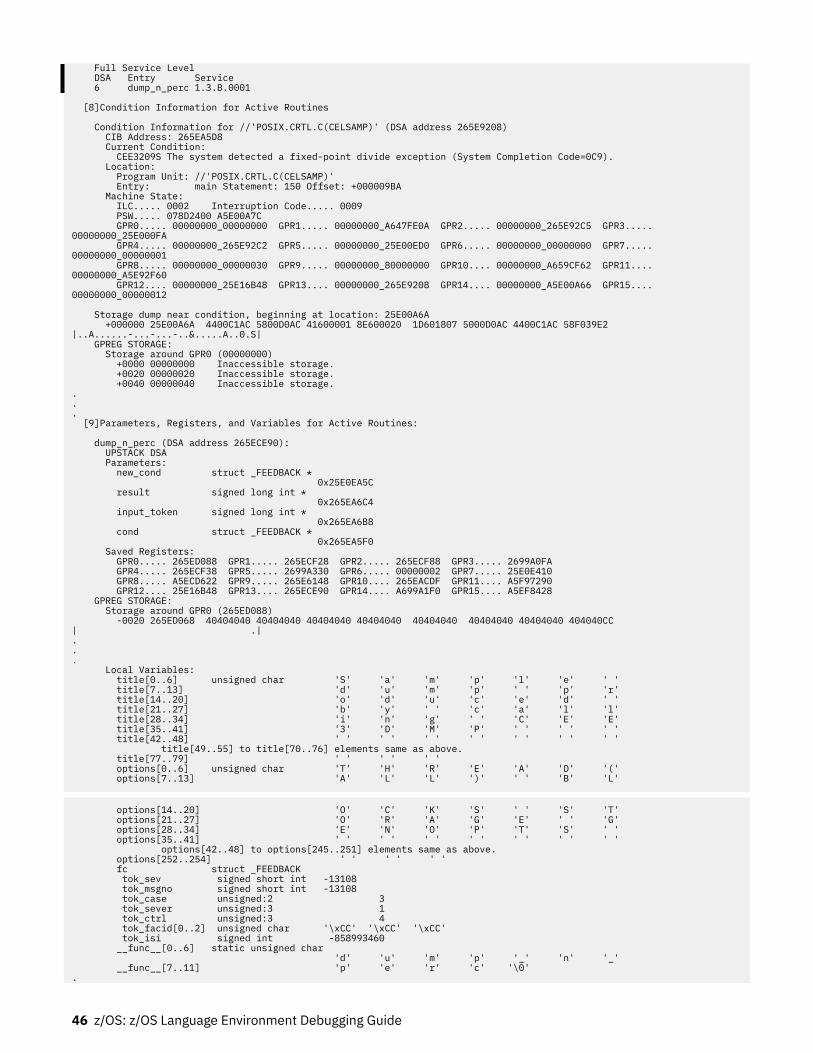
Full Service Level DSA Entry Service 6 dump_n_perc 1.3.B.0001
[8]Condition Information for Active Routines Condition Information for //'POSIX.CRTL.C(CELSAMP)' (DSA address 265E9208) CIB Address: 265EA5D8 Current Condition: CEE3209S The system detected a fixed-point divide exception (System Completion Code=0C9). Location: Program Unit: //'POSIX.CRTL.C(CELSAMP)' Entry: main Statement: 150 Offset: +000009BA Machine State: ILC..... 0002 Interruption Code..... 0009 PSW..... 078D2400 A5E00A7C GPR0..... 00000000_00000000 GPR1..... 00000000_A647FE0A GPR2..... 00000000_265E92C5 GPR3..... 00000000_25E000FA GPR4..... 00000000_265E92C2 GPR5..... 00000000_25E00ED0 GPR6..... 00000000_00000000 GPR7..... 00000000_00000001 GPR8..... 00000000_00000030 GPR9..... 00000000_80000000 GPR10.... 00000000_A659CF62 GPR11.... 00000000_A5E92F60 GPR12.... 00000000_25E16B48 GPR13.... 00000000_265E9208 GPR14.... 00000000_A5E00A66 GPR15.... 00000000_00000012 Storage dump near condition, beginning at location: 25E00A6A +000000 25E00A6A 4400C1AC 5800D0AC 41600001 8E600020 1D601807 5000D0AC 4400C1AC 58F039E2 |..A......-...-...-..&.....A..0.S| GPREG STORAGE: Storage around GPR0 (00000000) +0000 00000000 Inaccessible storage. +0020 00000020 Inaccessible storage. +0040 00000040 Inaccessible storage.... [9]Parameters, Registers, and Variables for Active Routines: dump_n_perc (DSA address 265ECE90): UPSTACK DSA Parameters: new_cond struct _FEEDBACK * 0x25E0EA5C result signed long int * 0x265EA6C4 input_token signed long int * 0x265EA6B8 cond struct _FEEDBACK * 0x265EA5F0 Saved Registers: GPR0..... 265ED088 GPR1..... 265ECF28 GPR2..... 265ECF88 GPR3..... 2699A0FA GPR4..... 265ECF38 GPR5..... 2699A330 GPR6..... 00000002 GPR7..... 25E0E410 GPR8..... A5ECD622 GPR9..... 265E6148 GPR10.... 265EACDF GPR11.... A5F97290 GPR12.... 25E16B48 GPR13.... 265ECE90 GPR14.... A699A1F0 GPR15.... A5EF8428 GPREG STORAGE: Storage around GPR0 (265ED088) -0020 265ED068 40404040 40404040 40404040 40404040 40404040 40404040 40404040 404040CC | .|... Local Variables: title[0..6] unsigned char 'S' 'a' 'm' 'p' 'l' 'e' ' ' title[7..13] 'd' 'u' 'm' 'p' ' ' 'p' 'r' title[14..20] 'o' 'd' 'u' 'c' 'e' 'd' ' ' title[21..27] 'b' 'y' ' ' 'c' 'a' 'l' 'l' title[28..34] 'i' 'n' 'g' ' ' 'C' 'E' 'E' title[35..41] '3' 'D' 'M' 'P' ' ' ' ' ' ' title[42..48] ' ' ' ' ' ' ' ' ' ' ' ' ' ' title[49..55] to title[70..76] elements same as above. title[77..79] ' ' ' ' ' ' options[0..6] unsigned char 'T' 'H' 'R' 'E' 'A' 'D' '(' options[7..13] 'A' 'L' 'L' ')' ' ' 'B' 'L'
options[14..20] 'O' 'C' 'K' 'S' ' ' 'S' 'T' options[21..27] 'O' 'R' 'A' 'G' 'E' ' ' 'G' options[28..34] 'E' 'N' 'O' 'P' 'T' 'S' ' ' options[35..41] ' ' ' ' ' ' ' ' ' ' ' ' ' ' options[42..48] to options[245..251] elements same as above. options[252..254] ' ' ' ' ' ' fc struct _FEEDBACK tok_sev signed short int -13108 tok_msgno signed short int -13108 tok_case unsigned:2 3 tok_sever unsigned:3 1 tok_ctrl unsigned:3 4 tok_facid[0..2] unsigned char '\xCC' '\xCC' '\xCC' tok_isi signed int -858993460 __func__[0..6] static unsigned char 'd' 'u' 'm' 'p' '_' 'n' '_' __func__[7..11] 'p' 'e' 'r' 'c' '\0'.
46 z/OS: z/OS Language Environment Debugging Guide
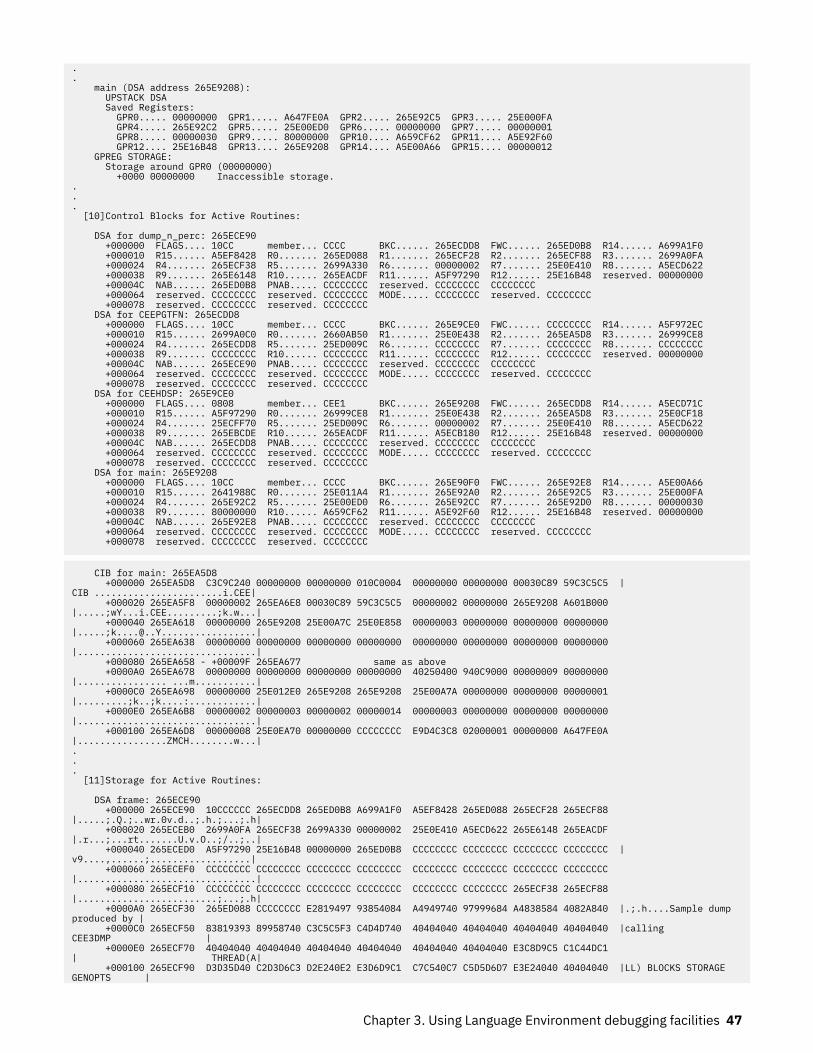
.
. main (DSA address 265E9208): UPSTACK DSA Saved Registers: GPR0..... 00000000 GPR1..... A647FE0A GPR2..... 265E92C5 GPR3..... 25E000FA GPR4..... 265E92C2 GPR5..... 25E00ED0 GPR6..... 00000000 GPR7..... 00000001 GPR8..... 00000030 GPR9..... 80000000 GPR10.... A659CF62 GPR11.... A5E92F60 GPR12.... 25E16B48 GPR13.... 265E9208 GPR14.... A5E00A66 GPR15.... 00000012 GPREG STORAGE: Storage around GPR0 (00000000) +0000 00000000 Inaccessible storage.... [10]Control Blocks for Active Routines: DSA for dump_n_perc: 265ECE90 +000000 FLAGS.... 10CC member... CCCC BKC...... 265ECDD8 FWC...... 265ED0B8 R14...... A699A1F0 +000010 R15...... A5EF8428 R0....... 265ED088 R1....... 265ECF28 R2....... 265ECF88 R3....... 2699A0FA +000024 R4....... 265ECF38 R5....... 2699A330 R6....... 00000002 R7....... 25E0E410 R8....... A5ECD622 +000038 R9....... 265E6148 R10...... 265EACDF R11...... A5F97290 R12...... 25E16B48 reserved. 00000000 +00004C NAB...... 265ED0B8 PNAB..... CCCCCCCC reserved. CCCCCCCC CCCCCCCC +000064 reserved. CCCCCCCC reserved. CCCCCCCC MODE..... CCCCCCCC reserved. CCCCCCCC +000078 reserved. CCCCCCCC reserved. CCCCCCCC DSA for CEEPGTFN: 265ECDD8 +000000 FLAGS.... 10CC member... CCCC BKC...... 265E9CE0 FWC...... CCCCCCCC R14...... A5F972EC +000010 R15...... 2699A0C0 R0....... 2660AB50 R1....... 25E0E438 R2....... 265EA5D8 R3....... 26999CE8 +000024 R4....... 265ECDD8 R5....... 25ED009C R6....... CCCCCCCC R7....... CCCCCCCC R8....... CCCCCCCC +000038 R9....... CCCCCCCC R10...... CCCCCCCC R11...... CCCCCCCC R12...... CCCCCCCC reserved. 00000000 +00004C NAB...... 265ECE90 PNAB..... CCCCCCCC reserved. CCCCCCCC CCCCCCCC +000064 reserved. CCCCCCCC reserved. CCCCCCCC MODE..... CCCCCCCC reserved. CCCCCCCC +000078 reserved. CCCCCCCC reserved. CCCCCCCC DSA for CEEHDSP: 265E9CE0 +000000 FLAGS.... 0808 member... CEE1 BKC...... 265E9208 FWC...... 265ECDD8 R14...... A5ECD71C +000010 R15...... A5F97290 R0....... 26999CE8 R1....... 25E0E438 R2....... 265EA5D8 R3....... 25E0CF18 +000024 R4....... 25ECFF70 R5....... 25ED009C R6....... 00000002 R7....... 25E0E410 R8....... A5ECD622 +000038 R9....... 265EBCDE R10...... 265EACDF R11...... A5ECB180 R12...... 25E16B48 reserved. 00000000 +00004C NAB...... 265ECDD8 PNAB..... CCCCCCCC reserved. CCCCCCCC CCCCCCCC +000064 reserved. CCCCCCCC reserved. CCCCCCCC MODE..... CCCCCCCC reserved. CCCCCCCC +000078 reserved. CCCCCCCC reserved. CCCCCCCC DSA for main: 265E9208 +000000 FLAGS.... 10CC member... CCCC BKC...... 265E90F0 FWC...... 265E92E8 R14...... A5E00A66 +000010 R15...... 2641988C R0....... 25E011A4 R1....... 265E92A0 R2....... 265E92C5 R3....... 25E000FA +000024 R4....... 265E92C2 R5....... 25E00ED0 R6....... 265E92CC R7....... 265E92D0 R8....... 00000030 +000038 R9....... 80000000 R10...... A659CF62 R11...... A5E92F60 R12...... 25E16B48 reserved. 00000000 +00004C NAB...... 265E92E8 PNAB..... CCCCCCCC reserved. CCCCCCCC CCCCCCCC +000064 reserved. CCCCCCCC reserved. CCCCCCCC MODE..... CCCCCCCC reserved. CCCCCCCC +000078 reserved. CCCCCCCC reserved. CCCCCCCC
CIB for main: 265EA5D8 +000000 265EA5D8 C3C9C240 00000000 00000000 010C0004 00000000 00000000 00030C89 59C3C5C5 |CIB .......................i.CEE| +000020 265EA5F8 00000002 265EA6E8 00030C89 59C3C5C5 00000002 00000000 265E9208 A601B000 |.....;wY...i.CEE.........;k.w...| +000040 265EA618 00000000 265E9208 25E00A7C 25E0E858 00000003 00000000 00000000 00000000 |.....;[email protected].................| +000060 265EA638 00000000 00000000 00000000 00000000 00000000 00000000 00000000 00000000 |................................| +000080 265EA658 - +00009F 265EA677 same as above +0000A0 265EA678 00000000 00000000 00000000 00000000 40250400 940C9000 00000009 00000000 |................ ...m...........| +0000C0 265EA698 00000000 25E012E0 265E9208 265E9208 25E00A7A 00000000 00000000 00000001 |.........;k..;k....:............| +0000E0 265EA6B8 00000002 00000003 00000002 00000014 00000003 00000000 00000000 00000000 |................................| +000100 265EA6D8 00000008 25E0EA70 00000000 CCCCCCCC E9D4C3C8 02000001 00000000 A647FE0A |................ZMCH........w...|... [11]Storage for Active Routines: DSA frame: 265ECE90 +000000 265ECE90 10CCCCCC 265ECDD8 265ED0B8 A699A1F0 A5EF8428 265ED088 265ECF28 265ECF88 |.....;.Q.;..wr.0v.d..;.h.;...;.h| +000020 265ECEB0 2699A0FA 265ECF38 2699A330 00000002 25E0E410 A5ECD622 265E6148 265EACDF |.r...;...rt.......U.v.O..;/..;..| +000040 265ECED0 A5F97290 25E16B48 00000000 265ED0B8 CCCCCCCC CCCCCCCC CCCCCCCC CCCCCCCC |v9....,......;..................| +000060 265ECEF0 CCCCCCCC CCCCCCCC CCCCCCCC CCCCCCCC CCCCCCCC CCCCCCCC CCCCCCCC CCCCCCCC |................................| +000080 265ECF10 CCCCCCCC CCCCCCCC CCCCCCCC CCCCCCCC CCCCCCCC CCCCCCCC 265ECF38 265ECF88 |.........................;...;.h| +0000A0 265ECF30 265ED088 CCCCCCCC E2819497 93854084 A4949740 97999684 A4838584 4082A840 |.;.h....Sample dump produced by | +0000C0 265ECF50 83819393 89958740 C3C5C5F3 C4D4D740 40404040 40404040 40404040 40404040 |calling CEE3DMP | +0000E0 265ECF70 40404040 40404040 40404040 40404040 40404040 40404040 E3C8D9C5 C1C44DC1 | THREAD(A| +000100 265ECF90 D3D35D40 C2D3D6C3 D2E240E2 E3D6D9C1 C7C540C7 C5D5D6D7 E3E24040 40404040 |LL) BLOCKS STORAGE GENOPTS |
Chapter 3. Using Language Environment debugging facilities 47
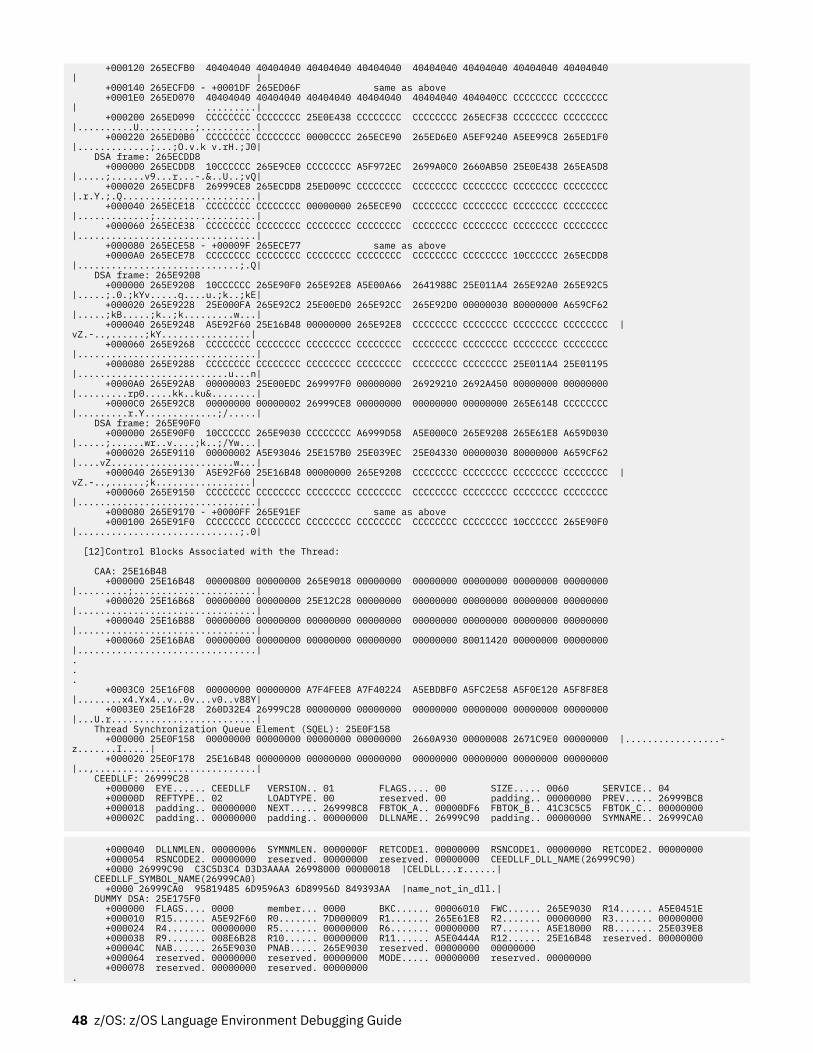
+000120 265ECFB0 40404040 40404040 40404040 40404040 40404040 40404040 40404040 40404040 | | +000140 265ECFD0 - +0001DF 265ED06F same as above +0001E0 265ED070 40404040 40404040 40404040 40404040 40404040 404040CC CCCCCCCC CCCCCCCC | .........| +000200 265ED090 CCCCCCCC CCCCCCCC 25E0E438 CCCCCCCC CCCCCCCC 265ECF38 CCCCCCCC CCCCCCCC |..........U..........;..........| +000220 265ED0B0 CCCCCCCC CCCCCCCC 0000CCCC 265ECE90 265ED6E0 A5EF9240 A5EE99C8 265ED1F0 |.............;...;O.v.k v.rH.;J0| DSA frame: 265ECDD8 +000000 265ECDD8 10CCCCCC 265E9CE0 CCCCCCCC A5F972EC 2699A0C0 2660AB50 25E0E438 265EA5D8 |.....;......v9...r...-.&..U..;vQ| +000020 265ECDF8 26999CE8 265ECDD8 25ED009C CCCCCCCC CCCCCCCC CCCCCCCC CCCCCCCC CCCCCCCC |.r.Y.;.Q........................| +000040 265ECE18 CCCCCCCC CCCCCCCC 00000000 265ECE90 CCCCCCCC CCCCCCCC CCCCCCCC CCCCCCCC |.............;..................| +000060 265ECE38 CCCCCCCC CCCCCCCC CCCCCCCC CCCCCCCC CCCCCCCC CCCCCCCC CCCCCCCC CCCCCCCC |................................| +000080 265ECE58 - +00009F 265ECE77 same as above +0000A0 265ECE78 CCCCCCCC CCCCCCCC CCCCCCCC CCCCCCCC CCCCCCCC CCCCCCCC 10CCCCCC 265ECDD8 |.............................;.Q| DSA frame: 265E9208 +000000 265E9208 10CCCCCC 265E90F0 265E92E8 A5E00A66 2641988C 25E011A4 265E92A0 265E92C5 |.....;.0.;kYv.....q....u.;k..;kE| +000020 265E9228 25E000FA 265E92C2 25E00ED0 265E92CC 265E92D0 00000030 80000000 A659CF62 |.....;kB.....;k..;k.........w...| +000040 265E9248 A5E92F60 25E16B48 00000000 265E92E8 CCCCCCCC CCCCCCCC CCCCCCCC CCCCCCCC |vZ.-..,......;kY................| +000060 265E9268 CCCCCCCC CCCCCCCC CCCCCCCC CCCCCCCC CCCCCCCC CCCCCCCC CCCCCCCC CCCCCCCC |................................| +000080 265E9288 CCCCCCCC CCCCCCCC CCCCCCCC CCCCCCCC CCCCCCCC CCCCCCCC 25E011A4 25E01195 |...........................u...n| +0000A0 265E92A8 00000003 25E00EDC 269997F0 00000000 26929210 2692A450 00000000 00000000 |.........rp0.....kk..ku&........| +0000C0 265E92C8 00000000 00000002 26999CE8 00000000 00000000 00000000 265E6148 CCCCCCCC |.........r.Y.............;/.....| DSA frame: 265E90F0 +000000 265E90F0 10CCCCCC 265E9030 CCCCCCCC A6999D58 A5E000C0 265E9208 265E61E8 A659D030 |.....;......wr..v....;k..;/Yw...| +000020 265E9110 00000002 A5E93046 25E157B0 25E039EC 25E04330 00000030 80000000 A659CF62 |....vZ......................w...| +000040 265E9130 A5E92F60 25E16B48 00000000 265E9208 CCCCCCCC CCCCCCCC CCCCCCCC CCCCCCCC |vZ.-..,......;k.................| +000060 265E9150 CCCCCCCC CCCCCCCC CCCCCCCC CCCCCCCC CCCCCCCC CCCCCCCC CCCCCCCC CCCCCCCC |................................| +000080 265E9170 - +0000FF 265E91EF same as above +000100 265E91F0 CCCCCCCC CCCCCCCC CCCCCCCC CCCCCCCC CCCCCCCC CCCCCCCC 10CCCCCC 265E90F0 |.............................;.0| [12]Control Blocks Associated with the Thread: CAA: 25E16B48 +000000 25E16B48 00000800 00000000 265E9018 00000000 00000000 00000000 00000000 00000000 |.........;......................| +000020 25E16B68 00000000 00000000 25E12C28 00000000 00000000 00000000 00000000 00000000 |................................| +000040 25E16B88 00000000 00000000 00000000 00000000 00000000 00000000 00000000 00000000 |................................| +000060 25E16BA8 00000000 00000000 00000000 00000000 00000000 80011420 00000000 00000000 |................................|... +0003C0 25E16F08 00000000 00000000 A7F4FEE8 A7F40224 A5EBDBF0 A5FC2E58 A5F0E120 A5F8F8E8 |........x4.Yx4..v..0v...v0..v88Y| +0003E0 25E16F28 260D32E4 26999C28 00000000 00000000 00000000 00000000 00000000 00000000 |...U.r..........................| Thread Synchronization Queue Element (SQEL): 25E0F158 +000000 25E0F158 00000000 00000000 00000000 00000000 2660A930 00000008 2671C9E0 00000000 |.................-z.......I.....| +000020 25E0F178 25E16B48 00000000 00000000 00000000 00000000 00000000 00000000 00000000 |..,.............................| CEEDLLF: 26999C28 +000000 EYE...... CEEDLLF VERSION.. 01 FLAGS.... 00 SIZE..... 0060 SERVICE.. 04 +00000D REFTYPE.. 02 LOADTYPE. 00 reserved. 00 padding.. 00000000 PREV..... 26999BC8 +000018 padding.. 00000000 NEXT..... 269998C8 FBTOK_A.. 00000DF6 FBTOK_B.. 41C3C5C5 FBTOK_C.. 00000000 +00002C padding.. 00000000 padding.. 00000000 DLLNAME.. 26999C90 padding.. 00000000 SYMNAME.. 26999CA0
+000040 DLLNMLEN. 00000006 SYMNMLEN. 0000000F RETCODE1. 00000000 RSNCODE1. 00000000 RETCODE2. 00000000 +000054 RSNCODE2. 00000000 reserved. 00000000 reserved. 00000000 CEEDLLF_DLL_NAME(26999C90) +0000 26999C90 C3C5D3C4 D3D3AAAA 26998000 00000018 |CELDLL...r......| CEEDLLF_SYMBOL_NAME(26999CA0) +0000 26999CA0 95819485 6D9596A3 6D89956D 849393AA |name_not_in_dll.| DUMMY DSA: 25E175F0 +000000 FLAGS.... 0000 member... 0000 BKC...... 00006010 FWC...... 265E9030 R14...... A5E0451E +000010 R15...... A5E92F60 R0....... 7D000009 R1....... 265E61E8 R2....... 00000000 R3....... 00000000 +000024 R4....... 00000000 R5....... 00000000 R6....... 00000000 R7....... A5E18000 R8....... 25E039E8 +000038 R9....... 008E6B28 R10...... 00000000 R11...... A5E0444A R12...... 25E16B48 reserved. 00000000 +00004C NAB...... 265E9030 PNAB..... 265E9030 reserved. 00000000 00000000 +000064 reserved. 00000000 reserved. 00000000 MODE..... 00000000 reserved. 00000000 +000078 reserved. 00000000 reserved. 00000000.
48 z/OS: z/OS Language Environment Debugging Guide
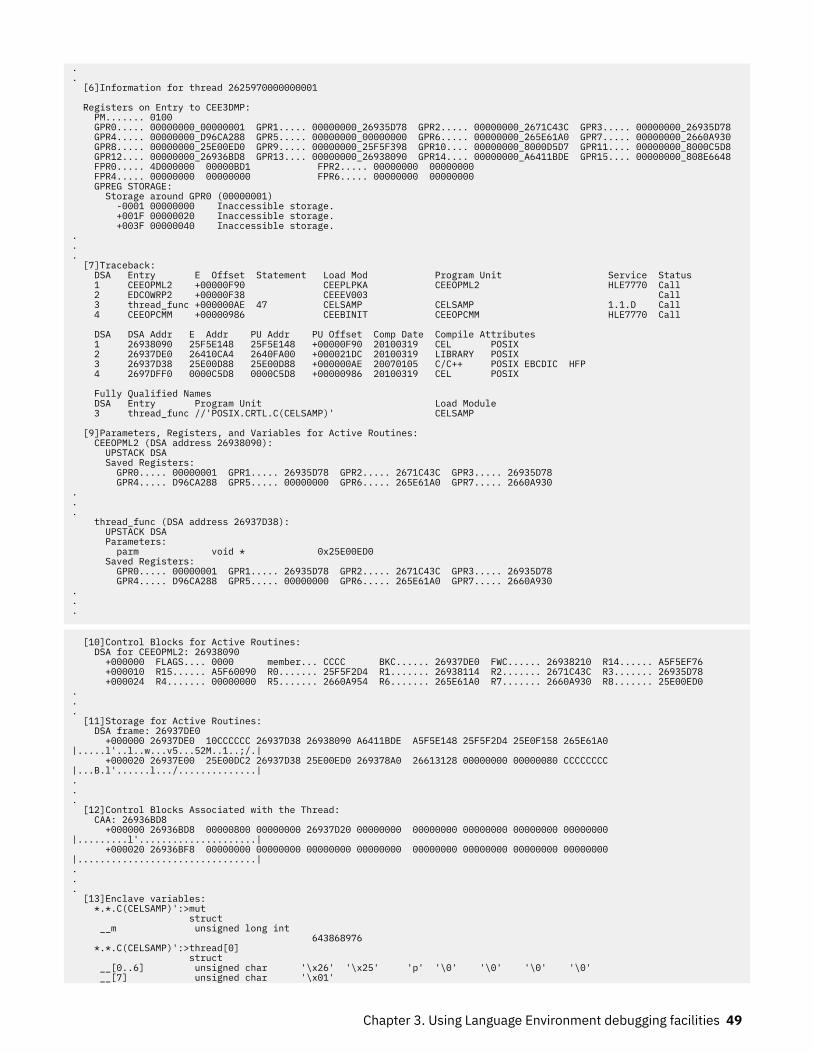
.
. [6]Information for thread 2625970000000001 Registers on Entry to CEE3DMP: PM....... 0100 GPR0..... 00000000_00000001 GPR1..... 00000000_26935D78 GPR2..... 00000000_2671C43C GPR3..... 00000000_26935D78 GPR4..... 00000000_D96CA288 GPR5..... 00000000_00000000 GPR6..... 00000000_265E61A0 GPR7..... 00000000_2660A930 GPR8..... 00000000_25E00ED0 GPR9..... 00000000_25F5F398 GPR10.... 00000000_8000D5D7 GPR11.... 00000000_8000C5D8 GPR12.... 00000000_26936BD8 GPR13.... 00000000_26938090 GPR14.... 00000000_A6411BDE GPR15.... 00000000_808E6648 FPR0..... 4D000000 00000BD1 FPR2..... 00000000 00000000 FPR4..... 00000000 00000000 FPR6..... 00000000 00000000 GPREG STORAGE: Storage around GPR0 (00000001) -0001 00000000 Inaccessible storage. +001F 00000020 Inaccessible storage. +003F 00000040 Inaccessible storage.... [7]Traceback: DSA Entry E Offset Statement Load Mod Program Unit Service Status 1 CEEOPML2 +00000F90 CEEPLPKA CEEOPML2 HLE7770 Call 2 EDCOWRP2 +00000F38 CEEEV003 Call 3 thread_func +000000AE 47 CELSAMP CELSAMP 1.1.D Call 4 CEEOPCMM +00000986 CEEBINIT CEEOPCMM HLE7770 Call DSA DSA Addr E Addr PU Addr PU Offset Comp Date Compile Attributes 1 26938090 25F5E148 25F5E148 +00000F90 20100319 CEL POSIX 2 26937DE0 26410CA4 2640FA00 +000021DC 20100319 LIBRARY POSIX 3 26937D38 25E00D88 25E00D88 +000000AE 20070105 C/C++ POSIX EBCDIC HFP 4 2697DFF0 0000C5D8 0000C5D8 +00000986 20100319 CEL POSIX Fully Qualified Names DSA Entry Program Unit Load Module 3 thread_func //'POSIX.CRTL.C(CELSAMP)' CELSAMP [9]Parameters, Registers, and Variables for Active Routines: CEEOPML2 (DSA address 26938090): UPSTACK DSA Saved Registers: GPR0..... 00000001 GPR1..... 26935D78 GPR2..... 2671C43C GPR3..... 26935D78 GPR4..... D96CA288 GPR5..... 00000000 GPR6..... 265E61A0 GPR7..... 2660A930... thread_func (DSA address 26937D38): UPSTACK DSA Parameters: parm void * 0x25E00ED0 Saved Registers: GPR0..... 00000001 GPR1..... 26935D78 GPR2..... 2671C43C GPR3..... 26935D78 GPR4..... D96CA288 GPR5..... 00000000 GPR6..... 265E61A0 GPR7..... 2660A930...
[10]Control Blocks for Active Routines: DSA for CEEOPML2: 26938090 +000000 FLAGS.... 0000 member... CCCC BKC...... 26937DE0 FWC...... 26938210 R14...... A5F5EF76 +000010 R15...... A5F60090 R0....... 25F5F2D4 R1....... 26938114 R2....... 2671C43C R3....... 26935D78 +000024 R4....... 00000000 R5....... 2660A954 R6....... 265E61A0 R7....... 2660A930 R8....... 25E00ED0... [11]Storage for Active Routines: DSA frame: 26937DE0 +000000 26937DE0 10CCCCCC 26937D38 26938090 A6411BDE A5F5E148 25F5F2D4 25E0F158 265E61A0 |.....l'..l..w...v5...52M..1..;/.| +000020 26937E00 25E00DC2 26937D38 25E00ED0 269378A0 26613128 00000000 00000080 CCCCCCCC |...B.l'......l.../..............|... [12]Control Blocks Associated with the Thread: CAA: 26936BD8 +000000 26936BD8 00000800 00000000 26937D20 00000000 00000000 00000000 00000000 00000000 |.........l'.....................| +000020 26936BF8 00000000 00000000 00000000 00000000 00000000 00000000 00000000 00000000 |................................|... [13]Enclave variables: *.*.C(CELSAMP)':>mut struct __m unsigned long int 643868976 *.*.C(CELSAMP)':>thread[0] struct __[0..6] unsigned char '\x26' '\x25' 'p' '\0' '\0' '\0' '\0' __[7] unsigned char '\x01'
Chapter 3. Using Language Environment debugging facilities 49
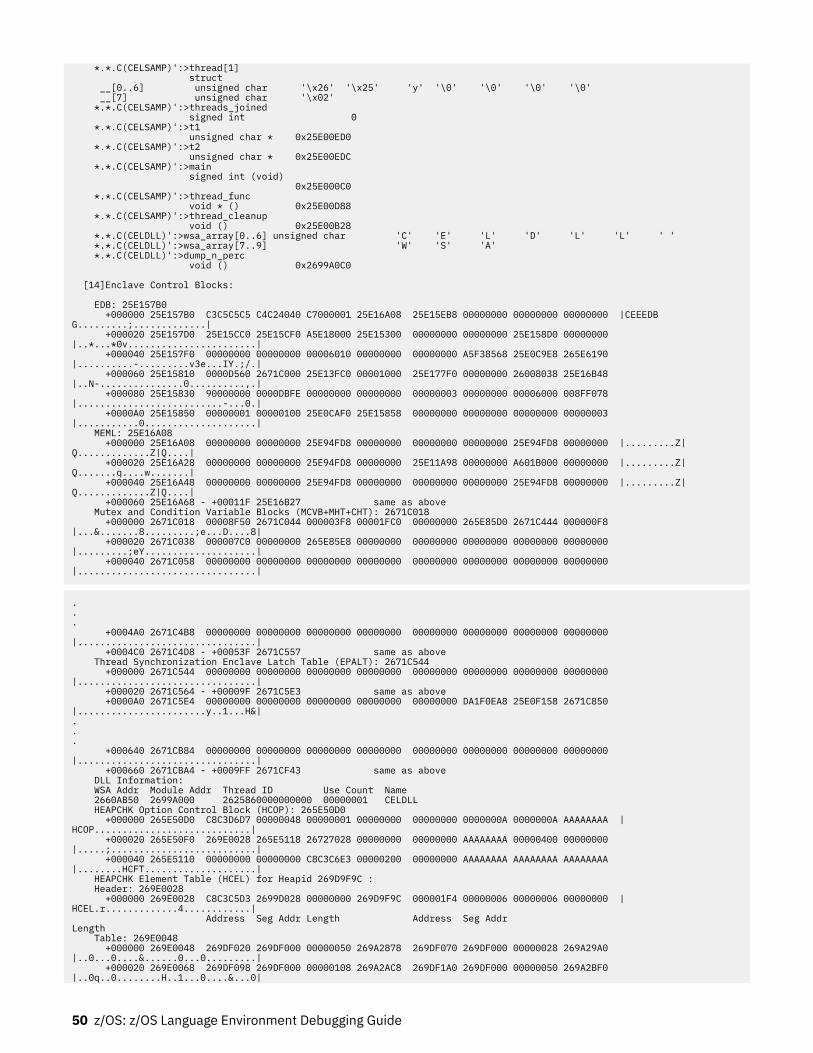
*.*.C(CELSAMP)':>thread[1] struct __[0..6] unsigned char '\x26' '\x25' 'y' '\0' '\0' '\0' '\0' __[7] unsigned char '\x02' *.*.C(CELSAMP)':>threads_joined signed int 0 *.*.C(CELSAMP)':>t1 unsigned char * 0x25E00ED0 *.*.C(CELSAMP)':>t2 unsigned char * 0x25E00EDC *.*.C(CELSAMP)':>main signed int (void) 0x25E000C0 *.*.C(CELSAMP)':>thread_func void * () 0x25E00D88 *.*.C(CELSAMP)':>thread_cleanup void () 0x25E00B28 *.*.C(CELDLL)':>wsa_array[0..6] unsigned char 'C' 'E' 'L' 'D' 'L' 'L' ' ' *.*.C(CELDLL)':>wsa_array[7..9] 'W' 'S' 'A' *.*.C(CELDLL)':>dump_n_perc void () 0x2699A0C0 [14]Enclave Control Blocks: EDB: 25E157B0 +000000 25E157B0 C3C5C5C5 C4C24040 C7000001 25E16A08 25E15EB8 00000000 00000000 00000000 |CEEEDB G.........;.............| +000020 25E157D0 25E15CC0 25E15CF0 A5E18000 25E15300 00000000 00000000 25E158D0 00000000 |..*...*0v.......................| +000040 25E157F0 00000000 00000000 00006010 00000000 00000000 A5F38568 25E0C9E8 265E6190 |..........-.........v3e...IY.;/.| +000060 25E15810 0000D560 2671C000 25E13FC0 00001000 25E177F0 00000000 26008038 25E16B48 |..N-...............0..........,.| +000080 25E15830 90000000 0000DBFE 00000000 00000000 00000003 00000000 00006000 008FF078 |..........................-...0.| +0000A0 25E15850 00000001 00000100 25E0CAF0 25E15858 00000000 00000000 00000000 00000003 |...........0....................| MEML: 25E16A08 +000000 25E16A08 00000000 00000000 25E94FD8 00000000 00000000 00000000 25E94FD8 00000000 |.........Z|Q.............Z|Q....| +000020 25E16A28 00000000 00000000 25E94FD8 00000000 25E11A98 00000000 A601B000 00000000 |.........Z|Q.......q....w.......| +000040 25E16A48 00000000 00000000 25E94FD8 00000000 00000000 00000000 25E94FD8 00000000 |.........Z|Q.............Z|Q....| +000060 25E16A68 - +00011F 25E16B27 same as above Mutex and Condition Variable Blocks (MCVB+MHT+CHT): 2671C018 +000000 2671C018 00008F50 2671C044 000003F8 00001FC0 00000000 265E85D0 2671C444 000000F8 |...&.......8.........;e...D....8| +000020 2671C038 000007C0 00000000 265E85E8 00000000 00000000 00000000 00000000 00000000 |.........;eY....................| +000040 2671C058 00000000 00000000 00000000 00000000 00000000 00000000 00000000 00000000 |................................|
.
.
. +0004A0 2671C4B8 00000000 00000000 00000000 00000000 00000000 00000000 00000000 00000000 |................................| +0004C0 2671C4D8 - +00053F 2671C557 same as above Thread Synchronization Enclave Latch Table (EPALT): 2671C544 +000000 2671C544 00000000 00000000 00000000 00000000 00000000 00000000 00000000 00000000 |................................| +000020 2671C564 - +00009F 2671C5E3 same as above +0000A0 2671C5E4 00000000 00000000 00000000 00000000 00000000 DA1F0EA8 25E0F158 2671C850 |.......................y..1...H&|... +000640 2671CB84 00000000 00000000 00000000 00000000 00000000 00000000 00000000 00000000 |................................| +000660 2671CBA4 - +0009FF 2671CF43 same as above DLL Information: WSA Addr Module Addr Thread ID Use Count Name 2660AB50 2699A000 2625860000000000 00000001 CELDLL HEAPCHK Option Control Block (HCOP): 265E50D0 +000000 265E50D0 C8C3D6D7 00000048 00000001 00000000 00000000 0000000A 0000000A AAAAAAAA |HCOP............................| +000020 265E50F0 269E0028 265E5118 26727028 00000000 00000000 AAAAAAAA 00000400 00000000 |.....;..........................| +000040 265E5110 00000000 00000000 C8C3C6E3 00000200 00000000 AAAAAAAA AAAAAAAA AAAAAAAA |........HCFT....................| HEAPCHK Element Table (HCEL) for Heapid 269D9F9C : Header: 269E0028 +000000 269E0028 C8C3C5D3 2699D028 00000000 269D9F9C 000001F4 00000006 00000006 00000000 |HCEL.r.............4............| Address Seg Addr Length Address Seg Addr Length Table: 269E0048 +000000 269E0048 269DF020 269DF000 00000050 269A2878 269DF070 269DF000 00000028 269A29A0 |..0...0....&......0...0.........| +000020 269E0068 269DF098 269DF000 00000108 269A2AC8 269DF1A0 269DF000 00000050 269A2BF0 |..0q..0........H..1...0....&...0|
50 z/OS: z/OS Language Environment Debugging Guide
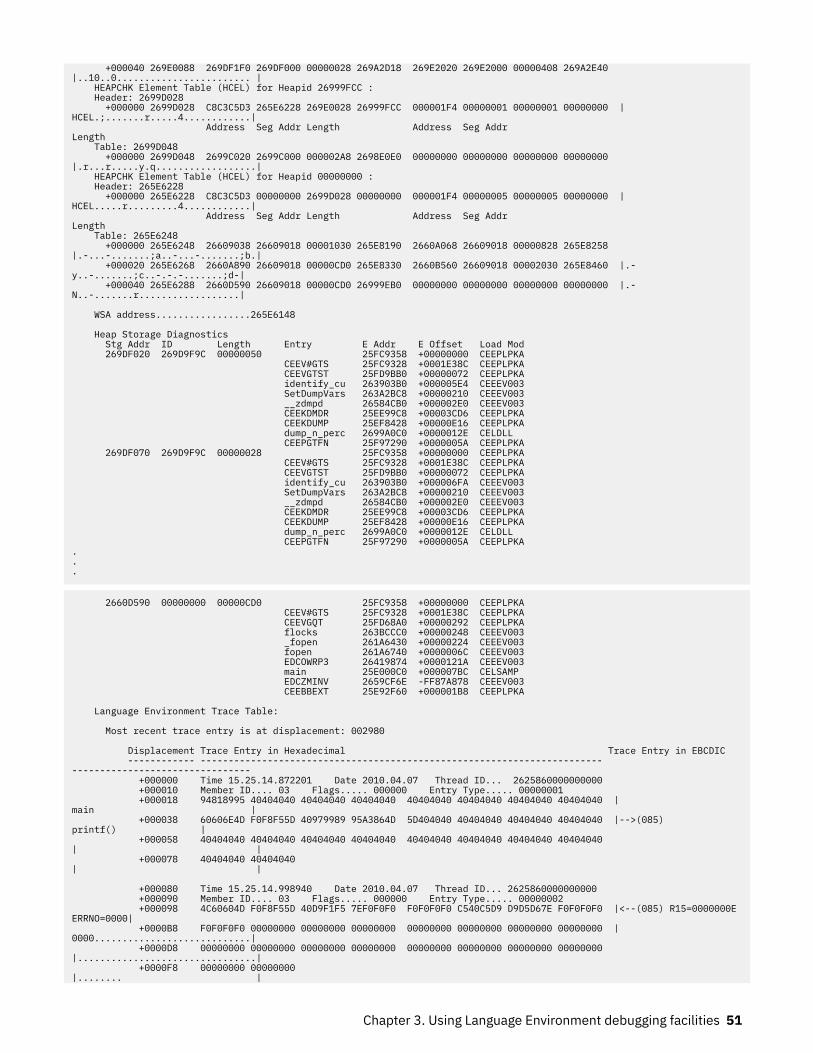
+000040 269E0088 269DF1F0 269DF000 00000028 269A2D18 269E2020 269E2000 00000408 269A2E40 |..10..0........................ | HEAPCHK Element Table (HCEL) for Heapid 26999FCC : Header: 2699D028 +000000 2699D028 C8C3C5D3 265E6228 269E0028 26999FCC 000001F4 00000001 00000001 00000000 |HCEL.;.......r.....4............| Address Seg Addr Length Address Seg Addr Length Table: 2699D048 +000000 2699D048 2699C020 2699C000 000002A8 2698E0E0 00000000 00000000 00000000 00000000 |.r...r.....y.q..................| HEAPCHK Element Table (HCEL) for Heapid 00000000 : Header: 265E6228 +000000 265E6228 C8C3C5D3 00000000 2699D028 00000000 000001F4 00000005 00000005 00000000 |HCEL.....r.........4............| Address Seg Addr Length Address Seg Addr Length Table: 265E6248 +000000 265E6248 26609038 26609018 00001030 265E8190 2660A068 26609018 00000828 265E8258 |.-...-.......;a..-...-.......;b.| +000020 265E6268 2660A890 26609018 00000CD0 265E8330 2660B560 26609018 00002030 265E8460 |.-y..-.......;c..-.-.-.......;d-| +000040 265E6288 2660D590 26609018 00000CD0 26999EB0 00000000 00000000 00000000 00000000 |.-N..-.......r..................| WSA address.................265E6148 Heap Storage Diagnostics Stg Addr ID Length Entry E Addr E Offset Load Mod 269DF020 269D9F9C 00000050 25FC9358 +00000000 CEEPLPKA CEEV#GTS 25FC9328 +0001E38C CEEPLPKA CEEVGTST 25FD9BB0 +00000072 CEEPLPKA identify_cu 263903B0 +000005E4 CEEEV003 SetDumpVars 263A2BC8 +00000210 CEEEV003 __zdmpd 26584CB0 +000002E0 CEEEV003 CEEKDMDR 25EE99C8 +00003CD6 CEEPLPKA CEEKDUMP 25EF8428 +00000E16 CEEPLPKA dump_n_perc 2699A0C0 +0000012E CELDLL CEEPGTFN 25F97290 +0000005A CEEPLPKA 269DF070 269D9F9C 00000028 25FC9358 +00000000 CEEPLPKA CEEV#GTS 25FC9328 +0001E38C CEEPLPKA CEEVGTST 25FD9BB0 +00000072 CEEPLPKA identify_cu 263903B0 +000006FA CEEEV003 SetDumpVars 263A2BC8 +00000210 CEEEV003 __zdmpd 26584CB0 +000002E0 CEEEV003 CEEKDMDR 25EE99C8 +00003CD6 CEEPLPKA CEEKDUMP 25EF8428 +00000E16 CEEPLPKA dump_n_perc 2699A0C0 +0000012E CELDLL CEEPGTFN 25F97290 +0000005A CEEPLPKA...
2660D590 00000000 00000CD0 25FC9358 +00000000 CEEPLPKA CEEV#GTS 25FC9328 +0001E38C CEEPLPKA CEEVGQT 25FD68A0 +00000292 CEEPLPKA flocks 263BCCC0 +00000248 CEEEV003 _fopen 261A6430 +00000224 CEEEV003 fopen 261A6740 +0000006C CEEEV003 EDCOWRP3 26419874 +0000121A CEEEV003 main 25E000C0 +000007BC CELSAMP EDCZMINV 2659CF6E -FF87A878 CEEEV003 CEEBBEXT 25E92F60 +000001B8 CEEPLPKA Language Environment Trace Table: Most recent trace entry is at displacement: 002980 Displacement Trace Entry in Hexadecimal Trace Entry in EBCDIC ------------ ------------------------------------------------------------------------ -------------------------------- +000000 Time 15.25.14.872201 Date 2010.04.07 Thread ID... 2625860000000000 +000010 Member ID.... 03 Flags..... 000000 Entry Type..... 00000001 +000018 94818995 40404040 40404040 40404040 40404040 40404040 40404040 40404040 |main | +000038 60606E4D F0F8F55D 40979989 95A3864D 5D404040 40404040 40404040 40404040 |-->(085) printf() | +000058 40404040 40404040 40404040 40404040 40404040 40404040 40404040 40404040 | | +000078 40404040 40404040 | | +000080 Time 15.25.14.998940 Date 2010.04.07 Thread ID... 2625860000000000 +000090 Member ID.... 03 Flags..... 000000 Entry Type..... 00000002 +000098 4C60604D F0F8F55D 40D9F1F5 7EF0F0F0 F0F0F0F0 C540C5D9 D9D5D67E F0F0F0F0 |<--(085) R15=0000000E ERRNO=0000| +0000B8 F0F0F0F0 00000000 00000000 00000000 00000000 00000000 00000000 00000000 |0000............................| +0000D8 00000000 00000000 00000000 00000000 00000000 00000000 00000000 00000000 |................................| +0000F8 00000000 00000000 |........ |
Chapter 3. Using Language Environment debugging facilities 51
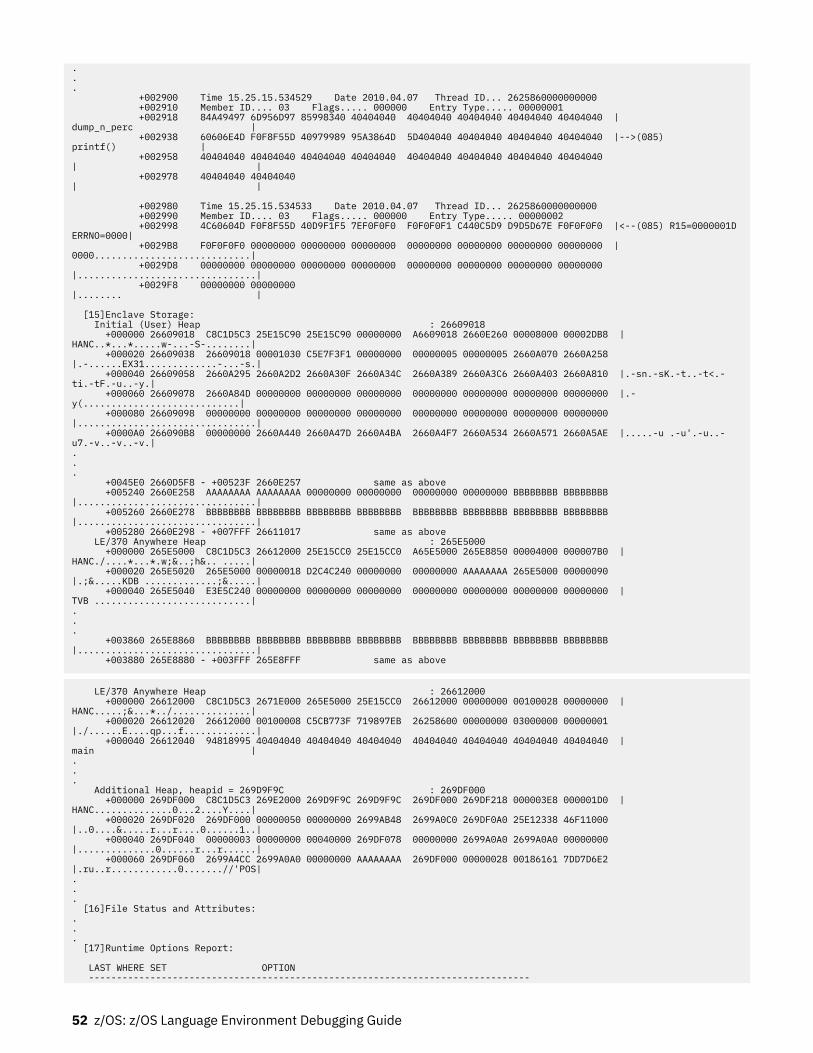
.
.
. +002900 Time 15.25.15.534529 Date 2010.04.07 Thread ID... 2625860000000000 +002910 Member ID.... 03 Flags..... 000000 Entry Type..... 00000001 +002918 84A49497 6D956D97 85998340 40404040 40404040 40404040 40404040 40404040 |dump_n_perc | +002938 60606E4D F0F8F55D 40979989 95A3864D 5D404040 40404040 40404040 40404040 |-->(085) printf() | +002958 40404040 40404040 40404040 40404040 40404040 40404040 40404040 40404040 | | +002978 40404040 40404040 | | +002980 Time 15.25.15.534533 Date 2010.04.07 Thread ID... 2625860000000000 +002990 Member ID.... 03 Flags..... 000000 Entry Type..... 00000002 +002998 4C60604D F0F8F55D 40D9F1F5 7EF0F0F0 F0F0F0F1 C440C5D9 D9D5D67E F0F0F0F0 |<--(085) R15=0000001D ERRNO=0000| +0029B8 F0F0F0F0 00000000 00000000 00000000 00000000 00000000 00000000 00000000 |0000............................| +0029D8 00000000 00000000 00000000 00000000 00000000 00000000 00000000 00000000 |................................| +0029F8 00000000 00000000 |........ | [15]Enclave Storage: Initial (User) Heap : 26609018 +000000 26609018 C8C1D5C3 25E15C90 25E15C90 00000000 A6609018 2660E260 00008000 00002DB8 |HANC..*...*.....w-...-S-........| +000020 26609038 26609018 00001030 C5E7F3F1 00000000 00000005 00000005 2660A070 2660A258 |.-......EX31.............-...-s.| +000040 26609058 2660A295 2660A2D2 2660A30F 2660A34C 2660A389 2660A3C6 2660A403 2660A810 |.-sn.-sK.-t..-t<.-ti.-tF.-u..-y.| +000060 26609078 2660A84D 00000000 00000000 00000000 00000000 00000000 00000000 00000000 |.-y(............................| +000080 26609098 00000000 00000000 00000000 00000000 00000000 00000000 00000000 00000000 |................................| +0000A0 266090B8 00000000 2660A440 2660A47D 2660A4BA 2660A4F7 2660A534 2660A571 2660A5AE |.....-u .-u'.-u..-u7.-v..-v..-v.|... +0045E0 2660D5F8 - +00523F 2660E257 same as above +005240 2660E258 AAAAAAAA AAAAAAAA 00000000 00000000 00000000 00000000 BBBBBBBB BBBBBBBB |................................| +005260 2660E278 BBBBBBBB BBBBBBBB BBBBBBBB BBBBBBBB BBBBBBBB BBBBBBBB BBBBBBBB BBBBBBBB |................................| +005280 2660E298 - +007FFF 26611017 same as above LE/370 Anywhere Heap : 265E5000 +000000 265E5000 C8C1D5C3 26612000 25E15CC0 25E15CC0 A65E5000 265E8850 00004000 000007B0 |HANC./....*...*.w;&..;h&.. .....| +000020 265E5020 265E5000 00000018 D2C4C240 00000000 00000000 AAAAAAAA 265E5000 00000090 |.;&.....KDB .............;&.....| +000040 265E5040 E3E5C240 00000000 00000000 00000000 00000000 00000000 00000000 00000000 |TVB ............................|... +003860 265E8860 BBBBBBBB BBBBBBBB BBBBBBBB BBBBBBBB BBBBBBBB BBBBBBBB BBBBBBBB BBBBBBBB |................................| +003880 265E8880 - +003FFF 265E8FFF same as above
LE/370 Anywhere Heap : 26612000 +000000 26612000 C8C1D5C3 2671E000 265E5000 25E15CC0 26612000 00000000 00100028 00000000 |HANC.....;&...*../..............| +000020 26612020 26612000 00100008 C5CB773F 719897EB 26258600 00000000 03000000 00000001 |./......E....qp...f.............| +000040 26612040 94818995 40404040 40404040 40404040 40404040 40404040 40404040 40404040 |main |... Additional Heap, heapid = 269D9F9C : 269DF000 +000000 269DF000 C8C1D5C3 269E2000 269D9F9C 269D9F9C 269DF000 269DF218 000003E8 000001D0 |HANC..............0...2....Y....| +000020 269DF020 269DF000 00000050 00000000 2699AB48 2699A0C0 269DF0A0 25E12338 46F11000 |..0....&.....r...r....0......1..| +000040 269DF040 00000003 00000000 00040000 269DF078 00000000 2699A0A0 2699A0A0 00000000 |..............0......r...r......| +000060 269DF060 2699A4CC 2699A0A0 00000000 AAAAAAAA 269DF000 00000028 00186161 7DD7D6E2 |.ru..r............0.......//'POS|... [16]File Status and Attributes:... [17]Runtime Options Report: LAST WHERE SET OPTION -------------------------------------------------------------------------------
52 z/OS: z/OS Language Environment Debugging Guide
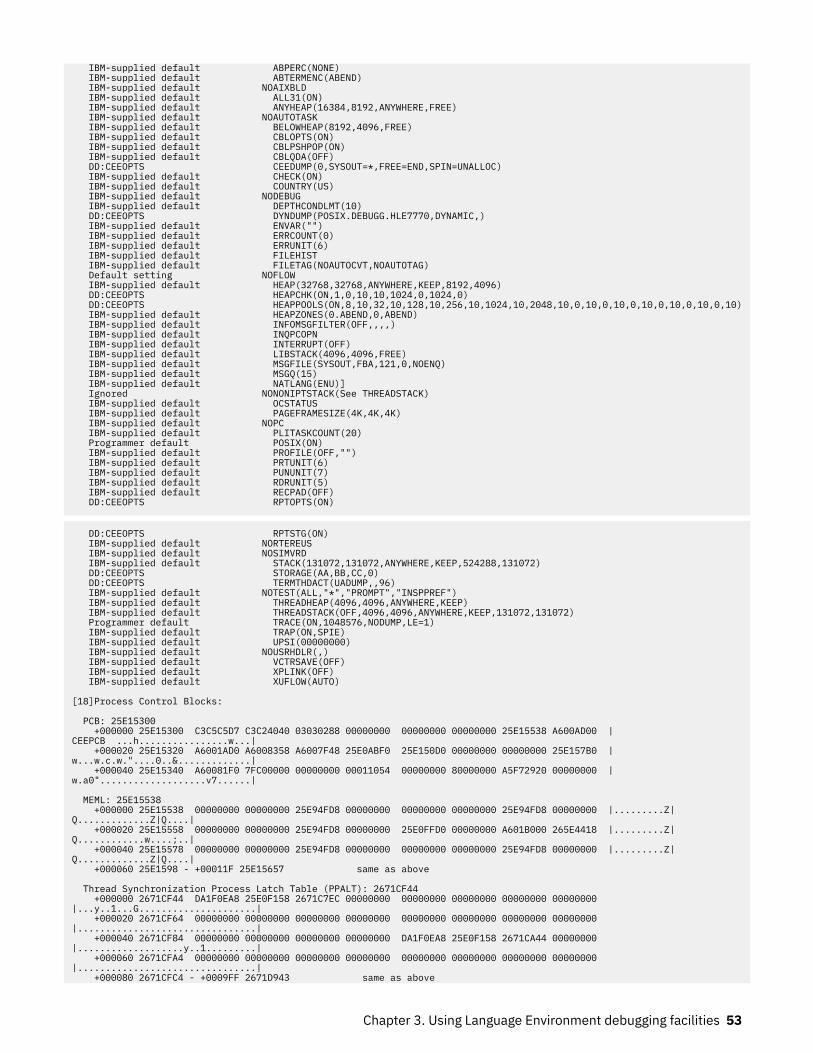
IBM-supplied default ABPERC(NONE) IBM-supplied default ABTERMENC(ABEND) IBM-supplied default NOAIXBLD IBM-supplied default ALL31(ON) IBM-supplied default ANYHEAP(16384,8192,ANYWHERE,FREE) IBM-supplied default NOAUTOTASK IBM-supplied default BELOWHEAP(8192,4096,FREE) IBM-supplied default CBLOPTS(ON) IBM-supplied default CBLPSHPOP(ON) IBM-supplied default CBLQDA(OFF) DD:CEEOPTS CEEDUMP(0,SYSOUT=*,FREE=END,SPIN=UNALLOC) IBM-supplied default CHECK(ON) IBM-supplied default COUNTRY(US) IBM-supplied default NODEBUG IBM-supplied default DEPTHCONDLMT(10) DD:CEEOPTS DYNDUMP(POSIX.DEBUGG.HLE7770,DYNAMIC,) IBM-supplied default ENVAR("") IBM-supplied default ERRCOUNT(0) IBM-supplied default ERRUNIT(6) IBM-supplied default FILEHIST IBM-supplied default FILETAG(NOAUTOCVT,NOAUTOTAG) Default setting NOFLOW IBM-supplied default HEAP(32768,32768,ANYWHERE,KEEP,8192,4096) DD:CEEOPTS HEAPCHK(ON,1,0,10,10,1024,0,1024,0) DD:CEEOPTS HEAPPOOLS(ON,8,10,32,10,128,10,256,10,1024,10,2048,10,0,10,0,10,0,10,0,10,0,10,0,10) IBM-supplied default HEAPZONES(0.ABEND,0,ABEND) IBM-supplied default INFOMSGFILTER(OFF,,,,) IBM-supplied default INQPCOPN IBM-supplied default INTERRUPT(OFF) IBM-supplied default LIBSTACK(4096,4096,FREE) IBM-supplied default MSGFILE(SYSOUT,FBA,121,0,NOENQ) IBM-supplied default MSGQ(15) IBM-supplied default NATLANG(ENU)] Ignored NONONIPTSTACK(See THREADSTACK) IBM-supplied default OCSTATUS IBM-supplied default PAGEFRAMESIZE(4K,4K,4K) IBM-supplied default NOPC IBM-supplied default PLITASKCOUNT(20) Programmer default POSIX(ON) IBM-supplied default PROFILE(OFF,"") IBM-supplied default PRTUNIT(6) IBM-supplied default PUNUNIT(7) IBM-supplied default RDRUNIT(5) IBM-supplied default RECPAD(OFF) DD:CEEOPTS RPTOPTS(ON)
DD:CEEOPTS RPTSTG(ON) IBM-supplied default NORTEREUS IBM-supplied default NOSIMVRD IBM-supplied default STACK(131072,131072,ANYWHERE,KEEP,524288,131072) DD:CEEOPTS STORAGE(AA,BB,CC,0) DD:CEEOPTS TERMTHDACT(UADUMP,,96) IBM-supplied default NOTEST(ALL,"*","PROMPT","INSPPREF") IBM-supplied default THREADHEAP(4096,4096,ANYWHERE,KEEP) IBM-supplied default THREADSTACK(OFF,4096,4096,ANYWHERE,KEEP,131072,131072) Programmer default TRACE(ON,1048576,NODUMP,LE=1) IBM-supplied default TRAP(ON,SPIE) IBM-supplied default UPSI(00000000) IBM-supplied default NOUSRHDLR(,) IBM-supplied default VCTRSAVE(OFF) IBM-supplied default XPLINK(OFF) IBM-supplied default XUFLOW(AUTO) [18]Process Control Blocks: PCB: 25E15300 +000000 25E15300 C3C5C5D7 C3C24040 03030288 00000000 00000000 00000000 25E15538 A600AD00 |CEEPCB ...h................w...| +000020 25E15320 A6001AD0 A6008358 A6007F48 25E0ABF0 25E150D0 00000000 00000000 25E157B0 |w...w.c.w."....0..&.............| +000040 25E15340 A60081F0 7FC00000 00000000 00011054 00000000 80000000 A5F72920 00000000 |w.a0"...................v7......| MEML: 25E15538 +000000 25E15538 00000000 00000000 25E94FD8 00000000 00000000 00000000 25E94FD8 00000000 |.........Z|Q.............Z|Q....| +000020 25E15558 00000000 00000000 25E94FD8 00000000 25E0FFD0 00000000 A601B000 265E4418 |.........Z|Q............w....;..| +000040 25E15578 00000000 00000000 25E94FD8 00000000 00000000 00000000 25E94FD8 00000000 |.........Z|Q.............Z|Q....| +000060 25E1598 - +00011F 25E15657 same as above Thread Synchronization Process Latch Table (PPALT): 2671CF44 +000000 2671CF44 DA1F0EA8 25E0F158 2671C7EC 00000000 00000000 00000000 00000000 00000000 |...y..1...G.....................| +000020 2671CF64 00000000 00000000 00000000 00000000 00000000 00000000 00000000 00000000 |................................| +000040 2671CF84 00000000 00000000 00000000 00000000 DA1F0EA8 25E0F158 2671CA44 00000000 |...................y..1.........| +000060 2671CFA4 00000000 00000000 00000000 00000000 00000000 00000000 00000000 00000000 |................................| +000080 2671CFC4 - +0009FF 2671D943 same as above
Chapter 3. Using Language Environment debugging facilities 53
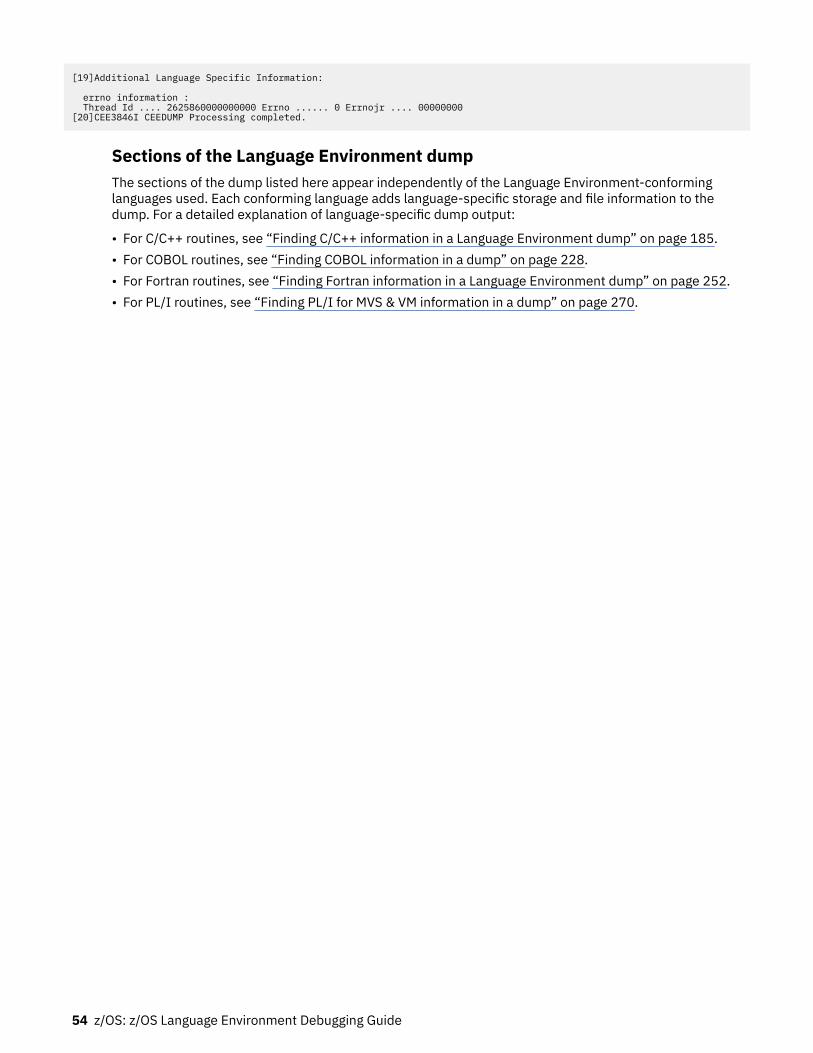
[19]Additional Language Specific Information: errno information : Thread Id .... 2625860000000000 Errno ...... 0 Errnojr .... 00000000[20]CEE3846I CEEDUMP Processing completed.
Sections of the Language Environment dumpThe sections of the dump listed here appear independently of the Language Environment-conforminglanguages used. Each conforming language adds language-specific storage and file information to thedump. For a detailed explanation of language-specific dump output:
• For C/C++ routines, see “Finding C/C++ information in a Language Environment dump” on page 185.• For COBOL routines, see “Finding COBOL information in a dump” on page 228.• For Fortran routines, see “Finding Fortran information in a Language Environment dump” on page 252.• For PL/I routines, see “Finding PL/I for MVS & VM information in a dump” on page 270.
54 z/OS: z/OS Language Environment Debugging Guide
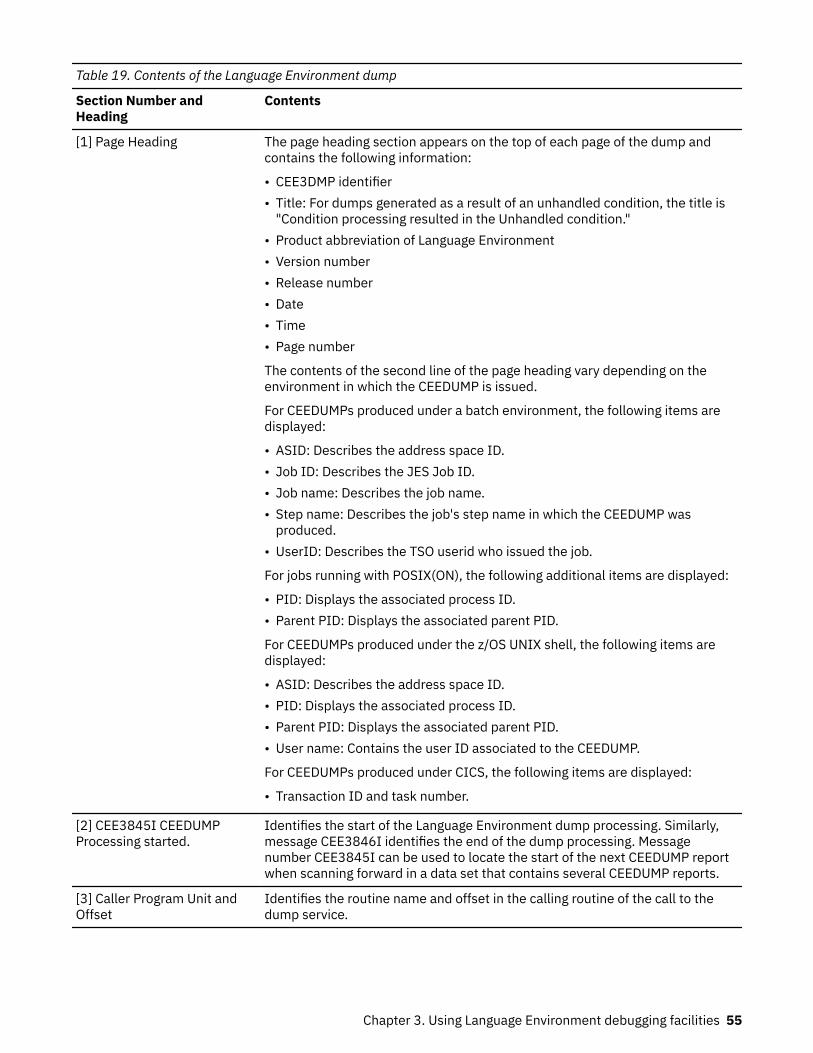
Table 19. Contents of the Language Environment dump
Section Number andHeading
Contents
[1] Page Heading The page heading section appears on the top of each page of the dump andcontains the following information:
• CEE3DMP identifier• Title: For dumps generated as a result of an unhandled condition, the title is
"Condition processing resulted in the Unhandled condition."• Product abbreviation of Language Environment• Version number • Release number • Date • Time • Page number
The contents of the second line of the page heading vary depending on theenvironment in which the CEEDUMP is issued.
For CEEDUMPs produced under a batch environment, the following items aredisplayed:
• ASID: Describes the address space ID.• Job ID: Describes the JES Job ID.• Job name: Describes the job name.• Step name: Describes the job's step name in which the CEEDUMP was
produced.• UserID: Describes the TSO userid who issued the job.
For jobs running with POSIX(ON), the following additional items are displayed:
• PID: Displays the associated process ID.• Parent PID: Displays the associated parent PID.
For CEEDUMPs produced under the z/OS UNIX shell, the following items aredisplayed:
• ASID: Describes the address space ID.• PID: Displays the associated process ID.• Parent PID: Displays the associated parent PID.• User name: Contains the user ID associated to the CEEDUMP.
For CEEDUMPs produced under CICS, the following items are displayed:
• Transaction ID and task number.
[2] CEE3845I CEEDUMPProcessing started.
Identifies the start of the Language Environment dump processing. Similarly,message CEE3846I identifies the end of the dump processing. Messagenumber CEE3845I can be used to locate the start of the next CEEDUMP reportwhen scanning forward in a data set that contains several CEEDUMP reports.
[3] Caller Program Unit andOffset
Identifies the routine name and offset in the calling routine of the call to thedump service.
Chapter 3. Using Language Environment debugging facilities 55
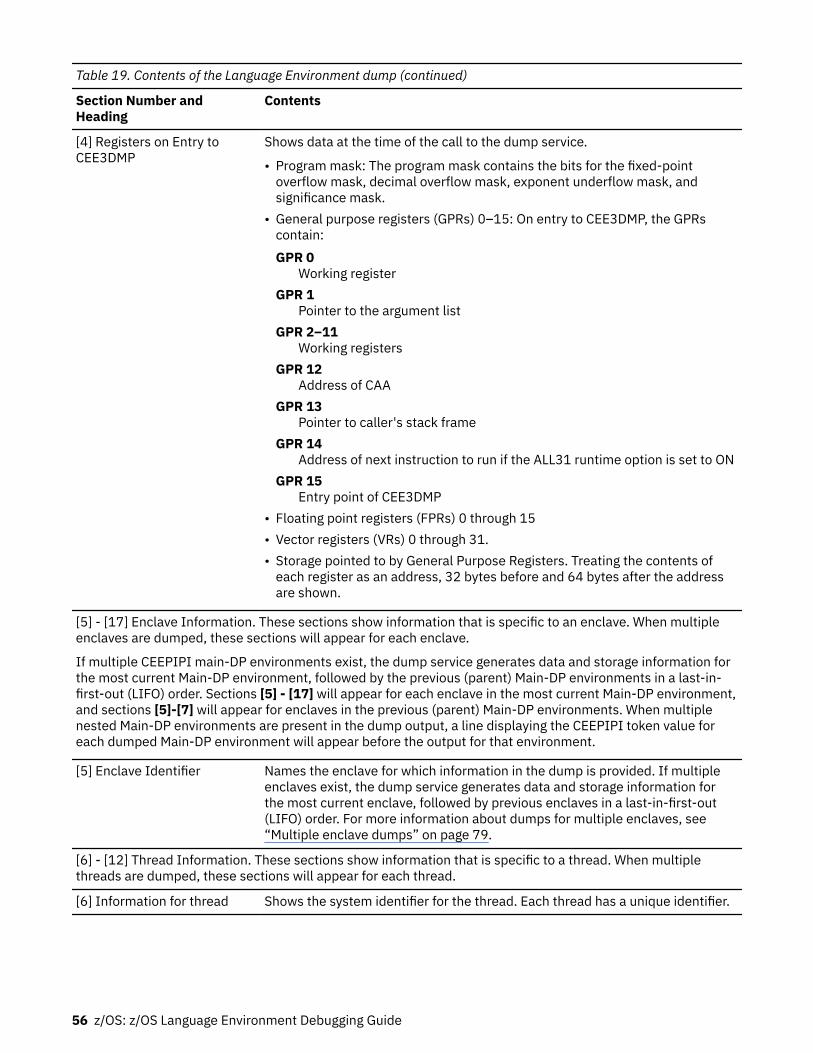
Table 19. Contents of the Language Environment dump (continued)
Section Number andHeading
Contents
[4] Registers on Entry toCEE3DMP
Shows data at the time of the call to the dump service.
• Program mask: The program mask contains the bits for the fixed-pointoverflow mask, decimal overflow mask, exponent underflow mask, andsignificance mask.
• General purpose registers (GPRs) 0–15: On entry to CEE3DMP, the GPRscontain:GPR 0
Working registerGPR 1
Pointer to the argument listGPR 2–11
Working registersGPR 12
Address of CAAGPR 13
Pointer to caller's stack frameGPR 14
Address of next instruction to run if the ALL31 runtime option is set to ONGPR 15
Entry point of CEE3DMP• Floating point registers (FPRs) 0 through 15• Vector registers (VRs) 0 through 31.• Storage pointed to by General Purpose Registers. Treating the contents of
each register as an address, 32 bytes before and 64 bytes after the addressare shown.
[5] - [17] Enclave Information. These sections show information that is specific to an enclave. When multipleenclaves are dumped, these sections will appear for each enclave.
If multiple CEEPIPI main-DP environments exist, the dump service generates data and storage information forthe most current Main-DP environment, followed by the previous (parent) Main-DP environments in a last-in-first-out (LIFO) order. Sections [5] - [17] will appear for each enclave in the most current Main-DP environment,and sections [5]-[7] will appear for enclaves in the previous (parent) Main-DP environments. When multiplenested Main-DP environments are present in the dump output, a line displaying the CEEPIPI token value foreach dumped Main-DP environment will appear before the output for that environment.
[5] Enclave Identifier Names the enclave for which information in the dump is provided. If multipleenclaves exist, the dump service generates data and storage information forthe most current enclave, followed by previous enclaves in a last-in-first-out(LIFO) order. For more information about dumps for multiple enclaves, see“Multiple enclave dumps” on page 79.
[6] - [12] Thread Information. These sections show information that is specific to a thread. When multiplethreads are dumped, these sections will appear for each thread.
[6] Information for thread Shows the system identifier for the thread. Each thread has a unique identifier.
56 z/OS: z/OS Language Environment Debugging Guide
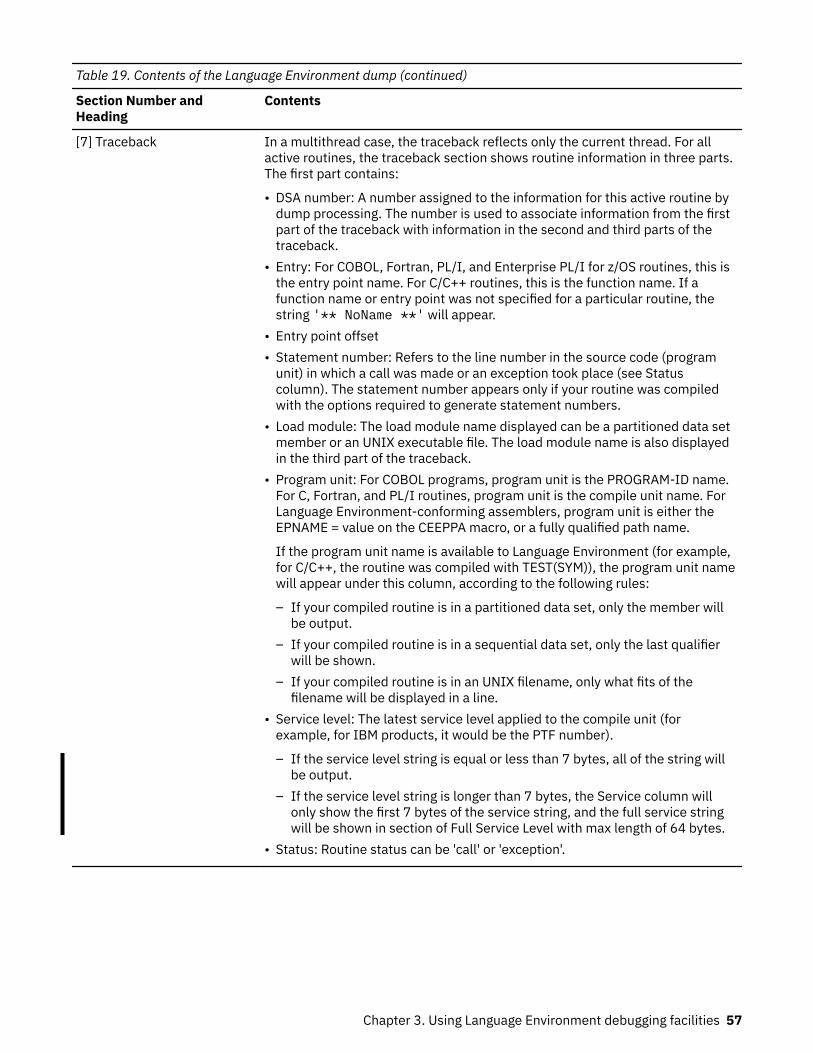
Table 19. Contents of the Language Environment dump (continued)
Section Number andHeading
Contents
[7] Traceback In a multithread case, the traceback reflects only the current thread. For allactive routines, the traceback section shows routine information in three parts.The first part contains:
• DSA number: A number assigned to the information for this active routine bydump processing. The number is used to associate information from the firstpart of the traceback with information in the second and third parts of thetraceback.
• Entry: For COBOL, Fortran, PL/I, and Enterprise PL/I for z/OS routines, this isthe entry point name. For C/C++ routines, this is the function name. If afunction name or entry point was not specified for a particular routine, thestring '** NoName **' will appear.
• Entry point offset• Statement number: Refers to the line number in the source code (program
unit) in which a call was made or an exception took place (see Statuscolumn). The statement number appears only if your routine was compiledwith the options required to generate statement numbers.
• Load module: The load module name displayed can be a partitioned data setmember or an UNIX executable file. The load module name is also displayedin the third part of the traceback.
• Program unit: For COBOL programs, program unit is the PROGRAM-ID name.For C, Fortran, and PL/I routines, program unit is the compile unit name. ForLanguage Environment-conforming assemblers, program unit is either theEPNAME = value on the CEEPPA macro, or a fully qualified path name.
If the program unit name is available to Language Environment (for example,for C/C++, the routine was compiled with TEST(SYM)), the program unit namewill appear under this column, according to the following rules:
– If your compiled routine is in a partitioned data set, only the member willbe output.
– If your compiled routine is in a sequential data set, only the last qualifierwill be shown.
– If your compiled routine is in an UNIX filename, only what fits of thefilename will be displayed in a line.
• Service level: The latest service level applied to the compile unit (forexample, for IBM products, it would be the PTF number).
– If the service level string is equal or less than 7 bytes, all of the string willbe output.
– If the service level string is longer than 7 bytes, the Service column willonly show the first 7 bytes of the service string, and the full service stringwill be shown in section of Full Service Level with max length of 64 bytes.
• Status: Routine status can be 'call' or 'exception'.
Chapter 3. Using Language Environment debugging facilities 57
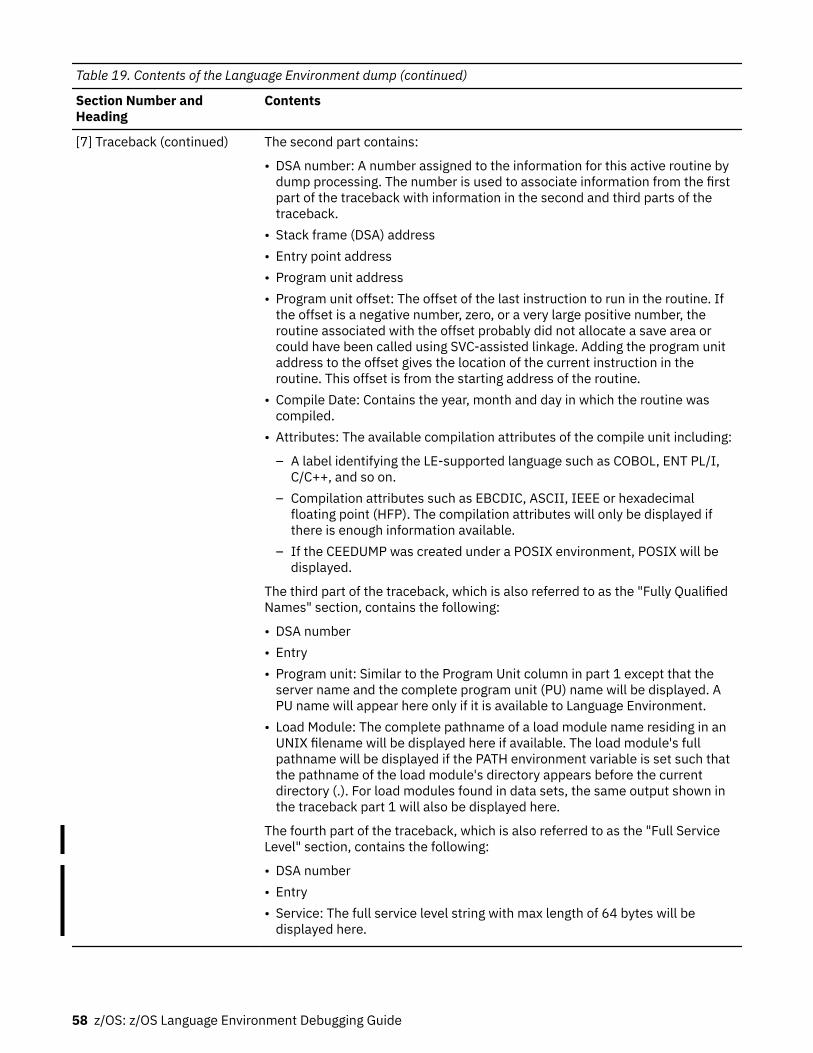
Table 19. Contents of the Language Environment dump (continued)
Section Number andHeading
Contents
[7] Traceback (continued) The second part contains:
• DSA number: A number assigned to the information for this active routine bydump processing. The number is used to associate information from the firstpart of the traceback with information in the second and third parts of thetraceback.
• Stack frame (DSA) address• Entry point address• Program unit address• Program unit offset: The offset of the last instruction to run in the routine. If
the offset is a negative number, zero, or a very large positive number, theroutine associated with the offset probably did not allocate a save area orcould have been called using SVC-assisted linkage. Adding the program unitaddress to the offset gives the location of the current instruction in theroutine. This offset is from the starting address of the routine.
• Compile Date: Contains the year, month and day in which the routine wascompiled.
• Attributes: The available compilation attributes of the compile unit including:
– A label identifying the LE-supported language such as COBOL, ENT PL/I,C/C++, and so on.
– Compilation attributes such as EBCDIC, ASCII, IEEE or hexadecimalfloating point (HFP). The compilation attributes will only be displayed ifthere is enough information available.
– If the CEEDUMP was created under a POSIX environment, POSIX will bedisplayed.
The third part of the traceback, which is also referred to as the "Fully QualifiedNames" section, contains the following:
• DSA number• Entry• Program unit: Similar to the Program Unit column in part 1 except that the
server name and the complete program unit (PU) name will be displayed. APU name will appear here only if it is available to Language Environment.
• Load Module: The complete pathname of a load module name residing in anUNIX filename will be displayed here if available. The load module's fullpathname will be displayed if the PATH environment variable is set such thatthe pathname of the load module's directory appears before the currentdirectory (.). For load modules found in data sets, the same output shown inthe traceback part 1 will also be displayed here.
The fourth part of the traceback, which is also referred to as the "Full ServiceLevel" section, contains the following:
• DSA number• Entry• Service: The full service level string with max length of 64 bytes will be
displayed here.
58 z/OS: z/OS Language Environment Debugging Guide
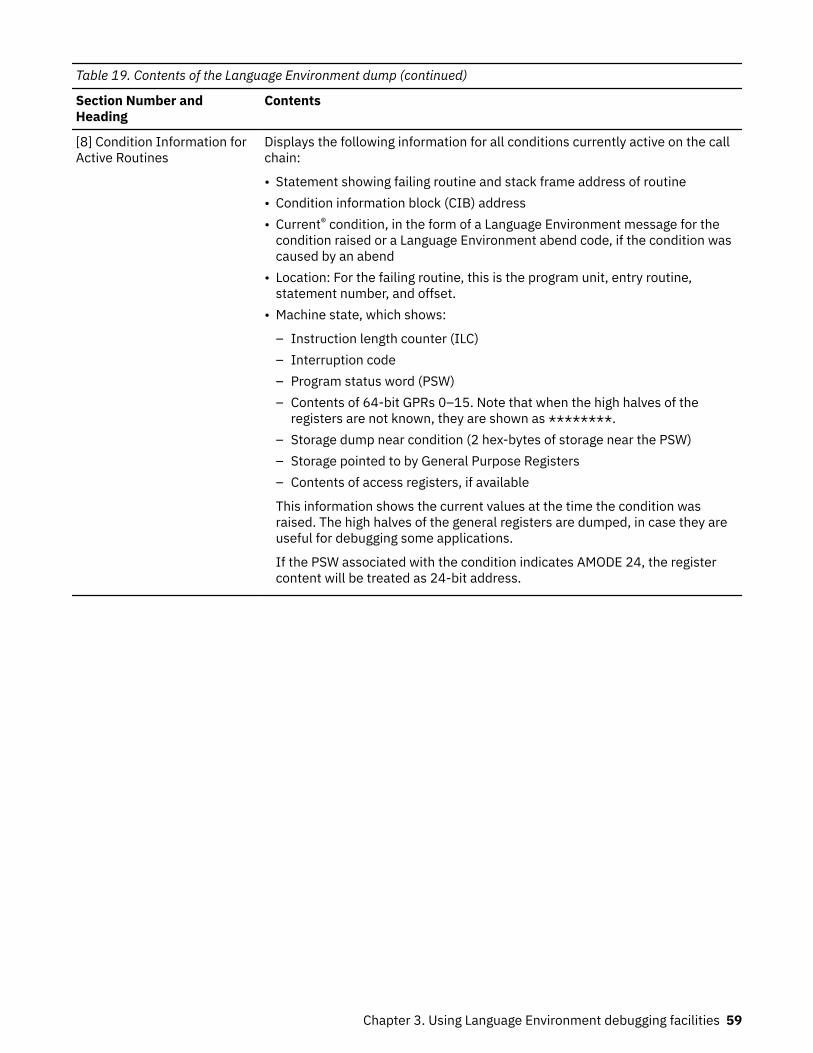
Table 19. Contents of the Language Environment dump (continued)
Section Number andHeading
Contents
[8] Condition Information forActive Routines
Displays the following information for all conditions currently active on the callchain:
• Statement showing failing routine and stack frame address of routine• Condition information block (CIB) address• Current® condition, in the form of a Language Environment message for the
condition raised or a Language Environment abend code, if the condition wascaused by an abend
• Location: For the failing routine, this is the program unit, entry routine,statement number, and offset.
• Machine state, which shows:
– Instruction length counter (ILC)– Interruption code – Program status word (PSW) – Contents of 64-bit GPRs 0–15. Note that when the high halves of the
registers are not known, they are shown as ********.– Storage dump near condition (2 hex-bytes of storage near the PSW)– Storage pointed to by General Purpose Registers– Contents of access registers, if available
This information shows the current values at the time the condition wasraised. The high halves of the general registers are dumped, in case they areuseful for debugging some applications.
If the PSW associated with the condition indicates AMODE 24, the registercontent will be treated as 24-bit address.
Chapter 3. Using Language Environment debugging facilities 59
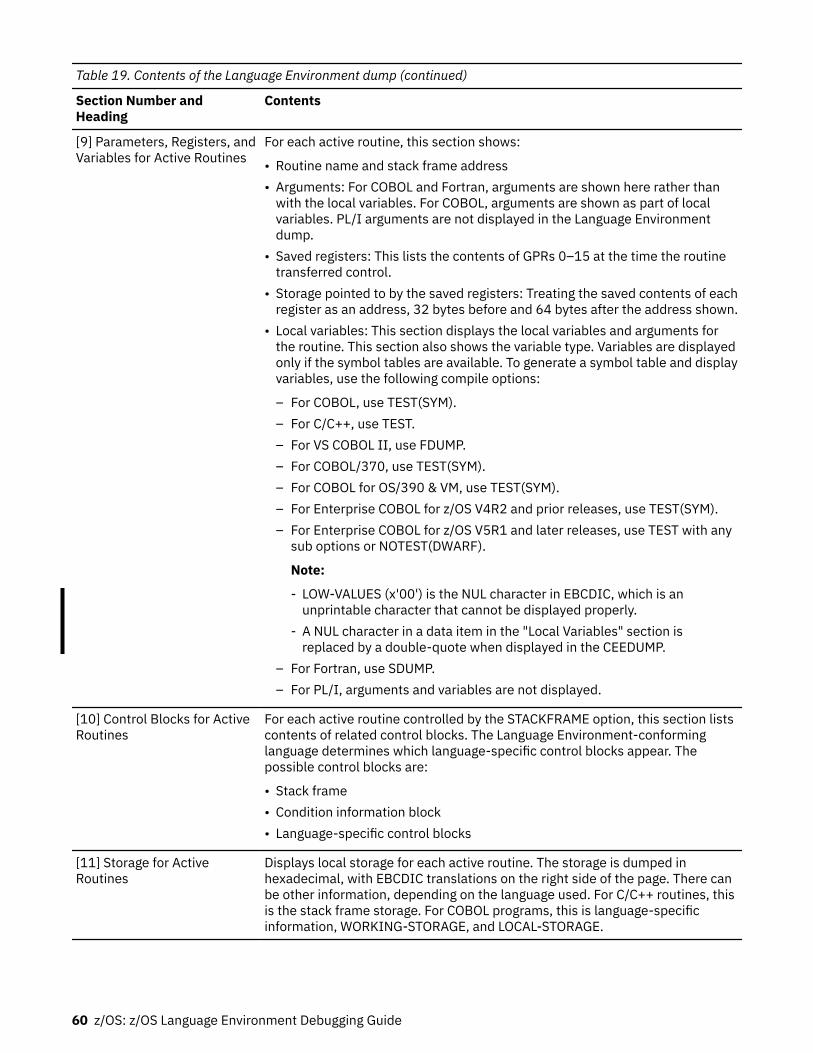
Table 19. Contents of the Language Environment dump (continued)
Section Number andHeading
Contents
[9] Parameters, Registers, andVariables for Active Routines
For each active routine, this section shows:
• Routine name and stack frame address• Arguments: For COBOL and Fortran, arguments are shown here rather than
with the local variables. For COBOL, arguments are shown as part of localvariables. PL/I arguments are not displayed in the Language Environmentdump.
• Saved registers: This lists the contents of GPRs 0–15 at the time the routinetransferred control.
• Storage pointed to by the saved registers: Treating the saved contents of eachregister as an address, 32 bytes before and 64 bytes after the address shown.
• Local variables: This section displays the local variables and arguments forthe routine. This section also shows the variable type. Variables are displayedonly if the symbol tables are available. To generate a symbol table and displayvariables, use the following compile options:
– For COBOL, use TEST(SYM).– For C/C++, use TEST.– For VS COBOL II, use FDUMP.– For COBOL/370, use TEST(SYM).– For COBOL for OS/390 & VM, use TEST(SYM).– For Enterprise COBOL for z/OS V4R2 and prior releases, use TEST(SYM).– For Enterprise COBOL for z/OS V5R1 and later releases, use TEST with any
sub options or NOTEST(DWARF).
Note:
- LOW-VALUES (x'00') is the NUL character in EBCDIC, which is anunprintable character that cannot be displayed properly.
- A NUL character in a data item in the "Local Variables" section isreplaced by a double-quote when displayed in the CEEDUMP.
– For Fortran, use SDUMP.– For PL/I, arguments and variables are not displayed.
[10] Control Blocks for ActiveRoutines
For each active routine controlled by the STACKFRAME option, this section listscontents of related control blocks. The Language Environment-conforminglanguage determines which language-specific control blocks appear. Thepossible control blocks are:
• Stack frame• Condition information block• Language-specific control blocks
[11] Storage for ActiveRoutines
Displays local storage for each active routine. The storage is dumped inhexadecimal, with EBCDIC translations on the right side of the page. There canbe other information, depending on the language used. For C/C++ routines, thisis the stack frame storage. For COBOL programs, this is language-specificinformation, WORKING-STORAGE, and LOCAL-STORAGE.
60 z/OS: z/OS Language Environment Debugging Guide
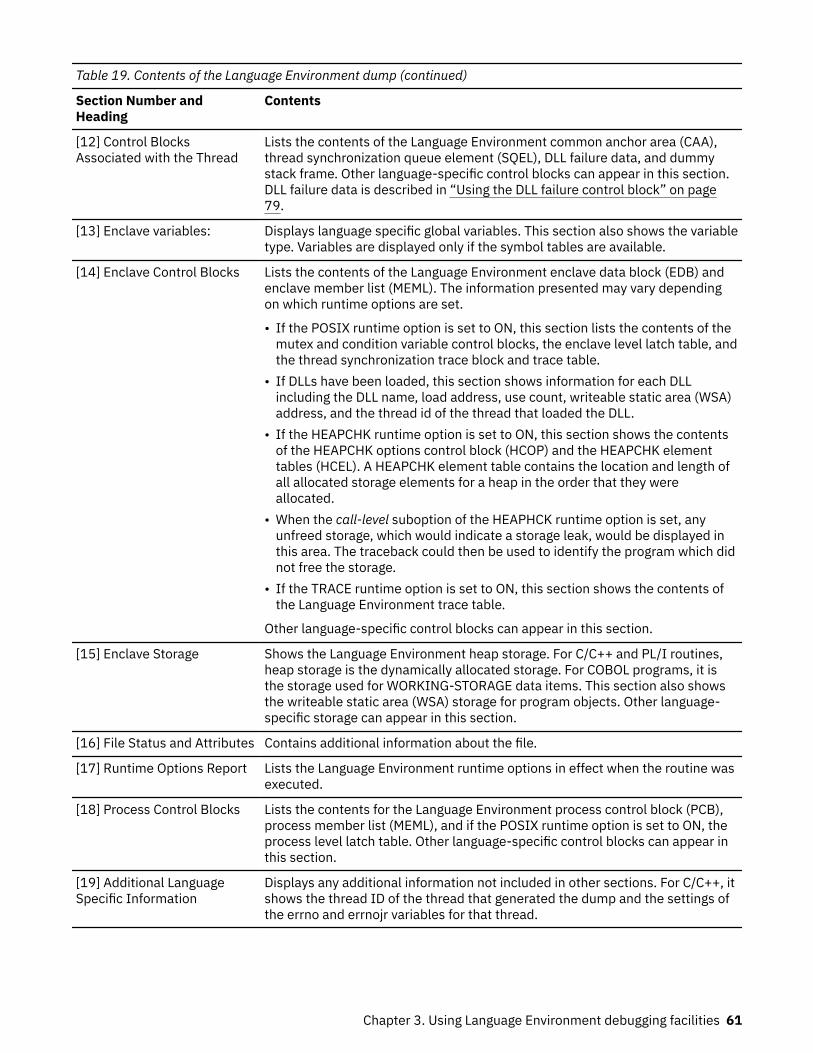
Table 19. Contents of the Language Environment dump (continued)
Section Number andHeading
Contents
[12] Control BlocksAssociated with the Thread
Lists the contents of the Language Environment common anchor area (CAA),thread synchronization queue element (SQEL), DLL failure data, and dummystack frame. Other language-specific control blocks can appear in this section.DLL failure data is described in “Using the DLL failure control block” on page79.
[13] Enclave variables: Displays language specific global variables. This section also shows the variabletype. Variables are displayed only if the symbol tables are available.
[14] Enclave Control Blocks Lists the contents of the Language Environment enclave data block (EDB) andenclave member list (MEML). The information presented may vary dependingon which runtime options are set.
• If the POSIX runtime option is set to ON, this section lists the contents of themutex and condition variable control blocks, the enclave level latch table, andthe thread synchronization trace block and trace table.
• If DLLs have been loaded, this section shows information for each DLLincluding the DLL name, load address, use count, writeable static area (WSA)address, and the thread id of the thread that loaded the DLL.
• If the HEAPCHK runtime option is set to ON, this section shows the contentsof the HEAPCHK options control block (HCOP) and the HEAPCHK elementtables (HCEL). A HEAPCHK element table contains the location and length ofall allocated storage elements for a heap in the order that they wereallocated.
• When the call-level suboption of the HEAPHCK runtime option is set, anyunfreed storage, which would indicate a storage leak, would be displayed inthis area. The traceback could then be used to identify the program which didnot free the storage.
• If the TRACE runtime option is set to ON, this section shows the contents ofthe Language Environment trace table.
Other language-specific control blocks can appear in this section.
[15] Enclave Storage Shows the Language Environment heap storage. For C/C++ and PL/I routines,heap storage is the dynamically allocated storage. For COBOL programs, it isthe storage used for WORKING-STORAGE data items. This section also showsthe writeable static area (WSA) storage for program objects. Other language-specific storage can appear in this section.
[16] File Status and Attributes Contains additional information about the file.
[17] Runtime Options Report Lists the Language Environment runtime options in effect when the routine wasexecuted.
[18] Process Control Blocks Lists the contents for the Language Environment process control block (PCB),process member list (MEML), and if the POSIX runtime option is set to ON, theprocess level latch table. Other language-specific control blocks can appear inthis section.
[19] Additional LanguageSpecific Information
Displays any additional information not included in other sections. For C/C++, itshows the thread ID of the thread that generated the dump and the settings ofthe errno and errnojr variables for that thread.
Chapter 3. Using Language Environment debugging facilities 61
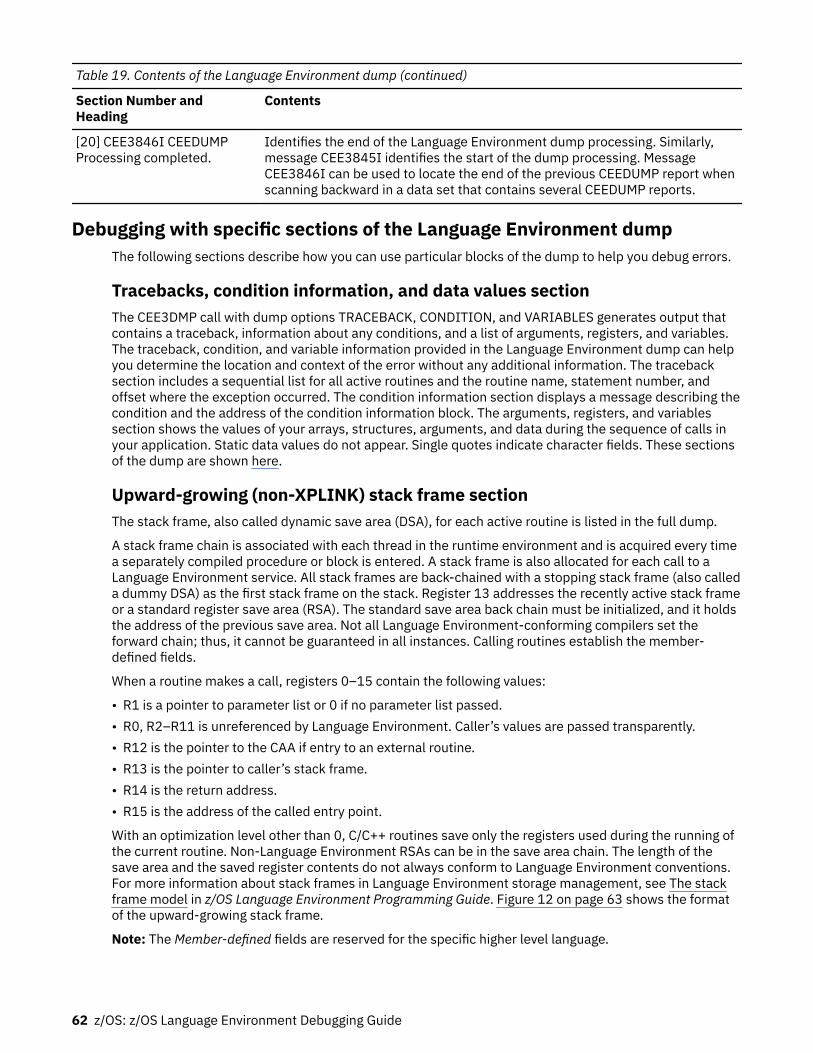
Table 19. Contents of the Language Environment dump (continued)
Section Number andHeading
Contents
[20] CEE3846I CEEDUMPProcessing completed.
Identifies the end of the Language Environment dump processing. Similarly,message CEE3845I identifies the start of the dump processing. MessageCEE3846I can be used to locate the end of the previous CEEDUMP report whenscanning backward in a data set that contains several CEEDUMP reports.
Debugging with specific sections of the Language Environment dumpThe following sections describe how you can use particular blocks of the dump to help you debug errors.
Tracebacks, condition information, and data values sectionThe CEE3DMP call with dump options TRACEBACK, CONDITION, and VARIABLES generates output thatcontains a traceback, information about any conditions, and a list of arguments, registers, and variables.The traceback, condition, and variable information provided in the Language Environment dump can helpyou determine the location and context of the error without any additional information. The tracebacksection includes a sequential list for all active routines and the routine name, statement number, andoffset where the exception occurred. The condition information section displays a message describing thecondition and the address of the condition information block. The arguments, registers, and variablessection shows the values of your arrays, structures, arguments, and data during the sequence of calls inyour application. Static data values do not appear. Single quotes indicate character fields. These sectionsof the dump are shown here.
Upward-growing (non-XPLINK) stack frame sectionThe stack frame, also called dynamic save area (DSA), for each active routine is listed in the full dump.
A stack frame chain is associated with each thread in the runtime environment and is acquired every timea separately compiled procedure or block is entered. A stack frame is also allocated for each call to aLanguage Environment service. All stack frames are back-chained with a stopping stack frame (also calleda dummy DSA) as the first stack frame on the stack. Register 13 addresses the recently active stack frameor a standard register save area (RSA). The standard save area back chain must be initialized, and it holdsthe address of the previous save area. Not all Language Environment-conforming compilers set theforward chain; thus, it cannot be guaranteed in all instances. Calling routines establish the member-defined fields.
When a routine makes a call, registers 0–15 contain the following values:
• R1 is a pointer to parameter list or 0 if no parameter list passed.• R0, R2–R11 is unreferenced by Language Environment. Caller’s values are passed transparently.• R12 is the pointer to the CAA if entry to an external routine.• R13 is the pointer to caller’s stack frame.• R14 is the return address.• R15 is the address of the called entry point.
With an optimization level other than 0, C/C++ routines save only the registers used during the running ofthe current routine. Non-Language Environment RSAs can be in the save area chain. The length of thesave area and the saved register contents do not always conform to Language Environment conventions.For more information about stack frames in Language Environment storage management, see The stackframe model in z/OS Language Environment Programming Guide. Figure 12 on page 63 shows the formatof the upward-growing stack frame.
Note: The Member-defined fields are reserved for the specific higher level language.
62 z/OS: z/OS Language Environment Debugging Guide
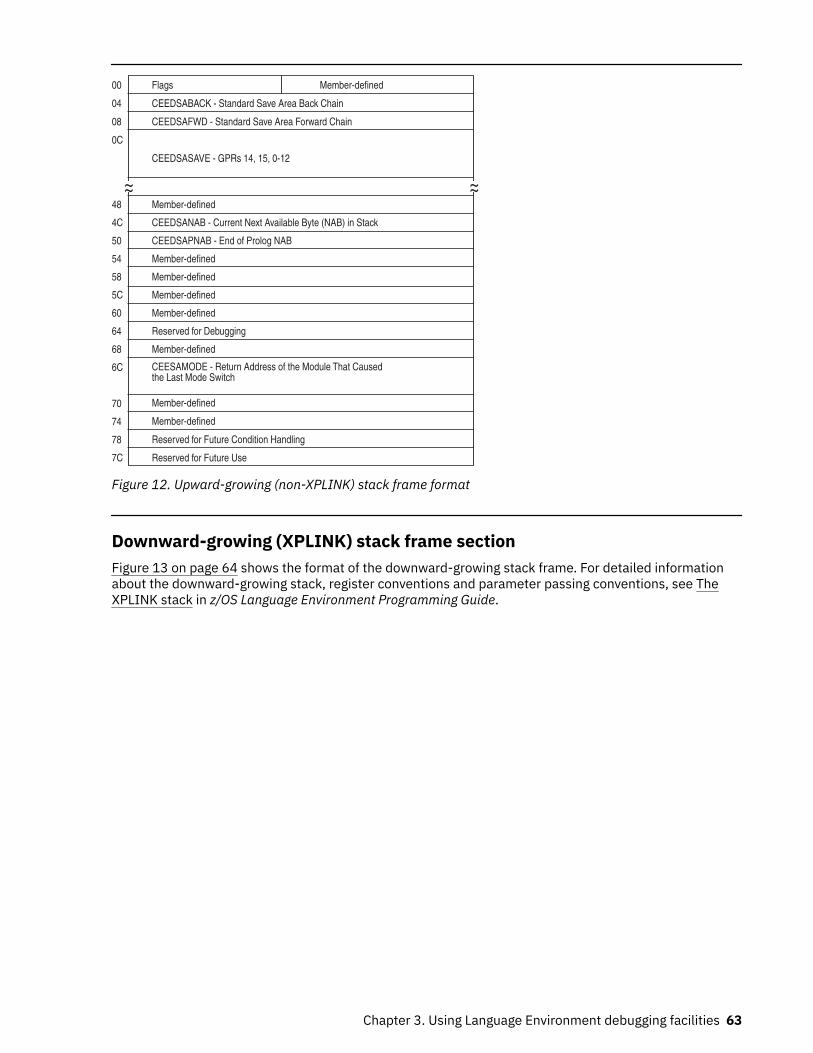
Member-defined
Member-defined
Reserved for Future Condition Handling
Reserved for Future Use
CEESAMODE - Return Address of the Module That Causedthe Last Mode Switch
Member-defined
CEEDSANAB - Current Next Available Byte (NAB) in Stack
CEEDSAPNAB - End of Prolog NAB
Member-defined
Member-defined
Member-defined
Member-defined
Reserved for Debugging
Member-defined
48
4C
50
54
58
5C
60
64
68
6C
70
74
78
7C
Member-definedFlags
CEEDSABACK - Standard Save Area Back Chain
CEEDSAFWD - Standard Save Area Forward Chain
CEEDSASAVE - GPRs 14, 15, 0-12
00
04
08
0C
~~ ~~
Figure 12. Upward-growing (non-XPLINK) stack frame format
Downward-growing (XPLINK) stack frame sectionFigure 13 on page 64 shows the format of the downward-growing stack frame. For detailed informationabout the downward-growing stack, register conventions and parameter passing conventions, see TheXPLINK stack in z/OS Language Environment Programming Guide.
Chapter 3. Using Language Environment debugging facilities 63
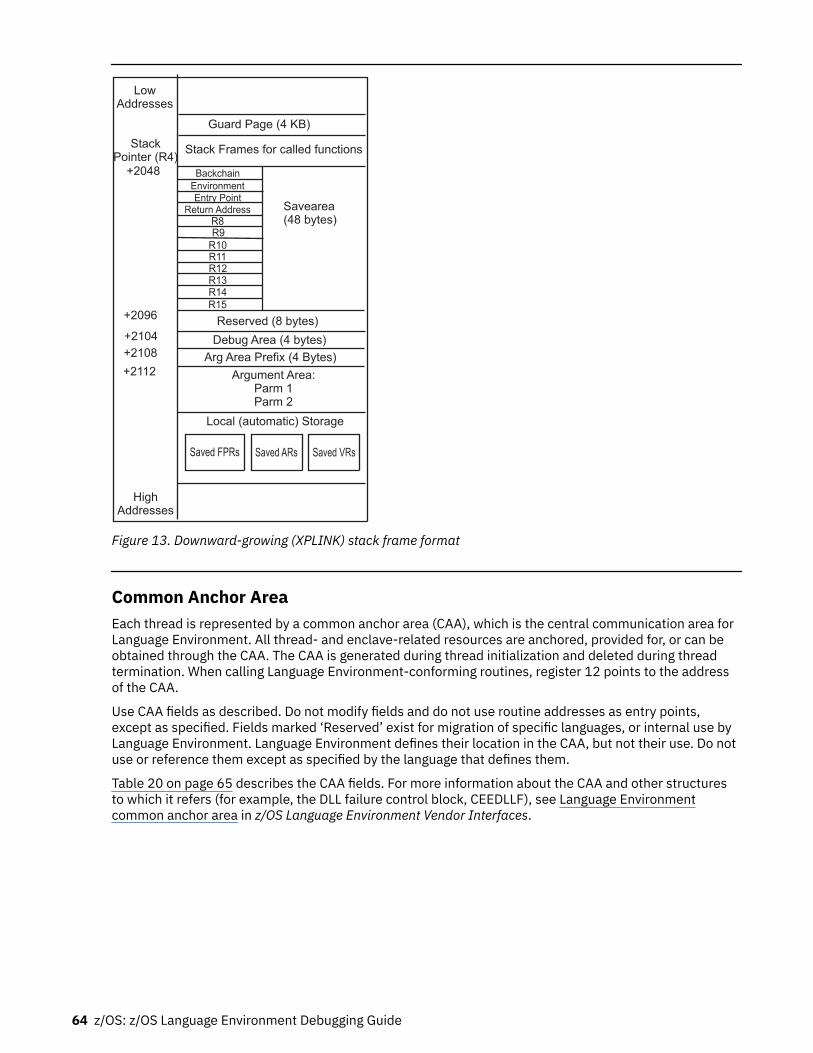
Guard Page (4 KB)
Stack Frames for called functions
Backchain
EnvironmentEntry Point
Return AddressR8R9
R10R11R12R13R14R15
Reserved (8 bytes)
Debug Area (4 bytes)
Arg Area Prefix (4 Bytes)
Argument Area:Parm 1Parm 2
Local (automatic) Storage
Savearea(48 bytes)
Saved FPRs Saved ARs
HighAddresses
LowAddresses
StackPointer (R4)
+2048
+2096
+2104
+2108
+2112
Saved VRs
Figure 13. Downward-growing (XPLINK) stack frame format
Common Anchor AreaEach thread is represented by a common anchor area (CAA), which is the central communication area forLanguage Environment. All thread- and enclave-related resources are anchored, provided for, or can beobtained through the CAA. The CAA is generated during thread initialization and deleted during threadtermination. When calling Language Environment-conforming routines, register 12 points to the addressof the CAA.
Use CAA fields as described. Do not modify fields and do not use routine addresses as entry points,except as specified. Fields marked ‘Reserved’ exist for migration of specific languages, or internal use byLanguage Environment. Language Environment defines their location in the CAA, but not their use. Do notuse or reference them except as specified by the language that defines them.
Table 20 on page 65 describes the CAA fields. For more information about the CAA and other structuresto which it refers (for example, the DLL failure control block, CEEDLLF), see Language Environmentcommon anchor area in z/OS Language Environment Vendor Interfaces.
64 z/OS: z/OS Language Environment Debugging Guide
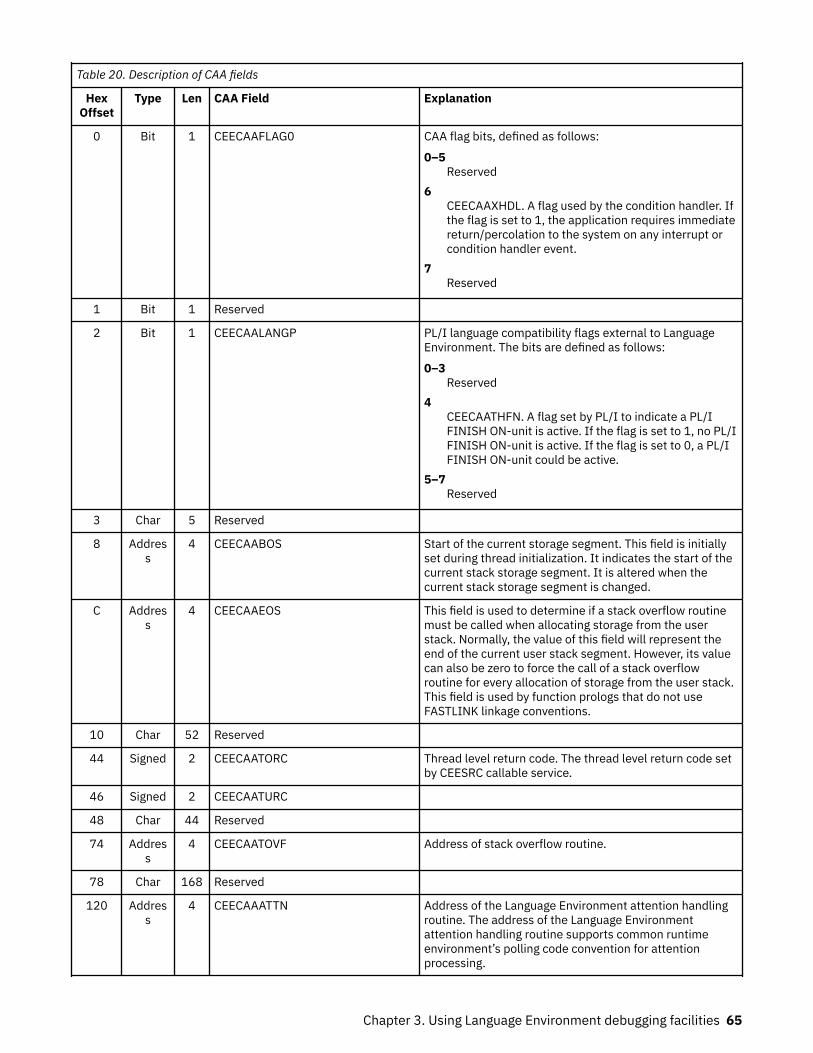
Table 20. Description of CAA fields
HexOffset
Type Len CAA Field Explanation
0 Bit 1 CEECAAFLAG0 CAA flag bits, defined as follows:
0–5Reserved
6CEECAAXHDL. A flag used by the condition handler. Ifthe flag is set to 1, the application requires immediatereturn/percolation to the system on any interrupt orcondition handler event.
7Reserved
1 Bit 1 Reserved
2 Bit 1 CEECAALANGP PL/I language compatibility flags external to LanguageEnvironment. The bits are defined as follows:
0–3Reserved
4CEECAATHFN. A flag set by PL/I to indicate a PL/IFINISH ON-unit is active. If the flag is set to 1, no PL/IFINISH ON-unit is active. If the flag is set to 0, a PL/IFINISH ON-unit could be active.
5–7Reserved
3 Char 5 Reserved
8 Address
4 CEECAABOS Start of the current storage segment. This field is initiallyset during thread initialization. It indicates the start of thecurrent stack storage segment. It is altered when thecurrent stack storage segment is changed.
C Address
4 CEECAAEOS This field is used to determine if a stack overflow routinemust be called when allocating storage from the userstack. Normally, the value of this field will represent theend of the current user stack segment. However, its valuecan also be zero to force the call of a stack overflowroutine for every allocation of storage from the user stack.This field is used by function prologs that do not useFASTLINK linkage conventions.
10 Char 52 Reserved
44 Signed 2 CEECAATORC Thread level return code. The thread level return code setby CEESRC callable service.
46 Signed 2 CEECAATURC
48 Char 44 Reserved
74 Address
4 CEECAATOVF Address of stack overflow routine.
78 Char 168 Reserved
120 Address
4 CEECAAATTN Address of the Language Environment attention handlingroutine. The address of the Language Environmentattention handling routine supports common runtimeenvironment’s polling code convention for attentionprocessing.
Chapter 3. Using Language Environment debugging facilities 65
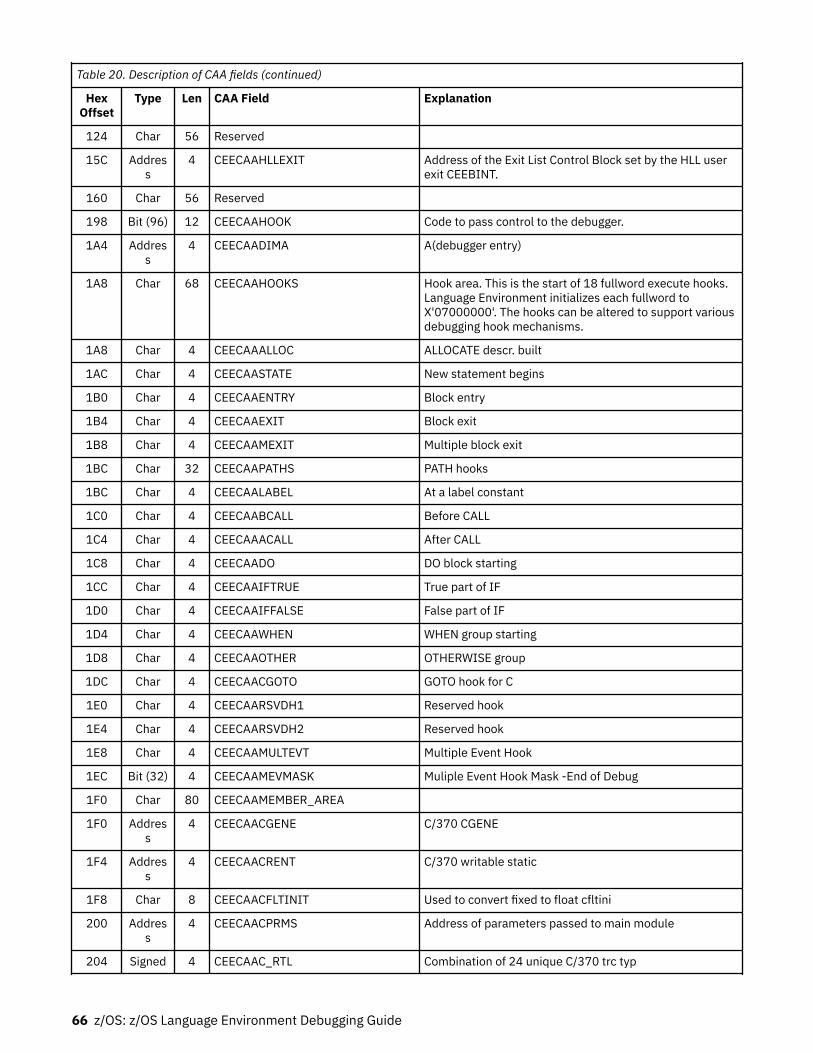
Table 20. Description of CAA fields (continued)
HexOffset
Type Len CAA Field Explanation
124 Char 56 Reserved
15C Address
4 CEECAAHLLEXIT Address of the Exit List Control Block set by the HLL userexit CEEBINT.
160 Char 56 Reserved
198 Bit (96) 12 CEECAAHOOK Code to pass control to the debugger.
1A4 Address
4 CEECAADIMA A(debugger entry)
1A8 Char 68 CEECAAHOOKS Hook area. This is the start of 18 fullword execute hooks.Language Environment initializes each fullword toX'07000000'. The hooks can be altered to support variousdebugging hook mechanisms.
1A8 Char 4 CEECAAALLOC ALLOCATE descr. built
1AC Char 4 CEECAASTATE New statement begins
1B0 Char 4 CEECAAENTRY Block entry
1B4 Char 4 CEECAAEXIT Block exit
1B8 Char 4 CEECAAMEXIT Multiple block exit
1BC Char 32 CEECAAPATHS PATH hooks
1BC Char 4 CEECAALABEL At a label constant
1C0 Char 4 CEECAABCALL Before CALL
1C4 Char 4 CEECAAACALL After CALL
1C8 Char 4 CEECAADO DO block starting
1CC Char 4 CEECAAIFTRUE True part of IF
1D0 Char 4 CEECAAIFFALSE False part of IF
1D4 Char 4 CEECAAWHEN WHEN group starting
1D8 Char 4 CEECAAOTHER OTHERWISE group
1DC Char 4 CEECAACGOTO GOTO hook for C
1E0 Char 4 CEECAARSVDH1 Reserved hook
1E4 Char 4 CEECAARSVDH2 Reserved hook
1E8 Char 4 CEECAAMULTEVT Multiple Event Hook
1EC Bit (32) 4 CEECAAMEVMASK Muliple Event Hook Mask -End of Debug
1F0 Char 80 CEECAAMEMBER_AREA
1F0 Address
4 CEECAACGENE C/370 CGENE
1F4 Address
4 CEECAACRENT C/370 writable static
1F8 Char 8 CEECAACFLTINIT Used to convert fixed to float cfltini
200 Address
4 CEECAACPRMS Address of parameters passed to main module
204 Signed 4 CEECAAC_RTL Combination of 24 unique C/370 trc typ
66 z/OS: z/OS Language Environment Debugging Guide
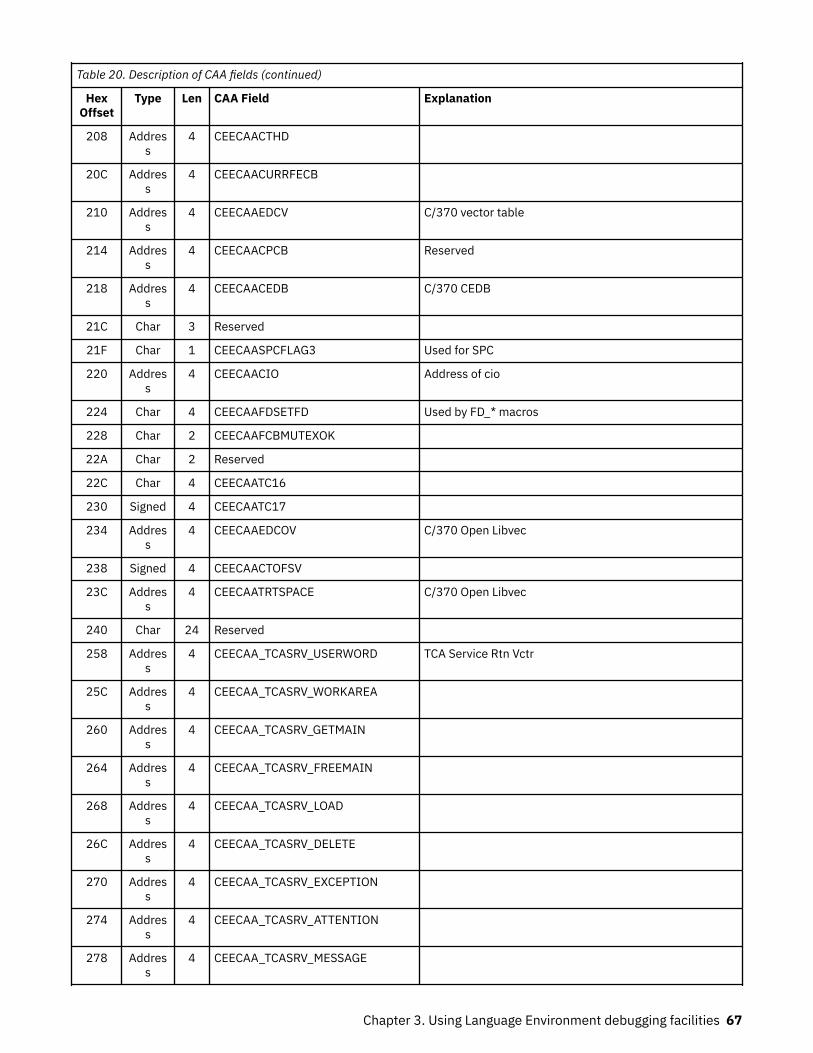
Table 20. Description of CAA fields (continued)
HexOffset
Type Len CAA Field Explanation
208 Address
4 CEECAACTHD
20C Address
4 CEECAACURRFECB
210 Address
4 CEECAAEDCV C/370 vector table
214 Address
4 CEECAACPCB Reserved
218 Address
4 CEECAACEDB C/370 CEDB
21C Char 3 Reserved
21F Char 1 CEECAASPCFLAG3 Used for SPC
220 Address
4 CEECAACIO Address of cio
224 Char 4 CEECAAFDSETFD Used by FD_* macros
228 Char 2 CEECAAFCBMUTEXOK
22A Char 2 Reserved
22C Char 4 CEECAATC16
230 Signed 4 CEECAATC17
234 Address
4 CEECAAEDCOV C/370 Open Libvec
238 Signed 4 CEECAACTOFSV
23C Address
4 CEECAATRTSPACE C/370 Open Libvec
240 Char 24 Reserved
258 Address
4 CEECAA_TCASRV_USERWORD TCA Service Rtn Vctr
25C Address
4 CEECAA_TCASRV_WORKAREA
260 Address
4 CEECAA_TCASRV_GETMAIN
264 Address
4 CEECAA_TCASRV_FREEMAIN
268 Address
4 CEECAA_TCASRV_LOAD
26C Address
4 CEECAA_TCASRV_DELETE
270 Address
4 CEECAA_TCASRV_EXCEPTION
274 Address
4 CEECAA_TCASRV_ATTENTION
278 Address
4 CEECAA_TCASRV_MESSAGE
Chapter 3. Using Language Environment debugging facilities 67
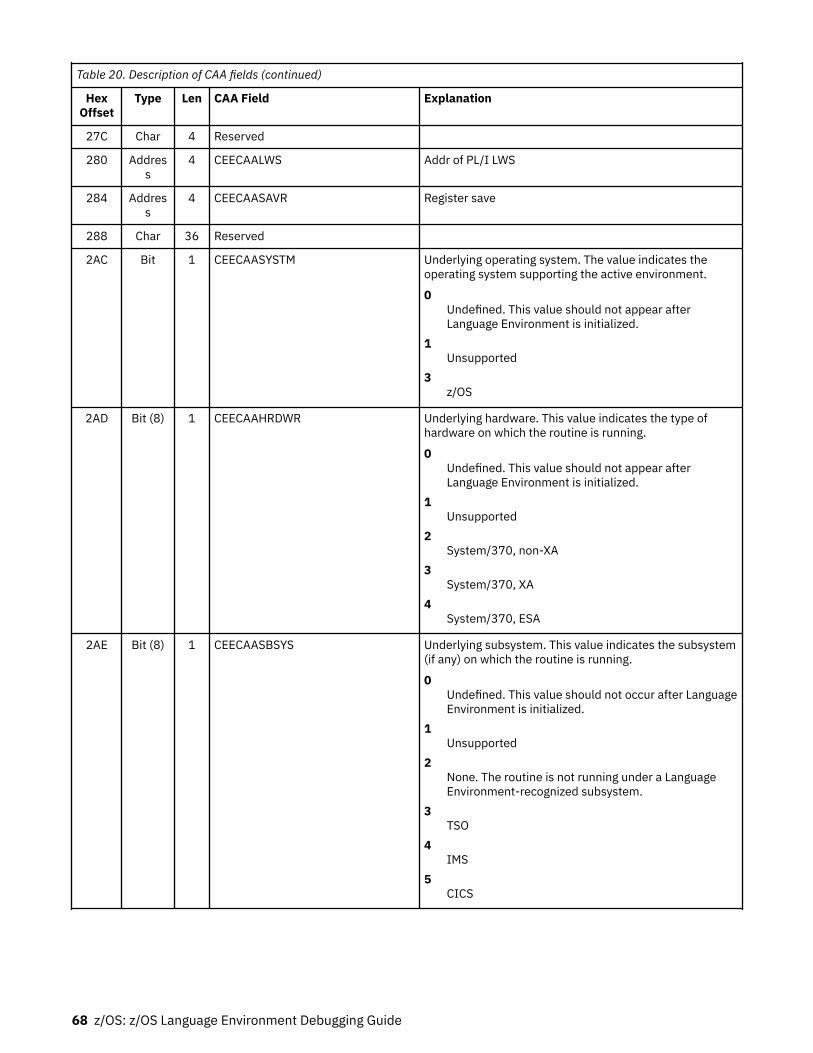
Table 20. Description of CAA fields (continued)
HexOffset
Type Len CAA Field Explanation
27C Char 4 Reserved
280 Address
4 CEECAALWS Addr of PL/I LWS
284 Address
4 CEECAASAVR Register save
288 Char 36 Reserved
2AC Bit 1 CEECAASYSTM Underlying operating system. The value indicates theoperating system supporting the active environment.
0Undefined. This value should not appear afterLanguage Environment is initialized.
1Unsupported
3z/OS
2AD Bit (8) 1 CEECAAHRDWR Underlying hardware. This value indicates the type ofhardware on which the routine is running.
0Undefined. This value should not appear afterLanguage Environment is initialized.
1Unsupported
2System/370, non-XA
3System/370, XA
4System/370, ESA
2AE Bit (8) 1 CEECAASBSYS Underlying subsystem. This value indicates the subsystem(if any) on which the routine is running.
0Undefined. This value should not occur after LanguageEnvironment is initialized.
1Unsupported
2None. The routine is not running under a LanguageEnvironment-recognized subsystem.
3TSO
4IMS
5CICS
68 z/OS: z/OS Language Environment Debugging Guide
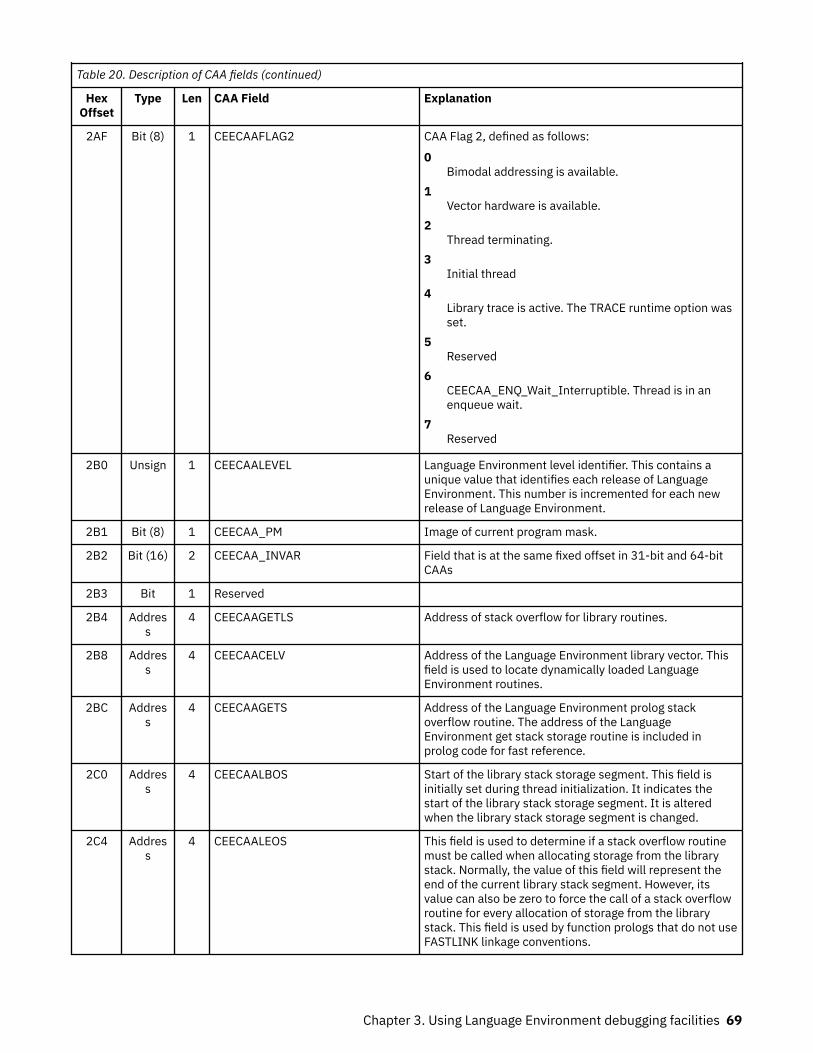
Table 20. Description of CAA fields (continued)
HexOffset
Type Len CAA Field Explanation
2AF Bit (8) 1 CEECAAFLAG2 CAA Flag 2, defined as follows:
0Bimodal addressing is available.
1Vector hardware is available.
2Thread terminating.
3Initial thread
4Library trace is active. The TRACE runtime option wasset.
5Reserved
6CEECAA_ENQ_Wait_Interruptible. Thread is in anenqueue wait.
7Reserved
2B0 Unsign 1 CEECAALEVEL Language Environment level identifier. This contains aunique value that identifies each release of LanguageEnvironment. This number is incremented for each newrelease of Language Environment.
2B1 Bit (8) 1 CEECAA_PM Image of current program mask.
2B2 Bit (16) 2 CEECAA_INVAR Field that is at the same fixed offset in 31-bit and 64-bitCAAs
2B3 Bit 1 Reserved
2B4 Address
4 CEECAAGETLS Address of stack overflow for library routines.
2B8 Address
4 CEECAACELV Address of the Language Environment library vector. Thisfield is used to locate dynamically loaded LanguageEnvironment routines.
2BC Address
4 CEECAAGETS Address of the Language Environment prolog stackoverflow routine. The address of the LanguageEnvironment get stack storage routine is included inprolog code for fast reference.
2C0 Address
4 CEECAALBOS Start of the library stack storage segment. This field isinitially set during thread initialization. It indicates thestart of the library stack storage segment. It is alteredwhen the library stack storage segment is changed.
2C4 Address
4 CEECAALEOS This field is used to determine if a stack overflow routinemust be called when allocating storage from the librarystack. Normally, the value of this field will represent theend of the current library stack segment. However, itsvalue can also be zero to force the call of a stack overflowroutine for every allocation of storage from the librarystack. This field is used by function prologs that do not useFASTLINK linkage conventions.
Chapter 3. Using Language Environment debugging facilities 69
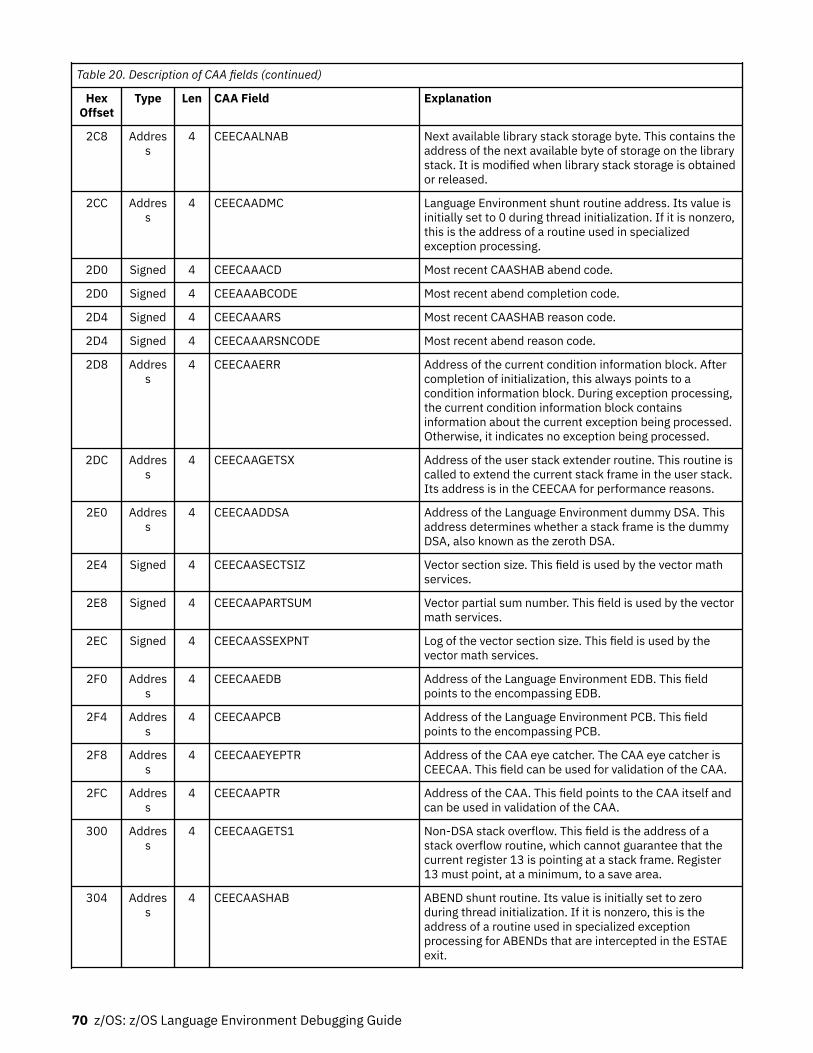
Table 20. Description of CAA fields (continued)
HexOffset
Type Len CAA Field Explanation
2C8 Address
4 CEECAALNAB Next available library stack storage byte. This contains theaddress of the next available byte of storage on the librarystack. It is modified when library stack storage is obtainedor released.
2CC Address
4 CEECAADMC Language Environment shunt routine address. Its value isinitially set to 0 during thread initialization. If it is nonzero,this is the address of a routine used in specializedexception processing.
2D0 Signed 4 CEECAAACD Most recent CAASHAB abend code.
2D0 Signed 4 CEEAAABCODE Most recent abend completion code.
2D4 Signed 4 CEECAAARS Most recent CAASHAB reason code.
2D4 Signed 4 CEECAAARSNCODE Most recent abend reason code.
2D8 Address
4 CEECAAERR Address of the current condition information block. Aftercompletion of initialization, this always points to acondition information block. During exception processing,the current condition information block containsinformation about the current exception being processed.Otherwise, it indicates no exception being processed.
2DC Address
4 CEECAAGETSX Address of the user stack extender routine. This routine iscalled to extend the current stack frame in the user stack.Its address is in the CEECAA for performance reasons.
2E0 Address
4 CEECAADDSA Address of the Language Environment dummy DSA. Thisaddress determines whether a stack frame is the dummyDSA, also known as the zeroth DSA.
2E4 Signed 4 CEECAASECTSIZ Vector section size. This field is used by the vector mathservices.
2E8 Signed 4 CEECAAPARTSUM Vector partial sum number. This field is used by the vectormath services.
2EC Signed 4 CEECAASSEXPNT Log of the vector section size. This field is used by thevector math services.
2F0 Address
4 CEECAAEDB Address of the Language Environment EDB. This fieldpoints to the encompassing EDB.
2F4 Address
4 CEECAAPCB Address of the Language Environment PCB. This fieldpoints to the encompassing PCB.
2F8 Address
4 CEECAAEYEPTR Address of the CAA eye catcher. The CAA eye catcher isCEECAA. This field can be used for validation of the CAA.
2FC Address
4 CEECAAPTR Address of the CAA. This field points to the CAA itself andcan be used in validation of the CAA.
300 Address
4 CEECAAGETS1 Non-DSA stack overflow. This field is the address of astack overflow routine, which cannot guarantee that thecurrent register 13 is pointing at a stack frame. Register13 must point, at a minimum, to a save area.
304 Address
4 CEECAASHAB ABEND shunt routine. Its value is initially set to zeroduring thread initialization. If it is nonzero, this is theaddress of a routine used in specialized exceptionprocessing for ABENDs that are intercepted in the ESTAEexit.
70 z/OS: z/OS Language Environment Debugging Guide
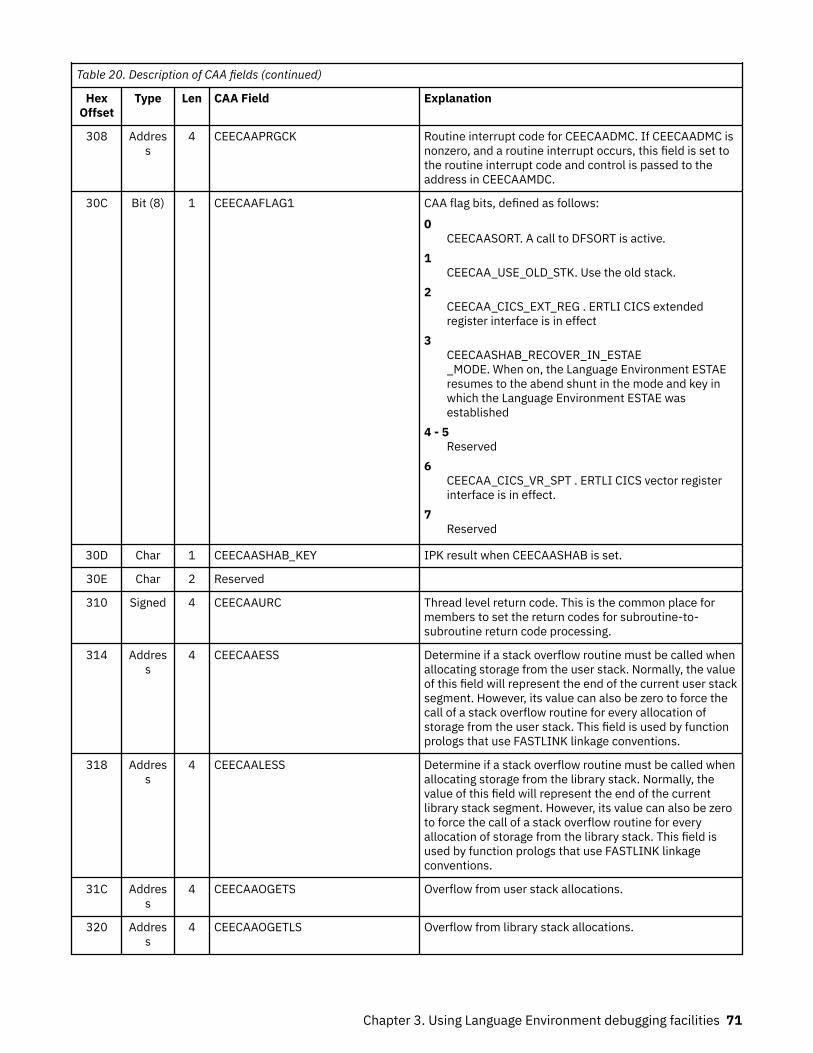
Table 20. Description of CAA fields (continued)
HexOffset
Type Len CAA Field Explanation
308 Address
4 CEECAAPRGCK Routine interrupt code for CEECAADMC. If CEECAADMC isnonzero, and a routine interrupt occurs, this field is set tothe routine interrupt code and control is passed to theaddress in CEECAAMDC.
30C Bit (8) 1 CEECAAFLAG1 CAA flag bits, defined as follows:
0CEECAASORT. A call to DFSORT is active.
1CEECAA_USE_OLD_STK. Use the old stack.
2CEECAA_CICS_EXT_REG . ERTLI CICS extendedregister interface is in effect
3CEECAASHAB_RECOVER_IN_ESTAE_MODE. When on, the Language Environment ESTAEresumes to the abend shunt in the mode and key inwhich the Language Environment ESTAE wasestablished
4 - 5Reserved
6CEECAA_CICS_VR_SPT . ERTLI CICS vector registerinterface is in effect.
7Reserved
30D Char 1 CEECAASHAB_KEY IPK result when CEECAASHAB is set.
30E Char 2 Reserved
310 Signed 4 CEECAAURC Thread level return code. This is the common place formembers to set the return codes for subroutine-to-subroutine return code processing.
314 Address
4 CEECAAESS Determine if a stack overflow routine must be called whenallocating storage from the user stack. Normally, the valueof this field will represent the end of the current user stacksegment. However, its value can also be zero to force thecall of a stack overflow routine for every allocation ofstorage from the user stack. This field is used by functionprologs that use FASTLINK linkage conventions.
318 Address
4 CEECAALESS Determine if a stack overflow routine must be called whenallocating storage from the library stack. Normally, thevalue of this field will represent the end of the currentlibrary stack segment. However, its value can also be zeroto force the call of a stack overflow routine for everyallocation of storage from the library stack. This field isused by function prologs that use FASTLINK linkageconventions.
31C Address
4 CEECAAOGETS Overflow from user stack allocations.
320 Address
4 CEECAAOGETLS Overflow from library stack allocations.
Chapter 3. Using Language Environment debugging facilities 71
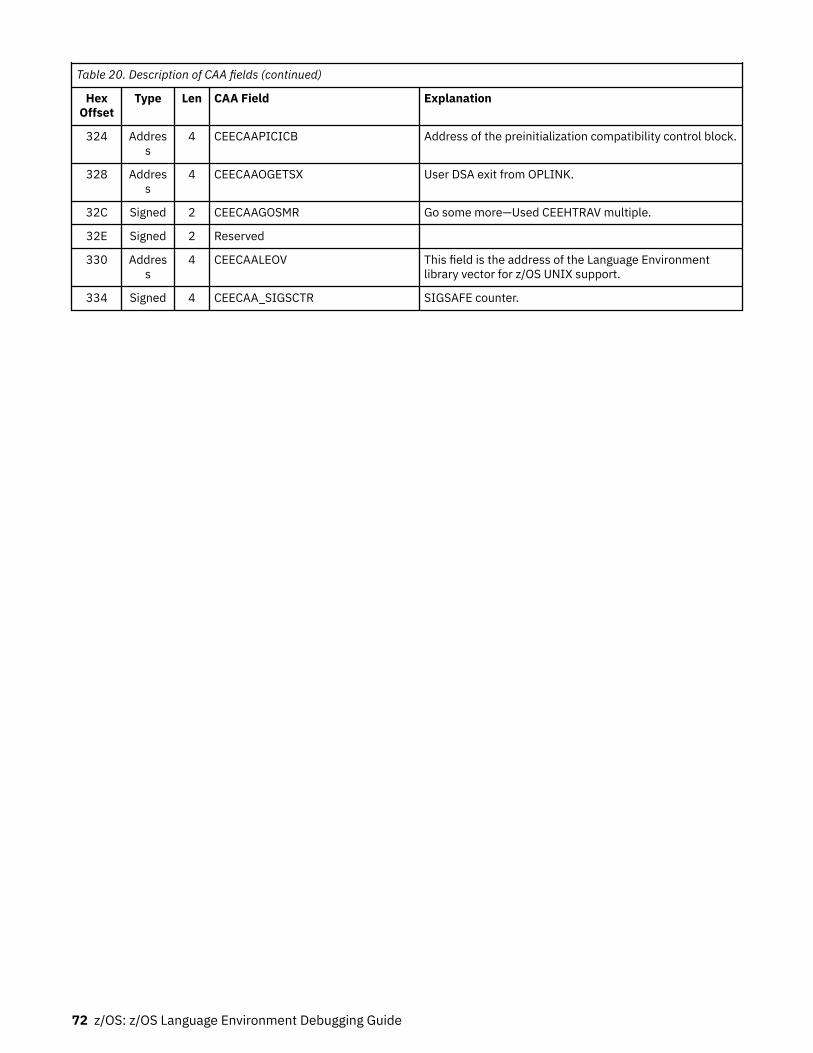
Table 20. Description of CAA fields (continued)
HexOffset
Type Len CAA Field Explanation
324 Address
4 CEECAAPICICB Address of the preinitialization compatibility control block.
328 Address
4 CEECAAOGETSX User DSA exit from OPLINK.
32C Signed 2 CEECAAGOSMR Go some more—Used CEEHTRAV multiple.
32E Signed 2 Reserved
330 Address
4 CEECAALEOV This field is the address of the Language Environmentlibrary vector for z/OS UNIX support.
334 Signed 4 CEECAA_SIGSCTR SIGSAFE counter.
72 z/OS: z/OS Language Environment Debugging Guide
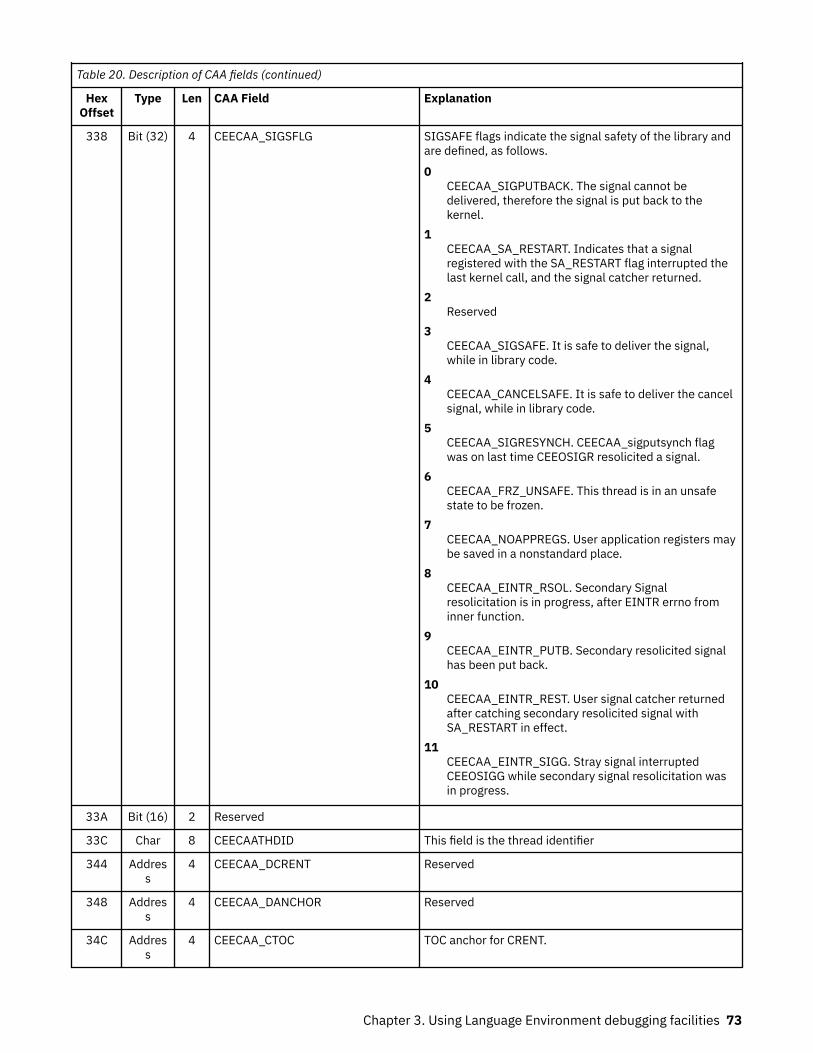
Table 20. Description of CAA fields (continued)
HexOffset
Type Len CAA Field Explanation
338 Bit (32) 4 CEECAA_SIGSFLG SIGSAFE flags indicate the signal safety of the library andare defined, as follows.
0CEECAA_SIGPUTBACK. The signal cannot bedelivered, therefore the signal is put back to thekernel.
1CEECAA_SA_RESTART. Indicates that a signalregistered with the SA_RESTART flag interrupted thelast kernel call, and the signal catcher returned.
2Reserved
3CEECAA_SIGSAFE. It is safe to deliver the signal,while in library code.
4CEECAA_CANCELSAFE. It is safe to deliver the cancelsignal, while in library code.
5CEECAA_SIGRESYNCH. CEECAA_sigputsynch flagwas on last time CEEOSIGR resolicited a signal.
6CEECAA_FRZ_UNSAFE. This thread is in an unsafestate to be frozen.
7CEECAA_NOAPPREGS. User application registers maybe saved in a nonstandard place.
8CEECAA_EINTR_RSOL. Secondary Signalresolicitation is in progress, after EINTR errno frominner function.
9CEECAA_EINTR_PUTB. Secondary resolicited signalhas been put back.
10CEECAA_EINTR_REST. User signal catcher returnedafter catching secondary resolicited signal withSA_RESTART in effect.
11CEECAA_EINTR_SIGG. Stray signal interruptedCEEOSIGG while secondary signal resolicitation wasin progress.
33A Bit (16) 2 Reserved
33C Char 8 CEECAATHDID This field is the thread identifier
344 Address
4 CEECAA_DCRENT Reserved
348 Address
4 CEECAA_DANCHOR Reserved
34C Address
4 CEECAA_CTOC TOC anchor for CRENT.
Chapter 3. Using Language Environment debugging facilities 73
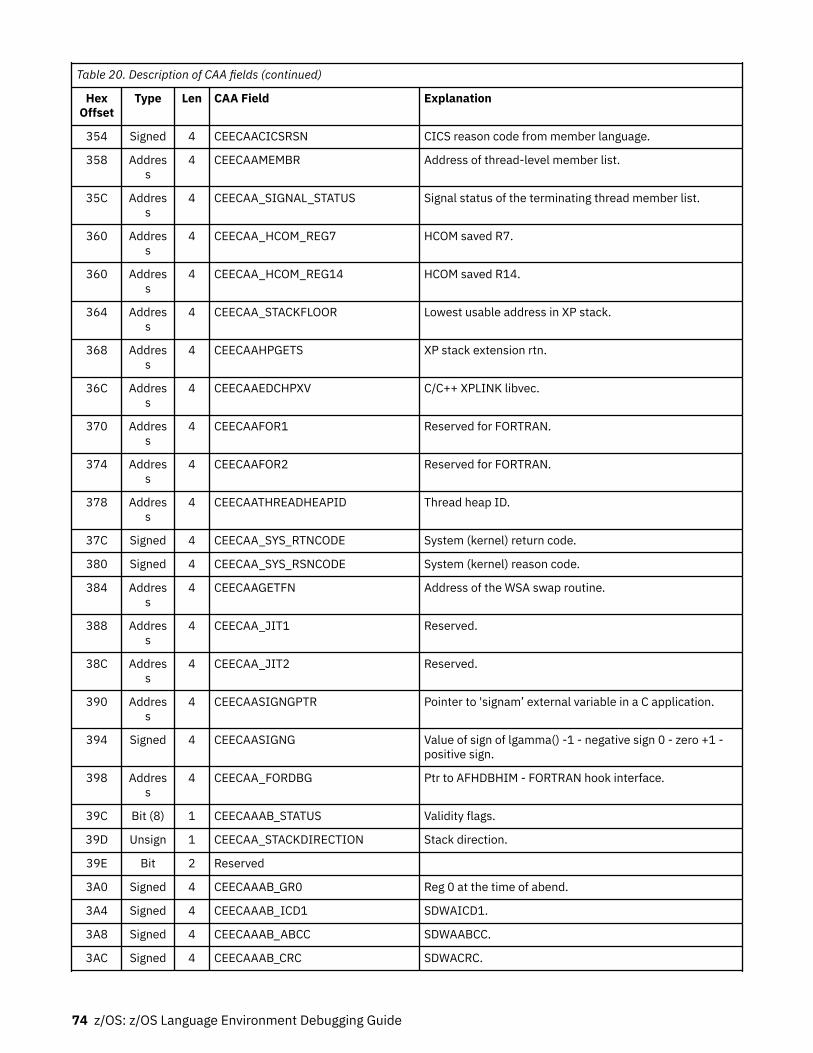
Table 20. Description of CAA fields (continued)
HexOffset
Type Len CAA Field Explanation
354 Signed 4 CEECAACICSRSN CICS reason code from member language.
358 Address
4 CEECAAMEMBR Address of thread-level member list.
35C Address
4 CEECAA_SIGNAL_STATUS Signal status of the terminating thread member list.
360 Address
4 CEECAA_HCOM_REG7 HCOM saved R7.
360 Address
4 CEECAA_HCOM_REG14 HCOM saved R14.
364 Address
4 CEECAA_STACKFLOOR Lowest usable address in XP stack.
368 Address
4 CEECAAHPGETS XP stack extension rtn.
36C Address
4 CEECAAEDCHPXV C/C++ XPLINK libvec.
370 Address
4 CEECAAFOR1 Reserved for FORTRAN.
374 Address
4 CEECAAFOR2 Reserved for FORTRAN.
378 Address
4 CEECAATHREADHEAPID Thread heap ID.
37C Signed 4 CEECAA_SYS_RTNCODE System (kernel) return code.
380 Signed 4 CEECAA_SYS_RSNCODE System (kernel) reason code.
384 Address
4 CEECAAGETFN Address of the WSA swap routine.
388 Address
4 CEECAA_JIT1 Reserved.
38C Address
4 CEECAA_JIT2 Reserved.
390 Address
4 CEECAASIGNGPTR Pointer to 'signam’ external variable in a C application.
394 Signed 4 CEECAASIGNG Value of sign of lgamma() -1 - negative sign 0 - zero +1 -positive sign.
398 Address
4 CEECAA_FORDBG Ptr to AFHDBHIM - FORTRAN hook interface.
39C Bit (8) 1 CEECAAAB_STATUS Validity flags.
39D Unsign 1 CEECAA_STACKDIRECTION Stack direction.
39E Bit 2 Reserved
3A0 Signed 4 CEECAAAB_GR0 Reg 0 at the time of abend.
3A4 Signed 4 CEECAAAB_ICD1 SDWAICD1.
3A8 Signed 4 CEECAAAB_ABCC SDWAABCC.
3AC Signed 4 CEECAAAB_CRC SDWACRC.
74 z/OS: z/OS Language Environment Debugging Guide
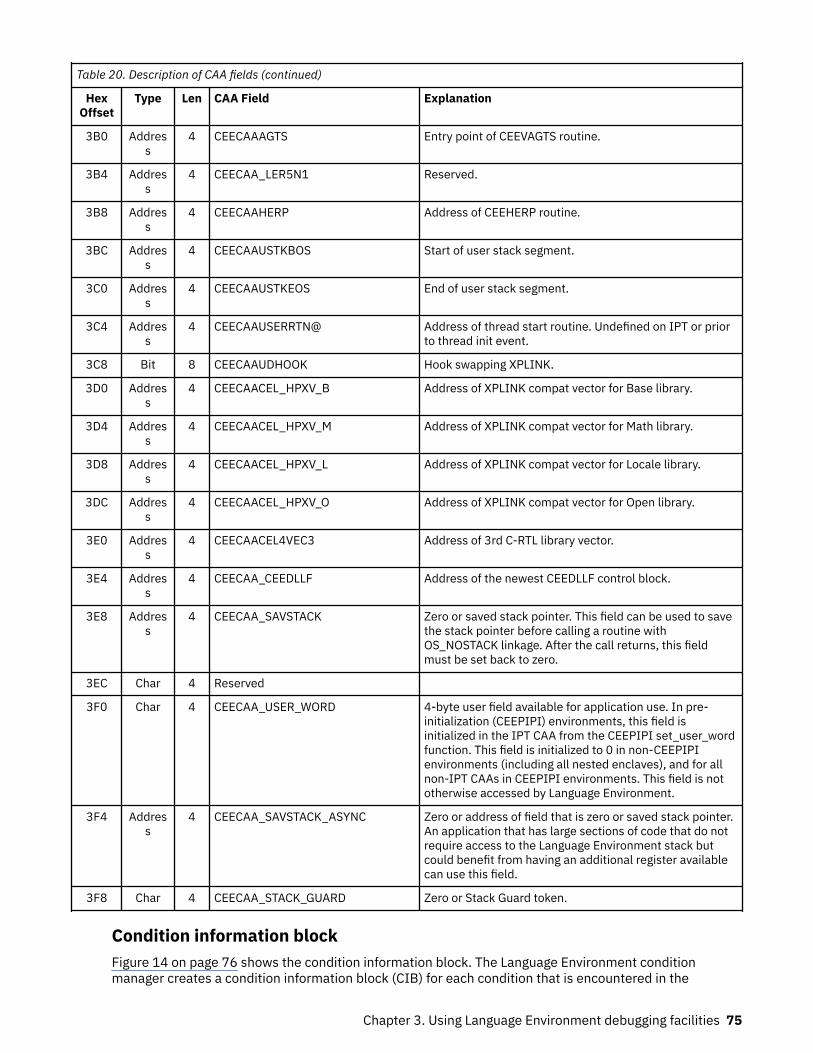
Table 20. Description of CAA fields (continued)
HexOffset
Type Len CAA Field Explanation
3B0 Address
4 CEECAAAGTS Entry point of CEEVAGTS routine.
3B4 Address
4 CEECAA_LER5N1 Reserved.
3B8 Address
4 CEECAAHERP Address of CEEHERP routine.
3BC Address
4 CEECAAUSTKBOS Start of user stack segment.
3C0 Address
4 CEECAAUSTKEOS End of user stack segment.
3C4 Address
4 CEECAAUSERRTN@ Address of thread start routine. Undefined on IPT or priorto thread init event.
3C8 Bit 8 CEECAAUDHOOK Hook swapping XPLINK.
3D0 Address
4 CEECAACEL_HPXV_B Address of XPLINK compat vector for Base library.
3D4 Address
4 CEECAACEL_HPXV_M Address of XPLINK compat vector for Math library.
3D8 Address
4 CEECAACEL_HPXV_L Address of XPLINK compat vector for Locale library.
3DC Address
4 CEECAACEL_HPXV_O Address of XPLINK compat vector for Open library.
3E0 Address
4 CEECAACEL4VEC3 Address of 3rd C-RTL library vector.
3E4 Address
4 CEECAA_CEEDLLF Address of the newest CEEDLLF control block.
3E8 Address
4 CEECAA_SAVSTACK Zero or saved stack pointer. This field can be used to savethe stack pointer before calling a routine withOS_NOSTACK linkage. After the call returns, this fieldmust be set back to zero.
3EC Char 4 Reserved
3F0 Char 4 CEECAA_USER_WORD 4-byte user field available for application use. In pre-initialization (CEEPIPI) environments, this field isinitialized in the IPT CAA from the CEEPIPI set_user_wordfunction. This field is initialized to 0 in non-CEEPIPIenvironments (including all nested enclaves), and for allnon-IPT CAAs in CEEPIPI environments. This field is nototherwise accessed by Language Environment.
3F4 Address
4 CEECAA_SAVSTACK_ASYNC Zero or address of field that is zero or saved stack pointer.An application that has large sections of code that do notrequire access to the Language Environment stack butcould benefit from having an additional register availablecan use this field.
3F8 Char 4 CEECAA_STACK_GUARD Zero or Stack Guard token.
Condition information blockFigure 14 on page 76 shows the condition information block. The Language Environment conditionmanager creates a condition information block (CIB) for each condition that is encountered in the
Chapter 3. Using Language Environment debugging facilities 75
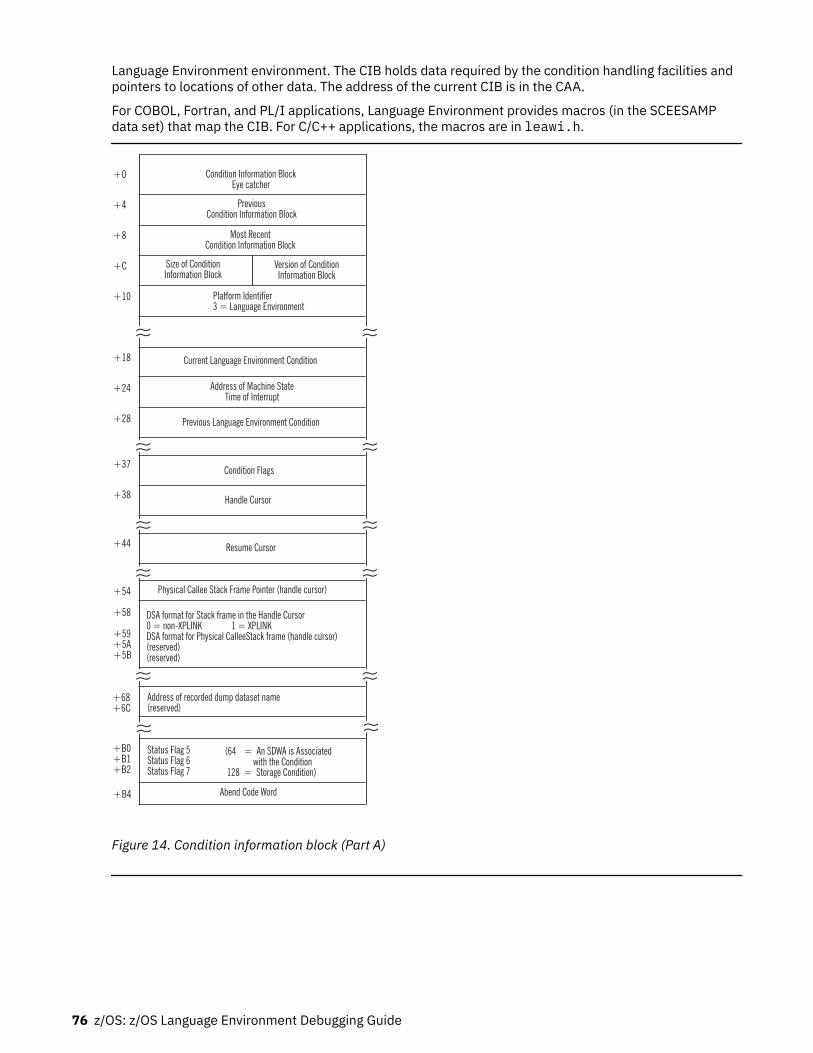
Language Environment environment. The CIB holds data required by the condition handling facilities andpointers to locations of other data. The address of the current CIB is in the CAA.
For COBOL, Fortran, and PL/I applications, Language Environment provides macros (in the SCEESAMPdata set) that map the CIB. For C/C++ applications, the macros are in leawi.h.
+58
+59+5A+5B
DSA format for Stack frame in the Handle Cursor0 = non-XPLINK 1 = XPLINKDSA format for Physical CalleeStack frame (handle cursor)(reserved)(reserved)
+54 Physical Callee Stack Frame Pointer (handle cursor)
Abend Code Word+B4
(64 = An SDWA is Associatedwith the Condition
128 = Storage Condition)
Status Flag 5Status Flag 6Status Flag 7
+68+6C
Resume Cursor
Handle Cursor
Condition Flags
Previous Language Environment Condition
Address of Machine StateTime of Interrupt
Current Language Environment Condition
Platform Identifier3 = Language Environment
Version of ConditionInformation Block
Size of ConditionInformation Block
Most RecentCondition Information Block
PreviousCondition Information Block
Condition Information BlockEye catcher
+0
+4
+8
+C
+10
+18
+24
+28
+37
+38
+44
~~ ~~
~~ ~~
~~ ~~
~~ ~~
~~ ~~Address of recorded dump dataset name(reserved)
~~+B0+B1+B2
~~
Figure 14. Condition information block (Part A)
76 z/OS: z/OS Language Environment Debugging Guide
Pointer to Language Environment'sCopy of the z/OS UNIX PPSD
+104
Address of the SDWAAssociated with the Condition
+F8
Name of the AbnormalTermination Exit in Control
Return or Action CodeFrom Condition Handler
+EC
Identification Code atTime of Interrupt
+E4
Token Provided by CEEHDLRor SF Address
+D4
+D8
+DC
+E0
Address of Feedback Tokenfor Signaled Conditions
Save Area of the FirstLanguage Environment-Conforming Prolog
First Language Environment-Conforming Prolog
+F4
Member Function Code
Address of Feedback Tokenfor Signaled Conditions
Address of Save Areaat Time of EVENT
Abend Load Module Name
+B8
+BC
+C4
+C8
+CC
~~ ~~
~~ ~~
~~ ~~
~~ ~~
~~ ~~
~~ ~~
Abend Reason Word
Figure 15. Condition information block (Part B)
The flags for Condition Flag 4:2
The resume cursor was moved.4
The message service processed the condition.8
The resume cursor was explicitly moved.
The flags for Status Flag 5, Language Environment events:1
Caused by an attention interrupt.2
Caused by a signaled condition.4
Caused by a promoted condition.8
Caused by a condition management raised TIU.
Chapter 3. Using Language Environment debugging facilities 77
32Caused by a condition signaled via CEEOKILL The signaled-via-CEEOKILL flag is always set with thesignaled flag; thus, a signaled condition can have a value of either 2 or 34. (The value is 2 if thesignaled condition does not come through CEEOKILL. If it comes through CEEOKILL, its value is2+32=34.)
64Caused by a program check.
128Caused by an abend.
The flags for Status Flag 6, Language Environment actions:2
Doing stack frame zero scan.4
H-cursor pointing to owning SF.8
Enable only pass (no condition pass).16
MRC type 1.32
Resume allowed.64
Math service condition.128
Abend reason code valid.
Address of recorded dump data set name: If this address is not 0, then it points to a 44-byte fixed-length character string. If the length of the data set name is less than 44, the character string is EBCDIC-encoded and is padded by blanks.
The language-specific function codes for the CIB:X'1'
For condition procedure.X'2'
For enablement.X'3'
For stack frame zero conditions.
Using the machine state information blockThe Language Environment machine state information block contains condition information pertaining tothe hardware state at the time of the error. Figure 16 on page 79 shows the machine state informationblock.
78 z/OS: z/OS Language Environment Debugging Guide
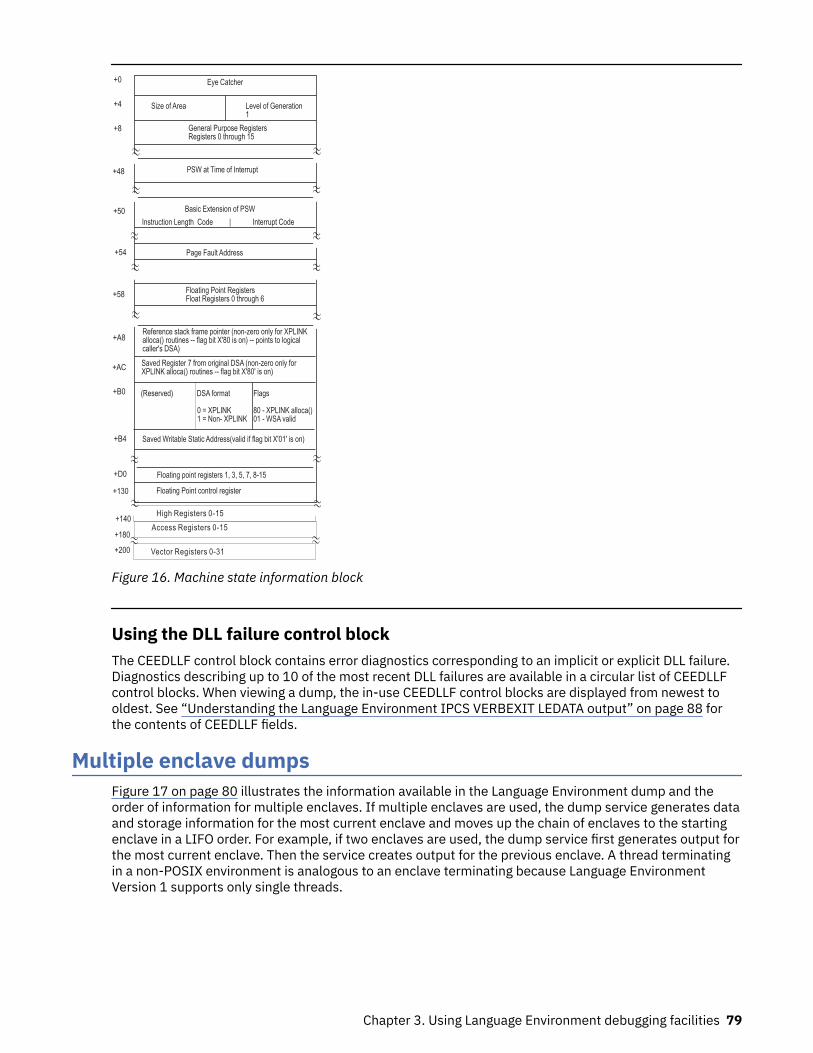
+130
+D0
Floating Point control register
Saved Writable Static Address(valid if flag bit X'01' is on)
~~ ~~Floating point registers 1, 3, 5, 7, 8-15
+B4
(Reserved) DSA format
0 = XPLINK1 = Non- XPLINK
Reference stack frame pointer (non-zero only for XPLINKalloca() routines -- flag bit X'80 is on) -- points to logicalcaller's DSA)
+B0 Flags
80 - XPLINK alloca()01 - WSA valid
+AC
Floating Point RegistersFloat Registers 0 through 6
+58
Basic Extension of PSW
~~
Saved Register 7 from original DSA (non-zero only forXPLINK alloca() routines -- flag bit X'80' is on)
Instruction Length Code | Interrupt Code
+50
Level of Generation1
General Purpose RegistersRegisters 0 through 15
Size of Area
Eye Catcher+0
+4
+8
PSW at Time of Interrupt+48
Page Fault Address+54
+A8
~~ ~~
~~
~~
~~
~~
~~
~~
~~
Access Registers 0-15
High Registers 0-15
+180
+140~~ ~~
~~ ~~+200 Vector Registers 0-31
Figure 16. Machine state information block
Using the DLL failure control blockThe CEEDLLF control block contains error diagnostics corresponding to an implicit or explicit DLL failure.Diagnostics describing up to 10 of the most recent DLL failures are available in a circular list of CEEDLLFcontrol blocks. When viewing a dump, the in-use CEEDLLF control blocks are displayed from newest tooldest. See “Understanding the Language Environment IPCS VERBEXIT LEDATA output” on page 88 forthe contents of CEEDLLF fields.
Multiple enclave dumpsFigure 17 on page 80 illustrates the information available in the Language Environment dump and theorder of information for multiple enclaves. If multiple enclaves are used, the dump service generates dataand storage information for the most current enclave and moves up the chain of enclaves to the startingenclave in a LIFO order. For example, if two enclaves are used, the dump service first generates output forthe most current enclave. Then the service creates output for the previous enclave. A thread terminatingin a non-POSIX environment is analogous to an enclave terminating because Language EnvironmentVersion 1 supports only single threads.
Chapter 3. Using Language Environment debugging facilities 79
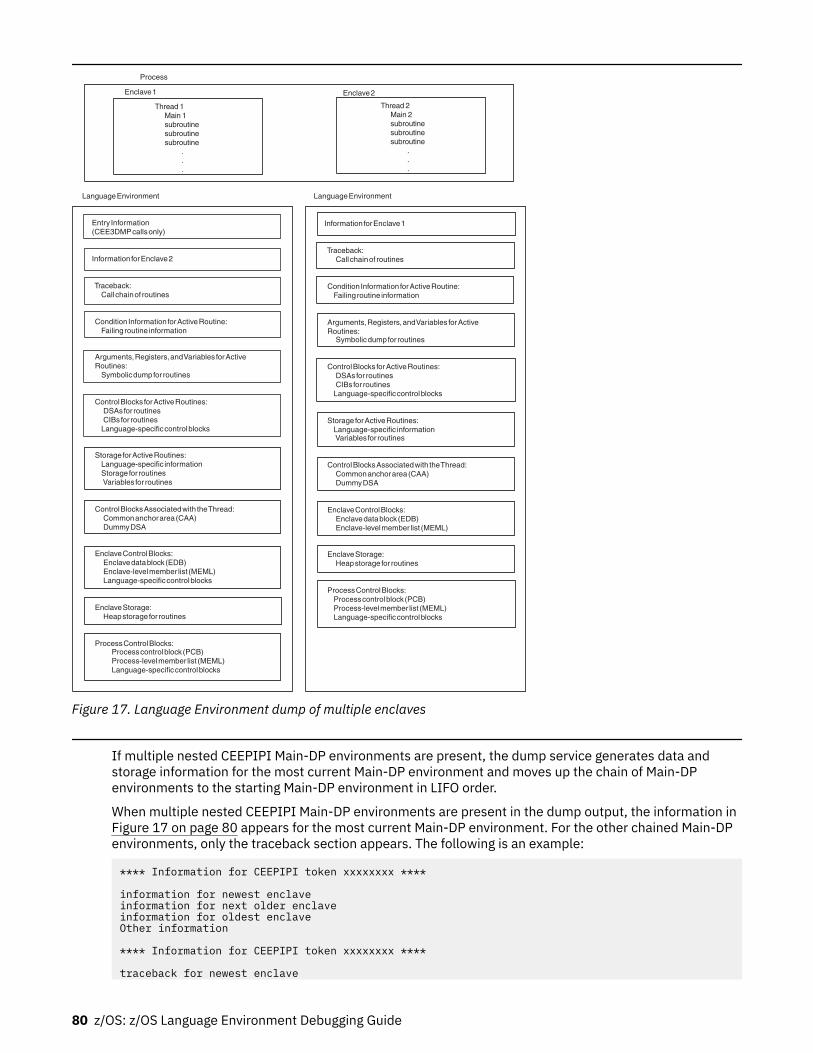
Enclave2
Information forEnclave1
Traceback:Call chainof routines
Condition Information forActiveRoutine:Failing routine information
Arguments,Registers,andVariables forActiveRoutines:
Symbolicdumpfor routines
ControlBlocks forActiveRoutines:DSAsfor routinesCIBs for routines
Language-specificcontrolblocks
StorageforActiveRoutines:Language-specific informationVariables for routines
ControlBlocksAssociatedwith theThread:Commonanchorarea(CAA)DummyDSA
EnclaveControlBlocks:Enclavedatablock(EDB)Enclave-levelmember list (MEML)
EnclaveStorage:Heapstorage for routines
ProcessControlBlocks:Processcontrolblock(PCB)Process-levelmember list (MEML)Language-specificcontrolblocks
LanguageEnvironment LanguageEnvironment
Thread 2Main 2subroutinesubroutinesubroutine
.
.
.
Enclave1
Process
Thread 1Main 1subroutinesubroutinesubroutine
.
.
.
Entry Information(CEE3DMPcallsonly)
Information forEnclave2
Traceback:Call chainof routines
Condition Information forActiveRoutine:Failing routine information
Arguments,Registers,andVariables forActiveRoutines:
Symbolicdumpfor routines
ControlBlocks forActiveRoutines:DSAsfor routinesCIBs for routines
Language-specificcontrolblocks
StorageforActiveRoutines:Language-specific informationStoragefor routinesVariables for routines
ControlBlocksAssociatedwith theThread:Commonanchorarea(CAA)DummyDSA
EnclaveControlBlocks:Enclavedatablock(EDB)Enclave-levelmember list (MEML)Language-specificcontrolblocks
EnclaveStorage:Heapstorage for routines
ProcessControlBlocks:Processcontrolblock(PCB)Process-levelmember list (MEML)Language-specificcontrolblocks
Figure 17. Language Environment dump of multiple enclaves
If multiple nested CEEPIPI Main-DP environments are present, the dump service generates data andstorage information for the most current Main-DP environment and moves up the chain of Main-DPenvironments to the starting Main-DP environment in LIFO order.
When multiple nested CEEPIPI Main-DP environments are present in the dump output, the information inFigure 17 on page 80 appears for the most current Main-DP environment. For the other chained Main-DPenvironments, only the traceback section appears. The following is an example:
**** Information for CEEPIPI token xxxxxxxx ****
information for newest enclave information for next older enclave information for oldest enclave Other information
**** Information for CEEPIPI token xxxxxxxx ****
traceback for newest enclave
80 z/OS: z/OS Language Environment Debugging Guide
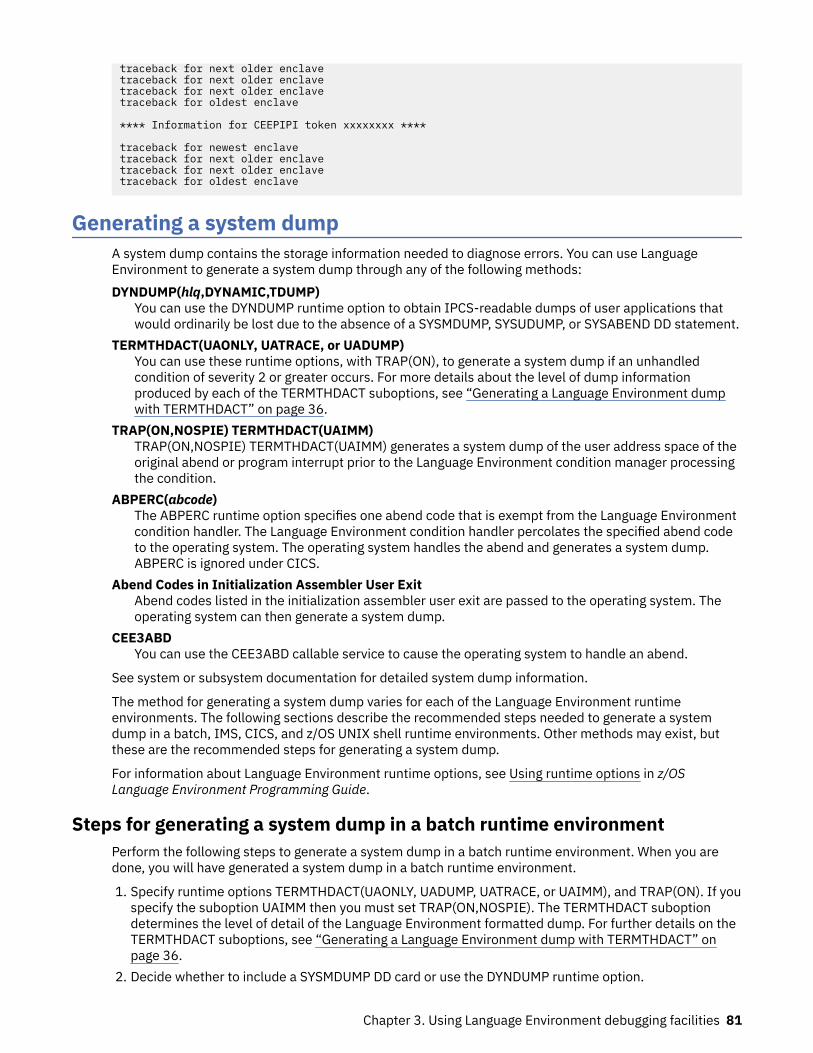
traceback for next older enclavetraceback for next older enclave traceback for next older enclavetraceback for oldest enclave
**** Information for CEEPIPI token xxxxxxxx ****
traceback for newest enclave traceback for next older enclave traceback for next older enclavetraceback for oldest enclave
Generating a system dumpA system dump contains the storage information needed to diagnose errors. You can use LanguageEnvironment to generate a system dump through any of the following methods:DYNDUMP(hlq,DYNAMIC,TDUMP)
You can use the DYNDUMP runtime option to obtain IPCS-readable dumps of user applications thatwould ordinarily be lost due to the absence of a SYSMDUMP, SYSUDUMP, or SYSABEND DD statement.
TERMTHDACT(UAONLY, UATRACE, or UADUMP)You can use these runtime options, with TRAP(ON), to generate a system dump if an unhandledcondition of severity 2 or greater occurs. For more details about the level of dump informationproduced by each of the TERMTHDACT suboptions, see “Generating a Language Environment dumpwith TERMTHDACT” on page 36.
TRAP(ON,NOSPIE) TERMTHDACT(UAIMM)TRAP(ON,NOSPIE) TERMTHDACT(UAIMM) generates a system dump of the user address space of theoriginal abend or program interrupt prior to the Language Environment condition manager processingthe condition.
ABPERC(abcode)The ABPERC runtime option specifies one abend code that is exempt from the Language Environmentcondition handler. The Language Environment condition handler percolates the specified abend codeto the operating system. The operating system handles the abend and generates a system dump.ABPERC is ignored under CICS.
Abend Codes in Initialization Assembler User ExitAbend codes listed in the initialization assembler user exit are passed to the operating system. Theoperating system can then generate a system dump.
CEE3ABDYou can use the CEE3ABD callable service to cause the operating system to handle an abend.
See system or subsystem documentation for detailed system dump information.
The method for generating a system dump varies for each of the Language Environment runtimeenvironments. The following sections describe the recommended steps needed to generate a systemdump in a batch, IMS, CICS, and z/OS UNIX shell runtime environments. Other methods may exist, butthese are the recommended steps for generating a system dump.
For information about Language Environment runtime options, see Using runtime options in z/OSLanguage Environment Programming Guide.
Steps for generating a system dump in a batch runtime environmentPerform the following steps to generate a system dump in a batch runtime environment. When you aredone, you will have generated a system dump in a batch runtime environment.
1. Specify runtime options TERMTHDACT(UAONLY, UADUMP, UATRACE, or UAIMM), and TRAP(ON). If youspecify the suboption UAIMM then you must set TRAP(ON,NOSPIE). The TERMTHDACT suboptiondetermines the level of detail of the Language Environment formatted dump. For further details on theTERMTHDACT suboptions, see “Generating a Language Environment dump with TERMTHDACT” onpage 36.
2. Decide whether to include a SYSMDUMP DD card or use the DYNDUMP runtime option.
Chapter 3. Using Language Environment debugging facilities 81
• Include a SYSMDUMP DD card with the desired data set name and DCB information:
LRECL=4160, BLKSIZE=4160, and RECFM=FBS.
• Specify the DYNDUMP runtime option with the following information:
DYNDUMP (hlq,DYNAMIC,TDUMP)
3. Rerun the program.
Steps for generating a system dump in an IMS runtime environmentPerform the following steps to generate a system dump in an IMS runtime environment. When you aredone, you will have generated system dump in an IMS runtime environment.
1. Specify runtime options TERMTHDACT(UAONLY, UADUMP, UATRACE, or UAIMM), ABTERM(ABEND),and TRAP(ON). If you specify the suboption UAIMM, then you must set TRAP(ON,NOSPIE). TheTERMTHDACT suboption determines the level of detail of the Language Environment formatted dump.For further details on the TERMTHDACT suboptions, see “Generating a Language Environment dumpwith TERMTHDACT” on page 36.
2. Decide whether to include a SYSMDUMP DD card or use the DYNDUMP runtime option.
• Include a SYSMDUMP DD card with the data set name and DCB information:
LRECL=4160, BLKSIZE=4160, and RECFM=FBS.
• Specify the DYNDUMP runtime option with the following information:
DYNDUMP (hlq,DYNAMIC,TDUMP)
3. Rerun the program.
Steps for generating a system dump in a CICS runtime environmentBefore you begin: Under CICS, a system dump provides the most useful information for diagnosingproblems. However, if you have a Language Environment U4038 abend, CICS will not generate a systemdump. To generate diagnostic information for a CICS runtime environment with a Language EnvironmentU4038 abend, you must create a Language Environment U4039 abend. For instructions on how to createa Language Environment U4039 abend, see “Steps for generating a Language Environment U4039 abend”on page 83.
Note: DYNDUMP is ignored in a CICS environment.
Perform the following steps to generate a system dump in a CICS runtime environment. When you aredone, you will have generated a system dump in a CICS runtime environment.
1. Specify runtime options TERMTHDACT(UAONLY, UADUMP, or UATRACE), ABTERM(ABEND), andTRAP(ON). The TERMTHDACT suboption determines the level of detail of the Language Environmentformatted dump. For more details on the TERMTHDACT suboptions, see “Generating a LanguageEnvironment dump with TERMTHDACT” on page 36.
2. Update the transaction dump table with the CICS-supplied CEMT command:
CEMT SET TRD(40XX) SYS ADD
ResultYou will see CEMT output.
Example
STATUS: RESULTS - OVERTYPE TO MODIFYTrd(4088) Sys Loc Max( 999 ) Cur(0000)
3. Rerun the program.
82 z/OS: z/OS Language Environment Debugging Guide
Steps for generating a Language Environment U4039 abendIf you have a Language Environment U4038 abend, CICS will not generate a system dump. To generatediagnostic information, you must create a Language Environment U4039 abend by performing thefollowing steps. By setting these runtime options, a Language Environment U4039 abend occurs whichgenerates a system dump.
1. Specify DUMP=YES in CICS DFHSIT.2. Specify runtime options TERMTHDACT(UAONLY, UATRACE, or UADUMP), ABTERM(ABEND), and
TRAP(ON)3. Rerun the program.
Steps for generating a system dump in a z/OS UNIX shellPerform the following steps to generate a system dump from a z/OS UNIX shell:
• Using _BPXK_MDUMP
1. Specify where to write the system dump
– To write the system dump to a z/OS data set, issue the following command, where filename is afully qualified data set name with DCB information: LRECL=4160, BLKSIZE=4160, andRECFM=FBS.
export _BPXK_MDUMP=filename
Exampleexport _BPXK_MDUMP=hlq.mydump
– To write the system dump to a z/OS UNIX file, issue the following command, where filename is afully qualified z/OS UNIX file name.
export _BPXK_MDUMP=filename
Exampleexport _BPXK_MDUMP=/tmp/mydump.dmp
2. Specify Language Environment runtime options, where suboption is UAONLY, UADUMP, UATRACE, orUAIMM.
export _CEE_RUNOPTS="termthdact(suboption)"
If UAIMM is set, TRAP(ON,NOSPIE) must also be set. The TERMTHDACT suboption determines thelevel of detail of the Language Environment formatted dump. For more details about theTERMTHDACT suboptions, see “Generating a Language Environment dump with TERMTHDACT” onpage 36.
3. Rerun the program.
When you are done, the system dump is written to the data set name or z/OS UNIX file name that wasspecified. For additional _BPXK_MDUMP information see _BPXK environment variables in z/OS UNIXSystem Services Planning.
• Using DYNDUMP
1. Specify Language Environment runtime options:
export _CEE_RUNOPTS="termthdact(suboption),DYNDUMP(hlq,DYNAMIC,TDUMP)"
suboptionis UAONLY, UADUMP, UATRACE, or UAIMM. If UAIMM is set, TRAP(ON,NOSPIE) must also be set.The TERMTHDACT suboption determines the level of detail of the Language Environmentformatted dump. For more details about the TERMTHDACT suboptions, see “Generating aLanguage Environment dump with TERMTHDACT” on page 36.
Chapter 3. Using Language Environment debugging facilities 83
hlqthe high level qualifier for the dump data set to be created.
2. Rerun the program.
When you are done, the system dump is written to the name generated by the DYNDUMP runtimeoption. For more information about DYNDUMP, see DYNDUMP in z/OS Language EnvironmentProgramming Reference.
You can also specify the signal SIGDUMP on the kill command to generate a system dump of the useraddress space. For more information about the kill command and the SIGDUMP signal, see kill - End aprocess or job, or send it a signal in z/OS UNIX System Services Command Reference.
Formatting and analyzing system dumpsYou can use the interactive problem control system (IPCS) to format and analyze system dumps.Language Environment provides an IPCS VERBEXIT LEDATA that can be used to format LanguageEnvironment control blocks. For more information about IPCS, see z/OS MVS IPCS User's Guide.
Preparing to use the Language Environment support for IPCSUse the following guidelines before you use IPCS to format Language Environment control blocks:
• Ensure that your IPCS job can find the CEEIPCSP member.
IPCS provides an exit control table with imbed statements to enable other products to supply exitcontrol information. The IPCS default table, BLSCECT, normally in the SYS1.PARMLIB library, has thefollowing entry for Language Environment:
IMBED MEMBER(CEEIPCSP) ENVIRONMENT(IPCS)
The Language Environment-supplied CEEIPCSP member, installed in the SYS1.PARMLIB library,contains the Language Environment-specific entries for the IPCS exit control table.
• Provide an IPCSPARM DD statement to specify the libraries containing the IPCS control tables.Example
//IPCSPARM DD DSN=SYS1.PARMLIB,DISP=SHR• Ensure that your IPCS job can find the Language Environment-supplied ANALYZE exit routines installed
in the SYS1.MIGLIB library.• To aid in debugging system or address space hang situations, Language Environment mutexes, latches
and condition variables can be displayed if the CEEIPCSP member you are using is updated to identifythe Language Environment ANALYZE exit, by including the following statement:
EXIT EP(CEEEANLZ) ANALYZE
Understanding Language Environment IPCS VERBEXIT – LEDATA
Purpose
Use the LEDATA verb exit to format data for Language Environment. This VERBEXIT provides informationabout the following topics:
• A summary of Language Environment at the time of the dump• Runtime Options• Storage Management Control Blocks• Condition Management Control Blocks• Message Handler Control Blocks
84 z/OS: z/OS Language Environment Debugging Guide
• C/C++ Control Blocks• COBOL Control Blocks• PL/I Control Blocks
Format
VERBEXIT LEDATA [ 'parameter[,parameter]...']
Report Type Parameters: [ SUM ] [ HEAP | STACK | SM ] [ HPT(number) [ HPTTCB (address) ] [ HPTCELL(address) ] [ HPTLOC(location) ] ] [ CM ] [ MH ] [ CEEDUMP ] [ COMP(value) ] [ PTBL(value) ] [ SW3164 ] [ ALL ]
Data Selection Parameters: [ DETAIL | EXCEPTION ]
Control Block Selection Parameters:
[ CAA(caa-address) ] [ DSA(dsa-address) ] [ TCB(tcb-address) ] [ ASID(address-space-id) ] [ NTHREADS(value) ]
Parameters
The following sections describe the different types of supported parameters. Note that only hexadecimalcharacters can be specified as addresses provided in LEDATA parameters. Special characters cause theformatter to fail. Therefore, to specify a 64–bit address as a parameter, it must be in the form like123456789 instead of 1_23456789.
Report type parametersUse the following parameters to select the type of report. You can specify as many reports as you want. Ifyou omit these parameters, the default is SUMMARY.SUMmary
Requests a summary of the Language Environment at the time of the dump. The following informationis included:
• TCB address• Address Space Identifier• Language Environment Release• Active members• Formatted CAA, PCB, RCB, EDB, and PMCB• Runtime Options in effect
HEAP | STACK | SMHEAP
Requests a report on Storage Management control blocks pertaining to HEAP storage, as well as adetailed report on heap segments. The detailed report includes information about the free storagetree in the heap segment, and information about each allocated storage element. It also specifiesa heap pools report with information useful to find potential damaged cells. Note that LanguageEnvironment does not support alternative Vendor Heap Manager (VHM) data.
Chapter 3. Using Language Environment debugging facilities 85
STACKRequests a report on Storage Management control blocks pertaining to STACK storage.
SMRequests a report on Storage Management control blocks. This is the same as specifying bothHEAP and STACK.
HPT(number) [ HPTTCB (address) ] [ HPTCELL(address) ] [ HPTLOC(location) ]
HPT(number)Requests that the HEAPPOOLS trace, if available, be formatted. If the value is 0 or *, the trace forevery HEAPPOOLS pool ID is formatted. If the value is a single number (1-12), the trace for thespecific HEAPPOOLS pool ID is formatted. If only the HPT keyword is specified with no value, thetrace behaves similar to when the value is *. If no filter is specified, all of the entries are formattedfor the specific pool ID.
HPTTCB (address)Filters the HEAPPOOLS trace table, if available, printing only those entries for a given TCB address(address).
HPTCELL(address)Filters the HEAPPOOLS trace table, if available, printing only those entries for a given cell address(address).
HPTLOC(location)Filters the HEAPPOOLS trace table, if available, printing only those entries for a given virtualstorage location (location). The following values are valid:31
Display entries that are located in virtual storage below the bar.64
Display entries that are located in virtual storage above the bar.ALL
Display entries that are located in virtual storage below or above the bar.
Note:
1. Filter options without specifying HPT implies HPT(*).2. You can specify multiple options together, like HPTTCB and HPTCELL. All pieces of information
must match the trace entry for it to be formatted. If location and cell contradict each other, such asHPTLOC(31) and HPTCELL(64bit addr), an error will be displayed.
CMRequests a report on Condition Management control blocks.
MHRequests a report on Message Handler control blocks.
CEEdumpRequests a CEEDUMP-like report. The report includes the traceback, the Language Environment trace,and thread synchronization control blocks at process, enclave, and thread levels.
If the dump output has multiple nested enclaves or multiple nested CEEPIPI Main-DP environments,tracebacks will appear for each enclave in each Main-DP environment. This is similar to how thetracebacks appear in the CEEDUMP output. See the section “Multiple enclave dumps” on page 79 fora description of CEEDUMP output when multiple enclave and Main-DP environments are present.
PTBL(value)Requests that PreInit tables be formatted according to the following values:,CURRENT
If current is specified, the PreInit table that is associated with the current or specified TCB isdisplayed.
86 z/OS: z/OS Language Environment Debugging Guide
addressIf an address is specified, the PreInit table at that address is specified.
*All active and dormant PreInit tables within the current address space are displayed; this option istime-consuming.
ACTIVEThe PreInit tables for all TCBs in the address space are displayed.
COMP(value)Requests component control blocks to be formatted according to the following values:C
Requests a report on C/C++ runtime control blocks.CIO
Requests a report on C/C++ I/O control blocks.COBOL
Requests a report on COBOL-specific control blocks.PLI
Requests a report on PL/I-specific control blocks.ALL
Requests a report on all the preceding control blocks.
If the value specified in COMP is not one of the values (C, CIO, COBOL, PL/I, or ALL), a message isdisplayed and it continues executing as if COMP(ALL) was specified.
Note: The ALL parameter for LEDATA also generates a report that includes all the component controlblocks.
SW3164Requests a report on AMODE 31 and AMODE 64 interoperability. The following information isincluded:
• Formatted SW3164 structure.
ALLRequests all reports, as well as C/C++, COBOL, and PL/I reports.
Data selection parametersData selection parameters limit the scope of the data in the report. If no data selection parameter isselected, the default is DETAIL.DETail
Requests formatting all control blocks for the selected components. Only significant fields in eachcontrol block are formatted. For the Heap and Storage Management Reports, the DETAIL parameterwill provide a detailed heap segment report for each heap segment in the dump. The detailed heapsegment report includes information on the free storage tree in the heap segments, and all allocatedstorage elements. This report will also identify problems that are detected in the heap managementdata structures. For more information about the Heap Reports, see “Understanding the HEAP LEDATAoutput” on page 107.
EXCeptionRequests validating all control blocks for the selected components. Output is only produced namingthe control block and its address for the first control block in a chain that is invalid. Validation consistsof control block header verification at the very least.
For the Summary, CEEDUMP, C/C++, COBOL, and PL/I reports, the EXCEPTION parameter has notbeen implemented. For these reports, DETAIL output is always produced.
Chapter 3. Using Language Environment debugging facilities 87
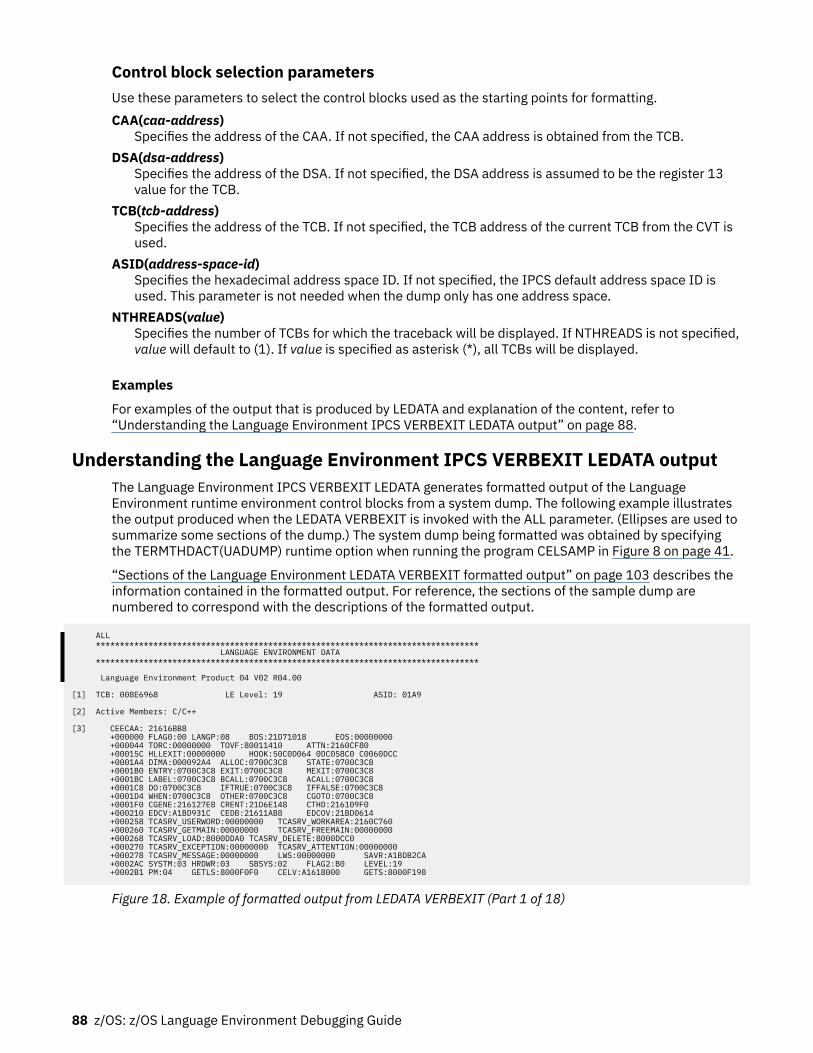
Control block selection parametersUse these parameters to select the control blocks used as the starting points for formatting.CAA(caa-address)
Specifies the address of the CAA. If not specified, the CAA address is obtained from the TCB.DSA(dsa-address)
Specifies the address of the DSA. If not specified, the DSA address is assumed to be the register 13value for the TCB.
TCB(tcb-address)Specifies the address of the TCB. If not specified, the TCB address of the current TCB from the CVT isused.
ASID(address-space-id)Specifies the hexadecimal address space ID. If not specified, the IPCS default address space ID isused. This parameter is not needed when the dump only has one address space.
NTHREADS(value)Specifies the number of TCBs for which the traceback will be displayed. If NTHREADS is not specified,value will default to (1). If value is specified as asterisk (*), all TCBs will be displayed.
Examples
For examples of the output that is produced by LEDATA and explanation of the content, refer to“Understanding the Language Environment IPCS VERBEXIT LEDATA output” on page 88.
Understanding the Language Environment IPCS VERBEXIT LEDATA outputThe Language Environment IPCS VERBEXIT LEDATA generates formatted output of the LanguageEnvironment runtime environment control blocks from a system dump. The following example illustratesthe output produced when the LEDATA VERBEXIT is invoked with the ALL parameter. (Ellipses are used tosummarize some sections of the dump.) The system dump being formatted was obtained by specifyingthe TERMTHDACT(UADUMP) runtime option when running the program CELSAMP in Figure 8 on page 41.
“Sections of the Language Environment LEDATA VERBEXIT formatted output” on page 103 describes theinformation contained in the formatted output. For reference, the sections of the sample dump arenumbered to correspond with the descriptions of the formatted output.
ALL ******************************************************************************** LANGUAGE ENVIRONMENT DATA ******************************************************************************** Language Environment Product 04 V02 R04.00 [1] TCB: 008E6968 LE Level: 19 ASID: 01A9 [2] Active Members: C/C++
[3] CEECAA: 21616BB8 +000000 FLAG0:00 LANGP:08 BOS:21D71018 EOS:00000000 +000044 TORC:00000000 TOVF:80011410 ATTN:2160CF80 +00015C HLLEXIT:00000000 HOOK:50C0D064 0DC058C0 C0060DCC +0001A4 DIMA:000092A4 ALLOC:0700C3C8 STATE:0700C3C8 +0001B0 ENTRY:0700C3C8 EXIT:0700C3C8 MEXIT:0700C3C8 +0001BC LABEL:0700C3C8 BCALL:0700C3C8 ACALL:0700C3C8 +0001C8 DO:0700C3C8 IFTRUE:0700C3C8 IFFALSE:0700C3C8 +0001D4 WHEN:0700C3C8 OTHER:0700C3C8 CGOTO:0700C3C8 +0001F0 CGENE:216127E8 CRENT:21D6E148 CTHD:216109F0 +000210 EDCV:A1BD931C CEDB:21611AB8 EDCOV:21BD0614 +000258 TCASRV_USERWORD:00000000 TCASRV_WORKAREA:2160C760 +000260 TCASRV_GETMAIN:00000000 TCASRV_FREEMAIN:00000000 +000268 TCASRV_LOAD:8000DDA0 TCASRV_DELETE:8000DCC0 +000270 TCASRV_EXCEPTION:00000000 TCASRV_ATTENTION:00000000 +000278 TCASRV_MESSAGE:00000000 LWS:00000000 SAVR:A1BDB2CA +0002AC SYSTM:03 HRDWR:03 SBSYS:02 FLAG2:B0 LEVEL:19 +0002B1 PM:04 GETLS:8000F0F0 CELV:A1618000 GETS:8000F198
Figure 18. Example of formatted output from LEDATA VERBEXIT (Part 1 of 18)
88 z/OS: z/OS Language Environment Debugging Guide
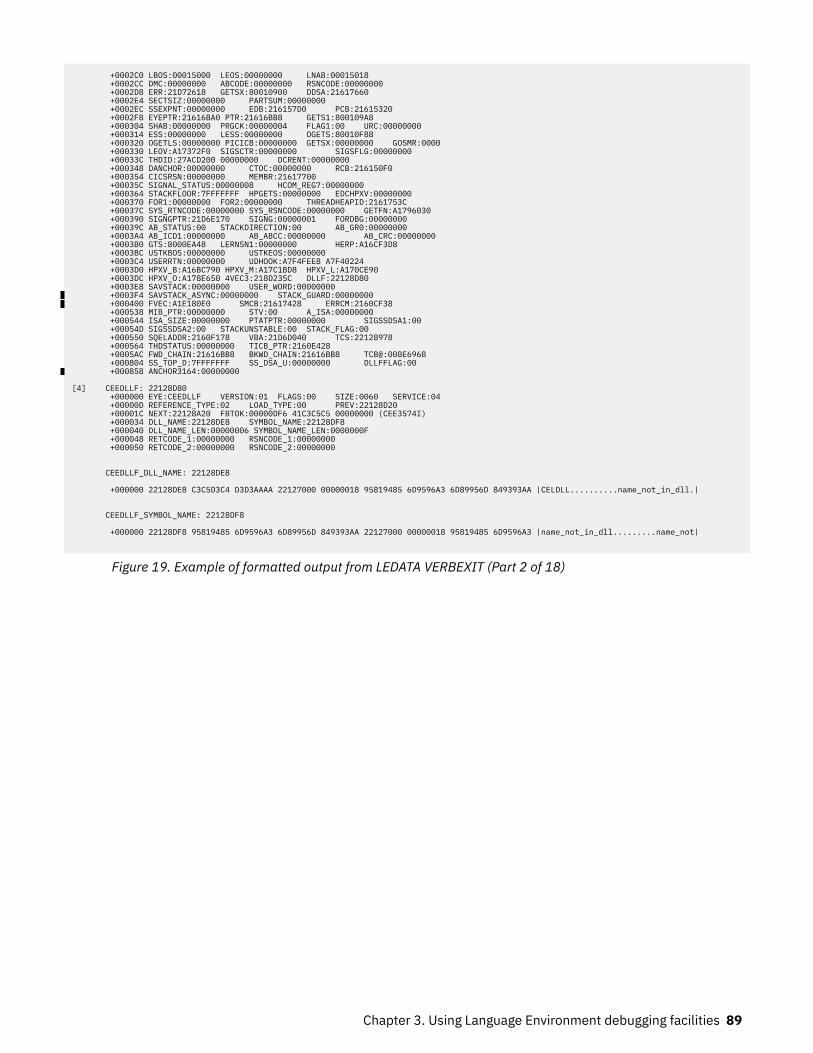
+0002C0 LBOS:00015000 LEOS:00000000 LNAB:00015018 +0002CC DMC:00000000 ABCODE:00000000 RSNCODE:00000000 +0002D8 ERR:21D72618 GETSX:80010900 DDSA:21617660 +0002E4 SECTSIZ:00000000 PARTSUM:00000000 +0002EC SSEXPNT:00000000 EDB:216157D0 PCB:21615320 +0002F8 EYEPTR:21616BA0 PTR:21616BB8 GETS1:800109A8 +000304 SHAB:00000000 PRGCK:00000004 FLAG1:00 URC:00000000 +000314 ESS:00000000 LESS:00000000 OGETS:80010F88 +000320 OGETLS:00000000 PICICB:00000000 GETSX:00000000 GOSMR:0000 +000330 LEOV:A17372F0 SIGSCTR:00000000 SIGSFLG:00000000 +00033C THDID:27ACD200 00000000 DCRENT:00000000 +000348 DANCHOR:00000000 CTOC:00000000 RCB:216150F0 +000354 CICSRSN:00000000 MEMBR:21617700 +00035C SIGNAL_STATUS:00000008 HCOM_REG7:00000000 +000364 STACKFLOOR:7FFFFFFF HPGETS:00000000 EDCHPXV:00000000 +000370 FOR1:00000000 FOR2:00000000 THREADHEAPID:2161753C +00037C SYS_RTNCODE:00000000 SYS_RSNCODE:00000000 GETFN:A1796030 +000390 SIGNGPTR:21D6E170 SIGNG:00000001 FORDBG:00000000 +00039C AB_STATUS:00 STACKDIRECTION:00 AB_GR0:00000000 +0003A4 AB_ICD1:00000000 AB_ABCC:00000000 AB_CRC:00000000 +0003B0 GTS:8000EA48 LERN5N1:00000000 HERP:A16CF3D8 +0003BC USTKBOS:00000000 USTKEOS:00000000 +0003C4 USERRTN:00000000 UDHOOK:A7F4FEE8 A7F40224 +0003D0 HPXV_B:A16BC790 HPXV_M:A17C1BD8 HPXV_L:A170CE90 +0003DC HPXV_O:A178E650 4VEC3:218D235C DLLF:22128D80 +0003E8 SAVSTACK:00000000 USER_WORD:00000000 +0003F4 SAVSTACK_ASYNC:00000000 STACK_GUARD:00000000 +000400 FVEC:A1E180E0 SMCB:21617428 ERRCM:2160CF38 +000538 MIB_PTR:00000000 STV:00 A_ISA:00000000 +000544 ISA_SIZE:00000000 PTATPTR:00000000 SIGSSDSA1:00 +00054D SIGSSDSA2:00 STACKUNSTABLE:00 STACK_FLAG:00 +000550 SQELADDR:2160F178 VBA:21D6D040 TCS:22128978 +000564 THDSTATUS:00000000 TICB_PTR:2160E428 +0005AC FWD_CHAIN:21616BB8 BKWD_CHAIN:21616BB8 TCB@:008E6968 +000804 SS_TOP_D:7FFFFFFF SS_DSA_U:00000000 DLLFFLAG:00 +000858 ANCHOR3164:00000000 [4] CEEDLLF: 22128D80 +000000 EYE:CEEDLLF VERSION:01 FLAGS:00 SIZE:0060 SERVICE:04 +00000D REFERENCE_TYPE:02 LOAD_TYPE:00 PREV:22128D20 +00001C NEXT:22128A20 FBTOK:00000DF6 41C3C5C5 00000000 (CEE3574I) +000034 DLL_NAME:22128DE8 SYMBOL_NAME:22128DF8 +000040 DLL_NAME_LEN:00000006 SYMBOL_NAME_LEN:0000000F +000048 RETCODE_1:00000000 RSNCODE_1:00000000 +000050 RETCODE_2:00000000 RSNCODE_2:00000000 CEEDLLF_DLL_NAME: 22128DE8 +000000 22128DE8 C3C5D3C4 D3D3AAAA 22127000 00000018 95819485 6D9596A3 6D89956D 849393AA |CELDLL..........name_not_in_dll.| CEEDLLF_SYMBOL_NAME: 22128DF8 +000000 22128DF8 95819485 6D9596A3 6D89956D 849393AA 22127000 00000018 95819485 6D9596A3 |name_not_in_dll.........name_not|
Figure 19. Example of formatted output from LEDATA VERBEXIT (Part 2 of 18)
Chapter 3. Using Language Environment debugging facilities 89
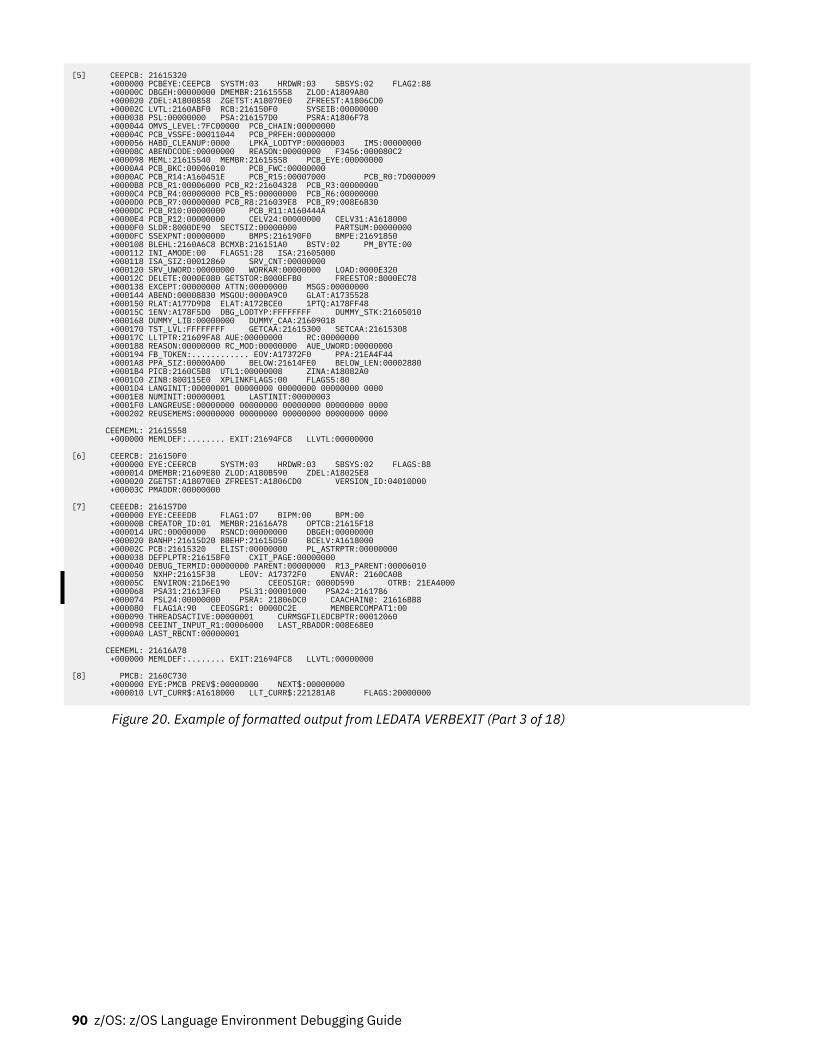
[5] CEEPCB: 21615320 +000000 PCBEYE:CEEPCB SYSTM:03 HRDWR:03 SBSYS:02 FLAG2:88 +00000C DBGEH:00000000 DMEMBR:21615558 ZLOD:A1809A80 +000020 ZDEL:A1800858 ZGETST:A18070E0 ZFREEST:A1806CD0 +00002C LVTL:2160ABF0 RCB:216150F0 SYSEIB:00000000 +000038 PSL:00000000 PSA:216157D0 PSRA:A1806F78 +000044 OMVS_LEVEL:7FC00000 PCB_CHAIN:00000000 +00004C PCB_VSSFE:00011044 PCB_PRFEH:00000000 +000056 HABD_CLEANUP:0000 LPKA_LODTYP:00000003 IMS:00000000 +00008C ABENDCODE:00000000 REASON:00000000 F3456:000080C2 +000098 MEML:21615540 MEMBR:21615558 PCB_EYE:00000000 +0000A4 PCB_BKC:00006010 PCB_FWC:00000000 +0000AC PCB_R14:A160451E PCB_R15:00007000 PCB_R0:7D000009 +0000B8 PCB_R1:00006000 PCB_R2:21604328 PCB_R3:00000000 +0000C4 PCB_R4:00000000 PCB_R5:00000000 PCB_R6:00000000 +0000D0 PCB_R7:00000000 PCB_R8:216039E8 PCB_R9:008E6B30 +0000DC PCB_R10:00000000 PCB_R11:A160444A +0000E4 PCB_R12:00000000 CELV24:00000000 CELV31:A1618000 +0000F0 SLDR:8000DE90 SECTSIZ:00000000 PARTSUM:00000000 +0000FC SSEXPNT:00000000 BMPS:216190F0 BMPE:21691850 +000108 BLEHL:2160A6C8 BCMXB:216151A0 BSTV:02 PM_BYTE:00 +000112 INI_AMODE:00 FLAGS1:28 ISA:21605000 +000118 ISA_SIZ:00012860 SRV_CNT:00000000 +000120 SRV_UWORD:00000000 WORKAR:00000000 LOAD:0000E320 +00012C DELETE:0000E080 GETSTOR:8000EFB0 FREESTOR:8000EC78 +000138 EXCEPT:00000000 ATTN:00000000 MSGS:00000000 +000144 ABEND:00008830 MSGOU:0000A9C0 GLAT:A1735528 +000150 RLAT:A177D9D8 ELAT:A172BCE0 1PTQ:A178FF48 +00015C 1ENV:A178F5D0 DBG_LODTYP:FFFFFFFF DUMMY_STK:21605010 +000168 DUMMY_LIB:00000000 DUMMY_CAA:21609018 +000170 TST_LVL:FFFFFFFF GETCAA:21615300 SETCAA:21615308 +00017C LLTPTR:21609FA8 AUE:00000000 RC:00000000 +000188 REASON:00000000 RC_MOD:00000000 AUE_UWORD:00000000 +000194 FB_TOKEN:............ EOV:A17372F0 PPA:21EA4F44 +0001A8 PPA_SIZ:00000A00 BELOW:21614FE0 BELOW_LEN:00002880 +0001B4 PICB:2160C5B8 UTL1:00000008 ZINA:A18082A0 +0001C0 ZINB:800115E0 XPLINKFLAGS:00 FLAGS5:80 +0001D4 LANGINIT:00000001 00000000 00000000 00000000 0000 +0001E8 NUMINIT:00000001 LASTINIT:00000003 +0001F0 LANGREUSE:00000000 00000000 00000000 00000000 0000 +000202 REUSEMEMS:00000000 00000000 00000000 00000000 0000 CEEMEML: 21615558 +000000 MEMLDEF:........ EXIT:21694FC8 LLVTL:00000000 [6] CEERCB: 216150F0 +000000 EYE:CEERCB SYSTM:03 HRDWR:03 SBSYS:02 FLAGS:88 +000014 DMEMBR:21609E80 ZLOD:A180B590 ZDEL:A18025E8 +000020 ZGETST:A18070E0 ZFREEST:A1806CD0 VERSION_ID:04010D00 +00003C PMADDR:00000000 [7] CEEEDB: 216157D0 +000000 EYE:CEEEDB FLAG1:D7 BIPM:00 BPM:00 +00000B CREATOR_ID:01 MEMBR:21616A78 OPTCB:21615F18 +000014 URC:00000000 RSNCD:00000000 DBGEH:00000000 +000020 BANHP:21615D20 BBEHP:21615D50 BCELV:A1618000 +00002C PCB:21615320 ELIST:00000000 PL_ASTRPTR:00000000 +000038 DEFPLPTR:216158F0 CXIT_PAGE:00000000 +000040 DEBUG_TERMID:00000000 PARENT:00000000 R13_PARENT:00006010 +000050 NXHP:21615F38 LEOV: A17372F0 ENVAR: 2160CA08 +00005C ENVIRON:21D6E190 CEEOSIGR: 0000D590 OTRB: 21EA4000 +000068 PSA31:21613FE0 PSL31:00001000 PSA24:2161786 +000074 PSL24:00000000 PSRA: 21806DC0 CAACHAIN@: 21616BB8 +000080 FLAG1A:90 CEEOSGR1: 0000DC2E MEMBERCOMPAT1:00 +000090 THREADSACTIVE:00000001 CURMSGFILEDCBPTR:00012060 +000098 CEEINT_INPUT_R1:00006000 LAST_RBADDR:008E68E0 +0000A0 LAST_RBCNT:00000001 CEEMEML: 21616A78 +000000 MEMLDEF:........ EXIT:21694FC8 LLVTL:00000000
[8] PMCB: 2160C730 +000000 EYE:PMCB PREV$:00000000 NEXT$:00000000 +000010 LVT_CURR$:A1618000 LLT_CURR$:221281A8 FLAGS:20000000
Figure 20. Example of formatted output from LEDATA VERBEXIT (Part 3 of 18)
90 z/OS: z/OS Language Environment Debugging Guide
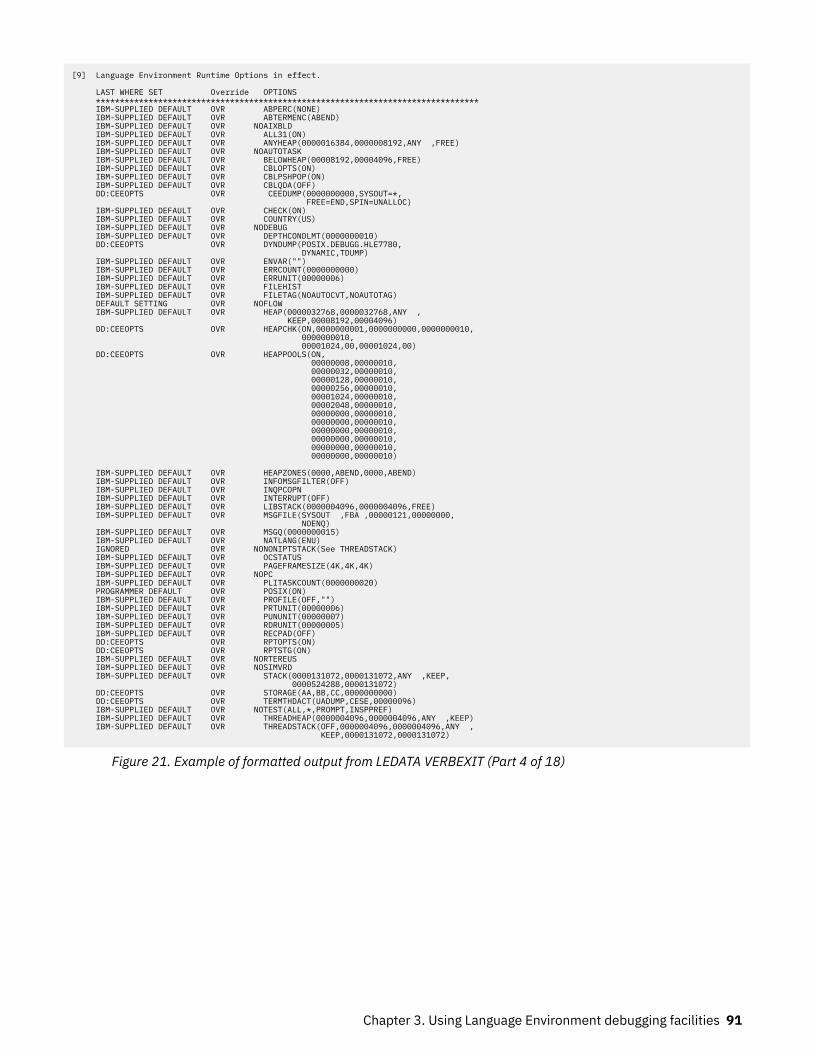
[9] Language Environment Runtime Options in effect. LAST WHERE SET Override OPTIONS ******************************************************************************** IBM-SUPPLIED DEFAULT OVR ABPERC(NONE) IBM-SUPPLIED DEFAULT OVR ABTERMENC(ABEND) IBM-SUPPLIED DEFAULT OVR NOAIXBLD IBM-SUPPLIED DEFAULT OVR ALL31(ON) IBM-SUPPLIED DEFAULT OVR ANYHEAP(0000016384,0000008192,ANY ,FREE) IBM-SUPPLIED DEFAULT OVR NOAUTOTASK IBM-SUPPLIED DEFAULT OVR BELOWHEAP(00008192,00004096,FREE) IBM-SUPPLIED DEFAULT OVR CBLOPTS(ON) IBM-SUPPLIED DEFAULT OVR CBLPSHPOP(ON) IBM-SUPPLIED DEFAULT OVR CBLQDA(OFF) DD:CEEOPTS OVR CEEDUMP(0000000000,SYSOUT=*, FREE=END,SPIN=UNALLOC) IBM-SUPPLIED DEFAULT OVR CHECK(ON) IBM-SUPPLIED DEFAULT OVR COUNTRY(US) IBM-SUPPLIED DEFAULT OVR NODEBUG IBM-SUPPLIED DEFAULT OVR DEPTHCONDLMT(0000000010) DD:CEEOPTS OVR DYNDUMP(POSIX.DEBUGG.HLE7780, DYNAMIC,TDUMP) IBM-SUPPLIED DEFAULT OVR ENVAR("") IBM-SUPPLIED DEFAULT OVR ERRCOUNT(0000000000) IBM-SUPPLIED DEFAULT OVR ERRUNIT(00000006) IBM-SUPPLIED DEFAULT OVR FILEHIST IBM-SUPPLIED DEFAULT OVR FILETAG(NOAUTOCVT,NOAUTOTAG) DEFAULT SETTING OVR NOFLOW IBM-SUPPLIED DEFAULT OVR HEAP(0000032768,0000032768,ANY , KEEP,00008192,00004096) DD:CEEOPTS OVR HEAPCHK(ON,0000000001,0000000000,0000000010, 0000000010, 00001024,00,00001024,00) DD:CEEOPTS OVR HEAPPOOLS(ON, 00000008,00000010, 00000032,00000010, 00000128,00000010, 00000256,00000010, 00001024,00000010, 00002048,00000010, 00000000,00000010, 00000000,00000010, 00000000,00000010, 00000000,00000010, 00000000,00000010, 00000000,00000010)
IBM-SUPPLIED DEFAULT OVR HEAPZONES(0000,ABEND,0000,ABEND) IBM-SUPPLIED DEFAULT OVR INFOMSGFILTER(OFF) IBM-SUPPLIED DEFAULT OVR INQPCOPN IBM-SUPPLIED DEFAULT OVR INTERRUPT(OFF) IBM-SUPPLIED DEFAULT OVR LIBSTACK(0000004096,0000004096,FREE) IBM-SUPPLIED DEFAULT OVR MSGFILE(SYSOUT ,FBA ,00000121,00000000, NOENQ) IBM-SUPPLIED DEFAULT OVR MSGQ(0000000015) IBM-SUPPLIED DEFAULT OVR NATLANG(ENU) IGNORED OVR NONONIPTSTACK(See THREADSTACK) IBM-SUPPLIED DEFAULT OVR OCSTATUS IBM-SUPPLIED DEFAULT OVR PAGEFRAMESIZE(4K,4K,4K) IBM-SUPPLIED DEFAULT OVR NOPC IBM-SUPPLIED DEFAULT OVR PLITASKCOUNT(0000000020) PROGRAMMER DEFAULT OVR POSIX(ON) IBM-SUPPLIED DEFAULT OVR PROFILE(OFF,"") IBM-SUPPLIED DEFAULT OVR PRTUNIT(00000006) IBM-SUPPLIED DEFAULT OVR PUNUNIT(00000007) IBM-SUPPLIED DEFAULT OVR RDRUNIT(00000005) IBM-SUPPLIED DEFAULT OVR RECPAD(OFF) DD:CEEOPTS OVR RPTOPTS(ON) DD:CEEOPTS OVR RPTSTG(ON) IBM-SUPPLIED DEFAULT OVR NORTEREUS IBM-SUPPLIED DEFAULT OVR NOSIMVRD IBM-SUPPLIED DEFAULT OVR STACK(0000131072,0000131072,ANY ,KEEP, 0000524288,0000131072) DD:CEEOPTS OVR STORAGE(AA,BB,CC,0000000000) DD:CEEOPTS OVR TERMTHDACT(UADUMP,CESE,00000096) IBM-SUPPLIED DEFAULT OVR NOTEST(ALL,*,PROMPT,INSPPREF) IBM-SUPPLIED DEFAULT OVR THREADHEAP(0000004096,0000004096,ANY ,KEEP) IBM-SUPPLIED DEFAULT OVR THREADSTACK(OFF,0000004096,0000004096,ANY , KEEP,0000131072,0000131072)
Figure 21. Example of formatted output from LEDATA VERBEXIT (Part 4 of 18)
Chapter 3. Using Language Environment debugging facilities 91
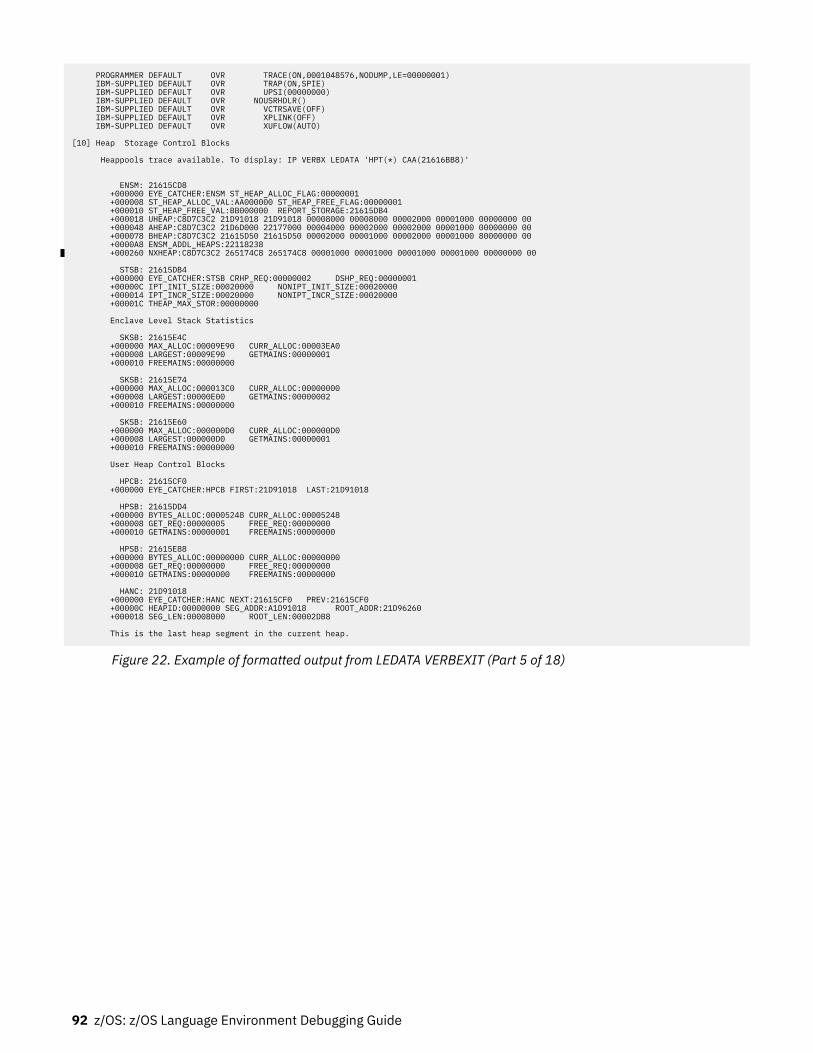
PROGRAMMER DEFAULT OVR TRACE(ON,0001048576,NODUMP,LE=00000001) IBM-SUPPLIED DEFAULT OVR TRAP(ON,SPIE) IBM-SUPPLIED DEFAULT OVR UPSI(00000000) IBM-SUPPLIED DEFAULT OVR NOUSRHDLR() IBM-SUPPLIED DEFAULT OVR VCTRSAVE(OFF) IBM-SUPPLIED DEFAULT OVR XPLINK(OFF) IBM-SUPPLIED DEFAULT OVR XUFLOW(AUTO) [10] Heap Storage Control Blocks Heappools trace available. To display: IP VERBX LEDATA 'HPT(*) CAA(21616BB8)' ENSM: 21615CD8 +000000 EYE_CATCHER:ENSM ST_HEAP_ALLOC_FLAG:00000001 +000008 ST_HEAP_ALLOC_VAL:AA000000 ST_HEAP_FREE_FLAG:00000001 +000010 ST_HEAP_FREE_VAL:BB000000 REPORT_STORAGE:21615DB4 +000018 UHEAP:C8D7C3C2 21D91018 21D91018 00008000 00008000 00002000 00001000 00000000 00 +000048 AHEAP:C8D7C3C2 21D6D000 22177000 00004000 00002000 00002000 00001000 00000000 00 +000078 BHEAP:C8D7C3C2 21615D50 21615D50 00002000 00001000 00002000 00001000 80000000 00 +0000A8 ENSM_ADDL_HEAPS:22118238 +000260 NXHEAP:C8D7C3C2 265174C8 265174C8 00001000 00001000 00001000 00001000 00000000 00 STSB: 21615DB4 +000000 EYE_CATCHER:STSB CRHP_REQ:00000002 DSHP_REQ:00000001 +00000C IPT_INIT_SIZE:00020000 NONIPT_INIT_SIZE:00020000 +000014 IPT_INCR_SIZE:00020000 NONIPT_INCR_SIZE:00020000 +00001C THEAP_MAX_STOR:00000000 Enclave Level Stack Statistics SKSB: 21615E4C +000000 MAX_ALLOC:00009E90 CURR_ALLOC:00003EA0 +000008 LARGEST:00009E90 GETMAINS:00000001 +000010 FREEMAINS:00000000 SKSB: 21615E74 +000000 MAX_ALLOC:000013C0 CURR_ALLOC:00000000 +000008 LARGEST:00000E00 GETMAINS:00000002 +000010 FREEMAINS:00000000 SKSB: 21615E60 +000000 MAX_ALLOC:000000D0 CURR_ALLOC:000000D0 +000008 LARGEST:000000D0 GETMAINS:00000001 +000010 FREEMAINS:00000000 User Heap Control Blocks HPCB: 21615CF0 +000000 EYE_CATCHER:HPCB FIRST:21D91018 LAST:21D91018 HPSB: 21615DD4 +000000 BYTES_ALLOC:00005248 CURR_ALLOC:00005248 +000008 GET_REQ:00000005 FREE_REQ:00000000 +000010 GETMAINS:00000001 FREEMAINS:00000000 HPSB: 21615E88 +000000 BYTES_ALLOC:00000000 CURR_ALLOC:00000000 +000008 GET_REQ:00000000 FREE_REQ:00000000 +000010 GETMAINS:00000000 FREEMAINS:00000000 HANC: 21D91018 +000000 EYE_CATCHER:HANC NEXT:21615CF0 PREV:21615CF0 +00000C HEAPID:00000000 SEG_ADDR:A1D91018 ROOT_ADDR:21D96260 +000018 SEG_LEN:00008000 ROOT_LEN:00002DB8 This is the last heap segment in the current heap.
Figure 22. Example of formatted output from LEDATA VERBEXIT (Part 5 of 18)
92 z/OS: z/OS Language Environment Debugging Guide
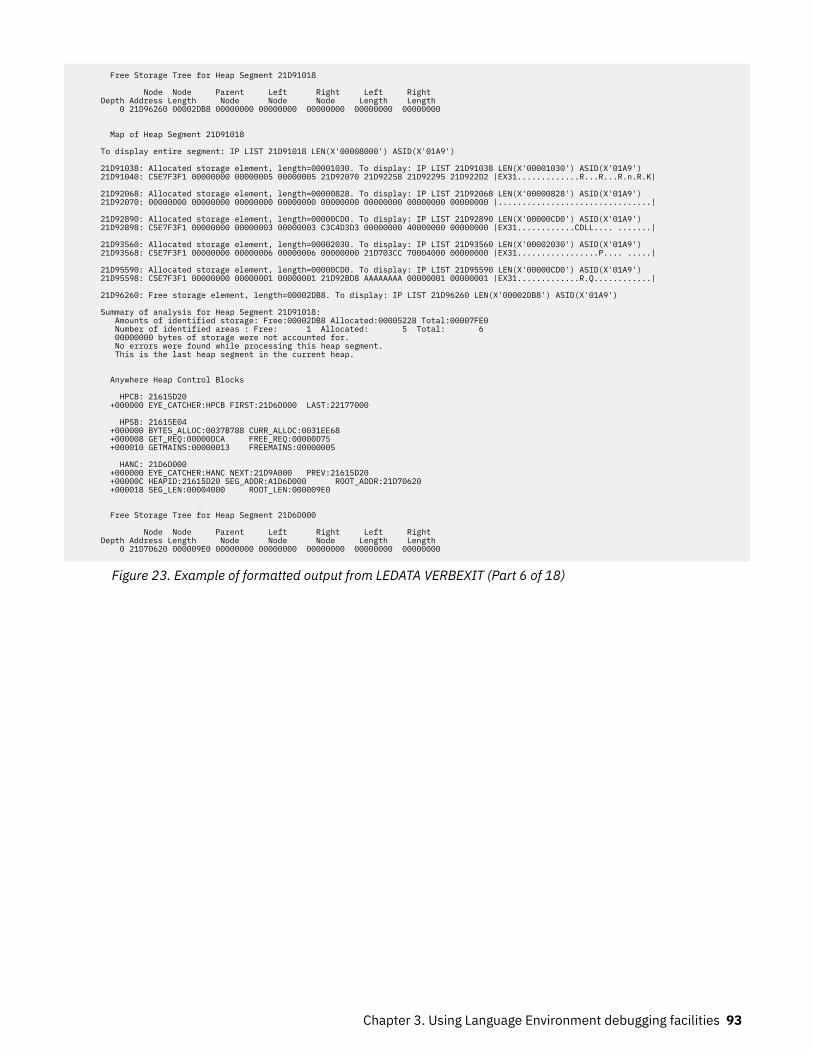
Free Storage Tree for Heap Segment 21D91018 Node Node Parent Left Right Left Right Depth Address Length Node Node Node Length Length 0 21D96260 00002DB8 00000000 00000000 00000000 00000000 00000000 Map of Heap Segment 21D91018 To display entire segment: IP LIST 21D91018 LEN(X'00008000') ASID(X'01A9') 21D91038: Allocated storage element, length=00001030. To display: IP LIST 21D91038 LEN(X'00001030') ASID(X'01A9') 21D91040: C5E7F3F1 00000000 00000005 00000005 21D92070 21D92258 21D92295 21D922D2 |EX31.............R...R...R.n.R.K| 21D92068: Allocated storage element, length=00000828. To display: IP LIST 21D92068 LEN(X'00000828') ASID(X'01A9') 21D92070: 00000000 00000000 00000000 00000000 00000000 00000000 00000000 00000000 |................................| 21D92890: Allocated storage element, length=00000CD0. To display: IP LIST 21D92890 LEN(X'00000CD0') ASID(X'01A9') 21D92898: C5E7F3F1 00000000 00000003 00000003 C3C4D3D3 00000000 40000000 00000000 |EX31............CDLL.... .......| 21D93560: Allocated storage element, length=00002030. To display: IP LIST 21D93560 LEN(X'00002030') ASID(X'01A9') 21D93568: C5E7F3F1 00000000 00000006 00000006 00000000 21D703CC 70004000 00000000 |EX31.................P.... .....| 21D95590: Allocated storage element, length=00000CD0. To display: IP LIST 21D95590 LEN(X'00000CD0') ASID(X'01A9') 21D95598: C5E7F3F1 00000000 00000001 00000001 21D92BD8 AAAAAAAA 00000001 00000001 |EX31.............R.Q............| 21D96260: Free storage element, length=00002DB8. To display: IP LIST 21D96260 LEN(X'00002DB8') ASID(X'01A9') Summary of analysis for Heap Segment 21D91018: Amounts of identified storage: Free:00002DB8 Allocated:00005228 Total:00007FE0 Number of identified areas : Free: 1 Allocated: 5 Total: 6 00000000 bytes of storage were not accounted for. No errors were found while processing this heap segment. This is the last heap segment in the current heap. Anywhere Heap Control Blocks HPCB: 21615D20 +000000 EYE_CATCHER:HPCB FIRST:21D6D000 LAST:22177000 HPSB: 21615E04 +000000 BYTES_ALLOC:0037B788 CURR_ALLOC:0031EE68 +000008 GET_REQ:00000DCA FREE_REQ:00000D75 +000010 GETMAINS:00000013 FREEMAINS:00000005 HANC: 21D6D000 +000000 EYE_CATCHER:HANC NEXT:21D9A000 PREV:21615D20 +00000C HEAPID:21615D20 SEG_ADDR:A1D6D000 ROOT_ADDR:21D70620 +000018 SEG_LEN:00004000 ROOT_LEN:000009E0 Free Storage Tree for Heap Segment 21D6D000 Node Node Parent Left Right Left Right Depth Address Length Node Node Node Length Length 0 21D70620 000009E0 00000000 00000000 00000000 00000000 00000000
Figure 23. Example of formatted output from LEDATA VERBEXIT (Part 6 of 18)
Chapter 3. Using Language Environment debugging facilities 93
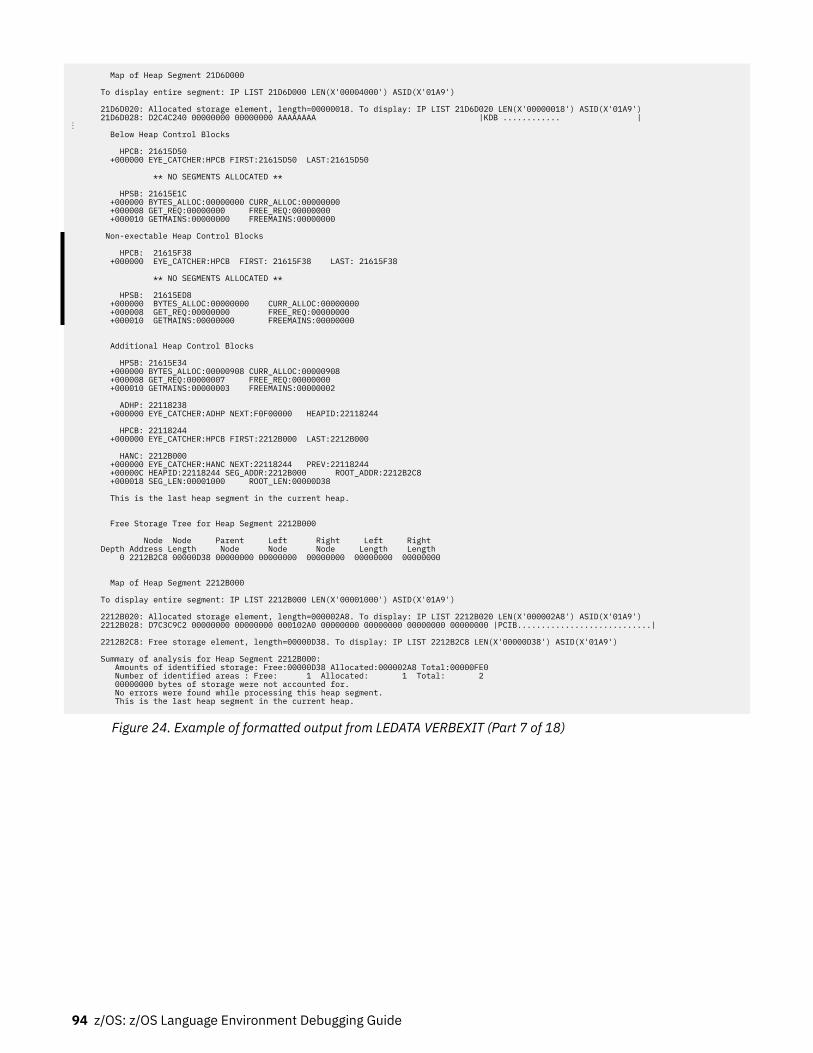
Map of Heap Segment 21D6D000 To display entire segment: IP LIST 21D6D000 LEN(X'00004000') ASID(X'01A9') 21D6D020: Allocated storage element, length=00000018. To display: IP LIST 21D6D020 LEN(X'00000018') ASID(X'01A9') 21D6D028: D2C4C240 00000000 00000000 AAAAAAAA |KDB ............ |⋮ Below Heap Control Blocks HPCB: 21615D50 +000000 EYE_CATCHER:HPCB FIRST:21615D50 LAST:21615D50 ** NO SEGMENTS ALLOCATED ** HPSB: 21615E1C +000000 BYTES_ALLOC:00000000 CURR_ALLOC:00000000 +000008 GET_REQ:00000000 FREE_REQ:00000000 +000010 GETMAINS:00000000 FREEMAINS:00000000
Non-exectable Heap Control Blocks HPCB: 21615F38 +000000 EYE_CATCHER:HPCB FIRST: 21615F38 LAST: 21615F38 ** NO SEGMENTS ALLOCATED ** HPSB: 21615ED8 +000000 BYTES_ALLOC:00000000 CURR_ALLOC:00000000 +000008 GET_REQ:00000000 FREE_REQ:00000000 +000010 GETMAINS:00000000 FREEMAINS:00000000
Additional Heap Control Blocks HPSB: 21615E34 +000000 BYTES_ALLOC:00000908 CURR_ALLOC:00000908 +000008 GET_REQ:00000007 FREE_REQ:00000000 +000010 GETMAINS:00000003 FREEMAINS:00000002 ADHP: 22118238 +000000 EYE_CATCHER:ADHP NEXT:F0F00000 HEAPID:22118244 HPCB: 22118244 +000000 EYE_CATCHER:HPCB FIRST:2212B000 LAST:2212B000 HANC: 2212B000 +000000 EYE_CATCHER:HANC NEXT:22118244 PREV:22118244 +00000C HEAPID:22118244 SEG_ADDR:2212B000 ROOT_ADDR:2212B2C8 +000018 SEG_LEN:00001000 ROOT_LEN:00000D38 This is the last heap segment in the current heap. Free Storage Tree for Heap Segment 2212B000 Node Node Parent Left Right Left Right Depth Address Length Node Node Node Length Length 0 2212B2C8 00000D38 00000000 00000000 00000000 00000000 00000000 Map of Heap Segment 2212B000 To display entire segment: IP LIST 2212B000 LEN(X'00001000') ASID(X'01A9') 2212B020: Allocated storage element, length=000002A8. To display: IP LIST 2212B020 LEN(X'000002A8') ASID(X'01A9') 2212B028: D7C3C9C2 00000000 00000000 000102A0 00000000 00000000 00000000 00000000 |PCIB............................| 2212B2C8: Free storage element, length=00000D38. To display: IP LIST 2212B2C8 LEN(X'00000D38') ASID(X'01A9') Summary of analysis for Heap Segment 2212B000: Amounts of identified storage: Free:00000D38 Allocated:000002A8 Total:00000FE0 Number of identified areas : Free: 1 Allocated: 1 Total: 2 00000000 bytes of storage were not accounted for. No errors were found while processing this heap segment. This is the last heap segment in the current heap.
Figure 24. Example of formatted output from LEDATA VERBEXIT (Part 7 of 18)
94 z/OS: z/OS Language Environment Debugging Guide
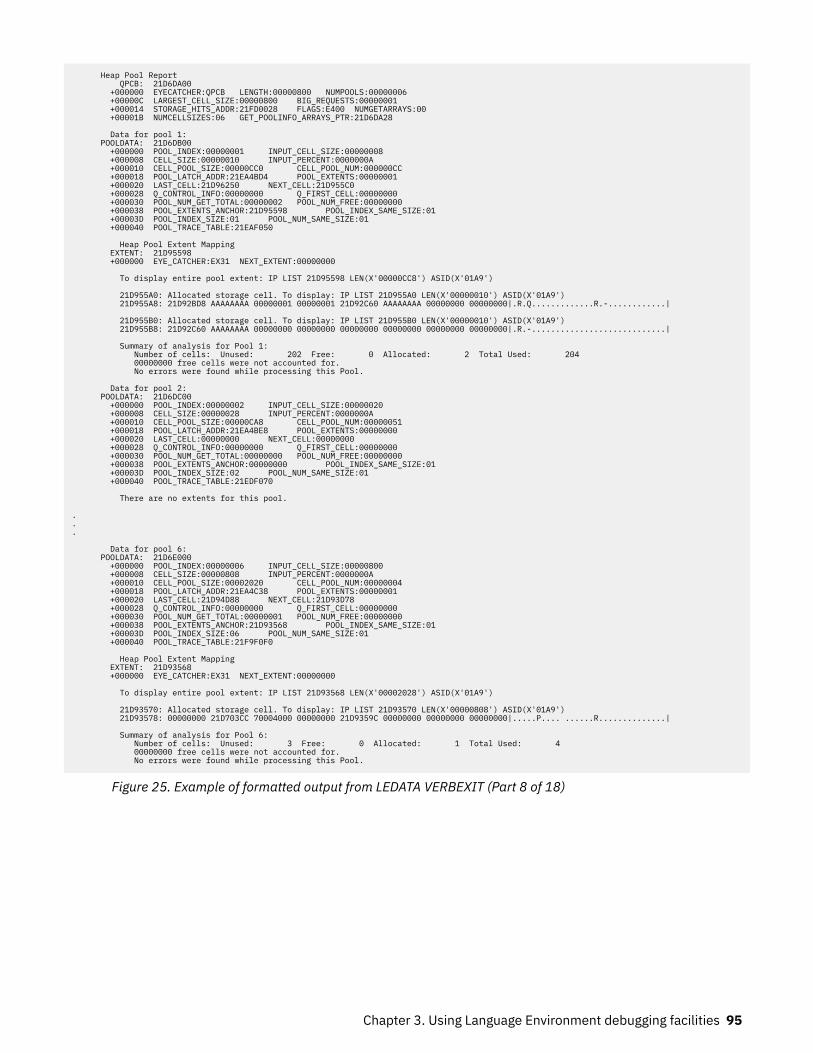
Heap Pool Report QPCB: 21D6DA00 +000000 EYECATCHER:QPCB LENGTH:00000800 NUMPOOLS:00000006 +00000C LARGEST_CELL_SIZE:00000800 BIG_REQUESTS:00000001 +000014 STORAGE_HITS_ADDR:21FD0028 FLAGS:E400 NUMGETARRAYS:00 +00001B NUMCELLSIZES:06 GET_POOLINFO_ARRAYS_PTR:21D6DA28 Data for pool 1: POOLDATA: 21D6DB00 +000000 POOL_INDEX:00000001 INPUT_CELL_SIZE:00000008 +000008 CELL_SIZE:00000010 INPUT_PERCENT:0000000A +000010 CELL_POOL_SIZE:00000CC0 CELL_POOL_NUM:000000CC +000018 POOL_LATCH_ADDR:21EA4BD4 POOL_EXTENTS:00000001 +000020 LAST_CELL:21D96250 NEXT_CELL:21D955C0 +000028 Q_CONTROL_INFO:00000000 Q_FIRST_CELL:00000000 +000030 POOL_NUM_GET_TOTAL:00000002 POOL_NUM_FREE:00000000 +000038 POOL_EXTENTS_ANCHOR:21D95598 POOL_INDEX_SAME_SIZE:01 +00003D POOL_INDEX_SIZE:01 POOL_NUM_SAME_SIZE:01 +000040 POOL_TRACE_TABLE:21EAF050 Heap Pool Extent Mapping EXTENT: 21D95598 +000000 EYE_CATCHER:EX31 NEXT_EXTENT:00000000 To display entire pool extent: IP LIST 21D95598 LEN(X'00000CC8') ASID(X'01A9') 21D955A0: Allocated storage cell. To display: IP LIST 21D955A0 LEN(X'00000010') ASID(X'01A9') 21D955A8: 21D92BD8 AAAAAAAA 00000001 00000001 21D92C60 AAAAAAAA 00000000 00000000|.R.Q.............R.-............| 21D955B0: Allocated storage cell. To display: IP LIST 21D955B0 LEN(X'00000010') ASID(X'01A9') 21D955B8: 21D92C60 AAAAAAAA 00000000 00000000 00000000 00000000 00000000 00000000|.R.-............................| Summary of analysis for Pool 1: Number of cells: Unused: 202 Free: 0 Allocated: 2 Total Used: 204 00000000 free cells were not accounted for. No errors were found while processing this Pool. Data for pool 2: POOLDATA: 21D6DC00 +000000 POOL_INDEX:00000002 INPUT_CELL_SIZE:00000020 +000008 CELL_SIZE:00000028 INPUT_PERCENT:0000000A +000010 CELL_POOL_SIZE:00000CA8 CELL_POOL_NUM:00000051 +000018 POOL_LATCH_ADDR:21EA4BE8 POOL_EXTENTS:00000000 +000020 LAST_CELL:00000000 NEXT_CELL:00000000 +000028 Q_CONTROL_INFO:00000000 Q_FIRST_CELL:00000000 +000030 POOL_NUM_GET_TOTAL:00000000 POOL_NUM_FREE:00000000 +000038 POOL_EXTENTS_ANCHOR:00000000 POOL_INDEX_SAME_SIZE:01 +00003D POOL_INDEX_SIZE:02 POOL_NUM_SAME_SIZE:01 +000040 POOL_TRACE_TABLE:21EDF070 There are no extents for this pool. ...
Data for pool 6: POOLDATA: 21D6E000 +000000 POOL_INDEX:00000006 INPUT_CELL_SIZE:00000800 +000008 CELL_SIZE:00000808 INPUT_PERCENT:0000000A +000010 CELL_POOL_SIZE:00002020 CELL_POOL_NUM:00000004 +000018 POOL_LATCH_ADDR:21EA4C38 POOL_EXTENTS:00000001 +000020 LAST_CELL:21D94D88 NEXT_CELL:21D93D78 +000028 Q_CONTROL_INFO:00000000 Q_FIRST_CELL:00000000 +000030 POOL_NUM_GET_TOTAL:00000001 POOL_NUM_FREE:00000000 +000038 POOL_EXTENTS_ANCHOR:21D93568 POOL_INDEX_SAME_SIZE:01 +00003D POOL_INDEX_SIZE:06 POOL_NUM_SAME_SIZE:01 +000040 POOL_TRACE_TABLE:21F9F0F0 Heap Pool Extent Mapping EXTENT: 21D93568 +000000 EYE_CATCHER:EX31 NEXT_EXTENT:00000000 To display entire pool extent: IP LIST 21D93568 LEN(X'00002028') ASID(X'01A9') 21D93570: Allocated storage cell. To display: IP LIST 21D93570 LEN(X'00000808') ASID(X'01A9') 21D93578: 00000000 21D703CC 70004000 00000000 21D9359C 00000000 00000000 00000000|.....P.... ......R..............| Summary of analysis for Pool 6: Number of cells: Unused: 3 Free: 0 Allocated: 1 Total Used: 4 00000000 free cells were not accounted for. No errors were found while processing this Pool.
Figure 25. Example of formatted output from LEDATA VERBEXIT (Part 8 of 18)
Chapter 3. Using Language Environment debugging facilities 95
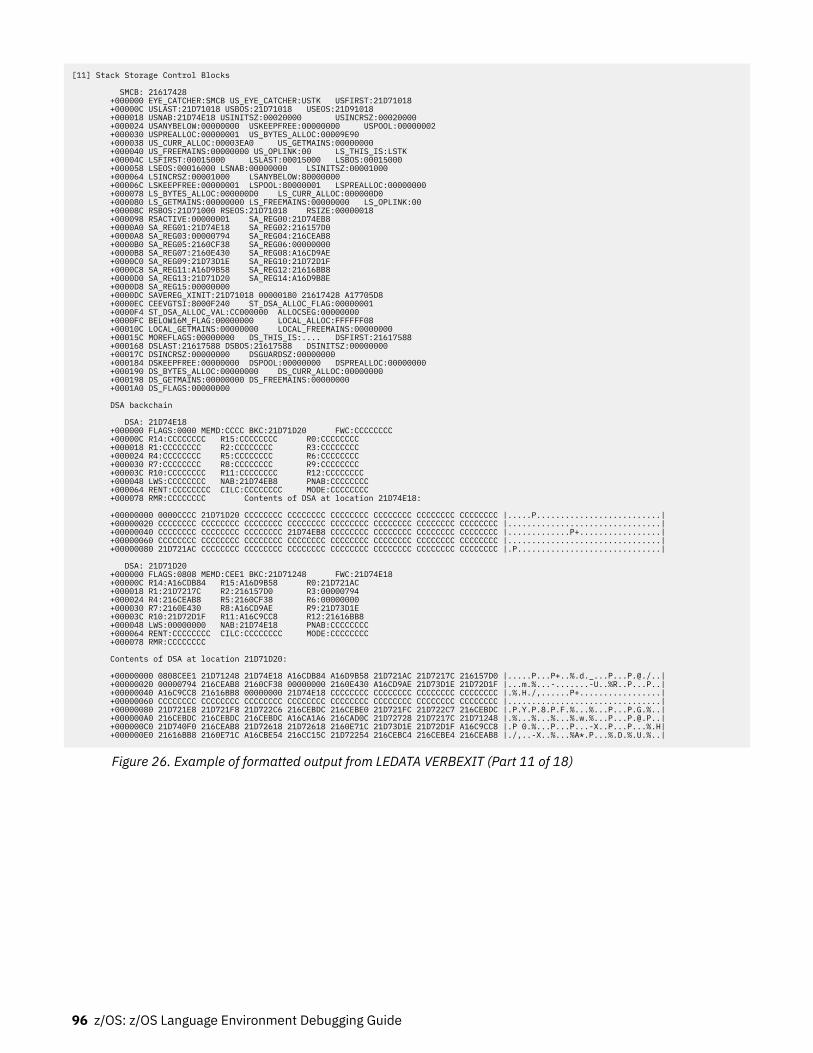
[11] Stack Storage Control Blocks SMCB: 21617428 +000000 EYE_CATCHER:SMCB US_EYE_CATCHER:USTK USFIRST:21D71018 +00000C USLAST:21D71018 USBOS:21D71018 USEOS:21D91018 +000018 USNAB:21D74E18 USINITSZ:00020000 USINCRSZ:00020000 +000024 USANYBELOW:00000000 USKEEPFREE:00000000 USPOOL:00000002 +000030 USPREALLOC:00000001 US_BYTES_ALLOC:00009E90 +000038 US_CURR_ALLOC:00003EA0 US_GETMAINS:00000000 +000040 US_FREEMAINS:00000000 US_OPLINK:00 LS_THIS_IS:LSTK +00004C LSFIRST:00015000 LSLAST:00015000 LSBOS:00015000 +000058 LSEOS:00016000 LSNAB:00000000 LSINITSZ:00001000 +000064 LSINCRSZ:00001000 LSANYBELOW:80000000 +00006C LSKEEPFREE:00000001 LSPOOL:80000001 LSPREALLOC:00000000 +000078 LS_BYTES_ALLOC:000000D0 LS_CURR_ALLOC:000000D0 +000080 LS_GETMAINS:00000000 LS_FREEMAINS:00000000 LS_OPLINK:00 +00008C RSBOS:21D71000 RSEOS:21D71018 RSIZE:00000018 +000098 RSACTIVE:00000001 SA_REG00:21D74EB8 +0000A0 SA_REG01:21D74E18 SA_REG02:216157D0 +0000A8 SA_REG03:00000794 SA_REG04:216CEAB8 +0000B0 SA_REG05:2160CF38 SA_REG06:00000000 +0000B8 SA_REG07:2160E430 SA_REG08:A16CD9AE +0000C0 SA_REG09:21D73D1E SA_REG10:21D72D1F +0000C8 SA_REG11:A16D9B58 SA_REG12:21616BB8 +0000D0 SA_REG13:21D71D20 SA_REG14:A16D9B8E +0000D8 SA_REG15:00000000 +0000DC SAVEREG_XINIT:21D71018 00000180 21617428 A17705D8 +0000EC CEEVGTSI:8000F240 ST_DSA_ALLOC_FLAG:00000001 +0000F4 ST_DSA_ALLOC_VAL:CC000000 ALLOCSEG:00000000 +0000FC BELOW16M_FLAG:00000000 LOCAL_ALLOC:FFFFFF08 +00010C LOCAL_GETMAINS:00000000 LOCAL_FREEMAINS:00000000 +00015C MOREFLAGS:00000000 DS_THIS_IS:.... DSFIRST:21617588 +000168 DSLAST:21617588 DSBOS:21617588 DSINITSZ:00000000 +00017C DSINCRSZ:00000000 DSGUARDSZ:00000000 +000184 DSKEEPFREE:00000000 DSPOOL:00000000 DSPREALLOC:00000000 +000190 DS_BYTES_ALLOC:00000000 DS_CURR_ALLOC:00000000 +000198 DS_GETMAINS:00000000 DS_FREEMAINS:00000000 +0001A0 DS_FLAGS:00000000 DSA backchain DSA: 21D74E18 +000000 FLAGS:0000 MEMD:CCCC BKC:21D71D20 FWC:CCCCCCCC +00000C R14:CCCCCCCC R15:CCCCCCCC R0:CCCCCCCC +000018 R1:CCCCCCCC R2:CCCCCCCC R3:CCCCCCCC +000024 R4:CCCCCCCC R5:CCCCCCCC R6:CCCCCCCC +000030 R7:CCCCCCCC R8:CCCCCCCC R9:CCCCCCCC +00003C R10:CCCCCCCC R11:CCCCCCCC R12:CCCCCCCC +000048 LWS:CCCCCCCC NAB:21D74EB8 PNAB:CCCCCCCC +000064 RENT:CCCCCCCC CILC:CCCCCCCC MODE:CCCCCCCC +000078 RMR:CCCCCCCC Contents of DSA at location 21D74E18: +00000000 0000CCCC 21D71D20 CCCCCCCC CCCCCCCC CCCCCCCC CCCCCCCC CCCCCCCC CCCCCCCC |.....P..........................| +00000020 CCCCCCCC CCCCCCCC CCCCCCCC CCCCCCCC CCCCCCCC CCCCCCCC CCCCCCCC CCCCCCCC |................................| +00000040 CCCCCCCC CCCCCCCC CCCCCCCC 21D74EB8 CCCCCCCC CCCCCCCC CCCCCCCC CCCCCCCC |.............P+.................| +00000060 CCCCCCCC CCCCCCCC CCCCCCCC CCCCCCCC CCCCCCCC CCCCCCCC CCCCCCCC CCCCCCCC |................................| +00000080 21D721AC CCCCCCCC CCCCCCCC CCCCCCCC CCCCCCCC CCCCCCCC CCCCCCCC CCCCCCCC |.P..............................| DSA: 21D71D20 +000000 FLAGS:0808 MEMD:CEE1 BKC:21D71248 FWC:21D74E18 +00000C R14:A16CDB84 R15:A16D9B58 R0:21D721AC +000018 R1:21D7217C R2:216157D0 R3:00000794 +000024 R4:216CEAB8 R5:2160CF38 R6:00000000 +000030 R7:2160E430 R8:A16CD9AE R9:21D73D1E +00003C R10:21D72D1F R11:A16C9CC8 R12:21616BB8 +000048 LWS:00000000 NAB:21D74E18 PNAB:CCCCCCCC +000064 RENT:CCCCCCCC CILC:CCCCCCCC MODE:CCCCCCCC +000078 RMR:CCCCCCCC Contents of DSA at location 21D71D20: +00000000 0808CEE1 21D71248 21D74E18 A16CDB84 A16D9B58 21D721AC 21D7217C 216157D0 |.....P...P+..%.d._...P...P.@./..| +00000020 00000794 216CEAB8 2160CF38 00000000 2160E430 A16CD9AE 21D73D1E 21D72D1F |...m.%...-.......-U..%R..P...P..| +00000040 A16C9CC8 21616BB8 00000000 21D74E18 CCCCCCCC CCCCCCCC CCCCCCCC CCCCCCCC |.%.H./,......P+.................| +00000060 CCCCCCCC CCCCCCCC CCCCCCCC CCCCCCCC CCCCCCCC CCCCCCCC CCCCCCCC CCCCCCCC |................................| +00000080 21D721E8 21D721F8 21D722C6 216CEBDC 216CEBE0 21D721FC 21D722C7 216CEBDC |.P.Y.P.8.P.F.%...%...P...P.G.%..| +000000A0 216CEBDC 216CEBDC 216CEBDC A16CA1A6 216CAD0C 21D72728 21D7217C 21D71248 |.%...%...%...%.w.%[email protected]..| +000000C0 21D740F0 216CEAB8 21D72618 21D72618 2160E71C 21D73D1E 21D72D1F A16C9CC8 |.P 0.%...P...P...-X..P...P...%.H| +000000E0 21616BB8 2160E71C A16CBE54 216CC15C 21D72254 216CEBC4 216CEBE4 216CEAB8 |./,..-X..%...%A*.P...%.D.%.U.%..|
Figure 26. Example of formatted output from LEDATA VERBEXIT (Part 11 of 18)
96 z/OS: z/OS Language Environment Debugging Guide
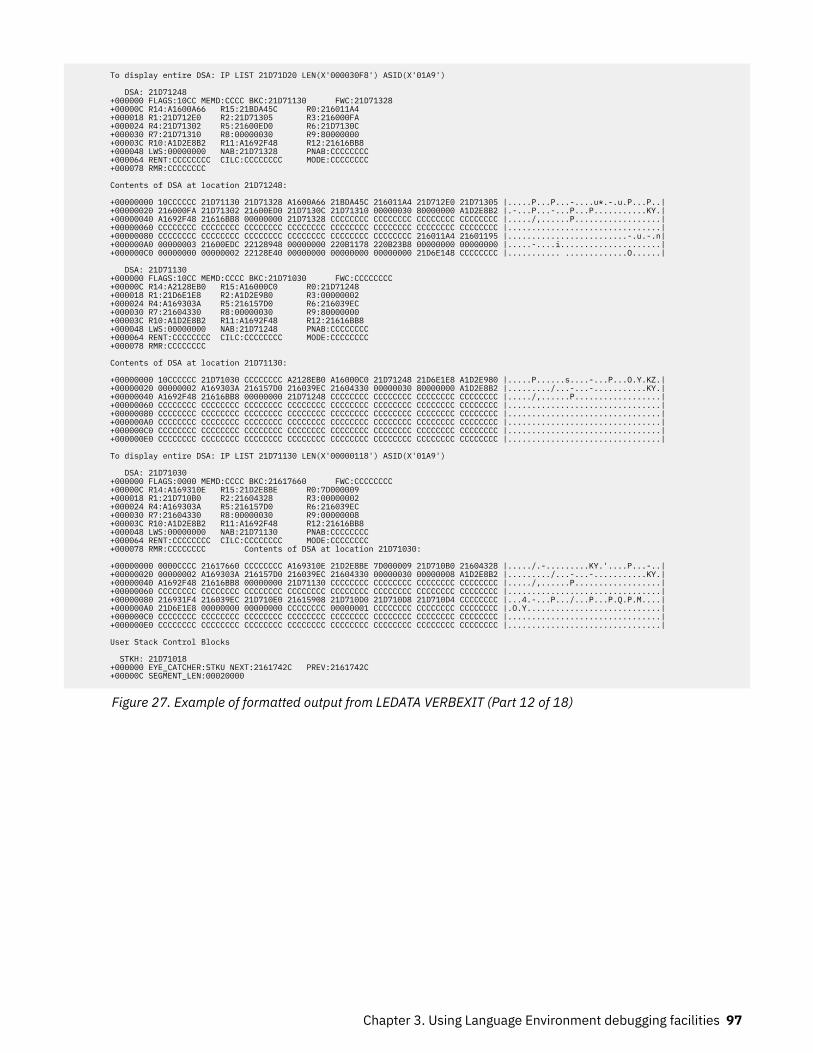
To display entire DSA: IP LIST 21D71D20 LEN(X'000030F8') ASID(X'01A9') DSA: 21D71248 +000000 FLAGS:10CC MEMD:CCCC BKC:21D71130 FWC:21D71328 +00000C R14:A1600A66 R15:21BDA45C R0:216011A4 +000018 R1:21D712E0 R2:21D71305 R3:216000FA +000024 R4:21D71302 R5:21600ED0 R6:21D7130C +000030 R7:21D71310 R8:00000030 R9:80000000 +00003C R10:A1D2E8B2 R11:A1692F48 R12:21616BB8 +000048 LWS:00000000 NAB:21D71328 PNAB:CCCCCCCC +000064 RENT:CCCCCCCC CILC:CCCCCCCC MODE:CCCCCCCC +000078 RMR:CCCCCCCC Contents of DSA at location 21D71248: +00000000 10CCCCCC 21D71130 21D71328 A1600A66 21BDA45C 216011A4 21D712E0 21D71305 |.....P...P...-....u*.-.u.P...P..| +00000020 216000FA 21D71302 21600ED0 21D7130C 21D71310 00000030 80000000 A1D2E8B2 |.-...P...-...P...P...........KY.| +00000040 A1692F48 21616BB8 00000000 21D71328 CCCCCCCC CCCCCCCC CCCCCCCC CCCCCCCC |...../,......P..................| +00000060 CCCCCCCC CCCCCCCC CCCCCCCC CCCCCCCC CCCCCCCC CCCCCCCC CCCCCCCC CCCCCCCC |................................| +00000080 CCCCCCCC CCCCCCCC CCCCCCCC CCCCCCCC CCCCCCCC CCCCCCCC 216011A4 21601195 |.........................-.u.-.n| +000000A0 00000003 21600EDC 22128948 00000000 220B1178 220B23B8 00000000 00000000 |.....-....i.....................| +000000C0 00000000 00000002 22128E40 00000000 00000000 00000000 21D6E148 CCCCCCCC |........... .............O......| DSA: 21D71130 +000000 FLAGS:10CC MEMD:CCCC BKC:21D71030 FWC:CCCCCCCC +00000C R14:A2128EB0 R15:A16000C0 R0:21D71248 +000018 R1:21D6E1E8 R2:A1D2E980 R3:00000002 +000024 R4:A169303A R5:216157D0 R6:216039EC +000030 R7:21604330 R8:00000030 R9:80000000 +00003C R10:A1D2E8B2 R11:A1692F48 R12:21616BB8 +000048 LWS:00000000 NAB:21D71248 PNAB:CCCCCCCC +000064 RENT:CCCCCCCC CILC:CCCCCCCC MODE:CCCCCCCC +000078 RMR:CCCCCCCC Contents of DSA at location 21D71130: +00000000 10CCCCCC 21D71030 CCCCCCCC A2128EB0 A16000C0 21D71248 21D6E1E8 A1D2E980 |.....P......s....-...P...O.Y.KZ.| +00000020 00000002 A169303A 216157D0 216039EC 21604330 00000030 80000000 A1D2E8B2 |........./...-...-...........KY.| +00000040 A1692F48 21616BB8 00000000 21D71248 CCCCCCCC CCCCCCCC CCCCCCCC CCCCCCCC |...../,......P..................| +00000060 CCCCCCCC CCCCCCCC CCCCCCCC CCCCCCCC CCCCCCCC CCCCCCCC CCCCCCCC CCCCCCCC |................................| +00000080 CCCCCCCC CCCCCCCC CCCCCCCC CCCCCCCC CCCCCCCC CCCCCCCC CCCCCCCC CCCCCCCC |................................| +000000A0 CCCCCCCC CCCCCCCC CCCCCCCC CCCCCCCC CCCCCCCC CCCCCCCC CCCCCCCC CCCCCCCC |................................| +000000C0 CCCCCCCC CCCCCCCC CCCCCCCC CCCCCCCC CCCCCCCC CCCCCCCC CCCCCCCC CCCCCCCC |................................| +000000E0 CCCCCCCC CCCCCCCC CCCCCCCC CCCCCCCC CCCCCCCC CCCCCCCC CCCCCCCC CCCCCCCC |................................| To display entire DSA: IP LIST 21D71130 LEN(X'00000118') ASID(X'01A9') DSA: 21D71030 +000000 FLAGS:0000 MEMD:CCCC BKC:21617660 FWC:CCCCCCCC +00000C R14:A169310E R15:21D2E8BE R0:7D000009 +000018 R1:21D710B0 R2:21604328 R3:00000002 +000024 R4:A169303A R5:216157D0 R6:216039EC +000030 R7:21604330 R8:00000030 R9:00000008 +00003C R10:A1D2E8B2 R11:A1692F48 R12:21616BB8 +000048 LWS:00000000 NAB:21D71130 PNAB:CCCCCCCC +000064 RENT:CCCCCCCC CILC:CCCCCCCC MODE:CCCCCCCC +000078 RMR:CCCCCCCC Contents of DSA at location 21D71030: +00000000 0000CCCC 21617660 CCCCCCCC A169310E 21D2E8BE 7D000009 21D710B0 21604328 |...../.-.........KY.'....P...-..| +00000020 00000002 A169303A 216157D0 216039EC 21604330 00000030 00000008 A1D2E8B2 |........./...-...-...........KY.| +00000040 A1692F48 21616BB8 00000000 21D71130 CCCCCCCC CCCCCCCC CCCCCCCC CCCCCCCC |...../,......P..................| +00000060 CCCCCCCC CCCCCCCC CCCCCCCC CCCCCCCC CCCCCCCC CCCCCCCC CCCCCCCC CCCCCCCC |................................| +00000080 216931F4 216039EC 21D710E0 21615908 21D710D0 21D710D8 21D710D4 CCCCCCCC |...4.-...P.../...P...P.Q.P.M....| +000000A0 21D6E1E8 00000000 00000000 CCCCCCCC 00000001 CCCCCCCC CCCCCCCC CCCCCCCC |.O.Y............................| +000000C0 CCCCCCCC CCCCCCCC CCCCCCCC CCCCCCCC CCCCCCCC CCCCCCCC CCCCCCCC CCCCCCCC |................................| +000000E0 CCCCCCCC CCCCCCCC CCCCCCCC CCCCCCCC CCCCCCCC CCCCCCCC CCCCCCCC CCCCCCCC |................................| User Stack Control Blocks STKH: 21D71018 +000000 EYE_CATCHER:STKU NEXT:2161742C PREV:2161742C +00000C SEGMENT_LEN:00020000
Figure 27. Example of formatted output from LEDATA VERBEXIT (Part 12 of 18)
Chapter 3. Using Language Environment debugging facilities 97
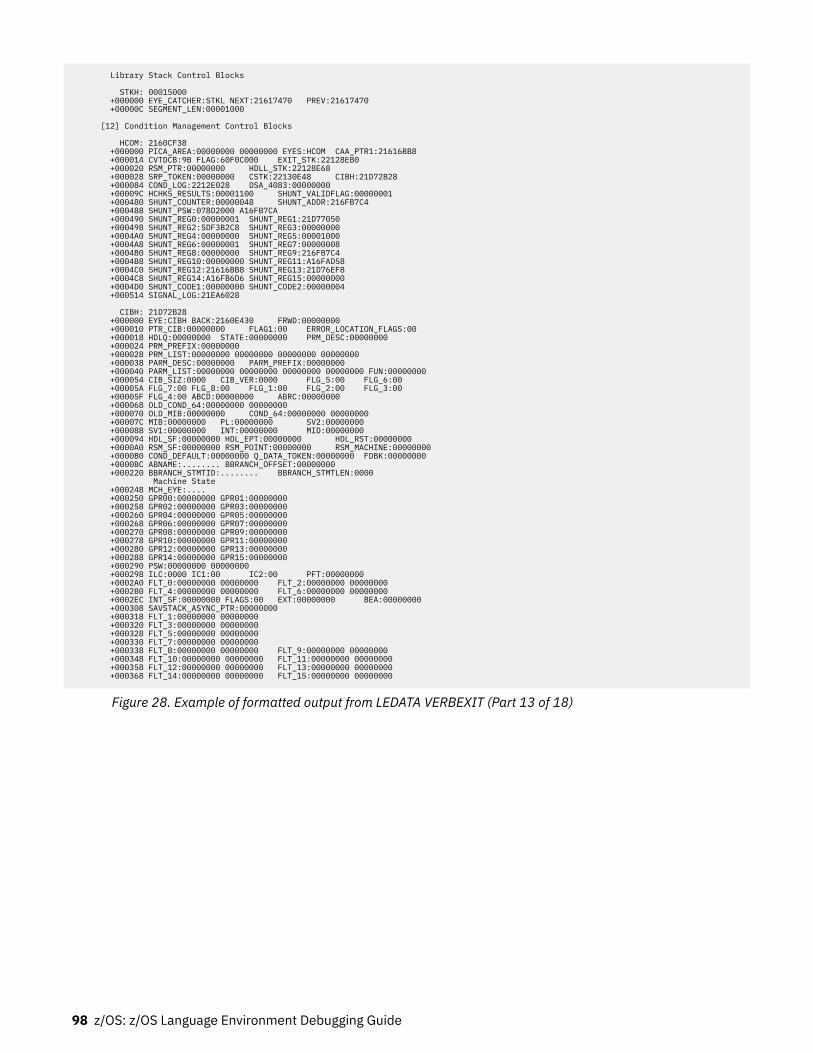
Library Stack Control Blocks STKH: 00015000 +000000 EYE_CATCHER:STKL NEXT:21617470 PREV:21617470 +00000C SEGMENT_LEN:00001000
[12] Condition Management Control Blocks
HCOM: 2160CF38 +000000 PICA_AREA:00000000 00000000 EYES:HCOM CAA_PTR1:21616BB8 +000014 CVTDCB:9B FLAG:60F0C000 EXIT_STK:22128EB0 +000020 RSM_PTR:00000000 HDLL_STK:22128E68 +000028 SRP_TOKEN:00000000 CSTK:22130E48 CIBH:21D72B28 +000084 COND_LOG:2212E028 DSA_4083:00000000 +00009C HCHK5_RESULTS:00001100 SHUNT_VALIDFLAG:00000001 +000480 SHUNT_COUNTER:00000048 SHUNT_ADDR:216FB7C4 +000488 SHUNT_PSW:078D2000 A16FB7CA +000490 SHUNT_REG0:00000001 SHUNT_REG1:21D77050 +000498 SHUNT_REG2:5DF3B2C8 SHUNT_REG3:00000000 +0004A0 SHUNT_REG4:00000000 SHUNT_REG5:00001000 +0004A8 SHUNT_REG6:00000001 SHUNT_REG7:00000008 +0004B0 SHUNT_REG8:00000000 SHUNT_REG9:216FB7C4 +0004B8 SHUNT_REG10:00000000 SHUNT_REG11:A16FAD58 +0004C0 SHUNT_REG12:21616BB8 SHUNT_REG13:21D76EF8 +0004C8 SHUNT_REG14:A16FB6D6 SHUNT_REG15:00000000 +0004D0 SHUNT_CODE1:00000000 SHUNT_CODE2:00000004 +000514 SIGNAL_LOG:21EA6028 CIBH: 21D72B28 +000000 EYE:CIBH BACK:2160E430 FRWD:00000000 +000010 PTR_CIB:00000000 FLAG1:00 ERROR_LOCATION_FLAGS:00 +000018 HDLQ:00000000 STATE:00000000 PRM_DESC:00000000 +000024 PRM_PREFIX:00000000 +000028 PRM_LIST:00000000 00000000 00000000 00000000 +000038 PARM_DESC:00000000 PARM_PREFIX:00000000 +000040 PARM_LIST:00000000 00000000 00000000 00000000 FUN:00000000 +000054 CIB_SIZ:0000 CIB_VER:0000 FLG_5:00 FLG_6:00 +00005A FLG_7:00 FLG_8:00 FLG_1:00 FLG_2:00 FLG_3:00 +00005F FLG_4:00 ABCD:00000000 ABRC:00000000 +000068 OLD_COND_64:00000000 00000000 +000070 OLD_MIB:00000000 COND_64:00000000 00000000 +00007C MIB:00000000 PL:00000000 SV2:00000000 +000088 SV1:00000000 INT:00000000 MID:00000000 +000094 HDL_SF:00000000 HDL_EPT:00000000 HDL_RST:00000000 +0000A0 RSM_SF:00000000 RSM_POINT:00000000 RSM_MACHINE:00000000 +0000B0 COND_DEFAULT:00000000 Q_DATA_TOKEN:00000000 FDBK:00000000 +0000BC ABNAME:........ BBRANCH_OFFSET:00000000 +000220 BBRANCH_STMTID:........ BBRANCH_STMTLEN:0000 Machine State +000248 MCH_EYE:.... +000250 GPR00:00000000 GPR01:00000000 +000258 GPR02:00000000 GPR03:00000000 +000260 GPR04:00000000 GPR05:00000000 +000268 GPR06:00000000 GPR07:00000000 +000270 GPR08:00000000 GPR09:00000000 +000278 GPR10:00000000 GPR11:00000000 +000280 GPR12:00000000 GPR13:00000000 +000288 GPR14:00000000 GPR15:00000000 +000290 PSW:00000000 00000000 +000298 ILC:0000 IC1:00 IC2:00 PFT:00000000 +0002A0 FLT_0:00000000 00000000 FLT_2:00000000 00000000 +0002B0 FLT_4:00000000 00000000 FLT_6:00000000 00000000 +0002EC INT_SF:00000000 FLAGS:00 EXT:00000000 BEA:00000000 +000308 SAVSTACK_ASYNC_PTR:00000000 +000318 FLT_1:00000000 00000000 +000320 FLT_3:00000000 00000000 +000328 FLT_5:00000000 00000000 +000330 FLT_7:00000000 00000000 +000338 FLT_8:00000000 00000000 FLT_9:00000000 00000000 +000348 FLT_10:00000000 00000000 FLT_11:00000000 00000000 +000358 FLT_12:00000000 00000000 FLT_13:00000000 00000000 +000368 FLT_14:00000000 00000000 FLT_15:00000000 00000000
Figure 28. Example of formatted output from LEDATA VERBEXIT (Part 13 of 18)
98 z/OS: z/OS Language Environment Debugging Guide
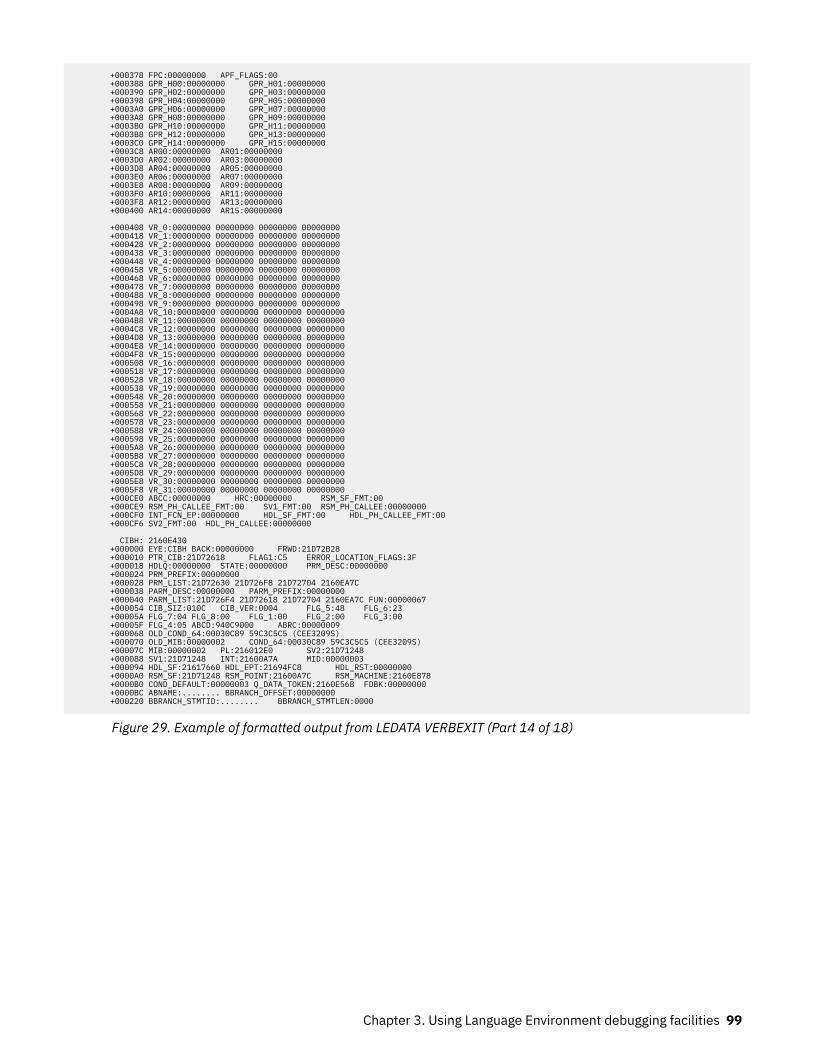
+000378 FPC:00000000 APF_FLAGS:00 +000388 GPR_H00:00000000 GPR_H01:00000000 +000390 GPR_H02:00000000 GPR_H03:00000000 +000398 GPR_H04:00000000 GPR_H05:00000000 +0003A0 GPR_H06:00000000 GPR_H07:00000000 +0003A8 GPR_H08:00000000 GPR_H09:00000000 +0003B0 GPR_H10:00000000 GPR_H11:00000000 +0003B8 GPR_H12:00000000 GPR_H13:00000000 +0003C0 GPR_H14:00000000 GPR_H15:00000000 +0003C8 AR00:00000000 AR01:00000000 +0003D0 AR02:00000000 AR03:00000000 +0003D8 AR04:00000000 AR05:00000000 +0003E0 AR06:00000000 AR07:00000000 +0003E8 AR08:00000000 AR09:00000000 +0003F0 AR10:00000000 AR11:00000000 +0003F8 AR12:00000000 AR13:00000000 +000400 AR14:00000000 AR15:00000000
+000408 VR_0:00000000 00000000 00000000 00000000 +000418 VR_1:00000000 00000000 00000000 00000000 +000428 VR_2:00000000 00000000 00000000 00000000 +000438 VR_3:00000000 00000000 00000000 00000000 +000448 VR_4:00000000 00000000 00000000 00000000 +000458 VR_5:00000000 00000000 00000000 00000000 +000468 VR_6:00000000 00000000 00000000 00000000 +000478 VR_7:00000000 00000000 00000000 00000000 +000488 VR_8:00000000 00000000 00000000 00000000 +000498 VR_9:00000000 00000000 00000000 00000000 +0004A8 VR_10:00000000 00000000 00000000 00000000 +0004B8 VR_11:00000000 00000000 00000000 00000000 +0004C8 VR_12:00000000 00000000 00000000 00000000 +0004D8 VR_13:00000000 00000000 00000000 00000000 +0004E8 VR_14:00000000 00000000 00000000 00000000 +0004F8 VR_15:00000000 00000000 00000000 00000000 +000508 VR_16:00000000 00000000 00000000 00000000 +000518 VR_17:00000000 00000000 00000000 00000000 +000528 VR_18:00000000 00000000 00000000 00000000 +000538 VR_19:00000000 00000000 00000000 00000000 +000548 VR_20:00000000 00000000 00000000 00000000 +000558 VR_21:00000000 00000000 00000000 00000000 +000568 VR_22:00000000 00000000 00000000 00000000 +000578 VR_23:00000000 00000000 00000000 00000000 +000588 VR_24:00000000 00000000 00000000 00000000 +000598 VR_25:00000000 00000000 00000000 00000000 +0005A8 VR_26:00000000 00000000 00000000 00000000 +0005B8 VR_27:00000000 00000000 00000000 00000000 +0005C8 VR_28:00000000 00000000 00000000 00000000 +0005D8 VR_29:00000000 00000000 00000000 00000000 +0005E8 VR_30:00000000 00000000 00000000 00000000 +0005F8 VR_31:00000000 00000000 00000000 00000000 +000CE0 ABCC:00000000 HRC:00000000 RSM_SF_FMT:00 +000CE9 RSM_PH_CALLEE_FMT:00 SV1_FMT:00 RSM_PH_CALLEE:00000000 +000CF0 INT_FCN_EP:00000000 HDL_SF_FMT:00 HDL_PH_CALLEE_FMT:00 +000CF6 SV2_FMT:00 HDL_PH_CALLEE:00000000 CIBH: 2160E430 +000000 EYE:CIBH BACK:00000000 FRWD:21D72B28 +000010 PTR_CIB:21D72618 FLAG1:C5 ERROR_LOCATION_FLAGS:3F +000018 HDLQ:00000000 STATE:00000000 PRM_DESC:00000000 +000024 PRM_PREFIX:00000000 +000028 PRM_LIST:21D72630 21D726F8 21D72704 2160EA7C +000038 PARM_DESC:00000000 PARM_PREFIX:00000000 +000040 PARM_LIST:21D726F4 21D72618 21D72704 2160EA7C FUN:00000067 +000054 CIB_SIZ:010C CIB_VER:0004 FLG_5:48 FLG_6:23 +00005A FLG_7:04 FLG_8:00 FLG_1:00 FLG_2:00 FLG_3:00 +00005F FLG_4:05 ABCD:940C9000 ABRC:00000009 +000068 OLD_COND_64:00030C89 59C3C5C5 (CEE3209S) +000070 OLD_MIB:00000002 COND_64:00030C89 59C3C5C5 (CEE3209S) +00007C MIB:00000002 PL:216012E0 SV2:21D71248 +000088 SV1:21D71248 INT:21600A7A MID:00000003 +000094 HDL_SF:21617660 HDL_EPT:21694FC8 HDL_RST:00000000 +0000A0 RSM_SF:21D71248 RSM_POINT:21600A7C RSM_MACHINE:2160E878 +0000B0 COND_DEFAULT:00000003 Q_DATA_TOKEN:2160E568 FDBK:00000000 +0000BC ABNAME:........ BBRANCH_OFFSET:00000000 +000220 BBRANCH_STMTID:........ BBRANCH_STMTLEN:0000
Figure 29. Example of formatted output from LEDATA VERBEXIT (Part 14 of 18)
Chapter 3. Using Language Environment debugging facilities 99
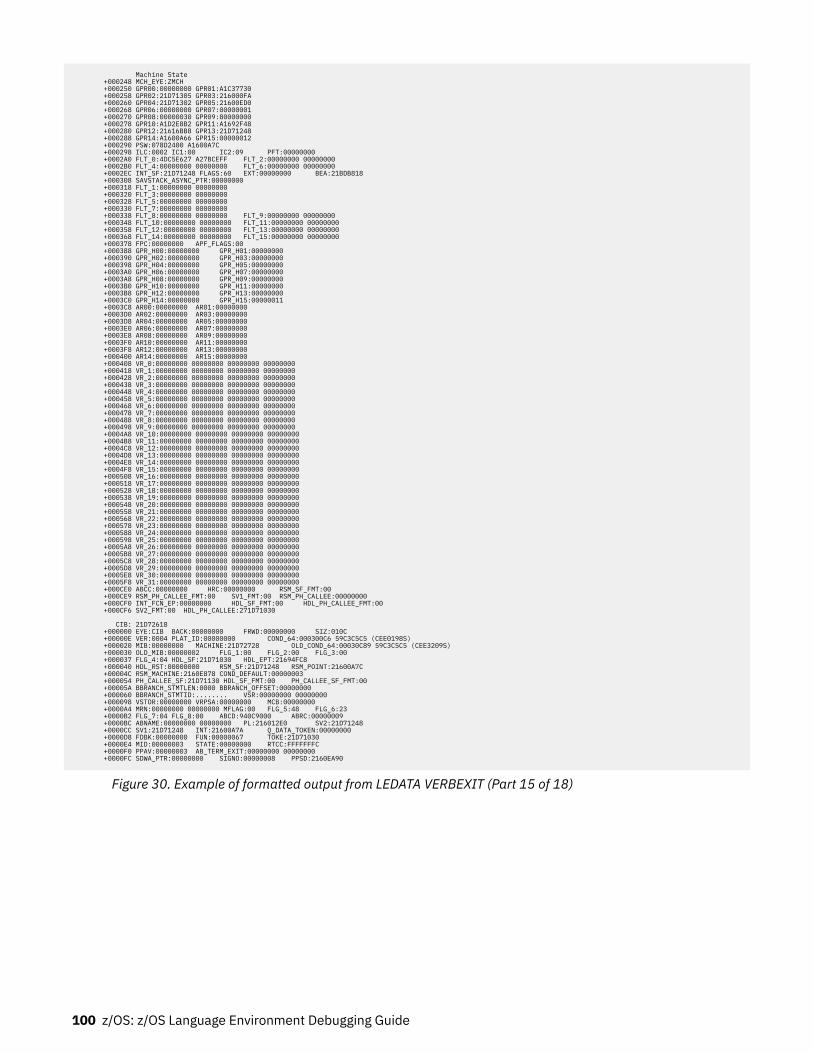
Machine State +000248 MCH_EYE:ZMCH +000250 GPR00:00000000 GPR01:A1C37730 +000258 GPR02:21D71305 GPR03:216000FA +000260 GPR04:21D71302 GPR05:21600ED0 +000268 GPR06:00000000 GPR07:00000001 +000270 GPR08:00000030 GPR09:80000000 +000278 GPR10:A1D2E8B2 GPR11:A1692F48 +000280 GPR12:21616BB8 GPR13:21D71248 +000288 GPR14:A1600A66 GPR15:00000012 +000290 PSW:078D2400 A1600A7C +000298 ILC:0002 IC1:00 IC2:09 PFT:00000000 +0002A0 FLT_0:4DC5E627 A27BCEFF FLT_2:00000000 00000000 +0002B0 FLT_4:00000000 00000000 FLT_6:00000000 00000000 +0002EC INT_SF:21D71248 FLAGS:60 EXT:00000000 BEA:21BDB818 +000308 SAVSTACK_ASYNC_PTR:00000000 +000318 FLT_1:00000000 00000000 +000320 FLT_3:00000000 00000000 +000328 FLT_5:00000000 00000000 +000330 FLT_7:00000000 00000000 +000338 FLT_8:00000000 00000000 FLT_9:00000000 00000000 +000348 FLT_10:00000000 00000000 FLT_11:00000000 00000000 +000358 FLT_12:00000000 00000000 FLT_13:00000000 00000000 +000368 FLT_14:00000000 00000000 FLT_15:00000000 00000000 +000378 FPC:00000000 APF_FLAGS:00 +000388 GPR_H00:00000000 GPR_H01:00000000 +000390 GPR_H02:00000000 GPR_H03:00000000 +000398 GPR_H04:00000000 GPR_H05:00000000 +0003A0 GPR_H06:00000000 GPR_H07:00000000 +0003A8 GPR_H08:00000000 GPR_H09:00000000 +0003B0 GPR_H10:00000000 GPR_H11:00000000 +0003B8 GPR_H12:00000000 GPR_H13:00000000 +0003C0 GPR_H14:00000000 GPR_H15:00000011 +0003C8 AR00:00000000 AR01:00000000 +0003D0 AR02:00000000 AR03:00000000 +0003D8 AR04:00000000 AR05:00000000 +0003E0 AR06:00000000 AR07:00000000 +0003E8 AR08:00000000 AR09:00000000 +0003F0 AR10:00000000 AR11:00000000 +0003F8 AR12:00000000 AR13:00000000 +000400 AR14:00000000 AR15:00000000 +000408 VR_0:00000000 00000000 00000000 00000000 +000418 VR_1:00000000 00000000 00000000 00000000 +000428 VR_2:00000000 00000000 00000000 00000000 +000438 VR_3:00000000 00000000 00000000 00000000 +000448 VR_4:00000000 00000000 00000000 00000000 +000458 VR_5:00000000 00000000 00000000 00000000 +000468 VR_6:00000000 00000000 00000000 00000000 +000478 VR_7:00000000 00000000 00000000 00000000 +000488 VR_8:00000000 00000000 00000000 00000000 +000498 VR_9:00000000 00000000 00000000 00000000 +0004A8 VR_10:00000000 00000000 00000000 00000000 +0004B8 VR_11:00000000 00000000 00000000 00000000 +0004C8 VR_12:00000000 00000000 00000000 00000000 +0004D8 VR_13:00000000 00000000 00000000 00000000 +0004E8 VR_14:00000000 00000000 00000000 00000000 +0004F8 VR_15:00000000 00000000 00000000 00000000 +000508 VR_16:00000000 00000000 00000000 00000000 +000518 VR_17:00000000 00000000 00000000 00000000 +000528 VR_18:00000000 00000000 00000000 00000000 +000538 VR_19:00000000 00000000 00000000 00000000 +000548 VR_20:00000000 00000000 00000000 00000000 +000558 VR_21:00000000 00000000 00000000 00000000 +000568 VR_22:00000000 00000000 00000000 00000000 +000578 VR_23:00000000 00000000 00000000 00000000 +000588 VR_24:00000000 00000000 00000000 00000000 +000598 VR_25:00000000 00000000 00000000 00000000 +0005A8 VR_26:00000000 00000000 00000000 00000000 +0005B8 VR_27:00000000 00000000 00000000 00000000 +0005C8 VR_28:00000000 00000000 00000000 00000000 +0005D8 VR_29:00000000 00000000 00000000 00000000 +0005E8 VR_30:00000000 00000000 00000000 00000000 +0005F8 VR_31:00000000 00000000 00000000 00000000 +000CE0 ABCC:00000000 HRC:00000000 RSM_SF_FMT:00 +000CE9 RSM_PH_CALLEE_FMT:00 SV1_FMT:00 RSM_PH_CALLEE:00000000 +000CF0 INT_FCN_EP:00000000 HDL_SF_FMT:00 HDL_PH_CALLEE_FMT:00 +000CF6 SV2_FMT:00 HDL_PH_CALLEE:271D71030 CIB: 21D72618 +000000 EYE:CIB BACK:00000000 FRWD:00000000 SIZ:010C +00000E VER:0004 PLAT_ID:00000000 COND_64:000300C6 59C3C5C5 (CEE0198S) +000020 MIB:00000000 MACHINE:21D72728 OLD_COND_64:00030C89 59C3C5C5 (CEE3209S) +000030 OLD_MIB:00000002 FLG_1:00 FLG_2:00 FLG_3:00 +000037 FLG_4:04 HDL_SF:21D71030 HDL_EPT:21694FC8 +000040 HDL_RST:00000000 RSM_SF:21D71248 RSM_POINT:21600A7C +00004C RSM_MACHINE:2160E878 COND_DEFAULT:00000003 +000054 PH_CALLEE_SF:21D71130 HDL_SF_FMT:00 PH_CALLEE_SF_FMT:00 +00005A BBRANCH_STMTLEN:0000 BBRANCH_OFFSET:00000000 +000060 BBRANCH_STMTID:........ VSR:00000000 00000000 +000098 VSTOR:00000000 VRPSA:00000000 MCB:00000000 +0000A4 MRN:00000000 00000000 MFLAG:00 FLG_5:48 FLG_6:23 +0000B2 FLG_7:04 FLG_8:00 ABCD:940C9000 ABRC:00000009 +0000BC ABNAME:00000000 00000000 PL:216012E0 SV2:21D71248 +0000CC SV1:21D71248 INT:21600A7A Q_DATA_TOKEN:00000000 +0000D8 FDBK:00000000 FUN:00000067 TOKE:21D71030 +0000E4 MID:00000003 STATE:00000000 RTCC:FFFFFFFC +0000F0 PPAV:00000003 AB_TERM_EXIT:00000000 00000000 +0000FC SDWA_PTR:00000000 SIGNO:00000008 PPSD:2160EA90
Figure 30. Example of formatted output from LEDATA VERBEXIT (Part 15 of 18)
100 z/OS: z/OS Language Environment Debugging Guide
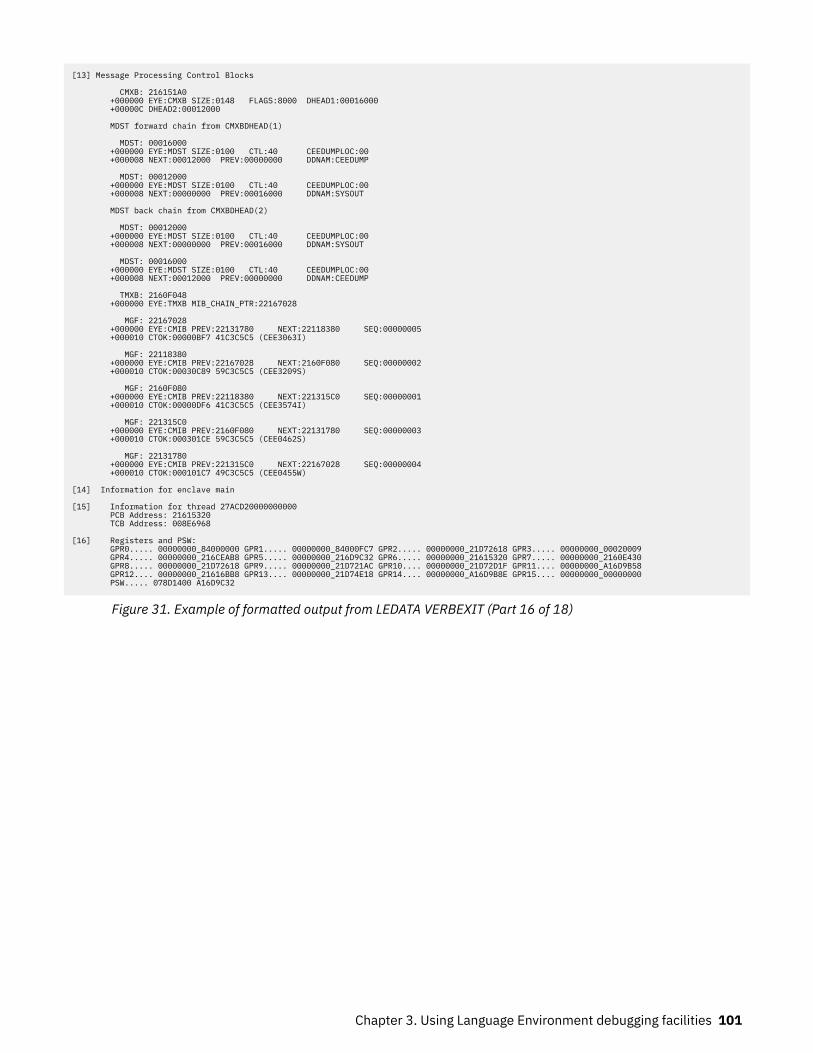
[13] Message Processing Control Blocks CMXB: 216151A0 +000000 EYE:CMXB SIZE:0148 FLAGS:8000 DHEAD1:00016000 +00000C DHEAD2:00012000 MDST forward chain from CMXBDHEAD(1) MDST: 00016000 +000000 EYE:MDST SIZE:0100 CTL:40 CEEDUMPLOC:00 +000008 NEXT:00012000 PREV:00000000 DDNAM:CEEDUMP MDST: 00012000 +000000 EYE:MDST SIZE:0100 CTL:40 CEEDUMPLOC:00 +000008 NEXT:00000000 PREV:00016000 DDNAM:SYSOUT MDST back chain from CMXBDHEAD(2) MDST: 00012000 +000000 EYE:MDST SIZE:0100 CTL:40 CEEDUMPLOC:00 +000008 NEXT:00000000 PREV:00016000 DDNAM:SYSOUT MDST: 00016000 +000000 EYE:MDST SIZE:0100 CTL:40 CEEDUMPLOC:00 +000008 NEXT:00012000 PREV:00000000 DDNAM:CEEDUMP TMXB: 2160F048 +000000 EYE:TMXB MIB_CHAIN_PTR:22167028 MGF: 22167028 +000000 EYE:CMIB PREV:22131780 NEXT:22118380 SEQ:00000005 +000010 CTOK:00000BF7 41C3C5C5 (CEE3063I)
MGF: 22118380 +000000 EYE:CMIB PREV:22167028 NEXT:2160F080 SEQ:00000002 +000010 CTOK:00030C89 59C3C5C5 (CEE3209S)
MGF: 2160F080 +000000 EYE:CMIB PREV:22118380 NEXT:221315C0 SEQ:00000001 +000010 CTOK:00000DF6 41C3C5C5 (CEE3574I)
MGF: 221315C0 +000000 EYE:CMIB PREV:2160F080 NEXT:22131780 SEQ:00000003 +000010 CTOK:000301CE 59C3C5C5 (CEE0462S)
MGF: 22131780 +000000 EYE:CMIB PREV:221315C0 NEXT:22167028 SEQ:00000004 +000010 CTOK:000101C7 49C3C5C5 (CEE0455W)
[14] Information for enclave main
[15] Information for thread 27ACD20000000000 PCB Address: 21615320 TCB Address: 008E6968 [16] Registers and PSW: GPR0..... 00000000_84000000 GPR1..... 00000000_84000FC7 GPR2..... 00000000_21D72618 GPR3..... 00000000_00020009 GPR4..... 00000000_216CEAB8 GPR5..... 00000000_216D9C32 GPR6..... 00000000_21615320 GPR7..... 00000000_2160E430 GPR8..... 00000000_21D72618 GPR9..... 00000000_21D721AC GPR10.... 00000000_21D72D1F GPR11.... 00000000_A16D9B58 GPR12.... 00000000_21616BB8 GPR13.... 00000000_21D74E18 GPR14.... 00000000_A16D9B8E GPR15.... 00000000_00000000 PSW..... 078D1400 A16D9C32
Figure 31. Example of formatted output from LEDATA VERBEXIT (Part 16 of 18)
Chapter 3. Using Language Environment debugging facilities 101
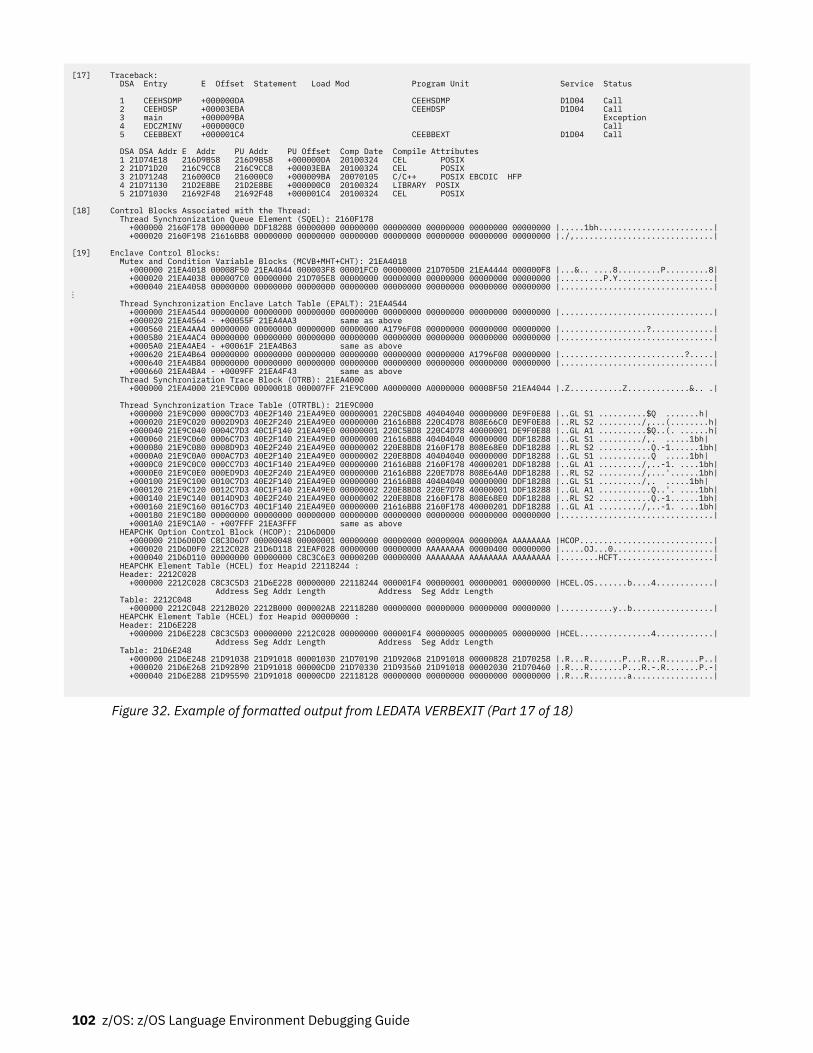
[17] Traceback: DSA Entry E Offset Statement Load Mod Program Unit Service Status 1 CEEHSDMP +000000DA CEEHSDMP D1D04 Call 2 CEEHDSP +00003EBA CEEHDSP D1D04 Call 3 main +000009BA Exception 4 EDCZMINV +000000C0 Call 5 CEEBBEXT +000001C4 CEEBBEXT D1D04 Call DSA DSA Addr E Addr PU Addr PU Offset Comp Date Compile Attributes 1 21D74E18 216D9B58 216D9B58 +000000DA 20100324 CEL POSIX 2 21D71D20 216C9CC8 216C9CC8 +00003EBA 20100324 CEL POSIX 3 21D71248 216000C0 216000C0 +000009BA 20070105 C/C++ POSIX EBCDIC HFP 4 21D71130 21D2E8BE 21D2E8BE +000000C0 20100324 LIBRARY POSIX 5 21D71030 21692F48 21692F48 +000001C4 20100324 CEL POSIX [18] Control Blocks Associated with the Thread: Thread Synchronization Queue Element (SQEL): 2160F178 +000000 2160F178 00000000 DDF18288 00000000 00000000 00000000 00000000 00000000 00000000 |.....1bh........................| +000020 2160F198 21616BB8 00000000 00000000 00000000 00000000 00000000 00000000 00000000 |./,.............................| [19] Enclave Control Blocks: Mutex and Condition Variable Blocks (MCVB+MHT+CHT): 21EA4018 +000000 21EA4018 00008F50 21EA4044 000003F8 00001FC0 00000000 21D705D0 21EA4444 000000F8 |...&.. ....8.........P.........8| +000020 21EA4038 000007C0 00000000 21D705E8 00000000 00000000 00000000 00000000 00000000 |.........P.Y....................| +000040 21EA4058 00000000 00000000 00000000 00000000 00000000 00000000 00000000 00000000 |................................|⋮ Thread Synchronization Enclave Latch Table (EPALT): 21EA4544 +000000 21EA4544 00000000 00000000 00000000 00000000 00000000 00000000 00000000 00000000 |................................| +000020 21EA4564 - +00055F 21EA4AA3 same as above +000560 21EA4AA4 00000000 00000000 00000000 00000000 A1796F08 00000000 00000000 00000000 |..................?.............| +000580 21EA4AC4 00000000 00000000 00000000 00000000 00000000 00000000 00000000 00000000 |................................| +0005A0 21EA4AE4 - +00061F 21EA4B63 same as above +000620 21EA4B64 00000000 00000000 00000000 00000000 00000000 00000000 A1796F08 00000000 |..........................?.....| +000640 21EA4B84 00000000 00000000 00000000 00000000 00000000 00000000 00000000 00000000 |................................| +000660 21EA4BA4 - +0009FF 21EA4F43 same as above Thread Synchronization Trace Block (OTRB): 21EA4000 +000000 21EA4000 21E9C000 00000018 000007FF 21E9C000 A0000000 A0000000 00008F50 21EA4044 |.Z...........Z.............&.. .| Thread Synchronization Trace Table (OTRTBL): 21E9C000 +000000 21E9C000 0000C7D3 40E2F140 21EA49E0 00000001 220C5BD8 40404040 00000000 DE9F0E88 |..GL S1 ..........$Q .......h| +000020 21E9C020 0002D9D3 40E2F240 21EA49E0 00000000 21616BB8 220C4D78 808E66C0 DE9F0E88 |..RL S2 ........./,...(........h| +000040 21E9C040 0004C7D3 40C1F140 21EA49E0 00000001 220C5BD8 220C4D78 40000001 DE9F0E88 |..GL A1 ..........$Q..(. ......h| +000060 21E9C060 0006C7D3 40E2F140 21EA49E0 00000000 21616BB8 40404040 00000000 DDF18288 |..GL S1 ........./,. .....1bh| +000080 21E9C080 0008D9D3 40E2F240 21EA49E0 00000002 220E8BD8 2160F178 808E68E0 DDF18288 |..RL S2 ...........Q.-1......1bh| +0000A0 21E9C0A0 000AC7D3 40E2F140 21EA49E0 00000002 220E8BD8 40404040 00000000 DDF18288 |..GL S1 ...........Q .....1bh| +0000C0 21E9C0C0 000CC7D3 40C1F140 21EA49E0 00000000 21616BB8 2160F178 40000201 DDF18288 |..GL A1 ........./,..-1. ....1bh| +0000E0 21E9C0E0 000ED9D3 40E2F240 21EA49E0 00000000 21616BB8 220E7D78 808E64A0 DDF18288 |..RL S2 ........./,...'......1bh| +000100 21E9C100 0010C7D3 40E2F140 21EA49E0 00000000 21616BB8 40404040 00000000 DDF18288 |..GL S1 ........./,. .....1bh| +000120 21E9C120 0012C7D3 40C1F140 21EA49E0 00000002 220E8BD8 220E7D78 40000001 DDF18288 |..GL A1 ...........Q..'. ....1bh| +000140 21E9C140 0014D9D3 40E2F240 21EA49E0 00000002 220E8BD8 2160F178 808E68E0 DDF18288 |..RL S2 ...........Q.-1......1bh| +000160 21E9C160 0016C7D3 40C1F140 21EA49E0 00000000 21616BB8 2160F178 40000201 DDF18288 |..GL A1 ........./,..-1. ....1bh| +000180 21E9C180 00000000 00000000 00000000 00000000 00000000 00000000 00000000 00000000 |................................| +0001A0 21E9C1A0 - +007FFF 21EA3FFF same as above HEAPCHK Option Control Block (HCOP): 21D6D0D0 +000000 21D6D0D0 C8C3D6D7 00000048 00000001 00000000 00000000 0000000A 0000000A AAAAAAAA |HCOP............................| +000020 21D6D0F0 2212C028 21D6D118 21EAF028 00000000 00000000 AAAAAAAA 00000400 00000000 |.....OJ...0.....................| +000040 21D6D110 00000000 00000000 C8C3C6E3 00000200 00000000 AAAAAAAA AAAAAAAA AAAAAAAA |........HCFT....................| HEAPCHK Element Table (HCEL) for Heapid 22118244 : Header: 2212C028 +000000 2212C028 C8C3C5D3 21D6E228 00000000 22118244 000001F4 00000001 00000001 00000000 |HCEL.OS.......b....4............| Address Seg Addr Length Address Seg Addr Length Table: 2212C048 +000000 2212C048 2212B020 2212B000 000002A8 22118280 00000000 00000000 00000000 00000000 |...........y..b.................| HEAPCHK Element Table (HCEL) for Heapid 00000000 : Header: 21D6E228 +000000 21D6E228 C8C3C5D3 00000000 2212C028 00000000 000001F4 00000005 00000005 00000000 |HCEL...............4............| Address Seg Addr Length Address Seg Addr Length Table: 21D6E248 +000000 21D6E248 21D91038 21D91018 00001030 21D70190 21D92068 21D91018 00000828 21D70258 |.R...R.......P...R...R.......P..| +000020 21D6E268 21D92890 21D91018 00000CD0 21D70330 21D93560 21D91018 00002030 21D70460 |.R...R.......P...R.-.R.......P.-| +000040 21D6E288 21D95590 21D91018 00000CD0 22118128 00000000 00000000 00000000 00000000 |.R...R........a.................|
Figure 32. Example of formatted output from LEDATA VERBEXIT (Part 17 of 18)
102 z/OS: z/OS Language Environment Debugging Guide
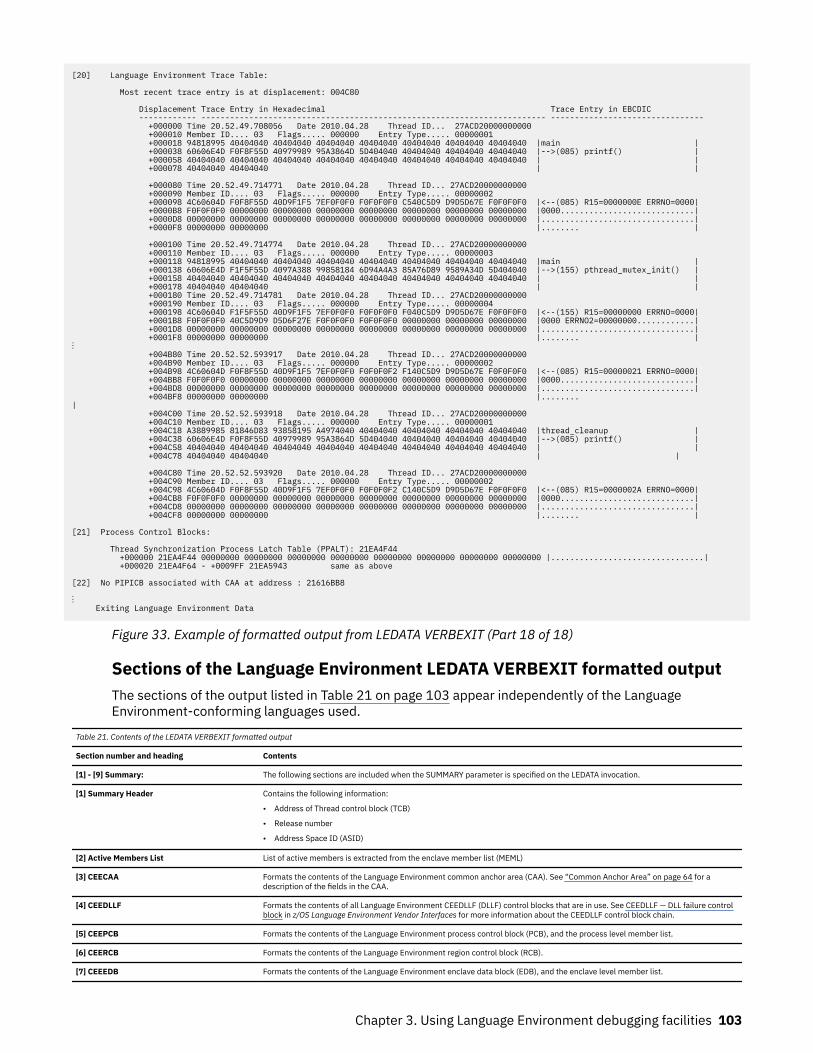
[20] Language Environment Trace Table: Most recent trace entry is at displacement: 004C80 Displacement Trace Entry in Hexadecimal Trace Entry in EBCDIC ------------ ------------------------------------------------------------------------ -------------------------------- +000000 Time 20.52.49.708056 Date 2010.04.28 Thread ID... 27ACD20000000000 +000010 Member ID.... 03 Flags..... 000000 Entry Type..... 00000001 +000018 94818995 40404040 40404040 40404040 40404040 40404040 40404040 40404040 |main | +000038 60606E4D F0F8F55D 40979989 95A3864D 5D404040 40404040 40404040 40404040 |-->(085) printf() | +000058 40404040 40404040 40404040 40404040 40404040 40404040 40404040 40404040 | | +000078 40404040 40404040 | | +000080 Time 20.52.49.714771 Date 2010.04.28 Thread ID... 27ACD20000000000 +000090 Member ID.... 03 Flags..... 000000 Entry Type..... 00000002 +000098 4C60604D F0F8F55D 40D9F1F5 7EF0F0F0 F0F0F0F0 C540C5D9 D9D5D67E F0F0F0F0 |<--(085) R15=0000000E ERRNO=0000| +0000B8 F0F0F0F0 00000000 00000000 00000000 00000000 00000000 00000000 00000000 |0000............................| +0000D8 00000000 00000000 00000000 00000000 00000000 00000000 00000000 00000000 |................................| +0000F8 00000000 00000000 |........ | +000100 Time 20.52.49.714774 Date 2010.04.28 Thread ID... 27ACD20000000000 +000110 Member ID.... 03 Flags..... 000000 Entry Type..... 00000003 +000118 94818995 40404040 40404040 40404040 40404040 40404040 40404040 40404040 |main | +000138 60606E4D F1F5F55D 4097A388 99858184 6D94A4A3 85A76D89 9589A34D 5D404040 |-->(155) pthread_mutex_init() | +000158 40404040 40404040 40404040 40404040 40404040 40404040 40404040 40404040 | | +000178 40404040 40404040 | | +000180 Time 20.52.49.714781 Date 2010.04.28 Thread ID... 27ACD20000000000 +000190 Member ID.... 03 Flags..... 000000 Entry Type..... 00000004 +000198 4C60604D F1F5F55D 40D9F1F5 7EF0F0F0 F0F0F0F0 F040C5D9 D9D5D67E F0F0F0F0 |<--(155) R15=00000000 ERRNO=0000| +0001B8 F0F0F0F0 40C5D9D9 D5D6F27E F0F0F0F0 F0F0F0F0 00000000 00000000 00000000 |0000 ERRNO2=00000000............| +0001D8 00000000 00000000 00000000 00000000 00000000 00000000 00000000 00000000 |................................| +0001F8 00000000 00000000 |........ |⋮ +004B80 Time 20.52.52.593917 Date 2010.04.28 Thread ID... 27ACD20000000000 +004B90 Member ID.... 03 Flags..... 000000 Entry Type..... 00000002 +004B98 4C60604D F0F8F55D 40D9F1F5 7EF0F0F0 F0F0F0F2 F140C5D9 D9D5D67E F0F0F0F0 |<--(085) R15=00000021 ERRNO=0000| +004BB8 F0F0F0F0 00000000 00000000 00000000 00000000 00000000 00000000 00000000 |0000............................| +004BD8 00000000 00000000 00000000 00000000 00000000 00000000 00000000 00000000 |................................| +004BF8 00000000 00000000 |........ | +004C00 Time 20.52.52.593918 Date 2010.04.28 Thread ID... 27ACD20000000000 +004C10 Member ID.... 03 Flags..... 000000 Entry Type..... 00000001 +004C18 A3889985 81846D83 93858195 A4974040 40404040 40404040 40404040 40404040 |thread_cleanup | +004C38 60606E4D F0F8F55D 40979989 95A3864D 5D404040 40404040 40404040 40404040 |-->(085) printf() | +004C58 40404040 40404040 40404040 40404040 40404040 40404040 40404040 40404040 | | +004C78 40404040 40404040 | | +004C80 Time 20.52.52.593920 Date 2010.04.28 Thread ID... 27ACD20000000000 +004C90 Member ID.... 03 Flags..... 000000 Entry Type..... 00000002 +004C98 4C60604D F0F8F55D 40D9F1F5 7EF0F0F0 F0F0F0F2 C140C5D9 D9D5D67E F0F0F0F0 |<--(085) R15=0000002A ERRNO=0000| +004CB8 F0F0F0F0 00000000 00000000 00000000 00000000 00000000 00000000 00000000 |0000............................| +004CD8 00000000 00000000 00000000 00000000 00000000 00000000 00000000 00000000 |................................| +004CF8 00000000 00000000 |........ | [21] Process Control Blocks: Thread Synchronization Process Latch Table (PPALT): 21EA4F44 +000000 21EA4F44 00000000 00000000 00000000 00000000 00000000 00000000 00000000 00000000 |................................| +000020 21EA4F64 - +0009FF 21EA5943 same as above [22] No PIPICB associated with CAA at address : 21616BB8 ⋮ Exiting Language Environment Data
Figure 33. Example of formatted output from LEDATA VERBEXIT (Part 18 of 18)
Sections of the Language Environment LEDATA VERBEXIT formatted outputThe sections of the output listed in Table 21 on page 103 appear independently of the LanguageEnvironment-conforming languages used.
Table 21. Contents of the LEDATA VERBEXIT formatted output
Section number and heading Contents
[1] - [9] Summary: The following sections are included when the SUMMARY parameter is specified on the LEDATA invocation.
[1] Summary Header Contains the following information:
• Address of Thread control block (TCB)
• Release number
• Address Space ID (ASID)
[2] Active Members List List of active members is extracted from the enclave member list (MEML)
[3] CEECAA Formats the contents of the Language Environment common anchor area (CAA). See “Common Anchor Area” on page 64 for adescription of the fields in the CAA.
[4] CEEDLLF Formats the contents of all Language Environment CEEDLLF (DLLF) control blocks that are in use. See CEEDLLF — DLL failure controlblock in z/OS Language Environment Vendor Interfaces for more information about the CEEDLLF control block chain.
[5] CEEPCB Formats the contents of the Language Environment process control block (PCB), and the process level member list.
[6] CEERCB Formats the contents of the Language Environment region control block (RCB).
[7] CEEEDB Formats the contents of the Language Environment enclave data block (EDB), and the enclave level member list.
Chapter 3. Using Language Environment debugging facilities 103
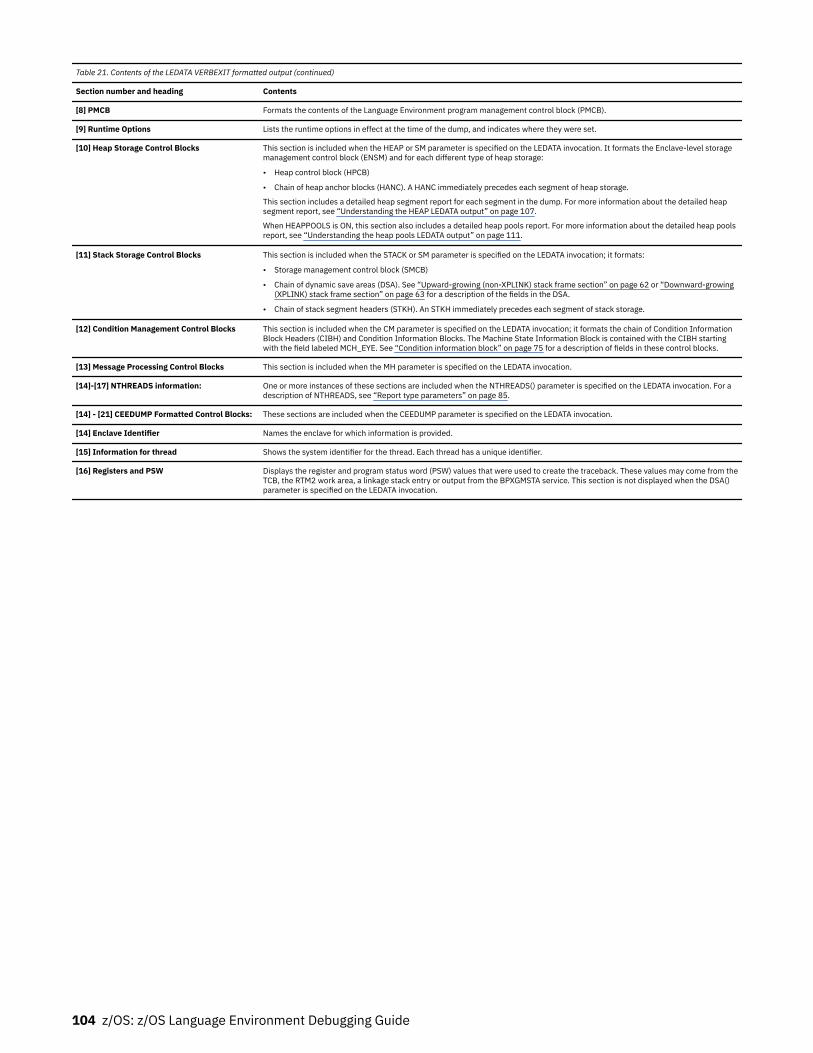
Table 21. Contents of the LEDATA VERBEXIT formatted output (continued)
Section number and heading Contents
[8] PMCB Formats the contents of the Language Environment program management control block (PMCB).
[9] Runtime Options Lists the runtime options in effect at the time of the dump, and indicates where they were set.
[10] Heap Storage Control Blocks This section is included when the HEAP or SM parameter is specified on the LEDATA invocation. It formats the Enclave-level storagemanagement control block (ENSM) and for each different type of heap storage:
• Heap control block (HPCB)
• Chain of heap anchor blocks (HANC). A HANC immediately precedes each segment of heap storage.
This section includes a detailed heap segment report for each segment in the dump. For more information about the detailed heapsegment report, see “Understanding the HEAP LEDATA output” on page 107.
When HEAPPOOLS is ON, this section also includes a detailed heap pools report. For more information about the detailed heap poolsreport, see “Understanding the heap pools LEDATA output” on page 111.
[11] Stack Storage Control Blocks This section is included when the STACK or SM parameter is specified on the LEDATA invocation; it formats:
• Storage management control block (SMCB)
• Chain of dynamic save areas (DSA). See “Upward-growing (non-XPLINK) stack frame section” on page 62 or “Downward-growing(XPLINK) stack frame section” on page 63 for a description of the fields in the DSA.
• Chain of stack segment headers (STKH). An STKH immediately precedes each segment of stack storage.
[12] Condition Management Control Blocks This section is included when the CM parameter is specified on the LEDATA invocation; it formats the chain of Condition InformationBlock Headers (CIBH) and Condition Information Blocks. The Machine State Information Block is contained with the CIBH startingwith the field labeled MCH_EYE. See “Condition information block” on page 75 for a description of fields in these control blocks.
[13] Message Processing Control Blocks This section is included when the MH parameter is specified on the LEDATA invocation.
[14]-[17] NTHREADS information: One or more instances of these sections are included when the NTHREADS() parameter is specified on the LEDATA invocation. For adescription of NTHREADS, see “Report type parameters” on page 85.
[14] - [21] CEEDUMP Formatted Control Blocks: These sections are included when the CEEDUMP parameter is specified on the LEDATA invocation.
[14] Enclave Identifier Names the enclave for which information is provided.
[15] Information for thread Shows the system identifier for the thread. Each thread has a unique identifier.
[16] Registers and PSW Displays the register and program status word (PSW) values that were used to create the traceback. These values may come from theTCB, the RTM2 work area, a linkage stack entry or output from the BPXGMSTA service. This section is not displayed when the DSA()parameter is specified on the LEDATA invocation.
104 z/OS: z/OS Language Environment Debugging Guide
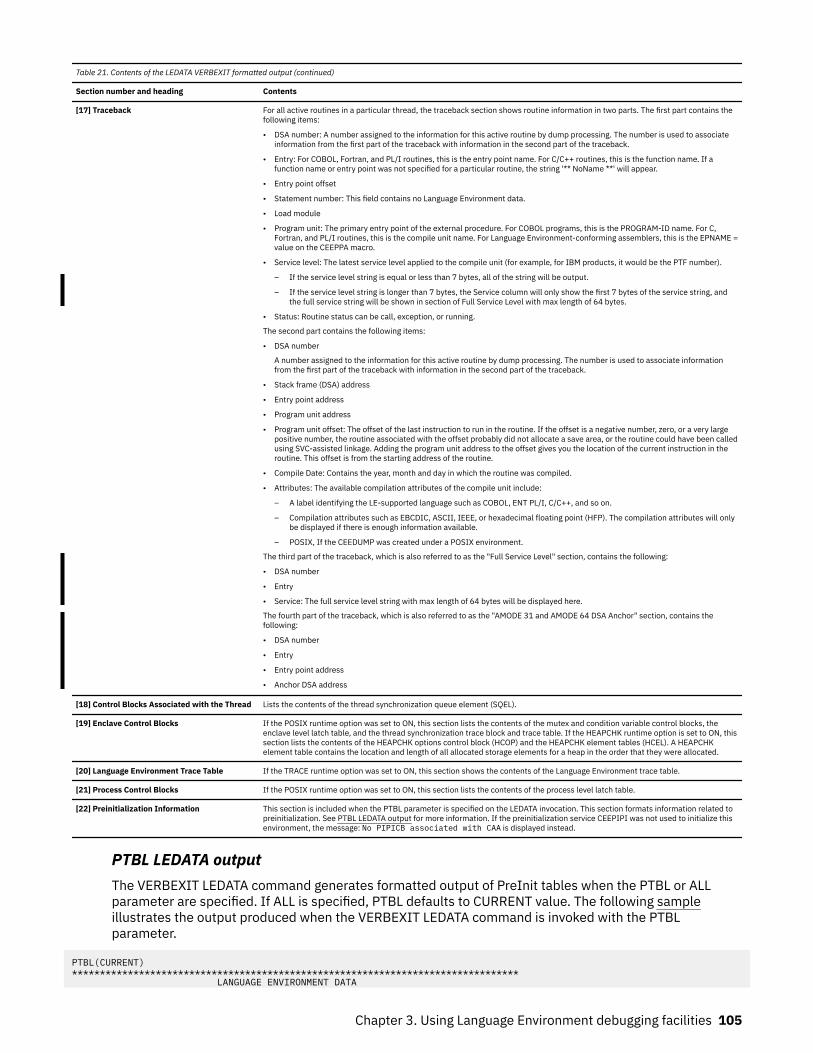
Table 21. Contents of the LEDATA VERBEXIT formatted output (continued)
Section number and heading Contents
[17] Traceback For all active routines in a particular thread, the traceback section shows routine information in two parts. The first part contains thefollowing items:
• DSA number: A number assigned to the information for this active routine by dump processing. The number is used to associateinformation from the first part of the traceback with information in the second part of the traceback.
• Entry: For COBOL, Fortran, and PL/I routines, this is the entry point name. For C/C++ routines, this is the function name. If afunction name or entry point was not specified for a particular routine, the string '** NoName **' will appear.
• Entry point offset
• Statement number: This field contains no Language Environment data.
• Load module
• Program unit: The primary entry point of the external procedure. For COBOL programs, this is the PROGRAM-ID name. For C,Fortran, and PL/I routines, this is the compile unit name. For Language Environment-conforming assemblers, this is the EPNAME =value on the CEEPPA macro.
• Service level: The latest service level applied to the compile unit (for example, for IBM products, it would be the PTF number).
– If the service level string is equal or less than 7 bytes, all of the string will be output.
– If the service level string is longer than 7 bytes, the Service column will only show the first 7 bytes of the service string, andthe full service string will be shown in section of Full Service Level with max length of 64 bytes.
• Status: Routine status can be call, exception, or running.
The second part contains the following items:
• DSA number
A number assigned to the information for this active routine by dump processing. The number is used to associate informationfrom the first part of the traceback with information in the second part of the traceback.
• Stack frame (DSA) address
• Entry point address
• Program unit address
• Program unit offset: The offset of the last instruction to run in the routine. If the offset is a negative number, zero, or a very largepositive number, the routine associated with the offset probably did not allocate a save area, or the routine could have been calledusing SVC-assisted linkage. Adding the program unit address to the offset gives you the location of the current instruction in theroutine. This offset is from the starting address of the routine.
• Compile Date: Contains the year, month and day in which the routine was compiled.
• Attributes: The available compilation attributes of the compile unit include:
– A label identifying the LE-supported language such as COBOL, ENT PL/I, C/C++, and so on.
– Compilation attributes such as EBCDIC, ASCII, IEEE, or hexadecimal floating point (HFP). The compilation attributes will onlybe displayed if there is enough information available.
– POSIX, If the CEEDUMP was created under a POSIX environment.
The third part of the traceback, which is also referred to as the "Full Service Level" section, contains the following:
• DSA number
• Entry
• Service: The full service level string with max length of 64 bytes will be displayed here.
The fourth part of the traceback, which is also referred to as the "AMODE 31 and AMODE 64 DSA Anchor" section, contains thefollowing:
• DSA number
• Entry
• Entry point address
• Anchor DSA address
[18] Control Blocks Associated with the Thread Lists the contents of the thread synchronization queue element (SQEL).
[19] Enclave Control Blocks If the POSIX runtime option was set to ON, this section lists the contents of the mutex and condition variable control blocks, theenclave level latch table, and the thread synchronization trace block and trace table. If the HEAPCHK runtime option is set to ON, thissection lists the contents of the HEAPCHK options control block (HCOP) and the HEAPCHK element tables (HCEL). A HEAPCHKelement table contains the location and length of all allocated storage elements for a heap in the order that they were allocated.
[20] Language Environment Trace Table If the TRACE runtime option was set to ON, this section shows the contents of the Language Environment trace table.
[21] Process Control Blocks If the POSIX runtime option was set to ON, this section lists the contents of the process level latch table.
[22] Preinitialization Information This section is included when the PTBL parameter is specified on the LEDATA invocation. This section formats information related topreinitialization. See PTBL LEDATA output for more information. If the preinitialization service CEEPIPI was not used to initialize thisenvironment, the message: No PIPICB associated with CAA is displayed instead.
PTBL LEDATA outputThe VERBEXIT LEDATA command generates formatted output of PreInit tables when the PTBL or ALLparameter are specified. If ALL is specified, PTBL defaults to CURRENT value. The following sampleillustrates the output produced when the VERBEXIT LEDATA command is invoked with the PTBLparameter.
PTBL(CURRENT) ******************************************************************************** LANGUAGE ENVIRONMENT DATA
Chapter 3. Using Language Environment debugging facilities 105
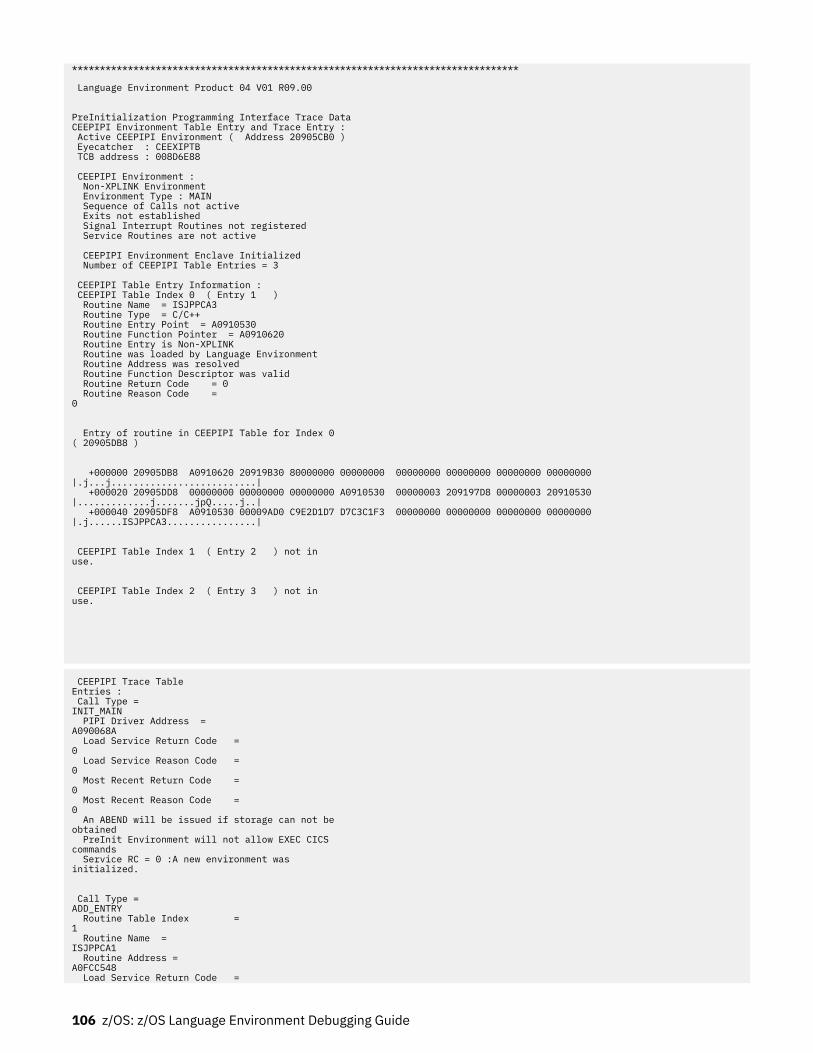
******************************************************************************** Language Environment Product 04 V01 R09.00 PreInitialization Programming Interface Trace Data CEEPIPI Environment Table Entry and Trace Entry : Active CEEPIPI Environment ( Address 20905CB0 ) Eyecatcher : CEEXIPTB TCB address : 008D6E88 CEEPIPI Environment : Non-XPLINK Environment Environment Type : MAIN Sequence of Calls not active Exits not established Signal Interrupt Routines not registered Service Routines are not active CEEPIPI Environment Enclave Initialized Number of CEEPIPI Table Entries = 3 CEEPIPI Table Entry Information : CEEPIPI Table Index 0 ( Entry 1 ) Routine Name = ISJPPCA3 Routine Type = C/C++ Routine Entry Point = A0910530 Routine Function Pointer = A0910620 Routine Entry is Non-XPLINK Routine was loaded by Language Environment Routine Address was resolved Routine Function Descriptor was valid Routine Return Code = 0 Routine Reason Code = 0 Entry of routine in CEEPIPI Table for Index 0 ( 20905DB8 ) +000000 20905DB8 A0910620 20919B30 80000000 00000000 00000000 00000000 00000000 00000000 |.j...j..........................| +000020 20905DD8 00000000 00000000 00000000 A0910530 00000003 209197D8 00000003 20910530 |.............j.......jpQ.....j..| +000040 20905DF8 A0910530 00009AD0 C9E2D1D7 D7C3C1F3 00000000 00000000 00000000 00000000 |.j......ISJPPCA3................| CEEPIPI Table Index 1 ( Entry 2 ) not in use. CEEPIPI Table Index 2 ( Entry 3 ) not in use.
CEEPIPI Trace Table Entries : Call Type = INIT_MAIN PIPI Driver Address = A090068A Load Service Return Code = 0 Load Service Reason Code = 0 Most Recent Return Code = 0 Most Recent Reason Code = 0 An ABEND will be issued if storage can not be obtained PreInit Environment will not allow EXEC CICS commands Service RC = 0 :A new environment was initialized. Call Type = ADD_ENTRY Routine Table Index = 1 Routine Name = ISJPPCA1 Routine Address = A0FCC548 Load Service Return Code =
106 z/OS: z/OS Language Environment Debugging Guide
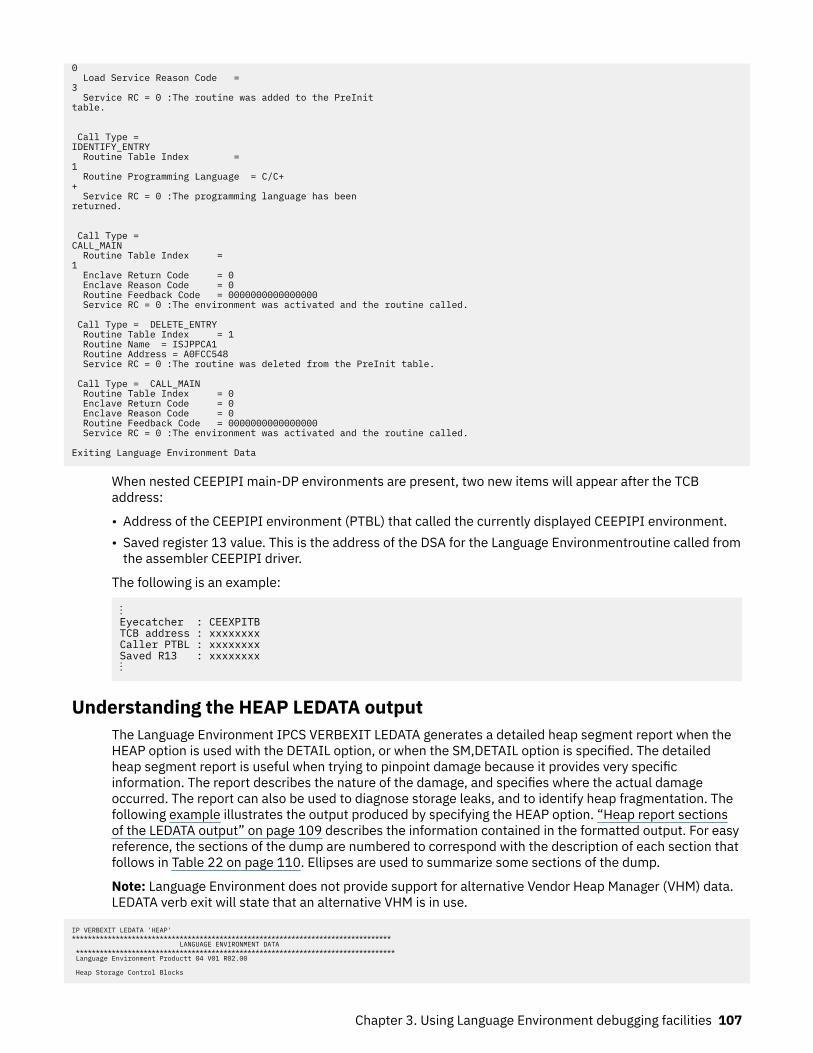
0 Load Service Reason Code = 3 Service RC = 0 :The routine was added to the PreInit table. Call Type = IDENTIFY_ENTRY Routine Table Index = 1 Routine Programming Language = C/C++ Service RC = 0 :The programming language has been returned. Call Type = CALL_MAIN Routine Table Index = 1 Enclave Return Code = 0 Enclave Reason Code = 0 Routine Feedback Code = 0000000000000000 Service RC = 0 :The environment was activated and the routine called. Call Type = DELETE_ENTRY Routine Table Index = 1 Routine Name = ISJPPCA1 Routine Address = A0FCC548 Service RC = 0 :The routine was deleted from the PreInit table. Call Type = CALL_MAIN Routine Table Index = 0 Enclave Return Code = 0 Enclave Reason Code = 0 Routine Feedback Code = 0000000000000000 Service RC = 0 :The environment was activated and the routine called. Exiting Language Environment Data
When nested CEEPIPI main-DP environments are present, two new items will appear after the TCBaddress:
• Address of the CEEPIPI environment (PTBL) that called the currently displayed CEEPIPI environment.• Saved register 13 value. This is the address of the DSA for the Language Environmentroutine called from
the assembler CEEPIPI driver.
The following is an example:
⋮Eyecatcher : CEEXPITBTCB address : xxxxxxxxCaller PTBL : xxxxxxxxSaved R13 : xxxxxxxx ⋮
Understanding the HEAP LEDATA outputThe Language Environment IPCS VERBEXIT LEDATA generates a detailed heap segment report when theHEAP option is used with the DETAIL option, or when the SM,DETAIL option is specified. The detailedheap segment report is useful when trying to pinpoint damage because it provides very specificinformation. The report describes the nature of the damage, and specifies where the actual damageoccurred. The report can also be used to diagnose storage leaks, and to identify heap fragmentation. Thefollowing example illustrates the output produced by specifying the HEAP option. “Heap report sectionsof the LEDATA output” on page 109 describes the information contained in the formatted output. For easyreference, the sections of the dump are numbered to correspond with the description of each section thatfollows in Table 22 on page 110. Ellipses are used to summarize some sections of the dump.
Note: Language Environment does not provide support for alternative Vendor Heap Manager (VHM) data.LEDATA verb exit will state that an alternative VHM is in use.
IP VERBEXIT LEDATA 'HEAP'******************************************************************************** LANGUAGE ENVIRONMENT DATA ******************************************************************************** Language Environment Productt 04 V01 R02.00
Heap Storage Control Blocks
Chapter 3. Using Language Environment debugging facilities 107
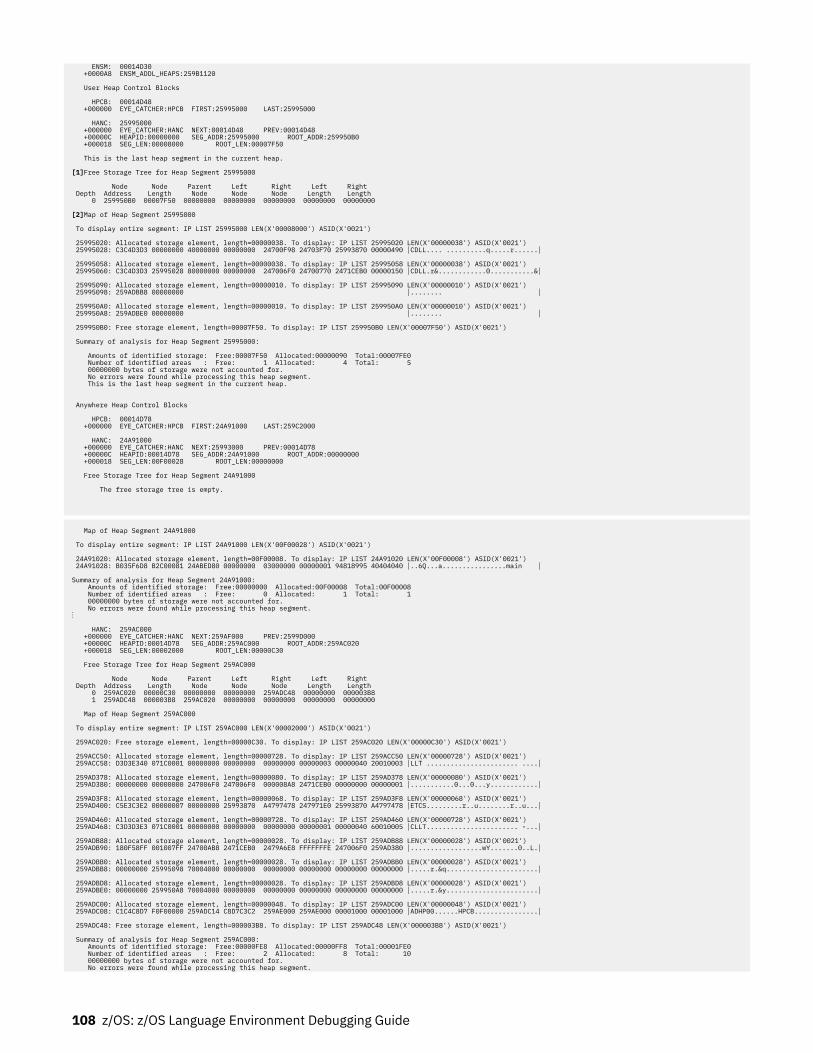
ENSM: 00014D30 +0000A8 ENSM_ADDL_HEAPS:259B1120
User Heap Control Blocks
HPCB: 00014D48 +000000 EYE_CATCHER:HPCB FIRST:25995000 LAST:25995000
HANC: 25995000 +000000 EYE_CATCHER:HANC NEXT:00014D48 PREV:00014D48 +00000C HEAPID:00000000 SEG_ADDR:25995000 ROOT_ADDR:259950B0 +000018 SEG_LEN:00008000 ROOT_LEN:00007F50
This is the last heap segment in the current heap.
[1]Free Storage Tree for Heap Segment 25995000
Node Node Parent Left Right Left Right Depth Address Length Node Node Node Length Length 0 259950B0 00007F50 00000000 00000000 00000000 00000000 00000000
[2]Map of Heap Segment 25995000
To display entire segment: IP LIST 25995000 LEN(X'00008000') ASID(X'0021')
25995020: Allocated storage element, length=00000038. To display: IP LIST 25995020 LEN(X'00000038') ASID(X'0021') 25995028: C3C4D3D3 00000000 40000000 00000000 24700F98 24703F70 25993870 00000490 │CDLL.... ..........q.....r......│
25995058: Allocated storage element, length=00000038. To display: IP LIST 25995058 LEN(X'00000038') ASID(X'0021') 25995060: C3C4D3D3 25995028 80000000 00000000 247006F0 24700770 2471CEB0 00000150 │CDLL.r&............0...........&│
25995090: Allocated storage element, length=00000010. To display: IP LIST 25995090 LEN(X'00000010') ASID(X'0021') 25995098: 259ADBB8 00000000 │........ │
259950A0: Allocated storage element, length=00000010. To display: IP LIST 259950A0 LEN(X'00000010') ASID(X'0021') 259950A8: 259ADBE0 00000000 │........ │
259950B0: Free storage element, length=00007F50. To display: IP LIST 259950B0 LEN(X'00007F50') ASID(X'0021')
Summary of analysis for Heap Segment 25995000:
Amounts of identified storage: Free:00007F50 Allocated:00000090 Total:00007FE0 Number of identified areas : Free: 1 Allocated: 4 Total: 5 00000000 bytes of storage were not accounted for. No errors were found while processing this heap segment. This is the last heap segment in the current heap.
Anywhere Heap Control Blocks
HPCB: 00014D78 +000000 EYE_CATCHER:HPCB FIRST:24A91000 LAST:259C2000
HANC: 24A91000 +000000 EYE_CATCHER:HANC NEXT:25993000 PREV:00014D78 +00000C HEAPID:00014D78 SEG_ADDR:24A91000 ROOT_ADDR:00000000 +000018 SEG_LEN:00F00028 ROOT_LEN:00000000
Free Storage Tree for Heap Segment 24A91000
The free storage tree is empty.
Map of Heap Segment 24A91000
To display entire segment: IP LIST 24A91000 LEN(X'00F00028') ASID(X'0021')
24A91020: Allocated storage element, length=00F00008. To display: IP LIST 24A91020 LEN(X'00F00008') ASID(X'0021') 24A91028: B035F6D8 B2C00081 24ABED80 00000000 03000000 00000001 94818995 40404040 │..6Q...a................main │
Summary of analysis for Heap Segment 24A91000: Amounts of identified storage: Free:00000000 Allocated:00F00008 Total:00F00008 Number of identified areas : Free: 0 Allocated: 1 Total: 1 00000000 bytes of storage were not accounted for. No errors were found while processing this heap segment.⋮
HANC: 259AC000 +000000 EYE_CATCHER:HANC NEXT:259AF000 PREV:2599D000 +00000C HEAPID:00014D78 SEG_ADDR:259AC000 ROOT_ADDR:259AC020 +000018 SEG_LEN:00002000 ROOT_LEN:00000C30
Free Storage Tree for Heap Segment 259AC000
Node Node Parent Left Right Left Right Depth Address Length Node Node Node Length Length 0 259AC020 00000C30 00000000 00000000 259ADC48 00000000 000003B8 1 259ADC48 000003B8 259AC020 00000000 00000000 00000000 00000000
Map of Heap Segment 259AC000
To display entire segment: IP LIST 259AC000 LEN(X'00002000') ASID(X'0021')
259AC020: Free storage element, length=00000C30. To display: IP LIST 259AC020 LEN(X'00000C30') ASID(X'0021')
259ACC50: Allocated storage element, length=00000728. To display: IP LIST 259ACC50 LEN(X'00000728') ASID(X'0021') 259ACC58: D3D3E340 071C0001 00000000 00000000 00000000 00000003 00000040 20010003 │LLT ....................... ....│
259AD378: Allocated storage element, length=00000080. To display: IP LIST 259AD378 LEN(X'00000080') ASID(X'0021') 259AD380: 00000000 00000000 247006F0 247006F0 000008A8 2471CEB0 00000000 00000001 │...........0...0...y............│
259AD3F8: Allocated storage element, length=00000068. To display: IP LIST 259AD3F8 LEN(X'00000068') ASID(X'0021') 259AD400: C5E3C3E2 00000007 00000000 25993870 A4797478 247971E0 25993870 A4797478 │ETCS.........r..u........r..u...│
259AD460: Allocated storage element, length=00000728. To display: IP LIST 259AD460 LEN(X'00000728') ASID(X'0021') 259AD468: C3D3D3E3 071C0001 00000000 00000000 00000000 00000001 00000040 60010005 │CLLT....................... -...│
259ADB88: Allocated storage element, length=00000028. To display: IP LIST 259ADB88 LEN(X'00000028') ASID(X'0021') 259ADB90: 180F58FF 001007FF 24700AB8 2471CEB0 2479A6E8 FFFFFFFE 247006F0 259AD380 │..................wY.......0..L.│
259ADBB0: Allocated storage element, length=00000028. To display: IP LIST 259ADBB0 LEN(X'00000028') ASID(X'0021') 259ADBB8: 00000000 25995098 70004000 00000000 00000000 00000000 00000000 00000000 │.....r.&q.......................│
259ADBD8: Allocated storage element, length=00000028. To display: IP LIST 259ADBD8 LEN(X'00000028') ASID(X'0021') 259ADBE0: 00000000 259950A8 70004000 00000000 00000000 00000000 00000000 00000000 │.....r.&y.......................│
259ADC00: Allocated storage element, length=00000048. To display: IP LIST 259ADC00 LEN(X'00000048') ASID(X'0021') 259ADC08: C1C4C8D7 F0F00000 259ADC14 C8D7C3C2 259AE000 259AE000 00001000 00001000 │ADHP00......HPCB................│
259ADC48: Free storage element, length=000003B8. To display: IP LIST 259ADC48 LEN(X'000003B8') ASID(X'0021')
Summary of analysis for Heap Segment 259AC000: Amounts of identified storage: Free:00000FE8 Allocated:00000FF8 Total:00001FE0 Number of identified areas : Free: 2 Allocated: 8 Total: 10 00000000 bytes of storage were not accounted for. No errors were found while processing this heap segment.
108 z/OS: z/OS Language Environment Debugging Guide
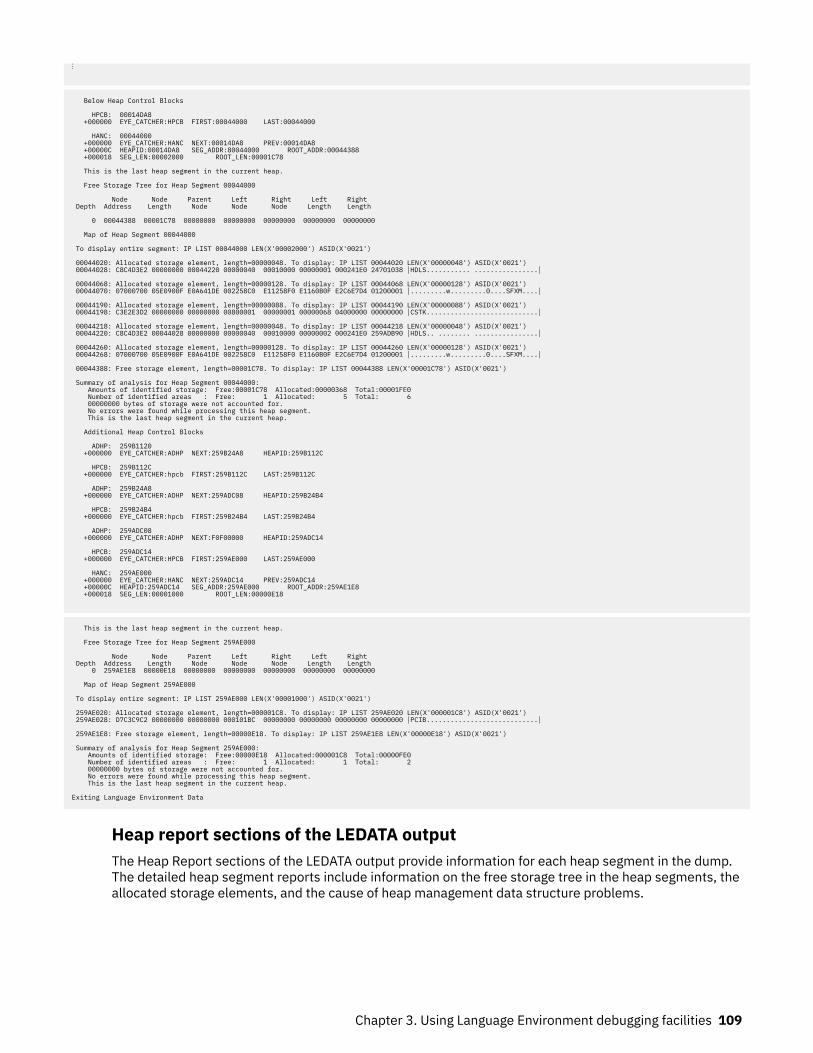
⋮
Below Heap Control Blocks
HPCB: 00014DA8 +000000 EYE_CATCHER:HPCB FIRST:00044000 LAST:00044000
HANC: 00044000 +000000 EYE_CATCHER:HANC NEXT:00014DA8 PREV:00014DA8 +00000C HEAPID:00014DA8 SEG_ADDR:80044000 ROOT_ADDR:00044388 +000018 SEG_LEN:00002000 ROOT_LEN:00001C78
This is the last heap segment in the current heap.
Free Storage Tree for Heap Segment 00044000
Node Node Parent Left Right Left Right Depth Address Length Node Node Node Length Length
0 00044388 00001C78 00000000 00000000 00000000 00000000 00000000
Map of Heap Segment 00044000
To display entire segment: IP LIST 00044000 LEN(X'00002000') ASID(X'0021')
00044020: Allocated storage element, length=00000048. To display: IP LIST 00044020 LEN(X'00000048') ASID(X'0021') 00044028: C8C4D3E2 00000000 00044220 00000040 00010000 00000001 000241E0 24701038 │HDLS........... ................│
00044068: Allocated storage element, length=00000128. To display: IP LIST 00044068 LEN(X'00000128') ASID(X'0021') 00044070: 07000700 05E0900F E0A641DE 002258C0 E11258F0 E1160B0F E2C6E7D4 01200001 │.........w.........0....SFXM....│
00044190: Allocated storage element, length=00000088. To display: IP LIST 00044190 LEN(X'00000088') ASID(X'0021') 00044198: C3E2E3D2 00000000 00000000 00800001 00000001 00000068 04000000 00000000 │CSTK............................│
00044218: Allocated storage element, length=00000048. To display: IP LIST 00044218 LEN(X'00000048') ASID(X'0021') 00044220: C8C4D3E2 00044028 00000000 00000040 00010000 00000002 000241E0 259ADB90 │HDLS.. ........ ................│
00044260: Allocated storage element, length=00000128. To display: IP LIST 00044260 LEN(X'00000128') ASID(X'0021') 00044268: 07000700 05E0900F E0A641DE 002258C0 E11258F0 E1160B0F E2C6E7D4 01200001 │.........w.........0....SFXM....│
00044388: Free storage element, length=00001C78. To display: IP LIST 00044388 LEN(X'00001C78') ASID(X'0021')
Summary of analysis for Heap Segment 00044000: Amounts of identified storage: Free:00001C78 Allocated:00000368 Total:00001FE0 Number of identified areas : Free: 1 Allocated: 5 Total: 6 00000000 bytes of storage were not accounted for. No errors were found while processing this heap segment. This is the last heap segment in the current heap.
Additional Heap Control Blocks
ADHP: 259B1120 +000000 EYE_CATCHER:ADHP NEXT:259B24A8 HEAPID:259B112C
HPCB: 259B112C +000000 EYE_CATCHER:hpcb FIRST:259B112C LAST:259B112C
ADHP: 259B24A8 +000000 EYE_CATCHER:ADHP NEXT:259ADC08 HEAPID:259B24B4
HPCB: 259B24B4 +000000 EYE_CATCHER:hpcb FIRST:259B24B4 LAST:259B24B4
ADHP: 259ADC08 +000000 EYE_CATCHER:ADHP NEXT:F0F00000 HEAPID:259ADC14
HPCB: 259ADC14 +000000 EYE_CATCHER:HPCB FIRST:259AE000 LAST:259AE000
HANC: 259AE000 +000000 EYE_CATCHER:HANC NEXT:259ADC14 PREV:259ADC14 +00000C HEAPID:259ADC14 SEG_ADDR:259AE000 ROOT_ADDR:259AE1E8 +000018 SEG_LEN:00001000 ROOT_LEN:00000E18
This is the last heap segment in the current heap.
Free Storage Tree for Heap Segment 259AE000
Node Node Parent Left Right Left Right Depth Address Length Node Node Node Length Length 0 259AE1E8 00000E18 00000000 00000000 00000000 00000000 00000000
Map of Heap Segment 259AE000
To display entire segment: IP LIST 259AE000 LEN(X'00001000') ASID(X'0021')
259AE020: Allocated storage element, length=000001C8. To display: IP LIST 259AE020 LEN(X'000001C8') ASID(X'0021') 259AE028: D7C3C9C2 00000000 00000000 000101BC 00000000 00000000 00000000 00000000 │PCIB............................│
259AE1E8: Free storage element, length=00000E18. To display: IP LIST 259AE1E8 LEN(X'00000E18') ASID(X'0021')
Summary of analysis for Heap Segment 259AE000: Amounts of identified storage: Free:00000E18 Allocated:000001C8 Total:00000FE0 Number of identified areas : Free: 1 Allocated: 1 Total: 2 00000000 bytes of storage were not accounted for. No errors were found while processing this heap segment. This is the last heap segment in the current heap.
Exiting Language Environment Data
Heap report sections of the LEDATA outputThe Heap Report sections of the LEDATA output provide information for each heap segment in the dump.The detailed heap segment reports include information on the free storage tree in the heap segments, theallocated storage elements, and the cause of heap management data structure problems.
Chapter 3. Using Language Environment debugging facilities 109
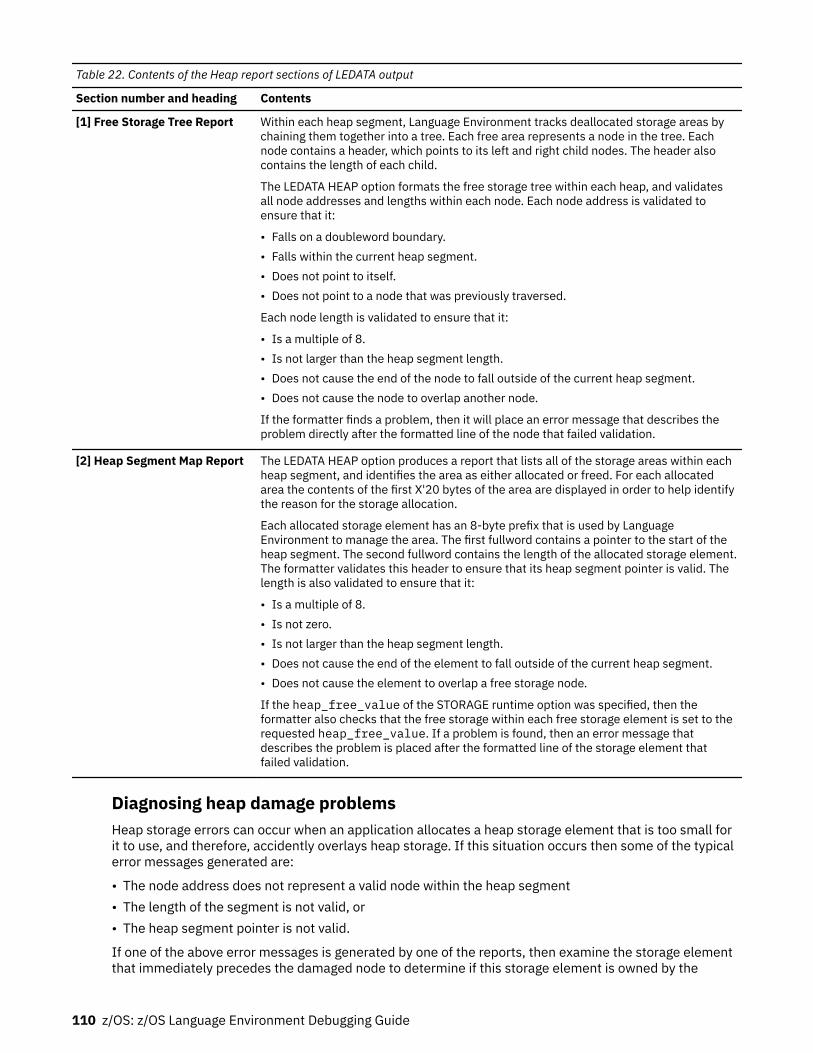
Table 22. Contents of the Heap report sections of LEDATA output
Section number and heading Contents
[1] Free Storage Tree Report Within each heap segment, Language Environment tracks deallocated storage areas bychaining them together into a tree. Each free area represents a node in the tree. Eachnode contains a header, which points to its left and right child nodes. The header alsocontains the length of each child.
The LEDATA HEAP option formats the free storage tree within each heap, and validatesall node addresses and lengths within each node. Each node address is validated toensure that it:
• Falls on a doubleword boundary.• Falls within the current heap segment.• Does not point to itself.• Does not point to a node that was previously traversed.
Each node length is validated to ensure that it:
• Is a multiple of 8.• Is not larger than the heap segment length.• Does not cause the end of the node to fall outside of the current heap segment.• Does not cause the node to overlap another node.
If the formatter finds a problem, then it will place an error message that describes theproblem directly after the formatted line of the node that failed validation.
[2] Heap Segment Map Report The LEDATA HEAP option produces a report that lists all of the storage areas within eachheap segment, and identifies the area as either allocated or freed. For each allocatedarea the contents of the first X'20 bytes of the area are displayed in order to help identifythe reason for the storage allocation.
Each allocated storage element has an 8-byte prefix that is used by LanguageEnvironment to manage the area. The first fullword contains a pointer to the start of theheap segment. The second fullword contains the length of the allocated storage element.The formatter validates this header to ensure that its heap segment pointer is valid. Thelength is also validated to ensure that it:
• Is a multiple of 8.• Is not zero.• Is not larger than the heap segment length.• Does not cause the end of the element to fall outside of the current heap segment.• Does not cause the element to overlap a free storage node.
If the heap_free_value of the STORAGE runtime option was specified, then theformatter also checks that the free storage within each free storage element is set to therequested heap_free_value. If a problem is found, then an error message thatdescribes the problem is placed after the formatted line of the storage element thatfailed validation.
Diagnosing heap damage problemsHeap storage errors can occur when an application allocates a heap storage element that is too small forit to use, and therefore, accidently overlays heap storage. If this situation occurs then some of the typicalerror messages generated are:
• The node address does not represent a valid node within the heap segment• The length of the segment is not valid, or• The heap segment pointer is not valid.
If one of the above error messages is generated by one of the reports, then examine the storage elementthat immediately precedes the damaged node to determine if this storage element is owned by the
110 z/OS: z/OS Language Environment Debugging Guide
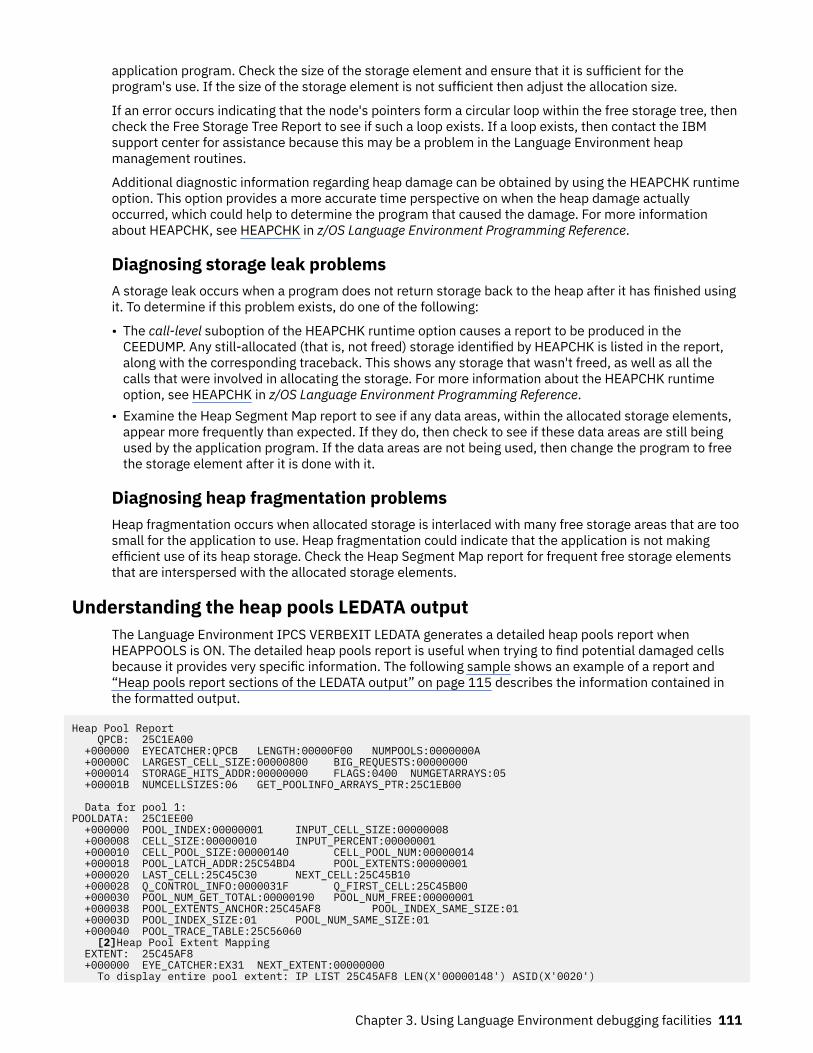
application program. Check the size of the storage element and ensure that it is sufficient for theprogram's use. If the size of the storage element is not sufficient then adjust the allocation size.
If an error occurs indicating that the node's pointers form a circular loop within the free storage tree, thencheck the Free Storage Tree Report to see if such a loop exists. If a loop exists, then contact the IBMsupport center for assistance because this may be a problem in the Language Environment heapmanagement routines.
Additional diagnostic information regarding heap damage can be obtained by using the HEAPCHK runtimeoption. This option provides a more accurate time perspective on when the heap damage actuallyoccurred, which could help to determine the program that caused the damage. For more informationabout HEAPCHK, see HEAPCHK in z/OS Language Environment Programming Reference.
Diagnosing storage leak problemsA storage leak occurs when a program does not return storage back to the heap after it has finished usingit. To determine if this problem exists, do one of the following:
• The call-level suboption of the HEAPCHK runtime option causes a report to be produced in theCEEDUMP. Any still-allocated (that is, not freed) storage identified by HEAPCHK is listed in the report,along with the corresponding traceback. This shows any storage that wasn't freed, as well as all thecalls that were involved in allocating the storage. For more information about the HEAPCHK runtimeoption, see HEAPCHK in z/OS Language Environment Programming Reference.
• Examine the Heap Segment Map report to see if any data areas, within the allocated storage elements,appear more frequently than expected. If they do, then check to see if these data areas are still beingused by the application program. If the data areas are not being used, then change the program to freethe storage element after it is done with it.
Diagnosing heap fragmentation problemsHeap fragmentation occurs when allocated storage is interlaced with many free storage areas that are toosmall for the application to use. Heap fragmentation could indicate that the application is not makingefficient use of its heap storage. Check the Heap Segment Map report for frequent free storage elementsthat are interspersed with the allocated storage elements.
Understanding the heap pools LEDATA outputThe Language Environment IPCS VERBEXIT LEDATA generates a detailed heap pools report whenHEAPPOOLS is ON. The detailed heap pools report is useful when trying to find potential damaged cellsbecause it provides very specific information. The following sample shows an example of a report and“Heap pools report sections of the LEDATA output” on page 115 describes the information contained inthe formatted output.
Heap Pool Report QPCB: 25C1EA00 +000000 EYECATCHER:QPCB LENGTH:00000F00 NUMPOOLS:0000000A +00000C LARGEST_CELL_SIZE:00000800 BIG_REQUESTS:00000000 +000014 STORAGE_HITS_ADDR:00000000 FLAGS:0400 NUMGETARRAYS:05 +00001B NUMCELLSIZES:06 GET_POOLINFO_ARRAYS_PTR:25C1EB00 Data for pool 1: POOLDATA: 25C1EE00 +000000 POOL_INDEX:00000001 INPUT_CELL_SIZE:00000008 +000008 CELL_SIZE:00000010 INPUT_PERCENT:00000001 +000010 CELL_POOL_SIZE:00000140 CELL_POOL_NUM:00000014 +000018 POOL_LATCH_ADDR:25C54BD4 POOL_EXTENTS:00000001 +000020 LAST_CELL:25C45C30 NEXT_CELL:25C45B10 +000028 Q_CONTROL_INFO:0000031F Q_FIRST_CELL:25C45B00 +000030 POOL_NUM_GET_TOTAL:00000190 POOL_NUM_FREE:00000001 +000038 POOL_EXTENTS_ANCHOR:25C45AF8 POOL_INDEX_SAME_SIZE:01 +00003D POOL_INDEX_SIZE:01 POOL_NUM_SAME_SIZE:01 +000040 POOL_TRACE_TABLE:25C56060 [2]Heap Pool Extent Mapping EXTENT: 25C45AF8 +000000 EYE_CATCHER:EX31 NEXT_EXTENT:00000000 To display entire pool extent: IP LIST 25C45AF8 LEN(X'00000148') ASID(X'0020')
Chapter 3. Using Language Environment debugging facilities 111
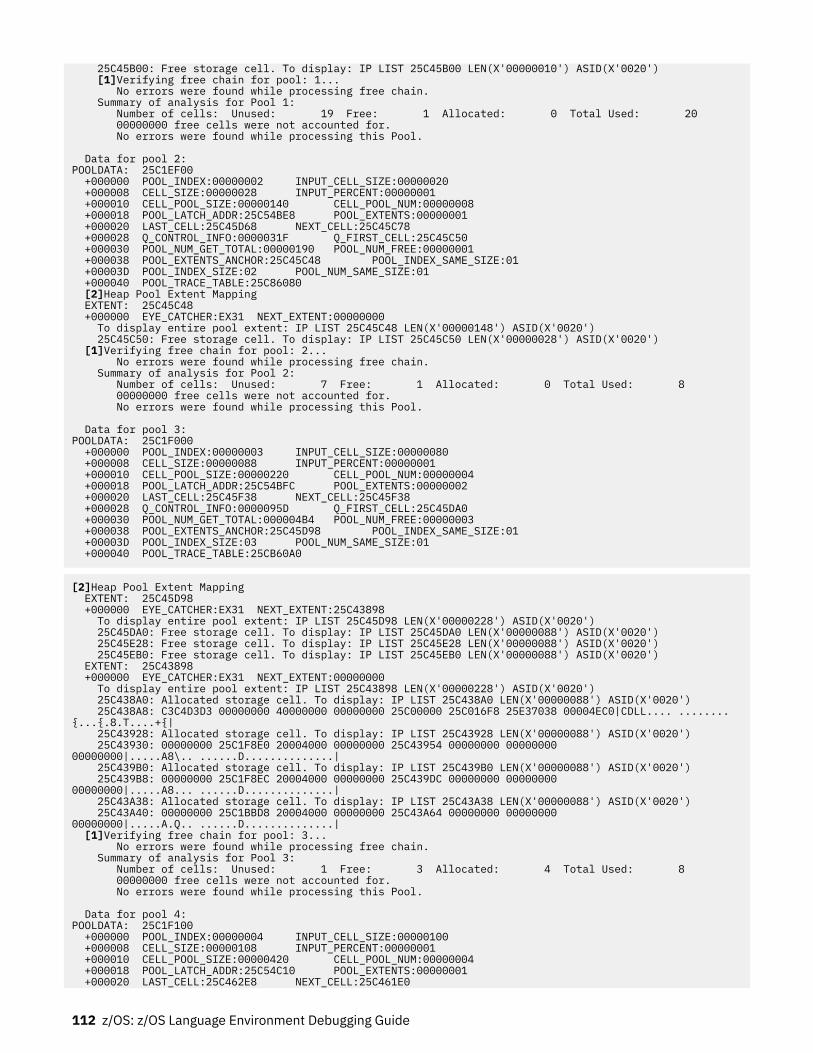
25C45B00: Free storage cell. To display: IP LIST 25C45B00 LEN(X'00000010') ASID(X'0020') [1]Verifying free chain for pool: 1... No errors were found while processing free chain. Summary of analysis for Pool 1: Number of cells: Unused: 19 Free: 1 Allocated: 0 Total Used: 20 00000000 free cells were not accounted for. No errors were found while processing this Pool. Data for pool 2: POOLDATA: 25C1EF00 +000000 POOL_INDEX:00000002 INPUT_CELL_SIZE:00000020 +000008 CELL_SIZE:00000028 INPUT_PERCENT:00000001 +000010 CELL_POOL_SIZE:00000140 CELL_POOL_NUM:00000008 +000018 POOL_LATCH_ADDR:25C54BE8 POOL_EXTENTS:00000001 +000020 LAST_CELL:25C45D68 NEXT_CELL:25C45C78 +000028 Q_CONTROL_INFO:0000031F Q_FIRST_CELL:25C45C50 +000030 POOL_NUM_GET_TOTAL:00000190 POOL_NUM_FREE:00000001 +000038 POOL_EXTENTS_ANCHOR:25C45C48 POOL_INDEX_SAME_SIZE:01 +00003D POOL_INDEX_SIZE:02 POOL_NUM_SAME_SIZE:01 +000040 POOL_TRACE_TABLE:25C86080 [2]Heap Pool Extent Mapping EXTENT: 25C45C48 +000000 EYE_CATCHER:EX31 NEXT_EXTENT:00000000 To display entire pool extent: IP LIST 25C45C48 LEN(X'00000148') ASID(X'0020') 25C45C50: Free storage cell. To display: IP LIST 25C45C50 LEN(X'00000028') ASID(X'0020') [1]Verifying free chain for pool: 2... No errors were found while processing free chain. Summary of analysis for Pool 2: Number of cells: Unused: 7 Free: 1 Allocated: 0 Total Used: 8 00000000 free cells were not accounted for. No errors were found while processing this Pool. Data for pool 3: POOLDATA: 25C1F000 +000000 POOL_INDEX:00000003 INPUT_CELL_SIZE:00000080 +000008 CELL_SIZE:00000088 INPUT_PERCENT:00000001 +000010 CELL_POOL_SIZE:00000220 CELL_POOL_NUM:00000004 +000018 POOL_LATCH_ADDR:25C54BFC POOL_EXTENTS:00000002 +000020 LAST_CELL:25C45F38 NEXT_CELL:25C45F38 +000028 Q_CONTROL_INFO:0000095D Q_FIRST_CELL:25C45DA0 +000030 POOL_NUM_GET_TOTAL:000004B4 POOL_NUM_FREE:00000003 +000038 POOL_EXTENTS_ANCHOR:25C45D98 POOL_INDEX_SAME_SIZE:01 +00003D POOL_INDEX_SIZE:03 POOL_NUM_SAME_SIZE:01 +000040 POOL_TRACE_TABLE:25CB60A0
[2]Heap Pool Extent Mapping EXTENT: 25C45D98 +000000 EYE_CATCHER:EX31 NEXT_EXTENT:25C43898 To display entire pool extent: IP LIST 25C45D98 LEN(X'00000228') ASID(X'0020') 25C45DA0: Free storage cell. To display: IP LIST 25C45DA0 LEN(X'00000088') ASID(X'0020') 25C45E28: Free storage cell. To display: IP LIST 25C45E28 LEN(X'00000088') ASID(X'0020') 25C45EB0: Free storage cell. To display: IP LIST 25C45EB0 LEN(X'00000088') ASID(X'0020') EXTENT: 25C43898 +000000 EYE_CATCHER:EX31 NEXT_EXTENT:00000000 To display entire pool extent: IP LIST 25C43898 LEN(X'00000228') ASID(X'0020') 25C438A0: Allocated storage cell. To display: IP LIST 25C438A0 LEN(X'00000088') ASID(X'0020') 25C438A8: C3C4D3D3 00000000 40000000 00000000 25C00000 25C016F8 25E37038 00004EC0|CDLL.... ........{...{.8.T....+{| 25C43928: Allocated storage cell. To display: IP LIST 25C43928 LEN(X'00000088') ASID(X'0020') 25C43930: 00000000 25C1F8E0 20004000 00000000 25C43954 00000000 00000000 00000000|.....A8\.. ......D..............| 25C439B0: Allocated storage cell. To display: IP LIST 25C439B0 LEN(X'00000088') ASID(X'0020') 25C439B8: 00000000 25C1F8EC 20004000 00000000 25C439DC 00000000 00000000 00000000|.....A8... ......D..............| 25C43A38: Allocated storage cell. To display: IP LIST 25C43A38 LEN(X'00000088') ASID(X'0020') 25C43A40: 00000000 25C1BBD8 20004000 00000000 25C43A64 00000000 00000000 00000000|.....A.Q.. ......D..............| [1]Verifying free chain for pool: 3... No errors were found while processing free chain. Summary of analysis for Pool 3: Number of cells: Unused: 1 Free: 3 Allocated: 4 Total Used: 8 00000000 free cells were not accounted for. No errors were found while processing this Pool. Data for pool 4: POOLDATA: 25C1F100 +000000 POOL_INDEX:00000004 INPUT_CELL_SIZE:00000100 +000008 CELL_SIZE:00000108 INPUT_PERCENT:00000001 +000010 CELL_POOL_SIZE:00000420 CELL_POOL_NUM:00000004 +000018 POOL_LATCH_ADDR:25C54C10 POOL_EXTENTS:00000001 +000020 LAST_CELL:25C462E8 NEXT_CELL:25C461E0
112 z/OS: z/OS Language Environment Debugging Guide
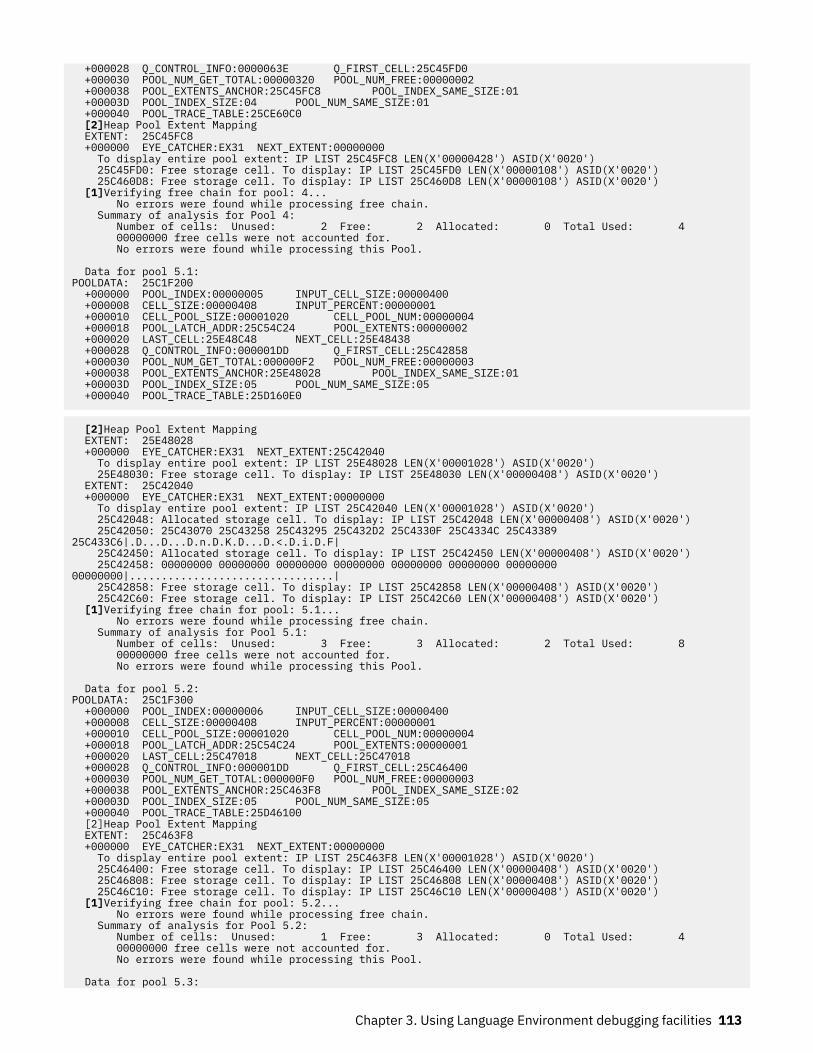
+000028 Q_CONTROL_INFO:0000063E Q_FIRST_CELL:25C45FD0 +000030 POOL_NUM_GET_TOTAL:00000320 POOL_NUM_FREE:00000002 +000038 POOL_EXTENTS_ANCHOR:25C45FC8 POOL_INDEX_SAME_SIZE:01 +00003D POOL_INDEX_SIZE:04 POOL_NUM_SAME_SIZE:01 +000040 POOL_TRACE_TABLE:25CE60C0 [2]Heap Pool Extent Mapping EXTENT: 25C45FC8 +000000 EYE_CATCHER:EX31 NEXT_EXTENT:00000000 To display entire pool extent: IP LIST 25C45FC8 LEN(X'00000428') ASID(X'0020') 25C45FD0: Free storage cell. To display: IP LIST 25C45FD0 LEN(X'00000108') ASID(X'0020') 25C460D8: Free storage cell. To display: IP LIST 25C460D8 LEN(X'00000108') ASID(X'0020') [1]Verifying free chain for pool: 4... No errors were found while processing free chain. Summary of analysis for Pool 4: Number of cells: Unused: 2 Free: 2 Allocated: 0 Total Used: 4 00000000 free cells were not accounted for. No errors were found while processing this Pool. Data for pool 5.1: POOLDATA: 25C1F200 +000000 POOL_INDEX:00000005 INPUT_CELL_SIZE:00000400 +000008 CELL_SIZE:00000408 INPUT_PERCENT:00000001 +000010 CELL_POOL_SIZE:00001020 CELL_POOL_NUM:00000004 +000018 POOL_LATCH_ADDR:25C54C24 POOL_EXTENTS:00000002 +000020 LAST_CELL:25E48C48 NEXT_CELL:25E48438 +000028 Q_CONTROL_INFO:000001DD Q_FIRST_CELL:25C42858 +000030 POOL_NUM_GET_TOTAL:000000F2 POOL_NUM_FREE:00000003 +000038 POOL_EXTENTS_ANCHOR:25E48028 POOL_INDEX_SAME_SIZE:01 +00003D POOL_INDEX_SIZE:05 POOL_NUM_SAME_SIZE:05 +000040 POOL_TRACE_TABLE:25D160E0
[2]Heap Pool Extent Mapping EXTENT: 25E48028 +000000 EYE_CATCHER:EX31 NEXT_EXTENT:25C42040 To display entire pool extent: IP LIST 25E48028 LEN(X'00001028') ASID(X'0020') 25E48030: Free storage cell. To display: IP LIST 25E48030 LEN(X'00000408') ASID(X'0020') EXTENT: 25C42040 +000000 EYE_CATCHER:EX31 NEXT_EXTENT:00000000 To display entire pool extent: IP LIST 25C42040 LEN(X'00001028') ASID(X'0020') 25C42048: Allocated storage cell. To display: IP LIST 25C42048 LEN(X'00000408') ASID(X'0020') 25C42050: 25C43070 25C43258 25C43295 25C432D2 25C4330F 25C4334C 25C43389 25C433C6|.D...D...D.n.D.K.D...D.<.D.i.D.F| 25C42450: Allocated storage cell. To display: IP LIST 25C42450 LEN(X'00000408') ASID(X'0020') 25C42458: 00000000 00000000 00000000 00000000 00000000 00000000 00000000 00000000|................................| 25C42858: Free storage cell. To display: IP LIST 25C42858 LEN(X'00000408') ASID(X'0020') 25C42C60: Free storage cell. To display: IP LIST 25C42C60 LEN(X'00000408') ASID(X'0020') [1]Verifying free chain for pool: 5.1... No errors were found while processing free chain. Summary of analysis for Pool 5.1: Number of cells: Unused: 3 Free: 3 Allocated: 2 Total Used: 8 00000000 free cells were not accounted for. No errors were found while processing this Pool. Data for pool 5.2: POOLDATA: 25C1F300 +000000 POOL_INDEX:00000006 INPUT_CELL_SIZE:00000400 +000008 CELL_SIZE:00000408 INPUT_PERCENT:00000001 +000010 CELL_POOL_SIZE:00001020 CELL_POOL_NUM:00000004 +000018 POOL_LATCH_ADDR:25C54C24 POOL_EXTENTS:00000001 +000020 LAST_CELL:25C47018 NEXT_CELL:25C47018 +000028 Q_CONTROL_INFO:000001DD Q_FIRST_CELL:25C46400 +000030 POOL_NUM_GET_TOTAL:000000F0 POOL_NUM_FREE:00000003 +000038 POOL_EXTENTS_ANCHOR:25C463F8 POOL_INDEX_SAME_SIZE:02 +00003D POOL_INDEX_SIZE:05 POOL_NUM_SAME_SIZE:05 +000040 POOL_TRACE_TABLE:25D46100 [2]Heap Pool Extent Mapping EXTENT: 25C463F8 +000000 EYE_CATCHER:EX31 NEXT_EXTENT:00000000 To display entire pool extent: IP LIST 25C463F8 LEN(X'00001028') ASID(X'0020') 25C46400: Free storage cell. To display: IP LIST 25C46400 LEN(X'00000408') ASID(X'0020') 25C46808: Free storage cell. To display: IP LIST 25C46808 LEN(X'00000408') ASID(X'0020') 25C46C10: Free storage cell. To display: IP LIST 25C46C10 LEN(X'00000408') ASID(X'0020') [1]Verifying free chain for pool: 5.2... No errors were found while processing free chain. Summary of analysis for Pool 5.2: Number of cells: Unused: 1 Free: 3 Allocated: 0 Total Used: 4 00000000 free cells were not accounted for. No errors were found while processing this Pool. Data for pool 5.3:
Chapter 3. Using Language Environment debugging facilities 113
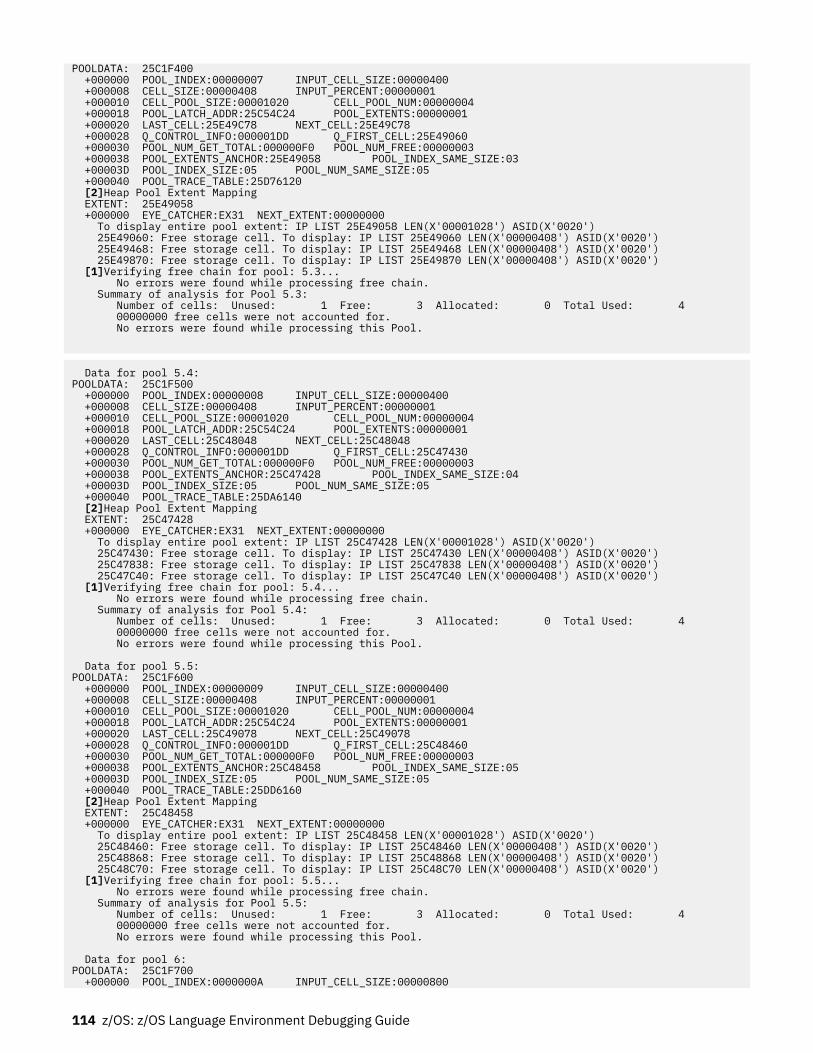
POOLDATA: 25C1F400 +000000 POOL_INDEX:00000007 INPUT_CELL_SIZE:00000400 +000008 CELL_SIZE:00000408 INPUT_PERCENT:00000001 +000010 CELL_POOL_SIZE:00001020 CELL_POOL_NUM:00000004 +000018 POOL_LATCH_ADDR:25C54C24 POOL_EXTENTS:00000001 +000020 LAST_CELL:25E49C78 NEXT_CELL:25E49C78 +000028 Q_CONTROL_INFO:000001DD Q_FIRST_CELL:25E49060 +000030 POOL_NUM_GET_TOTAL:000000F0 POOL_NUM_FREE:00000003 +000038 POOL_EXTENTS_ANCHOR:25E49058 POOL_INDEX_SAME_SIZE:03 +00003D POOL_INDEX_SIZE:05 POOL_NUM_SAME_SIZE:05 +000040 POOL_TRACE_TABLE:25D76120 [2]Heap Pool Extent Mapping EXTENT: 25E49058 +000000 EYE_CATCHER:EX31 NEXT_EXTENT:00000000 To display entire pool extent: IP LIST 25E49058 LEN(X'00001028') ASID(X'0020') 25E49060: Free storage cell. To display: IP LIST 25E49060 LEN(X'00000408') ASID(X'0020') 25E49468: Free storage cell. To display: IP LIST 25E49468 LEN(X'00000408') ASID(X'0020') 25E49870: Free storage cell. To display: IP LIST 25E49870 LEN(X'00000408') ASID(X'0020') [1]Verifying free chain for pool: 5.3... No errors were found while processing free chain. Summary of analysis for Pool 5.3: Number of cells: Unused: 1 Free: 3 Allocated: 0 Total Used: 4 00000000 free cells were not accounted for. No errors were found while processing this Pool.
Data for pool 5.4: POOLDATA: 25C1F500 +000000 POOL_INDEX:00000008 INPUT_CELL_SIZE:00000400 +000008 CELL_SIZE:00000408 INPUT_PERCENT:00000001 +000010 CELL_POOL_SIZE:00001020 CELL_POOL_NUM:00000004 +000018 POOL_LATCH_ADDR:25C54C24 POOL_EXTENTS:00000001 +000020 LAST_CELL:25C48048 NEXT_CELL:25C48048 +000028 Q_CONTROL_INFO:000001DD Q_FIRST_CELL:25C47430 +000030 POOL_NUM_GET_TOTAL:000000F0 POOL_NUM_FREE:00000003 +000038 POOL_EXTENTS_ANCHOR:25C47428 POOL_INDEX_SAME_SIZE:04 +00003D POOL_INDEX_SIZE:05 POOL_NUM_SAME_SIZE:05 +000040 POOL_TRACE_TABLE:25DA6140 [2]Heap Pool Extent Mapping EXTENT: 25C47428 +000000 EYE_CATCHER:EX31 NEXT_EXTENT:00000000 To display entire pool extent: IP LIST 25C47428 LEN(X'00001028') ASID(X'0020') 25C47430: Free storage cell. To display: IP LIST 25C47430 LEN(X'00000408') ASID(X'0020') 25C47838: Free storage cell. To display: IP LIST 25C47838 LEN(X'00000408') ASID(X'0020') 25C47C40: Free storage cell. To display: IP LIST 25C47C40 LEN(X'00000408') ASID(X'0020') [1]Verifying free chain for pool: 5.4... No errors were found while processing free chain. Summary of analysis for Pool 5.4: Number of cells: Unused: 1 Free: 3 Allocated: 0 Total Used: 4 00000000 free cells were not accounted for. No errors were found while processing this Pool. Data for pool 5.5: POOLDATA: 25C1F600 +000000 POOL_INDEX:00000009 INPUT_CELL_SIZE:00000400 +000008 CELL_SIZE:00000408 INPUT_PERCENT:00000001 +000010 CELL_POOL_SIZE:00001020 CELL_POOL_NUM:00000004 +000018 POOL_LATCH_ADDR:25C54C24 POOL_EXTENTS:00000001 +000020 LAST_CELL:25C49078 NEXT_CELL:25C49078 +000028 Q_CONTROL_INFO:000001DD Q_FIRST_CELL:25C48460 +000030 POOL_NUM_GET_TOTAL:000000F0 POOL_NUM_FREE:00000003 +000038 POOL_EXTENTS_ANCHOR:25C48458 POOL_INDEX_SAME_SIZE:05 +00003D POOL_INDEX_SIZE:05 POOL_NUM_SAME_SIZE:05 +000040 POOL_TRACE_TABLE:25DD6160 [2]Heap Pool Extent Mapping EXTENT: 25C48458 +000000 EYE_CATCHER:EX31 NEXT_EXTENT:00000000 To display entire pool extent: IP LIST 25C48458 LEN(X'00001028') ASID(X'0020') 25C48460: Free storage cell. To display: IP LIST 25C48460 LEN(X'00000408') ASID(X'0020') 25C48868: Free storage cell. To display: IP LIST 25C48868 LEN(X'00000408') ASID(X'0020') 25C48C70: Free storage cell. To display: IP LIST 25C48C70 LEN(X'00000408') ASID(X'0020') [1]Verifying free chain for pool: 5.5... No errors were found while processing free chain. Summary of analysis for Pool 5.5: Number of cells: Unused: 1 Free: 3 Allocated: 0 Total Used: 4 00000000 free cells were not accounted for. No errors were found while processing this Pool. Data for pool 6: POOLDATA: 25C1F700 +000000 POOL_INDEX:0000000A INPUT_CELL_SIZE:00000800
114 z/OS: z/OS Language Environment Debugging Guide
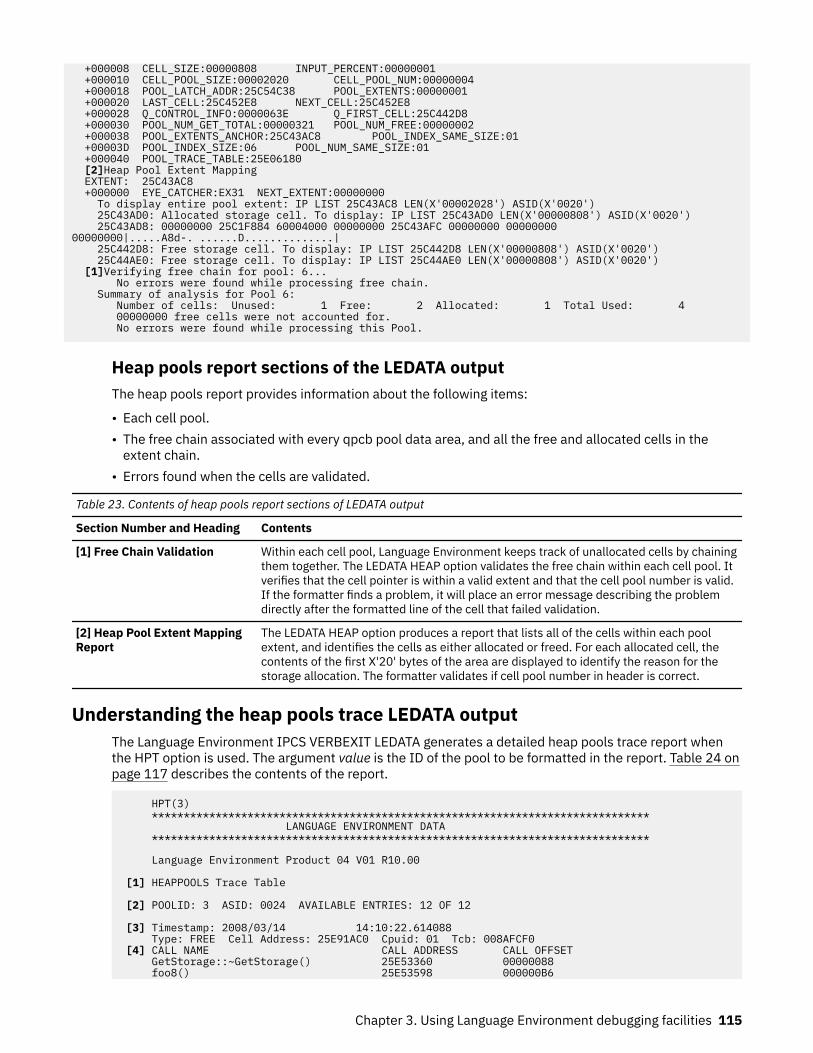
+000008 CELL_SIZE:00000808 INPUT_PERCENT:00000001 +000010 CELL_POOL_SIZE:00002020 CELL_POOL_NUM:00000004 +000018 POOL_LATCH_ADDR:25C54C38 POOL_EXTENTS:00000001 +000020 LAST_CELL:25C452E8 NEXT_CELL:25C452E8 +000028 Q_CONTROL_INFO:0000063E Q_FIRST_CELL:25C442D8 +000030 POOL_NUM_GET_TOTAL:00000321 POOL_NUM_FREE:00000002 +000038 POOL_EXTENTS_ANCHOR:25C43AC8 POOL_INDEX_SAME_SIZE:01 +00003D POOL_INDEX_SIZE:06 POOL_NUM_SAME_SIZE:01 +000040 POOL_TRACE_TABLE:25E06180 [2]Heap Pool Extent Mapping EXTENT: 25C43AC8 +000000 EYE_CATCHER:EX31 NEXT_EXTENT:00000000 To display entire pool extent: IP LIST 25C43AC8 LEN(X'00002028') ASID(X'0020') 25C43AD0: Allocated storage cell. To display: IP LIST 25C43AD0 LEN(X'00000808') ASID(X'0020') 25C43AD8: 00000000 25C1F884 60004000 00000000 25C43AFC 00000000 00000000 00000000|.....A8d-. ......D..............| 25C442D8: Free storage cell. To display: IP LIST 25C442D8 LEN(X'00000808') ASID(X'0020') 25C44AE0: Free storage cell. To display: IP LIST 25C44AE0 LEN(X'00000808') ASID(X'0020') [1]Verifying free chain for pool: 6... No errors were found while processing free chain. Summary of analysis for Pool 6: Number of cells: Unused: 1 Free: 2 Allocated: 1 Total Used: 4 00000000 free cells were not accounted for. No errors were found while processing this Pool.
Heap pools report sections of the LEDATA outputThe heap pools report provides information about the following items:
• Each cell pool.• The free chain associated with every qpcb pool data area, and all the free and allocated cells in the
extent chain.• Errors found when the cells are validated.
Table 23. Contents of heap pools report sections of LEDATA output
Section Number and Heading Contents
[1] Free Chain Validation Within each cell pool, Language Environment keeps track of unallocated cells by chainingthem together. The LEDATA HEAP option validates the free chain within each cell pool. Itverifies that the cell pointer is within a valid extent and that the cell pool number is valid.If the formatter finds a problem, it will place an error message describing the problemdirectly after the formatted line of the cell that failed validation.
[2] Heap Pool Extent MappingReport
The LEDATA HEAP option produces a report that lists all of the cells within each poolextent, and identifies the cells as either allocated or freed. For each allocated cell, thecontents of the first X'20' bytes of the area are displayed to identify the reason for thestorage allocation. The formatter validates if cell pool number in header is correct.
Understanding the heap pools trace LEDATA outputThe Language Environment IPCS VERBEXIT LEDATA generates a detailed heap pools trace report whenthe HPT option is used. The argument value is the ID of the pool to be formatted in the report. Table 24 onpage 117 describes the contents of the report.
HPT(3) ****************************************************************************** LANGUAGE ENVIRONMENT DATA ****************************************************************************** Language Environment Product 04 V01 R10.00 [1] HEAPPOOLS Trace Table [2] POOLID: 3 ASID: 0024 AVAILABLE ENTRIES: 12 OF 12 [3] Timestamp: 2008/03/14 14:10:22.614088 Type: FREE Cell Address: 25E91AC0 Cpuid: 01 Tcb: 008AFCF0 [4] CALL NAME CALL ADDRESS CALL OFFSET GetStorage::~GetStorage() 25E53360 00000088 foo8() 25E53598 000000B6
Chapter 3. Using Language Environment debugging facilities 115
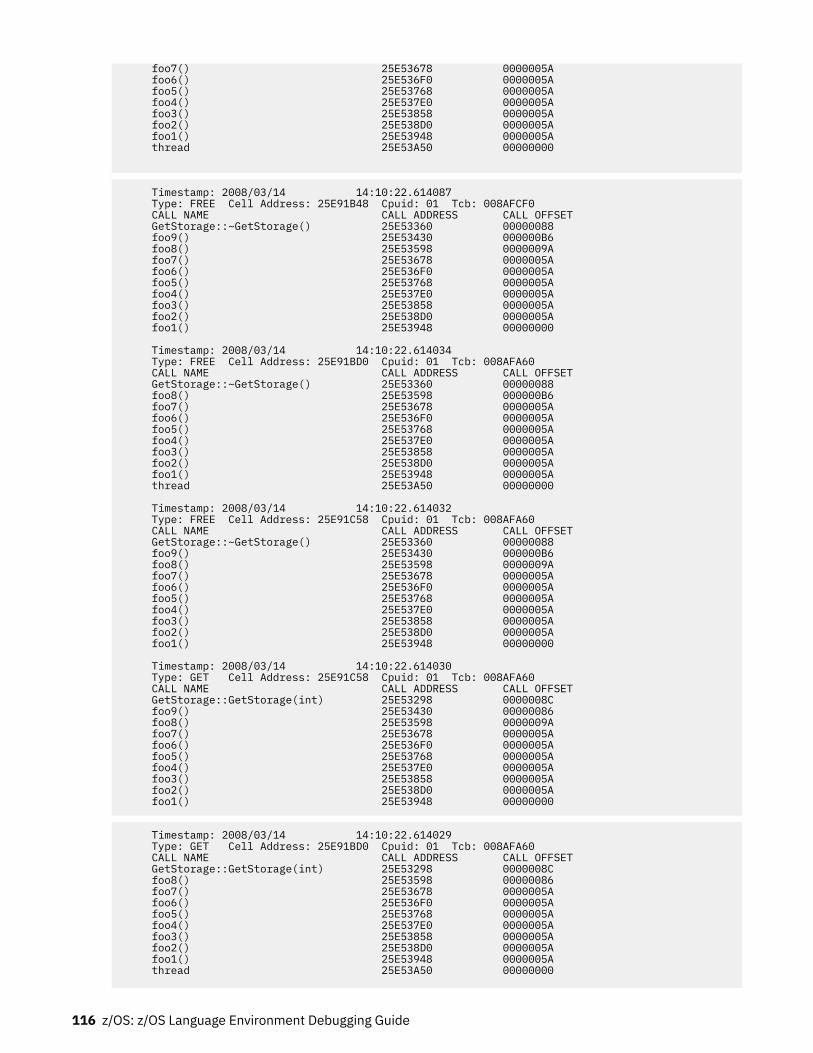
foo7() 25E53678 0000005A foo6() 25E536F0 0000005A foo5() 25E53768 0000005A foo4() 25E537E0 0000005A foo3() 25E53858 0000005A foo2() 25E538D0 0000005A foo1() 25E53948 0000005A thread 25E53A50 00000000
Timestamp: 2008/03/14 14:10:22.614087 Type: FREE Cell Address: 25E91B48 Cpuid: 01 Tcb: 008AFCF0 CALL NAME CALL ADDRESS CALL OFFSET GetStorage::~GetStorage() 25E53360 00000088 foo9() 25E53430 000000B6 foo8() 25E53598 0000009A foo7() 25E53678 0000005A foo6() 25E536F0 0000005A foo5() 25E53768 0000005A foo4() 25E537E0 0000005A foo3() 25E53858 0000005A foo2() 25E538D0 0000005A foo1() 25E53948 00000000 Timestamp: 2008/03/14 14:10:22.614034 Type: FREE Cell Address: 25E91BD0 Cpuid: 01 Tcb: 008AFA60 CALL NAME CALL ADDRESS CALL OFFSET GetStorage::~GetStorage() 25E53360 00000088 foo8() 25E53598 000000B6 foo7() 25E53678 0000005A foo6() 25E536F0 0000005A foo5() 25E53768 0000005A foo4() 25E537E0 0000005A foo3() 25E53858 0000005A foo2() 25E538D0 0000005A foo1() 25E53948 0000005A thread 25E53A50 00000000 Timestamp: 2008/03/14 14:10:22.614032 Type: FREE Cell Address: 25E91C58 Cpuid: 01 Tcb: 008AFA60 CALL NAME CALL ADDRESS CALL OFFSET GetStorage::~GetStorage() 25E53360 00000088 foo9() 25E53430 000000B6 foo8() 25E53598 0000009A foo7() 25E53678 0000005A foo6() 25E536F0 0000005A foo5() 25E53768 0000005A foo4() 25E537E0 0000005A foo3() 25E53858 0000005A foo2() 25E538D0 0000005A foo1() 25E53948 00000000 Timestamp: 2008/03/14 14:10:22.614030 Type: GET Cell Address: 25E91C58 Cpuid: 01 Tcb: 008AFA60 CALL NAME CALL ADDRESS CALL OFFSET GetStorage::GetStorage(int) 25E53298 0000008C foo9() 25E53430 00000086 foo8() 25E53598 0000009A foo7() 25E53678 0000005A foo6() 25E536F0 0000005A foo5() 25E53768 0000005A foo4() 25E537E0 0000005A foo3() 25E53858 0000005A foo2() 25E538D0 0000005A foo1() 25E53948 00000000
Timestamp: 2008/03/14 14:10:22.614029 Type: GET Cell Address: 25E91BD0 Cpuid: 01 Tcb: 008AFA60 CALL NAME CALL ADDRESS CALL OFFSET GetStorage::GetStorage(int) 25E53298 0000008C foo8() 25E53598 00000086 foo7() 25E53678 0000005A foo6() 25E536F0 0000005A foo5() 25E53768 0000005A foo4() 25E537E0 0000005A foo3() 25E53858 0000005A foo2() 25E538D0 0000005A foo1() 25E53948 0000005A thread 25E53A50 00000000
116 z/OS: z/OS Language Environment Debugging Guide
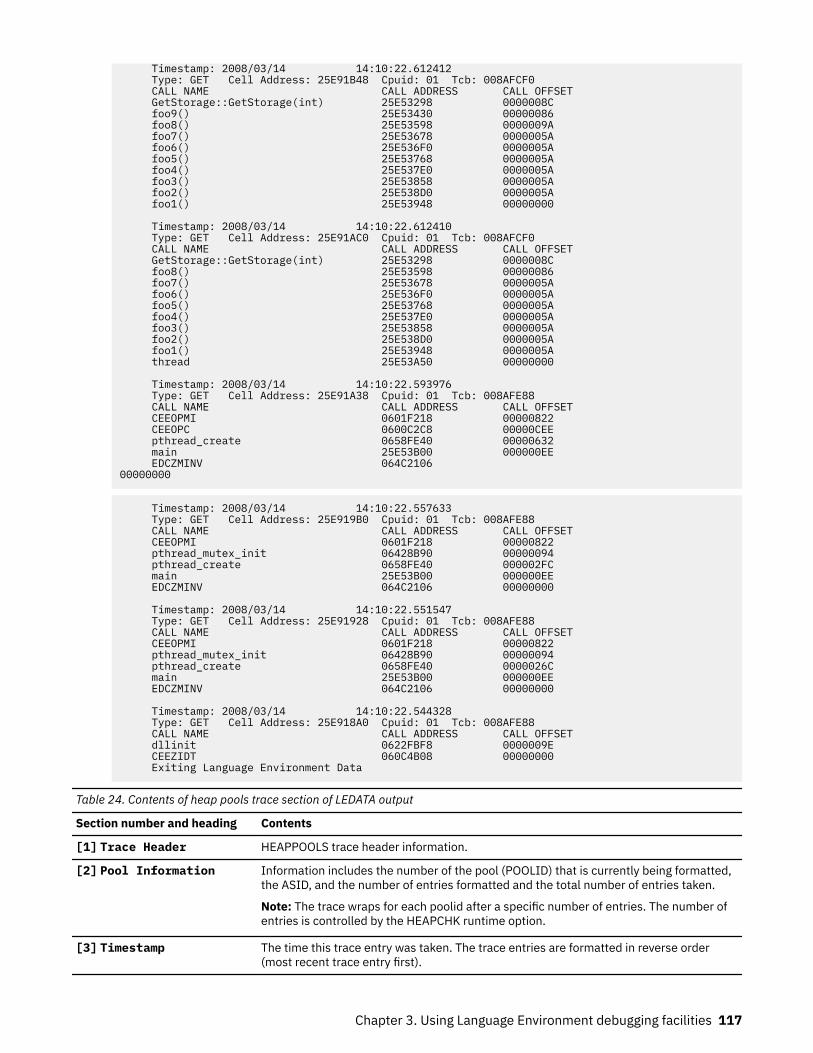
Timestamp: 2008/03/14 14:10:22.612412 Type: GET Cell Address: 25E91B48 Cpuid: 01 Tcb: 008AFCF0 CALL NAME CALL ADDRESS CALL OFFSET GetStorage::GetStorage(int) 25E53298 0000008C foo9() 25E53430 00000086 foo8() 25E53598 0000009A foo7() 25E53678 0000005A foo6() 25E536F0 0000005A foo5() 25E53768 0000005A foo4() 25E537E0 0000005A foo3() 25E53858 0000005A foo2() 25E538D0 0000005A foo1() 25E53948 00000000 Timestamp: 2008/03/14 14:10:22.612410 Type: GET Cell Address: 25E91AC0 Cpuid: 01 Tcb: 008AFCF0 CALL NAME CALL ADDRESS CALL OFFSET GetStorage::GetStorage(int) 25E53298 0000008C foo8() 25E53598 00000086 foo7() 25E53678 0000005A foo6() 25E536F0 0000005A foo5() 25E53768 0000005A foo4() 25E537E0 0000005A foo3() 25E53858 0000005A foo2() 25E538D0 0000005A foo1() 25E53948 0000005A thread 25E53A50 00000000 Timestamp: 2008/03/14 14:10:22.593976 Type: GET Cell Address: 25E91A38 Cpuid: 01 Tcb: 008AFE88 CALL NAME CALL ADDRESS CALL OFFSET CEEOPMI 0601F218 00000822 CEEOPC 0600C2C8 00000CEE pthread_create 0658FE40 00000632 main 25E53B00 000000EE EDCZMINV 064C2106 00000000
Timestamp: 2008/03/14 14:10:22.557633 Type: GET Cell Address: 25E919B0 Cpuid: 01 Tcb: 008AFE88 CALL NAME CALL ADDRESS CALL OFFSET CEEOPMI 0601F218 00000822 pthread_mutex_init 06428B90 00000094 pthread_create 0658FE40 000002FC main 25E53B00 000000EE EDCZMINV 064C2106 00000000 Timestamp: 2008/03/14 14:10:22.551547 Type: GET Cell Address: 25E91928 Cpuid: 01 Tcb: 008AFE88 CALL NAME CALL ADDRESS CALL OFFSET CEEOPMI 0601F218 00000822 pthread_mutex_init 06428B90 00000094 pthread_create 0658FE40 0000026C main 25E53B00 000000EE EDCZMINV 064C2106 00000000 Timestamp: 2008/03/14 14:10:22.544328 Type: GET Cell Address: 25E918A0 Cpuid: 01 Tcb: 008AFE88 CALL NAME CALL ADDRESS CALL OFFSET dllinit 0622FBF8 0000009E CEEZIDT 060C4B08 00000000 Exiting Language Environment Data
Table 24. Contents of heap pools trace section of LEDATA output
Section number and heading Contents
[1] Trace Header HEAPPOOLS trace header information.
[2] Pool Information Information includes the number of the pool (POOLID) that is currently being formatted,the ASID, and the number of entries formatted and the total number of entries taken.
Note: The trace wraps for each poolid after a specific number of entries. The number ofentries is controlled by the HEAPCHK runtime option.
[3] Timestamp The time this trace entry was taken. The trace entries are formatted in reverse order(most recent trace entry first).
Chapter 3. Using Language Environment debugging facilities 117
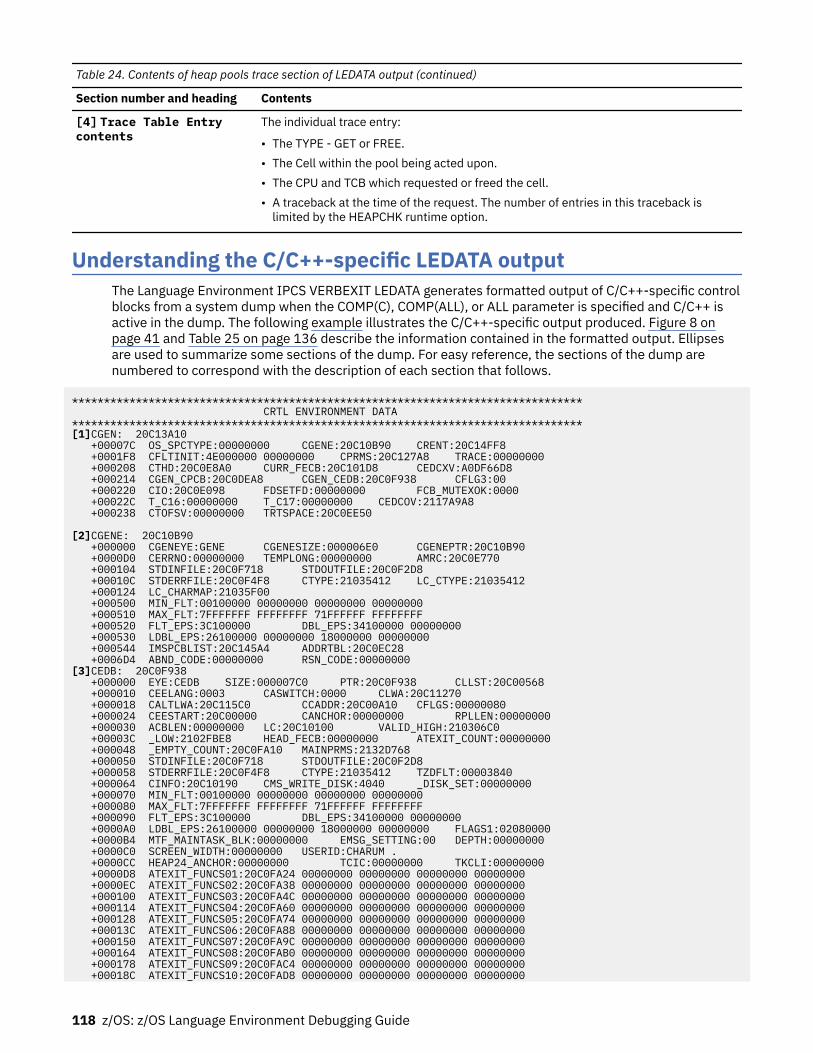
Table 24. Contents of heap pools trace section of LEDATA output (continued)
Section number and heading Contents
[4] Trace Table Entrycontents
The individual trace entry:
• The TYPE - GET or FREE.• The Cell within the pool being acted upon.• The CPU and TCB which requested or freed the cell.• A traceback at the time of the request. The number of entries in this traceback is
limited by the HEAPCHK runtime option.
Understanding the C/C++-specific LEDATA outputThe Language Environment IPCS VERBEXIT LEDATA generates formatted output of C/C++-specific controlblocks from a system dump when the COMP(C), COMP(ALL), or ALL parameter is specified and C/C++ isactive in the dump. The following example illustrates the C/C++-specific output produced. Figure 8 onpage 41 and Table 25 on page 136 describe the information contained in the formatted output. Ellipsesare used to summarize some sections of the dump. For easy reference, the sections of the dump arenumbered to correspond with the description of each section that follows.
******************************************************************************** CRTL ENVIRONMENT DATA********************************************************************************[1]CGEN: 20C13A10 +00007C OS_SPCTYPE:00000000 CGENE:20C10B90 CRENT:20C14FF8 +0001F8 CFLTINIT:4E000000 00000000 CPRMS:20C127A8 TRACE:00000000 +000208 CTHD:20C0E8A0 CURR_FECB:20C101D8 CEDCXV:A0DF66D8 +000214 CGEN_CPCB:20C0DEA8 CGEN_CEDB:20C0F938 CFLG3:00 +000220 CIO:20C0E098 FDSETFD:00000000 FCB_MUTEXOK:0000 +00022C T_C16:00000000 T_C17:00000000 CEDCOV:2117A9A8 +000238 CTOFSV:00000000 TRTSPACE:20C0EE50
[2]CGENE: 20C10B90 +000000 CGENEYE:GENE CGENESIZE:000006E0 CGENEPTR:20C10B90 +0000D0 CERRNO:00000000 TEMPLONG:00000000 AMRC:20C0E770 +000104 STDINFILE:20C0F718 STDOUTFILE:20C0F2D8 +00010C STDERRFILE:20C0F4F8 CTYPE:21035412 LC_CTYPE:21035412 +000124 LC_CHARMAP:21035F00 +000500 MIN_FLT:00100000 00000000 00000000 00000000 +000510 MAX_FLT:7FFFFFFF FFFFFFFF 71FFFFFF FFFFFFFF +000520 FLT_EPS:3C100000 DBL_EPS:34100000 00000000 +000530 LDBL_EPS:26100000 00000000 18000000 00000000 +000544 IMSPCBLIST:20C145A4 ADDRTBL:20C0EC28 +0006D4 ABND_CODE:00000000 RSN_CODE:00000000[3]CEDB: 20C0F938 +000000 EYE:CEDB SIZE:000007C0 PTR:20C0F938 CLLST:20C00568 +000010 CEELANG:0003 CASWITCH:0000 CLWA:20C11270 +000018 CALTLWA:20C115C0 CCADDR:20C00A10 CFLGS:00000080 +000024 CEESTART:20C00000 CANCHOR:00000000 RPLLEN:00000000 +000030 ACBLEN:00000000 LC:20C10100 VALID_HIGH:210306C0 +00003C _LOW:2102FBE8 HEAD_FECB:00000000 ATEXIT_COUNT:00000000 +000048 _EMPTY_COUNT:20C0FA10 MAINPRMS:2132D768 +000050 STDINFILE:20C0F718 STDOUTFILE:20C0F2D8 +000058 STDERRFILE:20C0F4F8 CTYPE:21035412 TZDFLT:00003840 +000064 CINFO:20C10190 CMS_WRITE_DISK:4040 _DISK_SET:00000000 +000070 MIN_FLT:00100000 00000000 00000000 00000000 +000080 MAX_FLT:7FFFFFFF FFFFFFFF 71FFFFFF FFFFFFFF +000090 FLT_EPS:3C100000 DBL_EPS:34100000 00000000 +0000A0 LDBL_EPS:26100000 00000000 18000000 00000000 FLAGS1:02080000 +0000B4 MTF_MAINTASK_BLK:00000000 EMSG_SETTING:00 DEPTH:00000000 +0000C0 SCREEN_WIDTH:00000000 USERID:CHARUM . +0000CC HEAP24_ANCHOR:00000000 TCIC:00000000 TKCLI:00000000 +0000D8 ATEXIT_FUNCS01:20C0FA24 00000000 00000000 00000000 00000000 +0000EC ATEXIT_FUNCS02:20C0FA38 00000000 00000000 00000000 00000000 +000100 ATEXIT_FUNCS03:20C0FA4C 00000000 00000000 00000000 00000000 +000114 ATEXIT_FUNCS04:20C0FA60 00000000 00000000 00000000 00000000 +000128 ATEXIT_FUNCS05:20C0FA74 00000000 00000000 00000000 00000000 +00013C ATEXIT_FUNCS06:20C0FA88 00000000 00000000 00000000 00000000 +000150 ATEXIT_FUNCS07:20C0FA9C 00000000 00000000 00000000 00000000 +000164 ATEXIT_FUNCS08:20C0FAB0 00000000 00000000 00000000 00000000 +000178 ATEXIT_FUNCS09:20C0FAC4 00000000 00000000 00000000 00000000 +00018C ATEXIT_FUNCS10:20C0FAD8 00000000 00000000 00000000 00000000
118 z/OS: z/OS Language Environment Debugging Guide
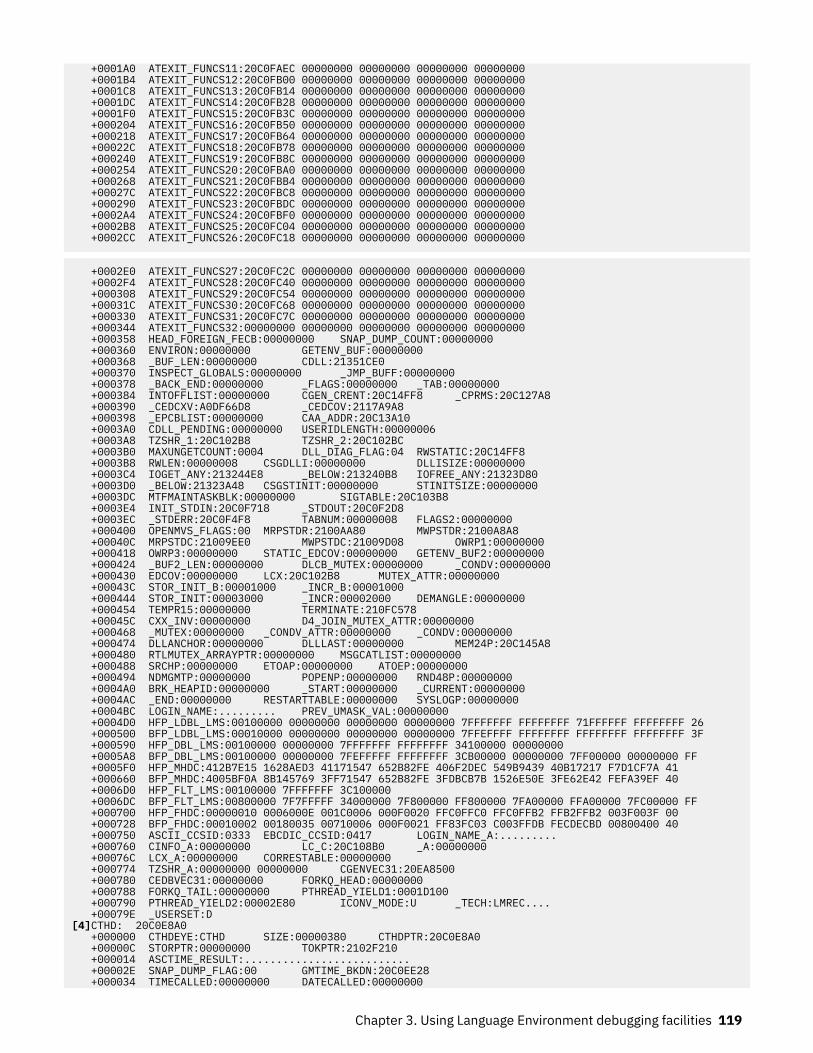
+0001A0 ATEXIT_FUNCS11:20C0FAEC 00000000 00000000 00000000 00000000 +0001B4 ATEXIT_FUNCS12:20C0FB00 00000000 00000000 00000000 00000000 +0001C8 ATEXIT_FUNCS13:20C0FB14 00000000 00000000 00000000 00000000 +0001DC ATEXIT_FUNCS14:20C0FB28 00000000 00000000 00000000 00000000 +0001F0 ATEXIT_FUNCS15:20C0FB3C 00000000 00000000 00000000 00000000 +000204 ATEXIT_FUNCS16:20C0FB50 00000000 00000000 00000000 00000000 +000218 ATEXIT_FUNCS17:20C0FB64 00000000 00000000 00000000 00000000 +00022C ATEXIT_FUNCS18:20C0FB78 00000000 00000000 00000000 00000000 +000240 ATEXIT_FUNCS19:20C0FB8C 00000000 00000000 00000000 00000000 +000254 ATEXIT_FUNCS20:20C0FBA0 00000000 00000000 00000000 00000000 +000268 ATEXIT_FUNCS21:20C0FBB4 00000000 00000000 00000000 00000000 +00027C ATEXIT_FUNCS22:20C0FBC8 00000000 00000000 00000000 00000000 +000290 ATEXIT_FUNCS23:20C0FBDC 00000000 00000000 00000000 00000000 +0002A4 ATEXIT_FUNCS24:20C0FBF0 00000000 00000000 00000000 00000000 +0002B8 ATEXIT_FUNCS25:20C0FC04 00000000 00000000 00000000 00000000 +0002CC ATEXIT_FUNCS26:20C0FC18 00000000 00000000 00000000 00000000
+0002E0 ATEXIT_FUNCS27:20C0FC2C 00000000 00000000 00000000 00000000 +0002F4 ATEXIT_FUNCS28:20C0FC40 00000000 00000000 00000000 00000000 +000308 ATEXIT_FUNCS29:20C0FC54 00000000 00000000 00000000 00000000 +00031C ATEXIT_FUNCS30:20C0FC68 00000000 00000000 00000000 00000000 +000330 ATEXIT_FUNCS31:20C0FC7C 00000000 00000000 00000000 00000000 +000344 ATEXIT_FUNCS32:00000000 00000000 00000000 00000000 00000000 +000358 HEAD_FOREIGN_FECB:00000000 SNAP_DUMP_COUNT:00000000 +000360 ENVIRON:00000000 GETENV_BUF:00000000 +000368 _BUF_LEN:00000000 CDLL:21351CE0 +000370 INSPECT_GLOBALS:00000000 _JMP_BUFF:00000000 +000378 _BACK_END:00000000 _FLAGS:00000000 _TAB:00000000 +000384 INTOFFLIST:00000000 CGEN_CRENT:20C14FF8 _CPRMS:20C127A8 +000390 _CEDCXV:A0DF66D8 _CEDCOV:2117A9A8 +000398 _EPCBLIST:00000000 CAA_ADDR:20C13A10 +0003A0 CDLL_PENDING:00000000 USERIDLENGTH:00000006 +0003A8 TZSHR_1:20C102B8 TZSHR_2:20C102BC +0003B0 MAXUNGETCOUNT:0004 DLL_DIAG_FLAG:04 RWSTATIC:20C14FF8 +0003B8 RWLEN:00000008 CSGDLLI:00000000 DLLISIZE:00000000 +0003C4 IOGET_ANY:213244E8 _BELOW:213240B8 IOFREE_ANY:21323D80 +0003D0 _BELOW:21323A48 CSGSTINIT:00000000 STINITSIZE:00000000 +0003DC MTFMAINTASKBLK:00000000 SIGTABLE:20C103B8 +0003E4 INIT_STDIN:20C0F718 _STDOUT:20C0F2D8 +0003EC _STDERR:20C0F4F8 TABNUM:00000008 FLAGS2:00000000 +000400 OPENMVS_FLAGS:00 MRPSTDR:2100AA80 MWPSTDR:2100A8A8 +00040C MRPSTDC:21009EE0 MWPSTDC:21009D08 OWRP1:00000000 +000418 OWRP3:00000000 STATIC_EDCOV:00000000 GETENV_BUF2:00000000 +000424 _BUF2_LEN:00000000 DLCB_MUTEX:00000000 _CONDV:00000000 +000430 EDCOV:00000000 LCX:20C102B8 MUTEX_ATTR:00000000 +00043C STOR_INIT_B:00001000 _INCR_B:00001000 +000444 STOR_INIT:00003000 _INCR:00002000 DEMANGLE:00000000 +000454 TEMPR15:00000000 TERMINATE:210FC578 +00045C CXX_INV:00000000 D4_JOIN_MUTEX_ATTR:00000000 +000468 _MUTEX:00000000 _CONDV_ATTR:00000000 _CONDV:00000000 +000474 DLLANCHOR:00000000 DLLLAST:00000000 MEM24P:20C145A8 +000480 RTLMUTEX_ARRAYPTR:00000000 MSGCATLIST:00000000 +000488 SRCHP:00000000 ETOAP:00000000 ATOEP:00000000 +000494 NDMGMTP:00000000 POPENP:00000000 RND48P:00000000 +0004A0 BRK_HEAPID:00000000 _START:00000000 _CURRENT:00000000 +0004AC _END:00000000 RESTARTTABLE:00000000 SYSLOGP:00000000 +0004BC LOGIN_NAME:......... PREV_UMASK_VAL:00000000 +0004D0 HFP_LDBL_LMS:00100000 00000000 00000000 00000000 7FFFFFFF FFFFFFFF 71FFFFFF FFFFFFFF 26 +000500 BFP_LDBL_LMS:00010000 00000000 00000000 00000000 7FFEFFFF FFFFFFFF FFFFFFFF FFFFFFFF 3F +000590 HFP_DBL_LMS:00100000 00000000 7FFFFFFF FFFFFFFF 34100000 00000000 +0005A8 BFP_DBL_LMS:00100000 00000000 7FEFFFFF FFFFFFFF 3CB00000 00000000 7FF00000 00000000 FF +0005F0 HFP_MHDC:412B7E15 1628AED3 41171547 652B82FE 406F2DEC 549B9439 40B17217 F7D1CF7A 41 +000660 BFP_MHDC:4005BF0A 8B145769 3FF71547 652B82FE 3FDBCB7B 1526E50E 3FE62E42 FEFA39EF 40 +0006D0 HFP_FLT_LMS:00100000 7FFFFFFF 3C100000 +0006DC BFP_FLT_LMS:00800000 7F7FFFFF 34000000 7F800000 FF800000 7FA00000 FFA00000 7FC00000 FF +000700 HFP_FHDC:00000010 0006000E 001C0006 000F0020 FFC0FFC0 FFC0FFB2 FFB2FFB2 003F003F 00 +000728 BFP_FHDC:00010002 00180035 00710006 000F0021 FF83FC03 C003FFDB FECDECBD 00800400 40 +000750 ASCII_CCSID:0333 EBCDIC_CCSID:0417 LOGIN_NAME_A:......... +000760 CINFO_A:00000000 LC_C:20C108B0 _A:00000000 +00076C LCX_A:00000000 CORRESTABLE:00000000 +000774 TZSHR_A:00000000 00000000 CGENVEC31:20EA8500 +000780 CEDBVEC31:00000000 FORKQ_HEAD:00000000 +000788 FORKQ_TAIL:00000000 PTHREAD_YIELD1:0001D100 +000790 PTHREAD_YIELD2:00002E80 ICONV_MODE:U _TECH:LMREC.... +00079E _USERSET:D[4]CTHD: 20C0E8A0 +000000 CTHDEYE:CTHD SIZE:00000380 CTHDPTR:20C0E8A0 +00000C STORPTR:00000000 TOKPTR:2102F210 +000014 ASCTIME_RESULT:.......................... +00002E SNAP_DUMP_FLAG:00 GMTIME_BKDN:20C0EE28 +000034 TIMECALLED:00000000 DATECALLED:00000000
Chapter 3. Using Language Environment debugging facilities 119
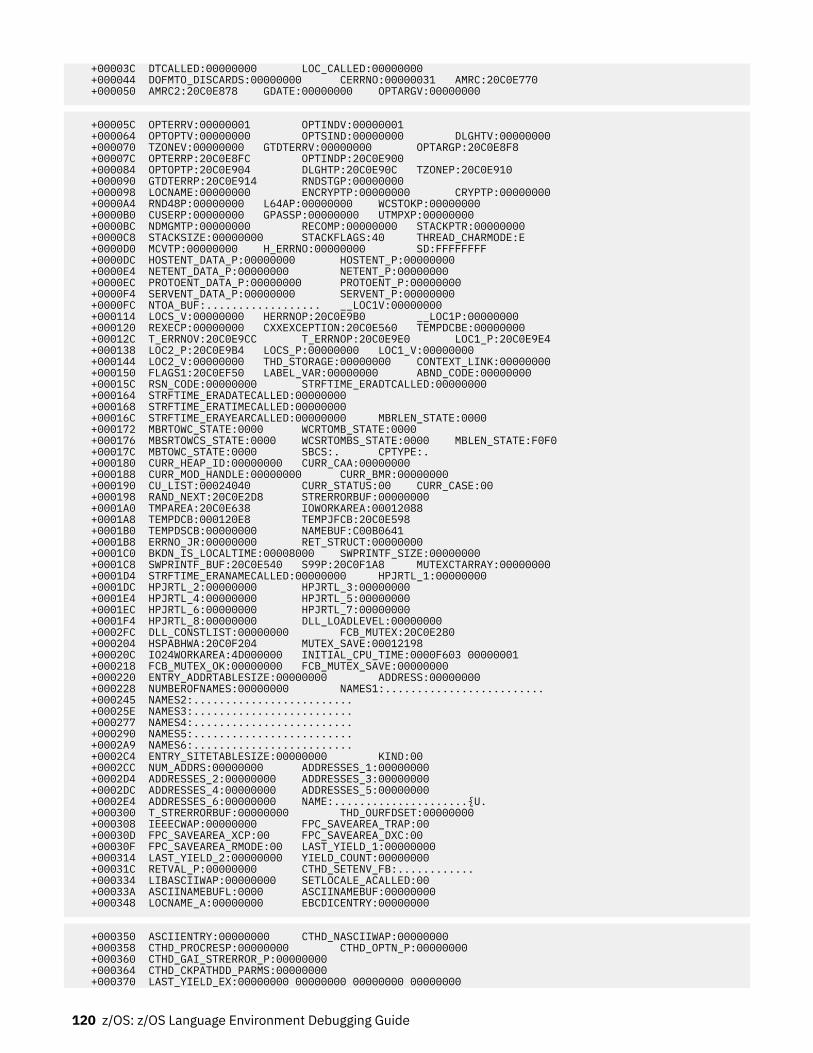
+00003C DTCALLED:00000000 LOC_CALLED:00000000 +000044 DOFMTO_DISCARDS:00000000 CERRNO:00000031 AMRC:20C0E770 +000050 AMRC2:20C0E878 GDATE:00000000 OPTARGV:00000000
+00005C OPTERRV:00000001 OPTINDV:00000001 +000064 OPTOPTV:00000000 OPTSIND:00000000 DLGHTV:00000000 +000070 TZONEV:00000000 GTDTERRV:00000000 OPTARGP:20C0E8F8 +00007C OPTERRP:20C0E8FC OPTINDP:20C0E900 +000084 OPTOPTP:20C0E904 DLGHTP:20C0E90C TZONEP:20C0E910 +000090 GTDTERRP:20C0E914 RNDSTGP:00000000 +000098 LOCNAME:00000000 ENCRYPTP:00000000 CRYPTP:00000000 +0000A4 RND48P:00000000 L64AP:00000000 WCSTOKP:00000000 +0000B0 CUSERP:00000000 GPASSP:00000000 UTMPXP:00000000 +0000BC NDMGMTP:00000000 RECOMP:00000000 STACKPTR:00000000 +0000C8 STACKSIZE:00000000 STACKFLAGS:40 THREAD_CHARMODE:E +0000D0 MCVTP:00000000 H_ERRNO:00000000 SD:FFFFFFFF +0000DC HOSTENT_DATA_P:00000000 HOSTENT_P:00000000 +0000E4 NETENT_DATA_P:00000000 NETENT_P:00000000 +0000EC PROTOENT_DATA_P:00000000 PROTOENT_P:00000000 +0000F4 SERVENT_DATA_P:00000000 SERVENT_P:00000000 +0000FC NTOA_BUF:.................. __LOC1V:00000000 +000114 LOCS_V:00000000 HERRNOP:20C0E9B0 __LOC1P:00000000 +000120 REXECP:00000000 CXXEXCEPTION:20C0E560 TEMPDCBE:00000000 +00012C T_ERRNOV:20C0E9CC T_ERRNOP:20C0E9E0 LOC1_P:20C0E9E4 +000138 LOC2_P:20C0E9B4 LOCS_P:00000000 LOC1_V:00000000 +000144 LOC2_V:00000000 THD_STORAGE:00000000 CONTEXT_LINK:00000000 +000150 FLAGS1:20C0EF50 LABEL_VAR:00000000 ABND_CODE:00000000 +00015C RSN_CODE:00000000 STRFTIME_ERADTCALLED:00000000 +000164 STRFTIME_ERADATECALLED:00000000 +000168 STRFTIME_ERATIMECALLED:00000000 +00016C STRFTIME_ERAYEARCALLED:00000000 MBRLEN_STATE:0000 +000172 MBRTOWC_STATE:0000 WCRTOMB_STATE:0000 +000176 MBSRTOWCS_STATE:0000 WCSRTOMBS_STATE:0000 MBLEN_STATE:F0F0 +00017C MBTOWC_STATE:0000 SBCS:. CPTYPE:. +000180 CURR_HEAP_ID:00000000 CURR_CAA:00000000 +000188 CURR_MOD_HANDLE:00000000 CURR_BMR:00000000 +000190 CU_LIST:00024040 CURR_STATUS:00 CURR_CASE:00 +000198 RAND_NEXT:20C0E2D8 STRERRORBUF:00000000 +0001A0 TMPAREA:20C0E638 IOWORKAREA:00012088 +0001A8 TEMPDCB:000120E8 TEMPJFCB:20C0E598 +0001B0 TEMPDSCB:00000000 NAMEBUF:C00B0641 +0001B8 ERRNO_JR:00000000 RET_STRUCT:00000000 +0001C0 BKDN_IS_LOCALTIME:00008000 SWPRINTF_SIZE:00000000 +0001C8 SWPRINTF_BUF:20C0E540 S99P:20C0F1A8 MUTEXCTARRAY:00000000 +0001D4 STRFTIME_ERANAMECALLED:00000000 HPJRTL_1:00000000 +0001DC HPJRTL_2:00000000 HPJRTL_3:00000000 +0001E4 HPJRTL_4:00000000 HPJRTL_5:00000000 +0001EC HPJRTL_6:00000000 HPJRTL_7:00000000 +0001F4 HPJRTL_8:00000000 DLL_LOADLEVEL:00000000 +0002FC DLL_CONSTLIST:00000000 FCB_MUTEX:20C0E280 +000204 HSPABHWA:20C0F204 MUTEX_SAVE:00012198 +00020C IO24WORKAREA:4D000000 INITIAL_CPU_TIME:0000F603 00000001 +000218 FCB_MUTEX_OK:00000000 FCB_MUTEX_SAVE:00000000 +000220 ENTRY_ADDRTABLESIZE:00000000 ADDRESS:00000000 +000228 NUMBEROFNAMES:00000000 NAMES1:......................... +000245 NAMES2:......................... +00025E NAMES3:......................... +000277 NAMES4:......................... +000290 NAMES5:......................... +0002A9 NAMES6:......................... +0002C4 ENTRY_SITETABLESIZE:00000000 KIND:00 +0002CC NUM_ADDRS:00000000 ADDRESSES_1:00000000 +0002D4 ADDRESSES_2:00000000 ADDRESSES_3:00000000 +0002DC ADDRESSES_4:00000000 ADDRESSES_5:00000000 +0002E4 ADDRESSES_6:00000000 NAME:.....................{U. +000300 T_STRERRORBUF:00000000 THD_OURFDSET:00000000 +000308 IEEECWAP:00000000 FPC_SAVEAREA_TRAP:00 +00030D FPC_SAVEAREA_XCP:00 FPC_SAVEAREA_DXC:00 +00030F FPC_SAVEAREA_RMODE:00 LAST_YIELD_1:00000000 +000314 LAST_YIELD_2:00000000 YIELD_COUNT:00000000 +00031C RETVAL_P:00000000 CTHD_SETENV_FB:............ +000334 LIBASCIIWAP:00000000 SETLOCALE_ACALLED:00 +00033A ASCIINAMEBUFL:0000 ASCIINAMEBUF:00000000 +000348 LOCNAME_A:00000000 EBCDICENTRY:00000000
+000350 ASCIIENTRY:00000000 CTHD_NASCIIWAP:00000000 +000358 CTHD_PROCRESP:00000000 CTHD_OPTN_P:00000000 +000360 CTHD_GAI_STRERROR_P:00000000 +000364 CTHD_CKPATHDD_PARMS:00000000 +000370 LAST_YIELD_EX:00000000 00000000 00000000 00000000
120 z/OS: z/OS Language Environment Debugging Guide
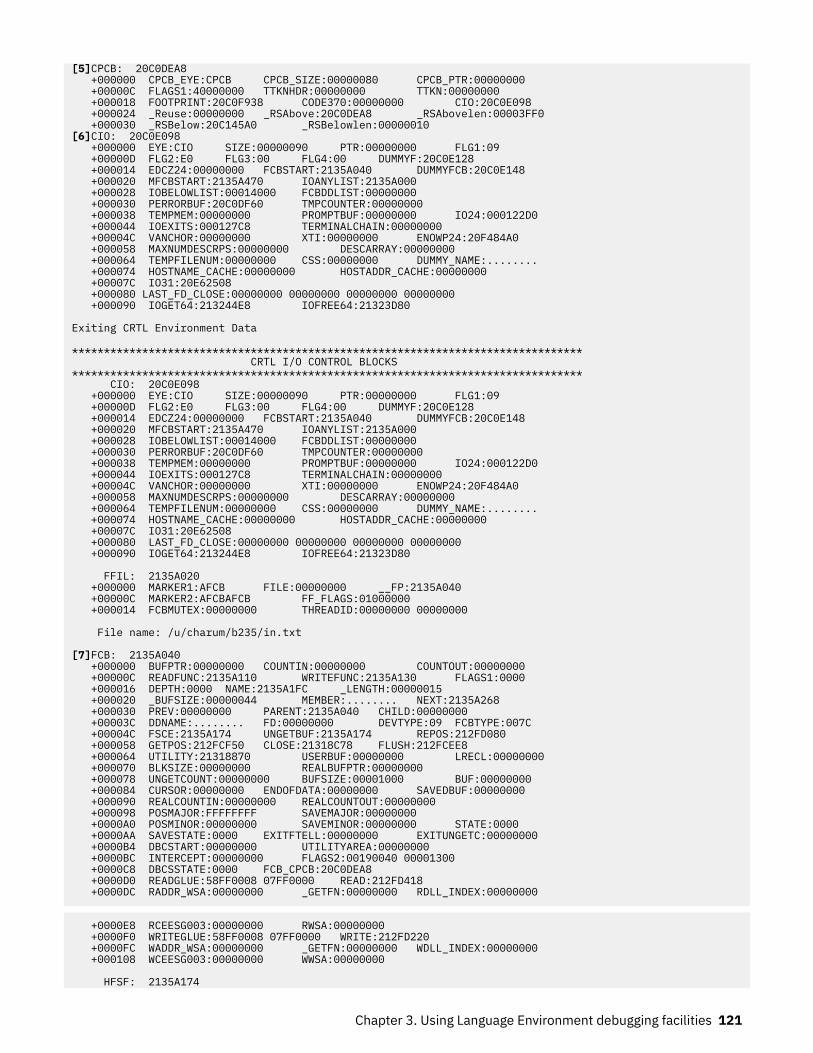
[5]CPCB: 20C0DEA8 +000000 CPCB_EYE:CPCB CPCB_SIZE:00000080 CPCB_PTR:00000000 +00000C FLAGS1:40000000 TTKNHDR:00000000 TTKN:00000000 +000018 FOOTPRINT:20C0F938 CODE370:00000000 CIO:20C0E098 +000024 _Reuse:00000000 _RSAbove:20C0DEA8 _RSAbovelen:00003FF0 +000030 _RSBelow:20C145A0 _RSBelowlen:00000010[6]CIO: 20C0E098 +000000 EYE:CIO SIZE:00000090 PTR:00000000 FLG1:09 +00000D FLG2:E0 FLG3:00 FLG4:00 DUMMYF:20C0E128 +000014 EDCZ24:00000000 FCBSTART:2135A040 DUMMYFCB:20C0E148 +000020 MFCBSTART:2135A470 IOANYLIST:2135A000 +000028 IOBELOWLIST:00014000 FCBDDLIST:00000000 +000030 PERRORBUF:20C0DF60 TMPCOUNTER:00000000 +000038 TEMPMEM:00000000 PROMPTBUF:00000000 IO24:000122D0 +000044 IOEXITS:000127C8 TERMINALCHAIN:00000000 +00004C VANCHOR:00000000 XTI:00000000 ENOWP24:20F484A0 +000058 MAXNUMDESCRPS:00000000 DESCARRAY:00000000 +000064 TEMPFILENUM:00000000 CSS:00000000 DUMMY_NAME:........ +000074 HOSTNAME_CACHE:00000000 HOSTADDR_CACHE:00000000 +00007C IO31:20E62508 +000080 LAST_FD_CLOSE:00000000 00000000 00000000 00000000 +000090 IOGET64:213244E8 IOFREE64:21323D80
Exiting CRTL Environment Data
******************************************************************************** CRTL I/O CONTROL BLOCKS******************************************************************************** CIO: 20C0E098 +000000 EYE:CIO SIZE:00000090 PTR:00000000 FLG1:09 +00000D FLG2:E0 FLG3:00 FLG4:00 DUMMYF:20C0E128 +000014 EDCZ24:00000000 FCBSTART:2135A040 DUMMYFCB:20C0E148 +000020 MFCBSTART:2135A470 IOANYLIST:2135A000 +000028 IOBELOWLIST:00014000 FCBDDLIST:00000000 +000030 PERRORBUF:20C0DF60 TMPCOUNTER:00000000 +000038 TEMPMEM:00000000 PROMPTBUF:00000000 IO24:000122D0 +000044 IOEXITS:000127C8 TERMINALCHAIN:00000000 +00004C VANCHOR:00000000 XTI:00000000 ENOWP24:20F484A0 +000058 MAXNUMDESCRPS:00000000 DESCARRAY:00000000 +000064 TEMPFILENUM:00000000 CSS:00000000 DUMMY_NAME:........ +000074 HOSTNAME_CACHE:00000000 HOSTADDR_CACHE:00000000 +00007C IO31:20E62508 +000080 LAST_FD_CLOSE:00000000 00000000 00000000 00000000 +000090 IOGET64:213244E8 IOFREE64:21323D80
FFIL: 2135A020 +000000 MARKER1:AFCB FILE:00000000 __FP:2135A040 +00000C MARKER2:AFCBAFCB FF_FLAGS:01000000 +000014 FCBMUTEX:00000000 THREADID:00000000 00000000
File name: /u/charum/b235/in.txt
[7]FCB: 2135A040 +000000 BUFPTR:00000000 COUNTIN:00000000 COUNTOUT:00000000 +00000C READFUNC:2135A110 WRITEFUNC:2135A130 FLAGS1:0000 +000016 DEPTH:0000 NAME:2135A1FC _LENGTH:00000015 +000020 _BUFSIZE:00000044 MEMBER:........ NEXT:2135A268 +000030 PREV:00000000 PARENT:2135A040 CHILD:00000000 +00003C DDNAME:........ FD:00000000 DEVTYPE:09 FCBTYPE:007C +00004C FSCE:2135A174 UNGETBUF:2135A174 REPOS:212FD080 +000058 GETPOS:212FCF50 CLOSE:21318C78 FLUSH:212FCEE8 +000064 UTILITY:21318870 USERBUF:00000000 LRECL:00000000 +000070 BLKSIZE:00000000 REALBUFPTR:00000000 +000078 UNGETCOUNT:00000000 BUFSIZE:00001000 BUF:00000000 +000084 CURSOR:00000000 ENDOFDATA:00000000 SAVEDBUF:00000000 +000090 REALCOUNTIN:00000000 REALCOUNTOUT:00000000 +000098 POSMAJOR:FFFFFFFF SAVEMAJOR:00000000 +0000A0 POSMINOR:00000000 SAVEMINOR:00000000 STATE:0000 +0000AA SAVESTATE:0000 EXITFTELL:00000000 EXITUNGETC:00000000 +0000B4 DBCSTART:00000000 UTILITYAREA:00000000 +0000BC INTERCEPT:00000000 FLAGS2:00190040 00001300 +0000C8 DBCSSTATE:0000 FCB_CPCB:20C0DEA8 +0000D0 READGLUE:58FF0008 07FF0000 READ:212FD418 +0000DC RADDR_WSA:00000000 _GETFN:00000000 RDLL_INDEX:00000000
+0000E8 RCEESG003:00000000 RWSA:00000000 +0000F0 WRITEGLUE:58FF0008 07FF0000 WRITE:212FD220 +0000FC WADDR_WSA:00000000 _GETFN:00000000 WDLL_INDEX:00000000 +000108 WCEESG003:00000000 WWSA:00000000
HFSF: 2135A174
Chapter 3. Using Language Environment debugging facilities 121
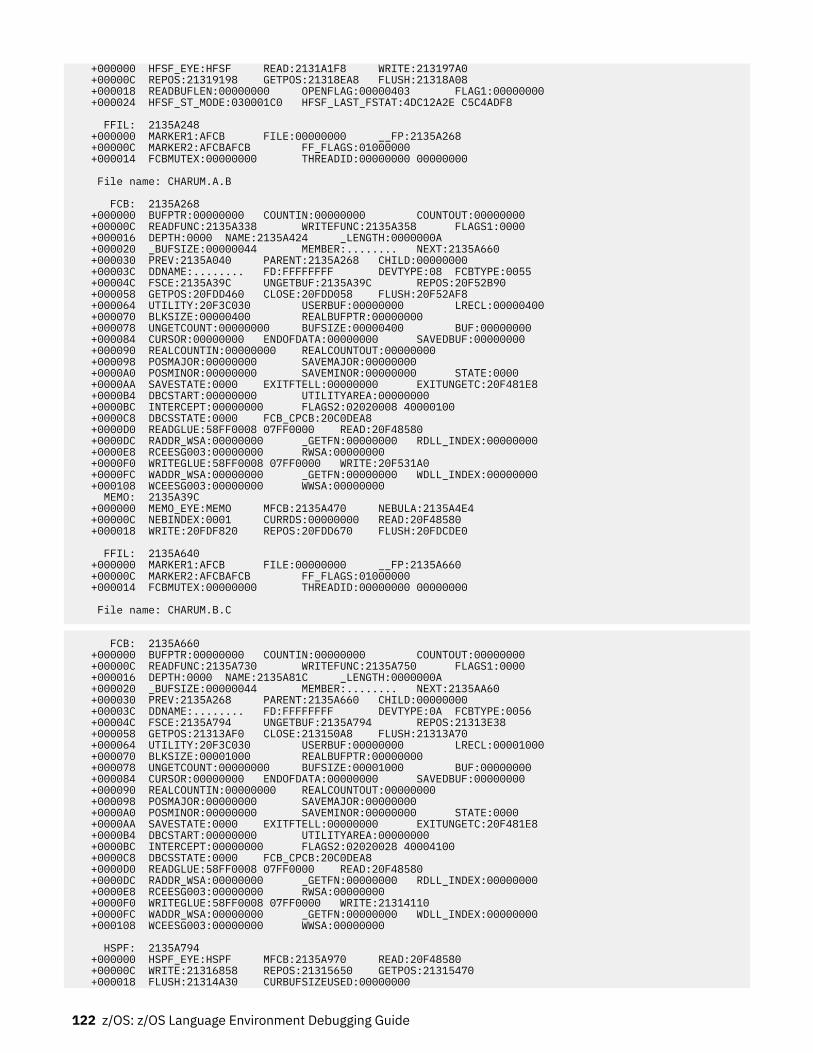
+000000 HFSF_EYE:HFSF READ:2131A1F8 WRITE:213197A0 +00000C REPOS:21319198 GETPOS:21318EA8 FLUSH:21318A08 +000018 READBUFLEN:00000000 OPENFLAG:00000403 FLAG1:00000000 +000024 HFSF_ST_MODE:030001C0 HFSF_LAST_FSTAT:4DC12A2E C5C4ADF8
FFIL: 2135A248 +000000 MARKER1:AFCB FILE:00000000 __FP:2135A268 +00000C MARKER2:AFCBAFCB FF_FLAGS:01000000 +000014 FCBMUTEX:00000000 THREADID:00000000 00000000
File name: CHARUM.A.B
FCB: 2135A268 +000000 BUFPTR:00000000 COUNTIN:00000000 COUNTOUT:00000000 +00000C READFUNC:2135A338 WRITEFUNC:2135A358 FLAGS1:0000 +000016 DEPTH:0000 NAME:2135A424 _LENGTH:0000000A +000020 _BUFSIZE:00000044 MEMBER:........ NEXT:2135A660 +000030 PREV:2135A040 PARENT:2135A268 CHILD:00000000 +00003C DDNAME:........ FD:FFFFFFFF DEVTYPE:08 FCBTYPE:0055 +00004C FSCE:2135A39C UNGETBUF:2135A39C REPOS:20F52B90 +000058 GETPOS:20FDD460 CLOSE:20FDD058 FLUSH:20F52AF8 +000064 UTILITY:20F3C030 USERBUF:00000000 LRECL:00000400 +000070 BLKSIZE:00000400 REALBUFPTR:00000000 +000078 UNGETCOUNT:00000000 BUFSIZE:00000400 BUF:00000000 +000084 CURSOR:00000000 ENDOFDATA:00000000 SAVEDBUF:00000000 +000090 REALCOUNTIN:00000000 REALCOUNTOUT:00000000 +000098 POSMAJOR:00000000 SAVEMAJOR:00000000 +0000A0 POSMINOR:00000000 SAVEMINOR:00000000 STATE:0000 +0000AA SAVESTATE:0000 EXITFTELL:00000000 EXITUNGETC:20F481E8 +0000B4 DBCSTART:00000000 UTILITYAREA:00000000 +0000BC INTERCEPT:00000000 FLAGS2:02020008 40000100 +0000C8 DBCSSTATE:0000 FCB_CPCB:20C0DEA8 +0000D0 READGLUE:58FF0008 07FF0000 READ:20F48580 +0000DC RADDR_WSA:00000000 _GETFN:00000000 RDLL_INDEX:00000000 +0000E8 RCEESG003:00000000 RWSA:00000000 +0000F0 WRITEGLUE:58FF0008 07FF0000 WRITE:20F531A0 +0000FC WADDR_WSA:00000000 _GETFN:00000000 WDLL_INDEX:00000000 +000108 WCEESG003:00000000 WWSA:00000000 MEMO: 2135A39C +000000 MEMO_EYE:MEMO MFCB:2135A470 NEBULA:2135A4E4 +00000C NEBINDEX:0001 CURRDS:00000000 READ:20F48580 +000018 WRITE:20FDF820 REPOS:20FDD670 FLUSH:20FDCDE0
FFIL: 2135A640 +000000 MARKER1:AFCB FILE:00000000 __FP:2135A660 +00000C MARKER2:AFCBAFCB FF_FLAGS:01000000 +000014 FCBMUTEX:00000000 THREADID:00000000 00000000
File name: CHARUM.B.C
FCB: 2135A660 +000000 BUFPTR:00000000 COUNTIN:00000000 COUNTOUT:00000000 +00000C READFUNC:2135A730 WRITEFUNC:2135A750 FLAGS1:0000 +000016 DEPTH:0000 NAME:2135A81C _LENGTH:0000000A +000020 _BUFSIZE:00000044 MEMBER:........ NEXT:2135AA60 +000030 PREV:2135A268 PARENT:2135A660 CHILD:00000000 +00003C DDNAME:........ FD:FFFFFFFF DEVTYPE:0A FCBTYPE:0056 +00004C FSCE:2135A794 UNGETBUF:2135A794 REPOS:21313E38 +000058 GETPOS:21313AF0 CLOSE:213150A8 FLUSH:21313A70 +000064 UTILITY:20F3C030 USERBUF:00000000 LRECL:00001000 +000070 BLKSIZE:00001000 REALBUFPTR:00000000 +000078 UNGETCOUNT:00000000 BUFSIZE:00001000 BUF:00000000 +000084 CURSOR:00000000 ENDOFDATA:00000000 SAVEDBUF:00000000 +000090 REALCOUNTIN:00000000 REALCOUNTOUT:00000000 +000098 POSMAJOR:00000000 SAVEMAJOR:00000000 +0000A0 POSMINOR:00000000 SAVEMINOR:00000000 STATE:0000 +0000AA SAVESTATE:0000 EXITFTELL:00000000 EXITUNGETC:20F481E8 +0000B4 DBCSTART:00000000 UTILITYAREA:00000000 +0000BC INTERCEPT:00000000 FLAGS2:02020028 40004100 +0000C8 DBCSSTATE:0000 FCB_CPCB:20C0DEA8 +0000D0 READGLUE:58FF0008 07FF0000 READ:20F48580 +0000DC RADDR_WSA:00000000 _GETFN:00000000 RDLL_INDEX:00000000 +0000E8 RCEESG003:00000000 RWSA:00000000 +0000F0 WRITEGLUE:58FF0008 07FF0000 WRITE:21314110 +0000FC WADDR_WSA:00000000 _GETFN:00000000 WDLL_INDEX:00000000 +000108 WCEESG003:00000000 WWSA:00000000
HSPF: 2135A794 +000000 HSPF_EYE:HSPF MFCB:2135A970 READ:20F48580 +00000C WRITE:21316858 REPOS:21315650 GETPOS:21315470 +000018 FLUSH:21314A30 CURBUFSIZEUSED:00000000
122 z/OS: z/OS Language Environment Debugging Guide
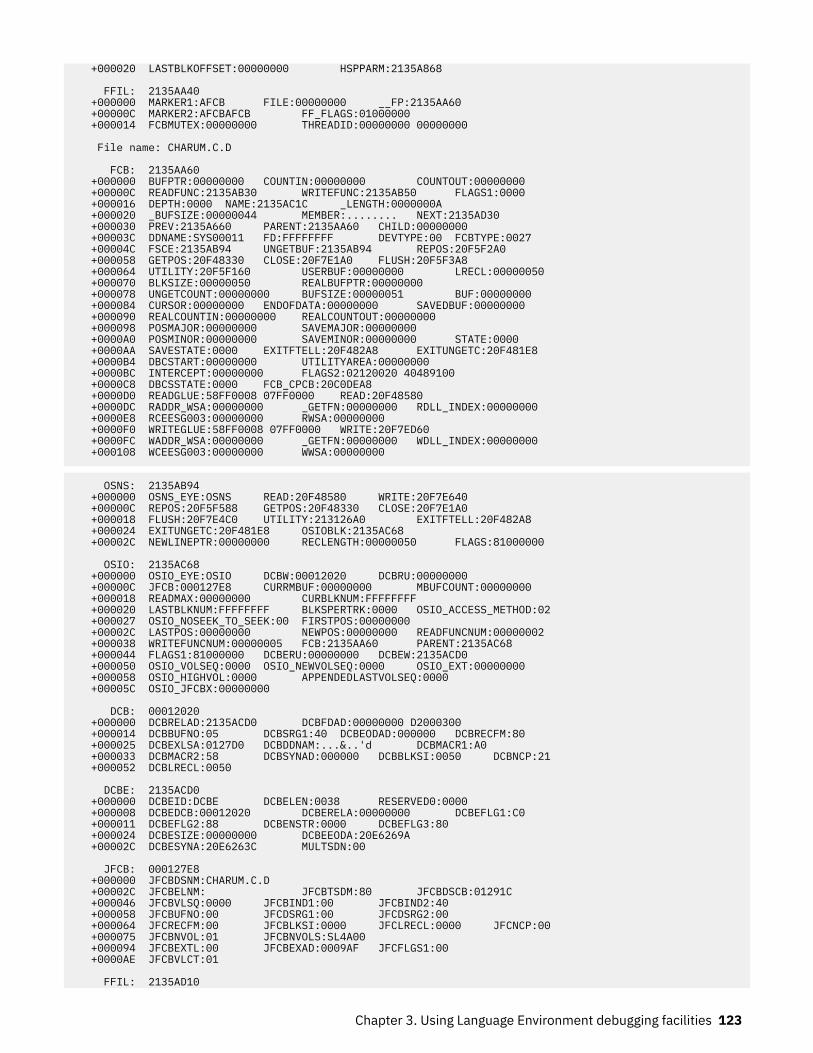
+000020 LASTBLKOFFSET:00000000 HSPPARM:2135A868
FFIL: 2135AA40 +000000 MARKER1:AFCB FILE:00000000 __FP:2135AA60 +00000C MARKER2:AFCBAFCB FF_FLAGS:01000000 +000014 FCBMUTEX:00000000 THREADID:00000000 00000000
File name: CHARUM.C.D
FCB: 2135AA60 +000000 BUFPTR:00000000 COUNTIN:00000000 COUNTOUT:00000000 +00000C READFUNC:2135AB30 WRITEFUNC:2135AB50 FLAGS1:0000 +000016 DEPTH:0000 NAME:2135AC1C _LENGTH:0000000A +000020 _BUFSIZE:00000044 MEMBER:........ NEXT:2135AD30 +000030 PREV:2135A660 PARENT:2135AA60 CHILD:00000000 +00003C DDNAME:SYS00011 FD:FFFFFFFF DEVTYPE:00 FCBTYPE:0027 +00004C FSCE:2135AB94 UNGETBUF:2135AB94 REPOS:20F5F2A0 +000058 GETPOS:20F48330 CLOSE:20F7E1A0 FLUSH:20F5F3A8 +000064 UTILITY:20F5F160 USERBUF:00000000 LRECL:00000050 +000070 BLKSIZE:00000050 REALBUFPTR:00000000 +000078 UNGETCOUNT:00000000 BUFSIZE:00000051 BUF:00000000 +000084 CURSOR:00000000 ENDOFDATA:00000000 SAVEDBUF:00000000 +000090 REALCOUNTIN:00000000 REALCOUNTOUT:00000000 +000098 POSMAJOR:00000000 SAVEMAJOR:00000000 +0000A0 POSMINOR:00000000 SAVEMINOR:00000000 STATE:0000 +0000AA SAVESTATE:0000 EXITFTELL:20F482A8 EXITUNGETC:20F481E8 +0000B4 DBCSTART:00000000 UTILITYAREA:00000000 +0000BC INTERCEPT:00000000 FLAGS2:02120020 40489100 +0000C8 DBCSSTATE:0000 FCB_CPCB:20C0DEA8 +0000D0 READGLUE:58FF0008 07FF0000 READ:20F48580 +0000DC RADDR_WSA:00000000 _GETFN:00000000 RDLL_INDEX:00000000 +0000E8 RCEESG003:00000000 RWSA:00000000 +0000F0 WRITEGLUE:58FF0008 07FF0000 WRITE:20F7ED60 +0000FC WADDR_WSA:00000000 _GETFN:00000000 WDLL_INDEX:00000000 +000108 WCEESG003:00000000 WWSA:00000000
OSNS: 2135AB94 +000000 OSNS_EYE:OSNS READ:20F48580 WRITE:20F7E640 +00000C REPOS:20F5F588 GETPOS:20F48330 CLOSE:20F7E1A0 +000018 FLUSH:20F7E4C0 UTILITY:213126A0 EXITFTELL:20F482A8 +000024 EXITUNGETC:20F481E8 OSIOBLK:2135AC68 +00002C NEWLINEPTR:00000000 RECLENGTH:00000050 FLAGS:81000000
OSIO: 2135AC68 +000000 OSIO_EYE:OSIO DCBW:00012020 DCBRU:00000000 +00000C JFCB:000127E8 CURRMBUF:00000000 MBUFCOUNT:00000000 +000018 READMAX:00000000 CURBLKNUM:FFFFFFFF +000020 LASTBLKNUM:FFFFFFFF BLKSPERTRK:0000 OSIO_ACCESS_METHOD:02 +000027 OSIO_NOSEEK_TO_SEEK:00 FIRSTPOS:00000000 +00002C LASTPOS:00000000 NEWPOS:00000000 READFUNCNUM:00000002 +000038 WRITEFUNCNUM:00000005 FCB:2135AA60 PARENT:2135AC68 +000044 FLAGS1:81000000 DCBERU:00000000 DCBEW:2135ACD0 +000050 OSIO_VOLSEQ:0000 OSIO_NEWVOLSEQ:0000 OSIO_EXT:00000000 +000058 OSIO_HIGHVOL:0000 APPENDEDLASTVOLSEQ:0000 +00005C OSIO_JFCBX:00000000
DCB: 00012020 +000000 DCBRELAD:2135ACD0 DCBFDAD:00000000 D2000300 +000014 DCBBUFNO:05 DCBSRG1:40 DCBEODAD:000000 DCBRECFM:80 +000025 DCBEXLSA:0127D0 DCBDDNAM:...&..'d DCBMACR1:A0 +000033 DCBMACR2:58 DCBSYNAD:000000 DCBBLKSI:0050 DCBNCP:21 +000052 DCBLRECL:0050
DCBE: 2135ACD0 +000000 DCBEID:DCBE DCBELEN:0038 RESERVED0:0000 +000008 DCBEDCB:00012020 DCBERELA:00000000 DCBEFLG1:C0 +000011 DCBEFLG2:88 DCBENSTR:0000 DCBEFLG3:80 +000024 DCBESIZE:00000000 DCBEEODA:20E6269A +00002C DCBESYNA:20E6263C MULTSDN:00
JFCB: 000127E8 +000000 JFCBDSNM:CHARUM.C.D +00002C JFCBELNM: JFCBTSDM:80 JFCBDSCB:01291C +000046 JFCBVLSQ:0000 JFCBIND1:00 JFCBIND2:40 +000058 JFCBUFNO:00 JFCDSRG1:00 JFCDSRG2:00 +000064 JFCRECFM:00 JFCBLKSI:0000 JFCLRECL:0000 JFCNCP:00 +000075 JFCBNVOL:01 JFCBNVOLS:SL4A00 +000094 JFCBEXTL:00 JFCBEXAD:0009AF JFCFLGS1:00 +0000AE JFCBVLCT:01
FFIL: 2135AD10
Chapter 3. Using Language Environment debugging facilities 123
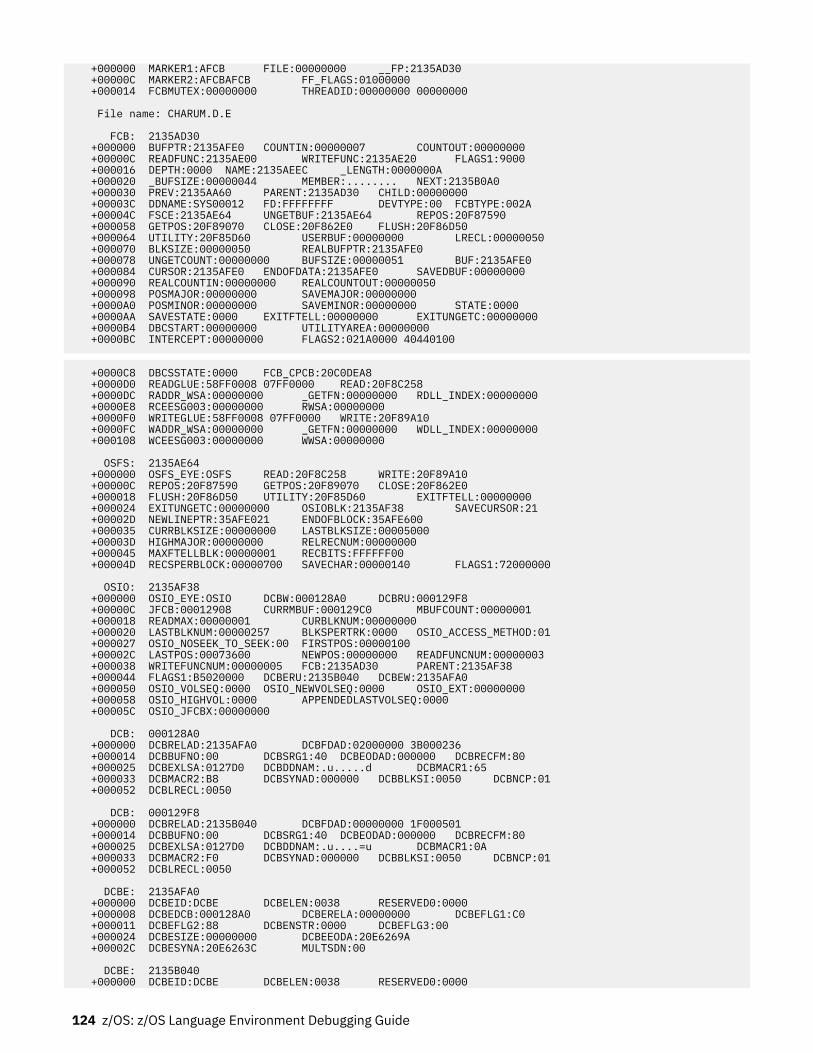
+000000 MARKER1:AFCB FILE:00000000 __FP:2135AD30 +00000C MARKER2:AFCBAFCB FF_FLAGS:01000000 +000014 FCBMUTEX:00000000 THREADID:00000000 00000000
File name: CHARUM.D.E
FCB: 2135AD30 +000000 BUFPTR:2135AFE0 COUNTIN:00000007 COUNTOUT:00000000 +00000C READFUNC:2135AE00 WRITEFUNC:2135AE20 FLAGS1:9000 +000016 DEPTH:0000 NAME:2135AEEC _LENGTH:0000000A +000020 _BUFSIZE:00000044 MEMBER:........ NEXT:2135B0A0 +000030 PREV:2135AA60 PARENT:2135AD30 CHILD:00000000 +00003C DDNAME:SYS00012 FD:FFFFFFFF DEVTYPE:00 FCBTYPE:002A +00004C FSCE:2135AE64 UNGETBUF:2135AE64 REPOS:20F87590 +000058 GETPOS:20F89070 CLOSE:20F862E0 FLUSH:20F86D50 +000064 UTILITY:20F85D60 USERBUF:00000000 LRECL:00000050 +000070 BLKSIZE:00000050 REALBUFPTR:2135AFE0 +000078 UNGETCOUNT:00000000 BUFSIZE:00000051 BUF:2135AFE0 +000084 CURSOR:2135AFE0 ENDOFDATA:2135AFE0 SAVEDBUF:00000000 +000090 REALCOUNTIN:00000000 REALCOUNTOUT:00000050 +000098 POSMAJOR:00000000 SAVEMAJOR:00000000 +0000A0 POSMINOR:00000000 SAVEMINOR:00000000 STATE:0000 +0000AA SAVESTATE:0000 EXITFTELL:00000000 EXITUNGETC:00000000 +0000B4 DBCSTART:00000000 UTILITYAREA:00000000 +0000BC INTERCEPT:00000000 FLAGS2:021A0000 40440100
+0000C8 DBCSSTATE:0000 FCB_CPCB:20C0DEA8 +0000D0 READGLUE:58FF0008 07FF0000 READ:20F8C258 +0000DC RADDR_WSA:00000000 _GETFN:00000000 RDLL_INDEX:00000000 +0000E8 RCEESG003:00000000 RWSA:00000000 +0000F0 WRITEGLUE:58FF0008 07FF0000 WRITE:20F89A10 +0000FC WADDR_WSA:00000000 _GETFN:00000000 WDLL_INDEX:00000000 +000108 WCEESG003:00000000 WWSA:00000000
OSFS: 2135AE64 +000000 OSFS_EYE:OSFS READ:20F8C258 WRITE:20F89A10 +00000C REPOS:20F87590 GETPOS:20F89070 CLOSE:20F862E0 +000018 FLUSH:20F86D50 UTILITY:20F85D60 EXITFTELL:00000000 +000024 EXITUNGETC:00000000 OSIOBLK:2135AF38 SAVECURSOR:21 +00002D NEWLINEPTR:35AFE021 ENDOFBLOCK:35AFE600 +000035 CURRBLKSIZE:00000000 LASTBLKSIZE:00005000 +00003D HIGHMAJOR:00000000 RELRECNUM:00000000 +000045 MAXFTELLBLK:00000001 RECBITS:FFFFFF00 +00004D RECSPERBLOCK:00000700 SAVECHAR:00000140 FLAGS1:72000000
OSIO: 2135AF38 +000000 OSIO_EYE:OSIO DCBW:000128A0 DCBRU:000129F8 +00000C JFCB:00012908 CURRMBUF:000129C0 MBUFCOUNT:00000001 +000018 READMAX:00000001 CURBLKNUM:00000000 +000020 LASTBLKNUM:00000257 BLKSPERTRK:0000 OSIO_ACCESS_METHOD:01 +000027 OSIO_NOSEEK_TO_SEEK:00 FIRSTPOS:00000100 +00002C LASTPOS:00073600 NEWPOS:00000000 READFUNCNUM:00000003 +000038 WRITEFUNCNUM:00000005 FCB:2135AD30 PARENT:2135AF38 +000044 FLAGS1:B5020000 DCBERU:2135B040 DCBEW:2135AFA0 +000050 OSIO_VOLSEQ:0000 OSIO_NEWVOLSEQ:0000 OSIO_EXT:00000000 +000058 OSIO_HIGHVOL:0000 APPENDEDLASTVOLSEQ:0000 +00005C OSIO_JFCBX:00000000
DCB: 000128A0 +000000 DCBRELAD:2135AFA0 DCBFDAD:02000000 3B000236 +000014 DCBBUFNO:00 DCBSRG1:40 DCBEODAD:000000 DCBRECFM:80 +000025 DCBEXLSA:0127D0 DCBDDNAM:.u.....d DCBMACR1:65 +000033 DCBMACR2:B8 DCBSYNAD:000000 DCBBLKSI:0050 DCBNCP:01 +000052 DCBLRECL:0050
DCB: 000129F8 +000000 DCBRELAD:2135B040 DCBFDAD:00000000 1F000501 +000014 DCBBUFNO:00 DCBSRG1:40 DCBEODAD:000000 DCBRECFM:80 +000025 DCBEXLSA:0127D0 DCBDDNAM:.u....=u DCBMACR1:0A +000033 DCBMACR2:F0 DCBSYNAD:000000 DCBBLKSI:0050 DCBNCP:01 +000052 DCBLRECL:0050
DCBE: 2135AFA0 +000000 DCBEID:DCBE DCBELEN:0038 RESERVED0:0000 +000008 DCBEDCB:000128A0 DCBERELA:00000000 DCBEFLG1:C0 +000011 DCBEFLG2:88 DCBENSTR:0000 DCBEFLG3:00 +000024 DCBESIZE:00000000 DCBEEODA:20E6269A +00002C DCBESYNA:20E6263C MULTSDN:00
DCBE: 2135B040 +000000 DCBEID:DCBE DCBELEN:0038 RESERVED0:0000
124 z/OS: z/OS Language Environment Debugging Guide
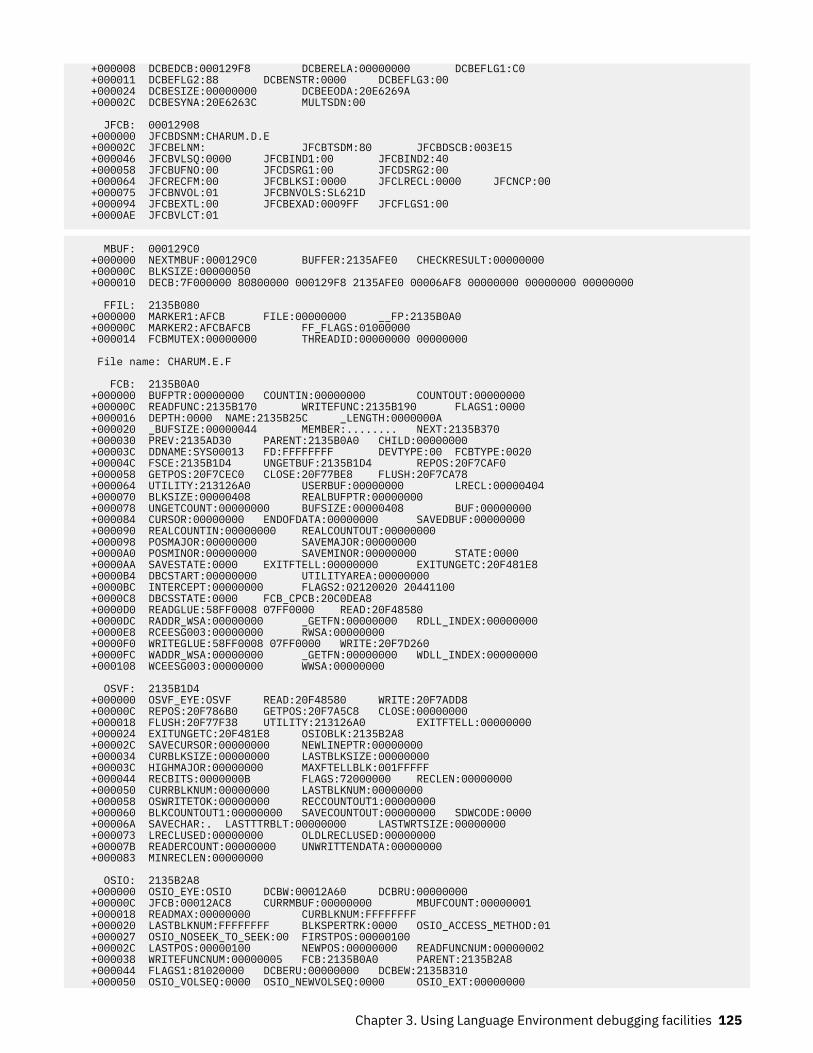
+000008 DCBEDCB:000129F8 DCBERELA:00000000 DCBEFLG1:C0 +000011 DCBEFLG2:88 DCBENSTR:0000 DCBEFLG3:00 +000024 DCBESIZE:00000000 DCBEEODA:20E6269A +00002C DCBESYNA:20E6263C MULTSDN:00
JFCB: 00012908 +000000 JFCBDSNM:CHARUM.D.E +00002C JFCBELNM: JFCBTSDM:80 JFCBDSCB:003E15 +000046 JFCBVLSQ:0000 JFCBIND1:00 JFCBIND2:40 +000058 JFCBUFNO:00 JFCDSRG1:00 JFCDSRG2:00 +000064 JFCRECFM:00 JFCBLKSI:0000 JFCLRECL:0000 JFCNCP:00 +000075 JFCBNVOL:01 JFCBNVOLS:SL621D +000094 JFCBEXTL:00 JFCBEXAD:0009FF JFCFLGS1:00 +0000AE JFCBVLCT:01
MBUF: 000129C0 +000000 NEXTMBUF:000129C0 BUFFER:2135AFE0 CHECKRESULT:00000000 +00000C BLKSIZE:00000050 +000010 DECB:7F000000 80800000 000129F8 2135AFE0 00006AF8 00000000 00000000 00000000
FFIL: 2135B080 +000000 MARKER1:AFCB FILE:00000000 __FP:2135B0A0 +00000C MARKER2:AFCBAFCB FF_FLAGS:01000000 +000014 FCBMUTEX:00000000 THREADID:00000000 00000000
File name: CHARUM.E.F
FCB: 2135B0A0 +000000 BUFPTR:00000000 COUNTIN:00000000 COUNTOUT:00000000 +00000C READFUNC:2135B170 WRITEFUNC:2135B190 FLAGS1:0000 +000016 DEPTH:0000 NAME:2135B25C _LENGTH:0000000A +000020 _BUFSIZE:00000044 MEMBER:........ NEXT:2135B370 +000030 PREV:2135AD30 PARENT:2135B0A0 CHILD:00000000 +00003C DDNAME:SYS00013 FD:FFFFFFFF DEVTYPE:00 FCBTYPE:0020 +00004C FSCE:2135B1D4 UNGETBUF:2135B1D4 REPOS:20F7CAF0 +000058 GETPOS:20F7CEC0 CLOSE:20F77BE8 FLUSH:20F7CA78 +000064 UTILITY:213126A0 USERBUF:00000000 LRECL:00000404 +000070 BLKSIZE:00000408 REALBUFPTR:00000000 +000078 UNGETCOUNT:00000000 BUFSIZE:00000408 BUF:00000000 +000084 CURSOR:00000000 ENDOFDATA:00000000 SAVEDBUF:00000000 +000090 REALCOUNTIN:00000000 REALCOUNTOUT:00000000 +000098 POSMAJOR:00000000 SAVEMAJOR:00000000 +0000A0 POSMINOR:00000000 SAVEMINOR:00000000 STATE:0000 +0000AA SAVESTATE:0000 EXITFTELL:00000000 EXITUNGETC:20F481E8 +0000B4 DBCSTART:00000000 UTILITYAREA:00000000 +0000BC INTERCEPT:00000000 FLAGS2:02120020 20441100 +0000C8 DBCSSTATE:0000 FCB_CPCB:20C0DEA8 +0000D0 READGLUE:58FF0008 07FF0000 READ:20F48580 +0000DC RADDR_WSA:00000000 _GETFN:00000000 RDLL_INDEX:00000000 +0000E8 RCEESG003:00000000 RWSA:00000000 +0000F0 WRITEGLUE:58FF0008 07FF0000 WRITE:20F7D260 +0000FC WADDR_WSA:00000000 _GETFN:00000000 WDLL_INDEX:00000000 +000108 WCEESG003:00000000 WWSA:00000000
OSVF: 2135B1D4 +000000 OSVF_EYE:OSVF READ:20F48580 WRITE:20F7ADD8 +00000C REPOS:20F786B0 GETPOS:20F7A5C8 CLOSE:00000000 +000018 FLUSH:20F77F38 UTILITY:213126A0 EXITFTELL:00000000 +000024 EXITUNGETC:20F481E8 OSIOBLK:2135B2A8 +00002C SAVECURSOR:00000000 NEWLINEPTR:00000000 +000034 CURBLKSIZE:00000000 LASTBLKSIZE:00000000 +00003C HIGHMAJOR:00000000 MAXFTELLBLK:001FFFFF +000044 RECBITS:0000000B FLAGS:72000000 RECLEN:00000000 +000050 CURRBLKNUM:00000000 LASTBLKNUM:00000000 +000058 OSWRITETOK:00000000 RECCOUNTOUT1:00000000 +000060 BLKCOUNTOUT1:00000000 SAVECOUNTOUT:00000000 SDWCODE:0000 +00006A SAVECHAR:. LASTTTRBLT:00000000 LASTWRTSIZE:00000000 +000073 LRECLUSED:00000000 OLDLRECLUSED:00000000 +00007B READERCOUNT:00000000 UNWRITTENDATA:00000000 +000083 MINRECLEN:00000000
OSIO: 2135B2A8 +000000 OSIO_EYE:OSIO DCBW:00012A60 DCBRU:00000000 +00000C JFCB:00012AC8 CURRMBUF:00000000 MBUFCOUNT:00000001 +000018 READMAX:00000000 CURBLKNUM:FFFFFFFF +000020 LASTBLKNUM:FFFFFFFF BLKSPERTRK:0000 OSIO_ACCESS_METHOD:01 +000027 OSIO_NOSEEK_TO_SEEK:00 FIRSTPOS:00000100 +00002C LASTPOS:00000100 NEWPOS:00000000 READFUNCNUM:00000002 +000038 WRITEFUNCNUM:00000005 FCB:2135B0A0 PARENT:2135B2A8 +000044 FLAGS1:81020000 DCBERU:00000000 DCBEW:2135B310 +000050 OSIO_VOLSEQ:0000 OSIO_NEWVOLSEQ:0000 OSIO_EXT:00000000
Chapter 3. Using Language Environment debugging facilities 125
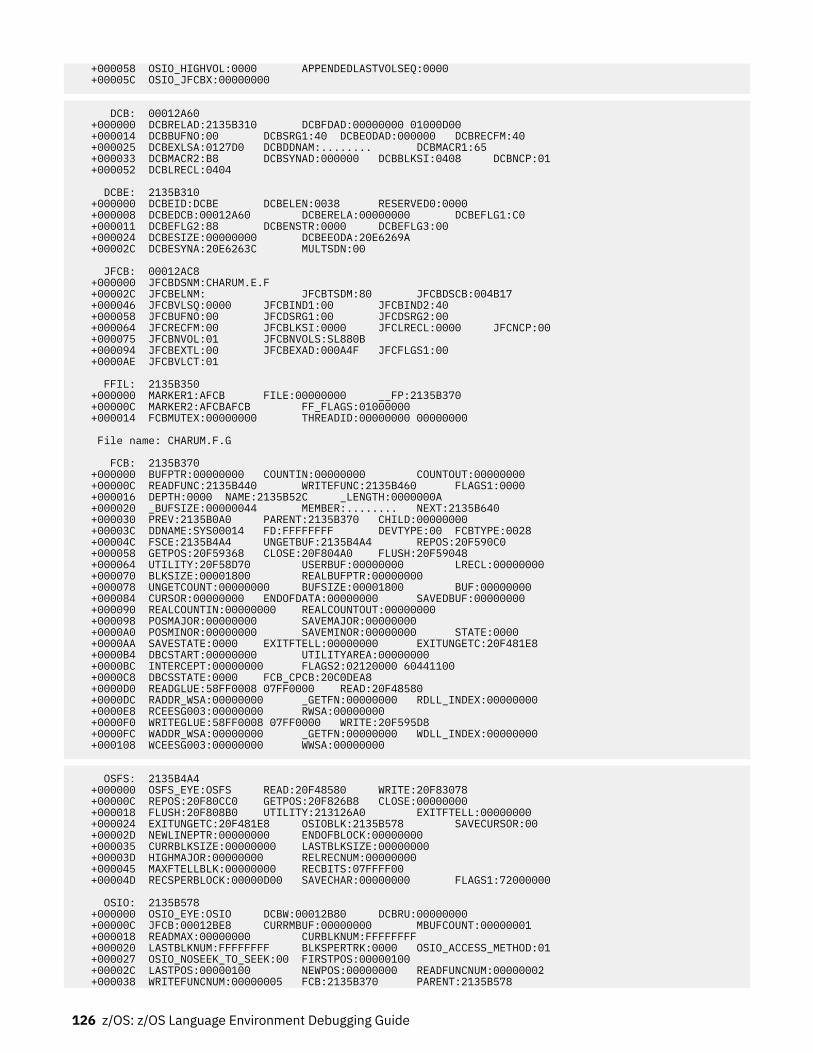
+000058 OSIO_HIGHVOL:0000 APPENDEDLASTVOLSEQ:0000 +00005C OSIO_JFCBX:00000000
DCB: 00012A60 +000000 DCBRELAD:2135B310 DCBFDAD:00000000 01000D00 +000014 DCBBUFNO:00 DCBSRG1:40 DCBEODAD:000000 DCBRECFM:40 +000025 DCBEXLSA:0127D0 DCBDDNAM:........ DCBMACR1:65 +000033 DCBMACR2:B8 DCBSYNAD:000000 DCBBLKSI:0408 DCBNCP:01 +000052 DCBLRECL:0404
DCBE: 2135B310 +000000 DCBEID:DCBE DCBELEN:0038 RESERVED0:0000 +000008 DCBEDCB:00012A60 DCBERELA:00000000 DCBEFLG1:C0 +000011 DCBEFLG2:88 DCBENSTR:0000 DCBEFLG3:00 +000024 DCBESIZE:00000000 DCBEEODA:20E6269A +00002C DCBESYNA:20E6263C MULTSDN:00
JFCB: 00012AC8 +000000 JFCBDSNM:CHARUM.E.F +00002C JFCBELNM: JFCBTSDM:80 JFCBDSCB:004B17 +000046 JFCBVLSQ:0000 JFCBIND1:00 JFCBIND2:40 +000058 JFCBUFNO:00 JFCDSRG1:00 JFCDSRG2:00 +000064 JFCRECFM:00 JFCBLKSI:0000 JFCLRECL:0000 JFCNCP:00 +000075 JFCBNVOL:01 JFCBNVOLS:SL880B +000094 JFCBEXTL:00 JFCBEXAD:000A4F JFCFLGS1:00 +0000AE JFCBVLCT:01
FFIL: 2135B350 +000000 MARKER1:AFCB FILE:00000000 __FP:2135B370 +00000C MARKER2:AFCBAFCB FF_FLAGS:01000000 +000014 FCBMUTEX:00000000 THREADID:00000000 00000000
File name: CHARUM.F.G
FCB: 2135B370 +000000 BUFPTR:00000000 COUNTIN:00000000 COUNTOUT:00000000 +00000C READFUNC:2135B440 WRITEFUNC:2135B460 FLAGS1:0000 +000016 DEPTH:0000 NAME:2135B52C _LENGTH:0000000A +000020 _BUFSIZE:00000044 MEMBER:........ NEXT:2135B640 +000030 PREV:2135B0A0 PARENT:2135B370 CHILD:00000000 +00003C DDNAME:SYS00014 FD:FFFFFFFF DEVTYPE:00 FCBTYPE:0028 +00004C FSCE:2135B4A4 UNGETBUF:2135B4A4 REPOS:20F590C0 +000058 GETPOS:20F59368 CLOSE:20F804A0 FLUSH:20F59048 +000064 UTILITY:20F58D70 USERBUF:00000000 LRECL:00000000 +000070 BLKSIZE:00001800 REALBUFPTR:00000000 +000078 UNGETCOUNT:00000000 BUFSIZE:00001800 BUF:00000000 +000084 CURSOR:00000000 ENDOFDATA:00000000 SAVEDBUF:00000000 +000090 REALCOUNTIN:00000000 REALCOUNTOUT:00000000 +000098 POSMAJOR:00000000 SAVEMAJOR:00000000 +0000A0 POSMINOR:00000000 SAVEMINOR:00000000 STATE:0000 +0000AA SAVESTATE:0000 EXITFTELL:00000000 EXITUNGETC:20F481E8 +0000B4 DBCSTART:00000000 UTILITYAREA:00000000 +0000BC INTERCEPT:00000000 FLAGS2:02120000 60441100 +0000C8 DBCSSTATE:0000 FCB_CPCB:20C0DEA8 +0000D0 READGLUE:58FF0008 07FF0000 READ:20F48580 +0000DC RADDR_WSA:00000000 _GETFN:00000000 RDLL_INDEX:00000000 +0000E8 RCEESG003:00000000 RWSA:00000000 +0000F0 WRITEGLUE:58FF0008 07FF0000 WRITE:20F595D8 +0000FC WADDR_WSA:00000000 _GETFN:00000000 WDLL_INDEX:00000000 +000108 WCEESG003:00000000 WWSA:00000000
OSFS: 2135B4A4 +000000 OSFS_EYE:OSFS READ:20F48580 WRITE:20F83078 +00000C REPOS:20F80CC0 GETPOS:20F826B8 CLOSE:00000000 +000018 FLUSH:20F808B0 UTILITY:213126A0 EXITFTELL:00000000 +000024 EXITUNGETC:20F481E8 OSIOBLK:2135B578 SAVECURSOR:00 +00002D NEWLINEPTR:00000000 ENDOFBLOCK:00000000 +000035 CURRBLKSIZE:00000000 LASTBLKSIZE:00000000 +00003D HIGHMAJOR:00000000 RELRECNUM:00000000 +000045 MAXFTELLBLK:00000000 RECBITS:07FFFF00 +00004D RECSPERBLOCK:00000D00 SAVECHAR:00000000 FLAGS1:72000000
OSIO: 2135B578 +000000 OSIO_EYE:OSIO DCBW:00012B80 DCBRU:00000000 +00000C JFCB:00012BE8 CURRMBUF:00000000 MBUFCOUNT:00000001 +000018 READMAX:00000000 CURBLKNUM:FFFFFFFF +000020 LASTBLKNUM:FFFFFFFF BLKSPERTRK:0000 OSIO_ACCESS_METHOD:01 +000027 OSIO_NOSEEK_TO_SEEK:00 FIRSTPOS:00000100 +00002C LASTPOS:00000100 NEWPOS:00000000 READFUNCNUM:00000002 +000038 WRITEFUNCNUM:00000005 FCB:2135B370 PARENT:2135B578
126 z/OS: z/OS Language Environment Debugging Guide
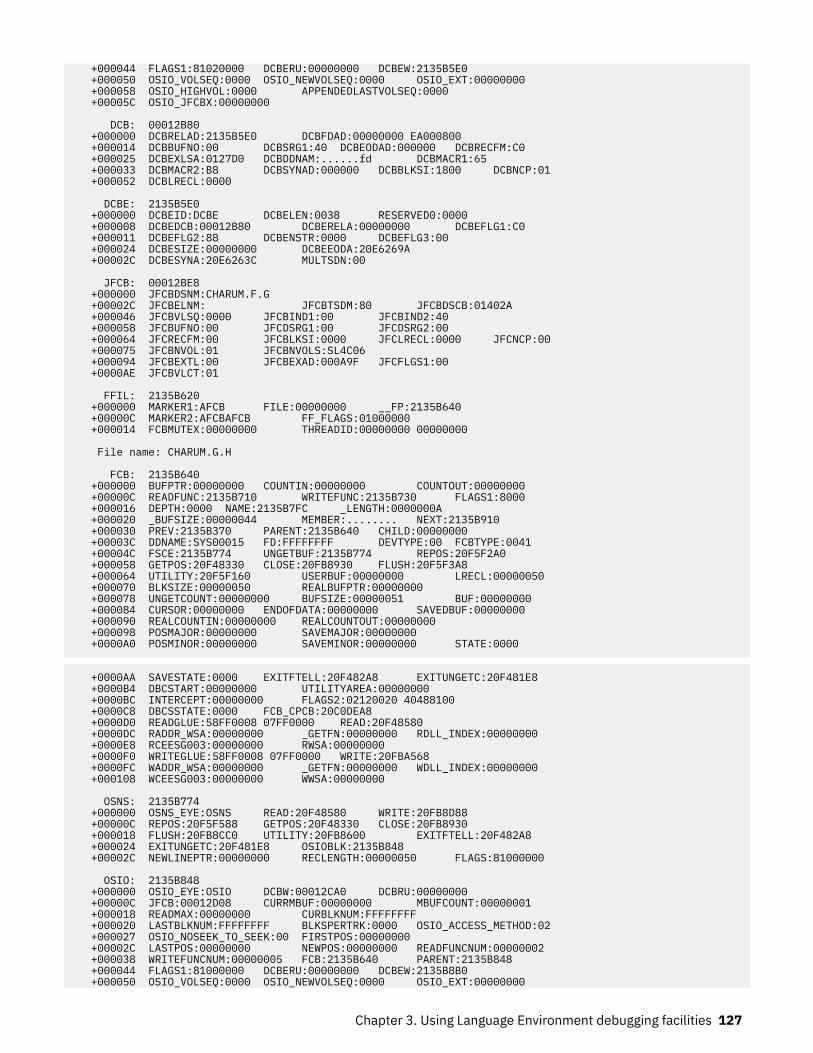
+000044 FLAGS1:81020000 DCBERU:00000000 DCBEW:2135B5E0 +000050 OSIO_VOLSEQ:0000 OSIO_NEWVOLSEQ:0000 OSIO_EXT:00000000 +000058 OSIO_HIGHVOL:0000 APPENDEDLASTVOLSEQ:0000 +00005C OSIO_JFCBX:00000000
DCB: 00012B80 +000000 DCBRELAD:2135B5E0 DCBFDAD:00000000 EA000800 +000014 DCBBUFNO:00 DCBSRG1:40 DCBEODAD:000000 DCBRECFM:C0 +000025 DCBEXLSA:0127D0 DCBDDNAM:......fd DCBMACR1:65 +000033 DCBMACR2:B8 DCBSYNAD:000000 DCBBLKSI:1800 DCBNCP:01 +000052 DCBLRECL:0000
DCBE: 2135B5E0 +000000 DCBEID:DCBE DCBELEN:0038 RESERVED0:0000 +000008 DCBEDCB:00012B80 DCBERELA:00000000 DCBEFLG1:C0 +000011 DCBEFLG2:88 DCBENSTR:0000 DCBEFLG3:00 +000024 DCBESIZE:00000000 DCBEEODA:20E6269A +00002C DCBESYNA:20E6263C MULTSDN:00
JFCB: 00012BE8 +000000 JFCBDSNM:CHARUM.F.G +00002C JFCBELNM: JFCBTSDM:80 JFCBDSCB:01402A +000046 JFCBVLSQ:0000 JFCBIND1:00 JFCBIND2:40 +000058 JFCBUFNO:00 JFCDSRG1:00 JFCDSRG2:00 +000064 JFCRECFM:00 JFCBLKSI:0000 JFCLRECL:0000 JFCNCP:00 +000075 JFCBNVOL:01 JFCBNVOLS:SL4C06 +000094 JFCBEXTL:00 JFCBEXAD:000A9F JFCFLGS1:00 +0000AE JFCBVLCT:01
FFIL: 2135B620 +000000 MARKER1:AFCB FILE:00000000 __FP:2135B640 +00000C MARKER2:AFCBAFCB FF_FLAGS:01000000 +000014 FCBMUTEX:00000000 THREADID:00000000 00000000
File name: CHARUM.G.H
FCB: 2135B640 +000000 BUFPTR:00000000 COUNTIN:00000000 COUNTOUT:00000000 +00000C READFUNC:2135B710 WRITEFUNC:2135B730 FLAGS1:8000 +000016 DEPTH:0000 NAME:2135B7FC _LENGTH:0000000A +000020 _BUFSIZE:00000044 MEMBER:........ NEXT:2135B910 +000030 PREV:2135B370 PARENT:2135B640 CHILD:00000000 +00003C DDNAME:SYS00015 FD:FFFFFFFF DEVTYPE:00 FCBTYPE:0041 +00004C FSCE:2135B774 UNGETBUF:2135B774 REPOS:20F5F2A0 +000058 GETPOS:20F48330 CLOSE:20FB8930 FLUSH:20F5F3A8 +000064 UTILITY:20F5F160 USERBUF:00000000 LRECL:00000050 +000070 BLKSIZE:00000050 REALBUFPTR:00000000 +000078 UNGETCOUNT:00000000 BUFSIZE:00000051 BUF:00000000 +000084 CURSOR:00000000 ENDOFDATA:00000000 SAVEDBUF:00000000 +000090 REALCOUNTIN:00000000 REALCOUNTOUT:00000000 +000098 POSMAJOR:00000000 SAVEMAJOR:00000000 +0000A0 POSMINOR:00000000 SAVEMINOR:00000000 STATE:0000
+0000AA SAVESTATE:0000 EXITFTELL:20F482A8 EXITUNGETC:20F481E8 +0000B4 DBCSTART:00000000 UTILITYAREA:00000000 +0000BC INTERCEPT:00000000 FLAGS2:02120020 40488100 +0000C8 DBCSSTATE:0000 FCB_CPCB:20C0DEA8 +0000D0 READGLUE:58FF0008 07FF0000 READ:20F48580 +0000DC RADDR_WSA:00000000 _GETFN:00000000 RDLL_INDEX:00000000 +0000E8 RCEESG003:00000000 RWSA:00000000 +0000F0 WRITEGLUE:58FF0008 07FF0000 WRITE:20FBA568 +0000FC WADDR_WSA:00000000 _GETFN:00000000 WDLL_INDEX:00000000 +000108 WCEESG003:00000000 WWSA:00000000
OSNS: 2135B774 +000000 OSNS_EYE:OSNS READ:20F48580 WRITE:20FB8D88 +00000C REPOS:20F5F588 GETPOS:20F48330 CLOSE:20FB8930 +000018 FLUSH:20FB8CC0 UTILITY:20FB8600 EXITFTELL:20F482A8 +000024 EXITUNGETC:20F481E8 OSIOBLK:2135B848 +00002C NEWLINEPTR:00000000 RECLENGTH:00000050 FLAGS:81000000
OSIO: 2135B848 +000000 OSIO_EYE:OSIO DCBW:00012CA0 DCBRU:00000000 +00000C JFCB:00012D08 CURRMBUF:00000000 MBUFCOUNT:00000001 +000018 READMAX:00000000 CURBLKNUM:FFFFFFFF +000020 LASTBLKNUM:FFFFFFFF BLKSPERTRK:0000 OSIO_ACCESS_METHOD:02 +000027 OSIO_NOSEEK_TO_SEEK:00 FIRSTPOS:00000000 +00002C LASTPOS:00000000 NEWPOS:00000000 READFUNCNUM:00000002 +000038 WRITEFUNCNUM:00000005 FCB:2135B640 PARENT:2135B848 +000044 FLAGS1:81000000 DCBERU:00000000 DCBEW:2135B8B0 +000050 OSIO_VOLSEQ:0000 OSIO_NEWVOLSEQ:0000 OSIO_EXT:00000000
Chapter 3. Using Language Environment debugging facilities 127
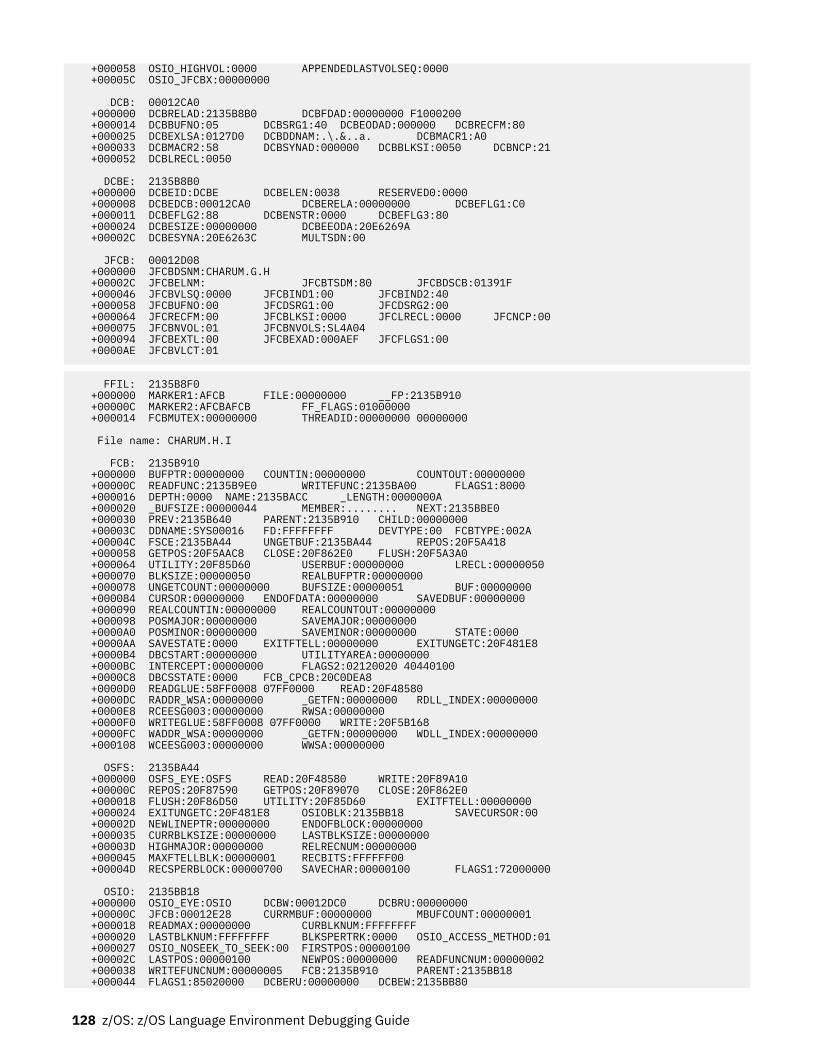
+000058 OSIO_HIGHVOL:0000 APPENDEDLASTVOLSEQ:0000 +00005C OSIO_JFCBX:00000000
DCB: 00012CA0 +000000 DCBRELAD:2135B8B0 DCBFDAD:00000000 F1000200 +000014 DCBBUFNO:05 DCBSRG1:40 DCBEODAD:000000 DCBRECFM:80 +000025 DCBEXLSA:0127D0 DCBDDNAM:.\.&..a. DCBMACR1:A0 +000033 DCBMACR2:58 DCBSYNAD:000000 DCBBLKSI:0050 DCBNCP:21 +000052 DCBLRECL:0050
DCBE: 2135B8B0 +000000 DCBEID:DCBE DCBELEN:0038 RESERVED0:0000 +000008 DCBEDCB:00012CA0 DCBERELA:00000000 DCBEFLG1:C0 +000011 DCBEFLG2:88 DCBENSTR:0000 DCBEFLG3:80 +000024 DCBESIZE:00000000 DCBEEODA:20E6269A +00002C DCBESYNA:20E6263C MULTSDN:00
JFCB: 00012D08 +000000 JFCBDSNM:CHARUM.G.H +00002C JFCBELNM: JFCBTSDM:80 JFCBDSCB:01391F +000046 JFCBVLSQ:0000 JFCBIND1:00 JFCBIND2:40 +000058 JFCBUFNO:00 JFCDSRG1:00 JFCDSRG2:00 +000064 JFCRECFM:00 JFCBLKSI:0000 JFCLRECL:0000 JFCNCP:00 +000075 JFCBNVOL:01 JFCBNVOLS:SL4A04 +000094 JFCBEXTL:00 JFCBEXAD:000AEF JFCFLGS1:00 +0000AE JFCBVLCT:01
FFIL: 2135B8F0 +000000 MARKER1:AFCB FILE:00000000 __FP:2135B910 +00000C MARKER2:AFCBAFCB FF_FLAGS:01000000 +000014 FCBMUTEX:00000000 THREADID:00000000 00000000
File name: CHARUM.H.I
FCB: 2135B910 +000000 BUFPTR:00000000 COUNTIN:00000000 COUNTOUT:00000000 +00000C READFUNC:2135B9E0 WRITEFUNC:2135BA00 FLAGS1:8000 +000016 DEPTH:0000 NAME:2135BACC _LENGTH:0000000A +000020 _BUFSIZE:00000044 MEMBER:........ NEXT:2135BBE0 +000030 PREV:2135B640 PARENT:2135B910 CHILD:00000000 +00003C DDNAME:SYS00016 FD:FFFFFFFF DEVTYPE:00 FCBTYPE:002A +00004C FSCE:2135BA44 UNGETBUF:2135BA44 REPOS:20F5A418 +000058 GETPOS:20F5AAC8 CLOSE:20F862E0 FLUSH:20F5A3A0 +000064 UTILITY:20F85D60 USERBUF:00000000 LRECL:00000050 +000070 BLKSIZE:00000050 REALBUFPTR:00000000 +000078 UNGETCOUNT:00000000 BUFSIZE:00000051 BUF:00000000 +000084 CURSOR:00000000 ENDOFDATA:00000000 SAVEDBUF:00000000 +000090 REALCOUNTIN:00000000 REALCOUNTOUT:00000000 +000098 POSMAJOR:00000000 SAVEMAJOR:00000000 +0000A0 POSMINOR:00000000 SAVEMINOR:00000000 STATE:0000 +0000AA SAVESTATE:0000 EXITFTELL:00000000 EXITUNGETC:20F481E8 +0000B4 DBCSTART:00000000 UTILITYAREA:00000000 +0000BC INTERCEPT:00000000 FLAGS2:02120020 40440100 +0000C8 DBCSSTATE:0000 FCB_CPCB:20C0DEA8 +0000D0 READGLUE:58FF0008 07FF0000 READ:20F48580 +0000DC RADDR_WSA:00000000 _GETFN:00000000 RDLL_INDEX:00000000 +0000E8 RCEESG003:00000000 RWSA:00000000 +0000F0 WRITEGLUE:58FF0008 07FF0000 WRITE:20F5B168 +0000FC WADDR_WSA:00000000 _GETFN:00000000 WDLL_INDEX:00000000 +000108 WCEESG003:00000000 WWSA:00000000
OSFS: 2135BA44 +000000 OSFS_EYE:OSFS READ:20F48580 WRITE:20F89A10 +00000C REPOS:20F87590 GETPOS:20F89070 CLOSE:20F862E0 +000018 FLUSH:20F86D50 UTILITY:20F85D60 EXITFTELL:00000000 +000024 EXITUNGETC:20F481E8 OSIOBLK:2135BB18 SAVECURSOR:00 +00002D NEWLINEPTR:00000000 ENDOFBLOCK:00000000 +000035 CURRBLKSIZE:00000000 LASTBLKSIZE:00000000 +00003D HIGHMAJOR:00000000 RELRECNUM:00000000 +000045 MAXFTELLBLK:00000001 RECBITS:FFFFFF00 +00004D RECSPERBLOCK:00000700 SAVECHAR:00000100 FLAGS1:72000000
OSIO: 2135BB18 +000000 OSIO_EYE:OSIO DCBW:00012DC0 DCBRU:00000000 +00000C JFCB:00012E28 CURRMBUF:00000000 MBUFCOUNT:00000001 +000018 READMAX:00000000 CURBLKNUM:FFFFFFFF +000020 LASTBLKNUM:FFFFFFFF BLKSPERTRK:0000 OSIO_ACCESS_METHOD:01 +000027 OSIO_NOSEEK_TO_SEEK:00 FIRSTPOS:00000100 +00002C LASTPOS:00000100 NEWPOS:00000000 READFUNCNUM:00000002 +000038 WRITEFUNCNUM:00000005 FCB:2135B910 PARENT:2135BB18 +000044 FLAGS1:85020000 DCBERU:00000000 DCBEW:2135BB80
128 z/OS: z/OS Language Environment Debugging Guide
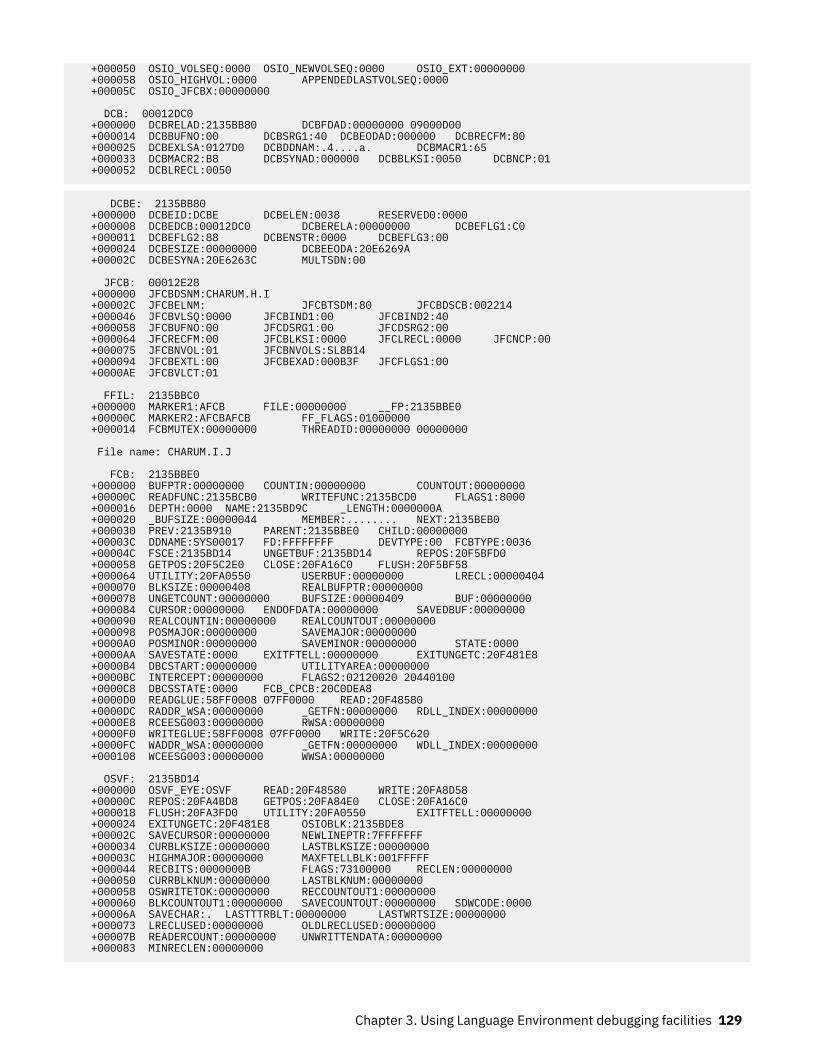
+000050 OSIO_VOLSEQ:0000 OSIO_NEWVOLSEQ:0000 OSIO_EXT:00000000 +000058 OSIO_HIGHVOL:0000 APPENDEDLASTVOLSEQ:0000 +00005C OSIO_JFCBX:00000000
DCB: 00012DC0 +000000 DCBRELAD:2135BB80 DCBFDAD:00000000 09000D00 +000014 DCBBUFNO:00 DCBSRG1:40 DCBEODAD:000000 DCBRECFM:80 +000025 DCBEXLSA:0127D0 DCBDDNAM:.4....a. DCBMACR1:65 +000033 DCBMACR2:B8 DCBSYNAD:000000 DCBBLKSI:0050 DCBNCP:01 +000052 DCBLRECL:0050
DCBE: 2135BB80 +000000 DCBEID:DCBE DCBELEN:0038 RESERVED0:0000 +000008 DCBEDCB:00012DC0 DCBERELA:00000000 DCBEFLG1:C0 +000011 DCBEFLG2:88 DCBENSTR:0000 DCBEFLG3:00 +000024 DCBESIZE:00000000 DCBEEODA:20E6269A +00002C DCBESYNA:20E6263C MULTSDN:00
JFCB: 00012E28 +000000 JFCBDSNM:CHARUM.H.I +00002C JFCBELNM: JFCBTSDM:80 JFCBDSCB:002214 +000046 JFCBVLSQ:0000 JFCBIND1:00 JFCBIND2:40 +000058 JFCBUFNO:00 JFCDSRG1:00 JFCDSRG2:00 +000064 JFCRECFM:00 JFCBLKSI:0000 JFCLRECL:0000 JFCNCP:00 +000075 JFCBNVOL:01 JFCBNVOLS:SL8B14 +000094 JFCBEXTL:00 JFCBEXAD:000B3F JFCFLGS1:00 +0000AE JFCBVLCT:01
FFIL: 2135BBC0 +000000 MARKER1:AFCB FILE:00000000 __FP:2135BBE0 +00000C MARKER2:AFCBAFCB FF_FLAGS:01000000 +000014 FCBMUTEX:00000000 THREADID:00000000 00000000
File name: CHARUM.I.J
FCB: 2135BBE0 +000000 BUFPTR:00000000 COUNTIN:00000000 COUNTOUT:00000000 +00000C READFUNC:2135BCB0 WRITEFUNC:2135BCD0 FLAGS1:8000 +000016 DEPTH:0000 NAME:2135BD9C _LENGTH:0000000A +000020 _BUFSIZE:00000044 MEMBER:........ NEXT:2135BEB0 +000030 PREV:2135B910 PARENT:2135BBE0 CHILD:00000000 +00003C DDNAME:SYS00017 FD:FFFFFFFF DEVTYPE:00 FCBTYPE:0036 +00004C FSCE:2135BD14 UNGETBUF:2135BD14 REPOS:20F5BFD0 +000058 GETPOS:20F5C2E0 CLOSE:20FA16C0 FLUSH:20F5BF58 +000064 UTILITY:20FA0550 USERBUF:00000000 LRECL:00000404 +000070 BLKSIZE:00000408 REALBUFPTR:00000000 +000078 UNGETCOUNT:00000000 BUFSIZE:00000409 BUF:00000000 +000084 CURSOR:00000000 ENDOFDATA:00000000 SAVEDBUF:00000000 +000090 REALCOUNTIN:00000000 REALCOUNTOUT:00000000 +000098 POSMAJOR:00000000 SAVEMAJOR:00000000 +0000A0 POSMINOR:00000000 SAVEMINOR:00000000 STATE:0000 +0000AA SAVESTATE:0000 EXITFTELL:00000000 EXITUNGETC:20F481E8 +0000B4 DBCSTART:00000000 UTILITYAREA:00000000 +0000BC INTERCEPT:00000000 FLAGS2:02120020 20440100 +0000C8 DBCSSTATE:0000 FCB_CPCB:20C0DEA8 +0000D0 READGLUE:58FF0008 07FF0000 READ:20F48580 +0000DC RADDR_WSA:00000000 _GETFN:00000000 RDLL_INDEX:00000000 +0000E8 RCEESG003:00000000 RWSA:00000000 +0000F0 WRITEGLUE:58FF0008 07FF0000 WRITE:20F5C620 +0000FC WADDR_WSA:00000000 _GETFN:00000000 WDLL_INDEX:00000000 +000108 WCEESG003:00000000 WWSA:00000000
OSVF: 2135BD14 +000000 OSVF_EYE:OSVF READ:20F48580 WRITE:20FA8D58 +00000C REPOS:20FA4BD8 GETPOS:20FA84E0 CLOSE:20FA16C0 +000018 FLUSH:20FA3FD0 UTILITY:20FA0550 EXITFTELL:00000000 +000024 EXITUNGETC:20F481E8 OSIOBLK:2135BDE8 +00002C SAVECURSOR:00000000 NEWLINEPTR:7FFFFFFF +000034 CURBLKSIZE:00000000 LASTBLKSIZE:00000000 +00003C HIGHMAJOR:00000000 MAXFTELLBLK:001FFFFF +000044 RECBITS:0000000B FLAGS:73100000 RECLEN:00000000 +000050 CURRBLKNUM:00000000 LASTBLKNUM:00000000 +000058 OSWRITETOK:00000000 RECCOUNTOUT1:00000000 +000060 BLKCOUNTOUT1:00000000 SAVECOUNTOUT:00000000 SDWCODE:0000 +00006A SAVECHAR:. LASTTTRBLT:00000000 LASTWRTSIZE:00000000 +000073 LRECLUSED:00000000 OLDLRECLUSED:00000000 +00007B READERCOUNT:00000000 UNWRITTENDATA:00000000 +000083 MINRECLEN:00000000
Chapter 3. Using Language Environment debugging facilities 129
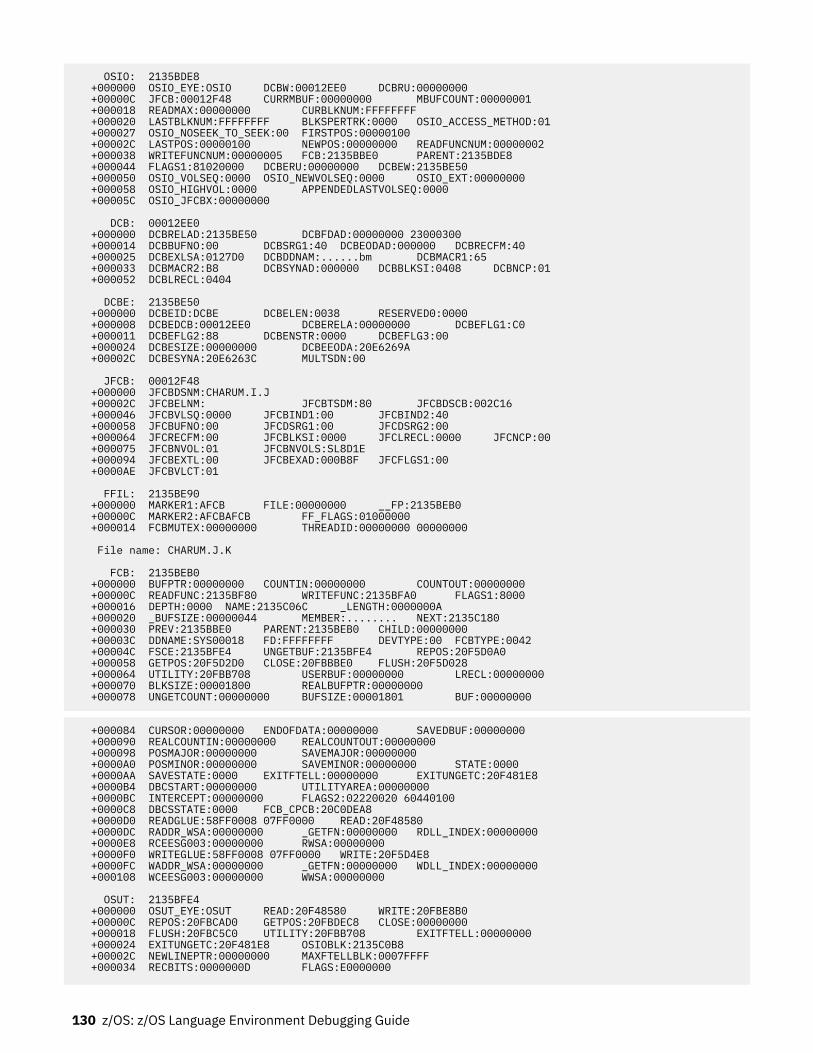
OSIO: 2135BDE8 +000000 OSIO_EYE:OSIO DCBW:00012EE0 DCBRU:00000000 +00000C JFCB:00012F48 CURRMBUF:00000000 MBUFCOUNT:00000001 +000018 READMAX:00000000 CURBLKNUM:FFFFFFFF +000020 LASTBLKNUM:FFFFFFFF BLKSPERTRK:0000 OSIO_ACCESS_METHOD:01 +000027 OSIO_NOSEEK_TO_SEEK:00 FIRSTPOS:00000100 +00002C LASTPOS:00000100 NEWPOS:00000000 READFUNCNUM:00000002 +000038 WRITEFUNCNUM:00000005 FCB:2135BBE0 PARENT:2135BDE8 +000044 FLAGS1:81020000 DCBERU:00000000 DCBEW:2135BE50 +000050 OSIO_VOLSEQ:0000 OSIO_NEWVOLSEQ:0000 OSIO_EXT:00000000 +000058 OSIO_HIGHVOL:0000 APPENDEDLASTVOLSEQ:0000 +00005C OSIO_JFCBX:00000000
DCB: 00012EE0 +000000 DCBRELAD:2135BE50 DCBFDAD:00000000 23000300 +000014 DCBBUFNO:00 DCBSRG1:40 DCBEODAD:000000 DCBRECFM:40 +000025 DCBEXLSA:0127D0 DCBDDNAM:......bm DCBMACR1:65 +000033 DCBMACR2:B8 DCBSYNAD:000000 DCBBLKSI:0408 DCBNCP:01 +000052 DCBLRECL:0404
DCBE: 2135BE50 +000000 DCBEID:DCBE DCBELEN:0038 RESERVED0:0000 +000008 DCBEDCB:00012EE0 DCBERELA:00000000 DCBEFLG1:C0 +000011 DCBEFLG2:88 DCBENSTR:0000 DCBEFLG3:00 +000024 DCBESIZE:00000000 DCBEEODA:20E6269A +00002C DCBESYNA:20E6263C MULTSDN:00
JFCB: 00012F48 +000000 JFCBDSNM:CHARUM.I.J +00002C JFCBELNM: JFCBTSDM:80 JFCBDSCB:002C16 +000046 JFCBVLSQ:0000 JFCBIND1:00 JFCBIND2:40 +000058 JFCBUFNO:00 JFCDSRG1:00 JFCDSRG2:00 +000064 JFCRECFM:00 JFCBLKSI:0000 JFCLRECL:0000 JFCNCP:00 +000075 JFCBNVOL:01 JFCBNVOLS:SL8D1E +000094 JFCBEXTL:00 JFCBEXAD:000B8F JFCFLGS1:00 +0000AE JFCBVLCT:01
FFIL: 2135BE90 +000000 MARKER1:AFCB FILE:00000000 __FP:2135BEB0 +00000C MARKER2:AFCBAFCB FF_FLAGS:01000000 +000014 FCBMUTEX:00000000 THREADID:00000000 00000000
File name: CHARUM.J.K
FCB: 2135BEB0 +000000 BUFPTR:00000000 COUNTIN:00000000 COUNTOUT:00000000 +00000C READFUNC:2135BF80 WRITEFUNC:2135BFA0 FLAGS1:8000 +000016 DEPTH:0000 NAME:2135C06C _LENGTH:0000000A +000020 _BUFSIZE:00000044 MEMBER:........ NEXT:2135C180 +000030 PREV:2135BBE0 PARENT:2135BEB0 CHILD:00000000 +00003C DDNAME:SYS00018 FD:FFFFFFFF DEVTYPE:00 FCBTYPE:0042 +00004C FSCE:2135BFE4 UNGETBUF:2135BFE4 REPOS:20F5D0A0 +000058 GETPOS:20F5D2D0 CLOSE:20FBBBE0 FLUSH:20F5D028 +000064 UTILITY:20FBB708 USERBUF:00000000 LRECL:00000000 +000070 BLKSIZE:00001800 REALBUFPTR:00000000 +000078 UNGETCOUNT:00000000 BUFSIZE:00001801 BUF:00000000
+000084 CURSOR:00000000 ENDOFDATA:00000000 SAVEDBUF:00000000 +000090 REALCOUNTIN:00000000 REALCOUNTOUT:00000000 +000098 POSMAJOR:00000000 SAVEMAJOR:00000000 +0000A0 POSMINOR:00000000 SAVEMINOR:00000000 STATE:0000 +0000AA SAVESTATE:0000 EXITFTELL:00000000 EXITUNGETC:20F481E8 +0000B4 DBCSTART:00000000 UTILITYAREA:00000000 +0000BC INTERCEPT:00000000 FLAGS2:02220020 60440100 +0000C8 DBCSSTATE:0000 FCB_CPCB:20C0DEA8 +0000D0 READGLUE:58FF0008 07FF0000 READ:20F48580 +0000DC RADDR_WSA:00000000 _GETFN:00000000 RDLL_INDEX:00000000 +0000E8 RCEESG003:00000000 RWSA:00000000 +0000F0 WRITEGLUE:58FF0008 07FF0000 WRITE:20F5D4E8 +0000FC WADDR_WSA:00000000 _GETFN:00000000 WDLL_INDEX:00000000 +000108 WCEESG003:00000000 WWSA:00000000
OSUT: 2135BFE4 +000000 OSUT_EYE:OSUT READ:20F48580 WRITE:20FBE8B0 +00000C REPOS:20FBCAD0 GETPOS:20FBDEC8 CLOSE:00000000 +000018 FLUSH:20FBC5C0 UTILITY:20FBB708 EXITFTELL:00000000 +000024 EXITUNGETC:20F481E8 OSIOBLK:2135C0B8 +00002C NEWLINEPTR:00000000 MAXFTELLBLK:0007FFFF +000034 RECBITS:0000000D FLAGS:E0000000
130 z/OS: z/OS Language Environment Debugging Guide
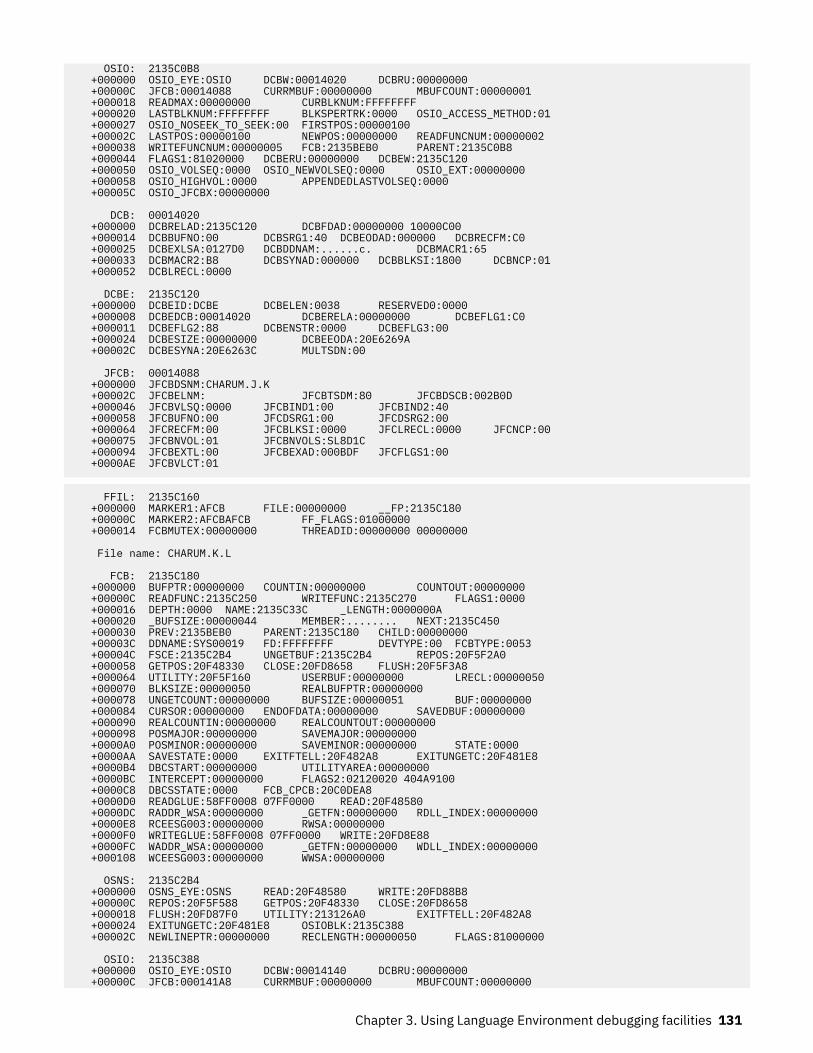
OSIO: 2135C0B8 +000000 OSIO_EYE:OSIO DCBW:00014020 DCBRU:00000000 +00000C JFCB:00014088 CURRMBUF:00000000 MBUFCOUNT:00000001 +000018 READMAX:00000000 CURBLKNUM:FFFFFFFF +000020 LASTBLKNUM:FFFFFFFF BLKSPERTRK:0000 OSIO_ACCESS_METHOD:01 +000027 OSIO_NOSEEK_TO_SEEK:00 FIRSTPOS:00000100 +00002C LASTPOS:00000100 NEWPOS:00000000 READFUNCNUM:00000002 +000038 WRITEFUNCNUM:00000005 FCB:2135BEB0 PARENT:2135C0B8 +000044 FLAGS1:81020000 DCBERU:00000000 DCBEW:2135C120 +000050 OSIO_VOLSEQ:0000 OSIO_NEWVOLSEQ:0000 OSIO_EXT:00000000 +000058 OSIO_HIGHVOL:0000 APPENDEDLASTVOLSEQ:0000 +00005C OSIO_JFCBX:00000000
DCB: 00014020 +000000 DCBRELAD:2135C120 DCBFDAD:00000000 10000C00 +000014 DCBBUFNO:00 DCBSRG1:40 DCBEODAD:000000 DCBRECFM:C0 +000025 DCBEXLSA:0127D0 DCBDDNAM:......c. DCBMACR1:65 +000033 DCBMACR2:B8 DCBSYNAD:000000 DCBBLKSI:1800 DCBNCP:01 +000052 DCBLRECL:0000
DCBE: 2135C120 +000000 DCBEID:DCBE DCBELEN:0038 RESERVED0:0000 +000008 DCBEDCB:00014020 DCBERELA:00000000 DCBEFLG1:C0 +000011 DCBEFLG2:88 DCBENSTR:0000 DCBEFLG3:00 +000024 DCBESIZE:00000000 DCBEEODA:20E6269A +00002C DCBESYNA:20E6263C MULTSDN:00
JFCB: 00014088 +000000 JFCBDSNM:CHARUM.J.K +00002C JFCBELNM: JFCBTSDM:80 JFCBDSCB:002B0D +000046 JFCBVLSQ:0000 JFCBIND1:00 JFCBIND2:40 +000058 JFCBUFNO:00 JFCDSRG1:00 JFCDSRG2:00 +000064 JFCRECFM:00 JFCBLKSI:0000 JFCLRECL:0000 JFCNCP:00 +000075 JFCBNVOL:01 JFCBNVOLS:SL8D1C +000094 JFCBEXTL:00 JFCBEXAD:000BDF JFCFLGS1:00 +0000AE JFCBVLCT:01
FFIL: 2135C160 +000000 MARKER1:AFCB FILE:00000000 __FP:2135C180 +00000C MARKER2:AFCBAFCB FF_FLAGS:01000000 +000014 FCBMUTEX:00000000 THREADID:00000000 00000000
File name: CHARUM.K.L
FCB: 2135C180 +000000 BUFPTR:00000000 COUNTIN:00000000 COUNTOUT:00000000 +00000C READFUNC:2135C250 WRITEFUNC:2135C270 FLAGS1:0000 +000016 DEPTH:0000 NAME:2135C33C _LENGTH:0000000A +000020 _BUFSIZE:00000044 MEMBER:........ NEXT:2135C450 +000030 PREV:2135BEB0 PARENT:2135C180 CHILD:00000000 +00003C DDNAME:SYS00019 FD:FFFFFFFF DEVTYPE:00 FCBTYPE:0053 +00004C FSCE:2135C2B4 UNGETBUF:2135C2B4 REPOS:20F5F2A0 +000058 GETPOS:20F48330 CLOSE:20FD8658 FLUSH:20F5F3A8 +000064 UTILITY:20F5F160 USERBUF:00000000 LRECL:00000050 +000070 BLKSIZE:00000050 REALBUFPTR:00000000 +000078 UNGETCOUNT:00000000 BUFSIZE:00000051 BUF:00000000 +000084 CURSOR:00000000 ENDOFDATA:00000000 SAVEDBUF:00000000 +000090 REALCOUNTIN:00000000 REALCOUNTOUT:00000000 +000098 POSMAJOR:00000000 SAVEMAJOR:00000000 +0000A0 POSMINOR:00000000 SAVEMINOR:00000000 STATE:0000 +0000AA SAVESTATE:0000 EXITFTELL:20F482A8 EXITUNGETC:20F481E8 +0000B4 DBCSTART:00000000 UTILITYAREA:00000000 +0000BC INTERCEPT:00000000 FLAGS2:02120020 404A9100 +0000C8 DBCSSTATE:0000 FCB_CPCB:20C0DEA8 +0000D0 READGLUE:58FF0008 07FF0000 READ:20F48580 +0000DC RADDR_WSA:00000000 _GETFN:00000000 RDLL_INDEX:00000000 +0000E8 RCEESG003:00000000 RWSA:00000000 +0000F0 WRITEGLUE:58FF0008 07FF0000 WRITE:20FD8E88 +0000FC WADDR_WSA:00000000 _GETFN:00000000 WDLL_INDEX:00000000 +000108 WCEESG003:00000000 WWSA:00000000
OSNS: 2135C2B4 +000000 OSNS_EYE:OSNS READ:20F48580 WRITE:20FD88B8 +00000C REPOS:20F5F588 GETPOS:20F48330 CLOSE:20FD8658 +000018 FLUSH:20FD87F0 UTILITY:213126A0 EXITFTELL:20F482A8 +000024 EXITUNGETC:20F481E8 OSIOBLK:2135C388 +00002C NEWLINEPTR:00000000 RECLENGTH:00000050 FLAGS:81000000
OSIO: 2135C388 +000000 OSIO_EYE:OSIO DCBW:00014140 DCBRU:00000000 +00000C JFCB:000141A8 CURRMBUF:00000000 MBUFCOUNT:00000000
Chapter 3. Using Language Environment debugging facilities 131
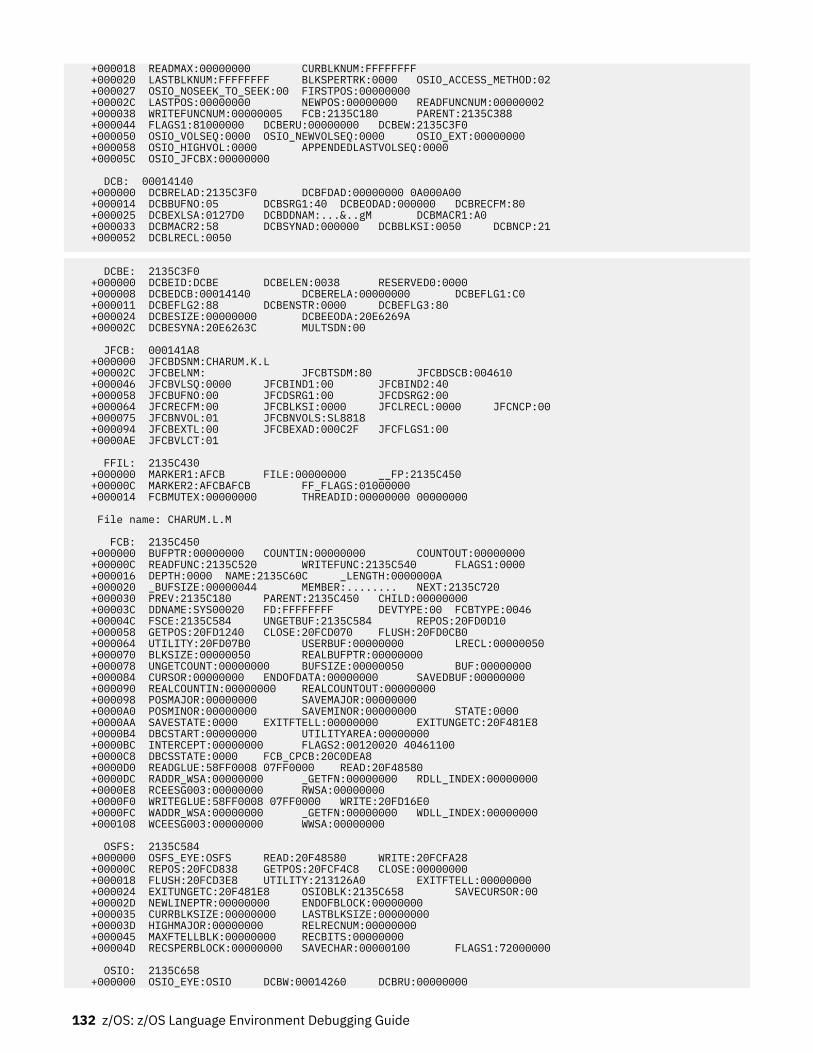
+000018 READMAX:00000000 CURBLKNUM:FFFFFFFF +000020 LASTBLKNUM:FFFFFFFF BLKSPERTRK:0000 OSIO_ACCESS_METHOD:02 +000027 OSIO_NOSEEK_TO_SEEK:00 FIRSTPOS:00000000 +00002C LASTPOS:00000000 NEWPOS:00000000 READFUNCNUM:00000002 +000038 WRITEFUNCNUM:00000005 FCB:2135C180 PARENT:2135C388 +000044 FLAGS1:81000000 DCBERU:00000000 DCBEW:2135C3F0 +000050 OSIO_VOLSEQ:0000 OSIO_NEWVOLSEQ:0000 OSIO_EXT:00000000 +000058 OSIO_HIGHVOL:0000 APPENDEDLASTVOLSEQ:0000 +00005C OSIO_JFCBX:00000000 DCB: 00014140 +000000 DCBRELAD:2135C3F0 DCBFDAD:00000000 0A000A00 +000014 DCBBUFNO:05 DCBSRG1:40 DCBEODAD:000000 DCBRECFM:80 +000025 DCBEXLSA:0127D0 DCBDDNAM:...&..gM DCBMACR1:A0 +000033 DCBMACR2:58 DCBSYNAD:000000 DCBBLKSI:0050 DCBNCP:21 +000052 DCBLRECL:0050
DCBE: 2135C3F0 +000000 DCBEID:DCBE DCBELEN:0038 RESERVED0:0000 +000008 DCBEDCB:00014140 DCBERELA:00000000 DCBEFLG1:C0 +000011 DCBEFLG2:88 DCBENSTR:0000 DCBEFLG3:80 +000024 DCBESIZE:00000000 DCBEEODA:20E6269A +00002C DCBESYNA:20E6263C MULTSDN:00
JFCB: 000141A8 +000000 JFCBDSNM:CHARUM.K.L +00002C JFCBELNM: JFCBTSDM:80 JFCBDSCB:004610 +000046 JFCBVLSQ:0000 JFCBIND1:00 JFCBIND2:40 +000058 JFCBUFNO:00 JFCDSRG1:00 JFCDSRG2:00 +000064 JFCRECFM:00 JFCBLKSI:0000 JFCLRECL:0000 JFCNCP:00 +000075 JFCBNVOL:01 JFCBNVOLS:SL8818 +000094 JFCBEXTL:00 JFCBEXAD:000C2F JFCFLGS1:00 +0000AE JFCBVLCT:01
FFIL: 2135C430 +000000 MARKER1:AFCB FILE:00000000 __FP:2135C450 +00000C MARKER2:AFCBAFCB FF_FLAGS:01000000 +000014 FCBMUTEX:00000000 THREADID:00000000 00000000
File name: CHARUM.L.M
FCB: 2135C450 +000000 BUFPTR:00000000 COUNTIN:00000000 COUNTOUT:00000000 +00000C READFUNC:2135C520 WRITEFUNC:2135C540 FLAGS1:0000 +000016 DEPTH:0000 NAME:2135C60C _LENGTH:0000000A +000020 _BUFSIZE:00000044 MEMBER:........ NEXT:2135C720 +000030 PREV:2135C180 PARENT:2135C450 CHILD:00000000 +00003C DDNAME:SYS00020 FD:FFFFFFFF DEVTYPE:00 FCBTYPE:0046 +00004C FSCE:2135C584 UNGETBUF:2135C584 REPOS:20FD0D10 +000058 GETPOS:20FD1240 CLOSE:20FCD070 FLUSH:20FD0CB0 +000064 UTILITY:20FD07B0 USERBUF:00000000 LRECL:00000050 +000070 BLKSIZE:00000050 REALBUFPTR:00000000 +000078 UNGETCOUNT:00000000 BUFSIZE:00000050 BUF:00000000 +000084 CURSOR:00000000 ENDOFDATA:00000000 SAVEDBUF:00000000 +000090 REALCOUNTIN:00000000 REALCOUNTOUT:00000000 +000098 POSMAJOR:00000000 SAVEMAJOR:00000000 +0000A0 POSMINOR:00000000 SAVEMINOR:00000000 STATE:0000 +0000AA SAVESTATE:0000 EXITFTELL:00000000 EXITUNGETC:20F481E8 +0000B4 DBCSTART:00000000 UTILITYAREA:00000000 +0000BC INTERCEPT:00000000 FLAGS2:00120020 40461100 +0000C8 DBCSSTATE:0000 FCB_CPCB:20C0DEA8 +0000D0 READGLUE:58FF0008 07FF0000 READ:20F48580 +0000DC RADDR_WSA:00000000 _GETFN:00000000 RDLL_INDEX:00000000 +0000E8 RCEESG003:00000000 RWSA:00000000 +0000F0 WRITEGLUE:58FF0008 07FF0000 WRITE:20FD16E0 +0000FC WADDR_WSA:00000000 _GETFN:00000000 WDLL_INDEX:00000000 +000108 WCEESG003:00000000 WWSA:00000000
OSFS: 2135C584 +000000 OSFS_EYE:OSFS READ:20F48580 WRITE:20FCFA28 +00000C REPOS:20FCD838 GETPOS:20FCF4C8 CLOSE:00000000 +000018 FLUSH:20FCD3E8 UTILITY:213126A0 EXITFTELL:00000000 +000024 EXITUNGETC:20F481E8 OSIOBLK:2135C658 SAVECURSOR:00 +00002D NEWLINEPTR:00000000 ENDOFBLOCK:00000000 +000035 CURRBLKSIZE:00000000 LASTBLKSIZE:00000000 +00003D HIGHMAJOR:00000000 RELRECNUM:00000000 +000045 MAXFTELLBLK:00000000 RECBITS:00000000 +00004D RECSPERBLOCK:00000000 SAVECHAR:00000100 FLAGS1:72000000
OSIO: 2135C658 +000000 OSIO_EYE:OSIO DCBW:00014260 DCBRU:00000000
132 z/OS: z/OS Language Environment Debugging Guide
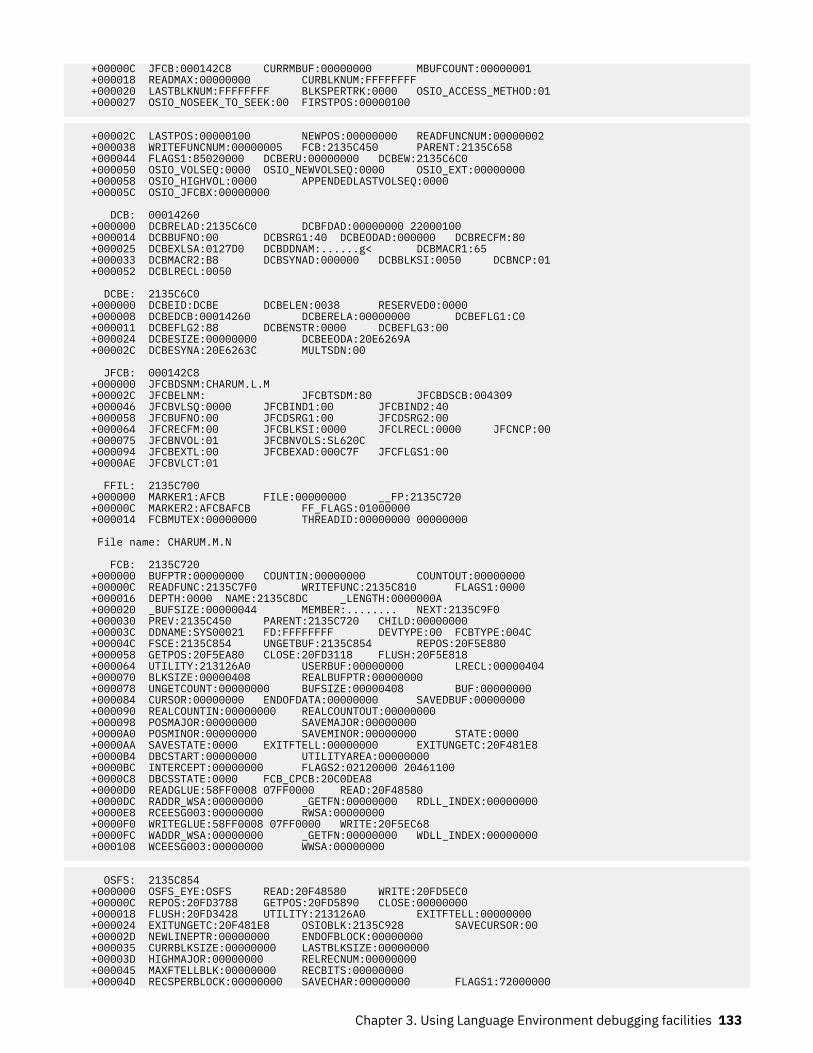
+00000C JFCB:000142C8 CURRMBUF:00000000 MBUFCOUNT:00000001 +000018 READMAX:00000000 CURBLKNUM:FFFFFFFF +000020 LASTBLKNUM:FFFFFFFF BLKSPERTRK:0000 OSIO_ACCESS_METHOD:01 +000027 OSIO_NOSEEK_TO_SEEK:00 FIRSTPOS:00000100
+00002C LASTPOS:00000100 NEWPOS:00000000 READFUNCNUM:00000002 +000038 WRITEFUNCNUM:00000005 FCB:2135C450 PARENT:2135C658 +000044 FLAGS1:85020000 DCBERU:00000000 DCBEW:2135C6C0 +000050 OSIO_VOLSEQ:0000 OSIO_NEWVOLSEQ:0000 OSIO_EXT:00000000 +000058 OSIO_HIGHVOL:0000 APPENDEDLASTVOLSEQ:0000 +00005C OSIO_JFCBX:00000000
DCB: 00014260 +000000 DCBRELAD:2135C6C0 DCBFDAD:00000000 22000100 +000014 DCBBUFNO:00 DCBSRG1:40 DCBEODAD:000000 DCBRECFM:80 +000025 DCBEXLSA:0127D0 DCBDDNAM:......g< DCBMACR1:65 +000033 DCBMACR2:B8 DCBSYNAD:000000 DCBBLKSI:0050 DCBNCP:01 +000052 DCBLRECL:0050
DCBE: 2135C6C0 +000000 DCBEID:DCBE DCBELEN:0038 RESERVED0:0000 +000008 DCBEDCB:00014260 DCBERELA:00000000 DCBEFLG1:C0 +000011 DCBEFLG2:88 DCBENSTR:0000 DCBEFLG3:00 +000024 DCBESIZE:00000000 DCBEEODA:20E6269A +00002C DCBESYNA:20E6263C MULTSDN:00
JFCB: 000142C8 +000000 JFCBDSNM:CHARUM.L.M +00002C JFCBELNM: JFCBTSDM:80 JFCBDSCB:004309 +000046 JFCBVLSQ:0000 JFCBIND1:00 JFCBIND2:40 +000058 JFCBUFNO:00 JFCDSRG1:00 JFCDSRG2:00 +000064 JFCRECFM:00 JFCBLKSI:0000 JFCLRECL:0000 JFCNCP:00 +000075 JFCBNVOL:01 JFCBNVOLS:SL620C +000094 JFCBEXTL:00 JFCBEXAD:000C7F JFCFLGS1:00 +0000AE JFCBVLCT:01
FFIL: 2135C700 +000000 MARKER1:AFCB FILE:00000000 __FP:2135C720 +00000C MARKER2:AFCBAFCB FF_FLAGS:01000000 +000014 FCBMUTEX:00000000 THREADID:00000000 00000000
File name: CHARUM.M.N
FCB: 2135C720 +000000 BUFPTR:00000000 COUNTIN:00000000 COUNTOUT:00000000 +00000C READFUNC:2135C7F0 WRITEFUNC:2135C810 FLAGS1:0000 +000016 DEPTH:0000 NAME:2135C8DC _LENGTH:0000000A +000020 _BUFSIZE:00000044 MEMBER:........ NEXT:2135C9F0 +000030 PREV:2135C450 PARENT:2135C720 CHILD:00000000 +00003C DDNAME:SYS00021 FD:FFFFFFFF DEVTYPE:00 FCBTYPE:004C +00004C FSCE:2135C854 UNGETBUF:2135C854 REPOS:20F5E880 +000058 GETPOS:20F5EA80 CLOSE:20FD3118 FLUSH:20F5E818 +000064 UTILITY:213126A0 USERBUF:00000000 LRECL:00000404 +000070 BLKSIZE:00000408 REALBUFPTR:00000000 +000078 UNGETCOUNT:00000000 BUFSIZE:00000408 BUF:00000000 +000084 CURSOR:00000000 ENDOFDATA:00000000 SAVEDBUF:00000000 +000090 REALCOUNTIN:00000000 REALCOUNTOUT:00000000 +000098 POSMAJOR:00000000 SAVEMAJOR:00000000 +0000A0 POSMINOR:00000000 SAVEMINOR:00000000 STATE:0000 +0000AA SAVESTATE:0000 EXITFTELL:00000000 EXITUNGETC:20F481E8 +0000B4 DBCSTART:00000000 UTILITYAREA:00000000 +0000BC INTERCEPT:00000000 FLAGS2:02120000 20461100 +0000C8 DBCSSTATE:0000 FCB_CPCB:20C0DEA8 +0000D0 READGLUE:58FF0008 07FF0000 READ:20F48580 +0000DC RADDR_WSA:00000000 _GETFN:00000000 RDLL_INDEX:00000000 +0000E8 RCEESG003:00000000 RWSA:00000000 +0000F0 WRITEGLUE:58FF0008 07FF0000 WRITE:20F5EC68 +0000FC WADDR_WSA:00000000 _GETFN:00000000 WDLL_INDEX:00000000 +000108 WCEESG003:00000000 WWSA:00000000
OSFS: 2135C854 +000000 OSFS_EYE:OSFS READ:20F48580 WRITE:20FD5EC0 +00000C REPOS:20FD3788 GETPOS:20FD5890 CLOSE:00000000 +000018 FLUSH:20FD3428 UTILITY:213126A0 EXITFTELL:00000000 +000024 EXITUNGETC:20F481E8 OSIOBLK:2135C928 SAVECURSOR:00 +00002D NEWLINEPTR:00000000 ENDOFBLOCK:00000000 +000035 CURRBLKSIZE:00000000 LASTBLKSIZE:00000000 +00003D HIGHMAJOR:00000000 RELRECNUM:00000000 +000045 MAXFTELLBLK:00000000 RECBITS:00000000 +00004D RECSPERBLOCK:00000000 SAVECHAR:00000000 FLAGS1:72000000
Chapter 3. Using Language Environment debugging facilities 133
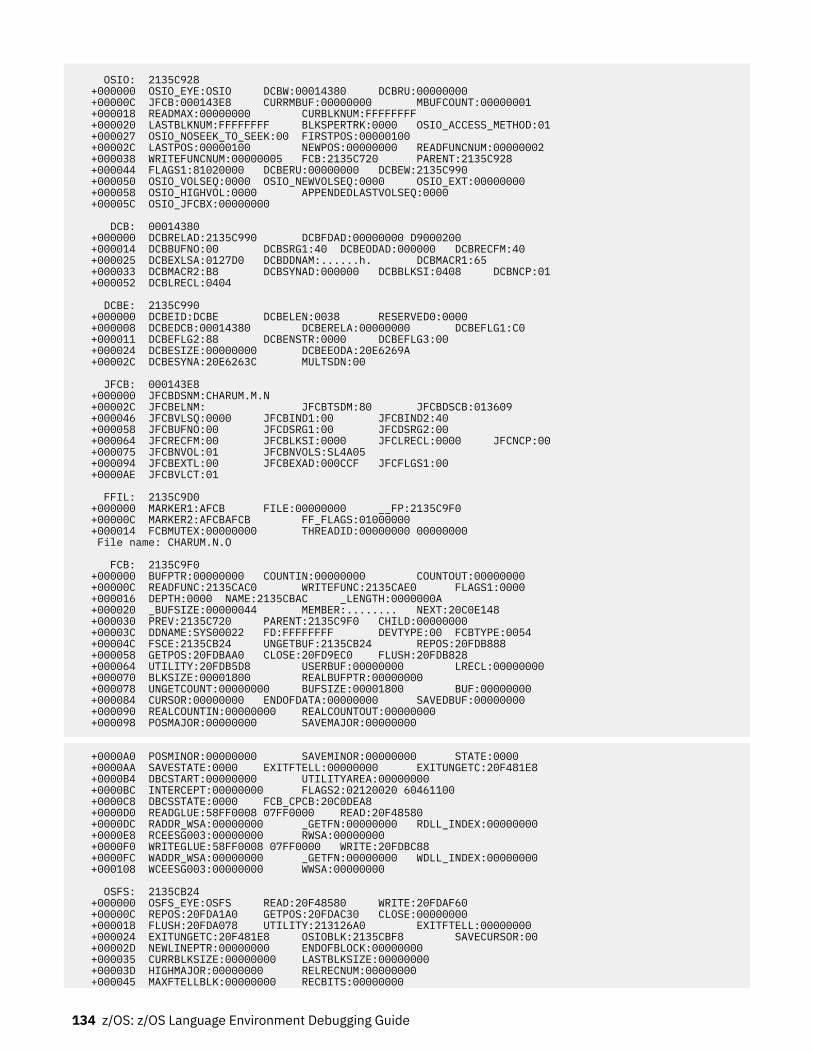
OSIO: 2135C928 +000000 OSIO_EYE:OSIO DCBW:00014380 DCBRU:00000000 +00000C JFCB:000143E8 CURRMBUF:00000000 MBUFCOUNT:00000001 +000018 READMAX:00000000 CURBLKNUM:FFFFFFFF +000020 LASTBLKNUM:FFFFFFFF BLKSPERTRK:0000 OSIO_ACCESS_METHOD:01 +000027 OSIO_NOSEEK_TO_SEEK:00 FIRSTPOS:00000100 +00002C LASTPOS:00000100 NEWPOS:00000000 READFUNCNUM:00000002 +000038 WRITEFUNCNUM:00000005 FCB:2135C720 PARENT:2135C928 +000044 FLAGS1:81020000 DCBERU:00000000 DCBEW:2135C990 +000050 OSIO_VOLSEQ:0000 OSIO_NEWVOLSEQ:0000 OSIO_EXT:00000000 +000058 OSIO_HIGHVOL:0000 APPENDEDLASTVOLSEQ:0000 +00005C OSIO_JFCBX:00000000
DCB: 00014380 +000000 DCBRELAD:2135C990 DCBFDAD:00000000 D9000200 +000014 DCBBUFNO:00 DCBSRG1:40 DCBEODAD:000000 DCBRECFM:40 +000025 DCBEXLSA:0127D0 DCBDDNAM:......h. DCBMACR1:65 +000033 DCBMACR2:B8 DCBSYNAD:000000 DCBBLKSI:0408 DCBNCP:01 +000052 DCBLRECL:0404
DCBE: 2135C990 +000000 DCBEID:DCBE DCBELEN:0038 RESERVED0:0000 +000008 DCBEDCB:00014380 DCBERELA:00000000 DCBEFLG1:C0 +000011 DCBEFLG2:88 DCBENSTR:0000 DCBEFLG3:00 +000024 DCBESIZE:00000000 DCBEEODA:20E6269A +00002C DCBESYNA:20E6263C MULTSDN:00
JFCB: 000143E8 +000000 JFCBDSNM:CHARUM.M.N +00002C JFCBELNM: JFCBTSDM:80 JFCBDSCB:013609 +000046 JFCBVLSQ:0000 JFCBIND1:00 JFCBIND2:40 +000058 JFCBUFNO:00 JFCDSRG1:00 JFCDSRG2:00 +000064 JFCRECFM:00 JFCBLKSI:0000 JFCLRECL:0000 JFCNCP:00 +000075 JFCBNVOL:01 JFCBNVOLS:SL4A05 +000094 JFCBEXTL:00 JFCBEXAD:000CCF JFCFLGS1:00 +0000AE JFCBVLCT:01
FFIL: 2135C9D0 +000000 MARKER1:AFCB FILE:00000000 __FP:2135C9F0 +00000C MARKER2:AFCBAFCB FF_FLAGS:01000000 +000014 FCBMUTEX:00000000 THREADID:00000000 00000000 File name: CHARUM.N.O
FCB: 2135C9F0 +000000 BUFPTR:00000000 COUNTIN:00000000 COUNTOUT:00000000 +00000C READFUNC:2135CAC0 WRITEFUNC:2135CAE0 FLAGS1:0000 +000016 DEPTH:0000 NAME:2135CBAC _LENGTH:0000000A +000020 _BUFSIZE:00000044 MEMBER:........ NEXT:20C0E148 +000030 PREV:2135C720 PARENT:2135C9F0 CHILD:00000000 +00003C DDNAME:SYS00022 FD:FFFFFFFF DEVTYPE:00 FCBTYPE:0054 +00004C FSCE:2135CB24 UNGETBUF:2135CB24 REPOS:20FDB888 +000058 GETPOS:20FDBAA0 CLOSE:20FD9EC0 FLUSH:20FDB828 +000064 UTILITY:20FDB5D8 USERBUF:00000000 LRECL:00000000 +000070 BLKSIZE:00001800 REALBUFPTR:00000000 +000078 UNGETCOUNT:00000000 BUFSIZE:00001800 BUF:00000000 +000084 CURSOR:00000000 ENDOFDATA:00000000 SAVEDBUF:00000000 +000090 REALCOUNTIN:00000000 REALCOUNTOUT:00000000 +000098 POSMAJOR:00000000 SAVEMAJOR:00000000
+0000A0 POSMINOR:00000000 SAVEMINOR:00000000 STATE:0000 +0000AA SAVESTATE:0000 EXITFTELL:00000000 EXITUNGETC:20F481E8 +0000B4 DBCSTART:00000000 UTILITYAREA:00000000 +0000BC INTERCEPT:00000000 FLAGS2:02120020 60461100 +0000C8 DBCSSTATE:0000 FCB_CPCB:20C0DEA8 +0000D0 READGLUE:58FF0008 07FF0000 READ:20F48580 +0000DC RADDR_WSA:00000000 _GETFN:00000000 RDLL_INDEX:00000000 +0000E8 RCEESG003:00000000 RWSA:00000000 +0000F0 WRITEGLUE:58FF0008 07FF0000 WRITE:20FDBC88 +0000FC WADDR_WSA:00000000 _GETFN:00000000 WDLL_INDEX:00000000 +000108 WCEESG003:00000000 WWSA:00000000
OSFS: 2135CB24 +000000 OSFS_EYE:OSFS READ:20F48580 WRITE:20FDAF60 +00000C REPOS:20FDA1A0 GETPOS:20FDAC30 CLOSE:00000000 +000018 FLUSH:20FDA078 UTILITY:213126A0 EXITFTELL:00000000 +000024 EXITUNGETC:20F481E8 OSIOBLK:2135CBF8 SAVECURSOR:00 +00002D NEWLINEPTR:00000000 ENDOFBLOCK:00000000 +000035 CURRBLKSIZE:00000000 LASTBLKSIZE:00000000 +00003D HIGHMAJOR:00000000 RELRECNUM:00000000 +000045 MAXFTELLBLK:00000000 RECBITS:00000000
134 z/OS: z/OS Language Environment Debugging Guide
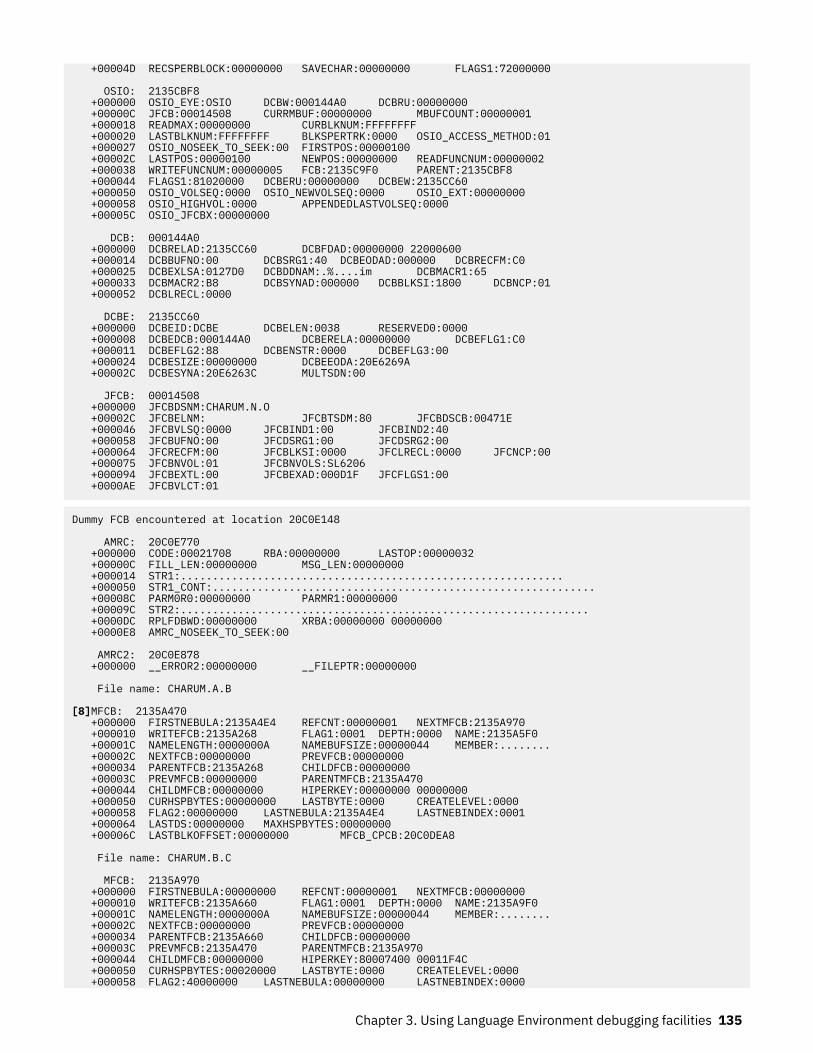
+00004D RECSPERBLOCK:00000000 SAVECHAR:00000000 FLAGS1:72000000
OSIO: 2135CBF8 +000000 OSIO_EYE:OSIO DCBW:000144A0 DCBRU:00000000 +00000C JFCB:00014508 CURRMBUF:00000000 MBUFCOUNT:00000001 +000018 READMAX:00000000 CURBLKNUM:FFFFFFFF +000020 LASTBLKNUM:FFFFFFFF BLKSPERTRK:0000 OSIO_ACCESS_METHOD:01 +000027 OSIO_NOSEEK_TO_SEEK:00 FIRSTPOS:00000100 +00002C LASTPOS:00000100 NEWPOS:00000000 READFUNCNUM:00000002 +000038 WRITEFUNCNUM:00000005 FCB:2135C9F0 PARENT:2135CBF8 +000044 FLAGS1:81020000 DCBERU:00000000 DCBEW:2135CC60 +000050 OSIO_VOLSEQ:0000 OSIO_NEWVOLSEQ:0000 OSIO_EXT:00000000 +000058 OSIO_HIGHVOL:0000 APPENDEDLASTVOLSEQ:0000 +00005C OSIO_JFCBX:00000000
DCB: 000144A0 +000000 DCBRELAD:2135CC60 DCBFDAD:00000000 22000600 +000014 DCBBUFNO:00 DCBSRG1:40 DCBEODAD:000000 DCBRECFM:C0 +000025 DCBEXLSA:0127D0 DCBDDNAM:.%....im DCBMACR1:65 +000033 DCBMACR2:B8 DCBSYNAD:000000 DCBBLKSI:1800 DCBNCP:01 +000052 DCBLRECL:0000
DCBE: 2135CC60 +000000 DCBEID:DCBE DCBELEN:0038 RESERVED0:0000 +000008 DCBEDCB:000144A0 DCBERELA:00000000 DCBEFLG1:C0 +000011 DCBEFLG2:88 DCBENSTR:0000 DCBEFLG3:00 +000024 DCBESIZE:00000000 DCBEEODA:20E6269A +00002C DCBESYNA:20E6263C MULTSDN:00
JFCB: 00014508 +000000 JFCBDSNM:CHARUM.N.O +00002C JFCBELNM: JFCBTSDM:80 JFCBDSCB:00471E +000046 JFCBVLSQ:0000 JFCBIND1:00 JFCBIND2:40 +000058 JFCBUFNO:00 JFCDSRG1:00 JFCDSRG2:00 +000064 JFCRECFM:00 JFCBLKSI:0000 JFCLRECL:0000 JFCNCP:00 +000075 JFCBNVOL:01 JFCBNVOLS:SL6206 +000094 JFCBEXTL:00 JFCBEXAD:000D1F JFCFLGS1:00 +0000AE JFCBVLCT:01
Dummy FCB encountered at location 20C0E148
AMRC: 20C0E770 +000000 CODE:00021708 RBA:00000000 LASTOP:00000032 +00000C FILL_LEN:00000000 MSG_LEN:00000000 +000014 STR1:............................................................ +000050 STR1_CONT:............................................................ +00008C PARM0R0:00000000 PARMR1:00000000 +00009C STR2:................................................................ +0000DC RPLFDBWD:00000000 XRBA:00000000 00000000 +0000E8 AMRC_NOSEEK_TO_SEEK:00
AMRC2: 20C0E878 +000000 __ERROR2:00000000 __FILEPTR:00000000
File name: CHARUM.A.B
[8]MFCB: 2135A470 +000000 FIRSTNEBULA:2135A4E4 REFCNT:00000001 NEXTMFCB:2135A970 +000010 WRITEFCB:2135A268 FLAG1:0001 DEPTH:0000 NAME:2135A5F0 +00001C NAMELENGTH:0000000A NAMEBUFSIZE:00000044 MEMBER:........ +00002C NEXTFCB:00000000 PREVFCB:00000000 +000034 PARENTFCB:2135A268 CHILDFCB:00000000 +00003C PREVMFCB:00000000 PARENTMFCB:2135A470 +000044 CHILDMFCB:00000000 HIPERKEY:00000000 00000000 +000050 CURHSPBYTES:00000000 LASTBYTE:0000 CREATELEVEL:0000 +000058 FLAG2:00000000 LASTNEBULA:2135A4E4 LASTNEBINDEX:0001 +000064 LASTDS:00000000 MAXHSPBYTES:00000000 +00006C LASTBLKOFFSET:00000000 MFCB_CPCB:20C0DEA8
File name: CHARUM.B.C
MFCB: 2135A970 +000000 FIRSTNEBULA:00000000 REFCNT:00000001 NEXTMFCB:00000000 +000010 WRITEFCB:2135A660 FLAG1:0001 DEPTH:0000 NAME:2135A9F0 +00001C NAMELENGTH:0000000A NAMEBUFSIZE:00000044 MEMBER:........ +00002C NEXTFCB:00000000 PREVFCB:00000000 +000034 PARENTFCB:2135A660 CHILDFCB:00000000 +00003C PREVMFCB:2135A470 PARENTMFCB:2135A970 +000044 CHILDMFCB:00000000 HIPERKEY:80007400 00011F4C +000050 CURHSPBYTES:00020000 LASTBYTE:0000 CREATELEVEL:0000 +000058 FLAG2:40000000 LASTNEBULA:00000000 LASTNEBINDEX:0000
Chapter 3. Using Language Environment debugging facilities 135
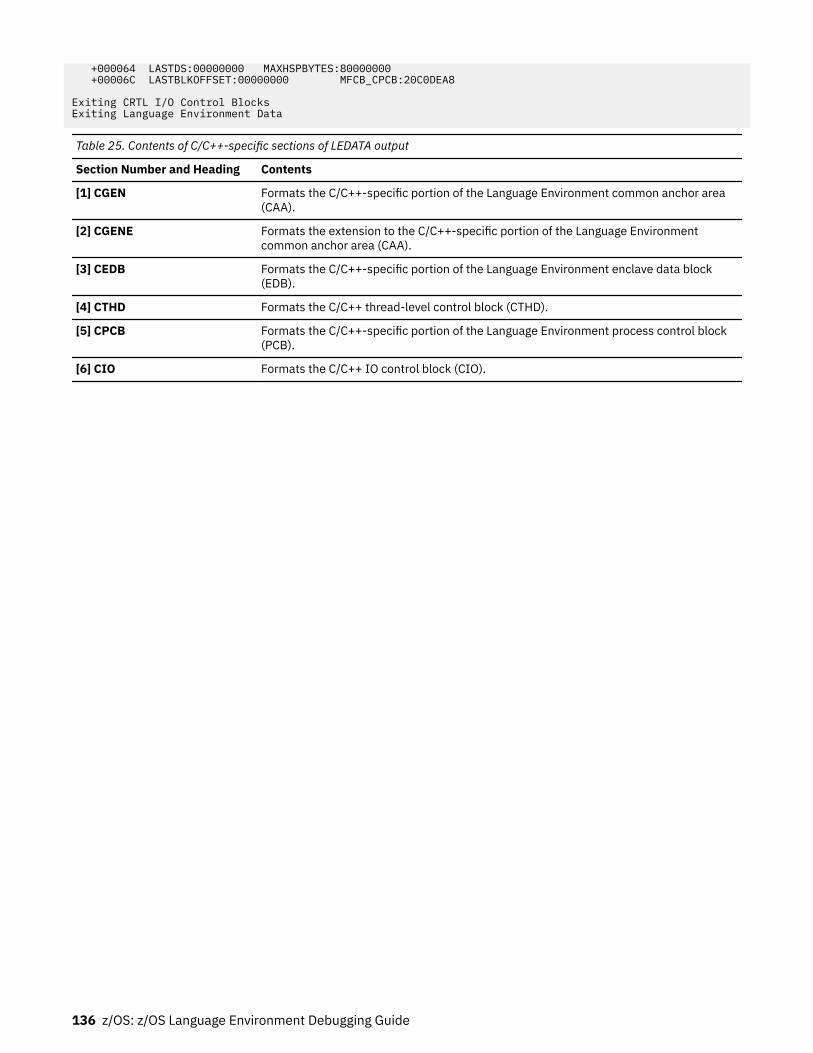
+000064 LASTDS:00000000 MAXHSPBYTES:80000000 +00006C LASTBLKOFFSET:00000000 MFCB_CPCB:20C0DEA8
Exiting CRTL I/O Control BlocksExiting Language Environment Data
Table 25. Contents of C/C++-specific sections of LEDATA output
Section Number and Heading Contents
[1] CGEN Formats the C/C++-specific portion of the Language Environment common anchor area(CAA).
[2] CGENE Formats the extension to the C/C++-specific portion of the Language Environmentcommon anchor area (CAA).
[3] CEDB Formats the C/C++-specific portion of the Language Environment enclave data block(EDB).
[4] CTHD Formats the C/C++ thread-level control block (CTHD).
[5] CPCB Formats the C/C++-specific portion of the Language Environment process control block(PCB).
[6] CIO Formats the C/C++ IO control block (CIO).
136 z/OS: z/OS Language Environment Debugging Guide
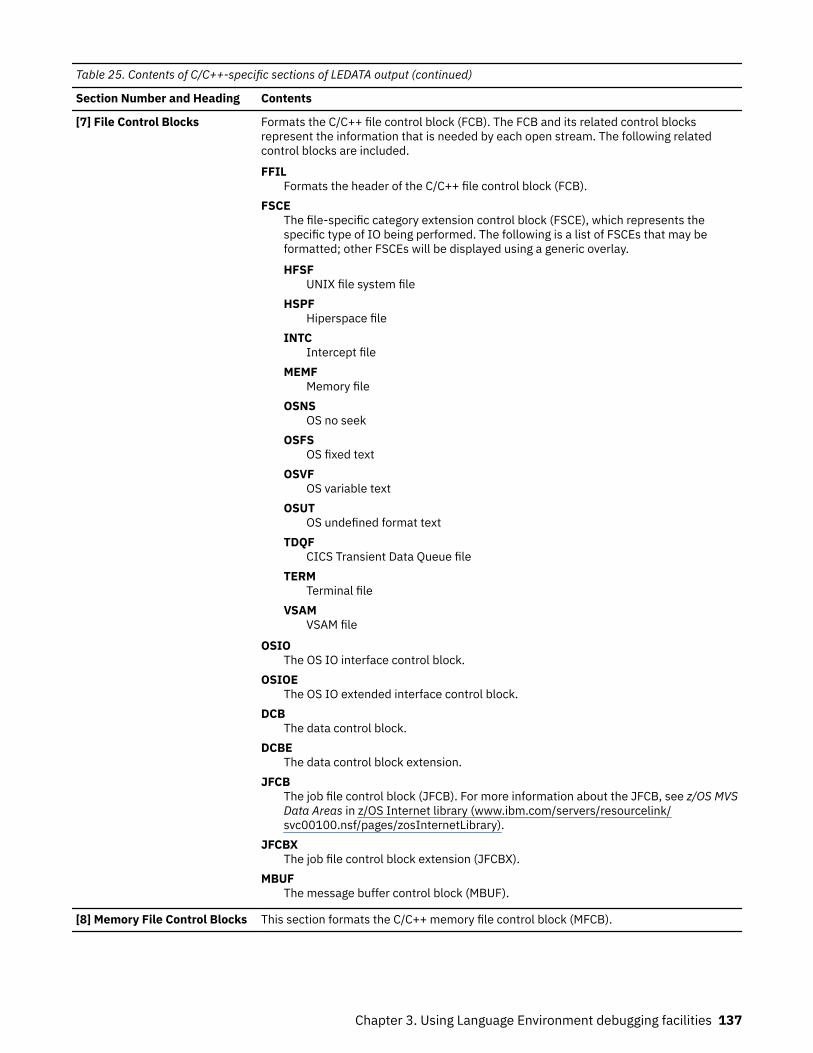
Table 25. Contents of C/C++-specific sections of LEDATA output (continued)
Section Number and Heading Contents
[7] File Control Blocks Formats the C/C++ file control block (FCB). The FCB and its related control blocksrepresent the information that is needed by each open stream. The following relatedcontrol blocks are included.
FFILFormats the header of the C/C++ file control block (FCB).
FSCEThe file-specific category extension control block (FSCE), which represents thespecific type of IO being performed. The following is a list of FSCEs that may beformatted; other FSCEs will be displayed using a generic overlay.
HFSFUNIX file system file
HSPFHiperspace file
INTCIntercept file
MEMFMemory file
OSNSOS no seek
OSFSOS fixed text
OSVFOS variable text
OSUTOS undefined format text
TDQFCICS Transient Data Queue file
TERMTerminal file
VSAMVSAM file
OSIOThe OS IO interface control block.
OSIOEThe OS IO extended interface control block.
DCBThe data control block.
DCBEThe data control block extension.
JFCBThe job file control block (JFCB). For more information about the JFCB, see z/OS MVSData Areas in z/OS Internet library (www.ibm.com/servers/resourcelink/svc00100.nsf/pages/zosInternetLibrary).
JFCBXThe job file control block extension (JFCBX).
MBUFThe message buffer control block (MBUF).
[8] Memory File Control Blocks This section formats the C/C++ memory file control block (MFCB).
Chapter 3. Using Language Environment debugging facilities 137
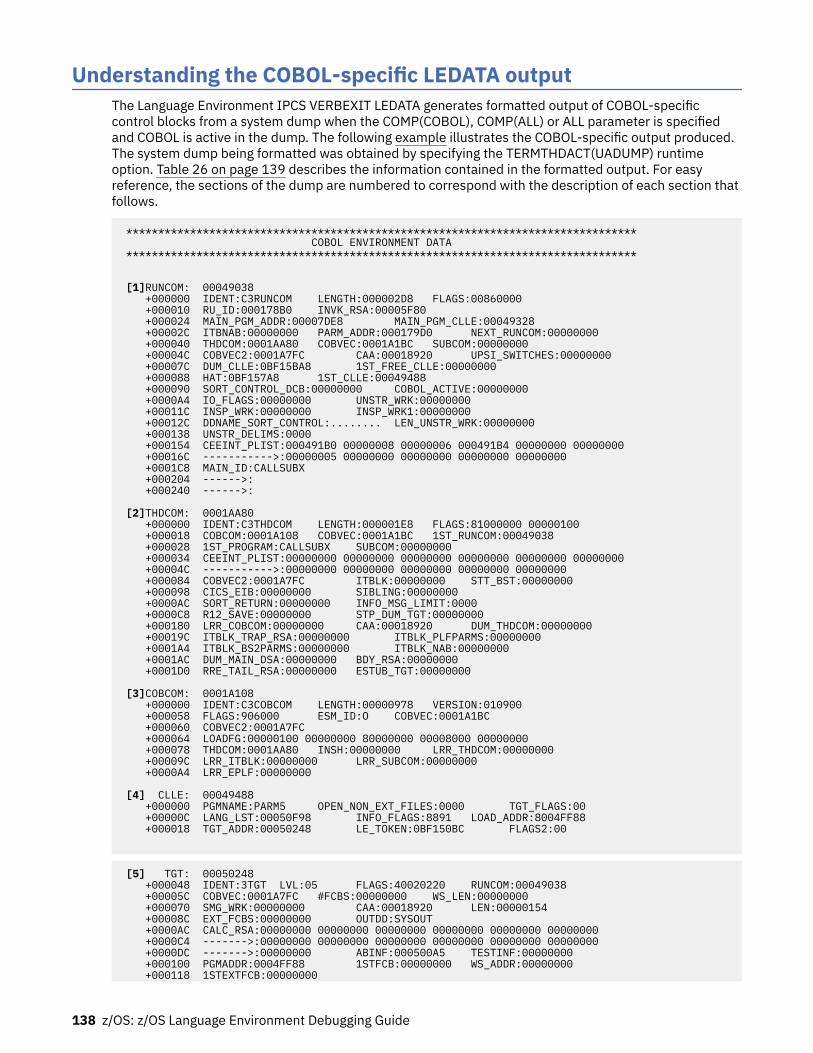
Understanding the COBOL-specific LEDATA outputThe Language Environment IPCS VERBEXIT LEDATA generates formatted output of COBOL-specificcontrol blocks from a system dump when the COMP(COBOL), COMP(ALL) or ALL parameter is specifiedand COBOL is active in the dump. The following example illustrates the COBOL-specific output produced.The system dump being formatted was obtained by specifying the TERMTHDACT(UADUMP) runtimeoption. Table 26 on page 139 describes the information contained in the formatted output. For easyreference, the sections of the dump are numbered to correspond with the description of each section thatfollows.
******************************************************************************** COBOL ENVIRONMENT DATA ********************************************************************************
[1]RUNCOM: 00049038 +000000 IDENT:C3RUNCOM LENGTH:000002D8 FLAGS:00860000 +000010 RU_ID:000178B0 INVK_RSA:00005F80 +000024 MAIN_PGM_ADDR:00007DE8 MAIN_PGM_CLLE:00049328 +00002C ITBNAB:00000000 PARM_ADDR:000179D0 NEXT_RUNCOM:00000000 +000040 THDCOM:0001AA80 COBVEC:0001A1BC SUBCOM:00000000 +00004C COBVEC2:0001A7FC CAA:00018920 UPSI_SWITCHES:00000000 +00007C DUM_CLLE:0BF15BA8 1ST_FREE_CLLE:00000000 +000088 HAT:0BF157A8 1ST_CLLE:00049488 +000090 SORT_CONTROL_DCB:00000000 COBOL_ACTIVE:00000000 +0000A4 IO_FLAGS:00000000 UNSTR_WRK:00000000 +00011C INSP_WRK:00000000 INSP_WRK1:00000000 +00012C DDNAME_SORT_CONTROL:........ LEN_UNSTR_WRK:00000000 +000138 UNSTR_DELIMS:0000 +000154 CEEINT_PLIST:000491B0 00000008 00000006 000491B4 00000000 00000000 +00016C ----------->:00000005 00000000 00000000 00000000 00000000 +0001C8 MAIN_ID:CALLSUBX +000204 ------>: +000240 ------>:
[2]THDCOM: 0001AA80 +000000 IDENT:C3THDCOM LENGTH:000001E8 FLAGS:81000000 00000100 +000018 COBCOM:0001A108 COBVEC:0001A1BC 1ST_RUNCOM:00049038 +000028 1ST_PROGRAM:CALLSUBX SUBCOM:00000000 +000034 CEEINT_PLIST:00000000 00000000 00000000 00000000 00000000 00000000 +00004C ----------->:00000000 00000000 00000000 00000000 00000000 +000084 COBVEC2:0001A7FC ITBLK:00000000 STT_BST:00000000 +000098 CICS_EIB:00000000 SIBLING:00000000 +0000AC SORT_RETURN:00000000 INFO_MSG_LIMIT:0000 +0000C8 R12_SAVE:00000000 STP_DUM_TGT:00000000 +000180 LRR_COBCOM:00000000 CAA:00018920 DUM_THDCOM:00000000 +00019C ITBLK_TRAP_RSA:00000000 ITBLK_PLFPARMS:00000000 +0001A4 ITBLK_BS2PARMS:00000000 ITBLK_NAB:00000000 +0001AC DUM_MAIN_DSA:00000000 BDY_RSA:00000000 +0001D0 RRE_TAIL_RSA:00000000 ESTUB_TGT:00000000
[3]COBCOM: 0001A108 +000000 IDENT:C3COBCOM LENGTH:00000978 VERSION:010900 +000058 FLAGS:906000 ESM_ID:O COBVEC:0001A1BC +000060 COBVEC2:0001A7FC +000064 LOADFG:00000100 00000000 80000000 00008000 00000000 +000078 THDCOM:0001AA80 INSH:00000000 LRR_THDCOM:00000000 +00009C LRR_ITBLK:00000000 LRR_SUBCOM:00000000 +0000A4 LRR_EPLF:00000000
[4] CLLE: 00049488 +000000 PGMNAME:PARM5 OPEN_NON_EXT_FILES:0000 TGT_FLAGS:00 +00000C LANG_LST:00050F98 INFO_FLAGS:8891 LOAD_ADDR:8004FF88 +000018 TGT_ADDR:00050248 LE_TOKEN:0BF150BC FLAGS2:00
[5] TGT: 00050248 +000048 IDENT:3TGT LVL:05 FLAGS:40020220 RUNCOM:00049038 +00005C COBVEC:0001A7FC #FCBS:00000000 WS_LEN:00000000 +000070 SMG_WRK:00000000 CAA:00018920 LEN:00000154 +00008C EXT_FCBS:00000000 OUTDD:SYSOUT +0000AC CALC_RSA:00000000 00000000 00000000 00000000 00000000 00000000 +0000C4 ------->:00000000 00000000 00000000 00000000 00000000 00000000 +0000DC ------->:00000000 ABINF:000500A5 TESTINF:00000000 +000100 PGMADDR:0004FF88 1STFCB:00000000 WS_ADDR:00000000 +000118 1STEXTFCB:00000000
138 z/OS: z/OS Language Environment Debugging Guide
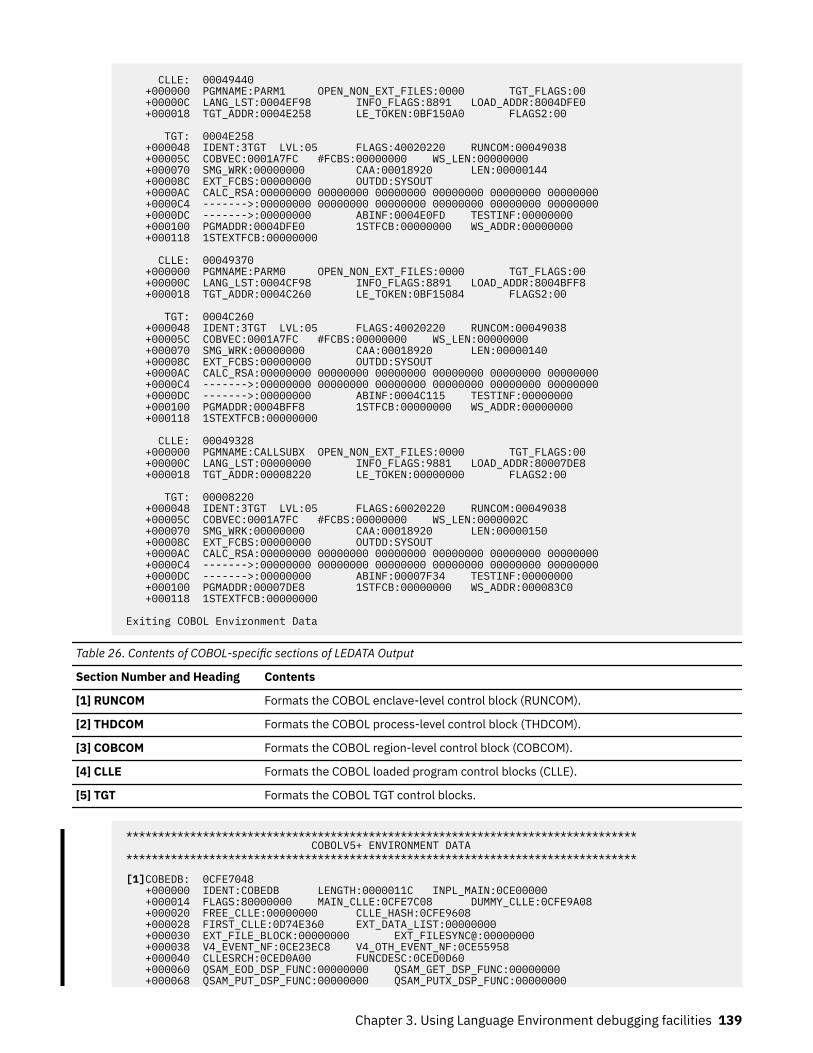
CLLE: 00049440 +000000 PGMNAME:PARM1 OPEN_NON_EXT_FILES:0000 TGT_FLAGS:00 +00000C LANG_LST:0004EF98 INFO_FLAGS:8891 LOAD_ADDR:8004DFE0 +000018 TGT_ADDR:0004E258 LE_TOKEN:0BF150A0 FLAGS2:00
TGT: 0004E258 +000048 IDENT:3TGT LVL:05 FLAGS:40020220 RUNCOM:00049038 +00005C COBVEC:0001A7FC #FCBS:00000000 WS_LEN:00000000 +000070 SMG_WRK:00000000 CAA:00018920 LEN:00000144 +00008C EXT_FCBS:00000000 OUTDD:SYSOUT +0000AC CALC_RSA:00000000 00000000 00000000 00000000 00000000 00000000 +0000C4 ------->:00000000 00000000 00000000 00000000 00000000 00000000 +0000DC ------->:00000000 ABINF:0004E0FD TESTINF:00000000 +000100 PGMADDR:0004DFE0 1STFCB:00000000 WS_ADDR:00000000 +000118 1STEXTFCB:00000000
CLLE: 00049370 +000000 PGMNAME:PARM0 OPEN_NON_EXT_FILES:0000 TGT_FLAGS:00 +00000C LANG_LST:0004CF98 INFO_FLAGS:8891 LOAD_ADDR:8004BFF8 +000018 TGT_ADDR:0004C260 LE_TOKEN:0BF15084 FLAGS2:00
TGT: 0004C260 +000048 IDENT:3TGT LVL:05 FLAGS:40020220 RUNCOM:00049038 +00005C COBVEC:0001A7FC #FCBS:00000000 WS_LEN:00000000 +000070 SMG_WRK:00000000 CAA:00018920 LEN:00000140 +00008C EXT_FCBS:00000000 OUTDD:SYSOUT +0000AC CALC_RSA:00000000 00000000 00000000 00000000 00000000 00000000 +0000C4 ------->:00000000 00000000 00000000 00000000 00000000 00000000 +0000DC ------->:00000000 ABINF:0004C115 TESTINF:00000000 +000100 PGMADDR:0004BFF8 1STFCB:00000000 WS_ADDR:00000000 +000118 1STEXTFCB:00000000
CLLE: 00049328 +000000 PGMNAME:CALLSUBX OPEN_NON_EXT_FILES:0000 TGT_FLAGS:00 +00000C LANG_LST:00000000 INFO_FLAGS:9881 LOAD_ADDR:80007DE8 +000018 TGT_ADDR:00008220 LE_TOKEN:00000000 FLAGS2:00
TGT: 00008220 +000048 IDENT:3TGT LVL:05 FLAGS:60020220 RUNCOM:00049038 +00005C COBVEC:0001A7FC #FCBS:00000000 WS_LEN:0000002C +000070 SMG_WRK:00000000 CAA:00018920 LEN:00000150 +00008C EXT_FCBS:00000000 OUTDD:SYSOUT +0000AC CALC_RSA:00000000 00000000 00000000 00000000 00000000 00000000 +0000C4 ------->:00000000 00000000 00000000 00000000 00000000 00000000 +0000DC ------->:00000000 ABINF:00007F34 TESTINF:00000000 +000100 PGMADDR:00007DE8 1STFCB:00000000 WS_ADDR:000083C0 +000118 1STEXTFCB:00000000
Exiting COBOL Environment Data
Table 26. Contents of COBOL-specific sections of LEDATA Output
Section Number and Heading Contents
[1] RUNCOM Formats the COBOL enclave-level control block (RUNCOM).
[2] THDCOM Formats the COBOL process-level control block (THDCOM).
[3] COBCOM Formats the COBOL region-level control block (COBCOM).
[4] CLLE Formats the COBOL loaded program control blocks (CLLE).
[5] TGT Formats the COBOL TGT control blocks.
******************************************************************************** COBOLV5+ ENVIRONMENT DATA ******************************************************************************** [1]COBEDB: 0CFE7048 +000000 IDENT:COBEDB LENGTH:0000011C INPL_MAIN:0CE00000 +000014 FLAGS:80000000 MAIN_CLLE:0CFE7C08 DUMMY_CLLE:0CFE9A08 +000020 FREE_CLLE:00000000 CLLE_HASH:0CFE9608 +000028 FIRST_CLLE:0D74E360 EXT_DATA_LIST:00000000 +000030 EXT_FILE_BLOCK:00000000 EXT_FILESYNC@:00000000 +000038 V4_EVENT_NF:0CE23EC8 V4_OTH_EVENT_NF:0CE55958 +000040 CLLESRCH:0CED0A00 FUNCDESC:0CED0D60 +000060 QSAM_EOD_DSP_FUNC:00000000 QSAM_GET_DSP_FUNC:00000000 +000068 QSAM_PUT_DSP_FUNC:00000000 QSAM_PUTX_DSP_FUNC:00000000
Chapter 3. Using Language Environment debugging facilities 139
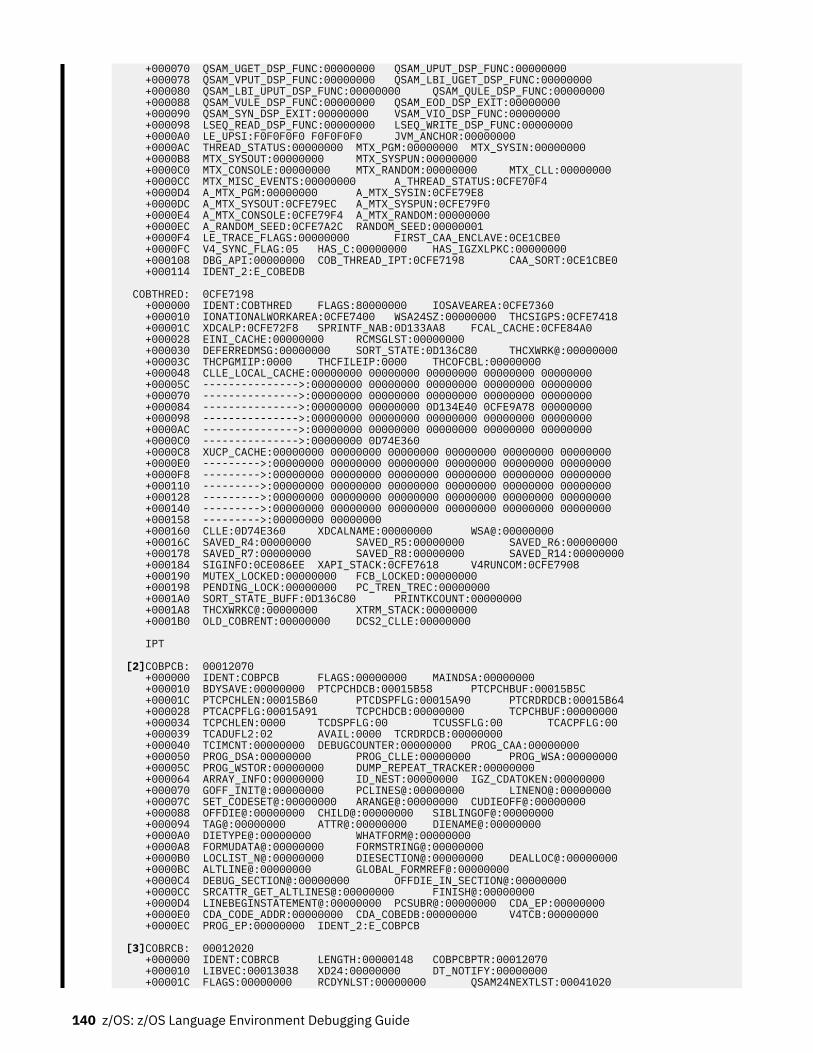
+000070 QSAM_UGET_DSP_FUNC:00000000 QSAM_UPUT_DSP_FUNC:00000000 +000078 QSAM_VPUT_DSP_FUNC:00000000 QSAM_LBI_UGET_DSP_FUNC:00000000 +000080 QSAM_LBI_UPUT_DSP_FUNC:00000000 QSAM_QULE_DSP_FUNC:00000000 +000088 QSAM_VULE_DSP_FUNC:00000000 QSAM_EOD_DSP_EXIT:00000000 +000090 QSAM_SYN_DSP_EXIT:00000000 VSAM_VIO_DSP_FUNC:00000000 +000098 LSEQ_READ_DSP_FUNC:00000000 LSEQ_WRITE_DSP_FUNC:00000000 +0000A0 LE_UPSI:F0F0F0F0 F0F0F0F0 JVM_ANCHOR:00000000 +0000AC THREAD_STATUS:00000000 MTX_PGM:00000000 MTX_SYSIN:00000000 +0000B8 MTX_SYSOUT:00000000 MTX_SYSPUN:00000000 +0000C0 MTX_CONSOLE:00000000 MTX_RANDOM:00000000 MTX_CLL:00000000 +0000CC MTX_MISC_EVENTS:00000000 A_THREAD_STATUS:0CFE70F4 +0000D4 A_MTX_PGM:00000000 A_MTX_SYSIN:0CFE79E8 +0000DC A_MTX_SYSOUT:0CFE79EC A_MTX_SYSPUN:0CFE79F0 +0000E4 A_MTX_CONSOLE:0CFE79F4 A_MTX_RANDOM:00000000 +0000EC A_RANDOM_SEED:0CFE7A2C RANDOM_SEED:00000001 +0000F4 LE_TRACE_FLAGS:00000000 FIRST_CAA_ENCLAVE:0CE1CBE0 +0000FC V4_SYNC_FLAG:05 HAS_C:00000000 HAS_IGZXLPKC:00000000 +000108 DBG_API:00000000 COB_THREAD_IPT:0CFE7198 CAA_SORT:0CE1CBE0 +000114 IDENT_2:E_COBEDB COBTHRED: 0CFE7198 +000000 IDENT:COBTHRED FLAGS:80000000 IOSAVEAREA:0CFE7360 +000010 IONATIONALWORKAREA:0CFE7400 WSA24SZ:00000000 THCSIGPS:0CFE7418 +00001C XDCALP:0CFE72F8 SPRINTF_NAB:0D133AA8 FCAL_CACHE:0CFE84A0 +000028 EINI_CACHE:00000000 RCMSGLST:00000000 +000030 DEFERREDMSG:00000000 SORT_STATE:0D136C80 THCXWRK@:00000000 +00003C THCPGMIIP:0000 THCFILEIP:0000 THCOFCBL:00000000 +000048 CLLE_LOCAL_CACHE:00000000 00000000 00000000 00000000 00000000 +00005C --------------->:00000000 00000000 00000000 00000000 00000000 +000070 --------------->:00000000 00000000 00000000 00000000 00000000 +000084 --------------->:00000000 00000000 0D134E40 0CFE9A78 00000000 +000098 --------------->:00000000 00000000 00000000 00000000 00000000 +0000AC --------------->:00000000 00000000 00000000 00000000 00000000 +0000C0 --------------->:00000000 0D74E360 +0000C8 XUCP_CACHE:00000000 00000000 00000000 00000000 00000000 00000000 +0000E0 --------->:00000000 00000000 00000000 00000000 00000000 00000000 +0000F8 --------->:00000000 00000000 00000000 00000000 00000000 00000000 +000110 --------->:00000000 00000000 00000000 00000000 00000000 00000000 +000128 --------->:00000000 00000000 00000000 00000000 00000000 00000000 +000140 --------->:00000000 00000000 00000000 00000000 00000000 00000000 +000158 --------->:00000000 00000000 +000160 CLLE:0D74E360 XDCALNAME:00000000 WSA@:00000000 +00016C SAVED_R4:00000000 SAVED_R5:00000000 SAVED_R6:00000000 +000178 SAVED_R7:00000000 SAVED_R8:00000000 SAVED_R14:00000000 +000184 SIGINFO:0CE086EE XAPI_STACK:0CFE7618 V4RUNCOM:0CFE7908 +000190 MUTEX_LOCKED:00000000 FCB_LOCKED:00000000 +000198 PENDING_LOCK:00000000 PC_TREN_TREC:00000000 +0001A0 SORT_STATE_BUFF:0D136C80 PRINTKCOUNT:00000000 +0001A8 THCXWRKC@:00000000 XTRM_STACK:00000000 +0001B0 OLD_COBRENT:00000000 DCS2_CLLE:00000000 IPT [2]COBPCB: 00012070 +000000 IDENT:COBPCB FLAGS:00000000 MAINDSA:00000000 +000010 BDYSAVE:00000000 PTCPCHDCB:00015B58 PTCPCHBUF:00015B5C +00001C PTCPCHLEN:00015B60 PTCDSPFLG:00015A90 PTCRDRDCB:00015B64 +000028 PTCACPFLG:00015A91 TCPCHDCB:00000000 TCPCHBUF:00000000 +000034 TCPCHLEN:0000 TCDSPFLG:00 TCUSSFLG:00 TCACPFLG:00 +000039 TCADUFL2:02 AVAIL:0000 TCRDRDCB:00000000 +000040 TCIMCNT:00000000 DEBUGCOUNTER:00000000 PROG_CAA:00000000 +000050 PROG_DSA:00000000 PROG_CLLE:00000000 PROG_WSA:00000000 +00005C PROG_WSTOR:00000000 DUMP_REPEAT_TRACKER:00000000 +000064 ARRAY_INFO:00000000 ID_NEST:00000000 IGZ_CDATOKEN:00000000 +000070 GOFF_INIT@:00000000 PCLINES@:00000000 LINENO@:00000000 +00007C SET_CODESET@:00000000 ARANGE@:00000000 CUDIEOFF@:00000000 +000088 OFFDIE@:00000000 CHILD@:00000000 SIBLINGOF@:00000000 +000094 TAG@:00000000 ATTR@:00000000 DIENAME@:00000000 +0000A0 DIETYPE@:00000000 WHATFORM@:00000000 +0000A8 FORMUDATA@:00000000 FORMSTRING@:00000000 +0000B0 LOCLIST_N@:00000000 DIESECTION@:00000000 DEALLOC@:00000000 +0000BC ALTLINE@:00000000 GLOBAL_FORMREF@:00000000 +0000C4 DEBUG_SECTION@:00000000 OFFDIE_IN_SECTION@:00000000 +0000CC SRCATTR_GET_ALTLINES@:00000000 FINISH@:00000000 +0000D4 LINEBEGINSTATEMENT@:00000000 PCSUBR@:00000000 CDA_EP:00000000 +0000E0 CDA_CODE_ADDR:00000000 CDA_COBEDB:00000000 V4TCB:00000000 +0000EC PROG_EP:00000000 IDENT_2:E_COBPCB [3]COBRCB: 00012020 +000000 IDENT:COBRCB LENGTH:00000148 COBPCBPTR:00012070 +000010 LIBVEC:00013038 XD24:00000000 DT_NOTIFY:00000000 +00001C FLAGS:00000000 RCDYNLST:00000000 QSAM24NEXTLST:00041020
140 z/OS: z/OS Language Environment Debugging Guide
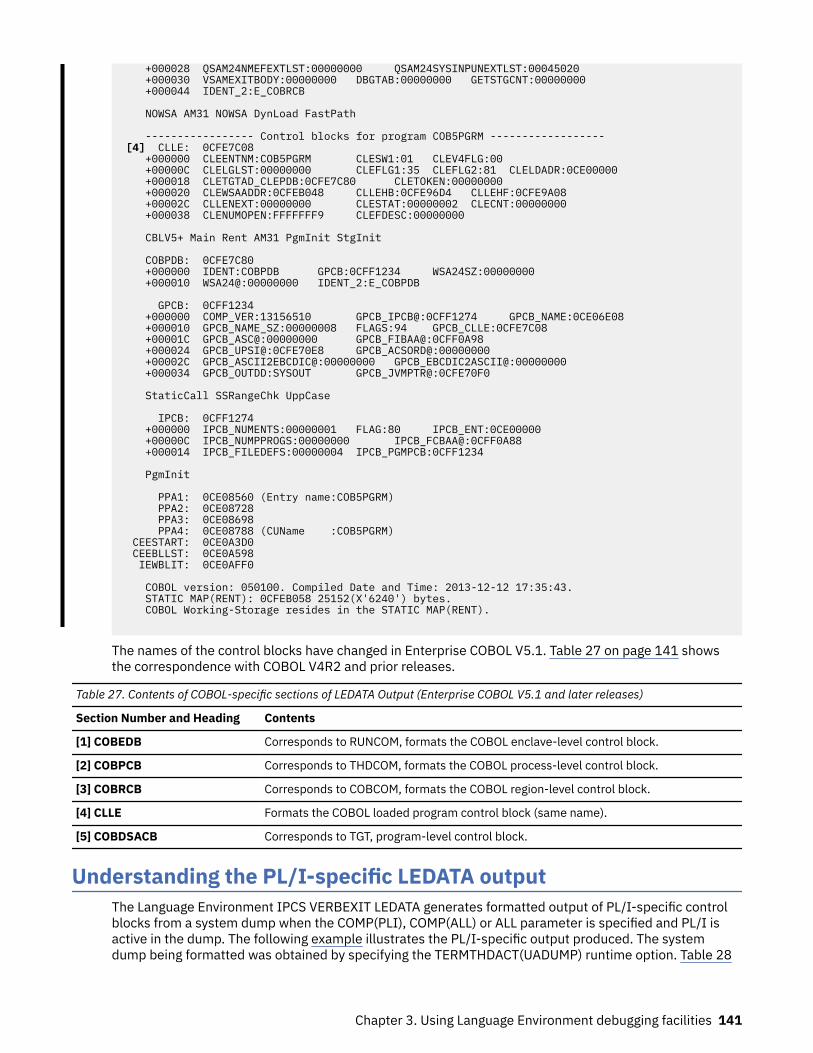
+000028 QSAM24NMEFEXTLST:00000000 QSAM24SYSINPUNEXTLST:00045020 +000030 VSAMEXITBODY:00000000 DBGTAB:00000000 GETSTGCNT:00000000 +000044 IDENT_2:E_COBRCB NOWSA AM31 NOWSA DynLoad FastPath ----------------- Control blocks for program COB5PGRM ------------------ [4] CLLE: 0CFE7C08 +000000 CLEENTNM:COB5PGRM CLESW1:01 CLEV4FLG:00 +00000C CLELGLST:00000000 CLEFLG1:35 CLEFLG2:81 CLELDADR:0CE00000 +000018 CLETGTAD_CLEPDB:0CFE7C80 CLETOKEN:00000000 +000020 CLEWSAADDR:0CFEB048 CLLEHB:0CFE96D4 CLLEHF:0CFE9A08 +00002C CLLENEXT:00000000 CLESTAT:00000002 CLECNT:00000000 +000038 CLENUMOPEN:FFFFFFF9 CLEFDESC:00000000 CBLV5+ Main Rent AM31 PgmInit StgInit COBPDB: 0CFE7C80 +000000 IDENT:COBPDB GPCB:0CFF1234 WSA24SZ:00000000 +000010 WSA24@:00000000 IDENT_2:E_COBPDB GPCB: 0CFF1234 +000000 COMP_VER:13156510 GPCB_IPCB@:0CFF1274 GPCB_NAME:0CE06E08 +000010 GPCB_NAME_SZ:00000008 FLAGS:94 GPCB_CLLE:0CFE7C08 +00001C GPCB_ASC@:00000000 GPCB_FIBAA@:0CFF0A98 +000024 GPCB_UPSI@:0CFE70E8 GPCB_ACSORD@:00000000 +00002C GPCB_ASCII2EBCDIC@:00000000 GPCB_EBCDIC2ASCII@:00000000 +000034 GPCB_OUTDD:SYSOUT GPCB_JVMPTR@:0CFE70F0 StaticCall SSRangeChk UppCase IPCB: 0CFF1274 +000000 IPCB_NUMENTS:00000001 FLAG:80 IPCB_ENT:0CE00000 +00000C IPCB_NUMPPROGS:00000000 IPCB_FCBAA@:0CFF0A88 +000014 IPCB_FILEDEFS:00000004 IPCB_PGMPCB:0CFF1234 PgmInit PPA1: 0CE08560 (Entry name:COB5PGRM) PPA2: 0CE08728 PPA3: 0CE08698 PPA4: 0CE08788 (CUName :COB5PGRM) CEESTART: 0CE0A3D0 CEEBLLST: 0CE0A598 IEWBLIT: 0CE0AFF0 COBOL version: 050100. Compiled Date and Time: 2013-12-12 17:35:43. STATIC MAP(RENT): 0CFEB058 25152(X'6240') bytes. COBOL Working-Storage resides in the STATIC MAP(RENT).
The names of the control blocks have changed in Enterprise COBOL V5.1. Table 27 on page 141 showsthe correspondence with COBOL V4R2 and prior releases.
Table 27. Contents of COBOL-specific sections of LEDATA Output (Enterprise COBOL V5.1 and later releases)
Section Number and Heading Contents
[1] COBEDB Corresponds to RUNCOM, formats the COBOL enclave-level control block.
[2] COBPCB Corresponds to THDCOM, formats the COBOL process-level control block.
[3] COBRCB Corresponds to COBCOM, formats the COBOL region-level control block.
[4] CLLE Formats the COBOL loaded program control block (same name).
[5] COBDSACB Corresponds to TGT, program-level control block.
Understanding the PL/I-specific LEDATA outputThe Language Environment IPCS VERBEXIT LEDATA generates formatted output of PL/I-specific controlblocks from a system dump when the COMP(PLI), COMP(ALL) or ALL parameter is specified and PL/I isactive in the dump. The following example illustrates the PL/I-specific output produced. The systemdump being formatted was obtained by specifying the TERMTHDACT(UADUMP) runtime option. Table 28
Chapter 3. Using Language Environment debugging facilities 141
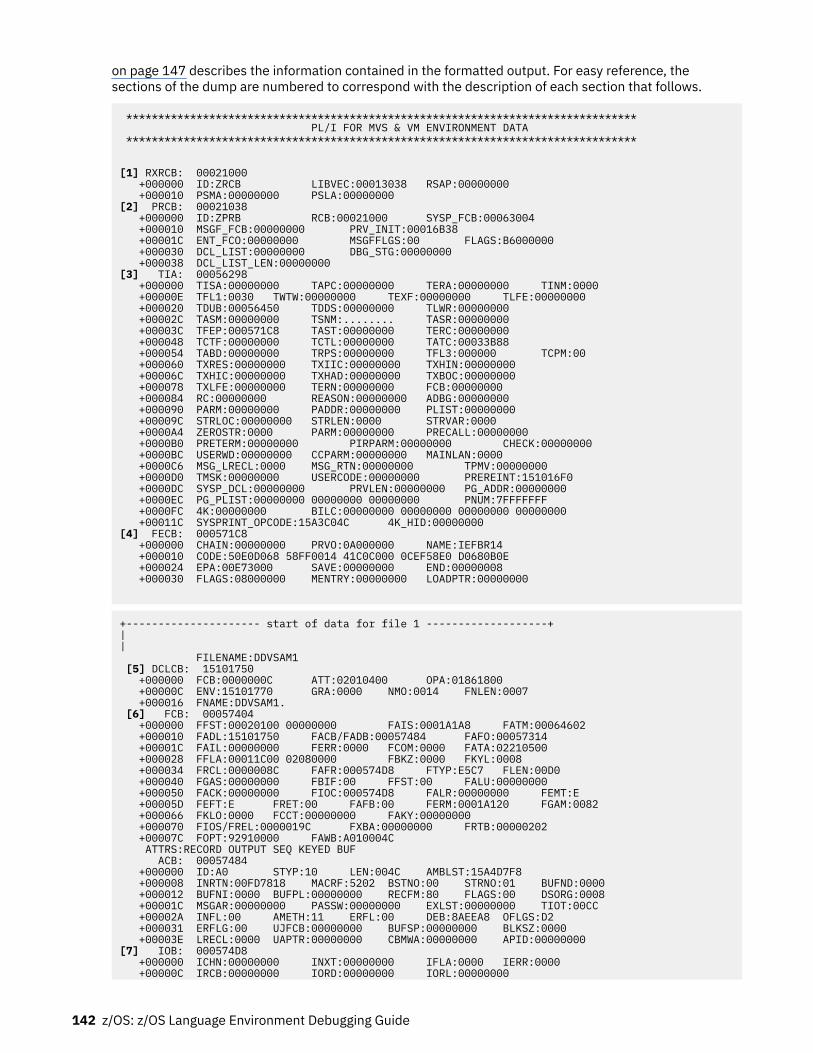
on page 147 describes the information contained in the formatted output. For easy reference, thesections of the dump are numbered to correspond with the description of each section that follows.
******************************************************************************** PL/I FOR MVS & VM ENVIRONMENT DATA ********************************************************************************
[1] RXRCB: 00021000 +000000 ID:ZRCB LIBVEC:00013038 RSAP:00000000 +000010 PSMA:00000000 PSLA:00000000[2] PRCB: 00021038 +000000 ID:ZPRB RCB:00021000 SYSP_FCB:00063004 +000010 MSGF_FCB:00000000 PRV_INIT:00016B38 +00001C ENT_FCO:00000000 MSGFFLGS:00 FLAGS:B6000000 +000030 DCL_LIST:00000000 DBG_STG:00000000 +000038 DCL_LIST_LEN:00000000[3] TIA: 00056298 +000000 TISA:00000000 TAPC:00000000 TERA:00000000 TINM:0000 +00000E TFL1:0030 TWTW:00000000 TEXF:00000000 TLFE:00000000 +000020 TDUB:00056450 TDDS:00000000 TLWR:00000000 +00002C TASM:00000000 TSNM:........ TASR:00000000 +00003C TFEP:000571C8 TAST:00000000 TERC:00000000 +000048 TCTF:00000000 TCTL:00000000 TATC:00033B88 +000054 TABD:00000000 TRPS:00000000 TFL3:000000 TCPM:00 +000060 TXRES:00000000 TXIIC:00000000 TXHIN:00000000 +00006C TXHIC:00000000 TXHAD:00000000 TXBOC:00000000 +000078 TXLFE:00000000 TERN:00000000 FCB:00000000 +000084 RC:00000000 REASON:00000000 ADBG:00000000 +000090 PARM:00000000 PADDR:00000000 PLIST:00000000 +00009C STRLOC:00000000 STRLEN:0000 STRVAR:0000 +0000A4 ZEROSTR:0000 PARM:00000000 PRECALL:00000000 +0000B0 PRETERM:00000000 PIRPARM:00000000 CHECK:00000000 +0000BC USERWD:00000000 CCPARM:00000000 MAINLAN:0000 +0000C6 MSG_LRECL:0000 MSG_RTN:00000000 TPMV:00000000 +0000D0 TMSK:00000000 USERCODE:00000000 PREREINT:151016F0 +0000DC SYSP_DCL:00000000 PRVLEN:00000000 PG_ADDR:00000000 +0000EC PG_PLIST:00000000 00000000 00000000 PNUM:7FFFFFFF +0000FC 4K:00000000 BILC:00000000 00000000 00000000 00000000 +00011C SYSPRINT_OPCODE:15A3C04C 4K_HID:00000000[4] FECB: 000571C8 +000000 CHAIN:00000000 PRVO:0A000000 NAME:IEFBR14 +000010 CODE:50E0D068 58FF0014 41C0C000 0CEF58E0 D0680B0E +000024 EPA:00E73000 SAVE:00000000 END:00000008 +000030 FLAGS:08000000 MENTRY:00000000 LOADPTR:00000000
+--------------------- start of data for file 1 -------------------+| | FILENAME:DDVSAM1 [5] DCLCB: 15101750 +000000 FCB:0000000C ATT:02010400 OPA:01861800 +00000C ENV:15101770 GRA:0000 NMO:0014 FNLEN:0007 +000016 FNAME:DDVSAM1. [6] FCB: 00057404 +000000 FFST:00020100 00000000 FAIS:0001A1A8 FATM:00064602 +000010 FADL:15101750 FACB/FADB:00057484 FAFO:00057314 +00001C FAIL:00000000 FERR:0000 FCOM:0000 FATA:02210500 +000028 FFLA:00011C00 02080000 FBKZ:0000 FKYL:0008 +000034 FRCL:0000008C FAFR:000574D8 FTYP:E5C7 FLEN:00D0 +000040 FGAS:00000000 FBIF:00 FFST:00 FALU:00000000 +000050 FACK:00000000 FIOC:000574D8 FALR:00000000 FEMT:E +00005D FEFT:E FRET:00 FAFB:00 FERM:0001A120 FGAM:0082 +000066 FKLO:0000 FCCT:00000000 FAKY:00000000 +000070 FIOS/FREL:0000019C FXBA:00000000 FRTB:00000202 +00007C FOPT:92910000 FAWB:A010004C ATTRS:RECORD OUTPUT SEQ KEYED BUF ACB: 00057484 +000000 ID:A0 STYP:10 LEN:004C AMBLST:15A4D7F8 +000008 INRTN:00FD7818 MACRF:5202 BSTNO:00 STRNO:01 BUFND:0000 +000012 BUFNI:0000 BUFPL:00000000 RECFM:80 FLAGS:00 DSORG:0008 +00001C MSGAR:00000000 PASSW:00000000 EXLST:00000000 TIOT:00CC +00002A INFL:00 AMETH:11 ERFL:00 DEB:8AEEA8 OFLGS:D2 +000031 ERFLG:00 UJFCB:00000000 BUFSP:00000000 BLKSZ:0000 +00003E LRECL:0000 UAPTR:00000000 CBMWA:00000000 APID:00000000[7] IOB: 000574D8 +000000 ICHN:00000000 INXT:00000000 IFLA:0000 IERR:0000 +00000C IRCB:00000000 IORD:00000000 IORL:00000000
142 z/OS: z/OS Language Environment Debugging Guide
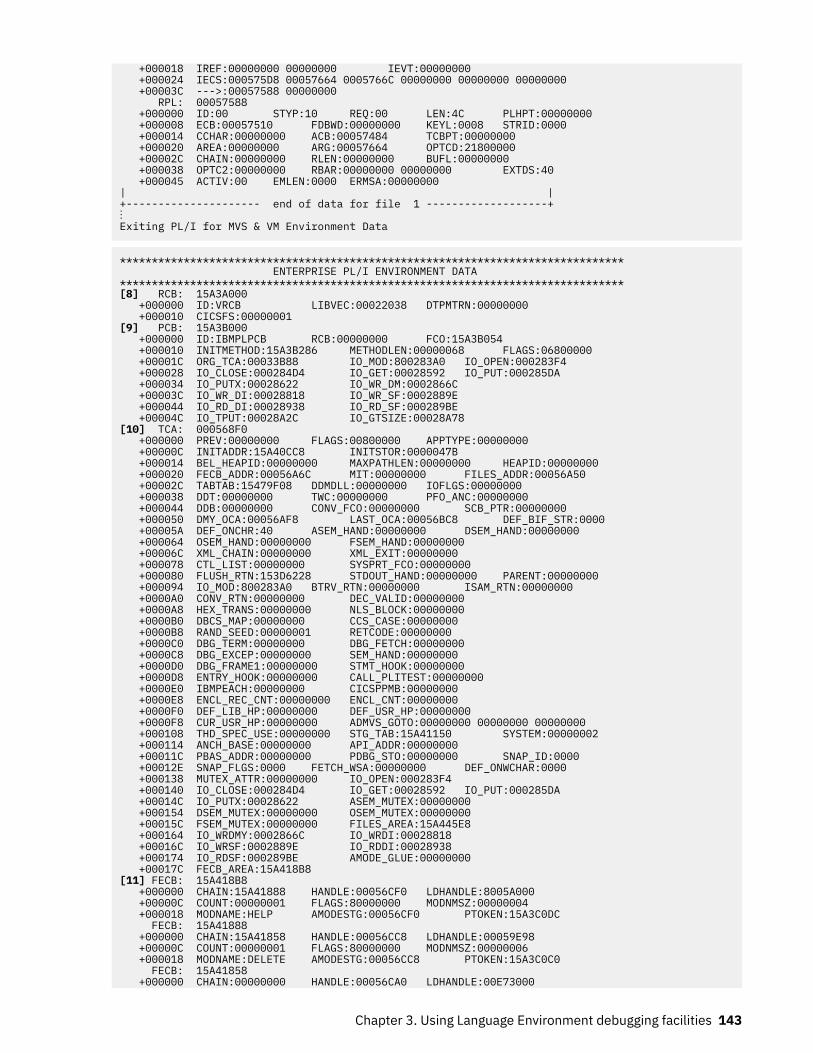
+000018 IREF:00000000 00000000 IEVT:00000000 +000024 IECS:000575D8 00057664 0005766C 00000000 00000000 00000000 +00003C --->:00057588 00000000 RPL: 00057588 +000000 ID:00 STYP:10 REQ:00 LEN:4C PLHPT:00000000 +000008 ECB:00057510 FDBWD:00000000 KEYL:0008 STRID:0000 +000014 CCHAR:00000000 ACB:00057484 TCBPT:00000000 +000020 AREA:00000000 ARG:00057664 OPTCD:21800000 +00002C CHAIN:00000000 RLEN:00000000 BUFL:00000000 +000038 OPTC2:00000000 RBAR:00000000 00000000 EXTDS:40 +000045 ACTIV:00 EMLEN:0000 ERMSA:00000000| |+--------------------- end of data for file 1 -------------------+⋮ Exiting PL/I for MVS & VM Environment Data
******************************************************************************* ENTERPRISE PL/I ENVIRONMENT DATA*******************************************************************************[8] RCB: 15A3A000 +000000 ID:VRCB LIBVEC:00022038 DTPMTRN:00000000 +000010 CICSFS:00000001[9] PCB: 15A3B000 +000000 ID:IBMPLPCB RCB:00000000 FCO:15A3B054 +000010 INITMETHOD:15A3B286 METHODLEN:00000068 FLAGS:06800000 +00001C ORG_TCA:00033B88 IO_MOD:800283A0 IO_OPEN:000283F4 +000028 IO_CLOSE:000284D4 IO_GET:00028592 IO_PUT:000285DA +000034 IO_PUTX:00028622 IO_WR_DM:0002866C +00003C IO_WR_DI:00028818 IO_WR_SF:0002889E +000044 IO_RD_DI:00028938 IO_RD_SF:000289BE +00004C IO_TPUT:00028A2C IO_GTSIZE:00028A78[10] TCA: 000568F0 +000000 PREV:00000000 FLAGS:00800000 APPTYPE:00000000 +00000C INITADDR:15A40CC8 INITSTOR:0000047B +000014 BEL_HEAPID:00000000 MAXPATHLEN:00000000 HEAPID:00000000 +000020 FECB_ADDR:00056A6C MIT:00000000 FILES_ADDR:00056A50 +00002C TABTAB:15479F08 DDMDLL:00000000 IOFLGS:00000000 +000038 DDT:00000000 TWC:00000000 PFO_ANC:00000000 +000044 DDB:00000000 CONV_FCO:00000000 SCB_PTR:00000000 +000050 DMY_OCA:00056AF8 LAST_OCA:00056BC8 DEF_BIF_STR:0000 +00005A DEF_ONCHR:40 ASEM_HAND:00000000 DSEM_HAND:00000000 +000064 OSEM_HAND:00000000 FSEM_HAND:00000000 +00006C XML_CHAIN:00000000 XML_EXIT:00000000 +000078 CTL_LIST:00000000 SYSPRT_FCO:00000000 +000080 FLUSH_RTN:153D6228 STDOUT_HAND:00000000 PARENT:00000000 +000094 IO_MOD:800283A0 BTRV_RTN:00000000 ISAM_RTN:00000000 +0000A0 CONV_RTN:00000000 DEC_VALID:00000000 +0000A8 HEX_TRANS:00000000 NLS_BLOCK:00000000 +0000B0 DBCS_MAP:00000000 CCS_CASE:00000000 +0000B8 RAND_SEED:00000001 RETCODE:00000000 +0000C0 DBG_TERM:00000000 DBG_FETCH:00000000 +0000C8 DBG_EXCEP:00000000 SEM_HAND:00000000 +0000D0 DBG_FRAME1:00000000 STMT_HOOK:00000000 +0000D8 ENTRY_HOOK:00000000 CALL_PLITEST:00000000 +0000E0 IBMPEACH:00000000 CICSPPMB:00000000 +0000E8 ENCL_REC_CNT:00000000 ENCL_CNT:00000000 +0000F0 DEF_LIB_HP:00000000 DEF_USR_HP:00000000 +0000F8 CUR_USR_HP:00000000 ADMVS_GOTO:00000000 00000000 00000000 +000108 THD_SPEC_USE:00000000 STG_TAB:15A41150 SYSTEM:00000002 +000114 ANCH_BASE:00000000 API_ADDR:00000000 +00011C PBAS_ADDR:00000000 PDBG_STO:00000000 SNAP_ID:0000 +00012E SNAP_FLGS:0000 FETCH_WSA:00000000 DEF_ONWCHAR:0000 +000138 MUTEX_ATTR:00000000 IO_OPEN:000283F4 +000140 IO_CLOSE:000284D4 IO_GET:00028592 IO_PUT:000285DA +00014C IO_PUTX:00028622 ASEM_MUTEX:00000000 +000154 DSEM_MUTEX:00000000 OSEM_MUTEX:00000000 +00015C FSEM_MUTEX:00000000 FILES_AREA:15A445E8 +000164 IO_WRDMY:0002866C IO_WRDI:00028818 +00016C IO_WRSF:0002889E IO_RDDI:00028938 +000174 IO_RDSF:000289BE AMODE_GLUE:00000000 +00017C FECB_AREA:15A418B8[11] FECB: 15A418B8 +000000 CHAIN:15A41888 HANDLE:00056CF0 LDHANDLE:8005A000 +00000C COUNT:00000001 FLAGS:80000000 MODNMSZ:00000004 +000018 MODNAME:HELP AMODESTG:00056CF0 PTOKEN:15A3C0DC FECB: 15A41888 +000000 CHAIN:15A41858 HANDLE:00056CC8 LDHANDLE:00059E98 +00000C COUNT:00000001 FLAGS:80000000 MODNMSZ:00000006 +000018 MODNAME:DELETE AMODESTG:00056CC8 PTOKEN:15A3C0C0 FECB: 15A41858 +000000 CHAIN:00000000 HANDLE:00056CA0 LDHANDLE:00E73000
Chapter 3. Using Language Environment debugging facilities 143
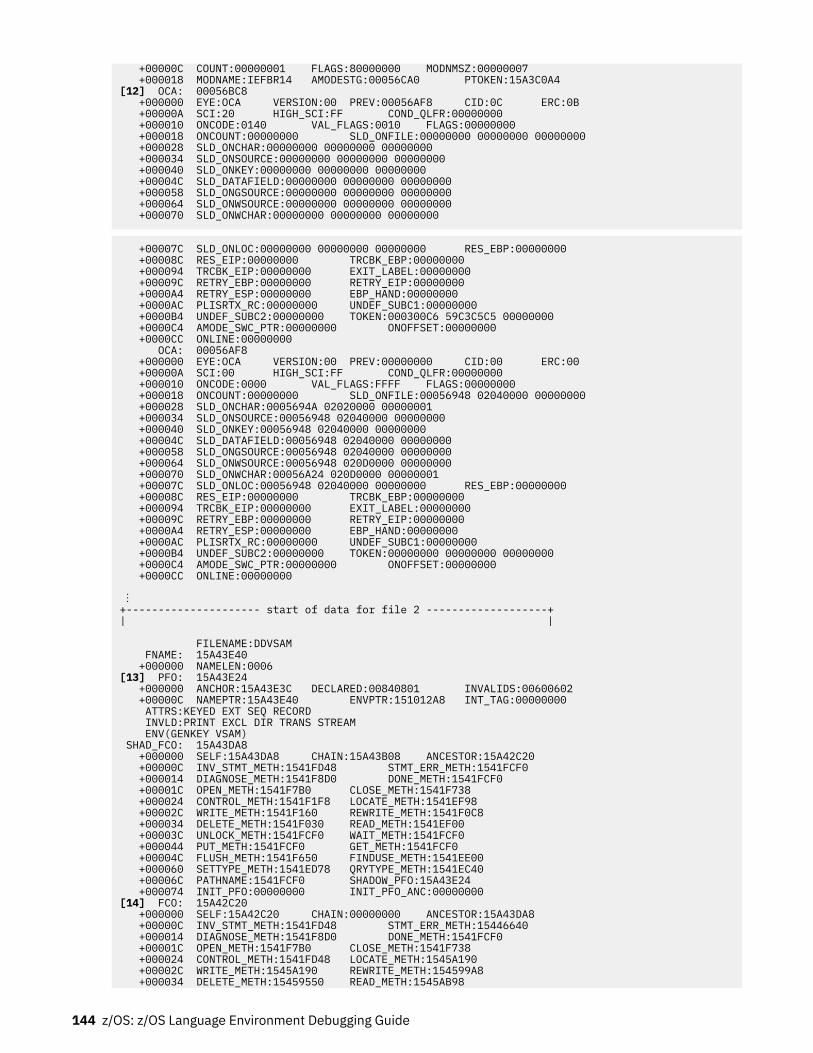
+00000C COUNT:00000001 FLAGS:80000000 MODNMSZ:00000007 +000018 MODNAME:IEFBR14 AMODESTG:00056CA0 PTOKEN:15A3C0A4[12] OCA: 00056BC8 +000000 EYE:OCA VERSION:00 PREV:00056AF8 CID:0C ERC:0B +00000A SCI:20 HIGH_SCI:FF COND_QLFR:00000000 +000010 ONCODE:0140 VAL_FLAGS:0010 FLAGS:00000000 +000018 ONCOUNT:00000000 SLD_ONFILE:00000000 00000000 00000000 +000028 SLD_ONCHAR:00000000 00000000 00000000 +000034 SLD_ONSOURCE:00000000 00000000 00000000 +000040 SLD_ONKEY:00000000 00000000 00000000 +00004C SLD_DATAFIELD:00000000 00000000 00000000 +000058 SLD_ONGSOURCE:00000000 00000000 00000000 +000064 SLD_ONWSOURCE:00000000 00000000 00000000 +000070 SLD_ONWCHAR:00000000 00000000 00000000
+00007C SLD_ONLOC:00000000 00000000 00000000 RES_EBP:00000000 +00008C RES_EIP:00000000 TRCBK_EBP:00000000 +000094 TRCBK_EIP:00000000 EXIT_LABEL:00000000 +00009C RETRY_EBP:00000000 RETRY_EIP:00000000 +0000A4 RETRY_ESP:00000000 EBP_HAND:00000000 +0000AC PLISRTX_RC:00000000 UNDEF_SUBC1:00000000 +0000B4 UNDEF_SUBC2:00000000 TOKEN:000300C6 59C3C5C5 00000000 +0000C4 AMODE_SWC_PTR:00000000 ONOFFSET:00000000 +0000CC ONLINE:00000000 OCA: 00056AF8 +000000 EYE:OCA VERSION:00 PREV:00000000 CID:00 ERC:00 +00000A SCI:00 HIGH_SCI:FF COND_QLFR:00000000 +000010 ONCODE:0000 VAL_FLAGS:FFFF FLAGS:00000000 +000018 ONCOUNT:00000000 SLD_ONFILE:00056948 02040000 00000000 +000028 SLD_ONCHAR:0005694A 02020000 00000001 +000034 SLD_ONSOURCE:00056948 02040000 00000000 +000040 SLD_ONKEY:00056948 02040000 00000000 +00004C SLD_DATAFIELD:00056948 02040000 00000000 +000058 SLD_ONGSOURCE:00056948 02040000 00000000 +000064 SLD_ONWSOURCE:00056948 020D0000 00000000 +000070 SLD_ONWCHAR:00056A24 020D0000 00000001 +00007C SLD_ONLOC:00056948 02040000 00000000 RES_EBP:00000000 +00008C RES_EIP:00000000 TRCBK_EBP:00000000 +000094 TRCBK_EIP:00000000 EXIT_LABEL:00000000 +00009C RETRY_EBP:00000000 RETRY_EIP:00000000 +0000A4 RETRY_ESP:00000000 EBP_HAND:00000000 +0000AC PLISRTX_RC:00000000 UNDEF_SUBC1:00000000 +0000B4 UNDEF_SUBC2:00000000 TOKEN:00000000 00000000 00000000 +0000C4 AMODE_SWC_PTR:00000000 ONOFFSET:00000000 +0000CC ONLINE:00000000
⋮+--------------------- start of data for file 2 -------------------+| | FILENAME:DDVSAM FNAME: 15A43E40 +000000 NAMELEN:0006[13] PFO: 15A43E24 +000000 ANCHOR:15A43E3C DECLARED:00840801 INVALIDS:00600602 +00000C NAMEPTR:15A43E40 ENVPTR:151012A8 INT_TAG:00000000 ATTRS:KEYED EXT SEQ RECORD INVLD:PRINT EXCL DIR TRANS STREAM ENV(GENKEY VSAM) SHAD_FCO: 15A43DA8 +000000 SELF:15A43DA8 CHAIN:15A43B08 ANCESTOR:15A42C20 +00000C INV_STMT_METH:1541FD48 STMT_ERR_METH:1541FCF0 +000014 DIAGNOSE_METH:1541F8D0 DONE_METH:1541FCF0 +00001C OPEN_METH:1541F7B0 CLOSE_METH:1541F738 +000024 CONTROL_METH:1541F1F8 LOCATE_METH:1541EF98 +00002C WRITE_METH:1541F160 REWRITE_METH:1541F0C8 +000034 DELETE_METH:1541F030 READ_METH:1541EF00 +00003C UNLOCK_METH:1541FCF0 WAIT_METH:1541FCF0 +000044 PUT_METH:1541FCF0 GET_METH:1541FCF0 +00004C FLUSH_METH:1541F650 FINDUSE_METH:1541EE00 +000060 SETTYPE_METH:1541ED78 QRYTYPE_METH:1541EC40 +00006C PATHNAME:1541FCF0 SHADOW_PFO:15A43E24 +000074 INIT_PFO:00000000 INIT_PFO_ANC:00000000[14] FCO: 15A42C20 +000000 SELF:15A42C20 CHAIN:00000000 ANCESTOR:15A43DA8 +00000C INV_STMT_METH:1541FD48 STMT_ERR_METH:15446640 +000014 DIAGNOSE_METH:1541F8D0 DONE_METH:1541FCF0 +00001C OPEN_METH:1541F7B0 CLOSE_METH:1541F738 +000024 CONTROL_METH:1541FD48 LOCATE_METH:1545A190 +00002C WRITE_METH:1545A190 REWRITE_METH:154599A8 +000034 DELETE_METH:15459550 READ_METH:1545AB98
144 z/OS: z/OS Language Environment Debugging Guide
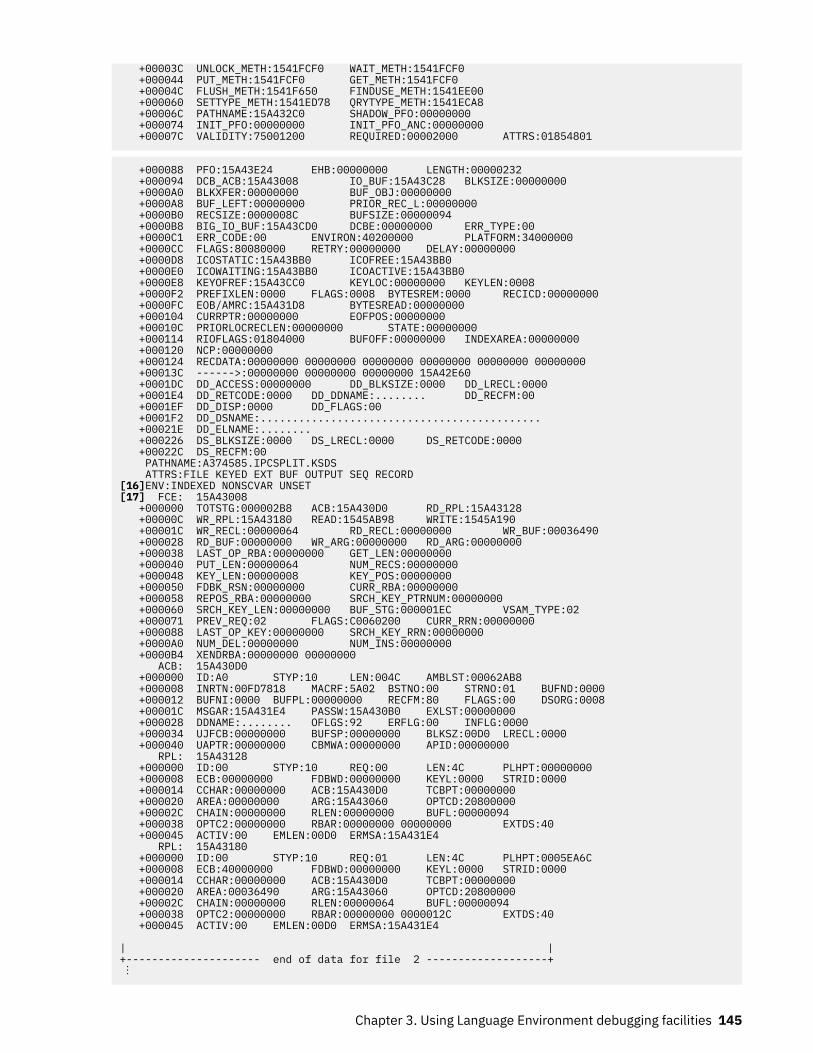
+00003C UNLOCK_METH:1541FCF0 WAIT_METH:1541FCF0 +000044 PUT_METH:1541FCF0 GET_METH:1541FCF0 +00004C FLUSH_METH:1541F650 FINDUSE_METH:1541EE00 +000060 SETTYPE_METH:1541ED78 QRYTYPE_METH:1541ECA8 +00006C PATHNAME:15A432C0 SHADOW_PFO:00000000 +000074 INIT_PFO:00000000 INIT_PFO_ANC:00000000 +00007C VALIDITY:75001200 REQUIRED:00002000 ATTRS:01854801
+000088 PFO:15A43E24 EHB:00000000 LENGTH:00000232 +000094 DCB_ACB:15A43008 IO_BUF:15A43C28 BLKSIZE:00000000 +0000A0 BLKXFER:00000000 BUF_OBJ:00000000 +0000A8 BUF_LEFT:00000000 PRIOR_REC_L:00000000 +0000B0 RECSIZE:0000008C BUFSIZE:00000094 +0000B8 BIG_IO_BUF:15A43CD0 DCBE:00000000 ERR_TYPE:00 +0000C1 ERR_CODE:00 ENVIRON:40200000 PLATFORM:34000000 +0000CC FLAGS:80080000 RETRY:00000000 DELAY:00000000 +0000D8 ICOSTATIC:15A43BB0 ICOFREE:15A43BB0 +0000E0 ICOWAITING:15A43BB0 ICOACTIVE:15A43BB0 +0000E8 KEYOFREF:15A43CC0 KEYLOC:00000000 KEYLEN:0008 +0000F2 PREFIXLEN:0000 FLAGS:0008 BYTESREM:0000 RECICD:00000000 +0000FC EOB/AMRC:15A431D8 BYTESREAD:00000000 +000104 CURRPTR:00000000 EOFPOS:00000000 +00010C PRIORLOCRECLEN:00000000 STATE:00000000 +000114 RIOFLAGS:01804000 BUFOFF:00000000 INDEXAREA:00000000 +000120 NCP:00000000 +000124 RECDATA:00000000 00000000 00000000 00000000 00000000 00000000 +00013C ------>:00000000 00000000 00000000 15A42E60 +0001DC DD_ACCESS:00000000 DD_BLKSIZE:0000 DD_LRECL:0000 +0001E4 DD_RETCODE:0000 DD_DDNAME:........ DD_RECFM:00 +0001EF DD_DISP:0000 DD_FLAGS:00 +0001F2 DD_DSNAME:............................................ +00021E DD_ELNAME:........ +000226 DS_BLKSIZE:0000 DS_LRECL:0000 DS_RETCODE:0000 +00022C DS_RECFM:00 PATHNAME:A374585.IPCSPLIT.KSDS ATTRS:FILE KEYED EXT BUF OUTPUT SEQ RECORD[16]ENV:INDEXED NONSCVAR UNSET[17] FCE: 15A43008 +000000 TOTSTG:000002B8 ACB:15A430D0 RD_RPL:15A43128 +00000C WR_RPL:15A43180 READ:1545AB98 WRITE:1545A190 +00001C WR_RECL:00000064 RD_RECL:00000000 WR_BUF:00036490 +000028 RD_BUF:00000000 WR_ARG:00000000 RD_ARG:00000000 +000038 LAST_OP_RBA:00000000 GET_LEN:00000000 +000040 PUT_LEN:00000064 NUM_RECS:00000000 +000048 KEY_LEN:00000008 KEY_POS:00000000 +000050 FDBK_RSN:00000000 CURR_RBA:00000000 +000058 REPOS_RBA:00000000 SRCH_KEY_PTRNUM:00000000 +000060 SRCH_KEY_LEN:00000000 BUF_STG:000001EC VSAM_TYPE:02 +000071 PREV_REQ:02 FLAGS:C0060200 CURR_RRN:00000000 +000088 LAST_OP_KEY:00000000 SRCH_KEY_RRN:00000000 +0000A0 NUM_DEL:00000000 NUM_INS:00000000 +0000B4 XENDRBA:00000000 00000000 ACB: 15A430D0 +000000 ID:A0 STYP:10 LEN:004C AMBLST:00062AB8 +000008 INRTN:00FD7818 MACRF:5A02 BSTNO:00 STRNO:01 BUFND:0000 +000012 BUFNI:0000 BUFPL:00000000 RECFM:80 FLAGS:00 DSORG:0008 +00001C MSGAR:15A431E4 PASSW:15A430B0 EXLST:00000000 +000028 DDNAME:........ OFLGS:92 ERFLG:00 INFLG:0000 +000034 UJFCB:00000000 BUFSP:00000000 BLKSZ:00D0 LRECL:0000 +000040 UAPTR:00000000 CBMWA:00000000 APID:00000000 RPL: 15A43128 +000000 ID:00 STYP:10 REQ:00 LEN:4C PLHPT:00000000 +000008 ECB:00000000 FDBWD:00000000 KEYL:0000 STRID:0000 +000014 CCHAR:00000000 ACB:15A430D0 TCBPT:00000000 +000020 AREA:00000000 ARG:15A43060 OPTCD:20800000 +00002C CHAIN:00000000 RLEN:00000000 BUFL:00000094 +000038 OPTC2:00000000 RBAR:00000000 00000000 EXTDS:40 +000045 ACTIV:00 EMLEN:00D0 ERMSA:15A431E4 RPL: 15A43180 +000000 ID:00 STYP:10 REQ:01 LEN:4C PLHPT:0005EA6C +000008 ECB:40000000 FDBWD:00000000 KEYL:0000 STRID:0000 +000014 CCHAR:00000000 ACB:15A430D0 TCBPT:00000000 +000020 AREA:00036490 ARG:15A43060 OPTCD:20800000 +00002C CHAIN:00000000 RLEN:00000064 BUFL:00000094 +000038 OPTC2:00000000 RBAR:00000000 0000012C EXTDS:40 +000045 ACTIV:00 EMLEN:00D0 ERMSA:15A431E4
| |+--------------------- end of data for file 2 -------------------+ ⋮
Chapter 3. Using Language Environment debugging facilities 145
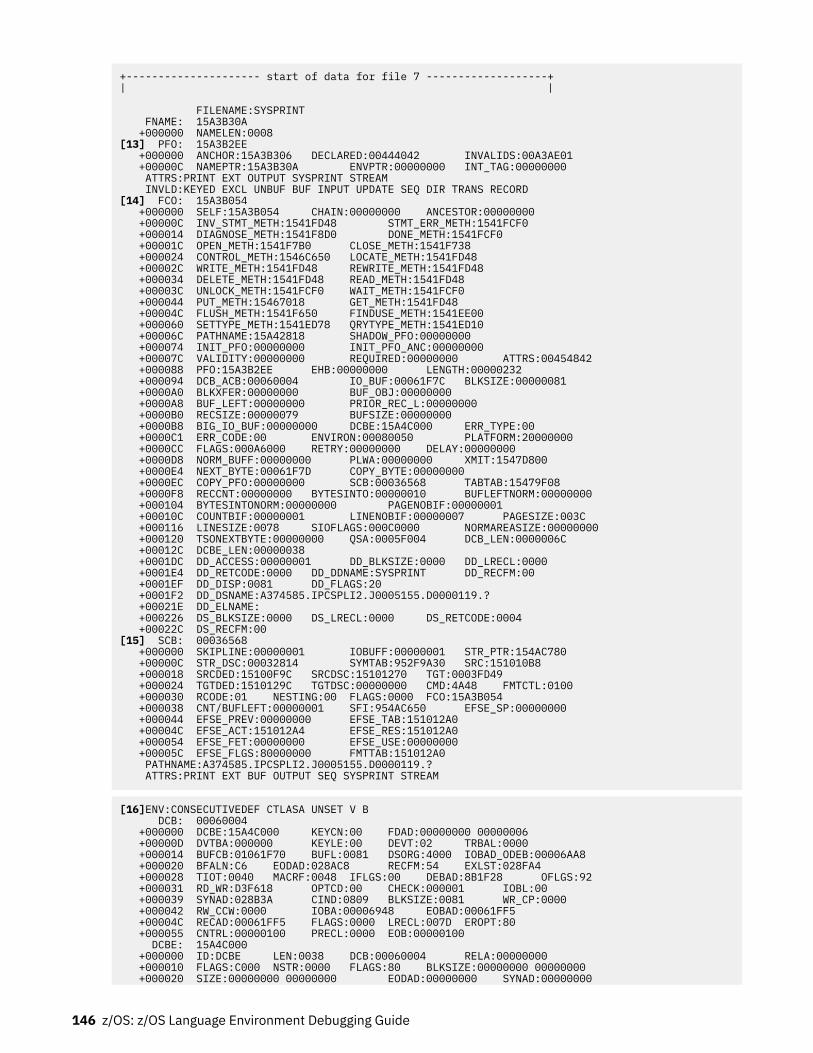
+--------------------- start of data for file 7 -------------------+| | FILENAME:SYSPRINT FNAME: 15A3B30A +000000 NAMELEN:0008[13] PFO: 15A3B2EE +000000 ANCHOR:15A3B306 DECLARED:00444042 INVALIDS:00A3AE01 +00000C NAMEPTR:15A3B30A ENVPTR:00000000 INT_TAG:00000000 ATTRS:PRINT EXT OUTPUT SYSPRINT STREAM INVLD:KEYED EXCL UNBUF BUF INPUT UPDATE SEQ DIR TRANS RECORD[14] FCO: 15A3B054 +000000 SELF:15A3B054 CHAIN:00000000 ANCESTOR:00000000 +00000C INV_STMT_METH:1541FD48 STMT_ERR_METH:1541FCF0 +000014 DIAGNOSE_METH:1541F8D0 DONE_METH:1541FCF0 +00001C OPEN_METH:1541F7B0 CLOSE_METH:1541F738 +000024 CONTROL_METH:1546C650 LOCATE_METH:1541FD48 +00002C WRITE_METH:1541FD48 REWRITE_METH:1541FD48 +000034 DELETE_METH:1541FD48 READ_METH:1541FD48 +00003C UNLOCK_METH:1541FCF0 WAIT_METH:1541FCF0 +000044 PUT_METH:15467018 GET_METH:1541FD48 +00004C FLUSH_METH:1541F650 FINDUSE_METH:1541EE00 +000060 SETTYPE_METH:1541ED78 QRYTYPE_METH:1541ED10 +00006C PATHNAME:15A42818 SHADOW_PFO:00000000 +000074 INIT_PFO:00000000 INIT_PFO_ANC:00000000 +00007C VALIDITY:00000000 REQUIRED:00000000 ATTRS:00454842 +000088 PFO:15A3B2EE EHB:00000000 LENGTH:00000232 +000094 DCB_ACB:00060004 IO_BUF:00061F7C BLKSIZE:00000081 +0000A0 BLKXFER:00000000 BUF_OBJ:00000000 +0000A8 BUF_LEFT:00000000 PRIOR_REC_L:00000000 +0000B0 RECSIZE:00000079 BUFSIZE:00000000 +0000B8 BIG_IO_BUF:00000000 DCBE:15A4C000 ERR_TYPE:00 +0000C1 ERR_CODE:00 ENVIRON:00080050 PLATFORM:20000000 +0000CC FLAGS:000A6000 RETRY:00000000 DELAY:00000000 +0000D8 NORM_BUFF:00000000 PLWA:00000000 XMIT:1547D800 +0000E4 NEXT_BYTE:00061F7D COPY_BYTE:00000000 +0000EC COPY_PFO:00000000 SCB:00036568 TABTAB:15479F08 +0000F8 RECCNT:00000000 BYTESINTO:00000010 BUFLEFTNORM:00000000 +000104 BYTESINTONORM:00000000 PAGENOBIF:00000001 +00010C COUNTBIF:00000001 LINENOBIF:00000007 PAGESIZE:003C +000116 LINESIZE:0078 SIOFLAGS:000C0000 NORMAREASIZE:00000000 +000120 TSONEXTBYTE:00000000 QSA:0005F004 DCB_LEN:0000006C +00012C DCBE_LEN:00000038 +0001DC DD_ACCESS:00000001 DD_BLKSIZE:0000 DD_LRECL:0000 +0001E4 DD_RETCODE:0000 DD_DDNAME:SYSPRINT DD_RECFM:00 +0001EF DD_DISP:0081 DD_FLAGS:20 +0001F2 DD_DSNAME:A374585.IPCSPLI2.J0005155.D0000119.? +00021E DD_ELNAME: +000226 DS_BLKSIZE:0000 DS_LRECL:0000 DS_RETCODE:0004 +00022C DS_RECFM:00[15] SCB: 00036568 +000000 SKIPLINE:00000001 IOBUFF:00000001 STR_PTR:154AC780 +00000C STR_DSC:00032814 SYMTAB:952F9A30 SRC:151010B8 +000018 SRCDED:15100F9C SRCDSC:15101270 TGT:0003FD49 +000024 TGTDED:1510129C TGTDSC:00000000 CMD:4A48 FMTCTL:0100 +000030 RCODE:01 NESTING:00 FLAGS:0000 FCO:15A3B054 +000038 CNT/BUFLEFT:00000001 SFI:954AC650 EFSE_SP:00000000 +000044 EFSE_PREV:00000000 EFSE_TAB:151012A0 +00004C EFSE_ACT:151012A4 EFSE_RES:151012A0 +000054 EFSE_FET:00000000 EFSE_USE:00000000 +00005C EFSE_FLGS:80000000 FMTTAB:151012A0 PATHNAME:A374585.IPCSPLI2.J0005155.D0000119.? ATTRS:PRINT EXT BUF OUTPUT SEQ SYSPRINT STREAM
[16]ENV:CONSECUTIVEDEF CTLASA UNSET V B DCB: 00060004 +000000 DCBE:15A4C000 KEYCN:00 FDAD:00000000 00000006 +00000D DVTBA:000000 KEYLE:00 DEVT:02 TRBAL:0000 +000014 BUFCB:01061F70 BUFL:0081 DSORG:4000 IOBAD_ODEB:00006AA8 +000020 BFALN:C6 EODAD:028AC8 RECFM:54 EXLST:028FA4 +000028 TIOT:0040 MACRF:0048 IFLGS:00 DEBAD:8B1F28 OFLGS:92 +000031 RD_WR:D3F618 OPTCD:00 CHECK:000001 IOBL:00 +000039 SYNAD:028B3A CIND:0809 BLKSIZE:0081 WR_CP:0000 +000042 RW_CCW:0000 IOBA:00006948 EOBAD:00061FF5 +00004C RECAD:00061FF5 FLAGS:0000 LRECL:007D EROPT:80 +000055 CNTRL:00000100 PRECL:0000 EOB:00000100 DCBE: 15A4C000 +000000 ID:DCBE LEN:0038 DCB:00060004 RELA:00000000 +000010 FLAGS:C000 NSTR:0000 FLAGS:80 BLKSIZE:00000000 00000000 +000020 SIZE:00000000 00000000 EODAD:00000000 SYNAD:00000000
146 z/OS: z/OS Language Environment Debugging Guide
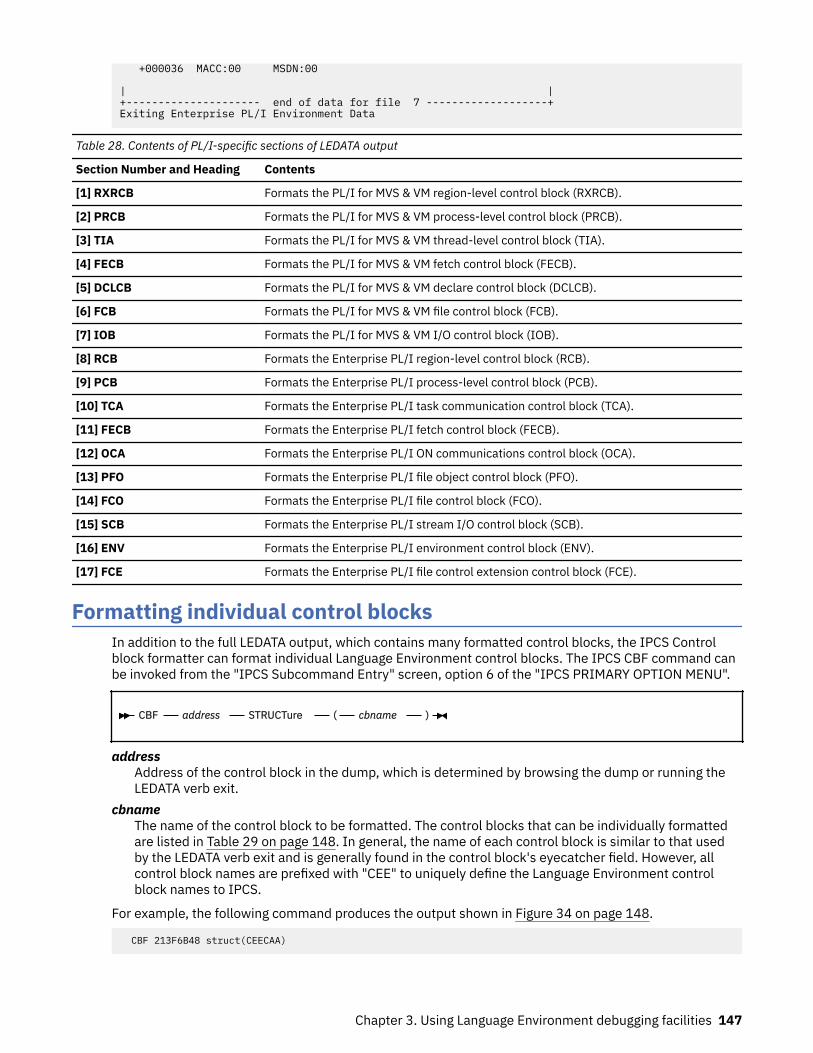
+000036 MACC:00 MSDN:00 | |+--------------------- end of data for file 7 -------------------+Exiting Enterprise PL/I Environment Data
Table 28. Contents of PL/I-specific sections of LEDATA output
Section Number and Heading Contents
[1] RXRCB Formats the PL/I for MVS & VM region-level control block (RXRCB).
[2] PRCB Formats the PL/I for MVS & VM process-level control block (PRCB).
[3] TIA Formats the PL/I for MVS & VM thread-level control block (TIA).
[4] FECB Formats the PL/I for MVS & VM fetch control block (FECB).
[5] DCLCB Formats the PL/I for MVS & VM declare control block (DCLCB).
[6] FCB Formats the PL/I for MVS & VM file control block (FCB).
[7] IOB Formats the PL/I for MVS & VM I/O control block (IOB).
[8] RCB Formats the Enterprise PL/I region-level control block (RCB).
[9] PCB Formats the Enterprise PL/I process-level control block (PCB).
[10] TCA Formats the Enterprise PL/I task communication control block (TCA).
[11] FECB Formats the Enterprise PL/I fetch control block (FECB).
[12] OCA Formats the Enterprise PL/I ON communications control block (OCA).
[13] PFO Formats the Enterprise PL/I file object control block (PFO).
[14] FCO Formats the Enterprise PL/I file control block (FCO).
[15] SCB Formats the Enterprise PL/I stream I/O control block (SCB).
[16] ENV Formats the Enterprise PL/I environment control block (ENV).
[17] FCE Formats the Enterprise PL/I file control extension control block (FCE).
Formatting individual control blocksIn addition to the full LEDATA output, which contains many formatted control blocks, the IPCS Controlblock formatter can format individual Language Environment control blocks. The IPCS CBF command canbe invoked from the "IPCS Subcommand Entry" screen, option 6 of the "IPCS PRIMARY OPTION MENU".
CBF address STRUCTure ( cbname )
addressAddress of the control block in the dump, which is determined by browsing the dump or running theLEDATA verb exit.
cbnameThe name of the control block to be formatted. The control blocks that can be individually formattedare listed in Table 29 on page 148. In general, the name of each control block is similar to that usedby the LEDATA verb exit and is generally found in the control block's eyecatcher field. However, allcontrol block names are prefixed with "CEE" to uniquely define the Language Environment controlblock names to IPCS.
For example, the following command produces the output shown in Figure 34 on page 148.
CBF 213F6B48 struct(CEECAA)
Chapter 3. Using Language Environment debugging facilities 147
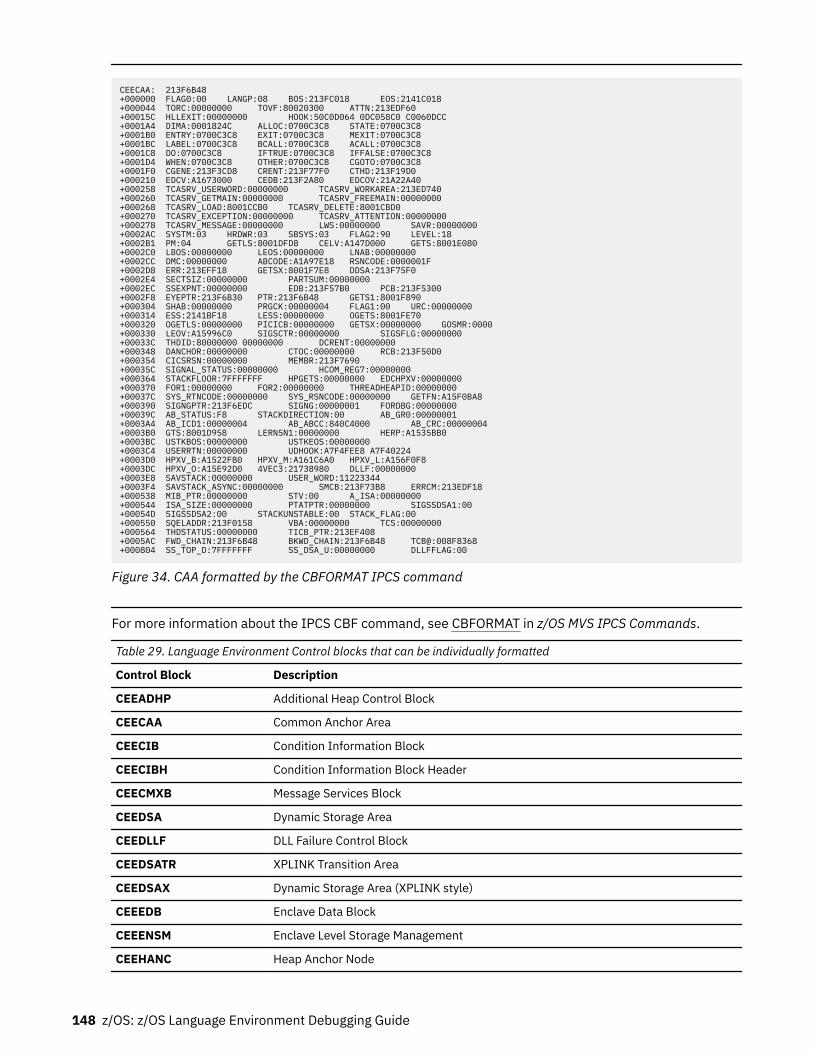
CEECAA: 213F6B48 +000000 FLAG0:00 LANGP:08 BOS:213FC018 EOS:2141C018 +000044 TORC:00000000 TOVF:80020300 ATTN:213EDF60 +00015C HLLEXIT:00000000 HOOK:50C0D064 0DC058C0 C0060DCC +0001A4 DIMA:0001824C ALLOC:0700C3C8 STATE:0700C3C8 +0001B0 ENTRY:0700C3C8 EXIT:0700C3C8 MEXIT:0700C3C8 +0001BC LABEL:0700C3C8 BCALL:0700C3C8 ACALL:0700C3C8 +0001C8 DO:0700C3C8 IFTRUE:0700C3C8 IFFALSE:0700C3C8 +0001D4 WHEN:0700C3C8 OTHER:0700C3C8 CGOTO:0700C3C8 +0001F0 CGENE:213F3CD8 CRENT:213F77F0 CTHD:213F19D0 +000210 EDCV:A1673000 CEDB:213F2A80 EDCOV:21A22A40 +000258 TCASRV_USERWORD:00000000 TCASRV_WORKAREA:213ED740 +000260 TCASRV_GETMAIN:00000000 TCASRV_FREEMAIN:00000000 +000268 TCASRV_LOAD:8001CCB0 TCASRV_DELETE:8001CBD0 +000270 TCASRV_EXCEPTION:00000000 TCASRV_ATTENTION:00000000 +000278 TCASRV_MESSAGE:00000000 LWS:00000000 SAVR:00000000 +0002AC SYSTM:03 HRDWR:03 SBSYS:03 FLAG2:90 LEVEL:18 +0002B1 PM:04 GETLS:8001DFD8 CELV:A147D000 GETS:8001E080 +0002C0 LBOS:00000000 LEOS:00000000 LNAB:00000000 +0002CC DMC:00000000 ABCODE:A1A97E18 RSNCODE:0000001F +0002D8 ERR:213EFF18 GETSX:8001F7E8 DDSA:213F75F0 +0002E4 SECTSIZ:00000000 PARTSUM:00000000 +0002EC SSEXPNT:00000000 EDB:213F57B0 PCB:213F5300 +0002F8 EYEPTR:213F6B30 PTR:213F6B48 GETS1:8001F890 +000304 SHAB:00000000 PRGCK:00000004 FLAG1:00 URC:00000000 +000314 ESS:2141BF18 LESS:00000000 OGETS:8001FE70 +000320 OGETLS:00000000 PICICB:00000000 GETSX:00000000 GOSMR:0000 +000330 LEOV:A15996C0 SIGSCTR:00000000 SIGSFLG:00000000 +00033C THDID:80000000 00000000 DCRENT:00000000 +000348 DANCHOR:00000000 CTOC:00000000 RCB:213F50D0 +000354 CICSRSN:00000000 MEMBR:213F7690 +00035C SIGNAL_STATUS:00000000 HCOM_REG7:00000000 +000364 STACKFLOOR:7FFFFFFF HPGETS:00000000 EDCHPXV:00000000 +000370 FOR1:00000000 FOR2:00000000 THREADHEAPID:00000000 +00037C SYS_RTNCODE:00000000 SYS_RSNCODE:00000000 GETFN:A15F0BA8 +000390 SIGNGPTR:213F6EDC SIGNG:00000001 FORDBG:00000000 +00039C AB_STATUS:F8 STACKDIRECTION:00 AB_GR0:00000001 +0003A4 AB_ICD1:00000004 AB_ABCC:840C4000 AB_CRC:00000004 +0003B0 GTS:8001D958 LERN5N1:00000000 HERP:A1535BB0 +0003BC USTKBOS:00000000 USTKEOS:00000000 +0003C4 USERRTN:00000000 UDHOOK:A7F4FEE8 A7F40224 +0003D0 HPXV_B:A1522FB0 HPXV_M:A161C6A0 HPXV_L:A156F0F8 +0003DC HPXV_O:A15E92D0 4VEC3:21738980 DLLF:00000000 +0003E8 SAVSTACK:00000000 USER_WORD:11223344 +0003F4 SAVSTACK_ASYNC:00000000 SMCB:213F73B8 ERRCM:213EDF18+000538 MIB_PTR:00000000 STV:00 A_ISA:00000000 +000544 ISA_SIZE:00000000 PTATPTR:00000000 SIGSSDSA1:00 +00054D SIGSSDSA2:00 STACKUNSTABLE:00 STACK_FLAG:00 +000550 SQELADDR:213F0158 VBA:00000000 TCS:00000000 +000564 THDSTATUS:00000000 TICB_PTR:213EF408 +0005AC FWD_CHAIN:213F6B48 BKWD_CHAIN:213F6B48 TCB@:008F8368 +000804 SS_TOP_D:7FFFFFFF SS_DSA_U:00000000 DLLFFLAG:00
Figure 34. CAA formatted by the CBFORMAT IPCS command
For more information about the IPCS CBF command, see CBFORMAT in z/OS MVS IPCS Commands.
Table 29. Language Environment Control blocks that can be individually formatted
Control Block Description
CEEADHP Additional Heap Control Block
CEECAA Common Anchor Area
CEECIB Condition Information Block
CEECIBH Condition Information Block Header
CEECMXB Message Services Block
CEEDSA Dynamic Storage Area
CEEDLLF DLL Failure Control Block
CEEDSATR XPLINK Transition Area
CEEDSAX Dynamic Storage Area (XPLINK style)
CEEEDB Enclave Data Block
CEEENSM Enclave Level Storage Management
CEEHANC Heap Anchor Node
148 z/OS: z/OS Language Environment Debugging Guide
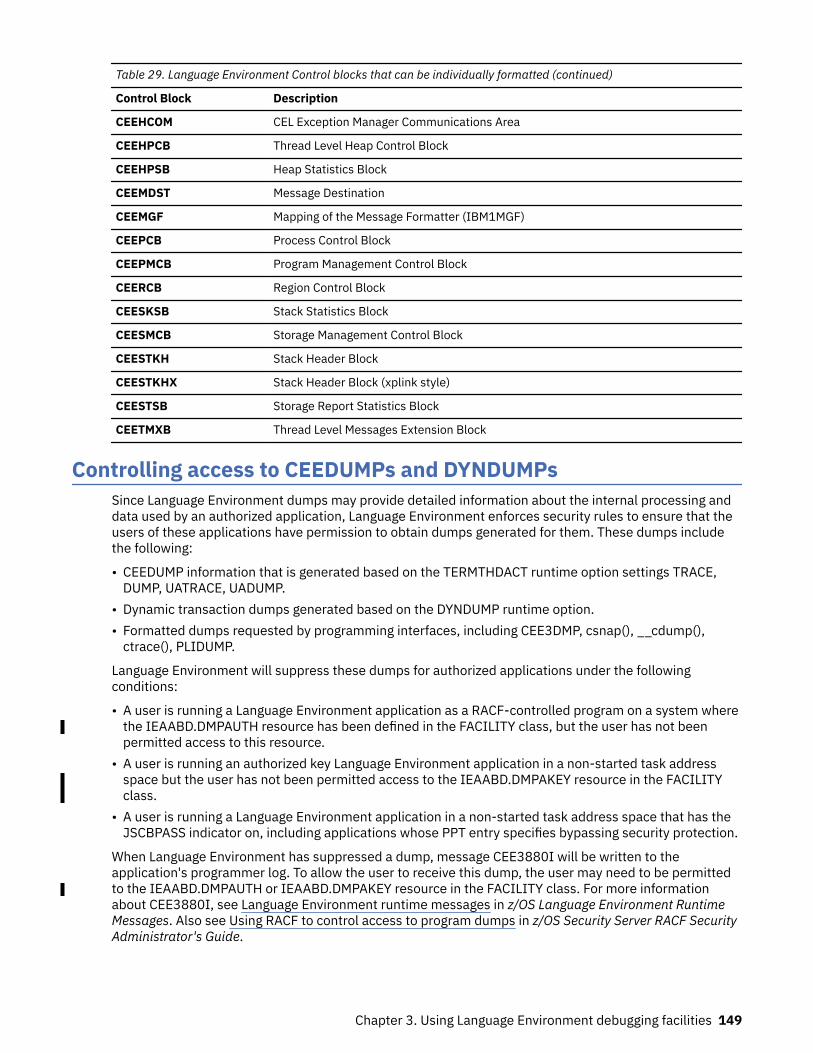
Table 29. Language Environment Control blocks that can be individually formatted (continued)
Control Block Description
CEEHCOM CEL Exception Manager Communications Area
CEEHPCB Thread Level Heap Control Block
CEEHPSB Heap Statistics Block
CEEMDST Message Destination
CEEMGF Mapping of the Message Formatter (IBM1MGF)
CEEPCB Process Control Block
CEEPMCB Program Management Control Block
CEERCB Region Control Block
CEESKSB Stack Statistics Block
CEESMCB Storage Management Control Block
CEESTKH Stack Header Block
CEESTKHX Stack Header Block (xplink style)
CEESTSB Storage Report Statistics Block
CEETMXB Thread Level Messages Extension Block
Controlling access to CEEDUMPs and DYNDUMPsSince Language Environment dumps may provide detailed information about the internal processing anddata used by an authorized application, Language Environment enforces security rules to ensure that theusers of these applications have permission to obtain dumps generated for them. These dumps includethe following:
• CEEDUMP information that is generated based on the TERMTHDACT runtime option settings TRACE,DUMP, UATRACE, UADUMP.
• Dynamic transaction dumps generated based on the DYNDUMP runtime option.• Formatted dumps requested by programming interfaces, including CEE3DMP, csnap(), __cdump(),
ctrace(), PLIDUMP.
Language Environment will suppress these dumps for authorized applications under the followingconditions:
• A user is running a Language Environment application as a RACF-controlled program on a system wherethe IEAABD.DMPAUTH resource has been defined in the FACILITY class, but the user has not beenpermitted access to this resource.
• A user is running an authorized key Language Environment application in a non-started task addressspace but the user has not been permitted access to the IEAABD.DMPAKEY resource in the FACILITYclass.
• A user is running a Language Environment application in a non-started task address space that has theJSCBPASS indicator on, including applications whose PPT entry specifies bypassing security protection.
When Language Environment has suppressed a dump, message CEE3880I will be written to theapplication's programmer log. To allow the user to receive this dump, the user may need to be permittedto the IEAABD.DMPAUTH or IEAABD.DMPAKEY resource in the FACILITY class. For more informationabout CEE3880I, see Language Environment runtime messages in z/OS Language Environment RuntimeMessages. Also see Using RACF to control access to program dumps in z/OS Security Server RACF SecurityAdministrator's Guide.
Chapter 3. Using Language Environment debugging facilities 149
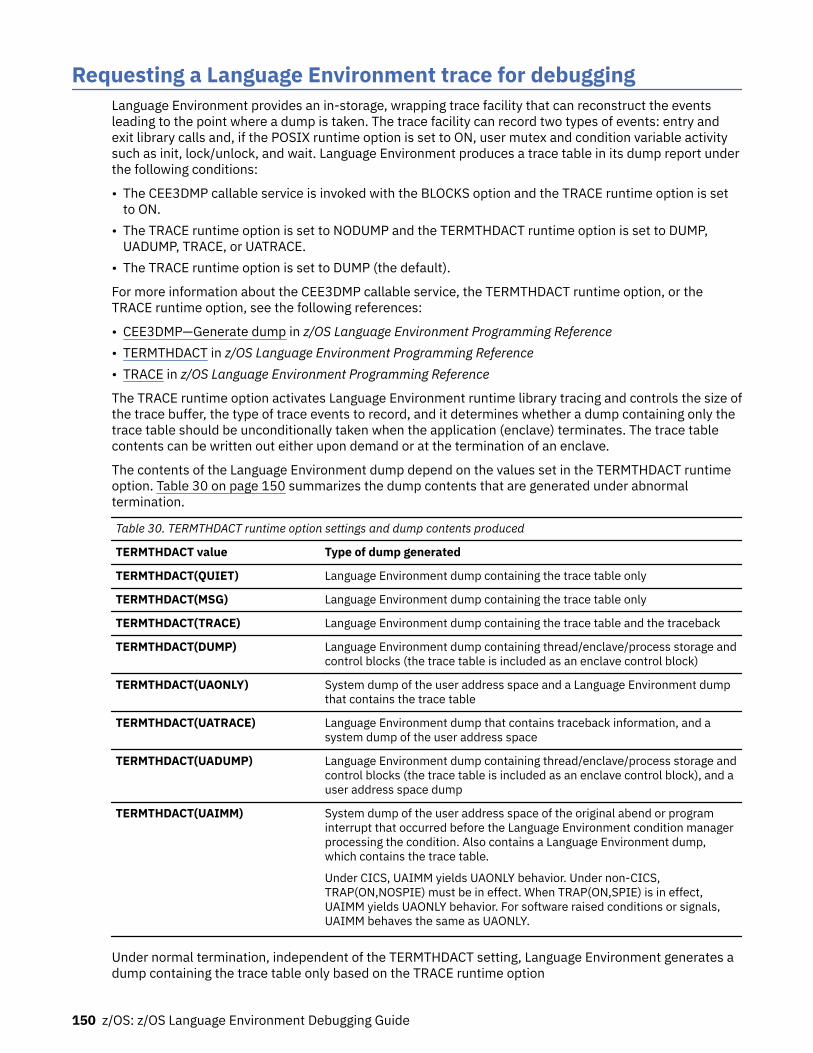
Requesting a Language Environment trace for debuggingLanguage Environment provides an in-storage, wrapping trace facility that can reconstruct the eventsleading to the point where a dump is taken. The trace facility can record two types of events: entry andexit library calls and, if the POSIX runtime option is set to ON, user mutex and condition variable activitysuch as init, lock/unlock, and wait. Language Environment produces a trace table in its dump report underthe following conditions:
• The CEE3DMP callable service is invoked with the BLOCKS option and the TRACE runtime option is setto ON.
• The TRACE runtime option is set to NODUMP and the TERMTHDACT runtime option is set to DUMP,UADUMP, TRACE, or UATRACE.
• The TRACE runtime option is set to DUMP (the default).
For more information about the CEE3DMP callable service, the TERMTHDACT runtime option, or theTRACE runtime option, see the following references:
• CEE3DMP—Generate dump in z/OS Language Environment Programming Reference• TERMTHDACT in z/OS Language Environment Programming Reference• TRACE in z/OS Language Environment Programming Reference
The TRACE runtime option activates Language Environment runtime library tracing and controls the size ofthe trace buffer, the type of trace events to record, and it determines whether a dump containing only thetrace table should be unconditionally taken when the application (enclave) terminates. The trace tablecontents can be written out either upon demand or at the termination of an enclave.
The contents of the Language Environment dump depend on the values set in the TERMTHDACT runtimeoption. Table 30 on page 150 summarizes the dump contents that are generated under abnormaltermination.
Table 30. TERMTHDACT runtime option settings and dump contents produced
TERMTHDACT value Type of dump generated
TERMTHDACT(QUIET) Language Environment dump containing the trace table only
TERMTHDACT(MSG) Language Environment dump containing the trace table only
TERMTHDACT(TRACE) Language Environment dump containing the trace table and the traceback
TERMTHDACT(DUMP) Language Environment dump containing thread/enclave/process storage andcontrol blocks (the trace table is included as an enclave control block)
TERMTHDACT(UAONLY) System dump of the user address space and a Language Environment dumpthat contains the trace table
TERMTHDACT(UATRACE) Language Environment dump that contains traceback information, and asystem dump of the user address space
TERMTHDACT(UADUMP) Language Environment dump containing thread/enclave/process storage andcontrol blocks (the trace table is included as an enclave control block), and auser address space dump
TERMTHDACT(UAIMM) System dump of the user address space of the original abend or programinterrupt that occurred before the Language Environment condition managerprocessing the condition. Also contains a Language Environment dump,which contains the trace table.
Under CICS, UAIMM yields UAONLY behavior. Under non-CICS,TRAP(ON,NOSPIE) must be in effect. When TRAP(ON,SPIE) is in effect,UAIMM yields UAONLY behavior. For software raised conditions or signals,UAIMM behaves the same as UAONLY.
Under normal termination, independent of the TERMTHDACT setting, Language Environment generates adump containing the trace table only based on the TRACE runtime option
150 z/OS: z/OS Language Environment Debugging Guide
Language Environment quiesces all threads that are currently running except for the thread that issuedthe call to CEE3DMP. When you call CEE3DMP in a multithread environment, only the current thread isdumped. Enclave- and process-related storage could have changed from the time the dump request wasissued.
Locating the trace dumpIf your application calls CEE3DMP, the Language Environment dump is written to the file specified in theFNAME parameter of CEE3DMP (the default is CEEDUMP).
If your application is running under TSO or batch, and a CEEDUMP DD is not specified, LanguageEnvironment writes the CEEDUMP to the batch log (SYSOUT=* by default). You can change the SYSOUTclass by specifying a CEEDUMP DD, or by setting the environment variable, _CEE_DMPTARG=SYSOUT(x),where x is the preferred SYSOUT class.
If your application is running under z/OS UNIX and is either running in an address space you issued afork() to, or if it is invoked by one of the exec family of functions, the dump is written to z/OS UNIX filesystem. Language Environment writes the CEEDUMP to one of the following directories in the specifiedorder:
1. The directory found in environment variable _CEE_DMPTARG, if found.2. The current working directory, if the directory is not the root directory (/), the directory is writable, and
the CEEDUMP path name does not exceed 1024 characters.3. The directory found in environment variable TMPDIR (an environment variable that indicates the
location of a temporary directory if it is not /tmp).4. The /tmp directory.
The name of this file changes with each dump and uses the following format:
/path/Fname.Date.Time.Pid
pathPath determined from the preceding algorithm.
FnameName specified in the FNAME parameter on the call to CEE3DMP (default is CEEDUMP).
DateDate the dump is taken, appearing in the format YYYYMMDD (such as 20090307 for March 7, 2009).
TimeTime the dump is taken, appearing in the format HHMMSS (such as 175501 for 05:55:01 p.m.).
PidProcess ID the application is running in when the dump is taken.
Using the Language Environment trace table format in a dump reportThe Language Environment trace table is established unconditionally at enclave initialization time if theTRACE runtime option is set to ON. All threads in the enclave share the trace table; there is no thread-specific table, nor can the table be dynamically extended or enlarged.
Understanding the trace table entry (TTE)Each trace table entry is a fixed-length record consisting of a fixed-format portion (containing such itemsas the timestamp, thread ID, and member ID) and a member-specific portion. The member-specificportion has a fixed length, of which some (or all) can be unused. For information about how participatingproducts use the trace table entry, see the product-specific documentation. The format of the trace tableentry is as follows:
Chapter 3. Using Language Environment debugging facilities 151
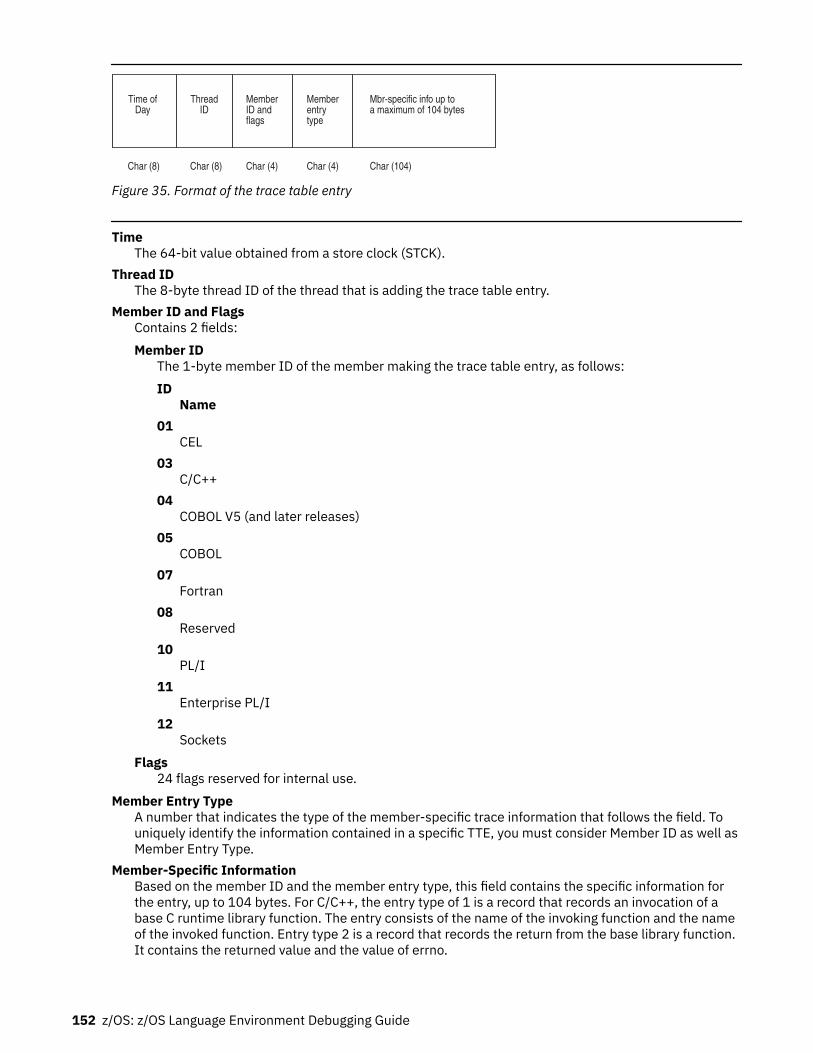
Char (104)Char (4)Char (4)Char (8)Char (8)
Mbr-specific info up toa maximum of 104 bytes
Memberentrytype
MemberID andflags
ThreadID
Time ofDay
Figure 35. Format of the trace table entry
TimeThe 64-bit value obtained from a store clock (STCK).
Thread IDThe 8-byte thread ID of the thread that is adding the trace table entry.
Member ID and FlagsContains 2 fields:Member ID
The 1-byte member ID of the member making the trace table entry, as follows:ID
Name01
CEL03
C/C++04
COBOL V5 (and later releases)05
COBOL07
Fortran08
Reserved10
PL/I11
Enterprise PL/I12
SocketsFlags
24 flags reserved for internal use.Member Entry Type
A number that indicates the type of the member-specific trace information that follows the field. Touniquely identify the information contained in a specific TTE, you must consider Member ID as well asMember Entry Type.
Member-Specific InformationBased on the member ID and the member entry type, this field contains the specific information forthe entry, up to 104 bytes. For C/C++, the entry type of 1 is a record that records an invocation of abase C runtime library function. The entry consists of the name of the invoking function and the nameof the invoked function. Entry type 2 is a record that records the return from the base library function.It contains the returned value and the value of errno.
152 z/OS: z/OS Language Environment Debugging Guide
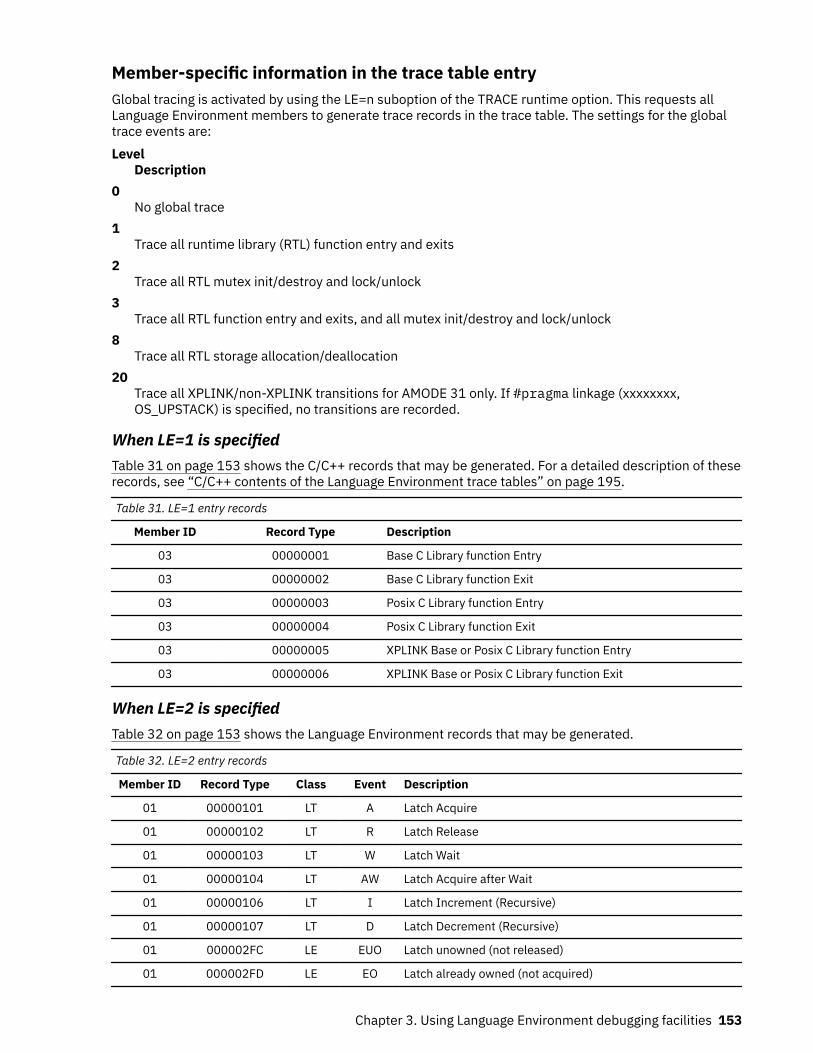
Member-specific information in the trace table entryGlobal tracing is activated by using the LE=n suboption of the TRACE runtime option. This requests allLanguage Environment members to generate trace records in the trace table. The settings for the globaltrace events are:Level
Description0
No global trace1
Trace all runtime library (RTL) function entry and exits2
Trace all RTL mutex init/destroy and lock/unlock3
Trace all RTL function entry and exits, and all mutex init/destroy and lock/unlock8
Trace all RTL storage allocation/deallocation20
Trace all XPLINK/non-XPLINK transitions for AMODE 31 only. If #pragma linkage (xxxxxxxx,OS_UPSTACK) is specified, no transitions are recorded.
When LE=1 is specifiedTable 31 on page 153 shows the C/C++ records that may be generated. For a detailed description of theserecords, see “C/C++ contents of the Language Environment trace tables” on page 195.
Table 31. LE=1 entry records
Member ID Record Type Description
03 00000001 Base C Library function Entry
03 00000002 Base C Library function Exit
03 00000003 Posix C Library function Entry
03 00000004 Posix C Library function Exit
03 00000005 XPLINK Base or Posix C Library function Entry
03 00000006 XPLINK Base or Posix C Library function Exit
When LE=2 is specifiedTable 32 on page 153 shows the Language Environment records that may be generated.
Table 32. LE=2 entry records
Member ID Record Type Class Event Description
01 00000101 LT A Latch Acquire
01 00000102 LT R Latch Release
01 00000103 LT W Latch Wait
01 00000104 LT AW Latch Acquire after Wait
01 00000106 LT I Latch Increment (Recursive)
01 00000107 LT D Latch Decrement (Recursive)
01 000002FC LE EUO Latch unowned (not released)
01 000002FD LE EO Latch already owned (not acquired)
Chapter 3. Using Language Environment debugging facilities 153
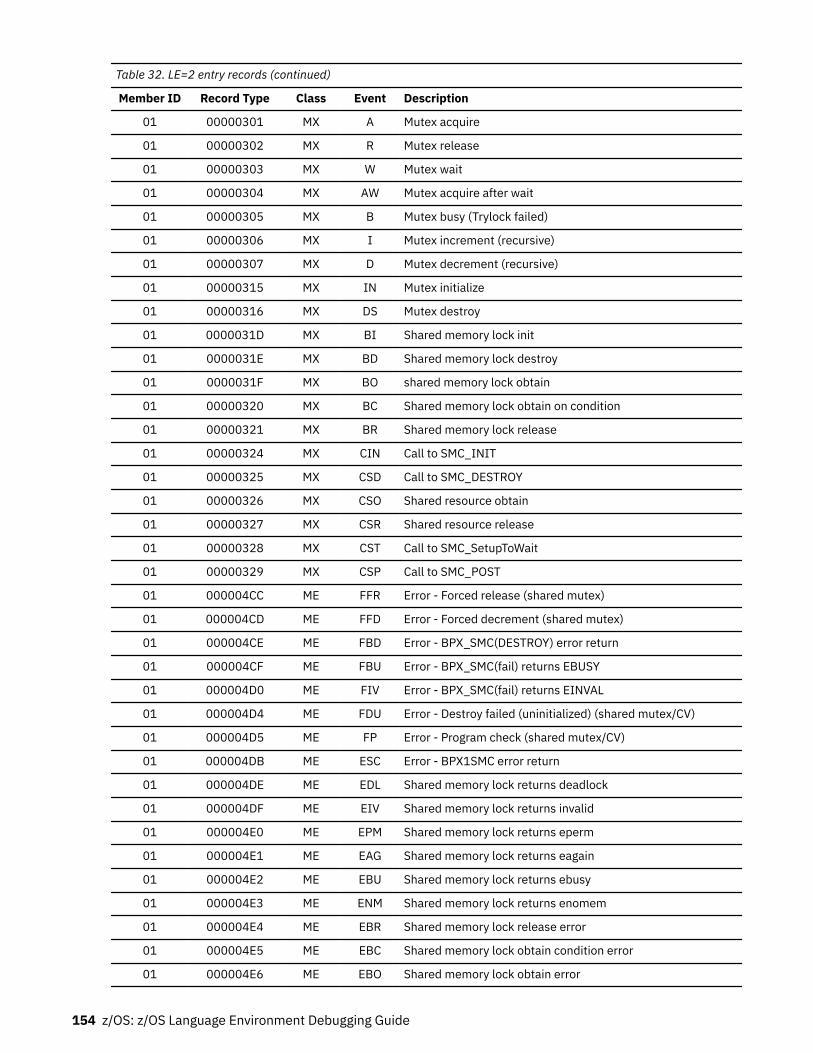
Table 32. LE=2 entry records (continued)
Member ID Record Type Class Event Description
01 00000301 MX A Mutex acquire
01 00000302 MX R Mutex release
01 00000303 MX W Mutex wait
01 00000304 MX AW Mutex acquire after wait
01 00000305 MX B Mutex busy (Trylock failed)
01 00000306 MX I Mutex increment (recursive)
01 00000307 MX D Mutex decrement (recursive)
01 00000315 MX IN Mutex initialize
01 00000316 MX DS Mutex destroy
01 0000031D MX BI Shared memory lock init
01 0000031E MX BD Shared memory lock destroy
01 0000031F MX BO shared memory lock obtain
01 00000320 MX BC Shared memory lock obtain on condition
01 00000321 MX BR Shared memory lock release
01 00000324 MX CIN Call to SMC_INIT
01 00000325 MX CSD Call to SMC_DESTROY
01 00000326 MX CSO Shared resource obtain
01 00000327 MX CSR Shared resource release
01 00000328 MX CST Call to SMC_SetupToWait
01 00000329 MX CSP Call to SMC_POST
01 000004CC ME FFR Error - Forced release (shared mutex)
01 000004CD ME FFD Error - Forced decrement (shared mutex)
01 000004CE ME FBD Error - BPX_SMC(DESTROY) error return
01 000004CF ME FBU Error - BPX_SMC(fail) returns EBUSY
01 000004D0 ME FIV Error - BPX_SMC(fail) returns EINVAL
01 000004D4 ME FDU Error - Destroy failed (uninitialized) (shared mutex/CV)
01 000004D5 ME FP Error - Program check (shared mutex/CV)
01 000004DB ME ESC Error - BPX1SMC error return
01 000004DE ME EDL Shared memory lock returns deadlock
01 000004DF ME EIV Shared memory lock returns invalid
01 000004E0 ME EPM Shared memory lock returns eperm
01 000004E1 ME EAG Shared memory lock returns eagain
01 000004E2 ME EBU Shared memory lock returns ebusy
01 000004E3 ME ENM Shared memory lock returns enomem
01 000004E4 ME EBR Shared memory lock release error
01 000004E5 ME EBC Shared memory lock obtain condition error
01 000004E6 ME EBO Shared memory lock obtain error
154 z/OS: z/OS Language Environment Debugging Guide
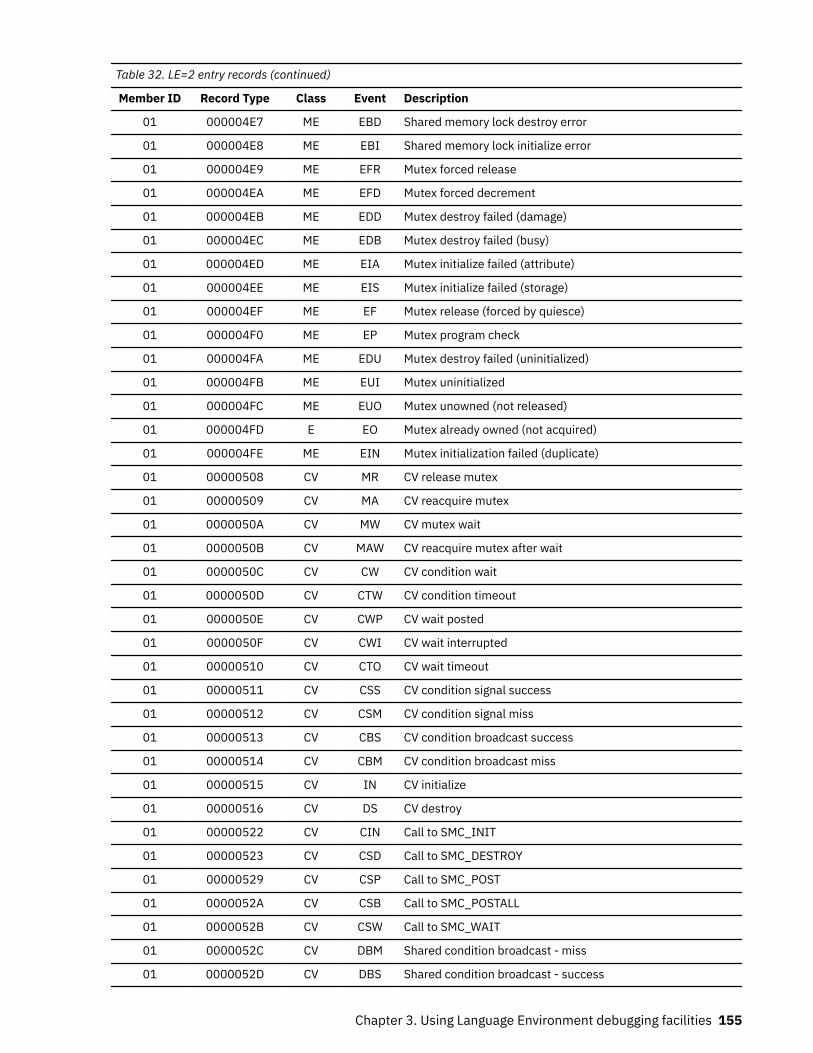
Table 32. LE=2 entry records (continued)
Member ID Record Type Class Event Description
01 000004E7 ME EBD Shared memory lock destroy error
01 000004E8 ME EBI Shared memory lock initialize error
01 000004E9 ME EFR Mutex forced release
01 000004EA ME EFD Mutex forced decrement
01 000004EB ME EDD Mutex destroy failed (damage)
01 000004EC ME EDB Mutex destroy failed (busy)
01 000004ED ME EIA Mutex initialize failed (attribute)
01 000004EE ME EIS Mutex initialize failed (storage)
01 000004EF ME EF Mutex release (forced by quiesce)
01 000004F0 ME EP Mutex program check
01 000004FA ME EDU Mutex destroy failed (uninitialized)
01 000004FB ME EUI Mutex uninitialized
01 000004FC ME EUO Mutex unowned (not released)
01 000004FD E EO Mutex already owned (not acquired)
01 000004FE ME EIN Mutex initialization failed (duplicate)
01 00000508 CV MR CV release mutex
01 00000509 CV MA CV reacquire mutex
01 0000050A CV MW CV mutex wait
01 0000050B CV MAW CV reacquire mutex after wait
01 0000050C CV CW CV condition wait
01 0000050D CV CTW CV condition timeout
01 0000050E CV CWP CV wait posted
01 0000050F CV CWI CV wait interrupted
01 00000510 CV CTO CV wait timeout
01 00000511 CV CSS CV condition signal success
01 00000512 CV CSM CV condition signal miss
01 00000513 CV CBS CV condition broadcast success
01 00000514 CV CBM CV condition broadcast miss
01 00000515 CV IN CV initialize
01 00000516 CV DS CV destroy
01 00000522 CV CIN Call to SMC_INIT
01 00000523 CV CSD Call to SMC_DESTROY
01 00000529 CV CSP Call to SMC_POST
01 0000052A CV CSB Call to SMC_POSTALL
01 0000052B CV CSW Call to SMC_WAIT
01 0000052C CV DBM Shared condition broadcast - miss
01 0000052D CV DBS Shared condition broadcast - success
Chapter 3. Using Language Environment debugging facilities 155
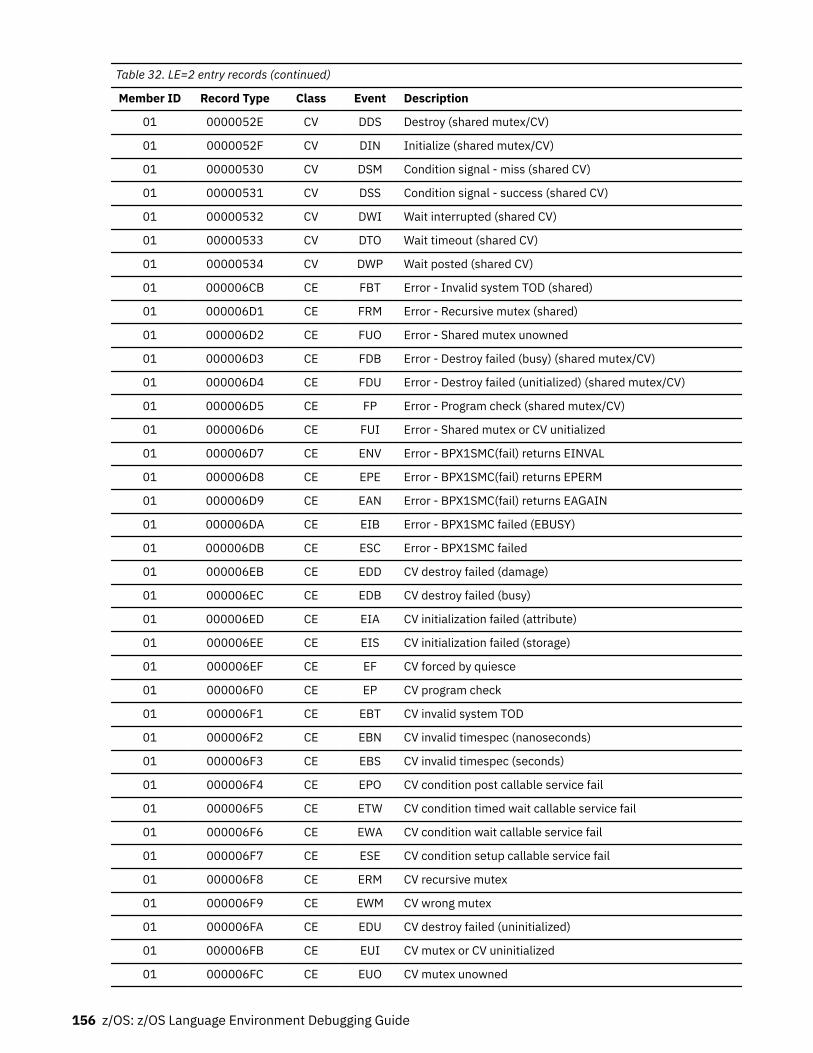
Table 32. LE=2 entry records (continued)
Member ID Record Type Class Event Description
01 0000052E CV DDS Destroy (shared mutex/CV)
01 0000052F CV DIN Initialize (shared mutex/CV)
01 00000530 CV DSM Condition signal - miss (shared CV)
01 00000531 CV DSS Condition signal - success (shared CV)
01 00000532 CV DWI Wait interrupted (shared CV)
01 00000533 CV DTO Wait timeout (shared CV)
01 00000534 CV DWP Wait posted (shared CV)
01 000006CB CE FBT Error - Invalid system TOD (shared)
01 000006D1 CE FRM Error - Recursive mutex (shared)
01 000006D2 CE FUO Error - Shared mutex unowned
01 000006D3 CE FDB Error - Destroy failed (busy) (shared mutex/CV)
01 000006D4 CE FDU Error - Destroy failed (unitialized) (shared mutex/CV)
01 000006D5 CE FP Error - Program check (shared mutex/CV)
01 000006D6 CE FUI Error - Shared mutex or CV unitialized
01 000006D7 CE ENV Error - BPX1SMC(fail) returns EINVAL
01 000006D8 CE EPE Error - BPX1SMC(fail) returns EPERM
01 000006D9 CE EAN Error - BPX1SMC(fail) returns EAGAIN
01 000006DA CE EIB Error - BPX1SMC failed (EBUSY)
01 000006DB CE ESC Error - BPX1SMC failed
01 000006EB CE EDD CV destroy failed (damage)
01 000006EC CE EDB CV destroy failed (busy)
01 000006ED CE EIA CV initialization failed (attribute)
01 000006EE CE EIS CV initialization failed (storage)
01 000006EF CE EF CV forced by quiesce
01 000006F0 CE EP CV program check
01 000006F1 CE EBT CV invalid system TOD
01 000006F2 CE EBN CV invalid timespec (nanoseconds)
01 000006F3 CE EBS CV invalid timespec (seconds)
01 000006F4 CE EPO CV condition post callable service fail
01 000006F5 CE ETW CV condition timed wait callable service fail
01 000006F6 CE EWA CV condition wait callable service fail
01 000006F7 CE ESE CV condition setup callable service fail
01 000006F8 CE ERM CV recursive mutex
01 000006F9 CE EWM CV wrong mutex
01 000006FA CE EDU CV destroy failed (uninitialized)
01 000006FB CE EUI CV mutex or CV uninitialized
01 000006FC CE EUO CV mutex unowned
156 z/OS: z/OS Language Environment Debugging Guide
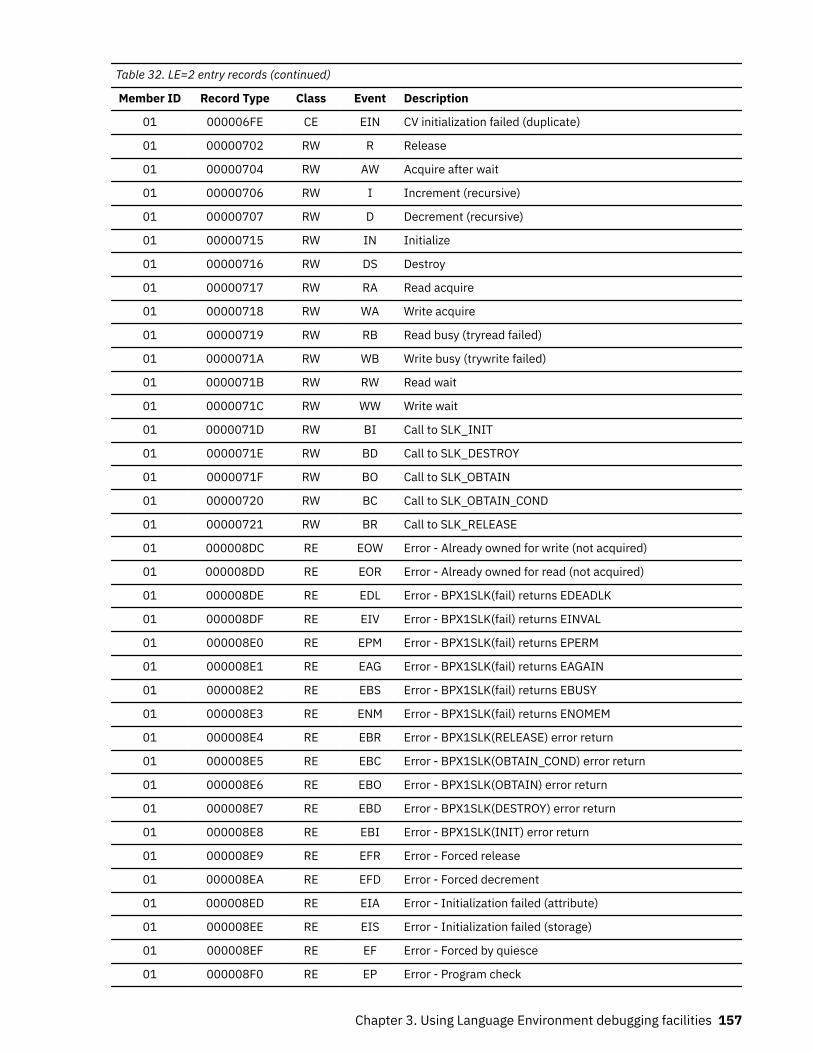
Table 32. LE=2 entry records (continued)
Member ID Record Type Class Event Description
01 000006FE CE EIN CV initialization failed (duplicate)
01 00000702 RW R Release
01 00000704 RW AW Acquire after wait
01 00000706 RW I Increment (recursive)
01 00000707 RW D Decrement (recursive)
01 00000715 RW IN Initialize
01 00000716 RW DS Destroy
01 00000717 RW RA Read acquire
01 00000718 RW WA Write acquire
01 00000719 RW RB Read busy (tryread failed)
01 0000071A RW WB Write busy (trywrite failed)
01 0000071B RW RW Read wait
01 0000071C RW WW Write wait
01 0000071D RW BI Call to SLK_INIT
01 0000071E RW BD Call to SLK_DESTROY
01 0000071F RW BO Call to SLK_OBTAIN
01 00000720 RW BC Call to SLK_OBTAIN_COND
01 00000721 RW BR Call to SLK_RELEASE
01 000008DC RE EOW Error - Already owned for write (not acquired)
01 000008DD RE EOR Error - Already owned for read (not acquired)
01 000008DE RE EDL Error - BPX1SLK(fail) returns EDEADLK
01 000008DF RE EIV Error - BPX1SLK(fail) returns EINVAL
01 000008E0 RE EPM Error - BPX1SLK(fail) returns EPERM
01 000008E1 RE EAG Error - BPX1SLK(fail) returns EAGAIN
01 000008E2 RE EBS Error - BPX1SLK(fail) returns EBUSY
01 000008E3 RE ENM Error - BPX1SLK(fail) returns ENOMEM
01 000008E4 RE EBR Error - BPX1SLK(RELEASE) error return
01 000008E5 RE EBC Error - BPX1SLK(OBTAIN_COND) error return
01 000008E6 RE EBO Error - BPX1SLK(OBTAIN) error return
01 000008E7 RE EBD Error - BPX1SLK(DESTROY) error return
01 000008E8 RE EBI Error - BPX1SLK(INIT) error return
01 000008E9 RE EFR Error - Forced release
01 000008EA RE EFD Error - Forced decrement
01 000008ED RE EIA Error - Initialization failed (attribute)
01 000008EE RE EIS Error - Initialization failed (storage)
01 000008EF RE EF Error - Forced by quiesce
01 000008F0 RE EP Error - Program check
Chapter 3. Using Language Environment debugging facilities 157
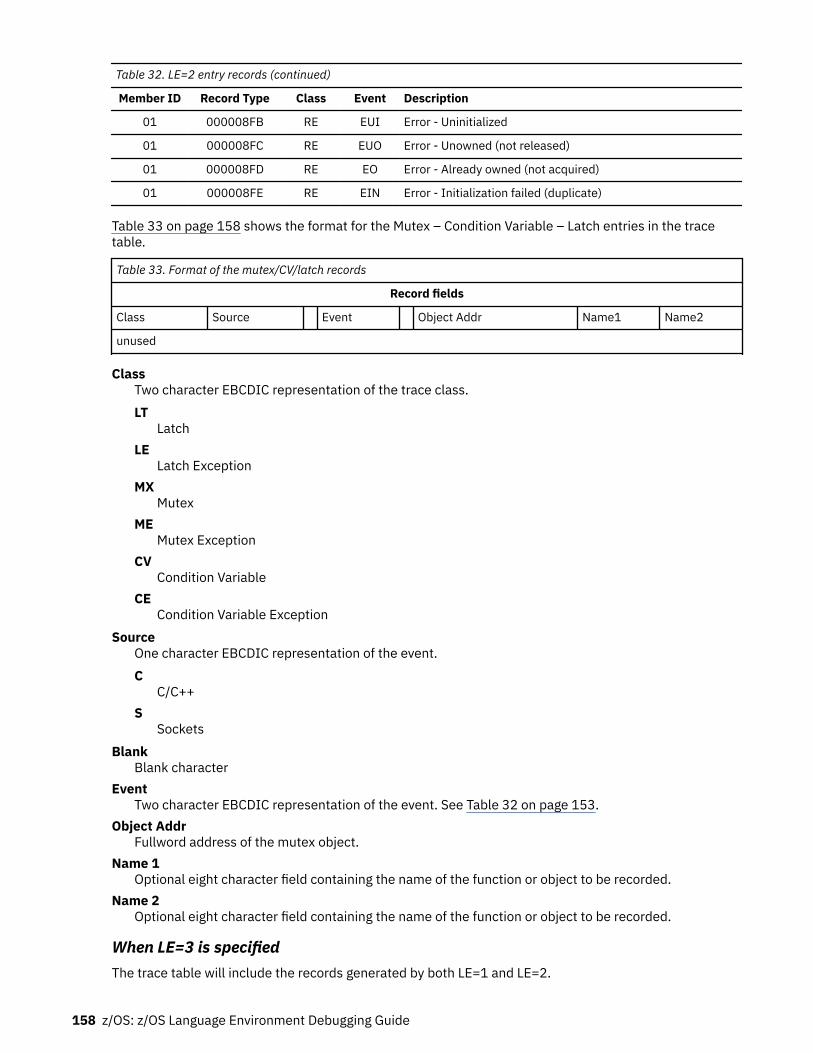
Table 32. LE=2 entry records (continued)
Member ID Record Type Class Event Description
01 000008FB RE EUI Error - Uninitialized
01 000008FC RE EUO Error - Unowned (not released)
01 000008FD RE EO Error - Already owned (not acquired)
01 000008FE RE EIN Error - Initialization failed (duplicate)
Table 33 on page 158 shows the format for the Mutex – Condition Variable – Latch entries in the tracetable.
Table 33. Format of the mutex/CV/latch records
Record fields
Class Source Event Object Addr Name1 Name2
unused
ClassTwo character EBCDIC representation of the trace class.LT
LatchLE
Latch ExceptionMX
MutexME
Mutex ExceptionCV
Condition VariableCE
Condition Variable ExceptionSource
One character EBCDIC representation of the event.C
C/C++S
SocketsBlank
Blank characterEvent
Two character EBCDIC representation of the event. See Table 32 on page 153.Object Addr
Fullword address of the mutex object.Name 1
Optional eight character field containing the name of the function or object to be recorded.Name 2
Optional eight character field containing the name of the function or object to be recorded.
When LE=3 is specifiedThe trace table will include the records generated by both LE=1 and LE=2.
158 z/OS: z/OS Language Environment Debugging Guide
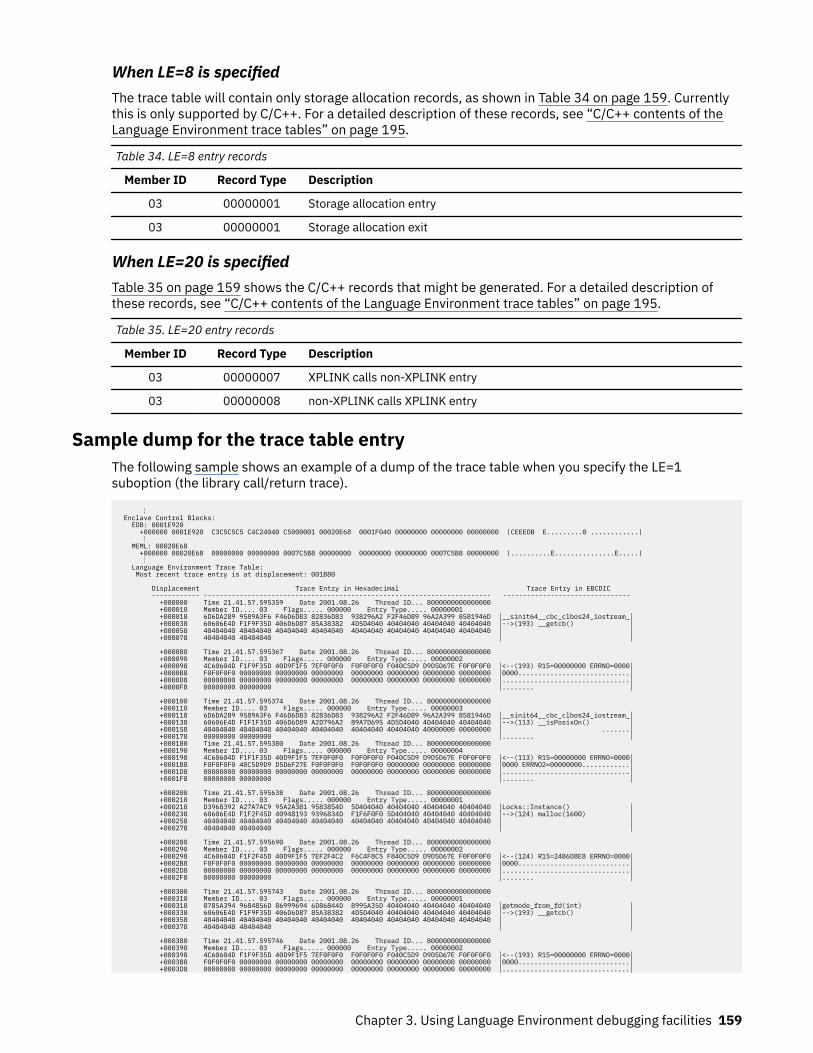
When LE=8 is specifiedThe trace table will contain only storage allocation records, as shown in Table 34 on page 159. Currentlythis is only supported by C/C++. For a detailed description of these records, see “C/C++ contents of theLanguage Environment trace tables” on page 195.
Table 34. LE=8 entry records
Member ID Record Type Description
03 00000001 Storage allocation entry
03 00000001 Storage allocation exit
When LE=20 is specifiedTable 35 on page 159 shows the C/C++ records that might be generated. For a detailed description ofthese records, see “C/C++ contents of the Language Environment trace tables” on page 195.
Table 35. LE=20 entry records
Member ID Record Type Description
03 00000007 XPLINK calls non-XPLINK entry
03 00000008 non-XPLINK calls XPLINK entry
Sample dump for the trace table entryThe following sample shows an example of a dump of the trace table when you specify the LE=1suboption (the library call/return trace).
⋮ Enclave Control Blocks: EDB: 0001E920 +000000 0001E920 C3C5C5C5 C4C24040 C5000001 00020E68 0001F040 00000000 00000000 00000000 |CEEEDB E.........0 ............| ⋮ MEML: 00020E68 +000000 00020E68 00000000 00000000 0007C5B8 00000000 00000000 00000000 0007C5B8 00000000 |..........E...............E.....| ⋮ Language Environment Trace Table: Most recent trace entry is at displacement: 001B80
Displacement Trace Entry in Hexadecimal Trace Entry in EBCDIC ------------ ------------------------------------------------------------------------ -------------------------------- +000000 Time 21.41.57.595359 Date 2001.08.26 Thread ID... 8000000000000000 +000010 Member ID.... 03 Flags..... 000000 Entry Type..... 00000001 +000018 6D6DA289 9589A3F6 F46D6D83 82836D83 938296A2 F2F46D89 96A2A399 8581946D │__sinit64__cbc_clbos24_iostream_│ +000038 60606E4D F1F9F35D 406D6D87 85A38382 4D5D4040 40404040 40404040 40404040 │-->(193) __getcb() │ +000058 40404040 40404040 40404040 40404040 40404040 40404040 40404040 40404040 │ │ +000078 40404040 40404040 │ │
+000080 Time 21.41.57.595367 Date 2001.08.26 Thread ID... 8000000000000000 +000090 Member ID.... 03 Flags..... 000000 Entry Type..... 00000002 +000098 4C60604D F1F9F35D 40D9F1F5 7EF0F0F0 F0F0F0F0 F040C5D9 D9D5D67E F0F0F0F0 │<--(193) R15=00000000 ERRNO=0000│ +0000B8 F0F0F0F0 00000000 00000000 00000000 00000000 00000000 00000000 00000000 │0000............................│ +0000D8 00000000 00000000 00000000 00000000 00000000 00000000 00000000 00000000 │................................│ +0000F8 00000000 00000000 │........ │
+000100 Time 21.41.57.595374 Date 2001.08.26 Thread ID... 8000000000000000 +000110 Member ID.... 03 Flags..... 000000 Entry Type..... 00000003 +000118 6D6DA289 9589A3F6 F46D6D83 82836D83 938296A2 F2F46D89 96A2A399 8581946D │__sinit64__cbc_clbos24_iostream_│ +000138 60606E4D F1F1F35D 406D6D89 A2D796A2 89A7D695 4D5D4040 40404040 40404040 │-->(113) __isPosixOn() │ +000158 40404040 40404040 40404040 40404040 40404040 40404040 40000000 00000000 │ .......│ +000178 00000000 00000000 │........ │ +000180 Time 21.41.57.595380 Date 2001.08.26 Thread ID... 8000000000000000 +000190 Member ID.... 03 Flags..... 000000 Entry Type..... 00000004 +000198 4C60604D F1F1F35D 40D9F1F5 7EF0F0F0 F0F0F0F0 F040C5D9 D9D5D67E F0F0F0F0 │<--(113) R15=00000000 ERRNO=0000│ +0001B8 F0F0F0F0 40C5D9D9 D5D6F27E F0F0F0F0 F0F0F0F0 00000000 00000000 00000000 │0000 ERRNO2=00000000............│ +0001D8 00000000 00000000 00000000 00000000 00000000 00000000 00000000 00000000 │................................│ +0001F8 00000000 00000000 │........ │
+000200 Time 21.41.57.595638 Date 2001.08.26 Thread ID... 8000000000000000 +000210 Member ID.... 03 Flags..... 000000 Entry Type..... 00000001 +000218 D3968392 A27A7AC9 95A2A381 9583854D 5D404040 40404040 40404040 40404040 │Locks::Instance() │ +000238 60606E4D F1F2F45D 40948193 9396834D F1F6F0F0 5D404040 40404040 40404040 │-->(124) malloc(1600) │ +000258 40404040 40404040 40404040 40404040 40404040 40404040 40404040 40404040 │ │ +000278 40404040 40404040 │ │
+000280 Time 21.41.57.595690 Date 2001.08.26 Thread ID... 8000000000000000 +000290 Member ID.... 03 Flags..... 000000 Entry Type..... 00000002 +000298 4C60604D F1F2F45D 40D9F1F5 7EF2F4C2 F6C4F8C5 F840C5D9 D9D5D67E F0F0F0F0 │<--(124) R15=24B6D8E8 ERRNO=0000│ +0002B8 F0F0F0F0 00000000 00000000 00000000 00000000 00000000 00000000 00000000 │0000............................│ +0002D8 00000000 00000000 00000000 00000000 00000000 00000000 00000000 00000000 │................................│ +0002F8 00000000 00000000 │........ │
+000300 Time 21.41.57.595743 Date 2001.08.26 Thread ID... 8000000000000000 +000310 Member ID.... 03 Flags..... 000000 Entry Type..... 00000001 +000318 8785A394 9684856D 86999694 6D86844D 8995A35D 40404040 40404040 40404040 │getmode_from_fd(int) │ +000338 60606E4D F1F9F35D 406D6D87 85A38382 4D5D4040 40404040 40404040 40404040 │-->(193) __getcb() │ +000358 40404040 40404040 40404040 40404040 40404040 40404040 40404040 40404040 │ │ +000378 40404040 40404040 │ │
+000380 Time 21.41.57.595746 Date 2001.08.26 Thread ID... 8000000000000000 +000390 Member ID.... 03 Flags..... 000000 Entry Type..... 00000002 +000398 4C60604D F1F9F35D 40D9F1F5 7EF0F0F0 F0F0F0F0 F040C5D9 D9D5D67E F0F0F0F0 │<--(193) R15=00000000 ERRNO=0000│ +0003B8 F0F0F0F0 00000000 00000000 00000000 00000000 00000000 00000000 00000000 │0000............................│ +0003D8 00000000 00000000 00000000 00000000 00000000 00000000 00000000 00000000 │................................│
Chapter 3. Using Language Environment debugging facilities 159
+0003F8 00000000 00000000 │........ │ ⋮
Requesting a UNIX System Services syscall trace for debuggingSignal SIGTRACE can be sent to a process or process group to start or stop a trace of the z/OS UNIXSystem Services syscalls made by the application. The signal is implemented as a toggle. With the traceturned on, the z/OS UNIX System Services kernel gathers the syscall trace records for the targetedprocesses. A system dump of the user address space can be generated by sending signal SIGDUMP to thesame processes to capture the trace output.
160 z/OS: z/OS Language Environment Debugging Guide
Part 2. Debugging language-specific routinesThis part provides specific information for debugging applications written in C/C++, COBOL, Fortran, andPL/I. It also discusses techniques for debugging under CICS.
© Copyright IBM Corp. 1991, 2020 161

162 z/OS: z/OS Language Environment Debugging Guide
Chapter 4. Debugging C/C++ routines
This chapter provides specific information to help you debug applications that contain one or more C/C++routines. It also provides information about debugging C/C++ applications compiled with XPLINK. Itincludes the following topics:
• Debugging C/C++ I/O routines• Using C/C++ compiler listings• Generating a Language Environment dump of a C/C++ routine• Generating a Language Environment dump of a C/C++ routine with XPLINK• Finding C/C++ information in a Language Environment dump• Debugging example of C/C++ routines• Debugging example of C/C++ routines with XPLINK
There are several debugging features that are unique to C/C++ routines. Before examining the C/C++techniques to find errors, you might want to consider the following areas of potential problems:
• If you suspect that you are using uninitialized storage, you may want to use the STORAGE runtimeoption.
• If you are using the fetch() function, see fetch() - Get a load module in z/OS XL C/C++ Runtime LibraryReference to ensure that you are creating the fetchable module correctly.
• If you are using DLLs, see Building and using Dynamic Link Libraries (DLLs) in z/OS XL C/C++Programming Guide.
• For non-System Programming C routines, ensure that the entry point of the load module is CEESTART. • You should avoid:
– Incorrect casting– Referencing an array element with a subscript outside the declared bounds– Copying a string to a target with a shorter length than the source string– Declaring but not initializing a pointer variable, or using a pointer to allocated storage that has already
been freed
If a routine exception occurred and you need more information than the condition handler provided, runyour routine with the following runtime options: TRAP(ON, NOSPIE) and TERMTHDACT(UAIMM). Settingthese runtime options generates a system dump of the user address space of the original abend orprogram interrupt prior to the Language Environment condition manager processing the condition. Afterthe system dump is taken by the operating system, the Language Environment condition managercontinues processing.
Debugging C/C++ programsYou can use C/C++ conventions such as __amrc and perror() when you debug C/C++ programs.
Using the __amrc and __amrc2 structures to debug input/output__amrc, a structure defined in stdio.h, can help you determine the cause of errors resulting from an I/Ooperation, because it contains diagnostic information (for example, the return code from a failed VSAMoperation). There are two structures:
• __amrc (defined by type __amrc_type• __amrc2 (defined by type __amrc2_type)
The __amrc2_type structure contains secondary information that C can provide.
© Copyright IBM Corp. 1991, 2020 163
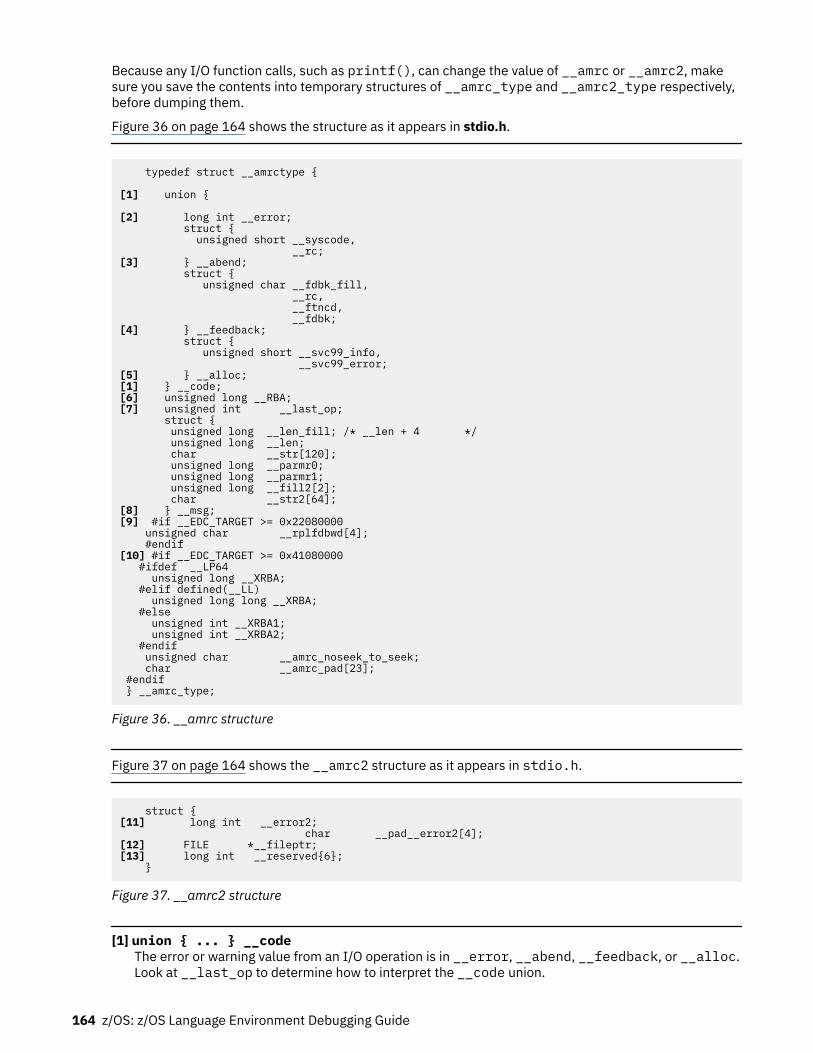
Because any I/O function calls, such as printf(), can change the value of __amrc or __amrc2, makesure you save the contents into temporary structures of __amrc_type and __amrc2_type respectively,before dumping them.
Figure 36 on page 164 shows the structure as it appears in stdio.h.
typedef struct __amrctype {
[1] union {
[2] long int __error; struct { unsigned short __syscode, __rc;[3] } __abend; struct { unsigned char __fdbk_fill, __rc, __ftncd, __fdbk;[4] } __feedback; struct { unsigned short __svc99_info, __svc99_error;[5] } __alloc;[1] } __code;[6] unsigned long __RBA;[7] unsigned int __last_op; struct { unsigned long __len_fill; /* __len + 4 */ unsigned long __len; char __str[120]; unsigned long __parmr0; unsigned long __parmr1; unsigned long __fill2[2]; char __str2[64];[8] } __msg;[9] #if __EDC_TARGET >= 0x22080000 unsigned char __rplfdbwd[4]; #endif [10] #if __EDC_TARGET >= 0x41080000 #ifdef __LP64 unsigned long __XRBA; #elif defined(__LL) unsigned long long __XRBA; #else unsigned int __XRBA1; unsigned int __XRBA2; #endif unsigned char __amrc_noseek_to_seek; char __amrc_pad[23]; #endif } __amrc_type;
Figure 36. __amrc structure
Figure 37 on page 164 shows the __amrc2 structure as it appears in stdio.h.
struct {[11] long int __error2; char __pad__error2[4];[12] FILE *__fileptr;[13] long int __reserved{6}; }
Figure 37. __amrc2 structure
[1] union { ... } __codeThe error or warning value from an I/O operation is in __error, __abend, __feedback, or __alloc.Look at __last_op to determine how to interpret the __code union.
164 z/OS: z/OS Language Environment Debugging Guide
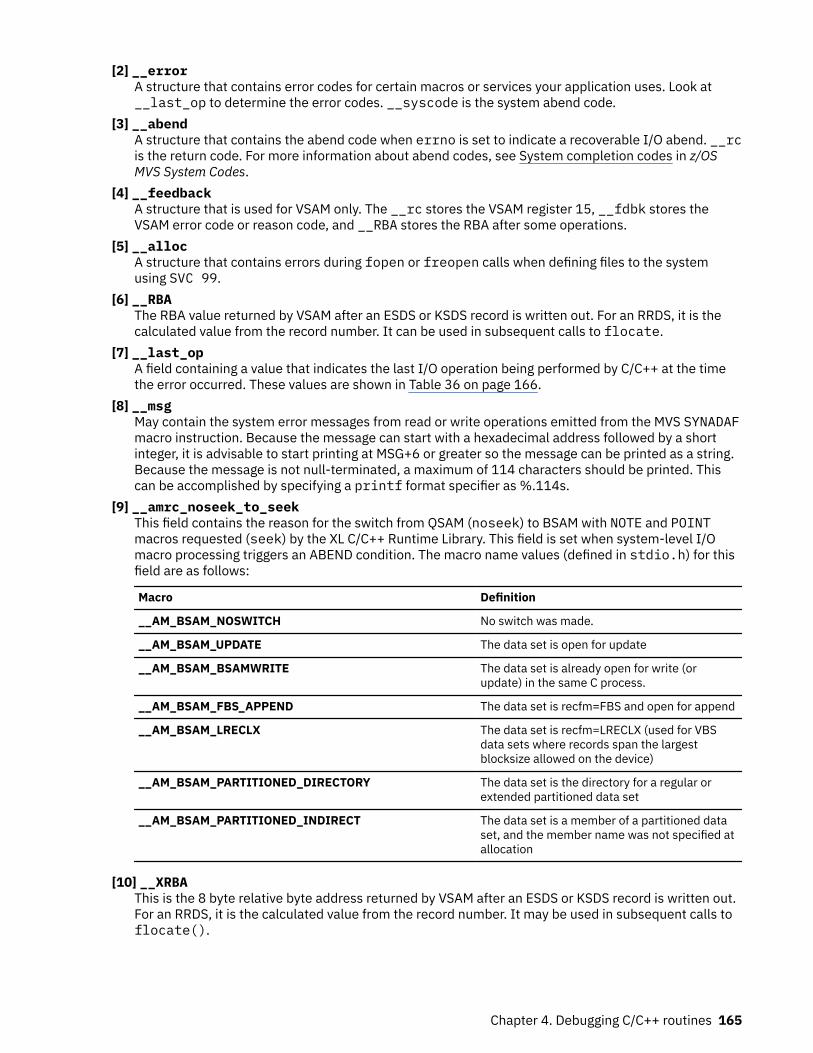
[2] __errorA structure that contains error codes for certain macros or services your application uses. Look at__last_op to determine the error codes. __syscode is the system abend code.
[3] __abendA structure that contains the abend code when errno is set to indicate a recoverable I/O abend. __rcis the return code. For more information about abend codes, see System completion codes in z/OSMVS System Codes.
[4] __feedbackA structure that is used for VSAM only. The __rc stores the VSAM register 15, __fdbk stores theVSAM error code or reason code, and __RBA stores the RBA after some operations.
[5] __allocA structure that contains errors during fopen or freopen calls when defining files to the systemusing SVC 99.
[6] __RBAThe RBA value returned by VSAM after an ESDS or KSDS record is written out. For an RRDS, it is thecalculated value from the record number. It can be used in subsequent calls to flocate.
[7] __last_opA field containing a value that indicates the last I/O operation being performed by C/C++ at the timethe error occurred. These values are shown in Table 36 on page 166.
[8] __msgMay contain the system error messages from read or write operations emitted from the MVS SYNADAFmacro instruction. Because the message can start with a hexadecimal address followed by a shortinteger, it is advisable to start printing at MSG+6 or greater so the message can be printed as a string.Because the message is not null-terminated, a maximum of 114 characters should be printed. Thiscan be accomplished by specifying a printf format specifier as %.114s.
[9] __amrc_noseek_to_seekThis field contains the reason for the switch from QSAM (noseek) to BSAM with NOTE and POINTmacros requested (seek) by the XL C/C++ Runtime Library. This field is set when system-level I/Omacro processing triggers an ABEND condition. The macro name values (defined in stdio.h) for thisfield are as follows:
Macro Definition
__AM_BSAM_NOSWITCH No switch was made.
__AM_BSAM_UPDATE The data set is open for update
__AM_BSAM_BSAMWRITE The data set is already open for write (orupdate) in the same C process.
__AM_BSAM_FBS_APPEND The data set is recfm=FBS and open for append
__AM_BSAM_LRECLX The data set is recfm=LRECLX (used for VBSdata sets where records span the largestblocksize allowed on the device)
__AM_BSAM_PARTITIONED_DIRECTORY The data set is the directory for a regular orextended partitioned data set
__AM_BSAM_PARTITIONED_INDIRECT The data set is a member of a partitioned dataset, and the member name was not specified atallocation
[10] __XRBAThis is the 8 byte relative byte address returned by VSAM after an ESDS or KSDS record is written out.For an RRDS, it is the calculated value from the record number. It may be used in subsequent calls toflocate().
Chapter 4. Debugging C/C++ routines 165
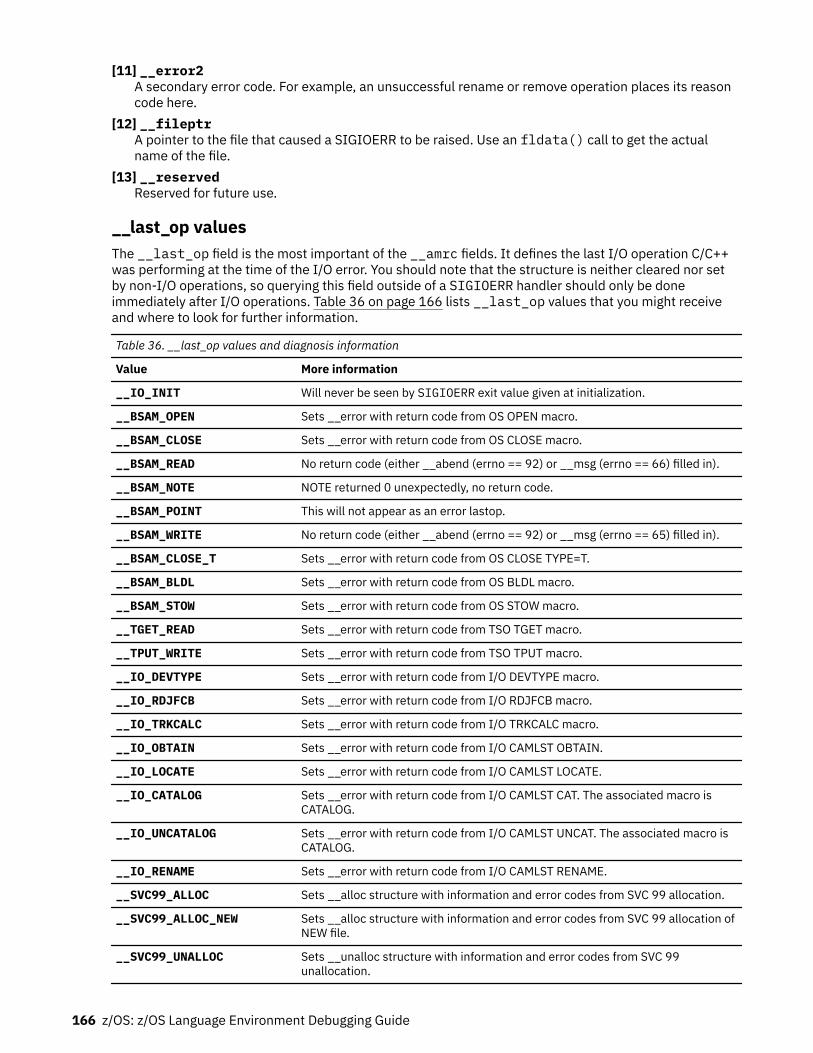
[11] __error2A secondary error code. For example, an unsuccessful rename or remove operation places its reasoncode here.
[12] __fileptrA pointer to the file that caused a SIGIOERR to be raised. Use an fldata() call to get the actualname of the file.
[13] __reservedReserved for future use.
__last_op valuesThe __last_op field is the most important of the __amrc fields. It defines the last I/O operation C/C++was performing at the time of the I/O error. You should note that the structure is neither cleared nor setby non-I/O operations, so querying this field outside of a SIGIOERR handler should only be doneimmediately after I/O operations. Table 36 on page 166 lists __last_op values that you might receiveand where to look for further information.
Table 36. __last_op values and diagnosis information
Value More information
__IO_INIT Will never be seen by SIGIOERR exit value given at initialization.
__BSAM_OPEN Sets __error with return code from OS OPEN macro.
__BSAM_CLOSE Sets __error with return code from OS CLOSE macro.
__BSAM_READ No return code (either __abend (errno == 92) or __msg (errno == 66) filled in).
__BSAM_NOTE NOTE returned 0 unexpectedly, no return code.
__BSAM_POINT This will not appear as an error lastop.
__BSAM_WRITE No return code (either __abend (errno == 92) or __msg (errno == 65) filled in).
__BSAM_CLOSE_T Sets __error with return code from OS CLOSE TYPE=T.
__BSAM_BLDL Sets __error with return code from OS BLDL macro.
__BSAM_STOW Sets __error with return code from OS STOW macro.
__TGET_READ Sets __error with return code from TSO TGET macro.
__TPUT_WRITE Sets __error with return code from TSO TPUT macro.
__IO_DEVTYPE Sets __error with return code from I/O DEVTYPE macro.
__IO_RDJFCB Sets __error with return code from I/O RDJFCB macro.
__IO_TRKCALC Sets __error with return code from I/O TRKCALC macro.
__IO_OBTAIN Sets __error with return code from I/O CAMLST OBTAIN.
__IO_LOCATE Sets __error with return code from I/O CAMLST LOCATE.
__IO_CATALOG Sets __error with return code from I/O CAMLST CAT. The associated macro isCATALOG.
__IO_UNCATALOG Sets __error with return code from I/O CAMLST UNCAT. The associated macro isCATALOG.
__IO_RENAME Sets __error with return code from I/O CAMLST RENAME.
__SVC99_ALLOC Sets __alloc structure with information and error codes from SVC 99 allocation.
__SVC99_ALLOC_NEW Sets __alloc structure with information and error codes from SVC 99 allocation ofNEW file.
__SVC99_UNALLOC Sets __unalloc structure with information and error codes from SVC 99unallocation.
166 z/OS: z/OS Language Environment Debugging Guide
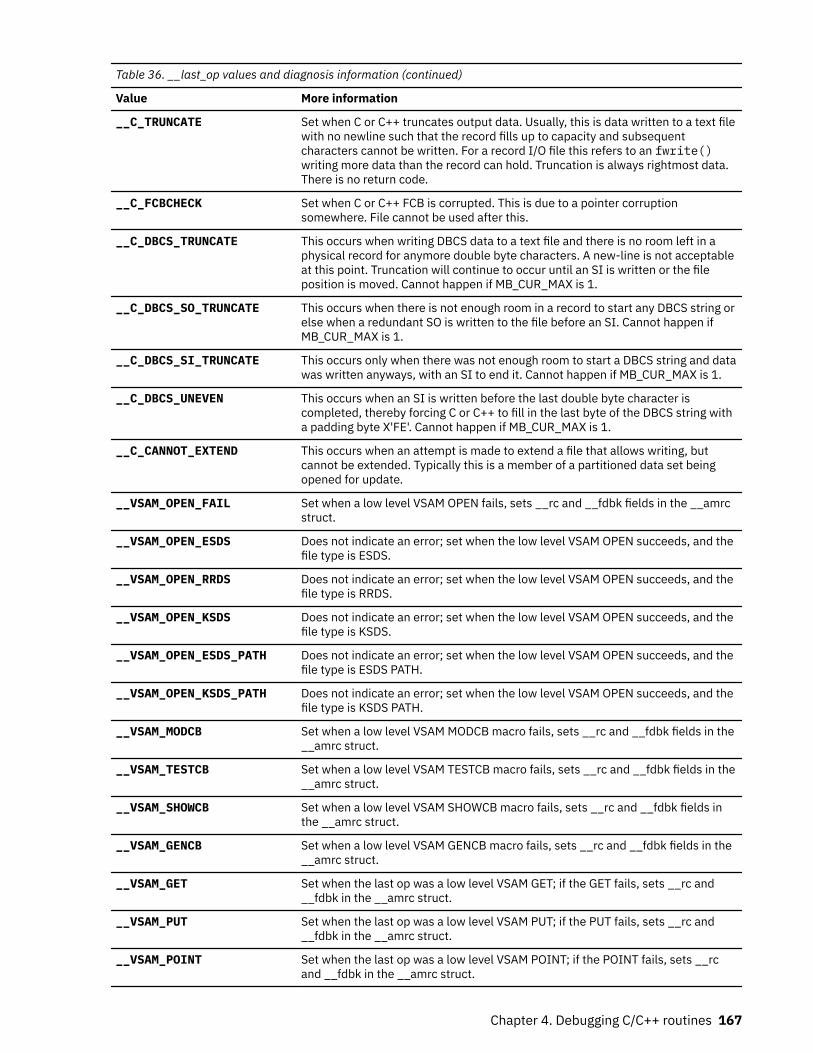
Table 36. __last_op values and diagnosis information (continued)
Value More information
__C_TRUNCATE Set when C or C++ truncates output data. Usually, this is data written to a text filewith no newline such that the record fills up to capacity and subsequentcharacters cannot be written. For a record I/O file this refers to an fwrite()writing more data than the record can hold. Truncation is always rightmost data.There is no return code.
__C_FCBCHECK Set when C or C++ FCB is corrupted. This is due to a pointer corruptionsomewhere. File cannot be used after this.
__C_DBCS_TRUNCATE This occurs when writing DBCS data to a text file and there is no room left in aphysical record for anymore double byte characters. A new-line is not acceptableat this point. Truncation will continue to occur until an SI is written or the fileposition is moved. Cannot happen if MB_CUR_MAX is 1.
__C_DBCS_SO_TRUNCATE This occurs when there is not enough room in a record to start any DBCS string orelse when a redundant SO is written to the file before an SI. Cannot happen ifMB_CUR_MAX is 1.
__C_DBCS_SI_TRUNCATE This occurs only when there was not enough room to start a DBCS string and datawas written anyways, with an SI to end it. Cannot happen if MB_CUR_MAX is 1.
__C_DBCS_UNEVEN This occurs when an SI is written before the last double byte character iscompleted, thereby forcing C or C++ to fill in the last byte of the DBCS string witha padding byte X'FE'. Cannot happen if MB_CUR_MAX is 1.
__C_CANNOT_EXTEND This occurs when an attempt is made to extend a file that allows writing, butcannot be extended. Typically this is a member of a partitioned data set beingopened for update.
__VSAM_OPEN_FAIL Set when a low level VSAM OPEN fails, sets __rc and __fdbk fields in the __amrcstruct.
__VSAM_OPEN_ESDS Does not indicate an error; set when the low level VSAM OPEN succeeds, and thefile type is ESDS.
__VSAM_OPEN_RRDS Does not indicate an error; set when the low level VSAM OPEN succeeds, and thefile type is RRDS.
__VSAM_OPEN_KSDS Does not indicate an error; set when the low level VSAM OPEN succeeds, and thefile type is KSDS.
__VSAM_OPEN_ESDS_PATH Does not indicate an error; set when the low level VSAM OPEN succeeds, and thefile type is ESDS PATH.
__VSAM_OPEN_KSDS_PATH Does not indicate an error; set when the low level VSAM OPEN succeeds, and thefile type is KSDS PATH.
__VSAM_MODCB Set when a low level VSAM MODCB macro fails, sets __rc and __fdbk fields in the__amrc struct.
__VSAM_TESTCB Set when a low level VSAM TESTCB macro fails, sets __rc and __fdbk fields in the__amrc struct.
__VSAM_SHOWCB Set when a low level VSAM SHOWCB macro fails, sets __rc and __fdbk fields inthe __amrc struct.
__VSAM_GENCB Set when a low level VSAM GENCB macro fails, sets __rc and __fdbk fields in the__amrc struct.
__VSAM_GET Set when the last op was a low level VSAM GET; if the GET fails, sets __rc and__fdbk in the __amrc struct.
__VSAM_PUT Set when the last op was a low level VSAM PUT; if the PUT fails, sets __rc and__fdbk in the __amrc struct.
__VSAM_POINT Set when the last op was a low level VSAM POINT; if the POINT fails, sets __rcand __fdbk in the __amrc struct.
Chapter 4. Debugging C/C++ routines 167
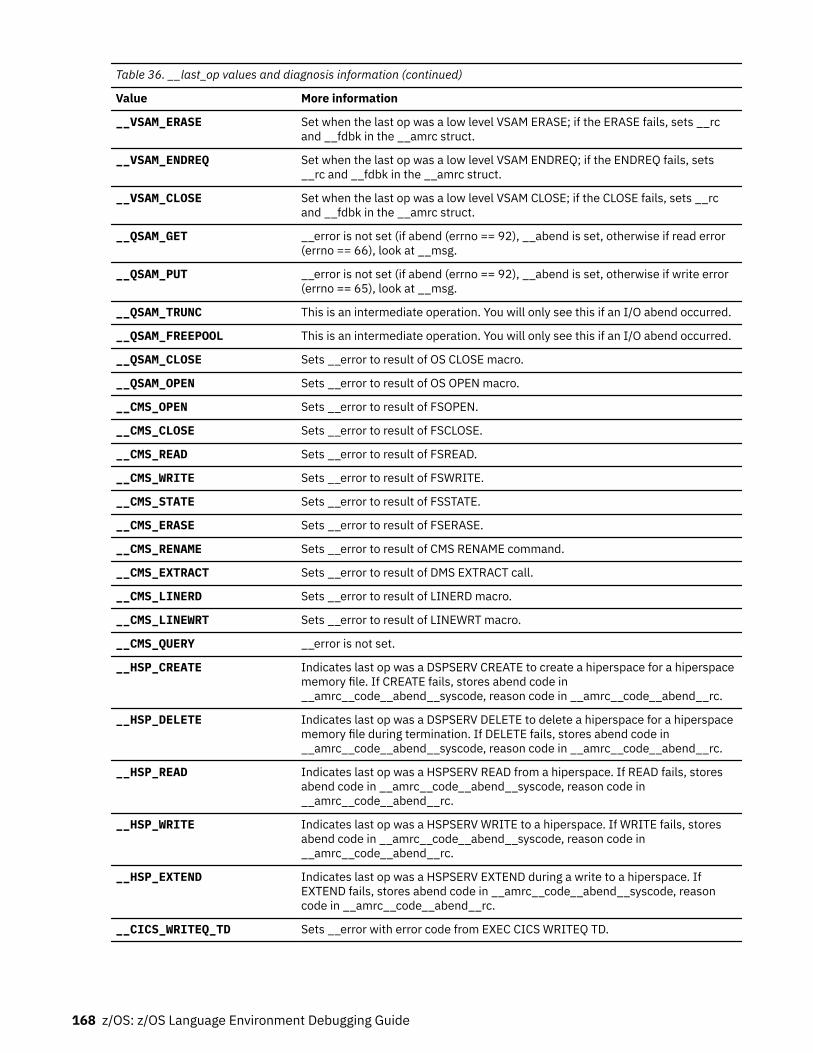
Table 36. __last_op values and diagnosis information (continued)
Value More information
__VSAM_ERASE Set when the last op was a low level VSAM ERASE; if the ERASE fails, sets __rcand __fdbk in the __amrc struct.
__VSAM_ENDREQ Set when the last op was a low level VSAM ENDREQ; if the ENDREQ fails, sets__rc and __fdbk in the __amrc struct.
__VSAM_CLOSE Set when the last op was a low level VSAM CLOSE; if the CLOSE fails, sets __rcand __fdbk in the __amrc struct.
__QSAM_GET __error is not set (if abend (errno == 92), __abend is set, otherwise if read error(errno == 66), look at __msg.
__QSAM_PUT __error is not set (if abend (errno == 92), __abend is set, otherwise if write error(errno == 65), look at __msg.
__QSAM_TRUNC This is an intermediate operation. You will only see this if an I/O abend occurred.
__QSAM_FREEPOOL This is an intermediate operation. You will only see this if an I/O abend occurred.
__QSAM_CLOSE Sets __error to result of OS CLOSE macro.
__QSAM_OPEN Sets __error to result of OS OPEN macro.
__CMS_OPEN Sets __error to result of FSOPEN.
__CMS_CLOSE Sets __error to result of FSCLOSE.
__CMS_READ Sets __error to result of FSREAD.
__CMS_WRITE Sets __error to result of FSWRITE.
__CMS_STATE Sets __error to result of FSSTATE.
__CMS_ERASE Sets __error to result of FSERASE.
__CMS_RENAME Sets __error to result of CMS RENAME command.
__CMS_EXTRACT Sets __error to result of DMS EXTRACT call.
__CMS_LINERD Sets __error to result of LINERD macro.
__CMS_LINEWRT Sets __error to result of LINEWRT macro.
__CMS_QUERY __error is not set.
__HSP_CREATE Indicates last op was a DSPSERV CREATE to create a hiperspace for a hiperspacememory file. If CREATE fails, stores abend code in__amrc__code__abend__syscode, reason code in __amrc__code__abend__rc.
__HSP_DELETE Indicates last op was a DSPSERV DELETE to delete a hiperspace for a hiperspacememory file during termination. If DELETE fails, stores abend code in__amrc__code__abend__syscode, reason code in __amrc__code__abend__rc.
__HSP_READ Indicates last op was a HSPSERV READ from a hiperspace. If READ fails, storesabend code in __amrc__code__abend__syscode, reason code in__amrc__code__abend__rc.
__HSP_WRITE Indicates last op was a HSPSERV WRITE to a hiperspace. If WRITE fails, storesabend code in __amrc__code__abend__syscode, reason code in__amrc__code__abend__rc.
__HSP_EXTEND Indicates last op was a HSPSERV EXTEND during a write to a hiperspace. IfEXTEND fails, stores abend code in __amrc__code__abend__syscode, reasoncode in __amrc__code__abend__rc.
__CICS_WRITEQ_TD Sets __error with error code from EXEC CICS WRITEQ TD.
168 z/OS: z/OS Language Environment Debugging Guide
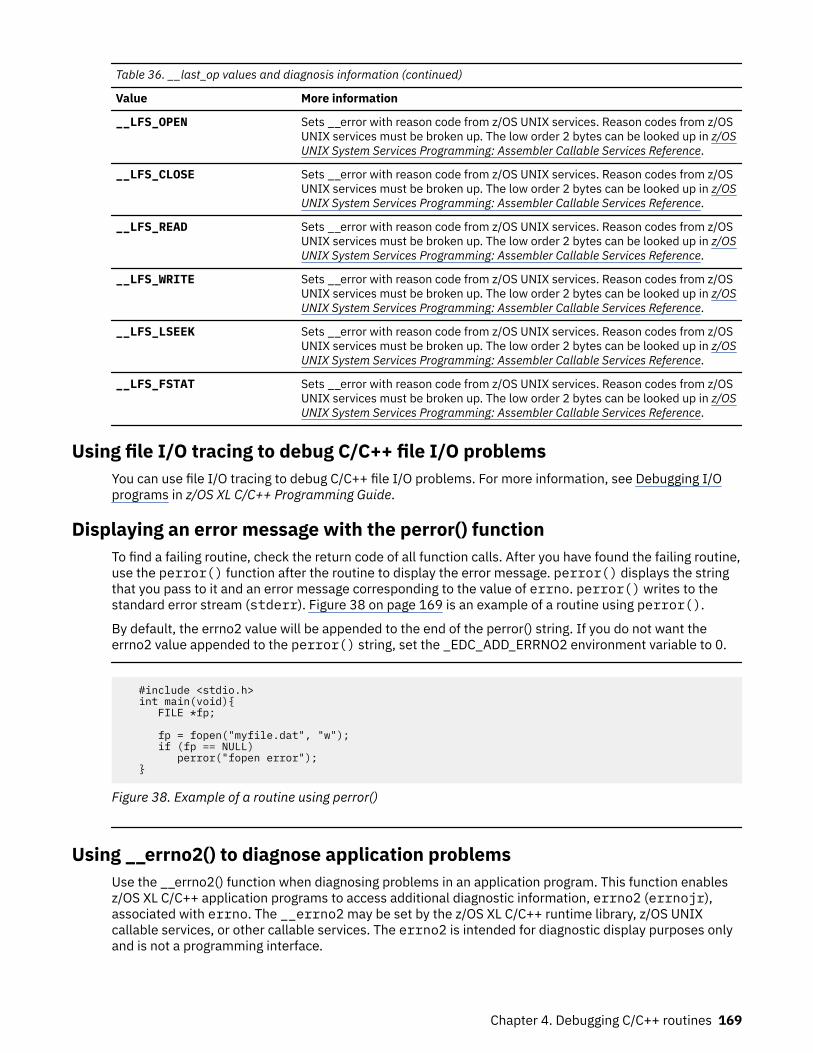
Table 36. __last_op values and diagnosis information (continued)
Value More information
__LFS_OPEN Sets __error with reason code from z/OS UNIX services. Reason codes from z/OSUNIX services must be broken up. The low order 2 bytes can be looked up in z/OSUNIX System Services Programming: Assembler Callable Services Reference.
__LFS_CLOSE Sets __error with reason code from z/OS UNIX services. Reason codes from z/OSUNIX services must be broken up. The low order 2 bytes can be looked up in z/OSUNIX System Services Programming: Assembler Callable Services Reference.
__LFS_READ Sets __error with reason code from z/OS UNIX services. Reason codes from z/OSUNIX services must be broken up. The low order 2 bytes can be looked up in z/OSUNIX System Services Programming: Assembler Callable Services Reference.
__LFS_WRITE Sets __error with reason code from z/OS UNIX services. Reason codes from z/OSUNIX services must be broken up. The low order 2 bytes can be looked up in z/OSUNIX System Services Programming: Assembler Callable Services Reference.
__LFS_LSEEK Sets __error with reason code from z/OS UNIX services. Reason codes from z/OSUNIX services must be broken up. The low order 2 bytes can be looked up in z/OSUNIX System Services Programming: Assembler Callable Services Reference.
__LFS_FSTAT Sets __error with reason code from z/OS UNIX services. Reason codes from z/OSUNIX services must be broken up. The low order 2 bytes can be looked up in z/OSUNIX System Services Programming: Assembler Callable Services Reference.
Using file I/O tracing to debug C/C++ file I/O problemsYou can use file I/O tracing to debug C/C++ file I/O problems. For more information, see Debugging I/Oprograms in z/OS XL C/C++ Programming Guide.
Displaying an error message with the perror() functionTo find a failing routine, check the return code of all function calls. After you have found the failing routine,use the perror() function after the routine to display the error message. perror() displays the stringthat you pass to it and an error message corresponding to the value of errno. perror() writes to thestandard error stream (stderr). Figure 38 on page 169 is an example of a routine using perror().
By default, the errno2 value will be appended to the end of the perror() string. If you do not want theerrno2 value appended to the perror() string, set the _EDC_ADD_ERRNO2 environment variable to 0.
#include <stdio.h> int main(void){ FILE *fp;
fp = fopen("myfile.dat", "w"); if (fp == NULL) perror("fopen error"); }
Figure 38. Example of a routine using perror()
Using __errno2() to diagnose application problemsUse the __errno2() function when diagnosing problems in an application program. This function enablesz/OS XL C/C++ application programs to access additional diagnostic information, errno2 (errnojr),associated with errno. The __errno2 may be set by the z/OS XL C/C++ runtime library, z/OS UNIXcallable services, or other callable services. The errno2 is intended for diagnostic display purposes onlyand is not a programming interface.
Chapter 4. Debugging C/C++ routines 169
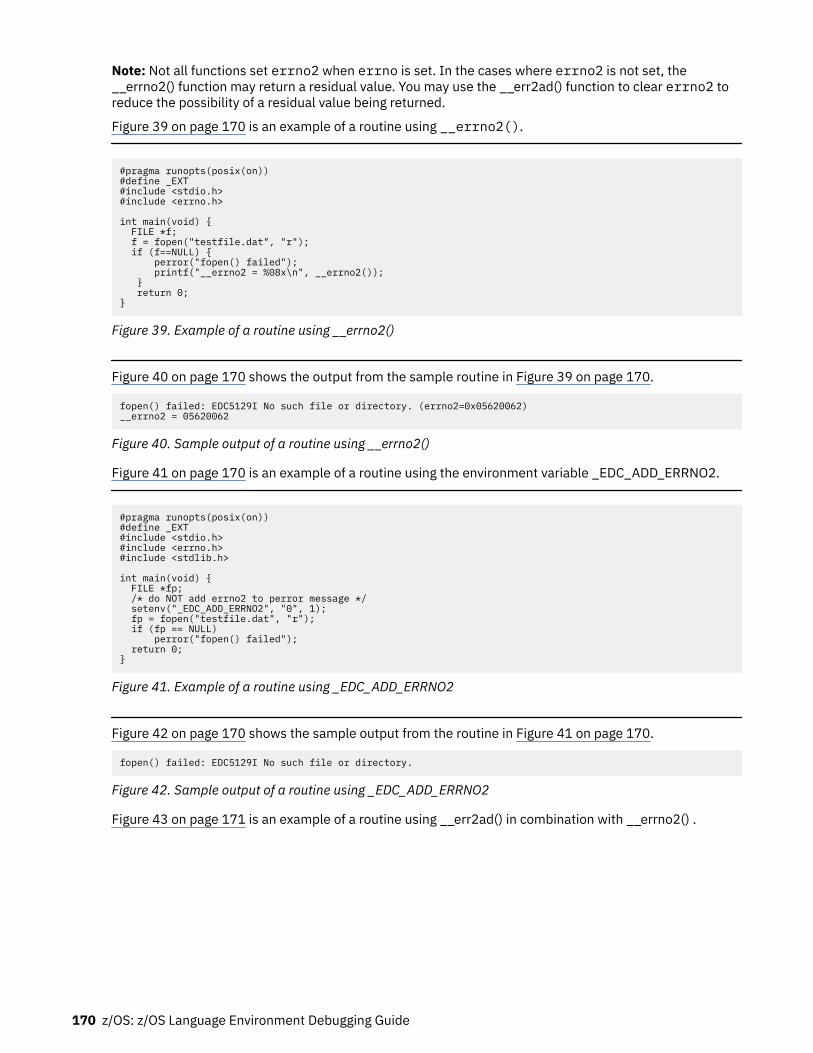
Note: Not all functions set errno2 when errno is set. In the cases where errno2 is not set, the__errno2() function may return a residual value. You may use the __err2ad() function to clear errno2 toreduce the possibility of a residual value being returned.
Figure 39 on page 170 is an example of a routine using __errno2().
#pragma runopts(posix(on))#define _EXT#include <stdio.h>#include <errno.h>
int main(void) { FILE *f; f = fopen("testfile.dat", "r"); if (f==NULL) { perror("fopen() failed"); printf("__errno2 = %08x\n", __errno2()); } return 0;}
Figure 39. Example of a routine using __errno2()
Figure 40 on page 170 shows the output from the sample routine in Figure 39 on page 170.
fopen() failed: EDC5129I No such file or directory. (errno2=0x05620062)__errno2 = 05620062
Figure 40. Sample output of a routine using __errno2()
Figure 41 on page 170 is an example of a routine using the environment variable _EDC_ADD_ERRNO2.
#pragma runopts(posix(on))#define _EXT#include <stdio.h>#include <errno.h>#include <stdlib.h>
int main(void) { FILE *fp; /* do NOT add errno2 to perror message */ setenv("_EDC_ADD_ERRNO2", "0", 1); fp = fopen("testfile.dat", "r"); if (fp == NULL) perror("fopen() failed"); return 0;}
Figure 41. Example of a routine using _EDC_ADD_ERRNO2
Figure 42 on page 170 shows the sample output from the routine in Figure 41 on page 170.
fopen() failed: EDC5129I No such file or directory.
Figure 42. Sample output of a routine using _EDC_ADD_ERRNO2
Figure 43 on page 171 is an example of a routine using __err2ad() in combination with __errno2() .
170 z/OS: z/OS Language Environment Debugging Guide
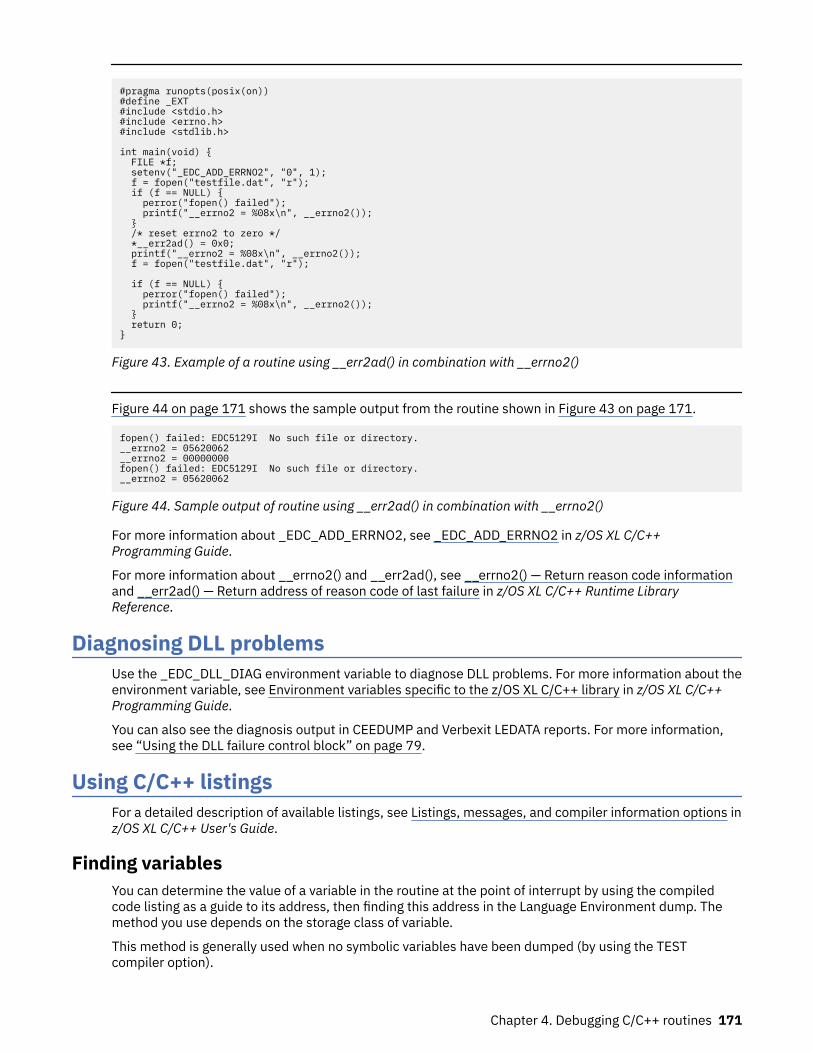
#pragma runopts(posix(on))#define _EXT#include <stdio.h>#include <errno.h>#include <stdlib.h>
int main(void) { FILE *f; setenv("_EDC_ADD_ERRNO2", "0", 1); f = fopen("testfile.dat", "r"); if (f == NULL) { perror("fopen() failed"); printf("__errno2 = %08x\n", __errno2()); } /* reset errno2 to zero */ *__err2ad() = 0x0; printf("__errno2 = %08x\n", __errno2()); f = fopen("testfile.dat", "r"); if (f == NULL) { perror("fopen() failed"); printf("__errno2 = %08x\n", __errno2()); } return 0;}
Figure 43. Example of a routine using __err2ad() in combination with __errno2()
Figure 44 on page 171 shows the sample output from the routine shown in Figure 43 on page 171.
fopen() failed: EDC5129I No such file or directory.__errno2 = 05620062__errno2 = 00000000 fopen() failed: EDC5129I No such file or directory.__errno2 = 05620062
Figure 44. Sample output of routine using __err2ad() in combination with __errno2()
For more information about _EDC_ADD_ERRNO2, see _EDC_ADD_ERRNO2 in z/OS XL C/C++Programming Guide.
For more information about __errno2() and __err2ad(), see __errno2() — Return reason code informationand __err2ad() — Return address of reason code of last failure in z/OS XL C/C++ Runtime LibraryReference.
Diagnosing DLL problemsUse the _EDC_DLL_DIAG environment variable to diagnose DLL problems. For more information about theenvironment variable, see Environment variables specific to the z/OS XL C/C++ library in z/OS XL C/C++Programming Guide.
You can also see the diagnosis output in CEEDUMP and Verbexit LEDATA reports. For more information,see “Using the DLL failure control block” on page 79.
Using C/C++ listingsFor a detailed description of available listings, see Listings, messages, and compiler information options inz/OS XL C/C++ User's Guide.
Finding variablesYou can determine the value of a variable in the routine at the point of interrupt by using the compiledcode listing as a guide to its address, then finding this address in the Language Environment dump. Themethod you use depends on the storage class of variable.
This method is generally used when no symbolic variables have been dumped (by using the TESTcompiler option).
Chapter 4. Debugging C/C++ routines 171
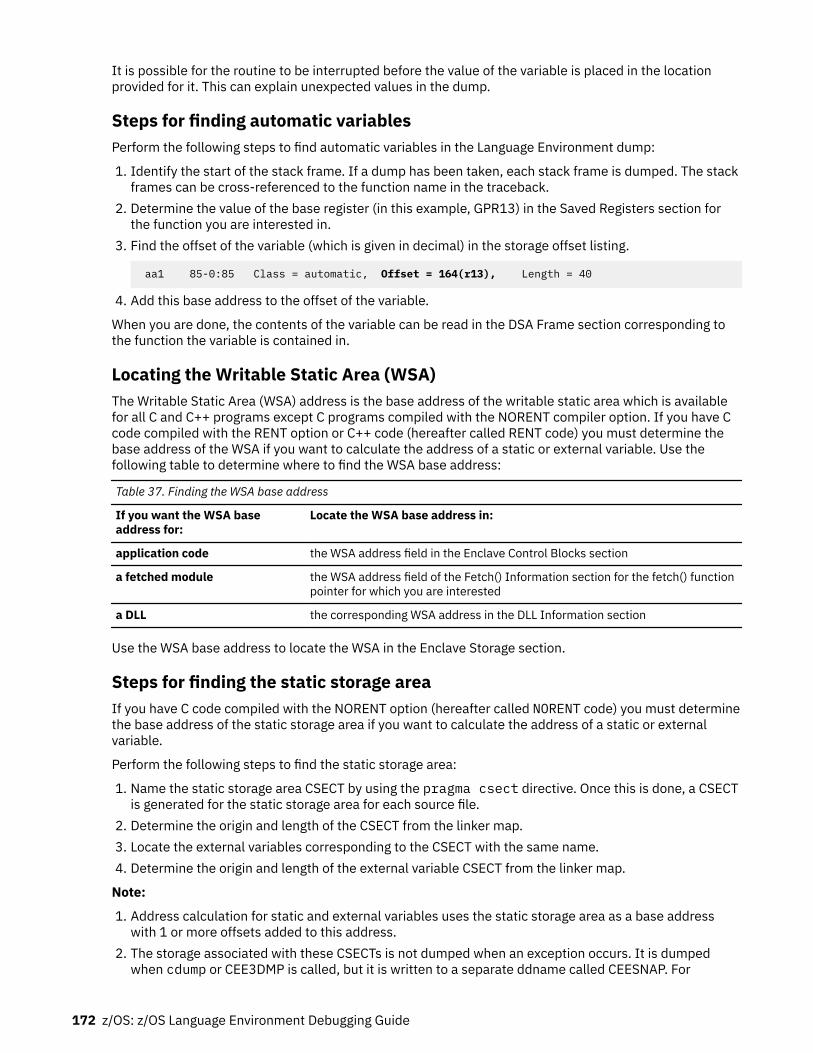
It is possible for the routine to be interrupted before the value of the variable is placed in the locationprovided for it. This can explain unexpected values in the dump.
Steps for finding automatic variablesPerform the following steps to find automatic variables in the Language Environment dump:
1. Identify the start of the stack frame. If a dump has been taken, each stack frame is dumped. The stackframes can be cross-referenced to the function name in the traceback.
2. Determine the value of the base register (in this example, GPR13) in the Saved Registers section forthe function you are interested in.
3. Find the offset of the variable (which is given in decimal) in the storage offset listing.
aa1 85-0:85 Class = automatic, Offset = 164(r13), Length = 40
4. Add this base address to the offset of the variable.
When you are done, the contents of the variable can be read in the DSA Frame section corresponding tothe function the variable is contained in.
Locating the Writable Static Area (WSA)The Writable Static Area (WSA) address is the base address of the writable static area which is availablefor all C and C++ programs except C programs compiled with the NORENT compiler option. If you have Ccode compiled with the RENT option or C++ code (hereafter called RENT code) you must determine thebase address of the WSA if you want to calculate the address of a static or external variable. Use thefollowing table to determine where to find the WSA base address:
Table 37. Finding the WSA base address
If you want the WSA baseaddress for:
Locate the WSA base address in:
application code the WSA address field in the Enclave Control Blocks section
a fetched module the WSA address field of the Fetch() Information section for the fetch() functionpointer for which you are interested
a DLL the corresponding WSA address in the DLL Information section
Use the WSA base address to locate the WSA in the Enclave Storage section.
Steps for finding the static storage areaIf you have C code compiled with the NORENT option (hereafter called NORENT code) you must determinethe base address of the static storage area if you want to calculate the address of a static or externalvariable.
Perform the following steps to find the static storage area:
1. Name the static storage area CSECT by using the pragma csect directive. Once this is done, a CSECTis generated for the static storage area for each source file.
2. Determine the origin and length of the CSECT from the linker map.3. Locate the external variables corresponding to the CSECT with the same name.4. Determine the origin and length of the external variable CSECT from the linker map.
Note:
1. Address calculation for static and external variables uses the static storage area as a base addresswith 1 or more offsets added to this address.
2. The storage associated with these CSECTs is not dumped when an exception occurs. It is dumpedwhen cdump or CEE3DMP is called, but it is written to a separate ddname called CEESNAP. For
172 z/OS: z/OS Language Environment Debugging Guide
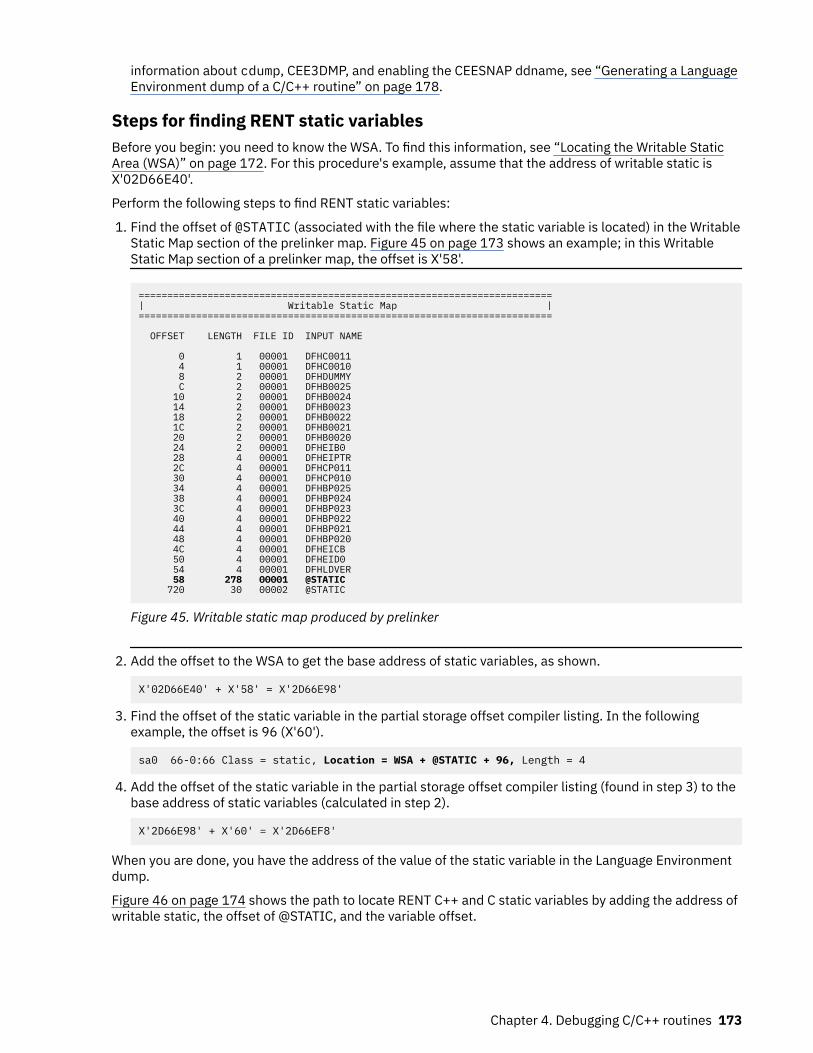
information about cdump, CEE3DMP, and enabling the CEESNAP ddname, see “Generating a LanguageEnvironment dump of a C/C++ routine” on page 178.
Steps for finding RENT static variablesBefore you begin: you need to know the WSA. To find this information, see “Locating the Writable StaticArea (WSA)” on page 172. For this procedure's example, assume that the address of writable static isX'02D66E40'.
Perform the following steps to find RENT static variables:
1. Find the offset of @STATIC (associated with the file where the static variable is located) in the WritableStatic Map section of the prelinker map. Figure 45 on page 173 shows an example; in this WritableStatic Map section of a prelinker map, the offset is X'58'.
========================================================================| Writable Static Map |========================================================================
OFFSET LENGTH FILE ID INPUT NAME
0 1 00001 DFHC0011 4 1 00001 DFHC0010 8 2 00001 DFHDUMMY C 2 00001 DFHB0025 10 2 00001 DFHB0024 14 2 00001 DFHB0023 18 2 00001 DFHB0022 1C 2 00001 DFHB0021 20 2 00001 DFHB0020 24 2 00001 DFHEIB0 28 4 00001 DFHEIPTR 2C 4 00001 DFHCP011 30 4 00001 DFHCP010 34 4 00001 DFHBP025 38 4 00001 DFHBP024 3C 4 00001 DFHBP023 40 4 00001 DFHBP022 44 4 00001 DFHBP021 48 4 00001 DFHBP020 4C 4 00001 DFHEICB 50 4 00001 DFHEID0 54 4 00001 DFHLDVER 58 278 00001 @STATIC 720 30 00002 @STATIC
Figure 45. Writable static map produced by prelinker
2. Add the offset to the WSA to get the base address of static variables, as shown.
X'02D66E40' + X'58' = X'2D66E98'
3. Find the offset of the static variable in the partial storage offset compiler listing. In the followingexample, the offset is 96 (X'60').
sa0 66-0:66 Class = static, Location = WSA + @STATIC + 96, Length = 4
4. Add the offset of the static variable in the partial storage offset compiler listing (found in step 3) to thebase address of static variables (calculated in step 2).
X'2D66E98' + X'60' = X'2D66EF8'
When you are done, you have the address of the value of the static variable in the Language Environmentdump.
Figure 46 on page 174 shows the path to locate RENT C++ and C static variables by adding the address ofwritable static, the offset of @STATIC, and the variable offset.
Chapter 4. Debugging C/C++ routines 173
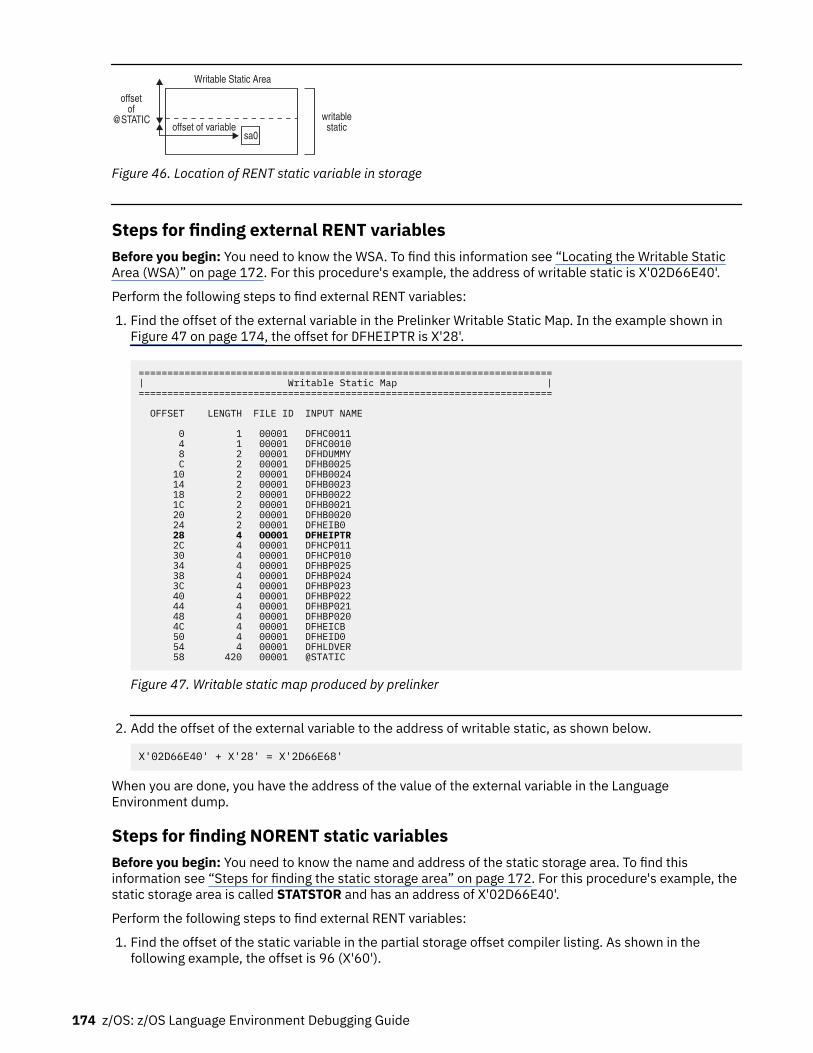
Writable Static Area
offset
of
@STATICoffset of variable
writable
staticsa0
Figure 46. Location of RENT static variable in storage
Steps for finding external RENT variablesBefore you begin: You need to know the WSA. To find this information see “Locating the Writable StaticArea (WSA)” on page 172. For this procedure's example, the address of writable static is X'02D66E40'.
Perform the following steps to find external RENT variables:
1. Find the offset of the external variable in the Prelinker Writable Static Map. In the example shown inFigure 47 on page 174, the offset for DFHEIPTR is X'28'.
========================================================================| Writable Static Map |========================================================================
OFFSET LENGTH FILE ID INPUT NAME
0 1 00001 DFHC0011 4 1 00001 DFHC0010 8 2 00001 DFHDUMMY C 2 00001 DFHB0025 10 2 00001 DFHB0024 14 2 00001 DFHB0023 18 2 00001 DFHB0022 1C 2 00001 DFHB0021 20 2 00001 DFHB0020 24 2 00001 DFHEIB0 28 4 00001 DFHEIPTR 2C 4 00001 DFHCP011 30 4 00001 DFHCP010 34 4 00001 DFHBP025 38 4 00001 DFHBP024 3C 4 00001 DFHBP023 40 4 00001 DFHBP022 44 4 00001 DFHBP021 48 4 00001 DFHBP020 4C 4 00001 DFHEICB 50 4 00001 DFHEID0 54 4 00001 DFHLDVER 58 420 00001 @STATIC
Figure 47. Writable static map produced by prelinker
2. Add the offset of the external variable to the address of writable static, as shown below.
X'02D66E40' + X'28' = X'2D66E68'
When you are done, you have the address of the value of the external variable in the LanguageEnvironment dump.
Steps for finding NORENT static variablesBefore you begin: You need to know the name and address of the static storage area. To find thisinformation see “Steps for finding the static storage area” on page 172. For this procedure's example, thestatic storage area is called STATSTOR and has an address of X'02D66E40'.
Perform the following steps to find external RENT variables:
1. Find the offset of the static variable in the partial storage offset compiler listing. As shown in thefollowing example, the offset is 96 (X'60').
174 z/OS: z/OS Language Environment Debugging Guide
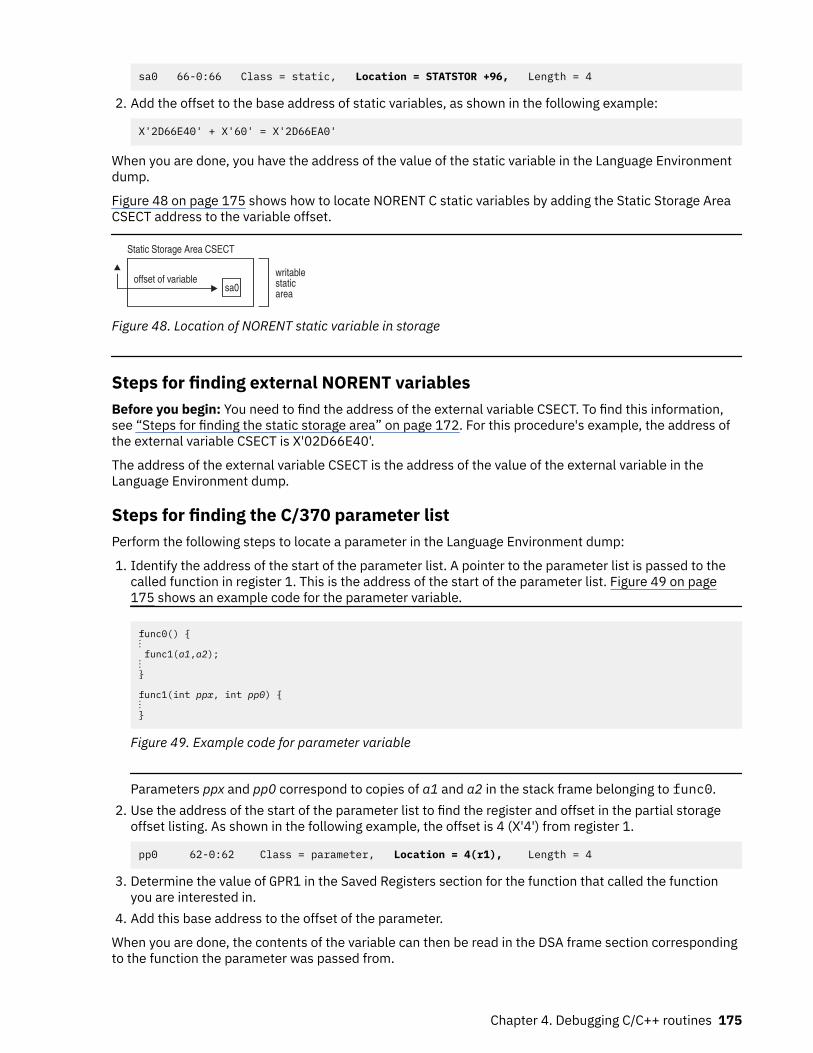
sa0 66-0:66 Class = static, Location = STATSTOR +96, Length = 4
2. Add the offset to the base address of static variables, as shown in the following example:
X'2D66E40' + X'60' = X'2D66EA0'
When you are done, you have the address of the value of the static variable in the Language Environmentdump.
Figure 48 on page 175 shows how to locate NORENT C static variables by adding the Static Storage AreaCSECT address to the variable offset.
Static Storage Area CSECT
offset of variablewritablestaticarea
sa0
Figure 48. Location of NORENT static variable in storage
Steps for finding external NORENT variablesBefore you begin: You need to find the address of the external variable CSECT. To find this information,see “Steps for finding the static storage area” on page 172. For this procedure's example, the address ofthe external variable CSECT is X'02D66E40'.
The address of the external variable CSECT is the address of the value of the external variable in theLanguage Environment dump.
Steps for finding the C/370 parameter listPerform the following steps to locate a parameter in the Language Environment dump:
1. Identify the address of the start of the parameter list. A pointer to the parameter list is passed to thecalled function in register 1. This is the address of the start of the parameter list. Figure 49 on page175 shows an example code for the parameter variable.
func0() {⋮ func1(a1,a2);⋮}
func1(int ppx, int pp0) {⋮}
Figure 49. Example code for parameter variable
Parameters ppx and pp0 correspond to copies of a1 and a2 in the stack frame belonging to func0.2. Use the address of the start of the parameter list to find the register and offset in the partial storage
offset listing. As shown in the following example, the offset is 4 (X'4') from register 1.
pp0 62-0:62 Class = parameter, Location = 4(r1), Length = 4
3. Determine the value of GPR1 in the Saved Registers section for the function that called the functionyou are interested in.
4. Add this base address to the offset of the parameter.
When you are done, the contents of the variable can then be read in the DSA frame section correspondingto the function the parameter was passed from.
Chapter 4. Debugging C/C++ routines 175
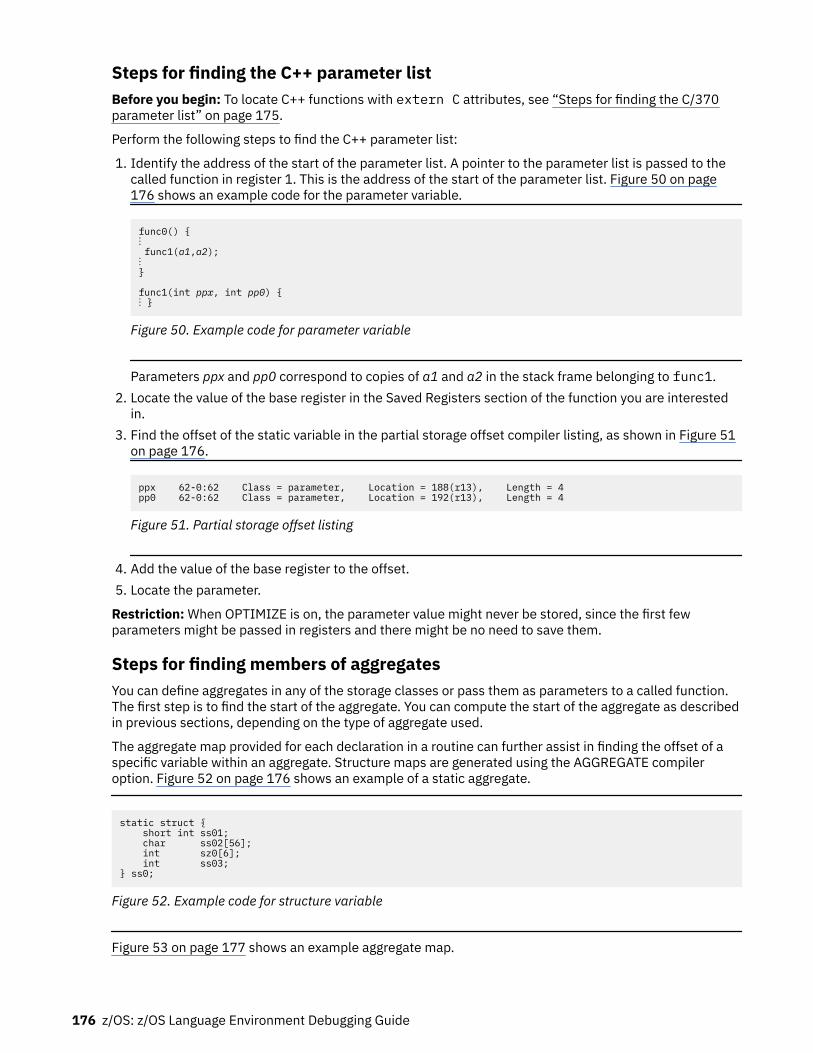
Steps for finding the C++ parameter listBefore you begin: To locate C++ functions with extern C attributes, see “Steps for finding the C/370parameter list” on page 175.
Perform the following steps to find the C++ parameter list:
1. Identify the address of the start of the parameter list. A pointer to the parameter list is passed to thecalled function in register 1. This is the address of the start of the parameter list. Figure 50 on page176 shows an example code for the parameter variable.
func0() {⋮ func1(a1,a2);⋮}
func1(int ppx, int pp0) {⋮ }
Figure 50. Example code for parameter variable
Parameters ppx and pp0 correspond to copies of a1 and a2 in the stack frame belonging to func1.2. Locate the value of the base register in the Saved Registers section of the function you are interested
in.3. Find the offset of the static variable in the partial storage offset compiler listing, as shown in Figure 51
on page 176.
ppx 62-0:62 Class = parameter, Location = 188(r13), Length = 4pp0 62-0:62 Class = parameter, Location = 192(r13), Length = 4
Figure 51. Partial storage offset listing
4. Add the value of the base register to the offset.5. Locate the parameter.
Restriction: When OPTIMIZE is on, the parameter value might never be stored, since the first fewparameters might be passed in registers and there might be no need to save them.
Steps for finding members of aggregatesYou can define aggregates in any of the storage classes or pass them as parameters to a called function.The first step is to find the start of the aggregate. You can compute the start of the aggregate as describedin previous sections, depending on the type of aggregate used.
The aggregate map provided for each declaration in a routine can further assist in finding the offset of aspecific variable within an aggregate. Structure maps are generated using the AGGREGATE compileroption. Figure 52 on page 176 shows an example of a static aggregate.
static struct { short int ss01; char ss02[56]; int sz0[6]; int ss03;} ss0;
Figure 52. Example code for structure variable
Figure 53 on page 177 shows an example aggregate map.
176 z/OS: z/OS Language Environment Debugging Guide
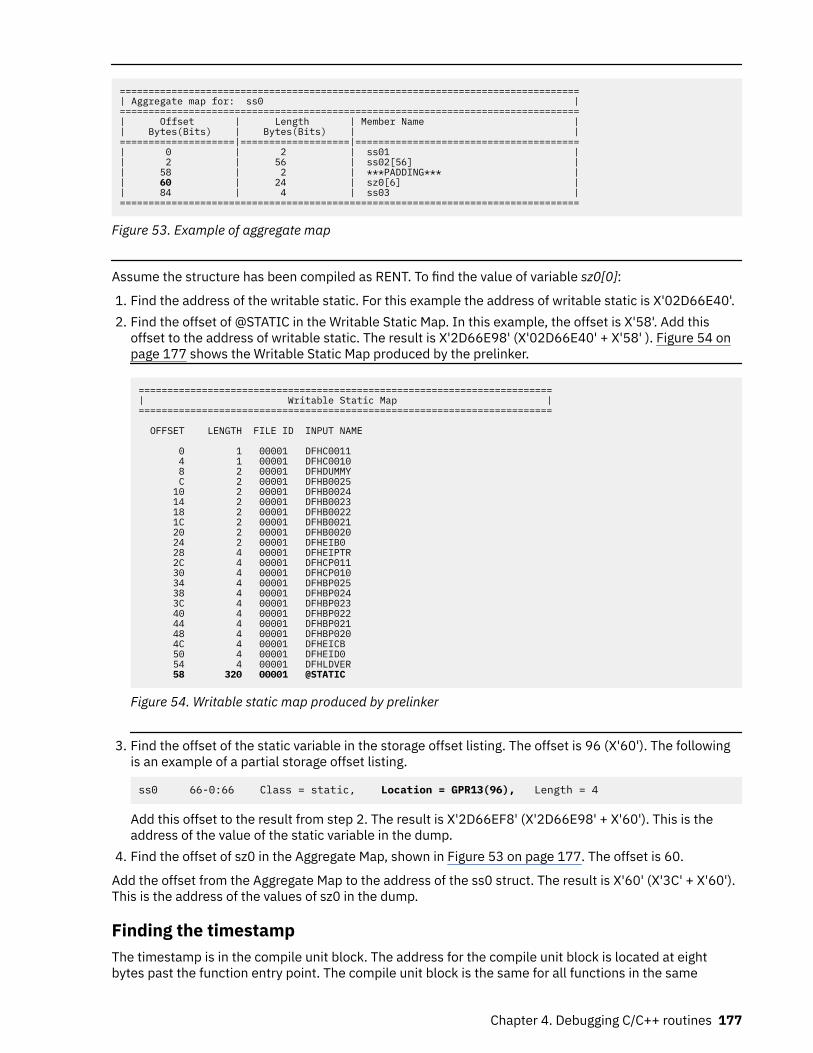
================================================================================| Aggregate map for: ss0 |================================================================================| Offset | Length | Member Name || Bytes(Bits) | Bytes(Bits) | |====================|===================|=======================================| 0 | 2 | ss01 || 2 | 56 | ss02[56] || 58 | 2 | ***PADDING*** || 60 | 24 | sz0[6] || 84 | 4 | ss03 |================================================================================
Figure 53. Example of aggregate map
Assume the structure has been compiled as RENT. To find the value of variable sz0[0]:
1. Find the address of the writable static. For this example the address of writable static is X'02D66E40'.2. Find the offset of @STATIC in the Writable Static Map. In this example, the offset is X'58'. Add this
offset to the address of writable static. The result is X'2D66E98' (X'02D66E40' + X'58' ). Figure 54 onpage 177 shows the Writable Static Map produced by the prelinker.
========================================================================| Writable Static Map |========================================================================
OFFSET LENGTH FILE ID INPUT NAME
0 1 00001 DFHC0011 4 1 00001 DFHC0010 8 2 00001 DFHDUMMY C 2 00001 DFHB0025 10 2 00001 DFHB0024 14 2 00001 DFHB0023 18 2 00001 DFHB0022 1C 2 00001 DFHB0021 20 2 00001 DFHB0020 24 2 00001 DFHEIB0 28 4 00001 DFHEIPTR 2C 4 00001 DFHCP011 30 4 00001 DFHCP010 34 4 00001 DFHBP025 38 4 00001 DFHBP024 3C 4 00001 DFHBP023 40 4 00001 DFHBP022 44 4 00001 DFHBP021 48 4 00001 DFHBP020 4C 4 00001 DFHEICB 50 4 00001 DFHEID0 54 4 00001 DFHLDVER 58 320 00001 @STATIC
Figure 54. Writable static map produced by prelinker
3. Find the offset of the static variable in the storage offset listing. The offset is 96 (X'60'). The followingis an example of a partial storage offset listing.
ss0 66-0:66 Class = static, Location = GPR13(96), Length = 4
Add this offset to the result from step 2. The result is X'2D66EF8' (X'2D66E98' + X'60'). This is theaddress of the value of the static variable in the dump.
4. Find the offset of sz0 in the Aggregate Map, shown in Figure 53 on page 177. The offset is 60.
Add the offset from the Aggregate Map to the address of the ss0 struct. The result is X'60' (X'3C' + X'60').This is the address of the values of sz0 in the dump.
Finding the timestampThe timestamp is in the compile unit block. The address for the compile unit block is located at eightbytes past the function entry point. The compile unit block is the same for all functions in the same
Chapter 4. Debugging C/C++ routines 177
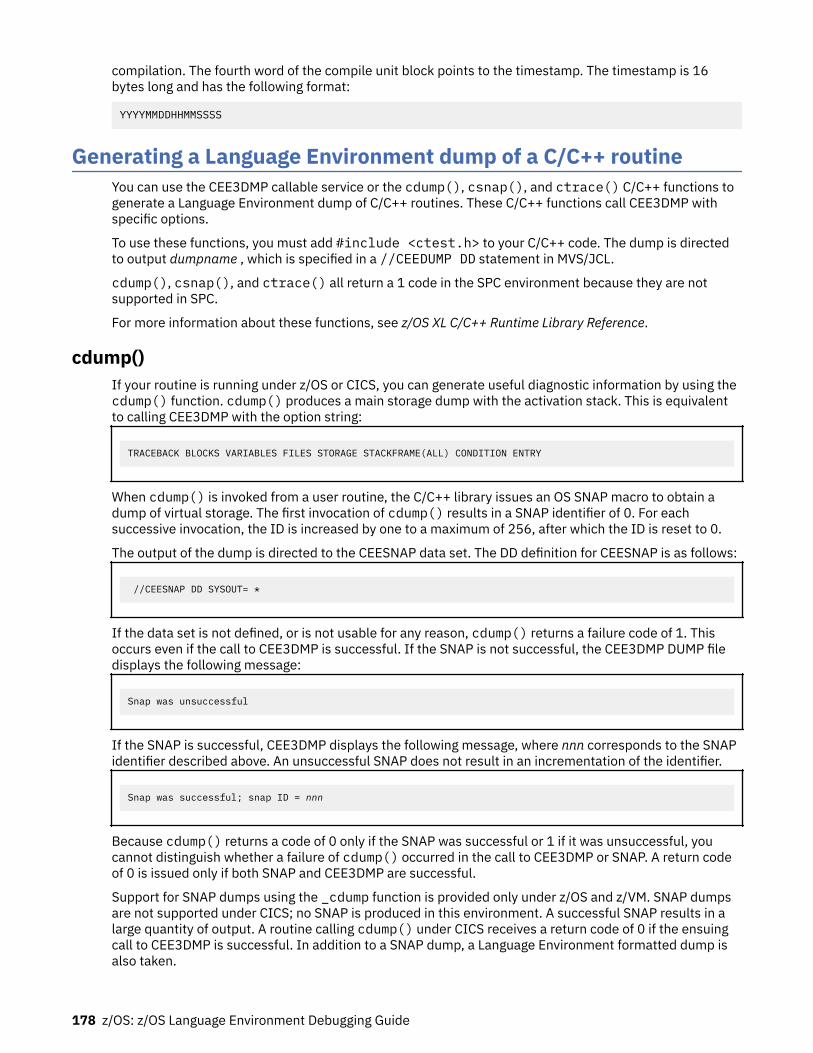
compilation. The fourth word of the compile unit block points to the timestamp. The timestamp is 16bytes long and has the following format:
YYYYMMDDHHMMSSSS
Generating a Language Environment dump of a C/C++ routineYou can use the CEE3DMP callable service or the cdump(), csnap(), and ctrace() C/C++ functions togenerate a Language Environment dump of C/C++ routines. These C/C++ functions call CEE3DMP withspecific options.
To use these functions, you must add #include <ctest.h> to your C/C++ code. The dump is directedto output dumpname , which is specified in a //CEEDUMP DD statement in MVS/JCL.
cdump(), csnap(), and ctrace() all return a 1 code in the SPC environment because they are notsupported in SPC.
For more information about these functions, see z/OS XL C/C++ Runtime Library Reference.
cdump()If your routine is running under z/OS or CICS, you can generate useful diagnostic information by using thecdump() function. cdump() produces a main storage dump with the activation stack. This is equivalentto calling CEE3DMP with the option string:
TRACEBACK BLOCKS VARIABLES FILES STORAGE STACKFRAME(ALL) CONDITION ENTRY
When cdump() is invoked from a user routine, the C/C++ library issues an OS SNAP macro to obtain adump of virtual storage. The first invocation of cdump() results in a SNAP identifier of 0. For eachsuccessive invocation, the ID is increased by one to a maximum of 256, after which the ID is reset to 0.
The output of the dump is directed to the CEESNAP data set. The DD definition for CEESNAP is as follows:
//CEESNAP DD SYSOUT= *
If the data set is not defined, or is not usable for any reason, cdump() returns a failure code of 1. Thisoccurs even if the call to CEE3DMP is successful. If the SNAP is not successful, the CEE3DMP DUMP filedisplays the following message:
Snap was unsuccessful
If the SNAP is successful, CEE3DMP displays the following message, where nnn corresponds to the SNAPidentifier described above. An unsuccessful SNAP does not result in an incrementation of the identifier.
Snap was successful; snap ID = nnn
Because cdump() returns a code of 0 only if the SNAP was successful or 1 if it was unsuccessful, youcannot distinguish whether a failure of cdump() occurred in the call to CEE3DMP or SNAP. A return codeof 0 is issued only if both SNAP and CEE3DMP are successful.
Support for SNAP dumps using the _cdump function is provided only under z/OS and z/VM. SNAP dumpsare not supported under CICS; no SNAP is produced in this environment. A successful SNAP results in alarge quantity of output. A routine calling cdump() under CICS receives a return code of 0 if the ensuingcall to CEE3DMP is successful. In addition to a SNAP dump, a Language Environment formatted dump isalso taken.
178 z/OS: z/OS Language Environment Debugging Guide
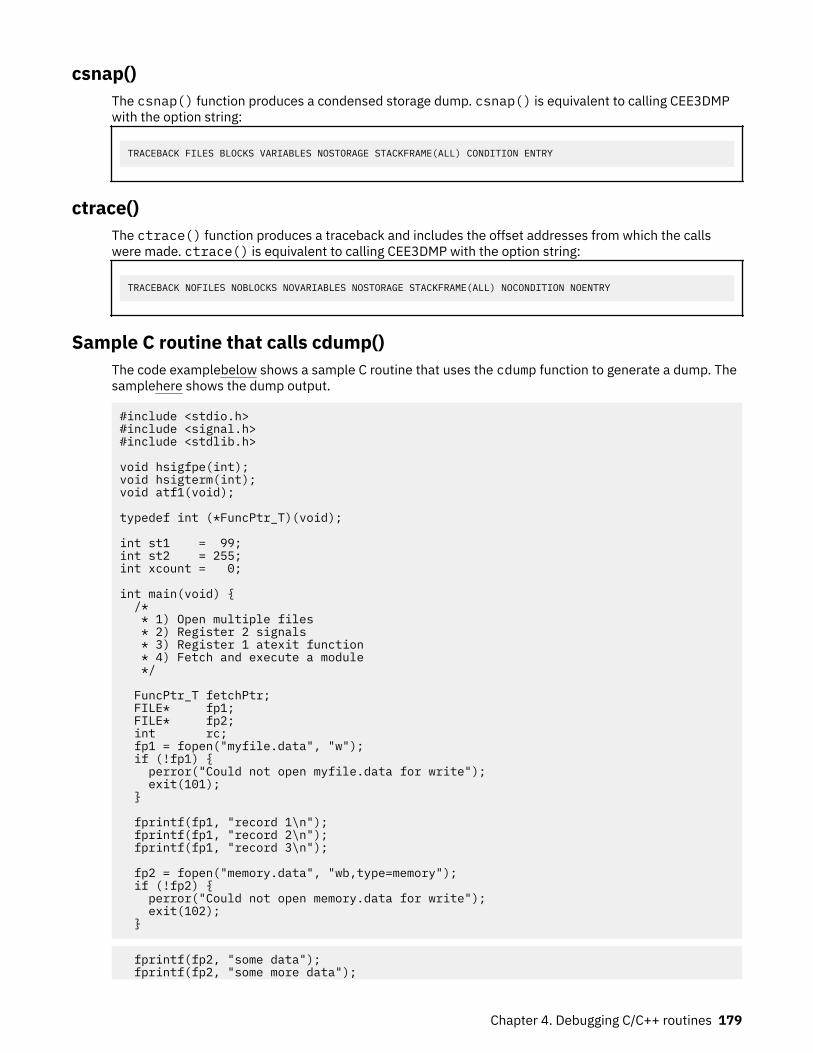
csnap()The csnap() function produces a condensed storage dump. csnap() is equivalent to calling CEE3DMPwith the option string:
TRACEBACK FILES BLOCKS VARIABLES NOSTORAGE STACKFRAME(ALL) CONDITION ENTRY
ctrace()The ctrace() function produces a traceback and includes the offset addresses from which the callswere made. ctrace() is equivalent to calling CEE3DMP with the option string:
TRACEBACK NOFILES NOBLOCKS NOVARIABLES NOSTORAGE STACKFRAME(ALL) NOCONDITION NOENTRY
Sample C routine that calls cdump()The code examplebelow shows a sample C routine that uses the cdump function to generate a dump. Thesamplehere shows the dump output.
#include <stdio.h>#include <signal.h>#include <stdlib.h>
void hsigfpe(int);void hsigterm(int);void atf1(void);
typedef int (*FuncPtr_T)(void);
int st1 = 99;int st2 = 255;int xcount = 0;
int main(void) { /* * 1) Open multiple files * 2) Register 2 signals * 3) Register 1 atexit function * 4) Fetch and execute a module */
FuncPtr_T fetchPtr; FILE* fp1; FILE* fp2; int rc; fp1 = fopen("myfile.data", "w"); if (!fp1) { perror("Could not open myfile.data for write"); exit(101); }
fprintf(fp1, "record 1\n"); fprintf(fp1, "record 2\n"); fprintf(fp1, "record 3\n");
fp2 = fopen("memory.data", "wb,type=memory"); if (!fp2) { perror("Could not open memory.data for write"); exit(102); }
fprintf(fp2, "some data"); fprintf(fp2, "some more data");
Chapter 4. Debugging C/C++ routines 179
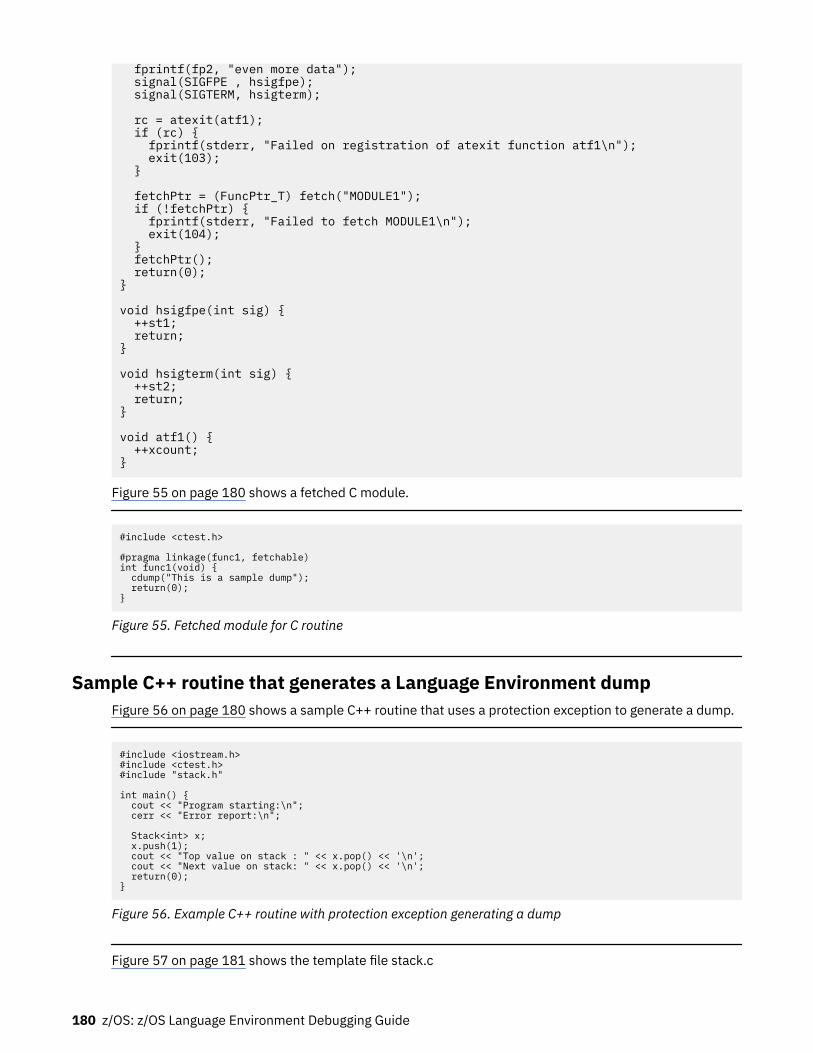
fprintf(fp2, "even more data"); signal(SIGFPE , hsigfpe); signal(SIGTERM, hsigterm);
rc = atexit(atf1); if (rc) { fprintf(stderr, "Failed on registration of atexit function atf1\n"); exit(103); }
fetchPtr = (FuncPtr_T) fetch("MODULE1"); if (!fetchPtr) { fprintf(stderr, "Failed to fetch MODULE1\n"); exit(104); } fetchPtr(); return(0);}
void hsigfpe(int sig) { ++st1; return;}
void hsigterm(int sig) { ++st2; return;}
void atf1() { ++xcount;}
Figure 55 on page 180 shows a fetched C module.
#include <ctest.h>
#pragma linkage(func1, fetchable)int func1(void) { cdump("This is a sample dump"); return(0);}
Figure 55. Fetched module for C routine
Sample C++ routine that generates a Language Environment dumpFigure 56 on page 180 shows a sample C++ routine that uses a protection exception to generate a dump.
#include <iostream.h>#include <ctest.h>#include "stack.h"
int main() { cout << "Program starting:\n"; cerr << "Error report:\n";
Stack<int> x; x.push(1); cout << "Top value on stack : " << x.pop() << '\n'; cout << "Next value on stack: " << x.pop() << '\n'; return(0);}
Figure 56. Example C++ routine with protection exception generating a dump
Figure 57 on page 181 shows the template file stack.c
180 z/OS: z/OS Language Environment Debugging Guide
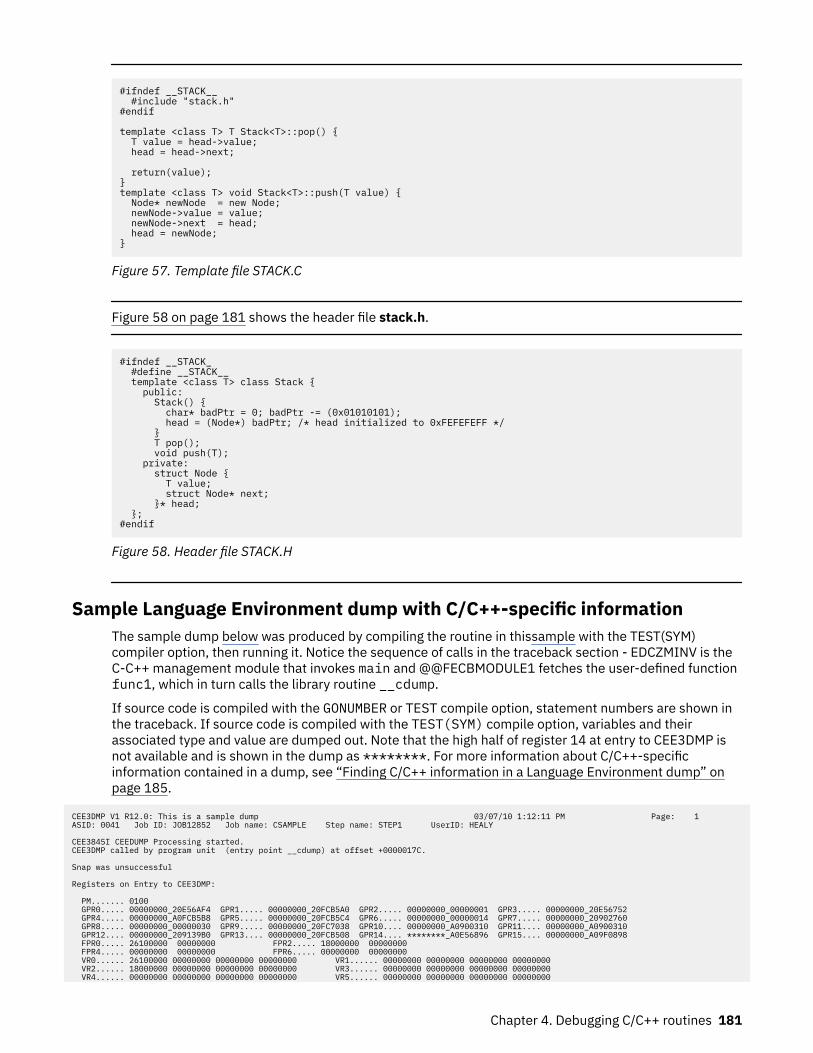
#ifndef __STACK__ #include "stack.h"#endif
template <class T> T Stack<T>::pop() { T value = head->value; head = head->next;
return(value);}template <class T> void Stack<T>::push(T value) { Node* newNode = new Node; newNode->value = value; newNode->next = head; head = newNode;}
Figure 57. Template file STACK.C
Figure 58 on page 181 shows the header file stack.h.
#ifndef __STACK_ #define __STACK__ template <class T> class Stack { public: Stack() { char* badPtr = 0; badPtr -= (0x01010101); head = (Node*) badPtr; /* head initialized to 0xFEFEFEFF */ } T pop(); void push(T); private: struct Node { T value; struct Node* next; }* head; };#endif
Figure 58. Header file STACK.H
Sample Language Environment dump with C/C++-specific informationThe sample dump below was produced by compiling the routine in thissample with the TEST(SYM)compiler option, then running it. Notice the sequence of calls in the traceback section - EDCZMINV is theC-C++ management module that invokes main and @@FECBMODULE1 fetches the user-defined functionfunc1, which in turn calls the library routine __cdump.
If source code is compiled with the GONUMBER or TEST compile option, statement numbers are shown inthe traceback. If source code is compiled with the TEST(SYM) compile option, variables and theirassociated type and value are dumped out. Note that the high half of register 14 at entry to CEE3DMP isnot available and is shown in the dump as ********. For more information about C/C++-specificinformation contained in a dump, see “Finding C/C++ information in a Language Environment dump” onpage 185.
CEE3DMP V1 R12.0: This is a sample dump 03/07/10 1:12:11 PM Page: 1 ASID: 0041 Job ID: JOB12852 Job name: CSAMPLE Step name: STEP1 UserID: HEALY CEE3845I CEEDUMP Processing started. CEE3DMP called by program unit (entry point __cdump) at offset +0000017C. Snap was unsuccessful Registers on Entry to CEE3DMP: PM....... 0100 GPR0..... 00000000_20E56AF4 GPR1..... 00000000_20FCB5A0 GPR2..... 00000000_00000001 GPR3..... 00000000_20E56752 GPR4..... 00000000_A0FCB5B8 GPR5..... 00000000_20FCB5C4 GPR6..... 00000000_00000014 GPR7..... 00000000_20902760 GPR8..... 00000000_00000030 GPR9..... 00000000_20FC7038 GPR10.... 00000000_A0900310 GPR11.... 00000000_A0900310 GPR12.... 00000000_209139B0 GPR13.... 00000000_20FCB508 GPR14.... ********_A0E56896 GPR15.... 00000000_A09F0898 FPR0..... 26100000 00000000 FPR2..... 18000000 00000000 FPR4..... 00000000 00000000 FPR6..... 00000000 00000000 VR0...... 26100000 00000000 00000000 00000000 VR1...... 00000000 00000000 00000000 00000000 VR2...... 18000000 00000000 00000000 00000000 VR3...... 00000000 00000000 00000000 00000000 VR4...... 00000000 00000000 00000000 00000000 VR5...... 00000000 00000000 00000000 00000000
Chapter 4. Debugging C/C++ routines 181
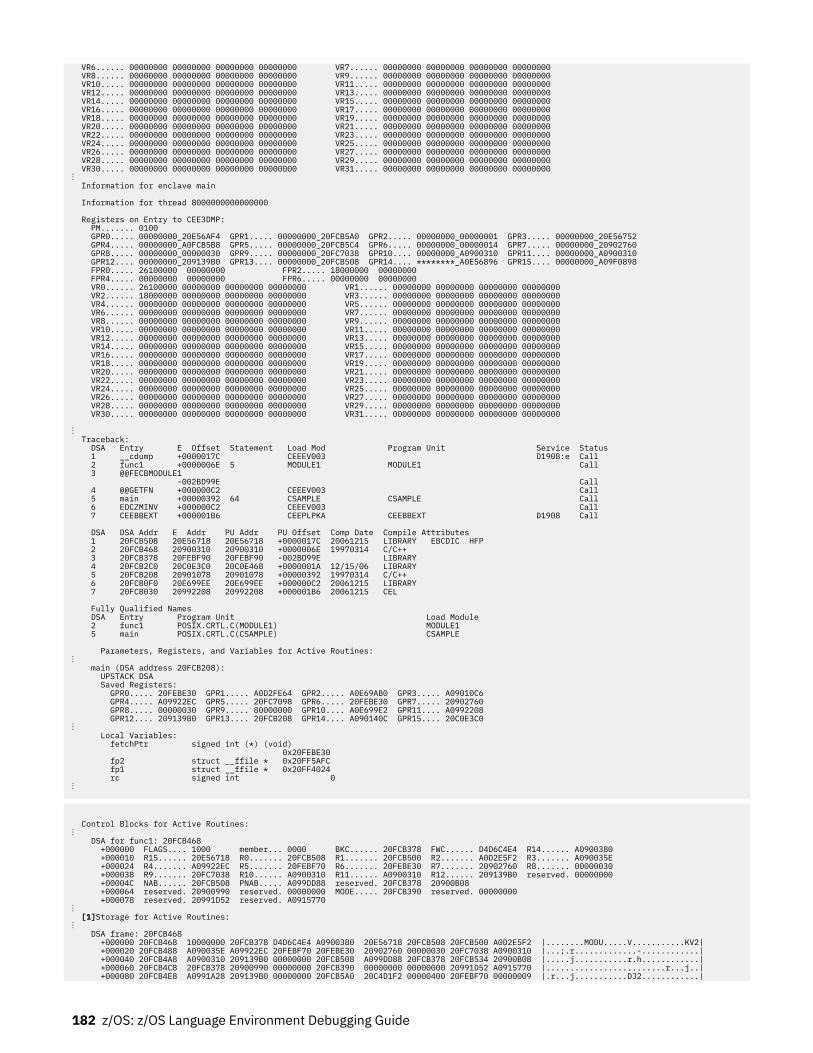
VR6...... 00000000 00000000 00000000 00000000 VR7...... 00000000 00000000 00000000 00000000 VR8...... 00000000 00000000 00000000 00000000 VR9...... 00000000 00000000 00000000 00000000 VR10..... 00000000 00000000 00000000 00000000 VR11..... 00000000 00000000 00000000 00000000 VR12..... 00000000 00000000 00000000 00000000 VR13..... 00000000 00000000 00000000 00000000 VR14..... 00000000 00000000 00000000 00000000 VR15..... 00000000 00000000 00000000 00000000 VR16..... 00000000 00000000 00000000 00000000 VR17..... 00000000 00000000 00000000 00000000 VR18..... 00000000 00000000 00000000 00000000 VR19..... 00000000 00000000 00000000 00000000 VR20..... 00000000 00000000 00000000 00000000 VR21..... 00000000 00000000 00000000 00000000 VR22..... 00000000 00000000 00000000 00000000 VR23..... 00000000 00000000 00000000 00000000 VR24..... 00000000 00000000 00000000 00000000 VR25..... 00000000 00000000 00000000 00000000 VR26..... 00000000 00000000 00000000 00000000 VR27..... 00000000 00000000 00000000 00000000 VR28..... 00000000 00000000 00000000 00000000 VR29..... 00000000 00000000 00000000 00000000 VR30..... 00000000 00000000 00000000 00000000 VR31..... 00000000 00000000 00000000 00000000⋮ Information for enclave main Information for thread 8000000000000000 Registers on Entry to CEE3DMP: PM....... 0100 GPR0..... 00000000_20E56AF4 GPR1..... 00000000_20FCB5A0 GPR2..... 00000000_00000001 GPR3..... 00000000_20E56752 GPR4..... 00000000_A0FCB5B8 GPR5..... 00000000_20FCB5C4 GPR6..... 00000000_00000014 GPR7..... 00000000_20902760 GPR8..... 00000000_00000030 GPR9..... 00000000_20FC7038 GPR10.... 00000000_A0900310 GPR11.... 00000000_A0900310 GPR12.... 00000000_209139B0 GPR13.... 00000000_20FCB508 GPR14.... ********_A0E56896 GPR15.... 00000000_A09F0898 FPR0..... 26100000 00000000 FPR2..... 18000000 00000000 FPR4..... 00000000 00000000 FPR6..... 00000000 00000000 VR0...... 26100000 00000000 00000000 00000000 VR1...... 00000000 00000000 00000000 00000000 VR2...... 18000000 00000000 00000000 00000000 VR3...... 00000000 00000000 00000000 00000000 VR4...... 00000000 00000000 00000000 00000000 VR5...... 00000000 00000000 00000000 00000000 VR6...... 00000000 00000000 00000000 00000000 VR7...... 00000000 00000000 00000000 00000000 VR8...... 00000000 00000000 00000000 00000000 VR9...... 00000000 00000000 00000000 00000000 VR10..... 00000000 00000000 00000000 00000000 VR11..... 00000000 00000000 00000000 00000000 VR12..... 00000000 00000000 00000000 00000000 VR13..... 00000000 00000000 00000000 00000000 VR14..... 00000000 00000000 00000000 00000000 VR15..... 00000000 00000000 00000000 00000000 VR16..... 00000000 00000000 00000000 00000000 VR17..... 00000000 00000000 00000000 00000000 VR18..... 00000000 00000000 00000000 00000000 VR19..... 00000000 00000000 00000000 00000000 VR20..... 00000000 00000000 00000000 00000000 VR21..... 00000000 00000000 00000000 00000000 VR22..... 00000000 00000000 00000000 00000000 VR23..... 00000000 00000000 00000000 00000000 VR24..... 00000000 00000000 00000000 00000000 VR25..... 00000000 00000000 00000000 00000000 VR26..... 00000000 00000000 00000000 00000000 VR27..... 00000000 00000000 00000000 00000000 VR28..... 00000000 00000000 00000000 00000000 VR29..... 00000000 00000000 00000000 00000000 VR30..... 00000000 00000000 00000000 00000000 VR31..... 00000000 00000000 00000000 00000000
⋮ Traceback: DSA Entry E Offset Statement Load Mod Program Unit Service Status 1 __cdump +0000017C CEEEV003 D1908:e Call 2 func1 +0000006E 5 MODULE1 MODULE1 Call 3 @@FECBMODULE1 -002BD99E Call 4 @@GETFN +000000C2 CEEEV003 Call 5 main +00000392 64 CSAMPLE CSAMPLE Call 6 EDCZMINV +000000C2 CEEEV003 Call 7 CEEBBEXT +000001B6 CEEPLPKA CEEBBEXT D1908 Call DSA DSA Addr E Addr PU Addr PU Offset Comp Date Compile Attributes 1 20FCB508 20E56718 20E56718 +0000017C 20061215 LIBRARY EBCDIC HFP 2 20FCB468 20900310 20900310 +0000006E 19970314 C/C++ 3 20FCB378 20FEBF90 20FEBF90 -002BD99E LIBRARY 4 20FCB2C0 20C0E3C0 20C0E468 +0000001A 12/15/06 LIBRARY 5 20FCB208 20901078 20901078 +00000392 19970314 C/C++ 6 20FCB0F0 20E699EE 20E699EE +000000C2 20061215 LIBRARY 7 20FCB030 20992208 20992208 +000001B6 20061215 CEL Fully Qualified Names DSA Entry Program Unit Load Module 2 func1 POSIX.CRTL.C(MODULE1) MODULE1 5 main POSIX.CRTL.C(CSAMPLE) CSAMPLE Parameters, Registers, and Variables for Active Routines: ⋮ main (DSA address 20FCB208): UPSTACK DSA Saved Registers: GPR0..... 20FEBE30 GPR1..... A0D2FE64 GPR2..... A0E69AB0 GPR3..... A09010C6 GPR4..... A09922EC GPR5..... 20FC7098 GPR6..... 20FEBE30 GPR7..... 20902760 GPR8..... 00000030 GPR9..... 80000000 GPR10.... A0E699E2 GPR11.... A0992208 GPR12.... 209139B0 GPR13.... 20FCB208 GPR14.... A090140C GPR15.... 20C0E3C0 ⋮ Local Variables: fetchPtr signed int (*) (void) 0x20FEBE30 fp2 struct __ffile * 0x20FF5AFC fp1 struct __ffile * 0x20FF4024 rc signed int 0 ⋮
Control Blocks for Active Routines: ⋮ DSA for func1: 20FCB468 +000000 FLAGS.... 1000 member... 0000 BKC...... 20FCB378 FWC...... D4D6C4E4 R14...... A0900380 +000010 R15...... 20E56718 R0....... 20FCB508 R1....... 20FCB500 R2....... A0D2E5F2 R3....... A090035E +000024 R4....... A09922EC R5....... 20FEBF70 R6....... 20FEBE30 R7....... 20902760 R8....... 00000030 +000038 R9....... 20FC7038 R10...... A0900310 R11...... A0900310 R12...... 209139B0 reserved. 00000000 +00004C NAB...... 20FCB508 PNAB..... A099DD88 reserved. 20FCB378 20900B08 +000064 reserved. 20900990 reserved. 00000000 MODE..... 20FCB390 reserved. 00000000 +000078 reserved. 20991D52 reserved. A0915770 ⋮ [1]Storage for Active Routines: ⋮ DSA frame: 20FCB468 +000000 20FCB468 10000000 20FCB378 D4D6C4E4 A0900380 20E56718 20FCB508 20FCB500 A0D2E5F2 |........MODU.....V...........KV2| +000020 20FCB488 A090035E A09922EC 20FEBF70 20FEBE30 20902760 00000030 20FC7038 A0900310 |...;.r.............-............| +000040 20FCB4A8 A0900310 209139B0 00000000 20FCB508 A099DD88 20FCB378 20FCB534 20900B08 |.....j...........r.h............| +000060 20FCB4C8 20FCB378 20900990 00000000 20FCB390 00000000 00000000 20991D52 A0915770 |.........................r...j..| +000080 20FCB4E8 A0991A28 209139B0 00000000 20FCB5A0 20C4D1F2 00000400 20FEBF70 00000009 |.r...j...........DJ2............|
182 z/OS: z/OS Language Environment Debugging Guide
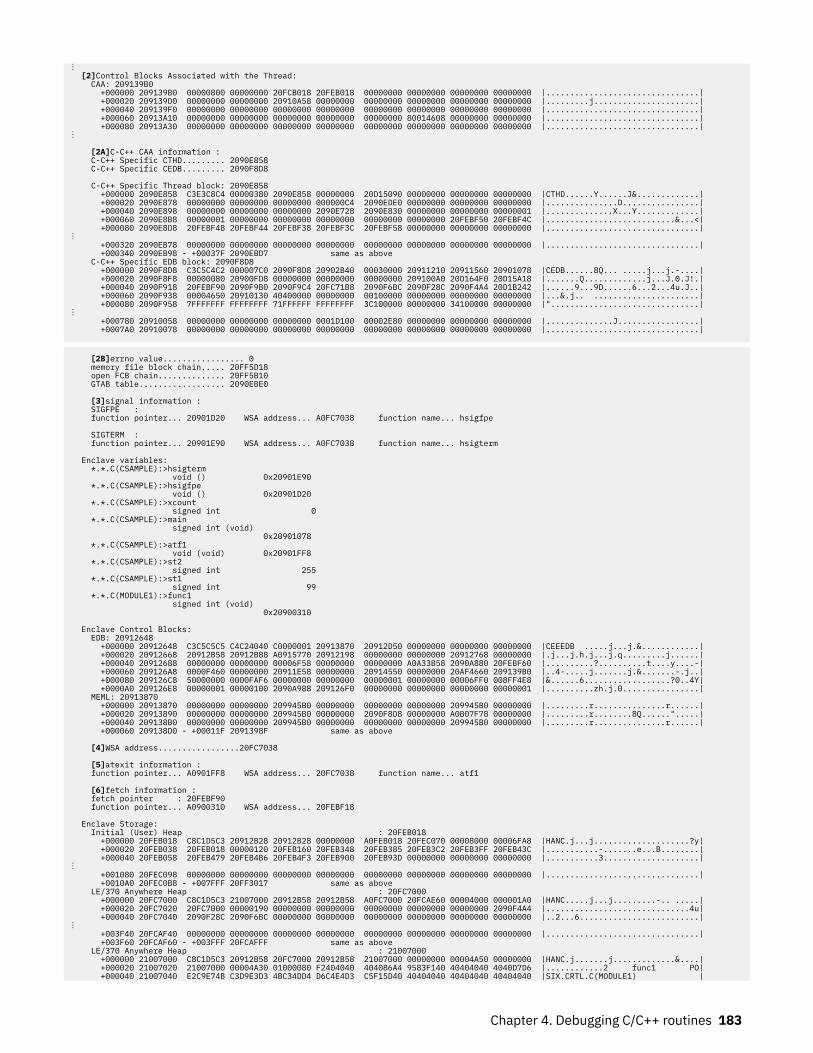
⋮ [2]Control Blocks Associated with the Thread: CAA: 209139B0 +000000 209139B0 00000800 00000000 20FCB018 20FEB018 00000000 00000000 00000000 00000000 |................................| +000020 209139D0 00000000 00000000 20910A58 00000000 00000000 00000000 00000000 00000000 |.........j......................| +000040 209139F0 00000000 00000000 00000000 00000000 00000000 00000000 00000000 00000000 |................................| +000060 20913A10 00000000 00000000 00000000 00000000 00000000 80014608 00000000 00000000 |................................| +000080 20913A30 00000000 00000000 00000000 00000000 00000000 00000000 00000000 00000000 |................................|⋮ [2A]C-C++ CAA information : C-C++ Specific CTHD......... 2090E858 C-C++ Specific CEDB......... 2090F8D8 C-C++ Specific Thread block: 2090E858 +000000 2090E858 C3E3C8C4 00000380 2090E858 00000000 20D15090 00000000 00000000 00000000 |CTHD......Y......J&.............| +000020 2090E878 00000000 00000000 00000000 000000C4 2090EDE0 00000000 00000000 00000000 |...............D................| +000040 2090E898 00000000 00000000 00000000 2090E728 2090E830 00000000 00000000 00000001 |..............X...Y.............| +000060 2090E8B8 00000001 00000000 00000000 00000000 00000000 00000000 20FEBF50 20FEBF4C |...........................&...<| +000080 2090E8D8 20FEBF48 20FEBF44 20FEBF38 20FEBF3C 20FEBF58 00000000 00000000 00000000 |................................|⋮ +000320 2090EB78 00000000 00000000 00000000 00000000 00000000 00000000 00000000 00000000 |................................| +000340 2090EB98 - +00037F 2090EBD7 same as above C-C++ Specific EDB block: 2090F8D8 +000000 2090F8D8 C3C5C4C2 000007C0 2090F8D8 20902B40 00030000 20911210 20911560 20901078 |CEDB......8Q... .....j...j.-....| +000020 2090F8F8 00000080 20900FD8 00000000 00000000 00000000 209100A0 20D164F0 20D15A18 |.......Q.............j...J.0.J!.| +000040 2090F918 20FEBF90 2090F9B0 2090F9C4 20FC71B8 2090F6BC 2090F28C 2090F4A4 20D1B242 |......9...9D......6...2...4u.J..| +000060 2090F938 00004650 20910130 40400000 00000000 00100000 00000000 00000000 00000000 |...&.j.. ......................| +000080 2090F958 7FFFFFFF FFFFFFFF 71FFFFFF FFFFFFFF 3C100000 00000000 34100000 00000000 |"...............................|⋮ +000780 20910058 00000000 00000000 00000000 0001D100 00002E80 00000000 00000000 00000000 |..............J.................| +0007A0 20910078 00000000 00000000 00000000 00000000 00000000 00000000 00000000 00000000 |................................|
[2B]errno value................. 0 memory file block chain..... 20FF5D18 open FCB chain.............. 20FF5B10 GTAB table.................. 2090EBE0 [3]signal information : SIGFPE : function pointer... 20901D20 WSA address... A0FC7038 function name... hsigfpe SIGTERM : function pointer... 20901E90 WSA address... A0FC7038 function name... hsigterm Enclave variables: *.*.C(CSAMPLE):>hsigterm void () 0x20901E90 *.*.C(CSAMPLE):>hsigfpe void () 0x20901D20 *.*.C(CSAMPLE):>xcount signed int 0 *.*.C(CSAMPLE):>main signed int (void) 0x20901078 *.*.C(CSAMPLE):>atf1 void (void) 0x20901FF8 *.*.C(CSAMPLE):>st2 signed int 255 *.*.C(CSAMPLE):>st1 signed int 99 *.*.C(MODULE1):>func1 signed int (void) 0x20900310 Enclave Control Blocks: EDB: 20912648 +000000 20912648 C3C5C5C5 C4C24040 C0000001 20913870 20912D50 00000000 00000000 00000000 |CEEEDB .....j...j.&............| +000020 20912668 20912B58 20912B88 A0915770 20912198 00000000 00000000 20912768 00000000 |.j...j.h.j...j.q.........j......| +000040 20912688 00000000 00000000 00006F58 00000000 00000000 A0A33B58 2090A880 20FEBF60 |..........?..........t....y....-| +000060 209126A8 0000F460 00000000 20911E58 00000000 20914550 00000000 20AF4660 209139B0 |..4-.....j.......j.&.......-.j..| +000080 209126C8 50000000 0000FAF6 00000000 00000000 00000001 00000000 00006FF0 008FF4E8 |&......6..................?0..4Y| +0000A0 209126E8 00000001 00000100 2090A988 209126F0 00000000 00000000 00000000 00000001 |..........zh.j.0................| MEML: 20913870 +000000 20913870 00000000 00000000 209945B0 00000000 00000000 00000000 209945B0 00000000 |.........r...............r......| +000020 20913890 00000000 00000000 209945B0 00000000 2090F8D8 00000000 A0B07F78 00000000 |.........r........8Q......".....| +000040 209138B0 00000000 00000000 209945B0 00000000 00000000 00000000 209945B0 00000000 |.........r...............r......| +000060 209138D0 - +00011F 2091398F same as above [4]WSA address.................20FC7038 [5]atexit information : function pointer... A0901FF8 WSA address... 20FC7038 function name... atf1 [6]fetch information : fetch pointer : 20FEBF90 function pointer... A0900310 WSA address... 20FEBF18 Enclave Storage: Initial (User) Heap : 20FEB018 +000000 20FEB018 C8C1D5C3 20912B28 20912B28 00000000 A0FEB018 20FEC070 00008000 00006FA8 |HANC.j...j....................?y| +000020 20FEB038 20FEB018 00000120 20FEB160 20FEB348 20FEB385 20FEB3C2 20FEB3FF 20FEB43C |...........-.......e...B........| +000040 20FEB058 20FEB479 20FEB4B6 20FEB4F3 20FEB900 20FEB93D 00000000 00000000 00000000 |...........3....................|⋮ +001080 20FEC098 00000000 00000000 00000000 00000000 00000000 00000000 00000000 00000000 |................................| +0010A0 20FEC0B8 - +007FFF 20FF3017 same as above LE/370 Anywhere Heap : 20FC7000 +000000 20FC7000 C8C1D5C3 21007000 20912B58 20912B58 A0FC7000 20FCAE60 00004000 000001A0 |HANC.....j...j.........-.. .....| +000020 20FC7020 20FC7000 00000190 00000000 00000000 00000000 00000000 00000000 2090F4A4 |..............................4u| +000040 20FC7040 2090F28C 2090F6BC 00000000 00000000 00000000 00000000 00000000 00000000 |..2...6.........................|⋮ +003F40 20FCAF40 00000000 00000000 00000000 00000000 00000000 00000000 00000000 00000000 |................................| +003F60 20FCAF60 - +003FFF 20FCAFFF same as above LE/370 Anywhere Heap : 21007000 +000000 21007000 C8C1D5C3 20912B58 20FC7000 20912B58 21007000 00000000 00004A50 00000000 |HANC.j.......j.............&....| +000020 21007020 21007000 00004A30 01000080 F2404040 404086A4 9583F140 40404040 4040D7D6 |............2 func1 PO| +000040 21007040 E2C9E74B C3D9E3D3 4BC34DD4 D6C4E4D3 C5F15D40 40404040 40404040 40404040 |SIX.CRTL.C(MODULE1) |
Chapter 4. Debugging C/C++ routines 183
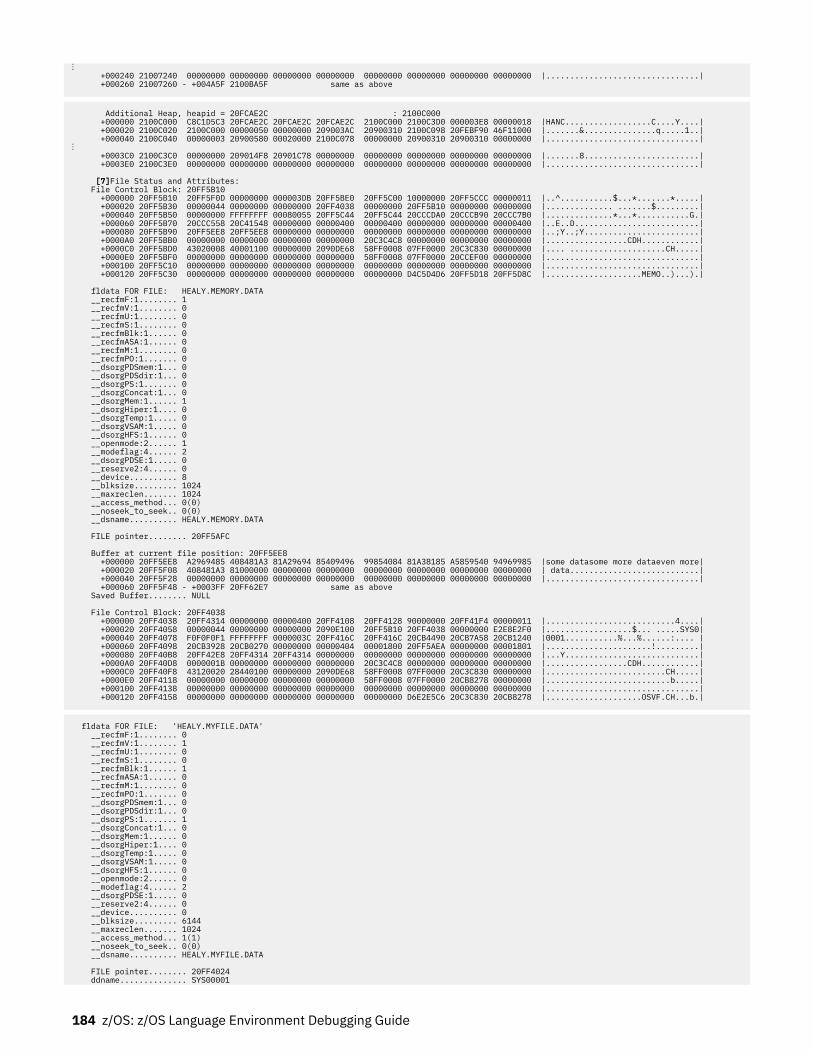
⋮ +000240 21007240 00000000 00000000 00000000 00000000 00000000 00000000 00000000 00000000 |................................| +000260 21007260 - +004A5F 2100BA5F same as above
Additional Heap, heapid = 20FCAE2C : 2100C000 +000000 2100C000 C8C1D5C3 20FCAE2C 20FCAE2C 20FCAE2C 2100C000 2100C3D0 000003E8 00000018 |HANC..................C....Y....| +000020 2100C020 2100C000 00000050 00000000 209003AC 20900310 2100C098 20FEBF90 46F11000 |.......&...............q.....1..| +000040 2100C040 00000003 20900580 00020000 2100C078 00000000 20900310 20900310 00000000 |................................|⋮ +0003C0 2100C3C0 00000000 209014F8 20901C78 00000000 00000000 00000000 00000000 00000000 |.......8........................| +0003E0 2100C3E0 00000000 00000000 00000000 00000000 00000000 00000000 00000000 00000000 |................................| [7]File Status and Attributes: File Control Block: 20FF5B10 +000000 20FF5B10 20FF5F0D 00000000 000003DB 20FF5BE0 20FF5C00 10000000 20FF5CCC 00000011 |..^...........$...*.......*.....| +000020 20FF5B30 00000044 00000000 00000000 20FF4038 00000000 20FF5B10 00000000 00000000 |.............. .......$.........| +000040 20FF5B50 00000000 FFFFFFFF 00080055 20FF5C44 20FF5C44 20CCCDA0 20CCCB90 20CCC7B0 |..............*...*...........G.| +000060 20FF5B70 20CCC558 20C41548 00000000 00000400 00000400 00000000 00000000 00000400 |..E..D..........................| +000080 20FF5B90 20FF5EE8 20FF5EE8 00000000 00000000 00000000 00000000 00000000 00000000 |..;Y..;Y........................| +0000A0 20FF5BB0 00000000 00000000 00000000 00000000 20C3C4C8 00000000 00000000 00000000 |.................CDH............| +0000C0 20FF5BD0 43020008 40001100 00000000 2090DE68 58FF0008 07FF0000 20C3C830 00000000 |.... ....................CH.....| +0000E0 20FF5BF0 00000000 00000000 00000000 00000000 58FF0008 07FF0000 20CCEF00 00000000 |................................| +000100 20FF5C10 00000000 00000000 00000000 00000000 00000000 00000000 00000000 00000000 |................................| +000120 20FF5C30 00000000 00000000 00000000 00000000 00000000 D4C5D4D6 20FF5D18 20FF5D8C |....................MEMO..)...).| fldata FOR FILE: HEALY.MEMORY.DATA __recfmF:1........ 1 __recfmV:1........ 0 __recfmU:1........ 0 __recfmS:1........ 0 __recfmBlk:1...... 0 __recfmASA:1...... 0 __recfmM:1........ 0 __recfmPO:1....... 0 __dsorgPDSmem:1... 0 __dsorgPDSdir:1... 0 __dsorgPS:1....... 0 __dsorgConcat:1... 0 __dsorgMem:1...... 1 __dsorgHiper:1.... 0 __dsorgTemp:1..... 0 __dsorgVSAM:1..... 0 __dsorgHFS:1...... 0 __openmode:2...... 1 __modeflag:4...... 2 __dsorgPDSE:1..... 0 __reserve2:4...... 0 __device.......... 8 __blksize......... 1024 __maxreclen....... 1024 __access_method... 0(0) __noseek_to_seek.. 0(0) __dsname.......... HEALY.MEMORY.DATA FILE pointer........ 20FF5AFC Buffer at current file position: 20FF5EE8 +000000 20FF5EE8 A2969485 408481A3 81A29694 85409496 99854084 81A38185 A5859540 94969985 |some datasome more dataeven more| +000020 20FF5F08 408481A3 81000000 00000000 00000000 00000000 00000000 00000000 00000000 | data...........................| +000040 20FF5F28 00000000 00000000 00000000 00000000 00000000 00000000 00000000 00000000 |................................| +000060 20FF5F48 - +0003FF 20FF62E7 same as above Saved Buffer........ NULL File Control Block: 20FF4038 +000000 20FF4038 20FF4314 00000000 00000400 20FF4108 20FF4128 90000000 20FF41F4 00000011 |...........................4....| +000020 20FF4058 00000044 00000000 00000000 2090E100 20FF5B10 20FF4038 00000000 E2E8E2F0 |..................$... .....SYS0| +000040 20FF4078 F0F0F0F1 FFFFFFFF 0000003C 20FF416C 20FF416C 20CB4490 20CB7A58 20CB1240 |0001...........%...%......:.... | +000060 20FF4098 20CB3928 20CB0270 00000000 00000404 00001800 20FF5AEA 00000000 00001801 |......................!.........| +000080 20FF40B8 20FF42E8 20FF4314 20FF4314 00000000 00000000 00000000 00000000 00000000 |...Y............................| +0000A0 20FF40D8 0000001B 00000000 00000000 00000000 20C3C4C8 00000000 00000000 00000000 |.................CDH............| +0000C0 20FF40F8 43120020 28440100 00000000 2090DE68 58FF0008 07FF0000 20C3C830 00000000 |.........................CH.....| +0000E0 20FF4118 00000000 00000000 00000000 00000000 58FF0008 07FF0000 20CB8278 00000000 |..........................b.....| +000100 20FF4138 00000000 00000000 00000000 00000000 00000000 00000000 00000000 00000000 |................................| +000120 20FF4158 00000000 00000000 00000000 00000000 00000000 D6E2E5C6 20C3C830 20CB8278 |....................OSVF.CH...b.|
fldata FOR FILE: 'HEALY.MYFILE.DATA' __recfmF:1........ 0 __recfmV:1........ 1 __recfmU:1........ 0 __recfmS:1........ 0 __recfmBlk:1...... 1 __recfmASA:1...... 0 __recfmM:1........ 0 __recfmPO:1....... 0 __dsorgPDSmem:1... 0 __dsorgPDSdir:1... 0 __dsorgPS:1....... 1 __dsorgConcat:1... 0 __dsorgMem:1...... 0 __dsorgHiper:1.... 0 __dsorgTemp:1..... 0 __dsorgVSAM:1..... 0 __dsorgHFS:1...... 0 __openmode:2...... 0 __modeflag:4...... 2 __dsorgPDSE:1..... 0 __reserve2:4...... 0 __device.......... 0 __blksize......... 6144 __maxreclen....... 1024 __access_method... 1(1) __noseek_to_seek.. 0(0) __dsname.......... HEALY.MYFILE.DATA FILE pointer........ 20FF4024 ddname.............. SYS00001
184 z/OS: z/OS Language Environment Debugging Guide
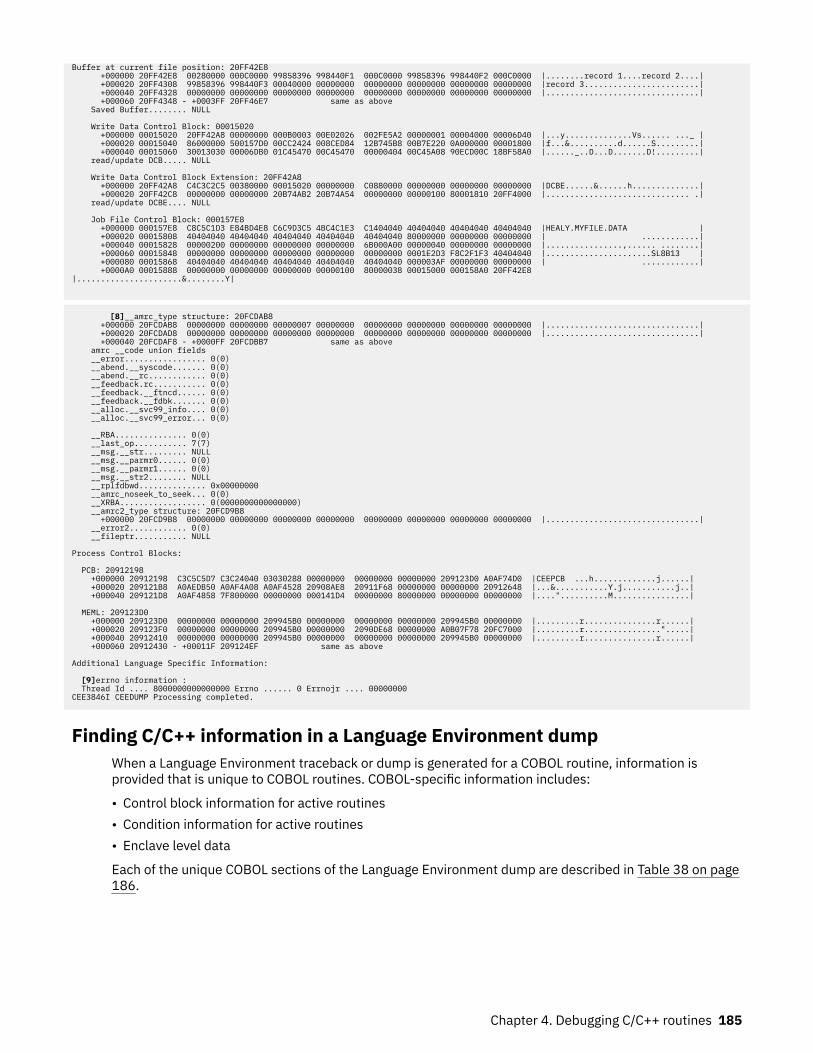
Buffer at current file position: 20FF42E8 +000000 20FF42E8 00280000 000C0000 99858396 998440F1 000C0000 99858396 998440F2 000C0000 |........record 1....record 2....| +000020 20FF4308 99858396 998440F3 00040000 00000000 00000000 00000000 00000000 00000000 |record 3........................| +000040 20FF4328 00000000 00000000 00000000 00000000 00000000 00000000 00000000 00000000 |................................| +000060 20FF4348 - +0003FF 20FF46E7 same as above Saved Buffer........ NULL Write Data Control Block: 00015020 +000000 00015020 20FF42A8 00000000 000B0003 00E02026 002FE5A2 00000001 00004000 00006D40 |...y..............Vs...... ..._ | +000020 00015040 86000000 500157D0 00CC2424 008CED84 12B745B8 00B7E220 0A000000 00001800 |f...&..........d......S.........| +000040 00015060 30013030 00006DB0 01C45470 00C45470 00000404 00C45A08 90ECD00C 18BF58A0 |......_..D...D.......D!.........| read/update DCB..... NULL Write Data Control Block Extension: 20FF42A8 +000000 20FF42A8 C4C3C2C5 00380000 00015020 00000000 C0880000 00000000 00000000 00000000 |DCBE......&......h..............| +000020 20FF42C8 00000000 00000000 20B74AB2 20B74A54 00000000 00000100 80001810 20FF4000 |.............................. .| read/update DCBE.... NULL Job File Control Block: 000157E8 +000000 000157E8 C8C5C1D3 E84BD4E8 C6C9D3C5 4BC4C1E3 C1404040 40404040 40404040 40404040 |HEALY.MYFILE.DATA | +000020 00015808 40404040 40404040 40404040 40404040 40404040 80000000 00000000 00000000 | ............| +000040 00015828 00000200 00000000 00000000 00000000 6B000A00 00000040 00000000 00000000 |................,...... ........| +000060 00015848 00000000 00000000 00000000 00000000 00000000 0001E2D3 F8C2F1F3 40404040 |......................SL8B13 | +000080 00015868 40404040 40404040 40404040 40404040 40404040 000003AF 00000000 00000000 | ............| +0000A0 00015888 00000000 00000000 00000000 00000100 80000038 00015000 000158A0 20FF42E8 |......................&........Y|
[8]__amrc_type structure: 20FCDAB8 +000000 20FCDAB8 00000000 00000000 00000007 00000000 00000000 00000000 00000000 00000000 |................................| +000020 20FCDAD8 00000000 00000000 00000000 00000000 00000000 00000000 00000000 00000000 |................................| +000040 20FCDAF8 - +0000FF 20FCDBB7 same as above amrc __code union fields __error................. 0(0) __abend.__syscode....... 0(0) __abend.__rc............ 0(0) __feedback.rc........... 0(0) __feedback.__ftncd...... 0(0) __feedback.__fdbk....... 0(0) __alloc.__svc99_info.... 0(0) __alloc.__svc99_error... 0(0) __RBA............... 0(0) __last_op........... 7(7) __msg.__str......... NULL __msg.__parmr0...... 0(0) __msg.__parmr1...... 0(0) __msg.__str2........ NULL __rplfdbwd.............. 0x00000000 __amrc_noseek_to_seek... 0(0) __XRBA.................. 0(0000000000000000) __amrc2_type structure: 20FCD9B8 +000000 20FCD9B8 00000000 00000000 00000000 00000000 00000000 00000000 00000000 00000000 |................................| __error2............ 0(0) __fileptr........... NULL Process Control Blocks: PCB: 20912198 +000000 20912198 C3C5C5D7 C3C24040 03030288 00000000 00000000 00000000 209123D0 A0AF74D0 |CEEPCB ...h.............j......| +000020 209121B8 A0AEDB50 A0AF4A08 A0AF4528 20908AE8 20911F68 00000000 00000000 20912648 |...&...........Y.j...........j..| +000040 209121D8 A0AF4858 7F800000 00000000 000141D4 00000000 80000000 00000000 00000000 |...."..........M................| MEML: 209123D0 +000000 209123D0 00000000 00000000 209945B0 00000000 00000000 00000000 209945B0 00000000 |.........r...............r......| +000020 209123F0 00000000 00000000 209945B0 00000000 2090DE68 00000000 A0B07F78 20FC7000 |.........r................".....| +000040 20912410 00000000 00000000 209945B0 00000000 00000000 00000000 209945B0 00000000 |.........r...............r......| +000060 20912430 - +00011F 209124EF same as above Additional Language Specific Information: [9]errno information : Thread Id .... 8000000000000000 Errno ...... 0 Errnojr .... 00000000 CEE3846I CEEDUMP Processing completed.
Finding C/C++ information in a Language Environment dumpWhen a Language Environment traceback or dump is generated for a COBOL routine, information isprovided that is unique to COBOL routines. COBOL-specific information includes:
• Control block information for active routines• Condition information for active routines• Enclave level data
Each of the unique COBOL sections of the Language Environment dump are described in Table 38 on page186.
Chapter 4. Debugging C/C++ routines 185
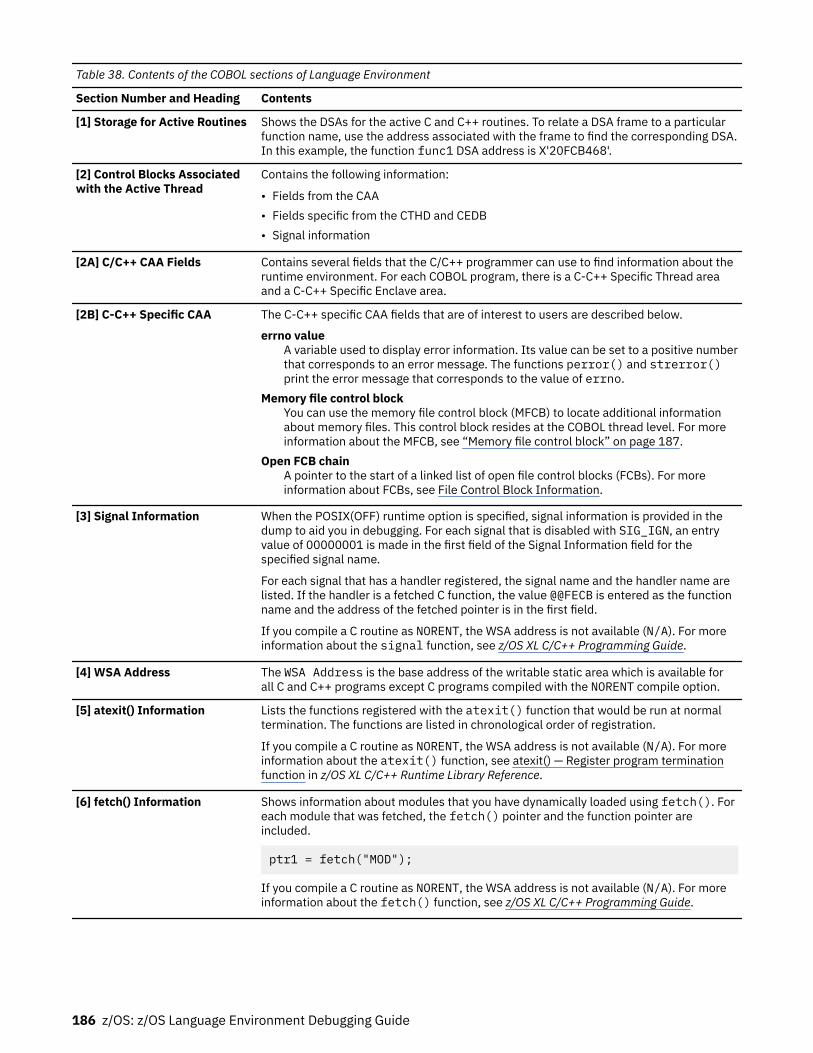
Table 38. Contents of the COBOL sections of Language Environment
Section Number and Heading Contents
[1] Storage for Active Routines Shows the DSAs for the active C and C++ routines. To relate a DSA frame to a particularfunction name, use the address associated with the frame to find the corresponding DSA.In this example, the function func1 DSA address is X'20FCB468'.
[2] Control Blocks Associatedwith the Active Thread
Contains the following information:
• Fields from the CAA• Fields specific from the CTHD and CEDB• Signal information
[2A] C/C++ CAA Fields Contains several fields that the C/C++ programmer can use to find information about theruntime environment. For each COBOL program, there is a C-C++ Specific Thread areaand a C-C++ Specific Enclave area.
[2B] C-C++ Specific CAA The C-C++ specific CAA fields that are of interest to users are described below.
errno valueA variable used to display error information. Its value can be set to a positive numberthat corresponds to an error message. The functions perror() and strerror()print the error message that corresponds to the value of errno.
Memory file control blockYou can use the memory file control block (MFCB) to locate additional informationabout memory files. This control block resides at the COBOL thread level. For moreinformation about the MFCB, see “Memory file control block” on page 187.
Open FCB chainA pointer to the start of a linked list of open file control blocks (FCBs). For moreinformation about FCBs, see File Control Block Information.
[3] Signal Information When the POSIX(OFF) runtime option is specified, signal information is provided in thedump to aid you in debugging. For each signal that is disabled with SIG_IGN, an entryvalue of 00000001 is made in the first field of the Signal Information field for thespecified signal name.
For each signal that has a handler registered, the signal name and the handler name arelisted. If the handler is a fetched C function, the value @@FECB is entered as the functionname and the address of the fetched pointer is in the first field.
If you compile a C routine as NORENT, the WSA address is not available (N/A). For moreinformation about the signal function, see z/OS XL C/C++ Programming Guide.
[4] WSA Address The WSA Address is the base address of the writable static area which is available forall C and C++ programs except C programs compiled with the NORENT compile option.
[5] atexit() Information Lists the functions registered with the atexit() function that would be run at normaltermination. The functions are listed in chronological order of registration.
If you compile a C routine as NORENT, the WSA address is not available (N/A). For moreinformation about the atexit() function, see atexit() — Register program terminationfunction in z/OS XL C/C++ Runtime Library Reference.
[6] fetch() Information Shows information about modules that you have dynamically loaded using fetch(). Foreach module that was fetched, the fetch() pointer and the function pointer areincluded.
ptr1 = fetch("MOD");
If you compile a C routine as NORENT, the WSA address is not available (N/A). For moreinformation about the fetch() function, see z/OS XL C/C++ Programming Guide.
186 z/OS: z/OS Language Environment Debugging Guide
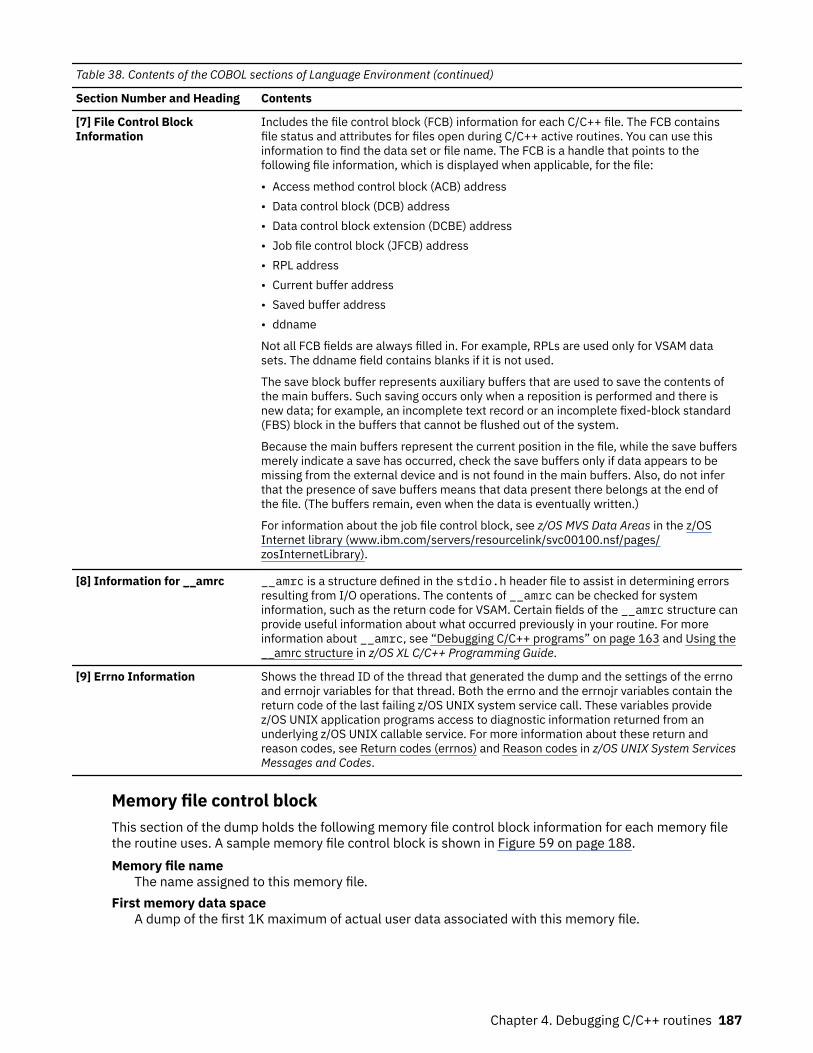
Table 38. Contents of the COBOL sections of Language Environment (continued)
Section Number and Heading Contents
[7] File Control BlockInformation
Includes the file control block (FCB) information for each C/C++ file. The FCB containsfile status and attributes for files open during C/C++ active routines. You can use thisinformation to find the data set or file name. The FCB is a handle that points to thefollowing file information, which is displayed when applicable, for the file:
• Access method control block (ACB) address• Data control block (DCB) address• Data control block extension (DCBE) address• Job file control block (JFCB) address• RPL address• Current buffer address• Saved buffer address• ddname
Not all FCB fields are always filled in. For example, RPLs are used only for VSAM datasets. The ddname field contains blanks if it is not used.
The save block buffer represents auxiliary buffers that are used to save the contents ofthe main buffers. Such saving occurs only when a reposition is performed and there isnew data; for example, an incomplete text record or an incomplete fixed-block standard(FBS) block in the buffers that cannot be flushed out of the system.
Because the main buffers represent the current position in the file, while the save buffersmerely indicate a save has occurred, check the save buffers only if data appears to bemissing from the external device and is not found in the main buffers. Also, do not inferthat the presence of save buffers means that data present there belongs at the end ofthe file. (The buffers remain, even when the data is eventually written.)
For information about the job file control block, see z/OS MVS Data Areas in the z/OSInternet library (www.ibm.com/servers/resourcelink/svc00100.nsf/pages/zosInternetLibrary).
[8] Information for __amrc __amrc is a structure defined in the stdio.h header file to assist in determining errorsresulting from I/O operations. The contents of __amrc can be checked for systeminformation, such as the return code for VSAM. Certain fields of the __amrc structure canprovide useful information about what occurred previously in your routine. For moreinformation about __amrc, see “Debugging C/C++ programs” on page 163 and Using the__amrc structure in z/OS XL C/C++ Programming Guide.
[9] Errno Information Shows the thread ID of the thread that generated the dump and the settings of the errnoand errnojr variables for that thread. Both the errno and the errnojr variables contain thereturn code of the last failing z/OS UNIX system service call. These variables providez/OS UNIX application programs access to diagnostic information returned from anunderlying z/OS UNIX callable service. For more information about these return andreason codes, see Return codes (errnos) and Reason codes in z/OS UNIX System ServicesMessages and Codes.
Memory file control blockThis section of the dump holds the following memory file control block information for each memory filethe routine uses. A sample memory file control block is shown in Figure 59 on page 188.Memory file name
The name assigned to this memory file.First memory data space
A dump of the first 1K maximum of actual user data associated with this memory file.
Chapter 4. Debugging C/C++ routines 187
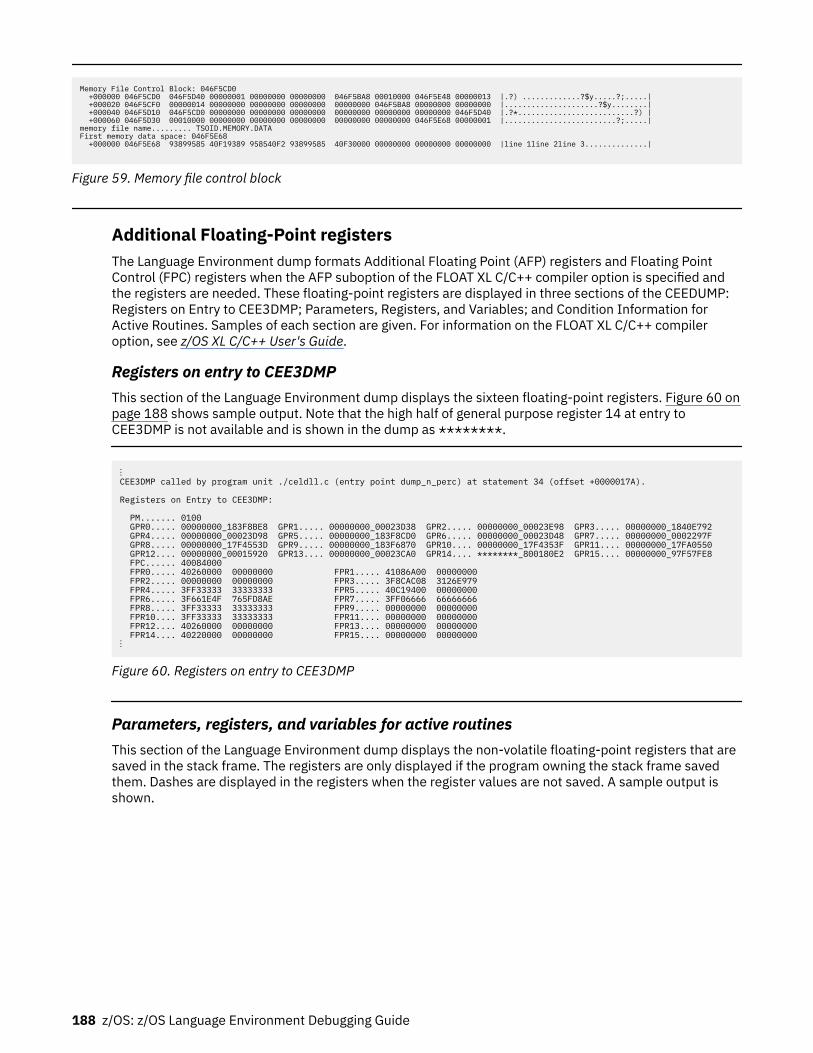
Memory File Control Block: 046F5CD0 +000000 046F5CD0 046F5D40 00000001 00000000 00000000 046F5BA8 00010000 046F5E48 00000013 |.?) .............?$y.....?;.....| +000020 046F5CF0 00000014 00000000 00000000 00000000 00000000 046F5BA8 00000000 00000000 |.....................?$y........| +000040 046F5D10 046F5CD0 00000000 00000000 00000000 00000000 00000000 00000000 046F5D40 |.?*..........................?) | +000060 046F5D30 00010000 00000000 00000000 00000000 00000000 00000000 046F5E68 00000001 |.........................?;.....|memory file name......... TSOID.MEMORY.DATAFirst memory data space: 046F5E68 +000000 046F5E68 93899585 40F19389 958540F2 93899585 40F30000 00000000 00000000 00000000 |line 1line 2line 3..............|
Figure 59. Memory file control block
Additional Floating-Point registersThe Language Environment dump formats Additional Floating Point (AFP) registers and Floating PointControl (FPC) registers when the AFP suboption of the FLOAT XL C/C++ compiler option is specified andthe registers are needed. These floating-point registers are displayed in three sections of the CEEDUMP:Registers on Entry to CEE3DMP; Parameters, Registers, and Variables; and Condition Information forActive Routines. Samples of each section are given. For information on the FLOAT XL C/C++ compileroption, see z/OS XL C/C++ User's Guide.
Registers on entry to CEE3DMPThis section of the Language Environment dump displays the sixteen floating-point registers. Figure 60 onpage 188 shows sample output. Note that the high half of general purpose register 14 at entry toCEE3DMP is not available and is shown in the dump as ********.
⋮CEE3DMP called by program unit ./celdll.c (entry point dump_n_perc) at statement 34 (offset +0000017A).
Registers on Entry to CEE3DMP:
PM....... 0100 GPR0..... 00000000_183F8BE8 GPR1..... 00000000_00023D38 GPR2..... 00000000_00023E98 GPR3..... 00000000_1840E792 GPR4..... 00000000_00023D98 GPR5..... 00000000_183F8CD0 GPR6..... 00000000_00023D48 GPR7..... 00000000_0002297F GPR8..... 00000000_17F4553D GPR9..... 00000000_183F6870 GPR10.... 00000000_17F4353F GPR11.... 00000000_17FA0550 GPR12.... 00000000_00015920 GPR13.... 00000000_00023CA0 GPR14.... ********_800180E2 GPR15.... 00000000_97F57FE8 FPC...... 40084000 FPR0..... 40260000 00000000 FPR1..... 41086A00 00000000 FPR2..... 00000000 00000000 FPR3..... 3F8CAC08 3126E979 FPR4..... 3FF33333 33333333 FPR5..... 40C19400 00000000 FPR6..... 3F661E4F 765FD8AE FPR7..... 3FF06666 66666666 FPR8..... 3FF33333 33333333 FPR9..... 00000000 00000000 FPR10.... 3FF33333 33333333 FPR11.... 00000000 00000000 FPR12.... 40260000 00000000 FPR13.... 00000000 00000000 FPR14.... 40220000 00000000 FPR15.... 00000000 00000000⋮
Figure 60. Registers on entry to CEE3DMP
Parameters, registers, and variables for active routinesThis section of the Language Environment dump displays the non-volatile floating-point registers that aresaved in the stack frame. The registers are only displayed if the program owning the stack frame savedthem. Dashes are displayed in the registers when the register values are not saved. A sample output isshown.
188 z/OS: z/OS Language Environment Debugging Guide
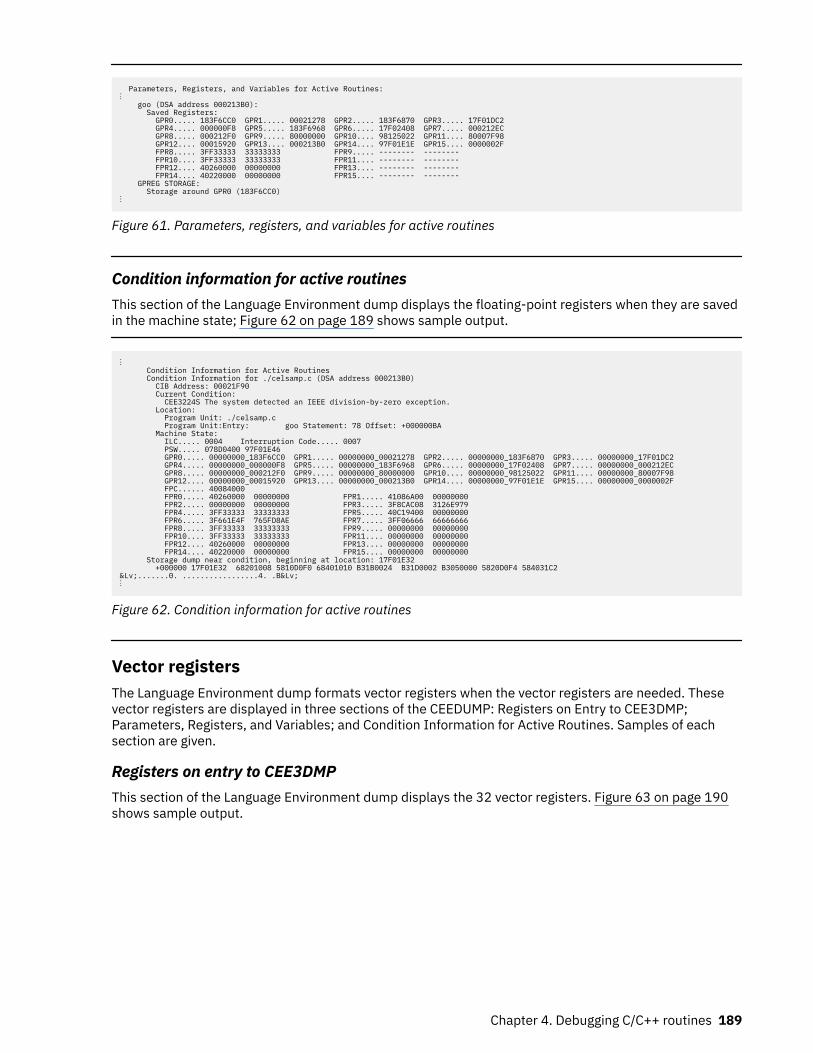
Parameters, Registers, and Variables for Active Routines:⋮ goo (DSA address 000213B0): Saved Registers: GPR0..... 183F6CC0 GPR1..... 00021278 GPR2..... 183F6870 GPR3..... 17F01DC2 GPR4..... 000000F8 GPR5..... 183F6968 GPR6..... 17F02408 GPR7..... 000212EC GPR8..... 000212F0 GPR9..... 80000000 GPR10.... 98125022 GPR11.... 80007F98 GPR12.... 00015920 GPR13.... 000213B0 GPR14.... 97F01E1E GPR15.... 0000002F FPR8..... 3FF33333 33333333 FPR9..... -------- -------- FPR10.... 3FF33333 33333333 FPR11.... -------- -------- FPR12.... 40260000 00000000 FPR13.... -------- -------- FPR14.... 40220000 00000000 FPR15.... -------- -------- GPREG STORAGE: Storage around GPR0 (183F6CC0)⋮
Figure 61. Parameters, registers, and variables for active routines
Condition information for active routinesThis section of the Language Environment dump displays the floating-point registers when they are savedin the machine state; Figure 62 on page 189 shows sample output.
⋮ Condition Information for Active Routines Condition Information for ./celsamp.c (DSA address 000213B0) CIB Address: 00021F90 Current Condition: CEE3224S The system detected an IEEE division-by-zero exception. Location: Program Unit: ./celsamp.c Program Unit:Entry: goo Statement: 78 Offset: +000000BA Machine State: ILC..... 0004 Interruption Code..... 0007 PSW..... 078D0400 97F01E46 GPR0..... 00000000_183F6CC0 GPR1..... 00000000_00021278 GPR2..... 00000000_183F6870 GPR3..... 00000000_17F01DC2 GPR4..... 00000000_000000F8 GPR5..... 00000000_183F6968 GPR6..... 00000000_17F02408 GPR7..... 00000000_000212EC GPR8..... 00000000_000212F0 GPR9..... 00000000_80000000 GPR10.... 00000000_98125022 GPR11.... 00000000_80007F98 GPR12.... 00000000_00015920 GPR13.... 00000000_000213B0 GPR14.... 00000000_97F01E1E GPR15.... 00000000_0000002F FPC...... 40084000 FPR0..... 40260000 00000000 FPR1..... 41086A00 00000000 FPR2..... 00000000 00000000 FPR3..... 3F8CAC08 3126E979 FPR4..... 3FF33333 33333333 FPR5..... 40C19400 00000000 FPR6..... 3F661E4F 765FD8AE FPR7..... 3FF06666 66666666 FPR8..... 3FF33333 33333333 FPR9..... 00000000 00000000 FPR10.... 3FF33333 33333333 FPR11.... 00000000 00000000 FPR12.... 40260000 00000000 FPR13.... 00000000 00000000 FPR14.... 40220000 00000000 FPR15.... 00000000 00000000 Storage dump near condition, beginning at location: 17F01E32 +000000 17F01E32 68201008 5810D0F0 68401010 B31B0024 B31D0002 B3050000 5820D0F4 584031C2 &Lv;.......0. .................4. .B&Lv;⋮
Figure 62. Condition information for active routines
Vector registersThe Language Environment dump formats vector registers when the vector registers are needed. Thesevector registers are displayed in three sections of the CEEDUMP: Registers on Entry to CEE3DMP;Parameters, Registers, and Variables; and Condition Information for Active Routines. Samples of eachsection are given.
Registers on entry to CEE3DMPThis section of the Language Environment dump displays the 32 vector registers. Figure 63 on page 190shows sample output.
Chapter 4. Debugging C/C++ routines 189
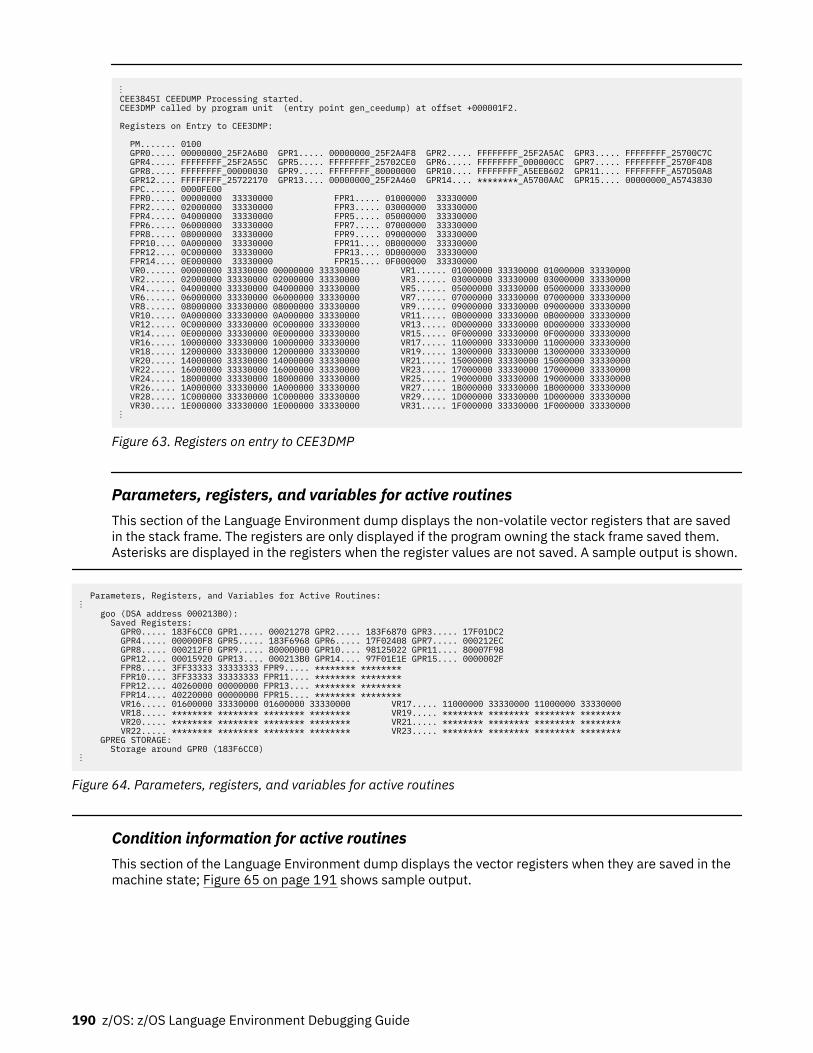
⋮CEE3845I CEEDUMP Processing started. CEE3DMP called by program unit (entry point gen_ceedump) at offset +000001F2. Registers on Entry to CEE3DMP: PM....... 0100 GPR0..... 00000000_25F2A6B0 GPR1..... 00000000_25F2A4F8 GPR2..... FFFFFFFF_25F2A5AC GPR3..... FFFFFFFF_25700C7C GPR4..... FFFFFFFF_25F2A55C GPR5..... FFFFFFFF_25702CE0 GPR6..... FFFFFFFF_000000CC GPR7..... FFFFFFFF_2570F4D8 GPR8..... FFFFFFFF_00000030 GPR9..... FFFFFFFF_80000000 GPR10.... FFFFFFFF_A5EEB602 GPR11.... FFFFFFFF_A57D50A8 GPR12.... FFFFFFFF_25722170 GPR13.... 00000000_25F2A460 GPR14.... ********_A5700AAC GPR15.... 00000000_A5743830 FPC...... 0000FE00 FPR0..... 00000000 33330000 FPR1..... 01000000 33330000 FPR2..... 02000000 33330000 FPR3..... 03000000 33330000 FPR4..... 04000000 33330000 FPR5..... 05000000 33330000 FPR6..... 06000000 33330000 FPR7..... 07000000 33330000 FPR8..... 08000000 33330000 FPR9..... 09000000 33330000 FPR10.... 0A000000 33330000 FPR11.... 0B000000 33330000 FPR12.... 0C000000 33330000 FPR13.... 0D000000 33330000 FPR14.... 0E000000 33330000 FPR15.... 0F000000 33330000 VR0...... 00000000 33330000 00000000 33330000 VR1...... 01000000 33330000 01000000 33330000 VR2...... 02000000 33330000 02000000 33330000 VR3...... 03000000 33330000 03000000 33330000 VR4...... 04000000 33330000 04000000 33330000 VR5...... 05000000 33330000 05000000 33330000 VR6...... 06000000 33330000 06000000 33330000 VR7...... 07000000 33330000 07000000 33330000 VR8...... 08000000 33330000 08000000 33330000 VR9...... 09000000 33330000 09000000 33330000 VR10..... 0A000000 33330000 0A000000 33330000 VR11..... 0B000000 33330000 0B000000 33330000 VR12..... 0C000000 33330000 0C000000 33330000 VR13..... 0D000000 33330000 0D000000 33330000 VR14..... 0E000000 33330000 0E000000 33330000 VR15..... 0F000000 33330000 0F000000 33330000 VR16..... 10000000 33330000 10000000 33330000 VR17..... 11000000 33330000 11000000 33330000 VR18..... 12000000 33330000 12000000 33330000 VR19..... 13000000 33330000 13000000 33330000 VR20..... 14000000 33330000 14000000 33330000 VR21..... 15000000 33330000 15000000 33330000 VR22..... 16000000 33330000 16000000 33330000 VR23..... 17000000 33330000 17000000 33330000 VR24..... 18000000 33330000 18000000 33330000 VR25..... 19000000 33330000 19000000 33330000 VR26..... 1A000000 33330000 1A000000 33330000 VR27..... 1B000000 33330000 1B000000 33330000 VR28..... 1C000000 33330000 1C000000 33330000 VR29..... 1D000000 33330000 1D000000 33330000 VR30..... 1E000000 33330000 1E000000 33330000 VR31..... 1F000000 33330000 1F000000 33330000⋮
Figure 63. Registers on entry to CEE3DMP
Parameters, registers, and variables for active routinesThis section of the Language Environment dump displays the non-volatile vector registers that are savedin the stack frame. The registers are only displayed if the program owning the stack frame saved them.Asterisks are displayed in the registers when the register values are not saved. A sample output is shown.
Parameters, Registers, and Variables for Active Routines:⋮ goo (DSA address 000213B0): Saved Registers: GPR0..... 183F6CC0 GPR1..... 00021278 GPR2..... 183F6870 GPR3..... 17F01DC2 GPR4..... 000000F8 GPR5..... 183F6968 GPR6..... 17F02408 GPR7..... 000212EC GPR8..... 000212F0 GPR9..... 80000000 GPR10.... 98125022 GPR11.... 80007F98 GPR12.... 00015920 GPR13.... 000213B0 GPR14.... 97F01E1E GPR15.... 0000002F FPR8..... 3FF33333 33333333 FPR9..... ******** ******** FPR10.... 3FF33333 33333333 FPR11.... ******** ******** FPR12.... 40260000 00000000 FPR13.... ******** ******** FPR14.... 40220000 00000000 FPR15.... ******** ******** VR16..... 01600000 33330000 01600000 33330000 VR17..... 11000000 33330000 11000000 33330000 VR18..... ******** ******** ******** ******** VR19..... ******** ******** ******** ******** VR20..... ******** ******** ******** ******** VR21..... ******** ******** ******** ******** VR22..... ******** ******** ******** ******** VR23..... ******** ******** ******** ******** GPREG STORAGE: Storage around GPR0 (183F6CC0)⋮
Figure 64. Parameters, registers, and variables for active routines
Condition information for active routinesThis section of the Language Environment dump displays the vector registers when they are saved in themachine state; Figure 65 on page 191 shows sample output.
190 z/OS: z/OS Language Environment Debugging Guide
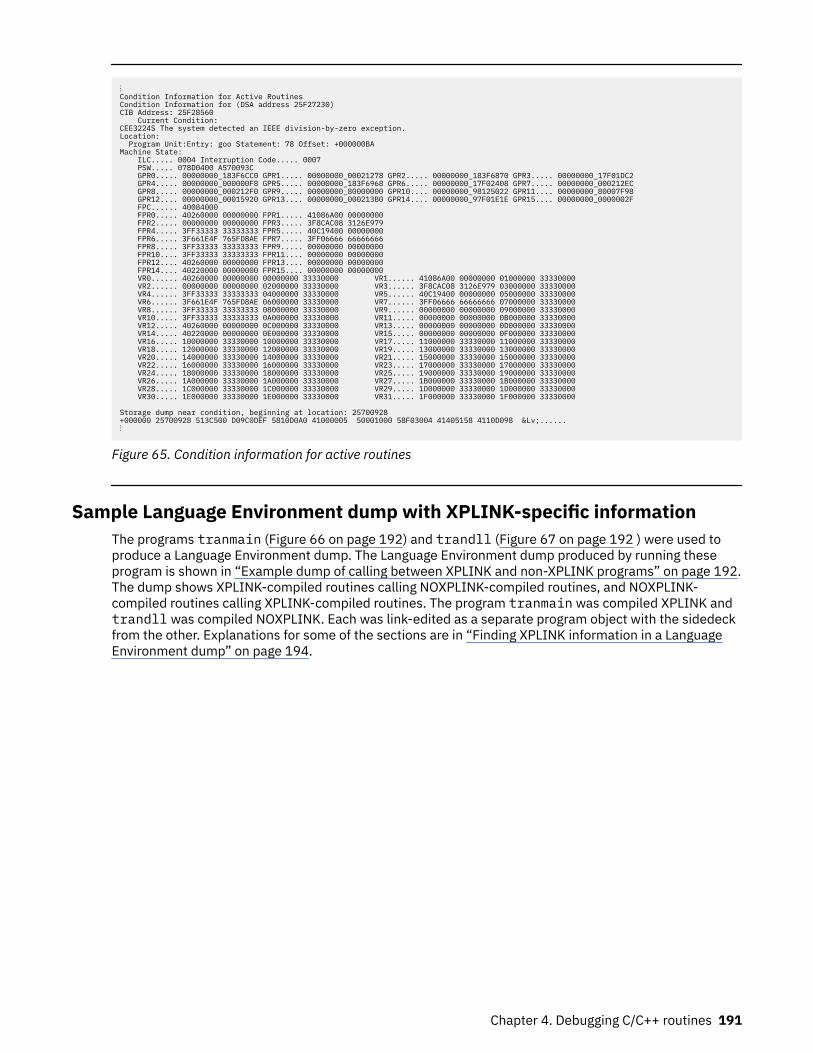
⋮Condition Information for Active RoutinesCondition Information for (DSA address 25F27230)CIB Address: 25F28560 Current Condition:CEE3224S The system detected an IEEE division-by-zero exception.Location: Program Unit:Entry: goo Statement: 78 Offset: +000000BAMachine State: ILC..... 0004 Interruption Code..... 0007 PSW..... 078D0400 A570093C GPR0..... 00000000_183F6CC0 GPR1..... 00000000_00021278 GPR2..... 00000000_183F6870 GPR3..... 00000000_17F01DC2 GPR4..... 00000000_000000F8 GPR5..... 00000000_183F6968 GPR6..... 00000000_17F02408 GPR7..... 00000000_000212EC GPR8..... 00000000_000212F0 GPR9..... 00000000_80000000 GPR10.... 00000000_98125022 GPR11.... 00000000_80007F98 GPR12.... 00000000_00015920 GPR13.... 00000000_000213B0 GPR14.... 00000000_97F01E1E GPR15.... 00000000_0000002F FPC...... 40084000 FPR0..... 40260000 00000000 FPR1..... 41086A00 00000000 FPR2..... 00000000 00000000 FPR3..... 3F8CAC08 3126E979 FPR4..... 3FF33333 33333333 FPR5..... 40C19400 00000000 FPR6..... 3F661E4F 765FD8AE FPR7..... 3FF06666 66666666 FPR8..... 3FF33333 33333333 FPR9..... 00000000 00000000 FPR10.... 3FF33333 33333333 FPR11.... 00000000 00000000 FPR12.... 40260000 00000000 FPR13.... 00000000 00000000 FPR14.... 40220000 00000000 FPR15.... 00000000 00000000 VR0...... 40260000 00000000 00000000 33330000 VR1...... 41086A00 00000000 01000000 33330000 VR2...... 00000000 00000000 02000000 33330000 VR3...... 3F8CAC08 3126E979 03000000 33330000 VR4...... 3FF33333 33333333 04000000 33330000 VR5...... 40C19400 00000000 05000000 33330000 VR6...... 3F661E4F 765FD8AE 06000000 33330000 VR7...... 3FF06666 66666666 07000000 33330000 VR8...... 3FF33333 33333333 08000000 33330000 VR9...... 00000000 00000000 09000000 33330000 VR10..... 3FF33333 33333333 0A000000 33330000 VR11..... 00000000 00000000 0B000000 33330000 VR12..... 40260000 00000000 0C000000 33330000 VR13..... 00000000 00000000 0D000000 33330000 VR14..... 40220000 00000000 0E000000 33330000 VR15..... 00000000 00000000 0F000000 33330000 VR16..... 10000000 33330000 10000000 33330000 VR17..... 11000000 33330000 11000000 33330000 VR18..... 12000000 33330000 12000000 33330000 VR19..... 13000000 33330000 13000000 33330000 VR20..... 14000000 33330000 14000000 33330000 VR21..... 15000000 33330000 15000000 33330000 VR22..... 16000000 33330000 16000000 33330000 VR23..... 17000000 33330000 17000000 33330000 VR24..... 18000000 33330000 18000000 33330000 VR25..... 19000000 33330000 19000000 33330000 VR26..... 1A000000 33330000 1A000000 33330000 VR27..... 1B000000 33330000 1B000000 33330000 VR28..... 1C000000 33330000 1C000000 33330000 VR29..... 1D000000 33330000 1D000000 33330000 VR30..... 1E000000 33330000 1E000000 33330000 VR31..... 1F000000 33330000 1F000000 33330000
Storage dump near condition, beginning at location: 25700928+000000 25700928 513C500 D09C0DEF 5810D0A0 41000005 50001000 58F03004 41405158 4110D098 &Lv;......⋮
Figure 65. Condition information for active routines
Sample Language Environment dump with XPLINK-specific informationThe programs tranmain (Figure 66 on page 192) and trandll (Figure 67 on page 192 ) were used toproduce a Language Environment dump. The Language Environment dump produced by running theseprogram is shown in “Example dump of calling between XPLINK and non-XPLINK programs” on page 192.The dump shows XPLINK-compiled routines calling NOXPLINK-compiled routines, and NOXPLINK-compiled routines calling XPLINK-compiled routines. The program tranmain was compiled XPLINK andtrandll was compiled NOXPLINK. Each was link-edited as a separate program object with the sidedeckfrom the other. Explanations for some of the sections are in “Finding XPLINK information in a LanguageEnvironment dump” on page 194.
Chapter 4. Debugging C/C++ routines 191
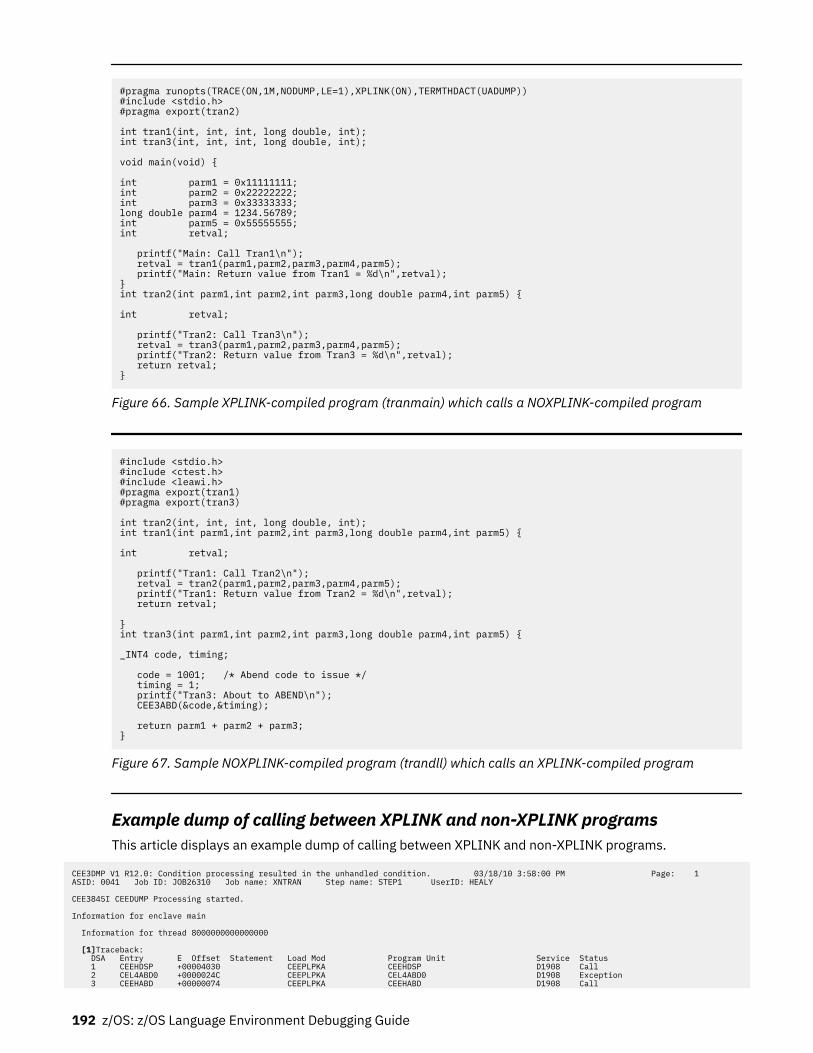
#pragma runopts(TRACE(ON,1M,NODUMP,LE=1),XPLINK(ON),TERMTHDACT(UADUMP))#include <stdio.h>#pragma export(tran2)
int tran1(int, int, int, long double, int);int tran3(int, int, int, long double, int);
void main(void) {
int parm1 = 0x11111111;int parm2 = 0x22222222;int parm3 = 0x33333333;long double parm4 = 1234.56789;int parm5 = 0x55555555;int retval;
printf("Main: Call Tran1\n"); retval = tran1(parm1,parm2,parm3,parm4,parm5); printf("Main: Return value from Tran1 = %d\n",retval);}int tran2(int parm1,int parm2,int parm3,long double parm4,int parm5) {
int retval;
printf("Tran2: Call Tran3\n"); retval = tran3(parm1,parm2,parm3,parm4,parm5); printf("Tran2: Return value from Tran3 = %d\n",retval); return retval;}
Figure 66. Sample XPLINK-compiled program (tranmain) which calls a NOXPLINK-compiled program
#include <stdio.h>#include <ctest.h>#include <leawi.h>#pragma export(tran1)#pragma export(tran3)
int tran2(int, int, int, long double, int);int tran1(int parm1,int parm2,int parm3,long double parm4,int parm5) {
int retval;
printf("Tran1: Call Tran2\n"); retval = tran2(parm1,parm2,parm3,parm4,parm5); printf("Tran1: Return value from Tran2 = %d\n",retval); return retval;
}int tran3(int parm1,int parm2,int parm3,long double parm4,int parm5) {
_INT4 code, timing;
code = 1001; /* Abend code to issue */ timing = 1; printf("Tran3: About to ABEND\n"); CEE3ABD(&code,&timing);
return parm1 + parm2 + parm3;}
Figure 67. Sample NOXPLINK-compiled program (trandll) which calls an XPLINK-compiled program
Example dump of calling between XPLINK and non-XPLINK programsThis article displays an example dump of calling between XPLINK and non-XPLINK programs.
CEE3DMP V1 R12.0: Condition processing resulted in the unhandled condition. 03/18/10 3:58:00 PM Page: 1 ASID: 0041 Job ID: JOB26310 Job name: XNTRAN Step name: STEP1 UserID: HEALY CEE3845I CEEDUMP Processing started. Information for enclave main Information for thread 8000000000000000 [1]Traceback: DSA Entry E Offset Statement Load Mod Program Unit Service Status 1 CEEHDSP +00004030 CEEPLPKA CEEHDSP D1908 Call 2 CEL4ABD0 +0000024C CEEPLPKA CEL4ABD0 D1908 Exception 3 CEEHABD +00000074 CEEPLPKA CEEHABD D1908 Call
192 z/OS: z/OS Language Environment Debugging Guide
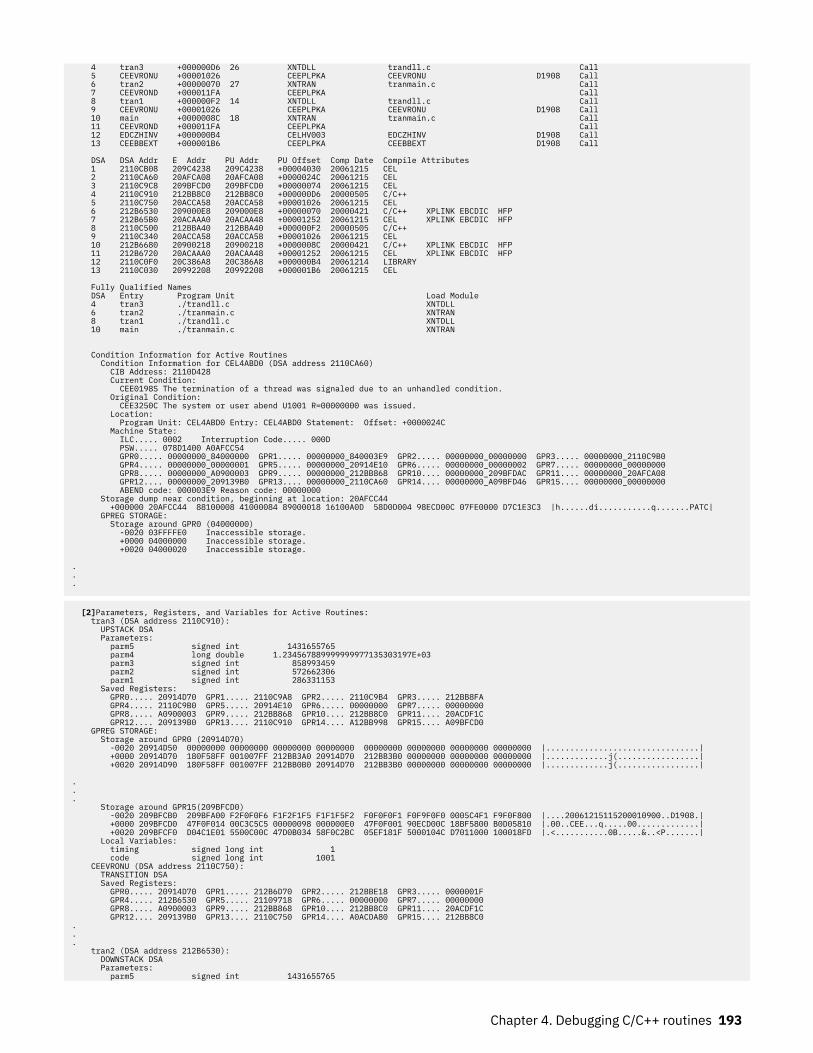
4 tran3 +000000D6 26 XNTDLL trandll.c Call 5 CEEVRONU +00001026 CEEPLPKA CEEVRONU D1908 Call 6 tran2 +00000070 27 XNTRAN tranmain.c Call 7 CEEVROND +000011FA CEEPLPKA Call 8 tran1 +000000F2 14 XNTDLL trandll.c Call 9 CEEVRONU +00001026 CEEPLPKA CEEVRONU D1908 Call 10 main +0000008C 18 XNTRAN tranmain.c Call 11 CEEVROND +000011FA CEEPLPKA Call 12 EDCZHINV +000000B4 CELHV003 EDCZHINV D1908 Call 13 CEEBBEXT +000001B6 CEEPLPKA CEEBBEXT D1908 Call DSA DSA Addr E Addr PU Addr PU Offset Comp Date Compile Attributes 1 2110CB08 209C4238 209C4238 +00004030 20061215 CEL 2 2110CA60 20AFCA08 20AFCA08 +0000024C 20061215 CEL 3 2110C9C8 209BFCD0 209BFCD0 +00000074 20061215 CEL 4 2110C910 212BB8C0 212BB8C0 +000000D6 20000505 C/C++ 5 2110C750 20ACCA58 20ACCA58 +00001026 20061215 CEL 6 212B6530 209000E8 209000E8 +00000070 20000421 C/C++ XPLINK EBCDIC HFP 7 212B65B0 20ACAAA0 20ACAA48 +00001252 20061215 CEL XPLINK EBCDIC HFP 8 2110C500 212BBA40 212BBA40 +000000F2 20000505 C/C++ 9 2110C340 20ACCA58 20ACCA58 +00001026 20061215 CEL 10 212B6680 20900218 20900218 +0000008C 20000421 C/C++ XPLINK EBCDIC HFP 11 212B6720 20ACAAA0 20ACAA48 +00001252 20061215 CEL XPLINK EBCDIC HFP 12 2110C0F0 20C386A8 20C386A8 +000000B4 20061214 LIBRARY 13 2110C030 20992208 20992208 +000001B6 20061215 CEL Fully Qualified Names DSA Entry Program Unit Load Module 4 tran3 ./trandll.c XNTDLL 6 tran2 ./tranmain.c XNTRAN 8 tran1 ./trandll.c XNTDLL 10 main ./tranmain.c XNTRAN Condition Information for Active Routines Condition Information for CEL4ABD0 (DSA address 2110CA60) CIB Address: 2110D428 Current Condition: CEE0198S The termination of a thread was signaled due to an unhandled condition. Original Condition: CEE3250C The system or user abend U1001 R=00000000 was issued. Location: Program Unit: CEL4ABD0 Entry: CEL4ABD0 Statement: Offset: +0000024C Machine State: ILC..... 0002 Interruption Code..... 000D PSW..... 078D1400 A0AFCC54 GPR0..... 00000000_84000000 GPR1..... 00000000_840003E9 GPR2..... 00000000_00000000 GPR3..... 00000000_2110C9B0 GPR4..... 00000000_00000001 GPR5..... 00000000_20914E10 GPR6..... 00000000_00000002 GPR7..... 00000000_00000000 GPR8..... 00000000_A0900003 GPR9..... 00000000_212BB868 GPR10.... 00000000_209BFDAC GPR11.... 00000000_20AFCA08 GPR12.... 00000000_209139B0 GPR13.... 00000000_2110CA60 GPR14.... 00000000_A09BFD46 GPR15.... 00000000_00000000 ABEND code: 000003E9 Reason code: 00000000 Storage dump near condition, beginning at location: 20AFCC44 +000000 20AFCC44 88100008 41000084 89000018 16100A0D 58D0D004 98ECD00C 07FE0000 D7C1E3C3 |h......di...........q.......PATC| GPREG STORAGE: Storage around GPR0 (04000000) -0020 03FFFFE0 Inaccessible storage. +0000 04000000 Inaccessible storage. +0020 04000020 Inaccessible storage. ...
[2]Parameters, Registers, and Variables for Active Routines: tran3 (DSA address 2110C910): UPSTACK DSA Parameters: parm5 signed int 1431655765 parm4 long double 1.234567889999999977135303197E+03 parm3 signed int 858993459 parm2 signed int 572662306 parm1 signed int 286331153 Saved Registers: GPR0..... 20914D70 GPR1..... 2110C9A8 GPR2..... 2110C9B4 GPR3..... 212BB8FA GPR4..... 2110C9B0 GPR5..... 20914E10 GPR6..... 00000000 GPR7..... 00000000 GPR8..... A0900003 GPR9..... 212BB868 GPR10.... 212BB8C0 GPR11.... 20ACDF1C GPR12.... 209139B0 GPR13.... 2110C910 GPR14.... A12BB998 GPR15.... A09BFCD0 GPREG STORAGE: Storage around GPR0 (20914D70) -0020 20914D50 00000000 00000000 00000000 00000000 00000000 00000000 00000000 00000000 |................................| +0000 20914D70 180F58FF 001007FF 212BB3A0 20914D70 212BB3B0 00000000 00000000 00000000 |.............j(.................| +0020 20914D90 180F58FF 001007FF 212BB0B0 20914D70 212BB3B0 00000000 00000000 00000000 |.............j(.................|
.
.
. Storage around GPR15(209BFCD0) -0020 209BFCB0 209BFA00 F2F0F0F6 F1F2F1F5 F1F1F5F2 F0F0F0F1 F0F9F0F0 0005C4F1 F9F0F800 |....20061215115200010900..D1908.| +0000 209BFCD0 47F0F014 00C3C5C5 00000098 000000E0 47F0F001 90ECD00C 18BF5800 B0D05810 |.00..CEE...q.....00.............| +0020 209BFCF0 D04C1E01 5500C00C 47D0B034 58F0C2BC 05EF181F 5000104C D7011000 100018FD |.<...........0B.....&..<P.......| Local Variables: timing signed long int 1 code signed long int 1001 CEEVRONU (DSA address 2110C750): TRANSITION DSA Saved Registers: GPR0..... 20914D70 GPR1..... 212B6D70 GPR2..... 212BBE18 GPR3..... 0000001F GPR4..... 212B6530 GPR5..... 21109718 GPR6..... 00000000 GPR7..... 00000000 GPR8..... A0900003 GPR9..... 212BB868 GPR10.... 212BB8C0 GPR11.... 20ACDF1C GPR12.... 209139B0 GPR13.... 2110C750 GPR14.... A0ACDA80 GPR15.... 212BB8C0 ... tran2 (DSA address 212B6530): DOWNSTACK DSA Parameters: parm5 signed int 1431655765
Chapter 4. Debugging C/C++ routines 193
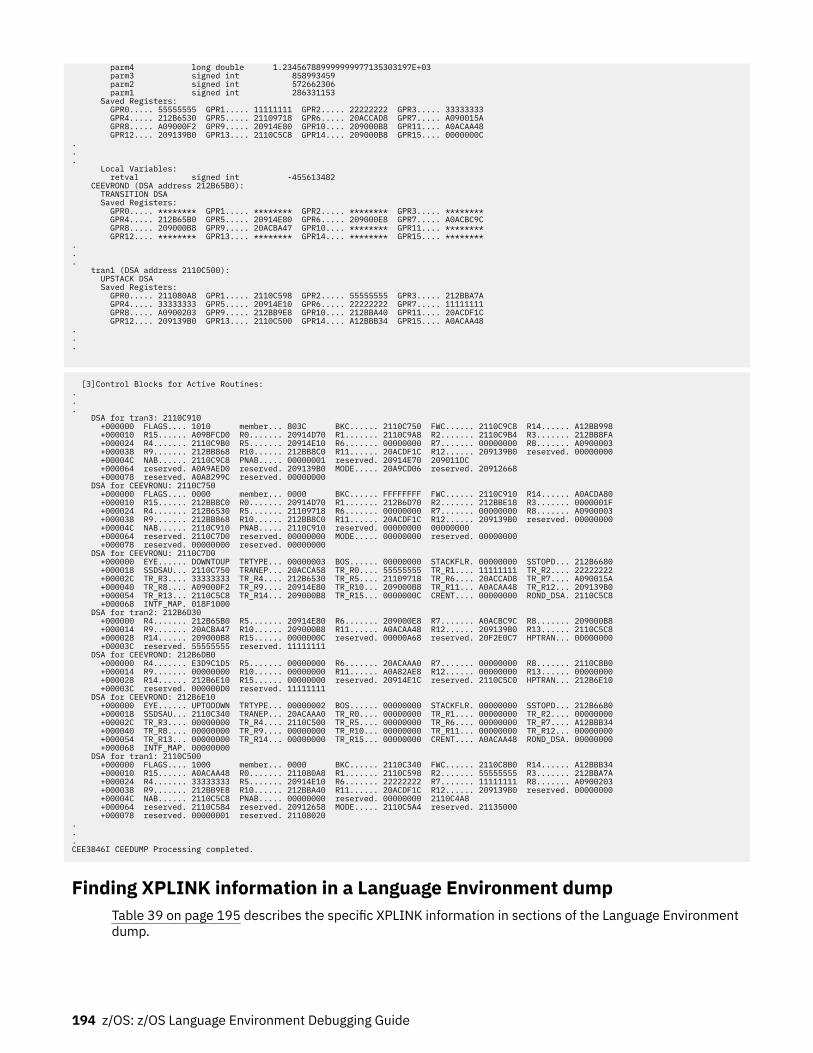
parm4 long double 1.234567889999999977135303197E+03 parm3 signed int 858993459 parm2 signed int 572662306 parm1 signed int 286331153 Saved Registers: GPR0..... 55555555 GPR1..... 11111111 GPR2..... 22222222 GPR3..... 33333333 GPR4..... 212B6530 GPR5..... 21109718 GPR6..... 20ACCAD8 GPR7..... A090015A GPR8..... A09000F2 GPR9..... 20914E80 GPR10.... 209000B8 GPR11.... A0ACAA48 GPR12.... 209139B0 GPR13.... 2110C5C8 GPR14.... 209000B8 GPR15.... 0000000C ... Local Variables: retval signed int -455613482 CEEVROND (DSA address 212B65B0): TRANSITION DSA Saved Registers: GPR0..... ******** GPR1..... ******** GPR2..... ******** GPR3..... ******** GPR4..... 212B65B0 GPR5..... 20914E80 GPR6..... 209000E8 GPR7..... A0ACBC9C GPR8..... 209000B8 GPR9..... 20ACBA47 GPR10.... ******** GPR11.... ******** GPR12.... ******** GPR13.... ******** GPR14.... ******** GPR15.... ******** ... tran1 (DSA address 2110C500): UPSTACK DSA Saved Registers: GPR0..... 211080A8 GPR1..... 2110C598 GPR2..... 55555555 GPR3..... 212BBA7A GPR4..... 33333333 GPR5..... 20914E10 GPR6..... 22222222 GPR7..... 11111111 GPR8..... A0900203 GPR9..... 212BB9E8 GPR10.... 212BBA40 GPR11.... 20ACDF1C GPR12.... 209139B0 GPR13.... 2110C500 GPR14.... A12BBB34 GPR15.... A0ACAA48 ...
[3]Control Blocks for Active Routines: ... DSA for tran3: 2110C910 +000000 FLAGS.... 1010 member... 803C BKC...... 2110C750 FWC...... 2110C9C8 R14...... A12BB998 +000010 R15...... A09BFCD0 R0....... 20914D70 R1....... 2110C9A8 R2....... 2110C9B4 R3....... 212BB8FA +000024 R4....... 2110C9B0 R5....... 20914E10 R6....... 00000000 R7....... 00000000 R8....... A0900003 +000038 R9....... 212BB868 R10...... 212BB8C0 R11...... 20ACDF1C R12...... 209139B0 reserved. 00000000 +00004C NAB...... 2110C9C8 PNAB..... 00000001 reserved. 20914E70 209011DC +000064 reserved. A0A9AED0 reserved. 209139B0 MODE..... 20A9CD06 reserved. 20912668 +000078 reserved. A0A8299C reserved. 00000000 DSA for CEEVRONU: 2110C750 +000000 FLAGS.... 0000 member... 0000 BKC...... FFFFFFFF FWC...... 2110C910 R14...... A0ACDA80 +000010 R15...... 212BB8C0 R0....... 20914D70 R1....... 212B6D70 R2....... 212BBE18 R3....... 0000001F +000024 R4....... 212B6530 R5....... 21109718 R6....... 00000000 R7....... 00000000 R8....... A0900003 +000038 R9....... 212BB868 R10...... 212BB8C0 R11...... 20ACDF1C R12...... 209139B0 reserved. 00000000 +00004C NAB...... 2110C910 PNAB..... 2110C910 reserved. 00000000 00000000 +000064 reserved. 2110C7D0 reserved. 00000000 MODE..... 00000000 reserved. 00000000 +000078 reserved. 00000000 reserved. 00000000 DSA for CEEVRONU: 2110C7D0 +000000 EYE...... DOWNTOUP TRTYPE... 00000003 BOS...... 00000000 STACKFLR. 00000000 SSTOPD... 212B6680 +000018 SSDSAU... 2110C750 TRANEP... 20ACCA58 TR_R0.... 55555555 TR_R1.... 11111111 TR_R2.... 22222222 +00002C TR_R3.... 33333333 TR_R4.... 212B6530 TR_R5.... 21109718 TR_R6.... 20ACCAD8 TR_R7.... A090015A +000040 TR_R8.... A09000F2 TR_R9.... 20914E80 TR_R10... 209000B8 TR_R11... A0ACAA48 TR_R12... 209139B0 +000054 TR_R13... 2110C5C8 TR_R14... 209000B8 TR_R15... 0000000C CRENT.... 00000000 ROND_DSA. 2110C5C8 +000068 INTF_MAP. 018F1000 DSA for tran2: 212B6D30 +000000 R4....... 212B65B0 R5....... 20914E80 R6....... 209000E8 R7....... A0ACBC9C R8....... 209000B8 +000014 R9....... 20ACBA47 R10...... 209000B8 R11...... A0ACAA48 R12...... 209139B0 R13...... 2110C5C8 +000028 R14...... 209000B8 R15...... 0000000C reserved. 00000A68 reserved. 20F2E0C7 HPTRAN... 00000000 +00003C reserved. 55555555 reserved. 11111111 DSA for CEEVROND: 212B6DB0 +000000 R4....... E3D9C1D5 R5....... 00000000 R6....... 20ACAAA0 R7....... 00000000 R8....... 2110C8B0 +000014 R9....... 00000000 R10...... 00000000 R11...... A0A82AE8 R12...... 00000000 R13...... 00000000 +000028 R14...... 212B6E10 R15...... 00000000 reserved. 20914E1C reserved. 2110C5C0 HPTRAN... 212B6E10 +00003C reserved. 000000D0 reserved. 11111111 DSA for CEEVROND: 212B6E10 +000000 EYE...... UPTODOWN TRTYPE... 00000002 BOS...... 00000000 STACKFLR. 00000000 SSTOPD... 212B6680 +000018 SSDSAU... 2110C340 TRANEP... 20ACAAA0 TR_R0.... 00000000 TR_R1.... 00000000 TR_R2.... 00000000 +00002C TR_R3.... 00000000 TR_R4.... 2110C500 TR_R5.... 00000000 TR_R6.... 00000000 TR_R7.... A12BBB34 +000040 TR_R8.... 00000000 TR_R9.... 00000000 TR_R10... 00000000 TR_R11... 00000000 TR_R12... 00000000 +000054 TR_R13... 00000000 TR_R14... 00000000 TR_R15... 00000000 CRENT.... A0ACAA48 ROND_DSA. 00000000 +000068 INTF_MAP. 00000000 DSA for tran1: 2110C500 +000000 FLAGS.... 1000 member... 0000 BKC...... 2110C340 FWC...... 2110C8B0 R14...... A12BBB34 +000010 R15...... A0ACAA48 R0....... 211080A8 R1....... 2110C598 R2....... 55555555 R3....... 212BBA7A +000024 R4....... 33333333 R5....... 20914E10 R6....... 22222222 R7....... 11111111 R8....... A0900203 +000038 R9....... 212BB9E8 R10...... 212BBA40 R11...... 20ACDF1C R12...... 209139B0 reserved. 00000000 +00004C NAB...... 2110C5C8 PNAB..... 00000000 reserved. 00000000 2110C4A8 +000064 reserved. 2110C584 reserved. 20912658 MODE..... 2110C5A4 reserved. 21135000 +000078 reserved. 00000001 reserved. 21108020 ... CEE3846I CEEDUMP Processing completed.
Finding XPLINK information in a Language Environment dumpTable 39 on page 195 describes the specific XPLINK information in sections of the Language Environmentdump.
194 z/OS: z/OS Language Environment Debugging Guide
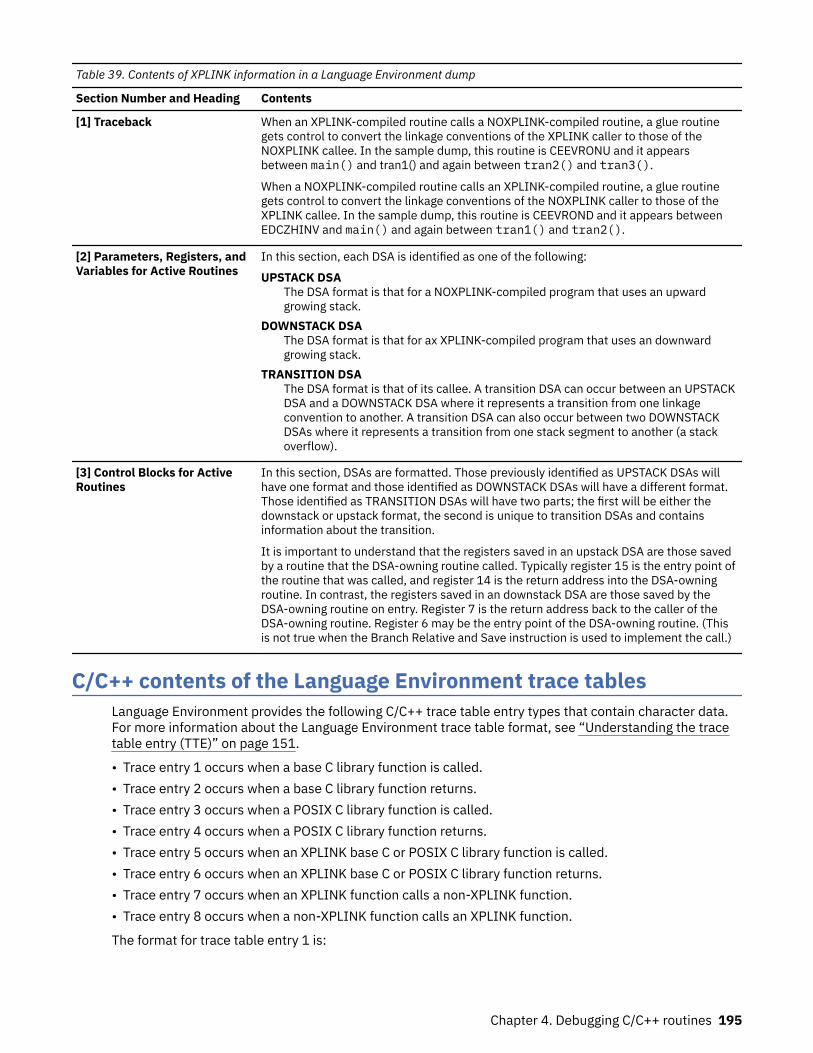
Table 39. Contents of XPLINK information in a Language Environment dump
Section Number and Heading Contents
[1] Traceback When an XPLINK-compiled routine calls a NOXPLINK-compiled routine, a glue routinegets control to convert the linkage conventions of the XPLINK caller to those of theNOXPLINK callee. In the sample dump, this routine is CEEVRONU and it appearsbetween main() and tran1() and again between tran2() and tran3().
When a NOXPLINK-compiled routine calls an XPLINK-compiled routine, a glue routinegets control to convert the linkage conventions of the NOXPLINK caller to those of theXPLINK callee. In the sample dump, this routine is CEEVROND and it appears betweenEDCZHINV and main() and again between tran1() and tran2().
[2] Parameters, Registers, andVariables for Active Routines
In this section, each DSA is identified as one of the following:
UPSTACK DSAThe DSA format is that for a NOXPLINK-compiled program that uses an upwardgrowing stack.
DOWNSTACK DSAThe DSA format is that for ax XPLINK-compiled program that uses an downwardgrowing stack.
TRANSITION DSAThe DSA format is that of its callee. A transition DSA can occur between an UPSTACKDSA and a DOWNSTACK DSA where it represents a transition from one linkageconvention to another. A transition DSA can also occur between two DOWNSTACKDSAs where it represents a transition from one stack segment to another (a stackoverflow).
[3] Control Blocks for ActiveRoutines
In this section, DSAs are formatted. Those previously identified as UPSTACK DSAs willhave one format and those identified as DOWNSTACK DSAs will have a different format.Those identified as TRANSITION DSAs will have two parts; the first will be either thedownstack or upstack format, the second is unique to transition DSAs and containsinformation about the transition.
It is important to understand that the registers saved in an upstack DSA are those savedby a routine that the DSA-owning routine called. Typically register 15 is the entry point ofthe routine that was called, and register 14 is the return address into the DSA-owningroutine. In contrast, the registers saved in an downstack DSA are those saved by theDSA-owning routine on entry. Register 7 is the return address back to the caller of theDSA-owning routine. Register 6 may be the entry point of the DSA-owning routine. (Thisis not true when the Branch Relative and Save instruction is used to implement the call.)
C/C++ contents of the Language Environment trace tablesLanguage Environment provides the following C/C++ trace table entry types that contain character data.For more information about the Language Environment trace table format, see “Understanding the tracetable entry (TTE)” on page 151.
• Trace entry 1 occurs when a base C library function is called.• Trace entry 2 occurs when a base C library function returns.• Trace entry 3 occurs when a POSIX C library function is called.• Trace entry 4 occurs when a POSIX C library function returns.• Trace entry 5 occurs when an XPLINK base C or POSIX C library function is called.• Trace entry 6 occurs when an XPLINK base C or POSIX C library function returns.• Trace entry 7 occurs when an XPLINK function calls a non-XPLINK function.• Trace entry 8 occurs when a non-XPLINK function calls an XPLINK function.
The format for trace table entry 1 is:
Chapter 4. Debugging C/C++ routines 195
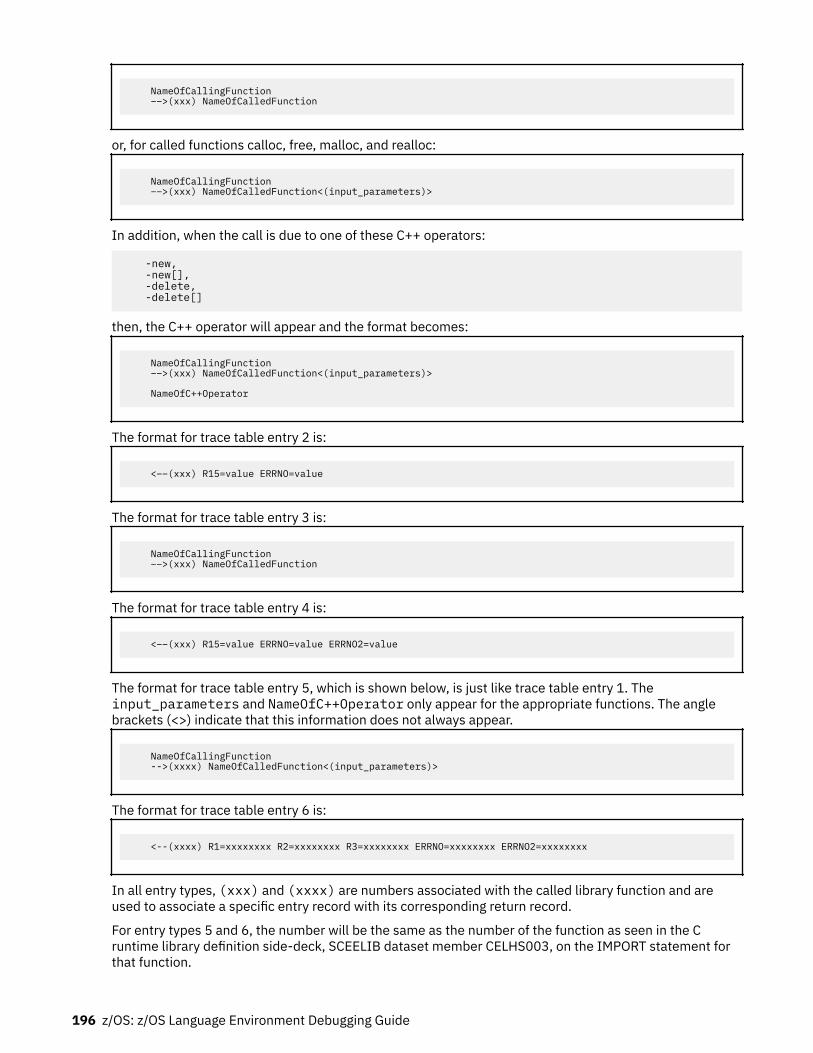
NameOfCallingFunction ––>(xxx) NameOfCalledFunction
or, for called functions calloc, free, malloc, and realloc:
NameOfCallingFunction ––>(xxx) NameOfCalledFunction<(input_parameters)>
In addition, when the call is due to one of these C++ operators:
-new, -new[], -delete, -delete[]
then, the C++ operator will appear and the format becomes:
NameOfCallingFunction ––>(xxx) NameOfCalledFunction<(input_parameters)> NameOfC++Operator
The format for trace table entry 2 is:
<––(xxx) R15=value ERRNO=value
The format for trace table entry 3 is:
NameOfCallingFunction ––>(xxx) NameOfCalledFunction
The format for trace table entry 4 is:
<––(xxx) R15=value ERRNO=value ERRNO2=value
The format for trace table entry 5, which is shown below, is just like trace table entry 1. Theinput_parameters and NameOfC++Operator only appear for the appropriate functions. The anglebrackets (<>) indicate that this information does not always appear.
NameOfCallingFunction -->(xxxx) NameOfCalledFunction<(input_parameters)>
The format for trace table entry 6 is:
<--(xxxx) R1=xxxxxxxx R2=xxxxxxxx R3=xxxxxxxx ERRNO=xxxxxxxx ERRNO2=xxxxxxxx
In all entry types, (xxx) and (xxxx) are numbers associated with the called library function and areused to associate a specific entry record with its corresponding return record.
For entry types 5 and 6, the number will be the same as the number of the function as seen in the Cruntime library definition side-deck, SCEELIB dataset member CELHS003, on the IMPORT statement forthat function.
196 z/OS: z/OS Language Environment Debugging Guide
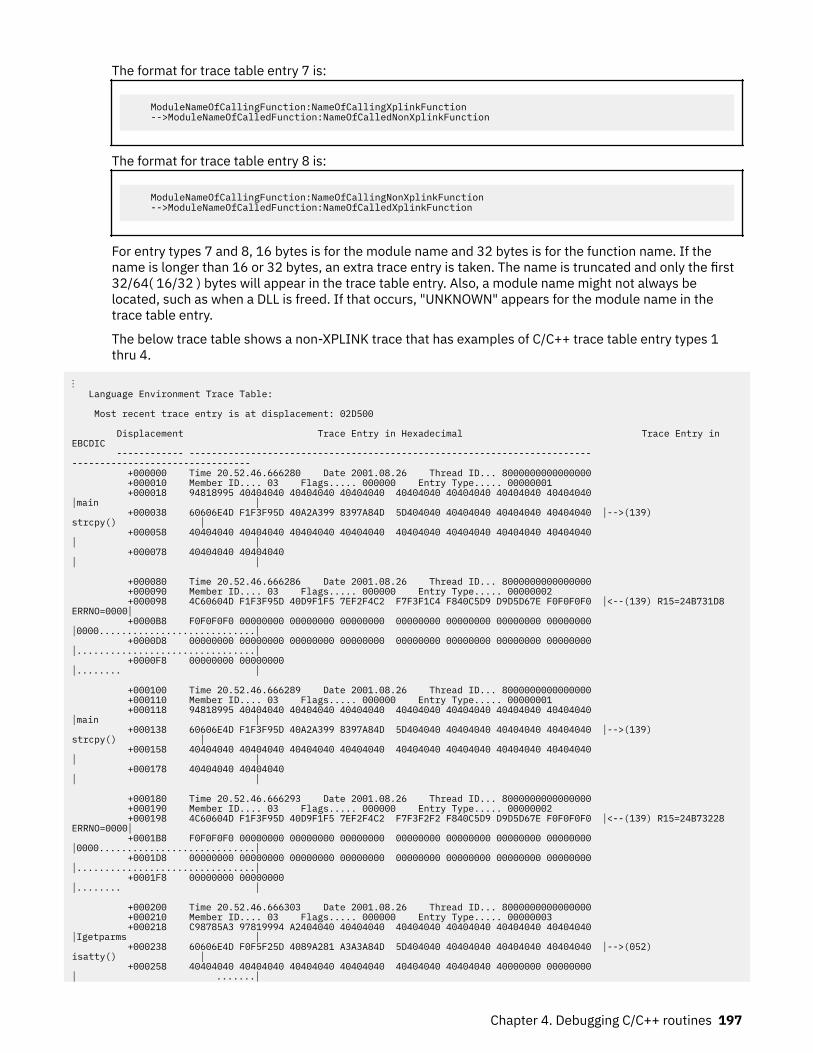
The format for trace table entry 7 is:
ModuleNameOfCallingFunction:NameOfCallingXplinkFunction -->ModuleNameOfCalledFunction:NameOfCalledNonXplinkFunction
The format for trace table entry 8 is:
ModuleNameOfCallingFunction:NameOfCallingNonXplinkFunction -->ModuleNameOfCalledFunction:NameOfCalledXplinkFunction
For entry types 7 and 8, 16 bytes is for the module name and 32 bytes is for the function name. If thename is longer than 16 or 32 bytes, an extra trace entry is taken. The name is truncated and only the first32/64( 16/32 ) bytes will appear in the trace table entry. Also, a module name might not always belocated, such as when a DLL is freed. If that occurs, "UNKNOWN" appears for the module name in thetrace table entry.
The below trace table shows a non-XPLINK trace that has examples of C/C++ trace table entry types 1thru 4.
⋮ Language Environment Trace Table:
Most recent trace entry is at displacement: 02D500
Displacement Trace Entry in Hexadecimal Trace Entry in EBCDIC ------------ ------------------------------------------------------------------------ -------------------------------- +000000 Time 20.52.46.666280 Date 2001.08.26 Thread ID... 8000000000000000 +000010 Member ID.... 03 Flags..... 000000 Entry Type..... 00000001 +000018 94818995 40404040 40404040 40404040 40404040 40404040 40404040 40404040 │main │ +000038 60606E4D F1F3F95D 40A2A399 8397A84D 5D404040 40404040 40404040 40404040 │-->(139) strcpy() │ +000058 40404040 40404040 40404040 40404040 40404040 40404040 40404040 40404040 │ │ +000078 40404040 40404040 │ │
+000080 Time 20.52.46.666286 Date 2001.08.26 Thread ID... 8000000000000000 +000090 Member ID.... 03 Flags..... 000000 Entry Type..... 00000002 +000098 4C60604D F1F3F95D 40D9F1F5 7EF2F4C2 F7F3F1C4 F840C5D9 D9D5D67E F0F0F0F0 │<--(139) R15=24B731D8 ERRNO=0000│ +0000B8 F0F0F0F0 00000000 00000000 00000000 00000000 00000000 00000000 00000000 │0000............................│ +0000D8 00000000 00000000 00000000 00000000 00000000 00000000 00000000 00000000 │................................│ +0000F8 00000000 00000000 │........ │
+000100 Time 20.52.46.666289 Date 2001.08.26 Thread ID... 8000000000000000 +000110 Member ID.... 03 Flags..... 000000 Entry Type..... 00000001 +000118 94818995 40404040 40404040 40404040 40404040 40404040 40404040 40404040 │main │ +000138 60606E4D F1F3F95D 40A2A399 8397A84D 5D404040 40404040 40404040 40404040 │-->(139) strcpy() │ +000158 40404040 40404040 40404040 40404040 40404040 40404040 40404040 40404040 │ │ +000178 40404040 40404040 │ │
+000180 Time 20.52.46.666293 Date 2001.08.26 Thread ID... 8000000000000000 +000190 Member ID.... 03 Flags..... 000000 Entry Type..... 00000002 +000198 4C60604D F1F3F95D 40D9F1F5 7EF2F4C2 F7F3F2F2 F840C5D9 D9D5D67E F0F0F0F0 │<--(139) R15=24B73228 ERRNO=0000│ +0001B8 F0F0F0F0 00000000 00000000 00000000 00000000 00000000 00000000 00000000 │0000............................│ +0001D8 00000000 00000000 00000000 00000000 00000000 00000000 00000000 00000000 │................................│ +0001F8 00000000 00000000 │........ │
+000200 Time 20.52.46.666303 Date 2001.08.26 Thread ID... 8000000000000000 +000210 Member ID.... 03 Flags..... 000000 Entry Type..... 00000003 +000218 C98785A3 97819994 A2404040 40404040 40404040 40404040 40404040 40404040 │Igetparms │ +000238 60606E4D F0F5F25D 4089A281 A3A3A84D 5D404040 40404040 40404040 40404040 │-->(052) isatty() │ +000258 40404040 40404040 40404040 40404040 40404040 40404040 40000000 00000000 │ .......│
Chapter 4. Debugging C/C++ routines 197
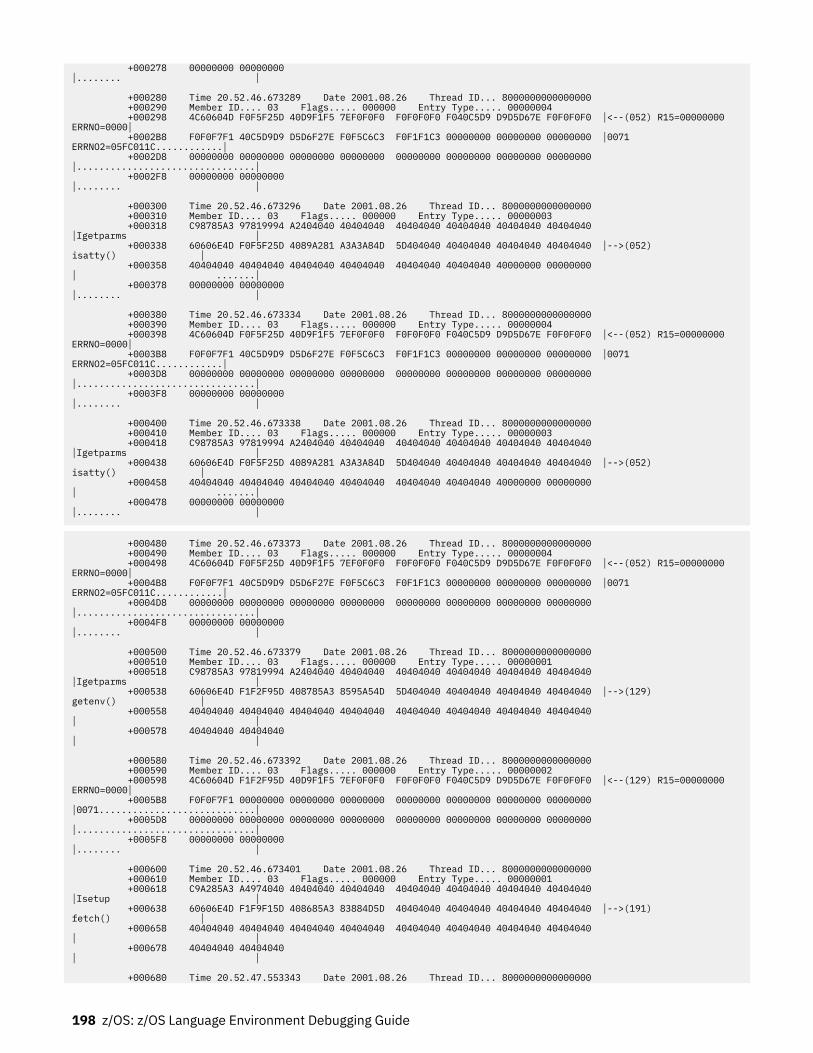
+000278 00000000 00000000 │........ │
+000280 Time 20.52.46.673289 Date 2001.08.26 Thread ID... 8000000000000000 +000290 Member ID.... 03 Flags..... 000000 Entry Type..... 00000004 +000298 4C60604D F0F5F25D 40D9F1F5 7EF0F0F0 F0F0F0F0 F040C5D9 D9D5D67E F0F0F0F0 │<--(052) R15=00000000 ERRNO=0000│ +0002B8 F0F0F7F1 40C5D9D9 D5D6F27E F0F5C6C3 F0F1F1C3 00000000 00000000 00000000 │0071 ERRNO2=05FC011C............│ +0002D8 00000000 00000000 00000000 00000000 00000000 00000000 00000000 00000000 │................................│ +0002F8 00000000 00000000 │........ │
+000300 Time 20.52.46.673296 Date 2001.08.26 Thread ID... 8000000000000000 +000310 Member ID.... 03 Flags..... 000000 Entry Type..... 00000003 +000318 C98785A3 97819994 A2404040 40404040 40404040 40404040 40404040 40404040 │Igetparms │ +000338 60606E4D F0F5F25D 4089A281 A3A3A84D 5D404040 40404040 40404040 40404040 │-->(052) isatty() │ +000358 40404040 40404040 40404040 40404040 40404040 40404040 40000000 00000000 │ .......│ +000378 00000000 00000000 │........ │
+000380 Time 20.52.46.673334 Date 2001.08.26 Thread ID... 8000000000000000 +000390 Member ID.... 03 Flags..... 000000 Entry Type..... 00000004 +000398 4C60604D F0F5F25D 40D9F1F5 7EF0F0F0 F0F0F0F0 F040C5D9 D9D5D67E F0F0F0F0 │<--(052) R15=00000000 ERRNO=0000│ +0003B8 F0F0F7F1 40C5D9D9 D5D6F27E F0F5C6C3 F0F1F1C3 00000000 00000000 00000000 │0071 ERRNO2=05FC011C............│ +0003D8 00000000 00000000 00000000 00000000 00000000 00000000 00000000 00000000 │................................│ +0003F8 00000000 00000000 │........ │
+000400 Time 20.52.46.673338 Date 2001.08.26 Thread ID... 8000000000000000 +000410 Member ID.... 03 Flags..... 000000 Entry Type..... 00000003 +000418 C98785A3 97819994 A2404040 40404040 40404040 40404040 40404040 40404040 │Igetparms │ +000438 60606E4D F0F5F25D 4089A281 A3A3A84D 5D404040 40404040 40404040 40404040 │-->(052) isatty() │ +000458 40404040 40404040 40404040 40404040 40404040 40404040 40000000 00000000 │ .......│ +000478 00000000 00000000 │........ │
+000480 Time 20.52.46.673373 Date 2001.08.26 Thread ID... 8000000000000000 +000490 Member ID.... 03 Flags..... 000000 Entry Type..... 00000004 +000498 4C60604D F0F5F25D 40D9F1F5 7EF0F0F0 F0F0F0F0 F040C5D9 D9D5D67E F0F0F0F0 │<--(052) R15=00000000 ERRNO=0000│ +0004B8 F0F0F7F1 40C5D9D9 D5D6F27E F0F5C6C3 F0F1F1C3 00000000 00000000 00000000 │0071 ERRNO2=05FC011C............│ +0004D8 00000000 00000000 00000000 00000000 00000000 00000000 00000000 00000000 │................................│ +0004F8 00000000 00000000 │........ │
+000500 Time 20.52.46.673379 Date 2001.08.26 Thread ID... 8000000000000000 +000510 Member ID.... 03 Flags..... 000000 Entry Type..... 00000001 +000518 C98785A3 97819994 A2404040 40404040 40404040 40404040 40404040 40404040 │Igetparms │ +000538 60606E4D F1F2F95D 408785A3 8595A54D 5D404040 40404040 40404040 40404040 │-->(129) getenv() │ +000558 40404040 40404040 40404040 40404040 40404040 40404040 40404040 40404040 │ │ +000578 40404040 40404040 │ │
+000580 Time 20.52.46.673392 Date 2001.08.26 Thread ID... 8000000000000000 +000590 Member ID.... 03 Flags..... 000000 Entry Type..... 00000002 +000598 4C60604D F1F2F95D 40D9F1F5 7EF0F0F0 F0F0F0F0 F040C5D9 D9D5D67E F0F0F0F0 │<--(129) R15=00000000 ERRNO=0000│ +0005B8 F0F0F7F1 00000000 00000000 00000000 00000000 00000000 00000000 00000000 │0071............................│ +0005D8 00000000 00000000 00000000 00000000 00000000 00000000 00000000 00000000 │................................│ +0005F8 00000000 00000000 │........ │
+000600 Time 20.52.46.673401 Date 2001.08.26 Thread ID... 8000000000000000 +000610 Member ID.... 03 Flags..... 000000 Entry Type..... 00000001 +000618 C9A285A3 A4974040 40404040 40404040 40404040 40404040 40404040 40404040 │Isetup │ +000638 60606E4D F1F9F15D 408685A3 83884D5D 40404040 40404040 40404040 40404040 │-->(191) fetch() │ +000658 40404040 40404040 40404040 40404040 40404040 40404040 40404040 40404040 │ │ +000678 40404040 40404040 │ │
+000680 Time 20.52.47.553343 Date 2001.08.26 Thread ID... 8000000000000000
198 z/OS: z/OS Language Environment Debugging Guide
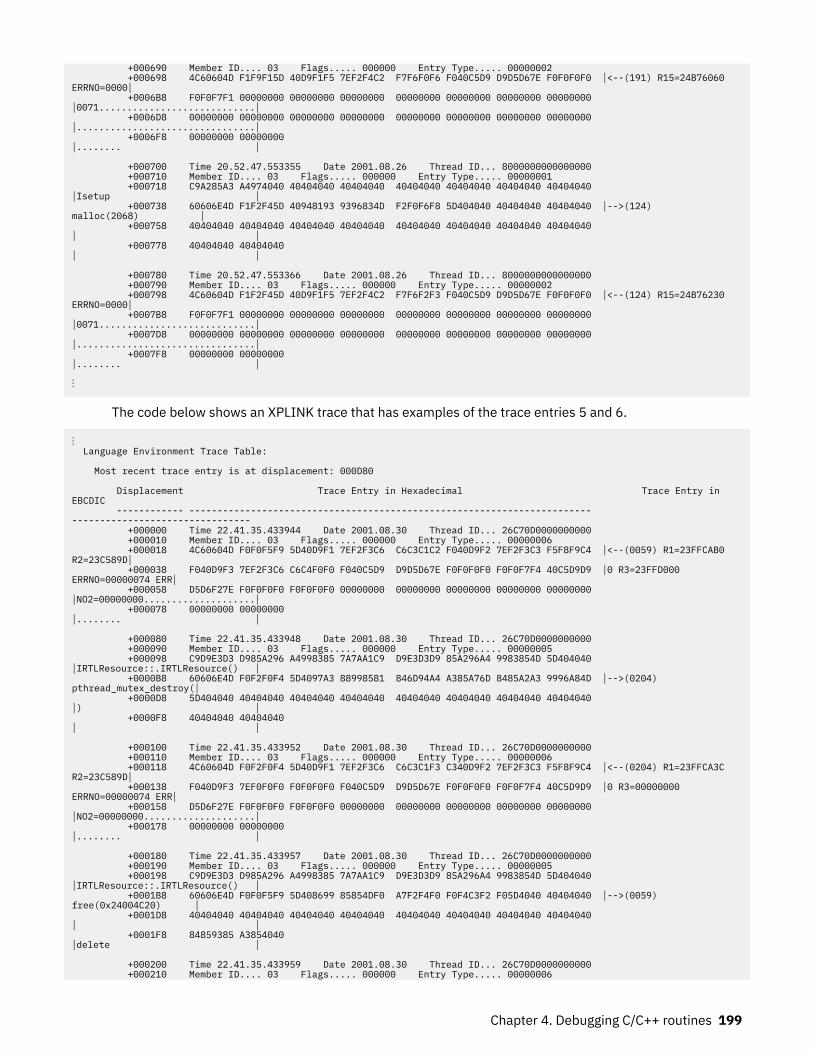
+000690 Member ID.... 03 Flags..... 000000 Entry Type..... 00000002 +000698 4C60604D F1F9F15D 40D9F1F5 7EF2F4C2 F7F6F0F6 F040C5D9 D9D5D67E F0F0F0F0 │<--(191) R15=24B76060 ERRNO=0000│ +0006B8 F0F0F7F1 00000000 00000000 00000000 00000000 00000000 00000000 00000000 │0071............................│ +0006D8 00000000 00000000 00000000 00000000 00000000 00000000 00000000 00000000 │................................│ +0006F8 00000000 00000000 │........ │
+000700 Time 20.52.47.553355 Date 2001.08.26 Thread ID... 8000000000000000 +000710 Member ID.... 03 Flags..... 000000 Entry Type..... 00000001 +000718 C9A285A3 A4974040 40404040 40404040 40404040 40404040 40404040 40404040 │Isetup │ +000738 60606E4D F1F2F45D 40948193 9396834D F2F0F6F8 5D404040 40404040 40404040 │-->(124) malloc(2068) │ +000758 40404040 40404040 40404040 40404040 40404040 40404040 40404040 40404040 │ │ +000778 40404040 40404040 │ │
+000780 Time 20.52.47.553366 Date 2001.08.26 Thread ID... 8000000000000000 +000790 Member ID.... 03 Flags..... 000000 Entry Type..... 00000002 +000798 4C60604D F1F2F45D 40D9F1F5 7EF2F4C2 F7F6F2F3 F040C5D9 D9D5D67E F0F0F0F0 │<--(124) R15=24B76230 ERRNO=0000│ +0007B8 F0F0F7F1 00000000 00000000 00000000 00000000 00000000 00000000 00000000 │0071............................│ +0007D8 00000000 00000000 00000000 00000000 00000000 00000000 00000000 00000000 │................................│ +0007F8 00000000 00000000 │........ │
⋮
The code below shows an XPLINK trace that has examples of the trace entries 5 and 6.
⋮ Language Environment Trace Table:
Most recent trace entry is at displacement: 000D80
Displacement Trace Entry in Hexadecimal Trace Entry in EBCDIC ------------ ------------------------------------------------------------------------ -------------------------------- +000000 Time 22.41.35.433944 Date 2001.08.30 Thread ID... 26C70D0000000000 +000010 Member ID.... 03 Flags..... 000000 Entry Type..... 00000006 +000018 4C60604D F0F0F5F9 5D40D9F1 7EF2F3C6 C6C3C1C2 F040D9F2 7EF2F3C3 F5F8F9C4 │<--(0059) R1=23FFCAB0 R2=23C589D│ +000038 F040D9F3 7EF2F3C6 C6C4F0F0 F040C5D9 D9D5D67E F0F0F0F0 F0F0F7F4 40C5D9D9 │0 R3=23FFD000 ERRNO=00000074 ERR│ +000058 D5D6F27E F0F0F0F0 F0F0F0F0 00000000 00000000 00000000 00000000 00000000 │NO2=00000000....................│ +000078 00000000 00000000 │........ │
+000080 Time 22.41.35.433948 Date 2001.08.30 Thread ID... 26C70D0000000000 +000090 Member ID.... 03 Flags..... 000000 Entry Type..... 00000005 +000098 C9D9E3D3 D985A296 A4998385 7A7AA1C9 D9E3D3D9 85A296A4 9983854D 5D404040 │IRTLResource::.IRTLResource() │ +0000B8 60606E4D F0F2F0F4 5D4097A3 88998581 846D94A4 A385A76D 8485A2A3 9996A84D │-->(0204) pthread_mutex_destroy(│ +0000D8 5D404040 40404040 40404040 40404040 40404040 40404040 40404040 40404040 │) │ +0000F8 40404040 40404040 │ │
+000100 Time 22.41.35.433952 Date 2001.08.30 Thread ID... 26C70D0000000000 +000110 Member ID.... 03 Flags..... 000000 Entry Type..... 00000006 +000118 4C60604D F0F2F0F4 5D40D9F1 7EF2F3C6 C6C3C1F3 C340D9F2 7EF2F3C3 F5F8F9C4 │<--(0204) R1=23FFCA3C R2=23C589D│ +000138 F040D9F3 7EF0F0F0 F0F0F0F0 F040C5D9 D9D5D67E F0F0F0F0 F0F0F7F4 40C5D9D9 │0 R3=00000000 ERRNO=00000074 ERR│ +000158 D5D6F27E F0F0F0F0 F0F0F0F0 00000000 00000000 00000000 00000000 00000000 │NO2=00000000....................│ +000178 00000000 00000000 │........ │
+000180 Time 22.41.35.433957 Date 2001.08.30 Thread ID... 26C70D0000000000 +000190 Member ID.... 03 Flags..... 000000 Entry Type..... 00000005 +000198 C9D9E3D3 D985A296 A4998385 7A7AA1C9 D9E3D3D9 85A296A4 9983854D 5D404040 │IRTLResource::.IRTLResource() │ +0001B8 60606E4D F0F0F5F9 5D408699 85854DF0 A7F2F4F0 F0F4C3F2 F05D4040 40404040 │-->(0059) free(0x24004C20) │ +0001D8 40404040 40404040 40404040 40404040 40404040 40404040 40404040 40404040 │ │ +0001F8 84859385 A3854040 │delete │
+000200 Time 22.41.35.433959 Date 2001.08.30 Thread ID... 26C70D0000000000 +000210 Member ID.... 03 Flags..... 000000 Entry Type..... 00000006
Chapter 4. Debugging C/C++ routines 199
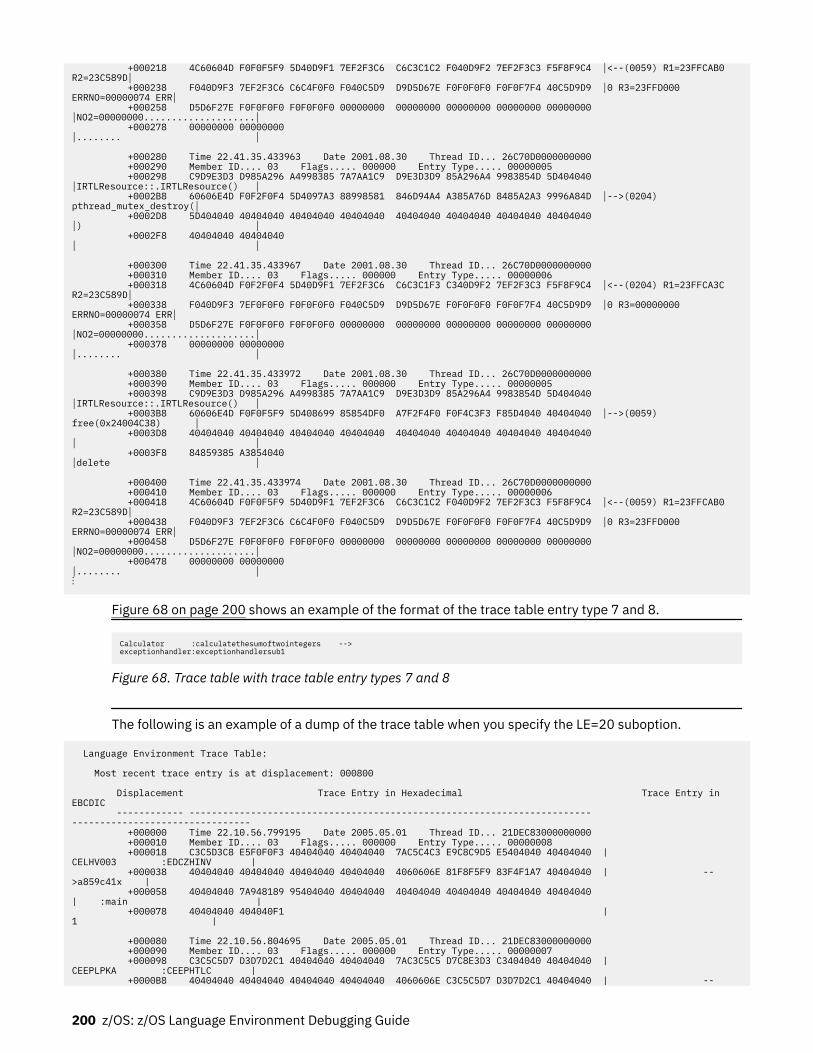
+000218 4C60604D F0F0F5F9 5D40D9F1 7EF2F3C6 C6C3C1C2 F040D9F2 7EF2F3C3 F5F8F9C4 │<--(0059) R1=23FFCAB0 R2=23C589D│ +000238 F040D9F3 7EF2F3C6 C6C4F0F0 F040C5D9 D9D5D67E F0F0F0F0 F0F0F7F4 40C5D9D9 │0 R3=23FFD000 ERRNO=00000074 ERR│ +000258 D5D6F27E F0F0F0F0 F0F0F0F0 00000000 00000000 00000000 00000000 00000000 │NO2=00000000....................│ +000278 00000000 00000000 │........ │
+000280 Time 22.41.35.433963 Date 2001.08.30 Thread ID... 26C70D0000000000 +000290 Member ID.... 03 Flags..... 000000 Entry Type..... 00000005 +000298 C9D9E3D3 D985A296 A4998385 7A7AA1C9 D9E3D3D9 85A296A4 9983854D 5D404040 │IRTLResource::.IRTLResource() │ +0002B8 60606E4D F0F2F0F4 5D4097A3 88998581 846D94A4 A385A76D 8485A2A3 9996A84D │-->(0204) pthread_mutex_destroy(│ +0002D8 5D404040 40404040 40404040 40404040 40404040 40404040 40404040 40404040 │) │ +0002F8 40404040 40404040 │ │
+000300 Time 22.41.35.433967 Date 2001.08.30 Thread ID... 26C70D0000000000 +000310 Member ID.... 03 Flags..... 000000 Entry Type..... 00000006 +000318 4C60604D F0F2F0F4 5D40D9F1 7EF2F3C6 C6C3C1F3 C340D9F2 7EF2F3C3 F5F8F9C4 │<--(0204) R1=23FFCA3C R2=23C589D│ +000338 F040D9F3 7EF0F0F0 F0F0F0F0 F040C5D9 D9D5D67E F0F0F0F0 F0F0F7F4 40C5D9D9 │0 R3=00000000 ERRNO=00000074 ERR│ +000358 D5D6F27E F0F0F0F0 F0F0F0F0 00000000 00000000 00000000 00000000 00000000 │NO2=00000000....................│ +000378 00000000 00000000 │........ │
+000380 Time 22.41.35.433972 Date 2001.08.30 Thread ID... 26C70D0000000000 +000390 Member ID.... 03 Flags..... 000000 Entry Type..... 00000005 +000398 C9D9E3D3 D985A296 A4998385 7A7AA1C9 D9E3D3D9 85A296A4 9983854D 5D404040 │IRTLResource::.IRTLResource() │ +0003B8 60606E4D F0F0F5F9 5D408699 85854DF0 A7F2F4F0 F0F4C3F3 F85D4040 40404040 │-->(0059) free(0x24004C38) │ +0003D8 40404040 40404040 40404040 40404040 40404040 40404040 40404040 40404040 │ │ +0003F8 84859385 A3854040 │delete │
+000400 Time 22.41.35.433974 Date 2001.08.30 Thread ID... 26C70D0000000000 +000410 Member ID.... 03 Flags..... 000000 Entry Type..... 00000006 +000418 4C60604D F0F0F5F9 5D40D9F1 7EF2F3C6 C6C3C1C2 F040D9F2 7EF2F3C3 F5F8F9C4 │<--(0059) R1=23FFCAB0 R2=23C589D│ +000438 F040D9F3 7EF2F3C6 C6C4F0F0 F040C5D9 D9D5D67E F0F0F0F0 F0F0F7F4 40C5D9D9 │0 R3=23FFD000 ERRNO=00000074 ERR│ +000458 D5D6F27E F0F0F0F0 F0F0F0F0 00000000 00000000 00000000 00000000 00000000 │NO2=00000000....................│ +000478 00000000 00000000 │........ │⋮
Figure 68 on page 200 shows an example of the format of the trace table entry type 7 and 8.
Calculator :calculatethesumoftwointegers -->exceptionhandler:exceptionhandlersub1
Figure 68. Trace table with trace table entry types 7 and 8
The following is an example of a dump of the trace table when you specify the LE=20 suboption.
Language Environment Trace Table: Most recent trace entry is at displacement: 000800 Displacement Trace Entry in Hexadecimal Trace Entry in EBCDIC ------------ ------------------------------------------------------------------------ -------------------------------- +000000 Time 22.10.56.799195 Date 2005.05.01 Thread ID... 21DEC83000000000 +000010 Member ID.... 03 Flags..... 000000 Entry Type..... 00000008 +000018 C3C5D3C8 E5F0F0F3 40404040 40404040 7AC5C4C3 E9C8C9D5 E5404040 40404040 |CELHV003 :EDCZHINV | +000038 40404040 40404040 40404040 40404040 4060606E 81F8F5F9 83F4F1A7 40404040 | -->a859c41x | +000058 40404040 7A948189 95404040 40404040 40404040 40404040 40404040 40404040 | :main | +000078 40404040 404040F1 | 1 | +000080 Time 22.10.56.804695 Date 2005.05.01 Thread ID... 21DEC83000000000 +000090 Member ID.... 03 Flags..... 000000 Entry Type..... 00000007 +000098 C3C5C5D7 D3D7D2C1 40404040 40404040 7AC3C5C5 D7C8E3D3 C3404040 40404040 |CEEPLPKA :CEEPHTLC | +0000B8 40404040 40404040 40404040 40404040 4060606E C3C5C5D7 D3D7D2C1 40404040 | --
200 z/OS: z/OS Language Environment Debugging Guide
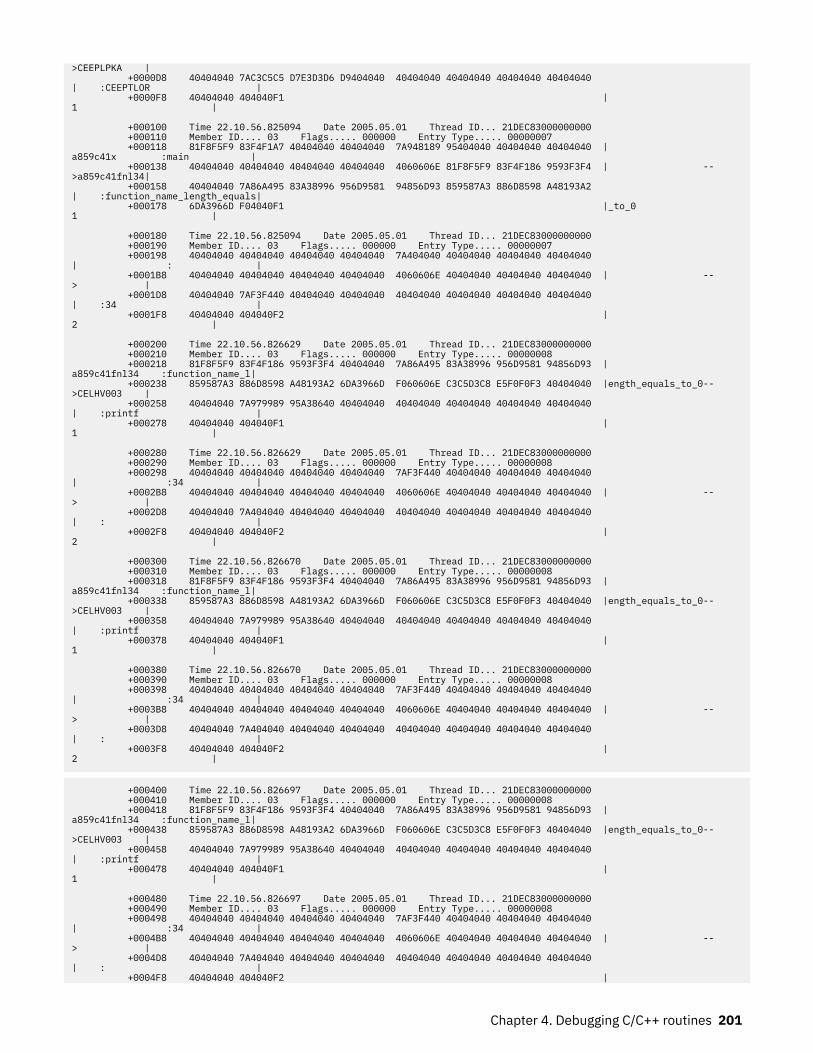
>CEEPLPKA | +0000D8 40404040 7AC3C5C5 D7E3D3D6 D9404040 40404040 40404040 40404040 40404040 | :CEEPTLOR | +0000F8 40404040 404040F1 | 1 | +000100 Time 22.10.56.825094 Date 2005.05.01 Thread ID... 21DEC83000000000 +000110 Member ID.... 03 Flags..... 000000 Entry Type..... 00000007 +000118 81F8F5F9 83F4F1A7 40404040 40404040 7A948189 95404040 40404040 40404040 |a859c41x :main | +000138 40404040 40404040 40404040 40404040 4060606E 81F8F5F9 83F4F186 9593F3F4 | -->a859c41fnl34| +000158 40404040 7A86A495 83A38996 956D9581 94856D93 859587A3 886D8598 A48193A2 | :function_name_length_equals| +000178 6DA3966D F04040F1 |_to_0 1 | +000180 Time 22.10.56.825094 Date 2005.05.01 Thread ID... 21DEC83000000000 +000190 Member ID.... 03 Flags..... 000000 Entry Type..... 00000007 +000198 40404040 40404040 40404040 40404040 7A404040 40404040 40404040 40404040 | : | +0001B8 40404040 40404040 40404040 40404040 4060606E 40404040 40404040 40404040 | --> | +0001D8 40404040 7AF3F440 40404040 40404040 40404040 40404040 40404040 40404040 | :34 | +0001F8 40404040 404040F2 | 2 | +000200 Time 22.10.56.826629 Date 2005.05.01 Thread ID... 21DEC83000000000 +000210 Member ID.... 03 Flags..... 000000 Entry Type..... 00000008 +000218 81F8F5F9 83F4F186 9593F3F4 40404040 7A86A495 83A38996 956D9581 94856D93 |a859c41fnl34 :function_name_l| +000238 859587A3 886D8598 A48193A2 6DA3966D F060606E C3C5D3C8 E5F0F0F3 40404040 |ength_equals_to_0-->CELHV003 | +000258 40404040 7A979989 95A38640 40404040 40404040 40404040 40404040 40404040 | :printf | +000278 40404040 404040F1 | 1 | +000280 Time 22.10.56.826629 Date 2005.05.01 Thread ID... 21DEC83000000000 +000290 Member ID.... 03 Flags..... 000000 Entry Type..... 00000008 +000298 40404040 40404040 40404040 40404040 7AF3F440 40404040 40404040 40404040 | :34 | +0002B8 40404040 40404040 40404040 40404040 4060606E 40404040 40404040 40404040 | --> | +0002D8 40404040 7A404040 40404040 40404040 40404040 40404040 40404040 40404040 | : | +0002F8 40404040 404040F2 | 2 | +000300 Time 22.10.56.826670 Date 2005.05.01 Thread ID... 21DEC83000000000 +000310 Member ID.... 03 Flags..... 000000 Entry Type..... 00000008 +000318 81F8F5F9 83F4F186 9593F3F4 40404040 7A86A495 83A38996 956D9581 94856D93 |a859c41fnl34 :function_name_l| +000338 859587A3 886D8598 A48193A2 6DA3966D F060606E C3C5D3C8 E5F0F0F3 40404040 |ength_equals_to_0-->CELHV003 | +000358 40404040 7A979989 95A38640 40404040 40404040 40404040 40404040 40404040 | :printf | +000378 40404040 404040F1 | 1 | +000380 Time 22.10.56.826670 Date 2005.05.01 Thread ID... 21DEC83000000000 +000390 Member ID.... 03 Flags..... 000000 Entry Type..... 00000008 +000398 40404040 40404040 40404040 40404040 7AF3F440 40404040 40404040 40404040 | :34 | +0003B8 40404040 40404040 40404040 40404040 4060606E 40404040 40404040 40404040 | --> | +0003D8 40404040 7A404040 40404040 40404040 40404040 40404040 40404040 40404040 | : | +0003F8 40404040 404040F2 | 2 |
+000400 Time 22.10.56.826697 Date 2005.05.01 Thread ID... 21DEC83000000000 +000410 Member ID.... 03 Flags..... 000000 Entry Type..... 00000008 +000418 81F8F5F9 83F4F186 9593F3F4 40404040 7A86A495 83A38996 956D9581 94856D93 |a859c41fnl34 :function_name_l| +000438 859587A3 886D8598 A48193A2 6DA3966D F060606E C3C5D3C8 E5F0F0F3 40404040 |ength_equals_to_0-->CELHV003 | +000458 40404040 7A979989 95A38640 40404040 40404040 40404040 40404040 40404040 | :printf | +000478 40404040 404040F1 | 1 | +000480 Time 22.10.56.826697 Date 2005.05.01 Thread ID... 21DEC83000000000 +000490 Member ID.... 03 Flags..... 000000 Entry Type..... 00000008 +000498 40404040 40404040 40404040 40404040 7AF3F440 40404040 40404040 40404040 | :34 | +0004B8 40404040 40404040 40404040 40404040 4060606E 40404040 40404040 40404040 | --> | +0004D8 40404040 7A404040 40404040 40404040 40404040 40404040 40404040 40404040 | : | +0004F8 40404040 404040F2 |
Chapter 4. Debugging C/C++ routines 201
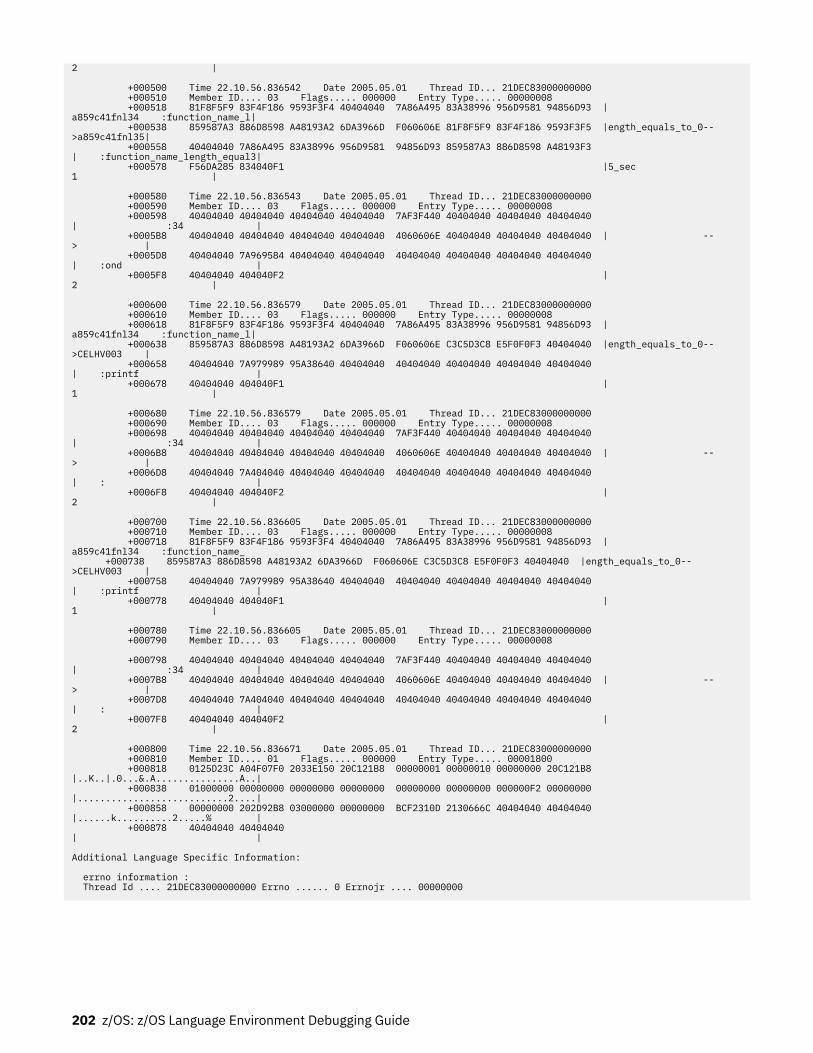
2 | +000500 Time 22.10.56.836542 Date 2005.05.01 Thread ID... 21DEC83000000000 +000510 Member ID.... 03 Flags..... 000000 Entry Type..... 00000008 +000518 81F8F5F9 83F4F186 9593F3F4 40404040 7A86A495 83A38996 956D9581 94856D93 |a859c41fnl34 :function_name_l| +000538 859587A3 886D8598 A48193A2 6DA3966D F060606E 81F8F5F9 83F4F186 9593F3F5 |ength_equals_to_0-->a859c41fnl35| +000558 40404040 7A86A495 83A38996 956D9581 94856D93 859587A3 886D8598 A48193F3 | :function_name_length_equal3| +000578 F56DA285 834040F1 |5_sec 1 | +000580 Time 22.10.56.836543 Date 2005.05.01 Thread ID... 21DEC83000000000 +000590 Member ID.... 03 Flags..... 000000 Entry Type..... 00000008 +000598 40404040 40404040 40404040 40404040 7AF3F440 40404040 40404040 40404040 | :34 | +0005B8 40404040 40404040 40404040 40404040 4060606E 40404040 40404040 40404040 | --> | +0005D8 40404040 7A969584 40404040 40404040 40404040 40404040 40404040 40404040 | :ond | +0005F8 40404040 404040F2 | 2 | +000600 Time 22.10.56.836579 Date 2005.05.01 Thread ID... 21DEC83000000000 +000610 Member ID.... 03 Flags..... 000000 Entry Type..... 00000008 +000618 81F8F5F9 83F4F186 9593F3F4 40404040 7A86A495 83A38996 956D9581 94856D93 |a859c41fnl34 :function_name_l| +000638 859587A3 886D8598 A48193A2 6DA3966D F060606E C3C5D3C8 E5F0F0F3 40404040 |ength_equals_to_0-->CELHV003 | +000658 40404040 7A979989 95A38640 40404040 40404040 40404040 40404040 40404040 | :printf | +000678 40404040 404040F1 | 1 | +000680 Time 22.10.56.836579 Date 2005.05.01 Thread ID... 21DEC83000000000 +000690 Member ID.... 03 Flags..... 000000 Entry Type..... 00000008 +000698 40404040 40404040 40404040 40404040 7AF3F440 40404040 40404040 40404040 | :34 | +0006B8 40404040 40404040 40404040 40404040 4060606E 40404040 40404040 40404040 | --> | +0006D8 40404040 7A404040 40404040 40404040 40404040 40404040 40404040 40404040 | : | +0006F8 40404040 404040F2 | 2 | +000700 Time 22.10.56.836605 Date 2005.05.01 Thread ID... 21DEC83000000000 +000710 Member ID.... 03 Flags..... 000000 Entry Type..... 00000008 +000718 81F8F5F9 83F4F186 9593F3F4 40404040 7A86A495 83A38996 956D9581 94856D93 |a859c41fnl34 :function_name_ +000738 859587A3 886D8598 A48193A2 6DA3966D F060606E C3C5D3C8 E5F0F0F3 40404040 |ength_equals_to_0-->CELHV003 | +000758 40404040 7A979989 95A38640 40404040 40404040 40404040 40404040 40404040 | :printf | +000778 40404040 404040F1 | 1 | +000780 Time 22.10.56.836605 Date 2005.05.01 Thread ID... 21DEC83000000000 +000790 Member ID.... 03 Flags..... 000000 Entry Type..... 00000008 +000798 40404040 40404040 40404040 40404040 7AF3F440 40404040 40404040 40404040 | :34 | +0007B8 40404040 40404040 40404040 40404040 4060606E 40404040 40404040 40404040 | --> | +0007D8 40404040 7A404040 40404040 40404040 40404040 40404040 40404040 40404040 | : | +0007F8 40404040 404040F2 | 2 | +000800 Time 22.10.56.836671 Date 2005.05.01 Thread ID... 21DEC83000000000 +000810 Member ID.... 01 Flags..... 000000 Entry Type..... 00001800 +000818 0125D23C A04F07F0 2033E150 20C121B8 00000001 00000010 00000000 20C121B8 |..K..|.0...&.A...............A..| +000838 01000000 00000000 00000000 00000000 00000000 00000000 000000F2 00000000 |...........................2....| +000858 00000000 202D92B8 03000000 00000000 BCF2310D 2130666C 40404040 40404040 |......k..........2.....% | +000878 40404040 40404040 | | Additional Language Specific Information: errno information : Thread Id .... 21DEC83000000000 Errno ...... 0 Errnojr .... 00000000
202 z/OS: z/OS Language Environment Debugging Guide
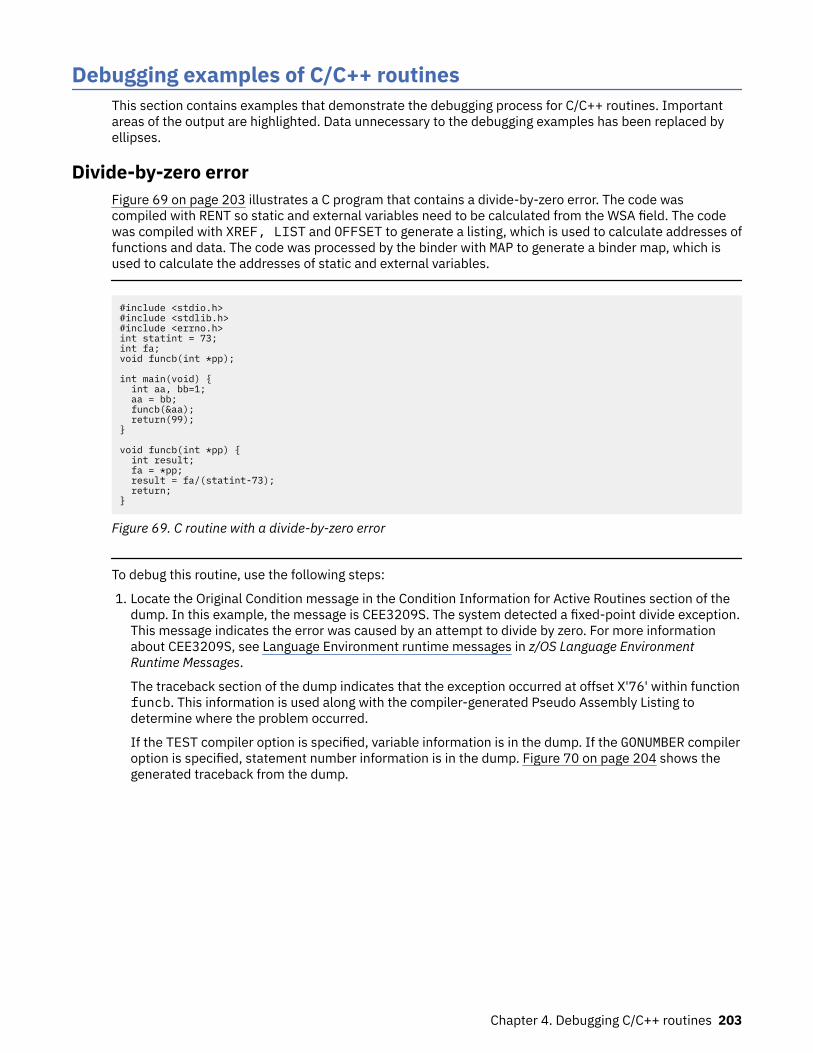
Debugging examples of C/C++ routinesThis section contains examples that demonstrate the debugging process for C/C++ routines. Importantareas of the output are highlighted. Data unnecessary to the debugging examples has been replaced byellipses.
Divide-by-zero errorFigure 69 on page 203 illustrates a C program that contains a divide-by-zero error. The code wascompiled with RENT so static and external variables need to be calculated from the WSA field. The codewas compiled with XREF, LIST and OFFSET to generate a listing, which is used to calculate addresses offunctions and data. The code was processed by the binder with MAP to generate a binder map, which isused to calculate the addresses of static and external variables.
#include <stdio.h>#include <stdlib.h>#include <errno.h>int statint = 73;int fa;void funcb(int *pp);
int main(void) { int aa, bb=1; aa = bb; funcb(&aa); return(99);}
void funcb(int *pp) { int result; fa = *pp; result = fa/(statint-73); return;}
Figure 69. C routine with a divide-by-zero error
To debug this routine, use the following steps:
1. Locate the Original Condition message in the Condition Information for Active Routines section of thedump. In this example, the message is CEE3209S. The system detected a fixed-point divide exception.This message indicates the error was caused by an attempt to divide by zero. For more informationabout CEE3209S, see Language Environment runtime messages in z/OS Language EnvironmentRuntime Messages.
The traceback section of the dump indicates that the exception occurred at offset X'76' within functionfuncb. This information is used along with the compiler-generated Pseudo Assembly Listing todetermine where the problem occurred.
If the TEST compiler option is specified, variable information is in the dump. If the GONUMBER compileroption is specified, statement number information is in the dump. Figure 70 on page 204 shows thegenerated traceback from the dump.
Chapter 4. Debugging C/C++ routines 203
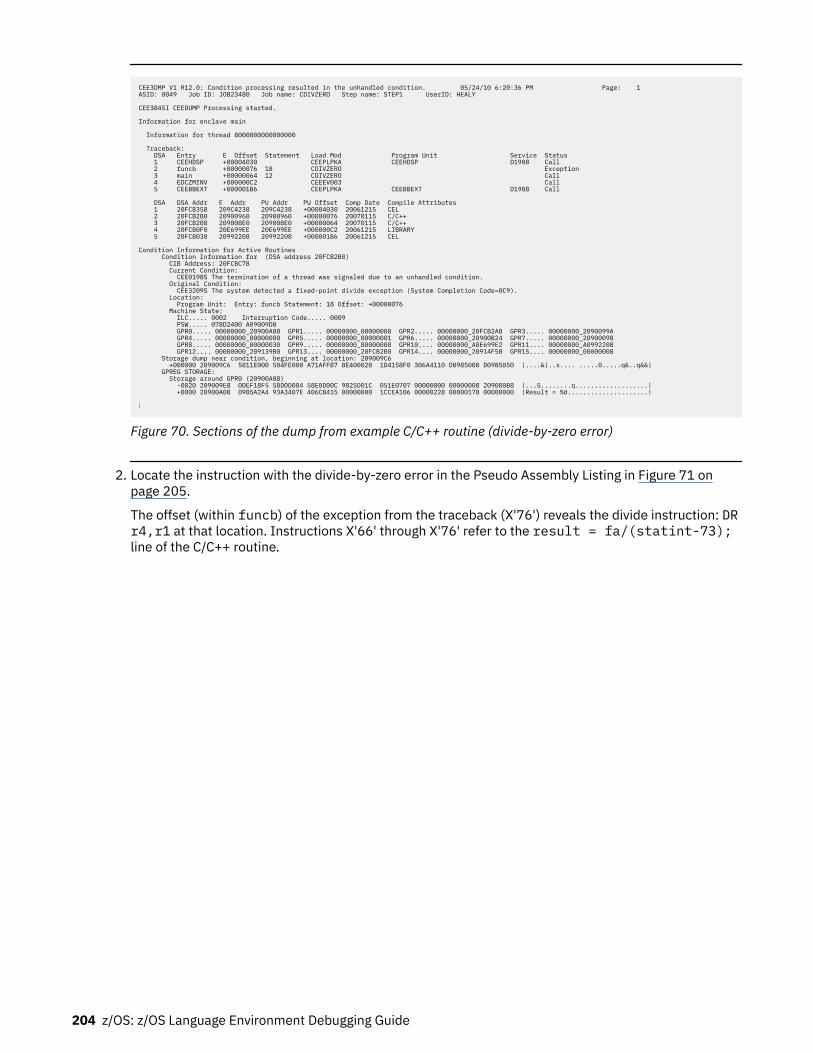
CEE3DMP V1 R12.0: Condition processing resulted in the unhandled condition. 05/24/10 6:20:36 PM Page: 1 ASID: 0049 Job ID: JOB23480 Job name: CDIVZERO Step name: STEP1 UserID: HEALY CEE3845I CEEDUMP Processing started. Information for enclave main Information for thread 8000000000000000 Traceback: DSA Entry E Offset Statement Load Mod Program Unit Service Status 1 CEEHDSP +00004030 CEEPLPKA CEEHDSP D1908 Call 2 funcb +00000076 18 CDIVZERO Exception 3 main +00000064 12 CDIVZERO Call 4 EDCZMINV +000000C2 CEEEV003 Call 5 CEEBBEXT +000001B6 CEEPLPKA CEEBBEXT D1908 Call DSA DSA Addr E Addr PU Addr PU Offset Comp Date Compile Attributes 1 20FCB358 209C4238 209C4238 +00004030 20061215 CEL 2 20FCB2B0 20900960 20900960 +00000076 20070115 C/C++ 3 20FCB208 209008E0 209008E0 +00000064 20070115 C/C++ 4 20FCB0F0 20E699EE 20E699EE +000000C2 20061215 LIBRARY 5 20FCB030 20992208 20992208 +000001B6 20061215 CEL
Condition Information for Active Routines Condition Information for (DSA address 20FCB2B0) CIB Address: 20FCBC78 Current Condition: CEE0198S The termination of a thread was signaled due to an unhandled condition. Original Condition: CEE3209S The system detected a fixed-point divide exception (System Completion Code=0C9). Location: Program Unit: Entry: funcb Statement: 18 Offset: +00000076 Machine State: ILC..... 0002 Interruption Code..... 0009 PSW..... 078D2400 A09009D8 GPR0..... 00000000_20900A08 GPR1..... 00000000_00000000 GPR2..... 00000000_20FCB2A8 GPR3..... 00000000_2090099A GPR4..... 00000000_00000000 GPR5..... 00000000_00000001 GPR6..... 00000000_20900B24 GPR7..... 00000000_20900098 GPR8..... 00000000_00000030 GPR9..... 00000000_80000000 GPR10.... 00000000_A0E699E2 GPR11.... 00000000_A0992208 GPR12.... 00000000_209139B0 GPR13.... 00000000_20FCB2B0 GPR14.... 00000000_20914F50 GPR15.... 00000000_00000008 Storage dump near condition, beginning at location: 209009C6 +000000 209009C6 5811E000 504FE000 A71AFFB7 8E400020 1D4158F0 306A4110 D0985000 D0985050 |....&|..x.... .....0.....q&..q&&| GPREG STORAGE: Storage around GPR0 (20900A08) -0020 209009E8 0DEF18F5 58D0D004 58E0D00C 9825D01C 051E0707 00000000 00000008 209000B8 |...5........q...................| +0000 20900A08 D985A2A4 93A3407E 406C8415 00000000 1CCEA106 00000228 00000178 00000000 |Result = %d.....................|
⋮
Figure 70. Sections of the dump from example C/C++ routine (divide-by-zero error)
2. Locate the instruction with the divide-by-zero error in the Pseudo Assembly Listing in Figure 71 onpage 205.
The offset (within funcb) of the exception from the traceback (X'76') reveals the divide instruction: DRr4,r1 at that location. Instructions X'66' through X'76' refer to the result = fa/(statint-73);line of the C/C++ routine.
204 z/OS: z/OS Language Environment Debugging Guide
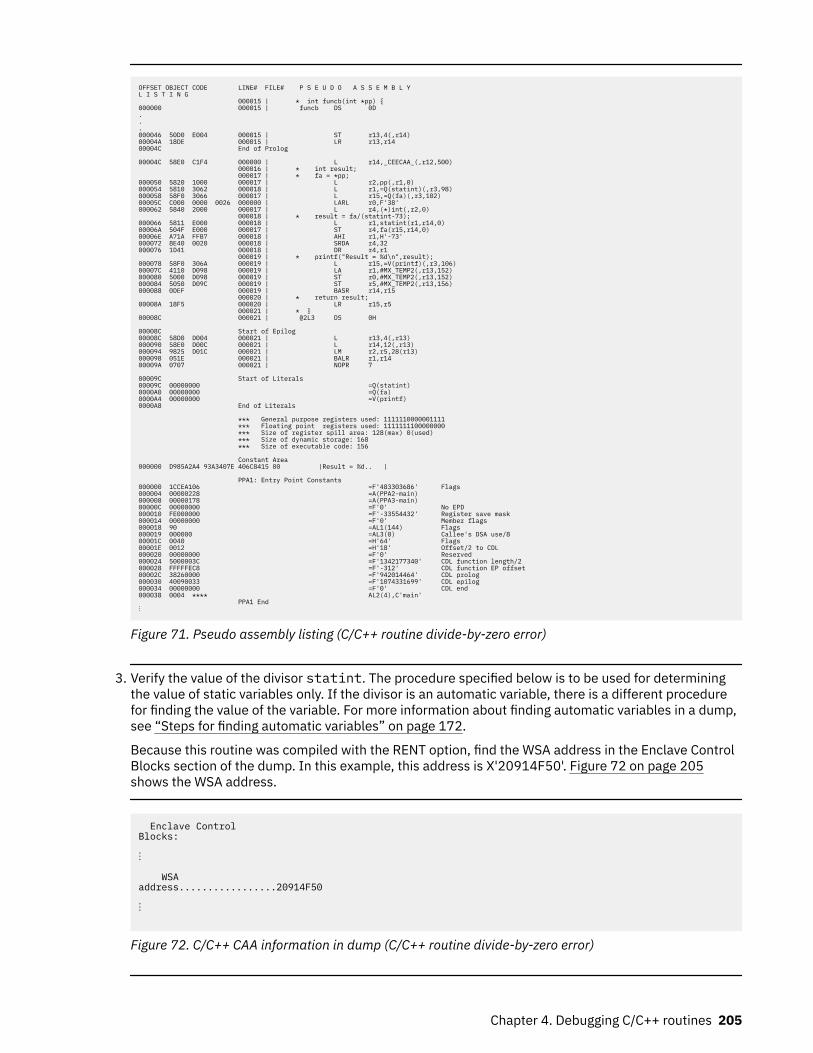
OFFSET OBJECT CODE LINE# FILE# P S E U D O A S S E M B L Y L I S T I N G 000015 | * int funcb(int *pp) { 000000 000015 | funcb DS 0D . . . 000046 50D0 E004 000015 | ST r13,4(,r14) 00004A 18DE 000015 | LR r13,r14 00004C End of Prolog 00004C 58E0 C1F4 000000 | L r14,_CEECAA_(,r12,500) 000016 | * int result; 000017 | * fa = *pp; 000050 5820 1000 000017 | L r2,pp(,r1,0) 000054 5810 3062 000018 | L r1,=Q(statint)(,r3,98) 000058 58F0 3066 000017 | L r15,=Q(fa)(,r3,102) 00005C C000 0000 0026 000000 | LARL r0,F'38' 000062 5840 2000 000017 | L r4,(*)int(,r2,0) 000018 | * result = fa/(statint-73); 000066 5811 E000 000018 | L r1,statint(r1,r14,0) 00006A 504F E000 000017 | ST r4,fa(r15,r14,0) 00006E A71A FFB7 000018 | AHI r1,H'-73' 000072 8E40 0020 000018 | SRDA r4,32 000076 1D41 000018 | DR r4,r1 000019 | * printf("Result = %d\n",result); 000078 58F0 306A 000019 | L r15,=V(printf)(,r3,106) 00007C 4110 D098 000019 | LA r1,#MX_TEMP2(,r13,152) 000080 5000 D098 000019 | ST r0,#MX_TEMP2(,r13,152) 000084 5050 D09C 000019 | ST r5,#MX_TEMP2(,r13,156) 000088 0DEF 000019 | BASR r14,r15 000020 | * return result; 00008A 18F5 000020 | LR r15,r5 000021 | * } 00008C 000021 | @2L3 DS 0H 00008C Start of Epilog 00008C 58D0 D004 000021 | L r13,4(,r13) 000090 58E0 D00C 000021 | L r14,12(,r13) 000094 9825 D01C 000021 | LM r2,r5,28(r13) 000098 051E 000021 | BALR r1,r14 00009A 0707 000021 | NOPR 7 00009C Start of Literals 00009C 00000000 =Q(statint) 0000A0 00000000 =Q(fa) 0000A4 00000000 =V(printf) 0000A8 End of Literals *** General purpose registers used: 1111110000001111 *** Floating point registers used: 1111111100000000 *** Size of register spill area: 128(max) 0(used) *** Size of dynamic storage: 168 *** Size of executable code: 156 Constant Area 000000 D985A2A4 93A3407E 406C8415 00 |Result = %d.. | PPA1: Entry Point Constants 000000 1CCEA106 =F'483303686' Flags 000004 00000228 =A(PPA2-main) 000008 00000178 =A(PPA3-main) 00000C 00000000 =F'0' No EPD 000010 FE000000 =F'-33554432' Register save mask 000014 00000000 =F'0' Member flags 000018 90 =AL1(144) Flags 000019 000000 =AL3(0) Callee's DSA use/8 00001C 0040 =H'64' Flags 00001E 0012 =H'18' Offset/2 to CDL 000020 00000000 =F'0' Reserved 000024 5000003C =F'1342177340' CDL function length/2 000028 FFFFFEC8 =F'-312' CDL function EP offset 00002C 38260000 =F'942014464' CDL prolog 000030 40090033 =F'1074331699' CDL epilog 000034 00000000 =F'0' CDL end 000038 0004 **** AL2(4),C'main' PPA1 End ⋮
Figure 71. Pseudo assembly listing (C/C++ routine divide-by-zero error)
3. Verify the value of the divisor statint. The procedure specified below is to be used for determiningthe value of static variables only. If the divisor is an automatic variable, there is a different procedurefor finding the value of the variable. For more information about finding automatic variables in a dump,see “Steps for finding automatic variables” on page 172.
Because this routine was compiled with the RENT option, find the WSA address in the Enclave ControlBlocks section of the dump. In this example, this address is X'20914F50'. Figure 72 on page 205shows the WSA address.
Enclave Control Blocks: ⋮ WSA address.................20914F50 ⋮
Figure 72. C/C++ CAA information in dump (C/C++ routine divide-by-zero error)
Chapter 4. Debugging C/C++ routines 205
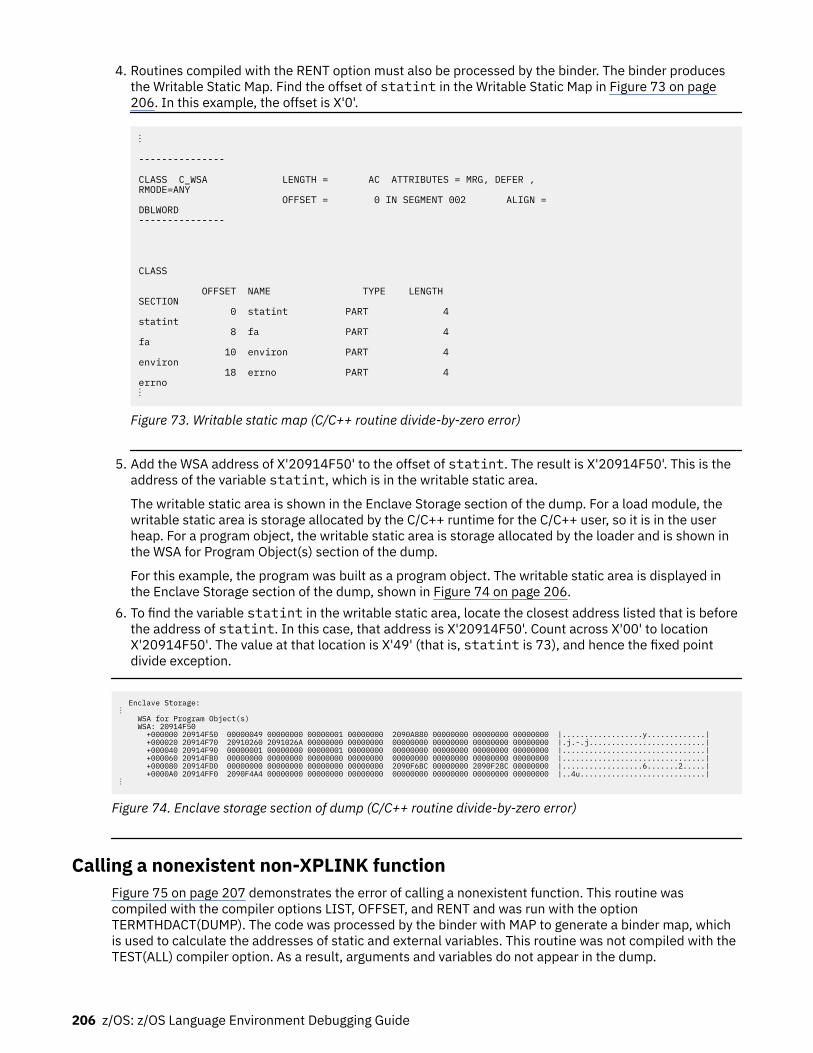
4. Routines compiled with the RENT option must also be processed by the binder. The binder producesthe Writable Static Map. Find the offset of statint in the Writable Static Map in Figure 73 on page206. In this example, the offset is X'0'.
⋮ --------------- CLASS C_WSA LENGTH = AC ATTRIBUTES = MRG, DEFER , RMODE=ANY OFFSET = 0 IN SEGMENT 002 ALIGN = DBLWORD --------------- CLASS OFFSET NAME TYPE LENGTH SECTION 0 statint PART 4 statint 8 fa PART 4 fa 10 environ PART 4 environ 18 errno PART 4 errno ⋮
Figure 73. Writable static map (C/C++ routine divide-by-zero error)
5. Add the WSA address of X'20914F50' to the offset of statint. The result is X'20914F50'. This is theaddress of the variable statint, which is in the writable static area.
The writable static area is shown in the Enclave Storage section of the dump. For a load module, thewritable static area is storage allocated by the C/C++ runtime for the C/C++ user, so it is in the userheap. For a program object, the writable static area is storage allocated by the loader and is shown inthe WSA for Program Object(s) section of the dump.
For this example, the program was built as a program object. The writable static area is displayed inthe Enclave Storage section of the dump, shown in Figure 74 on page 206.
6. To find the variable statint in the writable static area, locate the closest address listed that is beforethe address of statint. In this case, that address is X'20914F50'. Count across X'00' to locationX'20914F50'. The value at that location is X'49' (that is, statint is 73), and hence the fixed pointdivide exception.
Enclave Storage: ⋮ WSA for Program Object(s) WSA: 20914F50 +000000 20914F50 00000049 00000000 00000001 00000000 2090A880 00000000 00000000 00000000 |..................y.............| +000020 20914F70 20910260 2091026A 00000000 00000000 00000000 00000000 00000000 00000000 |.j.-.j..........................| +000040 20914F90 00000001 00000000 00000001 00000000 00000000 00000000 00000000 00000000 |................................| +000060 20914FB0 00000000 00000000 00000000 00000000 00000000 00000000 00000000 00000000 |................................| +000080 20914FD0 00000000 00000000 00000000 00000000 2090F6BC 00000000 2090F28C 00000000 |..................6.......2.....| +0000A0 20914FF0 2090F4A4 00000000 00000000 00000000 00000000 00000000 00000000 00000000 |..4u............................|⋮
Figure 74. Enclave storage section of dump (C/C++ routine divide-by-zero error)
Calling a nonexistent non-XPLINK functionFigure 75 on page 207 demonstrates the error of calling a nonexistent function. This routine wascompiled with the compiler options LIST, OFFSET, and RENT and was run with the optionTERMTHDACT(DUMP). The code was processed by the binder with MAP to generate a binder map, whichis used to calculate the addresses of static and external variables. This routine was not compiled with theTEST(ALL) compiler option. As a result, arguments and variables do not appear in the dump.
206 z/OS: z/OS Language Environment Debugging Guide
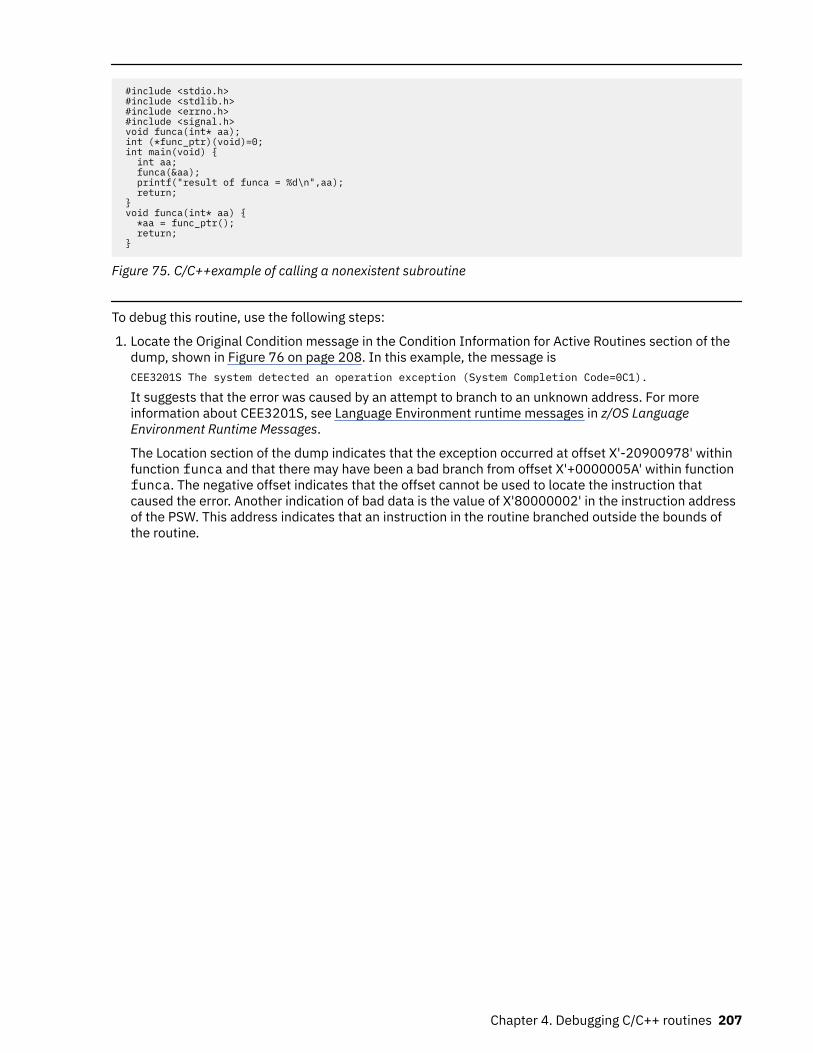
#include <stdio.h> #include <stdlib.h> #include <errno.h> #include <signal.h> void funca(int* aa); int (*func_ptr)(void)=0; int main(void) { int aa; funca(&aa); printf("result of funca = %d\n",aa); return; } void funca(int* aa) { *aa = func_ptr(); return; }
Figure 75. C/C++example of calling a nonexistent subroutine
To debug this routine, use the following steps:
1. Locate the Original Condition message in the Condition Information for Active Routines section of thedump, shown in Figure 76 on page 208. In this example, the message isCEE3201S The system detected an operation exception (System Completion Code=0C1).
It suggests that the error was caused by an attempt to branch to an unknown address. For moreinformation about CEE3201S, see Language Environment runtime messages in z/OS LanguageEnvironment Runtime Messages.
The Location section of the dump indicates that the exception occurred at offset X'-20900978' withinfunction funca and that there may have been a bad branch from offset X'+0000005A' within functionfunca. The negative offset indicates that the offset cannot be used to locate the instruction thatcaused the error. Another indication of bad data is the value of X'80000002' in the instruction addressof the PSW. This address indicates that an instruction in the routine branched outside the bounds ofthe routine.
Chapter 4. Debugging C/C++ routines 207
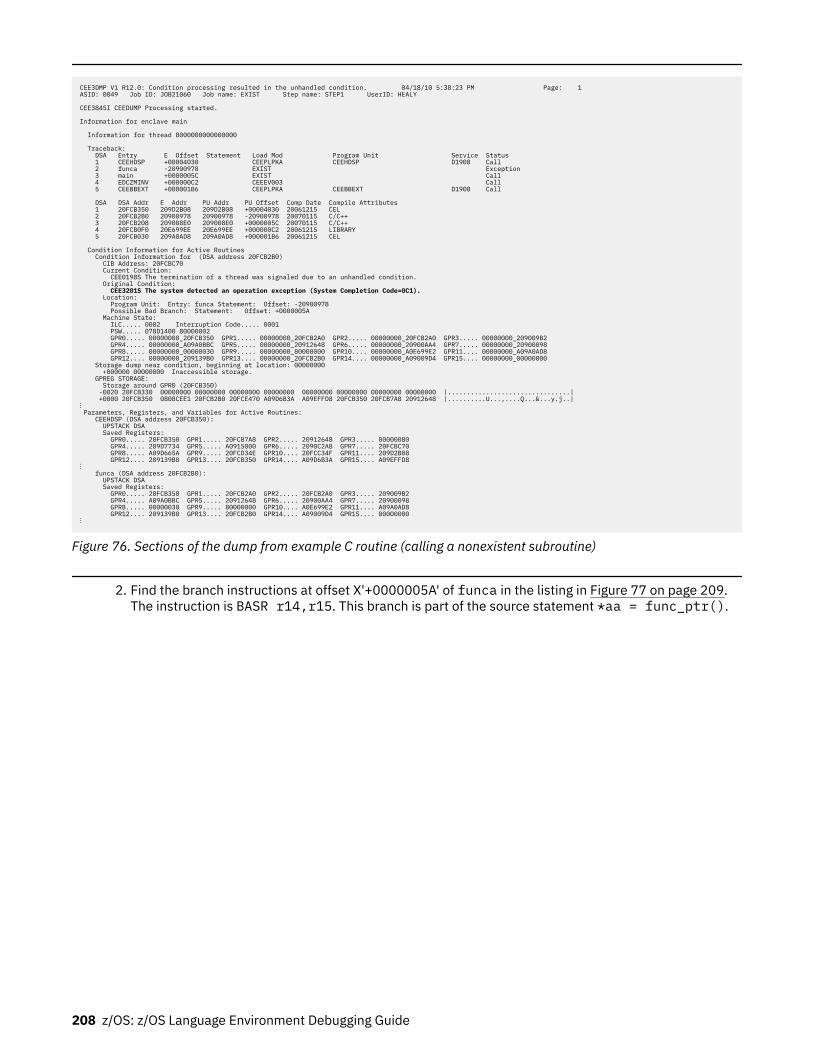
CEE3DMP V1 R12.0: Condition processing resulted in the unhandled condition. 04/18/10 5:38:23 PM Page: 1 ASID: 0049 Job ID: JOB21060 Job name: EXIST Step name: STEP1 UserID: HEALY CEE3845I CEEDUMP Processing started. Information for enclave main Information for thread 8000000000000000 Traceback: DSA Entry E Offset Statement Load Mod Program Unit Service Status 1 CEEHDSP +00004030 CEEPLPKA CEEHDSP D1908 Call 2 funca -20900978 EXIST Exception 3 main +0000005C EXIST Call 4 EDCZMINV +000000C2 CEEEV003 Call 5 CEEBBEXT +000001B6 CEEPLPKA CEEBBEXT D1908 Call DSA DSA Addr E Addr PU Addr PU Offset Comp Date Compile Attributes 1 20FCB350 209D2B08 209D2B08 +00004030 20061215 CEL 2 20FCB2B0 20900978 20900978 -20900978 20070115 C/C++ 3 20FCB208 209008E0 209008E0 +0000005C 20070115 C/C++ 4 20FCB0F0 20E699EE 20E699EE +000000C2 20061215 LIBRARY 5 20FCB030 209A0AD8 209A0AD8 +000001B6 20061215 CEL Condition Information for Active Routines Condition Information for (DSA address 20FCB2B0) CIB Address: 20FCBC70 Current Condition: CEE0198S The termination of a thread was signaled due to an unhandled condition. Original Condition: CEE3201S The system detected an operation exception (System Completion Code=0C1). Location: Program Unit: Entry: funca Statement: Offset: -20900978 Possible Bad Branch: Statement: Offset: +0000005A Machine State: ILC..... 0002 Interruption Code..... 0001 PSW..... 078D1400 80000002 GPR0..... 00000000_20FCB350 GPR1..... 00000000_20FCB2A0 GPR2..... 00000000_20FCB2A0 GPR3..... 00000000_209009B2 GPR4..... 00000000_A09A0BBC GPR5..... 00000000_20912648 GPR6..... 00000000_20900AA4 GPR7..... 00000000_20900098 GPR8..... 00000000_00000030 GPR9..... 00000000_80000000 GPR10.... 00000000_A0E699E2 GPR11.... 00000000_A09A0AD8 GPR12.... 00000000_209139B0 GPR13.... 00000000_20FCB2B0 GPR14.... 00000000_A09009D4 GPR15.... 00000000_00000000 Storage dump near condition, beginning at location: 00000000 +000000 00000000 Inaccessible storage. GPREG STORAGE: Storage around GPR0 (20FCB350) -0020 20FCB330 00000000 00000000 00000000 00000000 00000000 00000000 00000000 00000000 |................................| +0000 20FCB350 0808CEE1 20FCB2B0 20FCE470 A09D6B3A A09EFFD8 20FCB350 20FCB7A8 20912648 |..........U...,....Q...&...y.j..|⋮ Parameters, Registers, and Variables for Active Routines: CEEHDSP (DSA address 20FCB350): UPSTACK DSA Saved Registers: GPR0..... 20FCB350 GPR1..... 20FCB7A8 GPR2..... 20912648 GPR3..... 00000080 GPR4..... 209D7734 GPR5..... A0915000 GPR6..... 2090C2A8 GPR7..... 20FCBC70 GPR8..... A09D665A GPR9..... 20FCD34E GPR10.... 20FCC34F GPR11.... 209D2B08 GPR12.... 209139B0 GPR13.... 20FCB350 GPR14.... A09D6B3A GPR15.... A09EFFD8 ⋮ funca (DSA address 20FCB2B0): UPSTACK DSA Saved Registers: GPR0..... 20FCB350 GPR1..... 20FCB2A0 GPR2..... 20FCB2A0 GPR3..... 209009B2 GPR4..... A09A0BBC GPR5..... 20912648 GPR6..... 20900AA4 GPR7..... 20900098 GPR8..... 00000030 GPR9..... 80000000 GPR10.... A0E699E2 GPR11.... A09A0AD8 GPR12.... 209139B0 GPR13.... 20FCB2B0 GPR14.... A09009D4 GPR15.... 00000000 ⋮
Figure 76. Sections of the dump from example C routine (calling a nonexistent subroutine)
2. Find the branch instructions at offset X'+0000005A' of funca in the listing in Figure 77 on page 209.The instruction is BASR r14,r15. This branch is part of the source statement *aa = func_ptr().
208 z/OS: z/OS Language Environment Debugging Guide
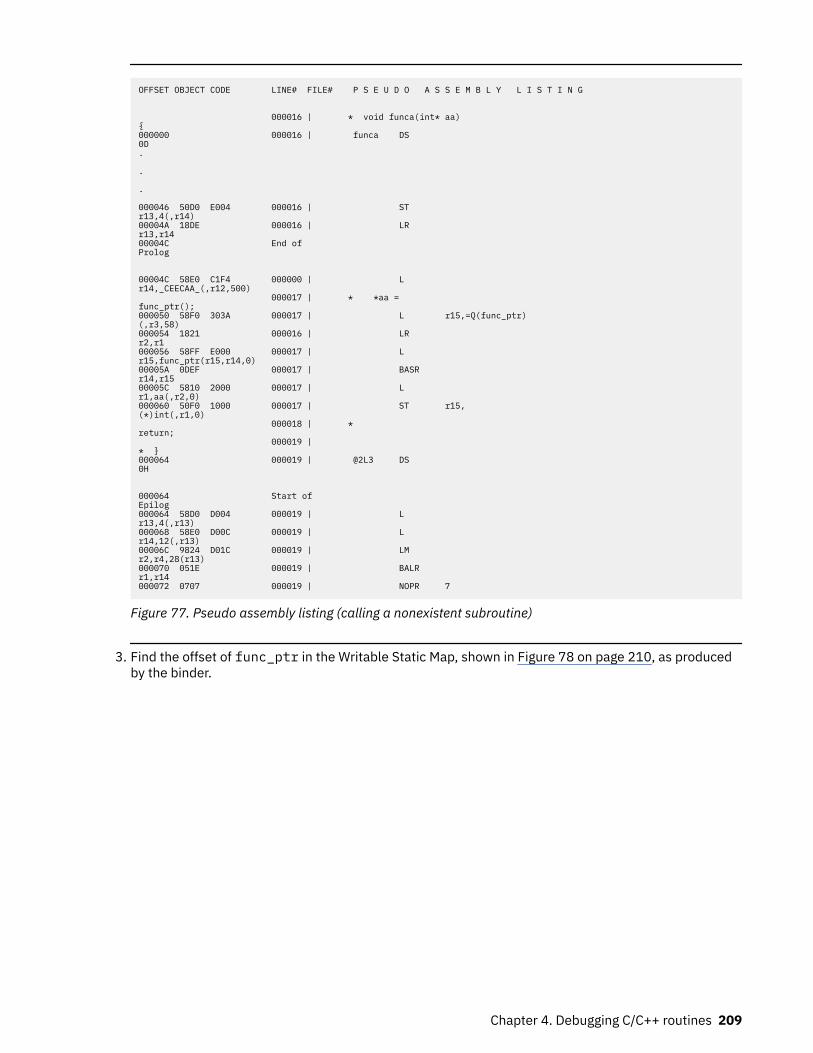
OFFSET OBJECT CODE LINE# FILE# P S E U D O A S S E M B L Y L I S T I N G 000016 | * void funca(int* aa) { 000000 000016 | funca DS 0D . . . 000046 50D0 E004 000016 | ST r13,4(,r14) 00004A 18DE 000016 | LR r13,r14 00004C End of Prolog 00004C 58E0 C1F4 000000 | L r14,_CEECAA_(,r12,500) 000017 | * *aa = func_ptr(); 000050 58F0 303A 000017 | L r15,=Q(func_ptr)(,r3,58) 000054 1821 000016 | LR r2,r1 000056 58FF E000 000017 | L r15,func_ptr(r15,r14,0) 00005A 0DEF 000017 | BASR r14,r15 00005C 5810 2000 000017 | L r1,aa(,r2,0) 000060 50F0 1000 000017 | ST r15,(*)int(,r1,0) 000018 | * return; 000019 | * } 000064 000019 | @2L3 DS 0H 000064 Start of Epilog 000064 58D0 D004 000019 | L r13,4(,r13) 000068 58E0 D00C 000019 | L r14,12(,r13) 00006C 9824 D01C 000019 | LM r2,r4,28(r13) 000070 051E 000019 | BALR r1,r14 000072 0707 000019 | NOPR 7
Figure 77. Pseudo assembly listing (calling a nonexistent subroutine)
3. Find the offset of func_ptr in the Writable Static Map, shown in Figure 78 on page 210, as producedby the binder.
Chapter 4. Debugging C/C++ routines 209
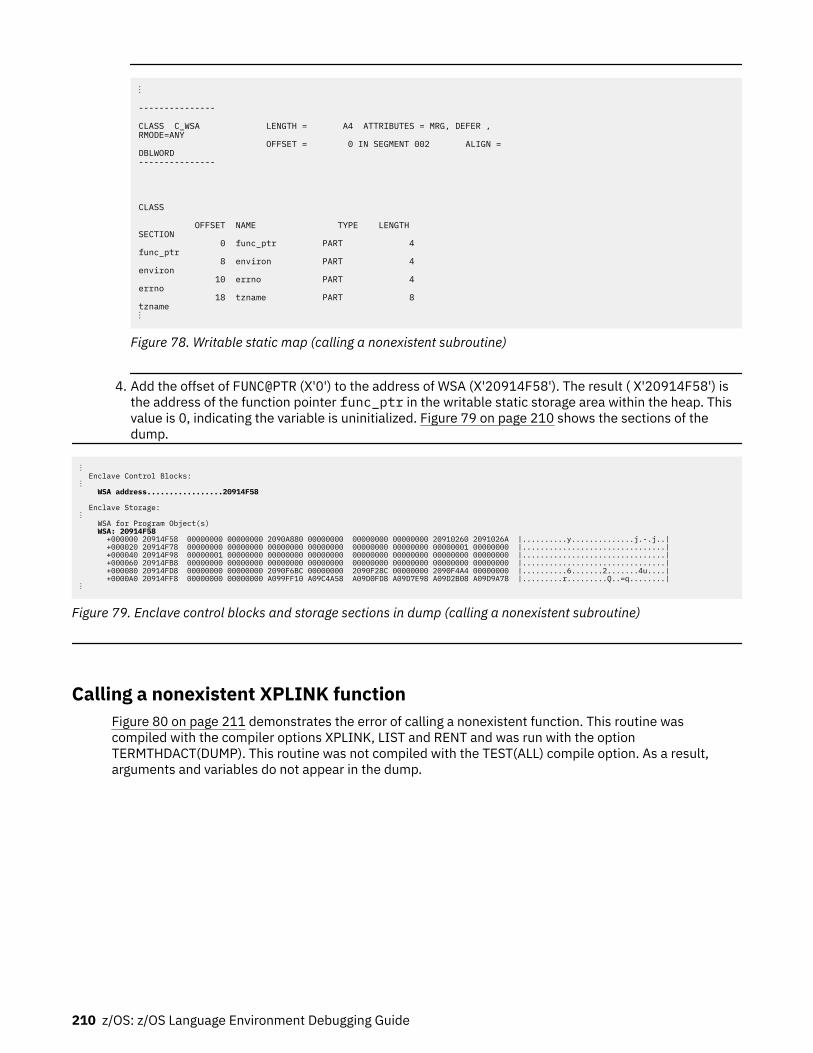
⋮ --------------- CLASS C_WSA LENGTH = A4 ATTRIBUTES = MRG, DEFER , RMODE=ANY OFFSET = 0 IN SEGMENT 002 ALIGN = DBLWORD --------------- CLASS OFFSET NAME TYPE LENGTH SECTION 0 func_ptr PART 4 func_ptr 8 environ PART 4 environ 10 errno PART 4 errno 18 tzname PART 8 tzname ⋮
Figure 78. Writable static map (calling a nonexistent subroutine)
4. Add the offset of FUNC@PTR (X'0') to the address of WSA (X'20914F58'). The result ( X'20914F58') isthe address of the function pointer func_ptr in the writable static storage area within the heap. Thisvalue is 0, indicating the variable is uninitialized. Figure 79 on page 210 shows the sections of thedump.
⋮ Enclave Control Blocks: ⋮ WSA address.................20914F58 Enclave Storage: ⋮ WSA for Program Object(s) WSA: 20914F58 +000000 20914F58 00000000 00000000 2090A880 00000000 00000000 00000000 20910260 2091026A |..........y..............j.-.j..| +000020 20914F78 00000000 00000000 00000000 00000000 00000000 00000000 00000001 00000000 |................................| +000040 20914F98 00000001 00000000 00000000 00000000 00000000 00000000 00000000 00000000 |................................| +000060 20914FB8 00000000 00000000 00000000 00000000 00000000 00000000 00000000 00000000 |................................| +000080 20914FD8 00000000 00000000 2090F6BC 00000000 2090F28C 00000000 2090F4A4 00000000 |..........6.......2.......4u....| +0000A0 20914FF8 00000000 00000000 A099FF10 A09C4A58 A09D0FD8 A09D7E98 A09D2B08 A09D9A78 |.........r.........Q..=q........|⋮
Figure 79. Enclave control blocks and storage sections in dump (calling a nonexistent subroutine)
Calling a nonexistent XPLINK functionFigure 80 on page 211 demonstrates the error of calling a nonexistent function. This routine wascompiled with the compiler options XPLINK, LIST and RENT and was run with the optionTERMTHDACT(DUMP). This routine was not compiled with the TEST(ALL) compile option. As a result,arguments and variables do not appear in the dump.
210 z/OS: z/OS Language Environment Debugging Guide
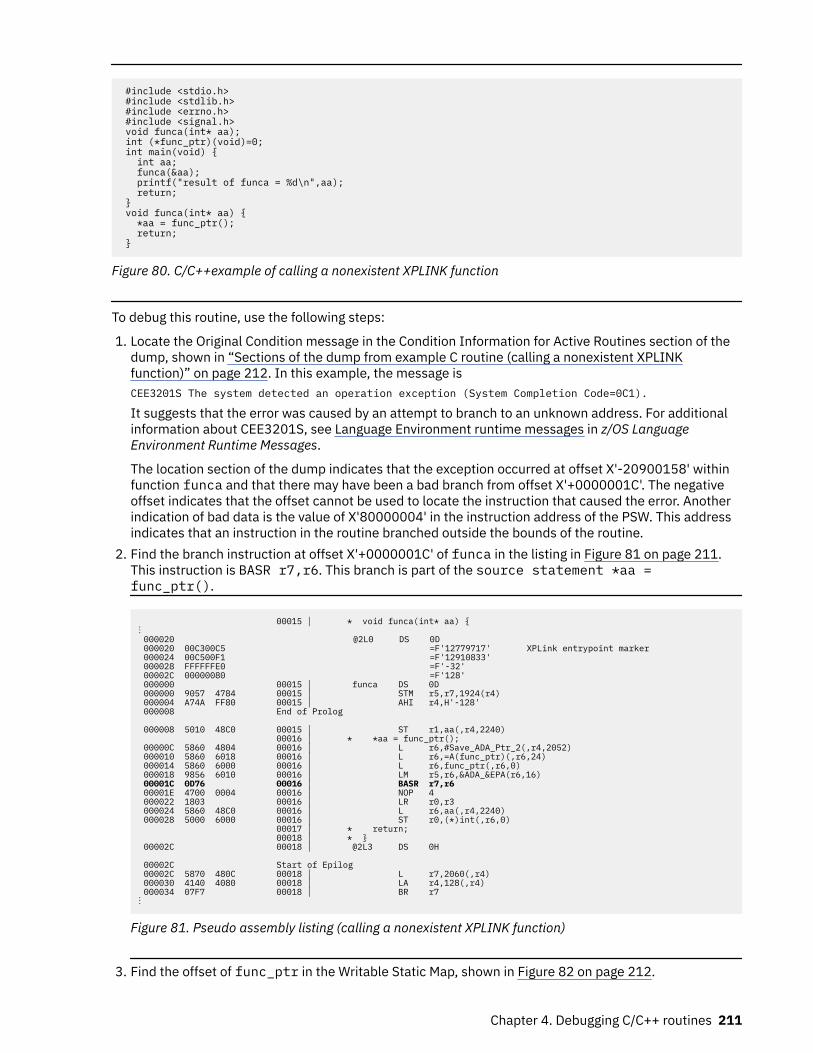
#include <stdio.h> #include <stdlib.h> #include <errno.h> #include <signal.h> void funca(int* aa); int (*func_ptr)(void)=0; int main(void) { int aa; funca(&aa); printf("result of funca = %d\n",aa); return; } void funca(int* aa) { *aa = func_ptr(); return; }
Figure 80. C/C++example of calling a nonexistent XPLINK function
To debug this routine, use the following steps:
1. Locate the Original Condition message in the Condition Information for Active Routines section of thedump, shown in “Sections of the dump from example C routine (calling a nonexistent XPLINKfunction)” on page 212. In this example, the message isCEE3201S The system detected an operation exception (System Completion Code=0C1).
It suggests that the error was caused by an attempt to branch to an unknown address. For additionalinformation about CEE3201S, see Language Environment runtime messages in z/OS LanguageEnvironment Runtime Messages.
The location section of the dump indicates that the exception occurred at offset X'-20900158' withinfunction funca and that there may have been a bad branch from offset X'+0000001C'. The negativeoffset indicates that the offset cannot be used to locate the instruction that caused the error. Anotherindication of bad data is the value of X'80000004' in the instruction address of the PSW. This addressindicates that an instruction in the routine branched outside the bounds of the routine.
2. Find the branch instruction at offset X'+0000001C' of funca in the listing in Figure 81 on page 211.This instruction is BASR r7,r6. This branch is part of the source statement *aa =func_ptr().
00015 │ * void funca(int* aa) {⋮ 000020 @2L0 DS 0D 000020 00C300C5 =F'12779717' XPLink entrypoint marker 000024 00C500F1 =F'12910833' 000028 FFFFFFE0 =F'-32' 00002C 00000080 =F'128' 000000 00015 │ funca DS 0D 000000 9057 4784 00015 │ STM r5,r7,1924(r4) 000004 A74A FF80 00015 │ AHI r4,H'-128' 000008 End of Prolog
000008 5010 48C0 00015 │ ST r1,aa(,r4,2240) 00016 │ * *aa = func_ptr(); 00000C 5860 4804 00016 │ L r6,#Save_ADA_Ptr_2(,r4,2052) 000010 5860 6018 00016 │ L r6,=A(func_ptr)(,r6,24) 000014 5860 6000 00016 │ L r6,func_ptr(,r6,0) 000018 9856 6010 00016 │ LM r5,r6,&ADA_&EPA(r6,16) 00001C 0D76 00016 │ BASR r7,r6 00001E 4700 0004 00016 │ NOP 4 000022 1803 00016 │ LR r0,r3 000024 5860 48C0 00016 │ L r6,aa(,r4,2240) 000028 5000 6000 00016 │ ST r0,(*)int(,r6,0) 00017 │ * return; 00018 │ * } 00002C 00018 │ @2L3 DS 0H
00002C Start of Epilog 00002C 5870 480C 00018 │ L r7,2060(,r4) 000030 4140 4080 00018 │ LA r4,128(,r4) 000034 07F7 00018 │ BR r7⋮
Figure 81. Pseudo assembly listing (calling a nonexistent XPLINK function)
3. Find the offset of func_ptr in the Writable Static Map, shown in Figure 82 on page 212.
Chapter 4. Debugging C/C++ routines 211
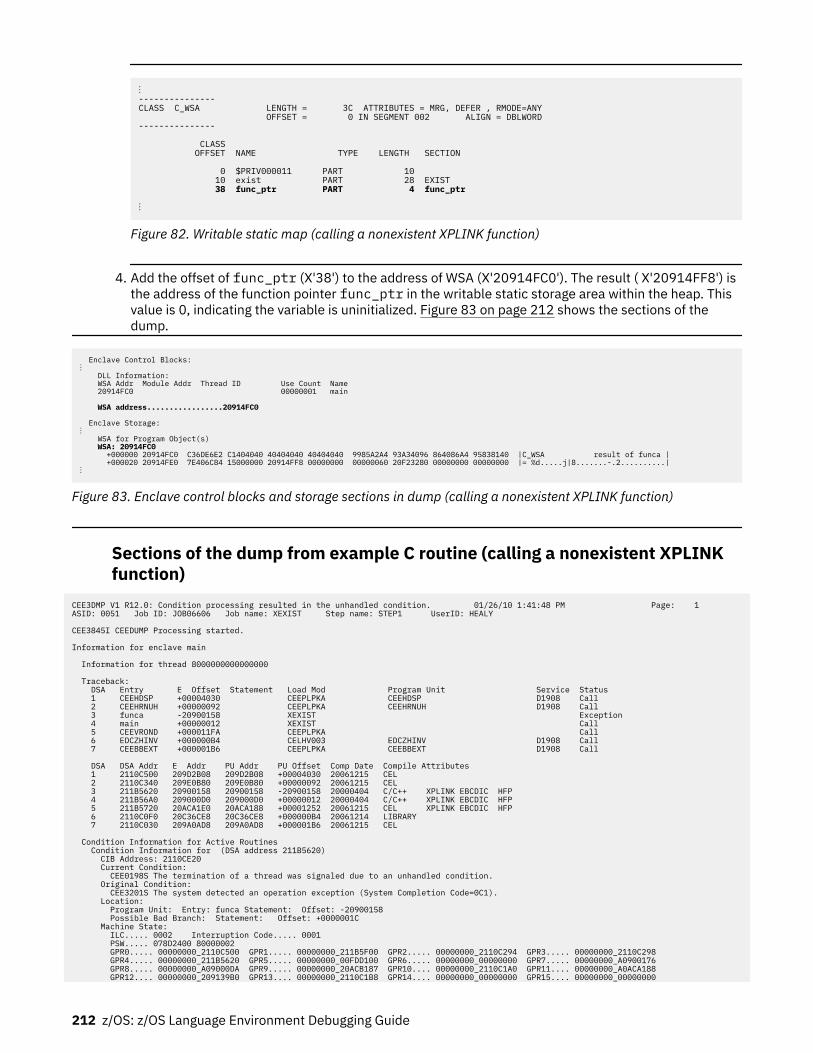
⋮---------------CLASS C_WSA LENGTH = 3C ATTRIBUTES = MRG, DEFER , RMODE=ANY OFFSET = 0 IN SEGMENT 002 ALIGN = DBLWORD---------------
CLASS OFFSET NAME TYPE LENGTH SECTION
0 $PRIV000011 PART 10 10 exist PART 28 EXIST 38 func_ptr PART 4 func_ptr
⋮
Figure 82. Writable static map (calling a nonexistent XPLINK function)
4. Add the offset of func_ptr (X'38') to the address of WSA (X'20914FC0'). The result ( X'20914FF8') isthe address of the function pointer func_ptr in the writable static storage area within the heap. Thisvalue is 0, indicating the variable is uninitialized. Figure 83 on page 212 shows the sections of thedump.
Enclave Control Blocks: ⋮ DLL Information: WSA Addr Module Addr Thread ID Use Count Name 20914FC0 00000001 main WSA address.................20914FC0 Enclave Storage: ⋮ WSA for Program Object(s) WSA: 20914FC0 +000000 20914FC0 C36DE6E2 C1404040 40404040 40404040 9985A2A4 93A34096 864086A4 95838140 |C_WSA result of funca | +000020 20914FE0 7E406C84 15000000 20914FF8 00000000 00000060 20F23280 00000000 00000000 |= %d.....j|8.......-.2..........|⋮
Figure 83. Enclave control blocks and storage sections in dump (calling a nonexistent XPLINK function)
Sections of the dump from example C routine (calling a nonexistent XPLINKfunction)
CEE3DMP V1 R12.0: Condition processing resulted in the unhandled condition. 01/26/10 1:41:48 PM Page: 1 ASID: 0051 Job ID: JOB06606 Job name: XEXIST Step name: STEP1 UserID: HEALY CEE3845I CEEDUMP Processing started. Information for enclave main Information for thread 8000000000000000 Traceback: DSA Entry E Offset Statement Load Mod Program Unit Service Status 1 CEEHDSP +00004030 CEEPLPKA CEEHDSP D1908 Call 2 CEEHRNUH +00000092 CEEPLPKA CEEHRNUH D1908 Call 3 funca -20900158 XEXIST Exception 4 main +00000012 XEXIST Call 5 CEEVROND +000011FA CEEPLPKA Call 6 EDCZHINV +000000B4 CELHV003 EDCZHINV D1908 Call 7 CEEBBEXT +000001B6 CEEPLPKA CEEBBEXT D1908 Call DSA DSA Addr E Addr PU Addr PU Offset Comp Date Compile Attributes 1 2110C500 209D2B08 209D2B08 +00004030 20061215 CEL 2 2110C340 209E0B80 209E0B80 +00000092 20061215 CEL 3 211B5620 20900158 20900158 -20900158 20000404 C/C++ XPLINK EBCDIC HFP 4 211B56A0 209000D0 209000D0 +00000012 20000404 C/C++ XPLINK EBCDIC HFP 5 211B5720 20ACA1E0 20ACA188 +00001252 20061215 CEL XPLINK EBCDIC HFP 6 2110C0F0 20C36CE8 20C36CE8 +000000B4 20061214 LIBRARY 7 2110C030 209A0AD8 209A0AD8 +000001B6 20061215 CEL Condition Information for Active Routines Condition Information for (DSA address 211B5620) CIB Address: 2110CE20 Current Condition: CEE0198S The termination of a thread was signaled due to an unhandled condition. Original Condition: CEE3201S The system detected an operation exception (System Completion Code=0C1). Location: Program Unit: Entry: funca Statement: Offset: -20900158 Possible Bad Branch: Statement: Offset: +0000001C Machine State: ILC..... 0002 Interruption Code..... 0001 PSW..... 078D2400 80000002 GPR0..... 00000000_2110C500 GPR1..... 00000000_211B5F00 GPR2..... 00000000_2110C294 GPR3..... 00000000_2110C298 GPR4..... 00000000_211B5620 GPR5..... 00000000_00FDD100 GPR6..... 00000000_00000000 GPR7..... 00000000_A0900176 GPR8..... 00000000_A09000DA GPR9..... 00000000_20ACB187 GPR10.... 00000000_2110C1A0 GPR11.... 00000000_A0ACA188 GPR12.... 00000000_209139B0 GPR13.... 00000000_2110C1B8 GPR14.... 00000000_00000000 GPR15.... 00000000_00000000
212 z/OS: z/OS Language Environment Debugging Guide
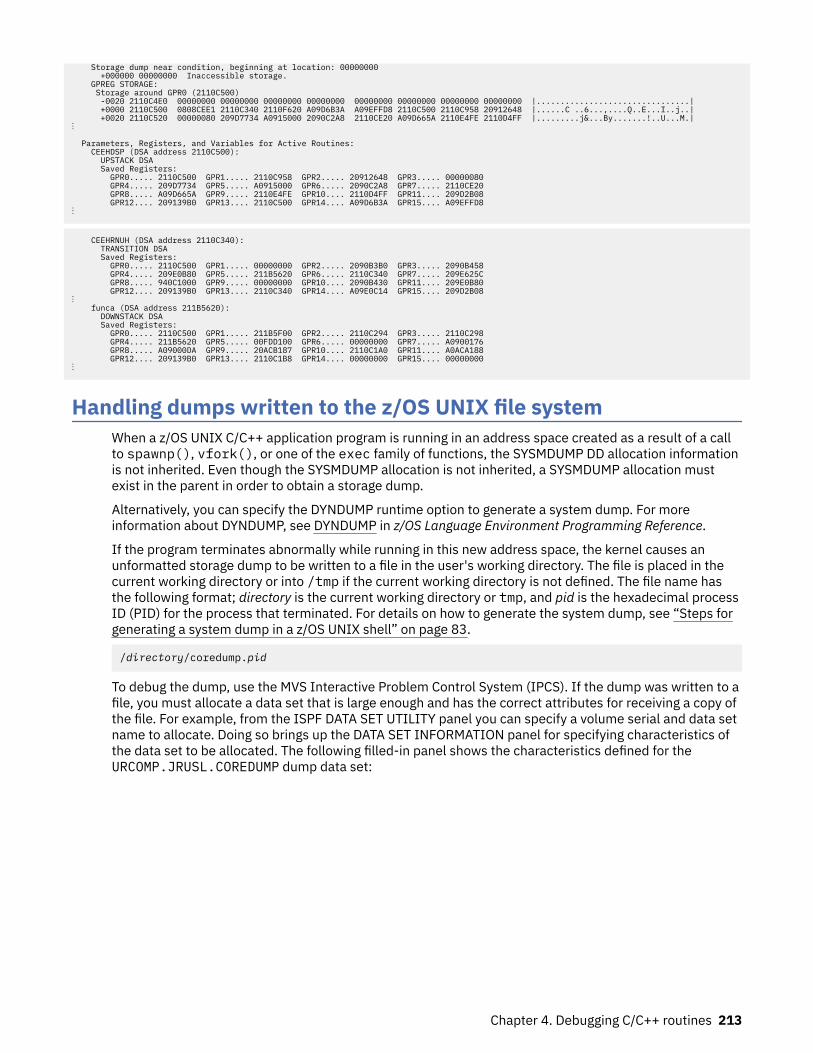
Storage dump near condition, beginning at location: 00000000 +000000 00000000 Inaccessible storage. GPREG STORAGE: Storage around GPR0 (2110C500) -0020 2110C4E0 00000000 00000000 00000000 00000000 00000000 00000000 00000000 00000000 |................................| +0000 2110C500 0808CEE1 2110C340 2110F620 A09D6B3A A09EFFD8 2110C500 2110C958 20912648 |......C ..6...,....Q..E...I..j..| +0020 2110C520 00000080 209D7734 A0915000 2090C2A8 2110CE20 A09D665A 2110E4FE 2110D4FF |.........j&...By.......!..U...M.| ⋮
Parameters, Registers, and Variables for Active Routines: CEEHDSP (DSA address 2110C500): UPSTACK DSA Saved Registers: GPR0..... 2110C500 GPR1..... 2110C958 GPR2..... 20912648 GPR3..... 00000080 GPR4..... 209D7734 GPR5..... A0915000 GPR6..... 2090C2A8 GPR7..... 2110CE20 GPR8..... A09D665A GPR9..... 2110E4FE GPR10.... 2110D4FF GPR11.... 209D2B08 GPR12.... 209139B0 GPR13.... 2110C500 GPR14.... A09D6B3A GPR15.... A09EFFD8 ⋮
CEEHRNUH (DSA address 2110C340): TRANSITION DSA Saved Registers: GPR0..... 2110C500 GPR1..... 00000000 GPR2..... 2090B3B0 GPR3..... 2090B458 GPR4..... 209E0B80 GPR5..... 211B5620 GPR6..... 2110C340 GPR7..... 209E625C GPR8..... 940C1000 GPR9..... 00000000 GPR10.... 2090B430 GPR11.... 209E0B80 GPR12.... 209139B0 GPR13.... 2110C340 GPR14.... A09E0C14 GPR15.... 209D2B08 ⋮ funca (DSA address 211B5620): DOWNSTACK DSA Saved Registers: GPR0..... 2110C500 GPR1..... 211B5F00 GPR2..... 2110C294 GPR3..... 2110C298 GPR4..... 211B5620 GPR5..... 00FDD100 GPR6..... 00000000 GPR7..... A0900176 GPR8..... A09000DA GPR9..... 20ACB187 GPR10.... 2110C1A0 GPR11.... A0ACA188 GPR12.... 209139B0 GPR13.... 2110C1B8 GPR14.... 00000000 GPR15.... 00000000 ⋮
Handling dumps written to the z/OS UNIX file systemWhen a z/OS UNIX C/C++ application program is running in an address space created as a result of a callto spawnp(), vfork(), or one of the exec family of functions, the SYSMDUMP DD allocation informationis not inherited. Even though the SYSMDUMP allocation is not inherited, a SYSMDUMP allocation mustexist in the parent in order to obtain a storage dump.
Alternatively, you can specify the DYNDUMP runtime option to generate a system dump. For moreinformation about DYNDUMP, see DYNDUMP in z/OS Language Environment Programming Reference.
If the program terminates abnormally while running in this new address space, the kernel causes anunformatted storage dump to be written to a file in the user's working directory. The file is placed in thecurrent working directory or into /tmp if the current working directory is not defined. The file name hasthe following format; directory is the current working directory or tmp, and pid is the hexadecimal processID (PID) for the process that terminated. For details on how to generate the system dump, see “Steps forgenerating a system dump in a z/OS UNIX shell” on page 83.
/directory/coredump.pid
To debug the dump, use the MVS Interactive Problem Control System (IPCS). If the dump was written to afile, you must allocate a data set that is large enough and has the correct attributes for receiving a copy ofthe file. For example, from the ISPF DATA SET UTILITY panel you can specify a volume serial and data setname to allocate. Doing so brings up the DATA SET INFORMATION panel for specifying characteristics ofthe data set to be allocated. The following filled-in panel shows the characteristics defined for theURCOMP.JRUSL.COREDUMP dump data set:
Chapter 4. Debugging C/C++ routines 213
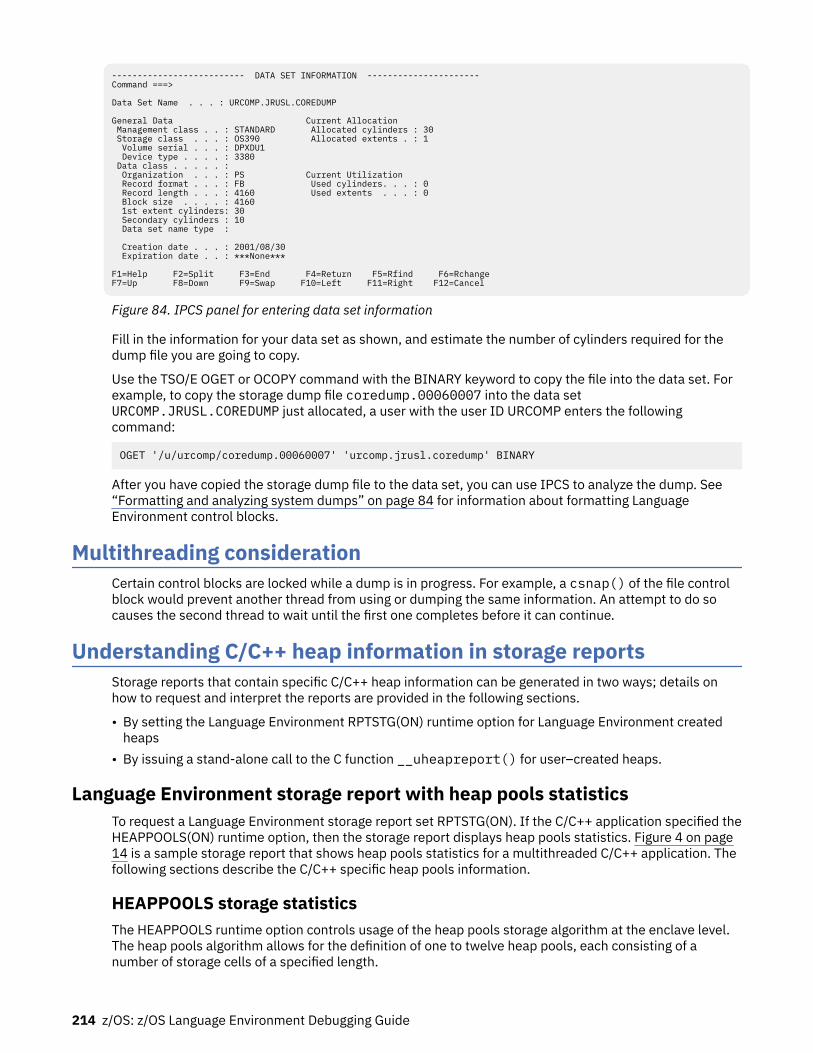
-------------------------- DATA SET INFORMATION ----------------------Command ===>
Data Set Name . . . : URCOMP.JRUSL.COREDUMP
General Data Current Allocation Management class . . : STANDARD Allocated cylinders : 30 Storage class . . . : OS390 Allocated extents . : 1 Volume serial . . . : DPXDU1 Device type . . . . : 3380 Data class . . . . . : Organization . . . : PS Current Utilization Record format . . . : FB Used cylinders. . . : 0 Record length . . . : 4160 Used extents . . . : 0 Block size . . . . : 4160 1st extent cylinders: 30 Secondary cylinders : 10 Data set name type :
Creation date . . . : 2001/08/30 Expiration date . . : ***None***
F1=Help F2=Split F3=End F4=Return F5=Rfind F6=RchangeF7=Up F8=Down F9=Swap F10=Left F11=Right F12=Cancel
Figure 84. IPCS panel for entering data set information
Fill in the information for your data set as shown, and estimate the number of cylinders required for thedump file you are going to copy.
Use the TSO/E OGET or OCOPY command with the BINARY keyword to copy the file into the data set. Forexample, to copy the storage dump file coredump.00060007 into the data setURCOMP.JRUSL.COREDUMP just allocated, a user with the user ID URCOMP enters the followingcommand:
OGET '/u/urcomp/coredump.00060007' 'urcomp.jrusl.coredump' BINARY
After you have copied the storage dump file to the data set, you can use IPCS to analyze the dump. See“Formatting and analyzing system dumps” on page 84 for information about formatting LanguageEnvironment control blocks.
Multithreading considerationCertain control blocks are locked while a dump is in progress. For example, a csnap() of the file controlblock would prevent another thread from using or dumping the same information. An attempt to do socauses the second thread to wait until the first one completes before it can continue.
Understanding C/C++ heap information in storage reportsStorage reports that contain specific C/C++ heap information can be generated in two ways; details onhow to request and interpret the reports are provided in the following sections.
• By setting the Language Environment RPTSTG(ON) runtime option for Language Environment createdheaps
• By issuing a stand-alone call to the C function __uheapreport() for user–created heaps.
Language Environment storage report with heap pools statisticsTo request a Language Environment storage report set RPTSTG(ON). If the C/C++ application specified theHEAPPOOLS(ON) runtime option, then the storage report displays heap pools statistics. Figure 4 on page14 is a sample storage report that shows heap pools statistics for a multithreaded C/C++ application. Thefollowing sections describe the C/C++ specific heap pools information.
HEAPPOOLS storage statisticsThe HEAPPOOLS runtime option controls usage of the heap pools storage algorithm at the enclave level.The heap pools algorithm allows for the definition of one to twelve heap pools, each consisting of anumber of storage cells of a specified length.
214 z/OS: z/OS Language Environment Debugging Guide
Note: The use of an alternative Vendor Heap Manager (VHM) overrides the use of the HEAPPOOLSruntime option.
HEAPPOOLS statistics• Pool p size: ssss Get requests: gggg
pthe number of the pool. When there are multiple pools for a cell size, the pools are numbered usingthe format aa.bbb.aa
the number for the cell size.bbb
the number for the pool within the cell size.ssss
the cell size specified for the pool.gggg
the number of storage requests that were satisfied from this pool.• Successful Get Heap requests: xxxx-yyyy n
xxxxthe low side of the 8 byte range
yyyythe high side of the 8 byte range
nthe number of requests in the 8 byte range.
• Requests greater than the largest cell size — the number of storage requests that are not satisfied byheap pools.
Note: Values displayed in the HEAPPOOLS statistics report are not serialized when collected; therefore,the values are not necessarily exact.
HEAPPOOLS summaryThe HEAPPOOLS summary displays a report of the HEAPPOOLS statistics and provides suggestedpercentages for current cell sizes as well as suggested cell sizes.
• Specified Cell Size — the size of the cell specified in the HEAPPOOLS runtime option• Element Size — the size of the cell plus any additional storage needed for control information or to
maintain alignment• Extent Percent — the cell pool percent specified by the HEAPPOOLS runtime option• Cells Per Extent — the number of cells per extent. This number is calculated using the following formula,
with a minimum of four cells:
Initial Heap Size * (Extent Percent/100))/(Element Size)
Note: Having a small number of cells per extent is not recommended since the pool could allocate manyextents, which would cause the HEAPPOOLS algorithm to perform inefficiently.
• Extents Allocated — the number of times that each pool allocated an extent.
To optimize storage usage, the extents allocated should be either one or two. If the number of extentsallocated is too high, then increase the percentage for the pool.
• Maximum Cells Used — the maximum number of cells used for each pool.• Cells In Use — the number of cells that were never freed.
A large number in this field could indicate a storage leak.
Chapter 4. Debugging C/C++ routines 215
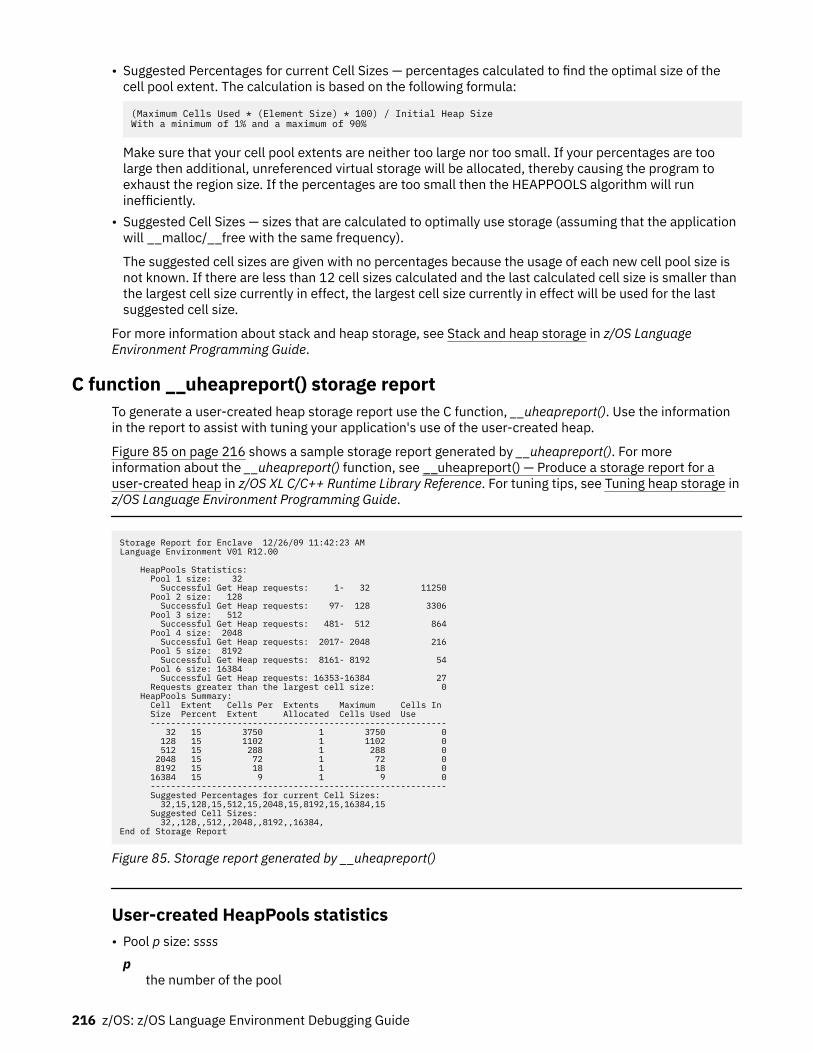
• Suggested Percentages for current Cell Sizes — percentages calculated to find the optimal size of thecell pool extent. The calculation is based on the following formula:
(Maximum Cells Used * (Element Size) * 100) / Initial Heap SizeWith a minimum of 1% and a maximum of 90%
Make sure that your cell pool extents are neither too large nor too small. If your percentages are toolarge then additional, unreferenced virtual storage will be allocated, thereby causing the program toexhaust the region size. If the percentages are too small then the HEAPPOOLS algorithm will runinefficiently.
• Suggested Cell Sizes — sizes that are calculated to optimally use storage (assuming that the applicationwill __malloc/__free with the same frequency).
The suggested cell sizes are given with no percentages because the usage of each new cell pool size isnot known. If there are less than 12 cell sizes calculated and the last calculated cell size is smaller thanthe largest cell size currently in effect, the largest cell size currently in effect will be used for the lastsuggested cell size.
For more information about stack and heap storage, see Stack and heap storage in z/OS LanguageEnvironment Programming Guide.
C function __uheapreport() storage reportTo generate a user-created heap storage report use the C function, __uheapreport(). Use the informationin the report to assist with tuning your application's use of the user-created heap.
Figure 85 on page 216 shows a sample storage report generated by __uheapreport(). For moreinformation about the __uheapreport() function, see __uheapreport() — Produce a storage report for auser-created heap in z/OS XL C/C++ Runtime Library Reference. For tuning tips, see Tuning heap storage inz/OS Language Environment Programming Guide.
Storage Report for Enclave 12/26/09 11:42:23 AMLanguage Environment V01 R12.00
HeapPools Statistics: Pool 1 size: 32 Successful Get Heap requests: 1- 32 11250 Pool 2 size: 128 Successful Get Heap requests: 97- 128 3306 Pool 3 size: 512 Successful Get Heap requests: 481- 512 864 Pool 4 size: 2048 Successful Get Heap requests: 2017- 2048 216 Pool 5 size: 8192 Successful Get Heap requests: 8161- 8192 54 Pool 6 size: 16384 Successful Get Heap requests: 16353-16384 27 Requests greater than the largest cell size: 0 HeapPools Summary: Cell Extent Cells Per Extents Maximum Cells In Size Percent Extent Allocated Cells Used Use ---------------------------------------------------------- 32 15 3750 1 3750 0 128 15 1102 1 1102 0 512 15 288 1 288 0 2048 15 72 1 72 0 8192 15 18 1 18 0 16384 15 9 1 9 0 ---------------------------------------------------------- Suggested Percentages for current Cell Sizes: 32,15,128,15,512,15,2048,15,8192,15,16384,15 Suggested Cell Sizes: 32,,128,,512,,2048,,8192,,16384,End of Storage Report
Figure 85. Storage report generated by __uheapreport()
User-created HeapPools statistics• Pool p size: ssss
pthe number of the pool
216 z/OS: z/OS Language Environment Debugging Guide
ssssthe cell size specified for the pool.
• Successful Get Heap requests: xxxx-yyyy nxxxx
the low side of the rangeyyyy
the high side of the rangen
the number of requests in the range.• Requests greater than the largest cell size — the number of storage requests that are not satisfied by
heap pools.
Note: Values displayed in the HeapPools statistics report are not serialized when collected; therefore, thevalues are not necessarily exact.
HeapPools summaryThe HeapPools summary displays a report of the HeapPool statistics and provides suggested percentagesfor current cell sizes as well as suggested cell sizes.
• Cell Size — the size of the cell specified on the __ucreate() call• Extent Percent — the cell pool percent specified on the __ucreate() call• Cells Per Extent — the number of cells per extent. This number is calculated using the following formula:
Initial Heap Size * (Extent Percent/100))/(8 + Cell Size)
with a minimum of four cells.• Extents Allocated — the number of times that each pool allocated an extent.• Maximum Cells Used — the maximum number of cells used for each pool.• Cells In Use — the number of cells that were never freed.
Note: A large number in this field could indicate a storage leak.• Suggested Percentages for current Cell Sizes — percentages calculated to find the optimal size of the
cell pool extent. The calculation is based on the following formula:
(Maximum Cells Used * (Cell Size + 8) * 100) / Initial Heap SizeWith a minimum of 1% and a maximum of 90%
Make sure that your cell pool extents are neither too large nor too small. If your percentages are toolarge then additional, unreferenced virtual storage will be allocated, thereby causing the program toexhaust the region size. If the percentages are too small then the HeapPools algorithm will runinefficiently.
• Suggested Cell Sizes — sizes that are calculated to optimally use storage (assuming that the applicationwill __umalloc/__ufree with the same frequency).
Note: The suggested cell sizes are given with no percentages because the usage of each new cell poolsize is not known. If there are less than 12 cell sizes calculated and the last calculated cell size issmaller than the largest cell size currently in effect, the largest cell size currently in effect will be usedfor the last suggested cell size.
For more information about stack and heap storage, see Stack and heap storage in z/OS LanguageEnvironment Programming Guide.
Chapter 4. Debugging C/C++ routines 217
MEMCHECK VHM memory leak analysis toolThe MEMCHECK VHM memory leak analysis tool is an alternative vendor heap manager used to diagnosememory problems. MEMCHECK VHM performs the following functions and displays the results in tworeports:
• Check for heap storage leaks, double free, and overlays.• Trace user heap storage allocation and deallocation requests.
The trace is limited to 1024 entries and will wrap.
Restrictions:
• MEMCHECK VHM works with C/C++ and Enterprise PL/I applications, but is not enabled for COBOL orFortran.
• MEMCHECK VHM and HEAPPOOLS are mutually exclusive. HEAPPOOLS will be ignored whenMEMCHEKC VHM is active.
• MEMCHECK VHM should not be used in PIPI, PICI, CICS, and SPC environments.
Invoking MEMCHECK VHMAs with any alternate vendor heap manager, you must specify the dllname with the environment variable_CEE_HEAP_MANAGER to indicate that MEMCHECK VHM will be used to manage the user heap. SinceCEE_HEAP_MANAGER must be set before any user code gains control, use the ENVAR runtime option toset the variable or set it inside the file specified by environment variables _CEE_ENVFILE or_CEE_ENVFILE_S. The format follows:
_CEE_HEAP_MANAGER=dllname
The following two DLLs are associated with MEMCHECK VHM and use the following events.
• CEL4MCHK: 31-bit base and XPLINK• CELQMCHK: 64-bit
_VHM_INITreplaces C-RTL malloc(), calloc(), realloc(), and free() with the corresponding MEMCHECK VHMfunctions. This event is only at Language Environment Initialization and only called by LanguageEnvironment.
_VHM_TERMterminates Vendor Heap Manager to free the memcheck storage functions. This event is called only byLanguage Environment at Language Environment Termination.
_VHM_REPORTgenerates the Heap Leak Report and the optional Trace Report. This new event will be called byLanguage Environment at Language Environment Termination and will write the Heap Leak Report(and the optional Trace Report if the _CEE_MEMCHECK_TRACE environment variable is active) in theoutput file name specified in _CEE_MEMCHECK_OUTFILENAME. This event can also be calleddynamically by the __vhm_event() API.
MEMCHECK VHM environment variablesThe MEMCHECK VHM environment variables control the tool, the call levels of the Heap Leak Report andTrace Report, the Overlay Analysis, the pad length added in the user heap allocation for overlay analysis,and the output file name for the reports. They should be activated through the ENVAR runtime option, thefile specified by the _CEE_ENVFILE (or _CEE_ENVFILE_S) environment variable, or using the exportcommand from the z/OS UNIX shell before any user code gets control (prior to the HLL user exit, staticconstructors, or main getting control). Setting these environment variables after the user code has begunexecution will not activate them and the default values will be used.
218 z/OS: z/OS Language Environment Debugging Guide
_CEE_MEMCHECK_DEPTHDescription: Controls the number of call-levels to be generated on the Heap Leak Report.
Valid settings: integer value : the minimum is 1 and the maximum is 100. If the value specified is notvalid, the default will be used.
Default: 10.
_CEE_MEMCHECK_OVERLAYDescription: Activates the storage overlays analysis beyond the end of the malloc'd storage.
Valid settings: ON to activate the analysis, OFF to deactivate. If an invalid value is specified, thedefault value will be used.
Default: OFF
_CEE_MEMCHECK_OVERLAYLENDescription: Sets the pad length added in the user heap allocation for overlay analysis. Thisenvironment variable will be used only if _CEE_MEMCHECK_OVERLAY is active.
Valid settings: integer value, multiple of 8: the minimum is 8 and the maximum is 80. Non-multiplesof 8 will be rounded up to the next multiple.
Default: 8
_CEE_MEMCHECK_TRACEDescription: Enables tracing of all heap storage allocation and deallocation and a Trace Report will begenerated at Language Environment Termination.
Valid settings: ON to activate the analysis, OFF to deactivate. If an invalid value is specified, thedefault value will be used.
Default: OFF
_CEE_MEMTRACE_DEPTHDescription: Controls the number of call-levels to be generated in the Trace Report, on each call to alibrary function that deals with heap. This environment variable will be used only if_CEE_MEMCHECK_TRACE is active.
Valid settings: integer value: the minimum is 1 and the maximum is 100. If the value specified is notvalid, the default value will be used.
Default: 10
_CEE_MEMCHECK_OUTFILENAMEDescription: Sets the name of the fully qualified path name of the file in which the Heap Leak Reportand Trace Report should be directed. The report name could be any valid name used in C-RTL fopen()function, then it could also generates the reports in a Data Set.
Valid settings: string value. If an invalid value is specified, the default value will be used.
Default: standard error output
MEMCHECK VHM report sample scenarioIn this example, the MEMCHECK VHM tool is used by specifying the environment variables from the z/OSUNIX shell. The user specifies a depth of 8 call levels in the Heap Leak Report and 8 call levels in theTrace Report for 31-bit.
1. Specifies the depth to trace on storage requests (written to the Heap Leak Report):
Export _CEE_MEMCHECK_DEPTH=8
2. Activates the Trace Report option:
Export _CEE_MEMCHECK_TRACE=ON
3. Specifies the depth to trace on storage requests (written to the Trace Report):
Chapter 4. Debugging C/C++ routines 219

Export _CEE_MEMTRACE_DEPTH=8
4. Activates the Overlay analysis option:
Export _CEE_MEMCHECK_OVERLAY=ON
5. Activates the tool with the 31-bit DLL (automatically generating the Heap Leak Report):
Export _CEE_HEAP_MANAGER=CEL4MCHK
MEMCHECK VHM report examplesBoth reports are written at Language Environment termination (_VHM_TERM event). They are written inthe output file name specified in _CEE_MEMCHECK_OUTFILENAME and are consistent with the format ofother Language Environment reports.
The following trace report will be generated at Language Environment termination (_VHM_TERM event) ifthe _CEE_MEMCHECK_TRACE environment variable is active. The report generates the tracebackinformation of all heap storage allocations and deallocations.
MEMCHECKLanguage Environment V1 R7TRACE REPORT for enclave main, termination report
DEALLOCATE of storage at 0x25a2ea30 - sequence 12 Called from: 25a43c78 +00000120 MemFree Called from: 05cd9918 +0000005c CEEPGTFN Called from: 257f6888 +000002b0 _cterm Called from: 05d46788 +0000040c (unknown)DEALLOCATE of storage at 0x25a2e0c8 - sequence 11 Called from: 25a43c78 +00000120 MemFree Called from: 05cd9918 +0000005c CEEPGTFN Called from: 257f6888 +000001bc _cterm Called from: 05d46788 +0000040c (unknown)DEALLOCATE of storage at 0x25a2ecf8 - sequence 10 Called from: 25a43c78 +00000120 MemFree Called from: 05cd9918 +0000005c CEEPGTFN Called from: 25601ae8 +000000b2 function3 Called from: 25601bb8 +0000008c function2 Called from: 25601c68 +000000ca function1 Called from: 25601a60 +00000062 mainALLOCATE of storage at 0x25a2ecf8 for 5 bytes - sequence 9 Called from: 25a44330 +000000fc MemAlloc Called from: 05cd9918 +0000005c CEEPGTFN Called from: 25601ae8 +00000084 function3 Called from: 25601bb8 +0000008c function2 Called from: 25601c68 +000000ca function1 Called from: 25601a60 +00000062 mainALLOCATE of storage at 0x25a2ecd8 for 8 bytes - sequence 8 Called from: 25a44330 +000000fc MemAlloc Called from: 05cd9918 +0000005c CEEPGTFN Called from: 25601bb8 +0000007e function2 Called from: 25601c68 +000000ca function1 Called from: 25601a60 +00000062 mainDEALLOCATE of storage at 0x25a2ecd8 - sequence 7 Called from: 25a43c78 +00000120 MemFree Called from: 05cd9918 +0000005c CEEPGTFN Called from: 25601c68 +000000bc function1 Called from: 25601a60 +00000062 mainDEALLOCATE of storage at 0x25a2ecd8 - sequence 6 Called from: 25a43c78 +00000120 MemFree Called from: 05cd9918 +0000005c CEEPGTFN Called from: 25601c68 +0000009e function1 Called from: 25601a60 +00000062 main
ALLOCATE of storage at 0x25a2ecd8 for 4 bytes - sequence 5
220 z/OS: z/OS Language Environment Debugging Guide
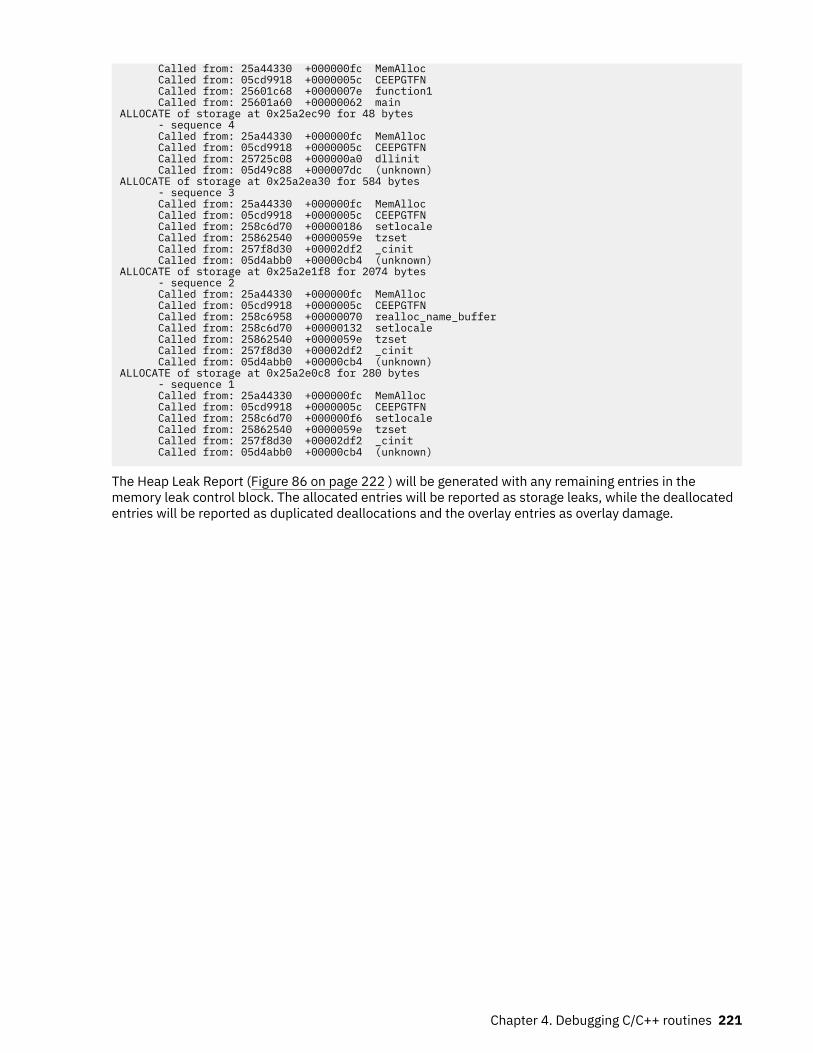
Called from: 25a44330 +000000fc MemAlloc Called from: 05cd9918 +0000005c CEEPGTFN Called from: 25601c68 +0000007e function1 Called from: 25601a60 +00000062 mainALLOCATE of storage at 0x25a2ec90 for 48 bytes - sequence 4 Called from: 25a44330 +000000fc MemAlloc Called from: 05cd9918 +0000005c CEEPGTFN Called from: 25725c08 +000000a0 dllinit Called from: 05d49c88 +000007dc (unknown)ALLOCATE of storage at 0x25a2ea30 for 584 bytes - sequence 3 Called from: 25a44330 +000000fc MemAlloc Called from: 05cd9918 +0000005c CEEPGTFN Called from: 258c6d70 +00000186 setlocale Called from: 25862540 +0000059e tzset Called from: 257f8d30 +00002df2 _cinit Called from: 05d4abb0 +00000cb4 (unknown)ALLOCATE of storage at 0x25a2e1f8 for 2074 bytes - sequence 2 Called from: 25a44330 +000000fc MemAlloc Called from: 05cd9918 +0000005c CEEPGTFN Called from: 258c6958 +00000070 realloc_name_buffer Called from: 258c6d70 +00000132 setlocale Called from: 25862540 +0000059e tzset Called from: 257f8d30 +00002df2 _cinit Called from: 05d4abb0 +00000cb4 (unknown)ALLOCATE of storage at 0x25a2e0c8 for 280 bytes - sequence 1 Called from: 25a44330 +000000fc MemAlloc Called from: 05cd9918 +0000005c CEEPGTFN Called from: 258c6d70 +000000f6 setlocale Called from: 25862540 +0000059e tzset Called from: 257f8d30 +00002df2 _cinit Called from: 05d4abb0 +00000cb4 (unknown)
The Heap Leak Report (Figure 86 on page 222 ) will be generated with any remaining entries in thememory leak control block. The allocated entries will be reported as storage leaks, while the deallocatedentries will be reported as duplicated deallocations and the overlay entries as overlay damage.
Chapter 4. Debugging C/C++ routines 221
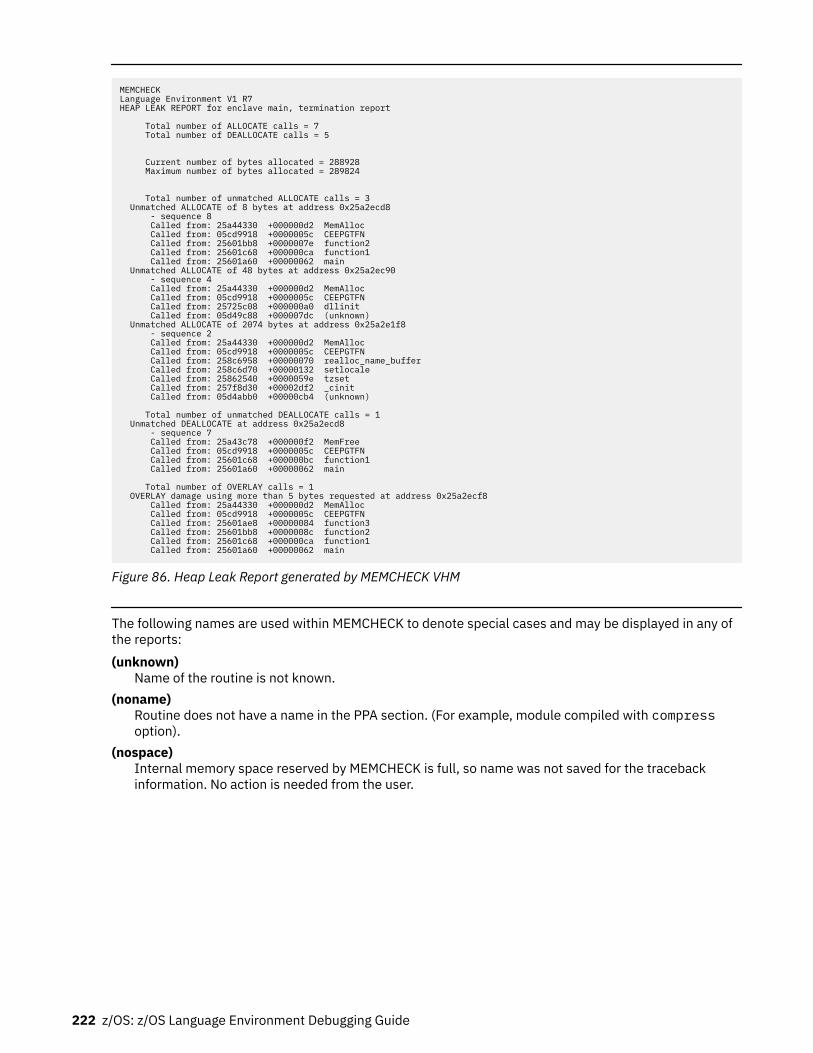
MEMCHECKLanguage Environment V1 R7HEAP LEAK REPORT for enclave main, termination report
Total number of ALLOCATE calls = 7 Total number of DEALLOCATE calls = 5
Current number of bytes allocated = 288928 Maximum number of bytes allocated = 289824
Total number of unmatched ALLOCATE calls = 3 Unmatched ALLOCATE of 8 bytes at address 0x25a2ecd8 - sequence 8 Called from: 25a44330 +000000d2 MemAlloc Called from: 05cd9918 +0000005c CEEPGTFN Called from: 25601bb8 +0000007e function2 Called from: 25601c68 +000000ca function1 Called from: 25601a60 +00000062 main Unmatched ALLOCATE of 48 bytes at address 0x25a2ec90 - sequence 4 Called from: 25a44330 +000000d2 MemAlloc Called from: 05cd9918 +0000005c CEEPGTFN Called from: 25725c08 +000000a0 dllinit Called from: 05d49c88 +000007dc (unknown) Unmatched ALLOCATE of 2074 bytes at address 0x25a2e1f8 - sequence 2 Called from: 25a44330 +000000d2 MemAlloc Called from: 05cd9918 +0000005c CEEPGTFN Called from: 258c6958 +00000070 realloc_name_buffer Called from: 258c6d70 +00000132 setlocale Called from: 25862540 +0000059e tzset Called from: 257f8d30 +00002df2 _cinit Called from: 05d4abb0 +00000cb4 (unknown)
Total number of unmatched DEALLOCATE calls = 1 Unmatched DEALLOCATE at address 0x25a2ecd8 - sequence 7 Called from: 25a43c78 +000000f2 MemFree Called from: 05cd9918 +0000005c CEEPGTFN Called from: 25601c68 +000000bc function1 Called from: 25601a60 +00000062 main
Total number of OVERLAY calls = 1 OVERLAY damage using more than 5 bytes requested at address 0x25a2ecf8 Called from: 25a44330 +000000d2 MemAlloc Called from: 05cd9918 +0000005c CEEPGTFN Called from: 25601ae8 +00000084 function3 Called from: 25601bb8 +0000008c function2 Called from: 25601c68 +000000ca function1 Called from: 25601a60 +00000062 main
Figure 86. Heap Leak Report generated by MEMCHECK VHM
The following names are used within MEMCHECK to denote special cases and may be displayed in any ofthe reports:(unknown)
Name of the routine is not known.(noname)
Routine does not have a name in the PPA section. (For example, module compiled with compressoption).
(nospace)Internal memory space reserved by MEMCHECK is full, so name was not saved for the tracebackinformation. No action is needed from the user.
222 z/OS: z/OS Language Environment Debugging Guide
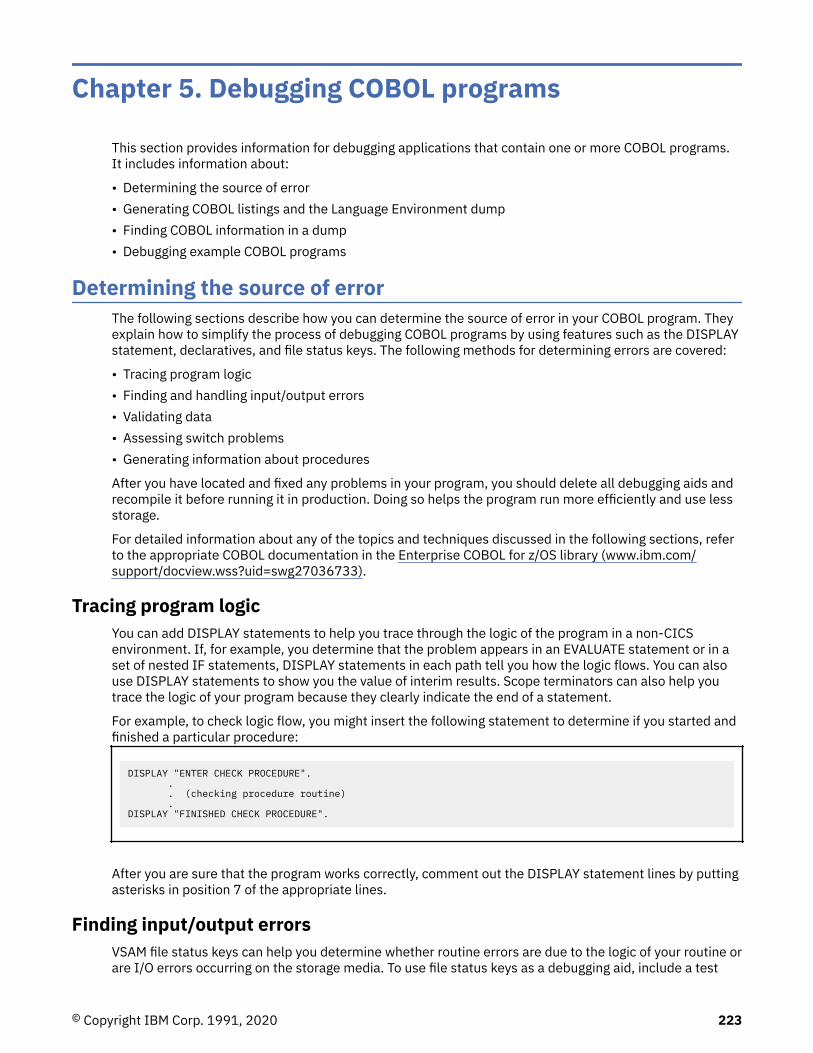
Chapter 5. Debugging COBOL programs
This section provides information for debugging applications that contain one or more COBOL programs.It includes information about:
• Determining the source of error• Generating COBOL listings and the Language Environment dump• Finding COBOL information in a dump• Debugging example COBOL programs
Determining the source of errorThe following sections describe how you can determine the source of error in your COBOL program. Theyexplain how to simplify the process of debugging COBOL programs by using features such as the DISPLAYstatement, declaratives, and file status keys. The following methods for determining errors are covered:
• Tracing program logic• Finding and handling input/output errors• Validating data• Assessing switch problems• Generating information about procedures
After you have located and fixed any problems in your program, you should delete all debugging aids andrecompile it before running it in production. Doing so helps the program run more efficiently and use lessstorage.
For detailed information about any of the topics and techniques discussed in the following sections, referto the appropriate COBOL documentation in the Enterprise COBOL for z/OS library (www.ibm.com/support/docview.wss?uid=swg27036733).
Tracing program logicYou can add DISPLAY statements to help you trace through the logic of the program in a non-CICSenvironment. If, for example, you determine that the problem appears in an EVALUATE statement or in aset of nested IF statements, DISPLAY statements in each path tell you how the logic flows. You can alsouse DISPLAY statements to show you the value of interim results. Scope terminators can also help youtrace the logic of your program because they clearly indicate the end of a statement.
For example, to check logic flow, you might insert the following statement to determine if you started andfinished a particular procedure:
DISPLAY "ENTER CHECK PROCEDURE". . . (checking procedure routine) .DISPLAY "FINISHED CHECK PROCEDURE".
After you are sure that the program works correctly, comment out the DISPLAY statement lines by puttingasterisks in position 7 of the appropriate lines.
Finding input/output errorsVSAM file status keys can help you determine whether routine errors are due to the logic of your routine orare I/O errors occurring on the storage media. To use file status keys as a debugging aid, include a test
© Copyright IBM Corp. 1991, 2020 223
after each I/O statement to check for a value other than 0 in the file status key. If the value is other than 0,you can expect to receive an error message. You can use a nonzero value to indicate how the I/Oprocedures in the routine were coded. You can also include procedures to correct the error based on thefile status key value.
Handling input/output errorsIf you have determined that the problem lies in one of the I/O procedures in your program, you caninclude the USE EXCEPTION/ERROR declarative to help debug the problem. If the file does not open, theappropriate USE EXCEPTION/ERROR declarative is activated. You can specify the appropriate declarativefor the file or for the different open attributes: INPUT, OUTPUT, I/O, or EXTEND. Code each USE AFTERSTANDARD ERROR statement in a separate section immediately after the Declarative Section keyword ofthe Procedure Division.
Validating data (class test)If you suspect that your program is trying to perform arithmetic on nonnumeric data or is somehowreceiving the wrong type of data on an input record, you can use the class test to validate the type of data.
Assessing switch problemsUsing INITIALIZE or SET statements to initialize a table or data item is useful when you suspect that aproblem is caused by residual data left in those fields. If your problem occurs intermittently and notalways with the same data, the problem could be that a switch is not initialized, but is generally set to theright value (0 or 1). By including a SET statement to ensure that the switch is initialized, you candetermine if the uninitialized switch is the cause of the problem.
Generating information about proceduresYou can use the USE FOR DEBUGGING declarative to include COBOL statements in a COBOL program andspecify when they should run. Use these statements to generate information about your program and howit is running. Code each USE FOR DEBUGGING declarative in a separate section in the DECLARATIVESSECTION of the PROCEDURE DIVISION.
For example, to check how many times a procedure is run, include a special procedure for debugging (inthe USE FOR DEBUGGING declarative) that adds 1 to a counter each time control passes to thatprocedure. The adding-to-a-counter technique can be used as a check for:
• How many times a PERFORM ran. This shows you whether the control flow you are using is correct.• How many times a loop routine actually runs. This tells you whether the loop is running and whether the
number you have used for the loop is accurate.
You can use debugging lines, debugging statements, or both in your program. Debugging lines are placedin your program, and are identified by a D in position 7. Debugging statements are coded in theDECLARATIVES SECTION of the PROCEDURE DIVISION.
• The USE FOR DEBUGGING declaratives must:
– Be only in the DECLARATIVES SECTION– Follow a DECLARATIVES header USE FOR DEBUGGING
With USE FOR DEBUGGING, the TEST compiler option must have the NONE hook-location suboptionspecified or the NOTEST compiler option must be specified. The TEST compiler option and the DEBUGruntime option are mutually exclusive, with DEBUG taking precedence.
• Debugging lines must have a D in position 7 to identify them.
To use debugging lines and statements in your declarative procedures, you must include both:
• WITH DEBUGGING MODE in the SOURCE-COMPUTER paragraph in the ENVIRONMENT DIVISION• The DEBUG runtime option
224 z/OS: z/OS Language Environment Debugging Guide
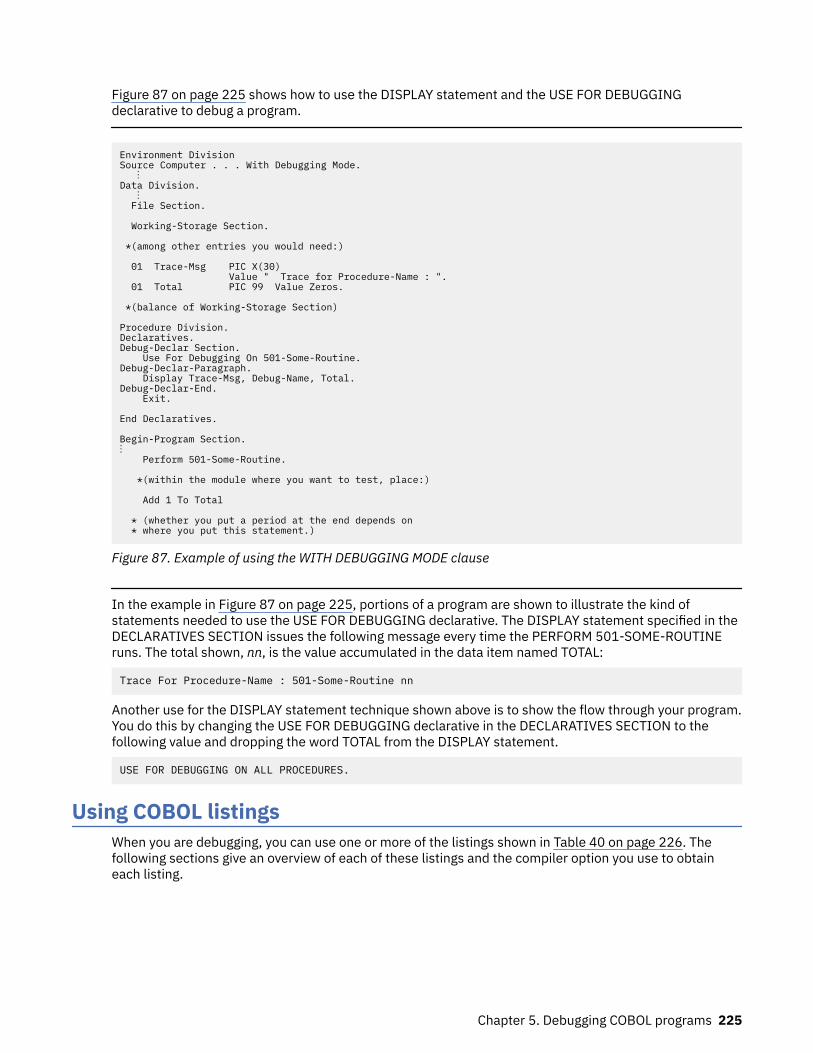
Figure 87 on page 225 shows how to use the DISPLAY statement and the USE FOR DEBUGGINGdeclarative to debug a program.
Environment DivisionSource Computer . . . With Debugging Mode. ⋮Data Division. ⋮ File Section.
Working-Storage Section.
*(among other entries you would need:)
01 Trace-Msg PIC X(30) Value " Trace for Procedure-Name : ". 01 Total PIC 99 Value Zeros.
*(balance of Working-Storage Section)
Procedure Division.Declaratives.Debug-Declar Section. Use For Debugging On 501-Some-Routine.Debug-Declar-Paragraph. Display Trace-Msg, Debug-Name, Total.Debug-Declar-End. Exit.
End Declaratives.
Begin-Program Section.⋮ Perform 501-Some-Routine.
*(within the module where you want to test, place:)
Add 1 To Total
* (whether you put a period at the end depends on * where you put this statement.)
Figure 87. Example of using the WITH DEBUGGING MODE clause
In the example in Figure 87 on page 225, portions of a program are shown to illustrate the kind ofstatements needed to use the USE FOR DEBUGGING declarative. The DISPLAY statement specified in theDECLARATIVES SECTION issues the following message every time the PERFORM 501-SOME-ROUTINEruns. The total shown, nn, is the value accumulated in the data item named TOTAL:
Trace For Procedure-Name : 501-Some-Routine nn
Another use for the DISPLAY statement technique shown above is to show the flow through your program.You do this by changing the USE FOR DEBUGGING declarative in the DECLARATIVES SECTION to thefollowing value and dropping the word TOTAL from the DISPLAY statement.
USE FOR DEBUGGING ON ALL PROCEDURES.
Using COBOL listingsWhen you are debugging, you can use one or more of the listings shown in Table 40 on page 226. Thefollowing sections give an overview of each of these listings and the compiler option you use to obtaineach listing.
Chapter 5. Debugging COBOL programs 225
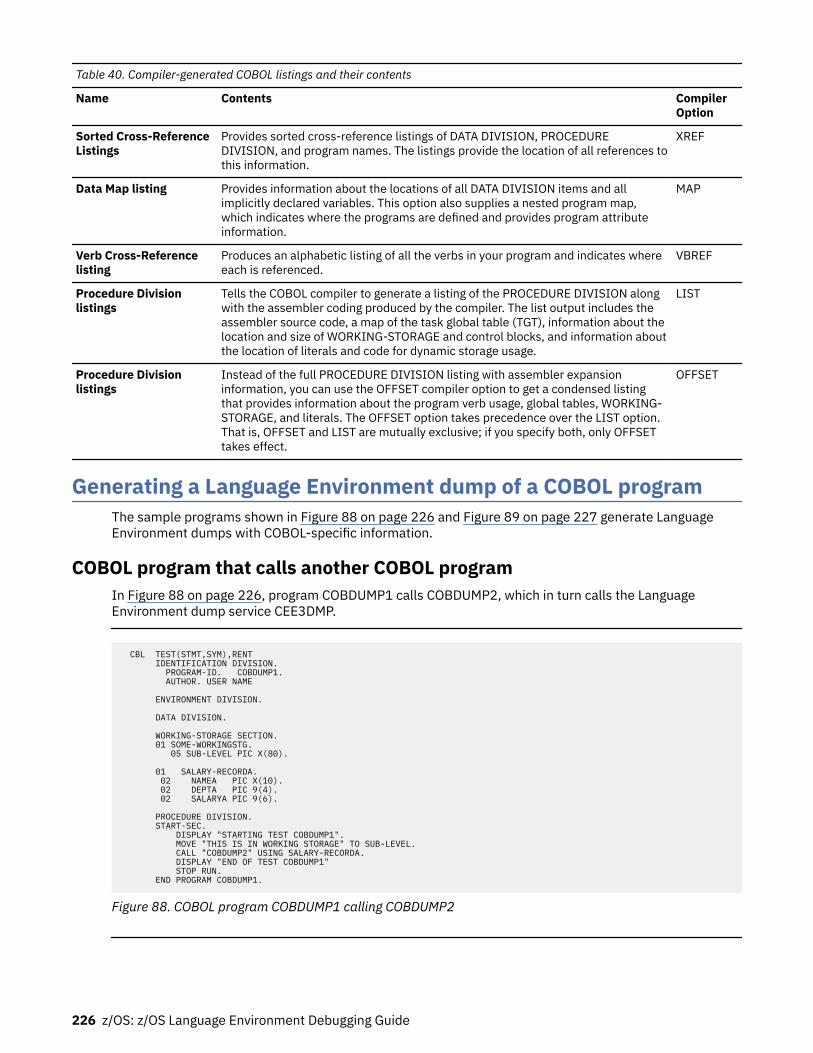
Table 40. Compiler-generated COBOL listings and their contents
Name Contents CompilerOption
Sorted Cross-ReferenceListings
Provides sorted cross-reference listings of DATA DIVISION, PROCEDUREDIVISION, and program names. The listings provide the location of all references tothis information.
XREF
Data Map listing Provides information about the locations of all DATA DIVISION items and allimplicitly declared variables. This option also supplies a nested program map,which indicates where the programs are defined and provides program attributeinformation.
MAP
Verb Cross-Referencelisting
Produces an alphabetic listing of all the verbs in your program and indicates whereeach is referenced.
VBREF
Procedure Divisionlistings
Tells the COBOL compiler to generate a listing of the PROCEDURE DIVISION alongwith the assembler coding produced by the compiler. The list output includes theassembler source code, a map of the task global table (TGT), information about thelocation and size of WORKING-STORAGE and control blocks, and information aboutthe location of literals and code for dynamic storage usage.
LIST
Procedure Divisionlistings
Instead of the full PROCEDURE DIVISION listing with assembler expansioninformation, you can use the OFFSET compiler option to get a condensed listingthat provides information about the program verb usage, global tables, WORKING-STORAGE, and literals. The OFFSET option takes precedence over the LIST option.That is, OFFSET and LIST are mutually exclusive; if you specify both, only OFFSETtakes effect.
OFFSET
Generating a Language Environment dump of a COBOL programThe sample programs shown in Figure 88 on page 226 and Figure 89 on page 227 generate LanguageEnvironment dumps with COBOL-specific information.
COBOL program that calls another COBOL programIn Figure 88 on page 226, program COBDUMP1 calls COBDUMP2, which in turn calls the LanguageEnvironment dump service CEE3DMP.
CBL TEST(STMT,SYM),RENT IDENTIFICATION DIVISION. PROGRAM-ID. COBDUMP1. AUTHOR. USER NAME
ENVIRONMENT DIVISION.
DATA DIVISION.
WORKING-STORAGE SECTION. 01 SOME-WORKINGSTG. 05 SUB-LEVEL PIC X(80).
01 SALARY-RECORDA. 02 NAMEA PIC X(10). 02 DEPTA PIC 9(4). 02 SALARYA PIC 9(6).
PROCEDURE DIVISION. START-SEC. DISPLAY "STARTING TEST COBDUMP1". MOVE "THIS IS IN WORKING STORAGE" TO SUB-LEVEL. CALL "COBDUMP2" USING SALARY-RECORDA. DISPLAY "END OF TEST COBDUMP1" STOP RUN. END PROGRAM COBDUMP1.
Figure 88. COBOL program COBDUMP1 calling COBDUMP2
226 z/OS: z/OS Language Environment Debugging Guide
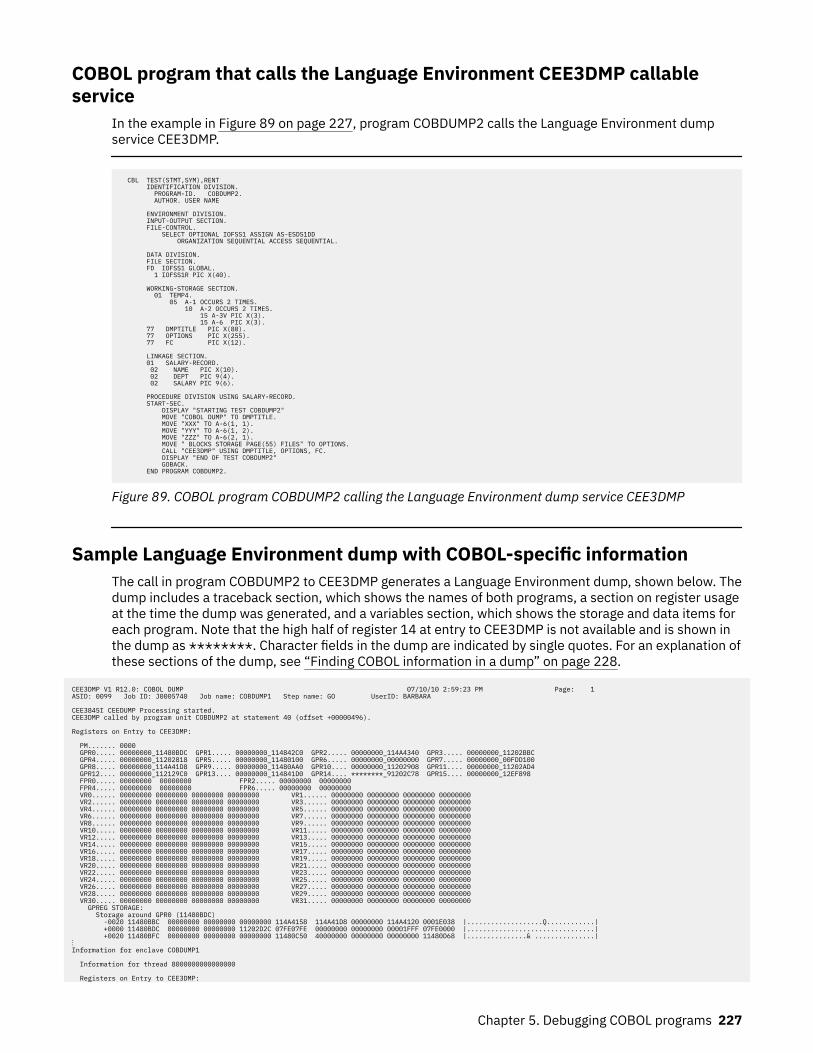
COBOL program that calls the Language Environment CEE3DMP callableservice
In the example in Figure 89 on page 227, program COBDUMP2 calls the Language Environment dumpservice CEE3DMP.
CBL TEST(STMT,SYM),RENT IDENTIFICATION DIVISION. PROGRAM-ID. COBDUMP2. AUTHOR. USER NAME
ENVIRONMENT DIVISION. INPUT-OUTPUT SECTION. FILE-CONTROL. SELECT OPTIONAL IOFSS1 ASSIGN AS-ESDS1DD ORGANIZATION SEQUENTIAL ACCESS SEQUENTIAL.
DATA DIVISION. FILE SECTION. FD IOFSS1 GLOBAL. 1 IOFSS1R PIC X(40).
WORKING-STORAGE SECTION. 01 TEMP4. 05 A-1 OCCURS 2 TIMES. 10 A-2 OCCURS 2 TIMES. 15 A-3V PIC X(3). 15 A-6 PIC X(3). 77 DMPTITLE PIC X(80). 77 OPTIONS PIC X(255). 77 FC PIC X(12).
LINKAGE SECTION. 01 SALARY-RECORD. 02 NAME PIC X(10). 02 DEPT PIC 9(4). 02 SALARY PIC 9(6).
PROCEDURE DIVISION USING SALARY-RECORD. START-SEC. DISPLAY "STARTING TEST COBDUMP2" MOVE "COBOL DUMP" TO DMPTITLE. MOVE "XXX" TO A-6(1, 1). MOVE "YYY" TO A-6(1, 2). MOVE "ZZZ" TO A-6(2, 1). MOVE " BLOCKS STORAGE PAGE(55) FILES" TO OPTIONS. CALL "CEE3DMP" USING DMPTITLE, OPTIONS, FC. DISPLAY "END OF TEST COBDUMP2" GOBACK. END PROGRAM COBDUMP2.
Figure 89. COBOL program COBDUMP2 calling the Language Environment dump service CEE3DMP
Sample Language Environment dump with COBOL-specific informationThe call in program COBDUMP2 to CEE3DMP generates a Language Environment dump, shown below. Thedump includes a traceback section, which shows the names of both programs, a section on register usageat the time the dump was generated, and a variables section, which shows the storage and data items foreach program. Note that the high half of register 14 at entry to CEE3DMP is not available and is shown inthe dump as ********. Character fields in the dump are indicated by single quotes. For an explanation ofthese sections of the dump, see “Finding COBOL information in a dump” on page 228.
CEE3DMP V1 R12.0: COBOL DUMP 07/10/10 2:59:23 PM Page: 1 ASID: 0099 Job ID: J0005740 Job name: COBDUMP1 Step name: GO UserID: BARBARA CEE3845I CEEDUMP Processing started. CEE3DMP called by program unit COBDUMP2 at statement 40 (offset +00000496). Registers on Entry to CEE3DMP: PM....... 0000 GPR0..... 00000000_11480BDC GPR1..... 00000000_114842C0 GPR2..... 00000000_114A4340 GPR3..... 00000000_11202BBC GPR4..... 00000000_11202818 GPR5..... 00000000_11480100 GPR6..... 00000000_00000000 GPR7..... 00000000_00FDD100 GPR8..... 00000000_114A41D8 GPR9..... 00000000_11480AA0 GPR10.... 00000000_11202908 GPR11.... 00000000_11202AD4 GPR12.... 00000000_112129C0 GPR13.... 00000000_114841D0 GPR14.... ********_91202C78 GPR15.... 00000000_12EF898 FPR0..... 00000000 00000000 FPR2..... 00000000 00000000 FPR4..... 00000000 00000000 FPR6..... 00000000 00000000 VR0...... 00000000 00000000 00000000 00000000 VR1...... 00000000 00000000 00000000 00000000 VR2...... 00000000 00000000 00000000 00000000 VR3...... 00000000 00000000 00000000 00000000 VR4...... 00000000 00000000 00000000 00000000 VR5...... 00000000 00000000 00000000 00000000 VR6...... 00000000 00000000 00000000 00000000 VR7...... 00000000 00000000 00000000 00000000 VR8...... 00000000 00000000 00000000 00000000 VR9...... 00000000 00000000 00000000 00000000 VR10..... 00000000 00000000 00000000 00000000 VR11..... 00000000 00000000 00000000 00000000 VR12..... 00000000 00000000 00000000 00000000 VR13..... 00000000 00000000 00000000 00000000 VR14..... 00000000 00000000 00000000 00000000 VR15..... 00000000 00000000 00000000 00000000 VR16..... 00000000 00000000 00000000 00000000 VR17..... 00000000 00000000 00000000 00000000 VR18..... 00000000 00000000 00000000 00000000 VR19..... 00000000 00000000 00000000 00000000 VR20..... 00000000 00000000 00000000 00000000 VR21..... 00000000 00000000 00000000 00000000 VR22..... 00000000 00000000 00000000 00000000 VR23..... 00000000 00000000 00000000 00000000 VR24..... 00000000 00000000 00000000 00000000 VR25..... 00000000 00000000 00000000 00000000 VR26..... 00000000 00000000 00000000 00000000 VR27..... 00000000 00000000 00000000 00000000 VR28..... 00000000 00000000 00000000 00000000 VR29..... 00000000 00000000 00000000 00000000 VR30..... 00000000 00000000 00000000 00000000 VR31..... 00000000 00000000 00000000 00000000 GPREG STORAGE: Storage around GPR0 (11480BDC) -0020 11480BBC 00000000 00000000 00000000 114A4158 114A41D8 00000000 114A4120 0001E038 |...................Q............| +0000 11480BDC 00000000 00000000 11202D2C 07FE07FE 00000000 00000000 00001FFF 07FE0000 |................................| +0020 11480BFC 00000000 00000000 00000000 11480C50 40000000 00000000 00000000 11480D68 |...............& ...............|⋮ Information for enclave COBDUMP1 Information for thread 8000000000000000 Registers on Entry to CEE3DMP:
Chapter 5. Debugging COBOL programs 227
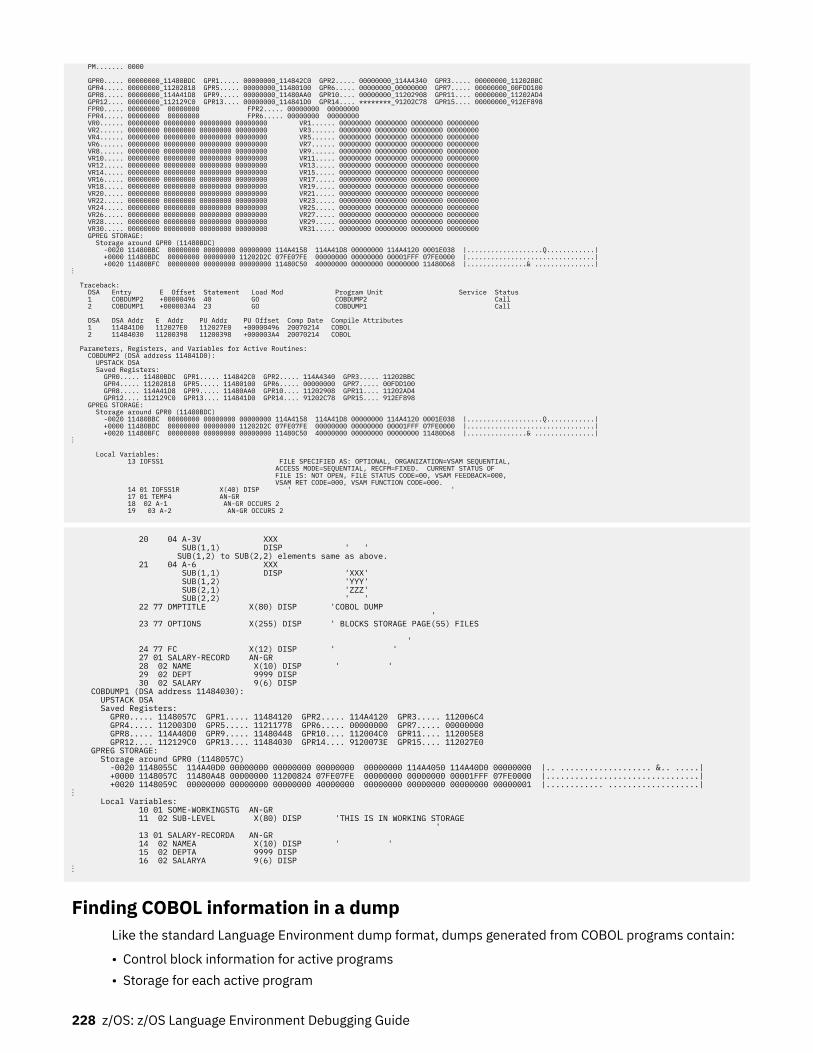
PM....... 0000 GPR0..... 00000000_11480BDC GPR1..... 00000000_114842C0 GPR2..... 00000000_114A4340 GPR3..... 00000000_11202BBC GPR4..... 00000000_11202818 GPR5..... 00000000_11480100 GPR6..... 00000000_00000000 GPR7..... 00000000_00FDD100 GPR8..... 00000000_114A41D8 GPR9..... 00000000_11480AA0 GPR10.... 00000000_11202908 GPR11.... 00000000_11202AD4 GPR12.... 00000000_112129C0 GPR13.... 00000000_114841D0 GPR14.... ********_91202C78 GPR15.... 00000000_912EF898 FPR0..... 00000000 00000000 FPR2..... 00000000 00000000 FPR4..... 00000000 00000000 FPR6..... 00000000 00000000 VR0...... 00000000 00000000 00000000 00000000 VR1...... 00000000 00000000 00000000 00000000 VR2...... 00000000 00000000 00000000 00000000 VR3...... 00000000 00000000 00000000 00000000 VR4...... 00000000 00000000 00000000 00000000 VR5...... 00000000 00000000 00000000 00000000 VR6...... 00000000 00000000 00000000 00000000 VR7...... 00000000 00000000 00000000 00000000 VR8...... 00000000 00000000 00000000 00000000 VR9...... 00000000 00000000 00000000 00000000 VR10..... 00000000 00000000 00000000 00000000 VR11..... 00000000 00000000 00000000 00000000 VR12..... 00000000 00000000 00000000 00000000 VR13..... 00000000 00000000 00000000 00000000 VR14..... 00000000 00000000 00000000 00000000 VR15..... 00000000 00000000 00000000 00000000 VR16..... 00000000 00000000 00000000 00000000 VR17..... 00000000 00000000 00000000 00000000 VR18..... 00000000 00000000 00000000 00000000 VR19..... 00000000 00000000 00000000 00000000 VR20..... 00000000 00000000 00000000 00000000 VR21..... 00000000 00000000 00000000 00000000 VR22..... 00000000 00000000 00000000 00000000 VR23..... 00000000 00000000 00000000 00000000 VR24..... 00000000 00000000 00000000 00000000 VR25..... 00000000 00000000 00000000 00000000 VR26..... 00000000 00000000 00000000 00000000 VR27..... 00000000 00000000 00000000 00000000 VR28..... 00000000 00000000 00000000 00000000 VR29..... 00000000 00000000 00000000 00000000 VR30..... 00000000 00000000 00000000 00000000 VR31..... 00000000 00000000 00000000 00000000 GPREG STORAGE: Storage around GPR0 (11480BDC) -0020 11480BBC 00000000 00000000 00000000 114A4158 114A41D8 00000000 114A4120 0001E038 |...................Q............| +0000 11480BDC 00000000 00000000 11202D2C 07FE07FE 00000000 00000000 00001FFF 07FE0000 |................................| +0020 11480BFC 00000000 00000000 00000000 11480C50 40000000 00000000 00000000 11480D68 |...............& ...............|⋮ Traceback: DSA Entry E Offset Statement Load Mod Program Unit Service Status 1 COBDUMP2 +00000496 40 GO COBDUMP2 Call 2 COBDUMP1 +000003A4 23 GO COBDUMP1 Call DSA DSA Addr E Addr PU Addr PU Offset Comp Date Compile Attributes 1 114841D0 112027E0 112027E0 +00000496 20070214 COBOL 2 11484030 11200398 11200398 +000003A4 20070214 COBOL Parameters, Registers, and Variables for Active Routines: COBDUMP2 (DSA address 114841D0): UPSTACK DSA Saved Registers: GPR0..... 11480BDC GPR1..... 114842C0 GPR2..... 114A4340 GPR3..... 11202BBC GPR4..... 11202818 GPR5..... 11480100 GPR6..... 00000000 GPR7..... 00FDD100 GPR8..... 114A41D8 GPR9..... 11480AA0 GPR10.... 11202908 GPR11.... 11202AD4 GPR12.... 112129C0 GPR13.... 114841D0 GPR14.... 91202C78 GPR15.... 912EF898 GPREG STORAGE: Storage around GPR0 (11480BDC) -0020 11480BBC 00000000 00000000 00000000 114A4158 114A41D8 00000000 114A4120 0001E038 |...................Q............| +0000 11480BDC 00000000 00000000 11202D2C 07FE07FE 00000000 00000000 00001FFF 07FE0000 |................................| +0020 11480BFC 00000000 00000000 00000000 11480C50 40000000 00000000 00000000 11480D68 |...............& ...............|⋮ Local Variables: 13 IOFSS1 FILE SPECIFIED AS: OPTIONAL, ORGANIZATION=VSAM SEQUENTIAL, ACCESS MODE=SEQUENTIAL, RECFM=FIXED. CURRENT STATUS OF FILE IS: NOT OPEN, FILE STATUS CODE=00, VSAM FEEDBACK=000, VSAM RET CODE=000, VSAM FUNCTION CODE=000. 14 01 IOFSS1R X(40) DISP ' ' 17 01 TEMP4 AN-GR 18 02 A-1 AN-GR OCCURS 2 19 03 A-2 AN-GR OCCURS 2
20 04 A-3V XXX SUB(1,1) DISP ' ' SUB(1,2) to SUB(2,2) elements same as above. 21 04 A-6 XXX SUB(1,1) DISP 'XXX' SUB(1,2) 'YYY' SUB(2,1) 'ZZZ' SUB(2,2) ' ' 22 77 DMPTITLE X(80) DISP 'COBOL DUMP ' 23 77 OPTIONS X(255) DISP ' BLOCKS STORAGE PAGE(55) FILES ' 24 77 FC X(12) DISP ' ' 27 01 SALARY-RECORD AN-GR 28 02 NAME X(10) DISP ' ' 29 02 DEPT 9999 DISP 30 02 SALARY 9(6) DISP COBDUMP1 (DSA address 11484030): UPSTACK DSA Saved Registers: GPR0..... 1148057C GPR1..... 11484120 GPR2..... 114A4120 GPR3..... 112006C4 GPR4..... 112003D0 GPR5..... 11211778 GPR6..... 00000000 GPR7..... 00000000 GPR8..... 114A40D0 GPR9..... 11480448 GPR10.... 112004C0 GPR11.... 112005E8 GPR12.... 112129C0 GPR13.... 11484030 GPR14.... 9120073E GPR15.... 112027E0 GPREG STORAGE: Storage around GPR0 (1148057C) -0020 1148055C 114A40D0 00000000 00000000 00000000 00000000 114A4050 114A40D0 00000000 |.. ................... &.. .....| +0000 1148057C 11480A48 00000000 11200824 07FE07FE 00000000 00000000 00001FFF 07FE0000 |................................| +0020 1148059C 00000000 00000000 00000000 40000000 00000000 00000000 00000000 00000001 |............ ...................|⋮ Local Variables: 10 01 SOME-WORKINGSTG AN-GR 11 02 SUB-LEVEL X(80) DISP 'THIS IS IN WORKING STORAGE ' 13 01 SALARY-RECORDA AN-GR 14 02 NAMEA X(10) DISP ' ' 15 02 DEPTA 9999 DISP 16 02 SALARYA 9(6) DISP ⋮
Finding COBOL information in a dumpLike the standard Language Environment dump format, dumps generated from COBOL programs contain:
• Control block information for active programs• Storage for each active program
228 z/OS: z/OS Language Environment Debugging Guide
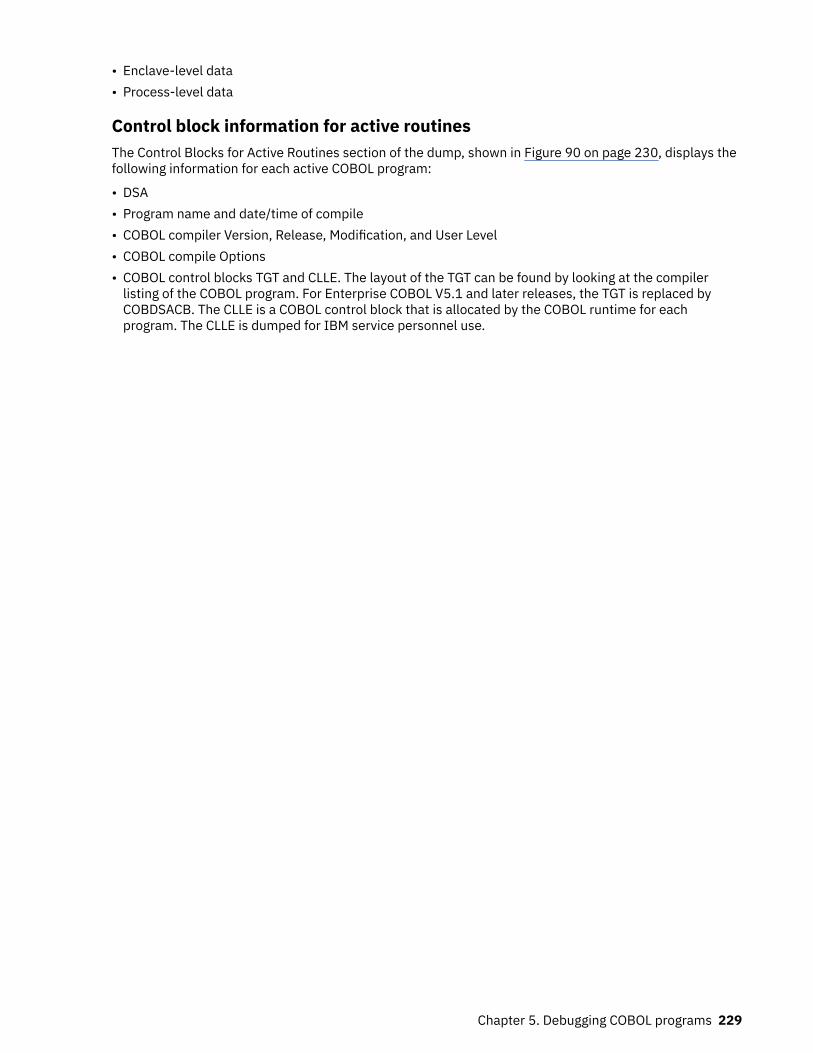
• Enclave-level data• Process-level data
Control block information for active routinesThe Control Blocks for Active Routines section of the dump, shown in Figure 90 on page 230, displays thefollowing information for each active COBOL program:
• DSA• Program name and date/time of compile• COBOL compiler Version, Release, Modification, and User Level• COBOL compile Options• COBOL control blocks TGT and CLLE. The layout of the TGT can be found by looking at the compiler
listing of the COBOL program. For Enterprise COBOL V5.1 and later releases, the TGT is replaced byCOBDSACB. The CLLE is a COBOL control block that is allocated by the COBOL runtime for eachprogram. The CLLE is dumped for IBM service personnel use.
Chapter 5. Debugging COBOL programs 229
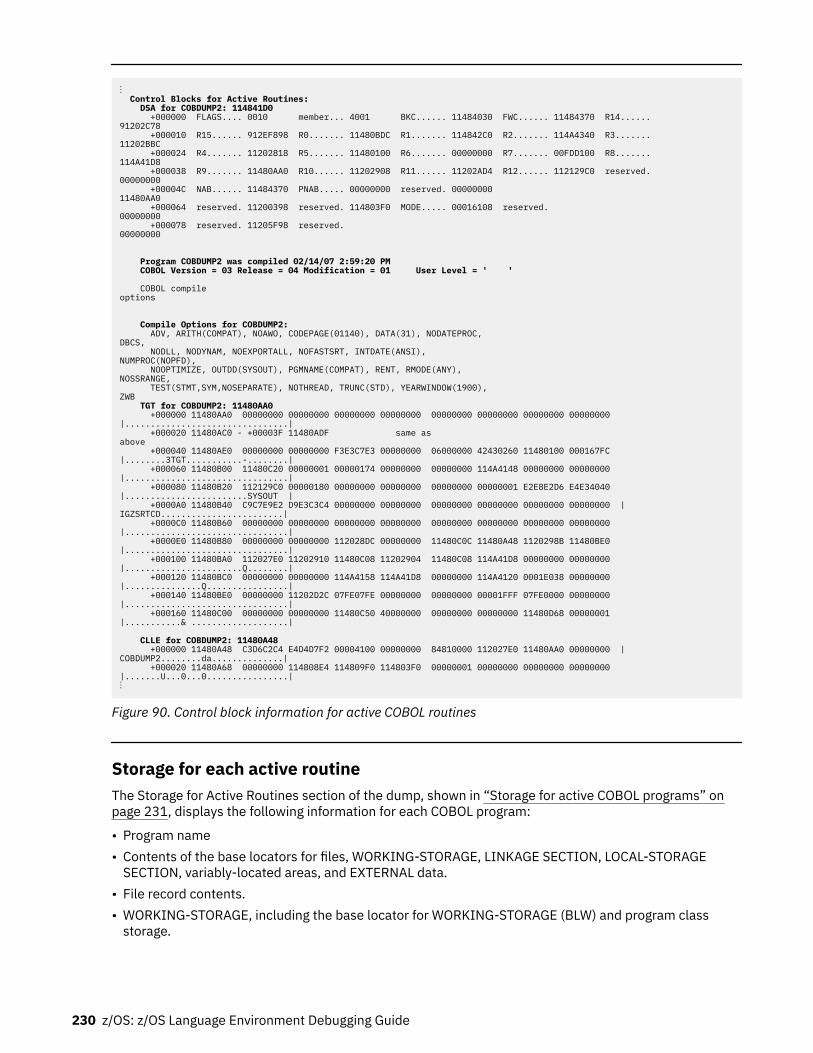
⋮ Control Blocks for Active Routines: DSA for COBDUMP2: 114841D0 +000000 FLAGS.... 0010 member... 4001 BKC...... 11484030 FWC...... 11484370 R14...... 91202C78 +000010 R15...... 912EF898 R0....... 11480BDC R1....... 114842C0 R2....... 114A4340 R3....... 11202BBC +000024 R4....... 11202818 R5....... 11480100 R6....... 00000000 R7....... 00FDD100 R8....... 114A41D8 +000038 R9....... 11480AA0 R10...... 11202908 R11...... 11202AD4 R12...... 112129C0 reserved. 00000000 +00004C NAB...... 11484370 PNAB..... 00000000 reserved. 00000000 11480AA0 +000064 reserved. 11200398 reserved. 114803F0 MODE..... 00016108 reserved. 00000000 +000078 reserved. 11205F98 reserved. 00000000 Program COBDUMP2 was compiled 02/14/07 2:59:20 PM COBOL Version = 03 Release = 04 Modification = 01 User Level = ' ' COBOL compile options Compile Options for COBDUMP2: ADV, ARITH(COMPAT), NOAWO, CODEPAGE(01140), DATA(31), NODATEPROC, DBCS, NODLL, NODYNAM, NOEXPORTALL, NOFASTSRT, INTDATE(ANSI), NUMPROC(NOPFD), NOOPTIMIZE, OUTDD(SYSOUT), PGMNAME(COMPAT), RENT, RMODE(ANY), NOSSRANGE, TEST(STMT,SYM,NOSEPARATE), NOTHREAD, TRUNC(STD), YEARWINDOW(1900), ZWB TGT for COBDUMP2: 11480AA0 +000000 11480AA0 00000000 00000000 00000000 00000000 00000000 00000000 00000000 00000000 |................................| +000020 11480AC0 - +00003F 11480ADF same as above +000040 11480AE0 00000000 00000000 F3E3C7E3 00000000 06000000 42430260 11480100 000167FC |........3TGT...........-........| +000060 11480B00 11480C20 00000001 00000174 00000000 00000000 114A4148 00000000 00000000 |................................| +000080 11480B20 112129C0 00000180 00000000 00000000 00000000 00000001 E2E8E2D6 E4E34040 |........................SYSOUT | +0000A0 11480B40 C9C7E9E2 D9E3C3C4 00000000 00000000 00000000 00000000 00000000 00000000 |IGZSRTCD........................| +0000C0 11480B60 00000000 00000000 00000000 00000000 00000000 00000000 00000000 00000000 |................................| +0000E0 11480B80 00000000 00000000 112028DC 00000000 11480C0C 11480A48 1120298B 11480BE0 |................................| +000100 11480BA0 112027E0 11202910 11480C08 11202904 11480C08 114A41D8 00000000 00000000 |.......................Q........| +000120 11480BC0 00000000 00000000 114A4158 114A41D8 00000000 114A4120 0001E038 00000000 |...............Q................| +000140 11480BE0 00000000 11202D2C 07FE07FE 00000000 00000000 00001FFF 07FE0000 00000000 |................................| +000160 11480C00 00000000 00000000 11480C50 40000000 00000000 00000000 11480D68 00000001 |...........& ...................|
CLLE for COBDUMP2: 11480A48 +000000 11480A48 C3D6C2C4 E4D4D7F2 00004100 00000000 84810000 112027E0 11480AA0 00000000 |COBDUMP2........da..............| +000020 11480A68 00000000 114808E4 114809F0 114803F0 00000001 00000000 00000000 00000000 |.......U...0...0................|⋮
Figure 90. Control block information for active COBOL routines
Storage for each active routineThe Storage for Active Routines section of the dump, shown in “Storage for active COBOL programs” onpage 231, displays the following information for each COBOL program:
• Program name• Contents of the base locators for files, WORKING-STORAGE, LINKAGE SECTION, LOCAL-STORAGE
SECTION, variably-located areas, and EXTERNAL data. • File record contents.• WORKING-STORAGE, including the base locator for WORKING-STORAGE (BLW) and program class
storage.
230 z/OS: z/OS Language Environment Debugging Guide
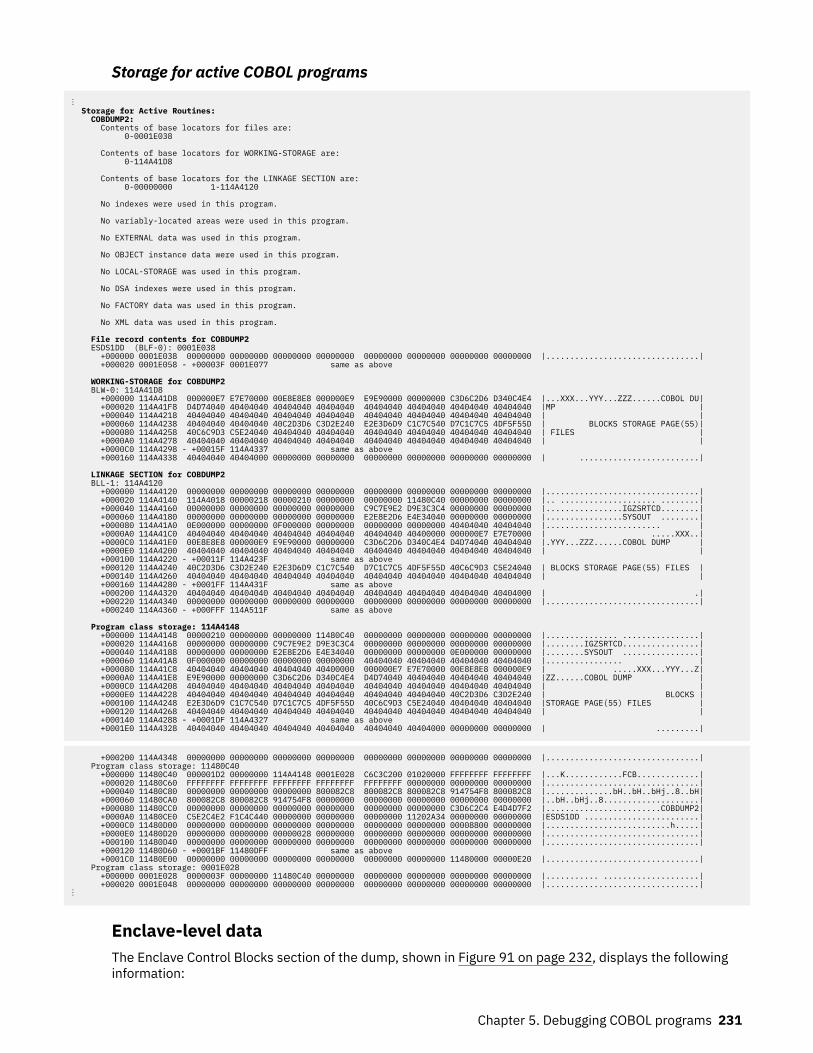
Storage for active COBOL programs⋮ Storage for Active Routines: COBDUMP2: Contents of base locators for files are: 0-0001E038 Contents of base locators for WORKING-STORAGE are: 0-114A41D8 Contents of base locators for the LINKAGE SECTION are: 0-00000000 1-114A4120 No indexes were used in this program. No variably-located areas were used in this program. No EXTERNAL data was used in this program. No OBJECT instance data were used in this program. No LOCAL-STORAGE was used in this program. No DSA indexes were used in this program. No FACTORY data was used in this program. No XML data was used in this program. File record contents for COBDUMP2 ESDS1DD (BLF-0): 0001E038 +000000 0001E038 00000000 00000000 00000000 00000000 00000000 00000000 00000000 00000000 |................................| +000020 0001E058 - +00003F 0001E077 same as above WORKING-STORAGE for COBDUMP2 BLW-0: 114A41D8 +000000 114A41D8 000000E7 E7E70000 00E8E8E8 000000E9 E9E90000 00000000 C3D6C2D6 D340C4E4 |...XXX...YYY...ZZZ......COBOL DU| +000020 114A41F8 D4D74040 40404040 40404040 40404040 40404040 40404040 40404040 40404040 |MP | +000040 114A4218 40404040 40404040 40404040 40404040 40404040 40404040 40404040 40404040 | | +000060 114A4238 40404040 40404040 40C2D3D6 C3D2E240 E2E3D6D9 C1C7C540 D7C1C7C5 4DF5F55D | BLOCKS STORAGE PAGE(55)| +000080 114A4258 40C6C9D3 C5E24040 40404040 40404040 40404040 40404040 40404040 40404040 | FILES | +0000A0 114A4278 40404040 40404040 40404040 40404040 40404040 40404040 40404040 40404040 | | +0000C0 114A4298 - +00015F 114A4337 same as above +000160 114A4338 40404040 40404000 00000000 00000000 00000000 00000000 00000000 00000000 | .........................| LINKAGE SECTION for COBDUMP2 BLL-1: 114A4120 +000000 114A4120 00000000 00000000 00000000 00000000 00000000 00000000 00000000 00000000 |................................| +000020 114A4140 114A4018 00000218 00000210 00000000 00000000 11480C40 00000000 00000000 |.. .................... ........| +000040 114A4160 00000000 00000000 00000000 00000000 C9C7E9E2 D9E3C3C4 00000000 00000000 |................IGZSRTCD........| +000060 114A4180 00000000 00000000 00000000 00000000 E2E8E2D6 E4E34040 00000000 00000000 |................SYSOUT ........| +000080 114A41A0 0E000000 00000000 0F000000 00000000 00000000 00000000 40404040 40404040 |........................ | +0000A0 114A41C0 40404040 40404040 40404040 40404040 40404040 40400000 000000E7 E7E70000 | .....XXX..| +0000C0 114A41E0 00E8E8E8 000000E9 E9E90000 00000000 C3D6C2D6 D340C4E4 D4D74040 40404040 |.YYY...ZZZ......COBOL DUMP | +0000E0 114A4200 40404040 40404040 40404040 40404040 40404040 40404040 40404040 40404040 | | +000100 114A4220 - +00011F 114A423F same as above +000120 114A4240 40C2D3D6 C3D2E240 E2E3D6D9 C1C7C540 D7C1C7C5 4DF5F55D 40C6C9D3 C5E24040 | BLOCKS STORAGE PAGE(55) FILES | +000140 114A4260 40404040 40404040 40404040 40404040 40404040 40404040 40404040 40404040 | | +000160 114A4280 - +0001FF 114A431F same as above +000200 114A4320 40404040 40404040 40404040 40404040 40404040 40404040 40404040 40404000 | .| +000220 114A4340 00000000 00000000 00000000 00000000 00000000 00000000 00000000 00000000 |................................| +000240 114A4360 - +000FFF 114A511F same as above Program class storage: 114A4148 +000000 114A4148 00000210 00000000 00000000 11480C40 00000000 00000000 00000000 00000000 |............... ................| +000020 114A4168 00000000 00000000 C9C7E9E2 D9E3C3C4 00000000 00000000 00000000 00000000 |........IGZSRTCD................| +000040 114A4188 00000000 00000000 E2E8E2D6 E4E34040 00000000 00000000 0E000000 00000000 |........SYSOUT ................| +000060 114A41A8 0F000000 00000000 00000000 00000000 40404040 40404040 40404040 40404040 |................ | +000080 114A41C8 40404040 40404040 40404040 40400000 000000E7 E7E70000 00E8E8E8 000000E9 | .....XXX...YYY...Z| +0000A0 114A41E8 E9E90000 00000000 C3D6C2D6 D340C4E4 D4D74040 40404040 40404040 40404040 |ZZ......COBOL DUMP | +0000C0 114A4208 40404040 40404040 40404040 40404040 40404040 40404040 40404040 40404040 | | +0000E0 114A4228 40404040 40404040 40404040 40404040 40404040 40404040 40C2D3D6 C3D2E240 | BLOCKS | +000100 114A4248 E2E3D6D9 C1C7C540 D7C1C7C5 4DF5F55D 40C6C9D3 C5E24040 40404040 40404040 |STORAGE PAGE(55) FILES | +000120 114A4268 40404040 40404040 40404040 40404040 40404040 40404040 40404040 40404040 | | +000140 114A4288 - +0001DF 114A4327 same as above +0001E0 114A4328 40404040 40404040 40404040 40404040 40404040 40404000 00000000 00000000 | .........|
+000200 114A4348 00000000 00000000 00000000 00000000 00000000 00000000 00000000 00000000 |................................| Program class storage: 11480C40 +000000 11480C40 000001D2 00000000 114A4148 0001E028 C6C3C200 01020000 FFFFFFFF FFFFFFFF |...K............FCB.............| +000020 11480C60 FFFFFFFF FFFFFFFF FFFFFFFF FFFFFFFF FFFFFFFF 00000000 00000000 00000000 |................................| +000040 11480C80 00000000 00000000 00000000 800082C8 800082C8 800082C8 914754F8 800082C8 |..............bH..bH..bHj..8..bH| +000060 11480CA0 800082C8 800082C8 914754F8 00000000 00000000 00000000 00000000 00000000 |..bH..bHj..8....................| +000080 11480CC0 00000000 00000000 00000000 00000000 00000000 00000000 C3D6C2C4 E4D4D7F2 |........................COBDUMP2| +0000A0 11480CE0 C5E2C4E2 F1C4C440 00000000 00000000 00000000 11202A34 00000000 00000000 |ESDS1DD ........................| +0000C0 11480D00 00000000 00000000 00000000 00000000 00000000 00000000 00008800 00000000 |..........................h.....| +0000E0 11480D20 00000000 00000000 00000028 00000000 00000000 00000000 00000000 00000000 |................................| +000100 11480D40 00000000 00000000 00000000 00000000 00000000 00000000 00000000 00000000 |................................| +000120 11480D60 - +0001BF 11480DFF same as above +0001C0 11480E00 00000000 00000000 00000000 00000000 00000000 00000000 11480000 00000E20 |................................| Program class storage: 0001E028 +000000 0001E028 0000003F 00000000 11480C40 00000000 00000000 00000000 00000000 00000000 |........... ....................| +000020 0001E048 00000000 00000000 00000000 00000000 00000000 00000000 00000000 00000000 |................................|⋮
Enclave-level dataThe Enclave Control Blocks section of the dump, shown in Figure 91 on page 232, displays the followinginformation:
Chapter 5. Debugging COBOL programs 231
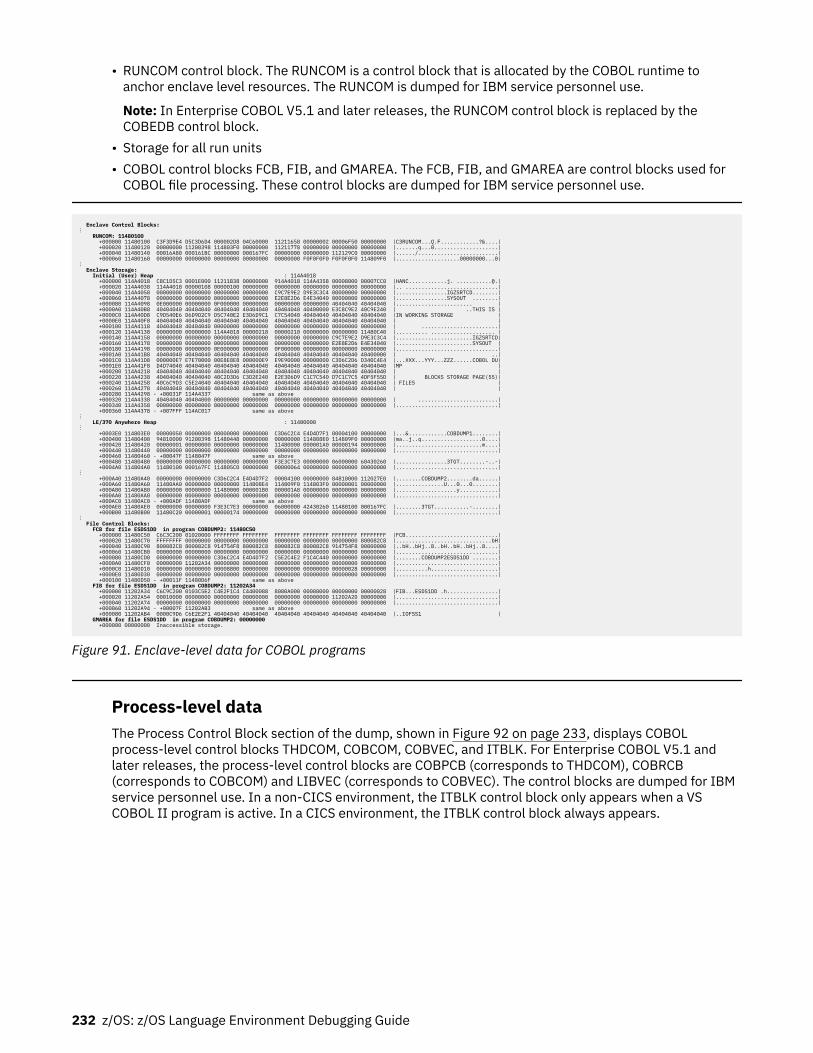
• RUNCOM control block. The RUNCOM is a control block that is allocated by the COBOL runtime toanchor enclave level resources. The RUNCOM is dumped for IBM service personnel use.
Note: In Enterprise COBOL V5.1 and later releases, the RUNCOM control block is replaced by theCOBEDB control block.
• Storage for all run units• COBOL control blocks FCB, FIB, and GMAREA. The FCB, FIB, and GMAREA are control blocks used for
COBOL file processing. These control blocks are dumped for IBM service personnel use.
Enclave Control Blocks: ⋮ RUNCOM: 11480100 +000000 11480100 C3F3D9E4 D5C3D6D4 000002D8 04C60000 11211658 00000002 00006F50 00000000 |C3RUNCOM...Q.F............?&....| +000020 11480120 00000000 11200398 114803F0 00000000 11211778 00000000 00000000 00000000 |.......q...0....................| +000040 11480140 00016A80 000161BC 00000000 000167FC 00000000 00000000 112129C0 00000000 |....../.........................| +000060 11480160 00000000 00000000 00000000 00000000 00000000 F0F0F0F0 F0F0F0F0 114809F0 |....................00000000...0|⋮ Enclave Storage: Initial (User) Heap : 114A4018 +000000 114A4018 C8C1D5C3 0001E000 11211B38 00000000 914A4018 114A4358 00008000 00007CC0 |HANC............j. ...........@.| +000020 114A4038 114A4018 00000108 00000100 00000000 00000000 00000000 00000000 00000000 |.. .............................| +000040 114A4058 00000000 00000000 00000000 00000000 C9C7E9E2 D9E3C3C4 00000000 00000000 |................IGZSRTCD........| +000060 114A4078 00000000 00000000 00000000 00000000 E2E8E2D6 E4E34040 00000000 00000000 |................SYSOUT ........| +000080 114A4098 0E000000 00000000 0F000000 00000000 00000000 00000000 40404040 40404040 |........................ | +0000A0 114A40B8 40404040 40404040 40404040 40404040 40404040 40400000 E3C8C9E2 40C9E240 | ..THIS IS | +0000C0 114A40D8 C9D540E6 D6D9D2C9 D5C740E2 E3D6D9C1 C7C54040 40404040 40404040 40404040 |IN WORKING STORAGE | +0000E0 114A40F8 40404040 40404040 40404040 40404040 40404040 40404040 40404040 40404040 | | +000100 114A4118 40404040 40404040 00000000 00000000 00000000 00000000 00000000 00000000 | ........................| +000120 114A4138 00000000 00000000 114A4018 00000218 00000210 00000000 00000000 11480C40 |.......... .................... | +000140 114A4158 00000000 00000000 00000000 00000000 00000000 00000000 C9C7E9E2 D9E3C3C4 |........................IGZSRTCD| +000160 114A4178 00000000 00000000 00000000 00000000 00000000 00000000 E2E8E2D6 E4E34040 |........................SYSOUT | +000180 114A4198 00000000 00000000 0E000000 00000000 0F000000 00000000 00000000 00000000 |................................| +0001A0 114A41B8 40404040 40404040 40404040 40404040 40404040 40404040 40404040 40400000 | ..| +0001C0 114A41D8 000000E7 E7E70000 00E8E8E8 000000E9 E9E90000 00000000 C3D6C2D6 D340C4E4 |...XXX...YYY...ZZZ......COBOL DU| +0001E0 114A41F8 D4D74040 40404040 40404040 40404040 40404040 40404040 40404040 40404040 |MP | +000200 114A4218 40404040 40404040 40404040 40404040 40404040 40404040 40404040 40404040 | | +000220 114A4238 40404040 40404040 40C2D3D6 C3D2E240 E2E3D6D9 C1C7C540 D7C1C7C5 4DF5F55D | BLOCKS STORAGE PAGE(55)| +000240 114A4258 40C6C9D3 C5E24040 40404040 40404040 40404040 40404040 40404040 40404040 | FILES | +000260 114A4278 40404040 40404040 40404040 40404040 40404040 40404040 40404040 40404040 | | +000280 114A4298 - +00031F 114A4337 same as above +000320 114A4338 40404040 40404000 00000000 00000000 00000000 00000000 00000000 00000000 | .........................| +000340 114A4358 00000000 00000000 00000000 00000000 00000000 00000000 00000000 00000000 |................................| +000360 114A4378 - +007FFF 114AC017 same as above ⋮ LE/370 Anywhere Heap : 11480000 ⋮ +0003E0 114803E0 00000050 00000000 00000000 00000000 C3D6C2C4 E4D4D7F1 00004100 00000000 |...&............COBDUMP1........| +000400 11480400 94810000 91200398 11480448 00000000 00000000 114808E0 114809F0 00000000 |ma..j..q...................0....| +000420 11480420 00000001 00000000 00000000 00000000 11480000 000001A0 00000194 00000000 |...........................m....| +000440 11480440 00000000 00000000 00000000 00000000 00000000 00000000 00000000 00000000 |................................| +000460 11480460 - +00047F 1148047F same as above +000480 11480480 00000000 00000000 00000000 00000000 F3E3C7E3 00000000 06000000 60430260 |................3TGT........-..-| +0004A0 114804A0 11480100 000167FC 114805C0 00000000 00000064 00000000 00000000 00000000 |................................|⋮ +000A40 11480A40 00000000 00000000 C3D6C2C4 E4D4D7F2 00004100 00000000 84810000 112027E0 |........COBDUMP2........da......| +000A60 11480A60 11480AA0 00000000 00000000 114808E4 114809F0 114803F0 00000001 00000000 |...............U...0...0........| +000A80 11480A80 00000000 00000000 11480000 000001B0 000001A8 00000000 00000000 00000000 |...................y............| +000AA0 11480AA0 00000000 00000000 00000000 00000000 00000000 00000000 00000000 00000000 |................................| +000AC0 11480AC0 - +000ADF 11480ADF same as above +000AE0 11480AE0 00000000 00000000 F3E3C7E3 00000000 06000000 42430260 11480100 000167FC |........3TGT...........-........| +000B00 11480B00 11480C20 00000001 00000174 00000000 00000000 00000000 00000000 00000000 |................................|⋮ File Control Blocks: FCB for file ESDS1DD in program COBDUMP2: 11480C50 +000000 11480C50 C6C3C200 01020000 FFFFFFFF FFFFFFFF FFFFFFFF FFFFFFFF FFFFFFFF FFFFFFFF |FCB.............................| +000020 11480C70 FFFFFFFF 00000000 00000000 00000000 00000000 00000000 00000000 800082C8 |..............................bH| +000040 11480C90 800082C8 800082C8 914754F8 800082C8 800082C8 800082C8 914754F8 00000000 |..bH..bHj..8..bH..bH..bHj..8....| +000060 11480CB0 00000000 00000000 00000000 00000000 00000000 00000000 00000000 00000000 |................................| +000080 11480CD0 00000000 00000000 C3D6C2C4 E4D4D7F2 C5E2C4E2 F1C4C440 00000000 00000000 |........COBDUMP2ESDS1DD ........| +0000A0 11480CF0 00000000 11202A34 00000000 00000000 00000000 00000000 00000000 00000000 |................................| +0000C0 11480D10 00000000 00000000 00008800 00000000 00000000 00000000 00000028 00000000 |..........h.....................| +0000E0 11480D30 00000000 00000000 00000000 00000000 00000000 00000000 00000000 00000000 |................................| +000100 11480D50 - +00011F 11480D6F same as above FIB for file ESDS1DD in program COBDUMP2: 11202A34 +000000 11202A34 C6C9C200 0103C5E2 C4E2F1C4 C4400088 8080A000 00008000 00000000 00000028 |FIB...ESDS1DD .h................| +000020 11202A54 00010000 00000000 00000000 00000000 00000000 00000000 11202A2D 00000000 |................................| +000040 11202A74 00000000 00000000 00000000 00000000 00000000 00000000 00000000 00000000 |................................| +000060 11202A94 - +00007F 11202AB3 same as above +000080 11202AB4 0000C9D6 C6E2E2F1 40404040 40404040 40404040 40404040 40404040 40404040 |..IOFSS1 | GMAREA for file ESDS1DD in program COBDUMP2: 00000000 +000000 00000000 Inaccessible storage.
Figure 91. Enclave-level data for COBOL programs
Process-level dataThe Process Control Block section of the dump, shown in Figure 92 on page 233, displays COBOLprocess-level control blocks THDCOM, COBCOM, COBVEC, and ITBLK. For Enterprise COBOL V5.1 andlater releases, the process-level control blocks are COBPCB (corresponds to THDCOM), COBRCB(corresponds to COBCOM) and LIBVEC (corresponds to COBVEC). The control blocks are dumped for IBMservice personnel use. In a non-CICS environment, the ITBLK control block only appears when a VSCOBOL II program is active. In a CICS environment, the ITBLK control block always appears.
232 z/OS: z/OS Language Environment Debugging Guide
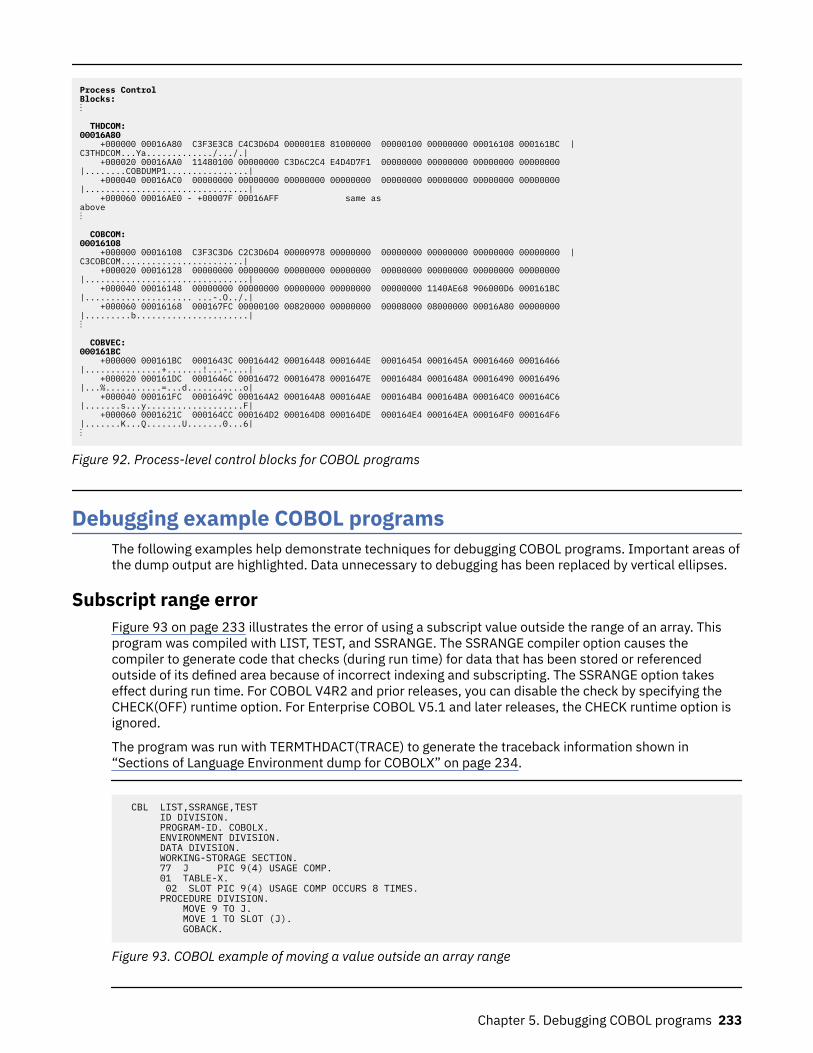
Process Control Blocks: ⋮ THDCOM: 00016A80 +000000 00016A80 C3F3E3C8 C4C3D6D4 000001E8 81000000 00000100 00000000 00016108 000161BC |C3THDCOM...Ya............./.../.| +000020 00016AA0 11480100 00000000 C3D6C2C4 E4D4D7F1 00000000 00000000 00000000 00000000 |........COBDUMP1................| +000040 00016AC0 00000000 00000000 00000000 00000000 00000000 00000000 00000000 00000000 |................................| +000060 00016AE0 - +00007F 00016AFF same as above ⋮ COBCOM: 00016108 +000000 00016108 C3F3C3D6 C2C3D6D4 00000978 00000000 00000000 00000000 00000000 00000000 |C3COBCOM........................| +000020 00016128 00000000 00000000 00000000 00000000 00000000 00000000 00000000 00000000 |................................| +000040 00016148 00000000 00000000 00000000 00000000 00000000 1140AE68 906000D6 000161BC |..................... ...-.O../.| +000060 00016168 000167FC 00000100 00820000 00000000 00008000 08000000 00016A80 00000000 |.........b......................| ⋮ COBVEC: 000161BC +000000 000161BC 0001643C 00016442 00016448 0001644E 00016454 0001645A 00016460 00016466 |...............+.......!...-....| +000020 000161DC 0001646C 00016472 00016478 0001647E 00016484 0001648A 00016490 00016496 |...%...........=...d...........o| +000040 000161FC 0001649C 000164A2 000164A8 000164AE 000164B4 000164BA 000164C0 000164C6 |.......s...y...................F| +000060 0001621C 000164CC 000164D2 000164D8 000164DE 000164E4 000164EA 000164F0 000164F6 |.......K...Q.......U.......0...6| ⋮
Figure 92. Process-level control blocks for COBOL programs
Debugging example COBOL programsThe following examples help demonstrate techniques for debugging COBOL programs. Important areas ofthe dump output are highlighted. Data unnecessary to debugging has been replaced by vertical ellipses.
Subscript range errorFigure 93 on page 233 illustrates the error of using a subscript value outside the range of an array. Thisprogram was compiled with LIST, TEST, and SSRANGE. The SSRANGE compiler option causes thecompiler to generate code that checks (during run time) for data that has been stored or referencedoutside of its defined area because of incorrect indexing and subscripting. The SSRANGE option takeseffect during run time. For COBOL V4R2 and prior releases, you can disable the check by specifying theCHECK(OFF) runtime option. For Enterprise COBOL V5.1 and later releases, the CHECK runtime option isignored.
The program was run with TERMTHDACT(TRACE) to generate the traceback information shown in“Sections of Language Environment dump for COBOLX” on page 234.
CBL LIST,SSRANGE,TEST ID DIVISION. PROGRAM-ID. COBOLX. ENVIRONMENT DIVISION. DATA DIVISION. WORKING-STORAGE SECTION. 77 J PIC 9(4) USAGE COMP. 01 TABLE-X. 02 SLOT PIC 9(4) USAGE COMP OCCURS 8 TIMES. PROCEDURE DIVISION. MOVE 9 TO J. MOVE 1 TO SLOT (J). GOBACK.
Figure 93. COBOL example of moving a value outside an array range
Chapter 5. Debugging COBOL programs 233
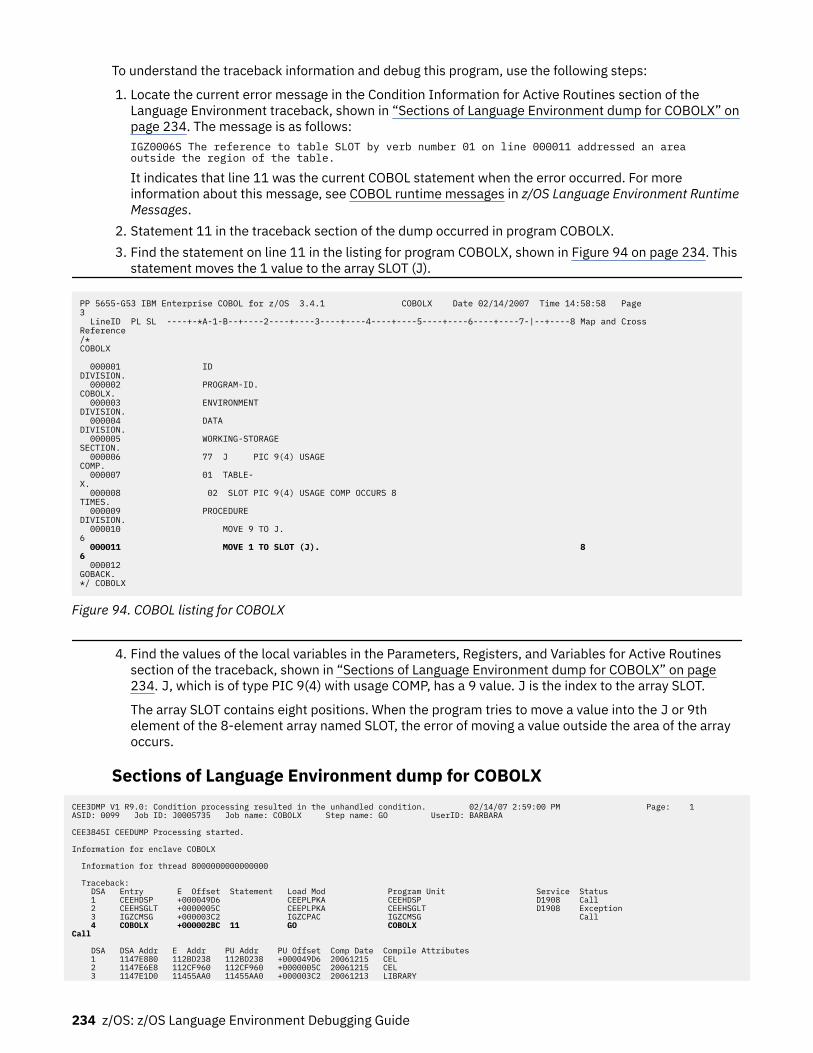
To understand the traceback information and debug this program, use the following steps:
1. Locate the current error message in the Condition Information for Active Routines section of theLanguage Environment traceback, shown in “Sections of Language Environment dump for COBOLX” onpage 234. The message is as follows:IGZ0006S The reference to table SLOT by verb number 01 on line 000011 addressed an area outside the region of the table.
It indicates that line 11 was the current COBOL statement when the error occurred. For moreinformation about this message, see COBOL runtime messages in z/OS Language Environment RuntimeMessages.
2. Statement 11 in the traceback section of the dump occurred in program COBOLX.3. Find the statement on line 11 in the listing for program COBOLX, shown in Figure 94 on page 234. This
statement moves the 1 value to the array SLOT (J).
PP 5655-G53 IBM Enterprise COBOL for z/OS 3.4.1 COBOLX Date 02/14/2007 Time 14:58:58 Page 3 LineID PL SL ----+-*A-1-B--+----2----+----3----+----4----+----5----+----6----+----7-|--+----8 Map and Cross Reference /* COBOLX 000001 ID DIVISION. 000002 PROGRAM-ID. COBOLX. 000003 ENVIRONMENT DIVISION. 000004 DATA DIVISION. 000005 WORKING-STORAGE SECTION. 000006 77 J PIC 9(4) USAGE COMP. 000007 01 TABLE-X. 000008 02 SLOT PIC 9(4) USAGE COMP OCCURS 8 TIMES. 000009 PROCEDURE DIVISION. 000010 MOVE 9 TO J. 6 000011 MOVE 1 TO SLOT (J). 8 6 000012 GOBACK. */ COBOLX
Figure 94. COBOL listing for COBOLX
4. Find the values of the local variables in the Parameters, Registers, and Variables for Active Routinessection of the traceback, shown in “Sections of Language Environment dump for COBOLX” on page234. J, which is of type PIC 9(4) with usage COMP, has a 9 value. J is the index to the array SLOT.
The array SLOT contains eight positions. When the program tries to move a value into the J or 9thelement of the 8-element array named SLOT, the error of moving a value outside the area of the arrayoccurs.
Sections of Language Environment dump for COBOLXCEE3DMP V1 R9.0: Condition processing resulted in the unhandled condition. 02/14/07 2:59:00 PM Page: 1 ASID: 0099 Job ID: J0005735 Job name: COBOLX Step name: GO UserID: BARBARA CEE3845I CEEDUMP Processing started. Information for enclave COBOLX Information for thread 8000000000000000 Traceback: DSA Entry E Offset Statement Load Mod Program Unit Service Status 1 CEEHDSP +000049D6 CEEPLPKA CEEHDSP D1908 Call 2 CEEHSGLT +0000005C CEEPLPKA CEEHSGLT D1908 Exception 3 IGZCMSG +000003C2 IGZCPAC IGZCMSG Call 4 COBOLX +000002BC 11 GO COBOLX Call DSA DSA Addr E Addr PU Addr PU Offset Comp Date Compile Attributes 1 1147E880 112BD238 112BD238 +000049D6 20061215 CEL 2 1147E6E8 112CF960 112CF960 +0000005C 20061215 CEL 3 1147E1D0 11455AA0 11455AA0 +000003C2 20061213 LIBRARY
234 z/OS: z/OS Language Environment Debugging Guide
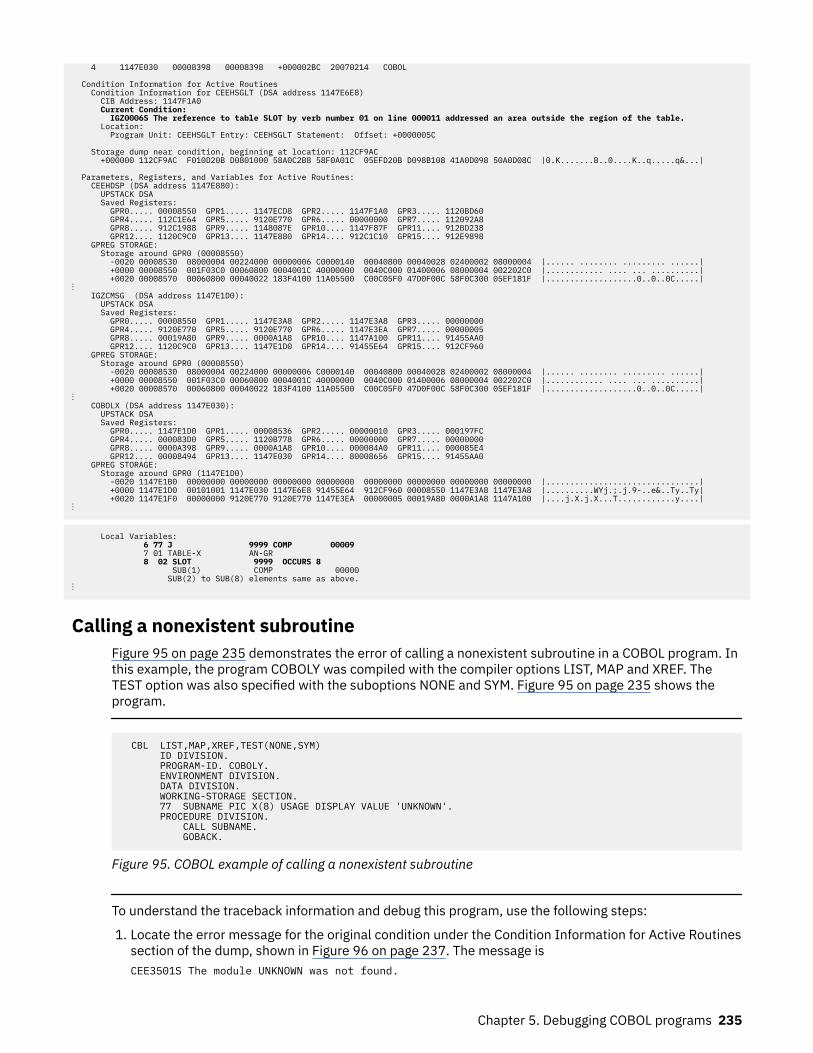
4 1147E030 00008398 00008398 +000002BC 20070214 COBOL Condition Information for Active Routines Condition Information for CEEHSGLT (DSA address 1147E6E8) CIB Address: 1147F1A0 Current Condition: IGZ0006S The reference to table SLOT by verb number 01 on line 000011 addressed an area outside the region of the table. Location: Program Unit: CEEHSGLT Entry: CEEHSGLT Statement: Offset: +0000005C Storage dump near condition, beginning at location: 112CF9AC +000000 112CF9AC F010D20B D0801000 58A0C2B8 58F0A01C 05EFD20B D098B108 41A0D098 50A0D08C |0.K.......B..0....K..q.....q&...| Parameters, Registers, and Variables for Active Routines: CEEHDSP (DSA address 1147E880): UPSTACK DSA Saved Registers: GPR0..... 00008550 GPR1..... 1147ECD8 GPR2..... 1147F1A0 GPR3..... 1120BD60 GPR4..... 112C1E64 GPR5..... 9120E770 GPR6..... 00000000 GPR7..... 112092A8 GPR8..... 912C1988 GPR9..... 1148087E GPR10.... 1147F87F GPR11.... 912BD238 GPR12.... 1120C9C0 GPR13.... 1147E880 GPR14.... 912C1C10 GPR15.... 912E9898 GPREG STORAGE: Storage around GPR0 (00008550) -0020 00008530 08000004 00224000 00000006 C0000140 00040800 00040028 02400002 08000004 |...... ........ ......... ......| +0000 00008550 001F03C0 00060800 0004001C 40000000 0040C000 01400006 08000004 002202C0 |............ .... ... ..........| +0020 00008570 00060800 00040022 183F4100 11A05500 C00C05F0 47D0F00C 58F0C300 05EF181F |...................0..0..0C.....|⋮ IGZCMSG (DSA address 1147E1D0): UPSTACK DSA Saved Registers: GPR0..... 00008550 GPR1..... 1147E3A8 GPR2..... 1147E3A8 GPR3..... 00000000 GPR4..... 9120E770 GPR5..... 9120E770 GPR6..... 1147E3EA GPR7..... 00000005 GPR8..... 00019A80 GPR9..... 0000A1A8 GPR10.... 1147A100 GPR11.... 91455AA0 GPR12.... 1120C9C0 GPR13.... 1147E1D0 GPR14.... 91455E64 GPR15.... 912CF960 GPREG STORAGE: Storage around GPR0 (00008550) -0020 00008530 08000004 00224000 00000006 C0000140 00040800 00040028 02400002 08000004 |...... ........ ......... ......| +0000 00008550 001F03C0 00060800 0004001C 40000000 0040C000 01400006 08000004 002202C0 |............ .... ... ..........| +0020 00008570 00060800 00040022 183F4100 11A05500 C00C05F0 47D0F00C 58F0C300 05EF181F |...................0..0..0C.....|⋮ COBOLX (DSA address 1147E030): UPSTACK DSA Saved Registers: GPR0..... 1147E1D0 GPR1..... 00008536 GPR2..... 00000010 GPR3..... 000197FC GPR4..... 000083D0 GPR5..... 1120B778 GPR6..... 00000000 GPR7..... 00000000 GPR8..... 0000A398 GPR9..... 0000A1A8 GPR10.... 000084A0 GPR11.... 000085E4 GPR12.... 00008494 GPR13.... 1147E030 GPR14.... 80008656 GPR15.... 91455AA0 GPREG STORAGE: Storage around GPR0 (1147E1D0) -0020 1147E1B0 00000000 00000000 00000000 00000000 00000000 00000000 00000000 00000000 |................................| +0000 1147E1D0 00101001 1147E030 1147E6E8 91455E64 912CF960 00008550 1147E3A8 1147E3A8 |..........WYj.;.j.9-..e&..Ty..Ty| +0020 1147E1F0 00000000 9120E770 9120E770 1147E3EA 00000005 00019A80 0000A1A8 1147A100 |....j.X.j.X...T............y....|⋮
Local Variables: 6 77 J 9999 COMP 00009 7 01 TABLE-X AN-GR 8 02 SLOT 9999 OCCURS 8 SUB(1) COMP 00000 SUB(2) to SUB(8) elements same as above. ⋮
Calling a nonexistent subroutineFigure 95 on page 235 demonstrates the error of calling a nonexistent subroutine in a COBOL program. Inthis example, the program COBOLY was compiled with the compiler options LIST, MAP and XREF. TheTEST option was also specified with the suboptions NONE and SYM. Figure 95 on page 235 shows theprogram.
CBL LIST,MAP,XREF,TEST(NONE,SYM) ID DIVISION. PROGRAM-ID. COBOLY. ENVIRONMENT DIVISION. DATA DIVISION. WORKING-STORAGE SECTION. 77 SUBNAME PIC X(8) USAGE DISPLAY VALUE 'UNKNOWN'. PROCEDURE DIVISION. CALL SUBNAME. GOBACK.
Figure 95. COBOL example of calling a nonexistent subroutine
To understand the traceback information and debug this program, use the following steps:
1. Locate the error message for the original condition under the Condition Information for Active Routinessection of the dump, shown in Figure 96 on page 237. The message isCEE3501S The module UNKNOWN was not found.
Chapter 5. Debugging COBOL programs 235
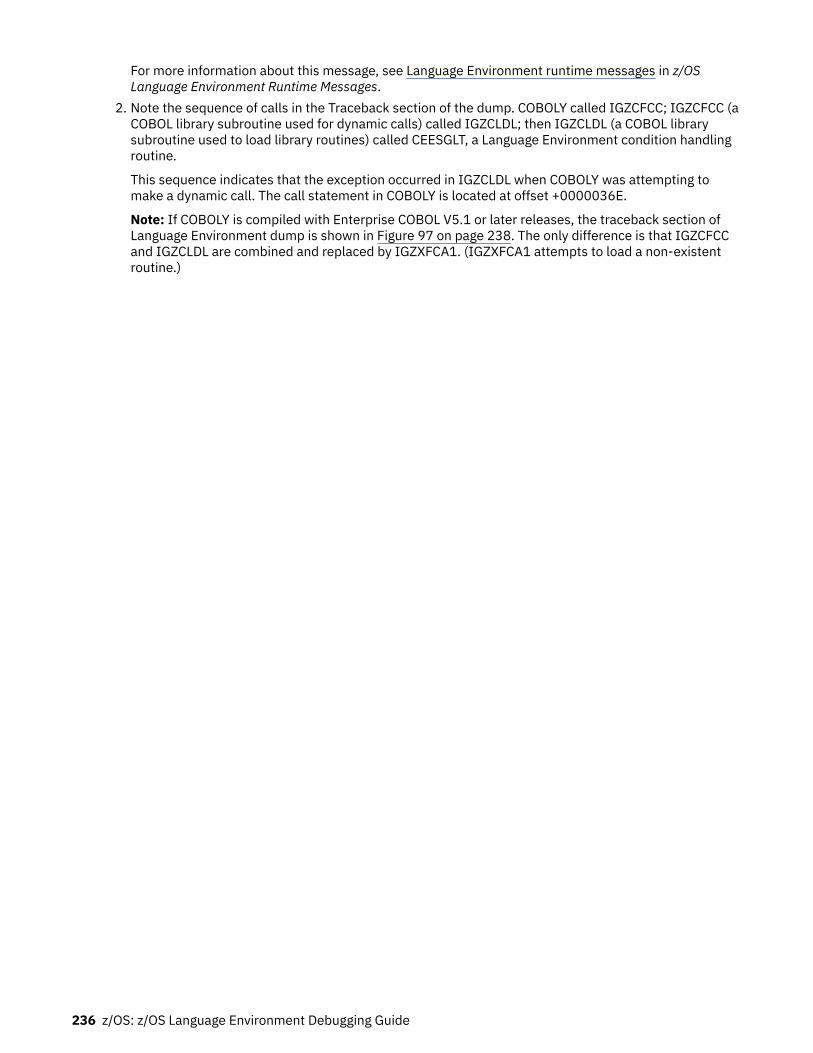
For more information about this message, see Language Environment runtime messages in z/OSLanguage Environment Runtime Messages.
2. Note the sequence of calls in the Traceback section of the dump. COBOLY called IGZCFCC; IGZCFCC (aCOBOL library subroutine used for dynamic calls) called IGZCLDL; then IGZCLDL (a COBOL librarysubroutine used to load library routines) called CEESGLT, a Language Environment condition handlingroutine.
This sequence indicates that the exception occurred in IGZCLDL when COBOLY was attempting tomake a dynamic call. The call statement in COBOLY is located at offset +0000036E.
Note: If COBOLY is compiled with Enterprise COBOL V5.1 or later releases, the traceback section ofLanguage Environment dump is shown in Figure 97 on page 238. The only difference is that IGZCFCCand IGZCLDL are combined and replaced by IGZXFCA1. (IGZXFCA1 attempts to load a non-existentroutine.)
236 z/OS: z/OS Language Environment Debugging Guide
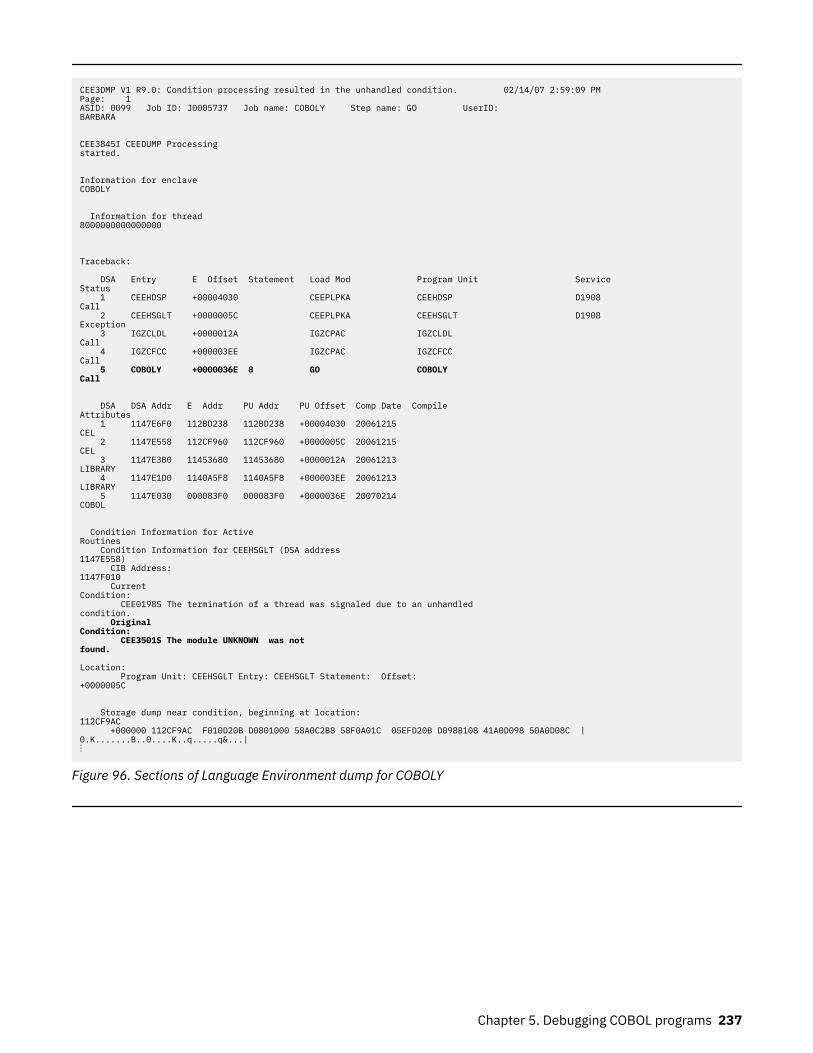
CEE3DMP V1 R9.0: Condition processing resulted in the unhandled condition. 02/14/07 2:59:09 PM Page: 1 ASID: 0099 Job ID: J0005737 Job name: COBOLY Step name: GO UserID: BARBARA CEE3845I CEEDUMP Processing started. Information for enclave COBOLY Information for thread 8000000000000000 Traceback: DSA Entry E Offset Statement Load Mod Program Unit Service Status 1 CEEHDSP +00004030 CEEPLPKA CEEHDSP D1908 Call 2 CEEHSGLT +0000005C CEEPLPKA CEEHSGLT D1908 Exception 3 IGZCLDL +0000012A IGZCPAC IGZCLDL Call 4 IGZCFCC +000003EE IGZCPAC IGZCFCC Call 5 COBOLY +0000036E 8 GO COBOLY Call DSA DSA Addr E Addr PU Addr PU Offset Comp Date Compile Attributes 1 1147E6F0 112BD238 112BD238 +00004030 20061215 CEL 2 1147E558 112CF960 112CF960 +0000005C 20061215 CEL 3 1147E3B0 11453680 11453680 +0000012A 20061213 LIBRARY 4 1147E1D0 1140A5F8 1140A5F8 +000003EE 20061213 LIBRARY 5 1147E030 000083F0 000083F0 +0000036E 20070214 COBOL Condition Information for Active Routines Condition Information for CEEHSGLT (DSA address 1147E558) CIB Address: 1147F010 Current Condition: CEE0198S The termination of a thread was signaled due to an unhandled condition. Original Condition: CEE3501S The module UNKNOWN was not found. Location: Program Unit: CEEHSGLT Entry: CEEHSGLT Statement: Offset: +0000005C Storage dump near condition, beginning at location: 112CF9AC +000000 112CF9AC F010D20B D0801000 58A0C2B8 58F0A01C 05EFD20B D098B108 41A0D098 50A0D08C |0.K.......B..0....K..q.....q&...|⋮
Figure 96. Sections of Language Environment dump for COBOLY
Chapter 5. Debugging COBOL programs 237
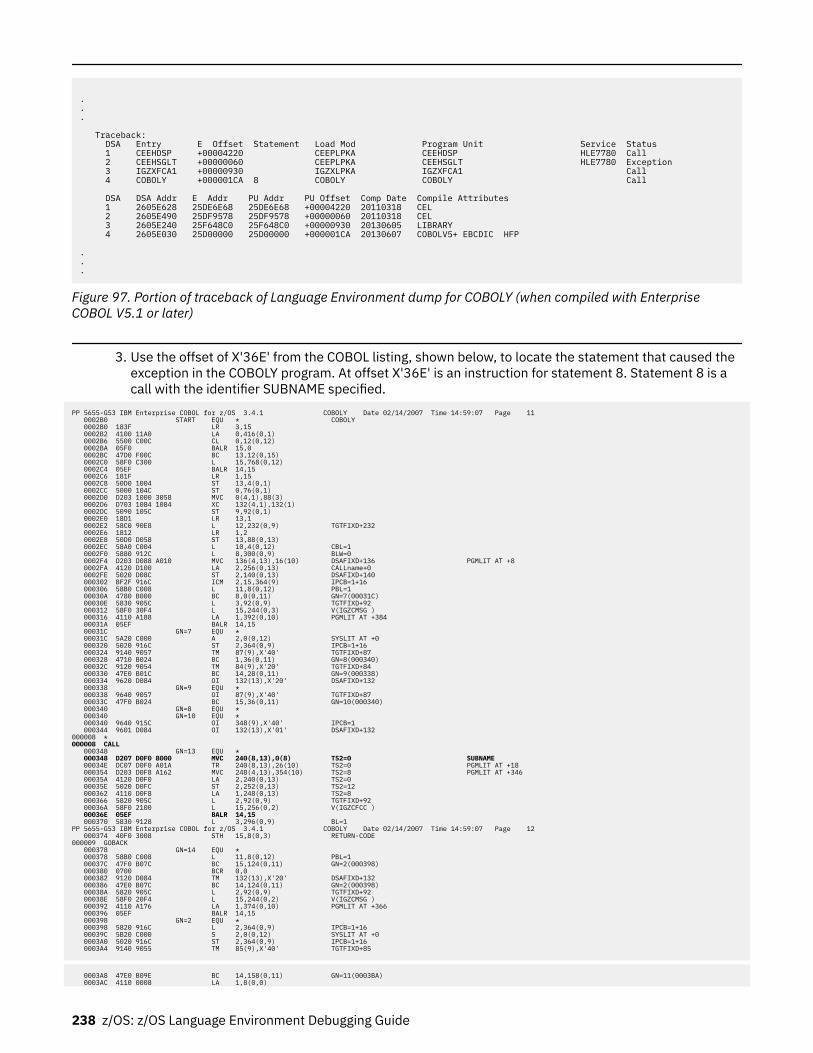
.
.
.
Traceback: DSA Entry E Offset Statement Load Mod Program Unit Service Status 1 CEEHDSP +00004220 CEEPLPKA CEEHDSP HLE7780 Call 2 CEEHSGLT +00000060 CEEPLPKA CEEHSGLT HLE7780 Exception 3 IGZXFCA1 +00000930 IGZXLPKA IGZXFCA1 Call 4 COBOLY +000001CA 8 COBOLY COBOLY Call
DSA DSA Addr E Addr PU Addr PU Offset Comp Date Compile Attributes 1 2605E628 25DE6E68 25DE6E68 +00004220 20110318 CEL 2 2605E490 25DF9578 25DF9578 +00000060 20110318 CEL 3 2605E240 25F648C0 25F648C0 +00000930 20130605 LIBRARY 4 2605E030 25D00000 25D00000 +000001CA 20130607 COBOLV5+ EBCDIC HFP
.
.
.
Figure 97. Portion of traceback of Language Environment dump for COBOLY (when compiled with EnterpriseCOBOL V5.1 or later)
3. Use the offset of X'36E' from the COBOL listing, shown below, to locate the statement that caused theexception in the COBOLY program. At offset X'36E' is an instruction for statement 8. Statement 8 is acall with the identifier SUBNAME specified.
PP 5655-G53 IBM Enterprise COBOL for z/OS 3.4.1 COBOLY Date 02/14/2007 Time 14:59:07 Page 11 0002B0 START EQU * COBOLY 0002B0 183F LR 3,15 0002B2 4100 11A0 LA 0,416(0,1) 0002B6 5500 C00C CL 0,12(0,12) 0002BA 05F0 BALR 15,0 0002BC 47D0 F00C BC 13,12(0,15) 0002C0 58F0 C300 L 15,768(0,12) 0002C4 05EF BALR 14,15 0002C6 181F LR 1,15 0002C8 50D0 1004 ST 13,4(0,1) 0002CC 5000 104C ST 0,76(0,1) 0002D0 D203 1000 3058 MVC 0(4,1),88(3) 0002D6 D703 1084 1084 XC 132(4,1),132(1) 0002DC 5090 105C ST 9,92(0,1) 0002E0 18D1 LR 13,1 0002E2 58C0 90E8 L 12,232(0,9) TGTFIXD+232 0002E6 1812 LR 1,2 0002E8 50D0 D058 ST 13,88(0,13) 0002EC 58A0 C004 L 10,4(0,12) CBL=1 0002F0 5880 912C L 8,300(0,9) BLW=0 0002F4 D203 D088 A010 MVC 136(4,13),16(10) DSAFIXD+136 PGMLIT AT +8 0002FA 4120 D100 LA 2,256(0,13) CALLname+0 0002FE 5020 D08C ST 2,140(0,13) DSAFIXD+140 000302 BF2F 916C ICM 2,15,364(9) IPCB=1+16 000306 58B0 C008 L 11,8(0,12) PBL=1 00030A 4780 B000 BC 8,0(0,11) GN=7(00031C) 00030E 5830 905C L 3,92(0,9) TGTFIXD+92 000312 58F0 30F4 L 15,244(0,3) V(IGZCMSG ) 000316 4110 A188 LA 1,392(0,10) PGMLIT AT +384 00031A 05EF BALR 14,15 00031C GN=7 EQU * 00031C 5A20 C000 A 2,0(0,12) SYSLIT AT +0 000320 5020 916C ST 2,364(0,9) IPCB=1+16 000324 9140 9057 TM 87(9),X'40' TGTFIXD+87 000328 4710 B024 BC 1,36(0,11) GN=8(000340) 00032C 9120 9054 TM 84(9),X'20' TGTFIXD+84 000330 47E0 B01C BC 14,28(0,11) GN=9(000338) 000334 9620 D084 OI 132(13),X'20' DSAFIXD+132 000338 GN=9 EQU * 000338 9640 9057 OI 87(9),X'40' TGTFIXD+87 00033C 47F0 B024 BC 15,36(0,11) GN=10(000340) 000340 GN=8 EQU * 000340 GN=10 EQU * 000340 9640 915C OI 348(9),X'40' IPCB=1 000344 9601 D084 OI 132(13),X'01' DSAFIXD+132 000008 * 000008 CALL 000348 GN=13 EQU * 000348 D207 D0F0 8000 MVC 240(8,13),0(8) TS2=0 SUBNAME 00034E DC07 D0F0 A01A TR 240(8,13),26(10) TS2=0 PGMLIT AT +18 000354 D203 D0F8 A162 MVC 248(4,13),354(10) TS2=8 PGMLIT AT +346 00035A 4120 D0F0 LA 2,240(0,13) TS2=0 00035E 5020 D0FC ST 2,252(0,13) TS2=12 000362 4110 D0F8 LA 1,248(0,13) TS2=8 000366 5820 905C L 2,92(0,9) TGTFIXD+92 00036A 58F0 2100 L 15,256(0,2) V(IGZCFCC ) 00036E 05EF BALR 14,15 000370 5830 9128 L 3,296(0,9) BL=1 PP 5655-G53 IBM Enterprise COBOL for z/OS 3.4.1 COBOLY Date 02/14/2007 Time 14:59:07 Page 12 000374 40F0 3008 STH 15,8(0,3) RETURN-CODE 000009 GOBACK 000378 GN=14 EQU * 000378 58B0 C008 L 11,8(0,12) PBL=1 00037C 47F0 B07C BC 15,124(0,11) GN=2(000398) 000380 0700 BCR 0,0 000382 9120 D084 TM 132(13),X'20' DSAFIXD+132 000386 47E0 B07C BC 14,124(0,11) GN=2(000398) 00038A 5820 905C L 2,92(0,9) TGTFIXD+92 00038E 58F0 20F4 L 15,244(0,2) V(IGZCMSG ) 000392 4110 A176 LA 1,374(0,10) PGMLIT AT +366 000396 05EF BALR 14,15 000398 GN=2 EQU * 000398 5820 916C L 2,364(0,9) IPCB=1+16 00039C 5B20 C000 S 2,0(0,12) SYSLIT AT +0 0003A0 5020 916C ST 2,364(0,9) IPCB=1+16 0003A4 9140 9055 TM 85(9),X'40' TGTFIXD+85
0003A8 47E0 B09E BC 14,158(0,11) GN=11(0003BA) 0003AC 4110 0008 LA 1,8(0,0)
238 z/OS: z/OS Language Environment Debugging Guide
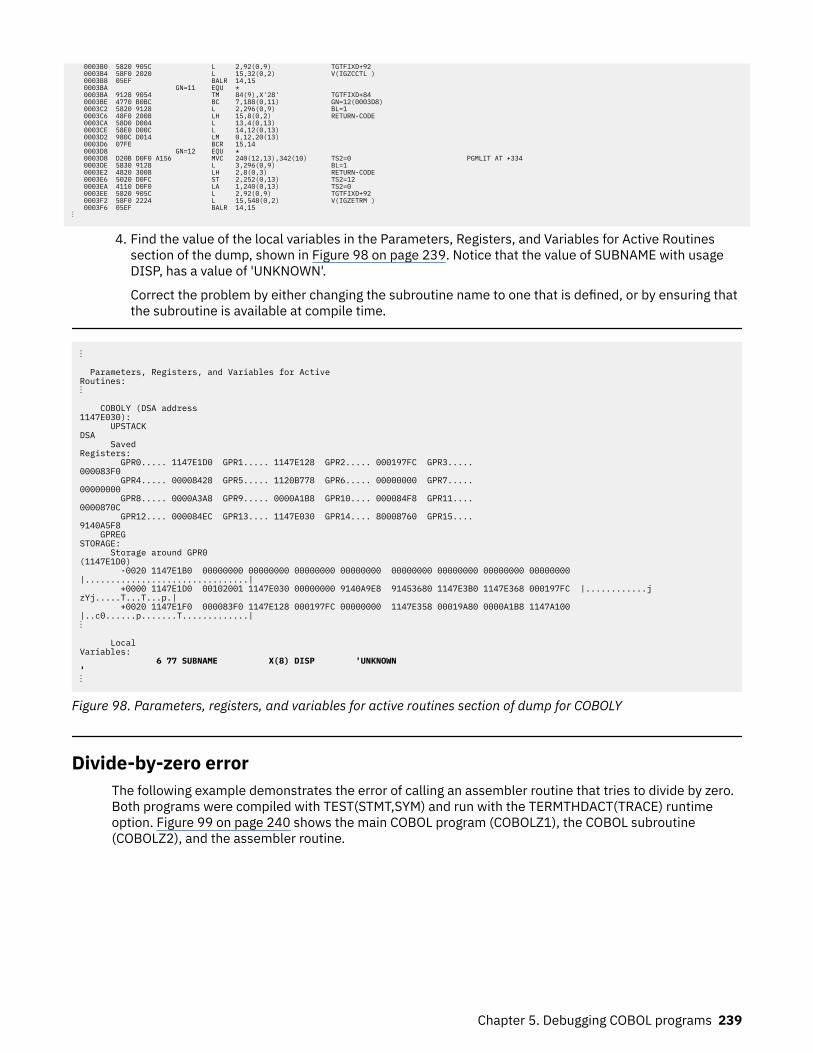
0003B0 5820 905C L 2,92(0,9) TGTFIXD+92 0003B4 58F0 2020 L 15,32(0,2) V(IGZCCTL ) 0003B8 05EF BALR 14,15 0003BA GN=11 EQU * 0003BA 9128 9054 TM 84(9),X'28' TGTFIXD+84 0003BE 4770 B0BC BC 7,188(0,11) GN=12(0003D8) 0003C2 5820 9128 L 2,296(0,9) BL=1 0003C6 48F0 2008 LH 15,8(0,2) RETURN-CODE 0003CA 58D0 D004 L 13,4(0,13) 0003CE 58E0 D00C L 14,12(0,13) 0003D2 980C D014 LM 0,12,20(13) 0003D6 07FE BCR 15,14 0003D8 GN=12 EQU * 0003D8 D20B D0F0 A156 MVC 240(12,13),342(10) TS2=0 PGMLIT AT +334 0003DE 5830 9128 L 3,296(0,9) BL=1 0003E2 4820 3008 LH 2,8(0,3) RETURN-CODE 0003E6 5020 D0FC ST 2,252(0,13) TS2=12 0003EA 4110 D0F0 LA 1,240(0,13) TS2=0 0003EE 5820 905C L 2,92(0,9) TGTFIXD+92 0003F2 58F0 2224 L 15,548(0,2) V(IGZETRM ) 0003F6 05EF BALR 14,15⋮
4. Find the value of the local variables in the Parameters, Registers, and Variables for Active Routinessection of the dump, shown in Figure 98 on page 239. Notice that the value of SUBNAME with usageDISP, has a value of 'UNKNOWN'.
Correct the problem by either changing the subroutine name to one that is defined, or by ensuring thatthe subroutine is available at compile time.
⋮ Parameters, Registers, and Variables for Active Routines: ⋮ COBOLY (DSA address 1147E030): UPSTACK DSA Saved Registers: GPR0..... 1147E1D0 GPR1..... 1147E128 GPR2..... 000197FC GPR3..... 000083F0 GPR4..... 00008428 GPR5..... 1120B778 GPR6..... 00000000 GPR7..... 00000000 GPR8..... 0000A3A8 GPR9..... 0000A1B8 GPR10.... 000084F8 GPR11.... 0000870C GPR12.... 000084EC GPR13.... 1147E030 GPR14.... 80008760 GPR15.... 9140A5F8 GPREG STORAGE: Storage around GPR0 (1147E1D0) -0020 1147E1B0 00000000 00000000 00000000 00000000 00000000 00000000 00000000 00000000 |................................| +0000 1147E1D0 00102001 1147E030 00000000 9140A9E8 91453680 1147E3B0 1147E368 000197FC |............j zYj.....T...T...p.| +0020 1147E1F0 000083F0 1147E128 000197FC 00000000 1147E358 00019A80 0000A1B8 1147A100 |..c0......p.......T.............|⋮ Local Variables: 6 77 SUBNAME X(8) DISP 'UNKNOWN ' ⋮
Figure 98. Parameters, registers, and variables for active routines section of dump for COBOLY
Divide-by-zero errorThe following example demonstrates the error of calling an assembler routine that tries to divide by zero. Both programs were compiled with TEST(STMT,SYM) and run with the TERMTHDACT(TRACE) runtimeoption. Figure 99 on page 240 shows the main COBOL program (COBOLZ1), the COBOL subroutine(COBOLZ2), and the assembler routine.
Chapter 5. Debugging COBOL programs 239
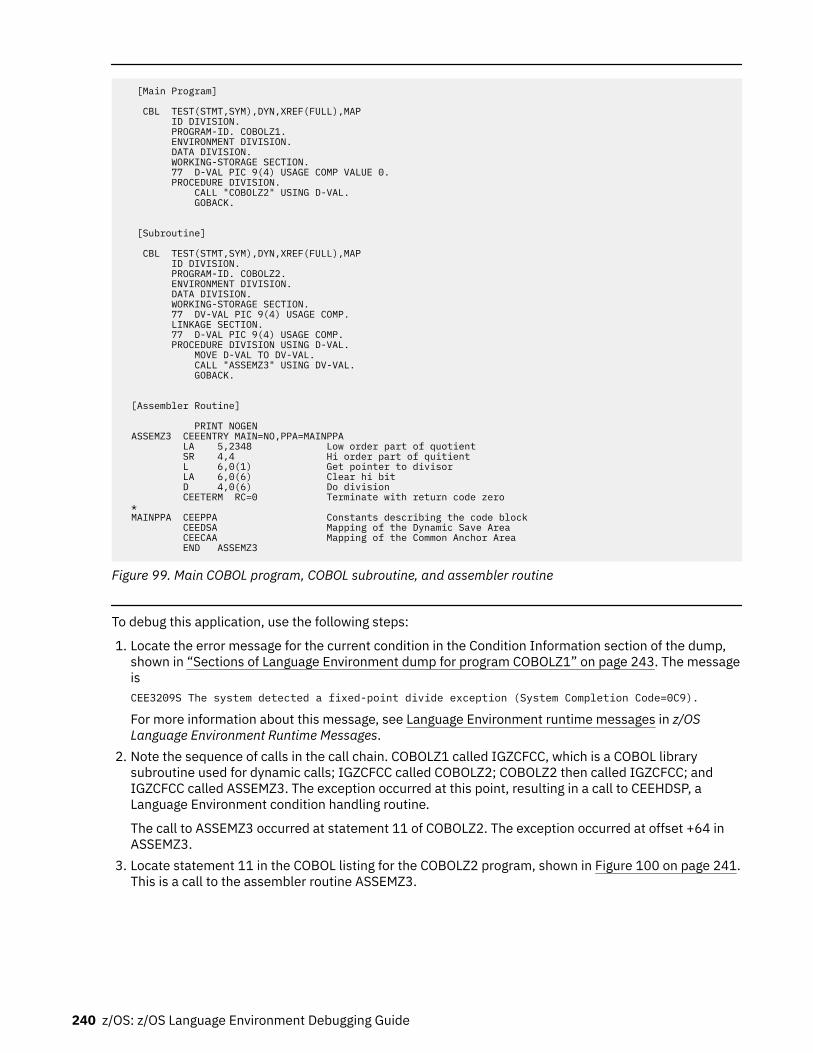
[Main Program]
CBL TEST(STMT,SYM),DYN,XREF(FULL),MAP ID DIVISION. PROGRAM-ID. COBOLZ1. ENVIRONMENT DIVISION. DATA DIVISION. WORKING-STORAGE SECTION. 77 D-VAL PIC 9(4) USAGE COMP VALUE 0. PROCEDURE DIVISION. CALL "COBOLZ2" USING D-VAL. GOBACK.
[Subroutine]
CBL TEST(STMT,SYM),DYN,XREF(FULL),MAP ID DIVISION. PROGRAM-ID. COBOLZ2. ENVIRONMENT DIVISION. DATA DIVISION. WORKING-STORAGE SECTION. 77 DV-VAL PIC 9(4) USAGE COMP. LINKAGE SECTION. 77 D-VAL PIC 9(4) USAGE COMP. PROCEDURE DIVISION USING D-VAL. MOVE D-VAL TO DV-VAL. CALL "ASSEMZ3" USING DV-VAL. GOBACK.
[Assembler Routine]
PRINT NOGEN ASSEMZ3 CEEENTRY MAIN=NO,PPA=MAINPPA LA 5,2348 Low order part of quotient SR 4,4 Hi order part of quitient L 6,0(1) Get pointer to divisor LA 6,0(6) Clear hi bit D 4,0(6) Do division CEETERM RC=0 Terminate with return code zero * MAINPPA CEEPPA Constants describing the code block CEEDSA Mapping of the Dynamic Save Area CEECAA Mapping of the Common Anchor Area END ASSEMZ3
Figure 99. Main COBOL program, COBOL subroutine, and assembler routine
To debug this application, use the following steps:
1. Locate the error message for the current condition in the Condition Information section of the dump,shown in “Sections of Language Environment dump for program COBOLZ1” on page 243. The messageisCEE3209S The system detected a fixed-point divide exception (System Completion Code=0C9).
For more information about this message, see Language Environment runtime messages in z/OSLanguage Environment Runtime Messages.
2. Note the sequence of calls in the call chain. COBOLZ1 called IGZCFCC, which is a COBOL librarysubroutine used for dynamic calls; IGZCFCC called COBOLZ2; COBOLZ2 then called IGZCFCC; andIGZCFCC called ASSEMZ3. The exception occurred at this point, resulting in a call to CEEHDSP, aLanguage Environment condition handling routine.
The call to ASSEMZ3 occurred at statement 11 of COBOLZ2. The exception occurred at offset +64 inASSEMZ3.
3. Locate statement 11 in the COBOL listing for the COBOLZ2 program, shown in Figure 100 on page 241.This is a call to the assembler routine ASSEMZ3.
240 z/OS: z/OS Language Environment Debugging Guide
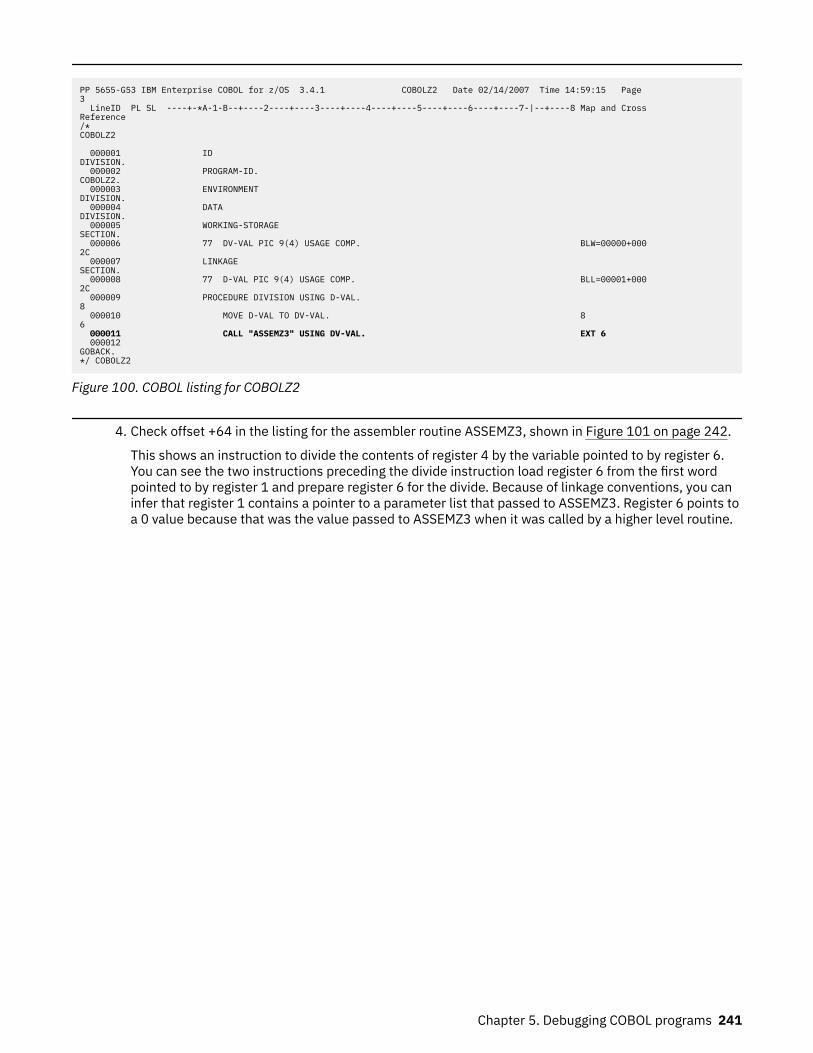
PP 5655-G53 IBM Enterprise COBOL for z/OS 3.4.1 COBOLZ2 Date 02/14/2007 Time 14:59:15 Page 3 LineID PL SL ----+-*A-1-B--+----2----+----3----+----4----+----5----+----6----+----7-|--+----8 Map and Cross Reference /* COBOLZ2 000001 ID DIVISION. 000002 PROGRAM-ID. COBOLZ2. 000003 ENVIRONMENT DIVISION. 000004 DATA DIVISION. 000005 WORKING-STORAGE SECTION. 000006 77 DV-VAL PIC 9(4) USAGE COMP. BLW=00000+000 2C 000007 LINKAGE SECTION. 000008 77 D-VAL PIC 9(4) USAGE COMP. BLL=00001+000 2C 000009 PROCEDURE DIVISION USING D-VAL. 8 000010 MOVE D-VAL TO DV-VAL. 8 6 000011 CALL "ASSEMZ3" USING DV-VAL. EXT 6 000012 GOBACK. */ COBOLZ2
Figure 100. COBOL listing for COBOLZ2
4. Check offset +64 in the listing for the assembler routine ASSEMZ3, shown in Figure 101 on page 242.
This shows an instruction to divide the contents of register 4 by the variable pointed to by register 6.You can see the two instructions preceding the divide instruction load register 6 from the first wordpointed to by register 1 and prepare register 6 for the divide. Because of linkage conventions, you caninfer that register 1 contains a pointer to a parameter list that passed to ASSEMZ3. Register 6 points toa 0 value because that was the value passed to ASSEMZ3 when it was called by a higher level routine.
Chapter 5. Debugging COBOL programs 241
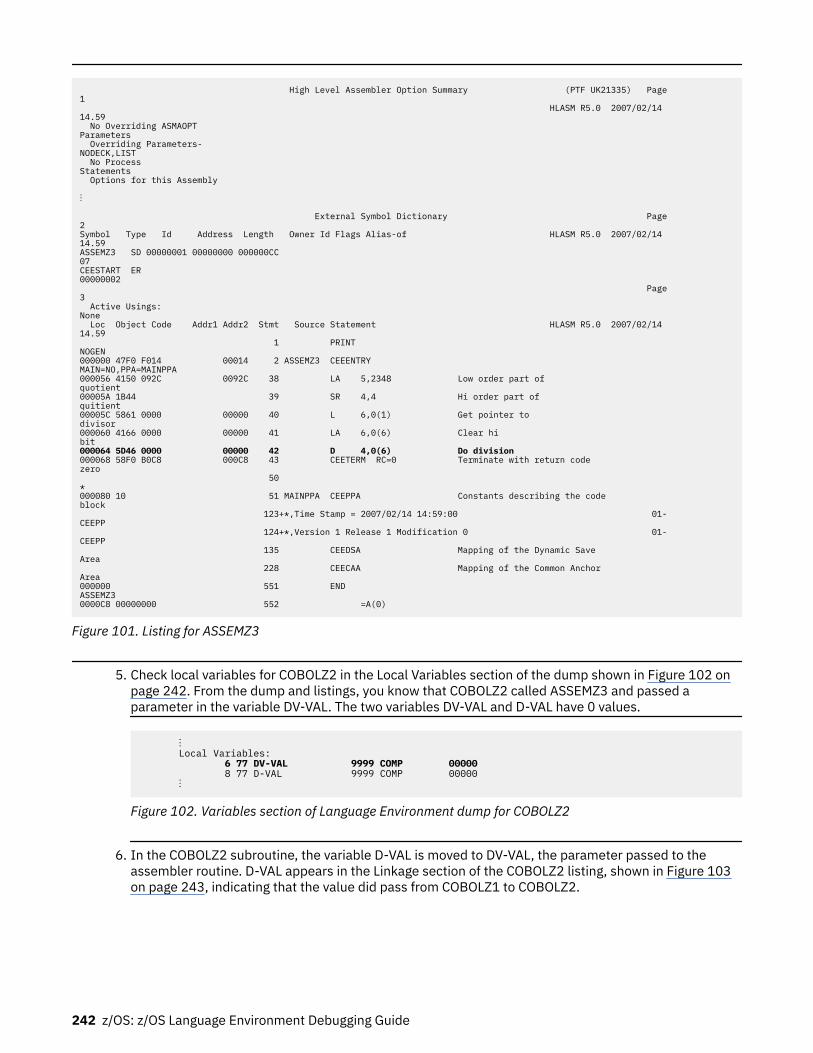
High Level Assembler Option Summary (PTF UK21335) Page 1 HLASM R5.0 2007/02/14 14.59 No Overriding ASMAOPT Parameters Overriding Parameters- NODECK,LIST No Process Statements Options for this Assembly
⋮ External Symbol Dictionary Page 2 Symbol Type Id Address Length Owner Id Flags Alias-of HLASM R5.0 2007/02/14 14.59 ASSEMZ3 SD 00000001 00000000 000000CC 07 CEESTART ER 00000002 Page 3 Active Usings: None Loc Object Code Addr1 Addr2 Stmt Source Statement HLASM R5.0 2007/02/14 14.59 1 PRINT NOGEN 000000 47F0 F014 00014 2 ASSEMZ3 CEEENTRY MAIN=NO,PPA=MAINPPA 000056 4150 092C 0092C 38 LA 5,2348 Low order part of quotient 00005A 1B44 39 SR 4,4 Hi order part of quitient 00005C 5861 0000 00000 40 L 6,0(1) Get pointer to divisor 000060 4166 0000 00000 41 LA 6,0(6) Clear hi bit 000064 5D46 0000 00000 42 D 4,0(6) Do division 000068 58F0 B0C8 000C8 43 CEETERM RC=0 Terminate with return code zero 50 * 000080 10 51 MAINPPA CEEPPA Constants describing the code block 123+*,Time Stamp = 2007/02/14 14:59:00 01-CEEPP 124+*,Version 1 Release 1 Modification 0 01-CEEPP 135 CEEDSA Mapping of the Dynamic Save Area 228 CEECAA Mapping of the Common Anchor Area 000000 551 END ASSEMZ3 0000C8 00000000 552 =A(0)
Figure 101. Listing for ASSEMZ3
5. Check local variables for COBOLZ2 in the Local Variables section of the dump shown in Figure 102 onpage 242. From the dump and listings, you know that COBOLZ2 called ASSEMZ3 and passed aparameter in the variable DV-VAL. The two variables DV-VAL and D-VAL have 0 values.
⋮ Local Variables: 6 77 DV-VAL 9999 COMP 00000 8 77 D-VAL 9999 COMP 00000 ⋮
Figure 102. Variables section of Language Environment dump for COBOLZ2
6. In the COBOLZ2 subroutine, the variable D-VAL is moved to DV-VAL, the parameter passed to theassembler routine. D-VAL appears in the Linkage section of the COBOLZ2 listing, shown in Figure 103on page 243, indicating that the value did pass from COBOLZ1 to COBOLZ2.
242 z/OS: z/OS Language Environment Debugging Guide
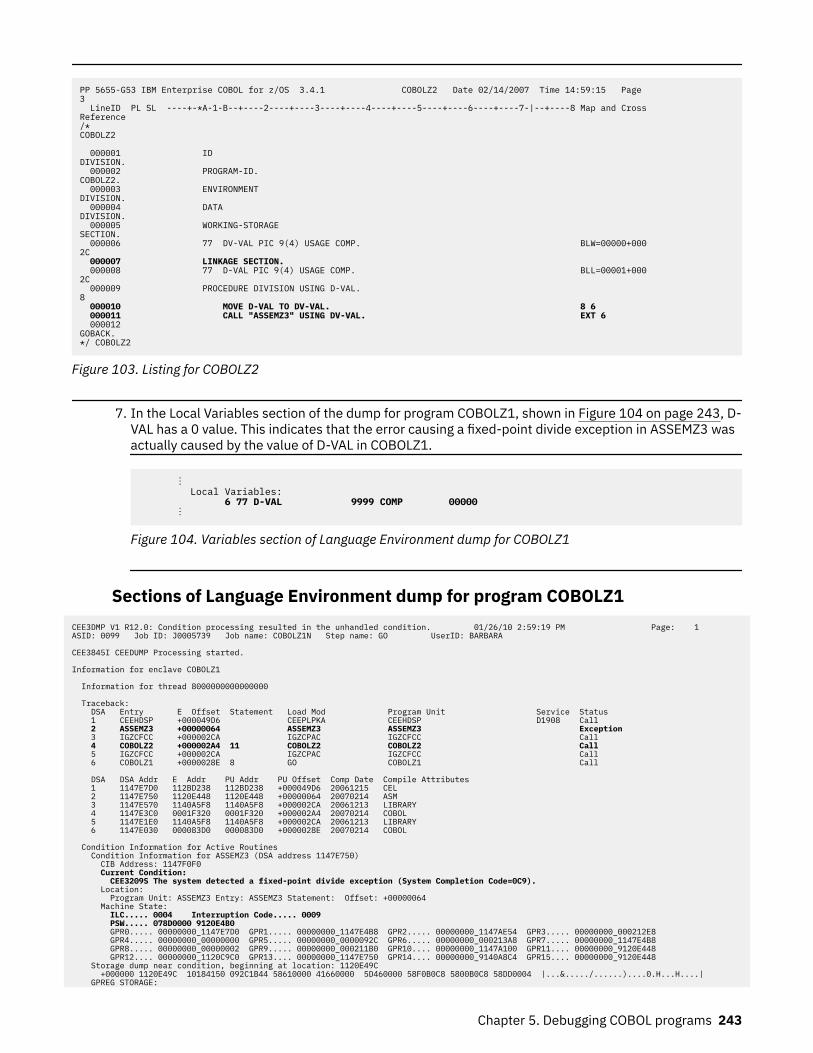
PP 5655-G53 IBM Enterprise COBOL for z/OS 3.4.1 COBOLZ2 Date 02/14/2007 Time 14:59:15 Page 3 LineID PL SL ----+-*A-1-B--+----2----+----3----+----4----+----5----+----6----+----7-|--+----8 Map and Cross Reference /* COBOLZ2 000001 ID DIVISION. 000002 PROGRAM-ID. COBOLZ2. 000003 ENVIRONMENT DIVISION. 000004 DATA DIVISION. 000005 WORKING-STORAGE SECTION. 000006 77 DV-VAL PIC 9(4) USAGE COMP. BLW=00000+000 2C 000007 LINKAGE SECTION. 000008 77 D-VAL PIC 9(4) USAGE COMP. BLL=00001+000 2C 000009 PROCEDURE DIVISION USING D-VAL. 8 000010 MOVE D-VAL TO DV-VAL. 8 6 000011 CALL "ASSEMZ3" USING DV-VAL. EXT 6 000012 GOBACK. */ COBOLZ2
Figure 103. Listing for COBOLZ2
7. In the Local Variables section of the dump for program COBOLZ1, shown in Figure 104 on page 243, D-VAL has a 0 value. This indicates that the error causing a fixed-point divide exception in ASSEMZ3 wasactually caused by the value of D-VAL in COBOLZ1.
⋮ Local Variables: 6 77 D-VAL 9999 COMP 00000 ⋮
Figure 104. Variables section of Language Environment dump for COBOLZ1
Sections of Language Environment dump for program COBOLZ1CEE3DMP V1 R12.0: Condition processing resulted in the unhandled condition. 01/26/10 2:59:19 PM Page: 1 ASID: 0099 Job ID: J0005739 Job name: COBOLZ1N Step name: GO UserID: BARBARA CEE3845I CEEDUMP Processing started. Information for enclave COBOLZ1 Information for thread 8000000000000000 Traceback: DSA Entry E Offset Statement Load Mod Program Unit Service Status 1 CEEHDSP +000049D6 CEEPLPKA CEEHDSP D1908 Call 2 ASSEMZ3 +00000064 ASSEMZ3 ASSEMZ3 Exception 3 IGZCFCC +000002CA IGZCPAC IGZCFCC Call 4 COBOLZ2 +000002A4 11 COBOLZ2 COBOLZ2 Call 5 IGZCFCC +000002CA IGZCPAC IGZCFCC Call 6 COBOLZ1 +0000028E 8 GO COBOLZ1 Call DSA DSA Addr E Addr PU Addr PU Offset Comp Date Compile Attributes 1 1147E7D0 112BD238 112BD238 +000049D6 20061215 CEL 2 1147E750 1120E448 1120E448 +00000064 20070214 ASM 3 1147E570 1140A5F8 1140A5F8 +000002CA 20061213 LIBRARY 4 1147E3C0 0001F320 0001F320 +000002A4 20070214 COBOL 5 1147E1E0 1140A5F8 1140A5F8 +000002CA 20061213 LIBRARY 6 1147E030 000083D0 000083D0 +0000028E 20070214 COBOL Condition Information for Active Routines Condition Information for ASSEMZ3 (DSA address 1147E750) CIB Address: 1147F0F0 Current Condition: CEE3209S The system detected a fixed-point divide exception (System Completion Code=0C9). Location: Program Unit: ASSEMZ3 Entry: ASSEMZ3 Statement: Offset: +00000064 Machine State: ILC..... 0004 Interruption Code..... 0009 PSW..... 078D0000 9120E4B0 GPR0..... 00000000_1147E7D0 GPR1..... 00000000_1147E4B8 GPR2..... 00000000_1147AE54 GPR3..... 00000000_000212E8 GPR4..... 00000000_00000000 GPR5..... 00000000_0000092C GPR6..... 00000000_000213A8 GPR7..... 00000000_1147E4B8 GPR8..... 00000000_00000002 GPR9..... 00000000_000211B0 GPR10.... 00000000_1147A100 GPR11.... 00000000_9120E448 GPR12.... 00000000_1120C9C0 GPR13.... 00000000_1147E750 GPR14.... 00000000_9140A8C4 GPR15.... 00000000_9120E448 Storage dump near condition, beginning at location: 1120E49C +000000 1120E49C 10184150 092C1B44 58610000 41660000 5D460000 58F0B0C8 5800B0C8 58DD0004 |...&...../......)....0.H...H....| GPREG STORAGE:
Chapter 5. Debugging COBOL programs 243
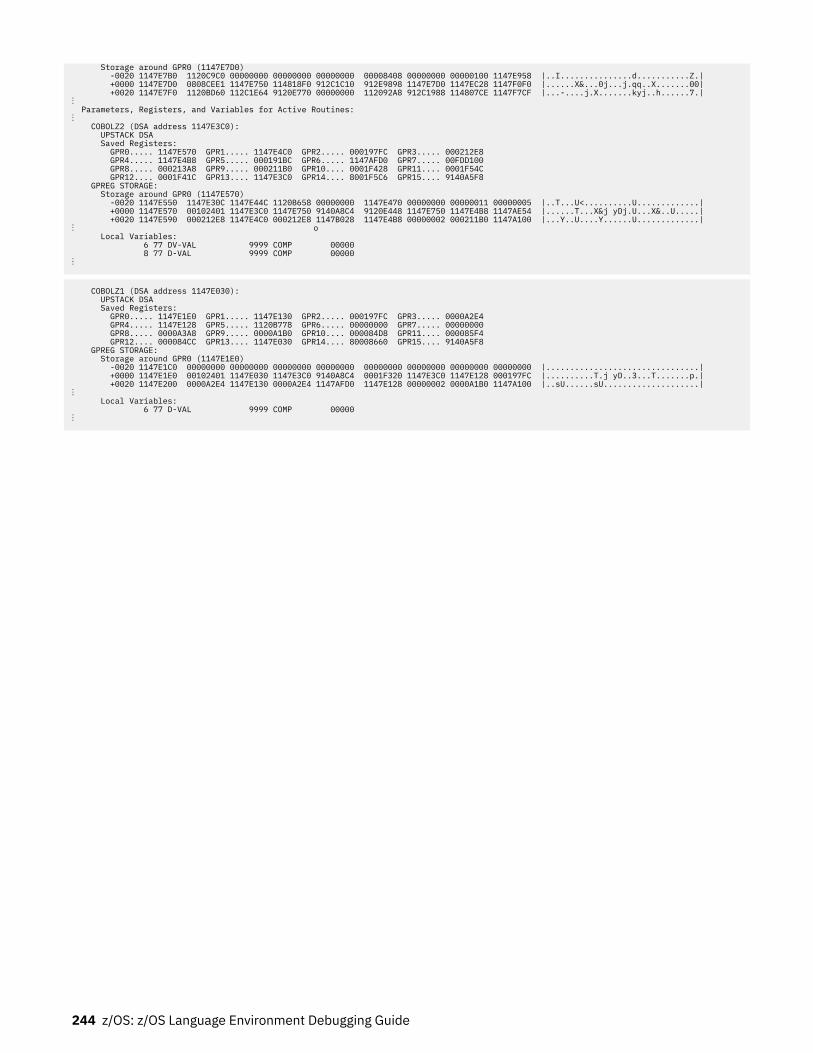
Storage around GPR0 (1147E7D0) -0020 1147E7B0 1120C9C0 00000000 00000000 00000000 00008408 00000000 00000100 1147E958 |..I...............d...........Z.| +0000 1147E7D0 0808CEE1 1147E750 114818F0 912C1C10 912E9898 1147E7D0 1147EC28 1147F0F0 |......X&...0j...j.qq..X.......00| +0020 1147E7F0 1120BD60 112C1E64 9120E770 00000000 112092A8 912C1988 114807CE 1147F7CF |...-....j.X.......kyj..h......7.|⋮ Parameters, Registers, and Variables for Active Routines: ⋮ COBOLZ2 (DSA address 1147E3C0): UPSTACK DSA Saved Registers: GPR0..... 1147E570 GPR1..... 1147E4C0 GPR2..... 000197FC GPR3..... 000212E8 GPR4..... 1147E4B8 GPR5..... 000191BC GPR6..... 1147AFD0 GPR7..... 00FDD100 GPR8..... 000213A8 GPR9..... 000211B0 GPR10.... 0001F428 GPR11.... 0001F54C GPR12.... 0001F41C GPR13.... 1147E3C0 GPR14.... 8001F5C6 GPR15.... 9140A5F8 GPREG STORAGE: Storage around GPR0 (1147E570) -0020 1147E550 1147E30C 1147E44C 1120B658 00000000 1147E470 00000000 00000011 00000005 |..T...U<..........U.............| +0000 1147E570 00102401 1147E3C0 1147E750 9140A8C4 9120E448 1147E750 1147E4B8 1147AE54 |......T...X&j yDj.U...X&..U.....| +0020 1147E590 000212E8 1147E4C0 000212E8 1147B028 1147E4B8 00000002 000211B0 1147A100 |...Y..U....Y......U.............|⋮ o Local Variables: 6 77 DV-VAL 9999 COMP 00000 8 77 D-VAL 9999 COMP 00000 ⋮
COBOLZ1 (DSA address 1147E030): UPSTACK DSA Saved Registers: GPR0..... 1147E1E0 GPR1..... 1147E130 GPR2..... 000197FC GPR3..... 0000A2E4 GPR4..... 1147E128 GPR5..... 1120B778 GPR6..... 00000000 GPR7..... 00000000 GPR8..... 0000A3A8 GPR9..... 0000A1B0 GPR10.... 000084D8 GPR11.... 000085F4 GPR12.... 000084CC GPR13.... 1147E030 GPR14.... 80008660 GPR15.... 9140A5F8 GPREG STORAGE: Storage around GPR0 (1147E1E0) -0020 1147E1C0 00000000 00000000 00000000 00000000 00000000 00000000 00000000 00000000 |................................| +0000 1147E1E0 00102401 1147E030 1147E3C0 9140A8C4 0001F320 1147E3C0 1147E128 000197FC |..........T.j yD..3...T.......p.| +0020 1147E200 0000A2E4 1147E130 0000A2E4 1147AFD0 1147E128 00000002 0000A1B0 1147A100 |..sU......sU....................|⋮ Local Variables: 6 77 D-VAL 9999 COMP 00000 ⋮
244 z/OS: z/OS Language Environment Debugging Guide
Chapter 6. Debugging Fortran routines
You can debug applications that contain one or more Fortran routines.
Determining the source of errors in Fortran routinesMost errors in Fortran routines can be identified by the information provided in Fortran runtime messages,which begin with the prefix "FOR". The Fortran compiler cannot identify all possible errors. The followinglist identifies several errors not detected by the compiler that could potentially result in problems:
• Failing to assign values to variables and arrays before using them in your program.• Specifying subscript values that are not within the bounds of an array. If you assign data outside the
array bounds, you can inadvertently destroy data and instructions.• Moving data into an item that is too small for it, resulting in truncation.• Making invalid data references to EQUIVALENCE items of differing types (for example, integer or real).• Transferring control into the range of a DO loop from outside the range of the loop. The compiler issues
a warning message for all such branches if you specify OPT(2), OPT(3), or VECTOR.• Using arithmetic variables and constants that are too small to give the precision you need in the result.
For example, to obtain more than 6 decimal digits in floating-point results, you must use doubleprecision.
• Concatenating character strings in such a way that overlap can occur.• Trying to access services that are not available in the operating system or hardware.• Failing to resolve name conflicts between Fortran and C library routines using the procedures described
in Resolving library module name conflicts between Fortran and C in z/OS Language EnvironmentProgramming Guide.
Identifying runtime errorsFortran has several features that help you find runtime errors. Fortran runtime messages are discussed inFortran runtime messages in z/OS Language Environment Runtime Messages. Other debugging aidsinclude the optional traceback map, program interruption messages, abnormal termination dumps, andoperator messages.
• The optional traceback map helps you identify where errors occurred while running your application.The TERMTHDACT(TRACE) runtime option, which is set by default under Language Environment,generates a dump containing the traceback map.
You can also get a traceback map at any point in your routine by invoking the ERRTRA subroutine. • Program interruption messages are generated whenever the program is interrupted during execution.
Program interruption messages are written to the Language Environment message file.
The program interruption message indicates the exception that caused the termination; the completioncode from the system indicates the specification or operation exception resulting in termination.
• Program interruptions causing an abnormal termination produce a dump, which displays the completioncode and the contents of registers and system control fields.
To display the contents of main storage as well, you must request an abnormal termination (ABEND)dump by including a SYSUDUMP DD statement in the appropriate job step. The following exampleshows how the statement can be specified for IBM-supplied cataloged procedures:
//GO.SYSUDUMP DD SYSOUT=A
© Copyright IBM Corp. 1991, 2020 245
• You can request various dumps by invoking any of several dump service routines while your programruns. These dump service routines are discussed in “Generating a Language Environment dump of aFortran routine” on page 247.
• Operator messages are displayed when your program issues a PAUSE or STOP n statement. Thesemessages help you understand how far execution has progressed before reaching the PAUSE or STOPstatement.
The operator message can take the following forms:n
String of 1–5 decimal digits you specified in the PAUSE or STOP statement. For the STOP statement,this number is placed in R15.
'message'Character constant you specified in the PAUSE or STOP statement.
0Printed when a PAUSE statement containing no characters is executed (not printed for a STOPstatement).
A PAUSE message causes the program to stop running pending an operator response. The format of theoperator's response to the message depends on the system being used.
• Under Language Environment, error messages produced by Language Environment and Fortran arewritten to a common message file. Its ddname is specified in the MSGFILE runtime option. The defaultddname is SYSOUT.
Fortran information directed to the message file includes:
– Error messages resulting from unhandled conditions– Printed output from any of the dump services (SDUMP, DUMP/PDUMP, CDUMP/CPDUMP)– Output produced by a WRITE statement with a unit identifier having the same value as the Fortran
error message unit– Output produced by a WRITE statement with * given as the unit identifier (assuming the Fortran error
message unit and standard print unit are the same unit)– Output produced by the PRINT statement (assuming the Fortran error message unit and the standard
print unit are the same unit)
For more information about handling message output using the Language Environment MSGFILEruntime option, see MSGFILE in z/OS Language Environment Programming Reference.
Using Fortran compiler listingsFortran listings provide you with:
• The date of compilation including information about the compiler• A listing of your source program• Diagnostic messages telling you of errors in the source program• Informative messages telling you the status of the compilation
Table 41 on page 246lists of the contents of the various compiler-generated listings that you might findhelpful when you use information in dumps to debug Fortran programs.
Table 41. Compiler-generated Fortran listings and their contents
Name Contents CompilerOption
Diagnostic messagelisting
Error messages detected during compilation. FLAG
Source program Source program statements. SOURCE
246 z/OS: z/OS Language Environment Debugging Guide
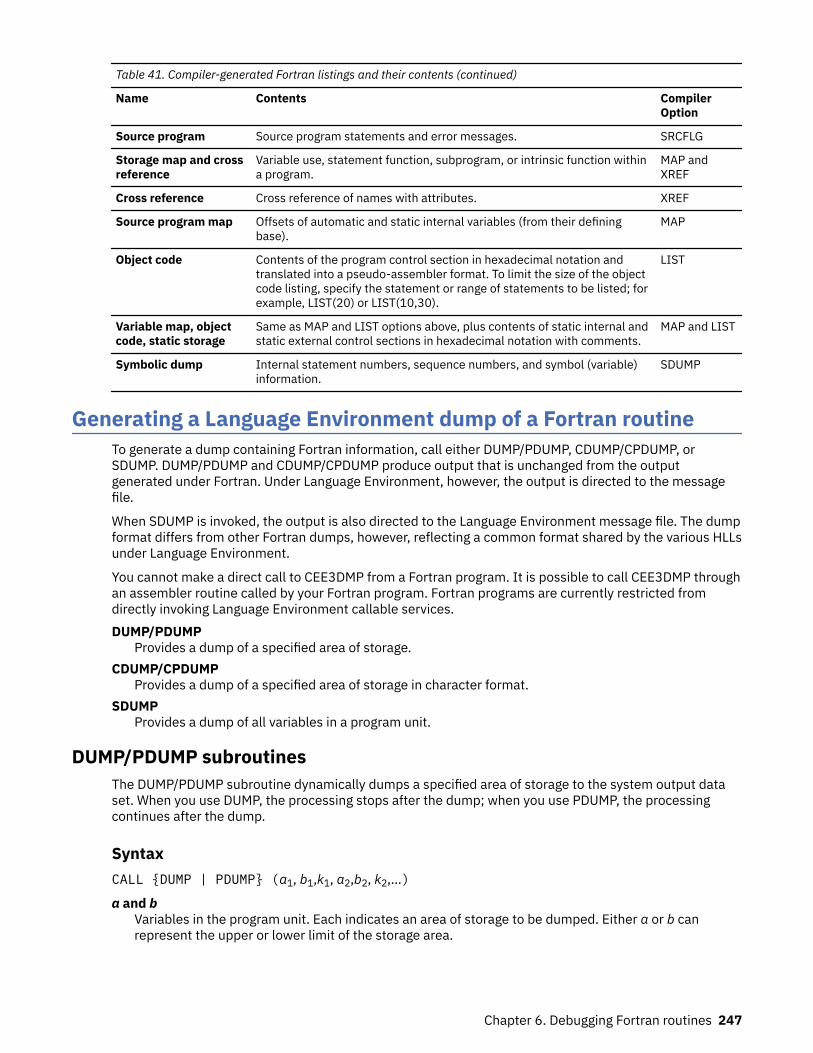
Table 41. Compiler-generated Fortran listings and their contents (continued)
Name Contents CompilerOption
Source program Source program statements and error messages. SRCFLG
Storage map and crossreference
Variable use, statement function, subprogram, or intrinsic function withina program.
MAP andXREF
Cross reference Cross reference of names with attributes. XREF
Source program map Offsets of automatic and static internal variables (from their definingbase).
MAP
Object code Contents of the program control section in hexadecimal notation andtranslated into a pseudo-assembler format. To limit the size of the objectcode listing, specify the statement or range of statements to be listed; forexample, LIST(20) or LIST(10,30).
LIST
Variable map, objectcode, static storage
Same as MAP and LIST options above, plus contents of static internal andstatic external control sections in hexadecimal notation with comments.
MAP and LIST
Symbolic dump Internal statement numbers, sequence numbers, and symbol (variable)information.
SDUMP
Generating a Language Environment dump of a Fortran routineTo generate a dump containing Fortran information, call either DUMP/PDUMP, CDUMP/CPDUMP, orSDUMP. DUMP/PDUMP and CDUMP/CPDUMP produce output that is unchanged from the outputgenerated under Fortran. Under Language Environment, however, the output is directed to the messagefile.
When SDUMP is invoked, the output is also directed to the Language Environment message file. The dumpformat differs from other Fortran dumps, however, reflecting a common format shared by the various HLLsunder Language Environment.
You cannot make a direct call to CEE3DMP from a Fortran program. It is possible to call CEE3DMP throughan assembler routine called by your Fortran program. Fortran programs are currently restricted fromdirectly invoking Language Environment callable services.DUMP/PDUMP
Provides a dump of a specified area of storage.CDUMP/CPDUMP
Provides a dump of a specified area of storage in character format.SDUMP
Provides a dump of all variables in a program unit.
DUMP/PDUMP subroutinesThe DUMP/PDUMP subroutine dynamically dumps a specified area of storage to the system output dataset. When you use DUMP, the processing stops after the dump; when you use PDUMP, the processingcontinues after the dump.
SyntaxCALL {DUMP | PDUMP} (a1, b1,k1, a2,b2, k2,…)
a and bVariables in the program unit. Each indicates an area of storage to be dumped. Either a or b canrepresent the upper or lower limit of the storage area.
Chapter 6. Debugging Fortran routines 247
kThe dump format to be used. The values that can be specified for k, and the resulting dump formats,are: Value
Format Requested0
Hexadecimal1
LOGICAL*12
LOGICAL*43
INTEGER*24
INTEGER*45
REAL*46
REAL*87
COMPLEX*88
COMPLEX*169
CHARACTER10
REAL*1611
COMPLEX*3212
UNSIGNED*113
INTEGER*114
LOGICAL*215
INTEGER*816
LOGICAL*8
Usage considerations for DUMP/PDUMPA load module or phase can occupy a different area of storage each time it is executed. To ensure that theappropriate areas of storage are dumped, the following conventions should be observed.
If an array and a variable are to be dumped at the same time, a separate set of arguments should be usedfor the array and for the variable. The specification of limits for the array should be from the first elementin the array to the last element. For example, assume that A is a variable in common, B is a real number,and TABLE is an array of 20 elements. The following call to the storage dump routine could be used todump TABLE and B in hexadecimal format, and stop the program after the dump is taken.
CALL DUMP(TABLE(1),TABLE(20),0,B,B,0)
248 z/OS: z/OS Language Environment Debugging Guide
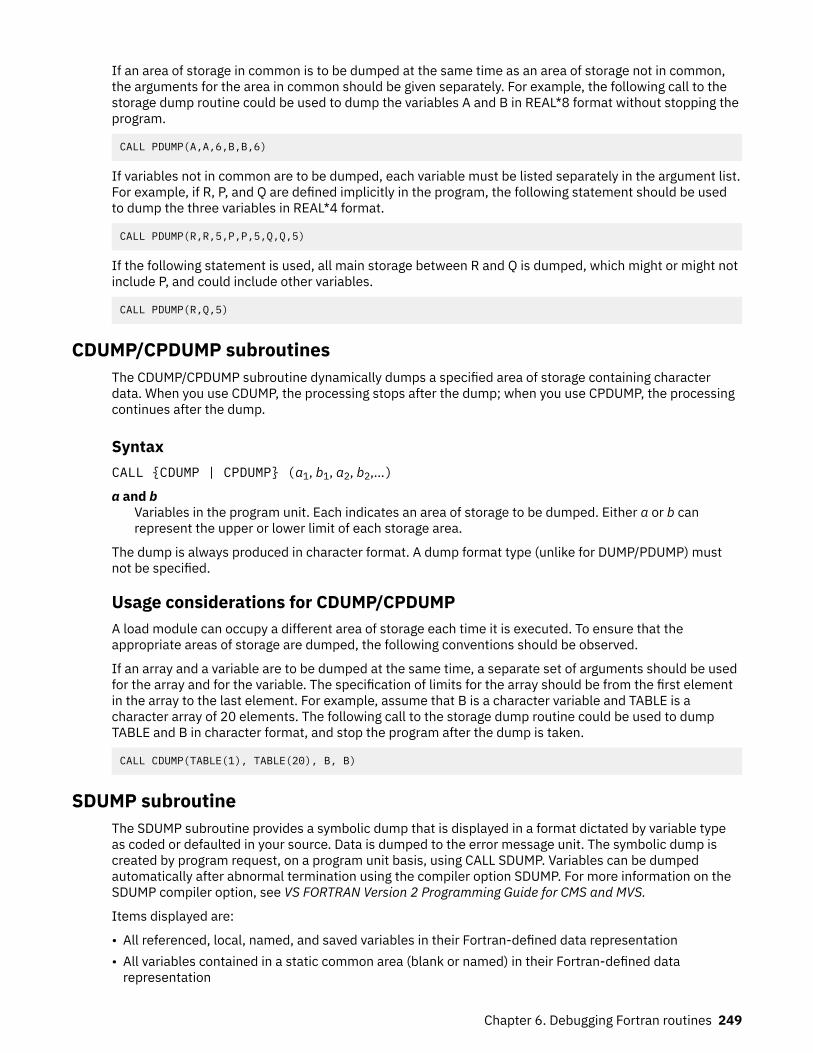
If an area of storage in common is to be dumped at the same time as an area of storage not in common,the arguments for the area in common should be given separately. For example, the following call to thestorage dump routine could be used to dump the variables A and B in REAL*8 format without stopping theprogram.
CALL PDUMP(A,A,6,B,B,6)
If variables not in common are to be dumped, each variable must be listed separately in the argument list.For example, if R, P, and Q are defined implicitly in the program, the following statement should be usedto dump the three variables in REAL*4 format.
CALL PDUMP(R,R,5,P,P,5,Q,Q,5)
If the following statement is used, all main storage between R and Q is dumped, which might or might notinclude P, and could include other variables.
CALL PDUMP(R,Q,5)
CDUMP/CPDUMP subroutinesThe CDUMP/CPDUMP subroutine dynamically dumps a specified area of storage containing characterdata. When you use CDUMP, the processing stops after the dump; when you use CPDUMP, the processingcontinues after the dump.
SyntaxCALL {CDUMP | CPDUMP} (a1, b1, a2, b2,…)
a and bVariables in the program unit. Each indicates an area of storage to be dumped. Either a or b canrepresent the upper or lower limit of each storage area.
The dump is always produced in character format. A dump format type (unlike for DUMP/PDUMP) mustnot be specified.
Usage considerations for CDUMP/CPDUMPA load module can occupy a different area of storage each time it is executed. To ensure that theappropriate areas of storage are dumped, the following conventions should be observed.
If an array and a variable are to be dumped at the same time, a separate set of arguments should be usedfor the array and for the variable. The specification of limits for the array should be from the first elementin the array to the last element. For example, assume that B is a character variable and TABLE is acharacter array of 20 elements. The following call to the storage dump routine could be used to dumpTABLE and B in character format, and stop the program after the dump is taken.
CALL CDUMP(TABLE(1), TABLE(20), B, B)
SDUMP subroutineThe SDUMP subroutine provides a symbolic dump that is displayed in a format dictated by variable typeas coded or defaulted in your source. Data is dumped to the error message unit. The symbolic dump iscreated by program request, on a program unit basis, using CALL SDUMP. Variables can be dumpedautomatically after abnormal termination using the compiler option SDUMP. For more information on theSDUMP compiler option, see VS FORTRAN Version 2 Programming Guide for CMS and MVS.
Items displayed are:
• All referenced, local, named, and saved variables in their Fortran-defined data representation• All variables contained in a static common area (blank or named) in their Fortran-defined data
representation
Chapter 6. Debugging Fortran routines 249
• All variables contained in a dynamic common area in their Fortran-defined data representation• Nonzero or nonblank character array elements only• Array elements with their correct indexes
The amount of output produced can be very large, especially if your program has large arrays, or largearrays in common blocks. For such programs, you might want to avoid calling SDUMP.
SyntaxCALL SDUMP [(rtn1,rtn2,…)]
rtn1,rtn2,…Names of other program units from which data will be dumped. These names must be listed in anEXTERNAL statement.
Usage considerations for SDUMP• To obtain symbolic dump information and location of error information, compilation must be done either
with the SDUMP option or with the TEST option.• Calling SDUMP and specifying program units that have not been entered gives unpredictable results.• Calling SDUMP with no parameters produces the symbolic dump for the current program unit.• An EXTERNAL statement must be used to identify the names being passed to SDUMP as external
routine names.• At higher levels of optimization (1, 2, or 3), the symbolic dump could show incorrect values for some
variables because of compiler optimization techniques. • Values for uninitialized variables are unpredictable. Arguments in uncalled subprograms or in
subprograms with argument lists shorter than the maximum can cause the SDUMP subroutine to fail.• The display of data can also be invoked automatically. If the runtime option TERMTHDACT(DUMP) is in
effect and your program abends in a program unit compiled with the SDUMP option or with the TESToption, all data in that program unit is automatically dumped. All data in any program unit in the savearea traceback chain compiled with the SDUMP option or with the TEST option is also dumped. Dataoccurring in a common block is dumped at each occurrence, because the data definition in eachprogram unit could be different.
Examples of calling SDUMP from the main program and from a subprogram follow. Figure 105 on page251 shows a sample program calling SDUMP and Figure 107 on page 252 shows the resulting output thatis generated. In the main program, the following statement
EXTERNAL PGM1,PGM2,PGM3
makes the address of subprograms PGM1, PGM2, and PGM3 available for a call to SDUMP, as follows:
CALL SDUMP (PGM1,PGM2,PGM3)
This causes variables in PGM1, PGM2, and PGM3 to be printed.
In the subprogram PGM1, the following statement makes PGM2 and PGM3 available. (PGM1 is missingbecause the call is in PGM1.)
EXTERNAL PGM2,PGM3
The following statements dump the variables PGM1, PGM2, and PGM3.
CALL SDUMPCALL SDUMP (PGM2,PGM3)
250 z/OS: z/OS Language Environment Debugging Guide
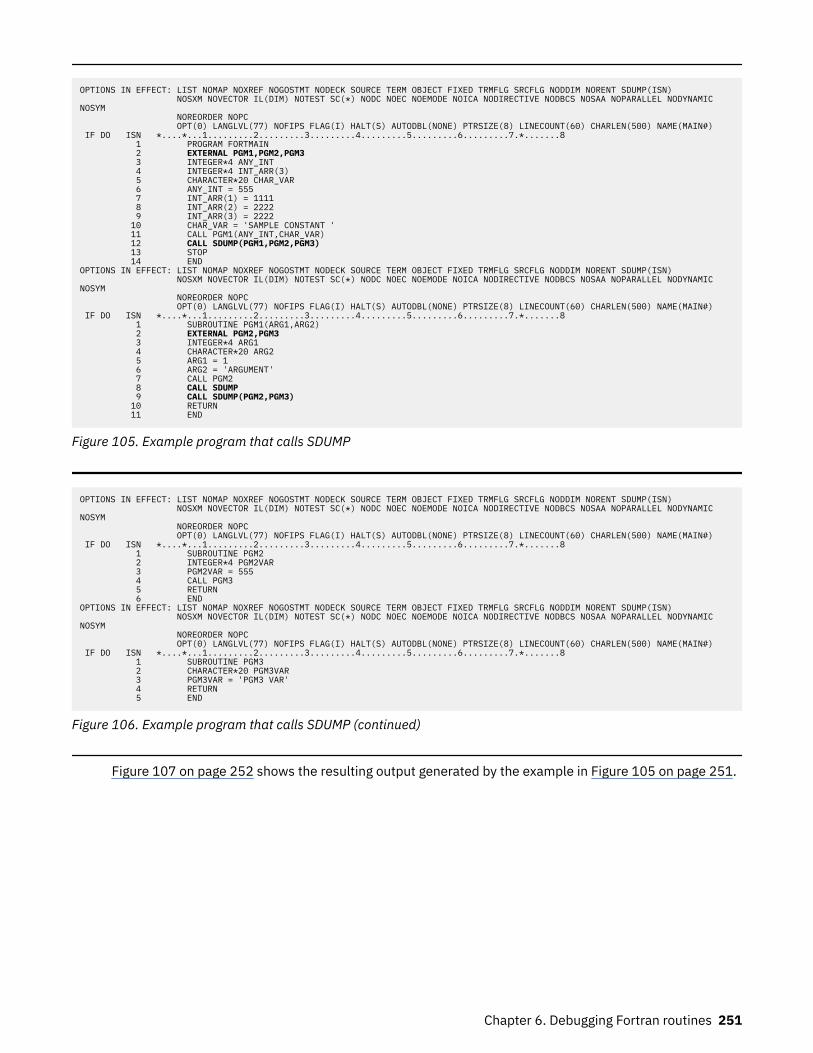
OPTIONS IN EFFECT: LIST NOMAP NOXREF NOGOSTMT NODECK SOURCE TERM OBJECT FIXED TRMFLG SRCFLG NODDIM NORENT SDUMP(ISN) NOSXM NOVECTOR IL(DIM) NOTEST SC(*) NODC NOEC NOEMODE NOICA NODIRECTIVE NODBCS NOSAA NOPARALLEL NODYNAMIC NOSYM NOREORDER NOPC OPT(0) LANGLVL(77) NOFIPS FLAG(I) HALT(S) AUTODBL(NONE) PTRSIZE(8) LINECOUNT(60) CHARLEN(500) NAME(MAIN#) IF DO ISN *....*...1.........2.........3.........4.........5.........6.........7.*.......8 1 PROGRAM FORTMAIN 2 EXTERNAL PGM1,PGM2,PGM3 3 INTEGER*4 ANY_INT 4 INTEGER*4 INT_ARR(3) 5 CHARACTER*20 CHAR_VAR 6 ANY_INT = 555 7 INT_ARR(1) = 1111 8 INT_ARR(2) = 2222 9 INT_ARR(3) = 2222 10 CHAR_VAR = 'SAMPLE CONSTANT ' 11 CALL PGM1(ANY_INT,CHAR_VAR) 12 CALL SDUMP(PGM1,PGM2,PGM3) 13 STOP 14 ENDOPTIONS IN EFFECT: LIST NOMAP NOXREF NOGOSTMT NODECK SOURCE TERM OBJECT FIXED TRMFLG SRCFLG NODDIM NORENT SDUMP(ISN) NOSXM NOVECTOR IL(DIM) NOTEST SC(*) NODC NOEC NOEMODE NOICA NODIRECTIVE NODBCS NOSAA NOPARALLEL NODYNAMIC NOSYM NOREORDER NOPC OPT(0) LANGLVL(77) NOFIPS FLAG(I) HALT(S) AUTODBL(NONE) PTRSIZE(8) LINECOUNT(60) CHARLEN(500) NAME(MAIN#) IF DO ISN *....*...1.........2.........3.........4.........5.........6.........7.*.......8 1 SUBROUTINE PGM1(ARG1,ARG2) 2 EXTERNAL PGM2,PGM3 3 INTEGER*4 ARG1 4 CHARACTER*20 ARG2 5 ARG1 = 1 6 ARG2 = 'ARGUMENT' 7 CALL PGM2 8 CALL SDUMP 9 CALL SDUMP(PGM2,PGM3) 10 RETURN 11 END
Figure 105. Example program that calls SDUMP
OPTIONS IN EFFECT: LIST NOMAP NOXREF NOGOSTMT NODECK SOURCE TERM OBJECT FIXED TRMFLG SRCFLG NODDIM NORENT SDUMP(ISN) NOSXM NOVECTOR IL(DIM) NOTEST SC(*) NODC NOEC NOEMODE NOICA NODIRECTIVE NODBCS NOSAA NOPARALLEL NODYNAMIC NOSYM NOREORDER NOPC OPT(0) LANGLVL(77) NOFIPS FLAG(I) HALT(S) AUTODBL(NONE) PTRSIZE(8) LINECOUNT(60) CHARLEN(500) NAME(MAIN#) IF DO ISN *....*...1.........2.........3.........4.........5.........6.........7.*.......8 1 SUBROUTINE PGM2 2 INTEGER*4 PGM2VAR 3 PGM2VAR = 555 4 CALL PGM3 5 RETURN 6 ENDOPTIONS IN EFFECT: LIST NOMAP NOXREF NOGOSTMT NODECK SOURCE TERM OBJECT FIXED TRMFLG SRCFLG NODDIM NORENT SDUMP(ISN) NOSXM NOVECTOR IL(DIM) NOTEST SC(*) NODC NOEC NOEMODE NOICA NODIRECTIVE NODBCS NOSAA NOPARALLEL NODYNAMIC NOSYM NOREORDER NOPC OPT(0) LANGLVL(77) NOFIPS FLAG(I) HALT(S) AUTODBL(NONE) PTRSIZE(8) LINECOUNT(60) CHARLEN(500) NAME(MAIN#) IF DO ISN *....*...1.........2.........3.........4.........5.........6.........7.*.......8 1 SUBROUTINE PGM3 2 CHARACTER*20 PGM3VAR 3 PGM3VAR = 'PGM3 VAR' 4 RETURN 5 END
Figure 106. Example program that calls SDUMP (continued)
Figure 107 on page 252 shows the resulting output generated by the example in Figure 105 on page 251.
Chapter 6. Debugging Fortran routines 251
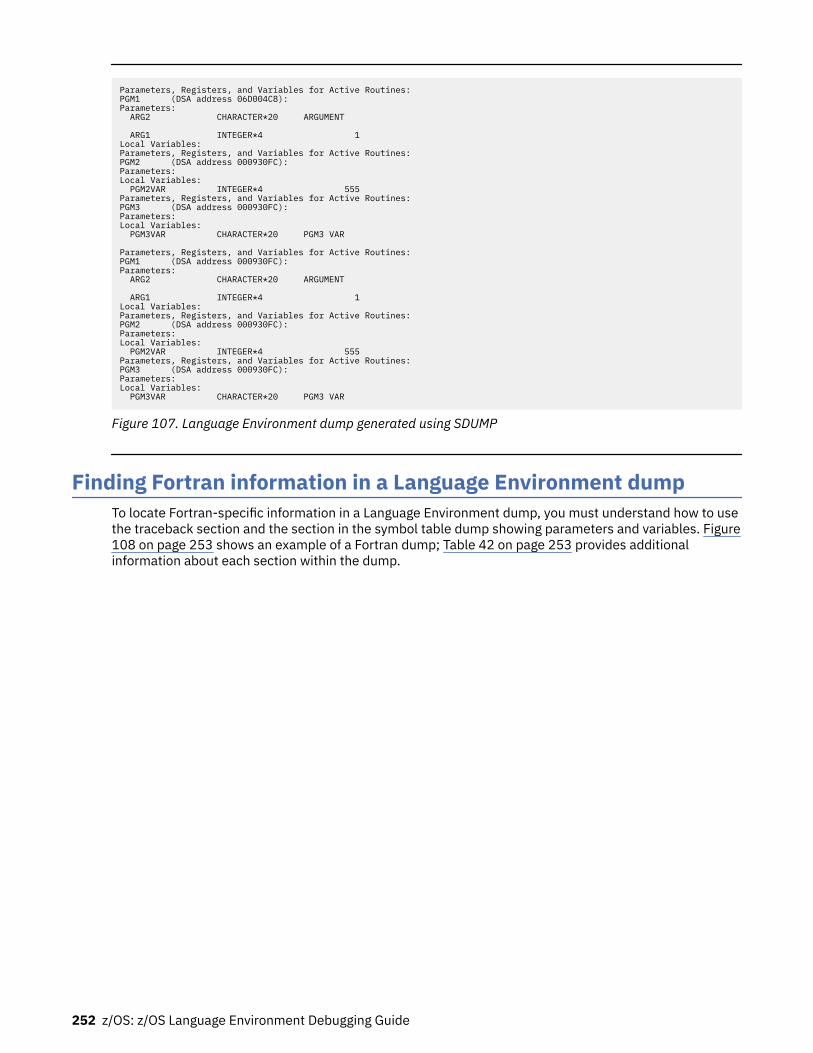
Parameters, Registers, and Variables for Active Routines:PGM1 (DSA address 06D004C8):Parameters: ARG2 CHARACTER*20 ARGUMENT
ARG1 INTEGER*4 1Local Variables:Parameters, Registers, and Variables for Active Routines:PGM2 (DSA address 000930FC):Parameters:Local Variables: PGM2VAR INTEGER*4 555Parameters, Registers, and Variables for Active Routines:PGM3 (DSA address 000930FC):Parameters:Local Variables: PGM3VAR CHARACTER*20 PGM3 VAR
Parameters, Registers, and Variables for Active Routines:PGM1 (DSA address 000930FC):Parameters: ARG2 CHARACTER*20 ARGUMENT
ARG1 INTEGER*4 1Local Variables:Parameters, Registers, and Variables for Active Routines:PGM2 (DSA address 000930FC):Parameters:Local Variables: PGM2VAR INTEGER*4 555Parameters, Registers, and Variables for Active Routines:PGM3 (DSA address 000930FC):Parameters:Local Variables: PGM3VAR CHARACTER*20 PGM3 VAR
Figure 107. Language Environment dump generated using SDUMP
Finding Fortran information in a Language Environment dumpTo locate Fortran-specific information in a Language Environment dump, you must understand how to usethe traceback section and the section in the symbol table dump showing parameters and variables. Figure108 on page 253 shows an example of a Fortran dump; Table 42 on page 253 provides additionalinformation about each section within the dump.
252 z/OS: z/OS Language Environment Debugging Guide
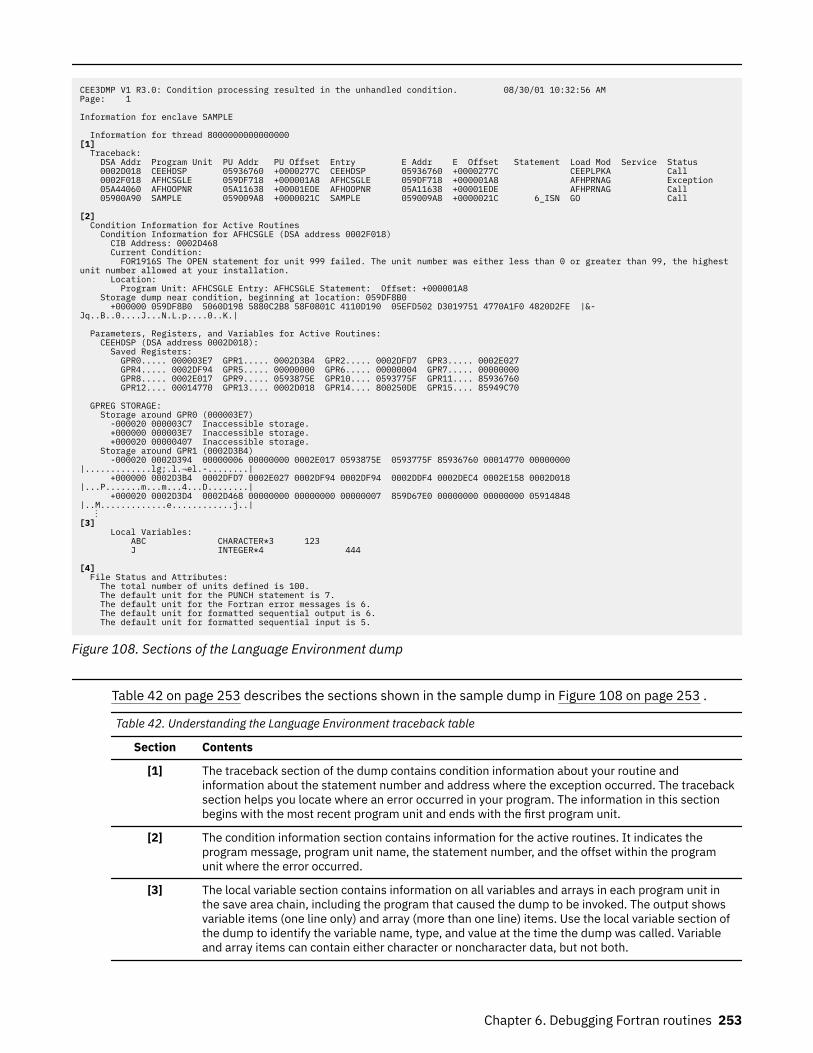
CEE3DMP V1 R3.0: Condition processing resulted in the unhandled condition. 08/30/01 10:32:56 AM Page: 1
Information for enclave SAMPLE
Information for thread 8000000000000000[1] Traceback: DSA Addr Program Unit PU Addr PU Offset Entry E Addr E Offset Statement Load Mod Service Status 0002D018 CEEHDSP 05936760 +0000277C CEEHDSP 05936760 +0000277C CEEPLPKA Call 0002F018 AFHCSGLE 059DF718 +000001A8 AFHCSGLE 059DF718 +000001A8 AFHPRNAG Exception 05A44060 AFHOOPNR 05A11638 +00001EDE AFHOOPNR 05A11638 +00001EDE AFHPRNAG Call 05900A90 SAMPLE 059009A8 +0000021C SAMPLE 059009A8 +0000021C 6_ISN GO Call
[2] Condition Information for Active Routines Condition Information for AFHCSGLE (DSA address 0002F018) CIB Address: 0002D468 Current Condition: FOR1916S The OPEN statement for unit 999 failed. The unit number was either less than 0 or greater than 99, the highestunit number allowed at your installation. Location: Program Unit: AFHCSGLE Entry: AFHCSGLE Statement: Offset: +000001A8 Storage dump near condition, beginning at location: 059DF8B0 +000000 059DF8B0 5060D198 5880C2B8 58F0801C 4110D190 05EFD502 D3019751 4770A1F0 4820D2FE |&-Jq..B..0....J...N.L.p....0..K.|
Parameters, Registers, and Variables for Active Routines: CEEHDSP (DSA address 0002D018): Saved Registers: GPR0..... 000003E7 GPR1..... 0002D3B4 GPR2..... 0002DFD7 GPR3..... 0002E027 GPR4..... 0002DF94 GPR5..... 00000000 GPR6..... 00000004 GPR7..... 00000000 GPR8..... 0002E017 GPR9..... 0593875E GPR10.... 0593775F GPR11.... 85936760 GPR12.... 00014770 GPR13.... 0002D018 GPR14.... 800250DE GPR15.... 85949C70
GPREG STORAGE: Storage around GPR0 (000003E7) -000020 000003C7 Inaccessible storage. +000000 000003E7 Inaccessible storage. +000020 00000407 Inaccessible storage. Storage around GPR1 (0002D3B4) -000020 0002D394 00000006 00000000 0002E017 0593875E 0593775F 85936760 00014770 00000000 |.............lg;.l.¬el.-........| +000000 0002D3B4 0002DFD7 0002E027 0002DF94 0002DF94 0002DDF4 0002DEC4 0002E158 0002D018 |...P.......m...m...4...D........| +000020 0002D3D4 0002D468 00000000 00000000 00000007 859D67E0 00000000 00000000 05914848 |..M.............e............j..| ⋮[3] Local Variables: ABC CHARACTER*3 123 J INTEGER*4 444
[4] File Status and Attributes: The total number of units defined is 100. The default unit for the PUNCH statement is 7. The default unit for the Fortran error messages is 6. The default unit for formatted sequential output is 6. The default unit for formatted sequential input is 5.
Figure 108. Sections of the Language Environment dump
Table 42 on page 253 describes the sections shown in the sample dump in Figure 108 on page 253 .
Table 42. Understanding the Language Environment traceback table
Section Contents
[1] The traceback section of the dump contains condition information about your routine andinformation about the statement number and address where the exception occurred. The tracebacksection helps you locate where an error occurred in your program. The information in this sectionbegins with the most recent program unit and ends with the first program unit.
[2] The condition information section contains information for the active routines. It indicates theprogram message, program unit name, the statement number, and the offset within the programunit where the error occurred.
[3] The local variable section contains information on all variables and arrays in each program unit inthe save area chain, including the program that caused the dump to be invoked. The output showsvariable items (one line only) and array (more than one line) items. Use the local variable section ofthe dump to identify the variable name, type, and value at the time the dump was called. Variableand array items can contain either character or noncharacter data, but not both.
Chapter 6. Debugging Fortran routines 253
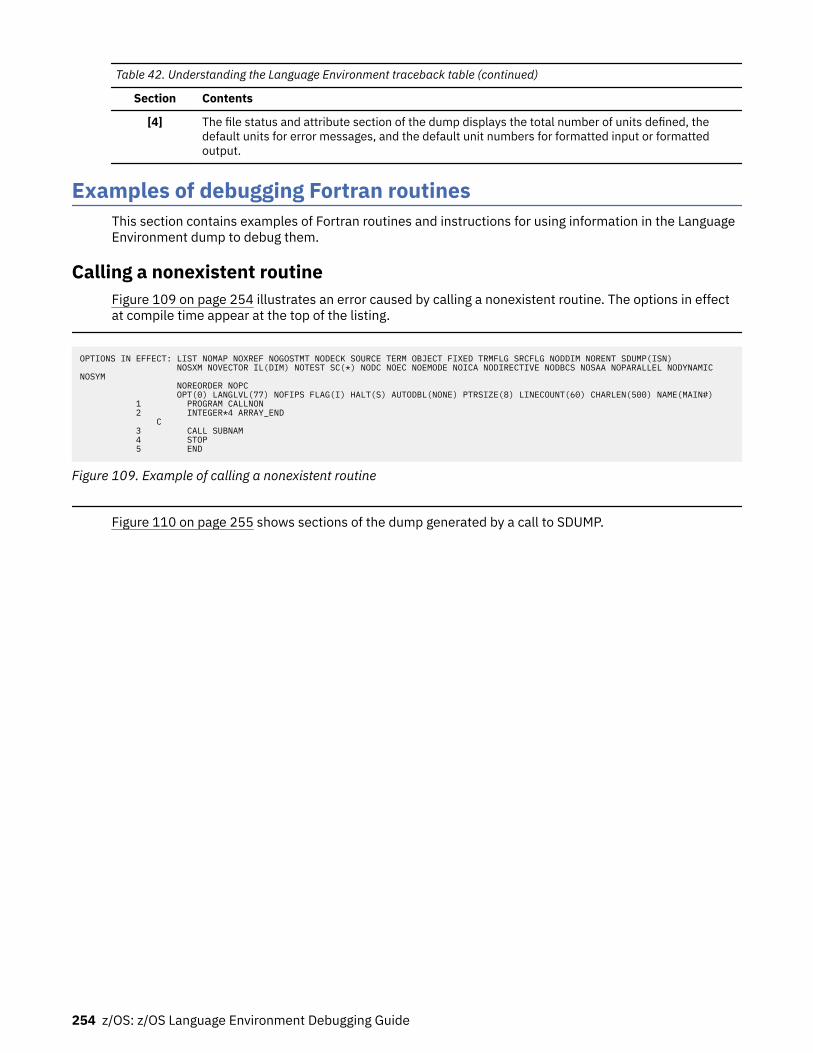
Table 42. Understanding the Language Environment traceback table (continued)
Section Contents
[4] The file status and attribute section of the dump displays the total number of units defined, thedefault units for error messages, and the default unit numbers for formatted input or formattedoutput.
Examples of debugging Fortran routinesThis section contains examples of Fortran routines and instructions for using information in the LanguageEnvironment dump to debug them.
Calling a nonexistent routineFigure 109 on page 254 illustrates an error caused by calling a nonexistent routine. The options in effectat compile time appear at the top of the listing.
OPTIONS IN EFFECT: LIST NOMAP NOXREF NOGOSTMT NODECK SOURCE TERM OBJECT FIXED TRMFLG SRCFLG NODDIM NORENT SDUMP(ISN) NOSXM NOVECTOR IL(DIM) NOTEST SC(*) NODC NOEC NOEMODE NOICA NODIRECTIVE NODBCS NOSAA NOPARALLEL NODYNAMIC NOSYM NOREORDER NOPC OPT(0) LANGLVL(77) NOFIPS FLAG(I) HALT(S) AUTODBL(NONE) PTRSIZE(8) LINECOUNT(60) CHARLEN(500) NAME(MAIN#) 1 PROGRAM CALLNON 2 INTEGER*4 ARRAY_END C 3 CALL SUBNAM 4 STOP 5 END
Figure 109. Example of calling a nonexistent routine
Figure 110 on page 255 shows sections of the dump generated by a call to SDUMP.
254 z/OS: z/OS Language Environment Debugging Guide
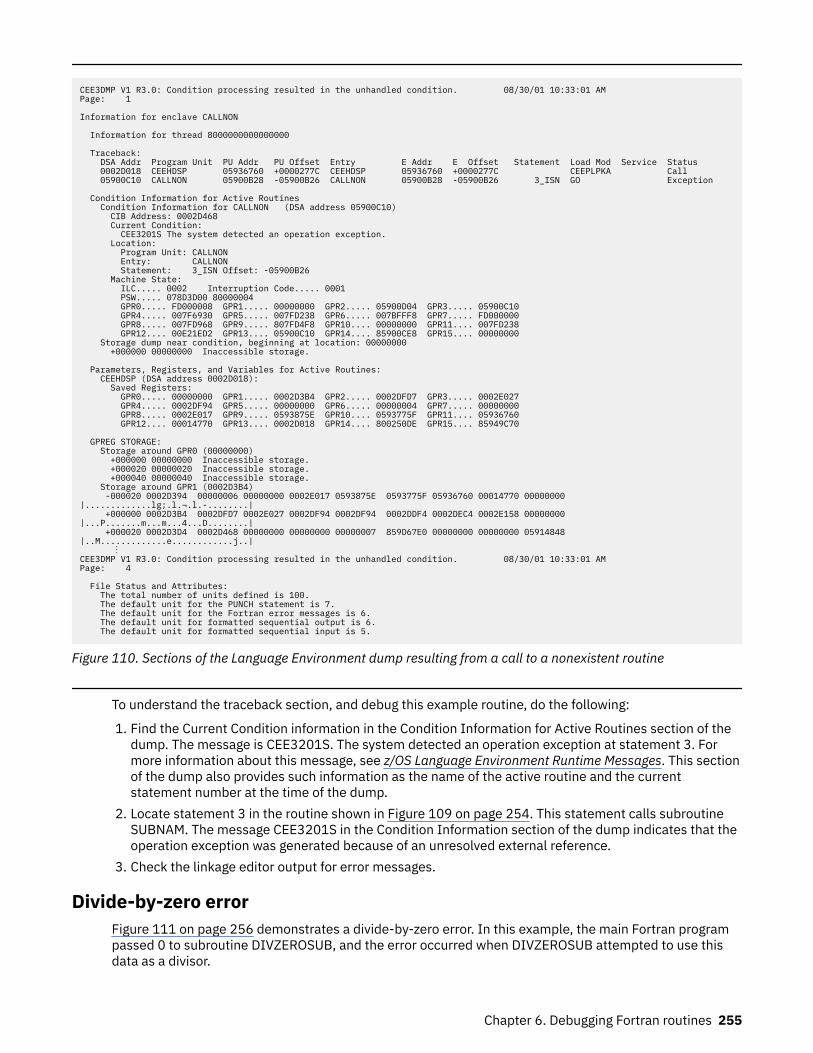
CEE3DMP V1 R3.0: Condition processing resulted in the unhandled condition. 08/30/01 10:33:01 AM Page: 1
Information for enclave CALLNON
Information for thread 8000000000000000
Traceback: DSA Addr Program Unit PU Addr PU Offset Entry E Addr E Offset Statement Load Mod Service Status 0002D018 CEEHDSP 05936760 +0000277C CEEHDSP 05936760 +0000277C CEEPLPKA Call 05900C10 CALLNON 05900B28 -05900B26 CALLNON 05900B28 -05900B26 3_ISN GO Exception
Condition Information for Active Routines Condition Information for CALLNON (DSA address 05900C10) CIB Address: 0002D468 Current Condition: CEE3201S The system detected an operation exception. Location: Program Unit: CALLNON Entry: CALLNON Statement: 3_ISN Offset: -05900B26 Machine State: ILC..... 0002 Interruption Code..... 0001 PSW..... 078D3D00 80000004 GPR0..... FD000008 GPR1..... 00000000 GPR2..... 05900D04 GPR3..... 05900C10 GPR4..... 007F6930 GPR5..... 007FD238 GPR6..... 007BFFF8 GPR7..... FD000000 GPR8..... 007FD968 GPR9..... 807FD4F8 GPR10.... 00000000 GPR11.... 007FD238 GPR12.... 00E21ED2 GPR13.... 05900C10 GPR14.... 85900CE8 GPR15.... 00000000 Storage dump near condition, beginning at location: 00000000 +000000 00000000 Inaccessible storage.
Parameters, Registers, and Variables for Active Routines: CEEHDSP (DSA address 0002D018): Saved Registers: GPR0..... 00000000 GPR1..... 0002D3B4 GPR2..... 0002DFD7 GPR3..... 0002E027 GPR4..... 0002DF94 GPR5..... 00000000 GPR6..... 00000004 GPR7..... 00000000 GPR8..... 0002E017 GPR9..... 0593875E GPR10.... 0593775F GPR11.... 05936760 GPR12.... 00014770 GPR13.... 0002D018 GPR14.... 800250DE GPR15.... 85949C70
GPREG STORAGE: Storage around GPR0 (00000000) +000000 00000000 Inaccessible storage. +000020 00000020 Inaccessible storage. +000040 00000040 Inaccessible storage. Storage around GPR1 (0002D3B4) -000020 0002D394 00000006 00000000 0002E017 0593875E 0593775F 05936760 00014770 00000000 |.............lg;.l.¬.l.-........| +000000 0002D3B4 0002DFD7 0002E027 0002DF94 0002DF94 0002DDF4 0002DEC4 0002E158 00000000 |...P.......m...m...4...D........| +000020 0002D3D4 0002D468 00000000 00000000 00000007 859D67E0 00000000 00000000 05914848 |..M.............e............j..| ⋮CEE3DMP V1 R3.0: Condition processing resulted in the unhandled condition. 08/30/01 10:33:01 AM Page: 4
File Status and Attributes: The total number of units defined is 100. The default unit for the PUNCH statement is 7. The default unit for the Fortran error messages is 6. The default unit for formatted sequential output is 6. The default unit for formatted sequential input is 5.
Figure 110. Sections of the Language Environment dump resulting from a call to a nonexistent routine
To understand the traceback section, and debug this example routine, do the following:
1. Find the Current Condition information in the Condition Information for Active Routines section of thedump. The message is CEE3201S. The system detected an operation exception at statement 3. Formore information about this message, see z/OS Language Environment Runtime Messages. This sectionof the dump also provides such information as the name of the active routine and the currentstatement number at the time of the dump.
2. Locate statement 3 in the routine shown in Figure 109 on page 254. This statement calls subroutineSUBNAM. The message CEE3201S in the Condition Information section of the dump indicates that theoperation exception was generated because of an unresolved external reference.
3. Check the linkage editor output for error messages.
Divide-by-zero errorFigure 111 on page 256 demonstrates a divide-by-zero error. In this example, the main Fortran programpassed 0 to subroutine DIVZEROSUB, and the error occurred when DIVZEROSUB attempted to use thisdata as a divisor.
Chapter 6. Debugging Fortran routines 255
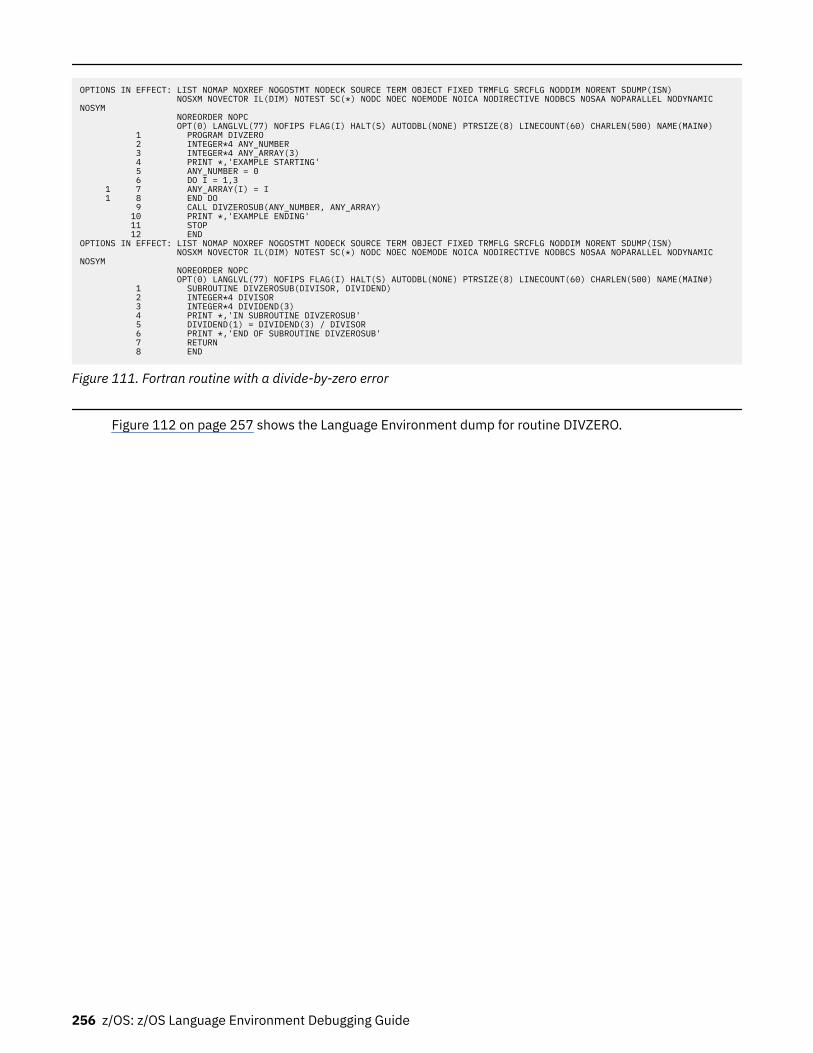
OPTIONS IN EFFECT: LIST NOMAP NOXREF NOGOSTMT NODECK SOURCE TERM OBJECT FIXED TRMFLG SRCFLG NODDIM NORENT SDUMP(ISN) NOSXM NOVECTOR IL(DIM) NOTEST SC(*) NODC NOEC NOEMODE NOICA NODIRECTIVE NODBCS NOSAA NOPARALLEL NODYNAMIC NOSYM NOREORDER NOPC OPT(0) LANGLVL(77) NOFIPS FLAG(I) HALT(S) AUTODBL(NONE) PTRSIZE(8) LINECOUNT(60) CHARLEN(500) NAME(MAIN#) 1 PROGRAM DIVZERO 2 INTEGER*4 ANY_NUMBER 3 INTEGER*4 ANY_ARRAY(3) 4 PRINT *,'EXAMPLE STARTING' 5 ANY_NUMBER = 0 6 DO I = 1,3 1 7 ANY_ARRAY(I) = I 1 8 END DO 9 CALL DIVZEROSUB(ANY_NUMBER, ANY_ARRAY) 10 PRINT *,'EXAMPLE ENDING' 11 STOP 12 ENDOPTIONS IN EFFECT: LIST NOMAP NOXREF NOGOSTMT NODECK SOURCE TERM OBJECT FIXED TRMFLG SRCFLG NODDIM NORENT SDUMP(ISN) NOSXM NOVECTOR IL(DIM) NOTEST SC(*) NODC NOEC NOEMODE NOICA NODIRECTIVE NODBCS NOSAA NOPARALLEL NODYNAMIC NOSYM NOREORDER NOPC OPT(0) LANGLVL(77) NOFIPS FLAG(I) HALT(S) AUTODBL(NONE) PTRSIZE(8) LINECOUNT(60) CHARLEN(500) NAME(MAIN#) 1 SUBROUTINE DIVZEROSUB(DIVISOR, DIVIDEND) 2 INTEGER*4 DIVISOR 3 INTEGER*4 DIVIDEND(3) 4 PRINT *,'IN SUBROUTINE DIVZEROSUB' 5 DIVIDEND(1) = DIVIDEND(3) / DIVISOR 6 PRINT *,'END OF SUBROUTINE DIVZEROSUB' 7 RETURN 8 END
Figure 111. Fortran routine with a divide-by-zero error
Figure 112 on page 257 shows the Language Environment dump for routine DIVZERO.
256 z/OS: z/OS Language Environment Debugging Guide
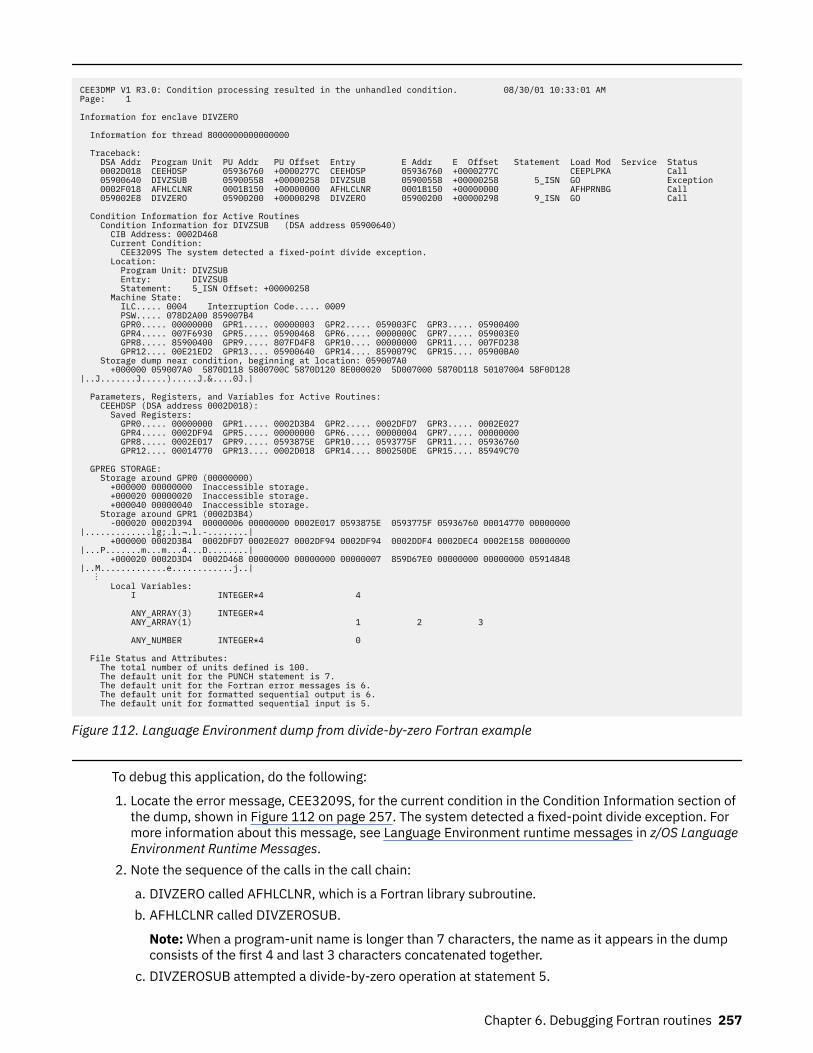
CEE3DMP V1 R3.0: Condition processing resulted in the unhandled condition. 08/30/01 10:33:01 AM Page: 1
Information for enclave DIVZERO
Information for thread 8000000000000000
Traceback: DSA Addr Program Unit PU Addr PU Offset Entry E Addr E Offset Statement Load Mod Service Status 0002D018 CEEHDSP 05936760 +0000277C CEEHDSP 05936760 +0000277C CEEPLPKA Call 05900640 DIVZSUB 05900558 +00000258 DIVZSUB 05900558 +00000258 5_ISN GO Exception 0002F018 AFHLCLNR 0001B150 +00000000 AFHLCLNR 0001B150 +00000000 AFHPRNBG Call 059002E8 DIVZERO 05900200 +00000298 DIVZERO 05900200 +00000298 9_ISN GO Call
Condition Information for Active Routines Condition Information for DIVZSUB (DSA address 05900640) CIB Address: 0002D468 Current Condition: CEE3209S The system detected a fixed-point divide exception. Location: Program Unit: DIVZSUB Entry: DIVZSUB Statement: 5_ISN Offset: +00000258 Machine State: ILC..... 0004 Interruption Code..... 0009 PSW..... 078D2A00 859007B4 GPR0..... 00000000 GPR1..... 00000003 GPR2..... 059003FC GPR3..... 05900400 GPR4..... 007F6930 GPR5..... 05900468 GPR6..... 0000000C GPR7..... 059003E0 GPR8..... 85900400 GPR9..... 807FD4F8 GPR10.... 00000000 GPR11.... 007FD238 GPR12.... 00E21ED2 GPR13.... 05900640 GPR14.... 8590079C GPR15.... 05900BA0 Storage dump near condition, beginning at location: 059007A0 +000000 059007A0 5870D118 5800700C 5870D120 8E000020 5D007000 5870D118 50107004 58F0D128 |..J.......J.....).....J.&....0J.|
Parameters, Registers, and Variables for Active Routines: CEEHDSP (DSA address 0002D018): Saved Registers: GPR0..... 00000000 GPR1..... 0002D3B4 GPR2..... 0002DFD7 GPR3..... 0002E027 GPR4..... 0002DF94 GPR5..... 00000000 GPR6..... 00000004 GPR7..... 00000000 GPR8..... 0002E017 GPR9..... 0593875E GPR10.... 0593775F GPR11.... 05936760 GPR12.... 00014770 GPR13.... 0002D018 GPR14.... 800250DE GPR15.... 85949C70
GPREG STORAGE: Storage around GPR0 (00000000) +000000 00000000 Inaccessible storage. +000020 00000020 Inaccessible storage. +000040 00000040 Inaccessible storage. Storage around GPR1 (0002D3B4) -000020 0002D394 00000006 00000000 0002E017 0593875E 0593775F 05936760 00014770 00000000 |.............lg;.l.¬.l.-........| +000000 0002D3B4 0002DFD7 0002E027 0002DF94 0002DF94 0002DDF4 0002DEC4 0002E158 00000000 |...P.......m...m...4...D........| +000020 0002D3D4 0002D468 00000000 00000000 00000007 859D67E0 00000000 00000000 05914848 |..M.............e............j..| ⋮ Local Variables: I INTEGER*4 4
ANY_ARRAY(3) INTEGER*4 ANY_ARRAY(1) 1 2 3
ANY_NUMBER INTEGER*4 0
File Status and Attributes: The total number of units defined is 100. The default unit for the PUNCH statement is 7. The default unit for the Fortran error messages is 6. The default unit for formatted sequential output is 6. The default unit for formatted sequential input is 5.
Figure 112. Language Environment dump from divide-by-zero Fortran example
To debug this application, do the following:
1. Locate the error message, CEE3209S, for the current condition in the Condition Information section ofthe dump, shown in Figure 112 on page 257. The system detected a fixed-point divide exception. Formore information about this message, see Language Environment runtime messages in z/OS LanguageEnvironment Runtime Messages.
2. Note the sequence of the calls in the call chain:
a. DIVZERO called AFHLCLNR, which is a Fortran library subroutine.b. AFHLCLNR called DIVZEROSUB.
Note: When a program-unit name is longer than 7 characters, the name as it appears in the dumpconsists of the first 4 and last 3 characters concatenated together.
c. DIVZEROSUB attempted a divide-by-zero operation at statement 5.
Chapter 6. Debugging Fortran routines 257
d. This resulted in a call to CEEHDSP, a Language Environment condition handling routine.3. Locate statement 5 in the Fortran listing for the DIVZEROSUB subroutine in Figure 112 on page 257.
This is an instruction to divide the contents of DIVIDEND(3) by DIVISOR.4. Since DIVISOR is a parameter of subroutine DIVZEROSUB, go to the Parameters section of the dump
shown in Figure 112 on page 257. The parameter DIVISOR shows a value of 0.5. Since DIVISOR contains the value passed to DIVZEROSUB, check its value. ANY_NUMBER is the actual
argument passed to DIVZEROSUB, and the dump and listing of DIVZERO indicate that ANY_NUMBERhad value 0 when passed to DIVZEROSUB, leading to the divide-by-zero exception.
258 z/OS: z/OS Language Environment Debugging Guide
Chapter 7. Debugging PL/I for MVS & VM routines
This section contains information that can help you debug applications that contain one or more PL/I forMVS & VM routines. Following a discussion about potential errors in PL/I for MVS & VM routines, the firsttopic discusses how to use compiler-generated listings to obtain information about PL/I for MVS & VMroutines, and how to use PLIDUMP to generate a Language Environment dump of a PL/I for MVS & VMroutine. The last part of this section provides examples of PL/I for MVS & VM routines and explains how todebug them using information contained in the traceback information provided in the dump.
Determining the source of errors in PL/I for MVS & VM routinesMost errors in PL/I for MVS & VM routines can be identified by the information provided in PL/I runtimemessages, which begin with the prefix IBM. For a list of these messages, see PL/I runtime messages inz/OS Language Environment Runtime Messages.
A malfunction in running a PL/I for MVS & VM routine can be caused by:
• Logic errors in the source routine• Invalid use of PL/I for MVS & VM• Unforeseen errors• Invalid input data• Compiler or runtime routine malfunction• System malfunction• Unidentified routine malfunction• Overlaid storage
Logic errors in the source routineErrors of this type are often difficult to detect because they often appear as compiler or librarymalfunctions. Some common errors in source routines are:
• Incorrect conversion from arithmetic data• Incorrect arithmetic and string manipulation operations• Unmatched data lists and format lists
Invalid use of PL/I for MVS & VMA misunderstanding of the language or a failure to provide the correct environment for using PL/I for MVS& VM can result in an apparent malfunction of a PL/I for MVS & VM routine. Any of the following, forexample, might cause a malfunction:
• Using uninitialized variables• Using controlled variables that have not been allocated• Reading records into incorrect structures• Misusing array subscripts• Misusing pointer variables• Incorrect conversion• Incorrect arithmetic operations• Incorrect string manipulation operations
© Copyright IBM Corp. 1991, 2020 259
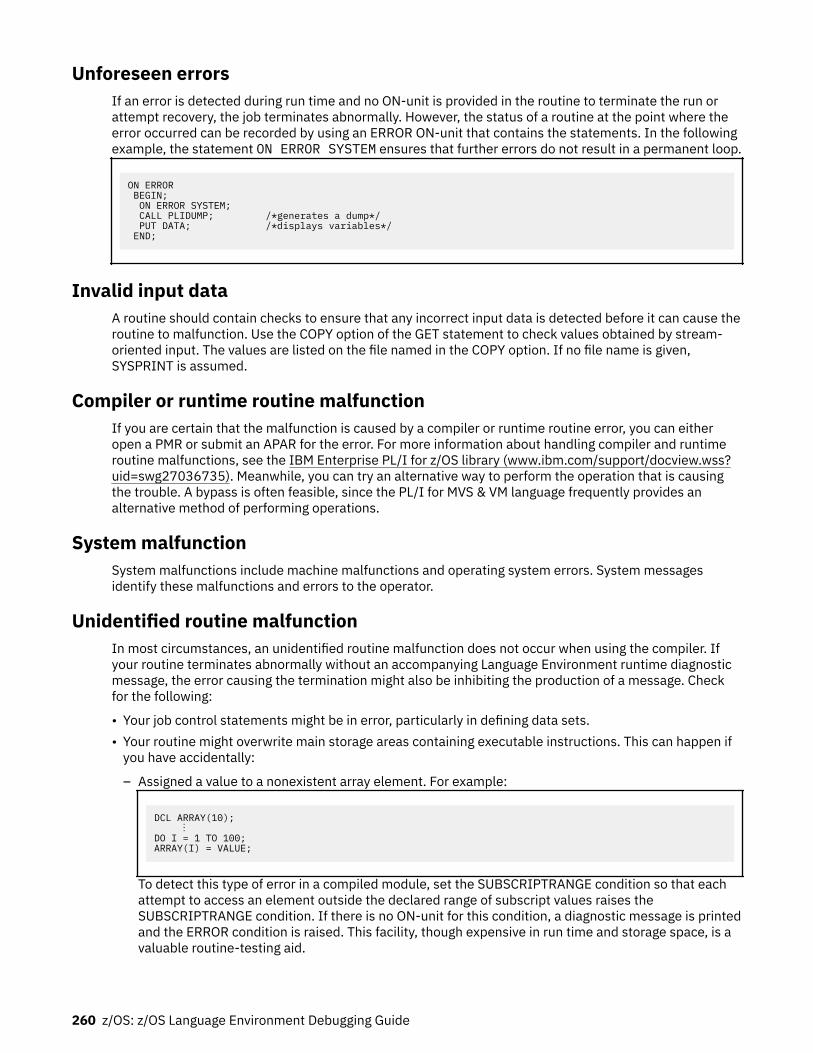
Unforeseen errorsIf an error is detected during run time and no ON-unit is provided in the routine to terminate the run orattempt recovery, the job terminates abnormally. However, the status of a routine at the point where theerror occurred can be recorded by using an ERROR ON-unit that contains the statements. In the followingexample, the statement ON ERROR SYSTEM ensures that further errors do not result in a permanent loop.
ON ERROR BEGIN; ON ERROR SYSTEM; CALL PLIDUMP; /*generates a dump*/ PUT DATA; /*displays variables*/ END;
Invalid input dataA routine should contain checks to ensure that any incorrect input data is detected before it can cause theroutine to malfunction. Use the COPY option of the GET statement to check values obtained by stream-oriented input. The values are listed on the file named in the COPY option. If no file name is given,SYSPRINT is assumed.
Compiler or runtime routine malfunctionIf you are certain that the malfunction is caused by a compiler or runtime routine error, you can eitheropen a PMR or submit an APAR for the error. For more information about handling compiler and runtimeroutine malfunctions, see the IBM Enterprise PL/I for z/OS library (www.ibm.com/support/docview.wss?uid=swg27036735). Meanwhile, you can try an alternative way to perform the operation that is causingthe trouble. A bypass is often feasible, since the PL/I for MVS & VM language frequently provides analternative method of performing operations.
System malfunctionSystem malfunctions include machine malfunctions and operating system errors. System messagesidentify these malfunctions and errors to the operator.
Unidentified routine malfunctionIn most circumstances, an unidentified routine malfunction does not occur when using the compiler. Ifyour routine terminates abnormally without an accompanying Language Environment runtime diagnosticmessage, the error causing the termination might also be inhibiting the production of a message. Checkfor the following:
• Your job control statements might be in error, particularly in defining data sets.• Your routine might overwrite main storage areas containing executable instructions. This can happen if
you have accidentally:
– Assigned a value to a nonexistent array element. For example:
DCL ARRAY(10); ⋮DO I = 1 TO 100;ARRAY(I) = VALUE;
To detect this type of error in a compiled module, set the SUBSCRIPTRANGE condition so that eachattempt to access an element outside the declared range of subscript values raises theSUBSCRIPTRANGE condition. If there is no ON-unit for this condition, a diagnostic message is printedand the ERROR condition is raised. This facility, though expensive in run time and storage space, is avaluable routine-testing aid.
260 z/OS: z/OS Language Environment Debugging Guide
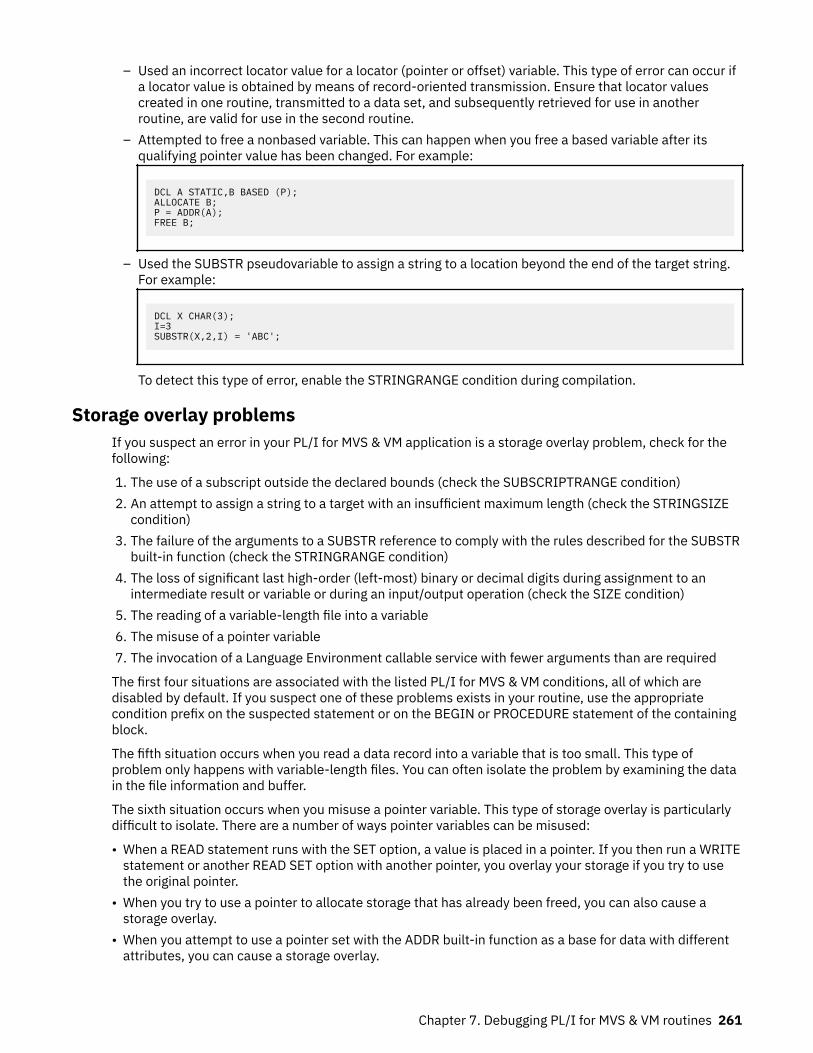
– Used an incorrect locator value for a locator (pointer or offset) variable. This type of error can occur ifa locator value is obtained by means of record-oriented transmission. Ensure that locator valuescreated in one routine, transmitted to a data set, and subsequently retrieved for use in anotherroutine, are valid for use in the second routine.
– Attempted to free a nonbased variable. This can happen when you free a based variable after itsqualifying pointer value has been changed. For example:
DCL A STATIC,B BASED (P);ALLOCATE B;P = ADDR(A);FREE B;
– Used the SUBSTR pseudovariable to assign a string to a location beyond the end of the target string.For example:
DCL X CHAR(3);I=3SUBSTR(X,2,I) = 'ABC';
To detect this type of error, enable the STRINGRANGE condition during compilation.
Storage overlay problemsIf you suspect an error in your PL/I for MVS & VM application is a storage overlay problem, check for thefollowing:
1. The use of a subscript outside the declared bounds (check the SUBSCRIPTRANGE condition) 2. An attempt to assign a string to a target with an insufficient maximum length (check the STRINGSIZE
condition)3. The failure of the arguments to a SUBSTR reference to comply with the rules described for the SUBSTR
built-in function (check the STRINGRANGE condition)4. The loss of significant last high-order (left-most) binary or decimal digits during assignment to an
intermediate result or variable or during an input/output operation (check the SIZE condition)5. The reading of a variable-length file into a variable6. The misuse of a pointer variable7. The invocation of a Language Environment callable service with fewer arguments than are required
The first four situations are associated with the listed PL/I for MVS & VM conditions, all of which aredisabled by default. If you suspect one of these problems exists in your routine, use the appropriatecondition prefix on the suspected statement or on the BEGIN or PROCEDURE statement of the containingblock.
The fifth situation occurs when you read a data record into a variable that is too small. This type ofproblem only happens with variable-length files. You can often isolate the problem by examining the datain the file information and buffer.
The sixth situation occurs when you misuse a pointer variable. This type of storage overlay is particularlydifficult to isolate. There are a number of ways pointer variables can be misused:
• When a READ statement runs with the SET option, a value is placed in a pointer. If you then run a WRITEstatement or another READ SET option with another pointer, you overlay your storage if you try to usethe original pointer.
• When you try to use a pointer to allocate storage that has already been freed, you can also cause astorage overlay.
• When you attempt to use a pointer set with the ADDR built-in function as a base for data with differentattributes, you can cause a storage overlay.
Chapter 7. Debugging PL/I for MVS & VM routines 261
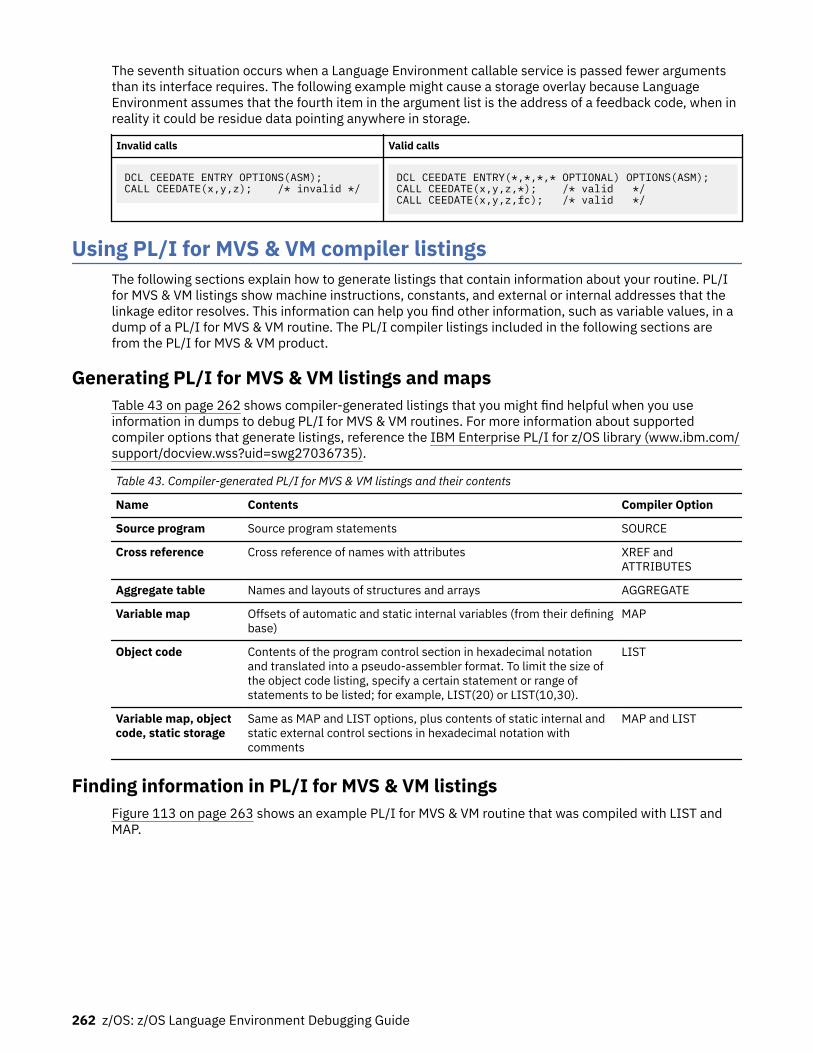
The seventh situation occurs when a Language Environment callable service is passed fewer argumentsthan its interface requires. The following example might cause a storage overlay because LanguageEnvironment assumes that the fourth item in the argument list is the address of a feedback code, when inreality it could be residue data pointing anywhere in storage.
Invalid calls Valid calls
DCL CEEDATE ENTRY OPTIONS(ASM);CALL CEEDATE(x,y,z); /* invalid */
DCL CEEDATE ENTRY(*,*,*,* OPTIONAL) OPTIONS(ASM);CALL CEEDATE(x,y,z,*); /* valid */CALL CEEDATE(x,y,z,fc); /* valid */
Using PL/I for MVS & VM compiler listingsThe following sections explain how to generate listings that contain information about your routine. PL/Ifor MVS & VM listings show machine instructions, constants, and external or internal addresses that thelinkage editor resolves. This information can help you find other information, such as variable values, in adump of a PL/I for MVS & VM routine. The PL/I compiler listings included in the following sections arefrom the PL/I for MVS & VM product.
Generating PL/I for MVS & VM listings and mapsTable 43 on page 262 shows compiler-generated listings that you might find helpful when you useinformation in dumps to debug PL/I for MVS & VM routines. For more information about supportedcompiler options that generate listings, reference the IBM Enterprise PL/I for z/OS library (www.ibm.com/support/docview.wss?uid=swg27036735).
Table 43. Compiler-generated PL/I for MVS & VM listings and their contents
Name Contents Compiler Option
Source program Source program statements SOURCE
Cross reference Cross reference of names with attributes XREF andATTRIBUTES
Aggregate table Names and layouts of structures and arrays AGGREGATE
Variable map Offsets of automatic and static internal variables (from their definingbase)
MAP
Object code Contents of the program control section in hexadecimal notationand translated into a pseudo-assembler format. To limit the size ofthe object code listing, specify a certain statement or range ofstatements to be listed; for example, LIST(20) or LIST(10,30).
LIST
Variable map, objectcode, static storage
Same as MAP and LIST options, plus contents of static internal andstatic external control sections in hexadecimal notation withcomments
MAP and LIST
Finding information in PL/I for MVS & VM listingsFigure 113 on page 263 shows an example PL/I for MVS & VM routine that was compiled with LIST andMAP.
262 z/OS: z/OS Language Environment Debugging Guide
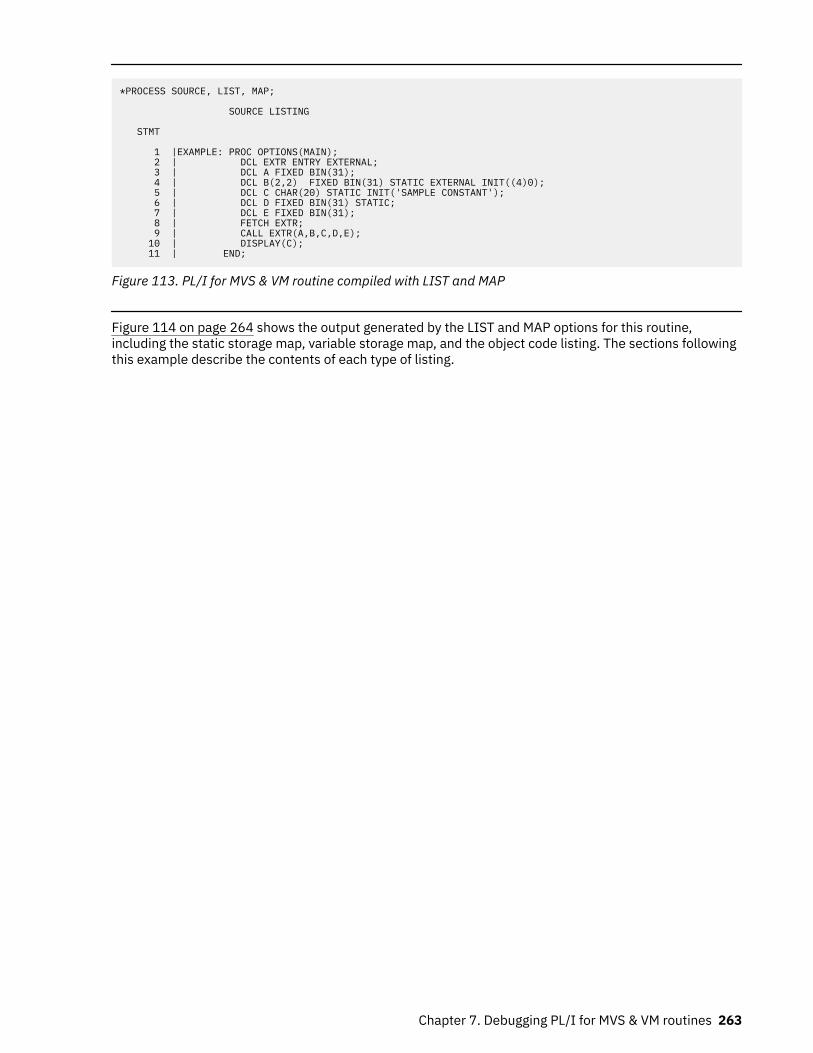
*PROCESS SOURCE, LIST, MAP;
SOURCE LISTING
STMT
1 |EXAMPLE: PROC OPTIONS(MAIN); 2 | DCL EXTR ENTRY EXTERNAL; 3 | DCL A FIXED BIN(31); 4 | DCL B(2,2) FIXED BIN(31) STATIC EXTERNAL INIT((4)0); 5 | DCL C CHAR(20) STATIC INIT('SAMPLE CONSTANT'); 6 | DCL D FIXED BIN(31) STATIC; 7 | DCL E FIXED BIN(31); 8 | FETCH EXTR; 9 | CALL EXTR(A,B,C,D,E); 10 | DISPLAY(C); 11 | END;
Figure 113. PL/I for MVS & VM routine compiled with LIST and MAP
Figure 114 on page 264 shows the output generated by the LIST and MAP options for this routine,including the static storage map, variable storage map, and the object code listing. The sections followingthis example describe the contents of each type of listing.
Chapter 7. Debugging PL/I for MVS & VM routines 263
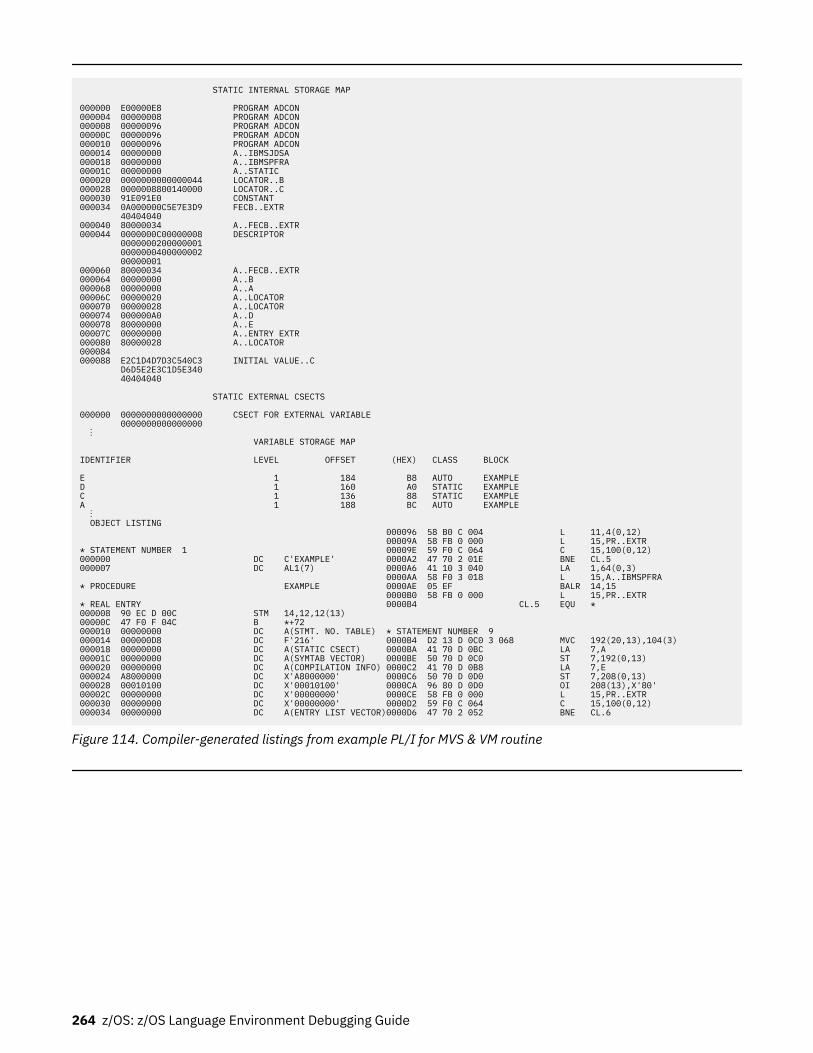
STATIC INTERNAL STORAGE MAP
000000 E00000E8 PROGRAM ADCON000004 00000008 PROGRAM ADCON000008 00000096 PROGRAM ADCON00000C 00000096 PROGRAM ADCON000010 00000096 PROGRAM ADCON000014 00000000 A..IBMSJDSA000018 00000000 A..IBMSPFRA00001C 00000000 A..STATIC000020 0000000000000044 LOCATOR..B000028 0000008800140000 LOCATOR..C000030 91E091E0 CONSTANT000034 0A000000C5E7E3D9 FECB..EXTR 40404040000040 80000034 A..FECB..EXTR000044 0000000C00000008 DESCRIPTOR 0000000200000001 0000000400000002 00000001000060 80000034 A..FECB..EXTR000064 00000000 A..B000068 00000000 A..A00006C 00000020 A..LOCATOR000070 00000028 A..LOCATOR000074 000000A0 A..D000078 80000000 A..E00007C 00000000 A..ENTRY EXTR000080 80000028 A..LOCATOR000084000088 E2C1D4D7D3C540C3 INITIAL VALUE..C D6D5E2E3C1D5E340 40404040
STATIC EXTERNAL CSECTS
000000 0000000000000000 CSECT FOR EXTERNAL VARIABLE 0000000000000000 ⋮ VARIABLE STORAGE MAP
IDENTIFIER LEVEL OFFSET (HEX) CLASS BLOCK
E 1 184 B8 AUTO EXAMPLED 1 160 A0 STATIC EXAMPLEC 1 136 88 STATIC EXAMPLEA 1 188 BC AUTO EXAMPLE ⋮ OBJECT LISTING 000096 58 B0 C 004 L 11,4(0,12) 00009A 58 FB 0 000 L 15,PR..EXTR* STATEMENT NUMBER 1 00009E 59 F0 C 064 C 15,100(0,12)000000 DC C'EXAMPLE' 0000A2 47 70 2 01E BNE CL.5000007 DC AL1(7) 0000A6 41 10 3 040 LA 1,64(0,3) 0000AA 58 F0 3 018 L 15,A..IBMSPFRA* PROCEDURE EXAMPLE 0000AE 05 EF BALR 14,15 0000B0 58 FB 0 000 L 15,PR..EXTR* REAL ENTRY 0000B4 CL.5 EQU *000008 90 EC D 00C STM 14,12,12(13)00000C 47 F0 F 04C B *+72000010 00000000 DC A(STMT. NO. TABLE) * STATEMENT NUMBER 9000014 000000D8 DC F'216' 0000B4 D2 13 D 0C0 3 068 MVC 192(20,13),104(3)000018 00000000 DC A(STATIC CSECT) 0000BA 41 70 D 0BC LA 7,A00001C 00000000 DC A(SYMTAB VECTOR) 0000BE 50 70 D 0C0 ST 7,192(0,13)000020 00000000 DC A(COMPILATION INFO) 0000C2 41 70 D 0B8 LA 7,E000024 A8000000 DC X'A8000000' 0000C6 50 70 D 0D0 ST 7,208(0,13)000028 00010100 DC X'00010100' 0000CA 96 80 D 0D0 OI 208(13),X'80'00002C 00000000 DC X'00000000' 0000CE 58 FB 0 000 L 15,PR..EXTR000030 00000000 DC X'00000000' 0000D2 59 F0 C 064 C 15,100(0,12)000034 00000000 DC A(ENTRY LIST VECTOR)0000D6 47 70 2 052 BNE CL.6
Figure 114. Compiler-generated listings from example PL/I for MVS & VM routine
264 z/OS: z/OS Language Environment Debugging Guide
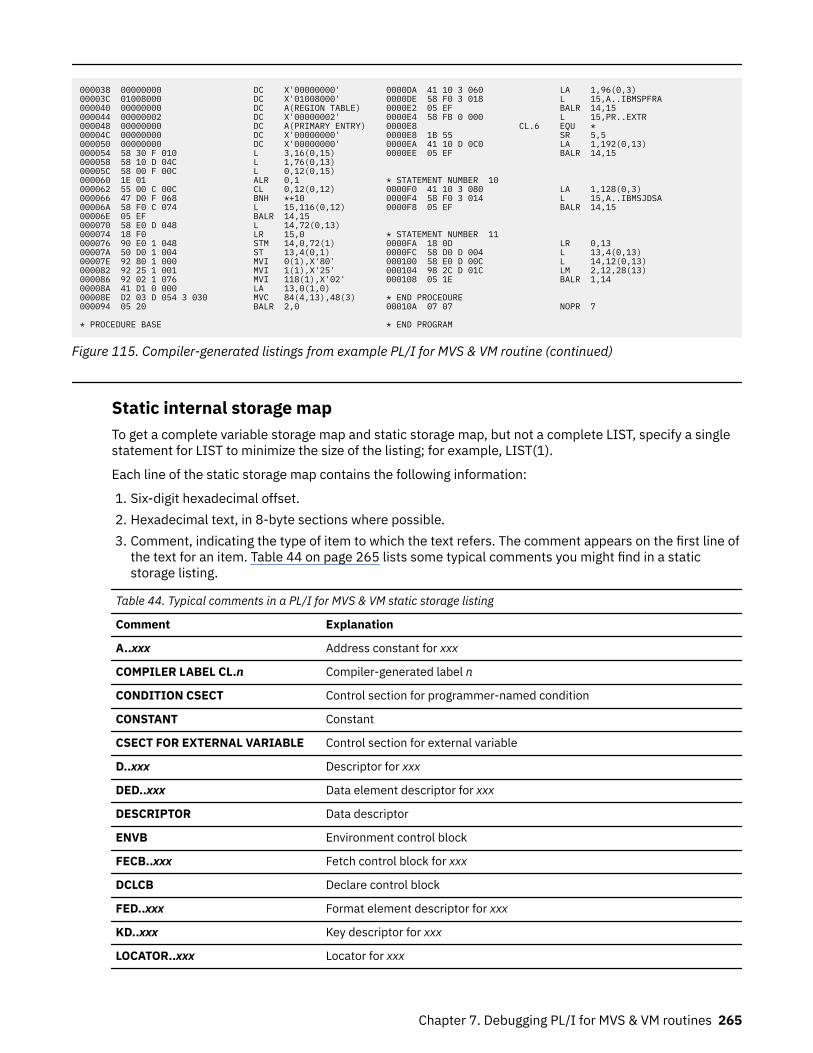
000038 00000000 DC X'00000000' 0000DA 41 10 3 060 LA 1,96(0,3)00003C 01008000 DC X'01008000' 0000DE 58 F0 3 018 L 15,A..IBMSPFRA000040 00000000 DC A(REGION TABLE) 0000E2 05 EF BALR 14,15000044 00000002 DC X'00000002' 0000E4 58 FB 0 000 L 15,PR..EXTR000048 00000000 DC A(PRIMARY ENTRY) 0000E8 CL.6 EQU *00004C 00000000 DC X'00000000' 0000E8 1B 55 SR 5,5000050 00000000 DC X'00000000' 0000EA 41 10 D 0C0 LA 1,192(0,13)000054 58 30 F 010 L 3,16(0,15) 0000EE 05 EF BALR 14,15000058 58 10 D 04C L 1,76(0,13)00005C 58 00 F 00C L 0,12(0,15)000060 1E 01 ALR 0,1 * STATEMENT NUMBER 10000062 55 00 C 00C CL 0,12(0,12) 0000F0 41 10 3 080 LA 1,128(0,3)000066 47 D0 F 068 BNH *+10 0000F4 58 F0 3 014 L 15,A..IBMSJDSA00006A 58 F0 C 074 L 15,116(0,12) 0000F8 05 EF BALR 14,1500006E 05 EF BALR 14,15000070 58 E0 D 048 L 14,72(0,13)000074 18 F0 LR 15,0 * STATEMENT NUMBER 11000076 90 E0 1 048 STM 14,0,72(1) 0000FA 18 0D LR 0,1300007A 50 D0 1 004 ST 13,4(0,1) 0000FC 58 D0 D 004 L 13,4(0,13)00007E 92 80 1 000 MVI 0(1),X'80' 000100 58 E0 D 00C L 14,12(0,13)000082 92 25 1 001 MVI 1(1),X'25' 000104 98 2C D 01C LM 2,12,28(13)000086 92 02 1 076 MVI 118(1),X'02' 000108 05 1E BALR 1,1400008A 41 D1 0 000 LA 13,0(1,0)00008E D2 03 D 054 3 030 MVC 84(4,13),48(3) * END PROCEDURE000094 05 20 BALR 2,0 00010A 07 07 NOPR 7
* PROCEDURE BASE * END PROGRAM
Figure 115. Compiler-generated listings from example PL/I for MVS & VM routine (continued)
Static internal storage mapTo get a complete variable storage map and static storage map, but not a complete LIST, specify a singlestatement for LIST to minimize the size of the listing; for example, LIST(1).
Each line of the static storage map contains the following information:
1. Six-digit hexadecimal offset.2. Hexadecimal text, in 8-byte sections where possible.3. Comment, indicating the type of item to which the text refers. The comment appears on the first line of
the text for an item. Table 44 on page 265 lists some typical comments you might find in a staticstorage listing.
Table 44. Typical comments in a PL/I for MVS & VM static storage listing
Comment Explanation
A..xxx Address constant for xxx
COMPILER LABEL CL.n Compiler-generated label n
CONDITION CSECT Control section for programmer-named condition
CONSTANT Constant
CSECT FOR EXTERNAL VARIABLE Control section for external variable
D..xxx Descriptor for xxx
DED..xxx Data element descriptor for xxx
DESCRIPTOR Data descriptor
ENVB Environment control block
FECB..xxx Fetch control block for xxx
DCLCB Declare control block
FED..xxx Format element descriptor for xxx
KD..xxx Key descriptor for xxx
LOCATOR..xxx Locator for xxx
Chapter 7. Debugging PL/I for MVS & VM routines 265
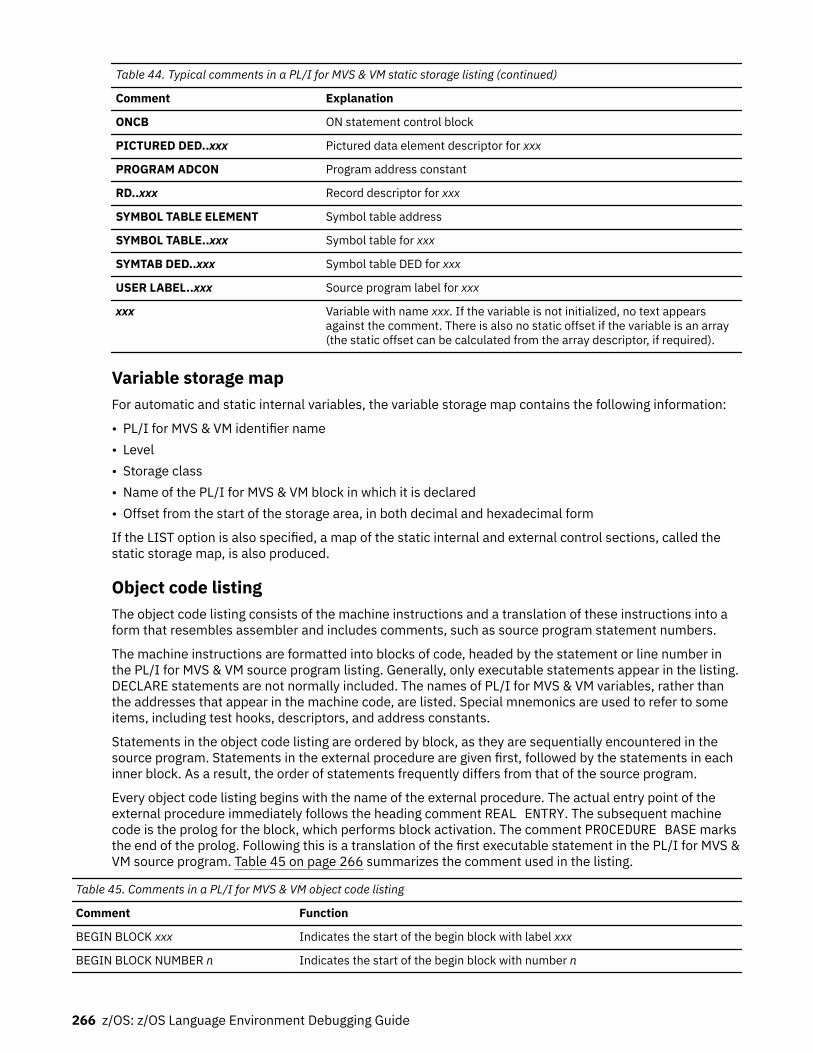
Table 44. Typical comments in a PL/I for MVS & VM static storage listing (continued)
Comment Explanation
ONCB ON statement control block
PICTURED DED..xxx Pictured data element descriptor for xxx
PROGRAM ADCON Program address constant
RD..xxx Record descriptor for xxx
SYMBOL TABLE ELEMENT Symbol table address
SYMBOL TABLE..xxx Symbol table for xxx
SYMTAB DED..xxx Symbol table DED for xxx
USER LABEL..xxx Source program label for xxx
xxx Variable with name xxx. If the variable is not initialized, no text appearsagainst the comment. There is also no static offset if the variable is an array(the static offset can be calculated from the array descriptor, if required).
Variable storage mapFor automatic and static internal variables, the variable storage map contains the following information:
• PL/I for MVS & VM identifier name• Level• Storage class• Name of the PL/I for MVS & VM block in which it is declared• Offset from the start of the storage area, in both decimal and hexadecimal form
If the LIST option is also specified, a map of the static internal and external control sections, called thestatic storage map, is also produced.
Object code listingThe object code listing consists of the machine instructions and a translation of these instructions into aform that resembles assembler and includes comments, such as source program statement numbers.
The machine instructions are formatted into blocks of code, headed by the statement or line number inthe PL/I for MVS & VM source program listing. Generally, only executable statements appear in the listing.DECLARE statements are not normally included. The names of PL/I for MVS & VM variables, rather thanthe addresses that appear in the machine code, are listed. Special mnemonics are used to refer to someitems, including test hooks, descriptors, and address constants.
Statements in the object code listing are ordered by block, as they are sequentially encountered in thesource program. Statements in the external procedure are given first, followed by the statements in eachinner block. As a result, the order of statements frequently differs from that of the source program.
Every object code listing begins with the name of the external procedure. The actual entry point of theexternal procedure immediately follows the heading comment REAL ENTRY. The subsequent machinecode is the prolog for the block, which performs block activation. The comment PROCEDURE BASE marksthe end of the prolog. Following this is a translation of the first executable statement in the PL/I for MVS &VM source program. Table 45 on page 266 summarizes the comment used in the listing.
Table 45. Comments in a PL/I for MVS & VM object code listing
Comment Function
BEGIN BLOCK xxx Indicates the start of the begin block with label xxx
BEGIN BLOCK NUMBER n Indicates the start of the begin block with number n
266 z/OS: z/OS Language Environment Debugging Guide
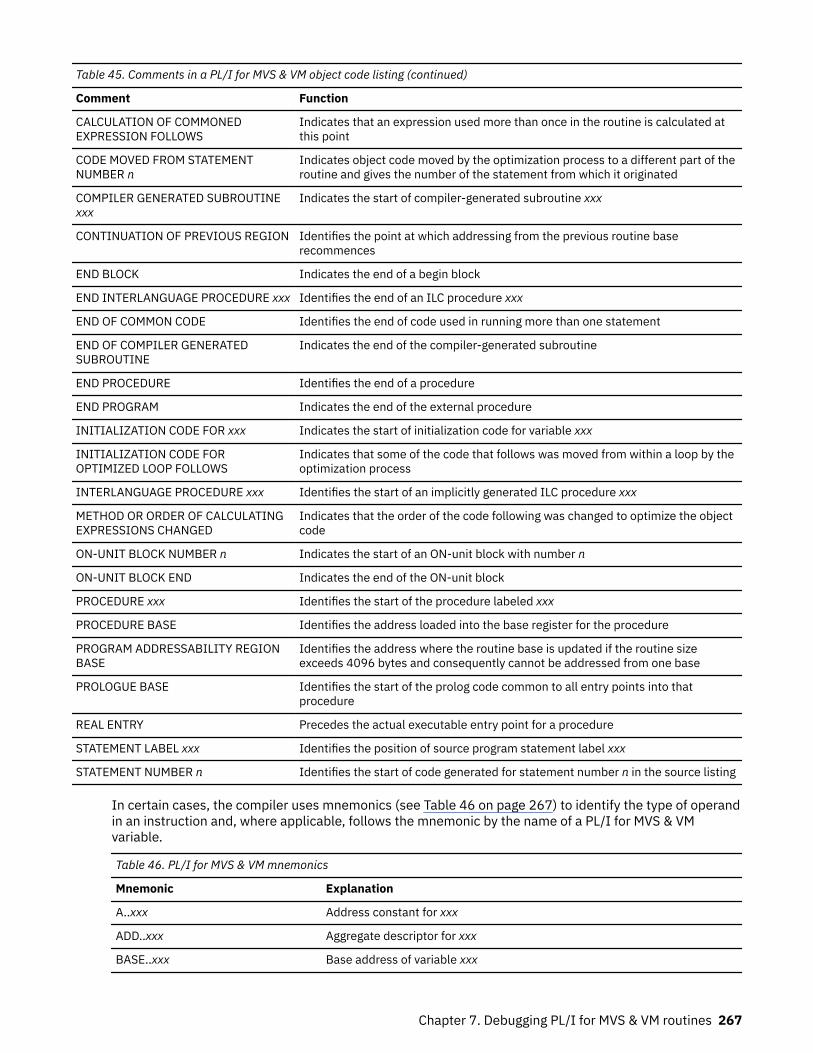
Table 45. Comments in a PL/I for MVS & VM object code listing (continued)
Comment Function
CALCULATION OF COMMONEDEXPRESSION FOLLOWS
Indicates that an expression used more than once in the routine is calculated atthis point
CODE MOVED FROM STATEMENTNUMBER n
Indicates object code moved by the optimization process to a different part of theroutine and gives the number of the statement from which it originated
COMPILER GENERATED SUBROUTINExxx
Indicates the start of compiler-generated subroutine xxx
CONTINUATION OF PREVIOUS REGION Identifies the point at which addressing from the previous routine baserecommences
END BLOCK Indicates the end of a begin block
END INTERLANGUAGE PROCEDURE xxx Identifies the end of an ILC procedure xxx
END OF COMMON CODE Identifies the end of code used in running more than one statement
END OF COMPILER GENERATEDSUBROUTINE
Indicates the end of the compiler-generated subroutine
END PROCEDURE Identifies the end of a procedure
END PROGRAM Indicates the end of the external procedure
INITIALIZATION CODE FOR xxx Indicates the start of initialization code for variable xxx
INITIALIZATION CODE FOROPTIMIZED LOOP FOLLOWS
Indicates that some of the code that follows was moved from within a loop by theoptimization process
INTERLANGUAGE PROCEDURE xxx Identifies the start of an implicitly generated ILC procedure xxx
METHOD OR ORDER OF CALCULATINGEXPRESSIONS CHANGED
Indicates that the order of the code following was changed to optimize the objectcode
ON-UNIT BLOCK NUMBER n Indicates the start of an ON-unit block with number n
ON-UNIT BLOCK END Indicates the end of the ON-unit block
PROCEDURE xxx Identifies the start of the procedure labeled xxx
PROCEDURE BASE Identifies the address loaded into the base register for the procedure
PROGRAM ADDRESSABILITY REGIONBASE
Identifies the address where the routine base is updated if the routine sizeexceeds 4096 bytes and consequently cannot be addressed from one base
PROLOGUE BASE Identifies the start of the prolog code common to all entry points into thatprocedure
REAL ENTRY Precedes the actual executable entry point for a procedure
STATEMENT LABEL xxx Identifies the position of source program statement label xxx
STATEMENT NUMBER n Identifies the start of code generated for statement number n in the source listing
In certain cases, the compiler uses mnemonics (see Table 46 on page 267) to identify the type of operandin an instruction and, where applicable, follows the mnemonic by the name of a PL/I for MVS & VMvariable.
Table 46. PL/I for MVS & VM mnemonics
Mnemonic Explanation
A..xxx Address constant for xxx
ADD..xxx Aggregate descriptor for xxx
BASE..xxx Base address of variable xxx
Chapter 7. Debugging PL/I for MVS & VM routines 267
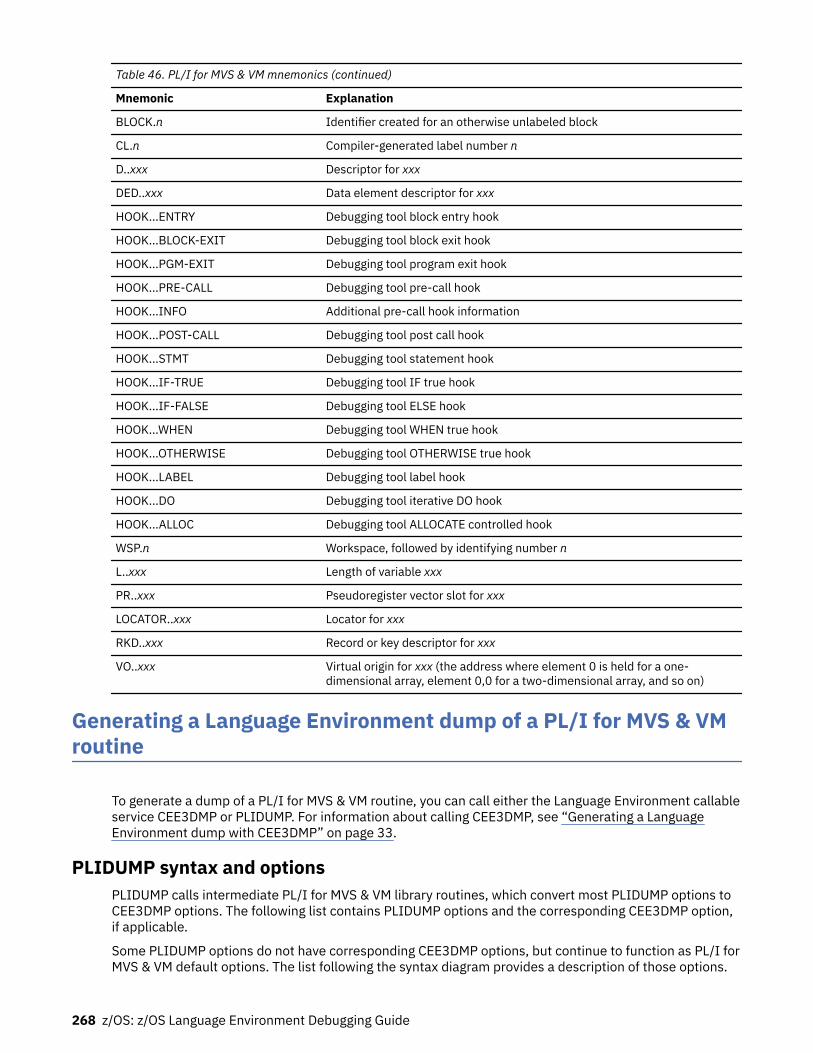
Table 46. PL/I for MVS & VM mnemonics (continued)
Mnemonic Explanation
BLOCK.n Identifier created for an otherwise unlabeled block
CL.n Compiler-generated label number n
D..xxx Descriptor for xxx
DED..xxx Data element descriptor for xxx
HOOK...ENTRY Debugging tool block entry hook
HOOK...BLOCK-EXIT Debugging tool block exit hook
HOOK...PGM-EXIT Debugging tool program exit hook
HOOK...PRE-CALL Debugging tool pre-call hook
HOOK...INFO Additional pre-call hook information
HOOK...POST-CALL Debugging tool post call hook
HOOK...STMT Debugging tool statement hook
HOOK...IF-TRUE Debugging tool IF true hook
HOOK...IF-FALSE Debugging tool ELSE hook
HOOK...WHEN Debugging tool WHEN true hook
HOOK...OTHERWISE Debugging tool OTHERWISE true hook
HOOK...LABEL Debugging tool label hook
HOOK...DO Debugging tool iterative DO hook
HOOK...ALLOC Debugging tool ALLOCATE controlled hook
WSP.n Workspace, followed by identifying number n
L..xxx Length of variable xxx
PR..xxx Pseudoregister vector slot for xxx
LOCATOR..xxx Locator for xxx
RKD..xxx Record or key descriptor for xxx
VO..xxx Virtual origin for xxx (the address where element 0 is held for a one-dimensional array, element 0,0 for a two-dimensional array, and so on)
Generating a Language Environment dump of a PL/I for MVS & VMroutine
To generate a dump of a PL/I for MVS & VM routine, you can call either the Language Environment callableservice CEE3DMP or PLIDUMP. For information about calling CEE3DMP, see “Generating a LanguageEnvironment dump with CEE3DMP” on page 33.
PLIDUMP syntax and optionsPLIDUMP calls intermediate PL/I for MVS & VM library routines, which convert most PLIDUMP options toCEE3DMP options. The following list contains PLIDUMP options and the corresponding CEE3DMP option,if applicable.
Some PLIDUMP options do not have corresponding CEE3DMP options, but continue to function as PL/I forMVS & VM default options. The list following the syntax diagram provides a description of those options.
268 z/OS: z/OS Language Environment Debugging Guide
PLIDUMP now conforms to National Language Support standards.
PLIDUMP can supply information across multiple Language Environment enclaves. If an applicationrunning in one enclave fetches a main procedure (an action that creates another enclave), PLIDUMPcontains information about both procedures.
The syntax and options for PLIDUMP are shown below.
PLIDUMP ( char.-string-exp 1 , char.-string-exp 2 )
char.-string-exp 1A dump options character string consisting of one or more of the following values. T, F, C, and A arethe default options.A
All. Results in a dump of all tasks including the ones in the WAIT state.B
BLOCKS (PL/I for MVS & VM hexadecimal dump). Dumps the control blocks used in LanguageEnvironment and member language libraries. For PL/I for MVS & VM, this includes the DSA forevery routine on the call chain and PL/I for MVS & VM "global" control blocks, such as TaskingImplementation Appendage (TIA), Task Communication Area (TCA), and the PL/I Tasking ControlBlock (PTCB). PL/I file control blocks and file buffers are also dumped if the F option is specified.
CContinue. The routine continues after the dump.
EExit. The enclave terminates after the dump. In a multitasking environment, if PLIDUMP is calledfrom the main task, the enclave terminates after the dump. If PLIDUMP is called from a subtask,the subtask and any subsequent tasks created from the subtask terminate after the dump. In amultithreaded environment, if PLIDUMP is called from the Initial Process Thread (IPT), theenclave terminates after the dump. If PLIDUMP is called from a non-IPT, only the non-IPTterminates after the dump.
FFILE INFORMATION. A set of attributes for all open files is given. The contents of the file buffersare displayed if the B option is specified.
HSTORAGE in hexadecimal. A SNAP dump of the region is produced. A ddname of CEESNAP mustbe provided to direct the CEESNAP dump report.
KBLOCKS (when running under CICS). The Transaction Work Area is included.
Note: This option is not supported under Enterprise PL/I.
NBNOBLOCKS.
NFNOFILES.
NHNOSTORAGE.
NKNOBLOCKS (when running under CICS).
NTNOTRACEBACK.
OTHREAD(CURRENT). Results in a dump of only the current task or current thread (the invoker ofPLIDUMP).
Chapter 7. Debugging PL/I for MVS & VM routines 269
SStop. The enclave terminates after the dump. In a multitasking environment, regardless ofwhether PLIDUMP is called from the main task or a subtask, the enclave terminates after thedump. In a multithreaded environment, regardless of whether PLIDUMP is called from the IPT or anon-IPT, the enclave terminates after the dump (in which case there is no fixed order as to whichthread terminates first).
TTRACEBACK. Includes a traceback of all routines on the call chain. The traceback shows transfersof control from either calls or exceptions. BEGIN blocks and ON-units are also control transfersand are included in the trace. The traceback extends backwards to the main program of thecurrent thread.
char.-string-exp 2A user-identified character string up to 80 characters long that is printed as the dump header.
PLIDUMP usage notesIf you use PLIDUMP, the following considerations apply:
• If a routine calls PLIDUMP a number of times, use a unique user-identifier for each PLIDUMP invocation.This simplifies identifying the beginning of each dump.
• In MVS or TSO, you can use ddnames of CEEDUMP, PLIDUMP, or PL1DUMP to direct dump output. If noddname is specified, CEEDUMP is used.
• The data set defined by the PLIDUMP, PL1DUMP, or CEEDUMP DD statement should specify a logicalrecord length (LRECL) of at least 131 to prevent dump records from wrapping.
• When you specify the H option in a call to PLIDUMP, the PL/I for MVS & VM library issues an OS SNAPmacro to obtain a dump of virtual storage. The first invocation of PLIDUMP results in a SNAP identifier of0. For each successive invocation, the ID is increased by one to a maximum of 256, after which the ID isreset to 0.
• Support for SNAP dumps using PLIDUMP is provided only under MVS. SNAP dumps are not produced ina CICS environment.
– If the SNAP does not succeed, the CEE3DMP DUMP file displays the message:
Snap was unsuccessful
Failure to define a CEESNAP data set is the most likely cause of an unsuccessful CEESNAP.– If the SNAP is successful, CEE3DMP displays the message:
Snap was successful; snap ID = nnn
where nnn corresponds to the SNAP identifier described above. An unsuccessful SNAP does notresult in an incrementation of the identifier.
• To ensure portability across system platforms, use PLIDUMP to generate a dump of your PL/I for MVS &VM routine.
Finding PL/I for MVS & VM information in a dumpThe following sections discuss PL/I-specific information located in the following sections of a LanguageEnvironment dump:
• Traceback• Control Blocks for Active Routines• Control Block Associated with the Thread• File Status and Attributes
270 z/OS: z/OS Language Environment Debugging Guide
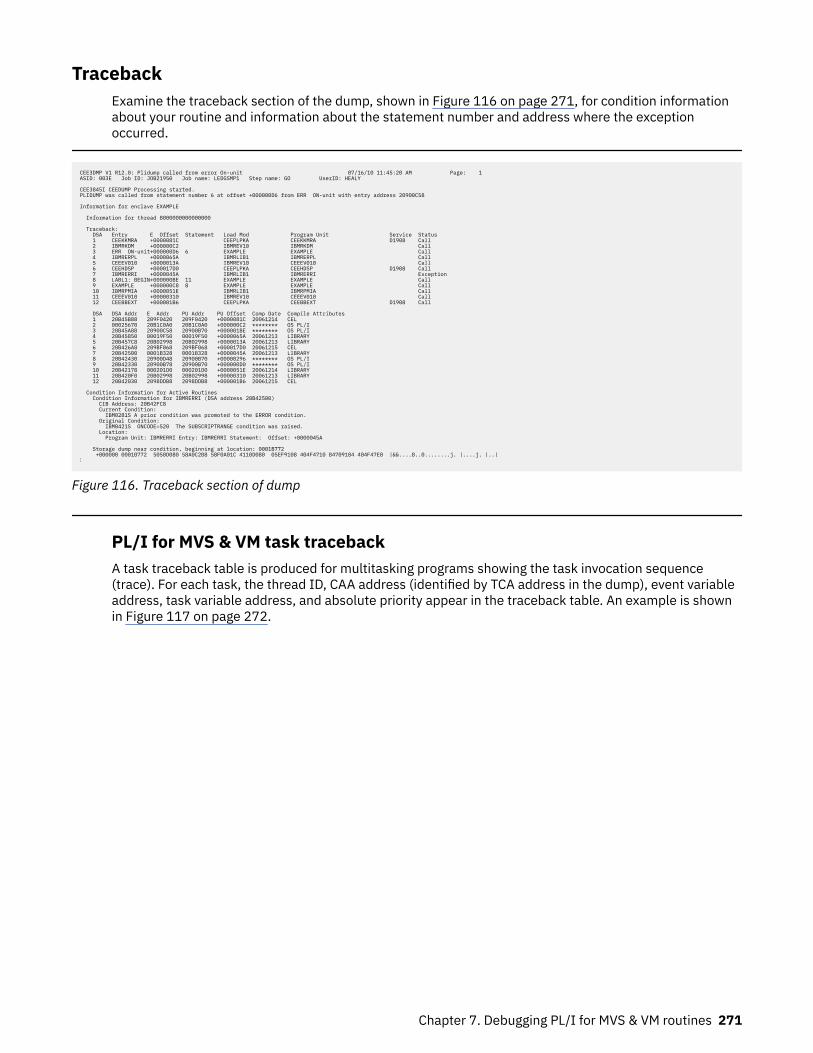
TracebackExamine the traceback section of the dump, shown in Figure 116 on page 271, for condition informationabout your routine and information about the statement number and address where the exceptionoccurred.
CEE3DMP V1 R12.0: Plidump called from error On-unit 07/16/10 11:45:20 AM Page: 1 ASID: 003E Job ID: JOB21950 Job name: LEDGSMP1 Step name: GO UserID: HEALY CEE3845I CEEDUMP Processing started. PLIDUMP was called from statement number 6 at offset +000000D6 from ERR ON-unit with entry address 20900C58 Information for enclave EXAMPLE Information for thread 8000000000000000 Traceback: DSA Entry E Offset Statement Load Mod Program Unit Service Status 1 CEEKKMRA +0000081C CEEPLPKA CEEKKMRA D1908 Call 2 IBMRKDM +000000C2 IBMREV10 IBMRKDM Call 3 ERR ON-unit+000000D6 6 EXAMPLE EXAMPLE Call 4 IBMRERPL +0000065A IBMRLIB1 IBMRERPL Call 5 CEEEV010 +0000013A IBMREV10 CEEEV010 Call 6 CEEHDSP +000017D0 CEEPLPKA CEEHDSP D1908 Call 7 IBMRERRI +0000045A IBMRLIB1 IBMRERRI Exception 8 LABL1: BEGIN+000000BE 11 EXAMPLE EXAMPLE Call 9 EXAMPLE +000000C8 8 EXAMPLE EXAMPLE Call 10 IBMRPMIA +0000051E IBMRLIB1 IBMRPMIA Call 11 CEEEV010 +00000310 IBMREV10 CEEEV010 Call 12 CEEBBEXT +000001B6 CEEPLPKA CEEBBEXT D1908 Call DSA DSA Addr E Addr PU Addr PU Offset Comp Date Compile Attributes 1 20B45B88 209F0420 209F0420 +0000081C 20061214 CEL 2 00025670 20B1C0A0 20B1C0A0 +000000C2 ******** OS PL/I 3 20B45A88 20900C58 20900B70 +000001BE ******** OS PL/I 4 20B45850 00019F50 00019F50 +0000065A 20061213 LIBRARY 5 20B457C8 20B02998 20B02998 +0000013A 20061213 LIBRARY 6 20B426A8 209BF068 209BF068 +000017D0 20061215 CEL 7 20B42500 0001B328 0001B328 +0000045A 20061213 LIBRARY 8 20B42430 20900D48 20900B70 +00000296 ******** OS PL/I 9 20B42330 20900B78 20900B70 +000000D0 ******** OS PL/I 10 20B42178 000201D0 000201D0 +0000051E 20061214 LIBRARY 11 20B420F0 20B02998 20B02998 +00000310 20061213 LIBRARY 12 20B42030 2098DDB8 2098DDB8 +000001B6 20061215 CEL Condition Information for Active Routines Condition Information for IBMRERRI (DSA address 20B42500) CIB Address: 20B42FC8 Current Condition: IBM0281S A prior condition was promoted to the ERROR condition. Original Condition: IBM0421S ONCODE=520 The SUBSCRIPTRANGE condition was raised. Location: Program Unit: IBMRERRI Entry: IBMRERRI Statement: Offset: +0000045A Storage dump near condition, beginning at location: 0001B772 +000000 0001B772 5050D080 58A0C2B8 58F0A01C 4110D080 05EF9108 404F4710 B4709104 404F47E0 |&&....B..0........j. |....j. |..|⋮
Figure 116. Traceback section of dump
PL/I for MVS & VM task tracebackA task traceback table is produced for multitasking programs showing the task invocation sequence(trace). For each task, the thread ID, CAA address (identified by TCA address in the dump), event variableaddress, task variable address, and absolute priority appear in the traceback table. An example is shownin Figure 117 on page 272.
Chapter 7. Debugging PL/I for MVS & VM routines 271
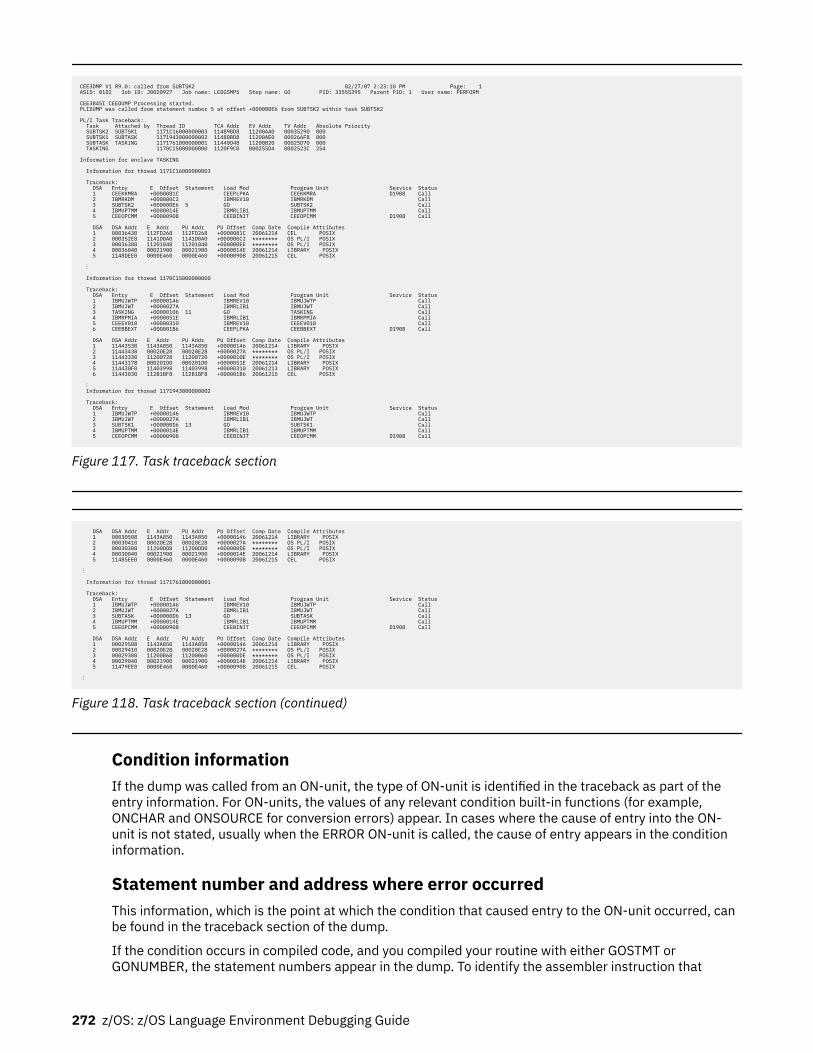
CEE3DMP V1 R9.0: called from SUBTSK2 02/27/07 2:23:10 PM Page: 1 ASID: 01D2 Job ID: J0020927 Job name: LEDGSMP5 Step name: GO PID: 33555395 Parent PID: 1 User name: PERFORM CEE3845I CEEDUMP Processing started. PLIDUMP was called from statement number 5 at offset +000000E6 from SUBTSK2 within task SUBTSK2 PL/I Task Traceback: Task Attached by Thread ID TCA Addr EV Addr TV Addr Absolute Priority SUBTSK2 SUBTSK1 1171C16000000003 11489BD8 11200AA0 00035290 000 SUBTSK1 SUBTASK 1171943000000002 11480BD8 11200AE0 000266F8 000 SUBTASK TASKING 1171761000000001 11440D48 11200B20 00025D70 000 TASKING 1170C15000000000 1120F9C0 000255D4 0002523C 254 Information for enclave TASKING Information for thread 1171C16000000003 Traceback: DSA Entry E Offset Statement Load Mod Program Unit Service Status 1 CEEKKMRA +0000081C CEEPLPKA CEEKKMRA D1908 Call 2 IBMRKDM +000000C2 IBMREV10 IBMRKDM Call 3 SUBTSK2 +000000E6 5 GO SUBTSK2 Call 4 IBMUPTMM +0000014E IBMRLIB1 IBMUPTMM Call 5 CEEOPCMM +00000908 CEEBINIT CEEOPCMM D1908 Call DSA DSA Addr E Addr PU Addr PU Offset Comp Date Compile Attributes 1 00036430 112FD268 112FD268 +0000081C 20061214 CEL POSIX 2 000352E8 1141D0A0 1141D0A0 +000000C2 ******** OS PL/I POSIX 3 00036308 11201048 11201040 +000000EE ******** OS PL/I POSIX 4 00036040 00021900 00021900 +0000014E 20061214 LIBRARY POSIX 5 1148DEE0 0000E460 0000E460 +00000908 20061215 CEL POSIX ⋮ Information for thread 1170C15000000000 Traceback: DSA Entry E Offset Statement Load Mod Program Unit Service Status 1 IBMUJWTP +00000146 IBMREV10 IBMUJWTP Call 2 IBMUJWT +0000027A IBMRLIB1 IBMUJWT Call 3 TASKING +00000106 11 GO TASKING Call 4 IBMRPMIA +0000051E IBMRLIB1 IBMRPMIA Call 5 CEEEV010 +00000310 IBMREV10 CEEEV010 Call 6 CEEBBEXT +000001B6 CEEPLPKA CEEBBEXT D1908 Call DSA DSA Addr E Addr PU Addr PU Offset Comp Date Compile Attributes 1 11443530 1143A850 1143A850 +00000146 20061214 LIBRARY POSIX 2 11443438 00020E28 00020E28 +0000027A ******** OS PL/I POSIX 3 11443330 11200728 11200720 +0000010E ******** OS PL/I POSIX 4 11443178 000201D0 000201D0 +0000051E 20061214 LIBRARY POSIX 5 114430F0 11403998 11403998 +00000310 20061213 LIBRARY POSIX 6 11443030 112B1BF8 112B1BF8 +000001B6 20061215 CEL POSIX ⋮ Information for thread 1171943000000002 Traceback: DSA Entry E Offset Statement Load Mod Program Unit Service Status 1 IBMUJWTP +00000146 IBMREV10 IBMUJWTP Call 2 IBMUJWT +0000027A IBMRLIB1 IBMUJWT Call 3 SUBTSK1 +000000D6 13 GO SUBTSK1 Call 4 IBMUPTMM +0000014E IBMRLIB1 IBMUPTMM Call 5 CEEOPCMM +00000908 CEEBINIT CEEOPCMM D1908 Call
Figure 117. Task traceback section
DSA DSA Addr E Addr PU Addr PU Offset Comp Date Compile Attributes 1 00030508 1143A850 1143A850 +00000146 20061214 LIBRARY POSIX 2 00030410 00020E28 00020E28 +0000027A ******** OS PL/I POSIX 3 00030308 11200DD8 11200DD0 +000000DE ******** OS PL/I POSIX 4 00030040 00021900 00021900 +0000014E 20061214 LIBRARY POSIX 5 11485EE0 0000E460 0000E460 +00000908 20061215 CEL POSIX ⋮ Information for thread 1171761000000001 Traceback: DSA Entry E Offset Statement Load Mod Program Unit Service Status 1 IBMUJWTP +00000146 IBMREV10 IBMUJWTP Call 2 IBMUJWT +0000027A IBMRLIB1 IBMUJWT Call 3 SUBTASK +000000D6 13 GO SUBTASK Call 4 IBMUPTMM +0000014E IBMRLIB1 IBMUPTMM Call 5 CEEOPCMM +00000908 CEEBINIT CEEOPCMM D1908 Call DSA DSA Addr E Addr PU Addr PU Offset Comp Date Compile Attributes 1 00029508 1143A850 1143A850 +00000146 20061214 LIBRARY POSIX 2 00029410 00020E28 00020E28 +0000027A ******** OS PL/I POSIX 3 00029308 11200B68 11200B60 +000000DE ******** OS PL/I POSIX 4 00029040 00021900 00021900 +0000014E 20061214 LIBRARY POSIX 5 11479EE0 0000E460 0000E460 +00000908 20061215 CEL POSIX ⋮
Figure 118. Task traceback section (continued)
Condition informationIf the dump was called from an ON-unit, the type of ON-unit is identified in the traceback as part of theentry information. For ON-units, the values of any relevant condition built-in functions (for example,ONCHAR and ONSOURCE for conversion errors) appear. In cases where the cause of entry into the ON-unit is not stated, usually when the ERROR ON-unit is called, the cause of entry appears in the conditioninformation.
Statement number and address where error occurredThis information, which is the point at which the condition that caused entry to the ON-unit occurred, canbe found in the traceback section of the dump.
If the condition occurs in compiled code, and you compiled your routine with either GOSTMT orGONUMBER, the statement numbers appear in the dump. To identify the assembler instruction that
272 z/OS: z/OS Language Environment Debugging Guide

caused the error, use the traceback information in the dump to find the program unit (PU) offset of thestatement number in which the error occurred. Then find that offset and the corresponding instruction inthe object code listing.
Control blocks for active routinesThis section shows the stack frames for all active routines, and the static storage. Use this section of thedump to identify variable values, determine the contents of parameter lists, and locate the timestamp.Figure 119 on page 273 shows this section of the dump.
Control Blocks for Active Routines: DSA for CEEKKMRA: 20B45B88 +000000 FLAGS.... 0000 member... 4040 BKC...... 00025670 FWC...... 20B46080 R14...... A09F0C3E +000010 R15...... A09EB5B8 R0....... 00000000 R1....... 20B45C18 R2....... 000251E8 R3....... 00000000 +000024 R4....... 00000001 R5....... 20B45E17 R6....... 00025030 R7....... 00000000 R8....... A09104D0 +000038 R9....... 00000000 R10...... 209F141F R11...... A09F0420 R12...... 2090E9C0 reserved. 00025760 +00004C NAB...... 20B46080 PNAB..... 20B40050 reserved. 00500007 00000000 +000064 reserved. 00000000 reserved. 00000000 MODE..... 00000000 reserved. 00000000 +000078 reserved. 00000000 reserved. 8000C3C5 DSA for IBMRKDM: 00025670 +000000 FLAGS.... 0800 member... 01E0 BKC...... 20B45A88 FWC...... 20B45B88 R14...... A0B1C164 +000010 R15...... A09F0420 R0....... 80007810 R1....... 20900EBC R2....... 20B45A88 R3....... A0B1C0A6 +000024 R4....... 00000064 R5....... 00000000 R6....... 20900EBC R7....... 20B45938 R8....... 20B45B58 +000038 R9....... 20B45B7C R10...... 00000000 R11...... 0001AF4F R12...... 2090E9C0 reserved. 00025760 +00004C NAB...... 20B45B88 PNAB..... 00000000 reserved. 00000000 00000000 +000064 reserved. 00000000 reserved. 00000000 MODE..... 00000000 reserved. 00000000 +000078 reserved. 00000000 reserved. 00000000 Library Work Space: 00025670 +000000 00025670 080001E0 20B45A88 20B45B88 A0B1C164 A09F0420 80007810 20900EBC 20B45A88 |......!h..$h..A...............!h| +000020 00025690 A0B1C0A6 00000064 00000000 20900EBC 20B45938 20B45B58 20B45B7C 00000000 |...w..................$...$@....| +000040 000256B0 0001AF4F 2090E9C0 00025760 20B45B88 00000000 00000000 00000000 00000000 |...|..Z....-..$h................| +000060 000256D0 00000000 00000000 00000000 00000000 00000000 00000000 00000000 00000000 |................................| +000080 000256F0 - +00009F 0002570F same as above DSA for ERR ON-unit: 20B45A88 +000000 FLAGS.... CC25 member... 4040 BKC...... 20B45850 FWC...... 40404040 R14...... A0900D30 +000010 R15...... A0B1C0A0 R0....... 20B45B88 R1....... 20900EBC R2....... A0900CE4 R3....... 20900E40 +000024 R4....... 00000064 R5....... 00000000 R6....... 20B45B40 R7....... 20B45938 R8....... 20B45B58 +000038 R9....... 20B45B7C R10...... 00000000 R11...... 0001AF4F R12...... D6D940C7 reserved. 00025670 +00004C NAB...... 20B45B88 PNAB..... 20B45B88 reserved. 91E091E0 20900F00 +000064 reserved. 40404040 reserved. 40404040 MODE..... 40404040 reserved. 20B45B40 +000078 reserved. 40404040 reserved. 40404040 Dynamic save area (ERR ON-unit): 20B45A88 +000000 20B45A88 CC254040 20B45850 40404040 A0900D30 A0B1C0A0 20B45B88 20900EBC A0900CE4 |.. ...& ..........$h.......U| +000020 20B45AA8 20900E40 00000064 00000000 20B45B40 20B45938 20B45B58 20B45B7C 00000000 |... ..........$ ......$...$@....| +000040 20B45AC8 0001AF4F D6D940C7 00025670 20B45B88 20B45B88 91E091E0 20B42330 20900F00 |...|OR G......$h..$hj.j.........| +000060 20B45AE8 40404040 40404040 40404040 40404040 20B45B40 40400240 40404040 40404040 | ..$ . | +000080 20B45B08 40404040 40404040 40404040 40404040 40404040 40404040 40404040 40404040 | | +0000A0 20B45B28 40404040 40404040 40404040 40404040 40404040 40404040 0C014040 40404040 | .. | +0000C0 20B45B48 A3829586 A2404040 20B45B48 00050000 D7938984 A4949740 83819393 85844086 |tbnfs ..$.....Plidump called f| +0000E0 20B45B68 99969440 85999996 9940D695 60A49589 A3404040 20B45B58 00210000 40404040 |rom error On-unit ..$..... | Static for procedure EXAMPLE Timestamp: 27 FEB 07 11:45:18 Starting from: 20900E40 +000000 20900E40 E00001E0 20900B78 20900C20 20900C30 20900C58 20900CE4 20900D48 20900DBE |.......................U........| +000020 20900E60 20900DBE 20900DBE 20900DBE 20901E40 B0000002 1F800004 00000000 20900E94 |............... ...............m| +000040 20900E80 00000000 00050000 00000000 00210000 91E091E0 00000004 00000004 0000000A |................j.j.............| +000060 20900EA0 00000001 91A091A0 00000014 00000001 0A200000 0000000A 00000002 20B45B50 |....j.j.......................$&| +000080 20900EC0 A0B45B7C 20901368 A3829586 A2D79389 84A49497 40838193 93858440 86999694 |[email protected] called from| +0000A0 20900EE0 40859999 969940D6 9560A495 89A30000 20900C34 20900C30 0C160000 20900C58 | error On-unit..................| +0000C0 20900F00 0C960000 00000000 20901038 00000000 00000000 20900F3C 20900F50 20900F6C |.o.........................&...%| +0000E0 20900F20 20900F84 00000000 20900F08 00000000 20900F14 00000000 20900F14 85000001 |...d........................e...| +000100 20900F40 20900E72 000000C8 00000000 0001C900 85000001 20900E72 000000CC 00000000 |.......H......I.e...............| +000120 20900F60 0009C1D9 D9C1E86D C5D5C400 81000101 20900E72 000000C0 00000000 0005C1D9 |..ARRAY_END.a.................AR| +000140 20900F80 D9C1E800 0D020001 20900E70 20900EF0 00000000 0005D3C1 C2D3F100 00000001 |RAY............0......LABL1.....| +000160 20900FA0 20900B78 000000DE 20900FC0 00000001 00B90004 00BD0008 00CF000E 00E00004 |................................| +000180 20900FC0 20900C58 000000E8 20900FE0 00000004 008D0005 00910006 00D90007 00E80008 |.......Y.............j...R...Y..| +0001A0 20900FE0 20900D48 000000F6 20901008 00000008 00770009 0083000A 009F000B 00D1000C |.......6.............c.......J..| +0001C0 20901000 00ED000D 00EC000D 0E0E0E0E F2F740C6 C5C240F0 F74040F1 F17AF4F5 7AF1F840 |............27 FEB 07 11:45:18 | +0001E0 20901020 80000117 20900AF0 01000001 20900B78 20901340 00000000 1D020000 20901054 |.......0........... ............|⋮ DSA for IBMRERRI: 20B42500 +000000 FLAGS.... 8800 member... 0000 BKC...... 20B42430 FWC...... 20B425C0 R14...... 8001B784 +000010 R15...... A09D0B48 R0....... 0000000B R1....... 20B42580 R2....... 0000000A R3....... 20900EB0 +000024 R4....... 00025470 R5....... 000254C4 R6....... 20B42330 R7....... 20B42330 R8....... 00000028 +000038 R9....... 00000008 R10...... A09104D0 R11...... 0001B328 R12...... 2090E9C0 reserved. 00025290 +00004C NAB...... 20B425C0 PNAB..... 008FF4E8 reserved. 2090D658 20AF22BC +000064 reserved. 2090E9C0 reserved. 20B420F0 MODE..... 20B2FA47 reserved. A09104D0 +000078 reserved. 00000000 reserved. 20B42838
Figure 119. Control blocks for active routines section of the dump (Part 1 of 3)
Chapter 7. Debugging PL/I for MVS & VM routines 273
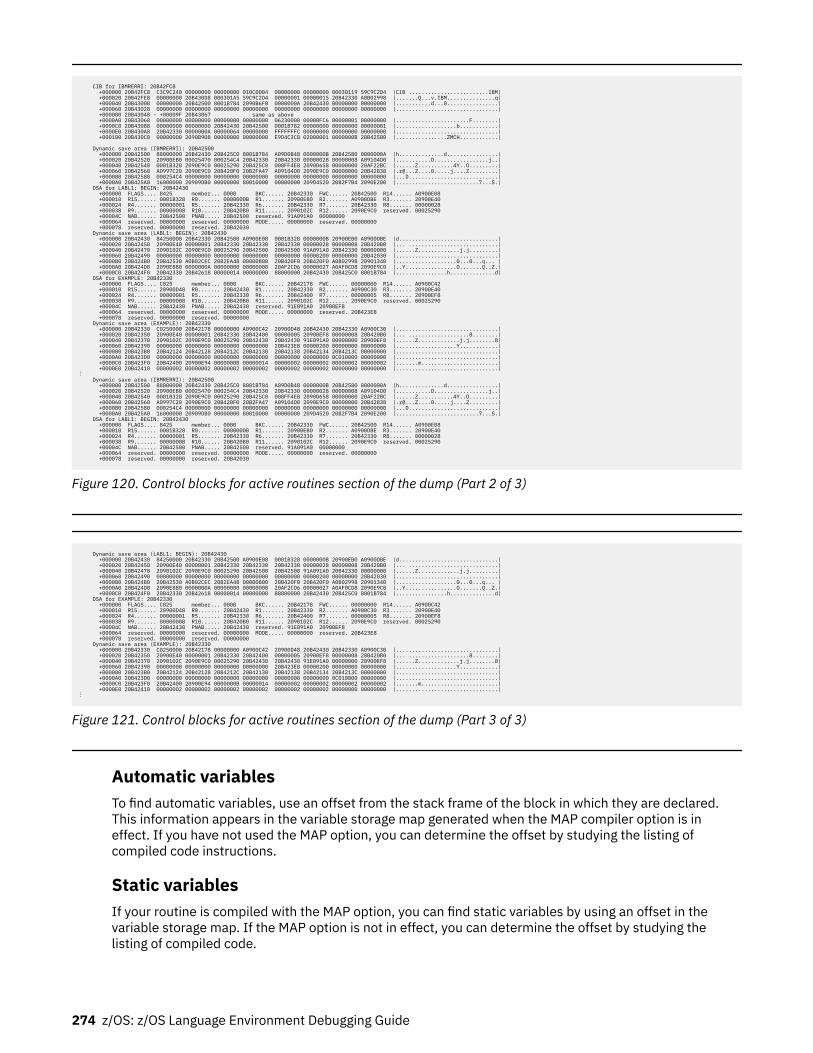
CIB for IBMRERRI: 20B42FC8 +000000 20B42FC8 C3C9C240 00000000 00000000 010C0004 00000000 00000000 00030119 59C9C2D4 |CIB .........................IBM| +000020 20B42FE8 00000000 20B430D8 000301A5 59C9C2D4 00000001 00000015 20B42330 A0B02998 |.......Q...v.IBM...............q| +000040 20B43008 00000000 20B42500 8001B784 2090B6F0 0000000A 20B42430 00000000 00000000 |...........d...0................| +000060 20B43028 00000000 00000000 00000000 00000000 00000000 00000000 00000000 00000000 |................................| +000080 20B43048 - +00009F 20B43067 same as above +0000A0 20B43068 00000000 00000000 00000000 00000000 06230000 00000FC6 00000001 00000000 |.......................F........| +0000C0 20B43088 00000000 00000000 20B42430 20B42500 0001B782 00000000 00000000 00000001 |...................b............| +0000E0 20B430A8 20B42330 0000000A 00000064 00000000 FFFFFFFC 00000000 00000000 00000000 |................................| +000100 20B430C8 00000000 2090B908 00000000 00000000 E9D4C3C8 02000001 0000000B 20B42580 |................ZMCH............|
Dynamic save area (IBMRERRI): 20B42500 +000000 20B42500 88000000 20B42430 20B425C0 8001B784 A09D0B48 0000000B 20B42580 0000000A |h..............d................| +000020 20B42520 20900EB0 00025470 000254C4 20B42330 20B42330 00000028 00000008 A09104D0 |...........D.................j..| +000040 20B42540 0001B328 2090E9C0 00025290 20B425C0 008FF4E8 2090D658 00000000 20AF22BC |......Z...........4Y..O.........| +000060 20B42560 A0997C20 2090E9C0 20B420F0 20B2FA47 A09104D0 2090E9C0 00000000 20B42838 |[email protected].........| +000080 20B42580 000254C4 00000000 00000000 00000000 00000000 00000000 00000000 00000000 |...D............................| +0000A0 20B425A0 16000000 20909DB0 00000000 80010000 00000000 209D4520 20B2F7B4 2090E200 |..........................7...S.| DSA for LABL1: BEGIN: 20B42430 +000000 FLAGS.... 8425 member... 0000 BKC...... 20B42330 FWC...... 20B42500 R14...... A0900E08 +000010 R15...... 0001B328 R0....... 0000000B R1....... 20900EB0 R2....... A0900DBE R3....... 20900E40 +000024 R4....... 00000001 R5....... 20B42330 R6....... 20B42330 R7....... 20B42330 R8....... 00000028 +000038 R9....... 00000008 R10...... 20B420B0 R11...... 2090102C R12...... 2090E9C0 reserved. 00025290 +00004C NAB...... 20B42500 PNAB..... 20B42500 reserved. 91A091A0 00000000 +000064 reserved. 00000000 reserved. 00000000 MODE..... 00000000 reserved. 00000000 +000078 reserved. 00000000 reserved. 20B42030 Dynamic save area (LABL1: BEGIN): 20B42430 +000000 20B42430 84250000 20B42330 20B42500 A0900E08 0001B328 0000000B 20900EB0 A0900DBE |d...............................| +000020 20B42450 20900E40 00000001 20B42330 20B42330 20B42330 00000028 00000008 20B420B0 |... ............................| +000040 20B42470 2090102C 2090E9C0 00025290 20B42500 20B42500 91A091A0 20B42330 00000000 |......Z.............j.j.........| +000060 20B42490 00000000 00000000 00000000 00000000 00000000 00000200 00000000 20B42030 |................................| +000080 20B424B0 20B42530 A0B02CEC 20B2EA48 00000800 20B420F0 20B420F0 A0B02998 20901340 |...................0...0...q... | +0000A0 20B424D0 2090E880 0000000A 00000000 00000000 20AF2CD6 00000027 A0AF0CD8 2090E9C0 |..Y................O.......Q..Z.| +0000C0 20B424F0 20B42330 20B42618 00000014 00000000 88000000 20B42430 20B425C0 8001B784 |................h..............d| DSA for EXAMPLE: 20B42330 +000000 FLAGS.... C025 member... 0000 BKC...... 20B42178 FWC...... 00000000 R14...... A0900C42 +000010 R15...... 20900D48 R0....... 20B42430 R1....... 20B42330 R2....... A0900C30 R3....... 20900E40 +000024 R4....... 00000001 R5....... 20B42330 R6....... 20B42400 R7....... 00000005 R8....... 20900EF8 +000038 R9....... 00000008 R10...... 20B420B0 R11...... 2090102C R12...... 2090E9C0 reserved. 00025290 +00004C NAB...... 20B42430 PNAB..... 20B42430 reserved. 91E091A0 20900EF8 +000064 reserved. 00000000 reserved. 00000000 MODE..... 00000000 reserved. 20B423E8 +000078 reserved. 00000000 reserved. 00000000 Dynamic save area (EXAMPLE): 20B42330 +000000 20B42330 C0250000 20B42178 00000000 A0900C42 20900D48 20B42430 20B42330 A0900C30 |................................| +000020 20B42350 20900E40 00000001 20B42330 20B42400 00000005 20900EF8 00000008 20B420B0 |... ...................8........| +000040 20B42370 2090102C 2090E9C0 00025290 20B42430 20B42430 91E091A0 00000000 20900EF8 |......Z.............j.j........8| +000060 20B42390 00000000 00000000 00000000 00000000 20B423E8 00000200 00000000 00000000 |...................Y............| +000080 20B423B0 20B42124 20B42128 20B4212C 20B42130 20B42138 20B42134 20B4213C 00000000 |................................| +0000A0 20B423D0 00000000 00000000 00000000 00000000 00000000 00000000 0C010000 00000000 |................................| +0000C0 20B423F0 20B42400 20900E94 0000000B 00000014 00000002 00000002 00000002 00000002 |.......m........................| +0000E0 20B42410 00000002 00000002 00000002 00000002 00000002 00000002 00000000 00000000 |................................|⋮ Dynamic save area (IBMRERRI): 20B42500 +000000 20B42500 88000000 20B42430 20B425C0 8001B784 A09D0B48 0000000B 20B42580 0000000A |h..............d................| +000020 20B42520 20900EB0 00025470 000254C4 20B42330 20B42330 00000028 00000008 A09104D0 |...........D.................j..| +000040 20B42540 0001B328 2090E9C0 00025290 20B425C0 008FF4E8 2090D658 00000000 20AF22BC |......Z...........4Y..O.........| +000060 20B42560 A0997C20 2090E9C0 20B420F0 20B2FA47 A09104D0 2090E9C0 00000000 20B42838 |[email protected].........| +000080 20B42580 000254C4 00000000 00000000 00000000 00000000 00000000 00000000 00000000 |...D............................| +0000A0 20B425A0 16000000 20909DB0 00000000 80010000 00000000 209D4520 20B2F7B4 2090E200 |..........................7...S.| DSA for LABL1: BEGIN: 20B42430 +000000 FLAGS.... 8425 member... 0000 BKC...... 20B42330 FWC...... 20B42500 R14...... A0900E08 +000010 R15...... 0001B328 R0....... 0000000B R1....... 20900EB0 R2....... A0900DBE R3....... 20900E40 +000024 R4....... 00000001 R5....... 20B42330 R6....... 20B42330 R7....... 20B42330 R8....... 00000028 +000038 R9....... 00000008 R10...... 20B420B0 R11...... 2090102C R12...... 2090E9C0 reserved. 00025290 +00004C NAB...... 20B42500 PNAB..... 20B42500 reserved. 91A091A0 00000000 +000064 reserved. 00000000 reserved. 00000000 MODE..... 00000000 reserved. 00000000 +000078 reserved. 00000000 reserved. 20B42030
Figure 120. Control blocks for active routines section of the dump (Part 2 of 3)
Dynamic save area (LABL1: BEGIN): 20B42430 +000000 20B42430 84250000 20B42330 20B42500 A0900E08 0001B328 0000000B 20900EB0 A0900DBE |d...............................| +000020 20B42450 20900E40 00000001 20B42330 20B42330 20B42330 00000028 00000008 20B420B0 |... ............................| +000040 20B42470 2090102C 2090E9C0 00025290 20B42500 20B42500 91A091A0 20B42330 00000000 |......Z.............j.j.........| +000060 20B42490 00000000 00000000 00000000 00000000 00000000 00000200 00000000 20B42030 |................................| +000080 20B424B0 20B42530 A0B02CEC 20B2EA48 00000800 20B420F0 20B420F0 A0B02998 20901340 |...................0...0...q... | +0000A0 20B424D0 2090E880 0000000A 00000000 00000000 20AF2CD6 00000027 A0AF0CD8 2090E9C0 |..Y................O.......Q..Z.| +0000C0 20B424F0 20B42330 20B42618 00000014 00000000 88000000 20B42430 20B425C0 8001B784 |................h..............d| DSA for EXAMPLE: 20B42330 +000000 FLAGS.... C025 member... 0000 BKC...... 20B42178 FWC...... 00000000 R14...... A0900C42 +000010 R15...... 20900D48 R0....... 20B42430 R1....... 20B42330 R2....... A0900C30 R3....... 20900E40 +000024 R4....... 00000001 R5....... 20B42330 R6....... 20B42400 R7....... 00000005 R8....... 20900EF8 +000038 R9....... 00000008 R10...... 20B420B0 R11...... 2090102C R12...... 2090E9C0 reserved. 00025290 +00004C NAB...... 20B42430 PNAB..... 20B42430 reserved. 91E091A0 20900EF8 +000064 reserved. 00000000 reserved. 00000000 MODE..... 00000000 reserved. 20B423E8 +000078 reserved. 00000000 reserved. 00000000 Dynamic save area (EXAMPLE): 20B42330 +000000 20B42330 C0250000 20B42178 00000000 A0900C42 20900D48 20B42430 20B42330 A0900C30 |................................| +000020 20B42350 20900E40 00000001 20B42330 20B42400 00000005 20900EF8 00000008 20B420B0 |... ...................8........| +000040 20B42370 2090102C 2090E9C0 00025290 20B42430 20B42430 91E091A0 00000000 20900EF8 |......Z.............j.j........8| +000060 20B42390 00000000 00000000 00000000 00000000 20B423E8 00000200 00000000 00000000 |...................Y............| +000080 20B423B0 20B42124 20B42128 20B4212C 20B42130 20B42138 20B42134 20B4213C 00000000 |................................| +0000A0 20B423D0 00000000 00000000 00000000 00000000 00000000 00000000 0C010000 00000000 |................................| +0000C0 20B423F0 20B42400 20900E94 0000000B 00000014 00000002 00000002 00000002 00000002 |.......m........................| +0000E0 20B42410 00000002 00000002 00000002 00000002 00000002 00000002 00000000 00000000 |................................|⋮
Figure 121. Control blocks for active routines section of the dump (Part 3 of 3)
Automatic variablesTo find automatic variables, use an offset from the stack frame of the block in which they are declared.This information appears in the variable storage map generated when the MAP compiler option is ineffect. If you have not used the MAP option, you can determine the offset by studying the listing ofcompiled code instructions.
Static variablesIf your routine is compiled with the MAP option, you can find static variables by using an offset in thevariable storage map. If the MAP option is not in effect, you can determine the offset by studying thelisting of compiled code.
274 z/OS: z/OS Language Environment Debugging Guide
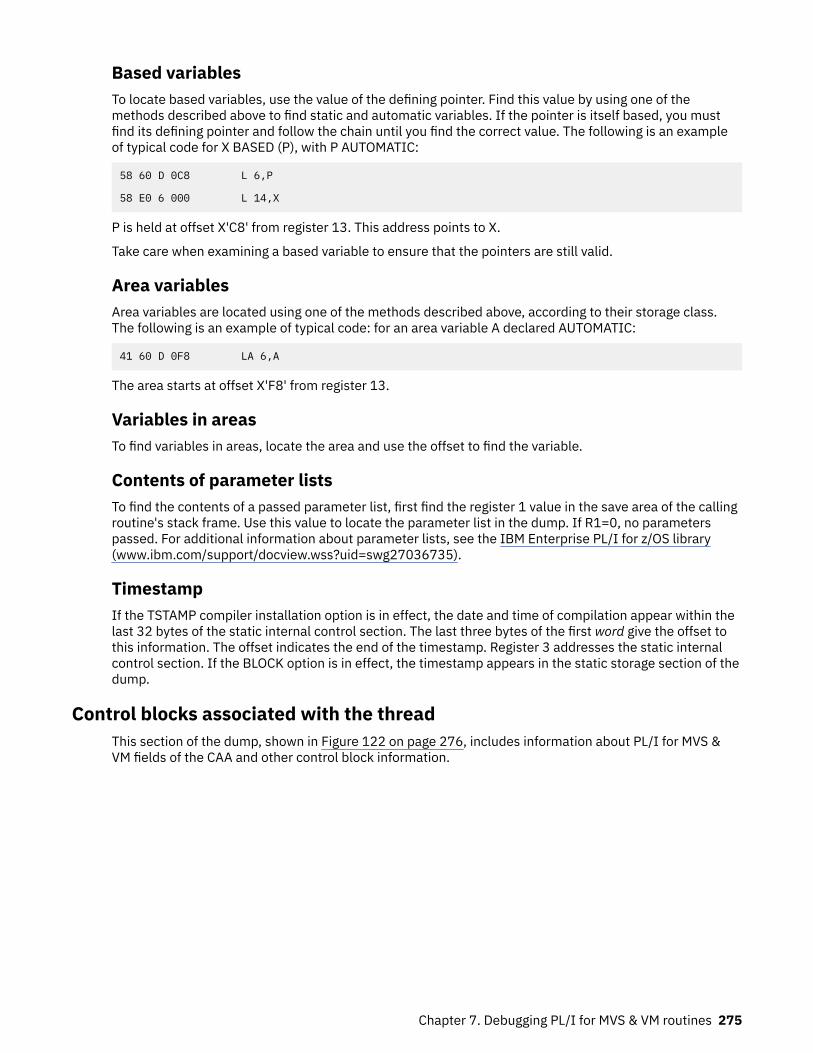
Based variablesTo locate based variables, use the value of the defining pointer. Find this value by using one of themethods described above to find static and automatic variables. If the pointer is itself based, you mustfind its defining pointer and follow the chain until you find the correct value. The following is an exampleof typical code for X BASED (P), with P AUTOMATIC:
58 60 D 0C8 L 6,P
58 E0 6 000 L 14,X
P is held at offset X'C8' from register 13. This address points to X.
Take care when examining a based variable to ensure that the pointers are still valid.
Area variablesArea variables are located using one of the methods described above, according to their storage class.The following is an example of typical code: for an area variable A declared AUTOMATIC:
41 60 D 0F8 LA 6,A
The area starts at offset X'F8' from register 13.
Variables in areasTo find variables in areas, locate the area and use the offset to find the variable.
Contents of parameter listsTo find the contents of a passed parameter list, first find the register 1 value in the save area of the callingroutine's stack frame. Use this value to locate the parameter list in the dump. If R1=0, no parameterspassed. For additional information about parameter lists, see the IBM Enterprise PL/I for z/OS library(www.ibm.com/support/docview.wss?uid=swg27036735).
TimestampIf the TSTAMP compiler installation option is in effect, the date and time of compilation appear within thelast 32 bytes of the static internal control section. The last three bytes of the first word give the offset tothis information. The offset indicates the end of the timestamp. Register 3 addresses the static internalcontrol section. If the BLOCK option is in effect, the timestamp appears in the static storage section of thedump.
Control blocks associated with the threadThis section of the dump, shown in Figure 122 on page 276, includes information about PL/I for MVS &VM fields of the CAA and other control block information.
Chapter 7. Debugging PL/I for MVS & VM routines 275
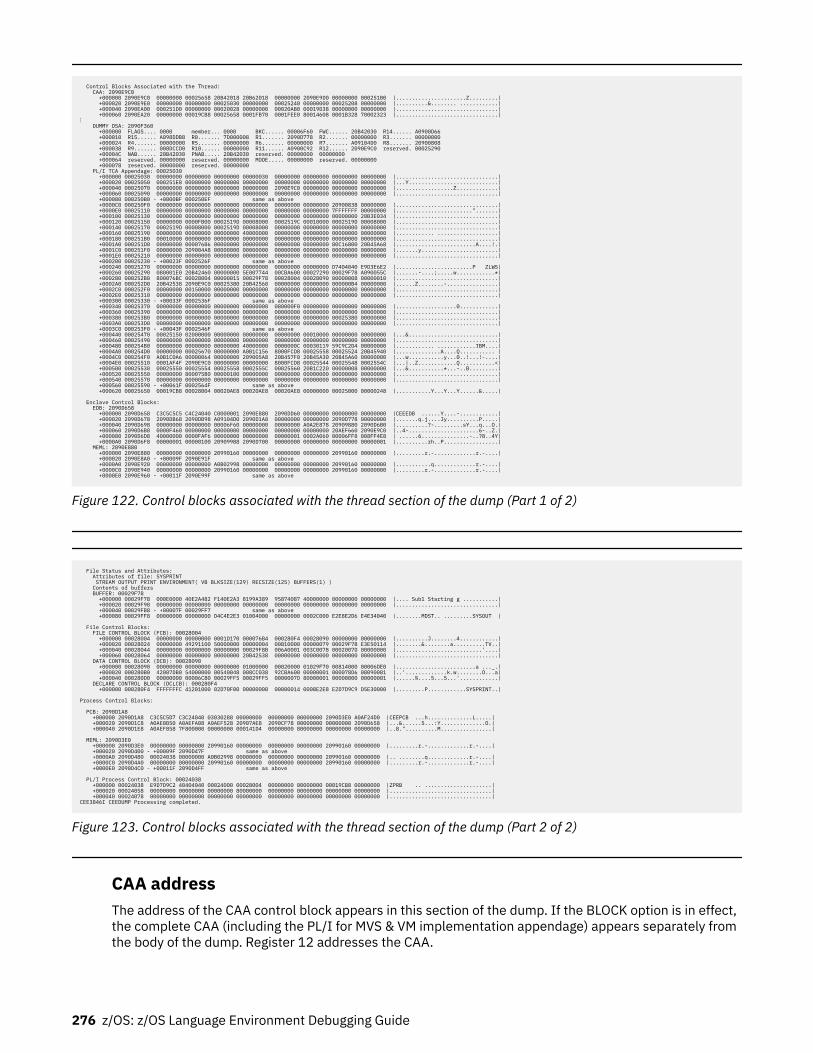
Control Blocks Associated with the Thread: CAA: 2090E9C0 +000000 2090E9C0 00000000 00025658 20B42018 20B62018 00000000 2090E9D0 00000000 000251B0 |......................Z.........| +000020 2090E9E0 00000000 00000000 00025030 00000000 00025240 00000000 00025208 00000000 |..........&........ ............| +000040 2090EA00 000251D0 00000000 00020028 00000000 00020AB0 00019D38 00000000 00000000 |................................| +000060 2090EA20 00000000 00019CB8 00025658 0001FB70 0001FEE0 80014608 0001B328 70002323 |................................|⋮ DUMMY DSA: 2090F360 +000000 FLAGS.... 0000 member... 0000 BKC...... 00006F60 FWC...... 20B42030 R14...... A0900D66 +000010 R15...... A098DDB8 R0....... 7D000008 R1....... 2090D778 R2....... 00000000 R3....... 00000000 +000024 R4....... 00000000 R5....... 00000000 R6....... 00000000 R7....... A09104D0 R8....... 20900808 +000038 R9....... 008DCCD0 R10...... 00000000 R11...... A0900C92 R12...... 2090E9C0 reserved. 00025290 +00004C NAB...... 20B42030 PNAB..... 20B42030 reserved. 00000000 00000000 +000064 reserved. 00000000 reserved. 00000000 MODE..... 00000000 reserved. 00000000 +000078 reserved. 00000000 reserved. 00000000 PL/I TCA Appendage: 00025030 +000000 00025030 00000000 00000000 00000000 00000030 00000000 00000000 00000000 00000000 |................................| +000020 00025050 000251E8 00000000 00000000 00000000 00000000 00000000 00000000 00000000 |...Y............................| +000040 00025070 00000000 00000000 00000000 00000000 2090E9C0 00000000 00000000 00000000 |..................Z.............| +000060 00025090 00000000 00000000 00000000 00000000 00000000 00000000 00000000 00000000 |................................| +000080 000250B0 - +0000BF 000250EF same as above +0000C0 000250F0 00000000 00000000 00000000 00000000 00000000 00000000 20900838 00000000 |................................| +0000E0 00025110 00000000 00000000 00000000 00000000 00000000 00000000 7FFFFFFF 00000000 |........................".......| +000100 00025130 00000000 00000000 00000000 00000000 00000000 00000000 00000000 20B3E034 |................................| +000120 00025150 00000000 0000FB00 0002519D 00008000 0002519C 00010000 0002519D 00008000 |................................| +000140 00025170 0002519D 00008000 0002519D 00008000 00000000 00000000 00000000 00000000 |................................| +000160 00025190 00000000 00000000 00000000 40000000 00000000 00000000 00000000 00000000 |............ ...................| +000180 000251B0 00010000 00000000 00000000 00000000 00000000 00000000 00000000 00000000 |................................| +0001A0 000251D0 00000000 000076B6 00000000 00000000 00000000 00000000 80C16800 20B45A68 |.........................A....!.| +0001C0 000251F0 00000000 209004A8 00000000 00000000 00000000 00000000 00000000 00000000 |.......y........................| +0001E0 00025210 00000000 00000000 00000000 00000000 00000000 00000000 00000000 00000000 |................................| +000200 00025230 - +00023F 0002526F same as above +000240 00025270 00000000 00000000 00000000 00000000 00000000 00000000 D7404040 E9D3E6E2 |........................P ZLWS| +000260 00025290 080001E0 20B42460 00000000 5E007744 00CBA600 00027290 00029F78 A090055C |.......-....;.....w............*| +000280 000252B0 800076BC 00028004 00000015 00029F78 00028004 00028090 00000008 00000010 |................................| +0002A0 000252D0 20B42538 2090E9C0 00025380 20B42560 00000000 00000000 000000B4 00000000 |......Z........-................| +0002C0 000252F0 00000000 00150000 00000000 00000000 00000000 00000000 00000000 00000000 |................................| +0002E0 00025310 00000000 00000000 00000000 00000000 00000000 00000000 00000000 00000000 |................................| +000300 00025330 - +00033F 0002536F same as above +000340 00025370 00000000 00000000 00000000 00000000 080000F0 00000000 00000000 00000000 |...................0............| +000360 00025390 00000000 00000000 00000000 00000000 00000000 00000000 00000000 00000000 |................................| +000380 000253B0 00000000 00000000 00000000 00000000 00000000 00000000 00025380 00000000 |................................| +0003A0 000253D0 00000000 00000000 00000000 00000000 00000000 00000000 00000000 00000000 |................................| +0003C0 000253F0 - +00043F 0002546F same as above +000440 00025470 00025150 02000000 00000000 00000000 00000000 00010000 00000000 00000000 |...&............................| +000460 00025490 00000000 00000000 00000000 00000000 00000000 00000000 00000000 00000000 |................................| +000480 000254B0 00000000 00000000 00000000 40000000 0000000C 00030119 59C9C2D4 00000000 |............ ............IBM....| +0004A0 000254D0 00000000 00025670 00000000 A0B1C156 8000FCD8 00025558 00025524 20B45940 |..............A....Q........... | +0004C0 000254F0 A0B1C0A6 00000064 00000000 209005A8 20B457F0 20B45A30 20B45A60 00000000 |...w...........y...0..!...!-....| +0004E0 00025510 0001AF4F 2090E9C0 00000000 00000000 8000FCD8 00025544 00025548 0002554C |...|..Z............Q...........<| +000500 00025530 00025550 00025554 00025558 0002555C 00025560 20B1C220 00000008 00000000 |...&...........*...-..B.........| +000520 00025550 00000000 800075B0 00000100 00000000 00000000 00000000 00000000 00000000 |................................| +000540 00025570 00000000 00000000 00000000 00000000 00000000 00000000 00000000 00000000 |................................| +000560 00025590 - +00061F 0002564F same as above +000620 00025650 00019CB8 00028004 00020AE8 00020AE8 00020AE8 00000000 00025000 00000248 |...........Y...Y...Y......&.....| Enclave Control Blocks: EDB: 2090D658 +000000 2090D658 C3C5C5C5 C4C24040 C0000001 2090E880 2090DD60 00000000 00000000 00000000 |CEEEDB ......Y....-............| +000020 2090D678 2090DB68 2090DB98 A09104D0 2090D1A8 00000000 00000000 2090D778 00000000 |.......q.j....Jy..........P.....| +000040 2090D698 00000000 00000000 00006F60 00000000 00000000 A0A2E878 20909880 2090D6B0 |..........?-.........sY...q...O.| +000060 2090D6B8 0000F460 00000000 00000000 00000000 00000000 00000000 20AEF660 2090E9C0 |..4-......................6-..Z.| +000080 2090D6D8 40000000 0000FAF6 00000000 00000000 00000001 0002A060 00006FF8 008FF4E8 | ......6...............-..?8..4Y| +0000A0 2090D6F8 00000001 00000100 20909988 2090D700 00000000 00000000 00000000 00000001 |..........rh..P.................| MEML: 2090E880 +000000 2090E880 00000000 00000000 20990160 00000000 00000000 00000000 20990160 00000000 |.........r.-.............r.-....| +000020 2090E8A0 - +00009F 2090E91F same as above +0000A0 2090E920 00000000 00000000 A0B02998 00000000 00000000 00000000 20990160 00000000 |...........q.............r.-....| +0000C0 2090E940 00000000 00000000 20990160 00000000 00000000 00000000 20990160 00000000 |.........r.-.............r.-....| +0000E0 2090E960 - +00011F 2090E99F same as above
Figure 122. Control blocks associated with the thread section of the dump (Part 1 of 2)
File Status and Attributes: Attributes of file: SYSPRINT STREAM OUTPUT PRINT ENVIRONMENT( VB BLKSIZE(129) RECSIZE(125) BUFFERS(1) ) Contents of buffers BUFFER: 00029F78 +000000 00029F78 000E0000 40E2A482 F140E2A3 8199A389 95874087 40000000 00000000 00000000 |.... Sub1 Starting g ...........| +000020 00029F98 00000000 00000000 00000000 00000000 00000000 00000000 00000000 00000000 |................................| +000040 00029FB8 - +00007F 00029FF7 same as above +000080 00029FF8 00000000 00000000 D4C4E2E3 01004000 00000000 0002C000 E2E8E2D6 E4E34040 |........MDST.. .........SYSOUT | File Control Blocks: FILE CONTROL BLOCK (FCB): 00028004 +000000 00028004 00000000 00000000 0001D170 000076B4 000280F4 00028090 00000000 00000000 |..........J........4............| +000020 00028024 00000000 49291100 50000000 00000004 00810000 00000079 00029F78 E3E50114 |........&........a..........TV..| +000040 00028044 00000000 00000000 00000000 00029F8B 006A0001 003C0078 0002007D 00000000 |...........................'....| +000060 00028064 00000000 00000000 00000000 20B42538 00000000 00000000 00000000 00000000 |................................| DATA CONTROL BLOCK (DCB): 00028090 +000000 00028090 00000000 00000000 00000000 01000000 00020000 01029F70 00814000 00006DE0 |.........................a ..._.| +000020 000280B0 42007DB0 54000000 00540048 008CC038 92CBA600 00000001 000078D6 08090081 |..'.............k.w........O...a| +000040 000280D0 00000000 00006C80 00029FF5 00029FF5 0000007D 80000001 00000000 00000001 |......%....5...5...'............| DECLARE CONTROL BLOCK (DCLCB): 000280F4 +000000 000280F4 FFFFFFFC 41201000 02D70F00 00000000 00000014 0008E2E8 E2D7D9C9 D5E30000 |.........P............SYSPRINT..| Process Control Blocks: PCB: 2090D1A8 +000000 2090D1A8 C3C5C5D7 C3C24040 03030288 00000000 00000000 00000000 2090D3E0 A0AF24D0 |CEEPCB ...h..............L.....| +000020 2090D1C8 A0AE8B50 A0AEFA08 A0AEF528 20907AE8 2090CF78 00000000 00000000 2090D658 |...&......5...:Y..............O.| +000040 2090D1E8 A0AEF858 7F800000 00000000 000141D4 00000000 80000000 00000000 00000000 |..8."..........M................| MEML: 2090D3E0 +000000 2090D3E0 00000000 00000000 20990160 00000000 00000000 00000000 20990160 00000000 |.........r.-.............r.-....| +000020 2090D400 - +00009F 2090D47F same as above +0000A0 2090D480 00024038 00000000 A0B02998 00000000 00000000 00000000 20990160 00000000 |.. ........q.............r.-....| +0000C0 2090D4A0 00000000 00000000 20990160 00000000 00000000 00000000 20990160 00000000 |.........r.-.............r.-....| +0000E0 2090D4C0 - +00011F 2090D4FF same as above PL/I Process Control Block: 00024038 +000000 00024038 E9D7D9C2 40404040 00024000 00028004 00000000 00000000 00019CB8 00000000 |ZPRB .. .....................| +000020 00024058 00000000 00000000 00000000 80000000 00000000 00000000 00000000 00000000 |................................| +000040 00024078 00000000 00000000 00000000 00000000 00000000 00000000 00000000 00000000 |................................| CEE3846I CEEDUMP Processing completed.
Figure 123. Control blocks associated with the thread section of the dump (Part 2 of 2)
CAA addressThe address of the CAA control block appears in this section of the dump. If the BLOCK option is in effect,the complete CAA (including the PL/I for MVS & VM implementation appendage) appears separately fromthe body of the dump. Register 12 addresses the CAA.
276 z/OS: z/OS Language Environment Debugging Guide
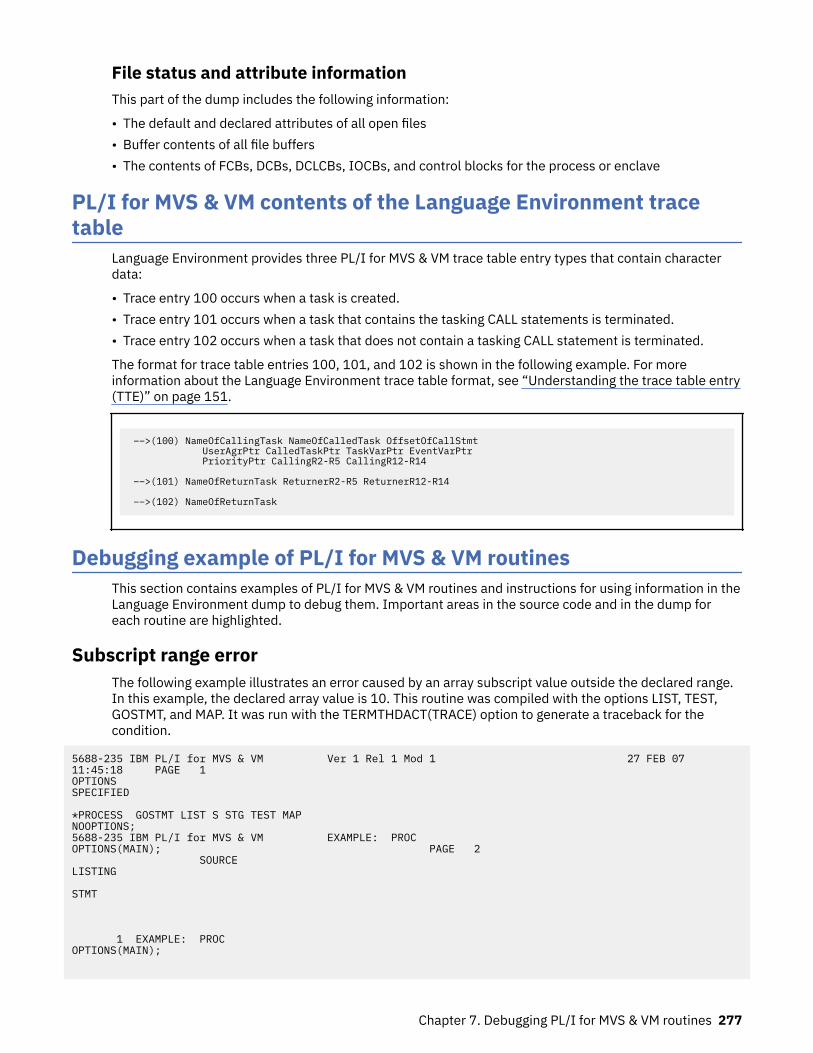
File status and attribute informationThis part of the dump includes the following information:
• The default and declared attributes of all open files• Buffer contents of all file buffers• The contents of FCBs, DCBs, DCLCBs, IOCBs, and control blocks for the process or enclave
PL/I for MVS & VM contents of the Language Environment tracetable
Language Environment provides three PL/I for MVS & VM trace table entry types that contain characterdata:
• Trace entry 100 occurs when a task is created.• Trace entry 101 occurs when a task that contains the tasking CALL statements is terminated.• Trace entry 102 occurs when a task that does not contain a tasking CALL statement is terminated.
The format for trace table entries 100, 101, and 102 is shown in the following example. For moreinformation about the Language Environment trace table format, see “Understanding the trace table entry(TTE)” on page 151.
––>(100) NameOfCallingTask NameOfCalledTask OffsetOfCallStmt UserAgrPtr CalledTaskPtr TaskVarPtr EventVarPtr PriorityPtr CallingR2-R5 CallingR12-R14
––>(101) NameOfReturnTask ReturnerR2-R5 ReturnerR12-R14
––>(102) NameOfReturnTask
Debugging example of PL/I for MVS & VM routinesThis section contains examples of PL/I for MVS & VM routines and instructions for using information in theLanguage Environment dump to debug them. Important areas in the source code and in the dump foreach routine are highlighted.
Subscript range errorThe following example illustrates an error caused by an array subscript value outside the declared range.In this example, the declared array value is 10. This routine was compiled with the options LIST, TEST,GOSTMT, and MAP. It was run with the TERMTHDACT(TRACE) option to generate a traceback for thecondition.
5688-235 IBM PL/I for MVS & VM Ver 1 Rel 1 Mod 1 27 FEB 07 11:45:18 PAGE 1 OPTIONS SPECIFIED *PROCESS GOSTMT LIST S STG TEST MAP NOOPTIONS; 5688-235 IBM PL/I for MVS & VM EXAMPLE: PROC OPTIONS(MAIN); PAGE 2 SOURCE LISTING STMT 1 EXAMPLE: PROC OPTIONS(MAIN);
Chapter 7. Debugging PL/I for MVS & VM routines 277
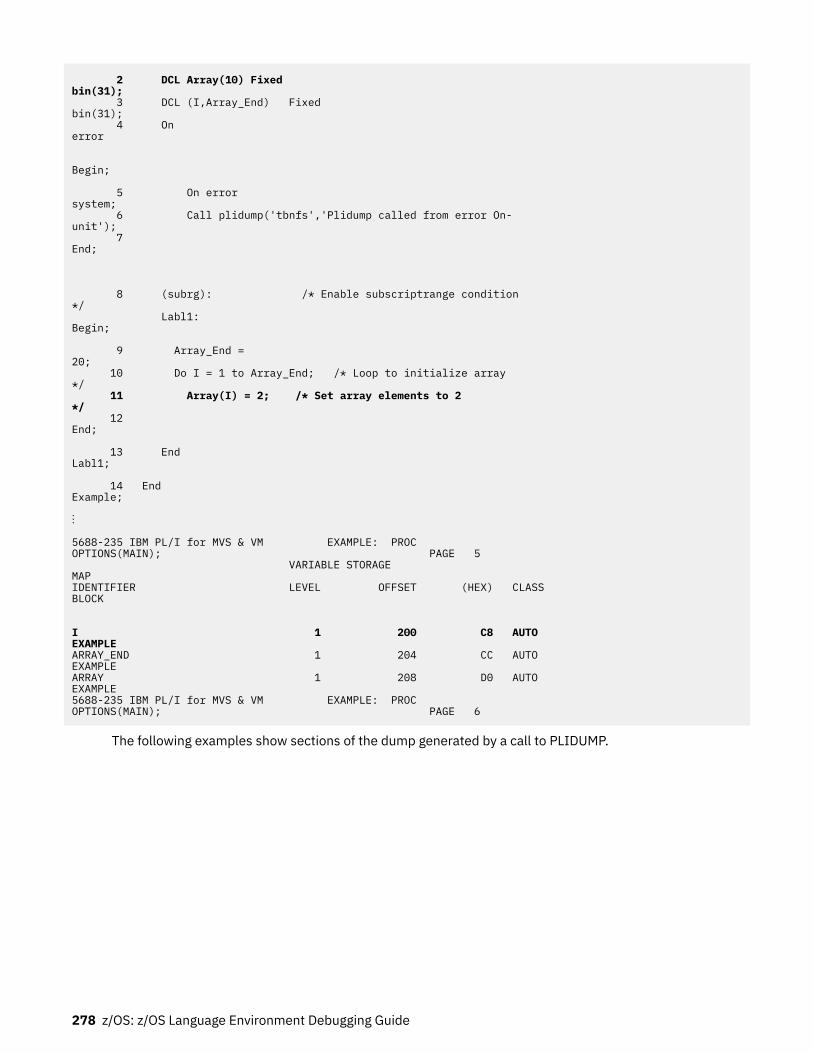
2 DCL Array(10) Fixed bin(31); 3 DCL (I,Array_End) Fixed bin(31); 4 On error Begin; 5 On error system; 6 Call plidump('tbnfs','Plidump called from error On-unit'); 7 End; 8 (subrg): /* Enable subscriptrange condition */ Labl1: Begin; 9 Array_End = 20; 10 Do I = 1 to Array_End; /* Loop to initialize array */ 11 Array(I) = 2; /* Set array elements to 2 */ 12 End; 13 End Labl1; 14 End Example; ⋮ 5688-235 IBM PL/I for MVS & VM EXAMPLE: PROC OPTIONS(MAIN); PAGE 5 VARIABLE STORAGE MAP IDENTIFIER LEVEL OFFSET (HEX) CLASS BLOCK I 1 200 C8 AUTO EXAMPLE ARRAY_END 1 204 CC AUTO EXAMPLE ARRAY 1 208 D0 AUTO EXAMPLE 5688-235 IBM PL/I for MVS & VM EXAMPLE: PROC OPTIONS(MAIN); PAGE 6
The following examples show sections of the dump generated by a call to PLIDUMP.
278 z/OS: z/OS Language Environment Debugging Guide
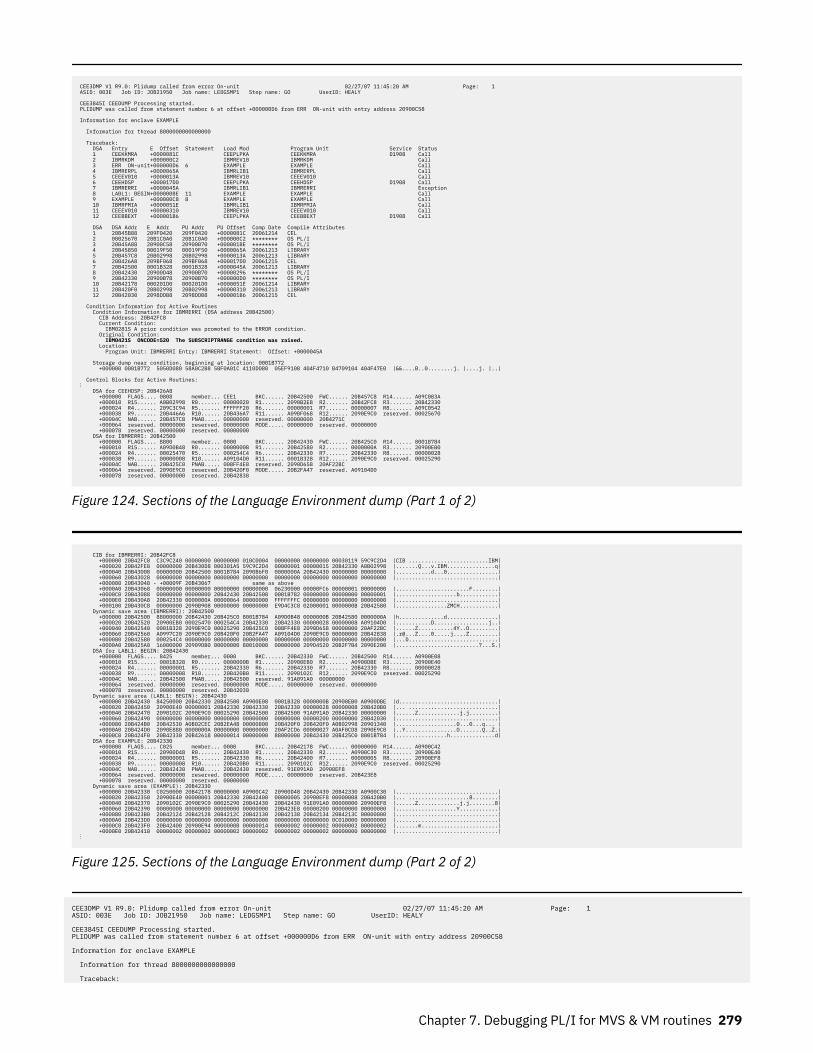
CEE3DMP V1 R9.0: Plidump called from error On-unit 02/27/07 11:45:20 AM Page: 1 ASID: 003E Job ID: JOB21950 Job name: LEDGSMP1 Step name: GO UserID: HEALY CEE3845I CEEDUMP Processing started. PLIDUMP was called from statement number 6 at offset +000000D6 from ERR ON-unit with entry address 20900C58 Information for enclave EXAMPLE Information for thread 8000000000000000 Traceback: DSA Entry E Offset Statement Load Mod Program Unit Service Status 1 CEEKKMRA +0000081C CEEPLPKA CEEKKMRA D1908 Call 2 IBMRKDM +000000C2 IBMREV10 IBMRKDM Call 3 ERR ON-unit+000000D6 6 EXAMPLE EXAMPLE Call 4 IBMRERPL +0000065A IBMRLIB1 IBMRERPL Call 5 CEEEV010 +0000013A IBMREV10 CEEEV010 Call 6 CEEHDSP +000017D0 CEEPLPKA CEEHDSP D1908 Call 7 IBMRERRI +0000045A IBMRLIB1 IBMRERRI Exception 8 LABL1: BEGIN+000000BE 11 EXAMPLE EXAMPLE Call 9 EXAMPLE +000000C8 8 EXAMPLE EXAMPLE Call 10 IBMRPMIA +0000051E IBMRLIB1 IBMRPMIA Call 11 CEEEV010 +00000310 IBMREV10 CEEEV010 Call 12 CEEBBEXT +000001B6 CEEPLPKA CEEBBEXT D1908 Call DSA DSA Addr E Addr PU Addr PU Offset Comp Date Compile Attributes 1 20B45B88 209F0420 209F0420 +0000081C 20061214 CEL 2 00025670 20B1C0A0 20B1C0A0 +000000C2 ******** OS PL/I 3 20B45A88 20900C58 20900B70 +000001BE ******** OS PL/I 4 20B45850 00019F50 00019F50 +0000065A 20061213 LIBRARY 5 20B457C8 20B02998 20B02998 +0000013A 20061213 LIBRARY 6 20B426A8 209BF068 209BF068 +000017D0 20061215 CEL 7 20B42500 0001B328 0001B328 +0000045A 20061213 LIBRARY 8 20B42430 20900D48 20900B70 +00000296 ******** OS PL/I 9 20B42330 20900B78 20900B70 +000000D0 ******** OS PL/I 10 20B42178 000201D0 000201D0 +0000051E 20061214 LIBRARY 11 20B420F0 20B02998 20B02998 +00000310 20061213 LIBRARY 12 20B42030 2098DDB8 2098DDB8 +000001B6 20061215 CEL Condition Information for Active Routines Condition Information for IBMRERRI (DSA address 20B42500) CIB Address: 20B42FC8 Current Condition: IBM0281S A prior condition was promoted to the ERROR condition. Original Condition: IBM0421S ONCODE=520 The SUBSCRIPTRANGE condition was raised. Location: Program Unit: IBMRERRI Entry: IBMRERRI Statement: Offset: +0000045A Storage dump near condition, beginning at location: 0001B772 +000000 0001B772 5050D080 58A0C2B8 58F0A01C 4110D080 05EF9108 404F4710 B4709104 404F47E0 |&&....B..0........j. |....j. |..| Control Blocks for Active Routines: ⋮ DSA for CEEHDSP: 20B426A8 +000000 FLAGS.... 0808 member... CEE1 BKC...... 20B42500 FWC...... 20B457C8 R14...... A09C083A +000010 R15...... A0B02998 R0....... 00000020 R1....... 2090B2E8 R2....... 20B42FC8 R3....... 20B42330 +000024 R4....... 209C3C94 R5....... FFFFFF20 R6....... 00000001 R7....... 00000007 R8....... A09C0542 +000038 R9....... 20B446A6 R10...... 20B436A7 R11...... A09BF068 R12...... 2090E9C0 reserved. 00025670 +00004C NAB...... 20B457C8 PNAB..... 00000000 reserved. 00000000 20B4271C +000064 reserved. 00000000 reserved. 00000000 MODE..... 00000000 reserved. 00000000 +000078 reserved. 00000000 reserved. 00000000 DSA for IBMRERRI: 20B42500 +000000 FLAGS.... 8800 member... 0000 BKC...... 20B42430 FWC...... 20B425C0 R14...... 8001B784 +000010 R15...... A09D0B48 R0....... 0000000B R1....... 20B42580 R2....... 0000000A R3....... 20900EB0 +000024 R4....... 00025470 R5....... 000254C4 R6....... 20B42330 R7....... 20B42330 R8....... 00000028 +000038 R9....... 00000008 R10...... A09104D0 R11...... 0001B328 R12...... 2090E9C0 reserved. 00025290 +00004C NAB...... 20B425C0 PNAB..... 008FF4E8 reserved. 2090D658 20AF22BC +000064 reserved. 2090E9C0 reserved. 20B420F0 MODE..... 20B2FA47 reserved. A09104D0 +000078 reserved. 00000000 reserved. 20B42838
Figure 124. Sections of the Language Environment dump (Part 1 of 2)
CIB for IBMRERRI: 20B42FC8 +000000 20B42FC8 C3C9C240 00000000 00000000 010C0004 00000000 00000000 00030119 59C9C2D4 |CIB .........................IBM| +000020 20B42FE8 00000000 20B430D8 000301A5 59C9C2D4 00000001 00000015 20B42330 A0B02998 |.......Q...v.IBM...............q| +000040 20B43008 00000000 20B42500 8001B784 2090B6F0 0000000A 20B42430 00000000 00000000 |...........d...0................| +000060 20B43028 00000000 00000000 00000000 00000000 00000000 00000000 00000000 00000000 |................................| +000080 20B43048 - +00009F 20B43067 same as above +0000A0 20B43068 00000000 00000000 00000000 00000000 06230000 00000FC6 00000001 00000000 |.......................F........| +0000C0 20B43088 00000000 00000000 20B42430 20B42500 0001B782 00000000 00000000 00000001 |...................b............| +0000E0 20B430A8 20B42330 0000000A 00000064 00000000 FFFFFFFC 00000000 00000000 00000000 |................................| +000100 20B430C8 00000000 2090B908 00000000 00000000 E9D4C3C8 02000001 0000000B 20B42580 |................ZMCH............| Dynamic save area (IBMRERRI): 20B42500 +000000 20B42500 88000000 20B42430 20B425C0 8001B784 A09D0B48 0000000B 20B42580 0000000A |h..............d................| +000020 20B42520 20900EB0 00025470 000254C4 20B42330 20B42330 00000028 00000008 A09104D0 |...........D.................j..| +000040 20B42540 0001B328 2090E9C0 00025290 20B425C0 008FF4E8 2090D658 00000000 20AF22BC |......Z...........4Y..O.........| +000060 20B42560 A0997C20 2090E9C0 20B420F0 20B2FA47 A09104D0 2090E9C0 00000000 20B42838 |[email protected].........| +000080 20B42580 000254C4 00000000 00000000 00000000 00000000 00000000 00000000 00000000 |...D............................| +0000A0 20B425A0 16000000 20909DB0 00000000 80010000 00000000 209D4520 20B2F7B4 2090E200 |..........................7...S.| DSA for LABL1: BEGIN: 20B42430 +000000 FLAGS.... 8425 member... 0000 BKC...... 20B42330 FWC...... 20B42500 R14...... A0900E08 +000010 R15...... 0001B328 R0....... 0000000B R1....... 20900EB0 R2....... A0900DBE R3....... 20900E40 +000024 R4....... 00000001 R5....... 20B42330 R6....... 20B42330 R7....... 20B42330 R8....... 00000028 +000038 R9....... 00000008 R10...... 20B420B0 R11...... 2090102C R12...... 2090E9C0 reserved. 00025290 +00004C NAB...... 20B42500 PNAB..... 20B42500 reserved. 91A091A0 00000000 +000064 reserved. 00000000 reserved. 00000000 MODE..... 00000000 reserved. 00000000 +000078 reserved. 00000000 reserved. 20B42030 Dynamic save area (LABL1: BEGIN): 20B42430 +000000 20B42430 84250000 20B42330 20B42500 A0900E08 0001B328 0000000B 20900EB0 A0900DBE |d...............................| +000020 20B42450 20900E40 00000001 20B42330 20B42330 20B42330 00000028 00000008 20B420B0 |... ............................| +000040 20B42470 2090102C 2090E9C0 00025290 20B42500 20B42500 91A091A0 20B42330 00000000 |......Z.............j.j.........| +000060 20B42490 00000000 00000000 00000000 00000000 00000000 00000200 00000000 20B42030 |................................| +000080 20B424B0 20B42530 A0B02CEC 20B2EA48 00000800 20B420F0 20B420F0 A0B02998 20901340 |...................0...0...q... | +0000A0 20B424D0 2090E880 0000000A 00000000 00000000 20AF2CD6 00000027 A0AF0CD8 2090E9C0 |..Y................O.......Q..Z.| +0000C0 20B424F0 20B42330 20B42618 00000014 00000000 88000000 20B42430 20B425C0 8001B784 |................h..............d| DSA for EXAMPLE: 20B42330 +000000 FLAGS.... C025 member... 0000 BKC...... 20B42178 FWC...... 00000000 R14...... A0900C42 +000010 R15...... 20900D48 R0....... 20B42430 R1....... 20B42330 R2....... A0900C30 R3....... 20900E40 +000024 R4....... 00000001 R5....... 20B42330 R6....... 20B42400 R7....... 00000005 R8....... 20900EF8 +000038 R9....... 00000008 R10...... 20B420B0 R11...... 2090102C R12...... 2090E9C0 reserved. 00025290 +00004C NAB...... 20B42430 PNAB..... 20B42430 reserved. 91E091A0 20900EF8 +000064 reserved. 00000000 reserved. 00000000 MODE..... 00000000 reserved. 20B423E8 +000078 reserved. 00000000 reserved. 00000000 Dynamic save area (EXAMPLE): 20B42330 +000000 20B42330 C0250000 20B42178 00000000 A0900C42 20900D48 20B42430 20B42330 A0900C30 |................................| +000020 20B42350 20900E40 00000001 20B42330 20B42400 00000005 20900EF8 00000008 20B420B0 |... ...................8........| +000040 20B42370 2090102C 2090E9C0 00025290 20B42430 20B42430 91E091A0 00000000 20900EF8 |......Z.............j.j........8| +000060 20B42390 00000000 00000000 00000000 00000000 20B423E8 00000200 00000000 00000000 |...................Y............| +000080 20B423B0 20B42124 20B42128 20B4212C 20B42130 20B42138 20B42134 20B4213C 00000000 |................................| +0000A0 20B423D0 00000000 00000000 00000000 00000000 00000000 00000000 0C010000 00000000 |................................| +0000C0 20B423F0 20B42400 20900E94 0000000B 00000014 00000002 00000002 00000002 00000002 |.......m........................| +0000E0 20B42410 00000002 00000002 00000002 00000002 00000002 00000002 00000000 00000000 |................................|⋮
Figure 125. Sections of the Language Environment dump (Part 2 of 2)
CEE3DMP V1 R9.0: Plidump called from error On-unit 02/27/07 11:45:20 AM Page: 1 ASID: 003E Job ID: JOB21950 Job name: LEDGSMP1 Step name: GO UserID: HEALY CEE3845I CEEDUMP Processing started. PLIDUMP was called from statement number 6 at offset +000000D6 from ERR ON-unit with entry address 20900C58 Information for enclave EXAMPLE Information for thread 8000000000000000 Traceback:
Chapter 7. Debugging PL/I for MVS & VM routines 279
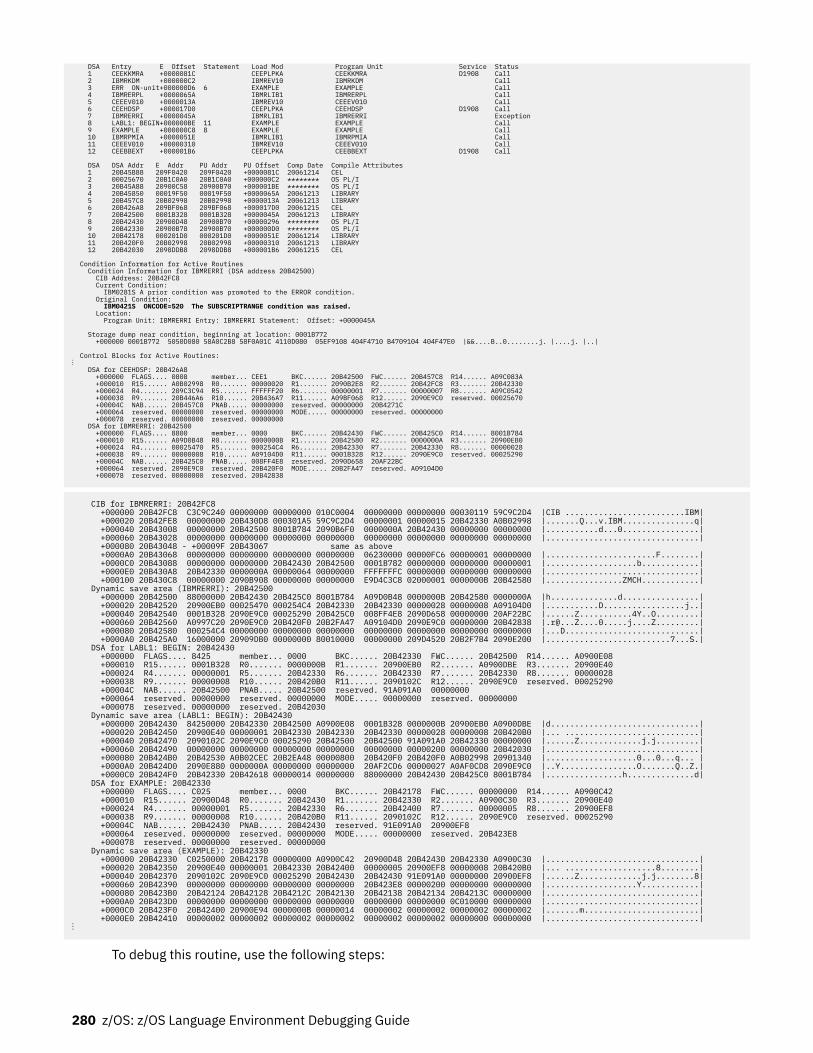
DSA Entry E Offset Statement Load Mod Program Unit Service Status 1 CEEKKMRA +0000081C CEEPLPKA CEEKKMRA D1908 Call 2 IBMRKDM +000000C2 IBMREV10 IBMRKDM Call 3 ERR ON-unit+000000D6 6 EXAMPLE EXAMPLE Call 4 IBMRERPL +0000065A IBMRLIB1 IBMRERPL Call 5 CEEEV010 +0000013A IBMREV10 CEEEV010 Call 6 CEEHDSP +000017D0 CEEPLPKA CEEHDSP D1908 Call 7 IBMRERRI +0000045A IBMRLIB1 IBMRERRI Exception 8 LABL1: BEGIN+000000BE 11 EXAMPLE EXAMPLE Call 9 EXAMPLE +000000C8 8 EXAMPLE EXAMPLE Call 10 IBMRPMIA +0000051E IBMRLIB1 IBMRPMIA Call 11 CEEEV010 +00000310 IBMREV10 CEEEV010 Call 12 CEEBBEXT +000001B6 CEEPLPKA CEEBBEXT D1908 Call DSA DSA Addr E Addr PU Addr PU Offset Comp Date Compile Attributes 1 20B45B88 209F0420 209F0420 +0000081C 20061214 CEL 2 00025670 20B1C0A0 20B1C0A0 +000000C2 ******** OS PL/I 3 20B45A88 20900C58 20900B70 +000001BE ******** OS PL/I 4 20B45850 00019F50 00019F50 +0000065A 20061213 LIBRARY 5 20B457C8 20B02998 20B02998 +0000013A 20061213 LIBRARY 6 20B426A8 209BF068 209BF068 +000017D0 20061215 CEL 7 20B42500 0001B328 0001B328 +0000045A 20061213 LIBRARY 8 20B42430 20900D48 20900B70 +00000296 ******** OS PL/I 9 20B42330 20900B78 20900B70 +000000D0 ******** OS PL/I 10 20B42178 000201D0 000201D0 +0000051E 20061214 LIBRARY 11 20B420F0 20B02998 20B02998 +00000310 20061213 LIBRARY 12 20B42030 2098DDB8 2098DDB8 +000001B6 20061215 CEL Condition Information for Active Routines Condition Information for IBMRERRI (DSA address 20B42500) CIB Address: 20B42FC8 Current Condition: IBM0281S A prior condition was promoted to the ERROR condition. Original Condition: IBM0421S ONCODE=520 The SUBSCRIPTRANGE condition was raised. Location: Program Unit: IBMRERRI Entry: IBMRERRI Statement: Offset: +0000045A Storage dump near condition, beginning at location: 0001B772 +000000 0001B772 5050D080 58A0C2B8 58F0A01C 4110D080 05EF9108 404F4710 B4709104 404F47E0 |&&....B..0........j. |....j. |..| Control Blocks for Active Routines: ⋮ DSA for CEEHDSP: 20B426A8 +000000 FLAGS.... 0808 member... CEE1 BKC...... 20B42500 FWC...... 20B457C8 R14...... A09C083A +000010 R15...... A0B02998 R0....... 00000020 R1....... 2090B2E8 R2....... 20B42FC8 R3....... 20B42330 +000024 R4....... 209C3C94 R5....... FFFFFF20 R6....... 00000001 R7....... 00000007 R8....... A09C0542 +000038 R9....... 20B446A6 R10...... 20B436A7 R11...... A09BF068 R12...... 2090E9C0 reserved. 00025670 +00004C NAB...... 20B457C8 PNAB..... 00000000 reserved. 00000000 20B4271C +000064 reserved. 00000000 reserved. 00000000 MODE..... 00000000 reserved. 00000000 +000078 reserved. 00000000 reserved. 00000000 DSA for IBMRERRI: 20B42500 +000000 FLAGS.... 8800 member... 0000 BKC...... 20B42430 FWC...... 20B425C0 R14...... 8001B784 +000010 R15...... A09D0B48 R0....... 0000000B R1....... 20B42580 R2....... 0000000A R3....... 20900EB0 +000024 R4....... 00025470 R5....... 000254C4 R6....... 20B42330 R7....... 20B42330 R8....... 00000028 +000038 R9....... 00000008 R10...... A09104D0 R11...... 0001B328 R12...... 2090E9C0 reserved. 00025290 +00004C NAB...... 20B425C0 PNAB..... 008FF4E8 reserved. 2090D658 20AF22BC +000064 reserved. 2090E9C0 reserved. 20B420F0 MODE..... 20B2FA47 reserved. A09104D0 +000078 reserved. 00000000 reserved. 20B42838
CIB for IBMRERRI: 20B42FC8 +000000 20B42FC8 C3C9C240 00000000 00000000 010C0004 00000000 00000000 00030119 59C9C2D4 |CIB .........................IBM| +000020 20B42FE8 00000000 20B430D8 000301A5 59C9C2D4 00000001 00000015 20B42330 A0B02998 |.......Q...v.IBM...............q| +000040 20B43008 00000000 20B42500 8001B784 2090B6F0 0000000A 20B42430 00000000 00000000 |...........d...0................| +000060 20B43028 00000000 00000000 00000000 00000000 00000000 00000000 00000000 00000000 |................................| +000080 20B43048 - +00009F 20B43067 same as above +0000A0 20B43068 00000000 00000000 00000000 00000000 06230000 00000FC6 00000001 00000000 |.......................F........| +0000C0 20B43088 00000000 00000000 20B42430 20B42500 0001B782 00000000 00000000 00000001 |...................b............| +0000E0 20B430A8 20B42330 0000000A 00000064 00000000 FFFFFFFC 00000000 00000000 00000000 |................................| +000100 20B430C8 00000000 2090B908 00000000 00000000 E9D4C3C8 02000001 0000000B 20B42580 |................ZMCH............| Dynamic save area (IBMRERRI): 20B42500 +000000 20B42500 88000000 20B42430 20B425C0 8001B784 A09D0B48 0000000B 20B42580 0000000A |h..............d................| +000020 20B42520 20900EB0 00025470 000254C4 20B42330 20B42330 00000028 00000008 A09104D0 |...........D.................j..| +000040 20B42540 0001B328 2090E9C0 00025290 20B425C0 008FF4E8 2090D658 00000000 20AF22BC |......Z...........4Y..O.........| +000060 20B42560 A0997C20 2090E9C0 20B420F0 20B2FA47 A09104D0 2090E9C0 00000000 20B42838 |[email protected].........| +000080 20B42580 000254C4 00000000 00000000 00000000 00000000 00000000 00000000 00000000 |...D............................| +0000A0 20B425A0 16000000 20909DB0 00000000 80010000 00000000 209D4520 20B2F7B4 2090E200 |..........................7...S.| DSA for LABL1: BEGIN: 20B42430 +000000 FLAGS.... 8425 member... 0000 BKC...... 20B42330 FWC...... 20B42500 R14...... A0900E08 +000010 R15...... 0001B328 R0....... 0000000B R1....... 20900EB0 R2....... A0900DBE R3....... 20900E40 +000024 R4....... 00000001 R5....... 20B42330 R6....... 20B42330 R7....... 20B42330 R8....... 00000028 +000038 R9....... 00000008 R10...... 20B420B0 R11...... 2090102C R12...... 2090E9C0 reserved. 00025290 +00004C NAB...... 20B42500 PNAB..... 20B42500 reserved. 91A091A0 00000000 +000064 reserved. 00000000 reserved. 00000000 MODE..... 00000000 reserved. 00000000 +000078 reserved. 00000000 reserved. 20B42030 Dynamic save area (LABL1: BEGIN): 20B42430 +000000 20B42430 84250000 20B42330 20B42500 A0900E08 0001B328 0000000B 20900EB0 A0900DBE |d...............................| +000020 20B42450 20900E40 00000001 20B42330 20B42330 20B42330 00000028 00000008 20B420B0 |... ............................| +000040 20B42470 2090102C 2090E9C0 00025290 20B42500 20B42500 91A091A0 20B42330 00000000 |......Z.............j.j.........| +000060 20B42490 00000000 00000000 00000000 00000000 00000000 00000200 00000000 20B42030 |................................| +000080 20B424B0 20B42530 A0B02CEC 20B2EA48 00000800 20B420F0 20B420F0 A0B02998 20901340 |...................0...0...q... | +0000A0 20B424D0 2090E880 0000000A 00000000 00000000 20AF2CD6 00000027 A0AF0CD8 2090E9C0 |..Y................O.......Q..Z.| +0000C0 20B424F0 20B42330 20B42618 00000014 00000000 88000000 20B42430 20B425C0 8001B784 |................h..............d| DSA for EXAMPLE: 20B42330 +000000 FLAGS.... C025 member... 0000 BKC...... 20B42178 FWC...... 00000000 R14...... A0900C42 +000010 R15...... 20900D48 R0....... 20B42430 R1....... 20B42330 R2....... A0900C30 R3....... 20900E40 +000024 R4....... 00000001 R5....... 20B42330 R6....... 20B42400 R7....... 00000005 R8....... 20900EF8 +000038 R9....... 00000008 R10...... 20B420B0 R11...... 2090102C R12...... 2090E9C0 reserved. 00025290 +00004C NAB...... 20B42430 PNAB..... 20B42430 reserved. 91E091A0 20900EF8 +000064 reserved. 00000000 reserved. 00000000 MODE..... 00000000 reserved. 20B423E8 +000078 reserved. 00000000 reserved. 00000000 Dynamic save area (EXAMPLE): 20B42330 +000000 20B42330 C0250000 20B42178 00000000 A0900C42 20900D48 20B42430 20B42330 A0900C30 |................................| +000020 20B42350 20900E40 00000001 20B42330 20B42400 00000005 20900EF8 00000008 20B420B0 |... ...................8........| +000040 20B42370 2090102C 2090E9C0 00025290 20B42430 20B42430 91E091A0 00000000 20900EF8 |......Z.............j.j........8| +000060 20B42390 00000000 00000000 00000000 00000000 20B423E8 00000200 00000000 00000000 |...................Y............| +000080 20B423B0 20B42124 20B42128 20B4212C 20B42130 20B42138 20B42134 20B4213C 00000000 |................................| +0000A0 20B423D0 00000000 00000000 00000000 00000000 00000000 00000000 0C010000 00000000 |................................| +0000C0 20B423F0 20B42400 20900E94 0000000B 00000014 00000002 00000002 00000002 00000002 |.......m........................| +0000E0 20B42410 00000002 00000002 00000002 00000002 00000002 00000002 00000000 00000000 |................................|⋮
To debug this routine, use the following steps:
280 z/OS: z/OS Language Environment Debugging Guide
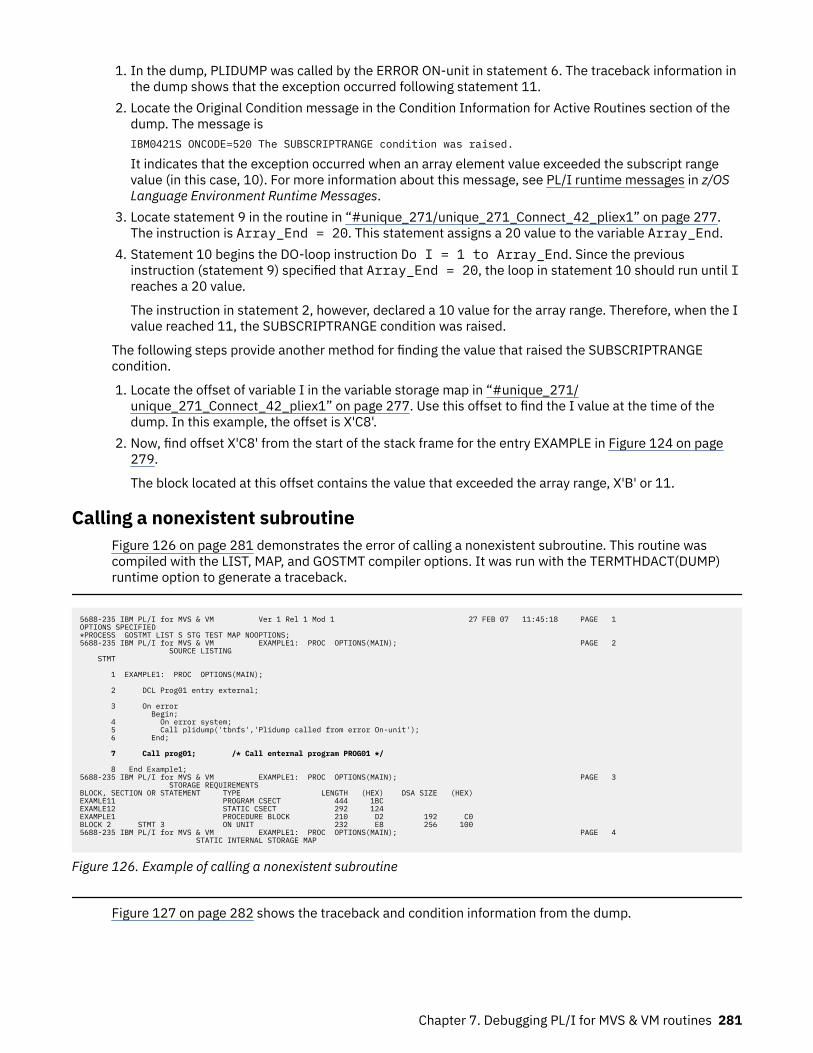
1. In the dump, PLIDUMP was called by the ERROR ON-unit in statement 6. The traceback information inthe dump shows that the exception occurred following statement 11.
2. Locate the Original Condition message in the Condition Information for Active Routines section of thedump. The message isIBM0421S ONCODE=520 The SUBSCRIPTRANGE condition was raised.
It indicates that the exception occurred when an array element value exceeded the subscript rangevalue (in this case, 10). For more information about this message, see PL/I runtime messages in z/OSLanguage Environment Runtime Messages.
3. Locate statement 9 in the routine in “#unique_271/unique_271_Connect_42_pliex1” on page 277.The instruction is Array_End = 20. This statement assigns a 20 value to the variable Array_End.
4. Statement 10 begins the DO-loop instruction Do I = 1 to Array_End. Since the previousinstruction (statement 9) specified that Array_End = 20, the loop in statement 10 should run until Ireaches a 20 value.
The instruction in statement 2, however, declared a 10 value for the array range. Therefore, when the Ivalue reached 11, the SUBSCRIPTRANGE condition was raised.
The following steps provide another method for finding the value that raised the SUBSCRIPTRANGEcondition.
1. Locate the offset of variable I in the variable storage map in “#unique_271/unique_271_Connect_42_pliex1” on page 277. Use this offset to find the I value at the time of thedump. In this example, the offset is X'C8'.
2. Now, find offset X'C8' from the start of the stack frame for the entry EXAMPLE in Figure 124 on page279.
The block located at this offset contains the value that exceeded the array range, X'B' or 11.
Calling a nonexistent subroutineFigure 126 on page 281 demonstrates the error of calling a nonexistent subroutine. This routine wascompiled with the LIST, MAP, and GOSTMT compiler options. It was run with the TERMTHDACT(DUMP)runtime option to generate a traceback.
5688-235 IBM PL/I for MVS & VM Ver 1 Rel 1 Mod 1 27 FEB 07 11:45:18 PAGE 1 OPTIONS SPECIFIED *PROCESS GOSTMT LIST S STG TEST MAP NOOPTIONS; 5688-235 IBM PL/I for MVS & VM EXAMPLE1: PROC OPTIONS(MAIN); PAGE 2 SOURCE LISTING STMT 1 EXAMPLE1: PROC OPTIONS(MAIN); 2 DCL Prog01 entry external; 3 On error Begin; 4 On error system; 5 Call plidump('tbnfs','Plidump called from error On-unit'); 6 End; 7 Call prog01; /* Call enternal program PROG01 */ 8 End Example1; 5688-235 IBM PL/I for MVS & VM EXAMPLE1: PROC OPTIONS(MAIN); PAGE 3 STORAGE REQUIREMENTS BLOCK, SECTION OR STATEMENT TYPE LENGTH (HEX) DSA SIZE (HEX) EXAMLE11 PROGRAM CSECT 444 1BC EXAMLE12 STATIC CSECT 292 124 EXAMPLE1 PROCEDURE BLOCK 210 D2 192 C0 BLOCK 2 STMT 3 ON UNIT 232 E8 256 100 5688-235 IBM PL/I for MVS & VM EXAMPLE1: PROC OPTIONS(MAIN); PAGE 4 STATIC INTERNAL STORAGE MAP
Figure 126. Example of calling a nonexistent subroutine
Figure 127 on page 282 shows the traceback and condition information from the dump.
Chapter 7. Debugging PL/I for MVS & VM routines 281
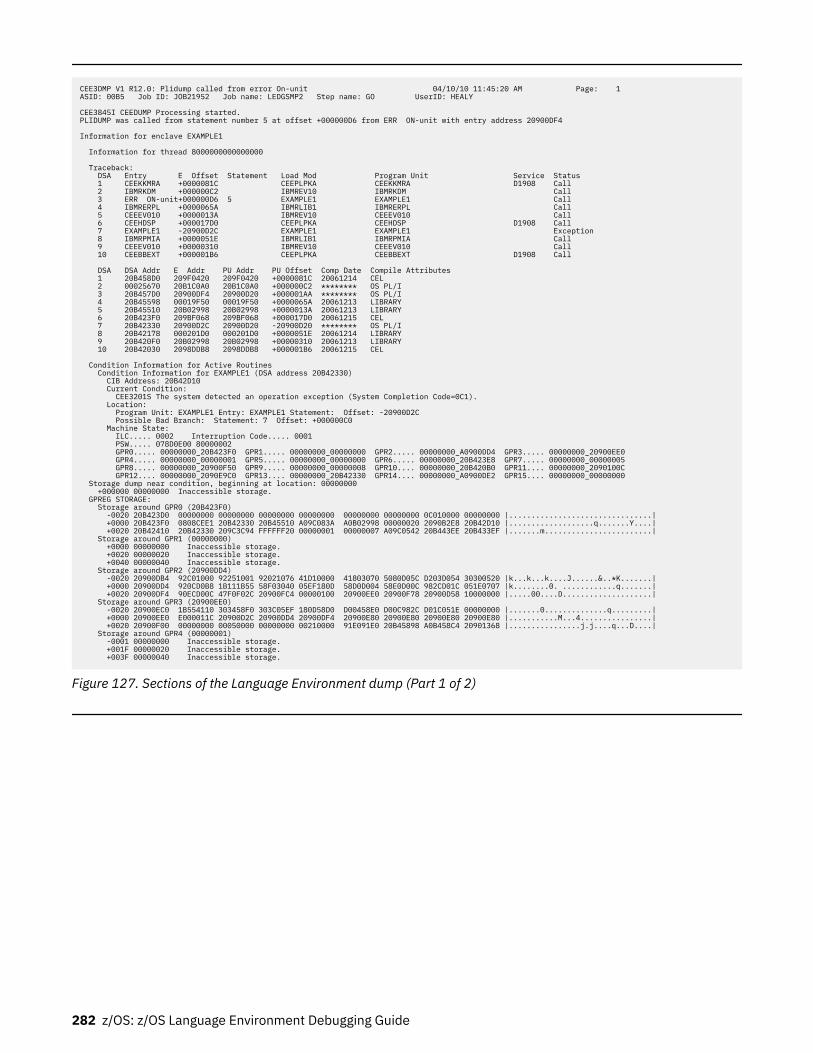
CEE3DMP V1 R12.0: Plidump called from error On-unit 04/10/10 11:45:20 AM Page: 1 ASID: 00B5 Job ID: JOB21952 Job name: LEDGSMP2 Step name: GO UserID: HEALY CEE3845I CEEDUMP Processing started. PLIDUMP was called from statement number 5 at offset +000000D6 from ERR ON-unit with entry address 20900DF4 Information for enclave EXAMPLE1 Information for thread 8000000000000000 Traceback: DSA Entry E Offset Statement Load Mod Program Unit Service Status 1 CEEKKMRA +0000081C CEEPLPKA CEEKKMRA D1908 Call 2 IBMRKDM +000000C2 IBMREV10 IBMRKDM Call 3 ERR ON-unit+000000D6 5 EXAMPLE1 EXAMPLE1 Call 4 IBMRERPL +0000065A IBMRLIB1 IBMRERPL Call 5 CEEEV010 +0000013A IBMREV10 CEEEV010 Call 6 CEEHDSP +000017D0 CEEPLPKA CEEHDSP D1908 Call 7 EXAMPLE1 -20900D2C EXAMPLE1 EXAMPLE1 Exception 8 IBMRPMIA +0000051E IBMRLIB1 IBMRPMIA Call 9 CEEEV010 +00000310 IBMREV10 CEEEV010 Call 10 CEEBBEXT +000001B6 CEEPLPKA CEEBBEXT D1908 Call DSA DSA Addr E Addr PU Addr PU Offset Comp Date Compile Attributes 1 20B458D0 209F0420 209F0420 +0000081C 20061214 CEL 2 00025670 20B1C0A0 20B1C0A0 +000000C2 ******** OS PL/I 3 20B457D0 20900DF4 20900D20 +000001AA ******** OS PL/I 4 20B45598 00019F50 00019F50 +0000065A 20061213 LIBRARY 5 20B45510 20B02998 20B02998 +0000013A 20061213 LIBRARY 6 20B423F0 209BF068 209BF068 +000017D0 20061215 CEL 7 20B42330 20900D2C 20900D20 -20900D20 ******** OS PL/I 8 20B42178 000201D0 000201D0 +0000051E 20061214 LIBRARY 9 20B420F0 20B02998 20B02998 +00000310 20061213 LIBRARY 10 20B42030 2098DDB8 2098DDB8 +000001B6 20061215 CEL Condition Information for Active Routines Condition Information for EXAMPLE1 (DSA address 20B42330) CIB Address: 20B42D10 Current Condition: CEE3201S The system detected an operation exception (System Completion Code=0C1). Location: Program Unit: EXAMPLE1 Entry: EXAMPLE1 Statement: Offset: -20900D2C Possible Bad Branch: Statement: 7 Offset: +000000C0 Machine State: ILC..... 0002 Interruption Code..... 0001 PSW..... 078D0E00 80000002 GPR0..... 00000000_20B423F0 GPR1..... 00000000_00000000 GPR2..... 00000000_A0900DD4 GPR3..... 00000000_20900EE0 GPR4..... 00000000_00000001 GPR5..... 00000000_00000000 GPR6..... 00000000_20B423E8 GPR7..... 00000000_00000005 GPR8..... 00000000_20900F50 GPR9..... 00000000_00000008 GPR10.... 00000000_20B420B0 GPR11.... 00000000_2090100C GPR12.... 00000000_2090E9C0 GPR13.... 00000000_20B42330 GPR14.... 00000000_A0900DE2 GPR15.... 00000000_00000000 Storage dump near condition, beginning at location: 00000000 +000000 00000000 Inaccessible storage. GPREG STORAGE: Storage around GPR0 (20B423F0) -0020 20B423D0 00000000 00000000 00000000 00000000 00000000 00000000 0C010000 00000000 |................................| +0000 20B423F0 0808CEE1 20B42330 20B45510 A09C083A A0B02998 00000020 2090B2E8 20B42D10 |...................q.......Y....| +0020 20B42410 20B42330 209C3C94 FFFFFF20 00000001 00000007 A09C0542 20B443EE 20B433EF |.......m........................| Storage around GPR1 (00000000) +0000 00000000 Inaccessible storage. +0020 00000020 Inaccessible storage. +0040 00000040 Inaccessible storage. Storage around GPR2 (20900DD4) -0020 20900DB4 92C01000 92251001 92021076 41D10000 41803070 5080D05C D203D054 30300520 |k...k...k....J......&..*K.......| +0000 20900DD4 920CD0B8 1B111B55 58F03040 05EF180D 58D0D004 58E0D00C 982CD01C 051E0707 |k........0. ............q.......| +0020 20900DF4 90ECD00C 47F0F02C 20900FC4 00000100 20900EE0 20900F78 20900D58 10000000 |.....00....D....................| Storage around GPR3 (20900EE0) -0020 20900EC0 1B554110 303458F0 303C05EF 180D58D0 D00458E0 D00C982C D01C051E 00000000 |.......0..............q.........| +0000 20900EE0 E000011C 20900D2C 20900DD4 20900DF4 20900E80 20900E80 20900E80 20900E80 |...........M...4................| +0020 20900F00 00000000 00050000 00000000 00210000 91E091E0 20B45898 A0B458C4 20901368 |................j.j....q...D....| Storage around GPR4 (00000001) -0001 00000000 Inaccessible storage. +001F 00000020 Inaccessible storage. +003F 00000040 Inaccessible storage.
Figure 127. Sections of the Language Environment dump (Part 1 of 2)
282 z/OS: z/OS Language Environment Debugging Guide
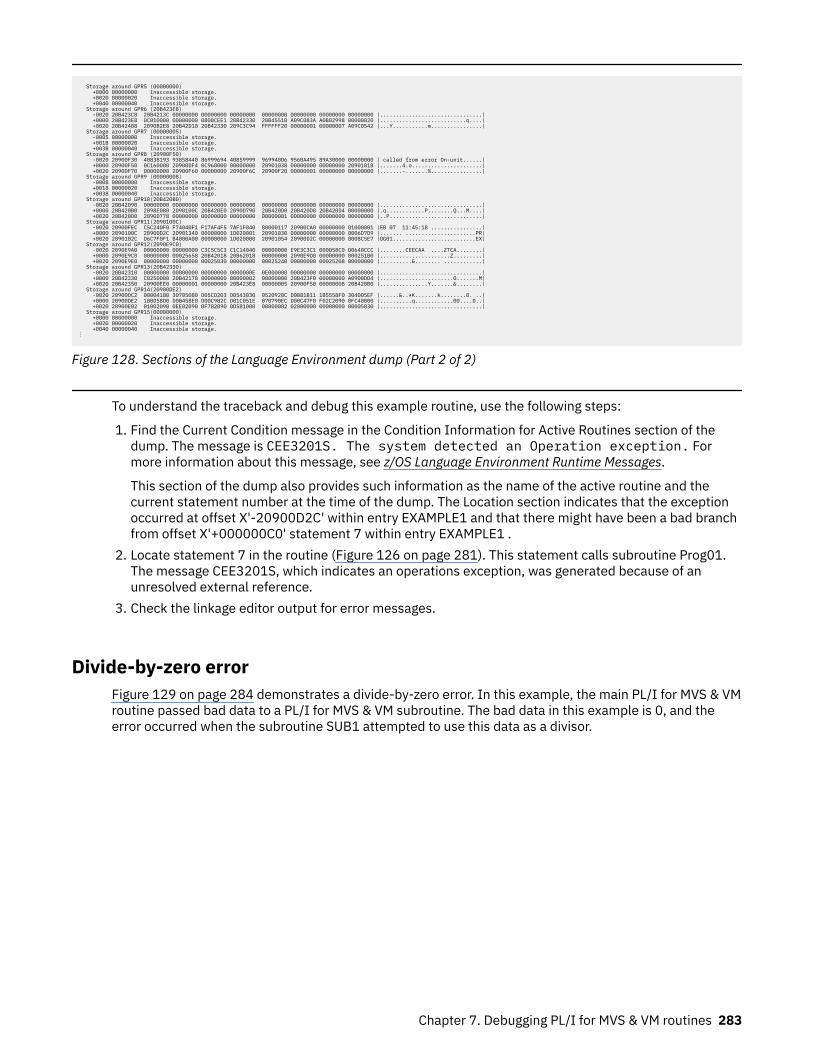
Storage around GPR5 (00000000) +0000 00000000 Inaccessible storage. +0020 00000020 Inaccessible storage. +0040 00000040 Inaccessible storage. Storage around GPR6 (20B423E8) -0020 20B423C8 20B4213C 00000000 00000000 00000000 00000000 00000000 00000000 00000000 |................................| +0000 20B423E8 0C010000 00000000 0808CEE1 20B42330 20B45510 A09C083A A0B02998 00000020 |...........................q....| +0020 20B42408 2090B2E8 20B42D10 20B42330 209C3C94 FFFFFF20 00000001 00000007 A09C0542 |...Y...........m................| Storage around GPR7 (00000005) -0005 00000000 Inaccessible storage. +001B 00000020 Inaccessible storage. +003B 00000040 Inaccessible storage. Storage around GPR8 (20900F50) -0020 20900F30 40838193 93858440 86999694 40859999 969940D6 9560A495 89A30000 00000000 | called from error On-unit......| +0000 20900F50 0C160000 20900DF4 0C960000 00000000 20901038 00000000 00000000 20901018 |.......4.o......................| +0020 20900F70 00000000 20900F60 00000000 20900F6C 20900F20 00000001 00000000 00000000 |.......-.......%................| Storage around GPR9 (00000008) -0008 00000000 Inaccessible storage. +0018 00000020 Inaccessible storage. +0038 00000040 Inaccessible storage. Storage around GPR10(20B420B0) -0020 20B42090 00000000 00000000 00000000 00000000 00000000 00000000 00000000 00000000 |................................| +0000 20B420B0 2098E080 2090100C 20B420E0 2090D790 20B420D0 20B420D8 20B420D4 00000000 |.q............P........Q...M....| +0020 20B420D0 2090D778 00000000 00000000 00000000 00000001 00000000 00000000 00000000 |..P.............................| Storage around GPR11(2090100C) -0020 20900FEC C5C240F0 F74040F1 F17AF4F5 7AF1F840 80000117 20900CA0 00000000 01000001 |EB 07 11:45:18 ................| +0000 2090100C 20900D2C 20901340 00000000 1D020001 20901030 00000000 00000000 0006D7D9 |....... ......................PR| +0020 2090102C D6C7F0F1 B4000A00 00000000 1D020000 20901054 20900D2C 00000000 0008C5E7 |OG01..........................EX| Storage around GPR12(2090E9C0) -0020 2090E9A0 00000000 00000000 C3C5C5C3 C1C14040 00000000 E9E3C3C1 000058C0 D0640CCC |........CEECAA ....ZTCA........| +0000 2090E9C0 00000000 00025658 20B42018 20B62018 00000000 2090E9D0 00000000 000251B0 |......................Z.........| +0020 2090E9E0 00000000 00000000 00025030 00000000 00025240 00000000 00025208 00000000 |..........&........ ............| Storage around GPR13(20B42330) -0020 20B42310 00000000 00000000 00000000 0000000E 0E000000 00000000 00000000 00000000 |................................| +0000 20B42330 C0250000 20B42178 00000000 80000002 00000000 20B423F0 00000000 A0900DD4 |.......................0.......M| +0020 20B42350 20900EE0 00000001 00000000 20B423E8 00000005 20900F50 00000008 20B420B0 |...............Y.......&........| Storage around GPR14(20900DE2) -0020 20900DC2 00004180 30705080 D05CD203 D0543030 0520920C D0B81B11 1B5558F0 304005EF |......&..*K.......k........0. ..| +0000 20900DE2 180D58D0 D00458E0 D00C982C D01C051E 070790EC D00C47F0 F02C2090 0FC40000 |..........q............00....D..| +0020 20900E02 01002090 0EE02090 0F782090 0D581000 00000002 02000000 00000000 00005830 |................................| Storage around GPR15(00000000) +0000 00000000 Inaccessible storage. +0020 00000020 Inaccessible storage. +0040 00000040 Inaccessible storage. ⋮
Figure 128. Sections of the Language Environment dump (Part 2 of 2)
To understand the traceback and debug this example routine, use the following steps:
1. Find the Current Condition message in the Condition Information for Active Routines section of thedump. The message is CEE3201S. The system detected an Operation exception. Formore information about this message, see z/OS Language Environment Runtime Messages.
This section of the dump also provides such information as the name of the active routine and thecurrent statement number at the time of the dump. The Location section indicates that the exceptionoccurred at offset X'-20900D2C' within entry EXAMPLE1 and that there might have been a bad branchfrom offset X'+000000C0' statement 7 within entry EXAMPLE1 .
2. Locate statement 7 in the routine (Figure 126 on page 281). This statement calls subroutine Prog01.The message CEE3201S, which indicates an operations exception, was generated because of anunresolved external reference.
3. Check the linkage editor output for error messages.
Divide-by-zero errorFigure 129 on page 284 demonstrates a divide-by-zero error. In this example, the main PL/I for MVS & VMroutine passed bad data to a PL/I for MVS & VM subroutine. The bad data in this example is 0, and theerror occurred when the subroutine SUB1 attempted to use this data as a divisor.
Chapter 7. Debugging PL/I for MVS & VM routines 283
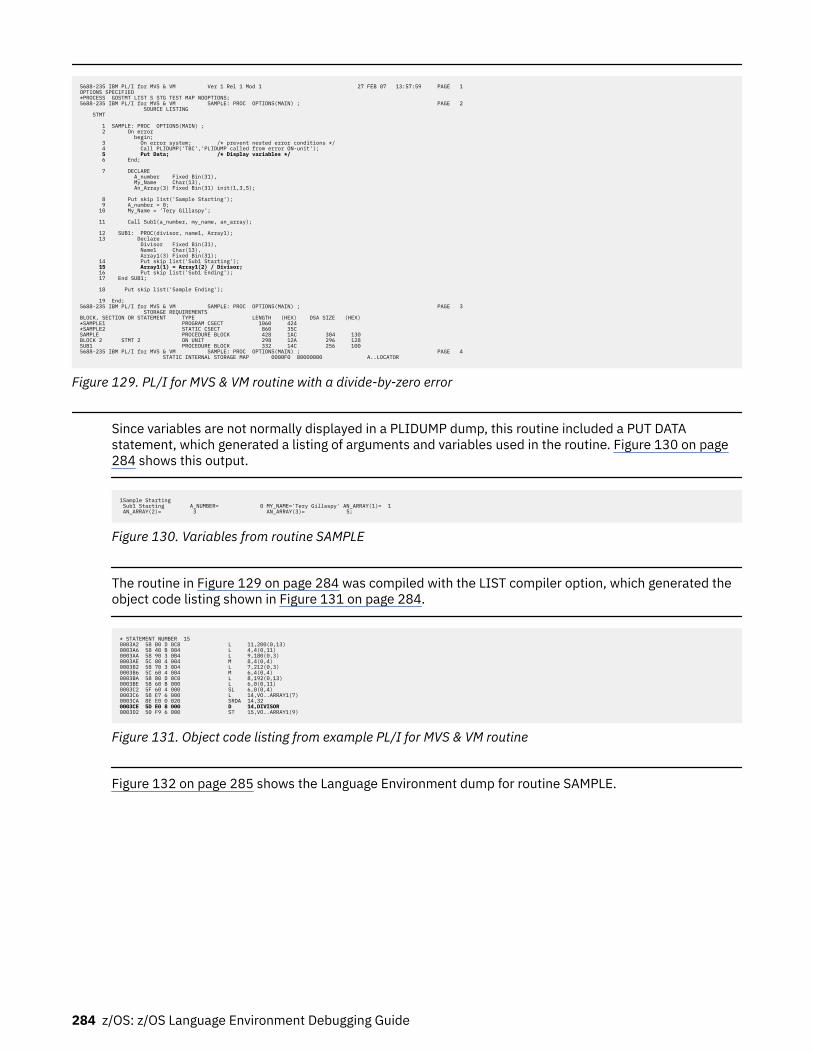
5688-235 IBM PL/I for MVS & VM Ver 1 Rel 1 Mod 1 27 FEB 07 13:57:59 PAGE 1 OPTIONS SPECIFIED *PROCESS GOSTMT LIST S STG TEST MAP NOOPTIONS; 5688-235 IBM PL/I for MVS & VM SAMPLE: PROC OPTIONS(MAIN) ; PAGE 2 SOURCE LISTING STMT 1 SAMPLE: PROC OPTIONS(MAIN) ; 2 On error begin; 3 On error system; /* prevent nested error conditions */ 4 Call PLIDUMP('TBC','PLIDUMP called from error ON-unit'); 5 Put Data; /* Display variables */ 6 End; 7 DECLARE A_number Fixed Bin(31), My_Name Char(13), An_Array(3) Fixed Bin(31) init(1,3,5); 8 Put skip list('Sample Starting'); 9 A_number = 0; 10 My_Name = 'Tery Gillaspy'; 11 Call Sub1(a_number, my_name, an_array); 12 SUB1: PROC(divisor, name1, Array1); 13 Declare Divisor Fixed Bin(31), Name1 Char(13), Array1(3) Fixed Bin(31); 14 Put skip list('Sub1 Starting'); 15 Array1(1) = Array1(2) / Divisor; 16 Put skip list('Sub1 Ending'); 17 End SUB1; 18 Put skip list('Sample Ending'); 19 End; 5688-235 IBM PL/I for MVS & VM SAMPLE: PROC OPTIONS(MAIN) ; PAGE 3 STORAGE REQUIREMENTS BLOCK, SECTION OR STATEMENT TYPE LENGTH (HEX) DSA SIZE (HEX) *SAMPLE1 PROGRAM CSECT 1060 424 *SAMPLE2 STATIC CSECT 860 35C SAMPLE PROCEDURE BLOCK 428 1AC 304 130 BLOCK 2 STMT 2 ON UNIT 298 12A 296 128 SUB1 PROCEDURE BLOCK 332 14C 256 100 5688-235 IBM PL/I for MVS & VM SAMPLE: PROC OPTIONS(MAIN) ; PAGE 4 STATIC INTERNAL STORAGE MAP 0000F0 80000000 A..LOCATOR
Figure 129. PL/I for MVS & VM routine with a divide-by-zero error
Since variables are not normally displayed in a PLIDUMP dump, this routine included a PUT DATAstatement, which generated a listing of arguments and variables used in the routine. Figure 130 on page284 shows this output.
1Sample Starting Sub1 Starting A_NUMBER= 0 MY_NAME='Tery Gillaspy' AN_ARRAY(1)= 1 AN_ARRAY(2)= 3 AN_ARRAY(3)= 5;
Figure 130. Variables from routine SAMPLE
The routine in Figure 129 on page 284 was compiled with the LIST compiler option, which generated theobject code listing shown in Figure 131 on page 284.
* STATEMENT NUMBER 15 0003A2 58 B0 D 0C8 L 11,200(0,13) 0003A6 58 40 B 004 L 4,4(0,11) 0003AA 58 90 3 0B4 L 9,180(0,3) 0003AE 5C 80 4 004 M 8,4(0,4) 0003B2 58 70 3 0D4 L 7,212(0,3) 0003B6 5C 60 4 004 M 6,4(0,4) 0003BA 58 80 D 0C0 L 8,192(0,13) 0003BE 58 60 B 000 L 6,0(0,11) 0003C2 5F 60 4 000 SL 6,0(0,4) 0003C6 58 E7 6 000 L 14,VO..ARRAY1(7) 0003CA 8E E0 0 020 SRDA 14,32 0003CE 5D E0 8 000 D 14,DIVISOR 0003D2 50 F9 6 000 ST 15,VO..ARRAY1(9)
Figure 131. Object code listing from example PL/I for MVS & VM routine
Figure 132 on page 285 shows the Language Environment dump for routine SAMPLE.
284 z/OS: z/OS Language Environment Debugging Guide
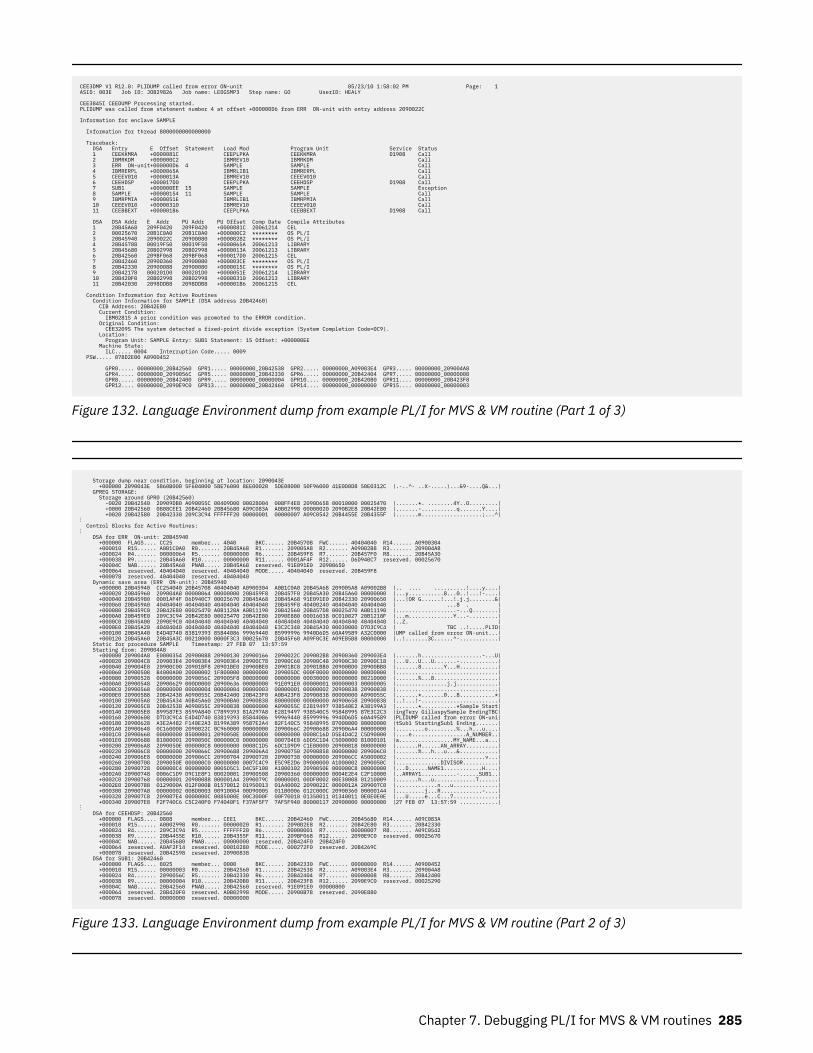
CEE3DMP V1 R12.0: PLIDUMP called from error ON-unit 05/23/10 1:58:02 PM Page: 1 ASID: 003E Job ID: JOB29826 Job name: LEDGSMP3 Step name: GO UserID: HEALY CEE3845I CEEDUMP Processing started. PLIDUMP was called from statement number 4 at offset +000000D6 from ERR ON-unit with entry address 2090022C Information for enclave SAMPLE Information for thread 8000000000000000 Traceback: DSA Entry E Offset Statement Load Mod Program Unit Service Status 1 CEEKKMRA +0000081C CEEPLPKA CEEKKMRA D1908 Call 2 IBMRKDM +000000C2 IBMREV10 IBMRKDM Call 3 ERR ON-unit+000000D6 4 SAMPLE SAMPLE Call 4 IBMRERPL +0000065A IBMRLIB1 IBMRERPL Call 5 CEEEV010 +0000013A IBMREV10 CEEEV010 Call 6 CEEHDSP +000017D0 CEEPLPKA CEEHDSP D1908 Call 7 SUB1 +000000EE 15 SAMPLE SAMPLE Exception 8 SAMPLE +00000154 11 SAMPLE SAMPLE Call 9 IBMRPMIA +0000051E IBMRLIB1 IBMRPMIA Call 10 CEEEV010 +00000310 IBMREV10 CEEEV010 Call 11 CEEBBEXT +000001B6 CEEPLPKA CEEBBEXT D1908 Call DSA DSA Addr E Addr PU Addr PU Offset Comp Date Compile Attributes 1 20B45A68 209F0420 209F0420 +0000081C 20061214 CEL 2 00025670 20B1C0A0 20B1C0A0 +000000C2 ******** OS PL/I 3 20B45940 2090022C 20900080 +00000282 ******** OS PL/I 4 20B45708 00019F50 00019F50 +0000065A 20061213 LIBRARY 5 20B45680 20B02998 20B02998 +0000013A 20061213 LIBRARY 6 20B42560 209BF068 209BF068 +000017D0 20061215 CEL 7 20B42460 20900360 20900080 +000003CE ******** OS PL/I 8 20B42330 20900088 20900080 +0000015C ******** OS PL/I 9 20B42178 000201D0 000201D0 +0000051E 20061214 LIBRARY 10 20B420F0 20B02998 20B02998 +00000310 20061213 LIBRARY 11 20B42030 2098DDB8 2098DDB8 +000001B6 20061215 CEL Condition Information for Active Routines Condition Information for SAMPLE (DSA address 20B42460) CIB Address: 20B42E80 Current Condition: IBM0281S A prior condition was promoted to the ERROR condition. Original Condition: CEE3209S The system detected a fixed-point divide exception (System Completion Code=0C9). Location: Program Unit: SAMPLE Entry: SUB1 Statement: 15 Offset: +000000EE Machine State: ILC..... 0004 Interruption Code..... 0009 PSW..... 078D2E00 A0900452 GPR0..... 00000000_20B42560 GPR1..... 00000000_20B42538 GPR2..... 00000000_A09003E4 GPR3..... 00000000_209004A8 GPR4..... 00000000_2090056C GPR5..... 00000000_20B42330 GPR6..... 00000000_20B42404 GPR7..... 00000000_00000008 GPR8..... 00000000_20B42400 GPR9..... 00000000_00000004 GPR10.... 00000000_20B420B0 GPR11.... 00000000_20B423F8 GPR12.... 00000000_2090E9C0 GPR13.... 00000000_20B42460 GPR14.... 00000000_00000000 GPR15.... 00000000_00000003
Figure 132. Language Environment dump from example PL/I for MVS & VM routine (Part 1 of 3)
Storage dump near condition, beginning at location: 2090043E +000000 2090043E 5860B000 5F604000 58E76000 8EE00020 5DE08000 50F96000 41E0D0D8 50E0312C |.-..^- ..X-.....)...&9-....Q&...| GPREG STORAGE: Storage around GPR0 (20B42560) -0020 20B42540 20909DB0 A090055C 00409D00 00028004 008FF4E8 2090D658 00010000 00025470 |.......*. ........4Y..O.........| +0000 20B42560 0808CEE1 20B42460 20B45680 A09C083A A0B02998 00000020 2090B2E8 20B42E80 |.......-...........q.......Y....| +0020 20B42580 20B42330 209C3C94 FFFFFF20 00000001 00000007 A09C0542 20B4455E 20B4355F |.......m...................;...^|⋮ Control Blocks for Active Routines: ⋮ DSA for ERR ON-unit: 20B45940 +000000 FLAGS.... CC25 member... 4040 BKC...... 20B45708 FWC...... 40404040 R14...... A0900304 +000010 R15...... A0B1C0A0 R0....... 20B45A68 R1....... 209005A8 R2....... A09002B8 R3....... 209004A8 +000024 R4....... 00000064 R5....... 00000000 R6....... 20B459F8 R7....... 20B457F0 R8....... 20B45A30 +000038 R9....... 20B45A60 R10...... 00000000 R11...... 0001AF4F R12...... D6D940C7 reserved. 00025670 +00004C NAB...... 20B45A68 PNAB..... 20B45A68 reserved. 91E091E0 20900650 +000064 reserved. 40404040 reserved. 40404040 MODE..... 40404040 reserved. 20B459F8 +000078 reserved. 40404040 reserved. 40404040 Dynamic save area (ERR ON-unit): 20B45940 +000000 20B45940 CC254040 20B45708 40404040 A0900304 A0B1C0A0 20B45A68 209005A8 A09002B8 |.. .... ..........!....y....| +000020 20B45960 209004A8 00000064 00000000 20B459F8 20B457F0 20B45A30 20B45A60 00000000 |...y...........8...0..!...!-....| +000040 20B45980 0001AF4F D6D940C7 00025670 20B45A68 20B45A68 91E091E0 20B42330 20900650 |...|OR G......!...!.j.j........&| +000060 20B459A0 40404040 40404040 40404040 40404040 20B459F8 40400240 40404040 40404040 | ...8 . | +000080 20B459C0 20B42E80 00025470 A0B1120A A0B11190 20B42560 20B457D8 00025470 A0B11190 |...................-...Q........| +0000A0 20B459E0 209C3C94 20B42E80 00025470 20B42E80 2090E880 00016038 0C010027 20B1218F |...m..............Y...-.........| +0000C0 20B45A00 2090E9C0 40404040 40404040 40404040 40404040 40404040 40404040 40404040 |..Z. | +0000E0 20B45A20 40404040 40404040 40404040 40404040 E3C2C340 20B45A30 00030000 D7D3C9C4 | TBC ..!.....PLID| +000100 20B45A40 E4D4D740 83819393 85844086 99969440 85999996 9940D6D5 60A49589 A32C0000 |UMP called from error ON-unit...| +000120 20B45A60 20B45A3C 00210000 0000F3C3 00025670 20B45F60 A09F0C3E A09EB5B8 00000000 |..!.......3C......^-............| Static for procedure SAMPLE Timestamp: 27 FEB 07 13:57:59 Starting from: 209004A8 +000000 209004A8 E0000354 20900088 20900130 20900166 2090022C 209002B8 20900360 209003E4 |.......h...................-...U| +000020 209004C8 209003E4 209003E4 209003E4 20900C78 20900C60 20900C48 20900C30 20900C18 |...U...U...U.......-............| +000040 209004E8 20900C00 20901BF8 20901BE0 20900BE8 20901BC8 20901BB0 20900BD0 20900BB8 |.......8.......Y...H............| +000060 20900508 B4000A00 20000002 1F800000 00000000 209005DC 000F0000 00000000 000D0000 |................................| +000080 20900528 00000000 2090056C 209005F8 000D0000 00000000 00030000 00000000 00210000 |.......%...8....................| +0000A0 20900548 20900629 000D0000 20900636 000B0000 91E091E0 00000001 00000003 00000005 |................j.j.............| +0000C0 20900568 00000000 00000004 00000004 00000003 00000001 00000002 20900838 20900838 |................................| +0000E0 20900588 20B42438 A090055C 20B42400 20B423F0 A0B423F8 20900838 00000000 A090055C |.......*.......0...8...........*| +000100 209005A8 20B45A34 A0B45A60 20900BA0 20900838 80000000 00000000 A0900658 20900838 |..!...!-........................| +000120 209005C8 20B42538 A090055C 20900838 00000000 A090055C E2819497 938540E2 A38199A3 |.......*...........*Sample Start| +000140 209005E8 899587E3 8599A840 C7899393 81A297A8 E2819497 938540C5 95848995 87E3C2C3 |ingTery GillaspySample EndingTBC| +000160 20900608 D7D3C9C4 E4D4D740 83819393 85844086 99969440 85999996 9940D6D5 60A49589 |PLIDUMP called from error ON-uni| +000180 20900628 A3E2A482 F140E2A3 8199A389 9587E2A4 82F140C5 95848995 87000000 00000000 |tSub1 StartingSub1 Ending.......| +0001A0 20900648 0C160000 2090022C 0C960000 00000000 2090066C 20900688 209006A4 00000000 |.........o.........%...h...u....| +0001C0 20900668 00000000 85000001 2090050E 000000D0 00000000 0008C16D D5E4D4C2 C5D90000 |....e.................A_NUMBER..| +0001E0 20900688 81000001 2090050C 000000C0 00000000 0007D4E8 6DD5C1D4 C5000000 81000101 |a.................MY_NAME...a...| +000200 209006A8 2090050E 000000C8 00000000 0008C1D5 6DC1D9D9 C1E80000 20900818 00000000 |.......H......AN_ARRAY..........| +000220 209006C8 00000000 2090066C 20900688 209006A4 20900750 20900858 00000000 209006C0 |.......%...h...u...&............| +000240 209006E8 00000000 209006CC 20900704 20900720 20900738 00000000 209006CC A5000002 |............................v...| +000260 20900708 2090050E 000000C0 00000000 0007C4C9 E5C9E2D6 D9000000 A1000002 2090050C |..............DIVISOR...........| +000280 20900728 000000C4 00000000 0005D5C1 D4C5F100 A1000102 2090050E 000000C8 00000000 |...D......NAME1............H....| +0002A0 20900748 0006C1D9 D9C1E8F1 0D020001 20900508 20900360 00000000 0004E2E4 C2F10000 |..ARRAY1...........-......SUB1..| +0002C0 20900768 00000001 20900088 000001A4 2090079C 00000001 00DF0002 00E30008 01210009 |.......h...u.............T......| +0002E0 20900788 0129000A 012F000B 01570012 01950013 01A40002 2090022C 0000012A 209007C0 |.............n...u..............| +000300 209007A8 00000002 008D0003 00910004 00D90005 011B0006 012C000C 20900360 00000144 |.........j...R.............-....| +000320 209007C8 209007E4 0000000C 0085000E 00C3000F 00F70010 01350011 01340011 0E0E0E0E |...U.....e...C...7..............| +000340 209007E8 F2F740C6 C5C240F0 F74040F1 F37AF5F7 7AF5F940 80000117 20900000 00000000 |27 FEB 07 13:57:59 ............|⋮ DSA for CEEHDSP: 20B42560 +000000 FLAGS.... 0808 member... CEE1 BKC...... 20B42460 FWC...... 20B45680 R14...... A09C083A +000010 R15...... A0B02998 R0....... 00000020 R1....... 2090B2E8 R2....... 20B42E80 R3....... 20B42330 +000024 R4....... 209C3C94 R5....... FFFFFF20 R6....... 00000001 R7....... 00000007 R8....... A09C0542 +000038 R9....... 20B4455E R10...... 20B4355F R11...... 209BF068 R12...... 2090E9C0 reserved. 00025670 +00004C NAB...... 20B45680 PNAB..... 00000000 reserved. 20B424F0 20B424F0 +000064 reserved. A0AF2F14 reserved. 00010280 MODE..... 000272F0 reserved. 20B4269C +000078 reserved. 20B42598 reserved. 20900838 DSA for SUB1: 20B42460 +000000 FLAGS.... 8025 member... 0000 BKC...... 20B42330 FWC...... 00000000 R14...... A0900452 +000010 R15...... 00000003 R0....... 20B42560 R1....... 20B42538 R2....... A09003E4 R3....... 209004A8 +000024 R4....... 2090056C R5....... 20B42330 R6....... 20B42404 R7....... 00000008 R8....... 20B42400 +000038 R9....... 00000004 R10...... 20B420B0 R11...... 20B423F8 R12...... 2090E9C0 reserved. 00025290 +00004C NAB...... 20B42560 PNAB..... 20B42560 reserved. 91E091E0 00000800 +000064 reserved. 20B420F0 reserved. A0B02998 MODE..... 20900B78 reserved. 2090E880 +000078 reserved. 00000000 reserved. 00000000
Figure 133. Language Environment dump from example PL/I for MVS & VM routine (Part 2 of 3)
Chapter 7. Debugging PL/I for MVS & VM routines 285
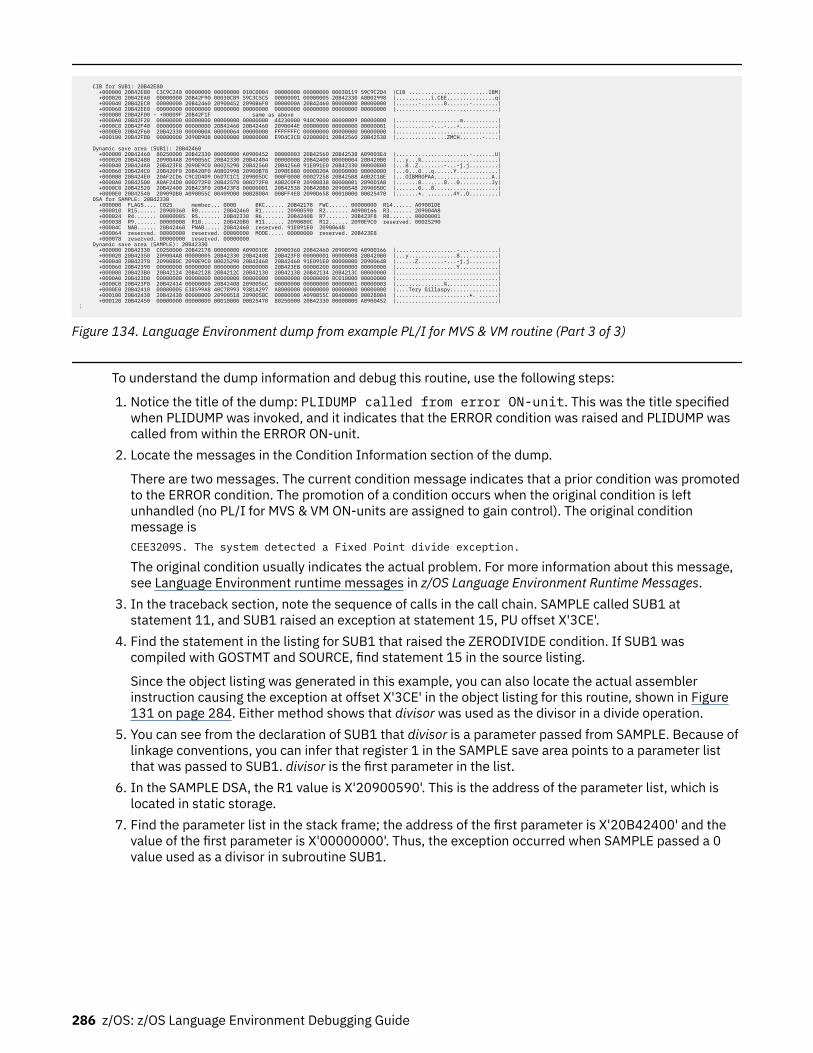
CIB for SUB1: 20B42E80 +000000 20B42E80 C3C9C240 00000000 00000000 010C0004 00000000 00000000 00030119 59C9C2D4 |CIB .........................IBM| +000020 20B42EA0 00000000 20B42F90 00030C89 59C3C5C5 00000001 00000005 20B42330 A0B02998 |...........i.CEE...............q| +000040 20B42EC0 00000000 20B42460 20900452 2090B6F0 0000000A 20B42460 00000000 00000000 |.......-.......0.......-........| +000060 20B42EE0 00000000 00000000 00000000 00000000 00000000 00000000 00000000 00000000 |................................| +000080 20B42F00 - +00009F 20B42F1F same as above +0000A0 20B42F20 00000000 00000000 00000000 00000000 44230000 940C9000 00000009 00000000 |....................m...........| +0000C0 20B42F40 00000000 00000000 20B42460 20B42460 2090044E 00000000 00000000 00000001 |...........-...-...+............| +0000E0 20B42F60 20B42330 0000000A 00000064 00000000 FFFFFFFC 00000000 00000000 00000000 |................................| +000100 20B42F80 00000000 2090B908 00000000 00000000 E9D4C3C8 02000001 20B42560 20B42538 |................ZMCH.......-....|
Dynamic save area (SUB1): 20B42460 +000000 20B42460 80250000 20B42330 00000000 A0900452 00000003 20B42560 20B42538 A09003E4 |.......................-.......U| +000020 20B42480 209004A8 2090056C 20B42330 20B42404 00000008 20B42400 00000004 20B420B0 |...y...%........................| +000040 20B424A0 20B423F8 2090E9C0 00025290 20B42560 20B42560 91E091E0 20B42330 00000800 |...8..Z........-...-j.j.........| +000060 20B424C0 20B420F0 20B420F0 A0B02998 20900B78 2090E880 0000020A 00000000 00000000 |...0...0...q......Y.............| +000080 20B424E0 20AF2CD6 C9C2D4D9 D6D7C1C1 209005DC 000F0000 00027258 20B425B8 A0B2C18E |...OIBMROPAA..................A.| +0000A0 20B42500 A0AF24D0 000272F0 20B42570 000272F0 A0B2C0F0 20900838 00000001 2090D1A8 |.......0.......0...0..........Jy| +0000C0 20B42520 20B42400 20B423F0 20B423F8 00000001 20B42538 20B420B0 20900548 2090050C |.......0...8....................| +0000E0 20B42540 20909DB0 A090055C 00409D00 00028004 008FF4E8 2090D658 00010000 00025470 |.......*. ........4Y..O.........| DSA for SAMPLE: 20B42330 +000000 FLAGS.... C025 member... 0000 BKC...... 20B42178 FWC...... 00000000 R14...... A09001DE +000010 R15...... 20900360 R0....... 20B42460 R1....... 20900590 R2....... A0900166 R3....... 209004A8 +000024 R4....... 00000005 R5....... 20B42330 R6....... 20B42408 R7....... 20B423F8 R8....... 00000001 +000038 R9....... 00000008 R10...... 20B420B0 R11...... 2090080C R12...... 2090E9C0 reserved. 00025290 +00004C NAB...... 20B42460 PNAB..... 20B42460 reserved. 91E091E0 20900648 +000064 reserved. 00000000 reserved. 00000000 MODE..... 00000000 reserved. 20B423E8 +000078 reserved. 00000000 reserved. 00000000 Dynamic save area (SAMPLE): 20B42330 +000000 20B42330 C0250000 20B42178 00000000 A09001DE 20900360 20B42460 20900590 A0900166 |...................-...-........| +000020 20B42350 209004A8 00000005 20B42330 20B42408 20B423F8 00000001 00000008 20B420B0 |...y...............8............| +000040 20B42370 2090080C 2090E9C0 00025290 20B42460 20B42460 91E091E0 00000000 20900648 |......Z........-...-j.j.........| +000060 20B42390 00000000 00000000 00000000 00000000 20B423E8 00000200 00000000 00000000 |...................Y............| +000080 20B423B0 20B42124 20B42128 20B4212C 20B42130 20B42138 20B42134 20B4213C 00000000 |................................| +0000A0 20B423D0 00000000 00000000 00000000 00000000 00000000 00000000 0C010000 00000000 |................................| +0000C0 20B423F0 20B42414 000D0000 20B42408 2090056C 00000000 00000000 00000001 00000003 |...............%................| +0000E0 20B42410 00000005 E38599A8 40C78993 9381A297 A8000000 00000000 00000000 00000000 |....Tery Gillaspy...............| +000100 20B42430 20B42438 00000000 20900518 2090050C 00000000 A090055C 00400000 00028004 |.......................*. ......| +000120 20B42450 00000000 00000000 00010000 00025470 80250000 20B42330 00000000 A0900452 |................................|⋮
Figure 134. Language Environment dump from example PL/I for MVS & VM routine (Part 3 of 3)
To understand the dump information and debug this routine, use the following steps:
1. Notice the title of the dump: PLIDUMP called from error ON-unit. This was the title specifiedwhen PLIDUMP was invoked, and it indicates that the ERROR condition was raised and PLIDUMP wascalled from within the ERROR ON-unit.
2. Locate the messages in the Condition Information section of the dump.
There are two messages. The current condition message indicates that a prior condition was promotedto the ERROR condition. The promotion of a condition occurs when the original condition is leftunhandled (no PL/I for MVS & VM ON-units are assigned to gain control). The original conditionmessage isCEE3209S. The system detected a Fixed Point divide exception.
The original condition usually indicates the actual problem. For more information about this message,see Language Environment runtime messages in z/OS Language Environment Runtime Messages.
3. In the traceback section, note the sequence of calls in the call chain. SAMPLE called SUB1 atstatement 11, and SUB1 raised an exception at statement 15, PU offset X'3CE'.
4. Find the statement in the listing for SUB1 that raised the ZERODIVIDE condition. If SUB1 wascompiled with GOSTMT and SOURCE, find statement 15 in the source listing.
Since the object listing was generated in this example, you can also locate the actual assemblerinstruction causing the exception at offset X'3CE' in the object listing for this routine, shown in Figure131 on page 284. Either method shows that divisor was used as the divisor in a divide operation.
5. You can see from the declaration of SUB1 that divisor is a parameter passed from SAMPLE. Because oflinkage conventions, you can infer that register 1 in the SAMPLE save area points to a parameter listthat was passed to SUB1. divisor is the first parameter in the list.
6. In the SAMPLE DSA, the R1 value is X'20900590'. This is the address of the parameter list, which islocated in static storage.
7. Find the parameter list in the stack frame; the address of the first parameter is X'20B42400' and thevalue of the first parameter is X'00000000'. Thus, the exception occurred when SAMPLE passed a 0value used as a divisor in subroutine SUB1.
286 z/OS: z/OS Language Environment Debugging Guide
Chapter 8. Debugging Enterprise PL/I routines
This topic contains information that can help you debug applications that contain one or more EnterprisePL/I routines. Following a discussion about potential errors in Enterprise PL/I routines, the first part ofthis information discusses how to use compiler-generated listings to obtain information about EnterprisePL/I routines, and how to use PLIDUMP to generate a Language Environment dump of an Enterprise PL/Iroutine. The last part of the chapter provides examples of Enterprise PL/I routines and explains how todebug them using information contained in the traceback information provided in the dump.
Determining the source of errors in Enterprise PL/I routinesMost errors in Enterprise PL/I routines can be identified by the information provided in Enterprise PL/Iruntime messages, which begin with the prefix IBM. For a list of these messages, see PL/I runtimemessages in z/OS Language Environment Runtime Messages.
A malfunction in running an Enterprise PL/I routine can be caused by:
• Logic errors in the source routine• Invalid use of Enterprise PL/I• Unforeseen errors• Invalid input data• Compiler or runtime routine malfunction• System malfunction• Unidentified routine malfunction• Overlaid storage
Logic errors in the source routineErrors of this type are often difficult to detect because they often appear as compiler or librarymalfunctions. Some common errors in source routines are:
• Incorrect conversion from arithmetic data• Incorrect arithmetic and string manipulation operations• Unmatched data lists and format lists
Invalid use of Enterprise PL/IA misunderstanding of the language or a failure to provide the correct environment for using EnterprisePL/I can result in an apparent malfunction of an Enterprise PL/I routine. Any of the following, for example,might cause a malfunction:
• Using uninitialized variables• Using controlled variables that have not been allocated• Reading records into incorrect structures• Misusing array subscripts• Misusing pointer variables• Incorrect conversion• Incorrect arithmetic operations• Incorrect string manipulation operations
© Copyright IBM Corp. 1991, 2020 287
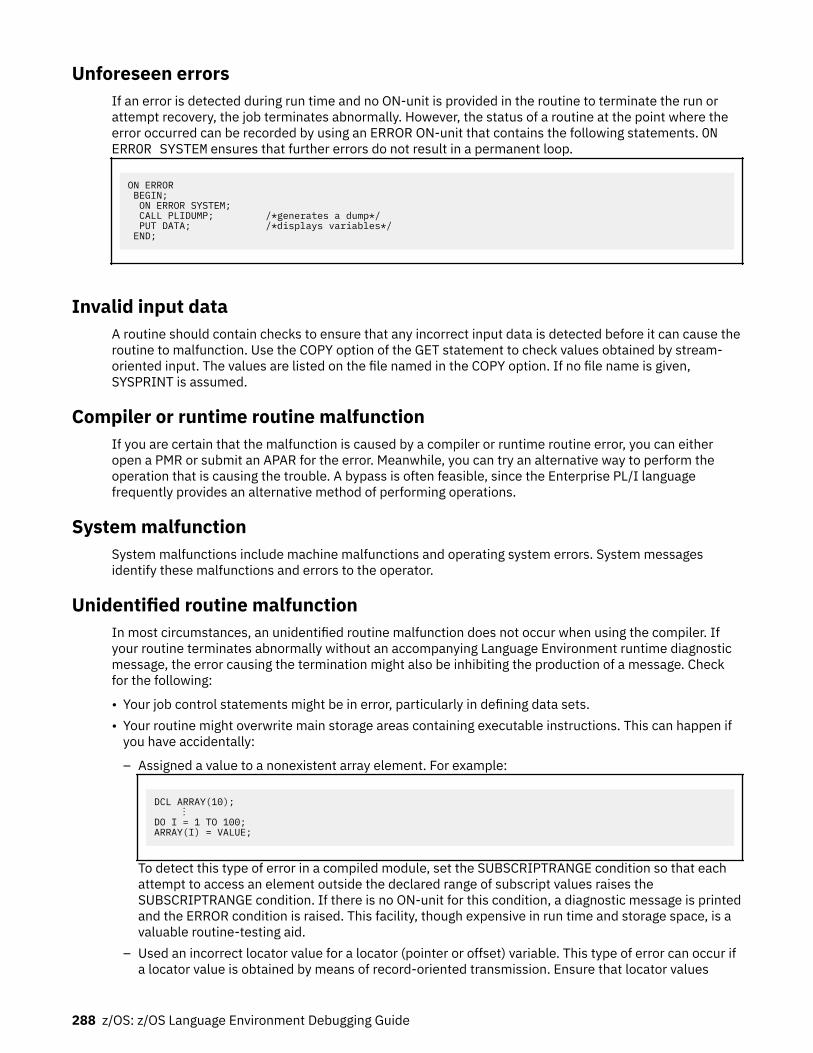
Unforeseen errorsIf an error is detected during run time and no ON-unit is provided in the routine to terminate the run orattempt recovery, the job terminates abnormally. However, the status of a routine at the point where theerror occurred can be recorded by using an ERROR ON-unit that contains the following statements. ONERROR SYSTEM ensures that further errors do not result in a permanent loop.
ON ERROR BEGIN; ON ERROR SYSTEM; CALL PLIDUMP; /*generates a dump*/ PUT DATA; /*displays variables*/ END;
Invalid input dataA routine should contain checks to ensure that any incorrect input data is detected before it can cause theroutine to malfunction. Use the COPY option of the GET statement to check values obtained by stream-oriented input. The values are listed on the file named in the COPY option. If no file name is given,SYSPRINT is assumed.
Compiler or runtime routine malfunctionIf you are certain that the malfunction is caused by a compiler or runtime routine error, you can eitheropen a PMR or submit an APAR for the error. Meanwhile, you can try an alternative way to perform theoperation that is causing the trouble. A bypass is often feasible, since the Enterprise PL/I languagefrequently provides an alternative method of performing operations.
System malfunctionSystem malfunctions include machine malfunctions and operating system errors. System messagesidentify these malfunctions and errors to the operator.
Unidentified routine malfunctionIn most circumstances, an unidentified routine malfunction does not occur when using the compiler. Ifyour routine terminates abnormally without an accompanying Language Environment runtime diagnosticmessage, the error causing the termination might also be inhibiting the production of a message. Checkfor the following:
• Your job control statements might be in error, particularly in defining data sets.• Your routine might overwrite main storage areas containing executable instructions. This can happen if
you have accidentally:
– Assigned a value to a nonexistent array element. For example:
DCL ARRAY(10); ⋮DO I = 1 TO 100;ARRAY(I) = VALUE;
To detect this type of error in a compiled module, set the SUBSCRIPTRANGE condition so that eachattempt to access an element outside the declared range of subscript values raises theSUBSCRIPTRANGE condition. If there is no ON-unit for this condition, a diagnostic message is printedand the ERROR condition is raised. This facility, though expensive in run time and storage space, is avaluable routine-testing aid.
– Used an incorrect locator value for a locator (pointer or offset) variable. This type of error can occur ifa locator value is obtained by means of record-oriented transmission. Ensure that locator values
288 z/OS: z/OS Language Environment Debugging Guide
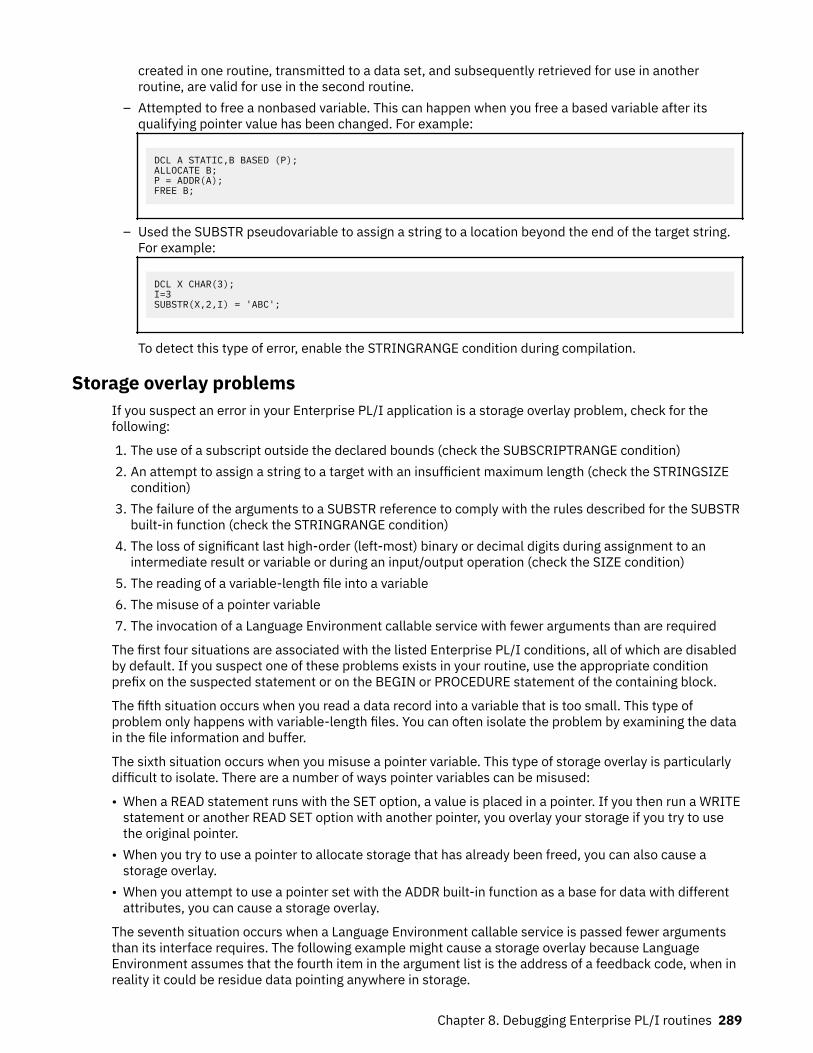
created in one routine, transmitted to a data set, and subsequently retrieved for use in anotherroutine, are valid for use in the second routine.
– Attempted to free a nonbased variable. This can happen when you free a based variable after itsqualifying pointer value has been changed. For example:
DCL A STATIC,B BASED (P);ALLOCATE B;P = ADDR(A);FREE B;
– Used the SUBSTR pseudovariable to assign a string to a location beyond the end of the target string.For example:
DCL X CHAR(3);I=3SUBSTR(X,2,I) = 'ABC';
To detect this type of error, enable the STRINGRANGE condition during compilation.
Storage overlay problemsIf you suspect an error in your Enterprise PL/I application is a storage overlay problem, check for thefollowing:
1. The use of a subscript outside the declared bounds (check the SUBSCRIPTRANGE condition) 2. An attempt to assign a string to a target with an insufficient maximum length (check the STRINGSIZE
condition)3. The failure of the arguments to a SUBSTR reference to comply with the rules described for the SUBSTR
built-in function (check the STRINGRANGE condition)4. The loss of significant last high-order (left-most) binary or decimal digits during assignment to an
intermediate result or variable or during an input/output operation (check the SIZE condition)5. The reading of a variable-length file into a variable6. The misuse of a pointer variable7. The invocation of a Language Environment callable service with fewer arguments than are required
The first four situations are associated with the listed Enterprise PL/I conditions, all of which are disabledby default. If you suspect one of these problems exists in your routine, use the appropriate conditionprefix on the suspected statement or on the BEGIN or PROCEDURE statement of the containing block.
The fifth situation occurs when you read a data record into a variable that is too small. This type ofproblem only happens with variable-length files. You can often isolate the problem by examining the datain the file information and buffer.
The sixth situation occurs when you misuse a pointer variable. This type of storage overlay is particularlydifficult to isolate. There are a number of ways pointer variables can be misused:
• When a READ statement runs with the SET option, a value is placed in a pointer. If you then run a WRITEstatement or another READ SET option with another pointer, you overlay your storage if you try to usethe original pointer.
• When you try to use a pointer to allocate storage that has already been freed, you can also cause astorage overlay.
• When you attempt to use a pointer set with the ADDR built-in function as a base for data with differentattributes, you can cause a storage overlay.
The seventh situation occurs when a Language Environment callable service is passed fewer argumentsthan its interface requires. The following example might cause a storage overlay because LanguageEnvironment assumes that the fourth item in the argument list is the address of a feedback code, when inreality it could be residue data pointing anywhere in storage.
Chapter 8. Debugging Enterprise PL/I routines 289
Invalid calls Valid calls
DCL CEEDATE ENTRY OPTIONS(ASM);CALL CEEDATE(x,y,z); /* invalid */
DCL CEEDATE ENTRY(*,*,*,* OPTIONAL) OPTIONS(ASM);CALL CEEDATE(x,y,z,*); /* valid */CALL CEEDATE(x,y,z,fc); /* valid */
Using Enterprise PL/I compiler listingsThe following sections explain how to generate listings that contain information about your routine.Enterprise PL/I listings show machine instructions, constants, and external or internal addresses that thelinkage editor resolves. This information can help you find other information, such as variable values, in adump of an Enterprise PL/I routine.
Note: Enterprise PL/I shares a common compiler back-end with C/C++. The Enterprise PL/I assemblerlisting will, consequently, have a similar form to those from the XL C/C++ compiler.
The compiler listings included below are from the Enterprise PL/I product.
Generating Enterprise PL/I listings and mapsTable 47 on page 290 shows compiler-generated listings that you might find helpful when you useinformation in dumps to debug Enterprise PL/I routines.
Table 47. Compiler-generated PL/I listings and their contents
Name Contents Compiler Option
Source program Source program statements SOURCE
Cross reference Cross reference of names with attributes XREF and ATTRIBUTES
Aggregate table Names and layouts of structures and arrays AGGREGATE
Variable map Offsets of automatic and static internal variables (from theirdefining base)
MAP
Object code Contents of the program control section in hexadecimalnotation and translated into a pseudo-assembler format.
LIST
Variable map, objectcode, static storage
Same as MAP and LIST options above, plus contents of staticinternal and static external control sections in hexadecimalnotation with comments
MAP and LIST
Finding information in Enterprise PL/I listingsFigure 135 on page 291 shows the first two pages of an example Enterprise PL/I routine that wascompiled with the LIST, MAP and SOURCE options.
290 z/OS: z/OS Language Environment Debugging Guide
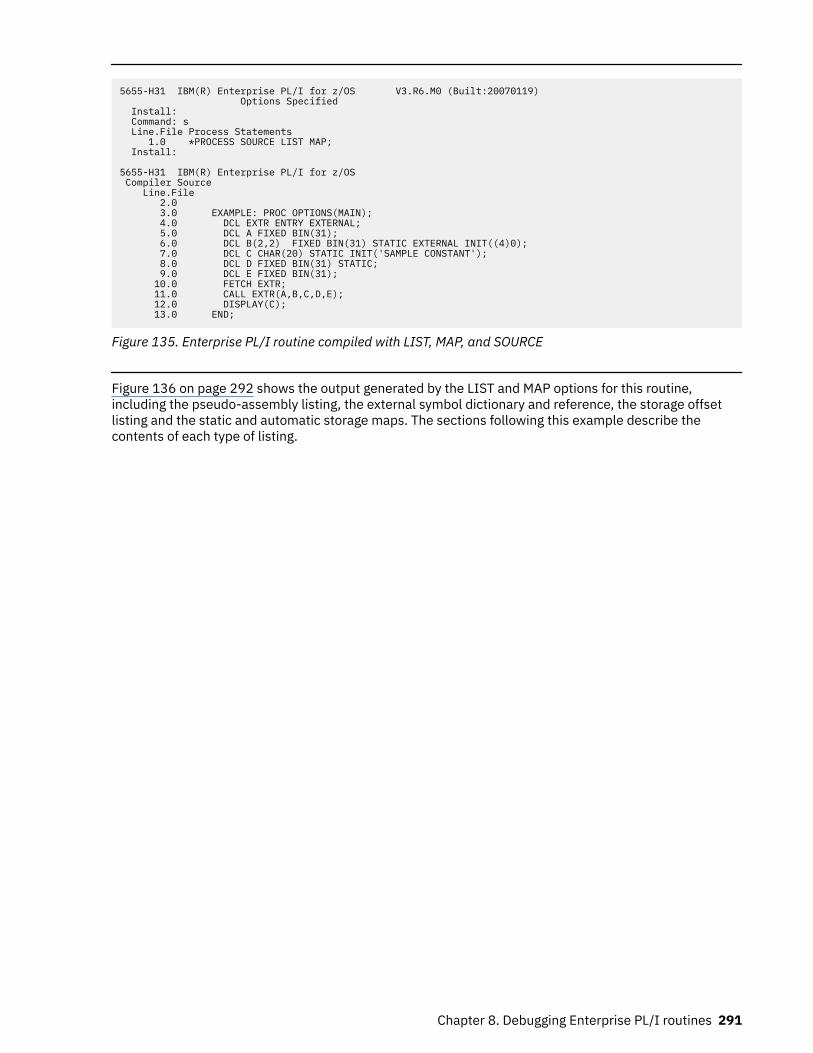
5655-H31 IBM(R) Enterprise PL/I for z/OS V3.R6.M0 (Built:20070119) Options Specified Install: Command: s Line.File Process Statements 1.0 *PROCESS SOURCE LIST MAP; Install:
5655-H31 IBM(R) Enterprise PL/I for z/OS Compiler Source Line.File 2.0 3.0 EXAMPLE: PROC OPTIONS(MAIN); 4.0 DCL EXTR ENTRY EXTERNAL; 5.0 DCL A FIXED BIN(31); 6.0 DCL B(2,2) FIXED BIN(31) STATIC EXTERNAL INIT((4)0); 7.0 DCL C CHAR(20) STATIC INIT('SAMPLE CONSTANT'); 8.0 DCL D FIXED BIN(31) STATIC; 9.0 DCL E FIXED BIN(31); 10.0 FETCH EXTR; 11.0 CALL EXTR(A,B,C,D,E); 12.0 DISPLAY(C); 13.0 END;
Figure 135. Enterprise PL/I routine compiled with LIST, MAP, and SOURCE
Figure 136 on page 292 shows the output generated by the LIST and MAP options for this routine,including the pseudo-assembly listing, the external symbol dictionary and reference, the storage offsetlisting and the static and automatic storage maps. The sections following this example describe thecontents of each type of listing.
Chapter 8. Debugging Enterprise PL/I routines 291
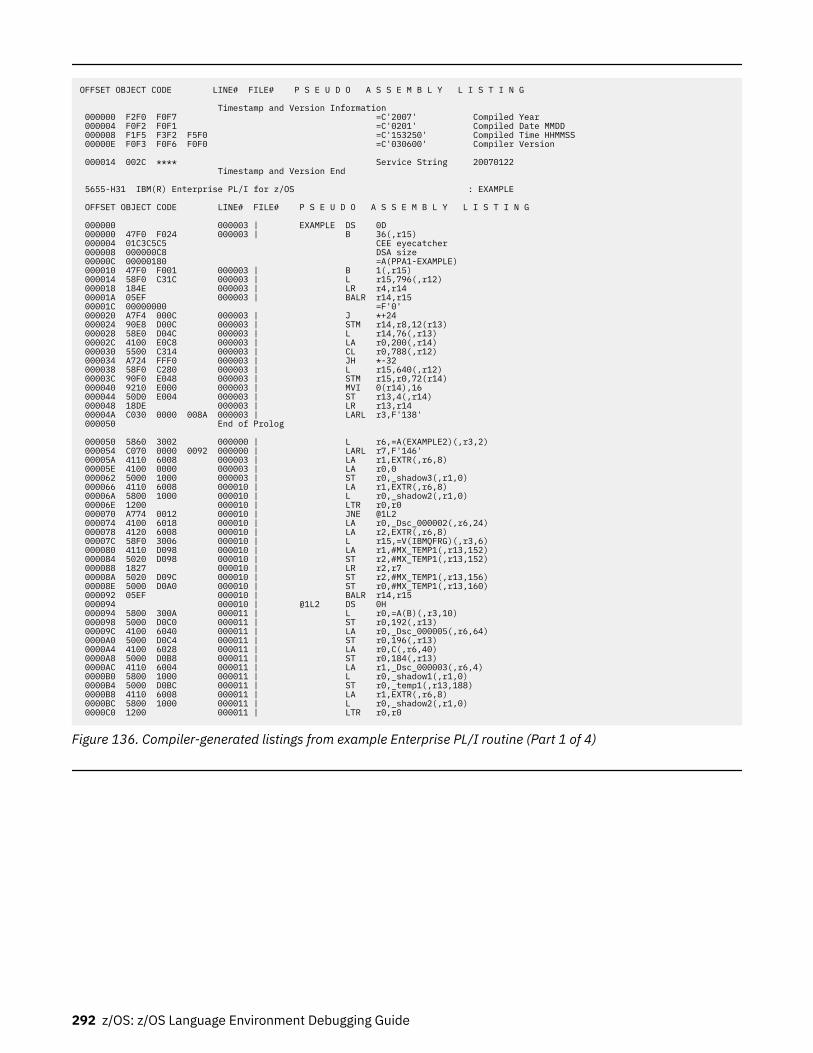
OFFSET OBJECT CODE LINE# FILE# P S E U D O A S S E M B L Y L I S T I N G
Timestamp and Version Information 000000 F2F0 F0F7 =C'2007' Compiled Year 000004 F0F2 F0F1 =C'0201' Compiled Date MMDD 000008 F1F5 F3F2 F5F0 =C'153250' Compiled Time HHMMSS 00000E F0F3 F0F6 F0F0 =C'030600' Compiler Version
000014 002C **** Service String 20070122 Timestamp and Version End
5655-H31 IBM(R) Enterprise PL/I for z/OS : EXAMPLE
OFFSET OBJECT CODE LINE# FILE# P S E U D O A S S E M B L Y L I S T I N G
000000 000003 | EXAMPLE DS 0D 000000 47F0 F024 000003 | B 36(,r15) 000004 01C3C5C5 CEE eyecatcher 000008 000000C8 DSA size 00000C 00000180 =A(PPA1-EXAMPLE) 000010 47F0 F001 000003 | B 1(,r15) 000014 58F0 C31C 000003 | L r15,796(,r12) 000018 184E 000003 | LR r4,r14 00001A 05EF 000003 | BALR r14,r15 00001C 00000000 =F'0' 000020 A7F4 000C 000003 | J *+24 000024 90E8 D00C 000003 | STM r14,r8,12(r13) 000028 58E0 D04C 000003 | L r14,76(,r13) 00002C 4100 E0C8 000003 | LA r0,200(,r14) 000030 5500 C314 000003 | CL r0,788(,r12) 000034 A724 FFF0 000003 | JH *-32 000038 58F0 C280 000003 | L r15,640(,r12) 00003C 90F0 E048 000003 | STM r15,r0,72(r14) 000040 9210 E000 000003 | MVI 0(r14),16 000044 50D0 E004 000003 | ST r13,4(,r14) 000048 18DE 000003 | LR r13,r14 00004A C030 0000 008A 000003 | LARL r3,F'138' 000050 End of Prolog
000050 5860 3002 000000 | L r6,=A(EXAMPLE2)(,r3,2) 000054 C070 0000 0092 000000 | LARL r7,F'146' 00005A 4110 6008 000003 | LA r1,EXTR(,r6,8) 00005E 4100 0000 000003 | LA r0,0 000062 5000 1000 000003 | ST r0,_shadow3(,r1,0) 000066 4110 6008 000010 | LA r1,EXTR(,r6,8) 00006A 5800 1000 000010 | L r0,_shadow2(,r1,0) 00006E 1200 000010 | LTR r0,r0 000070 A774 0012 000010 | JNE @1L2 000074 4100 6018 000010 | LA r0,_Dsc_000002(,r6,24) 000078 4120 6008 000010 | LA r2,EXTR(,r6,8) 00007C 58F0 3006 000010 | L r15,=V(IBMQFRG)(,r3,6) 000080 4110 D098 000010 | LA r1,#MX_TEMP1(,r13,152) 000084 5020 D098 000010 | ST r2,#MX_TEMP1(,r13,152) 000088 1827 000010 | LR r2,r7 00008A 5020 D09C 000010 | ST r2,#MX_TEMP1(,r13,156) 00008E 5000 D0A0 000010 | ST r0,#MX_TEMP1(,r13,160) 000092 05EF 000010 | BALR r14,r15 000094 000010 | @1L2 DS 0H 000094 5800 300A 000011 | L r0,=A(B)(,r3,10) 000098 5000 D0C0 000011 | ST r0,192(,r13) 00009C 4100 6040 000011 | LA r0,_Dsc_000005(,r6,64) 0000A0 5000 D0C4 000011 | ST r0,196(,r13) 0000A4 4100 6028 000011 | LA r0,C(,r6,40) 0000A8 5000 D0B8 000011 | ST r0,184(,r13) 0000AC 4110 6004 000011 | LA r1,_Dsc_000003(,r6,4) 0000B0 5800 1000 000011 | L r0,_shadow1(,r1,0) 0000B4 5000 D0BC 000011 | ST r0,_temp1(,r13,188) 0000B8 4110 6008 000011 | LA r1,EXTR(,r6,8) 0000BC 5800 1000 000011 | L r0,_shadow2(,r1,0) 0000C0 1200 000011 | LTR r0,r0
Figure 136. Compiler-generated listings from example Enterprise PL/I routine (Part 1 of 4)
292 z/OS: z/OS Language Environment Debugging Guide
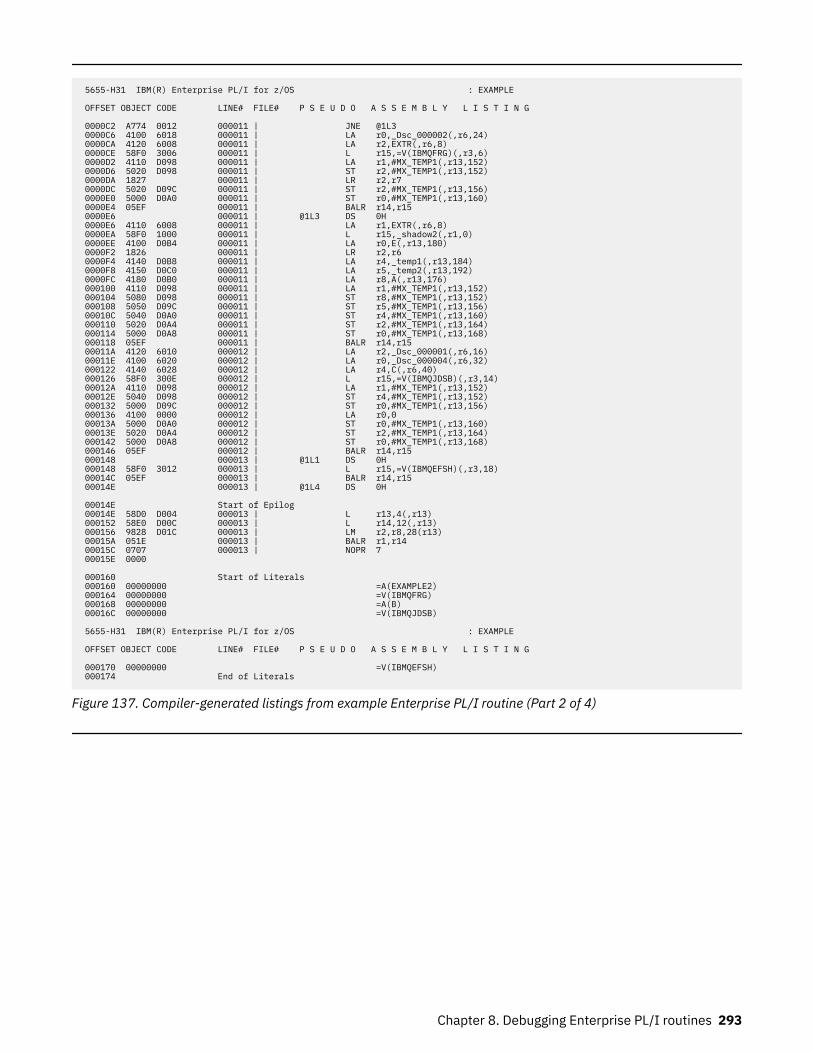
5655-H31 IBM(R) Enterprise PL/I for z/OS : EXAMPLE
OFFSET OBJECT CODE LINE# FILE# P S E U D O A S S E M B L Y L I S T I N G
0000C2 A774 0012 000011 | JNE @1L3 0000C6 4100 6018 000011 | LA r0,_Dsc_000002(,r6,24) 0000CA 4120 6008 000011 | LA r2,EXTR(,r6,8) 0000CE 58F0 3006 000011 | L r15,=V(IBMQFRG)(,r3,6) 0000D2 4110 D098 000011 | LA r1,#MX_TEMP1(,r13,152) 0000D6 5020 D098 000011 | ST r2,#MX_TEMP1(,r13,152) 0000DA 1827 000011 | LR r2,r7 0000DC 5020 D09C 000011 | ST r2,#MX_TEMP1(,r13,156) 0000E0 5000 D0A0 000011 | ST r0,#MX_TEMP1(,r13,160) 0000E4 05EF 000011 | BALR r14,r15 0000E6 000011 | @1L3 DS 0H 0000E6 4110 6008 000011 | LA r1,EXTR(,r6,8) 0000EA 58F0 1000 000011 | L r15,_shadow2(,r1,0) 0000EE 4100 D0B4 000011 | LA r0,E(,r13,180) 0000F2 1826 000011 | LR r2,r6 0000F4 4140 D0B8 000011 | LA r4,_temp1(,r13,184) 0000F8 4150 D0C0 000011 | LA r5,_temp2(,r13,192) 0000FC 4180 D0B0 000011 | LA r8,A(,r13,176) 000100 4110 D098 000011 | LA r1,#MX_TEMP1(,r13,152) 000104 5080 D098 000011 | ST r8,#MX_TEMP1(,r13,152) 000108 5050 D09C 000011 | ST r5,#MX_TEMP1(,r13,156) 00010C 5040 D0A0 000011 | ST r4,#MX_TEMP1(,r13,160) 000110 5020 D0A4 000011 | ST r2,#MX_TEMP1(,r13,164) 000114 5000 D0A8 000011 | ST r0,#MX_TEMP1(,r13,168) 000118 05EF 000011 | BALR r14,r15 00011A 4120 6010 000012 | LA r2,_Dsc_000001(,r6,16) 00011E 4100 6020 000012 | LA r0,_Dsc_000004(,r6,32) 000122 4140 6028 000012 | LA r4,C(,r6,40) 000126 58F0 300E 000012 | L r15,=V(IBMQJDSB)(,r3,14) 00012A 4110 D098 000012 | LA r1,#MX_TEMP1(,r13,152) 00012E 5040 D098 000012 | ST r4,#MX_TEMP1(,r13,152) 000132 5000 D09C 000012 | ST r0,#MX_TEMP1(,r13,156) 000136 4100 0000 000012 | LA r0,0 00013A 5000 D0A0 000012 | ST r0,#MX_TEMP1(,r13,160) 00013E 5020 D0A4 000012 | ST r2,#MX_TEMP1(,r13,164) 000142 5000 D0A8 000012 | ST r0,#MX_TEMP1(,r13,168) 000146 05EF 000012 | BALR r14,r15 000148 000013 | @1L1 DS 0H 000148 58F0 3012 000013 | L r15,=V(IBMQEFSH)(,r3,18) 00014C 05EF 000013 | BALR r14,r15 00014E 000013 | @1L4 DS 0H
00014E Start of Epilog 00014E 58D0 D004 000013 | L r13,4(,r13) 000152 58E0 D00C 000013 | L r14,12(,r13) 000156 9828 D01C 000013 | LM r2,r8,28(r13) 00015A 051E 000013 | BALR r1,r14 00015C 0707 000013 | NOPR 7 00015E 0000
000160 Start of Literals 000160 00000000 =A(EXAMPLE2) 000164 00000000 =V(IBMQFRG) 000168 00000000 =A(B) 00016C 00000000 =V(IBMQJDSB)
5655-H31 IBM(R) Enterprise PL/I for z/OS : EXAMPLE
OFFSET OBJECT CODE LINE# FILE# P S E U D O A S S E M B L Y L I S T I N G
000170 00000000 =V(IBMQEFSH) 000174 End of Literals
Figure 137. Compiler-generated listings from example Enterprise PL/I routine (Part 2 of 4)
Chapter 8. Debugging Enterprise PL/I routines 293
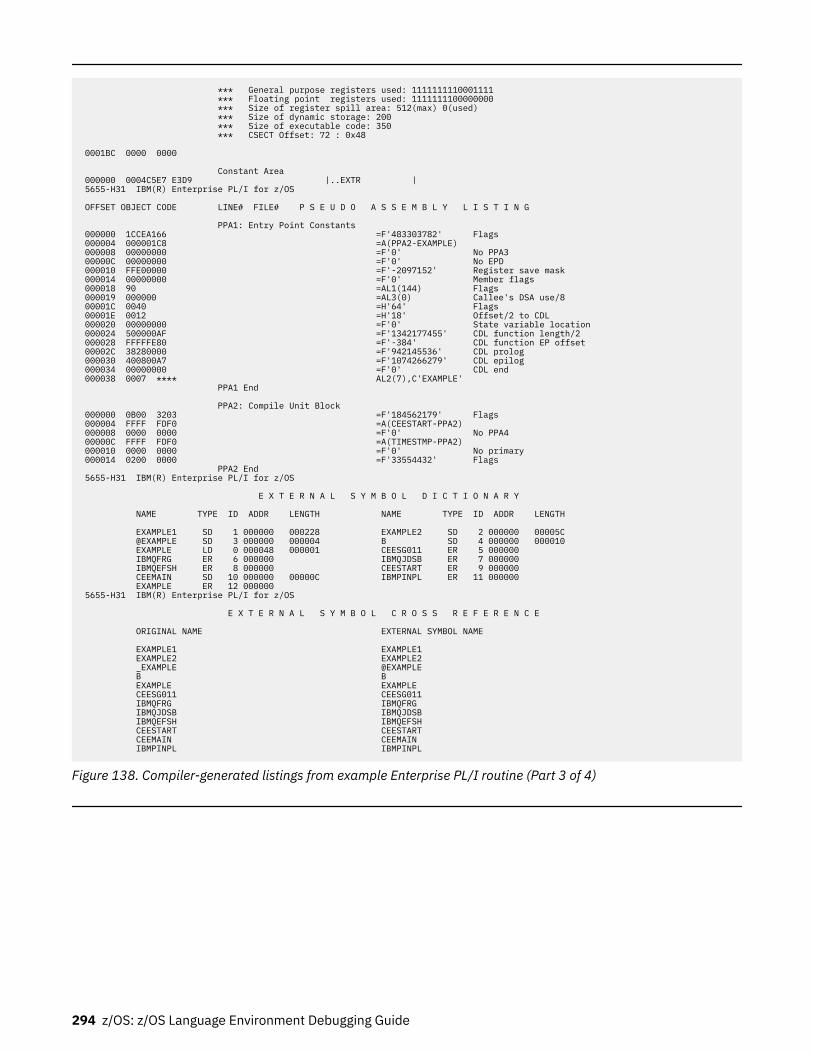
*** General purpose registers used: 1111111110001111 *** Floating point registers used: 1111111100000000 *** Size of register spill area: 512(max) 0(used) *** Size of dynamic storage: 200 *** Size of executable code: 350 *** CSECT Offset: 72 : 0x48
0001BC 0000 0000
Constant Area 000000 0004C5E7 E3D9 |..EXTR | 5655-H31 IBM(R) Enterprise PL/I for z/OS
OFFSET OBJECT CODE LINE# FILE# P S E U D O A S S E M B L Y L I S T I N G
PPA1: Entry Point Constants 000000 1CCEA166 =F'483303782' Flags 000004 000001C8 =A(PPA2-EXAMPLE) 000008 00000000 =F'0' No PPA3 00000C 00000000 =F'0' No EPD 000010 FFE00000 =F'-2097152' Register save mask 000014 00000000 =F'0' Member flags 000018 90 =AL1(144) Flags 000019 000000 =AL3(0) Callee's DSA use/8 00001C 0040 =H'64' Flags 00001E 0012 =H'18' Offset/2 to CDL 000020 00000000 =F'0' State variable location 000024 500000AF =F'1342177455' CDL function length/2 000028 FFFFFE80 =F'-384' CDL function EP offset 00002C 38280000 =F'942145536' CDL prolog 000030 400800A7 =F'1074266279' CDL epilog 000034 00000000 =F'0' CDL end 000038 0007 **** AL2(7),C'EXAMPLE' PPA1 End
PPA2: Compile Unit Block 000000 0B00 3203 =F'184562179' Flags 000004 FFFF FDF0 =A(CEESTART-PPA2) 000008 0000 0000 =F'0' No PPA4 00000C FFFF FDF0 =A(TIMESTMP-PPA2) 000010 0000 0000 =F'0' No primary 000014 0200 0000 =F'33554432' Flags PPA2 End 5655-H31 IBM(R) Enterprise PL/I for z/OS
E X T E R N A L S Y M B O L D I C T I O N A R Y
NAME TYPE ID ADDR LENGTH NAME TYPE ID ADDR LENGTH
EXAMPLE1 SD 1 000000 000228 EXAMPLE2 SD 2 000000 00005C @EXAMPLE SD 3 000000 000004 B SD 4 000000 000010 EXAMPLE LD 0 000048 000001 CEESG011 ER 5 000000 IBMQFRG ER 6 000000 IBMQJDSB ER 7 000000 IBMQEFSH ER 8 000000 CEESTART ER 9 000000 CEEMAIN SD 10 000000 00000C IBMPINPL ER 11 000000 EXAMPLE ER 12 000000 5655-H31 IBM(R) Enterprise PL/I for z/OS
E X T E R N A L S Y M B O L C R O S S R E F E R E N C E
ORIGINAL NAME EXTERNAL SYMBOL NAME
EXAMPLE1 EXAMPLE1 EXAMPLE2 EXAMPLE2 _EXAMPLE @EXAMPLE B B EXAMPLE EXAMPLE CEESG011 CEESG011 IBMQFRG IBMQFRG IBMQJDSB IBMQJDSB IBMQEFSH IBMQEFSH CEESTART CEESTART CEEMAIN CEEMAIN IBMPINPL IBMPINPL
Figure 138. Compiler-generated listings from example Enterprise PL/I routine (Part 3 of 4)
294 z/OS: z/OS Language Environment Debugging Guide
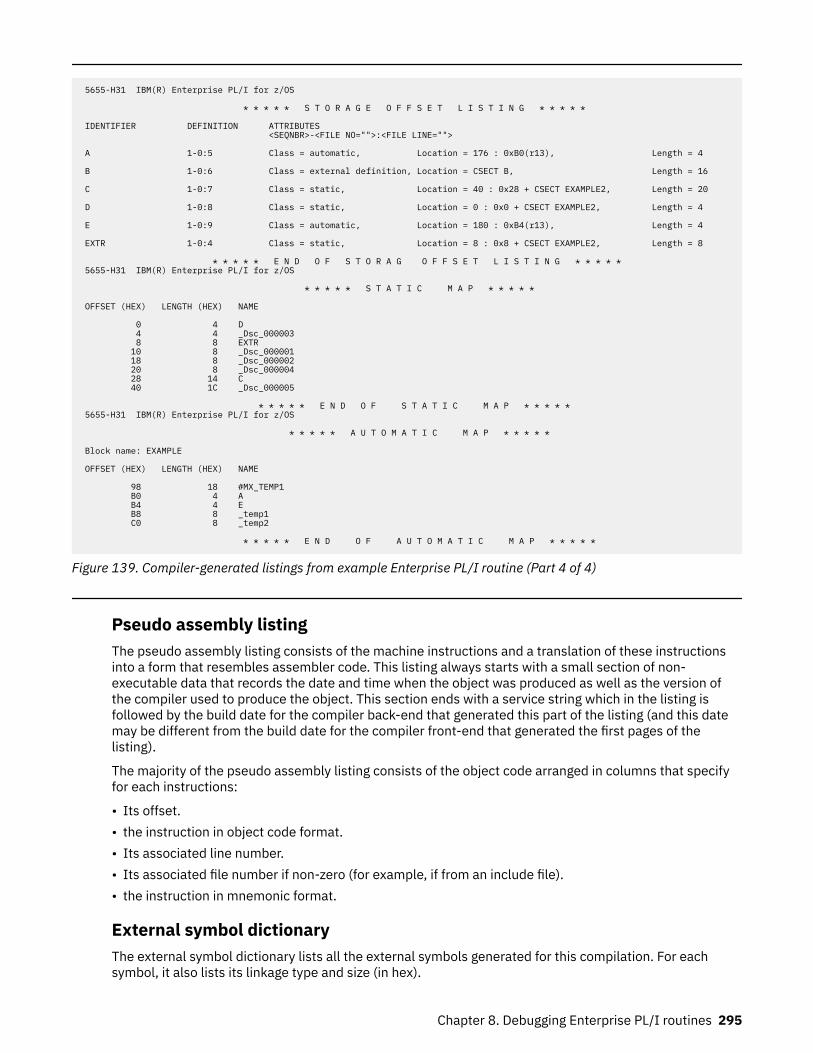
5655-H31 IBM(R) Enterprise PL/I for z/OS
* * * * * S T O R A G E O F F S E T L I S T I N G * * * * *
IDENTIFIER DEFINITION ATTRIBUTES <SEQNBR>-<FILE NO="">:<FILE LINE="">
A 1-0:5 Class = automatic, Location = 176 : 0xB0(r13), Length = 4
B 1-0:6 Class = external definition, Location = CSECT B, Length = 16
C 1-0:7 Class = static, Location = 40 : 0x28 + CSECT EXAMPLE2, Length = 20
D 1-0:8 Class = static, Location = 0 : 0x0 + CSECT EXAMPLE2, Length = 4
E 1-0:9 Class = automatic, Location = 180 : 0xB4(r13), Length = 4
EXTR 1-0:4 Class = static, Location = 8 : 0x8 + CSECT EXAMPLE2, Length = 8
* * * * * E N D O F S T O R A G O F F S E T L I S T I N G * * * * * 5655-H31 IBM(R) Enterprise PL/I for z/OS
* * * * * S T A T I C M A P * * * * *
OFFSET (HEX) LENGTH (HEX) NAME
0 4 D 4 4 _Dsc_000003 8 8 EXTR 10 8 _Dsc_000001 18 8 _Dsc_000002 20 8 _Dsc_000004 28 14 C 40 1C _Dsc_000005
* * * * * E N D O F S T A T I C M A P * * * * * 5655-H31 IBM(R) Enterprise PL/I for z/OS
* * * * * A U T O M A T I C M A P * * * * *
Block name: EXAMPLE
OFFSET (HEX) LENGTH (HEX) NAME
98 18 #MX_TEMP1 B0 4 A B4 4 E B8 8 _temp1 C0 8 _temp2
* * * * * E N D O F A U T O M A T I C M A P * * * * *
Figure 139. Compiler-generated listings from example Enterprise PL/I routine (Part 4 of 4)
Pseudo assembly listingThe pseudo assembly listing consists of the machine instructions and a translation of these instructionsinto a form that resembles assembler code. This listing always starts with a small section of non-executable data that records the date and time when the object was produced as well as the version ofthe compiler used to produce the object. This section ends with a service string which in the listing isfollowed by the build date for the compiler back-end that generated this part of the listing (and this datemay be different from the build date for the compiler front-end that generated the first pages of thelisting).
The majority of the pseudo assembly listing consists of the object code arranged in columns that specifyfor each instructions:
• Its offset.• the instruction in object code format.• Its associated line number.• Its associated file number if non-zero (for example, if from an include file).• the instruction in mnemonic format.
External symbol dictionaryThe external symbol dictionary lists all the external symbols generated for this compilation. For eachsymbol, it also lists its linkage type and size (in hex).
Chapter 8. Debugging Enterprise PL/I routines 295
External symbol cross referenceThe external symbol dictionary cross reference shows for each external symbol the name that will bevisible externally to the linker.
Storage offset listingEach line of the storage offset listing contains the following information for each user variable:
• Its name.• the number of the block in which it was declared.• the number of the file in which it was declared.• the number of the line in which it was declared.• Its class (automatic, static, etc).• Its location (as appropriate for its class).• Its byte length in decimal.
This list is sorted by block number and then by name within each block.
Static mapEach line of the static storage map contains the following information for each internal static variable:
• Its hexadecimal offset.• Its byte length in hex.• Its name.
This list is sorted by the offset of the variables in static. This list of variables may also include compiler-generated variables.
Automatic mapEach line of the automatic storage map contains the following information, grouped by named block, foreach automatic variable in that block:
• Its hexadecimal offset.• Its byte length in hex.• Its name.
These lists are sorted by the offset of the variables in automatic for each block. These lists of variablesmay also include compiler-generated variables.
Generating a Language Environment dump of an Enterprise PL/Iroutine
To generate a dump of an Enterprise PL/I routine, you can call either the Language Environment callableservice CEE3DMP or PLIDUMP. For information about calling CEE3DMP, see “Generating a LanguageEnvironment dump with CEE3DMP” on page 33.
PLIDUMP syntax and optionsPLIDUMP calls intermediate Enterprise PL/I library routines, which convert most PLIDUMP options toCEE3DMP options. The following list contains PLIDUMP options and the corresponding CEE3DMP option,if applicable. Some PLIDUMP options do not have corresponding CEE3DMP options, but continue tofunction as Enterprise PL/I default options. The list following the syntax diagram provides a description ofthose options.
296 z/OS: z/OS Language Environment Debugging Guide
PLIDUMP conforms to National Language Support standards. PLIDUMP can supply information acrossmultiple Language Environment enclaves. If an application running in one enclave fetches a mainprocedure (an action that creates another enclave), PLIDUMP contains information about bothprocedures. The syntax and options for PLIDUMP are shown below.
SyntaxPLIDUMP ( char.-string-exp 1 , char.-string-exp 2 )
char.-string-exp 1A dump options character string consisting of one or more of the following values. T, F, C, and A arethe default options.A
All. Results in a dump of all tasks including the ones in the WAIT state.B
BLOCKS (Enterprise PL/I hexadecimal dump). Dumps the control blocks used in LanguageEnvironment and member language libraries. For Enterprise PL/I, this includes the DSA for everyroutine on the call chain and Enterprise PL/I "global" control blocks, such as TaskingImplementation Appendage (TIA), Task Communication Area (TCA), and the PL/I Tasking ControlBlock (PTCB). Enterprise PL/I file control blocks and file buffers are also dumped if the F option isspecified.
CContinue. The routine continues after the dump.
EExit. The enclave terminates after the dump. In a multitasking environment, if PLIDUMP is calledfrom the main task, the enclave terminates after the dump. If PLIDUMP is called from a subtask,the subtask and any subsequent tasks created from the subtask terminate after the dump. In amultithreaded environment, if PLIDUMP is called from the Initial Process Thread (IPT), theenclave terminates after the dump. If PLIDUMP is called from a non-IPT, only the non-IPTterminates after the dump.
FFILE INFORMATION. A set of attributes for all open files is given. The contents of the file buffersare displayed if the B option is specified.
HSTORAGE in hexadecimal. A SNAP dump of the region is produced. A ddname of CEESNAP mustbe provided to direct the CEESNAP dump report.
KBLOCKS (when running under CICS). The Transaction Work Area is included.
Note: This option is not supported under Enterprise PL/I.
NBNOBLOCKS.
NFNOFILES.
NHNOSTORAGE.
NKNOBLOCKS (when running under CICS).
NTNOTRACEBACK.
OTHREAD(CURRENT). Results in a dump of only the current task or current thread (the invoker ofPLIDUMP).
Chapter 8. Debugging Enterprise PL/I routines 297
SStop. The enclave terminates after the dump. In a multitasking environment, regardless ofwhether PLIDUMP is called from the main task or a subtask, the enclave terminates after thedump. In a multithreaded environment, regardless of whether PLIDUMP is called from the IPT or anon-IPT, the enclave terminates after the dump (in which case there is no fixed order as to whichthread terminates first).
TTRACEBACK. Includes a traceback of all routines on the call chain. The traceback shows transfersof control from either calls or exceptions. BEGIN blocks and ON-units are also control transfersand are included in the trace. The traceback extends backwards to the main program of thecurrent thread.
char.-string-exp 2A user-identified character string up to 80 characters long that is printed as the dump header.
PLIDUMP usage notesIf you use PLIDUMP, the following considerations apply:
• If a routine calls PLIDUMP a number of times, use a unique user-identifier for each PLIDUMP invocation.This simplifies identifying the beginning of each dump.
• In MVS or TSO, you can use ddnames of CEEDUMP, PLIDUMP, or PL1DUMP to direct dump output. If noddname is specified, CEEDUMP is used.
• The data set defined by the PLIDUMP, PL1DUMP, or CEEDUMP DD statement should specify a logicalrecord length (LRECL) of at least 131 to prevent dump records from wrapping.
• When you specify the H option in a call to PLIDUMP, the Enterprise PL/I library issues an OS SNAPmacro to obtain a dump of virtual storage. The first invocation of PLIDUMP results in a SNAP identifier of0. For each successive invocation, the ID is increased by one to a maximum of 256, after which the ID isreset to 0.
• Support for SNAP dumps using PLIDUMP is provided only under MVS. SNAP dumps are not produced ina CICS environment.
– If the SNAP does not succeed, the CEE3DMP DUMP file displays the message:
Snap was unsuccessful
Failure to define a CEESNAP data set is the most likely cause of an unsuccessful CEESNAP.– If the SNAP is successful, CEE3DMP displays the message, where nnn corresponds to the SNAP
identifier described above. An unsuccessful SNAP does not result in an incrementation of theidentifier.
Snap was successful; snap ID = nnn
• To ensure portability across system platforms, use PLIDUMP to generate a dump of your Enterprise PL/Iroutine.
Finding Enterprise PL/I information in a dumpThe following sections discuss Enterprise PL/I-specific information located in the following sections of aLanguage Environment dump:
• Traceback• Control Blocks for Active Routines• Control Block Associated with the Thread• File Status and Attributes
298 z/OS: z/OS Language Environment Debugging Guide
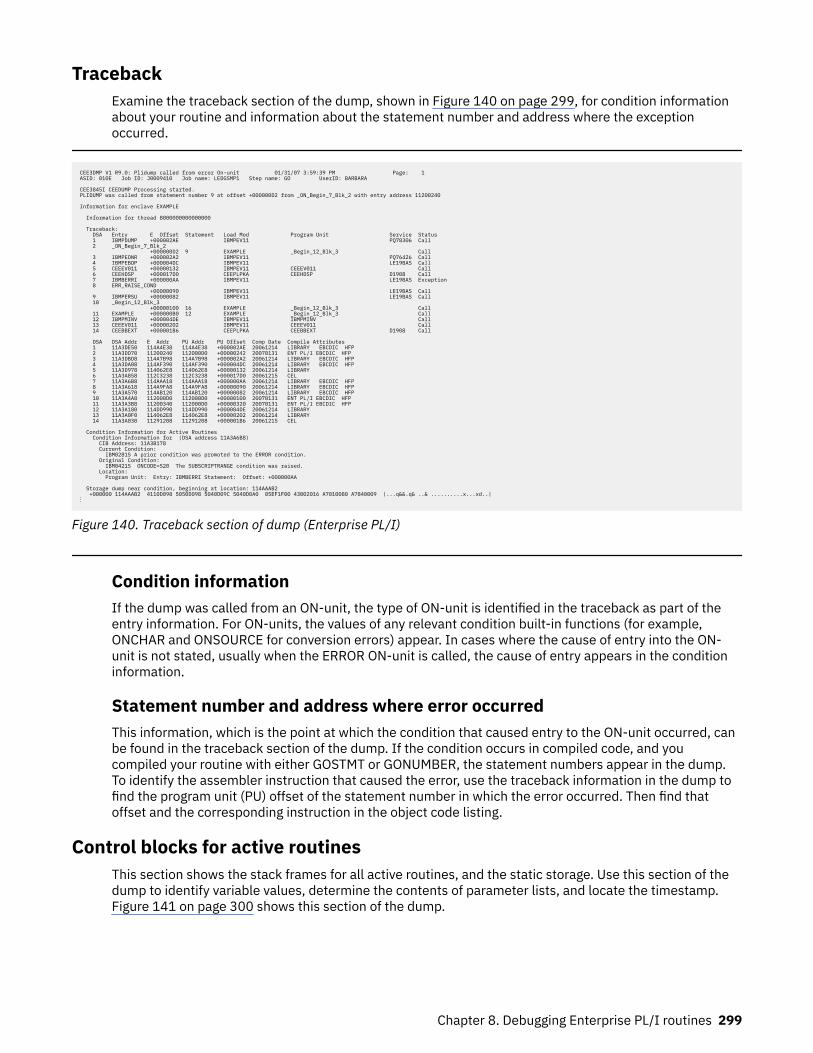
TracebackExamine the traceback section of the dump, shown in Figure 140 on page 299, for condition informationabout your routine and information about the statement number and address where the exceptionoccurred.
CEE3DMP V1 R9.0: Plidump called from error On-unit 01/31/07 3:59:39 PM Page: 1 ASID: 010E Job ID: J0009410 Job name: LEDGSMP1 Step name: GO UserID: BARBARA CEE3845I CEEDUMP Processing started. PLIDUMP was called from statement number 9 at offset +000000D2 from _ON_Begin_7_Blk_2 with entry address 11200240 Information for enclave EXAMPLE Information for thread 8000000000000000 Traceback: DSA Entry E Offset Statement Load Mod Program Unit Service Status 1 IBMPDUMP +000002AE IBMPEV11 PQ78306 Call 2 _ON_Begin_7_Blk_2 +000000D2 9 EXAMPLE _Begin_12_Blk_3 Call 3 IBMPEONR +000002A2 IBMPEV11 PQ76426 Call 4 IBMPEBOP +000004DC IBMPEV11 LE19BAS Call 5 CEEEV011 +00000132 IBMPEV11 CEEEV011 Call 6 CEEHDSP +000017D0 CEEPLPKA CEEHDSP D1908 Call 7 IBMBERRI +000000AA IBMPEV11 LE19BAS Exception 8 ERR_RAISE_COND +00000090 IBMPEV11 LE19BAS Call 9 IBMPERSU +00000082 IBMPEV11 LE19BAS Call 10 _Begin_12_Blk_3 +00000100 16 EXAMPLE _Begin_12_Blk_3 Call 11 EXAMPLE +000000B0 12 EXAMPLE _Begin_12_Blk_3 Call 12 IBMPMINV +000004DE IBMPEV11 IBMPMINV Call 13 CEEEV011 +00000202 IBMPEV11 CEEEV011 Call 14 CEEBBEXT +000001B6 CEEPLPKA CEEBBEXT D1908 Call DSA DSA Addr E Addr PU Addr PU Offset Comp Date Compile Attributes 1 11A3DE50 114A4E38 114A4E38 +000002AE 20061214 LIBRARY EBCDIC HFP 2 11A3DD70 11200240 112000D0 +00000242 20070131 ENT PL/I EBCDIC HFP 3 11A3DBD8 114A7B98 114A7B98 +000002A2 20061214 LIBRARY EBCDIC HFP 4 11A3DA08 114AF390 114AF390 +000004DC 20061214 LIBRARY EBCDIC HFP 5 11A3D978 114062E8 114062E8 +00000132 20061214 LIBRARY 6 11A3A858 112C3238 112C3238 +000017D0 20061215 CEL 7 11A3A6B8 114AAA18 114AAA18 +000000AA 20061214 LIBRARY EBCDIC HFP 8 11A3A618 114A9FA8 114A9FA8 +00000090 20061214 LIBRARY EBCDIC HFP 9 11A3A570 114AB120 114AB120 +00000082 20061214 LIBRARY EBCDIC HFP 10 11A3A4A8 112000D0 112000D0 +00000100 20070131 ENT PL/I EBCDIC HFP 11 11A3A3B8 11200340 112000D0 +00000320 20070131 ENT PL/I EBCDIC HFP 12 11A3A180 114DD990 114DD990 +000004DE 20061214 LIBRARY 13 11A3A0F0 114062E8 114062E8 +00000202 20061214 LIBRARY 14 11A3A030 11291208 11291208 +000001B6 20061215 CEL Condition Information for Active Routines Condition Information for (DSA address 11A3A6B8) CIB Address: 11A3B178 Current Condition: IBM0281S A prior condition was promoted to the ERROR condition. Original Condition: IBM0421S ONCODE=520 The SUBSCRIPTRANGE condition was raised. Location: Program Unit: Entry: IBMBERRI Statement: Offset: +000000AA Storage dump near condition, beginning at location: 114AAAB2 +000000 114AAAB2 4110D098 5050D098 5040D09C 5040D0A0 05EF1F00 43002016 A7010080 A7840009 |...q&&.q& ..& ..........x...xd..|⋮
Figure 140. Traceback section of dump (Enterprise PL/I)
Condition informationIf the dump was called from an ON-unit, the type of ON-unit is identified in the traceback as part of theentry information. For ON-units, the values of any relevant condition built-in functions (for example,ONCHAR and ONSOURCE for conversion errors) appear. In cases where the cause of entry into the ON-unit is not stated, usually when the ERROR ON-unit is called, the cause of entry appears in the conditioninformation.
Statement number and address where error occurredThis information, which is the point at which the condition that caused entry to the ON-unit occurred, canbe found in the traceback section of the dump. If the condition occurs in compiled code, and youcompiled your routine with either GOSTMT or GONUMBER, the statement numbers appear in the dump.To identify the assembler instruction that caused the error, use the traceback information in the dump tofind the program unit (PU) offset of the statement number in which the error occurred. Then find thatoffset and the corresponding instruction in the object code listing.
Control blocks for active routinesThis section shows the stack frames for all active routines, and the static storage. Use this section of thedump to identify variable values, determine the contents of parameter lists, and locate the timestamp.Figure 141 on page 300 shows this section of the dump.
Chapter 8. Debugging Enterprise PL/I routines 299
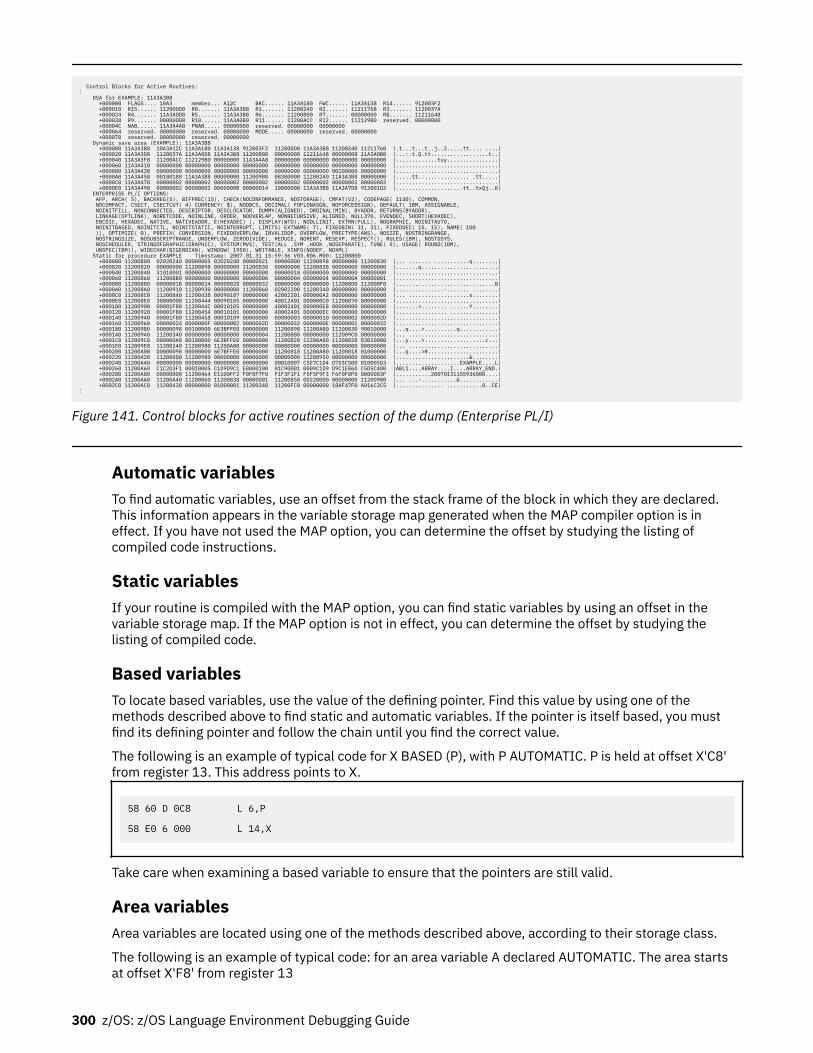
Control Blocks for Active Routines: ⋮ DSA for EXAMPLE: 11A3A3B8 +000000 FLAGS.... 10A3 member... A12C BKC...... 11A3A180 FWC...... 11A3A138 R14...... 912003F2 +000010 R15...... 112000D0 R0....... 11A3A3B8 R1....... 11200240 R2....... 11211768 R3....... 1120037A +000024 R4....... 11A3A0D8 R5....... 11A3A3B8 R6....... 11200800 R7....... 00000000 R8....... 11211648 +000038 R9....... 00000008 R10...... 11A3A0B0 R11...... 11200ACC R12...... 112129B0 reserved. 00000000 +00004C NAB...... 11A3A4A8 PNAB..... 00000000 reserved. 00000000 00000000 +000064 reserved. 00000000 reserved. 00000000 MODE..... 00000000 reserved. 00000000 +000078 reserved. 00000000 reserved. 00000000 Dynamic save area (EXAMPLE): 11A3A3B8 +000000 11A3A3B8 10A3A12C 11A3A180 11A3A138 912003F2 112000D0 11A3A3B8 11200240 11211768 |.t...t...t..j..2.....tt.... ....| +000020 11A3A3D8 1120037A 11A3A0D8 11A3A3B8 11200800 00000000 11211648 00000008 11A3A0B0 |...:.t.Q.tt..................t..| +000040 11A3A3F8 11200ACC 112129B0 00000000 11A3A4A8 00000000 00000000 00000000 00000000 |.............tuy................| +000060 11A3A418 00000000 00000000 00000000 00000000 00000000 00000000 00000000 00000000 |................................| +000080 11A3A438 00000000 00000000 00000000 00000000 00000000 00000000 00100000 00000000 |................................| +0000A0 11A3A458 00180180 11A3A3B8 00000000 11200980 0B300000 11200240 11A3A3B8 00000000 |.....tt................ .tt.....| +0000C0 11A3A478 00000002 00000002 00000002 00000002 00000002 00000002 00000002 00000002 |................................| +0000E0 11A3A498 00000002 00000002 0000000B 00000014 10000000 11A3A3B8 11A3A7D8 912001D2 |.....................tt..txQj..K| ENTERPRISE PL/I OPTIONS: AFP, ARCH( 5), BACKREG(5), BIFPREC(15), CHECK(NOCONFORMANCE, NOSTORAGE), CMPAT(V2), CODEPAGE( 1140), COMMON, NOCOMPACT, CSECT, CSECTCUT( 4) CURRENCY( $), NODBCS, DECIMAL( FOFLONASGN, NOFORCEDSIGN), DEFAULT( IBM, ASSIGNABLE, NOINITFILL, NONCONNECTED, DESCRIPTOR, DESCLOCATOR, DUMMY(ALIGNED), ORDINAL(MIN), BYADDR, RETURNS(BYADDR), LINKAGE(OPTLINK), NORETCODE, NOINLINE, ORDER, NOOVERLAP, NONRECURSIVE, ALIGNED, NULL370, EVENDEC, SHORT(HEXADEC), EBCDIC, HEXADEC, NATIVE, NATIVEADDR, E(HEXADEC) ), DISPLAY(WTO), NODLLINIT, EXTRN(FULL), NOGRAPHIC, NOINITAUTO, NOINITBASED, NOINITCTL, NOINITSTATIC, NOINTERRUPT, LIMITS( EXTNAME( 7), FIXEDBIN( 31, 31), FIXEDDEC( 15, 15), NAME( 100 )), OPTIMIZE( 0), PREFIX( CONVERSION, FIXEDOVERFLOW, INVALIDOP, OVERFLOW, PRECTYPE(ANS), NOSIZE, NOSTRINGRANGE, NOSTRINGSIZE, NOSUBSCRIPTRANGE, UNDERFLOW, ZERODIVIDE), REDUCE, NORENT, RESEXP, RESPECT(), RULES(IBM), NOSTDSYS, NOSCHEDULER, STRINGOFGRAPHIC(GRAPHIC), SYSTEM(MVS), TEST(ALL ,SYM ,HOOK ,NOSEPARATE), TUNE( 5), USAGE( ROUND(IBM), UNSPEC(IBM)), WIDECHAR(BIGENDIAN), WINDOW( 1950), WRITABLE, XINFO(NODEF, NOXML) Static for procedure EXAMPLE Timestamp: 2007.01.31 15:59:36 V03.R06.M00: 11200800 +000000 11200800 02020240 00000005 02020240 00000021 00000000 11200898 00000000 11200830 |... ....... ...........q........| +000020 11200820 00000000 11200898 00000000 11200830 00000000 11200838 00000000 00000000 |.......q........................| +000040 11200840 31010001 00000000 00000000 00000000 00000010 00000000 00000000 00000000 |................................| +000060 11200860 112008B0 00000000 00000000 00000000 00000004 00000004 0000000A 00000001 |................................| +000080 11200880 0000001B 00000024 0000002D 00000032 00000000 00000000 112008D0 112008F0 |...............................0| +0000A0 112008A0 11200910 11200930 00000000 11200860 02002200 11200340 00000000 00000000 |...............-....... ........| +0000C0 112008C0 11200840 11200438 00090107 00000000 42002201 000000A2 00000000 00000000 |... ...................s........| +0000E0 112008E0 30000000 11200444 00090105 00000000 48012401 D00000C0 11200870 00000000 |................................| +000100 11200900 00001F80 1120044C 00010105 00000000 40002401 D00000E8 00000000 00000000 |.......<........ ......Y........| +000120 11200920 00001F80 11200454 00010101 00000000 40002401 D00000EC 00000000 00000000 |................ ...............| +000140 11200940 00001F80 11200458 00010109 00000000 00000003 00000010 00000002 0000002D |................................| +000160 11200960 00000024 0000000F 00000002 0000002D 00000032 0000000E 00000001 00000032 |................................| +000180 11200980 D0000098 00100000 6E3BFFE0 00000000 11200898 11200A80 11200830 90010000 |...q....>..........q............| +0001A0 112009A0 11200340 00000000 00000000 00000004 11200880 00000000 112009C0 00000000 |... ............................| +0001C0 112009C0 D00000A8 00100000 6E3BFFE0 00000000 11200820 11200A80 11200828 83010000 |...y....>...................c...| +0001E0 112009E0 11200240 11200980 11200A00 00000000 00000000 00000000 00000000 00000000 |... ............................| +000200 11200A00 D0000098 00000000 6E7BFFE0 00000000 11200810 11200A80 11200818 01000000 |...q....>#......................| +000220 11200A20 112000D0 11200980 00000000 00000000 00000000 11200950 00000000 00000000 |.......................&........| +000240 11200A40 00000000 00000000 00000000 00000000 00010007 C5E7C1D4 D7D3C500 010005D3 |....................EXAMPLE....L| +000260 11200A60 C1C2D3F1 00010005 C1D9D9C1 E8000100 01C90001 0009C1D9 D9C1E86D C5D5C400 |ABL1....ARRAY....I....ARRAY_END.| +000280 11200A80 00000000 11200464 E1100FF2 F0F0F7F0 F1F3F1F1 F5F5F9F3 F6F0F0F0 0000003F |...........20070131155936000....| +0002A0 11200AA0 11200A40 11200860 11200838 00000001 11200850 00220000 00000000 11200980 |... ...-...........&............| +0002C0 11200AC0 11200438 00000000 01000001 11200340 11200FC0 00000000 18AF47F0 A016C3C5 |............... ...........0..CE|⋮
Figure 141. Control blocks for active routines section of the dump (Enterprise PL/I)
Automatic variablesTo find automatic variables, use an offset from the stack frame of the block in which they are declared.This information appears in the variable storage map generated when the MAP compiler option is ineffect. If you have not used the MAP option, you can determine the offset by studying the listing ofcompiled code instructions.
Static variablesIf your routine is compiled with the MAP option, you can find static variables by using an offset in thevariable storage map. If the MAP option is not in effect, you can determine the offset by studying thelisting of compiled code.
Based variablesTo locate based variables, use the value of the defining pointer. Find this value by using one of themethods described above to find static and automatic variables. If the pointer is itself based, you mustfind its defining pointer and follow the chain until you find the correct value.
The following is an example of typical code for X BASED (P), with P AUTOMATIC. P is held at offset X'C8'from register 13. This address points to X.
58 60 D 0C8 L 6,P
58 E0 6 000 L 14,X
Take care when examining a based variable to ensure that the pointers are still valid.
Area variablesArea variables are located using one of the methods described above, according to their storage class.
The following is an example of typical code: for an area variable A declared AUTOMATIC. The area startsat offset X'F8' from register 13
300 z/OS: z/OS Language Environment Debugging Guide
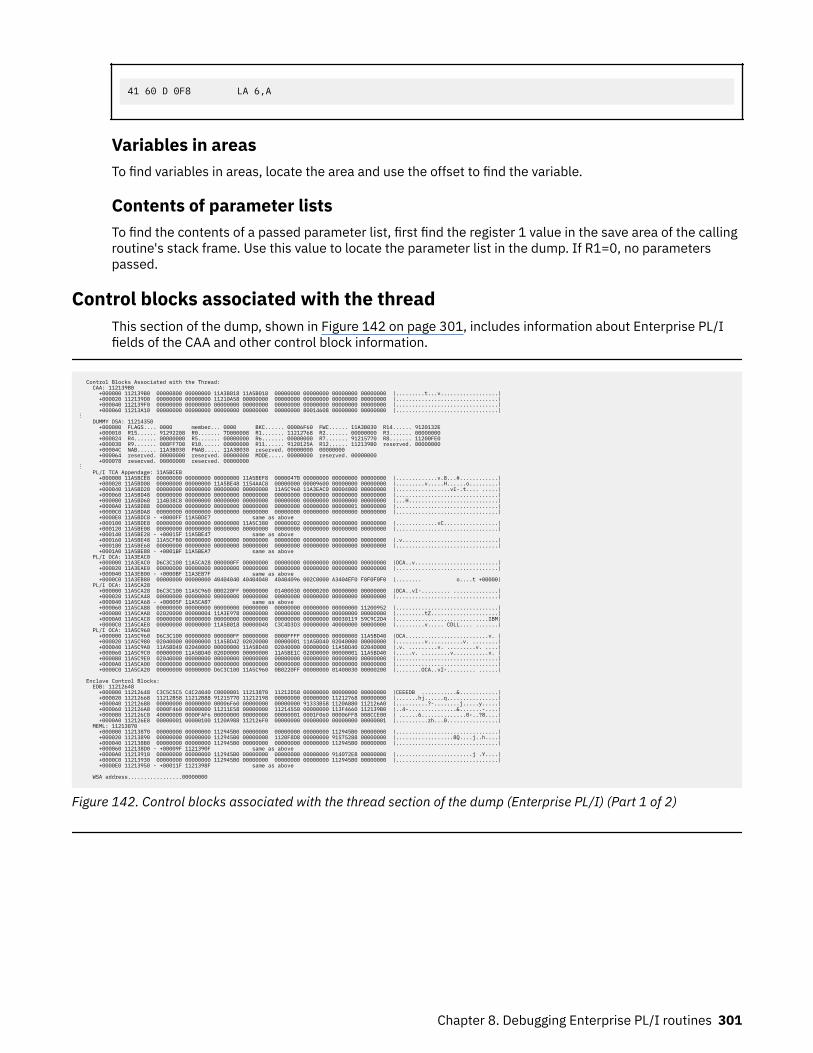
41 60 D 0F8 LA 6,A
Variables in areasTo find variables in areas, locate the area and use the offset to find the variable.
Contents of parameter listsTo find the contents of a passed parameter list, first find the register 1 value in the save area of the callingroutine's stack frame. Use this value to locate the parameter list in the dump. If R1=0, no parameterspassed.
Control blocks associated with the threadThis section of the dump, shown in Figure 142 on page 301, includes information about Enterprise PL/Ifields of the CAA and other control block information.
Control Blocks Associated with the Thread: CAA: 112139B0 +000000 112139B0 00000800 00000000 11A3B018 11A5B018 00000000 00000000 00000000 00000000 |.........t...v..................| +000020 112139D0 00000000 00000000 11210A58 00000000 00000000 00000000 00000000 00000000 |................................| +000040 112139F0 00000000 00000000 00000000 00000000 00000000 00000000 00000000 00000000 |................................| +000060 11213A10 00000000 00000000 00000000 00000000 00000000 80014608 00000000 00000000 |................................|⋮ DUMMY DSA: 11214350 +000000 FLAGS.... 0000 member... 0000 BKC...... 00006F60 FWC...... 11A3B030 R14...... 9120132E +000010 R15...... 91292208 R0....... 7D000008 R1....... 11212768 R2....... 00000000 R3....... 00000000 +000024 R4....... 00000000 R5....... 00000000 R6....... 00000000 R7....... 91215770 R8....... 11200FE0 +000038 R9....... 008FF7D0 R10...... 00000000 R11...... 9120125A R12...... 112139B0 reserved. 00000000 +00004C NAB...... 11A3B030 PNAB..... 11A3B030 reserved. 00000000 00000000 +000064 reserved. 00000000 reserved. 00000000 MODE..... 00000000 reserved. 00000000 +000078 reserved. 00000000 reserved. 00000000 ⋮ PL/I TCA Appendage: 11A5BCE8 +000000 11A5BCE8 00000000 00000000 00000000 11A5BEF8 0000047B 00000000 00000000 00000000 |.............v.8...#............| +000020 11A5BD08 00000000 00000000 11A5BE48 1154AAC8 00000000 00009600 00000000 00000000 |.........v.....H......o.........| +000040 11A5BD28 00000000 00000000 00000000 00000000 11A5C960 11A3EAC0 00004000 00000000 |.................vI-.t.... .....| +000060 11A5BD48 00000000 00000000 00000000 00000000 00000000 00000000 00000000 00000000 |................................| +000080 11A5BD68 114B38C8 00000000 00000000 00000000 00000000 00000000 00000000 00000000 |...H............................| +0000A0 11A5BD88 00000000 00000000 00000000 00000000 00000000 00000000 00000001 00000000 |................................| +0000C0 11A5BDA8 00000000 00000000 00000000 00000000 00000000 00000000 00000000 00000000 |................................| +0000E0 11A5BDC8 - +0000FF 11A5BDE7 same as above +000100 11A5BDE8 00000000 00000000 00000000 11A5C380 00000002 00000000 00000000 00000000 |.............vC.................| +000120 11A5BE08 00000000 00000000 00000000 00000000 00000000 00000000 00000000 00000000 |................................| +000140 11A5BE28 - +00015F 11A5BE47 same as above +000160 11A5BE48 11A5CFB0 00000000 00000000 00000000 00000000 00000000 00000000 00000000 |.v..............................| +000180 11A5BE68 00000000 00000000 00000000 00000000 00000000 00000000 00000000 00000000 |................................| +0001A0 11A5BE88 - +0001BF 11A5BEA7 same as above PL/I OCA: 11A3EAC0 +000000 11A3EAC0 D6C3C100 11A5CA28 000000FF 00000000 00000000 00000000 00000000 00000000 |OCA..v..........................| +000020 11A3EAE0 00000000 00000000 00000000 00000000 00000000 00000000 00000000 00000000 |................................| +000040 11A3EB00 - +0000BF 11A3EB7F same as above +0000C0 11A3EB80 00000000 00000000 40404040 40404040 40404096 002C0000 A3404EF0 F0F0F0F0 |........ o....t +00000| PL/I OCA: 11A5CA28 +000000 11A5CA28 D6C3C100 11A5C960 0B0220FF 00000000 01400030 00000200 00000000 00000000 |OCA..vI-......... ..............| +000020 11A5CA48 00000000 00000000 00000000 00000000 00000000 00000000 00000000 00000000 |................................| +000040 11A5CA68 - +00005F 11A5CA87 same as above +000060 11A5CA88 00000000 00000000 00000000 00000000 00000000 00000000 00000000 11200952 |................................| +000080 11A5CAA8 02020000 00000004 11A3E978 00000000 00000000 00000000 00000000 00000000 |.........tZ.....................| +0000A0 11A5CAC8 00000000 00000000 00000000 00000000 00000000 00000000 00030119 59C9C2D4 |.............................IBM| +0000C0 11A5CAE8 00000000 00000000 11A5B018 00000040 C3C4D3D3 00000000 40000000 00000000 |.........v..... CDLL.... .......| PL/I OCA: 11A5C960 +000000 11A5C960 D6C3C100 00000000 000000FF 00000000 0000FFFF 00000000 00000000 11A5BD40 |OCA..........................v. | +000020 11A5C980 02040000 00000000 11A5BD42 02020000 00000001 11A5BD40 02040000 00000000 |.........v...........v. ........| +000040 11A5C9A0 11A5BD40 02040000 00000000 11A5BD40 02040000 00000000 11A5BD40 02040000 |.v. .........v. .........v. ....| +000060 11A5C9C0 00000000 11A5BD40 020D0000 00000000 11A5BE1C 020D0000 00000001 11A5BD40 |.....v. .........v...........v. | +000080 11A5C9E0 02040000 00000000 00000000 00000000 00000000 00000000 00000000 00000000 |................................| +0000A0 11A5CA00 00000000 00000000 00000000 00000000 00000000 00000000 00000000 00000000 |................................| +0000C0 11A5CA20 00000000 00000000 D6C3C100 11A5C960 0B0220FF 00000000 01400030 00000200 |........OCA..vI-......... ......| Enclave Control Blocks: EDB: 11212648 +000000 11212648 C3C5C5C5 C4C24040 C0000001 11213870 11212D50 00000000 00000000 00000000 |CEEEDB ...........&............| +000020 11212668 11212B58 11212B88 91215770 11212198 00000000 00000000 11212768 00000000 |.......hj......q................| +000040 11212688 00000000 00000000 00006F60 00000000 00000000 91333B58 1120A880 112126A0 |..........?-........j.....y.....| +000060 112126A8 0000F460 00000000 11211E58 00000000 11214550 00000000 113F4660 112139B0 |..4-...............&.......-....| +000080 112126C8 40000000 0000FAF6 00000000 00000000 00000001 0001F060 00006FF8 008CCE00 | ......6..............0-..?8....| +0000A0 112126E8 00000001 00000100 1120A988 112126F0 00000000 00000000 00000000 00000001 |..........zh...0................| MEML: 11213870 +000000 11213870 00000000 00000000 112945B0 00000000 00000000 00000000 112945B0 00000000 |................................| +000020 11213890 00000000 00000000 112945B0 00000000 1120F8D8 00000000 91575288 00000000 |..................8Q....j..h....| +000040 112138B0 00000000 00000000 112945B0 00000000 00000000 00000000 112945B0 00000000 |................................| +000060 112138D0 - +00009F 1121390F same as above +0000A0 11213910 00000000 00000000 112945B0 00000000 00000000 00000000 914072E8 00000000 |........................j .Y....| +0000C0 11213930 00000000 00000000 112945B0 00000000 00000000 00000000 112945B0 00000000 |................................| +0000E0 11213950 - +00011F 1121398F same as above WSA address.................00000000
Figure 142. Control blocks associated with the thread section of the dump (Enterprise PL/I) (Part 1 of 2)
Chapter 8. Debugging Enterprise PL/I routines 301
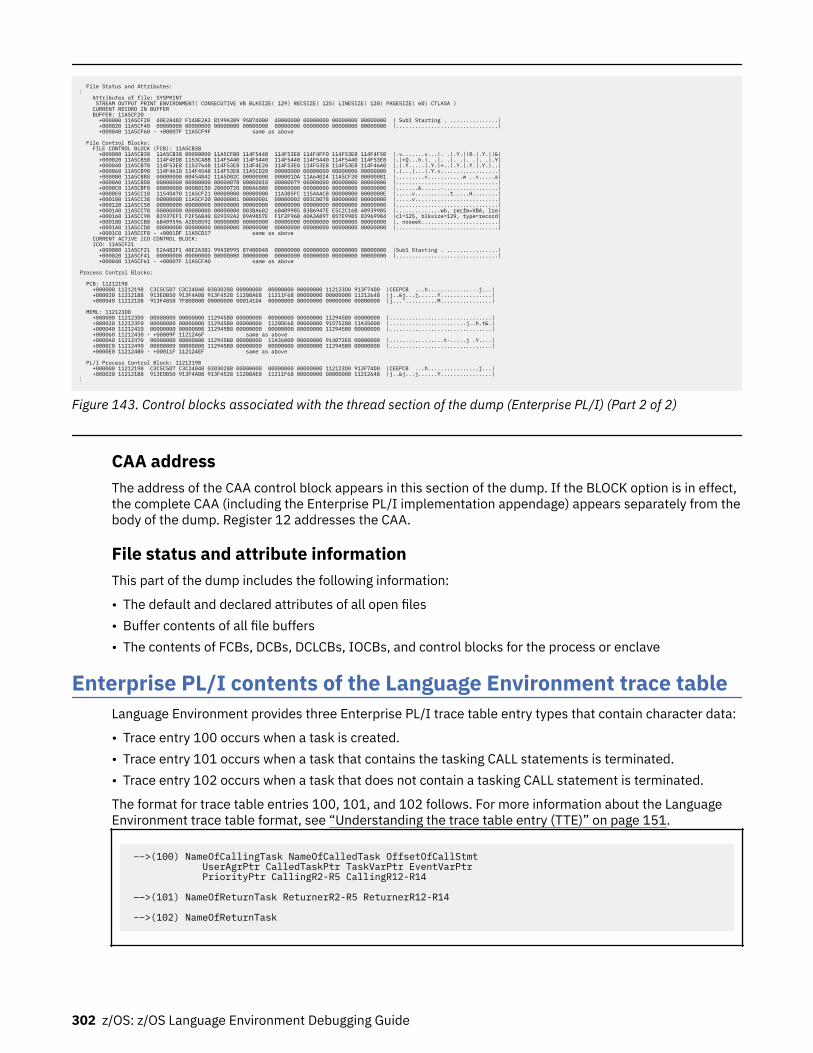
File Status and Attributes: ⋮ Attributes of file: SYSPRINT STREAM OUTPUT PRINT ENVIRONMENT( CONSECUTIVE VB BLKSIZE( 129) RECSIZE( 125) LINESIZE( 120) PAGESIZE( 60) CTLASA ) CURRENT RECORD IN BUFFER BUFFER: 11A5CF20 +000000 11A5CF20 40E2A482 F140E2A3 8199A389 95874000 40000000 00000000 00000000 00000000 | Sub1 Starting . ...............| +000020 11A5CF40 00000000 00000000 00000000 00000000 00000000 00000000 00000000 00000000 |................................| +000040 11A5CF60 - +00007F 11A5CF9F same as above File Control Blocks: FILE CONTROL BLOCK (FCB): 11A5CB38 +000000 11A5CB38 11A5CB38 00000000 11A5CFB0 114F5440 114F53E8 114F4FF0 114F53E8 114F4F50 |.v.......v...|. .|.Y.||0.|.Y.||&| +000020 11A5CB58 114F4ED8 1153CA88 114F5440 114F5440 114F5440 114F5440 114F5440 114F53E8 |.|+Q...h.|. .|. .|. .|. .|. .|.Y| +000040 11A5CB78 114F53E8 11537648 114F53E8 114F4E20 114F53E8 114F53E8 114F53E8 114F46A0 |.|.Y.....|.Y.|+..|.Y.|.Y.|.Y.|..| +000060 11A5CB98 114F4618 114F4548 114F53E8 11A5CD20 00000000 00000000 00000000 00000000 |.|...|...|.Y.v..................| +000080 11A5CBB8 00000000 00454842 11A5D02C 00000000 000001DA 11A64024 11A5CF20 00000081 |.........v...........w ..v.....a| +0000A0 11A5CBD8 00000000 00000000 00000078 00000010 00000079 00000000 00000000 00000000 |................................| +0000C0 11A5CBF8 00000000 00080150 20000720 000A6080 00000000 00000000 00000000 00000000 |.......&......-.................| +0000E0 11A5CC18 1154DA70 11A5CF21 00000000 00000000 11A3B5FC 1154AAC8 00000000 0000000E |.....v...........t.....H........| +000100 11A5CC38 00000000 11A5CF20 00000001 00000001 00000002 003C0078 08000000 00000000 |.....v..........................| +000120 11A5CC58 00000000 00000000 00000000 00000000 00000000 00000000 00000000 00000000 |................................| +000140 11A5CC78 00000000 00000000 00000000 003BA682 6B409985 8386947E E5C2C16B 40939985 |..............wb, recfm=VBA, lre| +000160 11A5CC98 83937EF1 F2F56B40 829392A2 89A9857E F1F2F96B 40A3A897 857E9985 83969984 |cl=125, blksize=129, type=record| +000180 11A5CCB8 6B409596 A2858592 00000000 00000000 00000000 00000000 00000000 00000000 |, noseek........................| +0001A0 11A5CCD8 00000000 00000000 00000000 00000000 00000000 00000000 00000000 00000000 |................................| +0001C0 11A5CCF8 - +0001DF 11A5CD17 same as above CURRENT ACTIVE ICO CONTROL BLOCK: ICO: 11A5CF21 +000000 11A5CF21 E2A482F1 40E2A381 99A38995 87400040 00000000 00000000 00000000 00000000 |Sub1 Starting . ................| +000020 11A5CF41 00000000 00000000 00000000 00000000 00000000 00000000 00000000 00000000 |................................| +000040 11A5CF61 - +00007F 11A5CFA0 same as above Process Control Blocks: PCB: 11212198 +000000 11212198 C3C5C5D7 C3C24040 03030288 00000000 00000000 00000000 112123D0 913F74D0 |CEEPCB ...h................j...| +000020 112121B8 913EDB50 913F4A08 913F4528 11208AE8 11211F68 00000000 00000000 11212648 |j..&j...j......Y................| +000040 112121D8 913F4858 7F800000 00000000 000141D4 00000000 80000000 00000000 00000000 |j..."..........M................| MEML: 112123D0 +000000 112123D0 00000000 00000000 112945B0 00000000 00000000 00000000 112945B0 00000000 |................................| +000020 112123F0 00000000 00000000 112945B0 00000000 1120DE68 00000000 91575288 11A35000 |........................j..h.t&.| +000040 11212410 00000000 00000000 112945B0 00000000 00000000 00000000 112945B0 00000000 |................................| +000060 11212430 - +00009F 1121246F same as above +0000A0 11212470 00000000 00000000 112945B0 00000000 11A36000 00000000 914072E8 00000000 |.................t-.....j .Y....| +0000C0 11212490 00000000 00000000 112945B0 00000000 00000000 00000000 112945B0 00000000 |................................| +0000E0 112124B0 - +00011F 112124EF same as above PL/I Process Control Block: 11212198 +000000 11212198 C3C5C5D7 C3C24040 03030288 00000000 00000000 00000000 112123D0 913F74D0 |CEEPCB ...h................j...| +000020 112121B8 913EDB50 913F4A08 913F4528 11208AE8 11211F68 00000000 00000000 11212648 |j..&j...j......Y................| ⋮
Figure 143. Control blocks associated with the thread section of the dump (Enterprise PL/I) (Part 2 of 2)
CAA addressThe address of the CAA control block appears in this section of the dump. If the BLOCK option is in effect,the complete CAA (including the Enterprise PL/I implementation appendage) appears separately from thebody of the dump. Register 12 addresses the CAA.
File status and attribute informationThis part of the dump includes the following information:
• The default and declared attributes of all open files• Buffer contents of all file buffers• The contents of FCBs, DCBs, DCLCBs, IOCBs, and control blocks for the process or enclave
Enterprise PL/I contents of the Language Environment trace tableLanguage Environment provides three Enterprise PL/I trace table entry types that contain character data:
• Trace entry 100 occurs when a task is created.• Trace entry 101 occurs when a task that contains the tasking CALL statements is terminated.• Trace entry 102 occurs when a task that does not contain a tasking CALL statement is terminated.
The format for trace table entries 100, 101, and 102 follows. For more information about the LanguageEnvironment trace table format, see “Understanding the trace table entry (TTE)” on page 151.
––>(100) NameOfCallingTask NameOfCalledTask OffsetOfCallStmt UserAgrPtr CalledTaskPtr TaskVarPtr EventVarPtr PriorityPtr CallingR2-R5 CallingR12-R14
––>(101) NameOfReturnTask ReturnerR2-R5 ReturnerR12-R14
––>(102) NameOfReturnTask
302 z/OS: z/OS Language Environment Debugging Guide
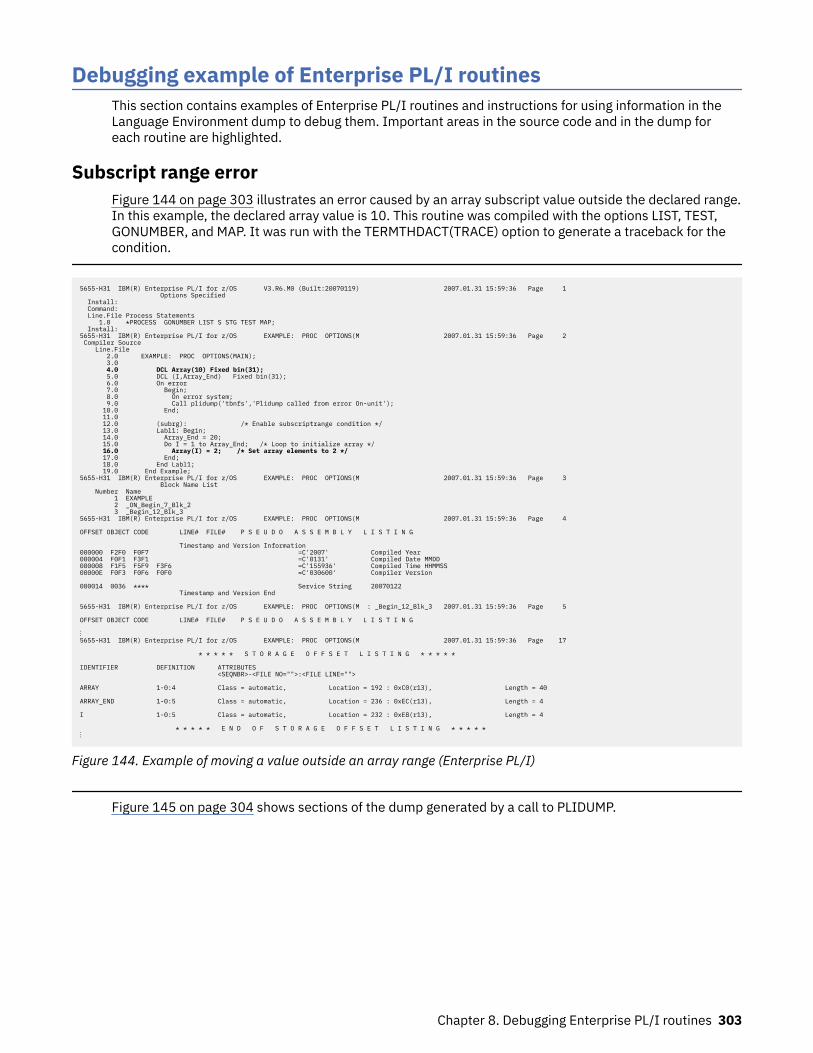
Debugging example of Enterprise PL/I routinesThis section contains examples of Enterprise PL/I routines and instructions for using information in theLanguage Environment dump to debug them. Important areas in the source code and in the dump foreach routine are highlighted.
Subscript range errorFigure 144 on page 303 illustrates an error caused by an array subscript value outside the declared range. In this example, the declared array value is 10. This routine was compiled with the options LIST, TEST,GONUMBER, and MAP. It was run with the TERMTHDACT(TRACE) option to generate a traceback for thecondition.
5655-H31 IBM(R) Enterprise PL/I for z/OS V3.R6.M0 (Built:20070119) 2007.01.31 15:59:36 Page 1 Options Specified Install: Command: Line.File Process Statements 1.0 *PROCESS GONUMBER LIST S STG TEST MAP; Install: 5655-H31 IBM(R) Enterprise PL/I for z/OS EXAMPLE: PROC OPTIONS(M 2007.01.31 15:59:36 Page 2 Compiler Source Line.File 2.0 EXAMPLE: PROC OPTIONS(MAIN); 3.0 4.0 DCL Array(10) Fixed bin(31); 5.0 DCL (I,Array_End) Fixed bin(31); 6.0 On error 7.0 Begin; 8.0 On error system; 9.0 Call plidump('tbnfs','Plidump called from error On-unit'); 10.0 End; 11.0 12.0 (subrg): /* Enable subscriptrange condition */ 13.0 Labl1: Begin; 14.0 Array_End = 20; 15.0 Do I = 1 to Array_End; /* Loop to initialize array */ 16.0 Array(I) = 2; /* Set array elements to 2 */ 17.0 End; 18.0 End Labl1; 19.0 End Example; 5655-H31 IBM(R) Enterprise PL/I for z/OS EXAMPLE: PROC OPTIONS(M 2007.01.31 15:59:36 Page 3 Block Name List Number Name 1 EXAMPLE 2 _ON_Begin_7_Blk_2 3 _Begin_12_Blk_3 5655-H31 IBM(R) Enterprise PL/I for z/OS EXAMPLE: PROC OPTIONS(M 2007.01.31 15:59:36 Page 4 OFFSET OBJECT CODE LINE# FILE# P S E U D O A S S E M B L Y L I S T I N G Timestamp and Version Information 000000 F2F0 F0F7 =C'2007' Compiled Year 000004 F0F1 F3F1 =C'0131' Compiled Date MMDD 000008 F1F5 F5F9 F3F6 =C'155936' Compiled Time HHMMSS 00000E F0F3 F0F6 F0F0 =C'030600' Compiler Version 000014 0036 **** Service String 20070122 Timestamp and Version End 5655-H31 IBM(R) Enterprise PL/I for z/OS EXAMPLE: PROC OPTIONS(M : _Begin_12_Blk_3 2007.01.31 15:59:36 Page 5 OFFSET OBJECT CODE LINE# FILE# P S E U D O A S S E M B L Y L I S T I N G ⋮ 5655-H31 IBM(R) Enterprise PL/I for z/OS EXAMPLE: PROC OPTIONS(M 2007.01.31 15:59:36 Page 17 * * * * * S T O R A G E O F F S E T L I S T I N G * * * * * IDENTIFIER DEFINITION ATTRIBUTES <SEQNBR>-<FILE NO="">:<FILE LINE=""> ARRAY 1-0:4 Class = automatic, Location = 192 : 0xC0(r13), Length = 40 ARRAY_END 1-0:5 Class = automatic, Location = 236 : 0xEC(r13), Length = 4 I 1-0:5 Class = automatic, Location = 232 : 0xE8(r13), Length = 4 * * * * * E N D O F S T O R A G E O F F S E T L I S T I N G * * * * * ⋮
Figure 144. Example of moving a value outside an array range (Enterprise PL/I)
Figure 145 on page 304 shows sections of the dump generated by a call to PLIDUMP.
Chapter 8. Debugging Enterprise PL/I routines 303
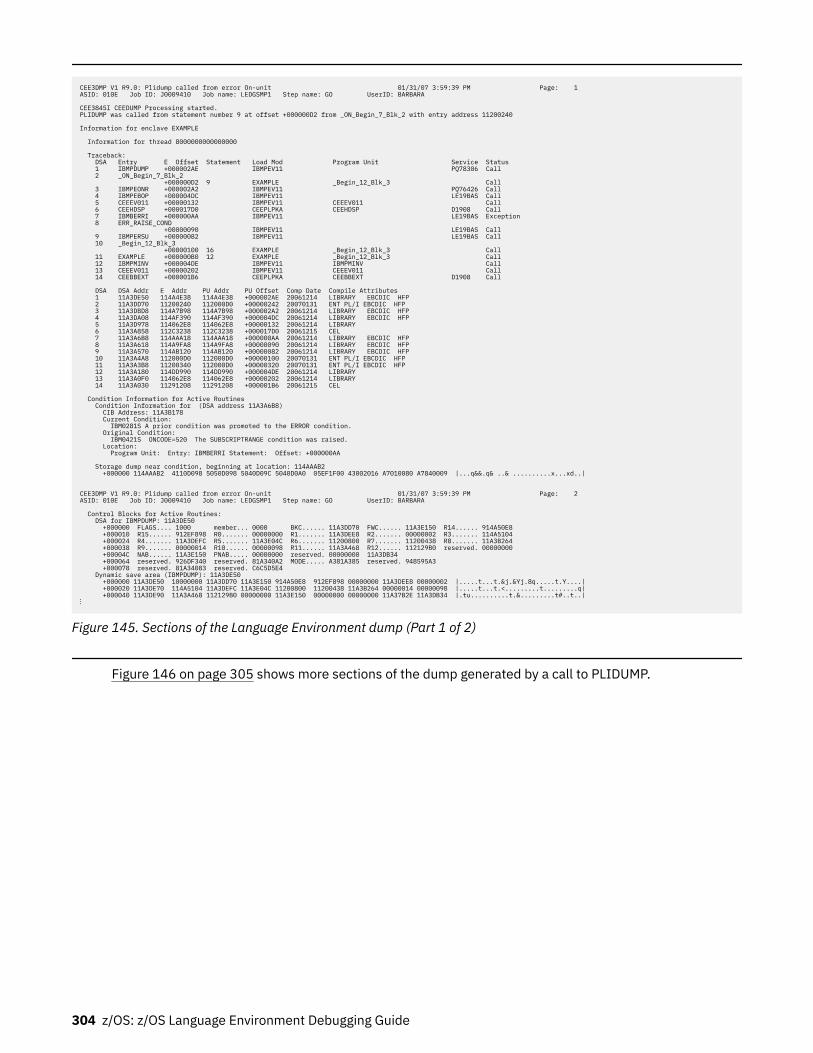
CEE3DMP V1 R9.0: Plidump called from error On-unit 01/31/07 3:59:39 PM Page: 1 ASID: 010E Job ID: J0009410 Job name: LEDGSMP1 Step name: GO UserID: BARBARA CEE3845I CEEDUMP Processing started. PLIDUMP was called from statement number 9 at offset +000000D2 from _ON_Begin_7_Blk_2 with entry address 11200240 Information for enclave EXAMPLE Information for thread 8000000000000000 Traceback: DSA Entry E Offset Statement Load Mod Program Unit Service Status 1 IBMPDUMP +000002AE IBMPEV11 PQ78306 Call 2 _ON_Begin_7_Blk_2 +000000D2 9 EXAMPLE _Begin_12_Blk_3 Call 3 IBMPEONR +000002A2 IBMPEV11 PQ76426 Call 4 IBMPEBOP +000004DC IBMPEV11 LE19BAS Call 5 CEEEV011 +00000132 IBMPEV11 CEEEV011 Call 6 CEEHDSP +000017D0 CEEPLPKA CEEHDSP D1908 Call 7 IBMBERRI +000000AA IBMPEV11 LE19BAS Exception 8 ERR_RAISE_COND +00000090 IBMPEV11 LE19BAS Call 9 IBMPERSU +00000082 IBMPEV11 LE19BAS Call 10 _Begin_12_Blk_3 +00000100 16 EXAMPLE _Begin_12_Blk_3 Call 11 EXAMPLE +000000B0 12 EXAMPLE _Begin_12_Blk_3 Call 12 IBMPMINV +000004DE IBMPEV11 IBMPMINV Call 13 CEEEV011 +00000202 IBMPEV11 CEEEV011 Call 14 CEEBBEXT +000001B6 CEEPLPKA CEEBBEXT D1908 Call DSA DSA Addr E Addr PU Addr PU Offset Comp Date Compile Attributes 1 11A3DE50 114A4E38 114A4E38 +000002AE 20061214 LIBRARY EBCDIC HFP 2 11A3DD70 11200240 112000D0 +00000242 20070131 ENT PL/I EBCDIC HFP 3 11A3DBD8 114A7B98 114A7B98 +000002A2 20061214 LIBRARY EBCDIC HFP 4 11A3DA08 114AF390 114AF390 +000004DC 20061214 LIBRARY EBCDIC HFP 5 11A3D978 114062E8 114062E8 +00000132 20061214 LIBRARY 6 11A3A858 112C3238 112C3238 +000017D0 20061215 CEL 7 11A3A6B8 114AAA18 114AAA18 +000000AA 20061214 LIBRARY EBCDIC HFP 8 11A3A618 114A9FA8 114A9FA8 +00000090 20061214 LIBRARY EBCDIC HFP 9 11A3A570 114AB120 114AB120 +00000082 20061214 LIBRARY EBCDIC HFP 10 11A3A4A8 112000D0 112000D0 +00000100 20070131 ENT PL/I EBCDIC HFP 11 11A3A3B8 11200340 112000D0 +00000320 20070131 ENT PL/I EBCDIC HFP 12 11A3A180 114DD990 114DD990 +000004DE 20061214 LIBRARY 13 11A3A0F0 114062E8 114062E8 +00000202 20061214 LIBRARY 14 11A3A030 11291208 11291208 +000001B6 20061215 CEL Condition Information for Active Routines Condition Information for (DSA address 11A3A6B8) CIB Address: 11A3B178 Current Condition: IBM0281S A prior condition was promoted to the ERROR condition. Original Condition: IBM0421S ONCODE=520 The SUBSCRIPTRANGE condition was raised. Location: Program Unit: Entry: IBMBERRI Statement: Offset: +000000AA Storage dump near condition, beginning at location: 114AAAB2 +000000 114AAAB2 4110D098 5050D098 5040D09C 5040D0A0 05EF1F00 43002016 A7010080 A7840009 |...q&&.q& ..& ..........x...xd..| CEE3DMP V1 R9.0: Plidump called from error On-unit 01/31/07 3:59:39 PM Page: 2 ASID: 010E Job ID: J0009410 Job name: LEDGSMP1 Step name: GO UserID: BARBARA Control Blocks for Active Routines: DSA for IBMPDUMP: 11A3DE50 +000000 FLAGS.... 1000 member... 0000 BKC...... 11A3DD70 FWC...... 11A3E150 R14...... 914A50E8 +000010 R15...... 912EF898 R0....... 00000000 R1....... 11A3DEE8 R2....... 00000002 R3....... 114A5104 +000024 R4....... 11A3DEFC R5....... 11A3E04C R6....... 11200800 R7....... 11200438 R8....... 11A3B264 +000038 R9....... 00000014 R10...... 00000098 R11...... 11A3A468 R12...... 112129B0 reserved. 00000000 +00004C NAB...... 11A3E150 PNAB..... 00000000 reserved. 00000000 11A3DB34 +000064 reserved. 926DF340 reserved. 81A340A2 MODE..... A381A385 reserved. 948595A3 +000078 reserved. 81A34083 reserved. C6C5D5E4 Dynamic save area (IBMPDUMP): 11A3DE50 +000000 11A3DE50 10000000 11A3DD70 11A3E150 914A50E8 912EF898 00000000 11A3DEE8 00000002 |.....t...t.&j.&Yj.8q.....t.Y....| +000020 11A3DE70 114A5104 11A3DEFC 11A3E04C 11200800 11200438 11A3B264 00000014 00000098 |.....t...t.<.........t.........q| +000040 11A3DE90 11A3A468 112129B0 00000000 11A3E150 00000000 00000000 11A37B2E 11A3DB34 |.tu..........t.&.........t#..t..|⋮
Figure 145. Sections of the Language Environment dump (Part 1 of 2)
Figure 146 on page 305 shows more sections of the dump generated by a call to PLIDUMP.
304 z/OS: z/OS Language Environment Debugging Guide
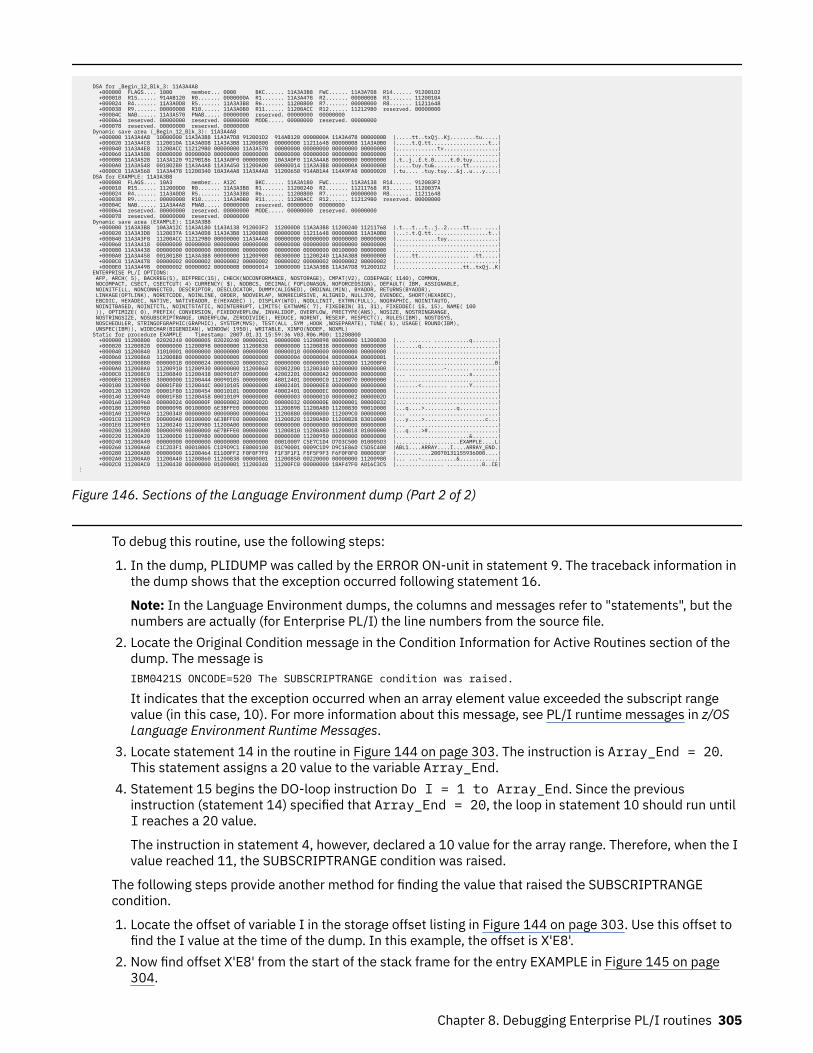
DSA for _Begin_12_Blk_3: 11A3A4A8 +000000 FLAGS.... 1000 member... 0000 BKC...... 11A3A3B8 FWC...... 11A3A7D8 R14...... 912001D2 +000010 R15...... 914AB120 R0....... 0000000A R1....... 11A3A478 R2....... 0000000B R3....... 1120010A +000024 R4....... 11A3A0D8 R5....... 11A3A3B8 R6....... 11200800 R7....... 00000000 R8....... 11211648 +000038 R9....... 00000008 R10...... 11A3A0B0 R11...... 11200ACC R12...... 112129B0 reserved. 00000000 +00004C NAB...... 11A3A570 PNAB..... 00000000 reserved. 00000000 00000000 +000064 reserved. 00000000 reserved. 00000000 MODE..... 00000000 reserved. 00000000 +000078 reserved. 00000000 reserved. 00000000 Dynamic save area (_Begin_12_Blk_3): 11A3A4A8 +000000 11A3A4A8 10000000 11A3A3B8 11A3A7D8 912001D2 914AB120 0000000A 11A3A478 0000000B |.....tt..txQj..Kj........tu.....| +000020 11A3A4C8 1120010A 11A3A0D8 11A3A3B8 11200800 00000000 11211648 00000008 11A3A0B0 |.....t.Q.tt..................t..| +000040 11A3A4E8 11200ACC 112129B0 00000000 11A3A570 00000000 00000000 00000000 00000000 |.............tv.................| +000060 11A3A508 00000000 00000000 00000000 00000000 00000000 00000000 00000000 00000000 |................................| +000080 11A3A528 11A3A120 9129B186 11A3A0F0 00000000 10A3A0F0 11A3A4A8 00000000 00000000 |.t..j..f.t.0.....t.0.tuy........| +0000A0 11A3A548 00180280 11A3A4A8 11A3A450 11200A00 00000014 11A3A3B8 0000000A 0000000B |.....tuy.tu&.........tt.........| +0000C0 11A3A568 11A3A478 11200340 10A3A4A8 11A3A4A8 11200650 914AB1A4 114A9FA8 00000020 |.tu.... .tuy.tuy...&j..u...y....| DSA for EXAMPLE: 11A3A3B8 +000000 FLAGS.... 10A3 member... A12C BKC...... 11A3A180 FWC...... 11A3A138 R14...... 912003F2 +000010 R15...... 112000D0 R0....... 11A3A3B8 R1....... 11200240 R2....... 11211768 R3....... 1120037A +000024 R4....... 11A3A0D8 R5....... 11A3A3B8 R6....... 11200800 R7....... 00000000 R8....... 11211648 +000038 R9....... 00000008 R10...... 11A3A0B0 R11...... 11200ACC R12...... 112129B0 reserved. 00000000 +00004C NAB...... 11A3A4A8 PNAB..... 00000000 reserved. 00000000 00000000 +000064 reserved. 00000000 reserved. 00000000 MODE..... 00000000 reserved. 00000000 +000078 reserved. 00000000 reserved. 00000000 Dynamic save area (EXAMPLE): 11A3A3B8 +000000 11A3A3B8 10A3A12C 11A3A180 11A3A138 912003F2 112000D0 11A3A3B8 11200240 11211768 |.t...t...t..j..2.....tt.... ....| +000020 11A3A3D8 1120037A 11A3A0D8 11A3A3B8 11200800 00000000 11211648 00000008 11A3A0B0 |...:.t.Q.tt..................t..| +000040 11A3A3F8 11200ACC 112129B0 00000000 11A3A4A8 00000000 00000000 00000000 00000000 |.............tuy................| +000060 11A3A418 00000000 00000000 00000000 00000000 00000000 00000000 00000000 00000000 |................................| +000080 11A3A438 00000000 00000000 00000000 00000000 00000000 00000000 00100000 00000000 |................................| +0000A0 11A3A458 00180180 11A3A3B8 00000000 11200980 0B300000 11200240 11A3A3B8 00000000 |.....tt................ .tt.....| +0000C0 11A3A478 00000002 00000002 00000002 00000002 00000002 00000002 00000002 00000002 |................................| +0000E0 11A3A498 00000002 00000002 0000000B 00000014 10000000 11A3A3B8 11A3A7D8 912001D2 |.....................tt..txQj..K| ENTERPRISE PL/I OPTIONS: AFP, ARCH( 5), BACKREG(5), BIFPREC(15), CHECK(NOCONFORMANCE, NOSTORAGE), CMPAT(V2), CODEPAGE( 1140), COMMON, NOCOMPACT, CSECT, CSECTCUT( 4) CURRENCY( $), NODBCS, DECIMAL( FOFLONASGN, NOFORCEDSIGN), DEFAULT( IBM, ASSIGNABLE, NOINITFILL, NONCONNECTED, DESCRIPTOR, DESCLOCATOR, DUMMY(ALIGNED), ORDINAL(MIN), BYADDR, RETURNS(BYADDR), LINKAGE(OPTLINK), NORETCODE, NOINLINE, ORDER, NOOVERLAP, NONRECURSIVE, ALIGNED, NULL370, EVENDEC, SHORT(HEXADEC), EBCDIC, HEXADEC, NATIVE, NATIVEADDR, E(HEXADEC) ), DISPLAY(WTO), NODLLINIT, EXTRN(FULL), NOGRAPHIC, NOINITAUTO, NOINITBASED, NOINITCTL, NOINITSTATIC, NOINTERRUPT, LIMITS( EXTNAME( 7), FIXEDBIN( 31, 31), FIXEDDEC( 15, 15), NAME( 100 )), OPTIMIZE( 0), PREFIX( CONVERSION, FIXEDOVERFLOW, INVALIDOP, OVERFLOW, PRECTYPE(ANS), NOSIZE, NOSTRINGRANGE, NOSTRINGSIZE, NOSUBSCRIPTRANGE, UNDERFLOW, ZERODIVIDE), REDUCE, NORENT, RESEXP, RESPECT(), RULES(IBM), NOSTDSYS, NOSCHEDULER, STRINGOFGRAPHIC(GRAPHIC), SYSTEM(MVS), TEST(ALL ,SYM ,HOOK ,NOSEPARATE), TUNE( 5), USAGE( ROUND(IBM), UNSPEC(IBM)), WIDECHAR(BIGENDIAN), WINDOW( 1950), WRITABLE, XINFO(NODEF, NOXML) Static for procedure EXAMPLE Timestamp: 2007.01.31 15:59:36 V03.R06.M00: 11200800 +000000 11200800 02020240 00000005 02020240 00000021 00000000 11200898 00000000 11200830 |... ....... ...........q........| +000020 11200820 00000000 11200898 00000000 11200830 00000000 11200838 00000000 00000000 |.......q........................| +000040 11200840 31010001 00000000 00000000 00000000 00000010 00000000 00000000 00000000 |................................| +000060 11200860 112008B0 00000000 00000000 00000000 00000004 00000004 0000000A 00000001 |................................| +000080 11200880 0000001B 00000024 0000002D 00000032 00000000 00000000 112008D0 112008F0 |...............................0| +0000A0 112008A0 11200910 11200930 00000000 11200860 02002200 11200340 00000000 00000000 |...............-....... ........| +0000C0 112008C0 11200840 11200438 00090107 00000000 42002201 000000A2 00000000 00000000 |... ...................s........| +0000E0 112008E0 30000000 11200444 00090105 00000000 48012401 D00000C0 11200870 00000000 |................................| +000100 11200900 00001F80 1120044C 00010105 00000000 40002401 D00000E8 00000000 00000000 |.......<........ ......Y........| +000120 11200920 00001F80 11200454 00010101 00000000 40002401 D00000EC 00000000 00000000 |................ ...............| +000140 11200940 00001F80 11200458 00010109 00000000 00000003 00000010 00000002 0000002D |................................| +000160 11200960 00000024 0000000F 00000002 0000002D 00000032 0000000E 00000001 00000032 |................................| +000180 11200980 D0000098 00100000 6E3BFFE0 00000000 11200898 11200A80 11200830 90010000 |...q....>..........q............| +0001A0 112009A0 11200340 00000000 00000000 00000004 11200880 00000000 112009C0 00000000 |... ............................| +0001C0 112009C0 D00000A8 00100000 6E3BFFE0 00000000 11200820 11200A80 11200828 83010000 |...y....>...................c...| +0001E0 112009E0 11200240 11200980 11200A00 00000000 00000000 00000000 00000000 00000000 |... ............................| +000200 11200A00 D0000098 00000000 6E7BFFE0 00000000 11200810 11200A80 11200818 01000000 |...q....>#......................| +000220 11200A20 112000D0 11200980 00000000 00000000 00000000 11200950 00000000 00000000 |.......................&........| +000240 11200A40 00000000 00000000 00000000 00000000 00010007 C5E7C1D4 D7D3C500 010005D3 |....................EXAMPLE....L| +000260 11200A60 C1C2D3F1 00010005 C1D9D9C1 E8000100 01C90001 0009C1D9 D9C1E86D C5D5C400 |ABL1....ARRAY....I....ARRAY_END.| +000280 11200A80 00000000 11200464 E1100FF2 F0F0F7F0 F1F3F1F1 F5F5F9F3 F6F0F0F0 0000003F |...........20070131155936000....| +0002A0 11200AA0 11200A40 11200860 11200838 00000001 11200850 00220000 00000000 11200980 |... ...-...........&............| +0002C0 11200AC0 11200438 00000000 01000001 11200340 11200FC0 00000000 18AF47F0 A016C3C5 |............... ...........0..CE|⋮
Figure 146. Sections of the Language Environment dump (Part 2 of 2)
To debug this routine, use the following steps:
1. In the dump, PLIDUMP was called by the ERROR ON-unit in statement 9. The traceback information inthe dump shows that the exception occurred following statement 16.
Note: In the Language Environment dumps, the columns and messages refer to "statements", but thenumbers are actually (for Enterprise PL/I) the line numbers from the source file.
2. Locate the Original Condition message in the Condition Information for Active Routines section of thedump. The message isIBM0421S ONCODE=520 The SUBSCRIPTRANGE condition was raised.
It indicates that the exception occurred when an array element value exceeded the subscript rangevalue (in this case, 10). For more information about this message, see PL/I runtime messages in z/OSLanguage Environment Runtime Messages.
3. Locate statement 14 in the routine in Figure 144 on page 303. The instruction is Array_End = 20.This statement assigns a 20 value to the variable Array_End.
4. Statement 15 begins the DO-loop instruction Do I = 1 to Array_End. Since the previousinstruction (statement 14) specified that Array_End = 20, the loop in statement 10 should run untilI reaches a 20 value.
The instruction in statement 4, however, declared a 10 value for the array range. Therefore, when the Ivalue reached 11, the SUBSCRIPTRANGE condition was raised.
The following steps provide another method for finding the value that raised the SUBSCRIPTRANGEcondition.
1. Locate the offset of variable I in the storage offset listing in Figure 144 on page 303. Use this offset tofind the I value at the time of the dump. In this example, the offset is X'E8'.
2. Now find offset X'E8' from the start of the stack frame for the entry EXAMPLE in Figure 145 on page304.
Chapter 8. Debugging Enterprise PL/I routines 305
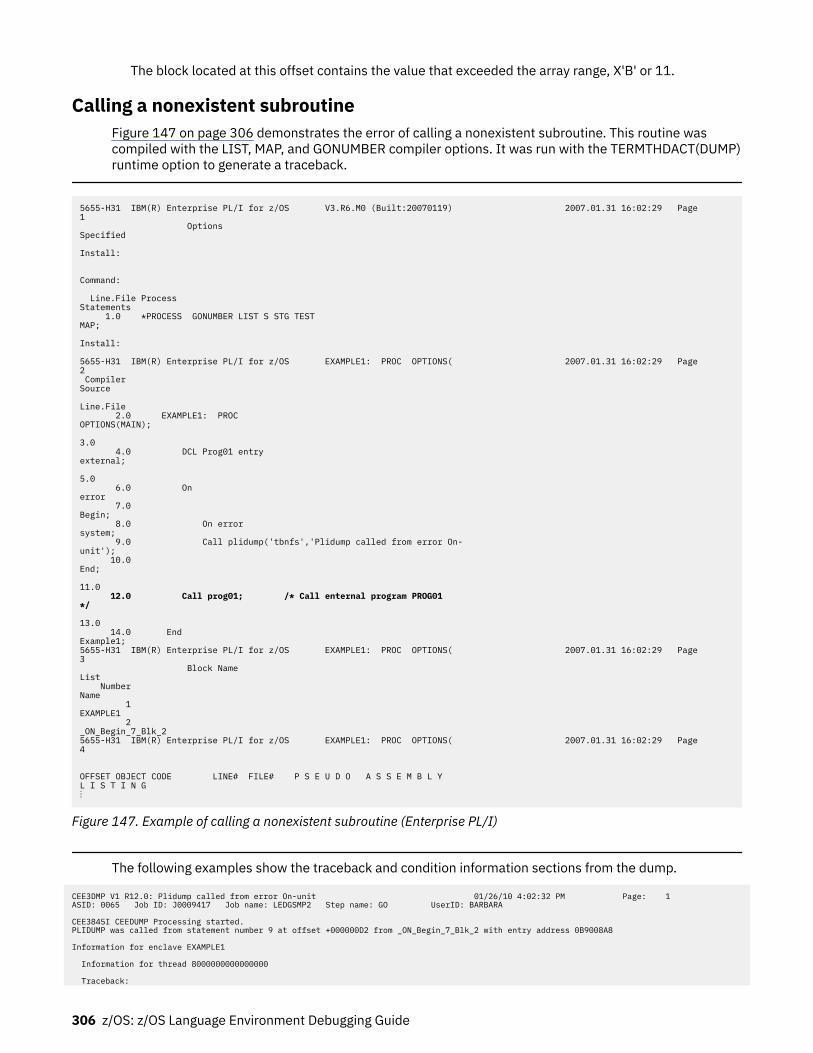
The block located at this offset contains the value that exceeded the array range, X'B' or 11.
Calling a nonexistent subroutineFigure 147 on page 306 demonstrates the error of calling a nonexistent subroutine. This routine wascompiled with the LIST, MAP, and GONUMBER compiler options. It was run with the TERMTHDACT(DUMP)runtime option to generate a traceback.
5655-H31 IBM(R) Enterprise PL/I for z/OS V3.R6.M0 (Built:20070119) 2007.01.31 16:02:29 Page 1 Options Specified Install: Command: Line.File Process Statements 1.0 *PROCESS GONUMBER LIST S STG TEST MAP; Install: 5655-H31 IBM(R) Enterprise PL/I for z/OS EXAMPLE1: PROC OPTIONS( 2007.01.31 16:02:29 Page 2 Compiler Source Line.File 2.0 EXAMPLE1: PROC OPTIONS(MAIN); 3.0 4.0 DCL Prog01 entry external; 5.0 6.0 On error 7.0 Begin; 8.0 On error system; 9.0 Call plidump('tbnfs','Plidump called from error On-unit'); 10.0 End; 11.0 12.0 Call prog01; /* Call enternal program PROG01 */ 13.0 14.0 End Example1; 5655-H31 IBM(R) Enterprise PL/I for z/OS EXAMPLE1: PROC OPTIONS( 2007.01.31 16:02:29 Page 3 Block Name List Number Name 1 EXAMPLE1 2 _ON_Begin_7_Blk_2 5655-H31 IBM(R) Enterprise PL/I for z/OS EXAMPLE1: PROC OPTIONS( 2007.01.31 16:02:29 Page 4 OFFSET OBJECT CODE LINE# FILE# P S E U D O A S S E M B L Y L I S T I N G ⋮
Figure 147. Example of calling a nonexistent subroutine (Enterprise PL/I)
The following examples show the traceback and condition information sections from the dump.
CEE3DMP V1 R12.0: Plidump called from error On-unit 01/26/10 4:02:32 PM Page: 1 ASID: 0065 Job ID: J0009417 Job name: LEDGSMP2 Step name: GO UserID: BARBARA CEE3845I CEEDUMP Processing started. PLIDUMP was called from statement number 9 at offset +000000D2 from _ON_Begin_7_Blk_2 with entry address 0B9008A8 Information for enclave EXAMPLE1 Information for thread 8000000000000000 Traceback:
306 z/OS: z/OS Language Environment Debugging Guide
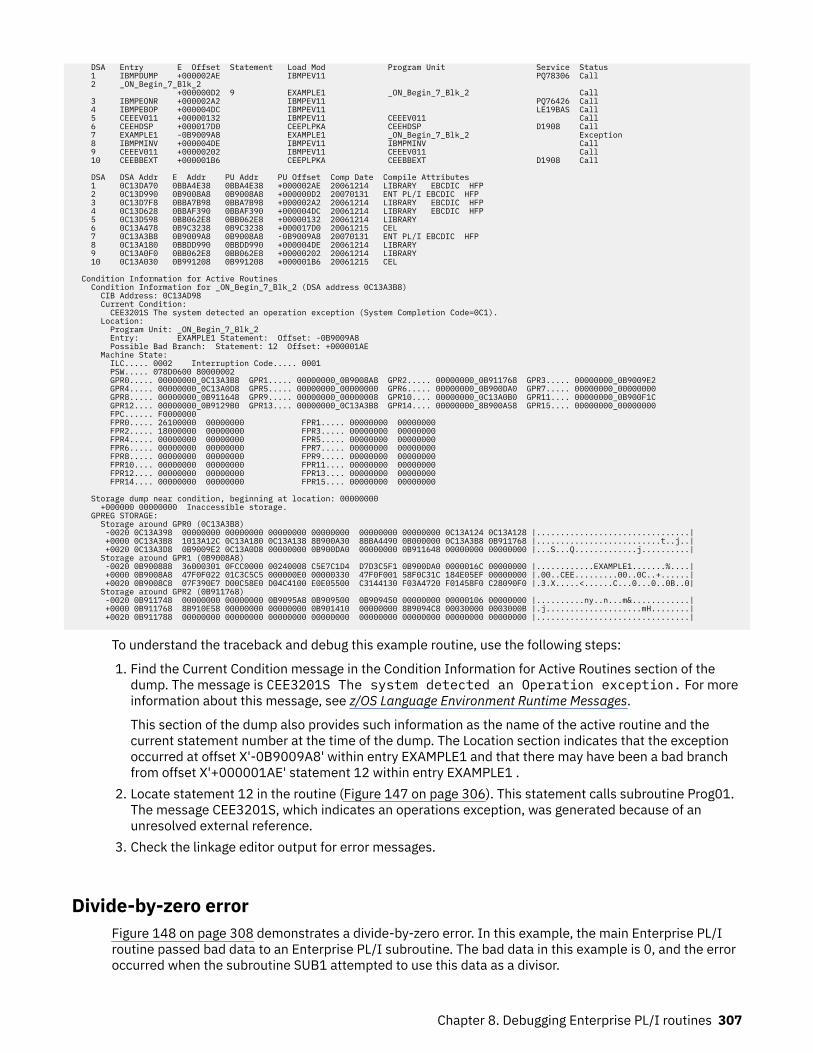
DSA Entry E Offset Statement Load Mod Program Unit Service Status 1 IBMPDUMP +000002AE IBMPEV11 PQ78306 Call 2 _ON_Begin_7_Blk_2 +000000D2 9 EXAMPLE1 _ON_Begin_7_Blk_2 Call 3 IBMPEONR +000002A2 IBMPEV11 PQ76426 Call 4 IBMPEBOP +000004DC IBMPEV11 LE19BAS Call 5 CEEEV011 +00000132 IBMPEV11 CEEEV011 Call 6 CEEHDSP +000017D0 CEEPLPKA CEEHDSP D1908 Call 7 EXAMPLE1 -0B9009A8 EXAMPLE1 _ON_Begin_7_Blk_2 Exception 8 IBMPMINV +000004DE IBMPEV11 IBMPMINV Call 9 CEEEV011 +00000202 IBMPEV11 CEEEV011 Call 10 CEEBBEXT +000001B6 CEEPLPKA CEEBBEXT D1908 Call DSA DSA Addr E Addr PU Addr PU Offset Comp Date Compile Attributes 1 0C13DA70 0BBA4E38 0BBA4E38 +000002AE 20061214 LIBRARY EBCDIC HFP 2 0C13D990 0B9008A8 0B9008A8 +000000D2 20070131 ENT PL/I EBCDIC HFP 3 0C13D7F8 0BBA7B98 0BBA7B98 +000002A2 20061214 LIBRARY EBCDIC HFP 4 0C13D628 0BBAF390 0BBAF390 +000004DC 20061214 LIBRARY EBCDIC HFP 5 0C13D598 0BB062E8 0BB062E8 +00000132 20061214 LIBRARY 6 0C13A478 0B9C3238 0B9C3238 +000017D0 20061215 CEL 7 0C13A3B8 0B9009A8 0B9008A8 -0B9009A8 20070131 ENT PL/I EBCDIC HFP 8 0C13A180 0BBDD990 0BBDD990 +000004DE 20061214 LIBRARY 9 0C13A0F0 0BB062E8 0BB062E8 +00000202 20061214 LIBRARY 10 0C13A030 0B991208 0B991208 +000001B6 20061215 CEL Condition Information for Active Routines Condition Information for _ON_Begin_7_Blk_2 (DSA address 0C13A3B8) CIB Address: 0C13AD98 Current Condition: CEE3201S The system detected an operation exception (System Completion Code=0C1). Location: Program Unit: _ON_Begin_7_Blk_2 Entry: EXAMPLE1 Statement: Offset: -0B9009A8 Possible Bad Branch: Statement: 12 Offset: +000001AE Machine State: ILC..... 0002 Interruption Code..... 0001 PSW..... 078D0600 80000002 GPR0..... 00000000_0C13A3B8 GPR1..... 00000000_0B9008A8 GPR2..... 00000000_0B911768 GPR3..... 00000000_0B9009E2 GPR4..... 00000000_0C13A0D8 GPR5..... 00000000_00000000 GPR6..... 00000000_0B900DA0 GPR7..... 00000000_00000000 GPR8..... 00000000_0B911648 GPR9..... 00000000_00000008 GPR10.... 00000000_0C13A0B0 GPR11.... 00000000_0B900F1C GPR12.... 00000000_0B9129B0 GPR13.... 00000000_0C13A3B8 GPR14.... 00000000_8B900A58 GPR15.... 00000000_00000000 FPC...... F0000000 FPR0..... 26100000 00000000 FPR1..... 00000000 00000000 FPR2..... 18000000 00000000 FPR3..... 00000000 00000000 FPR4..... 00000000 00000000 FPR5..... 00000000 00000000 FPR6..... 00000000 00000000 FPR7..... 00000000 00000000 FPR8..... 00000000 00000000 FPR9..... 00000000 00000000 FPR10.... 00000000 00000000 FPR11.... 00000000 00000000 FPR12.... 00000000 00000000 FPR13.... 00000000 00000000 FPR14.... 00000000 00000000 FPR15.... 00000000 00000000 Storage dump near condition, beginning at location: 00000000 +000000 00000000 Inaccessible storage. GPREG STORAGE: Storage around GPR0 (0C13A3B8) -0020 0C13A398 00000000 00000000 00000000 00000000 00000000 00000000 0C13A124 0C13A128 |................................| +0000 0C13A3B8 1013A12C 0C13A180 0C13A138 8B900A30 8BBA4490 0B000000 0C13A3B8 0B911768 |..........................t..j..| +0020 0C13A3D8 0B9009E2 0C13A0D8 00000000 0B900DA0 00000000 0B911648 00000000 00000000 |...S...Q.............j..........| Storage around GPR1 (0B9008A8) -0020 0B900888 36000301 0FCC0000 00240008 C5E7C1D4 D7D3C5F1 0B900DA0 0000016C 00000000 |............EXAMPLE1.......%....| +0000 0B9008A8 47F0F022 01C3C5C5 000000E0 00000330 47F0F001 58F0C31C 184E05EF 00000000 |.00..CEE.........00..0C..+......| +0020 0B9008C8 07F390E7 D00C58E0 D04C4100 E0E05500 C3144130 F03A4720 F01458F0 C28090F0 |.3.X.....<......C...0...0..0B..0| Storage around GPR2 (0B911768) -0020 0B911748 00000000 00000000 0B9095A8 0B909500 0B909450 00000000 00000106 00000000 |..........ny..n...m&............| +0000 0B911768 8B910E58 00000000 00000000 0B901410 00000000 8B9094C8 00030000 0003000B |.j....................mH........| +0020 0B911788 00000000 00000000 00000000 00000000 00000000 00000000 00000000 00000000 |................................|
To understand the traceback and debug this example routine, use the following steps:
1. Find the Current Condition message in the Condition Information for Active Routines section of thedump. The message is CEE3201S The system detected an Operation exception. For moreinformation about this message, see z/OS Language Environment Runtime Messages.
This section of the dump also provides such information as the name of the active routine and thecurrent statement number at the time of the dump. The Location section indicates that the exceptionoccurred at offset X'-0B9009A8' within entry EXAMPLE1 and that there may have been a bad branchfrom offset X'+000001AE' statement 12 within entry EXAMPLE1 .
2. Locate statement 12 in the routine (Figure 147 on page 306). This statement calls subroutine Prog01.The message CEE3201S, which indicates an operations exception, was generated because of anunresolved external reference.
3. Check the linkage editor output for error messages.
Divide-by-zero errorFigure 148 on page 308 demonstrates a divide-by-zero error. In this example, the main Enterprise PL/Iroutine passed bad data to an Enterprise PL/I subroutine. The bad data in this example is 0, and the erroroccurred when the subroutine SUB1 attempted to use this data as a divisor.
Chapter 8. Debugging Enterprise PL/I routines 307
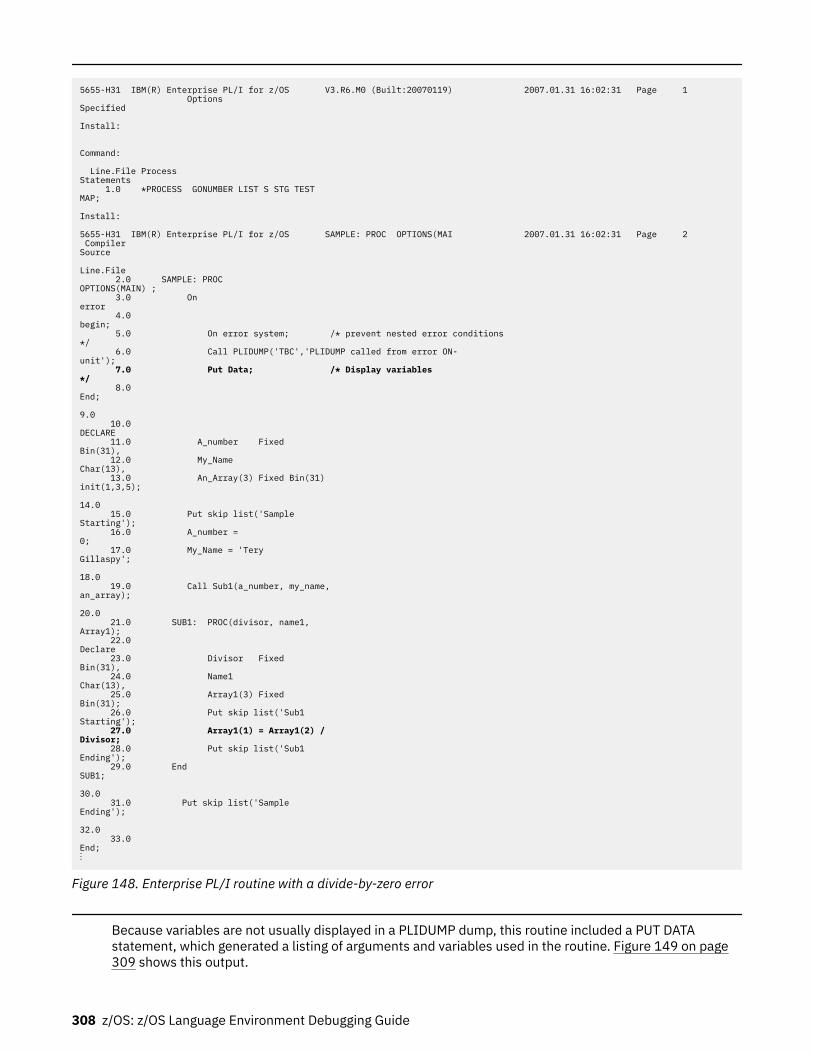
5655-H31 IBM(R) Enterprise PL/I for z/OS V3.R6.M0 (Built:20070119) 2007.01.31 16:02:31 Page 1 Options Specified Install: Command: Line.File Process Statements 1.0 *PROCESS GONUMBER LIST S STG TEST MAP; Install: 5655-H31 IBM(R) Enterprise PL/I for z/OS SAMPLE: PROC OPTIONS(MAI 2007.01.31 16:02:31 Page 2 Compiler Source Line.File 2.0 SAMPLE: PROC OPTIONS(MAIN) ; 3.0 On error 4.0 begin; 5.0 On error system; /* prevent nested error conditions */ 6.0 Call PLIDUMP('TBC','PLIDUMP called from error ON-unit'); 7.0 Put Data; /* Display variables */ 8.0 End; 9.0 10.0 DECLARE 11.0 A_number Fixed Bin(31), 12.0 My_Name Char(13), 13.0 An_Array(3) Fixed Bin(31) init(1,3,5); 14.0 15.0 Put skip list('Sample Starting'); 16.0 A_number = 0; 17.0 My_Name = 'Tery Gillaspy'; 18.0 19.0 Call Sub1(a_number, my_name, an_array); 20.0 21.0 SUB1: PROC(divisor, name1, Array1); 22.0 Declare 23.0 Divisor Fixed Bin(31), 24.0 Name1 Char(13), 25.0 Array1(3) Fixed Bin(31); 26.0 Put skip list('Sub1 Starting'); 27.0 Array1(1) = Array1(2) / Divisor; 28.0 Put skip list('Sub1 Ending'); 29.0 End SUB1; 30.0 31.0 Put skip list('Sample Ending'); 32.0 33.0 End; ⋮
Figure 148. Enterprise PL/I routine with a divide-by-zero error
Because variables are not usually displayed in a PLIDUMP dump, this routine included a PUT DATAstatement, which generated a listing of arguments and variables used in the routine. Figure 149 on page309 shows this output.
308 z/OS: z/OS Language Environment Debugging Guide
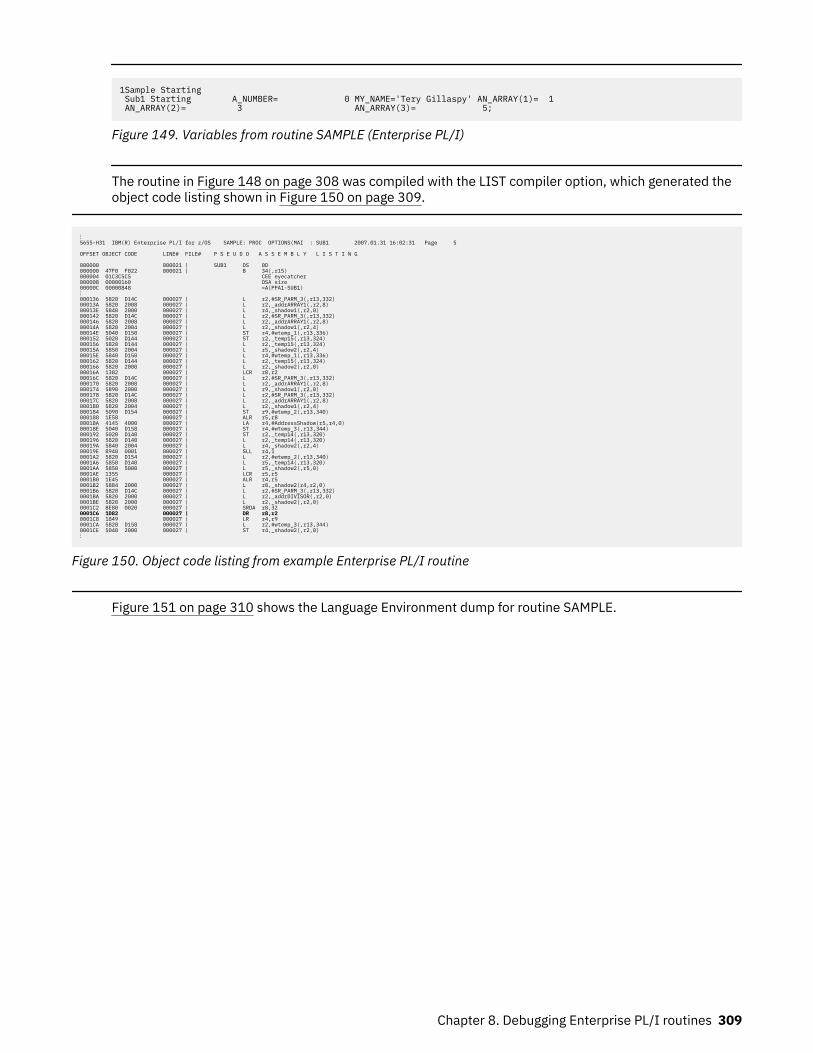
1Sample Starting Sub1 Starting A_NUMBER= 0 MY_NAME='Tery Gillaspy' AN_ARRAY(1)= 1 AN_ARRAY(2)= 3 AN_ARRAY(3)= 5;
Figure 149. Variables from routine SAMPLE (Enterprise PL/I)
The routine in Figure 148 on page 308 was compiled with the LIST compiler option, which generated theobject code listing shown in Figure 150 on page 309.
⋮ 5655-H31 IBM(R) Enterprise PL/I for z/OS SAMPLE: PROC OPTIONS(MAI : SUB1 2007.01.31 16:02:31 Page 5 OFFSET OBJECT CODE LINE# FILE# P S E U D O A S S E M B L Y L I S T I N G 000000 000021 | SUB1 DS 0D 000000 47F0 F022 000021 | B 34(,r15) 000004 01C3C5C5 CEE eyecatcher 000008 00000160 DSA size 00000C 00000848 =A(PPA1-SUB1) ⋮ 000136 5820 D14C 000027 | L r2,#SR_PARM_3(,r13,332) 00013A 5820 2008 000027 | L r2,_addrARRAY1(,r2,8) 00013E 5840 2000 000027 | L r4,_shadow1(,r2,0) 000142 5820 D14C 000027 | L r2,#SR_PARM_3(,r13,332) 000146 5820 2008 000027 | L r2,_addrARRAY1(,r2,8) 00014A 5820 2004 000027 | L r2,_shadow1(,r2,4) 00014E 5040 D150 000027 | ST r4,#wtemp_1(,r13,336) 000152 5020 D144 000027 | ST r2,_temp15(,r13,324) 000156 5820 D144 000027 | L r2,_temp15(,r13,324) 00015A 5850 2004 000027 | L r5,_shadow2(,r2,4) 00015E 5840 D150 000027 | L r4,#wtemp_1(,r13,336) 000162 5820 D144 000027 | L r2,_temp15(,r13,324) 000166 5820 2000 000027 | L r2,_shadow2(,r2,0) 00016A 1382 000027 | LCR r8,r2 00016C 5820 D14C 000027 | L r2,#SR_PARM_3(,r13,332) 000170 5820 2008 000027 | L r2,_addrARRAY1(,r2,8) 000174 5890 2000 000027 | L r9,_shadow1(,r2,0) 000178 5820 D14C 000027 | L r2,#SR_PARM_3(,r13,332) 00017C 5820 2008 000027 | L r2,_addrARRAY1(,r2,8) 000180 5820 2004 000027 | L r2,_shadow1(,r2,4) 000184 5090 D154 000027 | ST r9,#wtemp_2(,r13,340) 000188 1E58 000027 | ALR r5,r8 00018A 4145 4000 000027 | LA r4,#AddressShadow(r5,r4,0) 00018E 5040 D158 000027 | ST r4,#wtemp_3(,r13,344) 000192 5020 D140 000027 | ST r2,_temp14(,r13,320) 000196 5820 D140 000027 | L r2,_temp14(,r13,320) 00019A 5840 2004 000027 | L r4,_shadow2(,r2,4) 00019E 8940 0001 000027 | SLL r4,1 0001A2 5820 D154 000027 | L r2,#wtemp_2(,r13,340) 0001A6 5850 D140 000027 | L r5,_temp14(,r13,320) 0001AA 5850 5000 000027 | L r5,_shadow2(,r5,0) 0001AE 1355 000027 | LCR r5,r5 0001B0 1E45 000027 | ALR r4,r5 0001B2 5884 2000 000027 | L r8,_shadow2(r4,r2,0) 0001B6 5820 D14C 000027 | L r2,#SR_PARM_3(,r13,332) 0001BA 5820 2000 000027 | L r2,_addrDIVISOR(,r2,0) 0001BE 5820 2000 000027 | L r2,_shadow2(,r2,0) 0001C2 8E80 0020 000027 | SRDA r8,32 0001C6 1D82 000027 | DR r8,r2 0001C8 1849 000027 | LR r4,r9 0001CA 5820 D158 000027 | L r2,#wtemp_3(,r13,344) 0001CE 5040 2000 000027 | ST r4,_shadow2(,r2,0) ⋮
Figure 150. Object code listing from example Enterprise PL/I routine
Figure 151 on page 310 shows the Language Environment dump for routine SAMPLE.
Chapter 8. Debugging Enterprise PL/I routines 309
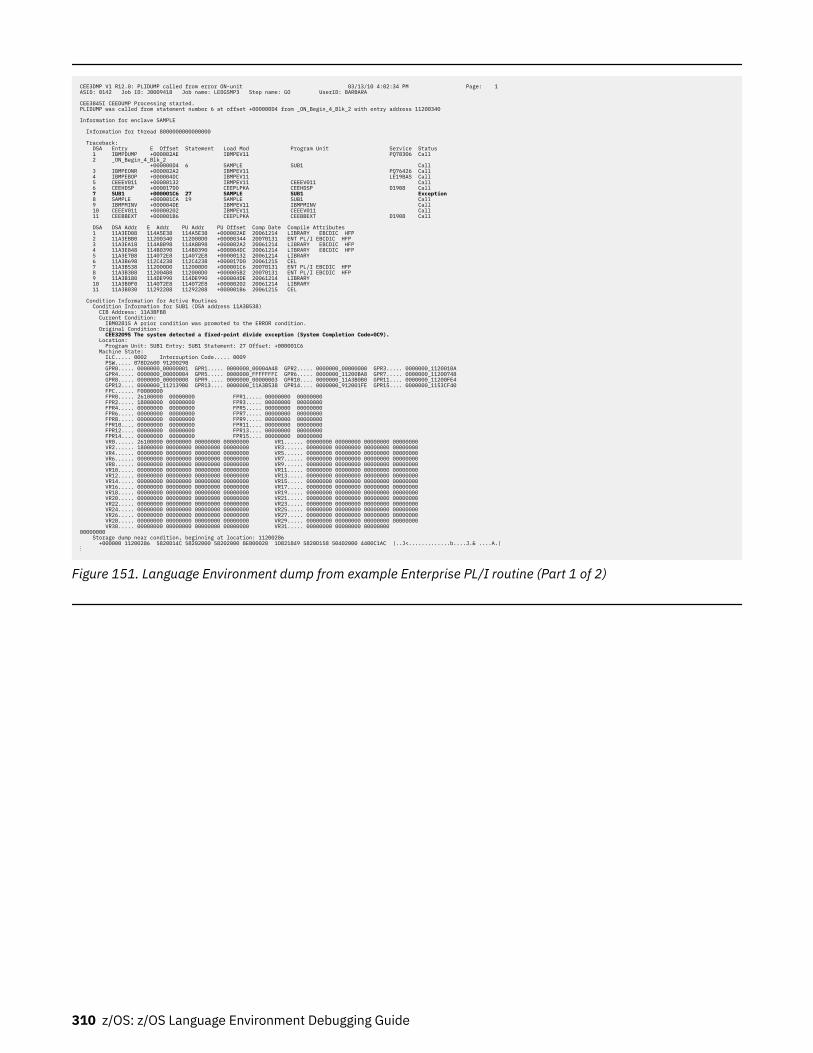
CEE3DMP V1 R12.0: PLIDUMP called from error ON-unit 03/13/10 4:02:34 PM Page: 1 ASID: 0142 Job ID: J0009418 Job name: LEDGSMP3 Step name: GO UserID: BARBARA CEE3845I CEEDUMP Processing started. PLIDUMP was called from statement number 6 at offset +000000D4 from _ON_Begin_4_Blk_2 with entry address 11200340 Information for enclave SAMPLE Information for thread 8000000000000000 Traceback: DSA Entry E Offset Statement Load Mod Program Unit Service Status 1 IBMPDUMP +000002AE IBMPEV11 PQ78306 Call 2 _ON_Begin_4_Blk_2 +000000D4 6 SAMPLE SUB1 Call 3 IBMPEONR +000002A2 IBMPEV11 PQ76426 Call 4 IBMPEBOP +000004DC IBMPEV11 LE19BAS Call 5 CEEEV011 +00000132 IBMPEV11 CEEEV011 Call 6 CEEHDSP +000017D0 CEEPLPKA CEEHDSP D1908 Call 7 SUB1 +000001C6 27 SAMPLE SUB1 Exception 8 SAMPLE +000001CA 19 SAMPLE SUB1 Call 9 IBMPMINV +000004DE IBMPEV11 IBMPMINV Call 10 CEEEV011 +00000202 IBMPEV11 CEEEV011 Call 11 CEEBBEXT +000001B6 CEEPLPKA CEEBBEXT D1908 Call DSA DSA Addr E Addr PU Addr PU Offset Comp Date Compile Attributes 1 11A3ED08 114A5E38 114A5E38 +000002AE 20061214 LIBRARY EBCDIC HFP 2 11A3EBB0 11200340 112000D0 +00000344 20070131 ENT PL/I EBCDIC HFP 3 11A3EA18 114A8B98 114A8B98 +000002A2 20061214 LIBRARY EBCDIC HFP 4 11A3E848 114B0390 114B0390 +000004DC 20061214 LIBRARY EBCDIC HFP 5 11A3E7B8 114072E8 114072E8 +00000132 20061214 LIBRARY 6 11A3B698 112C4238 112C4238 +000017D0 20061215 CEL 7 11A3B538 112000D0 112000D0 +000001C6 20070131 ENT PL/I EBCDIC HFP 8 11A3B3B8 112004B8 112000D0 +000005B2 20070131 ENT PL/I EBCDIC HFP 9 11A3B180 114DE990 114DE990 +000004DE 20061214 LIBRARY 10 11A3B0F0 114072E8 114072E8 +00000202 20061214 LIBRARY 11 11A3B030 11292208 11292208 +000001B6 20061215 CEL Condition Information for Active Routines Condition Information for SUB1 (DSA address 11A3B538) CIB Address: 11A3BFB8 Current Condition: IBM0281S A prior condition was promoted to the ERROR condition. Original Condition: CEE3209S The system detected a fixed-point divide exception (System Completion Code=0C9). Location: Program Unit: SUB1 Entry: SUB1 Statement: 27 Offset: +000001C6 Machine State: ILC..... 0002 Interruption Code..... 0009 PSW..... 078D2600 91200298 GPR0..... 0000000_00000001 GPR1..... 0000000_00004A48 GPR2..... 0000000_00000000 GPR3..... 0000000_1120010A GPR4..... 0000000_00000004 GPR5..... 0000000_FFFFFFFC GPR6..... 0000000_11200BA8 GPR7..... 0000000_11200748 GPR8..... 0000000_00000000 GPR9..... 0000000_00000003 GPR10.... 0000000_11A3B0B0 GPR11.... 0000000_11200FE4 GPR12.... 0000000_112139B0 GPR13.... 0000000_11A3B538 GPR14.... 0000000_912001FE GPR15.... 0000000_1153CF40 FPC...... F0000000 FPR0..... 26100000 00000000 FPR1..... 00000000 00000000 FPR2..... 18000000 00000000 FPR3..... 00000000 00000000 FPR4..... 00000000 00000000 FPR5..... 00000000 00000000 FPR6..... 00000000 00000000 FPR7..... 00000000 00000000 FPR8..... 00000000 00000000 FPR9..... 00000000 00000000 FPR10.... 00000000 00000000 FPR11.... 00000000 00000000 FPR12.... 00000000 00000000 FPR13.... 00000000 00000000 FPR14.... 00000000 00000000 FPR15.... 00000000 00000000 VR0...... 26100000 00000000 00000000 00000000 VR1...... 00000000 00000000 00000000 00000000 VR2...... 18000000 00000000 00000000 00000000 VR3...... 00000000 00000000 00000000 00000000 VR4...... 00000000 00000000 00000000 00000000 VR5...... 00000000 00000000 00000000 00000000 VR6...... 00000000 00000000 00000000 00000000 VR7...... 00000000 00000000 00000000 00000000 VR8...... 00000000 00000000 00000000 00000000 VR9...... 00000000 00000000 00000000 00000000 VR10..... 00000000 00000000 00000000 00000000 VR11..... 00000000 00000000 00000000 00000000 VR12..... 00000000 00000000 00000000 00000000 VR13..... 00000000 00000000 00000000 00000000 VR14..... 00000000 00000000 00000000 00000000 VR15..... 00000000 00000000 00000000 00000000 VR16..... 00000000 00000000 00000000 00000000 VR17..... 00000000 00000000 00000000 00000000 VR18..... 00000000 00000000 00000000 00000000 VR19..... 00000000 00000000 00000000 00000000 VR20..... 00000000 00000000 00000000 00000000 VR21..... 00000000 00000000 00000000 00000000 VR22..... 00000000 00000000 00000000 00000000 VR23..... 00000000 00000000 00000000 00000000 VR24..... 00000000 00000000 00000000 00000000 VR25..... 00000000 00000000 00000000 00000000 VR26..... 00000000 00000000 00000000 00000000 VR27..... 00000000 00000000 00000000 00000000 VR28..... 00000000 00000000 00000000 00000000 VR29..... 00000000 00000000 00000000 00000000 VR30..... 00000000 00000000 00000000 00000000 VR31..... 00000000 00000000 00000000 00000000 Storage dump near condition, beginning at location: 11200286 +000000 11200286 5820D14C 58202000 58202000 8E800020 1D821849 5820D158 50402000 4400C1AC |..J<.............b....J.& ....A.|⋮
Figure 151. Language Environment dump from example Enterprise PL/I routine (Part 1 of 2)
310 z/OS: z/OS Language Environment Debugging Guide
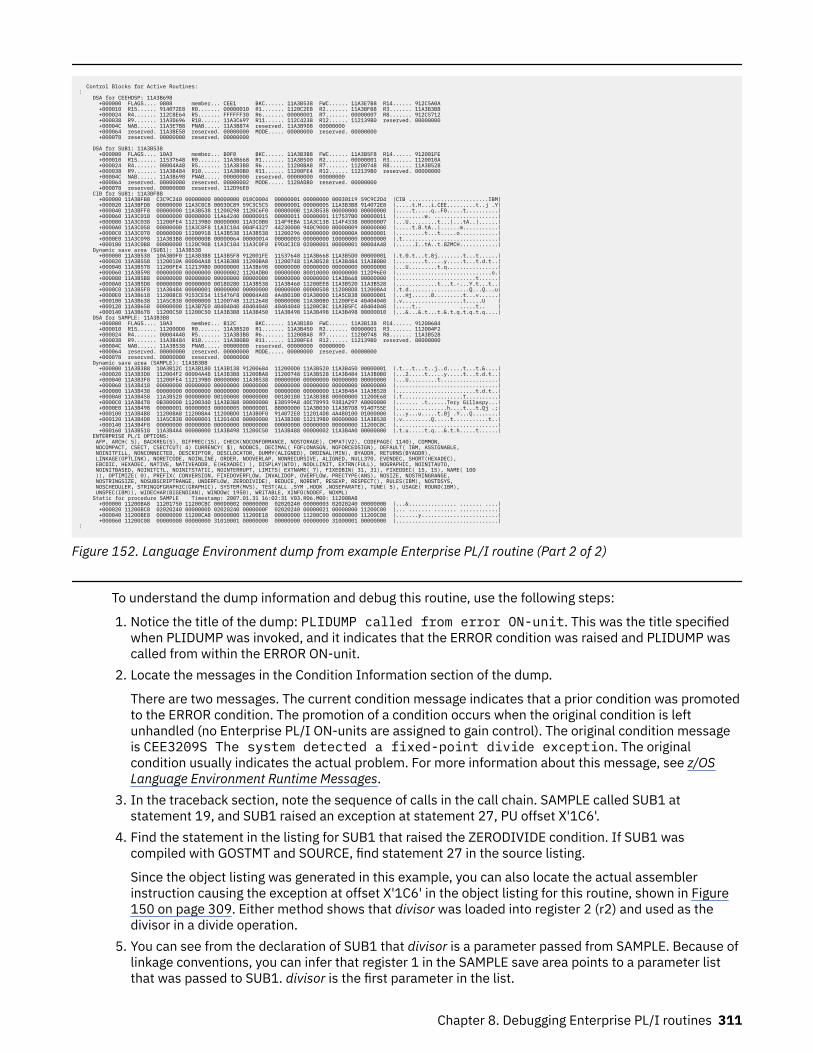
Control Blocks for Active Routines: ⋮ DSA for CEEHDSP: 11A3B698 +000000 FLAGS.... 0808 member... CEE1 BKC...... 11A3B538 FWC...... 11A3E7B8 R14...... 912C5A0A +000010 R15...... 914072E8 R0....... 00000010 R1....... 1120C2E8 R2....... 11A3BFB8 R3....... 11A3B3B8 +000024 R4....... 112C8E64 R5....... FFFFFF30 R6....... 00000001 R7....... 00000007 R8....... 912C5712 +000038 R9....... 11A3D696 R10...... 11A3C697 R11...... 112C4238 R12...... 112139B0 reserved. 00000000 +00004C NAB...... 11A3E7B8 PNAB..... 11A3B874 reserved. 11A3B9D8 00000000 +000064 reserved. 11A3BE58 reserved. 00000000 MODE..... 00000000 reserved. 00000000 +000078 reserved. 00000000 reserved. 00000000
DSA for SUB1: 11A3B538 +000000 FLAGS.... 10A3 member... B0F0 BKC...... 11A3B3B8 FWC...... 11A3B5F8 R14...... 912001FE +000010 R15...... 11537648 R0....... 11A3B668 R1....... 11A3B5D0 R2....... 00000001 R3....... 1120010A +000024 R4....... 00004A48 R5....... 11A3B3B8 R6....... 11200BA8 R7....... 11200748 R8....... 11A3B528 +000038 R9....... 11A3B484 R10...... 11A3B0B0 R11...... 11200FE4 R12...... 112139B0 reserved. 00000000 +00004C NAB...... 11A3B698 PNAB..... 00000000 reserved. 00000000 00000000 +000064 reserved. 00000000 reserved. 00000002 MODE..... 1120ADB0 reserved. 00000000 +000078 reserved. 00000000 reserved. 112D96E0 CIB for SUB1: 11A3BFB8 +000000 11A3BFB8 C3C9C240 00000000 00000000 010C0004 00000001 00000000 00030119 59C9C2D4 |CIB .........................IBM| +000020 11A3BFD8 00000000 11A3C0C8 00030C89 59C3C5C5 00000001 00000005 11A3B3B8 914072E8 |.....t.H...i.CEE.........t..j .Y| +000040 11A3BFF8 00000000 11A3B538 11200298 1120C6F0 0000000B 11A3B538 00000000 00000000 |.....t.....q..F0.....t..........| +000060 11A3C018 00000000 00000000 11A64240 00000015 00000011 00000001 117537B0 00000011 |.........w. ....................| +000080 11A3C038 11200FE4 112139B0 00000000 11A3C0B0 114F9EBA 11A3C138 114F4338 00000007 |...U.........t...|...tA..|......| +0000A0 11A3C058 00000000 11A3C0F8 11A3C104 004F4327 44230000 940C9000 00000009 00000000 |.....t.8.tA..|......m...........| +0000C0 11A3C078 00000000 11200918 11A3B538 11A3B538 11200296 00000000 0000000A 00000001 |.........t...t.....o............| +0000E0 11A3C098 11A3B3B8 0000000B 00000064 00000014 00000003 00000000 10000000 00000000 |.t..............................| +000100 11A3C0B8 00000000 1120C908 11A3C104 11A3C0F8 E9D4C3C8 02000001 00000001 00004A48 |......I..tA..t.8ZMCH............| Dynamic save area (SUB1): 11A3B538 +000000 11A3B538 10A3B0F0 11A3B3B8 11A3B5F8 912001FE 11537648 11A3B668 11A3B5D0 00000001 |.t.0.t...t.8j........t...t......| +000020 11A3B558 1120010A 00004A48 11A3B3B8 11200BA8 11200748 11A3B528 11A3B484 11A3B0B0 |.........t.....y.....t...t.d.t..| +000040 11A3B578 11200FE4 112139B0 00000000 11A3B698 00000000 00000000 00000000 00000000 |...U.........t.q................| +000060 11A3B598 00000000 00000000 00000002 1120ADB0 00000000 80010000 00000000 112D96E0 |..............................o.| +000080 11A3B5B8 00000000 00000000 00000000 00000000 00000000 00000000 11A3B668 00000000 |.........................t......| +0000A0 11A3B5D8 00000000 00000000 00180280 11A3B538 11A3B460 11200EE8 11A3B520 11A3B528 |.............t...t.-...Y.t...t..| +0000C0 11A3B5F8 11A3B484 00000001 00000000 00000000 00000000 000005D8 112008D8 112008A4 |.t.d...................Q...Q...u| +0000E0 11A3B618 11200BC8 9153CE54 115476F8 00004A48 4A480100 01A30000 11A5CB38 00000001 |...Hj......8.........t...v......| +000100 11A3B638 11A5CB38 00000000 11200748 11212648 00000008 11A3B0B0 11200FE4 40404040 |.v...................t.....U | +000120 11A3B658 00000000 11A3B7E0 40404040 40404040 40404040 11200CBC 11A3B5FC 40404040 |.....t.. .....t.. | +000140 11A3B678 11200C50 11200C50 11A3B3B8 11A3B450 11A3B498 11A3B498 11A3B498 00000010 |...&...&.t...t.&.t.q.t.q.t.q....| DSA for SAMPLE: 11A3B3B8 +000000 FLAGS.... 10A3 member... B12C BKC...... 11A3B180 FWC...... 11A3B138 R14...... 91200684 +000010 R15...... 112000D0 R0....... 11A3B520 R1....... 11A3B450 R2....... 00000001 R3....... 112004F2 +000024 R4....... 00004A48 R5....... 11A3B3B8 R6....... 11200BA8 R7....... 11200748 R8....... 11A3B528 +000038 R9....... 11A3B484 R10...... 11A3B0B0 R11...... 11200FE4 R12...... 112139B0 reserved. 00000000 +00004C NAB...... 11A3B538 PNAB..... 00000000 reserved. 00000000 00000000 +000064 reserved. 00000000 reserved. 00000000 MODE..... 00000000 reserved. 00000000 +000078 reserved. 00000000 reserved. 00000000 Dynamic save area (SAMPLE): 11A3B3B8 +000000 11A3B3B8 10A3B12C 11A3B180 11A3B138 91200684 112000D0 11A3B520 11A3B450 00000001 |.t...t...t..j..d.....t...t.&....| +000020 11A3B3D8 112004F2 00004A48 11A3B3B8 11200BA8 11200748 11A3B528 11A3B484 11A3B0B0 |...2.....t.....y.....t...t.d.t..| +000040 11A3B3F8 11200FE4 112139B0 00000000 11A3B538 00000000 00000000 00000000 00000000 |...U.........t..................| +000060 11A3B418 00000000 00000000 00000000 00000000 00000000 00000000 00000000 00000000 |................................| +000080 11A3B438 00000000 00000000 00000000 00000000 00000000 00000000 11A3B484 11A3B528 |.........................t.d.t..| +0000A0 11A3B458 11A3B520 00000000 00100000 00000000 00180180 11A3B3B8 00000000 11200E68 |.t...................t..........| +0000C0 11A3B478 0B300000 11200340 11A3B3B8 00000000 E38599A8 40C78993 9381A297 A8000000 |....... .t......Tery Gillaspy...| +0000E0 11A3B498 00000001 00000003 00000005 00000001 88000000 11A3B030 11A3B7D8 9140755E |................h....t...t.Qj .;| +000100 11A3B4B8 112008A8 112008A4 11200BD0 11A3B0F0 914072E8 112014D8 4A480100 01000000 |...y...u.....t.0j .Y...Q........| +000120 11A3B4D8 11A5CB38 00000001 112014D8 00000000 11A3B308 112139B0 00000000 11A3B538 |.v.........Q.....t...........t..| +000140 11A3B4F8 00000000 00000000 00000000 00000000 00000000 00000000 00000000 11200CBC |................................| +000160 11A3B518 11A3B4A4 00000000 11A3B498 11200C50 11A3B488 000D0002 11A3B4A0 00000000 |.t.u.....t.q...&.t.h.....t......| ENTERPRISE PL/I OPTIONS: AFP, ARCH( 5), BACKREG(5), BIFPREC(15), CHECK(NOCONFORMANCE, NOSTORAGE), CMPAT(V2), CODEPAGE( 1140), COMMON, NOCOMPACT, CSECT, CSECTCUT( 4) CURRENCY( $), NODBCS, DECIMAL( FOFLONASGN, NOFORCEDSIGN), DEFAULT( IBM, ASSIGNABLE, NOINITFILL, NONCONNECTED, DESCRIPTOR, DESCLOCATOR, DUMMY(ALIGNED), ORDINAL(MIN), BYADDR, RETURNS(BYADDR), LINKAGE(OPTLINK), NORETCODE, NOINLINE, ORDER, NOOVERLAP, NONRECURSIVE, ALIGNED, NULL370, EVENDEC, SHORT(HEXADEC), EBCDIC, HEXADEC, NATIVE, NATIVEADDR, E(HEXADEC) ), DISPLAY(WTO), NODLLINIT, EXTRN(FULL), NOGRAPHIC, NOINITAUTO, NOINITBASED, NOINITCTL, NOINITSTATIC, NOINTERRUPT, LIMITS( EXTNAME( 7), FIXEDBIN( 31, 31), FIXEDDEC( 15, 15), NAME( 100 )), OPTIMIZE( 0), PREFIX( CONVERSION, FIXEDOVERFLOW, INVALIDOP, OVERFLOW, PRECTYPE(ANS), NOSIZE, NOSTRINGRANGE, NOSTRINGSIZE, NOSUBSCRIPTRANGE, UNDERFLOW, ZERODIVIDE), REDUCE, NORENT, RESEXP, RESPECT(), RULES(IBM), NOSTDSYS, NOSCHEDULER, STRINGOFGRAPHIC(GRAPHIC), SYSTEM(MVS), TEST(ALL ,SYM ,HOOK ,NOSEPARATE), TUNE( 5), USAGE( ROUND(IBM), UNSPEC(IBM)), WIDECHAR(BIGENDIAN), WINDOW( 1950), WRITABLE, XINFO(NODEF, NOXML) Static for procedure SAMPLE Timestamp: 2007.01.31 16:02:31 V03.R06.M00: 11200BA8 +000000 11200BA8 11201750 11200CBC 000D0002 00000000 02020240 00000003 02020240 0000000B |...&............... ....... ....| +000020 11200BC8 02020240 0000000D 02020240 0000000F 02020240 00000021 00000000 11200C00 |... ....... ....... ............| +000040 11200BE8 00000000 11200CA8 00000000 11200E18 00000000 11200C00 00000000 11200C08 |.......y........................| +000060 11200C08 00000000 00000000 31010001 00000000 00000000 00000000 31000001 00000000 |................................|⋮
Figure 152. Language Environment dump from example Enterprise PL/I routine (Part 2 of 2)
To understand the dump information and debug this routine, use the following steps:
1. Notice the title of the dump: PLIDUMP called from error ON-unit. This was the title specifiedwhen PLIDUMP was invoked, and it indicates that the ERROR condition was raised and PLIDUMP wascalled from within the ERROR ON-unit.
2. Locate the messages in the Condition Information section of the dump.
There are two messages. The current condition message indicates that a prior condition was promotedto the ERROR condition. The promotion of a condition occurs when the original condition is leftunhandled (no Enterprise PL/I ON-units are assigned to gain control). The original condition messageis CEE3209S The system detected a fixed-point divide exception. The originalcondition usually indicates the actual problem. For more information about this message, see z/OSLanguage Environment Runtime Messages.
3. In the traceback section, note the sequence of calls in the call chain. SAMPLE called SUB1 atstatement 19, and SUB1 raised an exception at statement 27, PU offset X'1C6'.
4. Find the statement in the listing for SUB1 that raised the ZERODIVIDE condition. If SUB1 wascompiled with GOSTMT and SOURCE, find statement 27 in the source listing.
Since the object listing was generated in this example, you can also locate the actual assemblerinstruction causing the exception at offset X'1C6' in the object listing for this routine, shown in Figure150 on page 309. Either method shows that divisor was loaded into register 2 (r2) and used as thedivisor in a divide operation.
5. You can see from the declaration of SUB1 that divisor is a parameter passed from SAMPLE. Because oflinkage conventions, you can infer that register 1 in the SAMPLE save area points to a parameter listthat was passed to SUB1. divisor is the first parameter in the list.
Chapter 8. Debugging Enterprise PL/I routines 311
6. In the SAMPLE DSA, the R1 value is X'11A3B450'. This is the address of the parameter list, which islocated in static storage.
7. Find the parameter list in the stack frame; the address of the first parameter is X'11A3B484' and thevalue of the first parameter is X'00000000'. Thus, the exception occurred when SAMPLE passed a 0value used as a divisor in subroutine SUB1.
312 z/OS: z/OS Language Environment Debugging Guide
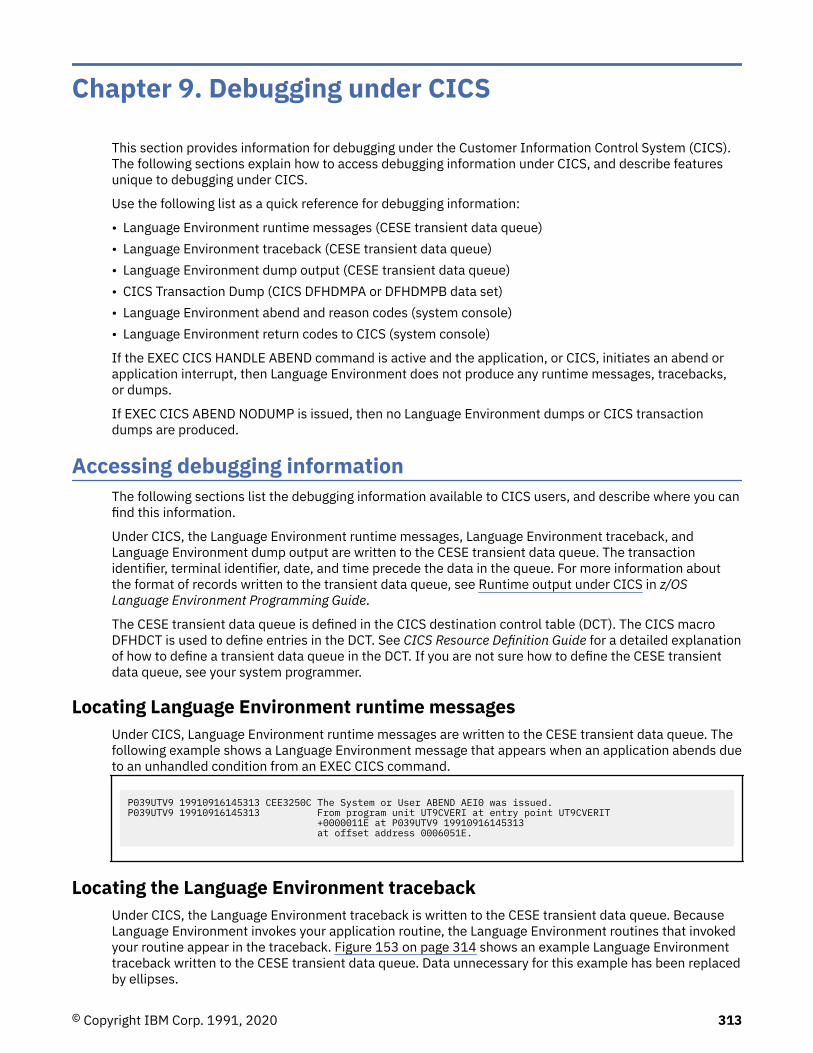
Chapter 9. Debugging under CICS
This section provides information for debugging under the Customer Information Control System (CICS).The following sections explain how to access debugging information under CICS, and describe featuresunique to debugging under CICS.
Use the following list as a quick reference for debugging information:
• Language Environment runtime messages (CESE transient data queue)• Language Environment traceback (CESE transient data queue)• Language Environment dump output (CESE transient data queue)• CICS Transaction Dump (CICS DFHDMPA or DFHDMPB data set)• Language Environment abend and reason codes (system console)• Language Environment return codes to CICS (system console)
If the EXEC CICS HANDLE ABEND command is active and the application, or CICS, initiates an abend orapplication interrupt, then Language Environment does not produce any runtime messages, tracebacks,or dumps.
If EXEC CICS ABEND NODUMP is issued, then no Language Environment dumps or CICS transactiondumps are produced.
Accessing debugging informationThe following sections list the debugging information available to CICS users, and describe where you canfind this information.
Under CICS, the Language Environment runtime messages, Language Environment traceback, andLanguage Environment dump output are written to the CESE transient data queue. The transactionidentifier, terminal identifier, date, and time precede the data in the queue. For more information aboutthe format of records written to the transient data queue, see Runtime output under CICS in z/OSLanguage Environment Programming Guide.
The CESE transient data queue is defined in the CICS destination control table (DCT). The CICS macroDFHDCT is used to define entries in the DCT. See CICS Resource Definition Guide for a detailed explanationof how to define a transient data queue in the DCT. If you are not sure how to define the CESE transientdata queue, see your system programmer.
Locating Language Environment runtime messagesUnder CICS, Language Environment runtime messages are written to the CESE transient data queue. Thefollowing example shows a Language Environment message that appears when an application abends dueto an unhandled condition from an EXEC CICS command.
P039UTV9 19910916145313 CEE3250C The System or User ABEND AEI0 was issued.P039UTV9 19910916145313 From program unit UT9CVERI at entry point UT9CVERIT +0000011E at P039UTV9 19910916145313 at offset address 0006051E.
Locating the Language Environment tracebackUnder CICS, the Language Environment traceback is written to the CESE transient data queue. BecauseLanguage Environment invokes your application routine, the Language Environment routines that invokedyour routine appear in the traceback. Figure 153 on page 314 shows an example Language Environmenttraceback written to the CESE transient data queue. Data unnecessary for this example has been replacedby ellipses.
© Copyright IBM Corp. 1991, 2020 313
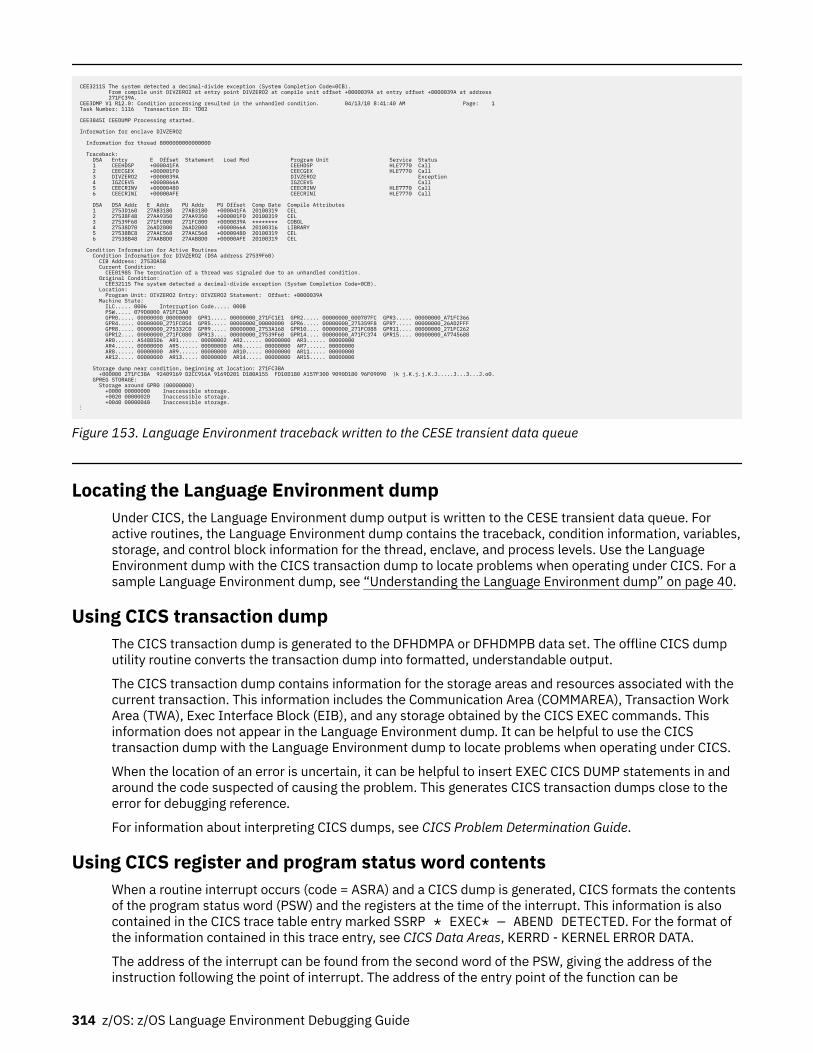
CEE3211S The system detected a decimal-divide exception (System Completion Code=0CB). From compile unit DIVZERO2 at entry point DIVZERO2 at compile unit offset +0000039A at entry offset +0000039A at address 271FC39A. CEE3DMP V1 R12.0: Condition processing resulted in the unhandled condition. 04/13/10 8:41:40 AM Page: 1Task Number: 1116 Transaction ID: TD02 CEE3845I CEEDUMP Processing started. Information for enclave DIVZERO2 Information for thread 8000000000000000 Traceback: DSA Entry E Offset Statement Load Mod Program Unit Service Status 1 CEEHDSP +000041FA CEEHDSP HLE7770 Call 2 CEECGEX +000001F0 CEECGEX HLE7770 Call 3 DIVZERO2 +0000039A DIVZERO2 Exception 4 IGZCEV5 +0000066A IGZCEV5 Call 5 CEECRINV +00000480 CEECRINV HLE7770 Call 6 CEECRINI +00000AFE CEECRINI HLE7770 Call DSA DSA Addr E Addr PU Addr PU Offset Comp Date Compile Attributes 1 2753D160 27AB3180 27AB3180 +000041FA 20100319 CEL 2 27538F48 27AA9350 27AA9350 +000001F0 20100319 CEL 3 27539F60 271FC000 271FC000 +0000039A ******** COBOL 4 27538D70 26AD2000 26AD2000 +0000066A 20100316 LIBRARY 5 27538BC8 27AAC568 27AAC568 +00000480 20100319 CEL 6 27538B48 27AAB8D0 27AAB8D0 +00000AFE 20100319 CEL Condition Information for Active Routines Condition Information for DIVZERO2 (DSA address 27539F60) CIB Address: 2753DA58 Current Condition: CEE0198S The termination of a thread was signaled due to an unhandled condition. Original Condition: CEE3211S The system detected a decimal-divide exception (System Completion Code=0CB). Location: Program Unit: DIVZERO2 Entry: DIVZERO2 Statement: Offset: +0000039A Machine State: ILC..... 0006 Interruption Code..... 000B PSW..... 079D0000 A71FC3A0 GPR0..... 00000000_00000000 GPR1..... 00000000_271FC1E1 GPR2..... 00000000_000707FC GPR3..... 00000000_A71FC366 GPR4..... 00000000_271FC054 GPR5..... 00000000_00000000 GPR6..... 00000000_275359F8 GPR7..... 00000000_26AD2FFF GPR8..... 00000000_275332C0 GPR9..... 00000000_2753A168 GPR10.... 00000000_271FC088 GPR11.... 00000000_271FC262 GPR12.... 00000000_271FC080 GPR13.... 00000000_27539F60 GPR14.... 00000000_A71FC374 GPR15.... 00000000_A7745688 AR0...... A54885D6 AR1...... 00000002 AR2...... 00000000 AR3...... 00000000 AR4...... 00000000 AR5...... 00000000 AR6...... 00000000 AR7...... 00000000 AR8...... 00000000 AR9...... 00000000 AR10..... 00000000 AR11..... 00000000 AR12..... 00000000 AR13..... 00000000 AR14..... 00000000 AR15..... 00000000 Storage dump near condition, beginning at location: 271FC38A +000000 271FC38A 92409169 D2CC916A 9169D201 D180A155 FD10D180 A157F300 9090D180 96F09090 |k j.K.j.j.K.J.....J...3...J.o0. GPREG STORAGE: Storage around GPR0 (00000000) +0000 00000000 Inaccessible storage. +0020 00000020 Inaccessible storage. +0040 00000040 Inaccessible storage. ⋮
Figure 153. Language Environment traceback written to the CESE transient data queue
Locating the Language Environment dumpUnder CICS, the Language Environment dump output is written to the CESE transient data queue. Foractive routines, the Language Environment dump contains the traceback, condition information, variables,storage, and control block information for the thread, enclave, and process levels. Use the LanguageEnvironment dump with the CICS transaction dump to locate problems when operating under CICS. For asample Language Environment dump, see “Understanding the Language Environment dump” on page 40.
Using CICS transaction dumpThe CICS transaction dump is generated to the DFHDMPA or DFHDMPB data set. The offline CICS dumputility routine converts the transaction dump into formatted, understandable output.
The CICS transaction dump contains information for the storage areas and resources associated with thecurrent transaction. This information includes the Communication Area (COMMAREA), Transaction WorkArea (TWA), Exec Interface Block (EIB), and any storage obtained by the CICS EXEC commands. Thisinformation does not appear in the Language Environment dump. It can be helpful to use the CICStransaction dump with the Language Environment dump to locate problems when operating under CICS.
When the location of an error is uncertain, it can be helpful to insert EXEC CICS DUMP statements in andaround the code suspected of causing the problem. This generates CICS transaction dumps close to theerror for debugging reference.
For information about interpreting CICS dumps, see CICS Problem Determination Guide.
Using CICS register and program status word contentsWhen a routine interrupt occurs (code = ASRA) and a CICS dump is generated, CICS formats the contentsof the program status word (PSW) and the registers at the time of the interrupt. This information is alsocontained in the CICS trace table entry marked SSRP * EXEC* — ABEND DETECTED. For the format ofthe information contained in this trace entry, see CICS Data Areas, KERRD - KERNEL ERROR DATA.
The address of the interrupt can be found from the second word of the PSW, giving the address of theinstruction following the point of interrupt. The address of the entry point of the function can be
314 z/OS: z/OS Language Environment Debugging Guide
subtracted from this address. The offset compared to this listing gives the statement that causes theinterrupt.
For C routines, you can find the address of the entry point in register 3.
If register 15 is corrupted, the contents of the first load module of the active enclave appear in theprogram storage section of the CICS transaction dump.
Using Language Environment abend and reason codesAn application can end with an abend in two ways:
• User-specified abend (that is, an abend requested by the assembler user exit or the ABTERMENCruntime option).
• Language Environment-detected unrecoverable error (in which case there is no Language Environmentcondition handling).
When Language Environment detects an unrecoverable error under CICS, Language Environmentterminates the transaction with an EXEC CICS abend. The abend code has a number between 4000 and4095. A write-to-operator (WTO) is performed to write a CEE1000S message to the system console. Thismessage contains the abend code and its associated reason code. The WTO is performed only forunrecoverable errors detected by Language Environment. No WTO occurs for user-requested abends.
Although this type of abend is performed only for unrecoverable error conditions, an abend code of 4000–4095 does not necessarily indicate an internal error within Language Environment. For example, anapplication routine can write a variable outside its storage and corrupt the Language Environment controlblocks.
Possible causes of a 4000–4095 abend are corrupted Language Environment control blocks and internalLanguage Environment errors. For more information about abend codes 4000–4095, see LanguageEnvironment abend codes in z/OS Language Environment Runtime Messages. Following is a sampleLanguage Environment abend and reason code. Abend codes appear in decimal, and reason codes appearin hexadecimal.
12.34.27 JOB05585 IEF450I XCEPII03 GO CEPII03 - ABEND=S000 U4094 REASON=0000002C
Using Language Environment return codes to CICSWhen the Language Environment condition handler encounters a severe condition that is specific to CICS,the condition handler generates a CICS-specific return code. This return code is written to the systemconsole. Possible causes of a Language Environment return code to CICS are:
• Incorrect region size• Incorrect DCT• Incorrect CSD definitions
For a list of the return codes written only to CICS, see Return codes to CICS in z/OS Language EnvironmentRuntime Messages. The following example shows a sample of a return code that was returned to CICS.
+DFHAP1200ILE03CC01 A CICS request to Language Environment has failed. Reasoncode '0012030'.
Activating Language Environment feature trace records under CICSActivating Language Environment feature trace records under CICS will allow users to monitor anddetermine the activity of a transaction. By activating the feature trace records, Level 2 trace points areadded insideLanguage Environment at these significant points:
• Event Handle• Set anchor
Chapter 9. Debugging under CICS 315
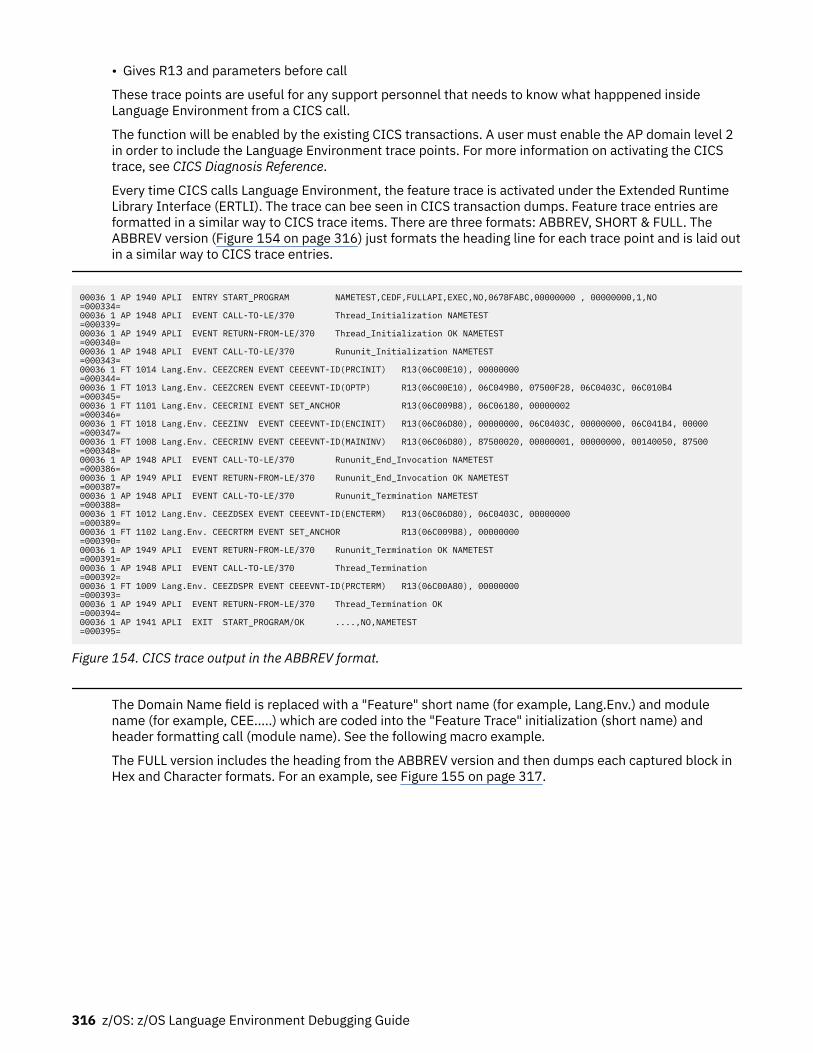
• Gives R13 and parameters before call
These trace points are useful for any support personnel that needs to know what happpened insideLanguage Environment from a CICS call.
The function will be enabled by the existing CICS transactions. A user must enable the AP domain level 2in order to include the Language Environment trace points. For more information on activating the CICStrace, see CICS Diagnosis Reference.
Every time CICS calls Language Environment, the feature trace is activated under the Extended RuntimeLibrary Interface (ERTLI). The trace can bee seen in CICS transaction dumps. Feature trace entries areformatted in a similar way to CICS trace items. There are three formats: ABBREV, SHORT & FULL. TheABBREV version (Figure 154 on page 316) just formats the heading line for each trace point and is laid outin a similar way to CICS trace entries.
00036 1 AP 1940 APLI ENTRY START_PROGRAM NAMETEST,CEDF,FULLAPI,EXEC,NO,0678FABC,00000000 , 00000000,1,NO =000334=00036 1 AP 1948 APLI EVENT CALL-TO-LE/370 Thread_Initialization NAMETEST =000339=00036 1 AP 1949 APLI EVENT RETURN-FROM-LE/370 Thread_Initialization OK NAMETEST =000340=00036 1 AP 1948 APLI EVENT CALL-TO-LE/370 Rununit_Initialization NAMETEST =000343=00036 1 FT 1014 Lang.Env. CEEZCREN EVENT CEEEVNT-ID(PRCINIT) R13(06C00E10), 00000000 =000344=00036 1 FT 1013 Lang.Env. CEEZCREN EVENT CEEEVNT-ID(OPTP) R13(06C00E10), 06C049B0, 07500F28, 06C0403C, 06C010B4 =000345=00036 1 FT 1101 Lang.Env. CEECRINI EVENT SET_ANCHOR R13(06C009B8), 06C06180, 00000002 =000346=00036 1 FT 1018 Lang.Env. CEEZINV EVENT CEEEVNT-ID(ENCINIT) R13(06C06D80), 00000000, 06C0403C, 00000000, 06C041B4, 00000 =000347=00036 1 FT 1008 Lang.Env. CEECRINV EVENT CEEEVNT-ID(MAININV) R13(06C06D80), 87500020, 00000001, 00000000, 00140050, 87500 =000348=00036 1 AP 1948 APLI EVENT CALL-TO-LE/370 Rununit_End_Invocation NAMETEST =000386=00036 1 AP 1949 APLI EVENT RETURN-FROM-LE/370 Rununit_End_Invocation OK NAMETEST =000387=00036 1 AP 1948 APLI EVENT CALL-TO-LE/370 Rununit_Termination NAMETEST =000388=00036 1 FT 1012 Lang.Env. CEEZDSEX EVENT CEEEVNT-ID(ENCTERM) R13(06C06D80), 06C0403C, 00000000 =000389=00036 1 FT 1102 Lang.Env. CEECRTRM EVENT SET_ANCHOR R13(06C009B8), 00000000 =000390=00036 1 AP 1949 APLI EVENT RETURN-FROM-LE/370 Rununit_Termination OK NAMETEST =000391=00036 1 AP 1948 APLI EVENT CALL-TO-LE/370 Thread_Termination =000392=00036 1 FT 1009 Lang.Env. CEEZDSPR EVENT CEEEVNT-ID(PRCTERM) R13(06C00A80), 00000000 =000393=00036 1 AP 1949 APLI EVENT RETURN-FROM-LE/370 Thread_Termination OK =000394=00036 1 AP 1941 APLI EXIT START_PROGRAM/OK ....,NO,NAMETEST =000395=
Figure 154. CICS trace output in the ABBREV format.
The Domain Name field is replaced with a "Feature" short name (for example, Lang.Env.) and modulename (for example, CEE.....) which are coded into the "Feature Trace" initialization (short name) andheader formatting call (module name). See the following macro example.
The FULL version includes the heading from the ABBREV version and then dumps each captured block inHex and Character formats. For an example, see Figure 155 on page 317.
316 z/OS: z/OS Language Environment Debugging Guide
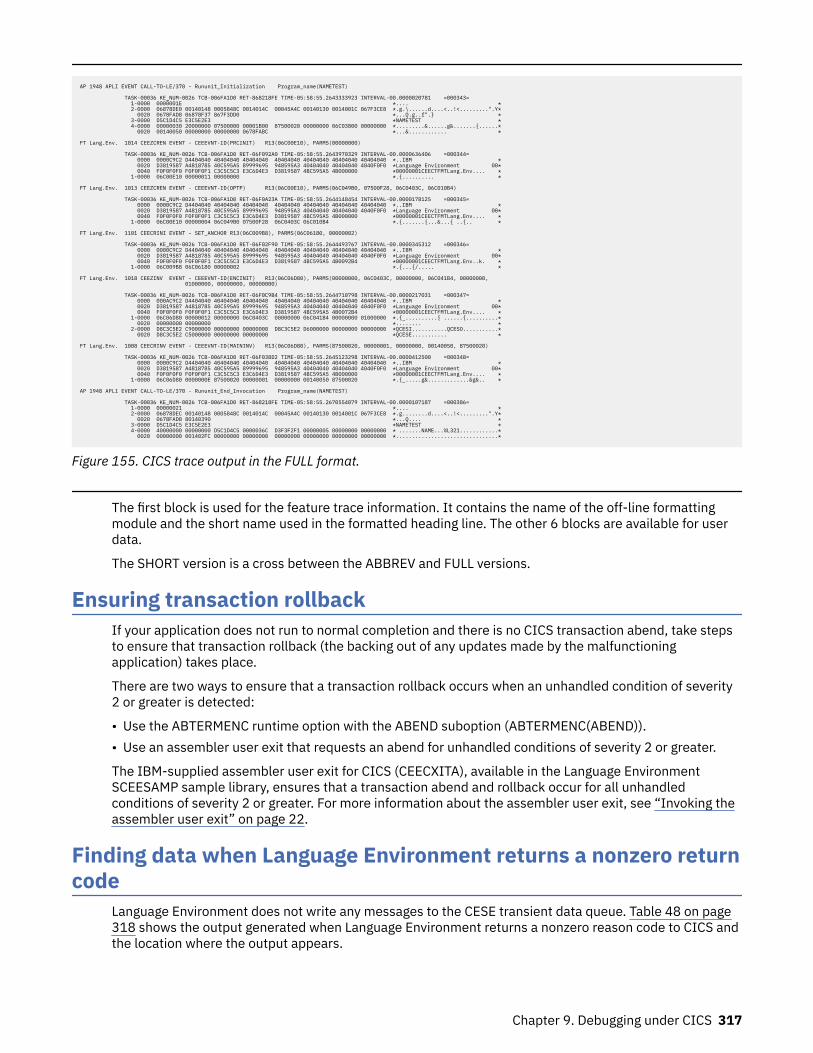
AP 1948 APLI EVENT CALL-TO-LE/370 - Rununit_Initialization Program_name(NAMETEST)
TASK-00036 KE_NUM-0026 TCB-006FA1D0 RET-868218FE TIME-05:58:55.2643333923 INTERVAL-00.0000020781 =000343= 1-0000 0000001E *.... * 2-0000 06878DE0 00140148 0005848C 0014014C 00045A4C 00140130 0014001C 067F3CE8 *.g.\......d....<..!<.........".Y* 0020 0678FAD8 06878F37 867F3DD0 *...Q.g..f".} * 3-0000 D5C1D4C5 E3C5E2E3 *NAMETEST * 4-0000 00000030 20000000 07500000 00001B00 87500020 00000000 06C03800 00000000 *.........&......g&.......{......* 0020 00140050 00000000 00000000 0678FABC *...&............ *
FT Lang.Env. 1014 CEEZCREN EVENT - CEEEVNT-ID(PRCINIT) R13(06C00E10), PARMS(00000000)
TASK-00036 KE_NUM-0026 TCB-006FA1D0 RET-06F092A0 TIME-05:58:55.2643970329 INTERVAL-00.0000636406 =000344= 0000 0000C9C2 D4404040 40404040 40404040 40404040 40404040 40404040 40404040 *..IBM * 0020 D3819587 A4818785 40C595A5 89999695 948595A3 40404040 40404040 4040F0F0 *Language Environment 00* 0040 F0F0F0F0 F0F0F0F1 C3C5C5C3 E3C6D4E3 D3819587 4BC595A5 4B000000 *00000001CEECTFMTLang.Env.... * 1-0000 06C00E10 00000011 00000000 *.{.......... *
FT Lang.Env. 1013 CEEZCREN EVENT - CEEEVNT-ID(OPTP) R13(06C00E10), PARMS(06C049B0, 07500F28, 06C0403C, 06C010B4)
TASK-00036 KE_NUM-0026 TCB-006FA1D0 RET-06F0A23A TIME-05:58:55.2644148454 INTERVAL-00.0000178125 =000345= 0000 0000C9C2 D4404040 40404040 40404040 40404040 40404040 40404040 40404040 *..IBM * 0020 D3819587 A4818785 40C595A5 89999695 948595A3 40404040 40404040 4040F0F0 *Language Environment 00* 0040 F0F0F0F0 F0F0F0F1 C3C5C5C3 E3C6D4E3 D3819587 4BC595A5 4B000000 *00000001CEECTFMTLang.Env.... * 1-0000 06C00E10 00000004 06C049B0 07500F28 06C0403C 06C010B4 *.{.......{...&...{ ..{.. *
FT Lang.Env. 1101 CEECRINI EVENT - SET_ANCHOR R13(06C009B8), PARMS(06C06180, 00000002)
TASK-00036 KE_NUM-0026 TCB-006FA1D0 RET-06F02F90 TIME-05:58:55.2644493767 INTERVAL-00.0000345312 =000346= 0000 0000C9C2 D4404040 40404040 40404040 40404040 40404040 40404040 40404040 *..IBM * 0020 D3819587 A4818785 40C595A5 89999695 948595A3 40404040 40404040 4040F0F0 *Language Environment 00* 0040 F0F0F0F0 F0F0F0F1 C3C5C5C3 E3C6D4E3 D3819587 4BC595A5 4B0092B4 *00000001CEECTFMTLang.Env..k. * 1-0000 06C009B8 06C06180 00000002 *.{...{/..... *
FT Lang.Env. 1018 CEEZINV EVENT - CEEEVNT-ID(ENCINIT) R13(06C06D80), PARMS(00000000, 06C0403C, 00000000, 06C041B4, 00000000, 01000000, 00000000, 00000000)
TASK-00036 KE_NUM-0026 TCB-006FA1D0 RET-06F0C9B4 TIME-05:58:55.2644710798 INTERVAL-00.0000217031 =000347= 0000 000AC9C2 D4404040 40404040 40404040 40404040 40404040 40404040 40404040 *..IBM * 0020 D3819587 A4818785 40C595A5 89999695 948595A3 40404040 40404040 4040F0F0 *Language Environment 00* 0040 F0F0F0F0 F0F0F0F1 C3C5C5C3 E3C6D4E3 D3819587 4BC595A5 4B0072B4 *00000001CEECTFMTLang.Env.... * 1-0000 06C06D80 00000012 00000000 06C0403C 00000000 06C041B4 00000000 01000000 *.{_..........{ ......{..........* 0020 00000000 00000000 *........ * 2-0000 D8C3C5E2 C9000000 00000000 00000000 D8C3C5E2 D6000000 00000000 00000000 *QCESI...........QCESO...........* 0020 D8C3C5E2 C5000000 00000000 00000000 *QCESE........... *
FT Lang.Env. 1008 CEECRINV EVENT - CEEEVNT-ID(MAININV) R13(06C06D80), PARMS(87500020, 00000001, 00000000, 00140050, 87500020)
TASK-00036 KE_NUM-0026 TCB-006FA1D0 RET-06F038D2 TIME-05:58:55.2645123298 INTERVAL-00.0000412500 =000348= 0000 0000C9C2 D4404040 40404040 40404040 40404040 40404040 40404040 40404040 *..IBM * 0020 D3819587 A4818785 40C595A5 89999695 948595A3 40404040 40404040 4040F0F0 *Language Environment 00* 0040 F0F0F0F0 F0F0F0F1 C3C5C5C3 E3C6D4E3 D3819587 4BC595A5 4B000000 *00000001CEECTFMTLang.Env.... * 1-0000 06C06D80 0000000E 87500020 00000001 00000000 00140050 87500020 *.{_.....g&.............&g&.. *
AP 1948 APLI EVENT CALL-TO-LE/370 - Rununit_End_Invocation Program_name(NAMETEST)
TASK-00036 KE_NUM-0026 TCB-006FA1D0 RET-868218FE TIME-05:58:55.2670554079 INTERVAL-00.0000107187 =000386= 1-0000 00000021 *.... * 2-0000 06878DEC 00140148 0005848C 0014014C 00045A4C 00140130 0014001C 067F3CE8 *.g........d....<..!<.........".Y* 0020 0678FAD8 80140390 *...Q.... * 3-0000 D5C1D4C5 E3C5E2E3 *NAMETEST * 4-0000 40000000 00000000 D5C1D4C5 0000036C D3F3F2F1 00000005 00000000 00000000 * .......NAME...%L321............* 0020 00000000 001402FC 00000000 00000000 00000000 00000000 00000000 00000000 *................................*
Figure 155. CICS trace output in the FULL format.
The first block is used for the feature trace information. It contains the name of the off-line formattingmodule and the short name used in the formatted heading line. The other 6 blocks are available for userdata.
The SHORT version is a cross between the ABBREV and FULL versions.
Ensuring transaction rollbackIf your application does not run to normal completion and there is no CICS transaction abend, take stepsto ensure that transaction rollback (the backing out of any updates made by the malfunctioningapplication) takes place.
There are two ways to ensure that a transaction rollback occurs when an unhandled condition of severity2 or greater is detected:
• Use the ABTERMENC runtime option with the ABEND suboption (ABTERMENC(ABEND)).• Use an assembler user exit that requests an abend for unhandled conditions of severity 2 or greater.
The IBM-supplied assembler user exit for CICS (CEECXITA), available in the Language EnvironmentSCEESAMP sample library, ensures that a transaction abend and rollback occur for all unhandledconditions of severity 2 or greater. For more information about the assembler user exit, see “Invoking theassembler user exit” on page 22.
Finding data when Language Environment returns a nonzero returncode
Language Environment does not write any messages to the CESE transient data queue. Table 48 on page318 shows the output generated when Language Environment returns a nonzero reason code to CICS andthe location where the output appears.
Chapter 9. Debugging under CICS 317
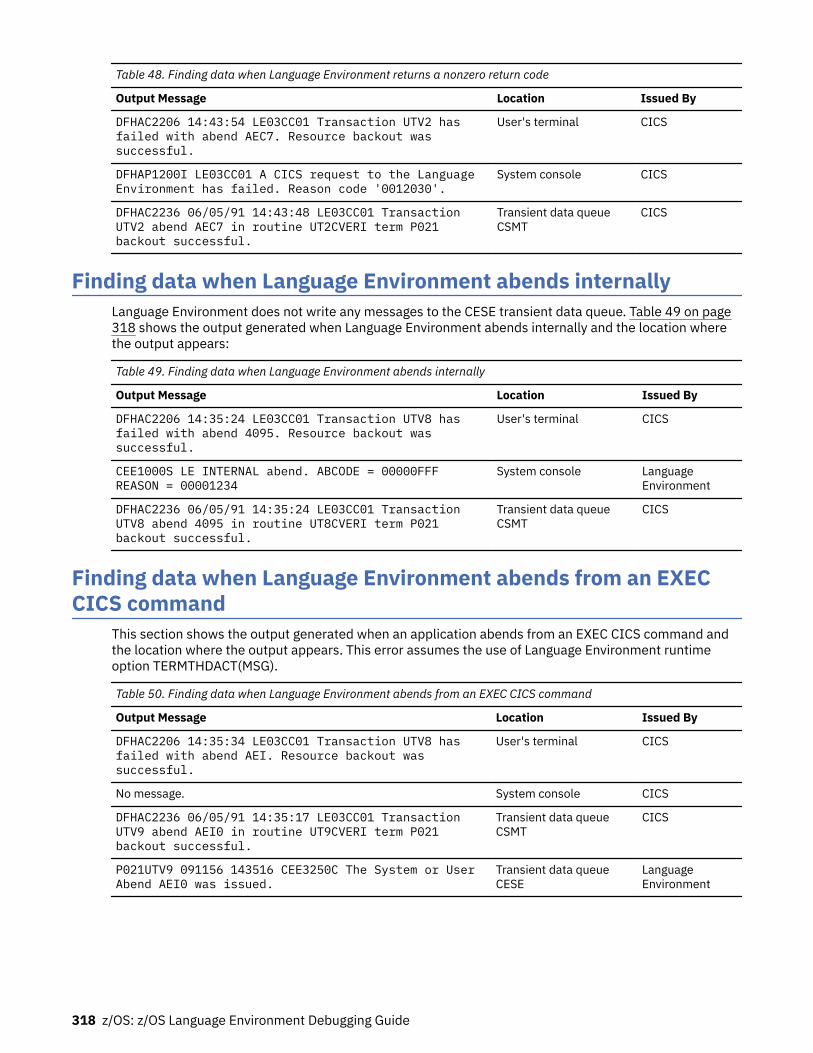
Table 48. Finding data when Language Environment returns a nonzero return code
Output Message Location Issued By
DFHAC2206 14:43:54 LE03CC01 Transaction UTV2 hasfailed with abend AEC7. Resource backout wassuccessful.
User's terminal CICS
DFHAP1200I LE03CC01 A CICS request to the LanguageEnvironment has failed. Reason code '0012030'.
System console CICS
DFHAC2236 06/05/91 14:43:48 LE03CC01 TransactionUTV2 abend AEC7 in routine UT2CVERI term P021backout successful.
Transient data queueCSMT
CICS
Finding data when Language Environment abends internallyLanguage Environment does not write any messages to the CESE transient data queue. Table 49 on page318 shows the output generated when Language Environment abends internally and the location wherethe output appears:
Table 49. Finding data when Language Environment abends internally
Output Message Location Issued By
DFHAC2206 14:35:24 LE03CC01 Transaction UTV8 hasfailed with abend 4095. Resource backout wassuccessful.
User's terminal CICS
CEE1000S LE INTERNAL abend. ABCODE = 00000FFFREASON = 00001234
System console LanguageEnvironment
DFHAC2236 06/05/91 14:35:24 LE03CC01 TransactionUTV8 abend 4095 in routine UT8CVERI term P021backout successful.
Transient data queueCSMT
CICS
Finding data when Language Environment abends from an EXECCICS command
This section shows the output generated when an application abends from an EXEC CICS command andthe location where the output appears. This error assumes the use of Language Environment runtimeoption TERMTHDACT(MSG).
Table 50. Finding data when Language Environment abends from an EXEC CICS command
Output Message Location Issued By
DFHAC2206 14:35:34 LE03CC01 Transaction UTV8 hasfailed with abend AEI. Resource backout wassuccessful.
User's terminal CICS
No message. System console CICS
DFHAC2236 06/05/91 14:35:17 LE03CC01 TransactionUTV9 abend AEI0 in routine UT9CVERI term P021backout successful.
Transient data queueCSMT
CICS
P021UTV9 091156 143516 CEE3250C The System or UserAbend AEI0 was issued.
Transient data queueCESE
LanguageEnvironment
318 z/OS: z/OS Language Environment Debugging Guide
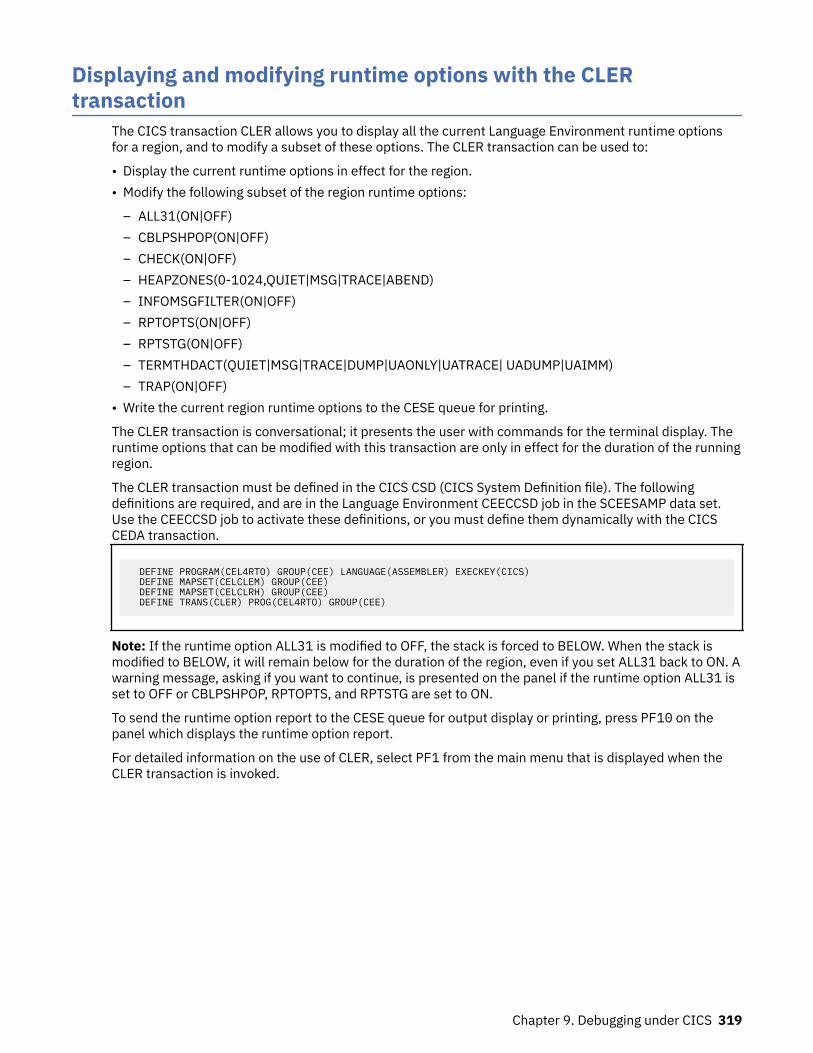
Displaying and modifying runtime options with the CLERtransaction
The CICS transaction CLER allows you to display all the current Language Environment runtime optionsfor a region, and to modify a subset of these options. The CLER transaction can be used to:
• Display the current runtime options in effect for the region.• Modify the following subset of the region runtime options:
– ALL31(ON|OFF)– CBLPSHPOP(ON|OFF)– CHECK(ON|OFF)– HEAPZONES(0-1024,QUIET|MSG|TRACE|ABEND)– INFOMSGFILTER(ON|OFF)– RPTOPTS(ON|OFF)– RPTSTG(ON|OFF)– TERMTHDACT(QUIET|MSG|TRACE|DUMP|UAONLY|UATRACE| UADUMP|UAIMM)– TRAP(ON|OFF)
• Write the current region runtime options to the CESE queue for printing.
The CLER transaction is conversational; it presents the user with commands for the terminal display. Theruntime options that can be modified with this transaction are only in effect for the duration of the runningregion.
The CLER transaction must be defined in the CICS CSD (CICS System Definition file). The followingdefinitions are required, and are in the Language Environment CEECCSD job in the SCEESAMP data set.Use the CEECCSD job to activate these definitions, or you must define them dynamically with the CICSCEDA transaction.
DEFINE PROGRAM(CEL4RTO) GROUP(CEE) LANGUAGE(ASSEMBLER) EXECKEY(CICS) DEFINE MAPSET(CELCLEM) GROUP(CEE) DEFINE MAPSET(CELCLRH) GROUP(CEE) DEFINE TRANS(CLER) PROG(CEL4RTO) GROUP(CEE)
Note: If the runtime option ALL31 is modified to OFF, the stack is forced to BELOW. When the stack ismodified to BELOW, it will remain below for the duration of the region, even if you set ALL31 back to ON. Awarning message, asking if you want to continue, is presented on the panel if the runtime option ALL31 isset to OFF or CBLPSHPOP, RPTOPTS, and RPTSTG are set to ON.
To send the runtime option report to the CESE queue for output display or printing, press PF10 on thepanel which displays the runtime option report.
For detailed information on the use of CLER, select PF1 from the main menu that is displayed when theCLER transaction is invoked.
Chapter 9. Debugging under CICS 319

320 z/OS: z/OS Language Environment Debugging Guide
Part 3. Debugging Language Environment AMODE 64applications
This part provides specific information for debugging applications written to make use of the memoryaddress space above the 2 GB bar.
© Copyright IBM Corp. 1991, 2020 321

322 z/OS: z/OS Language Environment Debugging Guide
Chapter 10. Preparing your AMODE 64 application fordebugging
This chapter describes options and features that you can use to prepare your AMODE 64 application fordebugging. The following topics are covered:
• Compiler options for C, C++, PL/I• Language Environment runtime options• Use of storage in routines• Options for modifying exception handling• Assembler user exits• Enclave termination behavior• Language Environment feedback codes and condition tokens
Setting compiler optionsThe following sections discuss language-specific compiler options important to debugging routines inLanguage Environment. These sections cover only the compiler options that are important to debugging.For a complete list of compiler options, see the appropriate HLL publications.
The use of some compiler options (such as DEBUG) can affect the performance of your routine. You mustset these options before you compile. In some cases, you might need to remove the option and recompileyour routine before delivering your application.
XL C and XL C++ compiler options for AMODE 64 applicationsWhen compiling an application using the LP64 compiler option, you cannot use the TEST compiler option.You must instead use the DEBUG(FORMAT(DWARF)) compiler option.
When the GONUMBER compiler option is used with LP64, it will produce executables with additionaldebug information. This is used by Language Environment to produce statement numbers in the LanguageEnvironment dump (CEEDUMP). Statement numbers in the CEEDUMP are also produced if the DEBUGcompiler option or the c89 -g option is used.
For more information about Interprocedural Analysis (IPA), see Using the IPA in z/OS XL C/C++Programming Guide.
Using Language Environment runtime optionsSeveral runtime options affect debugging in Language Environment. The TEST runtime option, forexample, can be used with a debugging tool to specify the level of control in effect for the debugging toolwhen the routine being initialized is started. The DYNDUMP, HEAPCHK, TERMTHDACT, TRACE, and TRAPoptions affect exception handling. The following Language Environment runtime options affect debugging.For a more detailed discussion of these runtime options, see z/OS Language Environment ProgrammingReference.
Runtime option Description of runtime option
CEEDUMP Specifies options to control the processing of the Language Environment dump report.
DYNDUMP Provides a way to obtain IPCS readable dumps of user applications that would ordinarily belost due to the absence of a SYSMDUMP, SYSUDUMP, or SYSABEND DD statement
HEAPCHK Determines whether additional heap check tests are performed.
HEAPZONES Activates user heap overlay toleration and checking.
© Copyright IBM Corp. 1991, 2020 323
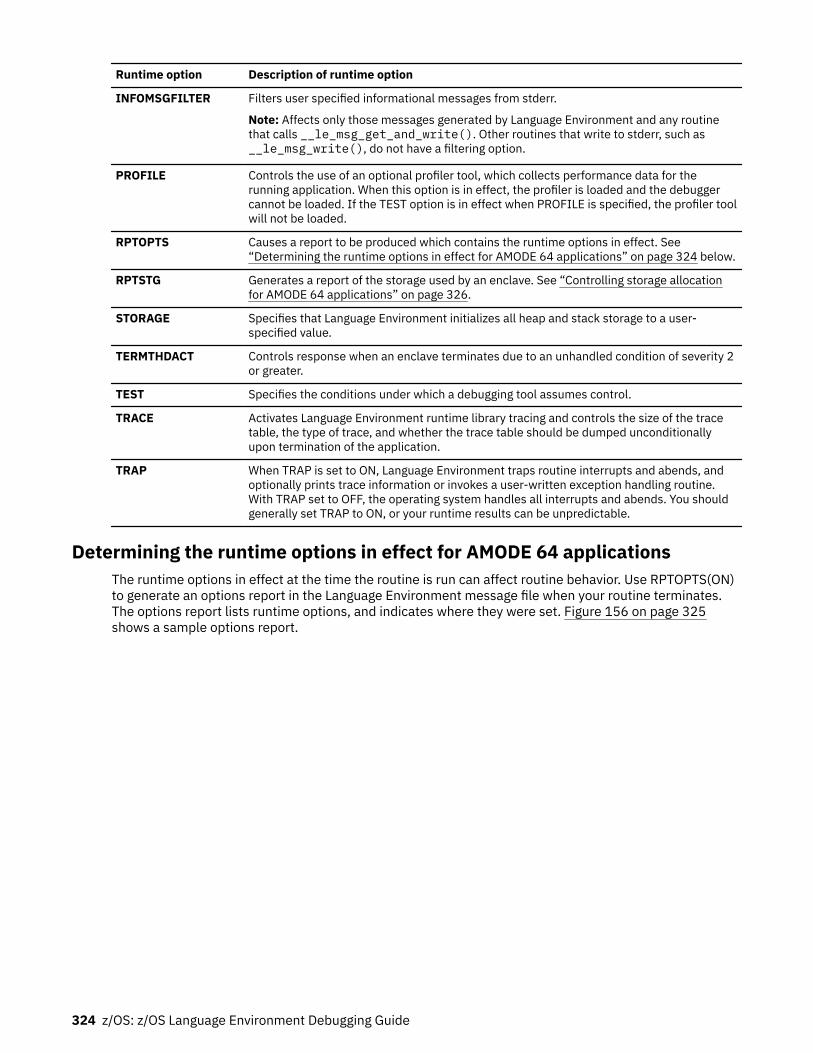
Runtime option Description of runtime option
INFOMSGFILTER Filters user specified informational messages from stderr.
Note: Affects only those messages generated by Language Environment and any routinethat calls __le_msg_get_and_write(). Other routines that write to stderr, such as__le_msg_write(), do not have a filtering option.
PROFILE Controls the use of an optional profiler tool, which collects performance data for therunning application. When this option is in effect, the profiler is loaded and the debuggercannot be loaded. If the TEST option is in effect when PROFILE is specified, the profiler toolwill not be loaded.
RPTOPTS Causes a report to be produced which contains the runtime options in effect. See“Determining the runtime options in effect for AMODE 64 applications” on page 324 below.
RPTSTG Generates a report of the storage used by an enclave. See “Controlling storage allocationfor AMODE 64 applications” on page 326.
STORAGE Specifies that Language Environment initializes all heap and stack storage to a user-specified value.
TERMTHDACT Controls response when an enclave terminates due to an unhandled condition of severity 2or greater.
TEST Specifies the conditions under which a debugging tool assumes control.
TRACE Activates Language Environment runtime library tracing and controls the size of the tracetable, the type of trace, and whether the trace table should be dumped unconditionallyupon termination of the application.
TRAP When TRAP is set to ON, Language Environment traps routine interrupts and abends, andoptionally prints trace information or invokes a user-written exception handling routine.With TRAP set to OFF, the operating system handles all interrupts and abends. You shouldgenerally set TRAP to ON, or your runtime results can be unpredictable.
Determining the runtime options in effect for AMODE 64 applicationsThe runtime options in effect at the time the routine is run can affect routine behavior. Use RPTOPTS(ON)to generate an options report in the Language Environment message file when your routine terminates.The options report lists runtime options, and indicates where they were set. Figure 156 on page 325shows a sample options report.
324 z/OS: z/OS Language Environment Debugging Guide
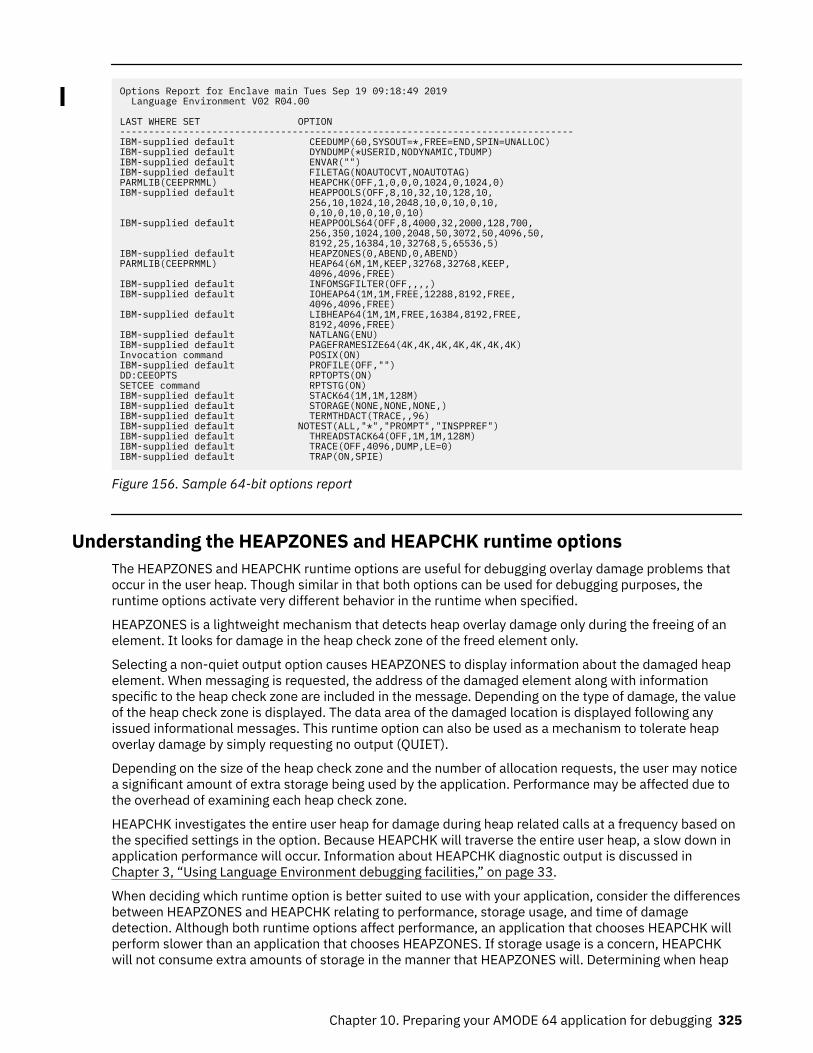
Options Report for Enclave main Tues Sep 19 09:18:49 2019 Language Environment V02 R04.00
LAST WHERE SET OPTION ------------------------------------------------------------------------------- IBM-supplied default CEEDUMP(60,SYSOUT=*,FREE=END,SPIN=UNALLOC) IBM-supplied default DYNDUMP(*USERID,NODYNAMIC,TDUMP) IBM-supplied default ENVAR("") IBM-supplied default FILETAG(NOAUTOCVT,NOAUTOTAG) PARMLIB(CEEPRMML) HEAPCHK(OFF,1,0,0,0,1024,0,1024,0) IBM-supplied default HEAPPOOLS(OFF,8,10,32,10,128,10, 256,10,1024,10,2048,10,0,10,0,10, 0,10,0,10,0,10,0,10)IBM-supplied default HEAPPOOLS64(OFF,8,4000,32,2000,128,700, 256,350,1024,100,2048,50,3072,50,4096,50, 8192,25,16384,10,32768,5,65536,5) IBM-supplied default HEAPZONES(0,ABEND,0,ABEND) PARMLIB(CEEPRMML) HEAP64(6M,1M,KEEP,32768,32768,KEEP, 4096,4096,FREE)IBM-supplied default INFOMSGFILTER(OFF,,,,) IBM-supplied default IOHEAP64(1M,1M,FREE,12288,8192,FREE, 4096,4096,FREE)IBM-supplied default LIBHEAP64(1M,1M,FREE,16384,8192,FREE, 8192,4096,FREE)IBM-supplied default NATLANG(ENU) IBM-supplied default PAGEFRAMESIZE64(4K,4K,4K,4K,4K,4K,4K)Invocation command POSIX(ON) IBM-supplied default PROFILE(OFF,"") DD:CEEOPTS RPTOPTS(ON) SETCEE command RPTSTG(ON) IBM-supplied default STACK64(1M,1M,128M) IBM-supplied default STORAGE(NONE,NONE,NONE,) IBM-supplied default TERMTHDACT(TRACE,,96) IBM-supplied default NOTEST(ALL,"*","PROMPT","INSPPREF") IBM-supplied default THREADSTACK64(OFF,1M,1M,128M) IBM-supplied default TRACE(OFF,4096,DUMP,LE=0) IBM-supplied default TRAP(ON,SPIE)
Figure 156. Sample 64-bit options report
Understanding the HEAPZONES and HEAPCHK runtime optionsThe HEAPZONES and HEAPCHK runtime options are useful for debugging overlay damage problems thatoccur in the user heap. Though similar in that both options can be used for debugging purposes, theruntime options activate very different behavior in the runtime when specified.
HEAPZONES is a lightweight mechanism that detects heap overlay damage only during the freeing of anelement. It looks for damage in the heap check zone of the freed element only.
Selecting a non-quiet output option causes HEAPZONES to display information about the damaged heapelement. When messaging is requested, the address of the damaged element along with informationspecific to the heap check zone are included in the message. Depending on the type of damage, the valueof the heap check zone is displayed. The data area of the damaged location is displayed following anyissued informational messages. This runtime option can also be used as a mechanism to tolerate heapoverlay damage by simply requesting no output (QUIET).
Depending on the size of the heap check zone and the number of allocation requests, the user may noticea significant amount of extra storage being used by the application. Performance may be affected due tothe overhead of examining each heap check zone.
HEAPCHK investigates the entire user heap for damage during heap related calls at a frequency based onthe specified settings in the option. Because HEAPCHK will traverse the entire user heap, a slow down inapplication performance will occur. Information about HEAPCHK diagnostic output is discussed inChapter 3, “Using Language Environment debugging facilities,” on page 33.
When deciding which runtime option is better suited to use with your application, consider the differencesbetween HEAPZONES and HEAPCHK relating to performance, storage usage, and time of damagedetection. Although both runtime options affect performance, an application that chooses HEAPCHK willperform slower than an application that chooses HEAPZONES. If storage usage is a concern, HEAPCHKwill not consume extra amounts of storage in the manner that HEAPZONES will. Determining when heap
Chapter 10. Preparing your AMODE 64 application for debugging 325
damage has occurred may be simpler to accomplish if HEAPCHK is chosen because of the frequency andscope of its analysis.
For more information about the HEAPZONES runtime option, see HEAPZONES in z/OS LanguageEnvironment Programming Reference.
For more information about the HEAPCHK runtime option, see HEAPCHK in z/OS Language EnvironmentProgramming Reference.
Controlling storage allocation for AMODE 64 applicationsThe following runtime options control storage allocation:
• HEAP64 • HEAPPOOLS• HEAPPOOLS64 • IOHEAP64 • LIBHEAP64 • STACK64 • THREADSTACK64
To generate a report of the storage a routine (or more specifically, an enclave) used during its run, specifythe RPTSTG(ON) runtime option. The storage report, generated during enclave termination providesstatistics that can help you understand how space is being consumed as the enclave runs. If storagemanagement tuning is desired, the statistics can help you set the corresponding storage-related runtimeoptions for future runs. Figure 157 on page 327 shows a sample storage report.
326 z/OS: z/OS Language Environment Debugging Guide
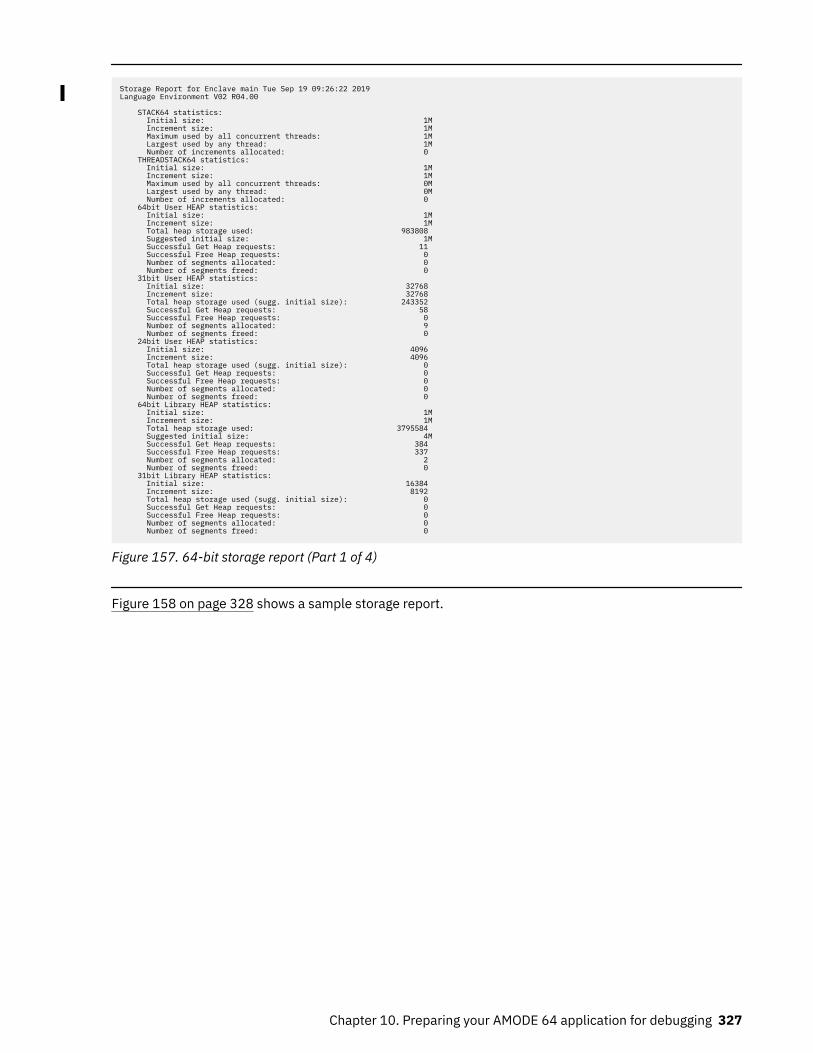
Storage Report for Enclave main Tue Sep 19 09:26:22 2019Language Environment V02 R04.00 STACK64 statistics: Initial size: 1M Increment size: 1M Maximum used by all concurrent threads: 1M Largest used by any thread: 1M Number of increments allocated: 0 THREADSTACK64 statistics: Initial size: 1M Increment size: 1M Maximum used by all concurrent threads: 0M Largest used by any thread: 0M Number of increments allocated: 0 64bit User HEAP statistics: Initial size: 1M Increment size: 1M Total heap storage used: 983808 Suggested initial size: 1M Successful Get Heap requests: 11 Successful Free Heap requests: 0 Number of segments allocated: 0 Number of segments freed: 0 31bit User HEAP statistics: Initial size: 32768 Increment size: 32768 Total heap storage used (sugg. initial size): 243352 Successful Get Heap requests: 58 Successful Free Heap requests: 0 Number of segments allocated: 9 Number of segments freed: 0 24bit User HEAP statistics: Initial size: 4096 Increment size: 4096 Total heap storage used (sugg. initial size): 0 Successful Get Heap requests: 0 Successful Free Heap requests: 0 Number of segments allocated: 0 Number of segments freed: 0 64bit Library HEAP statistics: Initial size: 1M Increment size: 1M Total heap storage used: 3795584 Suggested initial size: 4M Successful Get Heap requests: 384 Successful Free Heap requests: 337 Number of segments allocated: 2 Number of segments freed: 0 31bit Library HEAP statistics: Initial size: 16384 Increment size: 8192 Total heap storage used (sugg. initial size): 0 Successful Get Heap requests: 0 Successful Free Heap requests: 0 Number of segments allocated: 0 Number of segments freed: 0
Figure 157. 64-bit storage report (Part 1 of 4)
Figure 158 on page 328 shows a sample storage report.
Chapter 10. Preparing your AMODE 64 application for debugging 327
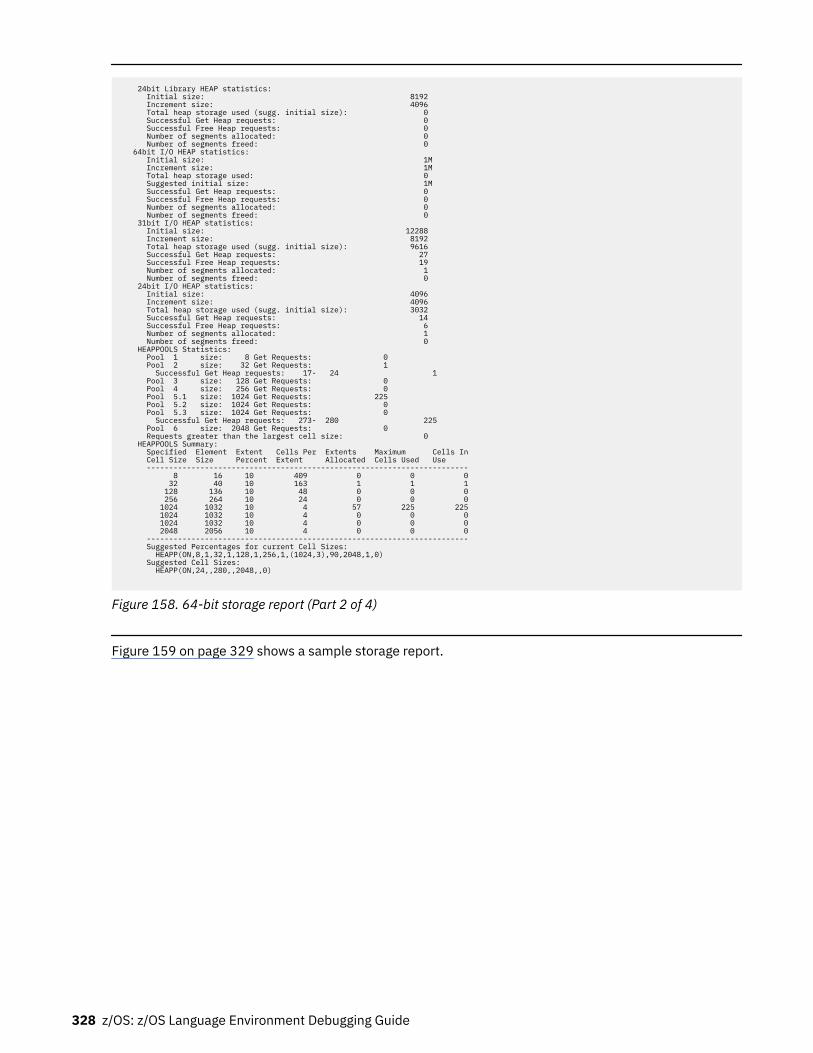
24bit Library HEAP statistics: Initial size: 8192 Increment size: 4096 Total heap storage used (sugg. initial size): 0 Successful Get Heap requests: 0 Successful Free Heap requests: 0 Number of segments allocated: 0 Number of segments freed: 0 64bit I/O HEAP statistics: Initial size: 1M Increment size: 1M Total heap storage used: 0 Suggested initial size: 1M Successful Get Heap requests: 0 Successful Free Heap requests: 0 Number of segments allocated: 0 Number of segments freed: 0 31bit I/O HEAP statistics: Initial size: 12288 Increment size: 8192 Total heap storage used (sugg. initial size): 9616 Successful Get Heap requests: 27 Successful Free Heap requests: 19 Number of segments allocated: 1 Number of segments freed: 0 24bit I/O HEAP statistics: Initial size: 4096 Increment size: 4096 Total heap storage used (sugg. initial size): 3032 Successful Get Heap requests: 14 Successful Free Heap requests: 6 Number of segments allocated: 1 Number of segments freed: 0 HEAPPOOLS Statistics: Pool 1 size: 8 Get Requests: 0 Pool 2 size: 32 Get Requests: 1 Successful Get Heap requests: 17- 24 1 Pool 3 size: 128 Get Requests: 0 Pool 4 size: 256 Get Requests: 0 Pool 5.1 size: 1024 Get Requests: 225 Pool 5.2 size: 1024 Get Requests: 0 Pool 5.3 size: 1024 Get Requests: 0 Successful Get Heap requests: 273- 280 225 Pool 6 size: 2048 Get Requests: 0 Requests greater than the largest cell size: 0 HEAPPOOLS Summary: Specified Element Extent Cells Per Extents Maximum Cells In Cell Size Size Percent Extent Allocated Cells Used Use ------------------------------------------------------------------------ 8 16 10 409 0 0 0 32 40 10 163 1 1 1 128 136 10 48 0 0 0 256 264 10 24 0 0 0 1024 1032 10 4 57 225 225 1024 1032 10 4 0 0 0 1024 1032 10 4 0 0 0 2048 2056 10 4 0 0 0 ------------------------------------------------------------------------ Suggested Percentages for current Cell Sizes: HEAPP(ON,8,1,32,1,128,1,256,1,(1024,3),90,2048,1,0) Suggested Cell Sizes: HEAPP(ON,24,,280,,2048,,0)
Figure 158. 64-bit storage report (Part 2 of 4)
Figure 159 on page 329 shows a sample storage report.
328 z/OS: z/OS Language Environment Debugging Guide
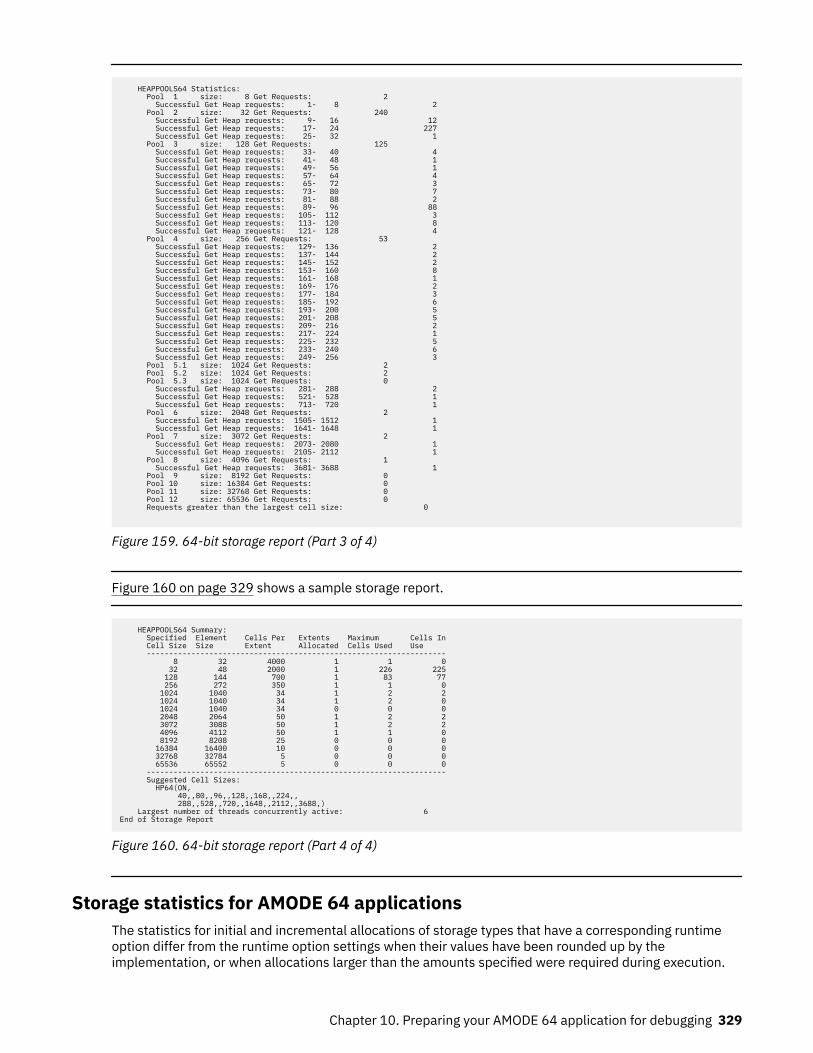
HEAPPOOLS64 Statistics: Pool 1 size: 8 Get Requests: 2 Successful Get Heap requests: 1- 8 2 Pool 2 size: 32 Get Requests: 240 Successful Get Heap requests: 9- 16 12 Successful Get Heap requests: 17- 24 227 Successful Get Heap requests: 25- 32 1 Pool 3 size: 128 Get Requests: 125 Successful Get Heap requests: 33- 40 4 Successful Get Heap requests: 41- 48 1 Successful Get Heap requests: 49- 56 1 Successful Get Heap requests: 57- 64 4 Successful Get Heap requests: 65- 72 3 Successful Get Heap requests: 73- 80 7 Successful Get Heap requests: 81- 88 2 Successful Get Heap requests: 89- 96 88 Successful Get Heap requests: 105- 112 3 Successful Get Heap requests: 113- 120 8 Successful Get Heap requests: 121- 128 4 Pool 4 size: 256 Get Requests: 53 Successful Get Heap requests: 129- 136 2 Successful Get Heap requests: 137- 144 2 Successful Get Heap requests: 145- 152 2 Successful Get Heap requests: 153- 160 8 Successful Get Heap requests: 161- 168 1 Successful Get Heap requests: 169- 176 2 Successful Get Heap requests: 177- 184 3 Successful Get Heap requests: 185- 192 6 Successful Get Heap requests: 193- 200 5 Successful Get Heap requests: 201- 208 5 Successful Get Heap requests: 209- 216 2 Successful Get Heap requests: 217- 224 1 Successful Get Heap requests: 225- 232 5 Successful Get Heap requests: 233- 240 6 Successful Get Heap requests: 249- 256 3 Pool 5.1 size: 1024 Get Requests: 2 Pool 5.2 size: 1024 Get Requests: 2 Pool 5.3 size: 1024 Get Requests: 0 Successful Get Heap requests: 281- 288 2 Successful Get Heap requests: 521- 528 1 Successful Get Heap requests: 713- 720 1 Pool 6 size: 2048 Get Requests: 2 Successful Get Heap requests: 1505- 1512 1 Successful Get Heap requests: 1641- 1648 1 Pool 7 size: 3072 Get Requests: 2 Successful Get Heap requests: 2073- 2080 1 Successful Get Heap requests: 2105- 2112 1 Pool 8 size: 4096 Get Requests: 1 Successful Get Heap requests: 3681- 3688 1 Pool 9 size: 8192 Get Requests: 0 Pool 10 size: 16384 Get Requests: 0 Pool 11 size: 32768 Get Requests: 0 Pool 12 size: 65536 Get Requests: 0 Requests greater than the largest cell size: 0
Figure 159. 64-bit storage report (Part 3 of 4)
Figure 160 on page 329 shows a sample storage report.
HEAPPOOLS64 Summary: Specified Element Cells Per Extents Maximum Cells In Cell Size Size Extent Allocated Cells Used Use ------------------------------------------------------------------- 8 32 4000 1 1 0 32 48 2000 1 226 225 128 144 700 1 83 77 256 272 350 1 1 0 1024 1040 34 1 2 2 1024 1040 34 1 2 0 1024 1040 34 0 0 0 2048 2064 50 1 2 2 3072 3088 50 1 2 2 4096 4112 50 1 1 0 8192 8208 25 0 0 0 16384 16400 10 0 0 0 32768 32784 5 0 0 0 65536 65552 5 0 0 0 ------------------------------------------------------------------- Suggested Cell Sizes: HP64(ON, 40,,80,,96,,128,,168,,224,, 288,,528,,720,,1648,,2112,,3688,) Largest number of threads concurrently active: 6 End of Storage Report
Figure 160. 64-bit storage report (Part 4 of 4)
Storage statistics for AMODE 64 applicationsThe statistics for initial and incremental allocations of storage types that have a corresponding runtimeoption differ from the runtime option settings when their values have been rounded up by theimplementation, or when allocations larger than the amounts specified were required during execution.
Chapter 10. Preparing your AMODE 64 application for debugging 329
See Storage statistics for AMODE 64 applications in z/OS Language Environment Programming Referencefor information about rounding.
Stack storage statistics for AMODE 64 applicationsLanguage Environment stack storage is managed at the thread level—each thread has its own stack-typeresources.
STACK64 and THREADSTACK64 statistics• Initial size—the actual size of the initial stack area assigned to each thread. If a pthread-attributes-table
is provided on the invocation of pthread-create, the stack size specified in the pthread-attributes-tabletakes precedence over the stack runtime options.
• Increment size—the size of each incremental stack area made available, as determined by theincrement portion of the corresponding runtime option.
• Maximum used by all concurrent threads—the maximum amount allocated in total at any one time by allconcurrently executing threads.
• Largest used by any thread—the largest amount allocated ever by any single thread.• Number of increments allocated—the number of incremental segments allocated by all threads.
Determining the applicable threadsIf the application is not a multithreading application, the STACK64 statistics are for the one and onlythread that executed, and the THREADSTACK64 statistics are all zero.
If the application is a multithreading application, and THREADSTACK64 was not suppressed, the STACK64statistics are for the initial thread (IPT), and the THREADSTACK64 statistics are for the other threads.However, if THREADSTACK64 was suppressed, the STACK64 statistics are for all of the threads, initial andother.
Allocating stack storageThe allocation of the stack for each thread, including the initial processing thread (IPT), is part of astorage request to the system when the thread is first created. Other storage, not part of the stack, is alsoacquired at this time. These storage allocations are not shown in the storage report. The size of the stackportion of this storage is the stack maximum size plus a one megabyte (1M) guard area. After allocation,the guard area follows the stack initial size and runs through the end of the stack maximum size plus the1M guard area. Increments to the stack for each thread do not result in additional storage requests to thesystem. They result in the movement of the beginning of the guard area no further than the maximum sizeof the stack. The stack initial, increment, and maximum sizes are controlled through the STACK64 andTHREADSTACK64 runtime options.
Heap storage statisticsLanguage Environment heap storage is managed at the enclave level. Each enclave has its own heap typeresources, which are shared by the threads that execute within the enclave. The heap resources have 64-bit, 31-bit, and 24-bit addressable areas, each of which can be tuned separately.
HEAP64, LIBHEAP64, and IOHEAP64 statistics• Initial size—the default initial allocation, as specified by the corresponding runtime option.• Increment size—the minimum incremental allocation, as specified by the corresponding runtime option.• Total heap storage used—the largest total amount used by the enclave at any one time.• Successful Get Heap requests—the number of get heap requests.• Successful Free Heap requests—the number of free heap requests.• Number of segments allocated—the number of incremental segments allocated.• Number of segments freed—the number of incremental segments individually freed.
330 z/OS: z/OS Language Environment Debugging Guide
The number of Free Heap requests could be less than the number of Get Heap requests if the pieces ofheap storage acquired by individual Get Heap requests were not explicitly freed, but were freed implicitlyduring enclave termination. The number of incremental segments individually freed could be less than thenumber allocated if the segments were not explicitly freed, but were freed implicitly during enclavetermination. The initial segment is included in Number of segments allocated for each 31-bit and 24-bitaddressable heap resource, and for the 64-bit addressable IOHEAP64 resource. A disposition of KEEPalways causes 0 to be reported for the Number of segments freed. These statistics, in all cases, specifytotals for the entire enclave.
Heap pools storage statisticsThe HEAPPOOLS and HEAPPOOLS64 runtime options for C/C++ applications only controls usage of theheap pools storage algorithm at the enclave level. The heap pools algorithm allows for the definition ofone to twelve heap pools, each consisting of a number of storage cells of a specified length. For furtherdetails regarding heap pools storage statistics in the storage report, see “Language Environment storagereport with heap pools statistics” on page 463.
Modifying exception handling behaviorSetting the exception handling behavior of your routine affects the response that occurs when the routineencounters an error. You can modify exception handling behavior in the following ways:
• Application program interfaces (API)• User-written exception handlers• POSIX functions (used to specifically set signal actions and signal masks)
Language Environment application program interfaces (API)You can use the following APIs to modify exception handling:
Function name API description
__cabend() Terminates an enclave using an abend.
__le_cib_get() Returns a pointer to a condition information block (CIB) associated with a givencondition token. The CIB contains detailed information about the condition.
__set_exception_handler() Activates a routine to handle an exception.
__reset_exception_handler() Removes handling of an exception by any routine.
Language Environment runtime optionsThe following Language Environment runtime options can affect your routine's exception handlingbehavior:
Chapter 10. Preparing your AMODE 64 application for debugging 331
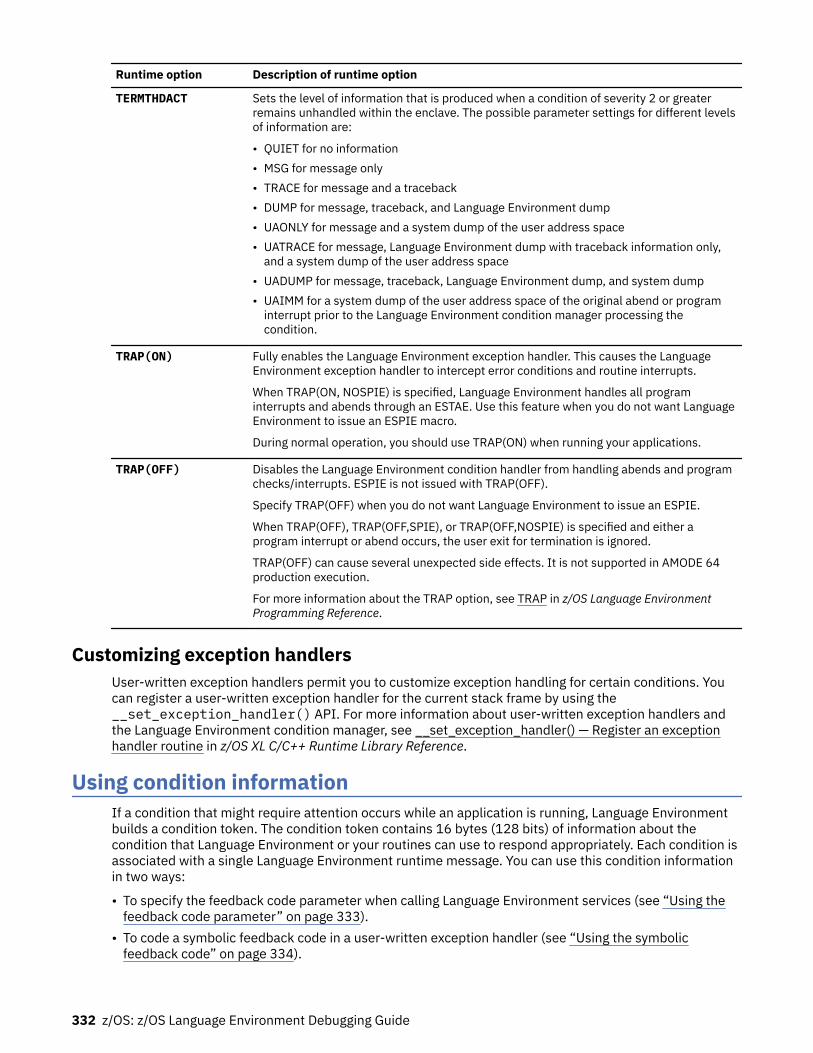
Runtime option Description of runtime option
TERMTHDACT Sets the level of information that is produced when a condition of severity 2 or greaterremains unhandled within the enclave. The possible parameter settings for different levelsof information are:
• QUIET for no information• MSG for message only• TRACE for message and a traceback• DUMP for message, traceback, and Language Environment dump• UAONLY for message and a system dump of the user address space • UATRACE for message, Language Environment dump with traceback information only,
and a system dump of the user address space • UADUMP for message, traceback, Language Environment dump, and system dump • UAIMM for a system dump of the user address space of the original abend or program
interrupt prior to the Language Environment condition manager processing thecondition.
TRAP(ON) Fully enables the Language Environment exception handler. This causes the LanguageEnvironment exception handler to intercept error conditions and routine interrupts.
When TRAP(ON, NOSPIE) is specified, Language Environment handles all programinterrupts and abends through an ESTAE. Use this feature when you do not want LanguageEnvironment to issue an ESPIE macro.
During normal operation, you should use TRAP(ON) when running your applications.
TRAP(OFF) Disables the Language Environment condition handler from handling abends and programchecks/interrupts. ESPIE is not issued with TRAP(OFF).
Specify TRAP(OFF) when you do not want Language Environment to issue an ESPIE.
When TRAP(OFF), TRAP(OFF,SPIE), or TRAP(OFF,NOSPIE) is specified and either aprogram interrupt or abend occurs, the user exit for termination is ignored.
TRAP(OFF) can cause several unexpected side effects. It is not supported in AMODE 64production execution.
For more information about the TRAP option, see TRAP in z/OS Language EnvironmentProgramming Reference.
Customizing exception handlersUser-written exception handlers permit you to customize exception handling for certain conditions. Youcan register a user-written exception handler for the current stack frame by using the__set_exception_handler() API. For more information about user-written exception handlers andthe Language Environment condition manager, see __set_exception_handler() — Register an exceptionhandler routine in z/OS XL C/C++ Runtime Library Reference.
Using condition informationIf a condition that might require attention occurs while an application is running, Language Environmentbuilds a condition token. The condition token contains 16 bytes (128 bits) of information about thecondition that Language Environment or your routines can use to respond appropriately. Each condition isassociated with a single Language Environment runtime message. You can use this condition informationin two ways:
• To specify the feedback code parameter when calling Language Environment services (see “Using thefeedback code parameter” on page 333).
• To code a symbolic feedback code in a user-written exception handler (see “Using the symbolicfeedback code” on page 334).
332 z/OS: z/OS Language Environment Debugging Guide
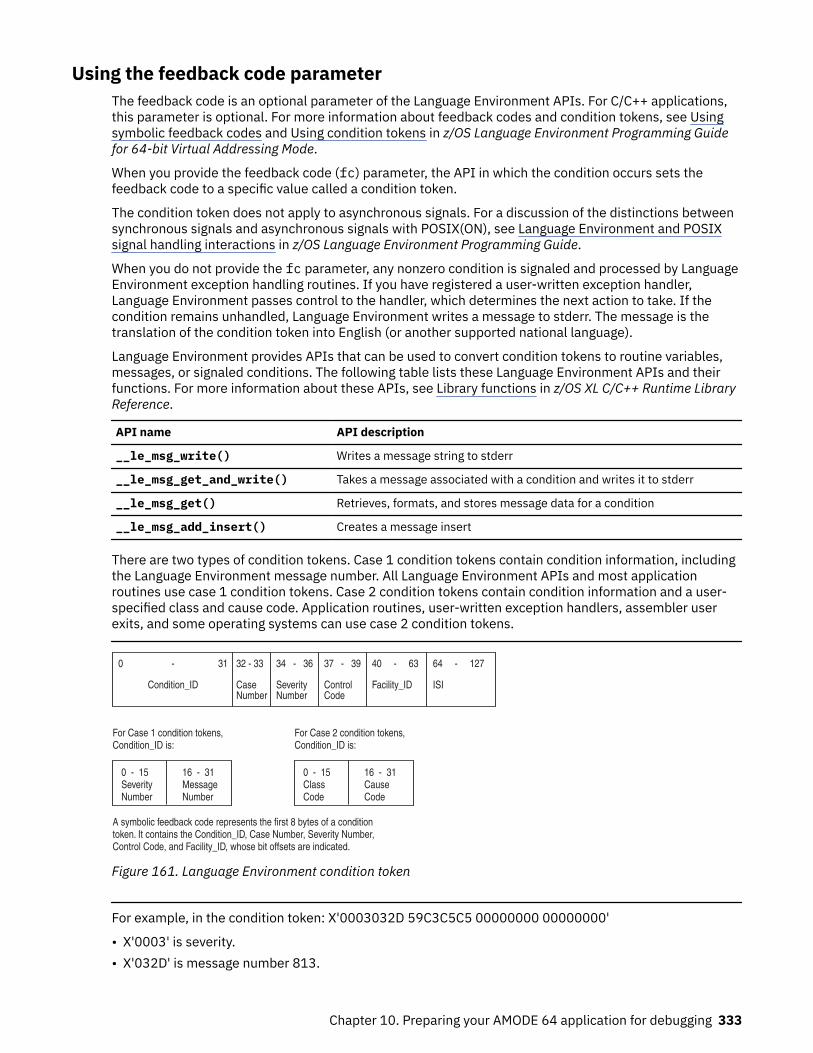
Using the feedback code parameterThe feedback code is an optional parameter of the Language Environment APIs. For C/C++ applications,this parameter is optional. For more information about feedback codes and condition tokens, see Usingsymbolic feedback codes and Using condition tokens in z/OS Language Environment Programming Guidefor 64-bit Virtual Addressing Mode.
When you provide the feedback code (fc) parameter, the API in which the condition occurs sets thefeedback code to a specific value called a condition token.
The condition token does not apply to asynchronous signals. For a discussion of the distinctions betweensynchronous signals and asynchronous signals with POSIX(ON), see Language Environment and POSIXsignal handling interactions in z/OS Language Environment Programming Guide.
When you do not provide the fc parameter, any nonzero condition is signaled and processed by LanguageEnvironment exception handling routines. If you have registered a user-written exception handler,Language Environment passes control to the handler, which determines the next action to take. If thecondition remains unhandled, Language Environment writes a message to stderr. The message is thetranslation of the condition token into English (or another supported national language).
Language Environment provides APIs that can be used to convert condition tokens to routine variables,messages, or signaled conditions. The following table lists these Language Environment APIs and theirfunctions. For more information about these APIs, see Library functions in z/OS XL C/C++ Runtime LibraryReference.
API name API description
__le_msg_write() Writes a message string to stderr
__le_msg_get_and_write() Takes a message associated with a condition and writes it to stderr
__le_msg_get() Retrieves, formats, and stores message data for a condition
__le_msg_add_insert() Creates a message insert
There are two types of condition tokens. Case 1 condition tokens contain condition information, includingthe Language Environment message number. All Language Environment APIs and most applicationroutines use case 1 condition tokens. Case 2 condition tokens contain condition information and a user-specified class and cause code. Application routines, user-written exception handlers, assembler userexits, and some operating systems can use case 2 condition tokens.
A symbolic feedback code represents the first 8 bytes of a conditiontoken. It contains the Condition_ID, Case Number, Severity Number,Control Code, and Facility_ID, whose bit offsets are indicated.
16 - 31CauseCode
0 - 15ClassCode
For Case 2 condition tokens,Condition_ID is:
16 - 31MessageNumber
0 - 15SeverityNumber
For Case 1 condition tokens,Condition_ID is:
64 - 127
ISI
40 - 63
Facility_ID
37 - 39
ControlCode
34 - 36
SeverityNumber
32 - 33
CaseNumber
0 - 31
Condition_ID
Figure 161. Language Environment condition token
For example, in the condition token: X'0003032D 59C3C5C5 00000000 00000000'
• X'0003' is severity.• X'032D' is message number 813.
Chapter 10. Preparing your AMODE 64 application for debugging 333
• X'59' are hexadecimal flags for case, severity, and control.• X'C3C5C5' is the CEE facility ID.• X'00000000 00000000' is the instance specific information (ISI). (In this case, no ISI was provided.)
If a Language Environment traceback or dump is generated while a condition token is being processed orwhen a condition exists, Language Environment writes the runtime message to the condition section ofthe traceback or dump. If a condition is detected when a Language Environment API is invoked without afeedback code, the condition token is passed to the Language Environment condition manager. If acondition is severity 0 or 1, Language Environment resumes without issuing a message. For conditions ofseverity 2 or greater, Language Environment issues a message and terminates. For a list of LanguageEnvironment runtime messages and corrective information, see Language Environment errno2 values inz/OS Language Environment Runtime Messages.
If a second condition is raised while Language Environment is attempting to handle a condition, themessage CEE0374C CONDITION = <message no.> is displayed using a write-to-operator (WTO). Themessage number in the CEE0374C message indicates the original condition that was being handled whenthe second condition was raised. This can happen when a critical error is signaled (for example, wheninternal control blocks are damaged).
If the output for this error message appears several times in sequence, the conditions appear in order ofoccurrence. Correcting the earliest condition can cause your application to run successfully.
Using the symbolic feedback codeThe symbolic feedback code represents the first 8 bytes of a 16-byte condition token. You can think of thesymbolic feedback code as the nickname for a condition. As such, the symbolic feedback code can beused in user-written exception handlers to screen for a given condition, even if it occurs at differentlocations in an application. For more details on symbolic feedback codes, see Using symbolic feedbackcodes in z/OS Language Environment Programming Guide for 64-bit Virtual Addressing Mode.
334 z/OS: z/OS Language Environment Debugging Guide
Chapter 11. Classifying AMODE 64 application errors
This chapter describes errors that commonly occur in Language Environment AMODE 64 applications. Italso explains how to use runtime messages and abend codes to obtain information about errors in yourapplication.
Identifying problems in routinesThe following sections describe how you can identify errors in Language Environment routines. Includedare common error symptoms and solutions.
Language Environment module namesYou can identify Language Environment-supplied module elements by any of the following three-character prefixes:
• CEE (Language Environment) • CEL (Language Environment) • EDC (C/C++)
Module elements or text files with other prefixes are not part of the Language Environment product forAMODE 64 applications.
Common errors in routinesThese common errors have simple solutions:
• If you receive abend U4093, reason X'224' (548 decimal), then make sure you use MEMLIMIT to allowaccess to above the 2 GB bar.
• If you do not have enough virtual storage, increase your region size or decrease your storage usage(stack size) by using the storage-related runtime options and callable services. (See “Controlling storageallocation for AMODE 64 applications” on page 326 for information about using storage in routines.)
• If you do not have enough disk space, increase your disk allocation.• If executable files are not available, check your executable library to ensure that they are defined. For
example, check your STEPLIB or JOBLIB definitions.
If your error is not caused by any of the items listed above, examine your routine or routines for changessince the last successful run. If there have been changes, review these changes for errors that might becausing the problem. One way to isolate the problem is to branch around or comment out recent changesand rerun the routine. If the run is successful, the error can be narrowed to the scope of the changes.
Changes in optimization levels, addressing modes, and input/output file formats can also causeunanticipated problems in your routine.
In most cases, generated condition tokens or runtime messages point to the nature of the error. Theruntime messages offer the most efficient corrective action. To help you analyze errors and determine themost useful method to fix the problem, Table 51 on page 335 lists common error symptoms, possiblecauses, and programmer responses.
Table 51. Common error symptoms, possible causes, and programmer responses
Error Symptom Possible Cause Programmer Response
Numbered runtimemessage appears
Condition raised in routine For any messages you receive, read theProgrammer Response. For information aboutmessage structure, see “Interpreting runtimemessages” on page 336.
© Copyright IBM Corp. 1991, 2020 335
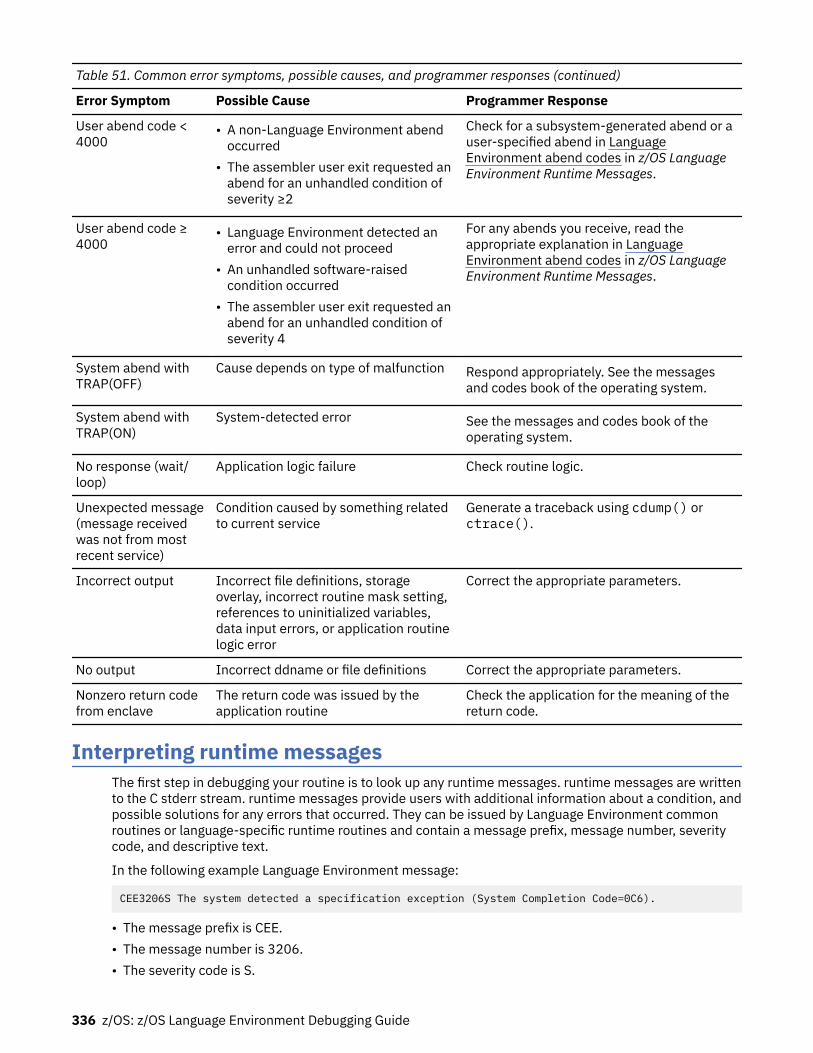
Table 51. Common error symptoms, possible causes, and programmer responses (continued)
Error Symptom Possible Cause Programmer Response
User abend code <4000
• A non-Language Environment abendoccurred
• The assembler user exit requested anabend for an unhandled condition ofseverity ≥2
Check for a subsystem-generated abend or auser-specified abend in LanguageEnvironment abend codes in z/OS LanguageEnvironment Runtime Messages.
User abend code ≥4000
• Language Environment detected anerror and could not proceed
• An unhandled software-raisedcondition occurred
• The assembler user exit requested anabend for an unhandled condition ofseverity 4
For any abends you receive, read theappropriate explanation in LanguageEnvironment abend codes in z/OS LanguageEnvironment Runtime Messages.
System abend withTRAP(OFF)
Cause depends on type of malfunction Respond appropriately. See the messagesand codes book of the operating system.
System abend withTRAP(ON)
System-detected error See the messages and codes book of theoperating system.
No response (wait/loop)
Application logic failure Check routine logic.
Unexpected message(message receivedwas not from mostrecent service)
Condition caused by something relatedto current service
Generate a traceback using cdump() orctrace().
Incorrect output Incorrect file definitions, storageoverlay, incorrect routine mask setting,references to uninitialized variables,data input errors, or application routinelogic error
Correct the appropriate parameters.
No output Incorrect ddname or file definitions Correct the appropriate parameters.
Nonzero return codefrom enclave
The return code was issued by theapplication routine
Check the application for the meaning of thereturn code.
Interpreting runtime messagesThe first step in debugging your routine is to look up any runtime messages. runtime messages are writtento the C stderr stream. runtime messages provide users with additional information about a condition, andpossible solutions for any errors that occurred. They can be issued by Language Environment commonroutines or language-specific runtime routines and contain a message prefix, message number, severitycode, and descriptive text.
In the following example Language Environment message:
CEE3206S The system detected a specification exception (System Completion Code=0C6).
• The message prefix is CEE.• The message number is 3206.• The severity code is S.
336 z/OS: z/OS Language Environment Debugging Guide
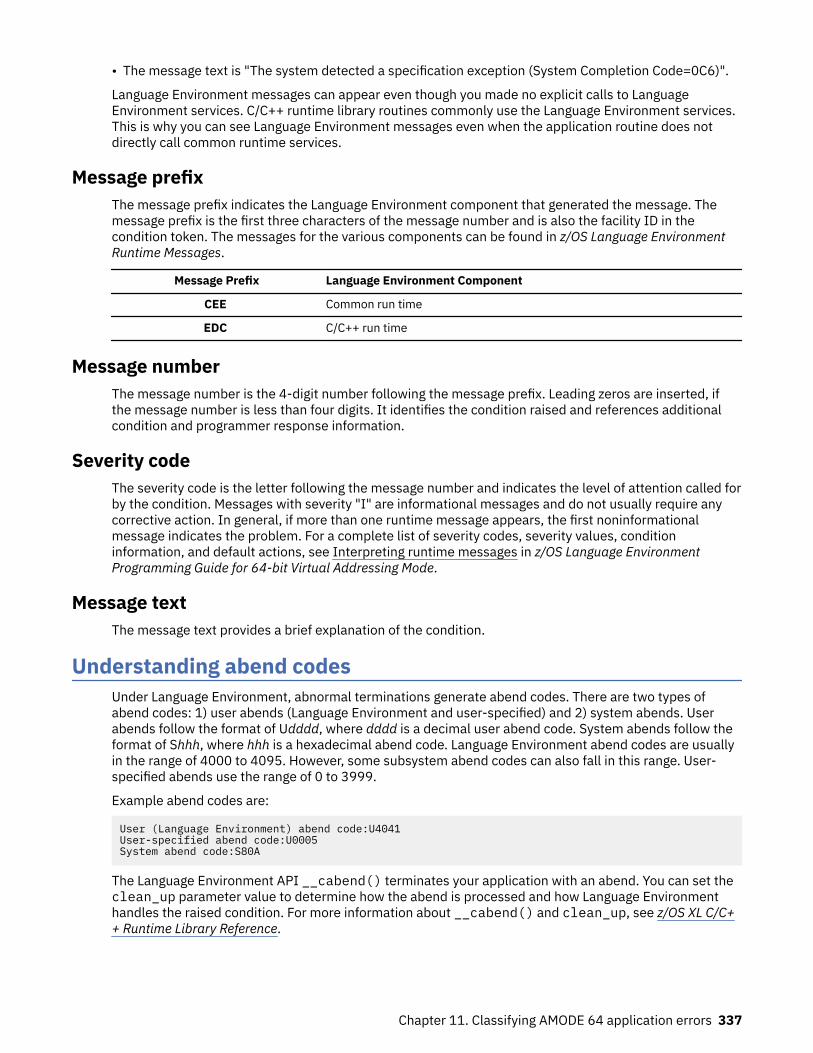
• The message text is "The system detected a specification exception (System Completion Code=0C6)".
Language Environment messages can appear even though you made no explicit calls to LanguageEnvironment services. C/C++ runtime library routines commonly use the Language Environment services.This is why you can see Language Environment messages even when the application routine does notdirectly call common runtime services.
Message prefixThe message prefix indicates the Language Environment component that generated the message. Themessage prefix is the first three characters of the message number and is also the facility ID in thecondition token. The messages for the various components can be found in z/OS Language EnvironmentRuntime Messages.
Message Prefix Language Environment Component
CEE Common run time
EDC C/C++ run time
Message numberThe message number is the 4-digit number following the message prefix. Leading zeros are inserted, ifthe message number is less than four digits. It identifies the condition raised and references additionalcondition and programmer response information.
Severity codeThe severity code is the letter following the message number and indicates the level of attention called forby the condition. Messages with severity "I" are informational messages and do not usually require anycorrective action. In general, if more than one runtime message appears, the first noninformationalmessage indicates the problem. For a complete list of severity codes, severity values, conditioninformation, and default actions, see Interpreting runtime messages in z/OS Language EnvironmentProgramming Guide for 64-bit Virtual Addressing Mode.
Message textThe message text provides a brief explanation of the condition.
Understanding abend codesUnder Language Environment, abnormal terminations generate abend codes. There are two types ofabend codes: 1) user abends (Language Environment and user-specified) and 2) system abends. Userabends follow the format of Udddd, where dddd is a decimal user abend code. System abends follow theformat of Shhh, where hhh is a hexadecimal abend code. Language Environment abend codes are usuallyin the range of 4000 to 4095. However, some subsystem abend codes can also fall in this range. User-specified abends use the range of 0 to 3999.
Example abend codes are:
User (Language Environment) abend code:U4041User-specified abend code:U0005System abend code:S80A
The Language Environment API __cabend() terminates your application with an abend. You can set theclean_up parameter value to determine how the abend is processed and how Language Environmenthandles the raised condition. For more information about __cabend() and clean_up, see z/OS XL C/C++ Runtime Library Reference.
Chapter 11. Classifying AMODE 64 application errors 337
User abendsIf you receive a Language Environment abend code, see Language Environment abend codes in z/OSLanguage Environment Runtime Messages for a list of abend codes, error descriptions, and programmerresponses.
System abendsIf you receive a system abend code, look up the code and the corresponding information in thepublications for the system you are using. When a system abend occurs, the operating system cangenerate a system dump. System dumps are written to ddname SYSMDUMP, SYSABEND, or SYSUDUMP. Ifthe DYNDUMP runtime option is used in combination with the TERMTHDACT runtime option, the systemdump can be written without the ddname specified. System dumps show the memory state at the time ofthe condition. See “Generating a system dump” on page 356 for more information about system dumps.
338 z/OS: z/OS Language Environment Debugging Guide
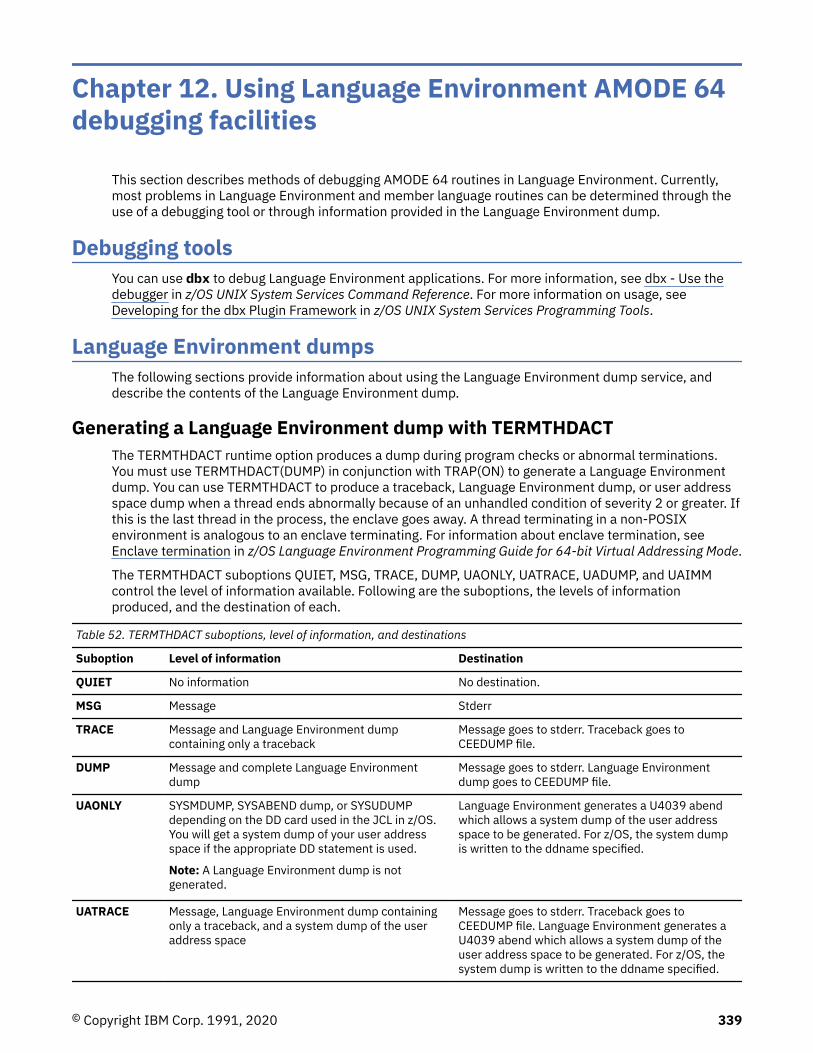
Chapter 12. Using Language Environment AMODE 64debugging facilities
This section describes methods of debugging AMODE 64 routines in Language Environment. Currently,most problems in Language Environment and member language routines can be determined through theuse of a debugging tool or through information provided in the Language Environment dump.
Debugging toolsYou can use dbx to debug Language Environment applications. For more information, see dbx - Use thedebugger in z/OS UNIX System Services Command Reference. For more information on usage, seeDeveloping for the dbx Plugin Framework in z/OS UNIX System Services Programming Tools.
Language Environment dumpsThe following sections provide information about using the Language Environment dump service, anddescribe the contents of the Language Environment dump.
Generating a Language Environment dump with TERMTHDACTThe TERMTHDACT runtime option produces a dump during program checks or abnormal terminations.You must use TERMTHDACT(DUMP) in conjunction with TRAP(ON) to generate a Language Environmentdump. You can use TERMTHDACT to produce a traceback, Language Environment dump, or user addressspace dump when a thread ends abnormally because of an unhandled condition of severity 2 or greater. Ifthis is the last thread in the process, the enclave goes away. A thread terminating in a non-POSIXenvironment is analogous to an enclave terminating. For information about enclave termination, seeEnclave termination in z/OS Language Environment Programming Guide for 64-bit Virtual Addressing Mode.
The TERMTHDACT suboptions QUIET, MSG, TRACE, DUMP, UAONLY, UATRACE, UADUMP, and UAIMMcontrol the level of information available. Following are the suboptions, the levels of informationproduced, and the destination of each.
Table 52. TERMTHDACT suboptions, level of information, and destinations
Suboption Level of information Destination
QUIET No information No destination.
MSG Message Stderr
TRACE Message and Language Environment dumpcontaining only a traceback
Message goes to stderr. Traceback goes toCEEDUMP file.
DUMP Message and complete Language Environmentdump
Message goes to stderr. Language Environmentdump goes to CEEDUMP file.
UAONLY SYSMDUMP, SYSABEND dump, or SYSUDUMPdepending on the DD card used in the JCL in z/OS.You will get a system dump of your user addressspace if the appropriate DD statement is used.
Note: A Language Environment dump is notgenerated.
Language Environment generates a U4039 abendwhich allows a system dump of the user addressspace to be generated. For z/OS, the system dumpis written to the ddname specified.
UATRACE Message, Language Environment dump containingonly a traceback, and a system dump of the useraddress space
Message goes to stderr. Traceback goes toCEEDUMP file. Language Environment generates aU4039 abend which allows a system dump of theuser address space to be generated. For z/OS, thesystem dump is written to the ddname specified.
© Copyright IBM Corp. 1991, 2020 339
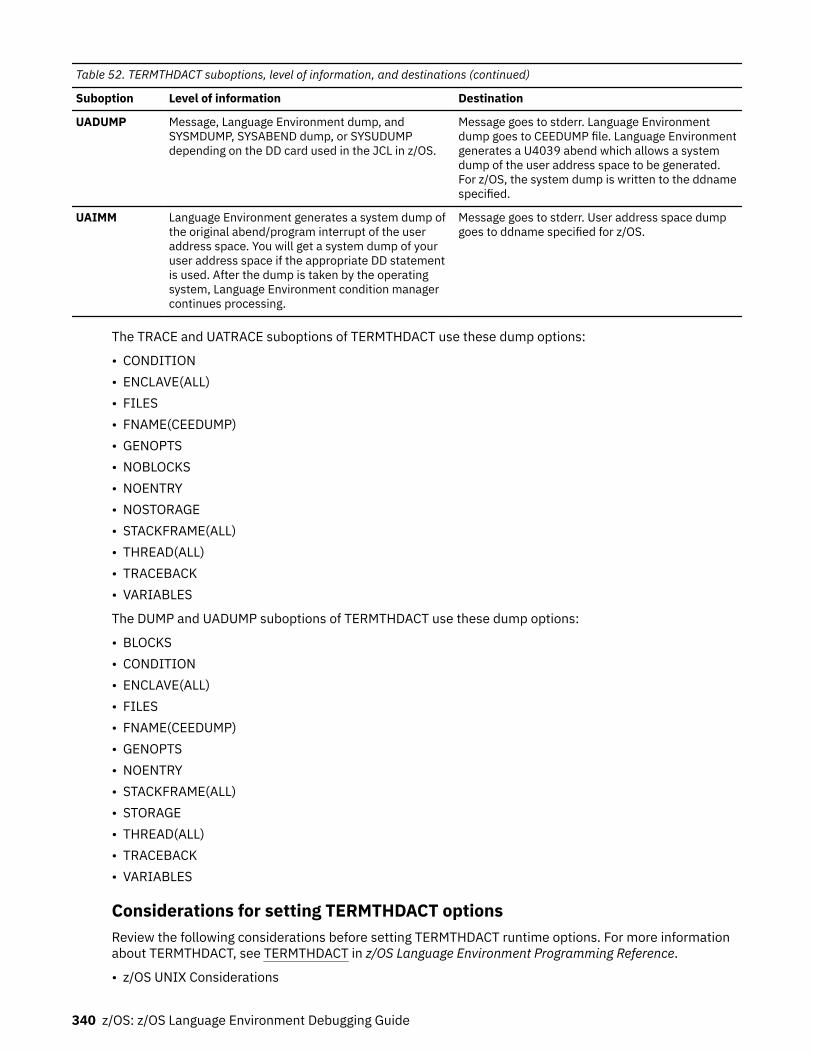
Table 52. TERMTHDACT suboptions, level of information, and destinations (continued)
Suboption Level of information Destination
UADUMP Message, Language Environment dump, andSYSMDUMP, SYSABEND dump, or SYSUDUMPdepending on the DD card used in the JCL in z/OS.
Message goes to stderr. Language Environmentdump goes to CEEDUMP file. Language Environmentgenerates a U4039 abend which allows a systemdump of the user address space to be generated.For z/OS, the system dump is written to the ddnamespecified.
UAIMM Language Environment generates a system dump ofthe original abend/program interrupt of the useraddress space. You will get a system dump of youruser address space if the appropriate DD statementis used. After the dump is taken by the operatingsystem, Language Environment condition managercontinues processing.
Message goes to stderr. User address space dumpgoes to ddname specified for z/OS.
The TRACE and UATRACE suboptions of TERMTHDACT use these dump options:
• CONDITION• ENCLAVE(ALL)• FILES• FNAME(CEEDUMP)• GENOPTS• NOBLOCKS• NOENTRY• NOSTORAGE• STACKFRAME(ALL)• THREAD(ALL)• TRACEBACK• VARIABLES
The DUMP and UADUMP suboptions of TERMTHDACT use these dump options:
• BLOCKS• CONDITION• ENCLAVE(ALL)• FILES• FNAME(CEEDUMP)• GENOPTS• NOENTRY• STACKFRAME(ALL)• STORAGE• THREAD(ALL)• TRACEBACK• VARIABLES
Considerations for setting TERMTHDACT optionsReview the following considerations before setting TERMTHDACT runtime options. For more informationabout TERMTHDACT, see TERMTHDACT in z/OS Language Environment Programming Reference.
• z/OS UNIX Considerations
340 z/OS: z/OS Language Environment Debugging Guide

– The TERMTHDACT option applies when a thread terminates abnormally. Abnormal termination of asingle thread causes termination of the entire enclave. If an unhandled condition of severity 2 orhigher percolates beyond the first routine's stack frame, the enclave terminates abnormally.
– If an enclave terminates due to a POSIX default signal action, then TERMTHDACT applies toconditions that result from software signals, program checks, or abends.
– If running under a shell and Language Environment generates a system dump, then a core dump isgenerated to a file based on the kernel environment variable, _BPXK_MDUMP.
• Preinitialized Environments for Authorized Programs Considerations
– The TERMTHDACT suboptions TRACE, DUMP, UADUMP, UATRACE are overridden to UAONLY.– For UAONLY, a U4039 abend is generated and an SVC dump of the U4039 abend with the following
title is taken:
COMPON=CEL,COMPID=568819801,ISSUER=CELAFRR ,MODULE=CELAEICT+????,ABEND=U4039,REASON=00000000
– For UAIMM, an SVC dump of the original abend/program interrupt with the following title is taken (theABEND and REASON values are those of the original abend/program interrupt):
COMPON=CEL,COMPID=568819801,ISSUER=CELAFRR ,MODULE=CELAEICT+????,ABEND=S00C9,REASON=00000009
Generating a Language Environment dump with language-specific functionsC/C++ routines can use the functions cdump(), csnap(), and ctrace() to produce a LanguageEnvironment dump. For more information on these functions, see “Generating a Language Environmentdump of a C/C++ routine” on page 442.
Understanding the Language Environment dumpThe Language Environment dump service generates output of data and storage from the LanguageEnvironment runtime environment on an enclave basis. This output contains the information needed todebug most basic routine errors.
Figure 165 on page 344 illustrates a dump for enclave main. The example shows full use of theTERMTHDACT dump options. Ellipses are used to summarize some sections of the dump and informationregarding unhandled conditions may not be present at all. Sections of the dump are numbered tocorrespond with the descriptions given in Figure 162 on page 342.
The CEE3DMP was generated by the C program CELQSAMP shown in Figure 162 on page 342. CELQSAMPuses the DLL CELQDLL shown in Figure 164 on page 343.
Chapter 12. Using Language Environment AMODE 64 debugging facilities 341
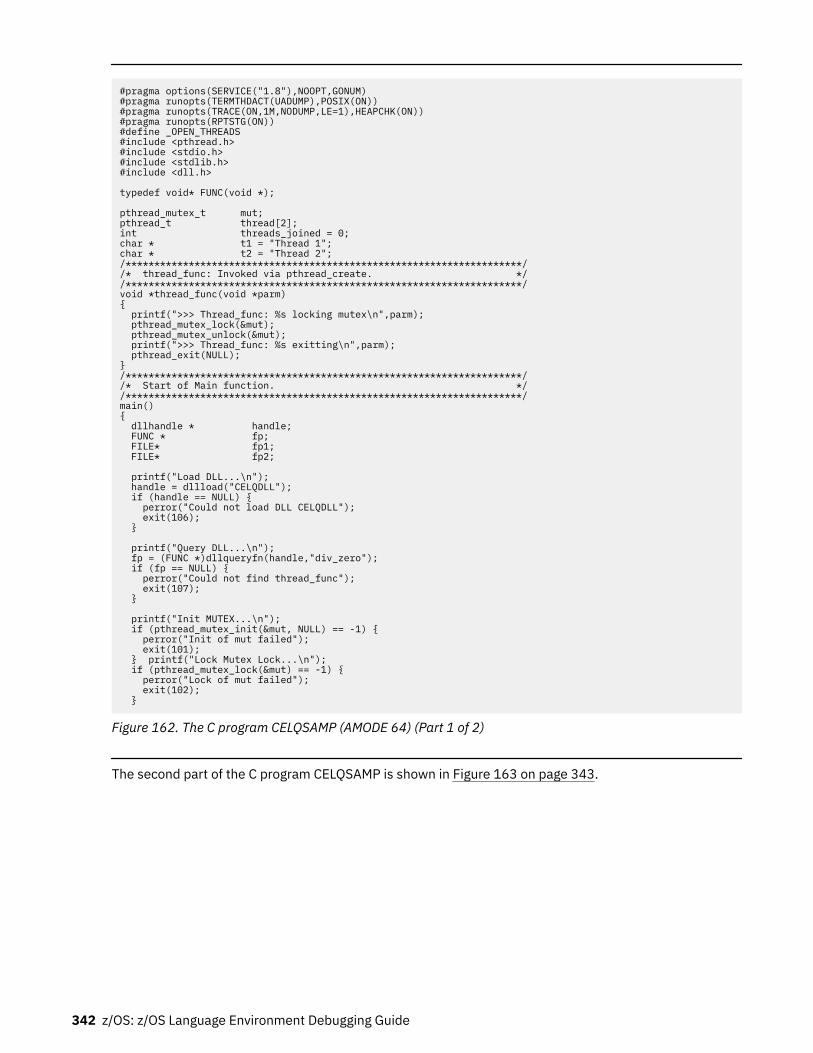
#pragma options(SERVICE("1.8"),NOOPT,GONUM)#pragma runopts(TERMTHDACT(UADUMP),POSIX(ON))#pragma runopts(TRACE(ON,1M,NODUMP,LE=1),HEAPCHK(ON))#pragma runopts(RPTSTG(ON))#define _OPEN_THREADS#include <pthread.h>#include <stdio.h>#include <stdlib.h>#include <dll.h>
typedef void* FUNC(void *);
pthread_mutex_t mut;pthread_t thread[2];int threads_joined = 0;char * t1 = "Thread 1";char * t2 = "Thread 2";/*********************************************************************//* thread_func: Invoked via pthread_create. *//*********************************************************************/void *thread_func(void *parm){ printf(">>> Thread_func: %s locking mutex\n",parm); pthread_mutex_lock(&mut); pthread_mutex_unlock(&mut); printf(">>> Thread_func: %s exitting\n",parm); pthread_exit(NULL);}/*********************************************************************//* Start of Main function. *//*********************************************************************/main(){ dllhandle * handle; FUNC * fp; FILE* fp1; FILE* fp2;
printf("Load DLL...\n"); handle = dllload("CELQDLL"); if (handle == NULL) { perror("Could not load DLL CELQDLL"); exit(106); }
printf("Query DLL...\n"); fp = (FUNC *)dllqueryfn(handle,"div_zero"); if (fp == NULL) { perror("Could not find thread_func"); exit(107); }
printf("Init MUTEX...\n"); if (pthread_mutex_init(&mut, NULL) == -1) { perror("Init of mut failed"); exit(101); } printf("Lock Mutex Lock...\n"); if (pthread_mutex_lock(&mut) == -1) { perror("Lock of mut failed"); exit(102); }
Figure 162. The C program CELQSAMP (AMODE 64) (Part 1 of 2)
The second part of the C program CELQSAMP is shown in Figure 163 on page 343.
342 z/OS: z/OS Language Environment Debugging Guide
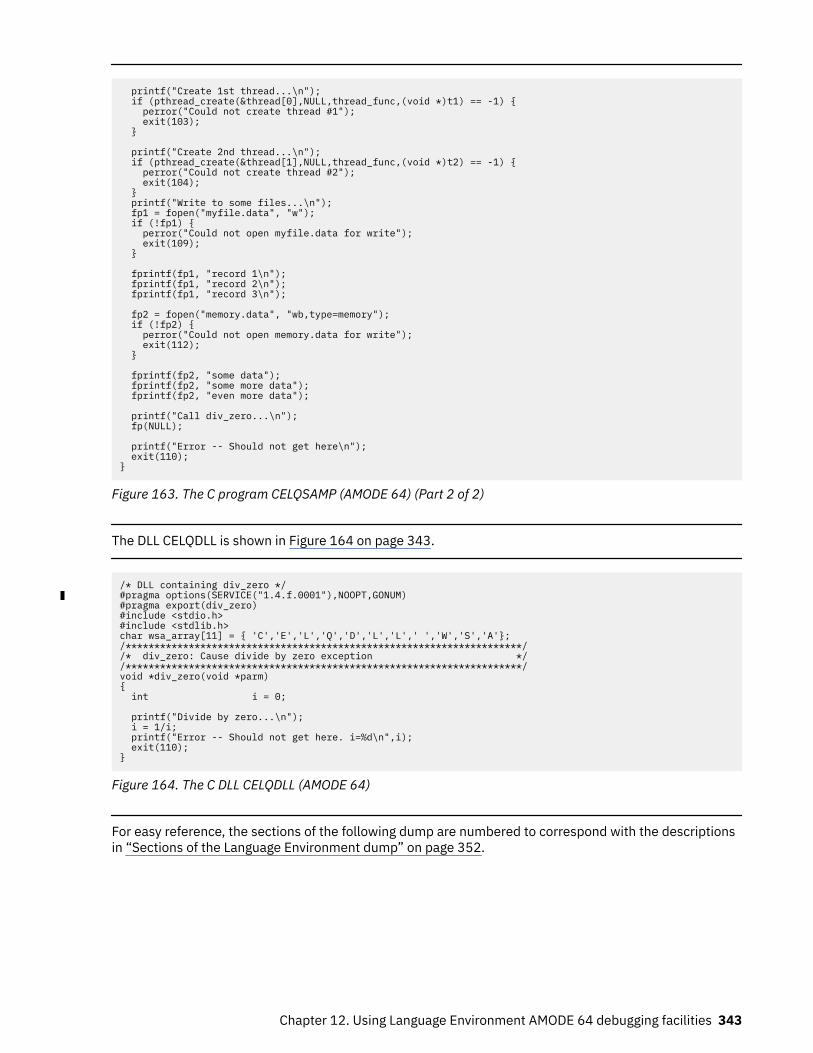
printf("Create 1st thread...\n"); if (pthread_create(&thread[0],NULL,thread_func,(void *)t1) == -1) { perror("Could not create thread #1"); exit(103); }
printf("Create 2nd thread...\n"); if (pthread_create(&thread[1],NULL,thread_func,(void *)t2) == -1) { perror("Could not create thread #2"); exit(104); } printf("Write to some files...\n"); fp1 = fopen("myfile.data", "w"); if (!fp1) { perror("Could not open myfile.data for write"); exit(109); }
fprintf(fp1, "record 1\n"); fprintf(fp1, "record 2\n"); fprintf(fp1, "record 3\n");
fp2 = fopen("memory.data", "wb,type=memory"); if (!fp2) { perror("Could not open memory.data for write"); exit(112); }
fprintf(fp2, "some data"); fprintf(fp2, "some more data"); fprintf(fp2, "even more data");
printf("Call div_zero...\n"); fp(NULL);
printf("Error -- Should not get here\n"); exit(110);}
Figure 163. The C program CELQSAMP (AMODE 64) (Part 2 of 2)
The DLL CELQDLL is shown in Figure 164 on page 343.
/* DLL containing div_zero */#pragma options(SERVICE("1.4.f.0001"),NOOPT,GONUM)#pragma export(div_zero)#include <stdio.h>#include <stdlib.h>char wsa_array[11] = { 'C','E','L','Q','D','L','L',' ','W','S','A'};/*********************************************************************//* div_zero: Cause divide by zero exception *//*********************************************************************/void *div_zero(void *parm){ int i = 0;
printf("Divide by zero...\n"); i = 1/i; printf("Error -- Should not get here. i=%d\n",i); exit(110);}
Figure 164. The C DLL CELQDLL (AMODE 64)
For easy reference, the sections of the following dump are numbered to correspond with the descriptionsin “Sections of the Language Environment dump” on page 352.
Chapter 12. Using Language Environment AMODE 64 debugging facilities 343
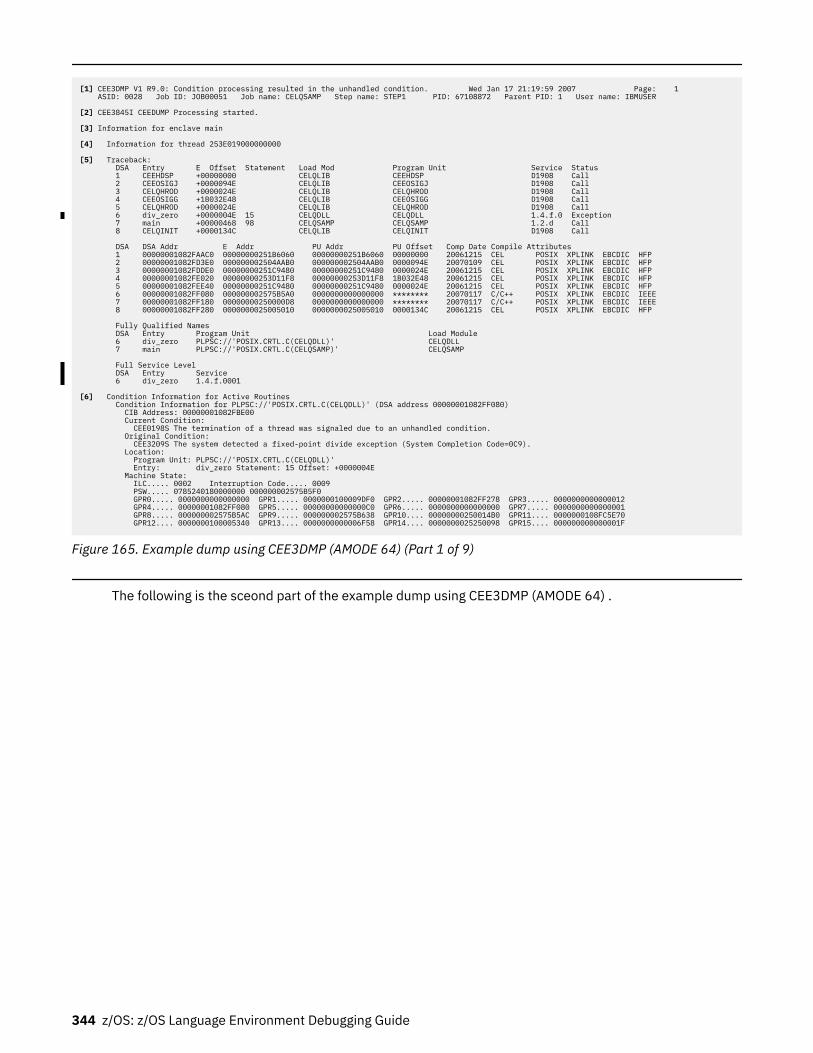
[1] CEE3DMP V1 R9.0: Condition processing resulted in the unhandled condition. Wed Jan 17 21:19:59 2007 Page: 1 ASID: 0028 Job ID: JOB00051 Job name: CELQSAMP Step name: STEP1 PID: 67108872 Parent PID: 1 User name: IBMUSER [2] CEE3845I CEEDUMP Processing started. [3] Information for enclave main [4] Information for thread 253E019000000000 [5] Traceback: DSA Entry E Offset Statement Load Mod Program Unit Service Status 1 CEEHDSP +00000000 CELQLIB CEEHDSP D1908 Call 2 CEEOSIGJ +0000094E CELQLIB CEEOSIGJ D1908 Call 3 CELQHROD +0000024E CELQLIB CELQHROD D1908 Call 4 CEEOSIGG +1B032E48 CELQLIB CEEOSIGG D1908 Call 5 CELQHROD +0000024E CELQLIB CELQHROD D1908 Call 6 div_zero +0000004E 15 CELQDLL CELQDLL 1.4.f.0 Exception 7 main +00000468 98 CELQSAMP CELQSAMP 1.2.d Call 8 CELQINIT +0000134C CELQLIB CELQINIT D1908 Call DSA DSA Addr E Addr PU Addr PU Offset Comp Date Compile Attributes 1 00000001082FAAC0 00000000251B6060 00000000251B6060 00000000 20061215 CEL POSIX XPLINK EBCDIC HFP 2 00000001082FD3E0 000000002504AAB0 000000002504AAB0 0000094E 20070109 CEL POSIX XPLINK EBCDIC HFP 3 00000001082FDDE0 00000000251C9480 00000000251C9480 0000024E 20061215 CEL POSIX XPLINK EBCDIC HFP 4 00000001082FE020 00000000253D11F8 00000000253D11F8 1B032E48 20061215 CEL POSIX XPLINK EBCDIC HFP 5 00000001082FEE40 00000000251C9480 00000000251C9480 0000024E 20061215 CEL POSIX XPLINK EBCDIC HFP 6 00000001082FF080 000000002575B5A0 0000000000000000 ******** 20070117 C/C++ POSIX XPLINK EBCDIC IEEE 7 00000001082FF180 00000000250000D8 0000000000000000 ******** 20070117 C/C++ POSIX XPLINK EBCDIC IEEE 8 00000001082FF280 0000000025005010 0000000025005010 0000134C 20061215 CEL POSIX XPLINK EBCDIC HFP Fully Qualified Names DSA Entry Program Unit Load Module 6 div_zero PLPSC://'POSIX.CRTL.C(CELQDLL)' CELQDLL 7 main PLPSC://'POSIX.CRTL.C(CELQSAMP)' CELQSAMP
Full Service Level DSA Entry Service 6 div_zero 1.4.f.0001
[6] Condition Information for Active Routines Condition Information for PLPSC://'POSIX.CRTL.C(CELQDLL)' (DSA address 00000001082FF080) CIB Address: 00000001082FBE00 Current Condition: CEE0198S The termination of a thread was signaled due to an unhandled condition. Original Condition: CEE3209S The system detected a fixed-point divide exception (System Completion Code=0C9). Location: Program Unit: PLPSC://'POSIX.CRTL.C(CELQDLL)' Entry: div_zero Statement: 15 Offset: +0000004E Machine State: ILC..... 0002 Interruption Code..... 0009 PSW..... 0785240180000000 000000002575B5F0 GPR0..... 0000000000000000 GPR1..... 0000000100009DF0 GPR2..... 00000001082FF278 GPR3..... 0000000000000012 GPR4..... 00000001082FF080 GPR5..... 00000000000000C0 GPR6..... 0000000000000000 GPR7..... 0000000000000001 GPR8..... 000000002575B5AC GPR9..... 000000002575B638 GPR10.... 00000000250014B0 GPR11.... 0000000108FC5E70 GPR12.... 0000000100005340 GPR13.... 0000000000006F58 GPR14.... 0000000025250098 GPR15.... 000000000000001F
Figure 165. Example dump using CEE3DMP (AMODE 64) (Part 1 of 9)
The following is the sceond part of the example dump using CEE3DMP (AMODE 64) .
344 z/OS: z/OS Language Environment Debugging Guide
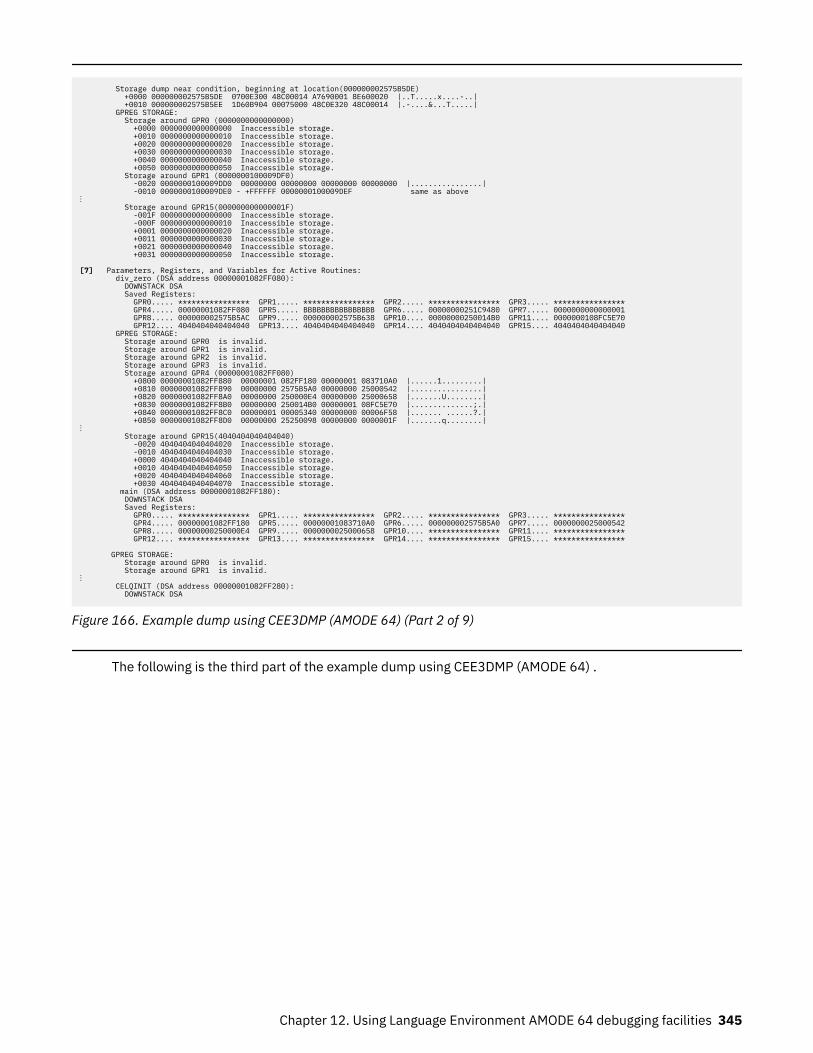
Storage dump near condition, beginning at location(000000002575B5DE) +0000 000000002575B5DE 0700E300 48C00014 A7690001 8E600020 |..T.....x....-..| +0010 000000002575B5EE 1D60B904 00075000 48C0E320 48C00014 |.-....&...T.....| GPREG STORAGE: Storage around GPR0 (0000000000000000) +0000 0000000000000000 Inaccessible storage. +0010 0000000000000010 Inaccessible storage. +0020 0000000000000020 Inaccessible storage. +0030 0000000000000030 Inaccessible storage. +0040 0000000000000040 Inaccessible storage. +0050 0000000000000050 Inaccessible storage. Storage around GPR1 (0000000100009DF0) -0020 0000000100009DD0 00000000 00000000 00000000 00000000 |................| -0010 0000000100009DE0 - +FFFFFF 0000000100009DEF same as above⋮ Storage around GPR15(000000000000001F) -001F 0000000000000000 Inaccessible storage. -000F 0000000000000010 Inaccessible storage. +0001 0000000000000020 Inaccessible storage. +0011 0000000000000030 Inaccessible storage. +0021 0000000000000040 Inaccessible storage. +0031 0000000000000050 Inaccessible storage.
[7] Parameters, Registers, and Variables for Active Routines: div_zero (DSA address 00000001082FF080): DOWNSTACK DSA Saved Registers: GPR0..... **************** GPR1..... **************** GPR2..... **************** GPR3..... **************** GPR4..... 00000001082FF080 GPR5..... BBBBBBBBBBBBBBBB GPR6..... 00000000251C9480 GPR7..... 0000000000000001 GPR8..... 000000002575B5AC GPR9..... 000000002575B638 GPR10.... 00000000250014B0 GPR11.... 0000000108FC5E70 GPR12.... 4040404040404040 GPR13.... 4040404040404040 GPR14.... 4040404040404040 GPR15.... 4040404040404040 GPREG STORAGE: Storage around GPR0 is invalid. Storage around GPR1 is invalid. Storage around GPR2 is invalid. Storage around GPR3 is invalid. Storage around GPR4 (00000001082FF080) +0800 00000001082FF880 00000001 082FF180 00000001 083710A0 |......1.........| +0810 00000001082FF890 00000000 2575B5A0 00000000 25000542 |................| +0820 00000001082FF8A0 00000000 250000E4 00000000 25000658 |.......U........| +0830 00000001082FF8B0 00000000 250014B0 00000001 08FC5E70 |..............;.| +0840 00000001082FF8C0 00000001 00005340 00000000 00006F58 |....... ......?.| +0850 00000001082FF8D0 00000000 25250098 00000000 0000001F |.......q........|⋮ Storage around GPR15(4040404040404040) -0020 4040404040404020 Inaccessible storage. -0010 4040404040404030 Inaccessible storage. +0000 4040404040404040 Inaccessible storage. +0010 4040404040404050 Inaccessible storage. +0020 4040404040404060 Inaccessible storage. +0030 4040404040404070 Inaccessible storage. main (DSA address 00000001082FF180): DOWNSTACK DSA Saved Registers: GPR0..... **************** GPR1..... **************** GPR2..... **************** GPR3..... **************** GPR4..... 00000001082FF180 GPR5..... 00000001083710A0 GPR6..... 000000002575B5A0 GPR7..... 0000000025000542 GPR8..... 00000000250000E4 GPR9..... 0000000025000658 GPR10.... **************** GPR11.... **************** GPR12.... **************** GPR13.... **************** GPR14.... **************** GPR15.... ****************
GPREG STORAGE: Storage around GPR0 is invalid. Storage around GPR1 is invalid.⋮ CELQINIT (DSA address 00000001082FF280): DOWNSTACK DSA
Figure 166. Example dump using CEE3DMP (AMODE 64) (Part 2 of 9)
The following is the third part of the example dump using CEE3DMP (AMODE 64) .
Chapter 12. Using Language Environment AMODE 64 debugging facilities 345
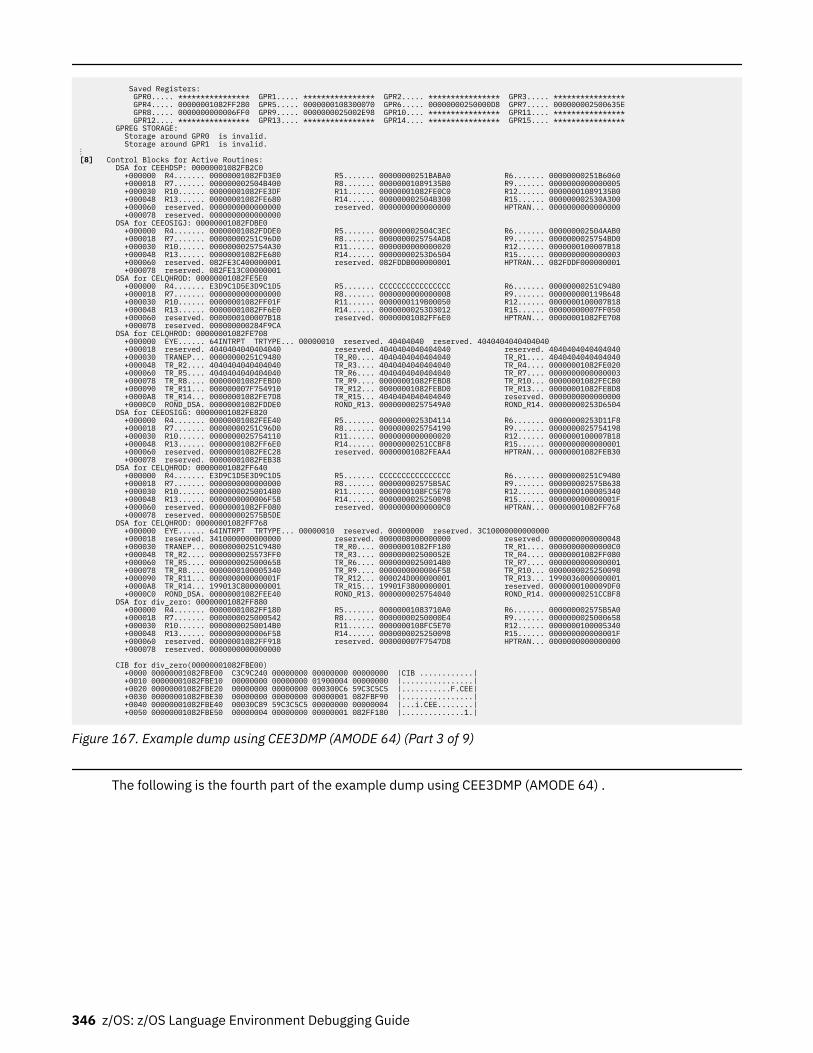
Saved Registers: GPR0..... **************** GPR1..... **************** GPR2..... **************** GPR3..... **************** GPR4..... 00000001082FF280 GPR5..... 0000000108300070 GPR6..... 00000000250000D8 GPR7..... 000000002500635E GPR8..... 0000000000006FF0 GPR9..... 0000000025002E98 GPR10.... **************** GPR11.... **************** GPR12.... **************** GPR13.... **************** GPR14.... **************** GPR15.... **************** GPREG STORAGE: Storage around GPR0 is invalid. Storage around GPR1 is invalid.⋮[8] Control Blocks for Active Routines: DSA for CEEHDSP: 00000001082FB2C0 +000000 R4....... 00000001082FD3E0 R5....... 00000000251BABA0 R6....... 00000000251B6060 +000018 R7....... 000000002504B400 R8....... 00000001089135B0 R9....... 0000000000000005 +000030 R10...... 00000001082FE3DF R11...... 00000001082FE0C0 R12...... 00000001089135B0 +000048 R13...... 00000001082FE680 R14...... 000000002504B300 R15...... 000000002530A300 +000060 reserved. 0000000000000000 reserved. 0000000000000000 HPTRAN... 0000000000000000 +000078 reserved. 0000000000000000 DSA for CEEOSIGJ: 00000001082FDBE0 +000000 R4....... 00000001082FDDE0 R5....... 000000002504C3EC R6....... 000000002504AAB0 +000018 R7....... 00000000251C96D0 R8....... 0000000025754AD8 R9....... 0000000025754BD0 +000030 R10...... 0000000025754A30 R11...... 0000000000000020 R12...... 0000000100007B18 +000048 R13...... 00000001082FE680 R14...... 00000000253D6504 R15...... 0000000000000003 +000060 reserved. 082FE3C400000001 reserved. 082FDDB000000001 HPTRAN... 082FDDF000000001 +000078 reserved. 082FE13C00000001 DSA for CELQHROD: 00000001082FE5E0 +000000 R4....... E3D9C1D5E3D9C1D5 R5....... CCCCCCCCCCCCCCCC R6....... 00000000251C9480 +000018 R7....... 0000000000000000 R8....... 0000000000000008 R9....... 000000000119B648 +000030 R10...... 00000001082FF01F R11...... 0000000119B00050 R12...... 0000000100007B18 +000048 R13...... 00000001082FF6E0 R14...... 00000000253D3012 R15...... 00000000007FF050 +000060 reserved. 0000000100007B18 reserved. 00000001082FF6E0 HPTRAN... 00000001082FE708 +000078 reserved. 000000000284F9CA DSA for CELQHROD: 00000001082FE708 +000000 EYE...... 64INTRPT TRTYPE... 00000010 reserved. 40404040 reserved. 4040404040404040 +000018 reserved. 4040404040404040 reserved. 4040404040404040 reserved. 4040404040404040 +000030 TRANEP... 00000000251C9480 TR_R0.... 4040404040404040 TR_R1.... 4040404040404040 +000048 TR_R2.... 4040404040404040 TR_R3.... 4040404040404040 TR_R4.... 00000001082FE020 +000060 TR_R5.... 4040404040404040 TR_R6.... 4040404040404040 TR_R7.... 0000000000000003 +000078 TR_R8.... 00000001082FEBD0 TR_R9.... 00000001082FEBD8 TR_R10... 00000001082FECB0 +000090 TR_R11... 000000007F754910 TR_R12... 00000001082FEBD0 TR_R13... 00000001082FEBD8 +0000A8 TR_R14... 00000001082FE7D8 TR_R15... 4040404040404040 reserved. 0000000000000000 +0000C0 ROND_DSA. 00000001082FDDE0 ROND_R13. 00000000257549A0 ROND_R14. 00000000253D6504 DSA for CEEOSIGG: 00000001082FE820 +000000 R4....... 00000001082FEE40 R5....... 00000000253D4114 R6....... 00000000253D11F8 +000018 R7....... 00000000251C96D0 R8....... 0000000025754190 R9....... 0000000025754198 +000030 R10...... 0000000025754110 R11...... 0000000000000020 R12...... 0000000100007B18 +000048 R13...... 00000001082FF6E0 R14...... 00000000251CCBF8 R15...... 0000000000000001 +000060 reserved. 00000001082FEC28 reserved. 00000001082FEAA4 HPTRAN... 00000001082FEB30 +000078 reserved. 00000001082FEB38 DSA for CELQHROD: 00000001082FF640 +000000 R4....... E3D9C1D5E3D9C1D5 R5....... CCCCCCCCCCCCCCCC R6....... 00000000251C9480 +000018 R7....... 0000000000000000 R8....... 000000002575B5AC R9....... 000000002575B638 +000030 R10...... 00000000250014B0 R11...... 0000000108FC5E70 R12...... 0000000100005340 +000048 R13...... 0000000000006F58 R14...... 0000000025250098 R15...... 000000000000001F +000060 reserved. 00000001082FF080 reserved. 00000000000000C0 HPTRAN... 00000001082FF768 +000078 reserved. 000000002575B5DE DSA for CELQHROD: 00000001082FF768 +000000 EYE...... 64INTRPT TRTYPE... 00000010 reserved. 00000000 reserved. 3C10000000000000 +000018 reserved. 3410000000000000 reserved. 0000008000000000 reserved. 0000000000000048 +000030 TRANEP... 00000000251C9480 TR_R0.... 00000001082FF180 TR_R1.... 00000000000000C0 +000048 TR_R2.... 0000000025573FF0 TR_R3.... 000000002500052E TR_R4.... 00000001082FF080 +000060 TR_R5.... 0000000025000658 TR_R6.... 00000000250014B0 TR_R7.... 0000000000000001 +000078 TR_R8.... 0000000100005340 TR_R9.... 0000000000006F58 TR_R10... 0000000025250098 +000090 TR_R11... 000000000000001F TR_R12... 000024D000000001 TR_R13... 1990036000000001 +0000A8 TR_R14... 199013C800000001 TR_R15... 19901F3800000001 reserved. 0000000100009DF0 +0000C0 ROND_DSA. 00000001082FEE40 ROND_R13. 0000000025754040 ROND_R14. 00000000251CCBF8 DSA for div_zero: 00000001082FF880 +000000 R4....... 00000001082FF180 R5....... 00000001083710A0 R6....... 000000002575B5A0 +000018 R7....... 0000000025000542 R8....... 00000000250000E4 R9....... 0000000025000658 +000030 R10...... 00000000250014B0 R11...... 0000000108FC5E70 R12...... 0000000100005340 +000048 R13...... 0000000000006F58 R14...... 0000000025250098 R15...... 000000000000001F +000060 reserved. 00000001082FF918 reserved. 000000007F7547D8 HPTRAN... 0000000000000000 +000078 reserved. 0000000000000000
CIB for div_zero(00000001082FBE00) +0000 00000001082FBE00 C3C9C240 00000000 00000000 00000000 |CIB ............| +0010 00000001082FBE10 00000000 00000000 01900004 00000000 |................| +0020 00000001082FBE20 00000000 00000000 000300C6 59C3C5C5 |...........F.CEE| +0030 00000001082FBE30 00000000 00000000 00000001 082FBF90 |................| +0040 00000001082FBE40 00030C89 59C3C5C5 00000000 00000004 |...i.CEE........| +0050 00000001082FBE50 00000004 00000000 00000001 082FF180 |..............1.|
Figure 167. Example dump using CEE3DMP (AMODE 64) (Part 3 of 9)
The following is the fourth part of the example dump using CEE3DMP (AMODE 64) .
346 z/OS: z/OS Language Environment Debugging Guide
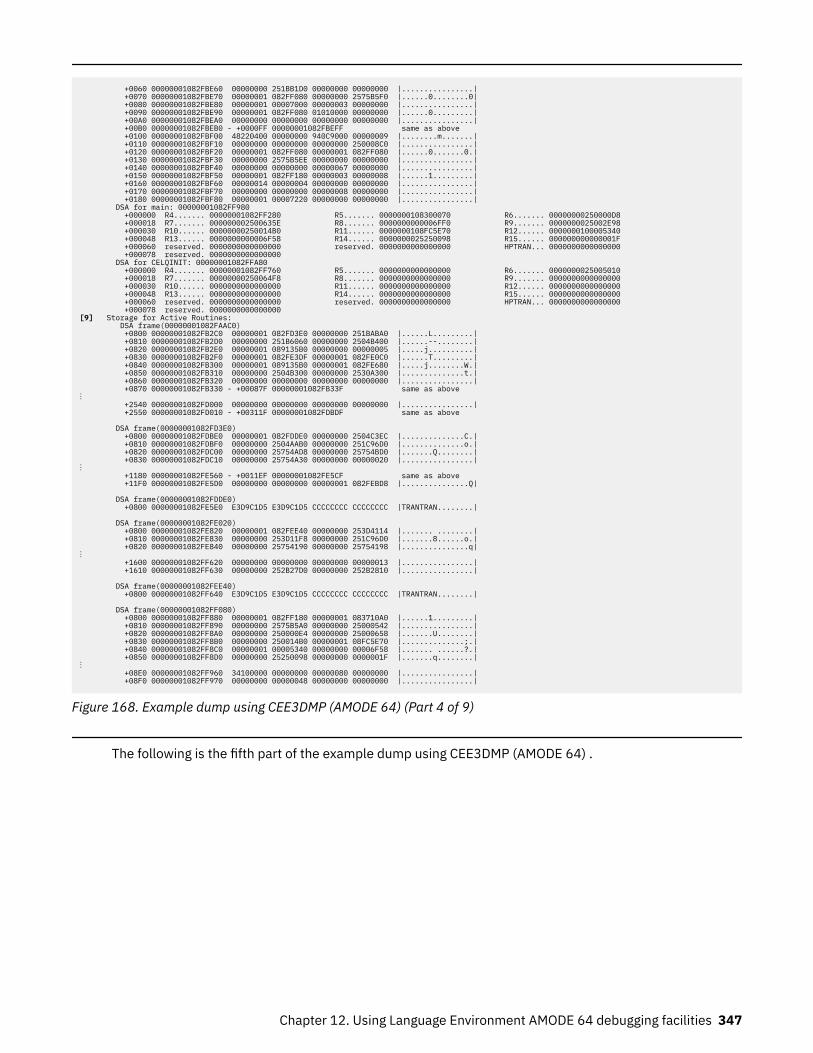
+0060 00000001082FBE60 00000000 251BB1D0 00000000 00000000 |................| +0070 00000001082FBE70 00000001 082FF080 00000000 2575B5F0 |......0........0| +0080 00000001082FBE80 00000001 00007000 00000003 00000000 |................| +0090 00000001082FBE90 00000001 082FF080 01010000 00000000 |......0.........| +00A0 00000001082FBEA0 00000000 00000000 00000000 00000000 |................| +00B0 00000001082FBEB0 - +0000FF 00000001082FBEFF same as above +0100 00000001082FBF00 48220400 00000000 940C9000 00000009 |........m.......| +0110 00000001082FBF10 00000000 00000000 00000000 250008C0 |................| +0120 00000001082FBF20 00000001 082FF080 00000001 082FF080 |......0.......0.| +0130 00000001082FBF30 00000000 2575B5EE 00000000 00000000 |................| +0140 00000001082FBF40 00000000 00000000 00000067 00000000 |................| +0150 00000001082FBF50 00000001 082FF180 00000003 00000008 |......1.........| +0160 00000001082FBF60 00000014 00000004 00000000 00000000 |................| +0170 00000001082FBF70 00000000 00000000 00000008 00000000 |................| +0180 00000001082FBF80 00000001 00007220 00000000 00000000 |................| DSA for main: 00000001082FF980 +000000 R4....... 00000001082FF280 R5....... 0000000108300070 R6....... 00000000250000D8 +000018 R7....... 000000002500635E R8....... 0000000000006FF0 R9....... 0000000025002E98 +000030 R10...... 00000000250014B0 R11...... 0000000108FC5E70 R12...... 0000000100005340 +000048 R13...... 0000000000006F58 R14...... 0000000025250098 R15...... 000000000000001F +000060 reserved. 0000000000000000 reserved. 0000000000000000 HPTRAN... 0000000000000000 +000078 reserved. 0000000000000000 DSA for CELQINIT: 00000001082FFA80 +000000 R4....... 00000001082FF760 R5....... 0000000000000000 R6....... 0000000025005010 +000018 R7....... 00000000250064F8 R8....... 0000000000000000 R9....... 0000000000000000 +000030 R10...... 0000000000000000 R11...... 0000000000000000 R12...... 0000000000000000 +000048 R13...... 0000000000000000 R14...... 0000000000000000 R15...... 0000000000000000 +000060 reserved. 0000000000000000 reserved. 0000000000000000 HPTRAN... 0000000000000000 +000078 reserved. 0000000000000000[9] Storage for Active Routines: DSA frame(00000001082FAAC0) +0800 00000001082FB2C0 00000001 082FD3E0 00000000 251BABA0 |......L.........| +0810 00000001082FB2D0 00000000 251B6060 00000000 2504B400 |......--........| +0820 00000001082FB2E0 00000001 089135B0 00000000 00000005 |.....j..........| +0830 00000001082FB2F0 00000001 082FE3DF 00000001 082FE0C0 |......T.........| +0840 00000001082FB300 00000001 089135B0 00000001 082FE680 |.....j........W.| +0850 00000001082FB310 00000000 2504B300 00000000 2530A300 |..............t.| +0860 00000001082FB320 00000000 00000000 00000000 00000000 |................| +0870 00000001082FB330 - +00087F 00000001082FB33F same as above⋮ +2540 00000001082FD000 00000000 00000000 00000000 00000000 |................| +2550 00000001082FD010 - +00311F 00000001082FDBDF same as above DSA frame(00000001082FD3E0) +0800 00000001082FDBE0 00000001 082FDDE0 00000000 2504C3EC |..............C.| +0810 00000001082FDBF0 00000000 2504AAB0 00000000 251C96D0 |..............o.| +0820 00000001082FDC00 00000000 25754AD8 00000000 25754BD0 |.......Q........| +0830 00000001082FDC10 00000000 25754A30 00000000 00000020 |................|⋮ +1180 00000001082FE560 - +0011EF 00000001082FE5CF same as above +11F0 00000001082FE5D0 00000000 00000000 00000001 082FEBD8 |...............Q| DSA frame(00000001082FDDE0) +0800 00000001082FE5E0 E3D9C1D5 E3D9C1D5 CCCCCCCC CCCCCCCC |TRANTRAN........| DSA frame(00000001082FE020) +0800 00000001082FE820 00000001 082FEE40 00000000 253D4114 |....... ........| +0810 00000001082FE830 00000000 253D11F8 00000000 251C96D0 |.......8......o.| +0820 00000001082FE840 00000000 25754190 00000000 25754198 |...............q|⋮ +1600 00000001082FF620 00000000 00000000 00000000 00000013 |................| +1610 00000001082FF630 00000000 252B27D0 00000000 252B2810 |................| DSA frame(00000001082FEE40) +0800 00000001082FF640 E3D9C1D5 E3D9C1D5 CCCCCCCC CCCCCCCC |TRANTRAN........|
DSA frame(00000001082FF080) +0800 00000001082FF880 00000001 082FF180 00000001 083710A0 |......1.........| +0810 00000001082FF890 00000000 2575B5A0 00000000 25000542 |................| +0820 00000001082FF8A0 00000000 250000E4 00000000 25000658 |.......U........| +0830 00000001082FF8B0 00000000 250014B0 00000001 08FC5E70 |..............;.| +0840 00000001082FF8C0 00000001 00005340 00000000 00006F58 |....... ......?.| +0850 00000001082FF8D0 00000000 25250098 00000000 0000001F |.......q........|⋮ +08E0 00000001082FF960 34100000 00000000 00000080 00000000 |................| +08F0 00000001082FF970 00000000 00000048 00000000 00000000 |................|
Figure 168. Example dump using CEE3DMP (AMODE 64) (Part 4 of 9)
The following is the fifth part of the example dump using CEE3DMP (AMODE 64) .
Chapter 12. Using Language Environment AMODE 64 debugging facilities 347
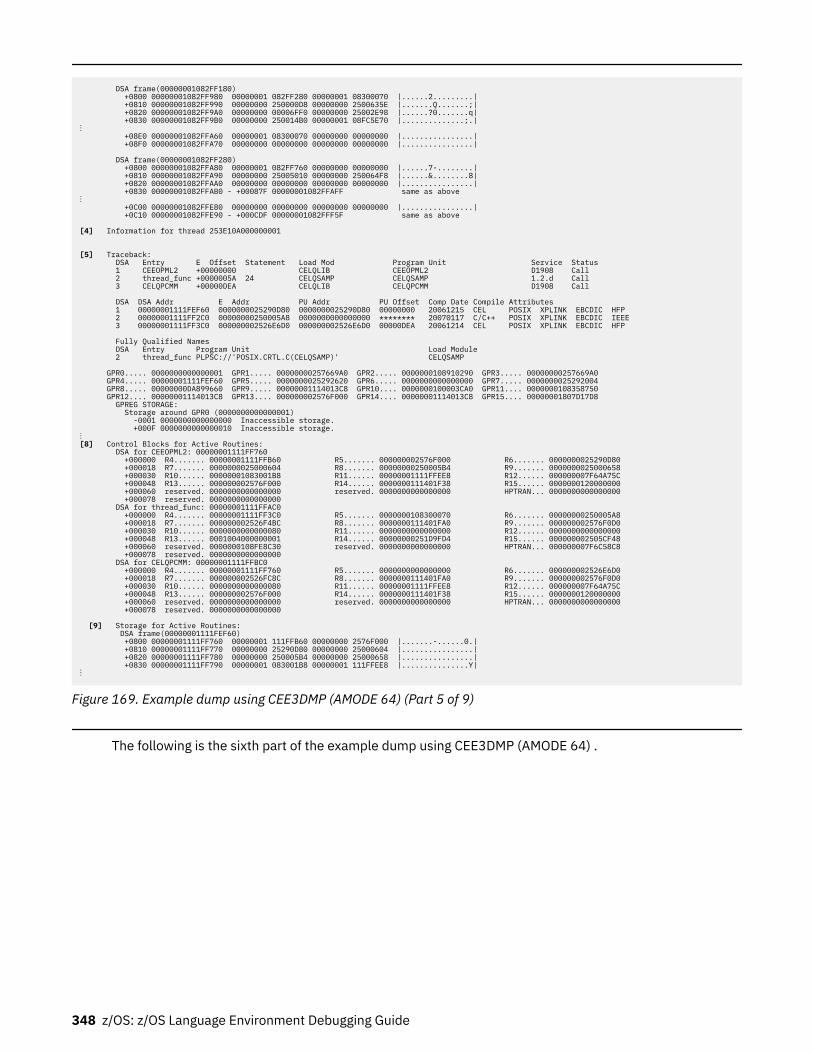
DSA frame(00000001082FF180) +0800 00000001082FF980 00000001 082FF280 00000001 08300070 |......2.........| +0810 00000001082FF990 00000000 250000D8 00000000 2500635E |.......Q.......;| +0820 00000001082FF9A0 00000000 00006FF0 00000000 25002E98 |......?0.......q| +0830 00000001082FF9B0 00000000 250014B0 00000001 08FC5E70 |..............;.|⋮ +08E0 00000001082FFA60 00000001 08300070 00000000 00000000 |................| +08F0 00000001082FFA70 00000000 00000000 00000000 00000000 |................| DSA frame(00000001082FF280) +0800 00000001082FFA80 00000001 082FF760 00000000 00000000 |......7-........| +0810 00000001082FFA90 00000000 25005010 00000000 250064F8 |......&........8| +0820 00000001082FFAA0 00000000 00000000 00000000 00000000 |................| +0830 00000001082FFAB0 - +00087F 00000001082FFAFF same as above⋮ +0C00 00000001082FFE80 00000000 00000000 00000000 00000000 |................| +0C10 00000001082FFE90 - +000CDF 00000001082FFF5F same as above
[4] Information for thread 253E10A000000001
[5] Traceback: DSA Entry E Offset Statement Load Mod Program Unit Service Status 1 CEEOPML2 +00000000 CELQLIB CEEOPML2 D1908 Call 2 thread_func +0000005A 24 CELQSAMP CELQSAMP 1.2.d Call 3 CELQPCMM +00000DEA CELQLIB CELQPCMM D1908 Call DSA DSA Addr E Addr PU Addr PU Offset Comp Date Compile Attributes 1 00000001111FEF60 0000000025290D80 0000000025290D80 00000000 20061215 CEL POSIX XPLINK EBCDIC HFP 2 00000001111FF2C0 00000000250005A8 0000000000000000 ******** 20070117 C/C++ POSIX XPLINK EBCDIC IEEE 3 00000001111FF3C0 000000002526E6D0 000000002526E6D0 00000DEA 20061214 CEL POSIX XPLINK EBCDIC HFP Fully Qualified Names DSA Entry Program Unit Load Module 2 thread_func PLPSC://'POSIX.CRTL.C(CELQSAMP)' CELQSAMP GPR0..... 0000000000000001 GPR1..... 00000000257669A0 GPR2..... 0000000108910290 GPR3..... 00000000257669A0 GPR4..... 00000001111FEF60 GPR5..... 0000000025292620 GPR6..... 0000000000000000 GPR7..... 0000000025292004 GPR8..... 00000000DA899660 GPR9..... 00000001114013C8 GPR10.... 0000000100003CA0 GPR11.... 0000000108358750 GPR12.... 00000001114013C8 GPR13.... 000000002576F000 GPR14.... 00000001114013C8 GPR15.... 00000001807D17D8 GPREG STORAGE: Storage around GPR0 (0000000000000001) -0001 0000000000000000 Inaccessible storage. +000F 0000000000000010 Inaccessible storage.⋮[8] Control Blocks for Active Routines: DSA for CEEOPML2: 00000001111FF760 +000000 R4....... 00000001111FFB60 R5....... 000000002576F000 R6....... 0000000025290D80 +000018 R7....... 0000000025000604 R8....... 00000000250005B4 R9....... 0000000025000658 +000030 R10...... 00000001083001B8 R11...... 00000001111FFEE8 R12...... 000000007F64A75C +000048 R13...... 000000002576F000 R14...... 0000000111401F38 R15...... 0000000120000000 +000060 reserved. 0000000000000000 reserved. 0000000000000000 HPTRAN... 0000000000000000 +000078 reserved. 0000000000000000 DSA for thread_func: 00000001111FFAC0 +000000 R4....... 00000001111FF3C0 R5....... 0000000108300070 R6....... 00000000250005A8 +000018 R7....... 000000002526F4BC R8....... 0000000111401FA0 R9....... 000000002576F0D0 +000030 R10...... 0000000000000080 R11...... 0000000000000000 R12...... 0000000000000000 +000048 R13...... 0001004000000001 R14...... 00000000251D9FD4 R15...... 000000002505CF48 +000060 reserved. 0000000108FE8C30 reserved. 0000000000000000 HPTRAN... 000000007F6C58C8 +000078 reserved. 0000000000000000 DSA for CELQPCMM: 00000001111FFBC0 +000000 R4....... 00000001111FF760 R5....... 0000000000000000 R6....... 000000002526E6D0 +000018 R7....... 000000002526FC8C R8....... 0000000111401FA0 R9....... 000000002576F0D0 +000030 R10...... 0000000000000080 R11...... 00000001111FFEE8 R12...... 000000007F64A75C +000048 R13...... 000000002576F000 R14...... 0000000111401F38 R15...... 0000000120000000 +000060 reserved. 0000000000000000 reserved. 0000000000000000 HPTRAN... 0000000000000000 +000078 reserved. 0000000000000000
[9] Storage for Active Routines: DSA frame(00000001111FEF60) +0800 00000001111FF760 00000001 111FFB60 00000000 2576F000 |.......-......0.| +0810 00000001111FF770 00000000 25290D80 00000000 25000604 |................| +0820 00000001111FF780 00000000 250005B4 00000000 25000658 |................| +0830 00000001111FF790 00000001 083001B8 00000001 111FFEE8 |...............Y|⋮
Figure 169. Example dump using CEE3DMP (AMODE 64) (Part 5 of 9)
The following is the sixth part of the example dump using CEE3DMP (AMODE 64) .
348 z/OS: z/OS Language Environment Debugging Guide
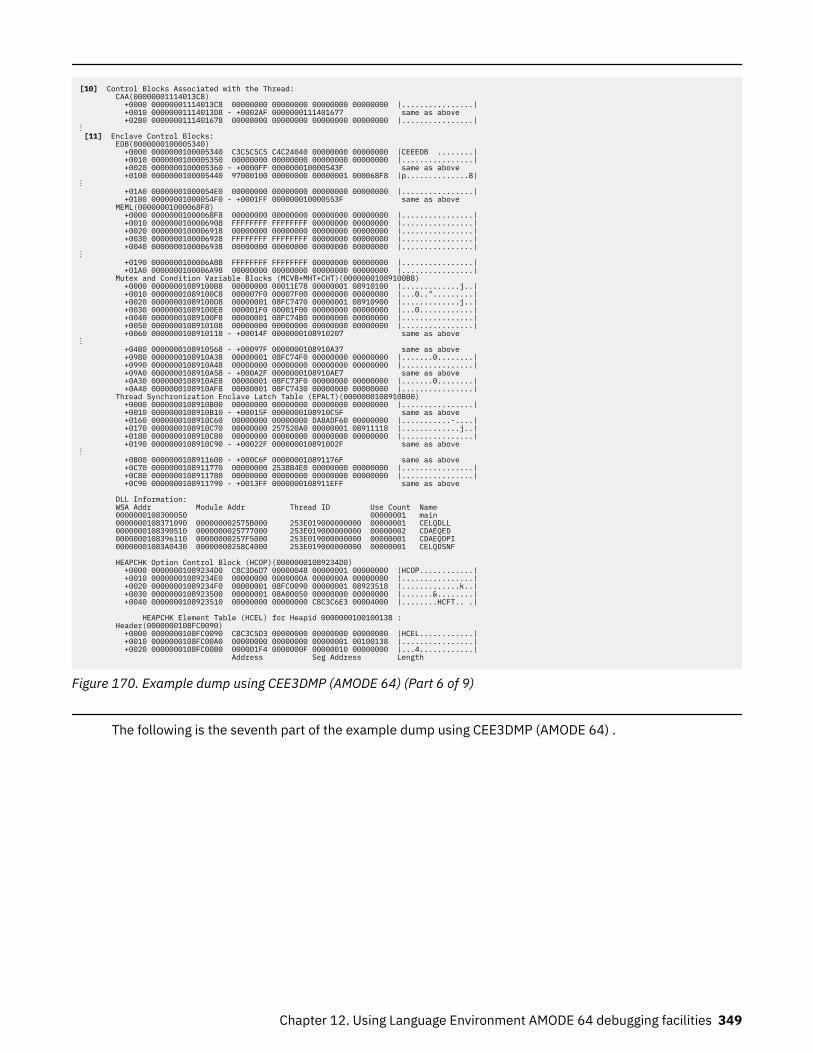
[10] Control Blocks Associated with the Thread: CAA(00000001114013C8) +0000 00000001114013C8 00000000 00000000 00000000 00000000 |................| +0010 00000001114013D8 - +0002AF 0000000111401677 same as above +02B0 0000000111401678 00008000 00000000 00000000 00000000 |................|⋮ [11] Enclave Control Blocks: EDB(0000000100005340) +0000 0000000100005340 C3C5C5C5 C4C24040 00000000 00000000 |CEEEDB ........| +0010 0000000100005350 00000000 00000000 00000000 00000000 |................| +0020 0000000100005360 - +0000FF 000000010000543F same as above +0100 0000000100005440 97000100 00000000 00000001 000068F8 |p..............8|⋮ +01A0 00000001000054E0 00000000 00000000 00000000 00000000 |................| +01B0 00000001000054F0 - +0001FF 000000010000553F same as above MEML(00000001000068F8) +0000 00000001000068F8 00000000 00000000 00000000 00000000 |................| +0010 0000000100006908 FFFFFFFF FFFFFFFF 00000000 00000000 |................| +0020 0000000100006918 00000000 00000000 00000000 00000000 |................| +0030 0000000100006928 FFFFFFFF FFFFFFFF 00000000 00000000 |................| +0040 0000000100006938 00000000 00000000 00000000 00000000 |................|⋮ +0190 0000000100006A88 FFFFFFFF FFFFFFFF 00000000 00000000 |................| +01A0 0000000100006A98 00000000 00000000 00000000 00000000 |................| Mutex and Condition Variable Blocks (MCVB+MHT+CHT)(00000001089100B8) +0000 00000001089100B8 00000000 00011E78 00000001 08910100 |.............j..| +0010 00000001089100C8 000007F0 00007F00 00000000 00000000 |...0..".........| +0020 00000001089100D8 00000001 08FC7470 00000001 08910900 |.............j..| +0030 00000001089100E8 000001F0 00001F00 00000000 00000000 |...0............| +0040 00000001089100F8 00000001 08FC74B0 00000000 00000000 |................| +0050 0000000108910108 00000000 00000000 00000000 00000000 |................| +0060 0000000108910118 - +00014F 0000000108910207 same as above⋮ +04B0 0000000108910568 - +00097F 0000000108910A37 same as above +0980 0000000108910A38 00000001 08FC74F0 00000000 00000000 |.......0........| +0990 0000000108910A48 00000000 00000000 00000000 00000000 |................| +09A0 0000000108910A58 - +000A2F 0000000108910AE7 same as above +0A30 0000000108910AE8 00000001 08FC73F0 00000000 00000000 |.......0........| +0A40 0000000108910AF8 00000001 08FC7430 00000000 00000000 |................| Thread Synchronization Enclave Latch Table (EPALT)(0000000108910B00) +0000 0000000108910B00 00000000 00000000 00000000 00000000 |................| +0010 0000000108910B10 - +00015F 0000000108910C5F same as above +0160 0000000108910C60 00000000 00000000 DA8ADF60 00000000 |...........-....| +0170 0000000108910C70 00000000 257520A0 00000001 08911118 |.............j..| +0180 0000000108910C80 00000000 00000000 00000000 00000000 |................| +0190 0000000108910C90 - +00022F 0000000108910D2F same as above⋮ +0B00 0000000108911600 - +000C6F 000000010891176F same as above +0C70 0000000108911770 00000000 2538B4E0 00000000 00000000 |................| +0C80 0000000108911780 00000000 00000000 00000000 00000000 |................| +0C90 0000000108911790 - +0013FF 0000000108911EFF same as above DLL Information: WSA Addr Module Addr Thread ID Use Count Name 0000000108300050 00000001 main 0000000108371090 000000002575B000 253E019000000000 00000001 CELQDLL 0000000108390510 0000000025777000 253E019000000000 00000002 CDAEQED 0000000108396110 00000000257F5000 253E019000000000 00000001 CDAEQDPI 00000001083A0430 00000000258C4000 253E019000000000 00000001 CELQDSNF HEAPCHK Option Control Block (HCOP)(00000001089234D0) +0000 00000001089234D0 C8C3D6D7 00000048 00000001 00000000 |HCOP............| +0010 00000001089234E0 00000000 0000000A 0000000A 00000000 |................| +0020 00000001089234F0 00000001 08FC0090 00000001 08923518 |.............k..| +0030 0000000108923500 00000001 08A00050 00000000 00000000 |.......&........| +0040 0000000108923510 00000000 00000000 C8C3C6E3 00004000 |........HCFT.. .|
HEAPCHK Element Table (HCEL) for Heapid 0000000100100138 : Header(0000000108FC0090) +0000 0000000108FC0090 C8C3C5D3 00000000 00000000 00000000 |HCEL............| +0010 0000000108FC00A0 00000000 00000000 00000001 00100138 |................| +0020 0000000108FC00B0 000001F4 0000000F 00000010 00000000 |...4............| Address Seg Address Length
Figure 170. Example dump using CEE3DMP (AMODE 64) (Part 6 of 9)
The following is the seventh part of the example dump using CEE3DMP (AMODE 64) .
Chapter 12. Using Language Environment AMODE 64 debugging facilities 349
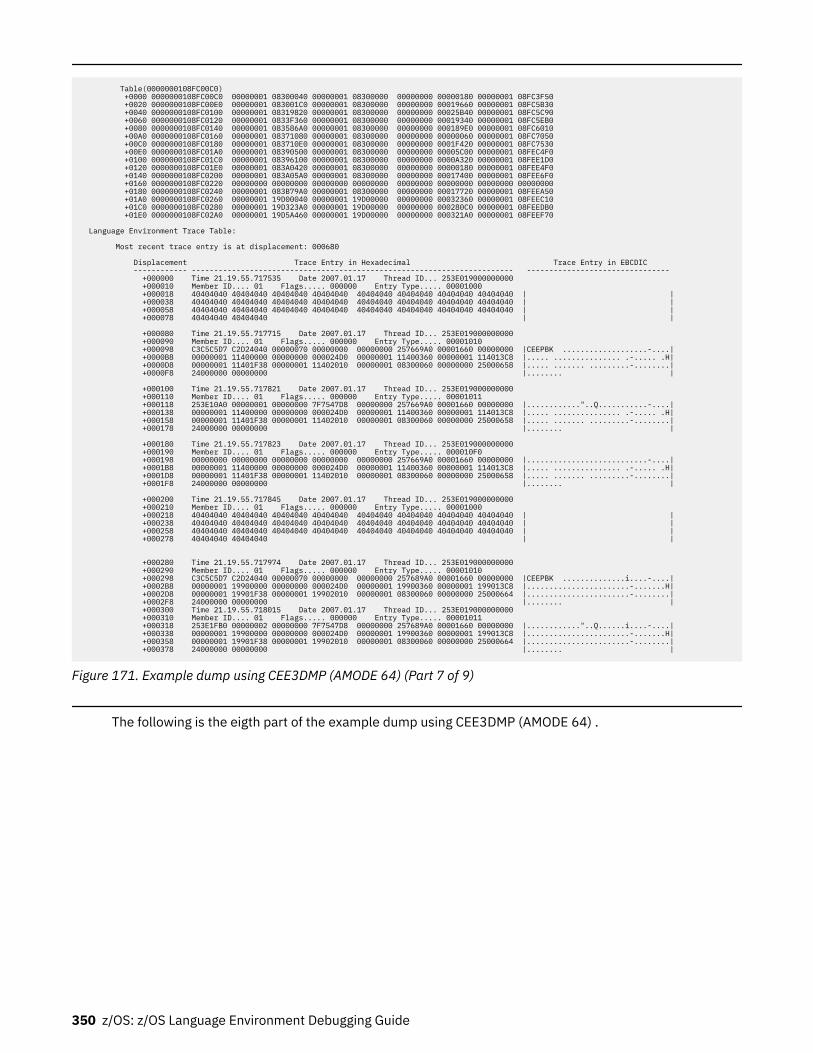
Table(0000000108FC00C0) +0000 0000000108FC00C0 00000001 08300040 00000001 08300000 00000000 00000180 00000001 08FC3F50 +0020 0000000108FC00E0 00000001 083001C0 00000001 08300000 00000000 00019660 00000001 08FC5B30 +0040 0000000108FC0100 00000001 08319820 00000001 08300000 00000000 00025B40 00000001 08FC5C90 +0060 0000000108FC0120 00000001 0833F360 00000001 08300000 00000000 00019340 00000001 08FC5EB0 +0080 0000000108FC0140 00000001 083586A0 00000001 08300000 00000000 000189E0 00000001 08FC6010 +00A0 0000000108FC0160 00000001 08371080 00000001 08300000 00000000 00000060 00000001 08FC7050 +00C0 0000000108FC0180 00000001 083710E0 00000001 08300000 00000000 0001F420 00000001 08FC7530 +00E0 0000000108FC01A0 00000001 08390500 00000001 08300000 00000000 00005C00 00000001 08FEC4F0 +0100 0000000108FC01C0 00000001 08396100 00000001 08300000 00000000 0000A320 00000001 08FEE1D0 +0120 0000000108FC01E0 00000001 083A0420 00000001 08300000 00000000 00000180 00000001 08FEE4F0 +0140 0000000108FC0200 00000001 083A05A0 00000001 08300000 00000000 00017400 00000001 08FEE6F0 +0160 0000000108FC0220 00000000 00000000 00000000 00000000 00000000 00000000 00000000 00000000 +0180 0000000108FC0240 00000001 083B79A0 00000001 08300000 00000000 00017720 00000001 08FEEA50 +01A0 0000000108FC0260 00000001 19D00040 00000001 19D00000 00000000 00032360 00000001 08FEEC10 +01C0 0000000108FC0280 00000001 19D323A0 00000001 19D00000 00000000 000280C0 00000001 08FEEDB0 +01E0 0000000108FC02A0 00000001 19D5A460 00000001 19D00000 00000000 000321A0 00000001 08FEEF70
Language Environment Trace Table: Most recent trace entry is at displacement: 000680 Displacement Trace Entry in Hexadecimal Trace Entry in EBCDIC ------------ ------------------------------------------------------------------------ -------------------------------- +000000 Time 21.19.55.717535 Date 2007.01.17 Thread ID... 253E019000000000 +000010 Member ID.... 01 Flags..... 000000 Entry Type..... 00001000 +000018 40404040 40404040 40404040 40404040 40404040 40404040 40404040 40404040 | | +000038 40404040 40404040 40404040 40404040 40404040 40404040 40404040 40404040 | | +000058 40404040 40404040 40404040 40404040 40404040 40404040 40404040 40404040 | | +000078 40404040 40404040 | | +000080 Time 21.19.55.717715 Date 2007.01.17 Thread ID... 253E019000000000 +000090 Member ID.... 01 Flags..... 000000 Entry Type..... 00001010 +000098 C3C5C5D7 C2D24040 00000070 00000000 00000000 257669A0 00001660 00000000 |CEEPBK ...................-....| +0000B8 00000001 11400000 00000000 000024D0 00000001 11400360 00000001 114013C8 |..... ............... .-..... .H| +0000D8 00000001 11401F38 00000001 11402010 00000001 08300060 00000000 25000658 |..... ....... .........-........| +0000F8 24000000 00000000 |........ | +000100 Time 21.19.55.717821 Date 2007.01.17 Thread ID... 253E019000000000 +000110 Member ID.... 01 Flags..... 000000 Entry Type..... 00001011 +000118 253E10A0 00000001 00000000 7F7547D8 00000000 257669A0 00001660 00000000 |............"..Q...........-....| +000138 00000001 11400000 00000000 000024D0 00000001 11400360 00000001 114013C8 |..... ............... .-..... .H| +000158 00000001 11401F38 00000001 11402010 00000001 08300060 00000000 25000658 |..... ....... .........-........| +000178 24000000 00000000 |........ | +000180 Time 21.19.55.717823 Date 2007.01.17 Thread ID... 253E019000000000 +000190 Member ID.... 01 Flags..... 000000 Entry Type..... 000010F0 +000198 00000000 00000000 00000000 00000000 00000000 257669A0 00001660 00000000 |...........................-....| +0001B8 00000001 11400000 00000000 000024D0 00000001 11400360 00000001 114013C8 |..... ............... .-..... .H| +0001D8 00000001 11401F38 00000001 11402010 00000001 08300060 00000000 25000658 |..... ....... .........-........| +0001F8 24000000 00000000 |........ | +000200 Time 21.19.55.717845 Date 2007.01.17 Thread ID... 253E019000000000 +000210 Member ID.... 01 Flags..... 000000 Entry Type..... 00001000 +000218 40404040 40404040 40404040 40404040 40404040 40404040 40404040 40404040 | | +000238 40404040 40404040 40404040 40404040 40404040 40404040 40404040 40404040 | | +000258 40404040 40404040 40404040 40404040 40404040 40404040 40404040 40404040 | | +000278 40404040 40404040 | |
+000280 Time 21.19.55.717974 Date 2007.01.17 Thread ID... 253E019000000000 +000290 Member ID.... 01 Flags..... 000000 Entry Type..... 00001010 +000298 C3C5C5D7 C2D24040 00000070 00000000 00000000 257689A0 00001660 00000000 |CEEPBK ..............i....-....| +0002B8 00000001 19900000 00000000 000024D0 00000001 19900360 00000001 199013C8 |.......................-.......H| +0002D8 00000001 19901F38 00000001 19902010 00000001 08300060 00000000 25000664 |.......................-........| +0002F8 24000000 00000000 |........ | +000300 Time 21.19.55.718015 Date 2007.01.17 Thread ID... 253E019000000000 +000310 Member ID.... 01 Flags..... 000000 Entry Type..... 00001011 +000318 253E1FB0 00000002 00000000 7F7547D8 00000000 257689A0 00001660 00000000 |............"..Q......i....-....| +000338 00000001 19900000 00000000 000024D0 00000001 19900360 00000001 199013C8 |.......................-.......H| +000358 00000001 19901F38 00000001 19902010 00000001 08300060 00000000 25000664 |.......................-........| +000378 24000000 00000000 |........ |
Figure 171. Example dump using CEE3DMP (AMODE 64) (Part 7 of 9)
The following is the eigth part of the example dump using CEE3DMP (AMODE 64) .
350 z/OS: z/OS Language Environment Debugging Guide
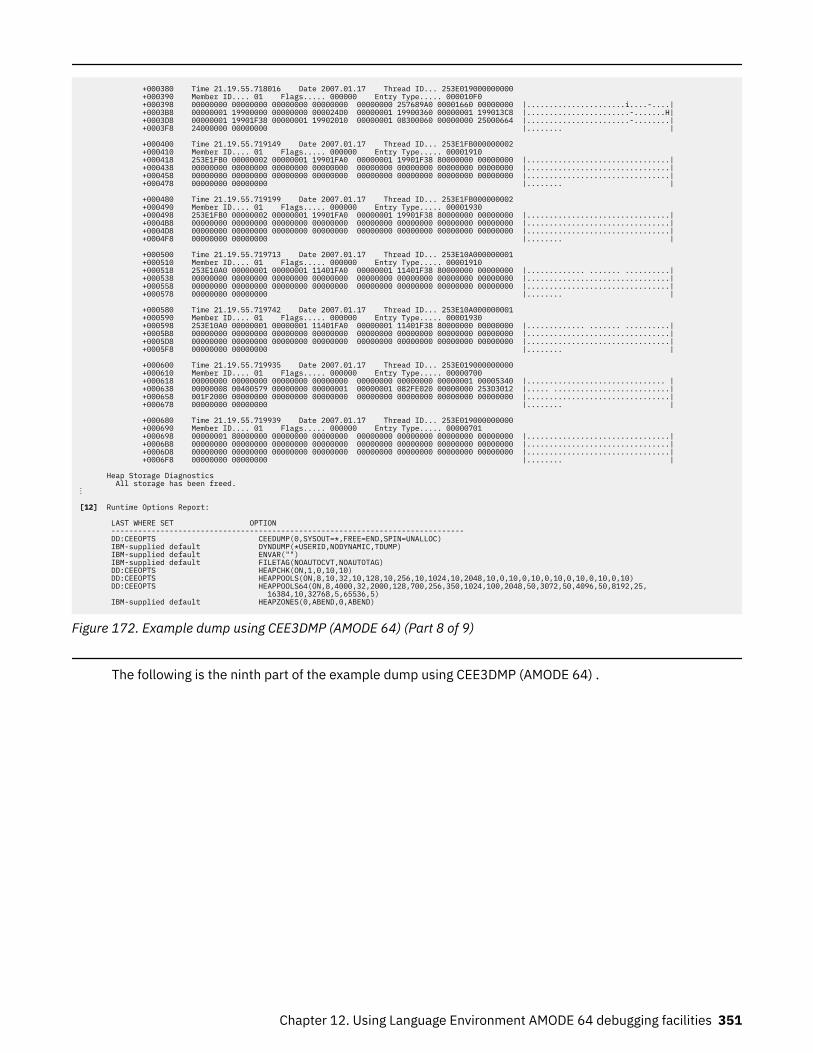
+000380 Time 21.19.55.718016 Date 2007.01.17 Thread ID... 253E019000000000 +000390 Member ID.... 01 Flags..... 000000 Entry Type..... 000010F0 +000398 00000000 00000000 00000000 00000000 00000000 257689A0 00001660 00000000 |......................i....-....| +0003B8 00000001 19900000 00000000 000024D0 00000001 19900360 00000001 199013C8 |.......................-.......H| +0003D8 00000001 19901F38 00000001 19902010 00000001 08300060 00000000 25000664 |.......................-........| +0003F8 24000000 00000000 |........ | +000400 Time 21.19.55.719149 Date 2007.01.17 Thread ID... 253E1FB000000002 +000410 Member ID.... 01 Flags..... 000000 Entry Type..... 00001910 +000418 253E1FB0 00000002 00000001 19901FA0 00000001 19901F38 80000000 00000000 |................................| +000438 00000000 00000000 00000000 00000000 00000000 00000000 00000000 00000000 |................................| +000458 00000000 00000000 00000000 00000000 00000000 00000000 00000000 00000000 |................................| +000478 00000000 00000000 |........ | +000480 Time 21.19.55.719199 Date 2007.01.17 Thread ID... 253E1FB000000002 +000490 Member ID.... 01 Flags..... 000000 Entry Type..... 00001930 +000498 253E1FB0 00000002 00000001 19901FA0 00000001 19901F38 80000000 00000000 |................................| +0004B8 00000000 00000000 00000000 00000000 00000000 00000000 00000000 00000000 |................................| +0004D8 00000000 00000000 00000000 00000000 00000000 00000000 00000000 00000000 |................................| +0004F8 00000000 00000000 |........ | +000500 Time 21.19.55.719713 Date 2007.01.17 Thread ID... 253E10A000000001 +000510 Member ID.... 01 Flags..... 000000 Entry Type..... 00001910 +000518 253E10A0 00000001 00000001 11401FA0 00000001 11401F38 80000000 00000000 |............. ....... ..........| +000538 00000000 00000000 00000000 00000000 00000000 00000000 00000000 00000000 |................................| +000558 00000000 00000000 00000000 00000000 00000000 00000000 00000000 00000000 |................................| +000578 00000000 00000000 |........ | +000580 Time 21.19.55.719742 Date 2007.01.17 Thread ID... 253E10A000000001 +000590 Member ID.... 01 Flags..... 000000 Entry Type..... 00001930 +000598 253E10A0 00000001 00000001 11401FA0 00000001 11401F38 80000000 00000000 |............. ....... ..........| +0005B8 00000000 00000000 00000000 00000000 00000000 00000000 00000000 00000000 |................................| +0005D8 00000000 00000000 00000000 00000000 00000000 00000000 00000000 00000000 |................................| +0005F8 00000000 00000000 |........ | +000600 Time 21.19.55.719935 Date 2007.01.17 Thread ID... 253E019000000000 +000610 Member ID.... 01 Flags..... 000000 Entry Type..... 00000700 +000618 00000000 00000000 00000000 00000000 00000000 00000000 00000001 00005340 |............................... | +000638 00000008 00400579 00000000 00000001 00000001 082FE020 00000000 253D3012 |..... ..........................| +000658 001F2000 00000000 00000000 00000000 00000000 00000000 00000000 00000000 |................................| +000678 00000000 00000000 |........ |
+000680 Time 21.19.55.719939 Date 2007.01.17 Thread ID... 253E019000000000 +000690 Member ID.... 01 Flags..... 000000 Entry Type..... 00000701 +000698 00000001 80000000 00000000 00000000 00000000 00000000 00000000 00000000 |................................| +0006B8 00000000 00000000 00000000 00000000 00000000 00000000 00000000 00000000 |................................| +0006D8 00000000 00000000 00000000 00000000 00000000 00000000 00000000 00000000 |................................| +0006F8 00000000 00000000 |........ | Heap Storage Diagnostics All storage has been freed.⋮
[12] Runtime Options Report: LAST WHERE SET OPTION ------------------------------------------------------------------------------- DD:CEEOPTS CEEDUMP(0,SYSOUT=*,FREE=END,SPIN=UNALLOC) IBM-supplied default DYNDUMP(*USERID,NODYNAMIC,TDUMP) IBM-supplied default ENVAR("") IBM-supplied default FILETAG(NOAUTOCVT,NOAUTOTAG) DD:CEEOPTS HEAPCHK(ON,1,0,10,10) DD:CEEOPTS HEAPPOOLS(ON,8,10,32,10,128,10,256,10,1024,10,2048,10,0,10,0,10,0,10,0,10,0,10,0,10) DD:CEEOPTS HEAPPOOLS64(ON,8,4000,32,2000,128,700,256,350,1024,100,2048,50,3072,50,4096,50,8192,25, 16384,10,32768,5,65536,5) IBM-supplied default HEAPZONES(0,ABEND,0,ABEND)
Figure 172. Example dump using CEE3DMP (AMODE 64) (Part 8 of 9)
The following is the ninth part of the example dump using CEE3DMP (AMODE 64) .
Chapter 12. Using Language Environment AMODE 64 debugging facilities 351
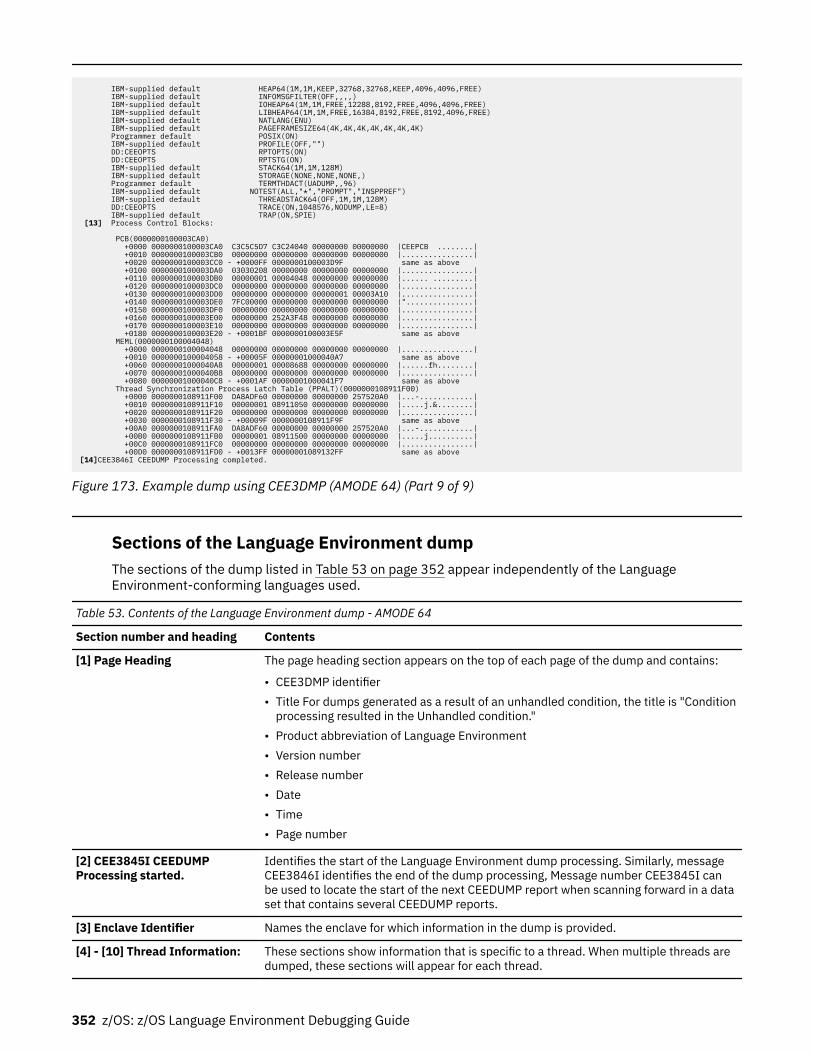
IBM-supplied default HEAP64(1M,1M,KEEP,32768,32768,KEEP,4096,4096,FREE) IBM-supplied default INFOMSGFILTER(OFF,,,,) IBM-supplied default IOHEAP64(1M,1M,FREE,12288,8192,FREE,4096,4096,FREE) IBM-supplied default LIBHEAP64(1M,1M,FREE,16384,8192,FREE,8192,4096,FREE) IBM-supplied default NATLANG(ENU) IBM-supplied default PAGEFRAMESIZE64(4K,4K,4K,4K,4K,4K,4K) Programmer default POSIX(ON) IBM-supplied default PROFILE(OFF,"") DD:CEEOPTS RPTOPTS(ON) DD:CEEOPTS RPTSTG(ON) IBM-supplied default STACK64(1M,1M,128M) IBM-supplied default STORAGE(NONE,NONE,NONE,) Programmer default TERMTHDACT(UADUMP,,96) IBM-supplied default NOTEST(ALL,"*","PROMPT","INSPPREF") IBM-supplied default THREADSTACK64(OFF,1M,1M,128M) DD:CEEOPTS TRACE(ON,1048576,NODUMP,LE=8) IBM-supplied default TRAP(ON,SPIE) [13] Process Control Blocks: PCB(0000000100003CA0) +0000 0000000100003CA0 C3C5C5D7 C3C24040 00000000 00000000 |CEEPCB ........| +0010 0000000100003CB0 00000000 00000000 00000000 00000000 |................| +0020 0000000100003CC0 - +0000FF 0000000100003D9F same as above +0100 0000000100003DA0 03030208 00000000 00000000 00000000 |................| +0110 0000000100003DB0 00000001 00004048 00000000 00000000 |...... .........| +0120 0000000100003DC0 00000000 00000000 00000000 00000000 |................| +0130 0000000100003DD0 00000000 00000000 00000001 00003A10 |................| +0140 0000000100003DE0 7FC00000 00000000 00000000 00000000 |"...............| +0150 0000000100003DF0 00000000 00000000 00000000 00000000 |................| +0160 0000000100003E00 00000000 252A3F48 00000000 00000000 |................| +0170 0000000100003E10 00000000 00000000 00000000 00000000 |................| +0180 0000000100003E20 - +0001BF 0000000100003E5F same as above MEML(0000000100004048) +0000 0000000100004048 00000000 00000000 00000000 00000000 |................| +0010 0000000100004058 - +00005F 00000001000040A7 same as above +0060 00000001000040A8 00000001 00008688 00000000 00000000 |......fh........| +0070 00000001000040B8 00000000 00000000 00000000 00000000 |................| +0080 00000001000040C8 - +0001AF 00000001000041F7 same as above Thread Synchronization Process Latch Table (PPALT)(0000000108911F00) +0000 0000000108911F00 DA8ADF60 00000000 00000000 257520A0 |...-............| +0010 0000000108911F10 00000001 08911050 00000000 00000000 |.....j.&........| +0020 0000000108911F20 00000000 00000000 00000000 00000000 |................| +0030 0000000108911F30 - +00009F 0000000108911F9F same as above +00A0 0000000108911FA0 DA8ADF60 00000000 00000000 257520A0 |...-............| +00B0 0000000108911FB0 00000001 08911500 00000000 00000000 |.....j..........| +00C0 0000000108911FC0 00000000 00000000 00000000 00000000 |................| +00D0 0000000108911FD0 - +0013FF 00000001089132FF same as above[14]CEE3846I CEEDUMP Processing completed.
Figure 173. Example dump using CEE3DMP (AMODE 64) (Part 9 of 9)
Sections of the Language Environment dumpThe sections of the dump listed in Table 53 on page 352 appear independently of the LanguageEnvironment-conforming languages used.
Table 53. Contents of the Language Environment dump - AMODE 64
Section number and heading Contents
[1] Page Heading The page heading section appears on the top of each page of the dump and contains:
• CEE3DMP identifier• Title For dumps generated as a result of an unhandled condition, the title is "Condition
processing resulted in the Unhandled condition."• Product abbreviation of Language Environment• Version number • Release number • Date • Time • Page number
[2] CEE3845I CEEDUMPProcessing started.
Identifies the start of the Language Environment dump processing. Similarly, messageCEE3846I identifies the end of the dump processing, Message number CEE3845I canbe used to locate the start of the next CEEDUMP report when scanning forward in a dataset that contains several CEEDUMP reports.
[3] Enclave Identifier Names the enclave for which information in the dump is provided.
[4] - [10] Thread Information: These sections show information that is specific to a thread. When multiple threads aredumped, these sections will appear for each thread.
352 z/OS: z/OS Language Environment Debugging Guide
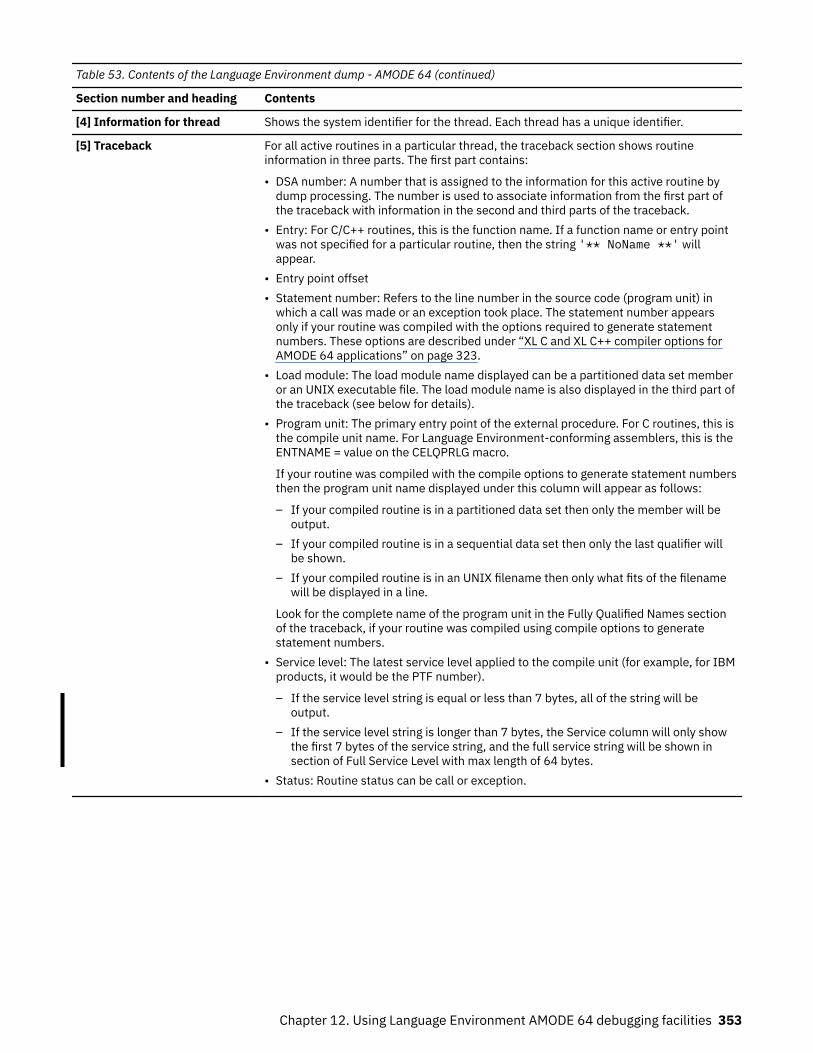
Table 53. Contents of the Language Environment dump - AMODE 64 (continued)
Section number and heading Contents
[4] Information for thread Shows the system identifier for the thread. Each thread has a unique identifier.
[5] Traceback For all active routines in a particular thread, the traceback section shows routineinformation in three parts. The first part contains:
• DSA number: A number that is assigned to the information for this active routine bydump processing. The number is used to associate information from the first part ofthe traceback with information in the second and third parts of the traceback.
• Entry: For C/C++ routines, this is the function name. If a function name or entry pointwas not specified for a particular routine, then the string '** NoName **' willappear.
• Entry point offset• Statement number: Refers to the line number in the source code (program unit) in
which a call was made or an exception took place. The statement number appearsonly if your routine was compiled with the options required to generate statementnumbers. These options are described under “XL C and XL C++ compiler options forAMODE 64 applications” on page 323.
• Load module: The load module name displayed can be a partitioned data set memberor an UNIX executable file. The load module name is also displayed in the third part ofthe traceback (see below for details).
• Program unit: The primary entry point of the external procedure. For C routines, this isthe compile unit name. For Language Environment-conforming assemblers, this is theENTNAME = value on the CELQPRLG macro.
If your routine was compiled with the compile options to generate statement numbersthen the program unit name displayed under this column will appear as follows:
– If your compiled routine is in a partitioned data set then only the member will beoutput.
– If your compiled routine is in a sequential data set then only the last qualifier willbe shown.
– If your compiled routine is in an UNIX filename then only what fits of the filenamewill be displayed in a line.
Look for the complete name of the program unit in the Fully Qualified Names sectionof the traceback, if your routine was compiled using compile options to generatestatement numbers.
• Service level: The latest service level applied to the compile unit (for example, for IBMproducts, it would be the PTF number).
– If the service level string is equal or less than 7 bytes, all of the string will beoutput.
– If the service level string is longer than 7 bytes, the Service column will only showthe first 7 bytes of the service string, and the full service string will be shown insection of Full Service Level with max length of 64 bytes.
• Status: Routine status can be call or exception.
Chapter 12. Using Language Environment AMODE 64 debugging facilities 353
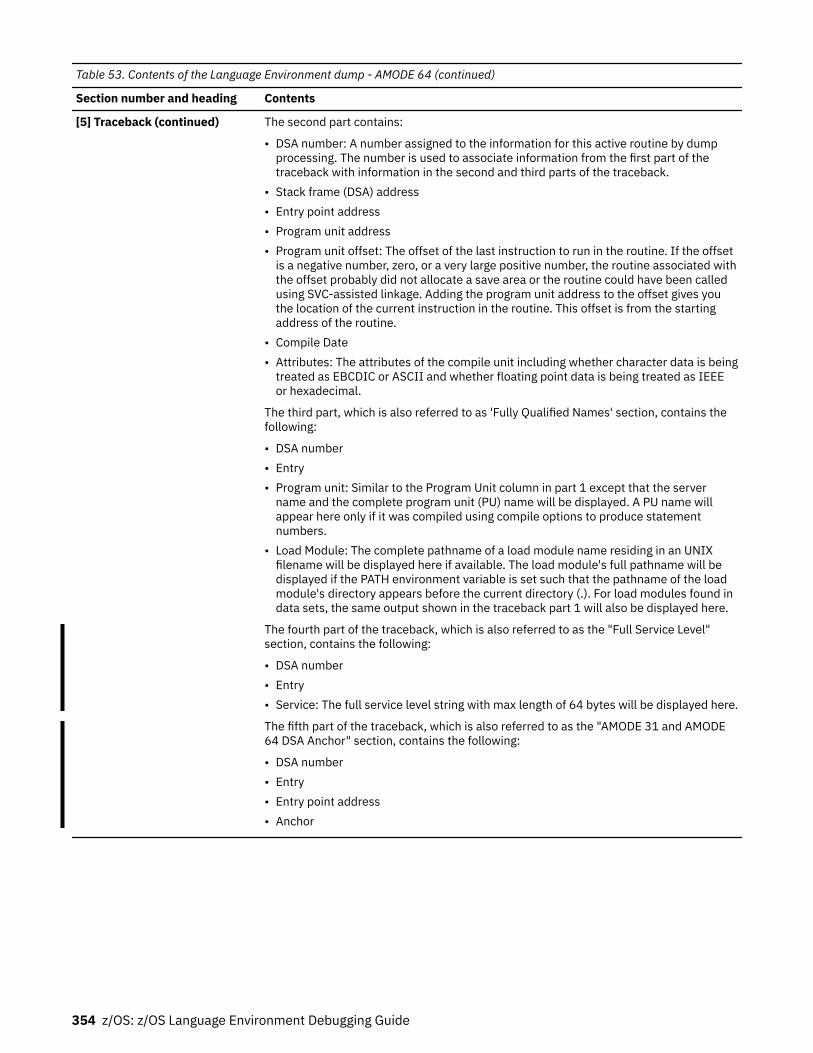
Table 53. Contents of the Language Environment dump - AMODE 64 (continued)
Section number and heading Contents
[5] Traceback (continued) The second part contains:
• DSA number: A number assigned to the information for this active routine by dumpprocessing. The number is used to associate information from the first part of thetraceback with information in the second and third parts of the traceback.
• Stack frame (DSA) address• Entry point address• Program unit address• Program unit offset: The offset of the last instruction to run in the routine. If the offset
is a negative number, zero, or a very large positive number, the routine associated withthe offset probably did not allocate a save area or the routine could have been calledusing SVC-assisted linkage. Adding the program unit address to the offset gives youthe location of the current instruction in the routine. This offset is from the startingaddress of the routine.
• Compile Date• Attributes: The attributes of the compile unit including whether character data is being
treated as EBCDIC or ASCII and whether floating point data is being treated as IEEEor hexadecimal.
The third part, which is also referred to as 'Fully Qualified Names' section, contains thefollowing:
• DSA number• Entry• Program unit: Similar to the Program Unit column in part 1 except that the server
name and the complete program unit (PU) name will be displayed. A PU name willappear here only if it was compiled using compile options to produce statementnumbers.
• Load Module: The complete pathname of a load module name residing in an UNIXfilename will be displayed here if available. The load module's full pathname will bedisplayed if the PATH environment variable is set such that the pathname of the loadmodule's directory appears before the current directory (.). For load modules found indata sets, the same output shown in the traceback part 1 will also be displayed here.
The fourth part of the traceback, which is also referred to as the "Full Service Level"section, contains the following:
• DSA number• Entry• Service: The full service level string with max length of 64 bytes will be displayed here.
The fifth part of the traceback, which is also referred to as the "AMODE 31 and AMODE64 DSA Anchor" section, contains the following:
• DSA number• Entry• Entry point address• Anchor
354 z/OS: z/OS Language Environment Debugging Guide
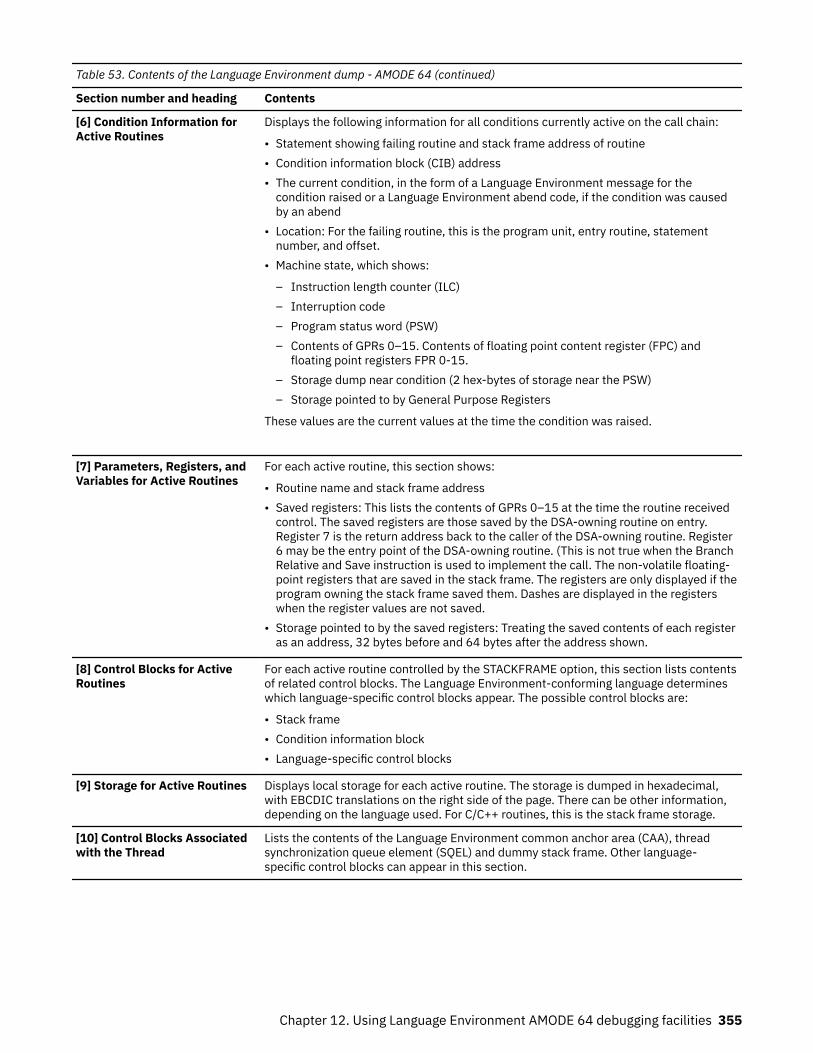
Table 53. Contents of the Language Environment dump - AMODE 64 (continued)
Section number and heading Contents
[6] Condition Information forActive Routines
Displays the following information for all conditions currently active on the call chain:
• Statement showing failing routine and stack frame address of routine• Condition information block (CIB) address• The current condition, in the form of a Language Environment message for the
condition raised or a Language Environment abend code, if the condition was causedby an abend
• Location: For the failing routine, this is the program unit, entry routine, statementnumber, and offset.
• Machine state, which shows:
– Instruction length counter (ILC) – Interruption code – Program status word (PSW) – Contents of GPRs 0–15. Contents of floating point content register (FPC) and
floating point registers FPR 0-15.– Storage dump near condition (2 hex-bytes of storage near the PSW)– Storage pointed to by General Purpose Registers
These values are the current values at the time the condition was raised.
[7] Parameters, Registers, andVariables for Active Routines
For each active routine, this section shows:
• Routine name and stack frame address• Saved registers: This lists the contents of GPRs 0–15 at the time the routine received
control. The saved registers are those saved by the DSA-owning routine on entry.Register 7 is the return address back to the caller of the DSA-owning routine. Register6 may be the entry point of the DSA-owning routine. (This is not true when the BranchRelative and Save instruction is used to implement the call. The non-volatile floating-point registers that are saved in the stack frame. The registers are only displayed if theprogram owning the stack frame saved them. Dashes are displayed in the registerswhen the register values are not saved.
• Storage pointed to by the saved registers: Treating the saved contents of each registeras an address, 32 bytes before and 64 bytes after the address shown.
[8] Control Blocks for ActiveRoutines
For each active routine controlled by the STACKFRAME option, this section lists contentsof related control blocks. The Language Environment-conforming language determineswhich language-specific control blocks appear. The possible control blocks are:
• Stack frame• Condition information block• Language-specific control blocks
[9] Storage for Active Routines Displays local storage for each active routine. The storage is dumped in hexadecimal,with EBCDIC translations on the right side of the page. There can be other information,depending on the language used. For C/C++ routines, this is the stack frame storage.
[10] Control Blocks Associatedwith the Thread
Lists the contents of the Language Environment common anchor area (CAA), threadsynchronization queue element (SQEL) and dummy stack frame. Other language-specific control blocks can appear in this section.
Chapter 12. Using Language Environment AMODE 64 debugging facilities 355
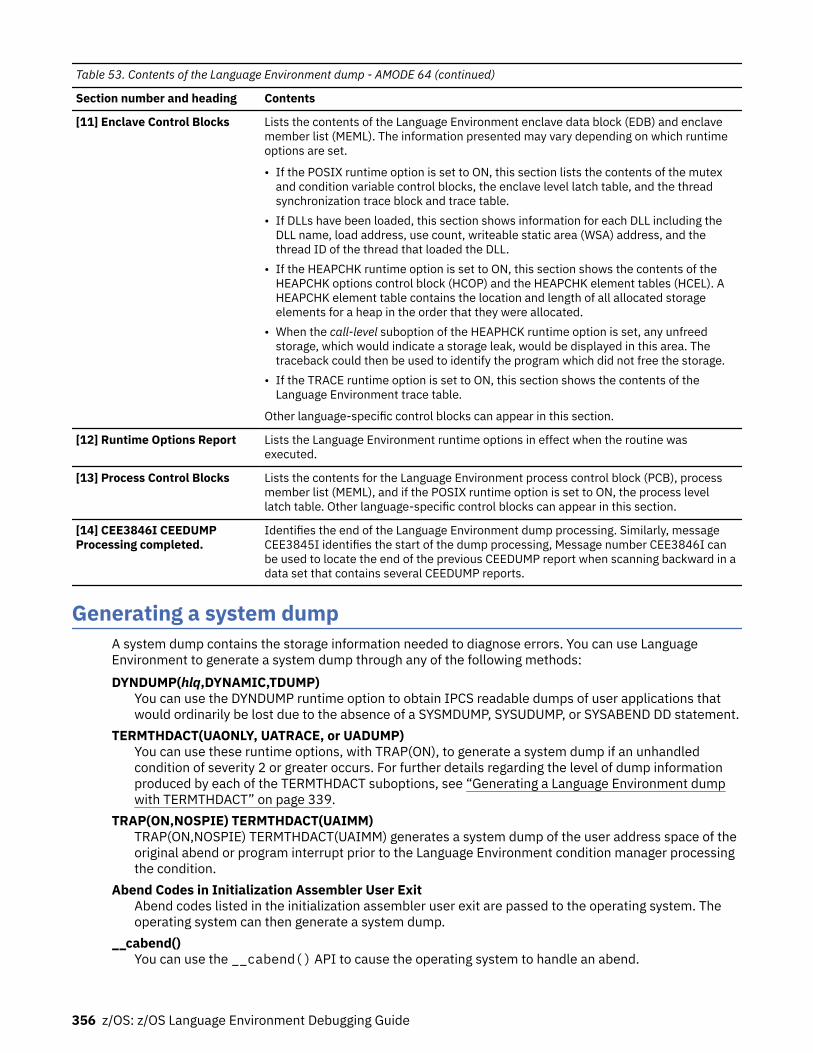
Table 53. Contents of the Language Environment dump - AMODE 64 (continued)
Section number and heading Contents
[11] Enclave Control Blocks Lists the contents of the Language Environment enclave data block (EDB) and enclavemember list (MEML). The information presented may vary depending on which runtimeoptions are set.
• If the POSIX runtime option is set to ON, this section lists the contents of the mutexand condition variable control blocks, the enclave level latch table, and the threadsynchronization trace block and trace table.
• If DLLs have been loaded, this section shows information for each DLL including theDLL name, load address, use count, writeable static area (WSA) address, and thethread ID of the thread that loaded the DLL.
• If the HEAPCHK runtime option is set to ON, this section shows the contents of theHEAPCHK options control block (HCOP) and the HEAPCHK element tables (HCEL). AHEAPCHK element table contains the location and length of all allocated storageelements for a heap in the order that they were allocated.
• When the call-level suboption of the HEAPHCK runtime option is set, any unfreedstorage, which would indicate a storage leak, would be displayed in this area. Thetraceback could then be used to identify the program which did not free the storage.
• If the TRACE runtime option is set to ON, this section shows the contents of theLanguage Environment trace table.
Other language-specific control blocks can appear in this section.
[12] Runtime Options Report Lists the Language Environment runtime options in effect when the routine wasexecuted.
[13] Process Control Blocks Lists the contents for the Language Environment process control block (PCB), processmember list (MEML), and if the POSIX runtime option is set to ON, the process levellatch table. Other language-specific control blocks can appear in this section.
[14] CEE3846I CEEDUMPProcessing completed.
Identifies the end of the Language Environment dump processing. Similarly, messageCEE3845I identifies the start of the dump processing, Message number CEE3846I canbe used to locate the end of the previous CEEDUMP report when scanning backward in adata set that contains several CEEDUMP reports.
Generating a system dumpA system dump contains the storage information needed to diagnose errors. You can use LanguageEnvironment to generate a system dump through any of the following methods:DYNDUMP(hlq,DYNAMIC,TDUMP)
You can use the DYNDUMP runtime option to obtain IPCS readable dumps of user applications thatwould ordinarily be lost due to the absence of a SYSMDUMP, SYSUDUMP, or SYSABEND DD statement.
TERMTHDACT(UAONLY, UATRACE, or UADUMP)You can use these runtime options, with TRAP(ON), to generate a system dump if an unhandledcondition of severity 2 or greater occurs. For further details regarding the level of dump informationproduced by each of the TERMTHDACT suboptions, see “Generating a Language Environment dumpwith TERMTHDACT” on page 339.
TRAP(ON,NOSPIE) TERMTHDACT(UAIMM)TRAP(ON,NOSPIE) TERMTHDACT(UAIMM) generates a system dump of the user address space of theoriginal abend or program interrupt prior to the Language Environment condition manager processingthe condition.
Abend Codes in Initialization Assembler User ExitAbend codes listed in the initialization assembler user exit are passed to the operating system. Theoperating system can then generate a system dump.
__cabend()You can use the __cabend() API to cause the operating system to handle an abend.
356 z/OS: z/OS Language Environment Debugging Guide
See system or subsystem documentation for detailed system dump information.
The method for generating a system dump varies for each of the Language Environment runtimeenvironments. The following sections describe the recommended steps needed to generate a systemdump in batch and z/OS UNIX shell runtime environments. Other methods may exist, but these are therecommended steps for generating a system dump. For details on setting Language Environment runtimeoptions, see z/OS Language Environment Programming Guide.
Steps for generating a system dump in a batch runtime environmentPerform the following steps to generate a system dump in a batch runtime environment. When you aredone, you have a generated system dump in a batch runtime environment.
1. Specify runtime options TERMTHDACT(UAONLY, UADUMP, UATRACE, or UAIMM), and TRAP(ON). If youspecify the suboption UAIMM then you must set TRAP(ON,NOSPIE). The TERMTHDACT suboptiondetermines the level of detail of the Language Environment formatted dump. For further details on theTERMTHDACT suboptions, see “Generating a Language Environment dump with TERMTHDACT” onpage 339.
2. Decide whether to include a SYSMDUMP DD card or use the DYNDUMP runtime option.
• Include a SYSMDUMP DD card with the desired data set name and DCB information:
LRECL=4160, BLKSIZE=4160, and RECFM=FBS.
• Specify the DYNDUMP runtime option with the following information:
DYNDUMP (hlq,DYNAMIC,TDUMP)
3. Rerun the program.
Steps for generating a system dump in a z/OS UNIX shellPerform the following steps to generate a system dump from a z/OS UNIX shell:
• Using _BPXK_MDUMP.
1. Specify where to write the system dump.
– To write the system dump to a z/OS data set, issue the export _BPXK_MDUMP=filenamecommand, where filename is a fully qualified data set name with DCB information: LRECL=4160,BLKSIZE=4160, and RECFM=FBS. For example:
export _BPXK_MDUMP=hlq.mydump
– To write the system dump to a z/OS UNIX file, issue the export _BPXK_MDUMP=filenamecommand, where filename is a fully qualified z/OS UNIX file name; For example:
export _BPXK_MDUMP=/tmp/mydump.dmp
2. Specify Language Environment runtime options, where suboption = UAONLY, UADUMP, UATRACE, orUAIMM. If UAIMM is set, TRAP(ON,NOSPIE) must also be set. The TERMTHDACT suboptiondetermines the level of detail of the Language Environment formatted dump. For more details aboutthe TERMTHDACT suboptions, see “Generating a Language Environment dump with TERMTHDACT”on page 339.
export _CEE_RUNOPTS="termthdact(suboption)"
3. Rerun the program.
When you are done, the system dump is written to the data set name or z/OS UNIX file name specified.For more information about BPXK_MDUMP, see _BPXK environment variables in z/OS UNIX SystemServices Planning.
• Using DYNDUMP.
Chapter 12. Using Language Environment AMODE 64 debugging facilities 357
1. Specify Language Environment runtime options:
export _CEE_RUNOPTS="termthdact(suboption),DYNDUMP(hlq,DYNAMIC,TDUMP)"
suboptionis UAONLY, UADUMP, UATRACE, or UAIMM. If UAIMM is set, TRAP(ON,NOSPIE) must also be set.The TERMTHDACT suboption determines the level of detail of the Language Environmentformatted dump. For further details regarding the TERMTHDACT suboptions, see “Generating aLanguage Environment dump with TERMTHDACT” on page 339
hlqis the high level qualifier for the dump data set to be created.
2. Rerun the program.
When you are done, the system dump is written to the name generated by the DYNDUMP runtimeoption. For more information about DYNDUMP information, see DYNDUMP in z/OS LanguageEnvironment Programming Reference.
You can also specify the signal SIGDUMP on the kill command to generate a system dump of the useraddress space. For more information about the kill command and signals, see kill - End a process or job,or send it a signal in z/OS UNIX System Services Command Reference.
Formatting and analyzing system dumpsYou can use the Interactive Problem Control System (IPCS) to format and analyze system dumps.Language Environment provides an IPCS VERBEXIT LEDATA that can be used to format LanguageEnvironment control blocks. For more information about using IPCS, see z/OS MVS IPCS User's Guide.
Preparing to use the Language Environment support for IPCSUse the following guidelines before you use IPCS to format Language Environment control blocks:
• Ensure that your IPCS job can find the CEEIPCSP member.
IPCS provides an exit control table with imbed statements to enable other products to supply exitcontrol information. The IPCS default table, BLSCECT, normally in the SYS1.PARMLIB library, has thefollowing entry for Language Environment:
IMBED MEMBER(CEEIPCSP) ENVIRONMENT(IPCS)
The Language Environment-supplied CEEIPCSP member, installed in the SYS1.PARMLIB library,contains the Language Environment-specific entries for the IPCS exit control table.
• Provide an IPCSPARM DD statement to specify the libraries containing the IPCS control tables; forexample:
//IPCSPARM DD DSN=SYS1.PARMLIB,DISP=SHR
• Ensure that your IPCS job can find the Language Environment-supplied ANALYZE exit routines installedin the SYS1.MIGLIB library.
• To aid in debugging system or address space hang situations, Language Environment mutexes, latchesand condition variables can be displayed if the CEEIPCSP member you are using is updated to identifythe Language Environment ANALYZE exit, by including the following statement:
EXIT EP(CEEEANLZ) ANALYZE
Understanding Language Environment IPCS VERBEXIT – LEDATA
Purpose
358 z/OS: z/OS Language Environment Debugging Guide
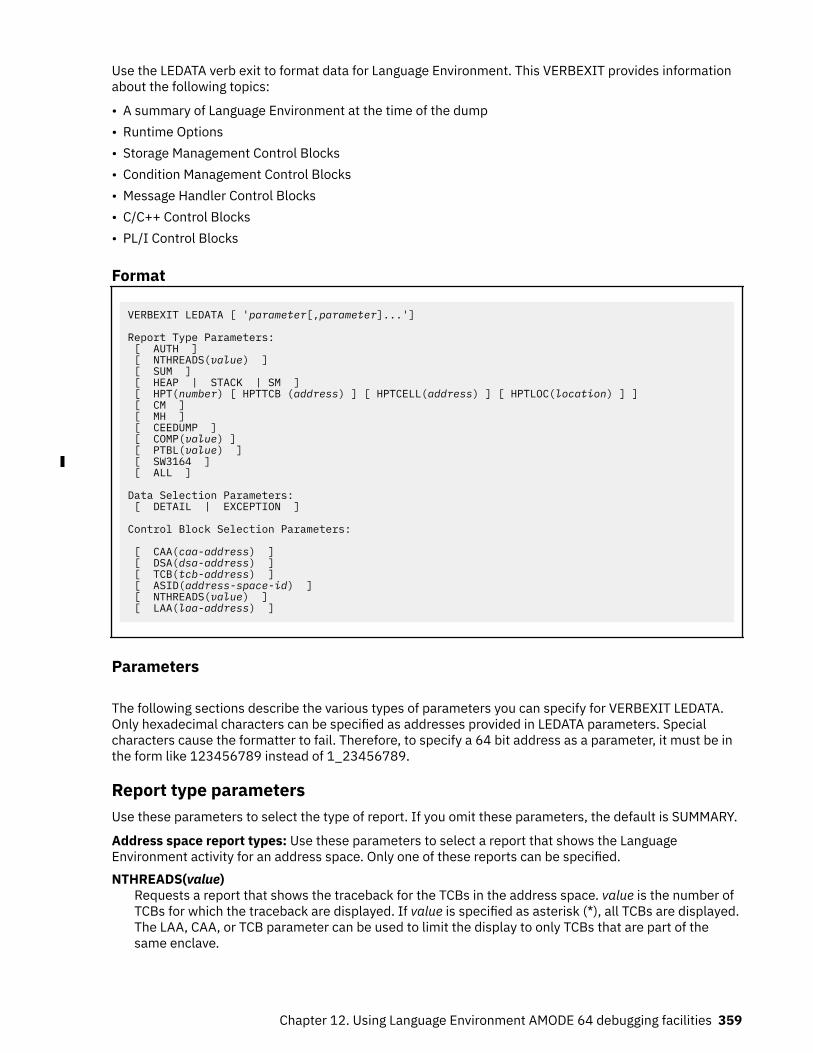
Use the LEDATA verb exit to format data for Language Environment. This VERBEXIT provides informationabout the following topics:
• A summary of Language Environment at the time of the dump• Runtime Options• Storage Management Control Blocks• Condition Management Control Blocks• Message Handler Control Blocks• C/C++ Control Blocks• PL/I Control Blocks
Format
VERBEXIT LEDATA [ 'parameter[,parameter]...']
Report Type Parameters: [ AUTH ] [ NTHREADS(value) ] [ SUM ] [ HEAP | STACK | SM ] [ HPT(number) [ HPTTCB (address) ] [ HPTCELL(address) ] [ HPTLOC(location) ] ] [ CM ] [ MH ] [ CEEDUMP ] [ COMP(value) ] [ PTBL(value) ] [ SW3164 ] [ ALL ]
Data Selection Parameters: [ DETAIL | EXCEPTION ]
Control Block Selection Parameters:
[ CAA(caa-address) ] [ DSA(dsa-address) ] [ TCB(tcb-address) ] [ ASID(address-space-id) ] [ NTHREADS(value) ] [ LAA(laa-address) ]
Parameters
The following sections describe the various types of parameters you can specify for VERBEXIT LEDATA.Only hexadecimal characters can be specified as addresses provided in LEDATA parameters. Specialcharacters cause the formatter to fail. Therefore, to specify a 64 bit address as a parameter, it must be inthe form like 123456789 instead of 1_23456789.
Report type parametersUse these parameters to select the type of report. If you omit these parameters, the default is SUMMARY.
Address space report types: Use these parameters to select a report that shows the LanguageEnvironment activity for an address space. Only one of these reports can be specified.NTHREADS(value)
Requests a report that shows the traceback for the TCBs in the address space. value is the number ofTCBs for which the traceback are displayed. If value is specified as asterisk (*), all TCBs are displayed.The LAA, CAA, or TCB parameter can be used to limit the display to only TCBs that are part of thesame enclave.
Chapter 12. Using Language Environment AMODE 64 debugging facilities 359
AUTHRequests a report on all Preinitialized Environments for Authorized Programs control blocks for theaddress space. NTHREADS is ignored when AUTH is specified.
PTBL(value)Requests that PreInit tables be formatted according to the following values.CURRENT
If current is specified, the PreInit table that is associated with the current or specified TCB isdisplayed.
addressIf an address is specified, the PreInit table at that address is specified.
*All active and dormant PreInit tables within the current address space are displayed; this option istime-consuming.
ACTIVEThe PreInit tables for all TCBs in the address space are displayed.
Thread-specific report types: Use these parameters to select reports that show Language Environmentactivity for a specific TCB. These report types are ignored if AUTH or NTHREADS is specified. You canspecify as many of these reports as you want.
SUMmaryRequests a summary of the Language Environment at the time of the dump. The following informationis included:
• TCB address.• Address Space Identifier.• Language Environment Release.• Active members.• Formatted CAA, PCB, RCB, EDB, LAA, and LCA.• Runtime Options in effect.
HEAP | STACK | SMHEAP
Requests a report on Storage Management control blocks pertaining to HEAP storage, as well as adetailed report on heap segments. The detailed report includes information about the free storagetree in the heap segment, and information about each allocated storage element. It also specifiesa heap pools report with information useful to find potential damaged cells.
Note: Language Environment does not support alternative Vendor Heap Manager (VHM) data.
STACKRequests a report on Storage Management control blocks pertaining to STACK storage.
SMRequests a report on Storage Management control blocks. This is the same as specifying bothHEAP and STACK.
HPT(number) [ HPTTCB (address) ] [ HPTCELL(address) ] [ HPTLOC(location) ]
HPT(number)Requests that the heap pool trace, if available, be formatted. If the value is 0 or *, the trace forevery heap pool ID is formatted. If the value is a single number (1-12), the trace for the specificheap pool ID is formatted. If only the HPT keyword is specified with no value, the trace behavessimilar to when the value is *. If no filter is specified, all of the entries are formatted for the specificpool ID.
360 z/OS: z/OS Language Environment Debugging Guide
HPTTCB (address)Filters the heap pool trace table, if available, printing only those entries for a given TCB address(address).
HPTCELL(address)Filters the heap pool trace table, if available, printing only those entries for a given cell address(address).
HPTLOC(value)Filters the heap pool trace table, if available, and prints only those entries for a given virtualstorage location (location). The following values are valid:31
Display entries that are located in virtual storage below the bar.64
Display entries that are located in virtual storage above the bar.ALL
Display entries that are located in virtual storage below or above the bar.
Note:
1. Filter options without specifying HPT implies HPT(*).2. You can specify multiple options together, like HPTTCB and HPTCELL. All pieces of information
must match the trace entry for it to be formatted. If location and cell contradict each other, such asHPTLOC(31) and HPTCELL(64bit addr), an error will be displayed.
CMRequests a report on Condition Management control blocks.
MHRequests a report on Message Handler control blocks.
CEEdumpRequests a CEEDUMP-like report. This includes the traceback, the Language Environment trace, andthread synchronization control blocks at process, enclave, and thread levels.
COMP(value)Requests component control blocks to be formatted according to the following values:C
Requests a report on C/C++ runtime control blocks.CIO
Requests a report on C/C++ I/O control blocks.COBOL
Requests a report on COBOL-specific control blocks.PLI
Requests a report on PL/I-specific control blocks.ALL
Requests a report on all the previous control blocks.
If the value specified in COMP is not one of the values (C, CIO, COBOL, PL/I, or ALL), a message isdisplayed and it continues executing as if COMP(ALL) was specified.
The ALL parameter for LEDATA also generates a report that includes all the component control blocks.
SW3164Requests a report on AMODE 31 and AMODE 64 interoperability. The following information isincluded:
• Formatted SW3164 structure.
ALLRequests all reports, as well as C/C++, COBOL, and PL/I reports.
Chapter 12. Using Language Environment AMODE 64 debugging facilities 361
Data selection parametersData selection parameters limit the scope of the data in the report. If no data selection parameter isselected, the default is DETAIL.DETail
Requests formatting all control blocks for the selected components. Only significant fields in eachcontrol block are formatted. For the Heap and Storage Management Reports, the DETAIL parameterwill provide a detailed heap segment report for each heap segment in the dump. The detailed heapsegment report includes information on the free storage tree in the heap segments, and all allocatedstorage elements. This report will also identify problems detected in the heap management datastructures. For more information about the Heap Reports, see “Understanding the HEAP LEDATAoutput” on page 376.
EXCeptionRequests validating all control blocks for the selected components. Output is only produced namingthe control block and its address for the first control block in a chain that is invalid. Validation consistsof control block header verification at the very least. For the Summary, CEEDUMP, C/C++, PL/I reports,the EXCEPTION parameter has not been implemented. For these reports, DETAIL output is alwaysproduced.
Control block selection parametersUse these parameters to select the control blocks used as the starting points for formatting.CAA(caa-address)
specifies the address of the CAA. If not specified, the CAA address is obtained from the LAA.DSA(dsa-address)
specifies the address of the DSA. If not specified, the DSA address may be obtained from the TCB orthe IPCS symbol REGGEN.
TCB(tcb-address)specifies the address of the TCB. If not specified, the TCB address may be obtained from the CAA orthe CVT.
LAA(laa-address)specifies the address of the LAA. If not specified, the LAA address may be obtained from the TCB orthe PSA.
ASID(address-space-id)specifies the hexadecimal address space ID. If not specified, the IPCS default address space ID isused. This parameter is not needed when the dump only has one address space.
ExamplesFor examples of the output produced by LEDATA and explanation of the content, refer to “Understandingthe Language Environment IPCS VERBEXIT LEDATA output” on page 362.
Understanding the Language Environment IPCS VERBEXIT LEDATA outputThe Language Environment IPCS VERBEXIT LEDATA generates formatted output of the LanguageEnvironment runtime environment control blocks from a system dump. The following sample illustratesthe output produced when the LEDATA VERBEXIT is invoked with the ALL parameter. The system dumpbeing formatted was obtained by specifying the TERMTHDACT(UADUMP) runtime option when runningthe program CELQSAMP in Figure 162 on page 342.
“Sections of the Language Environment LEDATA VERBEXIT formatted output” on page 372 describes theinformation in the formatted output. Ellipses are used to summarize some sections of the dump. For easyreference, the sections of the following dump are numbered to correspond with the descriptions in“Sections of the Language Environment LEDATA VERBEXIT formatted output” on page 372.
362 z/OS: z/OS Language Environment Debugging Guide
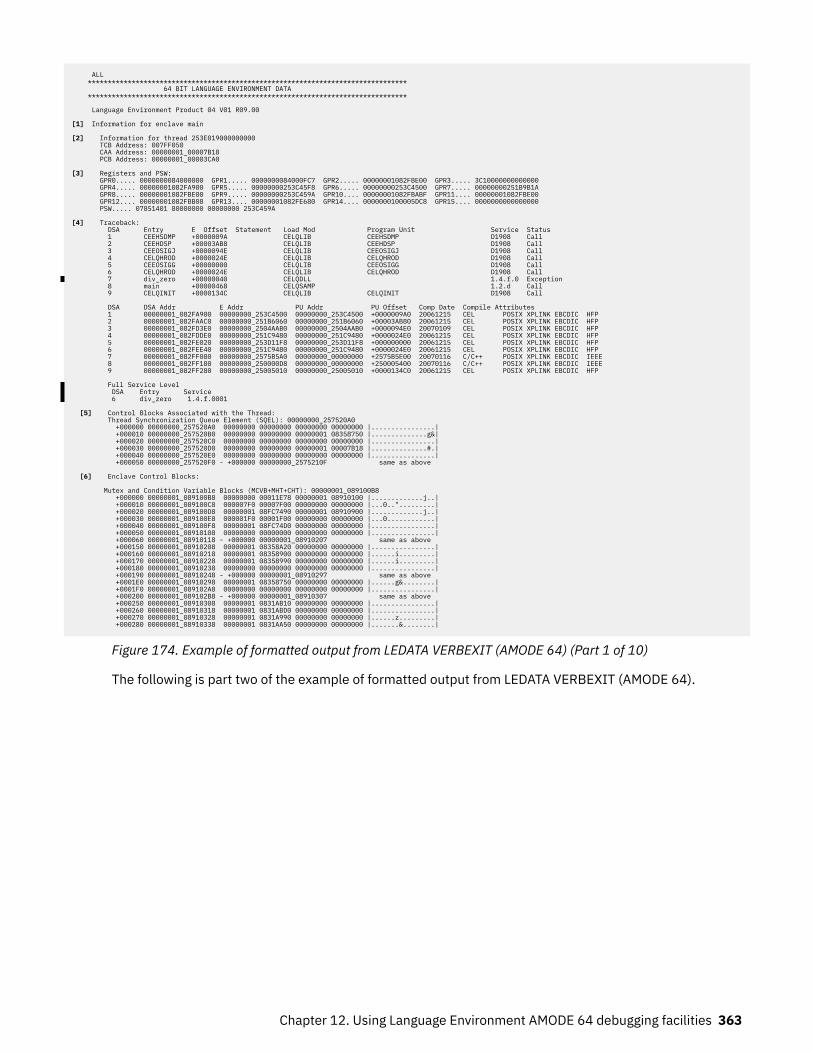
ALL ******************************************************************************** 64 BIT LANGUAGE ENVIRONMENT DATA ******************************************************************************** Language Environment Product 04 V01 R09.00 [1] Information for enclave main [2] Information for thread 253E019000000000 TCB Address: 007FF050 CAA Address: 00000001_00007B18 PCB Address: 00000001_00003CA0 [3] Registers and PSW: GPR0..... 0000000084000000 GPR1..... 0000000084000FC7 GPR2..... 00000001082FBE00 GPR3..... 3C10000000000000 GPR4..... 00000001082FA900 GPR5..... 00000000253C45F8 GPR6..... 00000000253C4500 GPR7..... 00000000251B9B1A GPR8..... 00000001082FBE00 GPR9..... 00000000253C459A GPR10.... 00000001082FBABF GPR11.... 00000001082FBE00 GPR12.... 00000001082FBB08 GPR13.... 00000001082FE680 GPR14.... 0000000100005DC8 GPR15.... 0000000000000000 PSW..... 07851401 80000000 00000000 253C459A [4] Traceback: DSA Entry E Offset Statement Load Mod Program Unit Service Status 1 CEEHSDMP +0000009A CELQLIB CEEHSDMP D1908 Call 2 CEEHDSP +00003AB8 CELQLIB CEEHDSP D1908 Call 3 CEEOSIGJ +0000094E CELQLIB CEEOSIGJ D1908 Call 4 CELQHROD +0000024E CELQLIB CELQHROD D1908 Call 5 CEEOSIGG +00000000 CELQLIB CEEOSIGG D1908 Call 6 CELQHROD +0000024E CELQLIB CELQHROD D1908 Call 7 div_zero +00000040 CELQDLL 1.4.f.0 Exception 8 main +00000468 CELQSAMP 1.2.d Call 9 CELQINIT +0000134C CELQLIB CELQINIT D1908 Call DSA DSA Addr E Addr PU Addr PU Offset Comp Date Compile Attributes 1 00000001_082FA900 00000000_253C4500 00000000_253C4500 +0000009A0 20061215 CEL POSIX XPLINK EBCDIC HFP 2 00000001_082FAAC0 00000000_251B6060 00000000_251B6060 +00003AB80 20061215 CEL POSIX XPLINK EBCDIC HFP 3 00000001_082FD3E0 00000000_2504AAB0 00000000_2504AAB0 +0000094E0 20070109 CEL POSIX XPLINK EBCDIC HFP 4 00000001_082FDDE0 00000000_251C9480 00000000_251C9480 +0000024E0 20061215 CEL POSIX XPLINK EBCDIC HFP 5 00000001_082FE020 00000000_253D11F8 00000000_253D11F8 +000000000 20061215 CEL POSIX XPLINK EBCDIC HFP 6 00000001_082FEE40 00000000_251C9480 00000000_251C9480 +0000024E0 20061215 CEL POSIX XPLINK EBCDIC HFP 7 00000001_082FF080 00000000_2575B5A0 00000000_00000000 +2575B5E00 20070116 C/C++ POSIX XPLINK EBCDIC IEEE 8 00000001_082FF180 00000000_250000D8 00000000_00000000 +250005400 20070116 C/C++ POSIX XPLINK EBCDIC IEEE 9 00000001_082FF280 00000000_25005010 00000000_25005010 +0000134C0 20061215 CEL POSIX XPLINK EBCDIC HFP Full Service Level DSA Entry Service 6 div_zero 1.4.f.0001
[5] Control Blocks Associated with the Thread: Thread Synchronization Queue Element (SQEL): 00000000_257520A0 +000000 00000000_257520A0 00000000 00000000 00000000 00000000 |................| +000010 00000000_257520B0 00000000 00000000 00000001 08358750 |..............g&| +000020 00000000_257520C0 00000000 00000000 00000000 00000000 |................| +000030 00000000_257520D0 00000000 00000000 00000001 00007B18 |..............#.| +000040 00000000_257520E0 00000000 00000000 00000000 00000000 |................| +000050 00000000_257520F0 - +000000 00000000_2575210F same as above [6] Enclave Control Blocks: Mutex and Condition Variable Blocks (MCVB+MHT+CHT): 00000001_089100B8 +000000 00000001_089100B8 00000000 00011E78 00000001 08910100 |.............j..| +000010 00000001_089100C8 000007F0 00007F00 00000000 00000000 |...0..".........| +000020 00000001_089100D8 00000001 08FC7490 00000001 08910900 |.............j..| +000030 00000001_089100E8 000001F0 00001F00 00000000 00000000 |...0............| +000040 00000001_089100F8 00000001 08FC74D0 00000000 00000000 |................| +000050 00000001_08910108 00000000 00000000 00000000 00000000 |................| +000060 00000001_08910118 - +000000 00000001_08910207 same as above +000150 00000001_08910208 00000001 08358A20 00000000 00000000 |................| +000160 00000001_08910218 00000001 08358900 00000000 00000000 |......i.........| +000170 00000001_08910228 00000001 08358990 00000000 00000000 |......i.........| +000180 00000001_08910238 00000000 00000000 00000000 00000000 |................| +000190 00000001_08910248 - +000000 00000001_08910297 same as above +0001E0 00000001_08910298 00000001 08358750 00000000 00000000 |......g&........| +0001F0 00000001_089102A8 00000000 00000000 00000000 00000000 |................| +000200 00000001_089102B8 - +000000 00000001_08910307 same as above +000250 00000001_08910308 00000001 0831AB10 00000000 00000000 |................| +000260 00000001_08910318 00000001 0831ABD0 00000000 00000000 |................| +000270 00000001_08910328 00000001 0831A990 00000000 00000000 |......z.........| +000280 00000001_08910338 00000001 0831AA50 00000000 00000000 |.......&........|
Figure 174. Example of formatted output from LEDATA VERBEXIT (AMODE 64) (Part 1 of 10)
The following is part two of the example of formatted output from LEDATA VERBEXIT (AMODE 64).
Chapter 12. Using Language Environment AMODE 64 debugging facilities 363
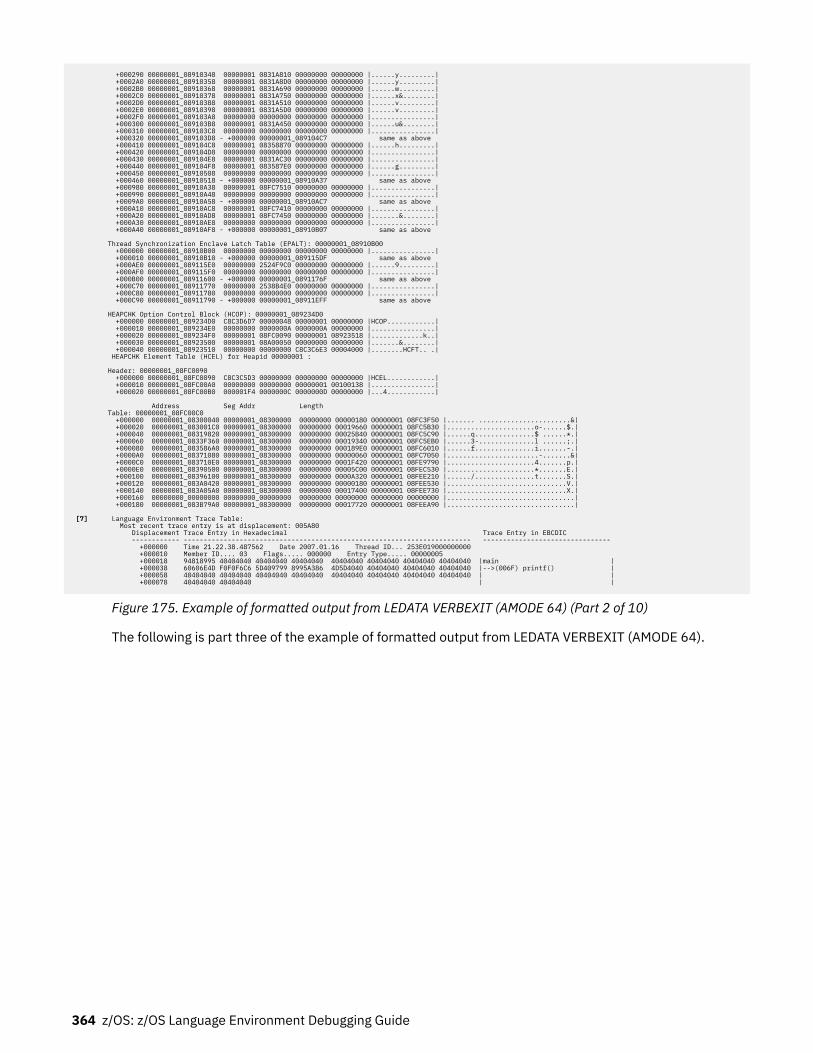
+000290 00000001_08910348 00000001 0831A810 00000000 00000000 |......y.........| +0002A0 00000001_08910358 00000001 0831A8D0 00000000 00000000 |......y.........| +0002B0 00000001_08910368 00000001 0831A690 00000000 00000000 |......w.........| +0002C0 00000001_08910378 00000001 0831A750 00000000 00000000 |......x&........| +0002D0 00000001_08910388 00000001 0831A510 00000000 00000000 |......v.........| +0002E0 00000001_08910398 00000001 0831A5D0 00000000 00000000 |......v.........| +0002F0 00000001_089103A8 00000000 00000000 00000000 00000000 |................| +000300 00000001_089103B8 00000001 0831A450 00000000 00000000 |......u&........| +000310 00000001_089103C8 00000000 00000000 00000000 00000000 |................| +000320 00000001_089103D8 - +000000 00000001_089104C7 same as above +000410 00000001_089104C8 00000001 08358870 00000000 00000000 |......h.........| +000420 00000001_089104D8 00000000 00000000 00000000 00000000 |................| +000430 00000001_089104E8 00000001 0831AC30 00000000 00000000 |................| +000440 00000001_089104F8 00000001 083587E0 00000000 00000000 |......g.........| +000450 00000001_08910508 00000000 00000000 00000000 00000000 |................| +000460 00000001_08910518 - +000000 00000001_08910A37 same as above +000980 00000001_08910A38 00000001 08FC7510 00000000 00000000 |................| +000990 00000001_08910A48 00000000 00000000 00000000 00000000 |................| +0009A0 00000001_08910A58 - +000000 00000001_08910AC7 same as above +000A10 00000001_08910AC8 00000001 08FC7410 00000000 00000000 |................| +000A20 00000001_08910AD8 00000001 08FC7450 00000000 00000000 |.......&........| +000A30 00000001_08910AE8 00000000 00000000 00000000 00000000 |................| +000A40 00000001_08910AF8 - +000000 00000001_08910B07 same as above Thread Synchronization Enclave Latch Table (EPALT): 00000001_08910B00 +000000 00000001_08910B00 00000000 00000000 00000000 00000000 |................| +000010 00000001_08910B10 - +000000 00000001_089115DF same as above +000AE0 00000001_089115E0 00000000 2524F9C0 00000000 00000000 |......9.........| +000AF0 00000001_089115F0 00000000 00000000 00000000 00000000 |................| +000B00 00000001_08911600 - +000000 00000001_0891176F same as above +000C70 00000001_08911770 00000000 2538B4E0 00000000 00000000 |................| +000C80 00000001_08911780 00000000 00000000 00000000 00000000 |................| +000C90 00000001_08911790 - +000000 00000001_08911EFF same as above HEAPCHK Option Control Block (HCOP): 00000001_089234D0 +000000 00000001_089234D0 C8C3D6D7 00000048 00000001 00000000 |HCOP............| +000010 00000001_089234E0 00000000 0000000A 0000000A 00000000 |................| +000020 00000001_089234F0 00000001 08FC0090 00000001 08923518 |.............k..| +000030 00000001_08923500 00000001 08A00050 00000000 00000000 |.......&........| +000040 00000001_08923510 00000000 00000000 C8C3C6E3 00004000 |........HCFT.. .| HEAPCHK Element Table (HCEL) for Heapid 00000001 : Header: 00000001_08FC0090 +000000 00000001_08FC0090 C8C3C5D3 00000000 00000000 00000000 |HCEL............| +000010 00000001_08FC00A0 00000000 00000000 00000001 00100138 |................| +000020 00000001_08FC00B0 000001F4 0000000C 0000000D 00000000 |...4............|
Address Seg Addr Length Table: 00000001_08FC00C0 +000000 00000001_08300040 00000001_08300000 00000000 00000180 00000001 08FC3F50 |....... .......................&| +000020 00000001_083001C0 00000001_08300000 00000000 00019660 00000001 08FC5B30 |......................o-......$.| +000040 00000001_08319820 00000001_08300000 00000000 00025B40 00000001 08FC5C90 |......q...............$ ......*.| +000060 00000001_0833F360 00000001_08300000 00000000 00019340 00000001 08FC5EB0 |......3-..............l ......;.| +000080 00000001_083586A0 00000001_08300000 00000000 000189E0 00000001 08FC6010 |......f...............i.......-.| +0000A0 00000001_08371080 00000001_08300000 00000000 00000060 00000001 08FC7050 |.......................-.......&| +0000C0 00000001_083710E0 00000001_08300000 00000000 0001F420 00000001 08FE9790 |......................4.......p.| +0000E0 00000001_08390500 00000001_08300000 00000000 00005C00 00000001 08FEC530 |......................*.......E.| +000100 00000001_08396100 00000001_08300000 00000000 0000A320 00000001 08FEE210 |....../...............t.......S.| +000120 00000001_083A0420 00000001_08300000 00000000 00000180 00000001 08FEE530 |..............................V.| +000140 00000001_083A05A0 00000001_08300000 00000000 00017400 00000001 08FEE730 |..............................X.| +000160 00000000_00000000 00000000_00000000 00000000 00000000 00000000 00000000 |................................| +000180 00000001_083B79A0 00000001_08300000 00000000 00017720 00000001 08FEEA90 |................................|
[7] Language Environment Trace Table: Most recent trace entry is at displacement: 005A80 Displacement Trace Entry in Hexadecimal Trace Entry in EBCDIC ------------ ------------------------------------------------------------------------ -------------------------------- +000000 Time 21.22.38.487562 Date 2007.01.16 Thread ID... 253E019000000000 +000010 Member ID.... 03 Flags..... 000000 Entry Type..... 00000005 +000018 94818995 40404040 40404040 40404040 40404040 40404040 40404040 40404040 |main | +000038 60606E4D F0F0F6C6 5D409799 8995A386 4D5D4040 40404040 40404040 40404040 |-->(006F) printf() | +000058 40404040 40404040 40404040 40404040 40404040 40404040 40404040 40404040 | | +000078 40404040 40404040 | |
Figure 175. Example of formatted output from LEDATA VERBEXIT (AMODE 64) (Part 2 of 10)
The following is part three of the example of formatted output from LEDATA VERBEXIT (AMODE 64).
364 z/OS: z/OS Language Environment Debugging Guide
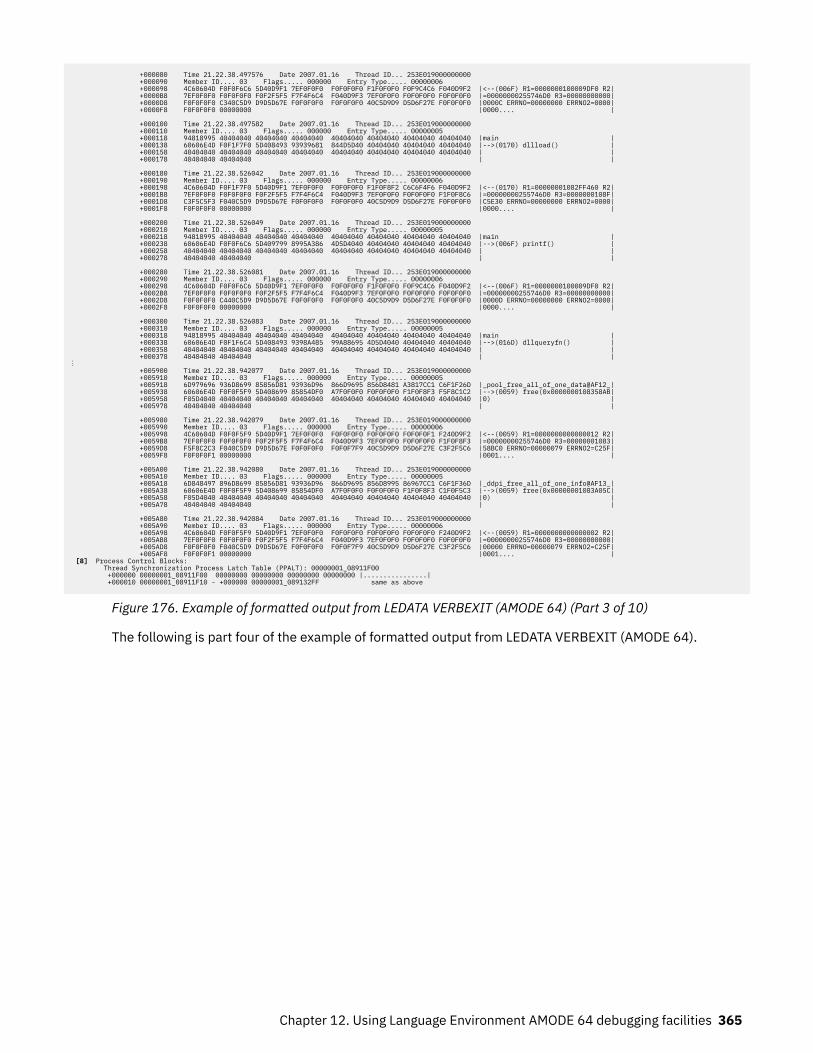
+000080 Time 21.22.38.497576 Date 2007.01.16 Thread ID... 253E019000000000 +000090 Member ID.... 03 Flags..... 000000 Entry Type..... 00000006 +000098 4C60604D F0F0F6C6 5D40D9F1 7EF0F0F0 F0F0F0F0 F1F0F0F0 F0F9C4C6 F040D9F2 |<--(006F) R1=0000000100009DF0 R2| +0000B8 7EF0F0F0 F0F0F0F0 F0F2F5F5 F7F4F6C4 F040D9F3 7EF0F0F0 F0F0F0F0 F0F0F0F0 |=00000000255746D0 R3=00000000000| +0000D8 F0F0F0F0 C340C5D9 D9D5D67E F0F0F0F0 F0F0F0F0 40C5D9D9 D5D6F27E F0F0F0F0 |0000C ERRNO=00000000 ERRNO2=0000| +0000F8 F0F0F0F0 00000000 |0000.... | +000100 Time 21.22.38.497582 Date 2007.01.16 Thread ID... 253E019000000000 +000110 Member ID.... 03 Flags..... 000000 Entry Type..... 00000005 +000118 94818995 40404040 40404040 40404040 40404040 40404040 40404040 40404040 |main | +000138 60606E4D F0F1F7F0 5D408493 93939681 844D5D40 40404040 40404040 40404040 |-->(0170) dllload() | +000158 40404040 40404040 40404040 40404040 40404040 40404040 40404040 40404040 | | +000178 40404040 40404040 | | +000180 Time 21.22.38.526042 Date 2007.01.16 Thread ID... 253E019000000000 +000190 Member ID.... 03 Flags..... 000000 Entry Type..... 00000006 +000198 4C60604D F0F1F7F0 5D40D9F1 7EF0F0F0 F0F0F0F0 F1F0F8F2 C6C6F4F6 F040D9F2 |<--(0170) R1=00000001082FF460 R2| +0001B8 7EF0F0F0 F0F0F0F0 F0F2F5F5 F7F4F6C4 F040D9F3 7EF0F0F0 F0F0F0F0 F1F0F8C6 |=00000000255746D0 R3=0000000108F| +0001D8 C3F5C5F3 F040C5D9 D9D5D67E F0F0F0F0 F0F0F0F0 40C5D9D9 D5D6F27E F0F0F0F0 |C5E30 ERRNO=00000000 ERRNO2=0000| +0001F8 F0F0F0F0 00000000 |0000.... | +000200 Time 21.22.38.526049 Date 2007.01.16 Thread ID... 253E019000000000 +000210 Member ID.... 03 Flags..... 000000 Entry Type..... 00000005 +000218 94818995 40404040 40404040 40404040 40404040 40404040 40404040 40404040 |main | +000238 60606E4D F0F0F6C6 5D409799 8995A386 4D5D4040 40404040 40404040 40404040 |-->(006F) printf() | +000258 40404040 40404040 40404040 40404040 40404040 40404040 40404040 40404040 | | +000278 40404040 40404040 | | +000280 Time 21.22.38.526081 Date 2007.01.16 Thread ID... 253E019000000000 +000290 Member ID.... 03 Flags..... 000000 Entry Type..... 00000006 +000298 4C60604D F0F0F6C6 5D40D9F1 7EF0F0F0 F0F0F0F0 F1F0F0F0 F0F9C4C6 F040D9F2 |<--(006F) R1=0000000100009DF0 R2| +0002B8 7EF0F0F0 F0F0F0F0 F0F2F5F5 F7F4F6C4 F040D9F3 7EF0F0F0 F0F0F0F0 F0F0F0F0 |=00000000255746D0 R3=00000000000| +0002D8 F0F0F0F0 C440C5D9 D9D5D67E F0F0F0F0 F0F0F0F0 40C5D9D9 D5D6F27E F0F0F0F0 |0000D ERRNO=00000000 ERRNO2=0000| +0002F8 F0F0F0F0 00000000 |0000.... | +000300 Time 21.22.38.526083 Date 2007.01.16 Thread ID... 253E019000000000 +000310 Member ID.... 03 Flags..... 000000 Entry Type..... 00000005 +000318 94818995 40404040 40404040 40404040 40404040 40404040 40404040 40404040 |main | +000338 60606E4D F0F1F6C4 5D408493 9398A485 99A88695 4D5D4040 40404040 40404040 |-->(016D) dllqueryfn() | +000358 40404040 40404040 40404040 40404040 40404040 40404040 40404040 40404040 | | +000378 40404040 40404040 | |⋮ +005900 Time 21.22.38.942077 Date 2007.01.16 Thread ID... 253E019000000000 +005910 Member ID.... 03 Flags..... 000000 Entry Type..... 00000005 +005918 6D979696 936D8699 85856D81 93936D96 866D9695 856D8481 A3817CC1 C6F1F26D |_pool_free_all_of_one_data@AF12_| +005938 60606E4D F0F0F5F9 5D408699 85854DF0 A7F0F0F0 F0F0F0F0 F1F0F8F3 F5F8C1C2 |-->(0059) free(0x0000000108358AB| +005958 F05D4040 40404040 40404040 40404040 40404040 40404040 40404040 40404040 |0) | +005978 40404040 40404040 | | +005980 Time 21.22.38.942079 Date 2007.01.16 Thread ID... 253E019000000000 +005990 Member ID.... 03 Flags..... 000000 Entry Type..... 00000006 +005998 4C60604D F0F0F5F9 5D40D9F1 7EF0F0F0 F0F0F0F0 F0F0F0F0 F0F0F0F1 F240D9F2 |<--(0059) R1=0000000000000012 R2| +0059B8 7EF0F0F0 F0F0F0F0 F0F2F5F5 F7F4F6C4 F040D9F3 7EF0F0F0 F0F0F0F0 F1F0F8F3 |=00000000255746D0 R3=00000001083| +0059D8 F5F8C2C3 F040C5D9 D9D5D67E F0F0F0F0 F0F0F7F9 40C5D9D9 D5D6F27E C3F2F5C6 |58BC0 ERRNO=00000079 ERRNO2=C25F| +0059F8 F0F0F0F1 00000000 |0001.... | +005A00 Time 21.22.38.942080 Date 2007.01.16 Thread ID... 253E019000000000 +005A10 Member ID.... 03 Flags..... 000000 Entry Type..... 00000005 +005A18 6D848497 896D8699 85856D81 93936D96 866D9695 856D8995 86967CC1 C6F1F36D |_ddpi_free_all_of_one_info@AF13_| +005A38 60606E4D F0F0F5F9 5D408699 85854DF0 A7F0F0F0 F0F0F0F0 F1F0F8F3 C1F0F5C3 |-->(0059) free(0x00000001083A05C| +005A58 F05D4040 40404040 40404040 40404040 40404040 40404040 40404040 40404040 |0) | +005A78 40404040 40404040 | | +005A80 Time 21.22.38.942084 Date 2007.01.16 Thread ID... 253E019000000000 +005A90 Member ID.... 03 Flags..... 000000 Entry Type..... 00000006 +005A98 4C60604D F0F0F5F9 5D40D9F1 7EF0F0F0 F0F0F0F0 F0F0F0F0 F0F0F0F0 F240D9F2 |<--(0059) R1=0000000000000002 R2| +005AB8 7EF0F0F0 F0F0F0F0 F0F2F5F5 F7F4F6C4 F040D9F3 7EF0F0F0 F0F0F0F0 F0F0F0F0 |=00000000255746D0 R3=00000000000| +005AD8 F0F0F0F0 F040C5D9 D9D5D67E F0F0F0F0 F0F0F7F9 40C5D9D9 D5D6F27E C3F2F5C6 |00000 ERRNO=00000079 ERRNO2=C25F| +005AF8 F0F0F0F1 00000000 |0001.... | [8] Process Control Blocks: Thread Synchronization Process Latch Table (PPALT): 00000001_08911F00 +000000 00000001_08911F00 00000000 00000000 00000000 00000000 |................| +000010 00000001_08911F10 - +000000 00000001_089132FF same as above
Figure 176. Example of formatted output from LEDATA VERBEXIT (AMODE 64) (Part 3 of 10)
The following is part four of the example of formatted output from LEDATA VERBEXIT (AMODE 64).
Chapter 12. Using Language Environment AMODE 64 debugging facilities 365
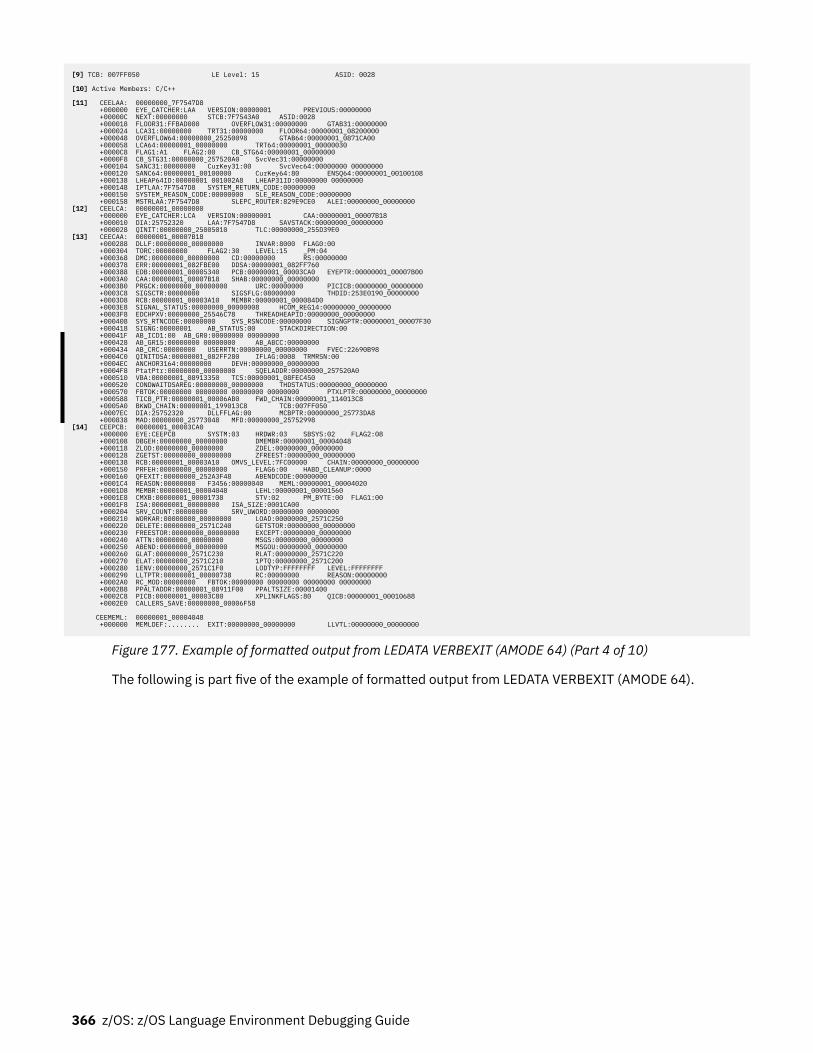
[9] TCB: 007FF050 LE Level: 15 ASID: 0028
[10] Active Members: C/C++
[11] CEELAA: 00000000_7F7547D8 +000000 EYE_CATCHER:LAA VERSION:00000001 PREVIOUS:00000000 +00000C NEXT:00000000 STCB:7F7543A0 ASID:0028 +000018 FLOOR31:FFBAD000 OVERFLOW31:00000000 GTAB31:00000000 +000024 LCA31:00000000 TRT31:00000000 FLOOR64:00000001_08200000 +000048 OVERFLOW64:00000000_25250098 GTAB64:00000001_0871CA00 +000058 LCA64:00000001_00000000 TRT64:00000001_00000030 +0000C8 FLAG1:A1 FLAG2:00 CB_STG64:00000001_00000000 +0000F8 CB_STG31:00000000_257520A0 SvcVec31:00000000 +000104 SANC31:00000000 CurKey31:00 SvcVec64:00000000 00000000 +000120 SANC64:00000001_00100000 CurKey64:80 ENSQ64:00000001_00100108 +000138 LHEAP64ID:00000001 001002A8 LHEAP31ID:00000000 00000000 +000148 IPTLAA:7F7547D8 SYSTEM_RETURN_CODE:00000000 +000150 SYSTEM_REASON_CODE:00000000 SLE_REASON_CODE:00000000 +000158 MSTRLAA:7F7547D8 SLEPC_ROUTER:829E9CE0 ALEI:00000000_00000000[12] CEELCA: 00000001_00000000 +000000 EYE_CATCHER:LCA VERSION:00000001 CAA:00000001_00007B18 +000010 DIA:25752320 LAA:7F7547D8 SAVSTACK:00000000_00000000 +000028 QINIT:00000000_25005010 TLC:00000000_255D39E0[13] CEECAA: 00000001_00007B18 +000288 DLLF:00000000_00000000 INVAR:8000 FLAG0:00 +000304 TORC:00000000 FLAG2:30 LEVEL:15 _PM:04 +000368 DMC:00000000_00000000 CD:00000000 RS:00000000 +000378 ERR:00000001_082FBE00 DDSA:00000001_082FF760 +000388 EDB:00000001_00005340 PCB:00000001_00003CA0 EYEPTR:00000001_00007B00 +0003A0 CAA:00000001_00007B18 SHAB:00000000_00000000 +0003B0 PRGCK:00000000_00000000 URC:00000000 PICICB:00000000_00000000 +0003C8 SIGSCTR:00000000 SIGSFLG:08000000 THDID:253E0190_00000000 +0003D8 RCB:00000001_00003A10 MEMBR:00000001_000084D0 +0003E8 SIGNAL_STATUS:00000000_00000008 HCOM_REG14:00000000_00000000 +0003F8 EDCHPXV:00000000_25546C78 THREADHEAPID:00000000_00000000 +000408 SYS_RTNCODE:00000000 SYS_RSNCODE:00000000 SIGNGPTR:00000001_00007F30 +000418 SIGNG:00000001 AB_STATUS:00 STACKDIRECTION:00 +00041F AB_ICD1:00 AB_GR0:00000000 00000000 +000428 AB_GR15:00000000 00000000 AB_ABCC:00000000 +000434 AB_CRC:00000000 USERRTN:00000000_00000000 FVEC:22690B98 +0004C0 QINITDSA:00000001_082FF280 IFLAG:0008 TRMRSN:00 +0004EC ANCHOR3164:00000000 DEVH:00000000_00000000 +0004F8 PtatPtr:00000000_00000000 SQELADDR:00000000_257520A0 +000510 VBA:00000001_08913350 TCS:00000001_08FEC450 +000520 CONDWAITDSAREG:00000000_00000000 THDSTATUS:00000000_00000000 +000570 FBTOK:00000000 00000000 00000000 00000000 PTXLPTR:00000000_00000000 +000588 TICB_PTR:00000001_00006AB0 FWD_CHAIN:00000001_114013C8 +0005A0 BKWD_CHAIN:00000001_199013C8 TCB:007FF050 +0007EC DIA:25752320 DLLFFLAG:00 MCBPTR:00000000_25773DA8 +000838 MAD:00000000_25773048 MFD:00000000_25752998[14] CEEPCB: 00000001_00003CA0 +000000 EYE:CEEPCB SYSTM:03 HRDWR:03 SBSYS:02 FLAG2:08 +000108 DBGEH:00000000_00000000 DMEMBR:00000001_00004048 +000118 ZLOD:00000000_00000000 ZDEL:00000000_00000000 +000128 ZGETST:00000000_00000000 ZFREEST:00000000_00000000 +000138 RCB:00000001_00003A10 OMVS_LEVEL:7FC00000 CHAIN:00000000_00000000 +000150 PRFEH:00000000_00000000 FLAG6:00 HABD_CLEANUP:0000 +000160 QFEXIT:00000000_252A3F48 ABENDCODE:00000000 +0001C4 REASON:00000000 F3456:00000040 MEML:00000001_00004020 +0001D8 MEMBR:00000001_00004048 LEHL:00000001_00001560 +0001E8 CMXB:00000001_00001738 STV:02 PM_BYTE:00 FLAG1:00 +0001F8 ISA:00000001_00000000 ISA_SIZE:0001CA00 +000204 SRV_COUNT:00000000 SRV_UWORD:00000000 00000000 +000210 WORKAR:00000000_00000000 LOAD:00000000_2571C250 +000220 DELETE:00000000_2571C240 GETSTOR:00000000_00000000 +000230 FREESTOR:00000000_00000000 EXCEPT:00000000_00000000 +000240 ATTN:00000000_00000000 MSGS:00000000_00000000 +000250 ABEND:00000000_00000000 MSGOU:00000000_00000000 +000260 GLAT:00000000_2571C230 RLAT:00000000_2571C220 +000270 ELAT:00000000_2571C210 1PTQ:00000000_2571C200 +000280 1ENV:00000000_2571C1F0 LODTYP:FFFFFFFF LEVEL:FFFFFFFF +000290 LLTPTR:00000001_00000738 RC:00000000 REASON:00000000 +0002A0 RC_MOD:00000000 FBTOK:00000000 00000000 00000000 00000000 +0002B8 PPALTADDR:00000001_08911F00 PPALTSIZE:00001400 +0002C8 PICB:00000001_00003C80 XPLINKFLAGS:80 QICB:00000001_00010688 +0002E0 CALLERS_SAVE:00000000_00006F58 CEEMEML: 00000001_00004048 +000000 MEMLDEF:........ EXIT:00000000_00000000 LLVTL:00000000_00000000
Figure 177. Example of formatted output from LEDATA VERBEXIT (AMODE 64) (Part 4 of 10)
The following is part five of the example of formatted output from LEDATA VERBEXIT (AMODE 64).
366 z/OS: z/OS Language Environment Debugging Guide
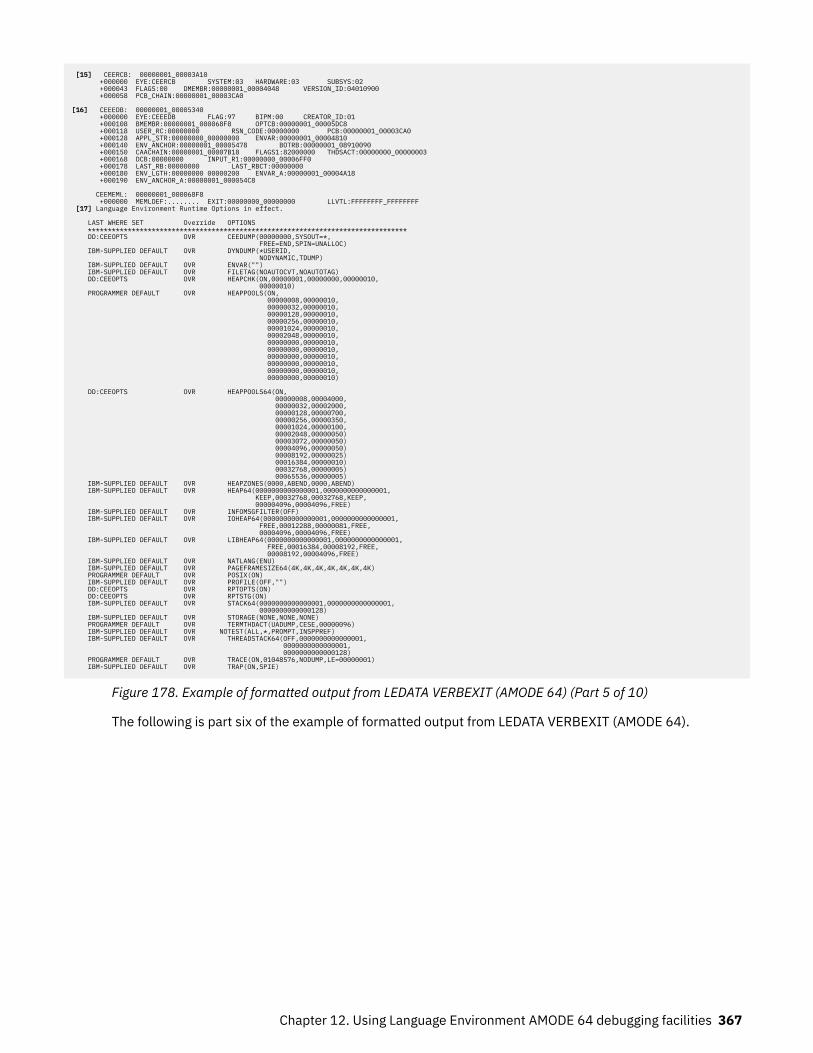
[15] CEERCB: 00000001_00003A10 +000000 EYE:CEERCB SYSTEM:03 HARDWARE:03 SUBSYS:02 +000043 FLAGS:00 DMEMBR:00000001_00004048 VERSION_ID:04010900 +000058 PCB_CHAIN:00000001_00003CA0 [16] CEEEDB: 00000001_00005340 +000000 EYE:CEEEDB FLAG:97 BIPM:00 CREATOR_ID:01 +000108 BMEMBR:00000001_000068F8 OPTCB:00000001_00005DC8 +000118 USER_RC:00000000 RSN_CODE:00000000 PCB:00000001_00003CA0 +000128 APPL_STR:00000000_00000000 ENVAR:00000001_00004810 +000140 ENV_ANCHOR:00000001_00005478 BOTRB:00000001_08910090 +000150 CAACHAIN:00000001_00007B18 FLAGS1:82000000 THDSACT:00000000_00000003 +000168 DCB:00000000 INPUT_R1:00000000_00006FF0 +000178 LAST_RB:00000000 LAST_RBCT:00000000 +000180 ENV_LGTH:00000000 00000200 ENVAR_A:00000001_00004A18 +000190 ENV_ANCHOR_A:00000001_000054C8 CEEMEML: 00000001_000068F8 +000000 MEMLDEF:........ EXIT:00000000_00000000 LLVTL:FFFFFFFF_FFFFFFFF [17] Language Environment Runtime Options in effect. LAST WHERE SET Override OPTIONS ******************************************************************************** DD:CEEOPTS OVR CEEDUMP(00000000,SYSOUT=*, FREE=END,SPIN=UNALLOC) IBM-SUPPLIED DEFAULT OVR DYNDUMP(*USERID, NODYNAMIC,TDUMP) IBM-SUPPLIED DEFAULT OVR ENVAR("") IBM-SUPPLIED DEFAULT OVR FILETAG(NOAUTOCVT,NOAUTOTAG) DD:CEEOPTS OVR HEAPCHK(ON,00000001,00000000,00000010, 00000010) PROGRAMMER DEFAULT OVR HEAPPOOLS(ON, 00000008,00000010, 00000032,00000010, 00000128,00000010, 00000256,00000010, 00001024,00000010, 00002048,00000010, 00000000,00000010, 00000000,00000010, 00000000,00000010, 00000000,00000010, 00000000,00000010, 00000000,00000010)
DD:CEEOPTS OVR HEAPPOOLS64(ON, 00000008,00004000, 00000032,00002000, 00000128,00000700, 00000256,00000350, 00001024,00000100, 00002048,00000050) 00003072,00000050) 00004096,00000050) 00008192,00000025) 00016384,00000010) 00032768,00000005) 00065536,00000005) IBM-SUPPLIED DEFAULT OVR HEAPZONES(0000,ABEND,0000,ABEND) IBM-SUPPLIED DEFAULT OVR HEAP64(0000000000000001,0000000000000001, KEEP,00032768,00032768,KEEP, 000004096,00004096,FREE) IBM-SUPPLIED DEFAULT OVR INFOMSGFILTER(OFF) IBM-SUPPLIED DEFAULT OVR IOHEAP64(0000000000000001,0000000000000001, FREE,00012288,00000081,FREE, 00004096,00004096,FREE) IBM-SUPPLIED DEFAULT OVR LIBHEAP64(0000000000000001,0000000000000001, FREE,00016384,00008192,FREE, 00008192,00004096,FREE) IBM-SUPPLIED DEFAULT OVR NATLANG(ENU) IBM-SUPPLIED DEFAULT OVR PAGEFRAMESIZE64(4K,4K,4K,4K,4K,4K,4K) PROGRAMMER DEFAULT OVR POSIX(ON) IBM-SUPPLIED DEFAULT OVR PROFILE(OFF,"") DD:CEEOPTS OVR RPTOPTS(ON) DD:CEEOPTS OVR RPTSTG(ON) IBM-SUPPLIED DEFAULT OVR STACK64(0000000000000001,0000000000000001, 0000000000000128) IBM-SUPPLIED DEFAULT OVR STORAGE(NONE,NONE,NONE) PROGRAMMER DEFAULT OVR TERMTHDACT(UADUMP,CESE,00000096) IBM-SUPPLIED DEFAULT OVR NOTEST(ALL,*,PROMPT,INSPPREF) IBM-SUPPLIED DEFAULT OVR THREADSTACK64(OFF,0000000000000001, 0000000000000001, 0000000000000128) PROGRAMMER DEFAULT OVR TRACE(ON,01048576,NODUMP,LE=00000001) IBM-SUPPLIED DEFAULT OVR TRAP(ON,SPIE)
Figure 178. Example of formatted output from LEDATA VERBEXIT (AMODE 64) (Part 5 of 10)
The following is part six of the example of formatted output from LEDATA VERBEXIT (AMODE 64).
Chapter 12. Using Language Environment AMODE 64 debugging facilities 367
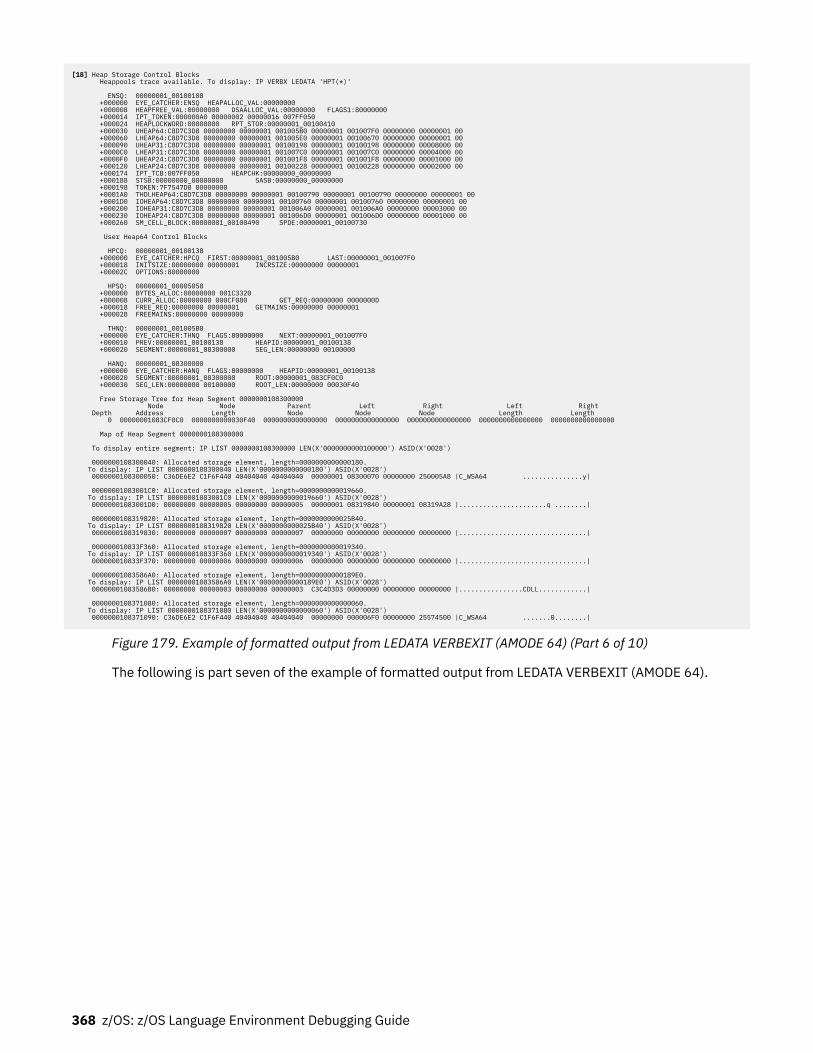
[18] Heap Storage Control Blocks Heappools trace available. To display: IP VERBX LEDATA 'HPT(*)' ENSQ: 00000001_00100108 +000000 EYE_CATCHER:ENSQ HEAPALLOC_VAL:00000000 +000008 HEAPFREE_VAL:00000000 DSAALLOC_VAL:00000000 FLAGS1:80000000 +000014 IPT_TOKEN:000000A0 00000002 00000016 007FF050 +000024 HEAPLOCKWORD:00000000 RPT_STOR:00000001_00100410 +000030 UHEAP64:C8D7C3D8 00000000 00000001 001005B0 00000001 001007F0 00000000 00000001 00 +000060 LHEAP64:C8D7C3D8 00000000 00000001 001005E0 00000001 00100670 00000000 00000001 00 +000090 UHEAP31:C8D7C3D8 00000000 00000001 00100198 00000001 00100198 00000000 00008000 00 +0000C0 LHEAP31:C8D7C3D8 00000000 00000001 001007C0 00000001 001007C0 00000000 00004000 00 +0000F0 UHEAP24:C8D7C3D8 00000000 00000001 001001F8 00000001 001001F8 00000000 00001000 00 +000120 LHEAP24:C8D7C3D8 00000000 00000001 00100228 00000001 00100228 00000000 00002000 00 +000174 IPT_TCB:007FF050 HEAPCHK:00000000_00000000 +000188 STSB:00000000_00000000 SASB:00000000_00000000 +000198 TOKEN:7F7547D8 00000000 +0001A0 THDLHEAP64:C8D7C3D8 00000000 00000001 00100790 00000001 00100790 00000000 00000001 00 +0001D0 IOHEAP64:C8D7C3D8 00000000 00000001 00100760 00000001 00100760 00000000 00000001 00 +000200 IOHEAP31:C8D7C3D8 00000000 00000001 001006A0 00000001 001006A0 00000000 00003000 00 +000230 IOHEAP24:C8D7C3D8 00000000 00000001 001006D0 00000001 001006D0 00000000 00001000 00 +000260 SM_CELL_BLOCK:00000001_00100490 SPDE:00000001_00100730 User Heap64 Control Blocks HPCQ: 00000001_00100138 +000000 EYE_CATCHER:HPCQ FIRST:00000001_001005B0 LAST:00000001_001007F0 +000018 INITSIZE:00000000 00000001 INCRSIZE:00000000 00000001 +00002C OPTIONS:80000000 HPSQ: 00000001_00005058 +000000 BYTES_ALLOC:00000000 001C3320 +000008 CURR_ALLOC:00000000 000CF080 GET_REQ:00000000 0000000D +000018 FREE_REQ:00000000 00000001 GETMAINS:00000000 00000001 +000028 FREEMAINS:00000000 00000000 THNQ: 00000001_001005B0 +000000 EYE_CATCHER:THNQ FLAGS:80000000 NEXT:00000001_001007F0 +000010 PREV:00000001_00100138 HEAPID:00000001_00100138 +000020 SEGMENT:00000001_08300000 SEG_LEN:00000000 00100000 HANQ: 00000001_08300000 +000000 EYE_CATCHER:HANQ FLAGS:80000000 HEAPID:00000001_00100138 +000020 SEGMENT:00000001_08300000 ROOT:00000001_083CF0C0 +000030 SEG_LEN:00000000 00100000 ROOT_LEN:00000000 00030F40 Free Storage Tree for Heap Segment 0000000108300000 Node Node Parent Left Right Left Right Depth Address Length Node Node Node Length Length 0 00000001083CF0C0 0000000000030F40 0000000000000000 0000000000000000 0000000000000000 0000000000000000 0000000000000000 Map of Heap Segment 0000000108300000 To display entire segment: IP LIST 0000000108300000 LEN(X'0000000000100000') ASID(X'0028') 0000000108300040: Allocated storage element, length=0000000000000180. To display: IP LIST 0000000108300040 LEN(X'0000000000000180') ASID(X'0028') 0000000108300050: C36DE6E2 C1F6F440 40404040 40404040 00000001 08300070 00000000 250005A8 |C_WSA64 ...............y| 00000001083001C0: Allocated storage element, length=0000000000019660. To display: IP LIST 00000001083001C0 LEN(X'0000000000019660') ASID(X'0028') 00000001083001D0: 00000000 00000005 00000000 00000005 00000001 08319840 00000001 08319A28 |......................q ........| 0000000108319820: Allocated storage element, length=0000000000025B40. To display: IP LIST 0000000108319820 LEN(X'0000000000025B40') ASID(X'0028') 0000000108319830: 00000000 00000007 00000000 00000007 00000000 00000000 00000000 00000000 |................................| 000000010833F360: Allocated storage element, length=0000000000019340. To display: IP LIST 000000010833F360 LEN(X'0000000000019340') ASID(X'0028') 000000010833F370: 00000000 00000006 00000000 00000006 00000000 00000000 00000000 00000000 |................................| 00000001083586A0: Allocated storage element, length=00000000000189E0. To display: IP LIST 00000001083586A0 LEN(X'00000000000189E0') ASID(X'0028') 00000001083586B0: 00000000 00000003 00000000 00000003 C3C4D3D3 00000000 00000000 00000000 |................CDLL............| 0000000108371080: Allocated storage element, length=0000000000000060. To display: IP LIST 0000000108371080 LEN(X'0000000000000060') ASID(X'0028') 0000000108371090: C36DE6E2 C1F6F440 40404040 40404040 00000000 000006F0 00000000 25574500 |C_WSA64 .......0........|
Figure 179. Example of formatted output from LEDATA VERBEXIT (AMODE 64) (Part 6 of 10)
The following is part seven of the example of formatted output from LEDATA VERBEXIT (AMODE 64).
368 z/OS: z/OS Language Environment Debugging Guide
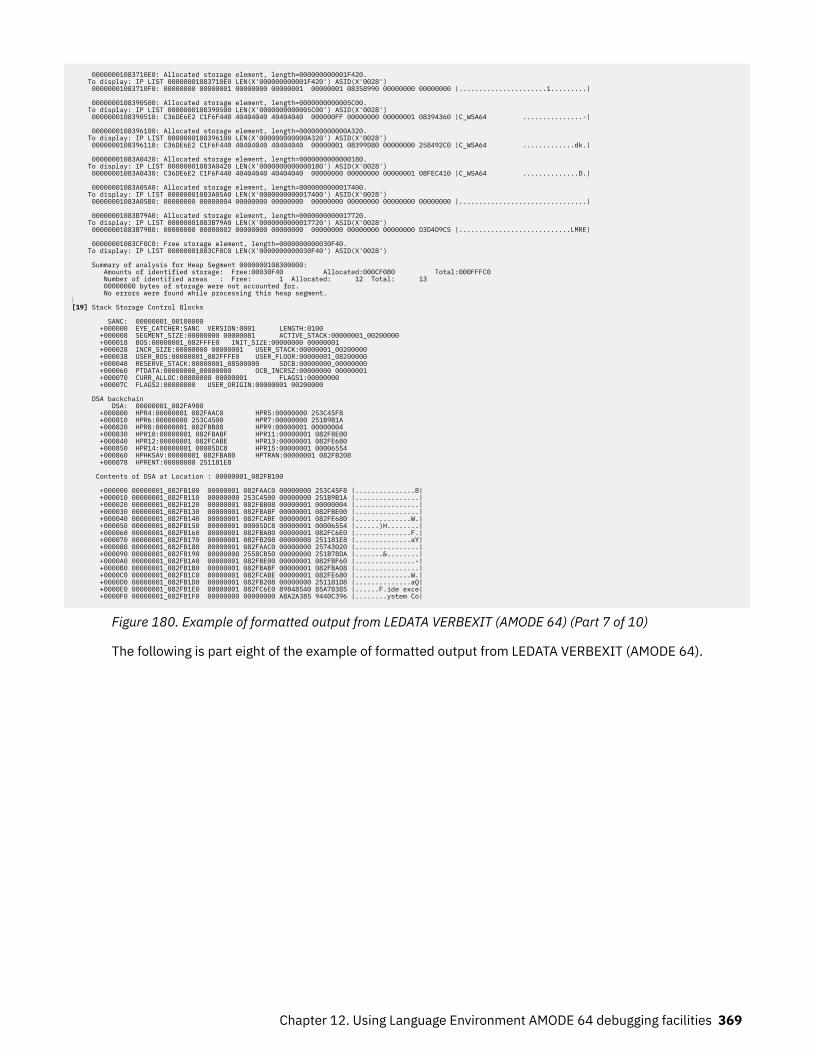
00000001083710E0: Allocated storage element, length=000000000001F420. To display: IP LIST 00000001083710E0 LEN(X'000000000001F420') ASID(X'0028') 00000001083710F0: 00000000 00000001 00000000 00000001 00000001 08358990 00000000 00000000 |......................i.........| 0000000108390500: Allocated storage element, length=0000000000005C00. To display: IP LIST 0000000108390500 LEN(X'0000000000005C00') ASID(X'0028') 0000000108390510: C36DE6E2 C1F6F440 40404040 40404040 000000FF 00000000 00000001 08394360 |C_WSA64 ...............-|
0000000108396100: Allocated storage element, length=000000000000A320. To display: IP LIST 0000000108396100 LEN(X'000000000000A320') ASID(X'0028') 0000000108396110: C36DE6E2 C1F6F440 40404040 40404040 00000001 08399D80 00000000 258492C0 |C_WSA64 .............dk.| 00000001083A0420: Allocated storage element, length=0000000000000180. To display: IP LIST 00000001083A0420 LEN(X'0000000000000180') ASID(X'0028') 00000001083A0430: C36DE6E2 C1F6F440 40404040 40404040 00000000 00000000 00000001 08FEC410 |C_WSA64 ..............D.| 00000001083A05A0: Allocated storage element, length=0000000000017400. To display: IP LIST 00000001083A05A0 LEN(X'0000000000017400') ASID(X'0028') 00000001083A05B0: 00000000 00000004 00000000 00000000 00000000 00000000 00000000 00000000 |................................| 00000001083B79A0: Allocated storage element, length=0000000000017720. To display: IP LIST 00000001083B79A0 LEN(X'0000000000017720') ASID(X'0028') 00000001083B79B0: 00000000 00000002 00000000 00000000 00000000 00000000 00000000 D3D4D9C5 |............................LMRE| 00000001083CF0C0: Free storage element, length=0000000000030F40. To display: IP LIST 00000001083CF0C0 LEN(X'0000000000030F40') ASID(X'0028') Summary of analysis for Heap Segment 0000000108300000: Amounts of identified storage: Free:00030F40 Allocated:000CF080 Total:000FFFC0 Number of identified areas : Free: 1 Allocated: 12 Total: 13 00000000 bytes of storage were not accounted for. No errors were found while processing this heap segment.⋮[19] Stack Storage Control Blocks SANC: 00000001_00100000 +000000 EYE_CATCHER:SANC VERSION:0001 LENGTH:0100 +000008 SEGMENT_SIZE:00000000 00000081 ACTIVE_STACK:00000001_00200000 +000018 BOS:00000001_082FFFE0 INIT_SIZE:00000000 00000001 +000028 INCR_SIZE:00000000 00000001 USER_STACK:00000001_00200000 +000038 USER_BOS:00000001_082FFFE0 USER_FLOOR:00000001_08200000 +000048 RESERVE_STACK:00000001_08500000 SDCB:00000000_00000000 +000060 PTDATA:00000000_00000000 OCB_INCRSZ:00000000 00000001 +000070 CURR_ALLOC:00000000 00000001 FLAGS1:00000000 +00007C FLAGS2:00000000 USER_ORIGIN:00000001 00200000 DSA backchain DSA: 00000001_082FA900 +000800 HPR4:00000001 082FAAC0 HPR5:00000000 253C45F8 +000810 HPR6:00000000 253C4500 HPR7:00000000 251B9B1A +000820 HPR8:00000001 082FBB08 HPR9:00000001 00000004 +000830 HPR10:00000001 082FBABF HPR11:00000001 082FBE00 +000840 HPR12:00000001 082FCABE HPR13:00000001 082FE680 +000850 HPR14:00000001 00005DC8 HPR15:00000001 00006554 +000860 HPHKSAV:00000001 082FBA80 HPTRAN:00000001 082FB208 +000878 HPRENT:00000000 251181E8 Contents of DSA at Location : 00000001_082FB100 +000000 00000001_082FB100 00000001 082FAAC0 00000000 253C45F8 |...............8| +000010 00000001_082FB110 00000000 253C4500 00000000 251B9B1A |................| +000020 00000001_082FB120 00000001 082FBB08 00000001 00000004 |................| +000030 00000001_082FB130 00000001 082FBABF 00000001 082FBE00 |................| +000040 00000001_082FB140 00000001 082FCABE 00000001 082FE680 |..............W.| +000050 00000001_082FB150 00000001 00005DC8 00000001 00006554 |......)H........| +000060 00000001_082FB160 00000001 082FBA80 00000001 082FC6E0 |..............F.| +000070 00000001_082FB170 00000001 082FB208 00000000 251181E8 |..............aY| +000080 00000001_082FB180 00000001 082FAAC0 00000000 25743020 |................| +000090 00000001_082FB190 00000000 2558CB50 00000000 251B78DA |.......&........| +0000A0 00000001_082FB1A0 00000001 082FBE00 00000001 082FBF60 |...............-| +0000B0 00000001_082FB1B0 00000001 082FBABF 00000001 082FBA08 |................| +0000C0 00000001_082FB1C0 00000001 082FCABE 00000001 082FE680 |..............W.| +0000D0 00000001_082FB1D0 00000001 082FB208 00000000 251181D8 |..............aQ| +0000E0 00000001_082FB1E0 00000001 082FC6E0 89848540 85A78385 |......F.ide exce| +0000F0 00000001_082FB1F0 00000000 00000000 A8A2A385 9440C396 |........ystem Co|
Figure 180. Example of formatted output from LEDATA VERBEXIT (AMODE 64) (Part 7 of 10)
The following is part eight of the example of formatted output from LEDATA VERBEXIT (AMODE 64).
Chapter 12. Using Language Environment AMODE 64 debugging facilities 369
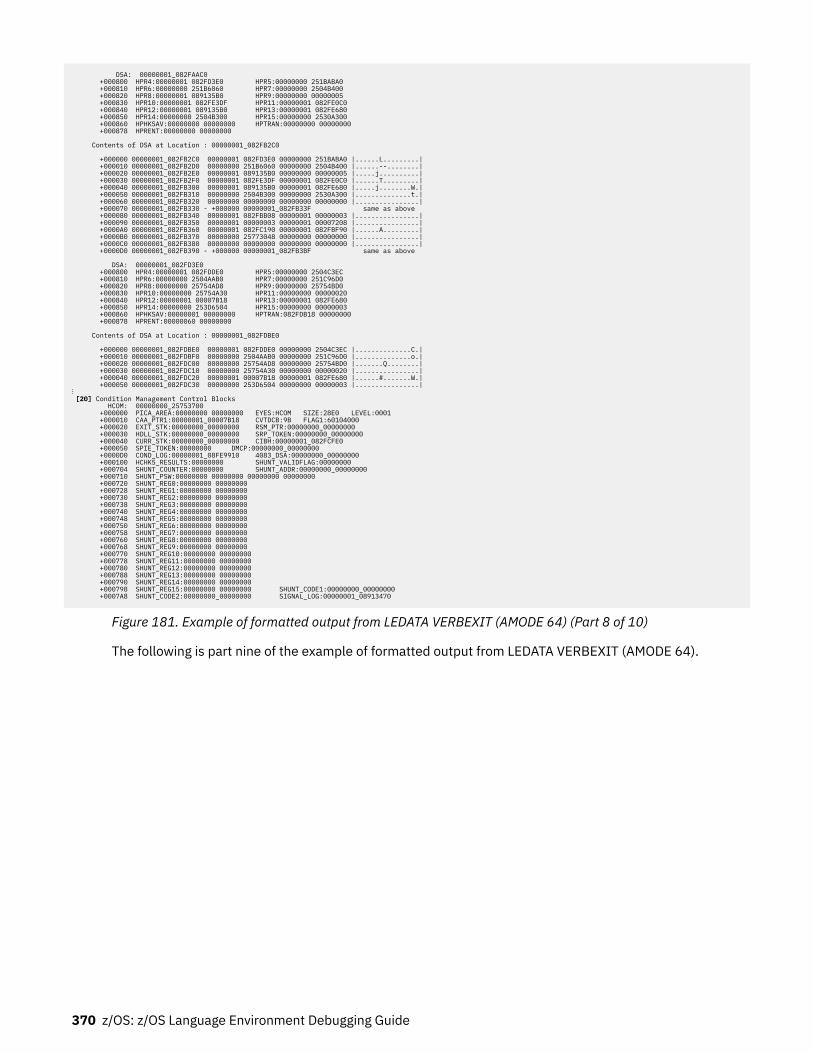
DSA: 00000001_082FAAC0 +000800 HPR4:00000001 082FD3E0 HPR5:00000000 251BABA0 +000810 HPR6:00000000 251B6060 HPR7:00000000 2504B400 +000820 HPR8:00000001 089135B0 HPR9:00000000 00000005 +000830 HPR10:00000001 082FE3DF HPR11:00000001 082FE0C0 +000840 HPR12:00000001 089135B0 HPR13:00000001 082FE680 +000850 HPR14:00000000 2504B300 HPR15:00000000 2530A300 +000860 HPHKSAV:00000000 00000000 HPTRAN:00000000 00000000 +000878 HPRENT:00000000 00000000 Contents of DSA at Location : 00000001_082FB2C0 +000000 00000001_082FB2C0 00000001 082FD3E0 00000000 251BABA0 |......L.........| +000010 00000001_082FB2D0 00000000 251B6060 00000000 2504B400 |......--........| +000020 00000001_082FB2E0 00000001 089135B0 00000000 00000005 |.....j..........| +000030 00000001_082FB2F0 00000001 082FE3DF 00000001 082FE0C0 |......T.........| +000040 00000001_082FB300 00000001 089135B0 00000001 082FE680 |.....j........W.| +000050 00000001_082FB310 00000000 2504B300 00000000 2530A300 |..............t.| +000060 00000001_082FB320 00000000 00000000 00000000 00000000 |................| +000070 00000001_082FB330 - +000000 00000001_082FB33F same as above +000080 00000001_082FB340 00000001 082FBB08 00000001 00000003 |................| +000090 00000001_082FB350 00000001 00000003 00000001 00007208 |................| +0000A0 00000001_082FB360 00000001 082FC190 00000001 082FBF90 |......A.........| +0000B0 00000001_082FB370 00000000 25773048 00000000 00000000 |................| +0000C0 00000001_082FB380 00000000 00000000 00000000 00000000 |................| +0000D0 00000001_082FB390 - +000000 00000001_082FB3BF same as above
DSA: 00000001_082FD3E0 +000800 HPR4:00000001 082FDDE0 HPR5:00000000 2504C3EC +000810 HPR6:00000000 2504AAB0 HPR7:00000000 251C96D0 +000820 HPR8:00000000 25754AD8 HPR9:00000000 25754BD0 +000830 HPR10:00000000 25754A30 HPR11:00000000 00000020 +000840 HPR12:00000001 00007B18 HPR13:00000001 082FE680 +000850 HPR14:00000000 253D6504 HPR15:00000000 00000003 +000860 HPHKSAV:00000001 00000000 HPTRAN:082FDB18 00000000 +000878 HPRENT:00000060 00000000 Contents of DSA at Location : 00000001_082FDBE0 +000000 00000001_082FDBE0 00000001 082FDDE0 00000000 2504C3EC |..............C.| +000010 00000001_082FDBF0 00000000 2504AAB0 00000000 251C96D0 |..............o.| +000020 00000001_082FDC00 00000000 25754AD8 00000000 25754BD0 |.......Q........| +000030 00000001_082FDC10 00000000 25754A30 00000000 00000020 |................| +000040 00000001_082FDC20 00000001 00007B18 00000001 082FE680 |......#.......W.| +000050 00000001_082FDC30 00000000 253D6504 00000000 00000003 |................|⋮ [20] Condition Management Control Blocks HCOM: 00000000_25753700 +000000 PICA_AREA:00000000 00000000 EYES:HCOM SIZE:28E0 LEVEL:0001 +000010 CAA_PTR1:00000001_00007B18 CVTDCB:9B FLAG1:60104000 +000020 EXIT_STK:00000000_00000000 RSM_PTR:00000000_00000000 +000030 HDLL_STK:00000000_00000000 SRP_TOKEN:00000000_00000000 +000040 CURR_STK:00000000_00000000 CIBH:00000001_082FCFE0 +000050 SPIE_TOKEN:00000000 DMCP:00000000_00000000 +0000D0 COND_LOG:00000001_08FE9910 4083_DSA:00000000_00000000 +000100 HCHK5_RESULTS:00000000 SHUNT_VALIDFLAG:00000000 +000704 SHUNT_COUNTER:00000000 SHUNT_ADDR:00000000_00000000 +000710 SHUNT_PSW:00000000 00000000 00000000 00000000 +000720 SHUNT_REG0:00000000 00000000 +000728 SHUNT_REG1:00000000 00000000 +000730 SHUNT_REG2:00000000 00000000 +000738 SHUNT_REG3:00000000 00000000 +000740 SHUNT_REG4:00000000 00000000 +000748 SHUNT_REG5:00000000 00000000 +000750 SHUNT_REG6:00000000 00000000 +000758 SHUNT_REG7:00000000 00000000 +000760 SHUNT_REG8:00000000 00000000 +000768 SHUNT_REG9:00000000 00000000 +000770 SHUNT_REG10:00000000 00000000 +000778 SHUNT_REG11:00000000 00000000 +000780 SHUNT_REG12:00000000 00000000 +000788 SHUNT_REG13:00000000 00000000 +000790 SHUNT_REG14:00000000 00000000 +000798 SHUNT_REG15:00000000 00000000 SHUNT_CODE1:00000000_00000000 +0007A8 SHUNT_CODE2:00000000_00000000 SIGNAL_LOG:00000001_08913470
Figure 181. Example of formatted output from LEDATA VERBEXIT (AMODE 64) (Part 8 of 10)
The following is part nine of the example of formatted output from LEDATA VERBEXIT (AMODE 64).
370 z/OS: z/OS Language Environment Debugging Guide
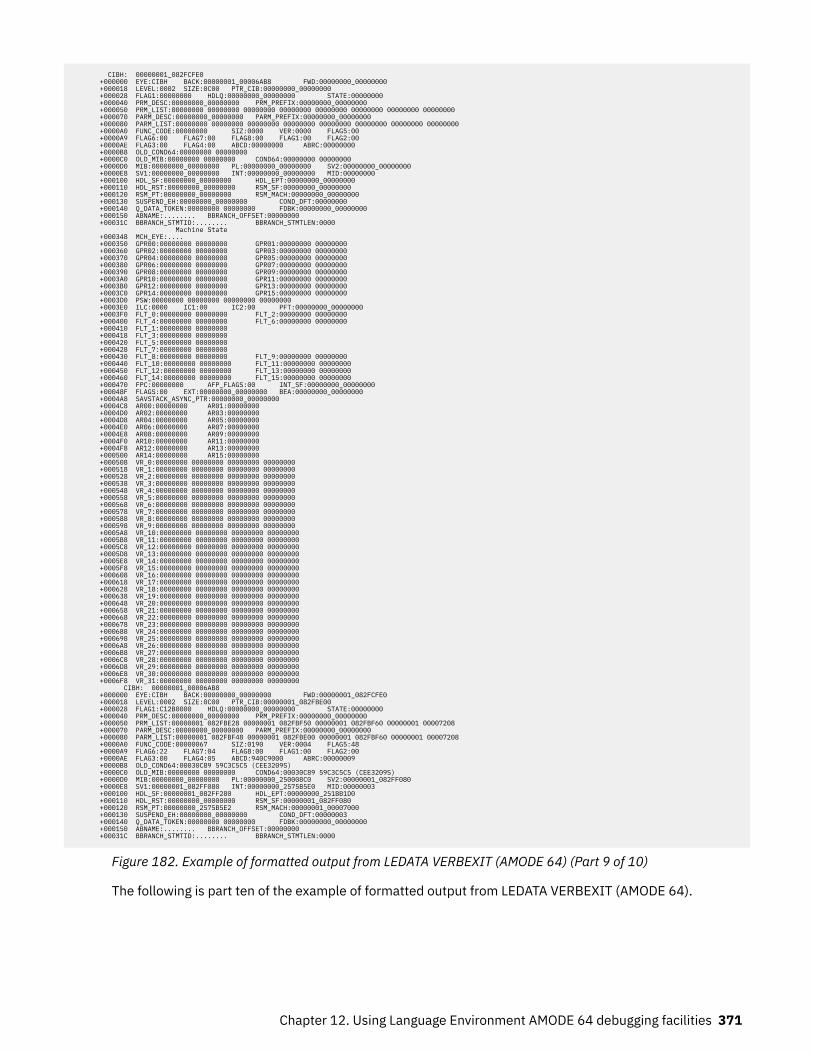
CIBH: 00000001_082FCFE0 +000000 EYE:CIBH BACK:00000001_00006AB8 FWD:00000000_00000000 +000018 LEVEL:0002 SIZE:0C00 PTR_CIB:00000000_00000000 +000028 FLAG1:00000000 HDLQ:00000000_00000000 STATE:00000000 +000040 PRM_DESC:00000000_00000000 PRM_PREFIX:00000000_00000000 +000050 PRM_LIST:00000000 00000000 00000000 00000000 00000000 00000000 00000000 00000000 +000070 PARM_DESC:00000000_00000000 PARM_PREFIX:00000000_00000000 +000080 PARM_LIST:00000000 00000000 00000000 00000000 00000000 00000000 00000000 00000000 +0000A0 FUNC_CODE:00000000 SIZ:0000 VER:0000 FLAG5:00 +0000A9 FLAG6:00 FLAG7:00 FLAG8:00 FLAG1:00 FLAG2:00 +0000AE FLAG3:00 FLAG4:00 ABCD:00000000 ABRC:00000000 +0000B8 OLD_COND64:00000000 00000000 +0000C0 OLD_MIB:00000000 00000000 COND64:00000000 00000000 +0000D0 MIB:00000000_00000000 PL:00000000_00000000 SV2:00000000_00000000 +0000E8 SV1:00000000_00000000 INT:00000000_00000000 MID:00000000 +000100 HDL_SF:00000000_00000000 HDL_EPT:00000000_00000000 +000110 HDL_RST:00000000_00000000 RSM_SF:00000000_00000000 +000120 RSM_PT:00000000_00000000 RSM_MACH:00000000_00000000 +000130 SUSPEND_EH:00000000_00000000 COND_DFT:00000000 +000140 Q_DATA_TOKEN:00000000 00000000 FDBK:00000000_00000000 +000150 ABNAME:........ BBRANCH_OFFSET:00000000 +00031C BBRANCH_STMTID:........ BBRANCH_STMTLEN:0000 Machine State +000348 MCH_EYE:.... +000350 GPR00:00000000 00000000 GPR01:00000000 00000000 +000360 GPR02:00000000 00000000 GPR03:00000000 00000000 +000370 GPR04:00000000 00000000 GPR05:00000000 00000000 +000380 GPR06:00000000 00000000 GPR07:00000000 00000000 +000390 GPR08:00000000 00000000 GPR09:00000000 00000000 +0003A0 GPR10:00000000 00000000 GPR11:00000000 00000000 +0003B0 GPR12:00000000 00000000 GPR13:00000000 00000000 +0003C0 GPR14:00000000 00000000 GPR15:00000000 00000000 +0003D0 PSW:00000000 00000000 00000000 00000000 +0003E0 ILC:0000 IC1:00 IC2:00 PFT:00000000_00000000 +0003F0 FLT_0:00000000 00000000 FLT_2:00000000 00000000 +000400 FLT_4:00000000 00000000 FLT_6:00000000 00000000 +000410 FLT_1:00000000 00000000 +000418 FLT_3:00000000 00000000 +000420 FLT_5:00000000 00000000 +000428 FLT_7:00000000 00000000 +000430 FLT_8:00000000 00000000 FLT_9:00000000 00000000 +000440 FLT_10:00000000 00000000 FLT_11:00000000 00000000 +000450 FLT_12:00000000 00000000 FLT_13:00000000 00000000 +000460 FLT_14:00000000 00000000 FLT_15:00000000 00000000 +000470 FPC:00000000 AFP_FLAGS:00 INT_SF:00000000_00000000 +00048F FLAGS:00 EXT:00000000_00000000 BEA:00000000_00000000 +0004A8 SAVSTACK_ASYNC_PTR:00000000_00000000 +0004C8 AR00:00000000 AR01:00000000 +0004D0 AR02:00000000 AR03:00000000 +0004D8 AR04:00000000 AR05:00000000 +0004E0 AR06:00000000 AR07:00000000 +0004E8 AR08:00000000 AR09:00000000 +0004F0 AR10:00000000 AR11:00000000 +0004F8 AR12:00000000 AR13:00000000 +000500 AR14:00000000 AR15:00000000 +000508 VR_0:00000000 00000000 00000000 00000000 +000518 VR_1:00000000 00000000 00000000 00000000 +000528 VR_2:00000000 00000000 00000000 00000000 +000538 VR_3:00000000 00000000 00000000 00000000 +000548 VR_4:00000000 00000000 00000000 00000000 +000558 VR_5:00000000 00000000 00000000 00000000 +000568 VR_6:00000000 00000000 00000000 00000000 +000578 VR_7:00000000 00000000 00000000 00000000 +000588 VR_8:00000000 00000000 00000000 00000000 +000598 VR_9:00000000 00000000 00000000 00000000 +0005A8 VR_10:00000000 00000000 00000000 00000000 +0005B8 VR_11:00000000 00000000 00000000 00000000 +0005C8 VR_12:00000000 00000000 00000000 00000000 +0005D8 VR_13:00000000 00000000 00000000 00000000 +0005E8 VR_14:00000000 00000000 00000000 00000000 +0005F8 VR_15:00000000 00000000 00000000 00000000 +000608 VR_16:00000000 00000000 00000000 00000000 +000618 VR_17:00000000 00000000 00000000 00000000 +000628 VR_18:00000000 00000000 00000000 00000000 +000638 VR_19:00000000 00000000 00000000 00000000 +000648 VR_20:00000000 00000000 00000000 00000000 +000658 VR_21:00000000 00000000 00000000 00000000 +000668 VR_22:00000000 00000000 00000000 00000000 +000678 VR_23:00000000 00000000 00000000 00000000 +000688 VR_24:00000000 00000000 00000000 00000000 +000698 VR_25:00000000 00000000 00000000 00000000 +0006A8 VR_26:00000000 00000000 00000000 00000000 +0006B8 VR_27:00000000 00000000 00000000 00000000 +0006C8 VR_28:00000000 00000000 00000000 00000000 +0006D8 VR_29:00000000 00000000 00000000 00000000 +0006E8 VR_30:00000000 00000000 00000000 00000000 +0006F8 VR_31:00000000 00000000 00000000 00000000 CIBH: 00000001_00006AB8 +000000 EYE:CIBH BACK:00000000_00000000 FWD:00000001_082FCFE0 +000018 LEVEL:0002 SIZE:0C00 PTR_CIB:00000001_082FBE00 +000028 FLAG1:C12B0000 HDLQ:00000000_00000000 STATE:00000000 +000040 PRM_DESC:00000000_00000000 PRM_PREFIX:00000000_00000000 +000050 PRM_LIST:00000001 082FBE28 00000001 082FBF50 00000001 082FBF60 00000001 00007208 +000070 PARM_DESC:00000000_00000000 PARM_PREFIX:00000000_00000000 +000080 PARM_LIST:00000001 082FBF48 00000001 082FBE00 00000001 082FBF60 00000001 00007208 +0000A0 FUNC_CODE:00000067 SIZ:0190 VER:0004 FLAG5:48 +0000A9 FLAG6:22 FLAG7:04 FLAG8:00 FLAG1:00 FLAG2:00 +0000AE FLAG3:00 FLAG4:05 ABCD:940C9000 ABRC:00000009 +0000B8 OLD_COND64:00030C89 59C3C5C5 (CEE3209S) +0000C0 OLD_MIB:00000000 00000000 COND64:00030C89 59C3C5C5 (CEE3209S) +0000D0 MIB:00000000_00000000 PL:00000000_250008C0 SV2:00000001_082FF080 +0000E8 SV1:00000001_082FF080 INT:00000000_2575B5E0 MID:00000003 +000100 HDL_SF:00000001_082FF280 HDL_EPT:00000000_251BB1D0 +000110 HDL_RST:00000000_00000000 RSM_SF:00000001_082FF080 +000120 RSM_PT:00000000_2575B5E2 RSM_MACH:00000001_00007000 +000130 SUSPEND_EH:00000000_00000000 COND_DFT:00000003 +000140 Q_DATA_TOKEN:00000000 00000000 FDBK:00000000_00000000 +000150 ABNAME:........ BBRANCH_OFFSET:00000000 +00031C BBRANCH_STMTID:........ BBRANCH_STMTLEN:0000
Figure 182. Example of formatted output from LEDATA VERBEXIT (AMODE 64) (Part 9 of 10)
The following is part ten of the example of formatted output from LEDATA VERBEXIT (AMODE 64).
Chapter 12. Using Language Environment AMODE 64 debugging facilities 371
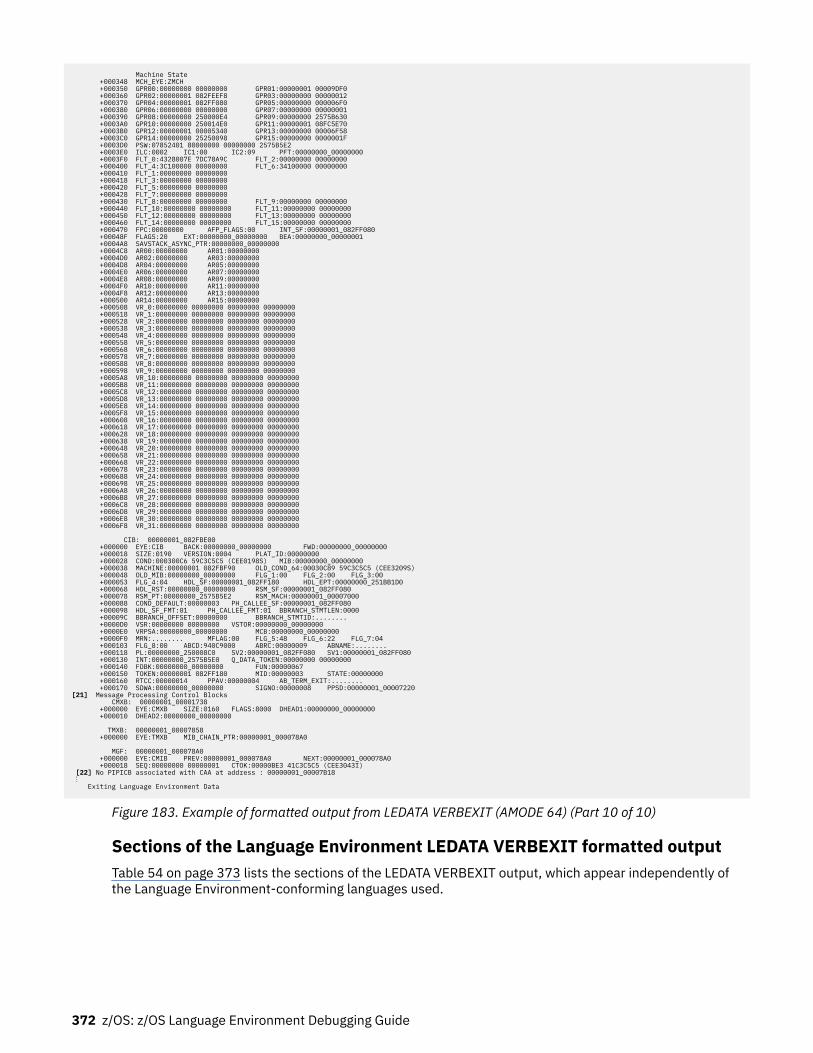
Machine State +000348 MCH_EYE:ZMCH +000350 GPR00:00000000 00000000 GPR01:00000001 00009DF0 +000360 GPR02:00000001 082FEEF8 GPR03:00000000 00000012 +000370 GPR04:00000001 082FF080 GPR05:00000000 000006F0 +000380 GPR06:00000000 00000000 GPR07:00000000 00000001 +000390 GPR08:00000000 250000E4 GPR09:00000000 2575B630 +0003A0 GPR10:00000000 250014E0 GPR11:00000001 08FC5E70 +0003B0 GPR12:00000001 00005340 GPR13:00000000 00006F58 +0003C0 GPR14:00000000 25250098 GPR15:00000000 0000001F +0003D0 PSW:07852401 80000000 00000000 2575B5E2 +0003E0 ILC:0002 IC1:00 IC2:09 PFT:00000000_00000000 +0003F0 FLT_0:4328007E 7DC78A9C FLT_2:00000000 00000000 +000400 FLT_4:3C100000 00000000 FLT_6:34100000 00000000 +000410 FLT_1:00000000 00000000 +000418 FLT_3:00000000 00000000 +000420 FLT_5:00000000 00000000 +000428 FLT_7:00000000 00000000 +000430 FLT_8:00000000 00000000 FLT_9:00000000 00000000 +000440 FLT_10:00000000 00000000 FLT_11:00000000 00000000 +000450 FLT_12:00000000 00000000 FLT_13:00000000 00000000 +000460 FLT_14:00000000 00000000 FLT_15:00000000 00000000 +000470 FPC:00000000 AFP_FLAGS:00 INT_SF:00000001_082FF080 +00048F FLAGS:20 EXT:00000000_00000000 BEA:00000000_00000001 +0004A8 SAVSTACK_ASYNC_PTR:00000000_00000000 +0004C8 AR00:00000000 AR01:00000000 +0004D0 AR02:00000000 AR03:00000000 +0004D8 AR04:00000000 AR05:00000000 +0004E0 AR06:00000000 AR07:00000000 +0004E8 AR08:00000000 AR09:00000000 +0004F0 AR10:00000000 AR11:00000000 +0004F8 AR12:00000000 AR13:00000000 +000500 AR14:00000000 AR15:00000000 +000508 VR_0:00000000 00000000 00000000 00000000 +000518 VR_1:00000000 00000000 00000000 00000000 +000528 VR_2:00000000 00000000 00000000 00000000 +000538 VR_3:00000000 00000000 00000000 00000000 +000548 VR_4:00000000 00000000 00000000 00000000 +000558 VR_5:00000000 00000000 00000000 00000000 +000568 VR_6:00000000 00000000 00000000 00000000 +000578 VR_7:00000000 00000000 00000000 00000000 +000588 VR_8:00000000 00000000 00000000 00000000 +000598 VR_9:00000000 00000000 00000000 00000000 +0005A8 VR_10:00000000 00000000 00000000 00000000 +0005B8 VR_11:00000000 00000000 00000000 00000000 +0005C8 VR_12:00000000 00000000 00000000 00000000 +0005D8 VR_13:00000000 00000000 00000000 00000000 +0005E8 VR_14:00000000 00000000 00000000 00000000 +0005F8 VR_15:00000000 00000000 00000000 00000000 +000608 VR_16:00000000 00000000 00000000 00000000 +000618 VR_17:00000000 00000000 00000000 00000000 +000628 VR_18:00000000 00000000 00000000 00000000 +000638 VR_19:00000000 00000000 00000000 00000000 +000648 VR_20:00000000 00000000 00000000 00000000 +000658 VR_21:00000000 00000000 00000000 00000000 +000668 VR_22:00000000 00000000 00000000 00000000 +000678 VR_23:00000000 00000000 00000000 00000000 +000688 VR_24:00000000 00000000 00000000 00000000 +000698 VR_25:00000000 00000000 00000000 00000000 +0006A8 VR_26:00000000 00000000 00000000 00000000 +0006B8 VR_27:00000000 00000000 00000000 00000000 +0006C8 VR_28:00000000 00000000 00000000 00000000 +0006D8 VR_29:00000000 00000000 00000000 00000000 +0006E8 VR_30:00000000 00000000 00000000 00000000 +0006F8 VR_31:00000000 00000000 00000000 00000000
CIB: 00000001_082FBE00 +000000 EYE:CIB BACK:00000000_00000000 FWD:00000000_00000000 +000018 SIZE:0190 VERSION:0004 PLAT_ID:00000000 +000028 COND:000300C6 59C3C5C5 (CEE0198S) MIB:00000000_00000000 +000038 MACHINE:00000001 082FBF90 OLD_COND_64:00030C89 59C3C5C5 (CEE3209S) +000048 OLD_MIB:00000000_00000000 FLG_1:00 FLG_2:00 FLG_3:00 +000053 FLG_4:04 HDL_SF:00000001_082FF180 HDL_EPT:00000000_251BB1D0 +000068 HDL_RST:00000000_00000000 RSM_SF:00000001_082FF080 +000078 RSM_PT:00000000_2575B5E2 RSM_MACH:00000001_00007000 +000088 COND_DEFAULT:00000003 PH_CALLEE_SF:00000001_082FF080 +000098 HDL_SF_FMT:01 PH_CALLEE_FMT:01 BBRANCH_STMTLEN:0000 +00009C BBRANCH_OFFSET:00000000 BBRANCH_STMTID:........ +0000D0 VSR:00000000 00000000 VSTOR:00000000_00000000 +0000E0 VRPSA:00000000_00000000 MCB:00000000_00000000 +0000F0 MRN:........ MFLAG:00 FLG_5:48 FLG_6:22 FLG_7:04 +000103 FLG_8:00 ABCD:940C9000 ABRC:00000009 ABNAME:........ +000118 PL:00000000_250008C0 SV2:00000001_082FF080 SV1:00000001_082FF080 +000130 INT:00000000_2575B5E0 Q_DATA_TOKEN:00000000 00000000 +000140 FDBK:00000000_00000000 FUN:00000067 +000150 TOKEN:00000001 082FF180 MID:00000003 STATE:00000000 +000160 RTCC:00000014 PPAV:00000004 AB_TERM_EXIT:........ +000170 SDWA:00000000_00000000 SIGNO:00000008 PPSD:00000001_00007220 [21] Message Processing Control Blocks CMXB: 00000001_00001738 +000000 EYE:CMXB SIZE:0160 FLAGS:8000 DHEAD1:00000000_00000000 +000010 DHEAD2:00000000_00000000 TMXB: 00000001_00007858 +000000 EYE:TMXB MIB_CHAIN_PTR:00000001_000078A0 MGF: 00000001_000078A0 +000000 EYE:CMIB PREV:00000001_000078A0 NEXT:00000001_000078A0 +000018 SEQ:00000000 00000001 CTOK:00000BE3 41C3C5C5 (CEE3043I) [22] No PIPICB associated with CAA at address : 00000001_00007B18 ⋮ Exiting Language Environment Data
Figure 183. Example of formatted output from LEDATA VERBEXIT (AMODE 64) (Part 10 of 10)
Sections of the Language Environment LEDATA VERBEXIT formatted outputTable 54 on page 373 lists the sections of the LEDATA VERBEXIT output, which appear independently ofthe Language Environment-conforming languages used.
372 z/OS: z/OS Language Environment Debugging Guide
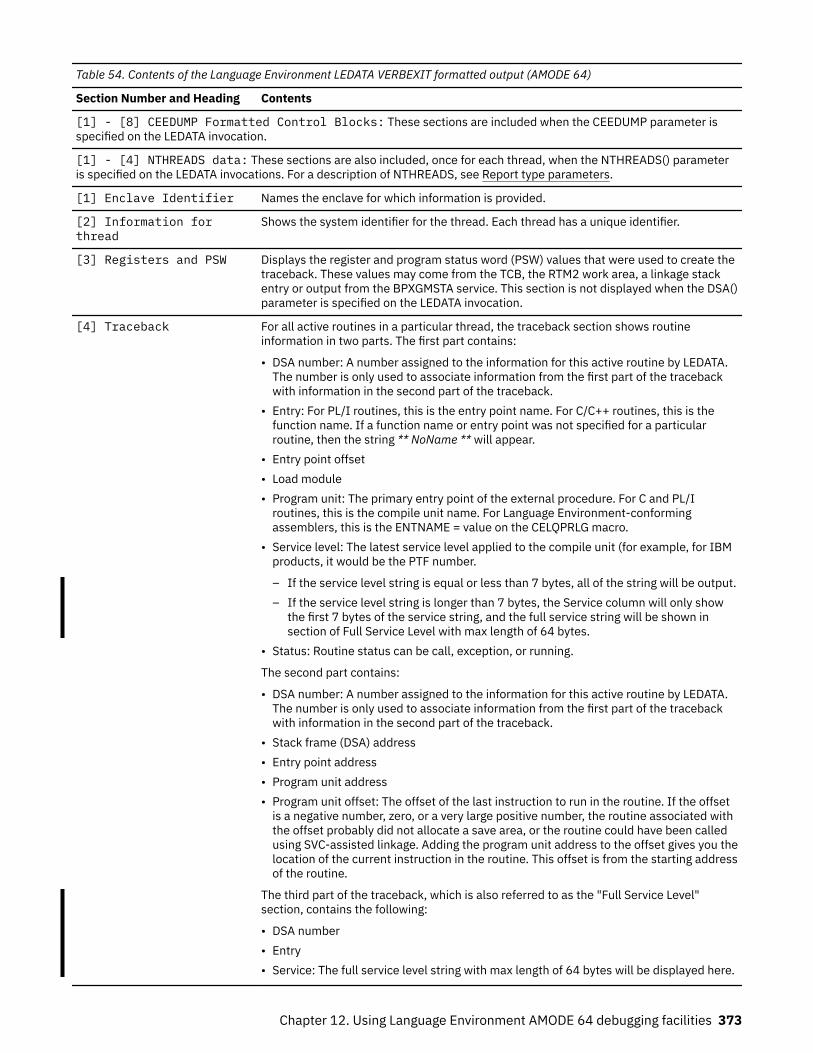
Table 54. Contents of the Language Environment LEDATA VERBEXIT formatted output (AMODE 64)
Section Number and Heading Contents
[1] - [8] CEEDUMP Formatted Control Blocks: These sections are included when the CEEDUMP parameter isspecified on the LEDATA invocation.
[1] - [4] NTHREADS data: These sections are also included, once for each thread, when the NTHREADS() parameteris specified on the LEDATA invocations. For a description of NTHREADS, see Report type parameters.
[1] Enclave Identifier Names the enclave for which information is provided.
[2] Information forthread
Shows the system identifier for the thread. Each thread has a unique identifier.
[3] Registers and PSW Displays the register and program status word (PSW) values that were used to create thetraceback. These values may come from the TCB, the RTM2 work area, a linkage stackentry or output from the BPXGMSTA service. This section is not displayed when the DSA()parameter is specified on the LEDATA invocation.
[4] Traceback For all active routines in a particular thread, the traceback section shows routineinformation in two parts. The first part contains:
• DSA number: A number assigned to the information for this active routine by LEDATA.The number is only used to associate information from the first part of the tracebackwith information in the second part of the traceback.
• Entry: For PL/I routines, this is the entry point name. For C/C++ routines, this is thefunction name. If a function name or entry point was not specified for a particularroutine, then the string ** NoName ** will appear.
• Entry point offset• Load module• Program unit: The primary entry point of the external procedure. For C and PL/I
routines, this is the compile unit name. For Language Environment-conformingassemblers, this is the ENTNAME = value on the CELQPRLG macro.
• Service level: The latest service level applied to the compile unit (for example, for IBMproducts, it would be the PTF number.
– If the service level string is equal or less than 7 bytes, all of the string will be output.– If the service level string is longer than 7 bytes, the Service column will only show
the first 7 bytes of the service string, and the full service string will be shown insection of Full Service Level with max length of 64 bytes.
• Status: Routine status can be call, exception, or running.
The second part contains:
• DSA number: A number assigned to the information for this active routine by LEDATA.The number is only used to associate information from the first part of the tracebackwith information in the second part of the traceback.
• Stack frame (DSA) address• Entry point address• Program unit address• Program unit offset: The offset of the last instruction to run in the routine. If the offset
is a negative number, zero, or a very large positive number, the routine associated withthe offset probably did not allocate a save area, or the routine could have been calledusing SVC-assisted linkage. Adding the program unit address to the offset gives you thelocation of the current instruction in the routine. This offset is from the starting addressof the routine.
The third part of the traceback, which is also referred to as the "Full Service Level"section, contains the following:
• DSA number• Entry• Service: The full service level string with max length of 64 bytes will be displayed here.
Chapter 12. Using Language Environment AMODE 64 debugging facilities 373
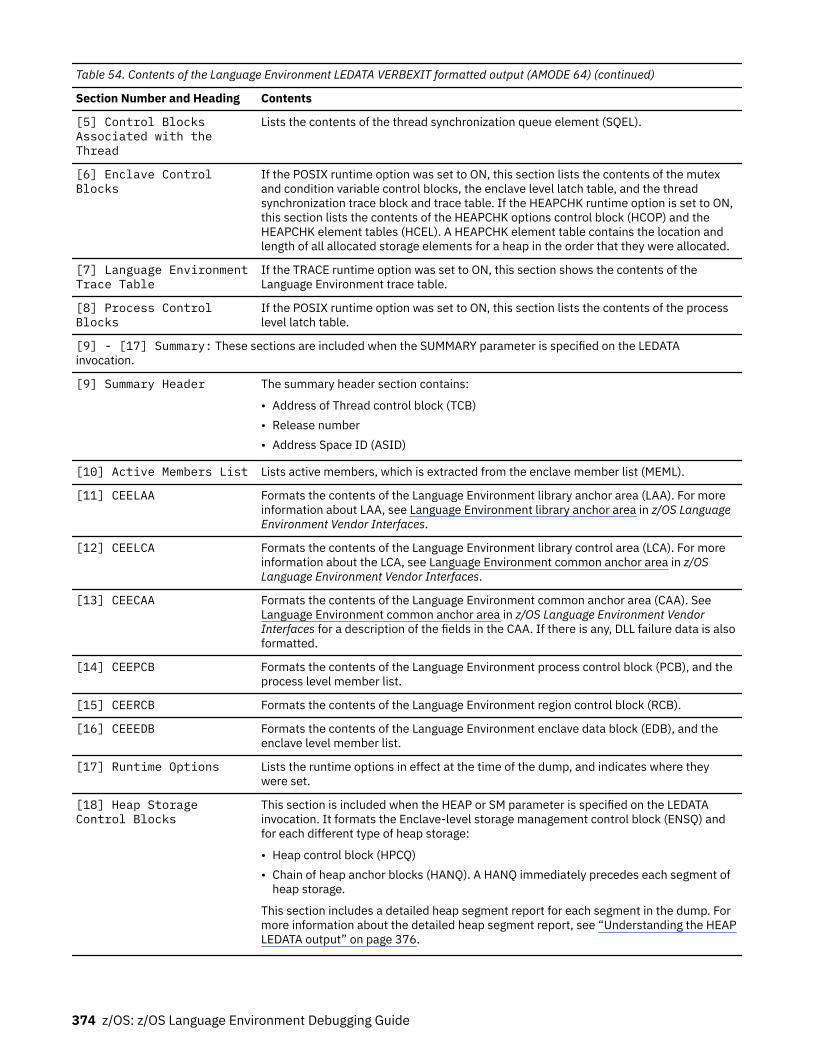
Table 54. Contents of the Language Environment LEDATA VERBEXIT formatted output (AMODE 64) (continued)
Section Number and Heading Contents
[5] Control BlocksAssociated with theThread
Lists the contents of the thread synchronization queue element (SQEL).
[6] Enclave ControlBlocks
If the POSIX runtime option was set to ON, this section lists the contents of the mutexand condition variable control blocks, the enclave level latch table, and the threadsynchronization trace block and trace table. If the HEAPCHK runtime option is set to ON,this section lists the contents of the HEAPCHK options control block (HCOP) and theHEAPCHK element tables (HCEL). A HEAPCHK element table contains the location andlength of all allocated storage elements for a heap in the order that they were allocated.
[7] Language EnvironmentTrace Table
If the TRACE runtime option was set to ON, this section shows the contents of theLanguage Environment trace table.
[8] Process ControlBlocks
If the POSIX runtime option was set to ON, this section lists the contents of the processlevel latch table.
[9] - [17] Summary: These sections are included when the SUMMARY parameter is specified on the LEDATAinvocation.
[9] Summary Header The summary header section contains:
• Address of Thread control block (TCB)• Release number• Address Space ID (ASID)
[10] Active Members List Lists active members, which is extracted from the enclave member list (MEML).
[11] CEELAA Formats the contents of the Language Environment library anchor area (LAA). For moreinformation about LAA, see Language Environment library anchor area in z/OS LanguageEnvironment Vendor Interfaces.
[12] CEELCA Formats the contents of the Language Environment library control area (LCA). For moreinformation about the LCA, see Language Environment common anchor area in z/OSLanguage Environment Vendor Interfaces.
[13] CEECAA Formats the contents of the Language Environment common anchor area (CAA). SeeLanguage Environment common anchor area in z/OS Language Environment VendorInterfaces for a description of the fields in the CAA. If there is any, DLL failure data is alsoformatted.
[14] CEEPCB Formats the contents of the Language Environment process control block (PCB), and theprocess level member list.
[15] CEERCB Formats the contents of the Language Environment region control block (RCB).
[16] CEEEDB Formats the contents of the Language Environment enclave data block (EDB), and theenclave level member list.
[17] Runtime Options Lists the runtime options in effect at the time of the dump, and indicates where theywere set.
[18] Heap StorageControl Blocks
This section is included when the HEAP or SM parameter is specified on the LEDATAinvocation. It formats the Enclave-level storage management control block (ENSQ) andfor each different type of heap storage:
• Heap control block (HPCQ)• Chain of heap anchor blocks (HANQ). A HANQ immediately precedes each segment of
heap storage.
This section includes a detailed heap segment report for each segment in the dump. Formore information about the detailed heap segment report, see “Understanding the HEAPLEDATA output” on page 376.
374 z/OS: z/OS Language Environment Debugging Guide
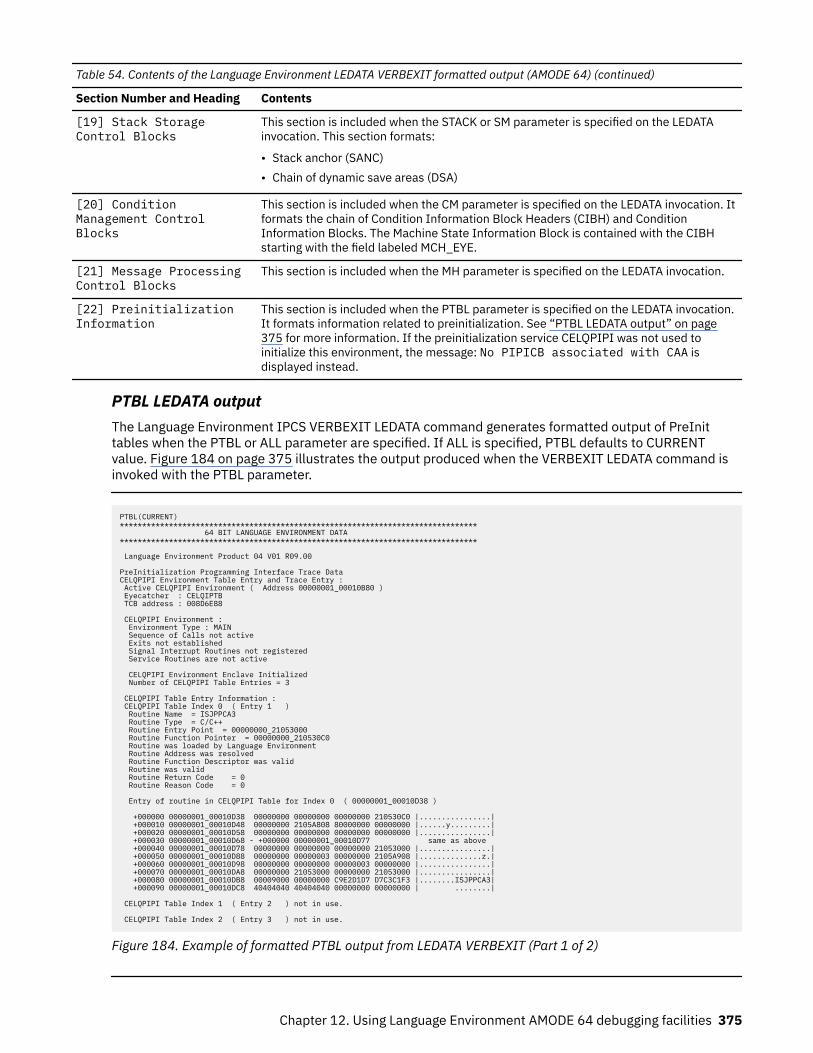
Table 54. Contents of the Language Environment LEDATA VERBEXIT formatted output (AMODE 64) (continued)
Section Number and Heading Contents
[19] Stack StorageControl Blocks
This section is included when the STACK or SM parameter is specified on the LEDATAinvocation. This section formats:
• Stack anchor (SANC)• Chain of dynamic save areas (DSA)
[20] ConditionManagement ControlBlocks
This section is included when the CM parameter is specified on the LEDATA invocation. Itformats the chain of Condition Information Block Headers (CIBH) and ConditionInformation Blocks. The Machine State Information Block is contained with the CIBHstarting with the field labeled MCH_EYE.
[21] Message ProcessingControl Blocks
This section is included when the MH parameter is specified on the LEDATA invocation.
[22] PreinitializationInformation
This section is included when the PTBL parameter is specified on the LEDATA invocation.It formats information related to preinitialization. See “PTBL LEDATA output” on page375 for more information. If the preinitialization service CELQPIPI was not used toinitialize this environment, the message: No PIPICB associated with CAA isdisplayed instead.
PTBL LEDATA outputThe Language Environment IPCS VERBEXIT LEDATA command generates formatted output of PreInittables when the PTBL or ALL parameter are specified. If ALL is specified, PTBL defaults to CURRENTvalue. Figure 184 on page 375 illustrates the output produced when the VERBEXIT LEDATA command isinvoked with the PTBL parameter.
PTBL(CURRENT) ******************************************************************************** 64 BIT LANGUAGE ENVIRONMENT DATA ******************************************************************************** Language Environment Product 04 V01 R09.00 PreInitialization Programming Interface Trace Data CELQPIPI Environment Table Entry and Trace Entry : Active CELQPIPI Environment ( Address 00000001_00010B80 ) Eyecatcher : CELQIPTB TCB address : 008D6E88 CELQPIPI Environment : Environment Type : MAIN Sequence of Calls not active Exits not established Signal Interrupt Routines not registered Service Routines are not active CELQPIPI Environment Enclave Initialized Number of CELQPIPI Table Entries = 3 CELQPIPI Table Entry Information : CELQPIPI Table Index 0 ( Entry 1 ) Routine Name = ISJPPCA3 Routine Type = C/C++ Routine Entry Point = 00000000_21053000 Routine Function Pointer = 00000000_210530C0 Routine was loaded by Language Environment Routine Address was resolved Routine Function Descriptor was valid Routine was valid Routine Return Code = 0 Routine Reason Code = 0 Entry of routine in CELQPIPI Table for Index 0 ( 00000001_00010D38 ) +000000 00000001_00010D38 00000000 00000000 00000000 210530C0 |................| +000010 00000001_00010D48 00000000 2105A808 80000000 00000000 |......y.........| +000020 00000001_00010D58 00000000 00000000 00000000 00000000 |................| +000030 00000001_00010D68 - +000000 00000001_00010D77 same as above +000040 00000001_00010D78 00000000 00000000 00000000 21053000 |................| +000050 00000001_00010D88 00000000 00000003 00000000 2105A908 |..............z.| +000060 00000001_00010D98 00000000 00000000 00000003 00000000 |................| +000070 00000001_00010DA8 00000000 21053000 00000000 21053000 |................| +000080 00000001_00010DB8 00009000 00000000 C9E2D1D7 D7C3C1F3 |........ISJPPCA3| +000090 00000001_00010DC8 40404040 40404040 00000000 00000000 | ........| CELQPIPI Table Index 1 ( Entry 2 ) not in use. CELQPIPI Table Index 2 ( Entry 3 ) not in use.
Figure 184. Example of formatted PTBL output from LEDATA VERBEXIT (Part 1 of 2)
Chapter 12. Using Language Environment AMODE 64 debugging facilities 375
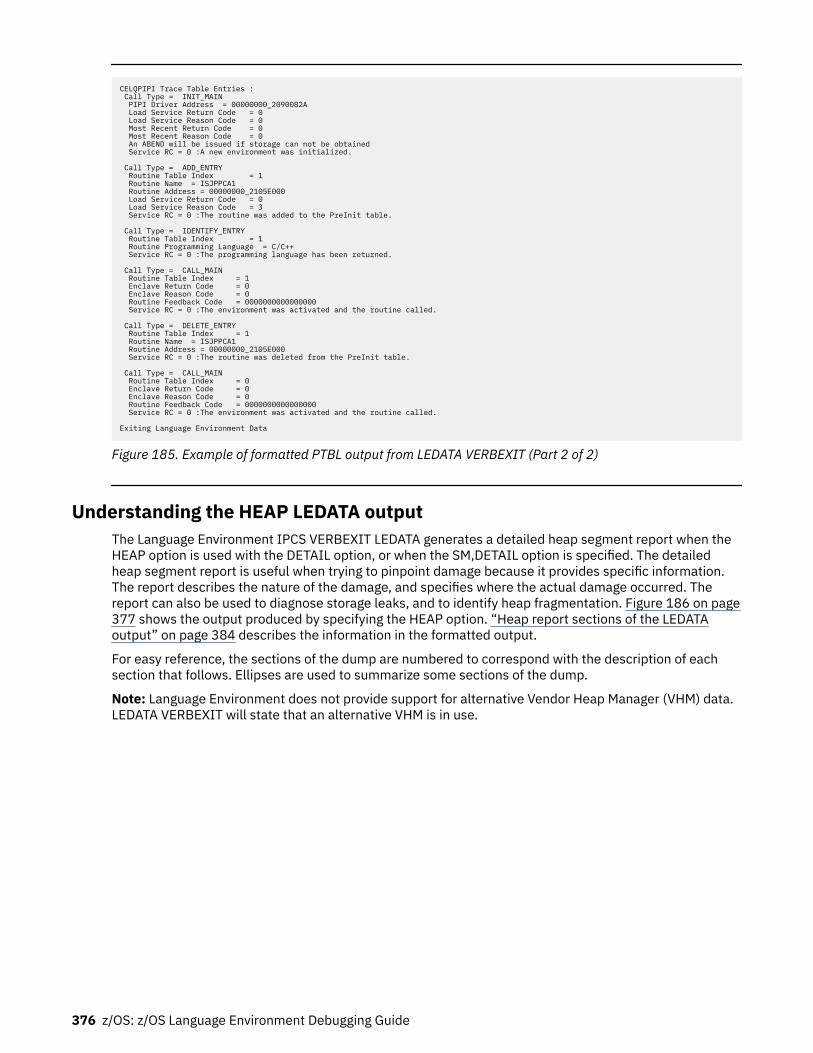
CELQPIPI Trace Table Entries : Call Type = INIT_MAIN PIPI Driver Address = 00000000_2090082A Load Service Return Code = 0 Load Service Reason Code = 0 Most Recent Return Code = 0 Most Recent Reason Code = 0 An ABEND will be issued if storage can not be obtained Service RC = 0 :A new environment was initialized. Call Type = ADD_ENTRY Routine Table Index = 1 Routine Name = ISJPPCA1 Routine Address = 00000000_2105E000 Load Service Return Code = 0 Load Service Reason Code = 3 Service RC = 0 :The routine was added to the PreInit table. Call Type = IDENTIFY_ENTRY Routine Table Index = 1 Routine Programming Language = C/C++ Service RC = 0 :The programming language has been returned. Call Type = CALL_MAIN Routine Table Index = 1 Enclave Return Code = 0 Enclave Reason Code = 0 Routine Feedback Code = 0000000000000000 Service RC = 0 :The environment was activated and the routine called. Call Type = DELETE_ENTRY Routine Table Index = 1 Routine Name = ISJPPCA1 Routine Address = 00000000_2105E000 Service RC = 0 :The routine was deleted from the PreInit table. Call Type = CALL_MAIN Routine Table Index = 0 Enclave Return Code = 0 Enclave Reason Code = 0 Routine Feedback Code = 0000000000000000 Service RC = 0 :The environment was activated and the routine called. Exiting Language Environment Data
Figure 185. Example of formatted PTBL output from LEDATA VERBEXIT (Part 2 of 2)
Understanding the HEAP LEDATA outputThe Language Environment IPCS VERBEXIT LEDATA generates a detailed heap segment report when theHEAP option is used with the DETAIL option, or when the SM,DETAIL option is specified. The detailedheap segment report is useful when trying to pinpoint damage because it provides specific information.The report describes the nature of the damage, and specifies where the actual damage occurred. Thereport can also be used to diagnose storage leaks, and to identify heap fragmentation. Figure 186 on page377 shows the output produced by specifying the HEAP option. “Heap report sections of the LEDATAoutput” on page 384 describes the information in the formatted output.
For easy reference, the sections of the dump are numbered to correspond with the description of eachsection that follows. Ellipses are used to summarize some sections of the dump.
Note: Language Environment does not provide support for alternative Vendor Heap Manager (VHM) data.LEDATA VERBEXIT will state that an alternative VHM is in use.
376 z/OS: z/OS Language Environment Debugging Guide
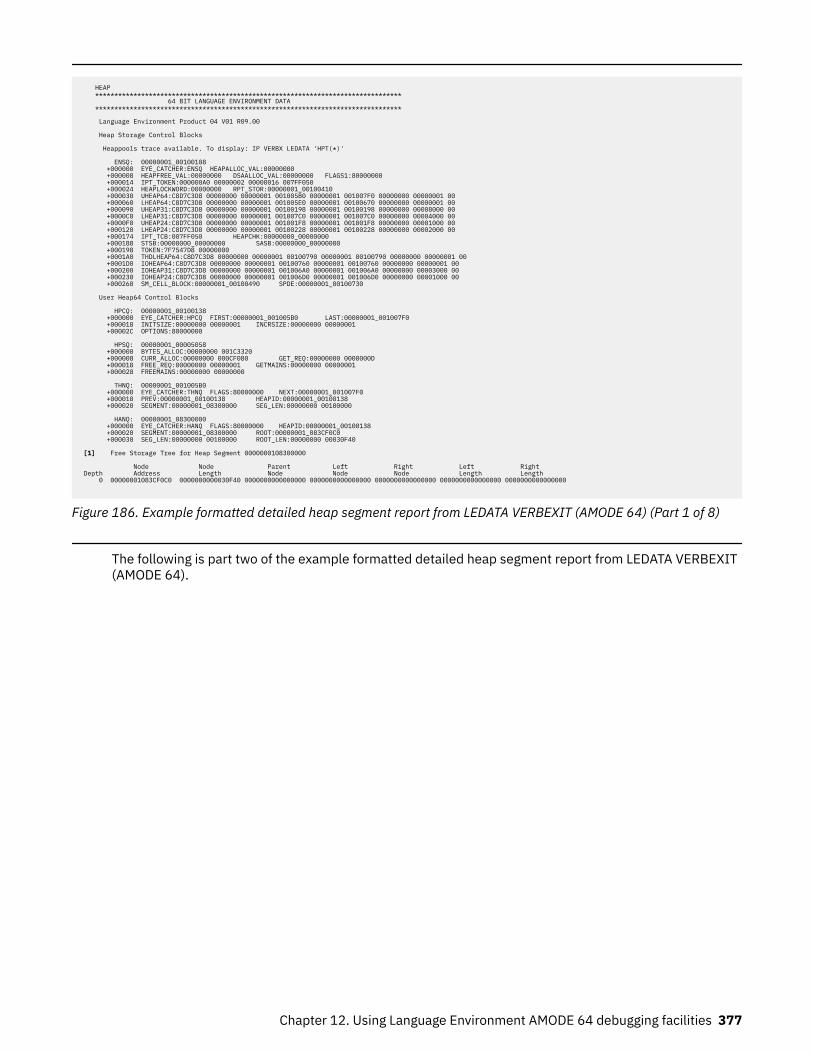
HEAP ******************************************************************************** 64 BIT LANGUAGE ENVIRONMENT DATA ******************************************************************************** Language Environment Product 04 V01 R09.00 Heap Storage Control Blocks Heappools trace available. To display: IP VERBX LEDATA 'HPT(*)' ENSQ: 00000001_00100108 +000000 EYE_CATCHER:ENSQ HEAPALLOC_VAL:00000000 +000008 HEAPFREE_VAL:00000000 DSAALLOC_VAL:00000000 FLAGS1:80000000 +000014 IPT_TOKEN:000000A0 00000002 00000016 007FF050 +000024 HEAPLOCKWORD:00000000 RPT_STOR:00000001_00100410 +000030 UHEAP64:C8D7C3D8 00000000 00000001 001005B0 00000001 001007F0 00000000 00000001 00 +000060 LHEAP64:C8D7C3D8 00000000 00000001 001005E0 00000001 00100670 00000000 00000001 00 +000090 UHEAP31:C8D7C3D8 00000000 00000001 00100198 00000001 00100198 00000000 00008000 00 +0000C0 LHEAP31:C8D7C3D8 00000000 00000001 001007C0 00000001 001007C0 00000000 00004000 00 +0000F0 UHEAP24:C8D7C3D8 00000000 00000001 001001F8 00000001 001001F8 00000000 00001000 00 +000120 LHEAP24:C8D7C3D8 00000000 00000001 00100228 00000001 00100228 00000000 00002000 00 +000174 IPT_TCB:007FF050 HEAPCHK:00000000_00000000 +000188 STSB:00000000_00000000 SASB:00000000_00000000 +000198 TOKEN:7F7547D8 00000000 +0001A0 THDLHEAP64:C8D7C3D8 00000000 00000001 00100790 00000001 00100790 00000000 00000001 00 +0001D0 IOHEAP64:C8D7C3D8 00000000 00000001 00100760 00000001 00100760 00000000 00000001 00 +000200 IOHEAP31:C8D7C3D8 00000000 00000001 001006A0 00000001 001006A0 00000000 00003000 00 +000230 IOHEAP24:C8D7C3D8 00000000 00000001 001006D0 00000001 001006D0 00000000 00001000 00 +000260 SM_CELL_BLOCK:00000001_00100490 SPDE:00000001_00100730 User Heap64 Control Blocks HPCQ: 00000001_00100138 +000000 EYE_CATCHER:HPCQ FIRST:00000001_001005B0 LAST:00000001_001007F0 +000018 INITSIZE:00000000 00000001 INCRSIZE:00000000 00000001 +00002C OPTIONS:80000000 HPSQ: 00000001_00005058 +000000 BYTES_ALLOC:00000000 001C3320 +000008 CURR_ALLOC:00000000 000CF080 GET_REQ:00000000 0000000D +000018 FREE_REQ:00000000 00000001 GETMAINS:00000000 00000001 +000028 FREEMAINS:00000000 00000000 THNQ: 00000001_001005B0 +000000 EYE_CATCHER:THNQ FLAGS:80000000 NEXT:00000001_001007F0 +000010 PREV:00000001_00100138 HEAPID:00000001_00100138 +000020 SEGMENT:00000001_08300000 SEG_LEN:00000000 00100000 HANQ: 00000001_08300000 +000000 EYE_CATCHER:HANQ FLAGS:80000000 HEAPID:00000001_00100138 +000020 SEGMENT:00000001_08300000 ROOT:00000001_083CF0C0 +000030 SEG_LEN:00000000 00100000 ROOT_LEN:00000000 00030F40
[1] Free Storage Tree for Heap Segment 0000000108300000 Node Node Parent Left Right Left Right Depth Address Length Node Node Node Length Length 0 00000001083CF0C0 0000000000030F40 0000000000000000 0000000000000000 0000000000000000 0000000000000000 0000000000000000
Figure 186. Example formatted detailed heap segment report from LEDATA VERBEXIT (AMODE 64) (Part 1 of 8)
The following is part two of the example formatted detailed heap segment report from LEDATA VERBEXIT(AMODE 64).
Chapter 12. Using Language Environment AMODE 64 debugging facilities 377
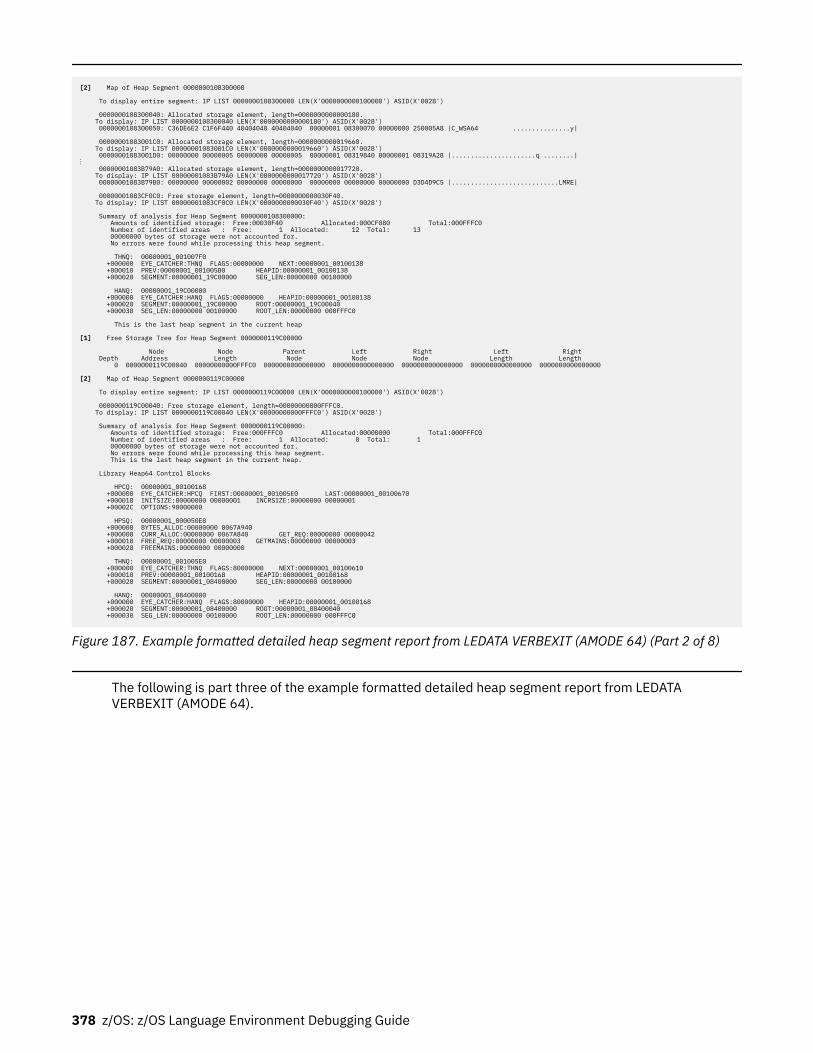
[2] Map of Heap Segment 0000000108300000 To display entire segment: IP LIST 0000000108300000 LEN(X'0000000000100000') ASID(X'0028') 0000000108300040: Allocated storage element, length=0000000000000180. To display: IP LIST 0000000108300040 LEN(X'0000000000000180') ASID(X'0028') 0000000108300050: C36DE6E2 C1F6F440 40404040 40404040 00000001 08300070 00000000 250005A8 |C_WSA64 ...............y| 00000001083001C0: Allocated storage element, length=0000000000019660. To display: IP LIST 00000001083001C0 LEN(X'0000000000019660') ASID(X'0028') 00000001083001D0: 00000000 00000005 00000000 00000005 00000001 08319840 00000001 08319A28 |......................q ........|⋮ 00000001083B79A0: Allocated storage element, length=0000000000017720. To display: IP LIST 00000001083B79A0 LEN(X'0000000000017720') ASID(X'0028') 00000001083B79B0: 00000000 00000002 00000000 00000000 00000000 00000000 00000000 D3D4D9C5 |............................LMRE| 00000001083CF0C0: Free storage element, length=0000000000030F40. To display: IP LIST 00000001083CF0C0 LEN(X'0000000000030F40') ASID(X'0028') Summary of analysis for Heap Segment 0000000108300000: Amounts of identified storage: Free:00030F40 Allocated:000CF080 Total:000FFFC0 Number of identified areas : Free: 1 Allocated: 12 Total: 13 00000000 bytes of storage were not accounted for. No errors were found while processing this heap segment. THNQ: 00000001_001007F0 +000000 EYE_CATCHER:THNQ FLAGS:00000000 NEXT:00000001_00100138 +000010 PREV:00000001_001005B0 HEAPID:00000001_00100138 +000020 SEGMENT:00000001_19C00000 SEG_LEN:00000000 00100000 HANQ: 00000001_19C00000 +000000 EYE_CATCHER:HANQ FLAGS:00000000 HEAPID:00000001_00100138 +000020 SEGMENT:00000001_19C00000 ROOT:00000001_19C00040 +000030 SEG_LEN:00000000 00100000 ROOT_LEN:00000000 000FFFC0 This is the last heap segment in the current heap [1] Free Storage Tree for Heap Segment 0000000119C00000 Node Node Parent Left Right Left Right Depth Address Length Node Node Node Length Length 0 0000000119C00040 00000000000FFFC0 0000000000000000 0000000000000000 0000000000000000 0000000000000000 0000000000000000 [2] Map of Heap Segment 0000000119C00000 To display entire segment: IP LIST 0000000119C00000 LEN(X'0000000000100000') ASID(X'0028') 0000000119C00040: Free storage element, length=00000000000FFFC0. To display: IP LIST 0000000119C00040 LEN(X'00000000000FFFC0') ASID(X'0028') Summary of analysis for Heap Segment 0000000119C00000: Amounts of identified storage: Free:000FFFC0 Allocated:00000000 Total:000FFFC0 Number of identified areas : Free: 1 Allocated: 0 Total: 1 00000000 bytes of storage were not accounted for. No errors were found while processing this heap segment. This is the last heap segment in the current heap. Library Heap64 Control Blocks HPCQ: 00000001_00100168 +000000 EYE_CATCHER:HPCQ FIRST:00000001_001005E0 LAST:00000001_00100670 +000018 INITSIZE:00000000 00000001 INCRSIZE:00000000 00000001 +00002C OPTIONS:90000000 HPSQ: 00000001_000050E8 +000000 BYTES_ALLOC:00000000 0067A940 +000008 CURR_ALLOC:00000000 0067A840 GET_REQ:00000000 00000042 +000018 FREE_REQ:00000000 00000003 GETMAINS:00000000 00000003 +000028 FREEMAINS:00000000 00000000 THNQ: 00000001_001005E0 +000000 EYE_CATCHER:THNQ FLAGS:80000000 NEXT:00000001_00100610 +000010 PREV:00000001_00100168 HEAPID:00000001_00100168 +000020 SEGMENT:00000001_08400000 SEG_LEN:00000000 00100000 HANQ: 00000001_08400000 +000000 EYE_CATCHER:HANQ FLAGS:80000000 HEAPID:00000001_00100168 +000020 SEGMENT:00000001_08400000 ROOT:00000001_08400040 +000030 SEG_LEN:00000000 00100000 ROOT_LEN:00000000 000FFFC0
Figure 187. Example formatted detailed heap segment report from LEDATA VERBEXIT (AMODE 64) (Part 2 of 8)
The following is part three of the example formatted detailed heap segment report from LEDATAVERBEXIT (AMODE 64).
378 z/OS: z/OS Language Environment Debugging Guide
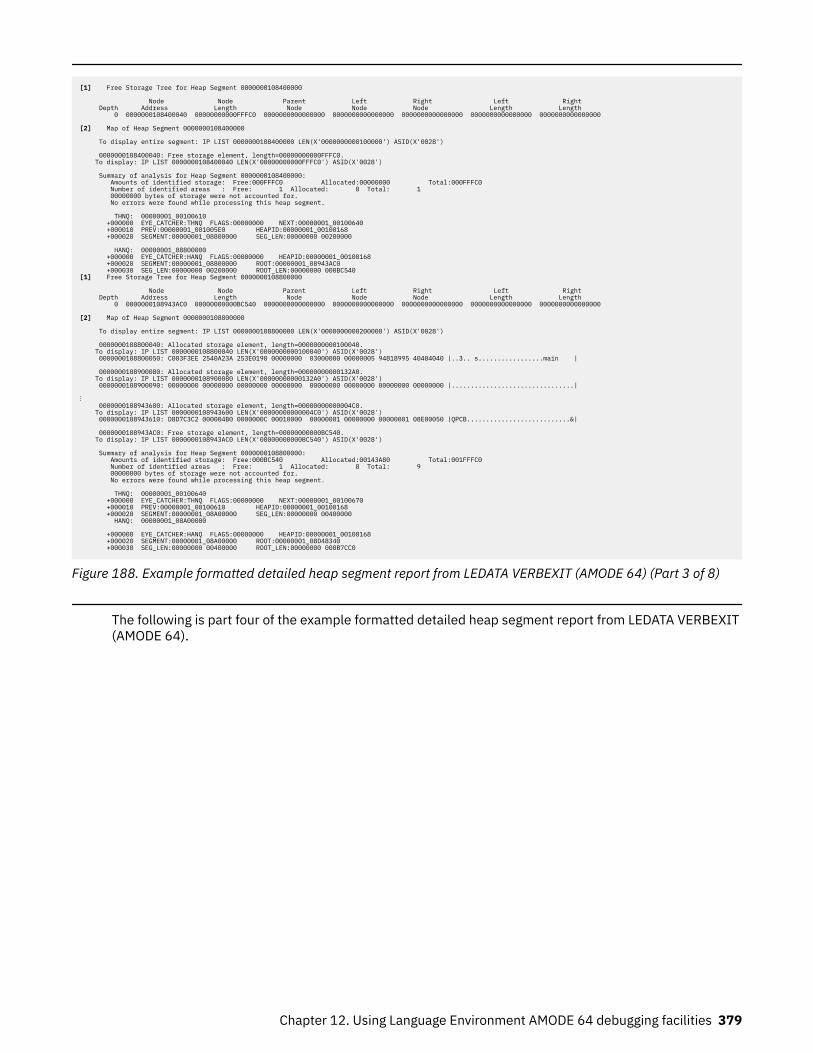
[1] Free Storage Tree for Heap Segment 0000000108400000 Node Node Parent Left Right Left Right Depth Address Length Node Node Node Length Length 0 0000000108400040 00000000000FFFC0 0000000000000000 0000000000000000 0000000000000000 0000000000000000 0000000000000000 [2] Map of Heap Segment 0000000108400000 To display entire segment: IP LIST 0000000108400000 LEN(X'0000000000100000') ASID(X'0028') 0000000108400040: Free storage element, length=00000000000FFFC0. To display: IP LIST 0000000108400040 LEN(X'00000000000FFFC0') ASID(X'0028') Summary of analysis for Heap Segment 0000000108400000: Amounts of identified storage: Free:000FFFC0 Allocated:00000000 Total:000FFFC0 Number of identified areas : Free: 1 Allocated: 0 Total: 1 00000000 bytes of storage were not accounted for. No errors were found while processing this heap segment. THNQ: 00000001_00100610 +000000 EYE_CATCHER:THNQ FLAGS:00000000 NEXT:00000001_00100640 +000010 PREV:00000001_001005E0 HEAPID:00000001_00100168 +000020 SEGMENT:00000001_08800000 SEG_LEN:00000000 00200000 HANQ: 00000001_08800000 +000000 EYE_CATCHER:HANQ FLAGS:00000000 HEAPID:00000001_00100168 +000020 SEGMENT:00000001_08800000 ROOT:00000001_08943AC0 +000030 SEG_LEN:00000000 00200000 ROOT_LEN:00000000 000BC540[1] Free Storage Tree for Heap Segment 0000000108800000 Node Node Parent Left Right Left Right Depth Address Length Node Node Node Length Length 0 0000000108943AC0 00000000000BC540 0000000000000000 0000000000000000 0000000000000000 0000000000000000 0000000000000000 [2] Map of Heap Segment 0000000108800000 To display entire segment: IP LIST 0000000108800000 LEN(X'0000000000200000') ASID(X'0028') 0000000108800040: Allocated storage element, length=0000000000100040. To display: IP LIST 0000000108800040 LEN(X'0000000000100040') ASID(X'0028') 0000000108800050: C003F3EE 2540A23A 253E0190 00000000 03000000 00000005 94818995 40404040 |..3.. s.................main | 0000000108900080: Allocated storage element, length=00000000000132A0. To display: IP LIST 0000000108900080 LEN(X'00000000000132A0') ASID(X'0028') 0000000108900090: 00000000 00000000 00000000 00000000 00000000 00000000 00000000 00000000 |................................| ⋮ 0000000108943600: Allocated storage element, length=00000000000004C0. To display: IP LIST 0000000108943600 LEN(X'00000000000004C0') ASID(X'0028') 0000000108943610: D8D7C3C2 000004B0 0000000C 00010000 00000001 00000000 00000001 08E00050 |QPCB...........................&| 0000000108943AC0: Free storage element, length=00000000000BC540. To display: IP LIST 0000000108943AC0 LEN(X'00000000000BC540') ASID(X'0028') Summary of analysis for Heap Segment 0000000108800000: Amounts of identified storage: Free:000BC540 Allocated:00143A80 Total:001FFFC0 Number of identified areas : Free: 1 Allocated: 8 Total: 9 00000000 bytes of storage were not accounted for. No errors were found while processing this heap segment. THNQ: 00000001_00100640 +000000 EYE_CATCHER:THNQ FLAGS:00000000 NEXT:00000001_00100670 +000010 PREV:00000001_00100610 HEAPID:00000001_00100168 +000020 SEGMENT:00000001_08A00000 SEG_LEN:00000000 00400000 HANQ: 00000001_08A00000 +000000 EYE_CATCHER:HANQ FLAGS:00000000 HEAPID:00000001_00100168 +000020 SEGMENT:00000001_08A00000 ROOT:00000001_08D48340 +000030 SEG_LEN:00000000 00400000 ROOT_LEN:00000000 000B7CC0
Figure 188. Example formatted detailed heap segment report from LEDATA VERBEXIT (AMODE 64) (Part 3 of 8)
The following is part four of the example formatted detailed heap segment report from LEDATA VERBEXIT(AMODE 64).
Chapter 12. Using Language Environment AMODE 64 debugging facilities 379
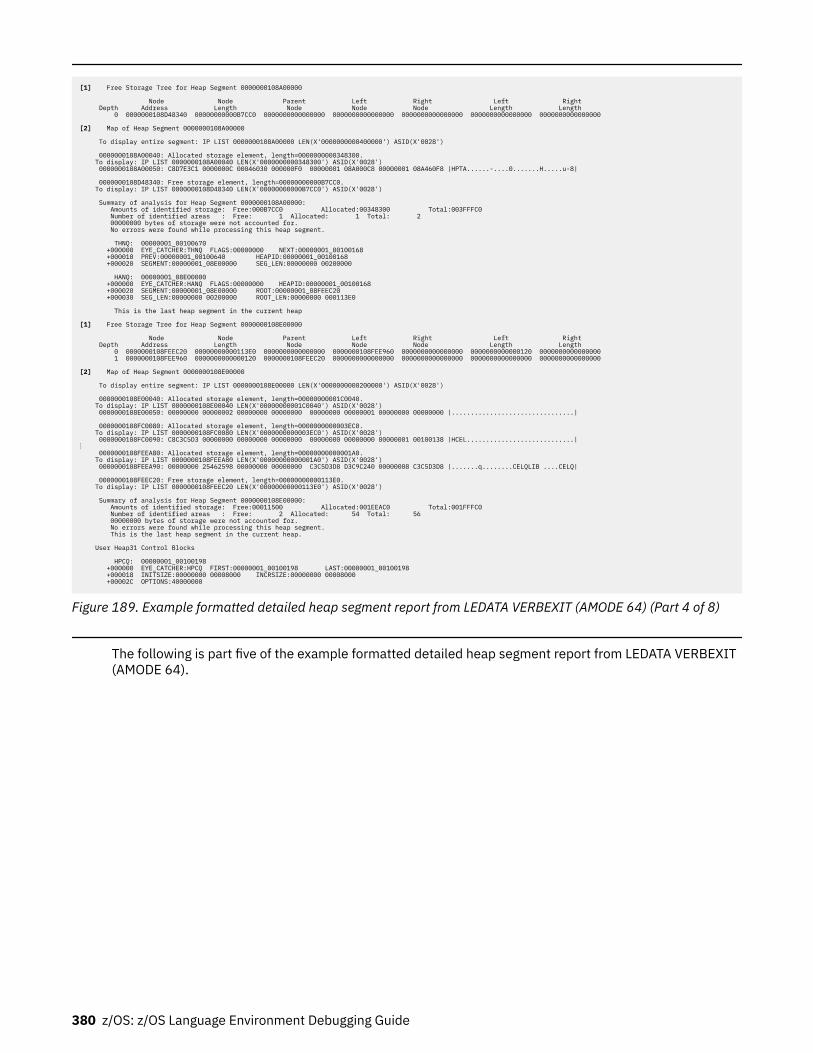
[1] Free Storage Tree for Heap Segment 0000000108A00000 Node Node Parent Left Right Left Right Depth Address Length Node Node Node Length Length 0 0000000108D48340 00000000000B7CC0 0000000000000000 0000000000000000 0000000000000000 0000000000000000 0000000000000000 [2] Map of Heap Segment 0000000108A00000 To display entire segment: IP LIST 0000000108A00000 LEN(X'0000000000400000') ASID(X'0028') 0000000108A00040: Allocated storage element, length=0000000000348300. To display: IP LIST 0000000108A00040 LEN(X'0000000000348300') ASID(X'0028') 0000000108A00050: C8D7E3C1 0000000C 00046030 000000F0 00000001 08A000C8 00000001 08A460F8 |HPTA......-....0.......H.....u-8| 0000000108D48340: Free storage element, length=00000000000B7CC0. To display: IP LIST 0000000108D48340 LEN(X'00000000000B7CC0') ASID(X'0028') Summary of analysis for Heap Segment 0000000108A00000: Amounts of identified storage: Free:000B7CC0 Allocated:00348300 Total:003FFFC0 Number of identified areas : Free: 1 Allocated: 1 Total: 2 00000000 bytes of storage were not accounted for. No errors were found while processing this heap segment. THNQ: 00000001_00100670 +000000 EYE_CATCHER:THNQ FLAGS:00000000 NEXT:00000001_00100168 +000010 PREV:00000001_00100640 HEAPID:00000001_00100168 +000020 SEGMENT:00000001_08E00000 SEG_LEN:00000000 00200000 HANQ: 00000001_08E00000 +000000 EYE_CATCHER:HANQ FLAGS:00000000 HEAPID:00000001_00100168 +000020 SEGMENT:00000001_08E00000 ROOT:00000001_08FEEC20 +000030 SEG_LEN:00000000 00200000 ROOT_LEN:00000000 000113E0 This is the last heap segment in the current heap [1] Free Storage Tree for Heap Segment 0000000108E00000 Node Node Parent Left Right Left Right Depth Address Length Node Node Node Length Length 0 0000000108FEEC20 00000000000113E0 0000000000000000 0000000108FEE960 0000000000000000 0000000000000120 0000000000000000 1 0000000108FEE960 0000000000000120 0000000108FEEC20 0000000000000000 0000000000000000 0000000000000000 0000000000000000 [2] Map of Heap Segment 0000000108E00000 To display entire segment: IP LIST 0000000108E00000 LEN(X'0000000000200000') ASID(X'0028') 0000000108E00040: Allocated storage element, length=00000000001C0040. To display: IP LIST 0000000108E00040 LEN(X'00000000001C0040') ASID(X'0028') 0000000108E00050: 00000000 00000002 00000000 00000000 00000000 00000001 00000000 00000000 |................................| 0000000108FC0080: Allocated storage element, length=0000000000003EC0. To display: IP LIST 0000000108FC0080 LEN(X'0000000000003EC0') ASID(X'0028') 0000000108FC0090: C8C3C5D3 00000000 00000000 00000000 00000000 00000000 00000001 00100138 |HCEL............................|⋮ 0000000108FEEA80: Allocated storage element, length=00000000000001A0. To display: IP LIST 0000000108FEEA80 LEN(X'00000000000001A0') ASID(X'0028') 0000000108FEEA90: 00000000 25462598 00000000 00000000 C3C5D3D8 D3C9C240 00000008 C3C5D3D8 |.......q........CELQLIB ....CELQ| 0000000108FEEC20: Free storage element, length=00000000000113E0. To display: IP LIST 0000000108FEEC20 LEN(X'00000000000113E0') ASID(X'0028') Summary of analysis for Heap Segment 0000000108E00000: Amounts of identified storage: Free:00011500 Allocated:001EEAC0 Total:001FFFC0 Number of identified areas : Free: 2 Allocated: 54 Total: 56 00000000 bytes of storage were not accounted for. No errors were found while processing this heap segment. This is the last heap segment in the current heap.
User Heap31 Control Blocks HPCQ: 00000001_00100198 +000000 EYE_CATCHER:HPCQ FIRST:00000001_00100198 LAST:00000001_00100198 +000018 INITSIZE:00000000 00008000 INCRSIZE:00000000 00008000 +00002C OPTIONS:40000000
Figure 189. Example formatted detailed heap segment report from LEDATA VERBEXIT (AMODE 64) (Part 4 of 8)
The following is part five of the example formatted detailed heap segment report from LEDATA VERBEXIT(AMODE 64).
380 z/OS: z/OS Language Environment Debugging Guide
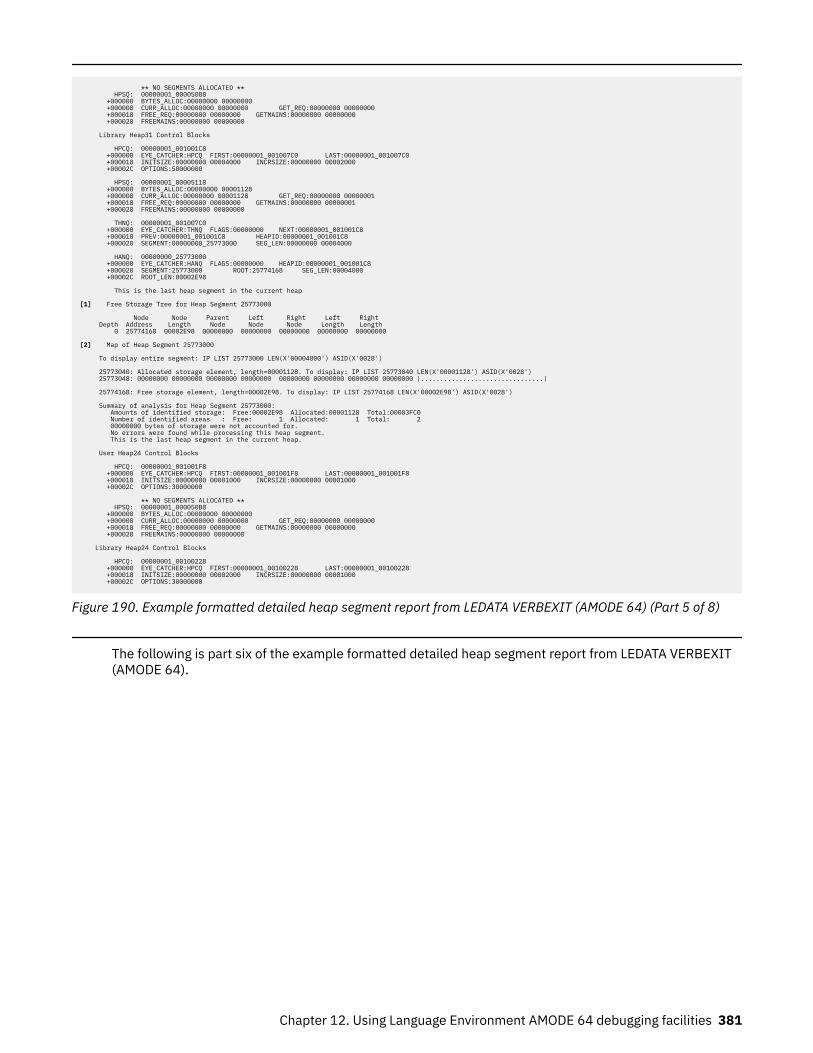
** NO SEGMENTS ALLOCATED ** HPSQ: 00000001_00005088 +000000 BYTES_ALLOC:00000000 00000000 +000008 CURR_ALLOC:00000000 00000000 GET_REQ:00000000 00000000 +000018 FREE_REQ:00000000 00000000 GETMAINS:00000000 00000000 +000028 FREEMAINS:00000000 00000000 Library Heap31 Control Blocks HPCQ: 00000001_001001C8 +000000 EYE_CATCHER:HPCQ FIRST:00000001_001007C0 LAST:00000001_001007C0 +000018 INITSIZE:00000000 00004000 INCRSIZE:00000000 00002000 +00002C OPTIONS:50000000 HPSQ: 00000001_00005118 +000000 BYTES_ALLOC:00000000 00001128 +000008 CURR_ALLOC:00000000 00001128 GET_REQ:00000000 00000001 +000018 FREE_REQ:00000000 00000000 GETMAINS:00000000 00000001 +000028 FREEMAINS:00000000 00000000 THNQ: 00000001_001007C0 +000000 EYE_CATCHER:THNQ FLAGS:00000000 NEXT:00000001_001001C8 +000010 PREV:00000001_001001C8 HEAPID:00000001_001001C8 +000020 SEGMENT:00000000_25773000 SEG_LEN:00000000 00004000 HANQ: 00000000_25773000 +000000 EYE_CATCHER:HANQ FLAGS:00000000 HEAPID:00000001_001001C8 +000020 SEGMENT:25773000 ROOT:25774168 SEG_LEN:00004000 +00002C ROOT_LEN:00002E98
This is the last heap segment in the current heap [1] Free Storage Tree for Heap Segment 25773000 Node Node Parent Left Right Left Right Depth Address Length Node Node Node Length Length 0 25774168 00002E98 00000000 00000000 00000000 00000000 00000000 [2] Map of Heap Segment 25773000 To display entire segment: IP LIST 25773000 LEN(X'00004000') ASID(X'0028') 25773040: Allocated storage element, length=00001128. To display: IP LIST 25773040 LEN(X'00001128') ASID(X'0028') 25773048: 00000000 00000000 00000000 00000000 00000000 00000000 00000000 00000000 |................................| 25774168: Free storage element, length=00002E98. To display: IP LIST 25774168 LEN(X'00002E98') ASID(X'0028') Summary of analysis for Heap Segment 25773000: Amounts of identified storage: Free:00002E98 Allocated:00001128 Total:00003FC0 Number of identified areas : Free: 1 Allocated: 1 Total: 2 00000000 bytes of storage were not accounted for. No errors were found while processing this heap segment. This is the last heap segment in the current heap. User Heap24 Control Blocks HPCQ: 00000001_001001F8 +000000 EYE_CATCHER:HPCQ FIRST:00000001_001001F8 LAST:00000001_001001F8 +000018 INITSIZE:00000000 00001000 INCRSIZE:00000000 00001000 +00002C OPTIONS:30000000 ** NO SEGMENTS ALLOCATED ** HPSQ: 00000001_000050B8 +000000 BYTES_ALLOC:00000000 00000000 +000008 CURR_ALLOC:00000000 00000000 GET_REQ:00000000 00000000 +000018 FREE_REQ:00000000 00000000 GETMAINS:00000000 00000000 +000028 FREEMAINS:00000000 00000000
Library Heap24 Control Blocks HPCQ: 00000001_00100228 +000000 EYE_CATCHER:HPCQ FIRST:00000001_00100228 LAST:00000001_00100228 +000018 INITSIZE:00000000 00002000 INCRSIZE:00000000 00001000 +00002C OPTIONS:30000000
Figure 190. Example formatted detailed heap segment report from LEDATA VERBEXIT (AMODE 64) (Part 5 of 8)
The following is part six of the example formatted detailed heap segment report from LEDATA VERBEXIT(AMODE 64).
Chapter 12. Using Language Environment AMODE 64 debugging facilities 381
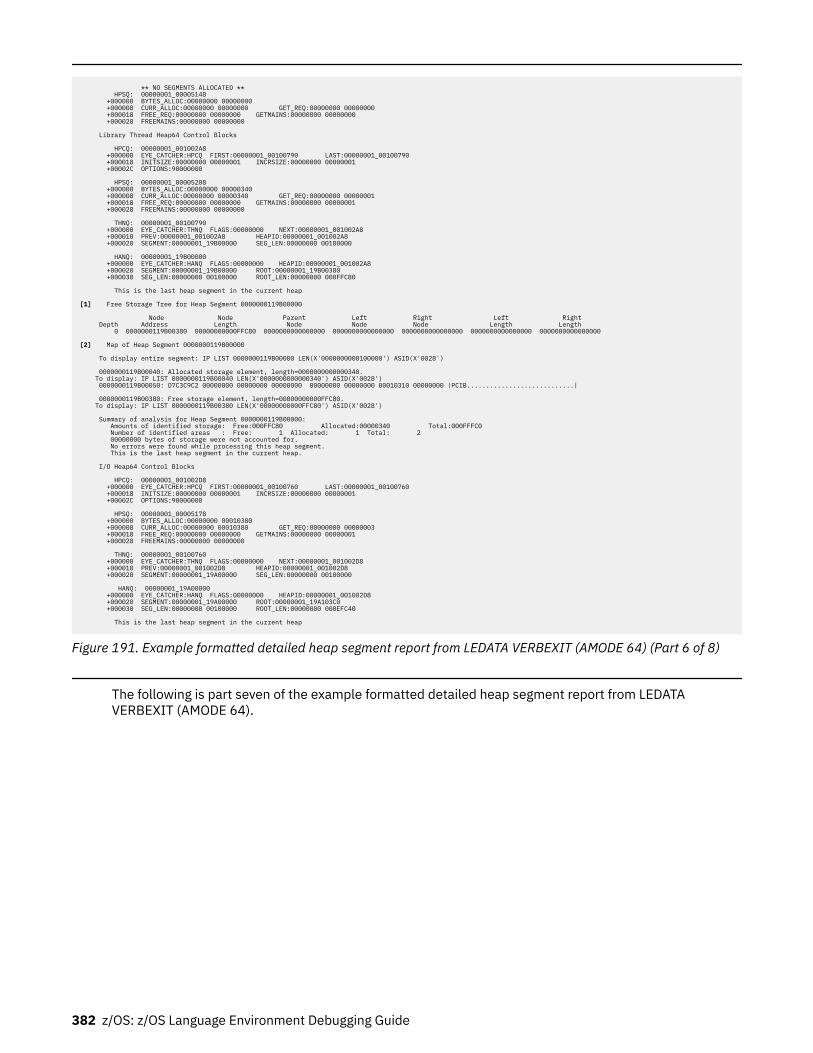
** NO SEGMENTS ALLOCATED ** HPSQ: 00000001_00005148 +000000 BYTES_ALLOC:00000000 00000000 +000008 CURR_ALLOC:00000000 00000000 GET_REQ:00000000 00000000 +000018 FREE_REQ:00000000 00000000 GETMAINS:00000000 00000000 +000028 FREEMAINS:00000000 00000000 Library Thread Heap64 Control Blocks HPCQ: 00000001_001002A8 +000000 EYE_CATCHER:HPCQ FIRST:00000001_00100790 LAST:00000001_00100790 +000018 INITSIZE:00000000 00000001 INCRSIZE:00000000 00000001 +00002C OPTIONS:90000000 HPSQ: 00000001_00005208 +000000 BYTES_ALLOC:00000000 00000340 +000008 CURR_ALLOC:00000000 00000340 GET_REQ:00000000 00000001 +000018 FREE_REQ:00000000 00000000 GETMAINS:00000000 00000001 +000028 FREEMAINS:00000000 00000000 THNQ: 00000001_00100790 +000000 EYE_CATCHER:THNQ FLAGS:00000000 NEXT:00000001_001002A8 +000010 PREV:00000001_001002A8 HEAPID:00000001_001002A8 +000020 SEGMENT:00000001_19B00000 SEG_LEN:00000000 00100000 HANQ: 00000001_19B00000 +000000 EYE_CATCHER:HANQ FLAGS:00000000 HEAPID:00000001_001002A8 +000020 SEGMENT:00000001_19B00000 ROOT:00000001_19B00380 +000030 SEG_LEN:00000000 00100000 ROOT_LEN:00000000 000FFC80
This is the last heap segment in the current heap [1] Free Storage Tree for Heap Segment 0000000119B00000 Node Node Parent Left Right Left Right Depth Address Length Node Node Node Length Length 0 0000000119B00380 00000000000FFC80 0000000000000000 0000000000000000 0000000000000000 0000000000000000 0000000000000000 [2] Map of Heap Segment 0000000119B00000 To display entire segment: IP LIST 0000000119B00000 LEN(X'0000000000100000') ASID(X'0028') 0000000119B00040: Allocated storage element, length=0000000000000340. To display: IP LIST 0000000119B00040 LEN(X'0000000000000340') ASID(X'0028') 0000000119B00050: D7C3C9C2 00000000 00000000 00000000 00000000 00000000 00010310 00000000 |PCIB............................| 0000000119B00380: Free storage element, length=00000000000FFC80. To display: IP LIST 0000000119B00380 LEN(X'00000000000FFC80') ASID(X'0028') Summary of analysis for Heap Segment 0000000119B00000: Amounts of identified storage: Free:000FFC80 Allocated:00000340 Total:000FFFC0 Number of identified areas : Free: 1 Allocated: 1 Total: 2 00000000 bytes of storage were not accounted for. No errors were found while processing this heap segment. This is the last heap segment in the current heap. I/O Heap64 Control Blocks HPCQ: 00000001_001002D8 +000000 EYE_CATCHER:HPCQ FIRST:00000001_00100760 LAST:00000001_00100760 +000018 INITSIZE:00000000 00000001 INCRSIZE:00000000 00000001 +00002C OPTIONS:90000000 HPSQ: 00000001_00005178 +000000 BYTES_ALLOC:00000000 00010380 +000008 CURR_ALLOC:00000000 00010380 GET_REQ:00000000 00000003 +000018 FREE_REQ:00000000 00000000 GETMAINS:00000000 00000001 +000028 FREEMAINS:00000000 00000000 THNQ: 00000001_00100760 +000000 EYE_CATCHER:THNQ FLAGS:00000000 NEXT:00000001_001002D8 +000010 PREV:00000001_001002D8 HEAPID:00000001_001002D8 +000020 SEGMENT:00000001_19A00000 SEG_LEN:00000000 00100000
HANQ: 00000001_19A00000 +000000 EYE_CATCHER:HANQ FLAGS:00000000 HEAPID:00000001_001002D8 +000020 SEGMENT:00000001_19A00000 ROOT:00000001_19A103C0 +000030 SEG_LEN:00000000 00100000 ROOT_LEN:00000000 000EFC40 This is the last heap segment in the current heap
Figure 191. Example formatted detailed heap segment report from LEDATA VERBEXIT (AMODE 64) (Part 6 of 8)
The following is part seven of the example formatted detailed heap segment report from LEDATAVERBEXIT (AMODE 64).
382 z/OS: z/OS Language Environment Debugging Guide
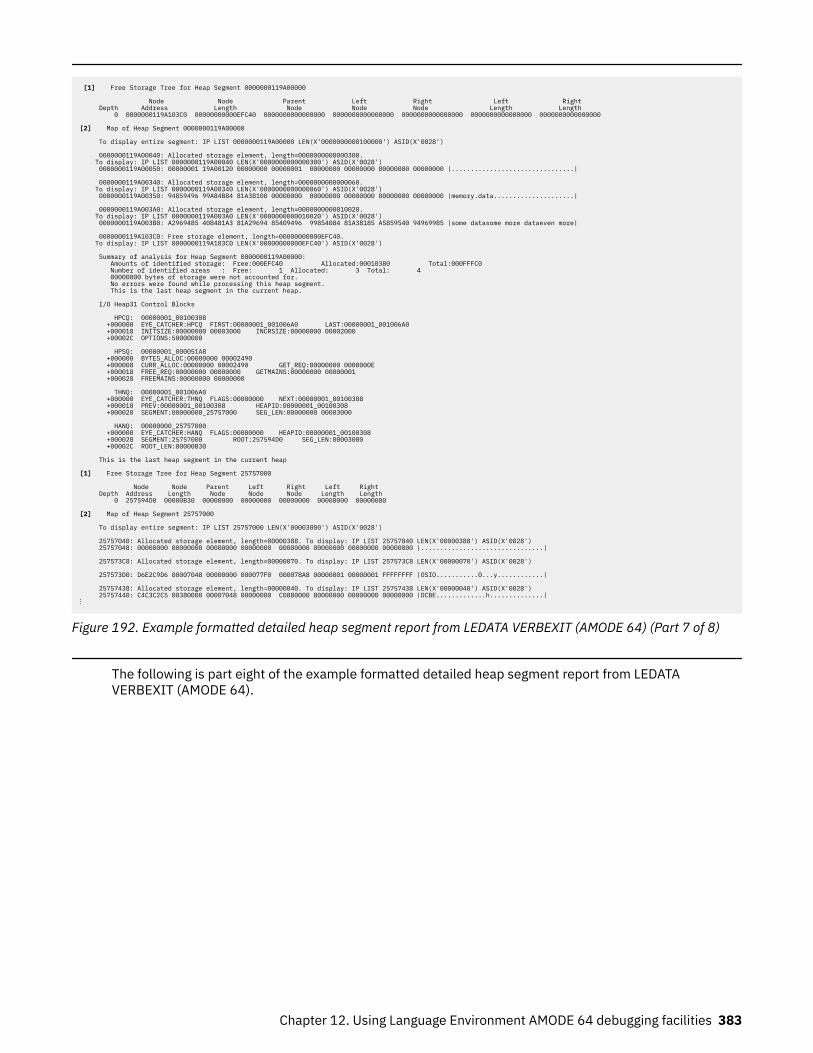
[1] Free Storage Tree for Heap Segment 0000000119A00000 Node Node Parent Left Right Left Right Depth Address Length Node Node Node Length Length 0 0000000119A103C0 00000000000EFC40 0000000000000000 0000000000000000 0000000000000000 0000000000000000 0000000000000000
[2] Map of Heap Segment 0000000119A00000 To display entire segment: IP LIST 0000000119A00000 LEN(X'0000000000100000') ASID(X'0028') 0000000119A00040: Allocated storage element, length=0000000000000300. To display: IP LIST 0000000119A00040 LEN(X'0000000000000300') ASID(X'0028') 0000000119A00050: 00000001 19A00120 00000000 00000001 00000000 00000000 00000000 00000000 |................................| 0000000119A00340: Allocated storage element, length=0000000000000060. To display: IP LIST 0000000119A00340 LEN(X'0000000000000060') ASID(X'0028') 0000000119A00350: 94859496 99A84B84 81A38100 00000000 00000000 00000000 00000000 00000000 |memory.data.....................| 0000000119A003A0: Allocated storage element, length=0000000000010020. To display: IP LIST 0000000119A003A0 LEN(X'0000000000010020') ASID(X'0028') 0000000119A003B0: A2969485 408481A3 81A29694 85409496 99854084 81A38185 A5859540 94969985 |some datasome more dataeven more| 0000000119A103C0: Free storage element, length=00000000000EFC40. To display: IP LIST 0000000119A103C0 LEN(X'00000000000EFC40') ASID(X'0028') Summary of analysis for Heap Segment 0000000119A00000: Amounts of identified storage: Free:000EFC40 Allocated:00010380 Total:000FFFC0 Number of identified areas : Free: 1 Allocated: 3 Total: 4 00000000 bytes of storage were not accounted for. No errors were found while processing this heap segment. This is the last heap segment in the current heap. I/O Heap31 Control Blocks HPCQ: 00000001_00100308 +000000 EYE_CATCHER:HPCQ FIRST:00000001_001006A0 LAST:00000001_001006A0 +000018 INITSIZE:00000000 00003000 INCRSIZE:00000000 00002000 +00002C OPTIONS:50000000 HPSQ: 00000001_000051A8 +000000 BYTES_ALLOC:00000000 00002490 +000008 CURR_ALLOC:00000000 00002490 GET_REQ:00000000 0000000E +000018 FREE_REQ:00000000 00000000 GETMAINS:00000000 00000001 +000028 FREEMAINS:00000000 00000000 THNQ: 00000001_001006A0 +000000 EYE_CATCHER:THNQ FLAGS:00000000 NEXT:00000001_00100308 +000010 PREV:00000001_00100308 HEAPID:00000001_00100308 +000020 SEGMENT:00000000_25757000 SEG_LEN:00000000 00003000 HANQ: 00000000_25757000 +000000 EYE_CATCHER:HANQ FLAGS:00000000 HEAPID:00000001_00100308 +000020 SEGMENT:25757000 ROOT:257594D0 SEG_LEN:00003000 +00002C ROOT_LEN:00000B30
This is the last heap segment in the current heap [1] Free Storage Tree for Heap Segment 25757000 Node Node Parent Left Right Left Right Depth Address Length Node Node Node Length Length 0 257594D0 00000B30 00000000 00000000 00000000 00000000 00000000
[2] Map of Heap Segment 25757000 To display entire segment: IP LIST 25757000 LEN(X'00003000') ASID(X'0028') 25757040: Allocated storage element, length=00000388. To display: IP LIST 25757040 LEN(X'00000388') ASID(X'0028') 25757048: 00000000 00000000 00000000 00000000 00000000 00000000 00000000 00000000 |................................|
257573C8: Allocated storage element, length=00000070. To display: IP LIST 257573C8 LEN(X'00000070') ASID(X'0028')
257573D0: D6E2C9D6 00007048 00000000 000077F0 000078A8 00000001 00000001 FFFFFFFF |OSIO...........0...y............| 25757438: Allocated storage element, length=00000040. To display: IP LIST 25757438 LEN(X'00000040') ASID(X'0028') 25757440: C4C3C2C5 00380000 00007048 00000000 C0880000 80000000 00000000 00000000 |DCBE.............h..............|⋮
Figure 192. Example formatted detailed heap segment report from LEDATA VERBEXIT (AMODE 64) (Part 7 of 8)
The following is part eight of the example formatted detailed heap segment report from LEDATAVERBEXIT (AMODE 64).
Chapter 12. Using Language Environment AMODE 64 debugging facilities 383
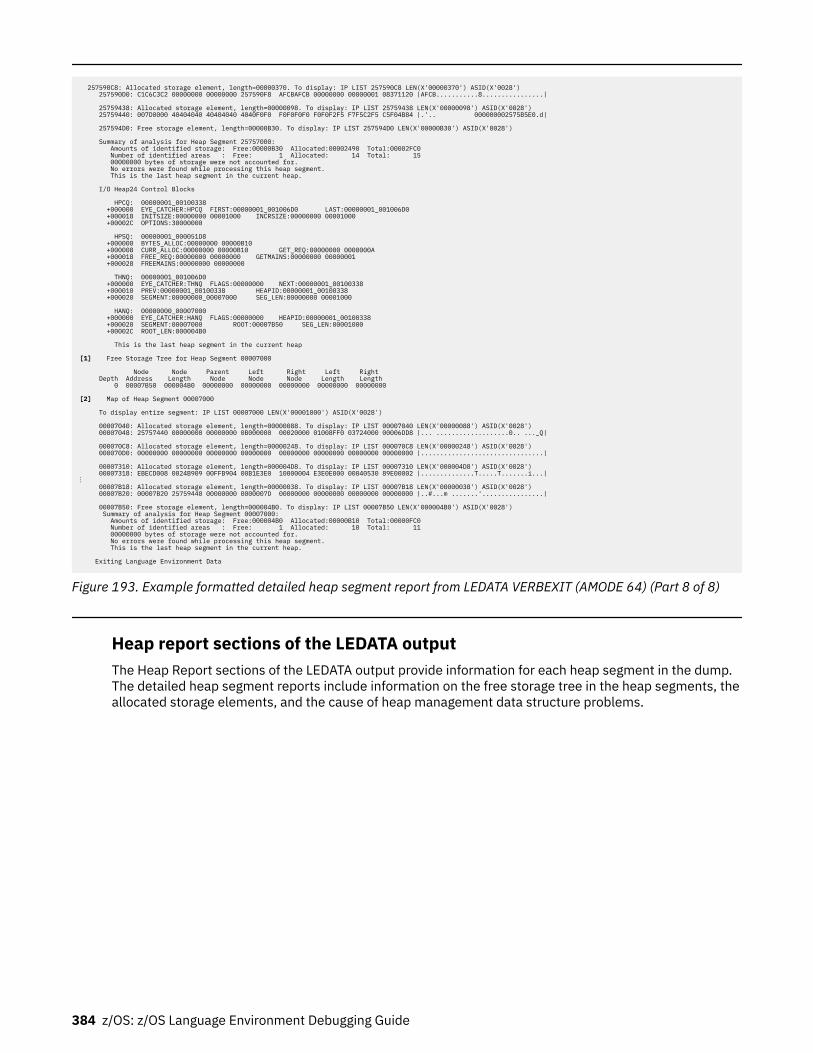
257590C8: Allocated storage element, length=00000370. To display: IP LIST 257590C8 LEN(X'00000370') ASID(X'0028') 257590D0: C1C6C3C2 00000000 00000000 257590F8 AFCBAFCB 00000000 00000001 08371120 |AFCB...........8................| 25759438: Allocated storage element, length=00000098. To display: IP LIST 25759438 LEN(X'00000098') ASID(X'0028') 25759440: 007D0000 40404040 40404040 4040F0F0 F0F0F0F0 F0F0F2F5 F7F5C2F5 C5F04B84 |.'.. 000000002575B5E0.d| 257594D0: Free storage element, length=00000B30. To display: IP LIST 257594D0 LEN(X'00000B30') ASID(X'0028') Summary of analysis for Heap Segment 25757000: Amounts of identified storage: Free:00000B30 Allocated:00002490 Total:00002FC0 Number of identified areas : Free: 1 Allocated: 14 Total: 15 00000000 bytes of storage were not accounted for. No errors were found while processing this heap segment. This is the last heap segment in the current heap. I/O Heap24 Control Blocks HPCQ: 00000001_00100338 +000000 EYE_CATCHER:HPCQ FIRST:00000001_001006D0 LAST:00000001_001006D0 +000018 INITSIZE:00000000 00001000 INCRSIZE:00000000 00001000 +00002C OPTIONS:30000000 HPSQ: 00000001_000051D8 +000000 BYTES_ALLOC:00000000 00000B10 +000008 CURR_ALLOC:00000000 00000B10 GET_REQ:00000000 0000000A +000018 FREE_REQ:00000000 00000000 GETMAINS:00000000 00000001 +000028 FREEMAINS:00000000 00000000 THNQ: 00000001_001006D0 +000000 EYE_CATCHER:THNQ FLAGS:00000000 NEXT:00000001_00100338 +000010 PREV:00000001_00100338 HEAPID:00000001_00100338 +000020 SEGMENT:00000000_00007000 SEG_LEN:00000000 00001000 HANQ: 00000000_00007000 +000000 EYE_CATCHER:HANQ FLAGS:00000000 HEAPID:00000001_00100338 +000020 SEGMENT:00007000 ROOT:00007B50 SEG_LEN:00001000 +00002C ROOT_LEN:000004B0
This is the last heap segment in the current heap [1] Free Storage Tree for Heap Segment 00007000 Node Node Parent Left Right Left Right Depth Address Length Node Node Node Length Length 0 00007B50 000004B0 00000000 00000000 00000000 00000000 00000000 [2] Map of Heap Segment 00007000 To display entire segment: IP LIST 00007000 LEN(X'00001000') ASID(X'0028') 00007040: Allocated storage element, length=00000088. To display: IP LIST 00007040 LEN(X'00000088') ASID(X'0028') 00007048: 25757440 00000000 00000000 0B000000 00020000 01008FF0 03724000 00006DD8 |... ...................0.. ..._Q| 000070C8: Allocated storage element, length=00000248. To display: IP LIST 000070C8 LEN(X'00000248') ASID(X'0028') 000070D0: 00000000 00000000 00000000 00000000 00000000 00000000 00000000 00000000 |................................| 00007310: Allocated storage element, length=000004D8. To display: IP LIST 00007310 LEN(X'000004D8') ASID(X'0028') 00007318: EBECD008 0024B909 00FFB904 00B1E3E0 10000004 E3E0E000 00040530 89E00002 |..............T.....T.......i...|⋮ 00007B18: Allocated storage element, length=00000038. To display: IP LIST 00007B18 LEN(X'00000038') ASID(X'0028') 00007B20: 00007B20 25759440 00000000 0000007D 00000000 00000000 00000000 00000000 |..#...m .......'................| 00007B50: Free storage element, length=000004B0. To display: IP LIST 00007B50 LEN(X'000004B0') ASID(X'0028') Summary of analysis for Heap Segment 00007000: Amounts of identified storage: Free:000004B0 Allocated:00000B10 Total:00000FC0 Number of identified areas : Free: 1 Allocated: 10 Total: 11 00000000 bytes of storage were not accounted for. No errors were found while processing this heap segment. This is the last heap segment in the current heap. Exiting Language Environment Data
Figure 193. Example formatted detailed heap segment report from LEDATA VERBEXIT (AMODE 64) (Part 8 of 8)
Heap report sections of the LEDATA outputThe Heap Report sections of the LEDATA output provide information for each heap segment in the dump.The detailed heap segment reports include information on the free storage tree in the heap segments, theallocated storage elements, and the cause of heap management data structure problems.
384 z/OS: z/OS Language Environment Debugging Guide
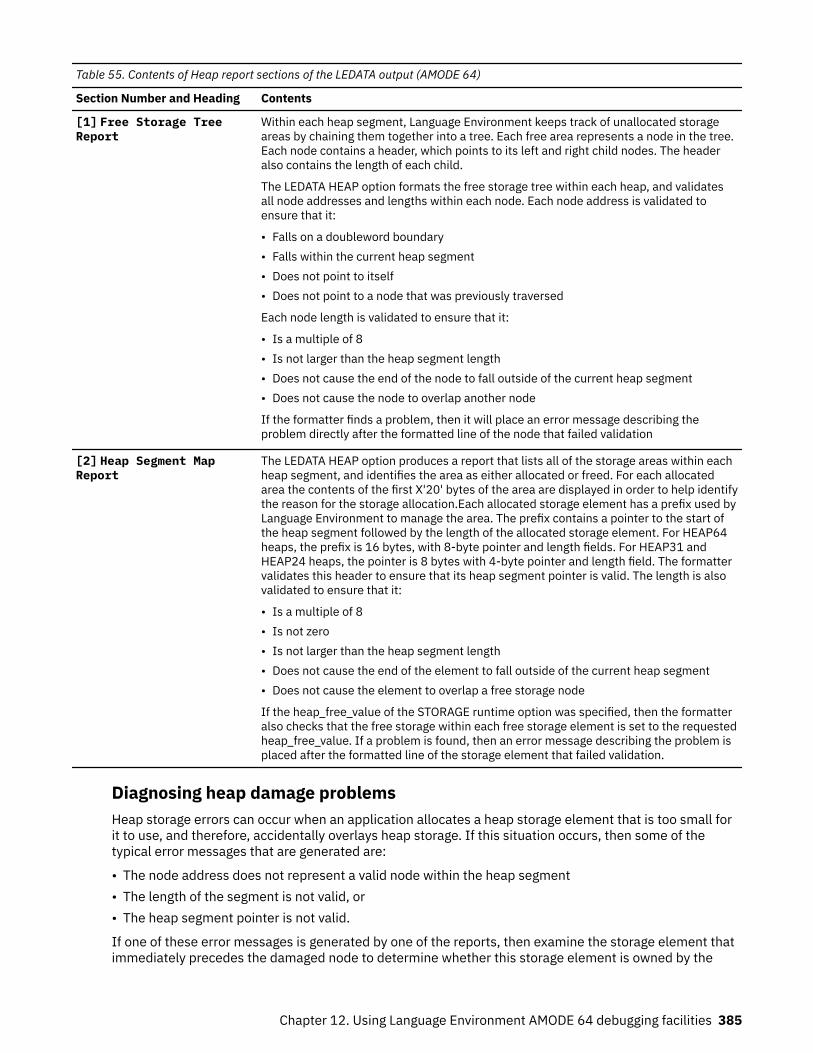
Table 55. Contents of Heap report sections of the LEDATA output (AMODE 64)
Section Number and Heading Contents
[1] Free Storage TreeReport
Within each heap segment, Language Environment keeps track of unallocated storageareas by chaining them together into a tree. Each free area represents a node in the tree.Each node contains a header, which points to its left and right child nodes. The headeralso contains the length of each child.
The LEDATA HEAP option formats the free storage tree within each heap, and validatesall node addresses and lengths within each node. Each node address is validated toensure that it:
• Falls on a doubleword boundary• Falls within the current heap segment• Does not point to itself• Does not point to a node that was previously traversed
Each node length is validated to ensure that it:
• Is a multiple of 8• Is not larger than the heap segment length• Does not cause the end of the node to fall outside of the current heap segment• Does not cause the node to overlap another node
If the formatter finds a problem, then it will place an error message describing theproblem directly after the formatted line of the node that failed validation
[2] Heap Segment MapReport
The LEDATA HEAP option produces a report that lists all of the storage areas within eachheap segment, and identifies the area as either allocated or freed. For each allocatedarea the contents of the first X'20' bytes of the area are displayed in order to help identifythe reason for the storage allocation.Each allocated storage element has a prefix used byLanguage Environment to manage the area. The prefix contains a pointer to the start ofthe heap segment followed by the length of the allocated storage element. For HEAP64heaps, the prefix is 16 bytes, with 8-byte pointer and length fields. For HEAP31 andHEAP24 heaps, the pointer is 8 bytes with 4-byte pointer and length field. The formattervalidates this header to ensure that its heap segment pointer is valid. The length is alsovalidated to ensure that it:
• Is a multiple of 8• Is not zero• Is not larger than the heap segment length• Does not cause the end of the element to fall outside of the current heap segment• Does not cause the element to overlap a free storage node
If the heap_free_value of the STORAGE runtime option was specified, then the formatteralso checks that the free storage within each free storage element is set to the requestedheap_free_value. If a problem is found, then an error message describing the problem isplaced after the formatted line of the storage element that failed validation.
Diagnosing heap damage problemsHeap storage errors can occur when an application allocates a heap storage element that is too small forit to use, and therefore, accidentally overlays heap storage. If this situation occurs, then some of thetypical error messages that are generated are:
• The node address does not represent a valid node within the heap segment• The length of the segment is not valid, or• The heap segment pointer is not valid.
If one of these error messages is generated by one of the reports, then examine the storage element thatimmediately precedes the damaged node to determine whether this storage element is owned by the
Chapter 12. Using Language Environment AMODE 64 debugging facilities 385
application program. Check the size of the storage element and ensure that it is sufficient for theprogram's use. If the size of the storage element is not sufficient, then adjust the allocation size.
If an error occurs indicating that the node's pointers form a circular loop within the free storage tree, thencheck the Free Storage Tree Report to see whether such a loop exists. If a loop exists, then contact theIBM support center for assistance because this may be a problem in the Language Environment heapmanagement routines.
Additional diagnostic information regarding heap damage can be obtained by using the HEAPCHK runtimeoption. This option provides a more accurate time perspective on when the heap damage actuallyoccurred, which could help to determine the program that caused the damage. For more informationabout HEAPCHK, see HEAPCHK in z/OS Language Environment Programming Reference.
Diagnosing storage leak problemsA storage leak occurs when a program does not return storage back to the heap after it has finished usingit. To determine if this problem exists, do one of the following:
• The call-level suboption of the HEAPCHK runtime option causes a report to be produced in theCEEDUMP. Any still-allocated (that is, not freed) storage identified by HEAPCHK is listed in the report,along with the corresponding traceback. This shows any storage that wasn't freed, as well as all thecalls that were involved in allocating the storage. For more information about the HEAPCHK runtimeoption, see HEAPCHK in z/OS Language Environment Programming Reference.
• Examine the Heap Segment Map report to see if any data areas, within the allocated storage elements,appear more frequently than expected. If they do, then check to see if these data areas are still beingused by the application program. If the data areas are not being used, then change the program to freethe storage element after it is done with it.
Diagnosing heap fragmentation problemsHeap fragmentation occurs when allocated storage is interlaced with many free storage areas that are toosmall for the application to use. Heap fragmentation could indicate that the application is not makingefficient use of its heap storage. Check the Heap Segment Map report for frequent free storage elementsthat are interspersed with the allocated storage elements.
Understanding the heap pool LEDATA outputThe Language Environment IPCS VERBEXIT LEDATA generates a detailed heap pool report whenHEAPPOOLS is ON. The detailed heap pool report is useful when trying to find potential damaged cellsbecause it provides very specific information.Figure 194 on page 387 illustrates the details of heap poolreport. “Heap pool report sections of the LEDATA output” on page 391 describes the informationcontained in the formatted output.
386 z/OS: z/OS Language Environment Debugging Guide
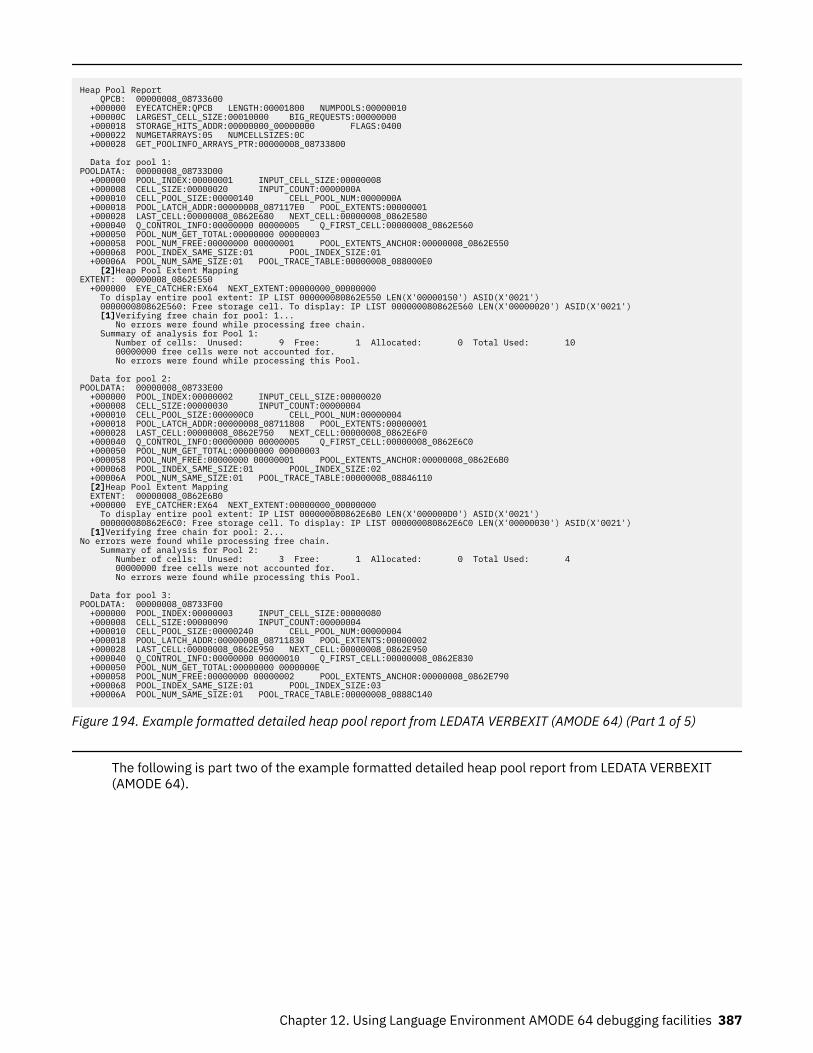
Heap Pool Report QPCB: 00000008_08733600 +000000 EYECATCHER:QPCB LENGTH:00001800 NUMPOOLS:00000010 +00000C LARGEST_CELL_SIZE:00010000 BIG_REQUESTS:00000000 +000018 STORAGE_HITS_ADDR:00000000_00000000 FLAGS:0400 +000022 NUMGETARRAYS:05 NUMCELLSIZES:0C +000028 GET_POOLINFO_ARRAYS_PTR:00000008_08733800 Data for pool 1: POOLDATA: 00000008_08733D00 +000000 POOL_INDEX:00000001 INPUT_CELL_SIZE:00000008 +000008 CELL_SIZE:00000020 INPUT_COUNT:0000000A +000010 CELL_POOL_SIZE:00000140 CELL_POOL_NUM:0000000A +000018 POOL_LATCH_ADDR:00000008_087117E0 POOL_EXTENTS:00000001 +000028 LAST_CELL:00000008_0862E680 NEXT_CELL:00000008_0862E580 +000040 Q_CONTROL_INFO:00000000 00000005 Q_FIRST_CELL:00000008_0862E560 +000050 POOL_NUM_GET_TOTAL:00000000 00000003 +000058 POOL_NUM_FREE:00000000 00000001 POOL_EXTENTS_ANCHOR:00000008_0862E550 +000068 POOL_INDEX_SAME_SIZE:01 POOL_INDEX_SIZE:01 +00006A POOL_NUM_SAME_SIZE:01 POOL_TRACE_TABLE:00000008_088000E0 [2]Heap Pool Extent Mapping EXTENT: 00000008_0862E550 +000000 EYE_CATCHER:EX64 NEXT_EXTENT:00000000_00000000 To display entire pool extent: IP LIST 000000080862E550 LEN(X'00000150') ASID(X'0021') 000000080862E560: Free storage cell. To display: IP LIST 000000080862E560 LEN(X'00000020') ASID(X'0021') [1]Verifying free chain for pool: 1... No errors were found while processing free chain. Summary of analysis for Pool 1: Number of cells: Unused: 9 Free: 1 Allocated: 0 Total Used: 10 00000000 free cells were not accounted for. No errors were found while processing this Pool. Data for pool 2: POOLDATA: 00000008_08733E00 +000000 POOL_INDEX:00000002 INPUT_CELL_SIZE:00000020 +000008 CELL_SIZE:00000030 INPUT_COUNT:00000004 +000010 CELL_POOL_SIZE:000000C0 CELL_POOL_NUM:00000004 +000018 POOL_LATCH_ADDR:00000008_08711808 POOL_EXTENTS:00000001 +000028 LAST_CELL:00000008_0862E750 NEXT_CELL:00000008_0862E6F0 +000040 Q_CONTROL_INFO:00000000 00000005 Q_FIRST_CELL:00000008_0862E6C0 +000050 POOL_NUM_GET_TOTAL:00000000 00000003 +000058 POOL_NUM_FREE:00000000 00000001 POOL_EXTENTS_ANCHOR:00000008_0862E6B0 +000068 POOL_INDEX_SAME_SIZE:01 POOL_INDEX_SIZE:02 +00006A POOL_NUM_SAME_SIZE:01 POOL_TRACE_TABLE:00000008_08846110 [2]Heap Pool Extent Mapping EXTENT: 00000008_0862E6B0 +000000 EYE_CATCHER:EX64 NEXT_EXTENT:00000000_00000000 To display entire pool extent: IP LIST 000000080862E6B0 LEN(X'000000D0') ASID(X'0021') 000000080862E6C0: Free storage cell. To display: IP LIST 000000080862E6C0 LEN(X'00000030') ASID(X'0021') [1]Verifying free chain for pool: 2... No errors were found while processing free chain. Summary of analysis for Pool 2: Number of cells: Unused: 3 Free: 1 Allocated: 0 Total Used: 4 00000000 free cells were not accounted for. No errors were found while processing this Pool. Data for pool 3: POOLDATA: 00000008_08733F00 +000000 POOL_INDEX:00000003 INPUT_CELL_SIZE:00000080 +000008 CELL_SIZE:00000090 INPUT_COUNT:00000004 +000010 CELL_POOL_SIZE:00000240 CELL_POOL_NUM:00000004 +000018 POOL_LATCH_ADDR:00000008_08711830 POOL_EXTENTS:00000002 +000028 LAST_CELL:00000008_0862E950 NEXT_CELL:00000008_0862E950 +000040 Q_CONTROL_INFO:00000000 00000010 Q_FIRST_CELL:00000008_0862E830 +000050 POOL_NUM_GET_TOTAL:00000000 0000000E +000058 POOL_NUM_FREE:00000000 00000002 POOL_EXTENTS_ANCHOR:00000008_0862E790 +000068 POOL_INDEX_SAME_SIZE:01 POOL_INDEX_SIZE:03 +00006A POOL_NUM_SAME_SIZE:01 POOL_TRACE_TABLE:00000008_0888C140
Figure 194. Example formatted detailed heap pool report from LEDATA VERBEXIT (AMODE 64) (Part 1 of 5)
The following is part two of the example formatted detailed heap pool report from LEDATA VERBEXIT(AMODE 64).
Chapter 12. Using Language Environment AMODE 64 debugging facilities 387
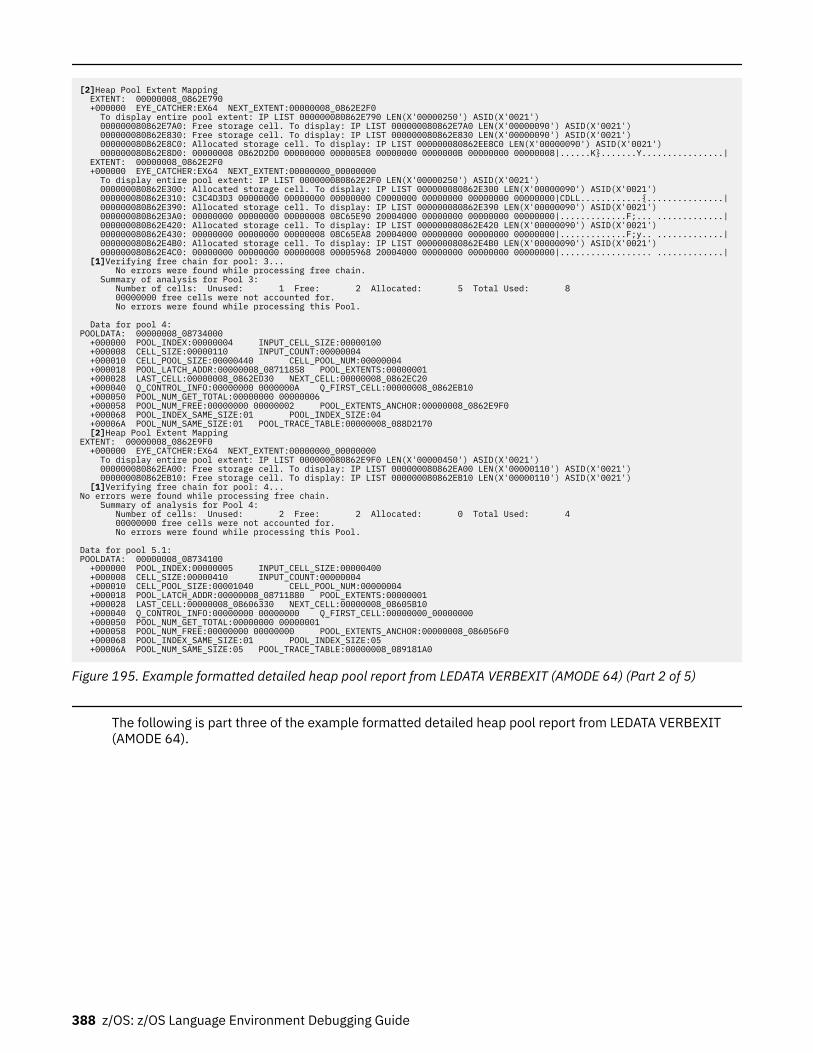
[2]Heap Pool Extent Mapping EXTENT: 00000008_0862E790 +000000 EYE_CATCHER:EX64 NEXT_EXTENT:00000008_0862E2F0 To display entire pool extent: IP LIST 000000080862E790 LEN(X'00000250') ASID(X'0021') 000000080862E7A0: Free storage cell. To display: IP LIST 000000080862E7A0 LEN(X'00000090') ASID(X'0021') 000000080862E830: Free storage cell. To display: IP LIST 000000080862E830 LEN(X'00000090') ASID(X'0021') 000000080862E8C0: Allocated storage cell. To display: IP LIST 000000080862EE8C0 LEN(X'00000090') ASID(X'0021') 000000080862E8D0: 00000008 0862D2D0 00000000 000005E8 00000000 0000000B 00000000 00000008|......K}.......Y................| EXTENT: 00000008_0862E2F0 +000000 EYE_CATCHER:EX64 NEXT_EXTENT:00000000_00000000 To display entire pool extent: IP LIST 000000080862E2F0 LEN(X'00000250') ASID(X'0021') 000000080862E300: Allocated storage cell. To display: IP LIST 000000080862E300 LEN(X'00000090') ASID(X'0021') 000000080862E310: C3C4D3D3 00000000 00000000 00000000 C0000000 00000000 00000000 00000000|CDLL............{...............| 000000080862E390: Allocated storage cell. To display: IP LIST 000000080862E390 LEN(X'00000090') ASID(X'0021') 000000080862E3A0: 00000000 00000000 00000008 08C65E90 20004000 00000000 00000000 00000000|.............F;... .............| 000000080862E420: Allocated storage cell. To display: IP LIST 000000080862E420 LEN(X'00000090') ASID(X'0021') 000000080862E430: 00000000 00000000 00000008 08C65EA8 20004000 00000000 00000000 00000000|.............F;y.. .............| 000000080862E4B0: Allocated storage cell. To display: IP LIST 000000080862E4B0 LEN(X'00000090') ASID(X'0021') 000000080862E4C0: 00000000 00000000 00000008 00005968 20004000 00000000 00000000 00000000|.................. .............| [1]Verifying free chain for pool: 3... No errors were found while processing free chain. Summary of analysis for Pool 3: Number of cells: Unused: 1 Free: 2 Allocated: 5 Total Used: 8 00000000 free cells were not accounted for. No errors were found while processing this Pool. Data for pool 4: POOLDATA: 00000008_08734000 +000000 POOL_INDEX:00000004 INPUT_CELL_SIZE:00000100 +000008 CELL_SIZE:00000110 INPUT_COUNT:00000004 +000010 CELL_POOL_SIZE:00000440 CELL_POOL_NUM:00000004 +000018 POOL_LATCH_ADDR:00000008_08711858 POOL_EXTENTS:00000001 +000028 LAST_CELL:00000008_0862ED30 NEXT_CELL:00000008_0862EC20 +000040 Q_CONTROL_INFO:00000000 0000000A Q_FIRST_CELL:00000008_0862EB10 +000050 POOL_NUM_GET_TOTAL:00000000 00000006 +000058 POOL_NUM_FREE:00000000 00000002 POOL_EXTENTS_ANCHOR:00000008_0862E9F0 +000068 POOL_INDEX_SAME_SIZE:01 POOL_INDEX_SIZE:04 +00006A POOL_NUM_SAME_SIZE:01 POOL_TRACE_TABLE:00000008_088D2170 [2]Heap Pool Extent Mapping EXTENT: 00000008_0862E9F0 +000000 EYE_CATCHER:EX64 NEXT_EXTENT:00000000_00000000 To display entire pool extent: IP LIST 000000080862E9F0 LEN(X'00000450') ASID(X'0021') 000000080862EA00: Free storage cell. To display: IP LIST 000000080862EA00 LEN(X'00000110') ASID(X'0021') 000000080862EB10: Free storage cell. To display: IP LIST 000000080862EB10 LEN(X'00000110') ASID(X'0021') [1]Verifying free chain for pool: 4... No errors were found while processing free chain. Summary of analysis for Pool 4: Number of cells: Unused: 2 Free: 2 Allocated: 0 Total Used: 4 00000000 free cells were not accounted for. No errors were found while processing this Pool. Data for pool 5.1: POOLDATA: 00000008_08734100 +000000 POOL_INDEX:00000005 INPUT_CELL_SIZE:00000400 +000008 CELL_SIZE:00000410 INPUT_COUNT:00000004 +000010 CELL_POOL_SIZE:00001040 CELL_POOL_NUM:00000004 +000018 POOL_LATCH_ADDR:00000008_08711880 POOL_EXTENTS:00000001 +000028 LAST_CELL:00000008_08606330 NEXT_CELL:00000008_08605B10 +000040 Q_CONTROL_INFO:00000000 00000000 Q_FIRST_CELL:00000000_00000000 +000050 POOL_NUM_GET_TOTAL:00000000 00000001 +000058 POOL_NUM_FREE:00000000 00000000 POOL_EXTENTS_ANCHOR:00000008_086056F0 +000068 POOL_INDEX_SAME_SIZE:01 POOL_INDEX_SIZE:05 +00006A POOL_NUM_SAME_SIZE:05 POOL_TRACE_TABLE:00000008_089181A0
Figure 195. Example formatted detailed heap pool report from LEDATA VERBEXIT (AMODE 64) (Part 2 of 5)
The following is part three of the example formatted detailed heap pool report from LEDATA VERBEXIT(AMODE 64).
388 z/OS: z/OS Language Environment Debugging Guide
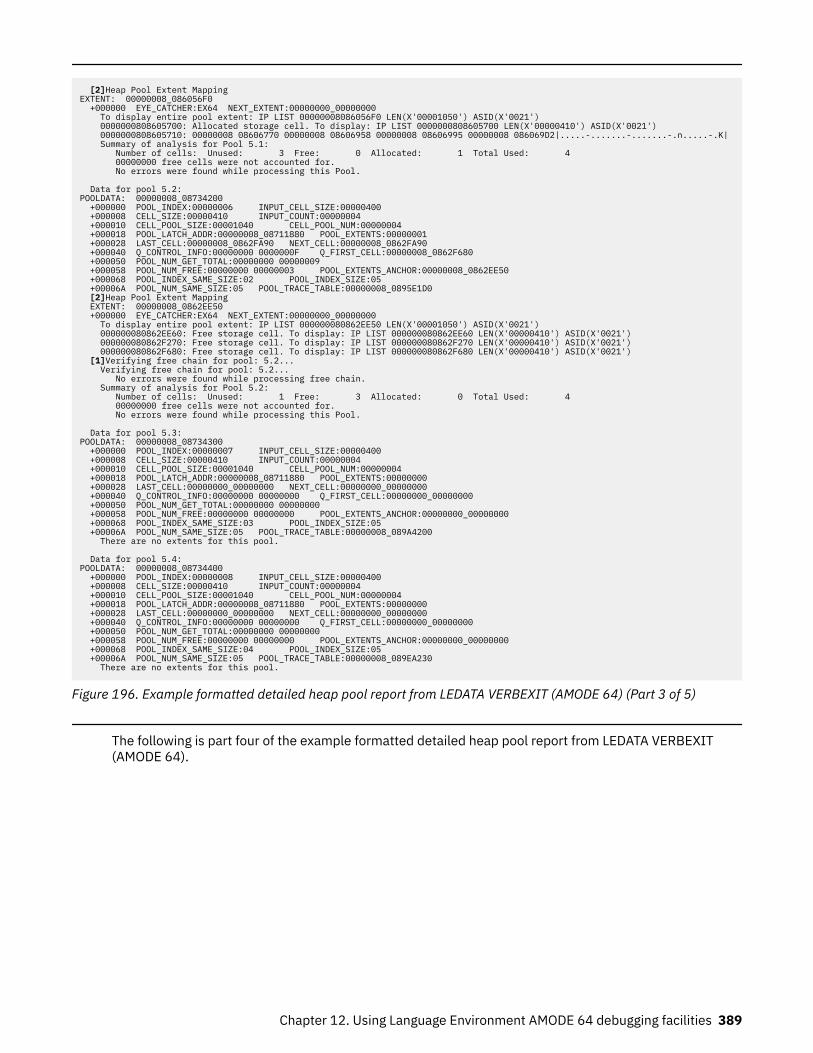
[2]Heap Pool Extent Mapping EXTENT: 00000008_086056F0 +000000 EYE_CATCHER:EX64 NEXT_EXTENT:00000000_00000000 To display entire pool extent: IP LIST 00000008086056F0 LEN(X'00001050') ASID(X'0021') 0000000808605700: Allocated storage cell. To display: IP LIST 0000000808605700 LEN(X'00000410') ASID(X'0021') 0000000808605710: 00000008 08606770 00000008 08606958 00000008 08606995 00000008 086069D2|.....-.......-.......-.n.....-.K| Summary of analysis for Pool 5.1: Number of cells: Unused: 3 Free: 0 Allocated: 1 Total Used: 4 00000000 free cells were not accounted for. No errors were found while processing this Pool. Data for pool 5.2: POOLDATA: 00000008_08734200 +000000 POOL_INDEX:00000006 INPUT_CELL_SIZE:00000400 +000008 CELL_SIZE:00000410 INPUT_COUNT:00000004 +000010 CELL_POOL_SIZE:00001040 CELL_POOL_NUM:00000004 +000018 POOL_LATCH_ADDR:00000008_08711880 POOL_EXTENTS:00000001 +000028 LAST_CELL:00000008_0862FA90 NEXT_CELL:00000008_0862FA90 +000040 Q_CONTROL_INFO:00000000 0000000F Q_FIRST_CELL:00000008_0862F680 +000050 POOL_NUM_GET_TOTAL:00000000 00000009 +000058 POOL_NUM_FREE:00000000 00000003 POOL_EXTENTS_ANCHOR:00000008_0862EE50 +000068 POOL_INDEX_SAME_SIZE:02 POOL_INDEX_SIZE:05 +00006A POOL_NUM_SAME_SIZE:05 POOL_TRACE_TABLE:00000008_0895E1D0 [2]Heap Pool Extent Mapping EXTENT: 00000008_0862EE50 +000000 EYE_CATCHER:EX64 NEXT_EXTENT:00000000_00000000 To display entire pool extent: IP LIST 000000080862EE50 LEN(X'00001050') ASID(X'0021') 000000080862EE60: Free storage cell. To display: IP LIST 000000080862EE60 LEN(X'00000410') ASID(X'0021') 000000080862F270: Free storage cell. To display: IP LIST 000000080862F270 LEN(X'00000410') ASID(X'0021') 000000080862F680: Free storage cell. To display: IP LIST 000000080862F680 LEN(X'00000410') ASID(X'0021') [1]Verifying free chain for pool: 5.2... Verifying free chain for pool: 5.2... No errors were found while processing free chain. Summary of analysis for Pool 5.2: Number of cells: Unused: 1 Free: 3 Allocated: 0 Total Used: 4 00000000 free cells were not accounted for. No errors were found while processing this Pool. Data for pool 5.3: POOLDATA: 00000008_08734300 +000000 POOL_INDEX:00000007 INPUT_CELL_SIZE:00000400 +000008 CELL_SIZE:00000410 INPUT_COUNT:00000004 +000010 CELL_POOL_SIZE:00001040 CELL_POOL_NUM:00000004 +000018 POOL_LATCH_ADDR:00000008_08711880 POOL_EXTENTS:00000000 +000028 LAST_CELL:00000000_00000000 NEXT_CELL:00000000_00000000 +000040 Q_CONTROL_INFO:00000000 00000000 Q_FIRST_CELL:00000000_00000000 +000050 POOL_NUM_GET_TOTAL:00000000 00000000 +000058 POOL_NUM_FREE:00000000 00000000 POOL_EXTENTS_ANCHOR:00000000_00000000 +000068 POOL_INDEX_SAME_SIZE:03 POOL_INDEX_SIZE:05 +00006A POOL_NUM_SAME_SIZE:05 POOL_TRACE_TABLE:00000008_089A4200 There are no extents for this pool. Data for pool 5.4: POOLDATA: 00000008_08734400 +000000 POOL_INDEX:00000008 INPUT_CELL_SIZE:00000400 +000008 CELL_SIZE:00000410 INPUT_COUNT:00000004 +000010 CELL_POOL_SIZE:00001040 CELL_POOL_NUM:00000004 +000018 POOL_LATCH_ADDR:00000008_08711880 POOL_EXTENTS:00000000 +000028 LAST_CELL:00000000_00000000 NEXT_CELL:00000000_00000000 +000040 Q_CONTROL_INFO:00000000 00000000 Q_FIRST_CELL:00000000_00000000 +000050 POOL_NUM_GET_TOTAL:00000000 00000000 +000058 POOL_NUM_FREE:00000000 00000000 POOL_EXTENTS_ANCHOR:00000000_00000000 +000068 POOL_INDEX_SAME_SIZE:04 POOL_INDEX_SIZE:05 +00006A POOL_NUM_SAME_SIZE:05 POOL_TRACE_TABLE:00000008_089EA230 There are no extents for this pool.
Figure 196. Example formatted detailed heap pool report from LEDATA VERBEXIT (AMODE 64) (Part 3 of 5)
The following is part four of the example formatted detailed heap pool report from LEDATA VERBEXIT(AMODE 64).
Chapter 12. Using Language Environment AMODE 64 debugging facilities 389
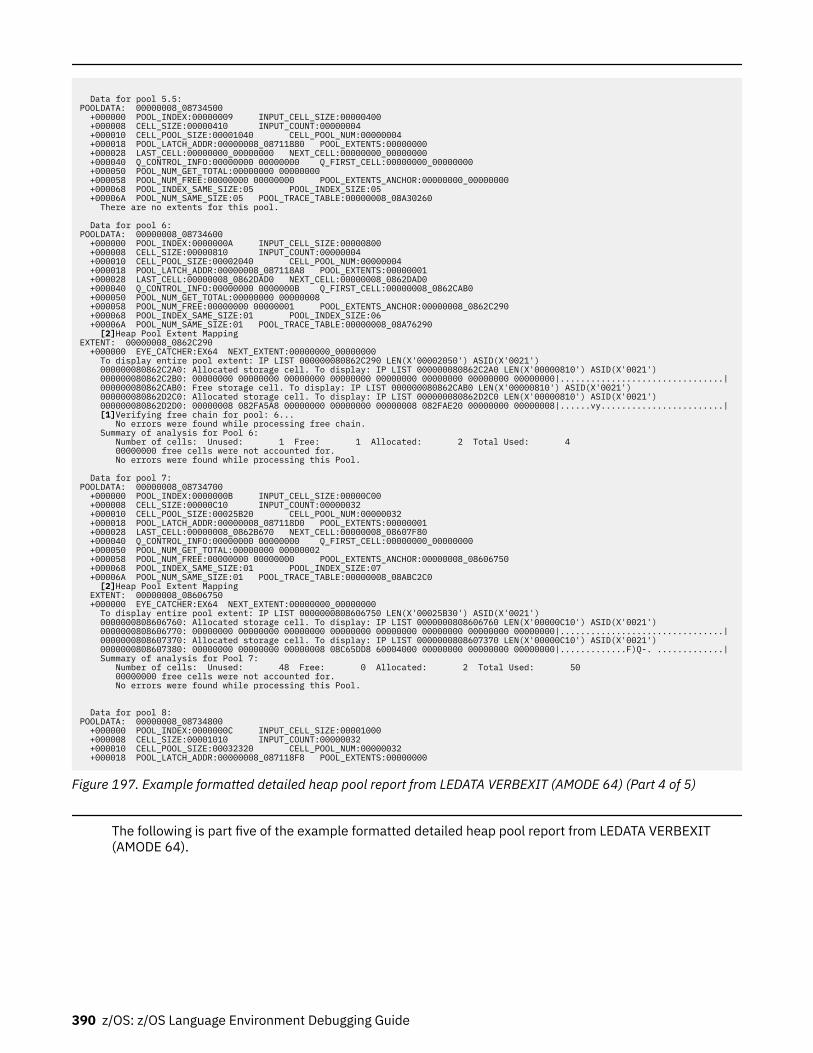
Data for pool 5.5: POOLDATA: 00000008_08734500 +000000 POOL_INDEX:00000009 INPUT_CELL_SIZE:00000400 +000008 CELL_SIZE:00000410 INPUT_COUNT:00000004 +000010 CELL_POOL_SIZE:00001040 CELL_POOL_NUM:00000004 +000018 POOL_LATCH_ADDR:00000008_08711880 POOL_EXTENTS:00000000 +000028 LAST_CELL:00000000_00000000 NEXT_CELL:00000000_00000000 +000040 Q_CONTROL_INFO:00000000 00000000 Q_FIRST_CELL:00000000_00000000 +000050 POOL_NUM_GET_TOTAL:00000000 00000000 +000058 POOL_NUM_FREE:00000000 00000000 POOL_EXTENTS_ANCHOR:00000000_00000000 +000068 POOL_INDEX_SAME_SIZE:05 POOL_INDEX_SIZE:05 +00006A POOL_NUM_SAME_SIZE:05 POOL_TRACE_TABLE:00000008_08A30260 There are no extents for this pool. Data for pool 6: POOLDATA: 00000008_08734600 +000000 POOL_INDEX:0000000A INPUT_CELL_SIZE:00000800 +000008 CELL_SIZE:00000810 INPUT_COUNT:00000004 +000010 CELL_POOL_SIZE:00002040 CELL_POOL_NUM:00000004 +000018 POOL_LATCH_ADDR:00000008_087118A8 POOL_EXTENTS:00000001 +000028 LAST_CELL:00000008_0862DAD0 NEXT_CELL:00000008_0862DAD0 +000040 Q_CONTROL_INFO:00000000 0000000B Q_FIRST_CELL:00000008_0862CAB0 +000050 POOL_NUM_GET_TOTAL:00000000 00000008 +000058 POOL_NUM_FREE:00000000 00000001 POOL_EXTENTS_ANCHOR:00000008_0862C290 +000068 POOL_INDEX_SAME_SIZE:01 POOL_INDEX_SIZE:06 +00006A POOL_NUM_SAME_SIZE:01 POOL_TRACE_TABLE:00000008_08A76290 [2]Heap Pool Extent Mapping EXTENT: 00000008_0862C290 +000000 EYE_CATCHER:EX64 NEXT_EXTENT:00000000_00000000 To display entire pool extent: IP LIST 000000080862C290 LEN(X'00002050') ASID(X'0021') 000000080862C2A0: Allocated storage cell. To display: IP LIST 000000080862C2A0 LEN(X'00000810') ASID(X'0021') 000000080862C2B0: 00000000 00000000 00000000 00000000 00000000 00000000 00000000 00000000|................................| 000000080862CAB0: Free storage cell. To display: IP LIST 000000080862CAB0 LEN(X'00000810') ASID(X'0021') 000000080862D2C0: Allocated storage cell. To display: IP LIST 000000080862D2C0 LEN(X'00000810') ASID(X'0021') 000000080862D2D0: 00000008 082FA5A8 00000000 00000000 00000008 082FAE20 00000000 00000008|......vy........................| [1]Verifying free chain for pool: 6... No errors were found while processing free chain. Summary of analysis for Pool 6: Number of cells: Unused: 1 Free: 1 Allocated: 2 Total Used: 4 00000000 free cells were not accounted for. No errors were found while processing this Pool. Data for pool 7: POOLDATA: 00000008_08734700 +000000 POOL_INDEX:0000000B INPUT_CELL_SIZE:00000C00 +000008 CELL_SIZE:00000C10 INPUT_COUNT:00000032 +000010 CELL_POOL_SIZE:00025B20 CELL_POOL_NUM:00000032 +000018 POOL_LATCH_ADDR:00000008_087118D0 POOL_EXTENTS:00000001 +000028 LAST_CELL:00000008_0862B670 NEXT_CELL:00000008_08607F80 +000040 Q_CONTROL_INFO:00000000 00000000 Q_FIRST_CELL:00000000_00000000 +000050 POOL_NUM_GET_TOTAL:00000000 00000002 +000058 POOL_NUM_FREE:00000000 00000000 POOL_EXTENTS_ANCHOR:00000008_08606750 +000068 POOL_INDEX_SAME_SIZE:01 POOL_INDEX_SIZE:07 +00006A POOL_NUM_SAME_SIZE:01 POOL_TRACE_TABLE:00000008_08ABC2C0 [2]Heap Pool Extent Mapping EXTENT: 00000008_08606750 +000000 EYE_CATCHER:EX64 NEXT_EXTENT:00000000_00000000 To display entire pool extent: IP LIST 0000000808606750 LEN(X'00025B30') ASID(X'0021') 0000000808606760: Allocated storage cell. To display: IP LIST 0000000808606760 LEN(X'00000C10') ASID(X'0021') 0000000808606770: 00000000 00000000 00000000 00000000 00000000 00000000 00000000 00000000|................................| 0000000808607370: Allocated storage cell. To display: IP LIST 0000000808607370 LEN(X'00000C10') ASID(X'0021') 0000000808607380: 00000000 00000000 00000008 08C65DD8 60004000 00000000 00000000 00000000|.............F)Q-. .............| Summary of analysis for Pool 7: Number of cells: Unused: 48 Free: 0 Allocated: 2 Total Used: 50 00000000 free cells were not accounted for. No errors were found while processing this Pool.
Data for pool 8: POOLDATA: 00000008_08734800 +000000 POOL_INDEX:0000000C INPUT_CELL_SIZE:00001000 +000008 CELL_SIZE:00001010 INPUT_COUNT:00000032 +000010 CELL_POOL_SIZE:00032320 CELL_POOL_NUM:00000032 +000018 POOL_LATCH_ADDR:00000008_087118F8 POOL_EXTENTS:00000000
Figure 197. Example formatted detailed heap pool report from LEDATA VERBEXIT (AMODE 64) (Part 4 of 5)
The following is part five of the example formatted detailed heap pool report from LEDATA VERBEXIT(AMODE 64).
390 z/OS: z/OS Language Environment Debugging Guide
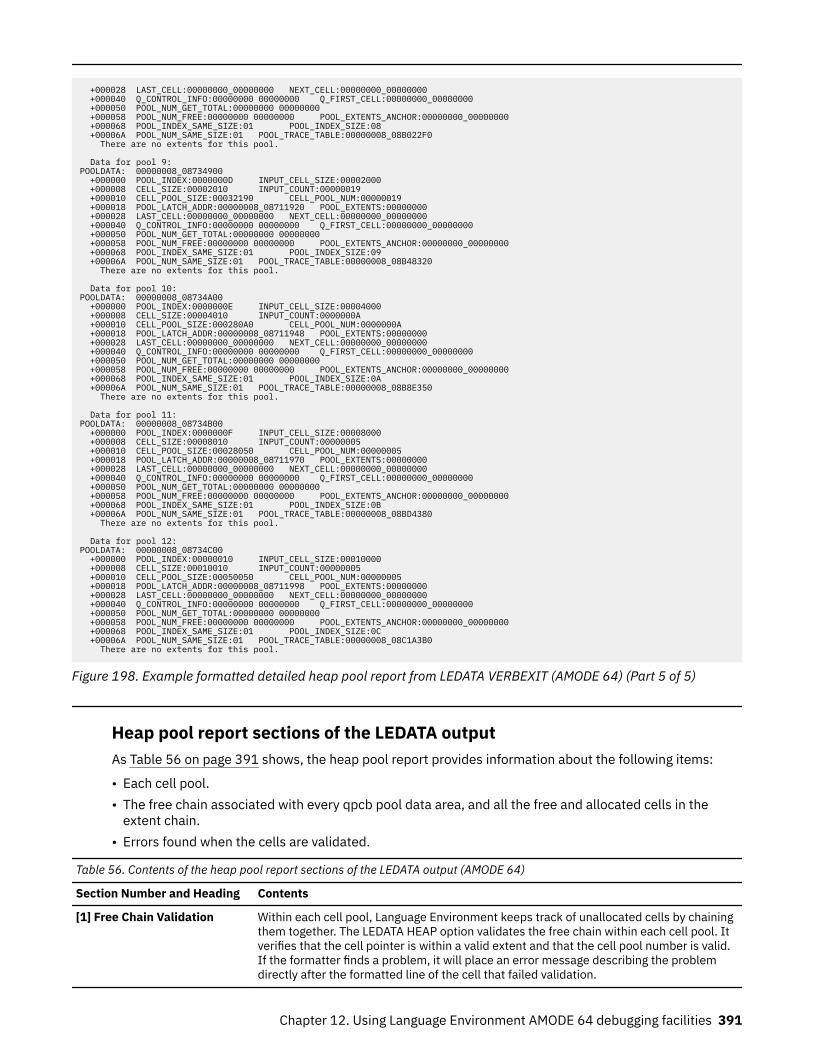
+000028 LAST_CELL:00000000_00000000 NEXT_CELL:00000000_00000000 +000040 Q_CONTROL_INFO:00000000 00000000 Q_FIRST_CELL:00000000_00000000 +000050 POOL_NUM_GET_TOTAL:00000000 00000000 +000058 POOL_NUM_FREE:00000000 00000000 POOL_EXTENTS_ANCHOR:00000000_00000000 +000068 POOL_INDEX_SAME_SIZE:01 POOL_INDEX_SIZE:08 +00006A POOL_NUM_SAME_SIZE:01 POOL_TRACE_TABLE:00000008_08B022F0 There are no extents for this pool. Data for pool 9: POOLDATA: 00000008_08734900 +000000 POOL_INDEX:0000000D INPUT_CELL_SIZE:00002000 +000008 CELL_SIZE:00002010 INPUT_COUNT:00000019 +000010 CELL_POOL_SIZE:00032190 CELL_POOL_NUM:00000019 +000018 POOL_LATCH_ADDR:00000008_08711920 POOL_EXTENTS:00000000 +000028 LAST_CELL:00000000_00000000 NEXT_CELL:00000000_00000000 +000040 Q_CONTROL_INFO:00000000 00000000 Q_FIRST_CELL:00000000_00000000 +000050 POOL_NUM_GET_TOTAL:00000000 00000000 +000058 POOL_NUM_FREE:00000000 00000000 POOL_EXTENTS_ANCHOR:00000000_00000000 +000068 POOL_INDEX_SAME_SIZE:01 POOL_INDEX_SIZE:09 +00006A POOL_NUM_SAME_SIZE:01 POOL_TRACE_TABLE:00000008_08B48320 There are no extents for this pool. Data for pool 10: POOLDATA: 00000008_08734A00 +000000 POOL_INDEX:0000000E INPUT_CELL_SIZE:00004000 +000008 CELL_SIZE:00004010 INPUT_COUNT:0000000A +000010 CELL_POOL_SIZE:000280A0 CELL_POOL_NUM:0000000A +000018 POOL_LATCH_ADDR:00000008_08711948 POOL_EXTENTS:00000000 +000028 LAST_CELL:00000000_00000000 NEXT_CELL:00000000_00000000 +000040 Q_CONTROL_INFO:00000000 00000000 Q_FIRST_CELL:00000000_00000000 +000050 POOL_NUM_GET_TOTAL:00000000 00000000 +000058 POOL_NUM_FREE:00000000 00000000 POOL_EXTENTS_ANCHOR:00000000_00000000 +000068 POOL_INDEX_SAME_SIZE:01 POOL_INDEX_SIZE:0A +00006A POOL_NUM_SAME_SIZE:01 POOL_TRACE_TABLE:00000008_08B8E350 There are no extents for this pool. Data for pool 11: POOLDATA: 00000008_08734B00 +000000 POOL_INDEX:0000000F INPUT_CELL_SIZE:00008000 +000008 CELL_SIZE:00008010 INPUT_COUNT:00000005 +000010 CELL_POOL_SIZE:00028050 CELL_POOL_NUM:00000005 +000018 POOL_LATCH_ADDR:00000008_08711970 POOL_EXTENTS:00000000 +000028 LAST_CELL:00000000_00000000 NEXT_CELL:00000000_00000000 +000040 Q_CONTROL_INFO:00000000 00000000 Q_FIRST_CELL:00000000_00000000 +000050 POOL_NUM_GET_TOTAL:00000000 00000000 +000058 POOL_NUM_FREE:00000000 00000000 POOL_EXTENTS_ANCHOR:00000000_00000000 +000068 POOL_INDEX_SAME_SIZE:01 POOL_INDEX_SIZE:0B +00006A POOL_NUM_SAME_SIZE:01 POOL_TRACE_TABLE:00000008_08BD4380 There are no extents for this pool. Data for pool 12: POOLDATA: 00000008_08734C00 +000000 POOL_INDEX:00000010 INPUT_CELL_SIZE:00010000 +000008 CELL_SIZE:00010010 INPUT_COUNT:00000005 +000010 CELL_POOL_SIZE:00050050 CELL_POOL_NUM:00000005 +000018 POOL_LATCH_ADDR:00000008_08711998 POOL_EXTENTS:00000000 +000028 LAST_CELL:00000000_00000000 NEXT_CELL:00000000_00000000 +000040 Q_CONTROL_INFO:00000000 00000000 Q_FIRST_CELL:00000000_00000000 +000050 POOL_NUM_GET_TOTAL:00000000 00000000 +000058 POOL_NUM_FREE:00000000 00000000 POOL_EXTENTS_ANCHOR:00000000_00000000 +000068 POOL_INDEX_SAME_SIZE:01 POOL_INDEX_SIZE:0C +00006A POOL_NUM_SAME_SIZE:01 POOL_TRACE_TABLE:00000008_08C1A3B0 There are no extents for this pool.
Figure 198. Example formatted detailed heap pool report from LEDATA VERBEXIT (AMODE 64) (Part 5 of 5)
Heap pool report sections of the LEDATA outputAs Table 56 on page 391 shows, the heap pool report provides information about the following items:
• Each cell pool.• The free chain associated with every qpcb pool data area, and all the free and allocated cells in the
extent chain.• Errors found when the cells are validated.
Table 56. Contents of the heap pool report sections of the LEDATA output (AMODE 64)
Section Number and Heading Contents
[1] Free Chain Validation Within each cell pool, Language Environment keeps track of unallocated cells by chainingthem together. The LEDATA HEAP option validates the free chain within each cell pool. Itverifies that the cell pointer is within a valid extent and that the cell pool number is valid.If the formatter finds a problem, it will place an error message describing the problemdirectly after the formatted line of the cell that failed validation.
Chapter 12. Using Language Environment AMODE 64 debugging facilities 391
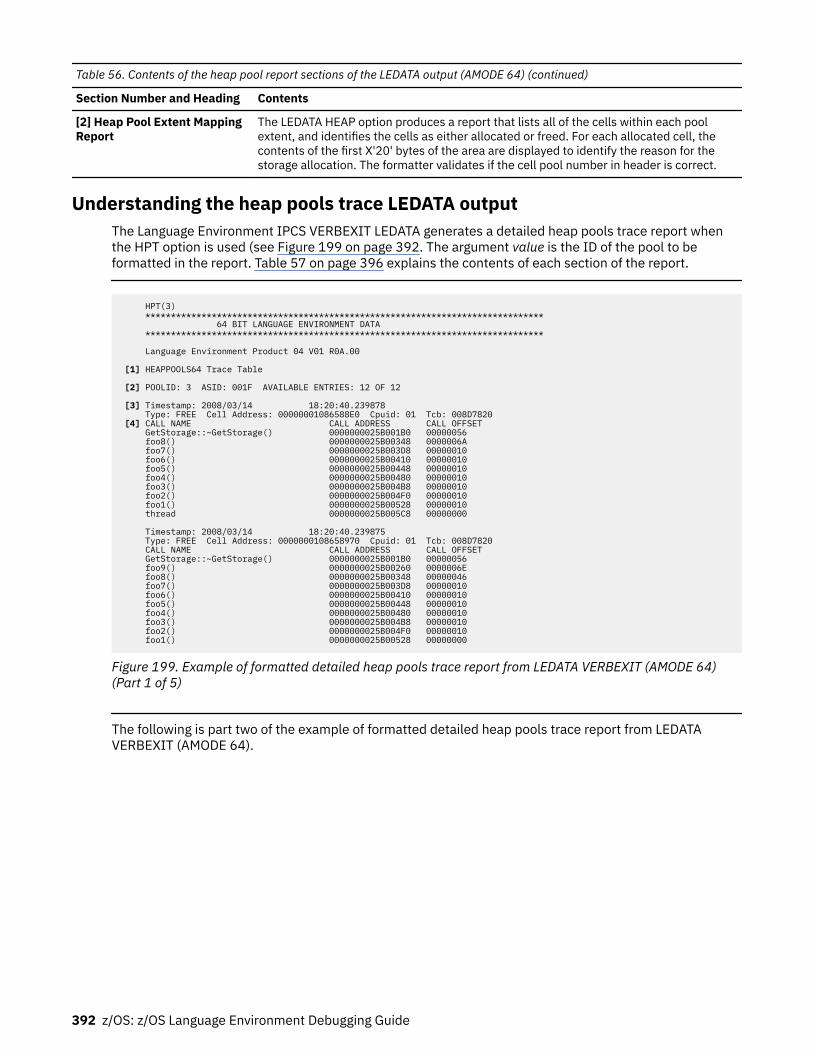
Table 56. Contents of the heap pool report sections of the LEDATA output (AMODE 64) (continued)
Section Number and Heading Contents
[2] Heap Pool Extent MappingReport
The LEDATA HEAP option produces a report that lists all of the cells within each poolextent, and identifies the cells as either allocated or freed. For each allocated cell, thecontents of the first X'20' bytes of the area are displayed to identify the reason for thestorage allocation. The formatter validates if the cell pool number in header is correct.
Understanding the heap pools trace LEDATA outputThe Language Environment IPCS VERBEXIT LEDATA generates a detailed heap pools trace report whenthe HPT option is used (see Figure 199 on page 392. The argument value is the ID of the pool to beformatted in the report. Table 57 on page 396 explains the contents of each section of the report.
HPT(3) ****************************************************************************** 64 BIT LANGUAGE ENVIRONMENT DATA ****************************************************************************** Language Environment Product 04 V01 R0A.00 [1] HEAPPOOLS64 Trace Table [2] POOLID: 3 ASID: 001F AVAILABLE ENTRIES: 12 OF 12 [3] Timestamp: 2008/03/14 18:20:40.239878 Type: FREE Cell Address: 00000001086588E0 Cpuid: 01 Tcb: 008D7820 [4] CALL NAME CALL ADDRESS CALL OFFSET GetStorage::~GetStorage() 0000000025B001B0 00000056 foo8() 0000000025B00348 0000006A foo7() 0000000025B003D8 00000010 foo6() 0000000025B00410 00000010 foo5() 0000000025B00448 00000010 foo4() 0000000025B00480 00000010 foo3() 0000000025B004B8 00000010 foo2() 0000000025B004F0 00000010 foo1() 0000000025B00528 00000010 thread 0000000025B005C8 00000000 Timestamp: 2008/03/14 18:20:40.239875 Type: FREE Cell Address: 0000000108658970 Cpuid: 01 Tcb: 008D7820 CALL NAME CALL ADDRESS CALL OFFSET GetStorage::~GetStorage() 0000000025B001B0 00000056 foo9() 0000000025B00260 0000006E foo8() 0000000025B00348 00000046 foo7() 0000000025B003D8 00000010 foo6() 0000000025B00410 00000010 foo5() 0000000025B00448 00000010 foo4() 0000000025B00480 00000010 foo3() 0000000025B004B8 00000010 foo2() 0000000025B004F0 00000010 foo1() 0000000025B00528 00000000
Figure 199. Example of formatted detailed heap pools trace report from LEDATA VERBEXIT (AMODE 64)(Part 1 of 5)
The following is part two of the example of formatted detailed heap pools trace report from LEDATAVERBEXIT (AMODE 64).
392 z/OS: z/OS Language Environment Debugging Guide
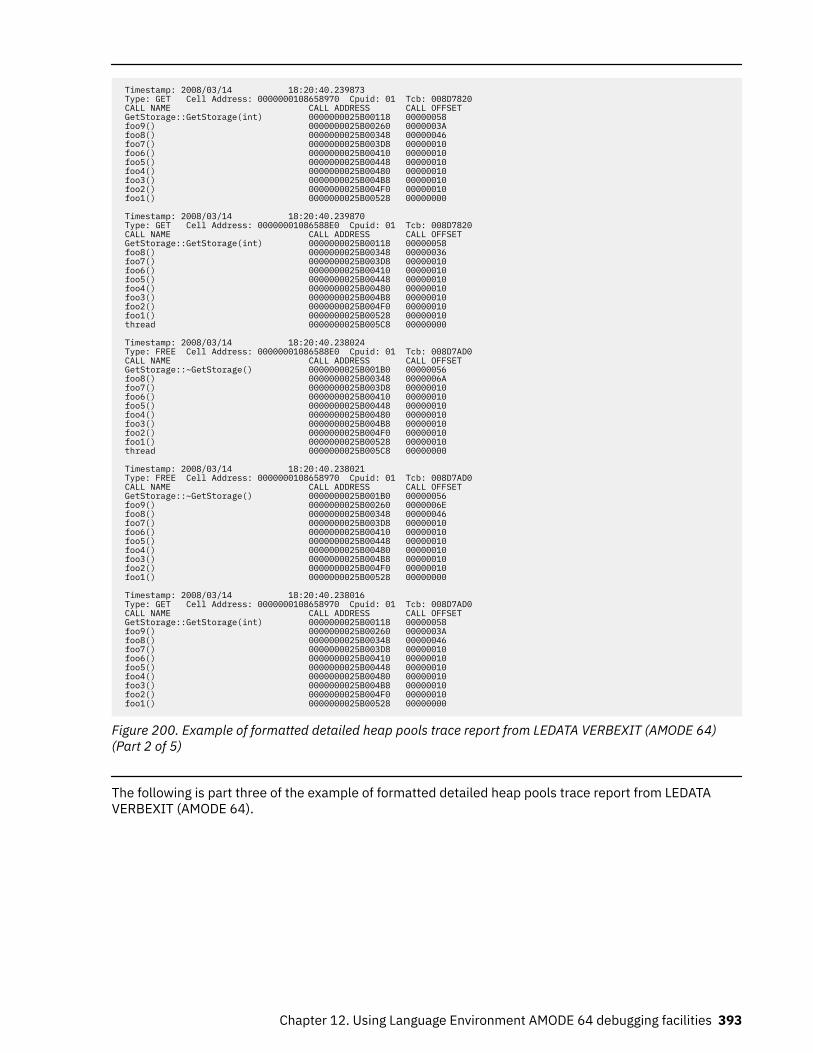
Timestamp: 2008/03/14 18:20:40.239873 Type: GET Cell Address: 0000000108658970 Cpuid: 01 Tcb: 008D7820 CALL NAME CALL ADDRESS CALL OFFSET GetStorage::GetStorage(int) 0000000025B00118 00000058 foo9() 0000000025B00260 0000003A foo8() 0000000025B00348 00000046 foo7() 0000000025B003D8 00000010 foo6() 0000000025B00410 00000010 foo5() 0000000025B00448 00000010 foo4() 0000000025B00480 00000010 foo3() 0000000025B004B8 00000010 foo2() 0000000025B004F0 00000010 foo1() 0000000025B00528 00000000 Timestamp: 2008/03/14 18:20:40.239870 Type: GET Cell Address: 00000001086588E0 Cpuid: 01 Tcb: 008D7820 CALL NAME CALL ADDRESS CALL OFFSET GetStorage::GetStorage(int) 0000000025B00118 00000058 foo8() 0000000025B00348 00000036 foo7() 0000000025B003D8 00000010 foo6() 0000000025B00410 00000010 foo5() 0000000025B00448 00000010 foo4() 0000000025B00480 00000010 foo3() 0000000025B004B8 00000010 foo2() 0000000025B004F0 00000010 foo1() 0000000025B00528 00000010 thread 0000000025B005C8 00000000 Timestamp: 2008/03/14 18:20:40.238024 Type: FREE Cell Address: 00000001086588E0 Cpuid: 01 Tcb: 008D7AD0 CALL NAME CALL ADDRESS CALL OFFSET GetStorage::~GetStorage() 0000000025B001B0 00000056 foo8() 0000000025B00348 0000006A foo7() 0000000025B003D8 00000010 foo6() 0000000025B00410 00000010 foo5() 0000000025B00448 00000010 foo4() 0000000025B00480 00000010 foo3() 0000000025B004B8 00000010 foo2() 0000000025B004F0 00000010 foo1() 0000000025B00528 00000010 thread 0000000025B005C8 00000000 Timestamp: 2008/03/14 18:20:40.238021 Type: FREE Cell Address: 0000000108658970 Cpuid: 01 Tcb: 008D7AD0 CALL NAME CALL ADDRESS CALL OFFSET GetStorage::~GetStorage() 0000000025B001B0 00000056 foo9() 0000000025B00260 0000006E foo8() 0000000025B00348 00000046 foo7() 0000000025B003D8 00000010 foo6() 0000000025B00410 00000010 foo5() 0000000025B00448 00000010 foo4() 0000000025B00480 00000010 foo3() 0000000025B004B8 00000010 foo2() 0000000025B004F0 00000010 foo1() 0000000025B00528 00000000 Timestamp: 2008/03/14 18:20:40.238016 Type: GET Cell Address: 0000000108658970 Cpuid: 01 Tcb: 008D7AD0 CALL NAME CALL ADDRESS CALL OFFSET GetStorage::GetStorage(int) 0000000025B00118 00000058 foo9() 0000000025B00260 0000003A foo8() 0000000025B00348 00000046 foo7() 0000000025B003D8 00000010 foo6() 0000000025B00410 00000010 foo5() 0000000025B00448 00000010 foo4() 0000000025B00480 00000010 foo3() 0000000025B004B8 00000010 foo2() 0000000025B004F0 00000010 foo1() 0000000025B00528 00000000
Figure 200. Example of formatted detailed heap pools trace report from LEDATA VERBEXIT (AMODE 64)(Part 2 of 5)
The following is part three of the example of formatted detailed heap pools trace report from LEDATAVERBEXIT (AMODE 64).
Chapter 12. Using Language Environment AMODE 64 debugging facilities 393
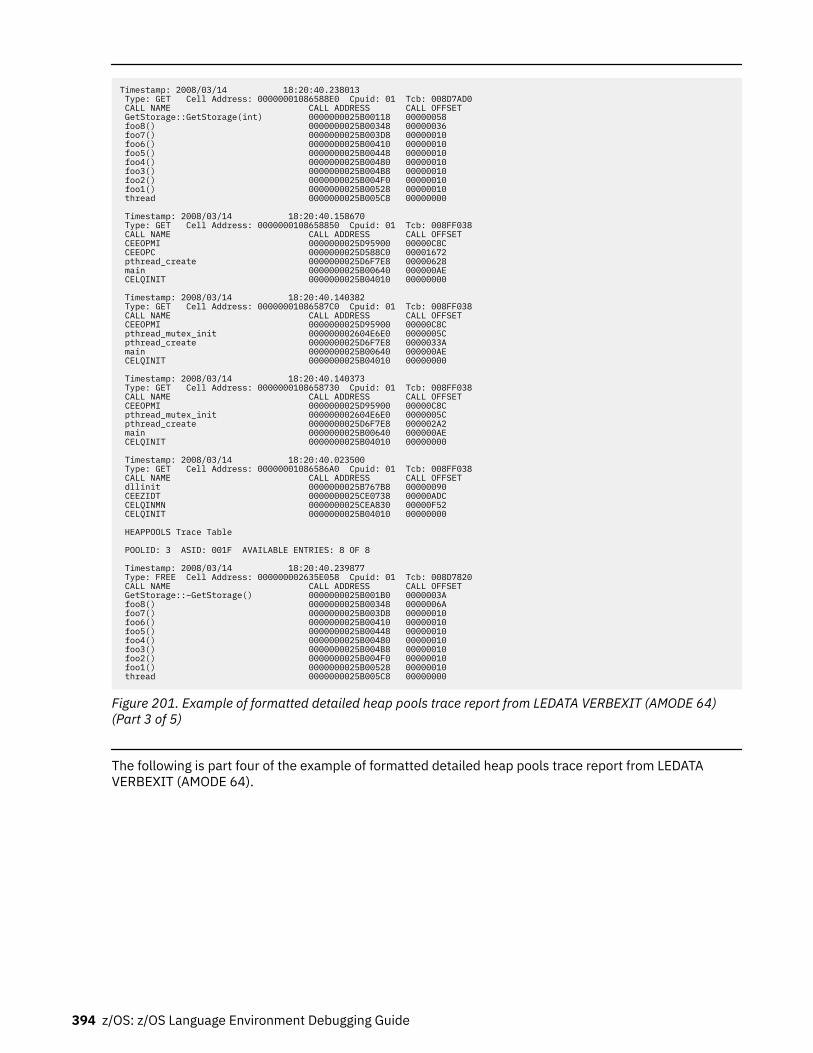
Timestamp: 2008/03/14 18:20:40.238013 Type: GET Cell Address: 00000001086588E0 Cpuid: 01 Tcb: 008D7AD0 CALL NAME CALL ADDRESS CALL OFFSET GetStorage::GetStorage(int) 0000000025B00118 00000058 foo8() 0000000025B00348 00000036 foo7() 0000000025B003D8 00000010 foo6() 0000000025B00410 00000010 foo5() 0000000025B00448 00000010 foo4() 0000000025B00480 00000010 foo3() 0000000025B004B8 00000010 foo2() 0000000025B004F0 00000010 foo1() 0000000025B00528 00000010 thread 0000000025B005C8 00000000 Timestamp: 2008/03/14 18:20:40.158670 Type: GET Cell Address: 0000000108658850 Cpuid: 01 Tcb: 008FF038 CALL NAME CALL ADDRESS CALL OFFSET CEEOPMI 0000000025D95900 00000C8C CEEOPC 0000000025D588C0 00001672 pthread_create 0000000025D6F7E8 00000628 main 0000000025B00640 000000AE CELQINIT 0000000025B04010 00000000 Timestamp: 2008/03/14 18:20:40.140382 Type: GET Cell Address: 00000001086587C0 Cpuid: 01 Tcb: 008FF038 CALL NAME CALL ADDRESS CALL OFFSET CEEOPMI 0000000025D95900 00000C8C pthread_mutex_init 000000002604E6E0 0000005C pthread_create 0000000025D6F7E8 0000033A main 0000000025B00640 000000AE CELQINIT 0000000025B04010 00000000 Timestamp: 2008/03/14 18:20:40.140373 Type: GET Cell Address: 0000000108658730 Cpuid: 01 Tcb: 008FF038 CALL NAME CALL ADDRESS CALL OFFSET CEEOPMI 0000000025D95900 00000C8C pthread_mutex_init 000000002604E6E0 0000005C pthread_create 0000000025D6F7E8 000002A2 main 0000000025B00640 000000AE CELQINIT 0000000025B04010 00000000 Timestamp: 2008/03/14 18:20:40.023500 Type: GET Cell Address: 00000001086586A0 Cpuid: 01 Tcb: 008FF038 CALL NAME CALL ADDRESS CALL OFFSET dllinit 0000000025B767B8 00000090 CEEZIDT 0000000025CE0738 00000ADC CELQINMN 0000000025CEA830 00000F52 CELQINIT 0000000025B04010 00000000 HEAPPOOLS Trace Table POOLID: 3 ASID: 001F AVAILABLE ENTRIES: 8 OF 8 Timestamp: 2008/03/14 18:20:40.239877 Type: FREE Cell Address: 000000002635E058 Cpuid: 01 Tcb: 008D7820 CALL NAME CALL ADDRESS CALL OFFSET GetStorage::~GetStorage() 0000000025B001B0 0000003A foo8() 0000000025B00348 0000006A foo7() 0000000025B003D8 00000010 foo6() 0000000025B00410 00000010 foo5() 0000000025B00448 00000010 foo4() 0000000025B00480 00000010 foo3() 0000000025B004B8 00000010 foo2() 0000000025B004F0 00000010 foo1() 0000000025B00528 00000010 thread 0000000025B005C8 00000000
Figure 201. Example of formatted detailed heap pools trace report from LEDATA VERBEXIT (AMODE 64)(Part 3 of 5)
The following is part four of the example of formatted detailed heap pools trace report from LEDATAVERBEXIT (AMODE 64).
394 z/OS: z/OS Language Environment Debugging Guide
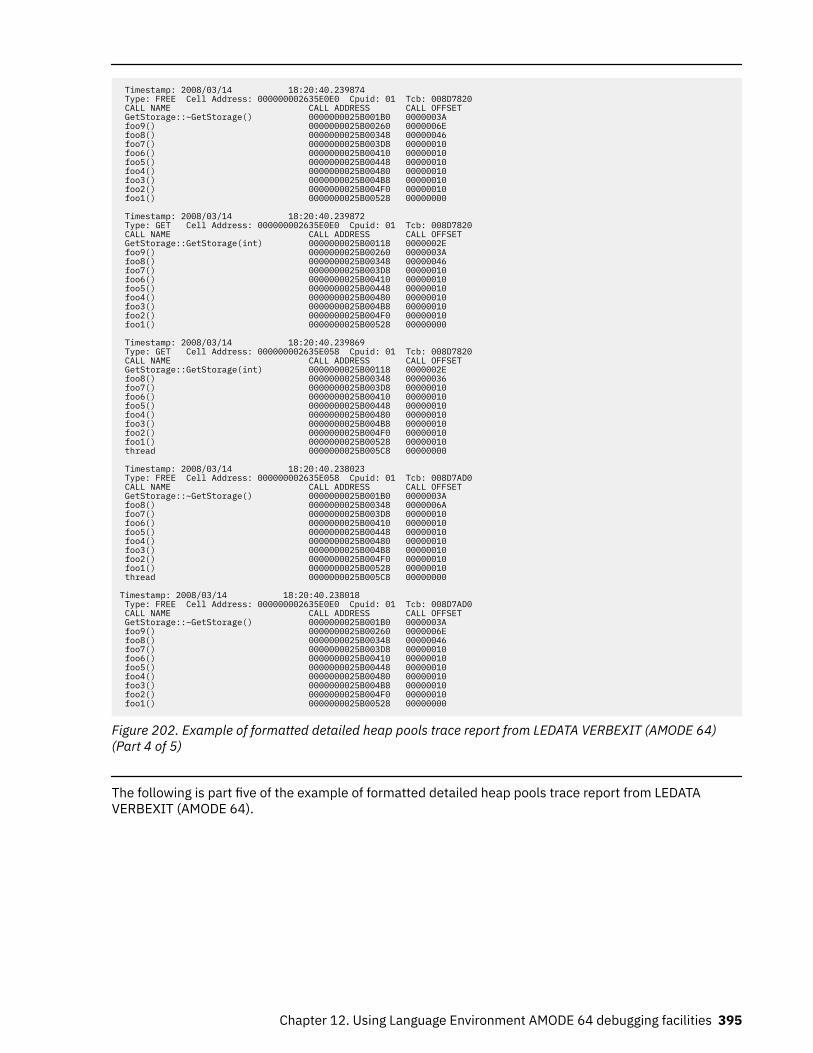
Timestamp: 2008/03/14 18:20:40.239874 Type: FREE Cell Address: 000000002635E0E0 Cpuid: 01 Tcb: 008D7820 CALL NAME CALL ADDRESS CALL OFFSET GetStorage::~GetStorage() 0000000025B001B0 0000003A foo9() 0000000025B00260 0000006E foo8() 0000000025B00348 00000046 foo7() 0000000025B003D8 00000010 foo6() 0000000025B00410 00000010 foo5() 0000000025B00448 00000010 foo4() 0000000025B00480 00000010 foo3() 0000000025B004B8 00000010 foo2() 0000000025B004F0 00000010 foo1() 0000000025B00528 00000000 Timestamp: 2008/03/14 18:20:40.239872 Type: GET Cell Address: 000000002635E0E0 Cpuid: 01 Tcb: 008D7820 CALL NAME CALL ADDRESS CALL OFFSET GetStorage::GetStorage(int) 0000000025B00118 0000002E foo9() 0000000025B00260 0000003A foo8() 0000000025B00348 00000046 foo7() 0000000025B003D8 00000010 foo6() 0000000025B00410 00000010 foo5() 0000000025B00448 00000010 foo4() 0000000025B00480 00000010 foo3() 0000000025B004B8 00000010 foo2() 0000000025B004F0 00000010 foo1() 0000000025B00528 00000000 Timestamp: 2008/03/14 18:20:40.239869 Type: GET Cell Address: 000000002635E058 Cpuid: 01 Tcb: 008D7820 CALL NAME CALL ADDRESS CALL OFFSET GetStorage::GetStorage(int) 0000000025B00118 0000002E foo8() 0000000025B00348 00000036 foo7() 0000000025B003D8 00000010 foo6() 0000000025B00410 00000010 foo5() 0000000025B00448 00000010 foo4() 0000000025B00480 00000010 foo3() 0000000025B004B8 00000010 foo2() 0000000025B004F0 00000010 foo1() 0000000025B00528 00000010 thread 0000000025B005C8 00000000 Timestamp: 2008/03/14 18:20:40.238023 Type: FREE Cell Address: 000000002635E058 Cpuid: 01 Tcb: 008D7AD0 CALL NAME CALL ADDRESS CALL OFFSET GetStorage::~GetStorage() 0000000025B001B0 0000003A foo8() 0000000025B00348 0000006A foo7() 0000000025B003D8 00000010 foo6() 0000000025B00410 00000010 foo5() 0000000025B00448 00000010 foo4() 0000000025B00480 00000010 foo3() 0000000025B004B8 00000010 foo2() 0000000025B004F0 00000010 foo1() 0000000025B00528 00000010 thread 0000000025B005C8 00000000 Timestamp: 2008/03/14 18:20:40.238018 Type: FREE Cell Address: 000000002635E0E0 Cpuid: 01 Tcb: 008D7AD0 CALL NAME CALL ADDRESS CALL OFFSET GetStorage::~GetStorage() 0000000025B001B0 0000003A foo9() 0000000025B00260 0000006E foo8() 0000000025B00348 00000046 foo7() 0000000025B003D8 00000010 foo6() 0000000025B00410 00000010 foo5() 0000000025B00448 00000010 foo4() 0000000025B00480 00000010 foo3() 0000000025B004B8 00000010 foo2() 0000000025B004F0 00000010 foo1() 0000000025B00528 00000000
Figure 202. Example of formatted detailed heap pools trace report from LEDATA VERBEXIT (AMODE 64)(Part 4 of 5)
The following is part five of the example of formatted detailed heap pools trace report from LEDATAVERBEXIT (AMODE 64).
Chapter 12. Using Language Environment AMODE 64 debugging facilities 395
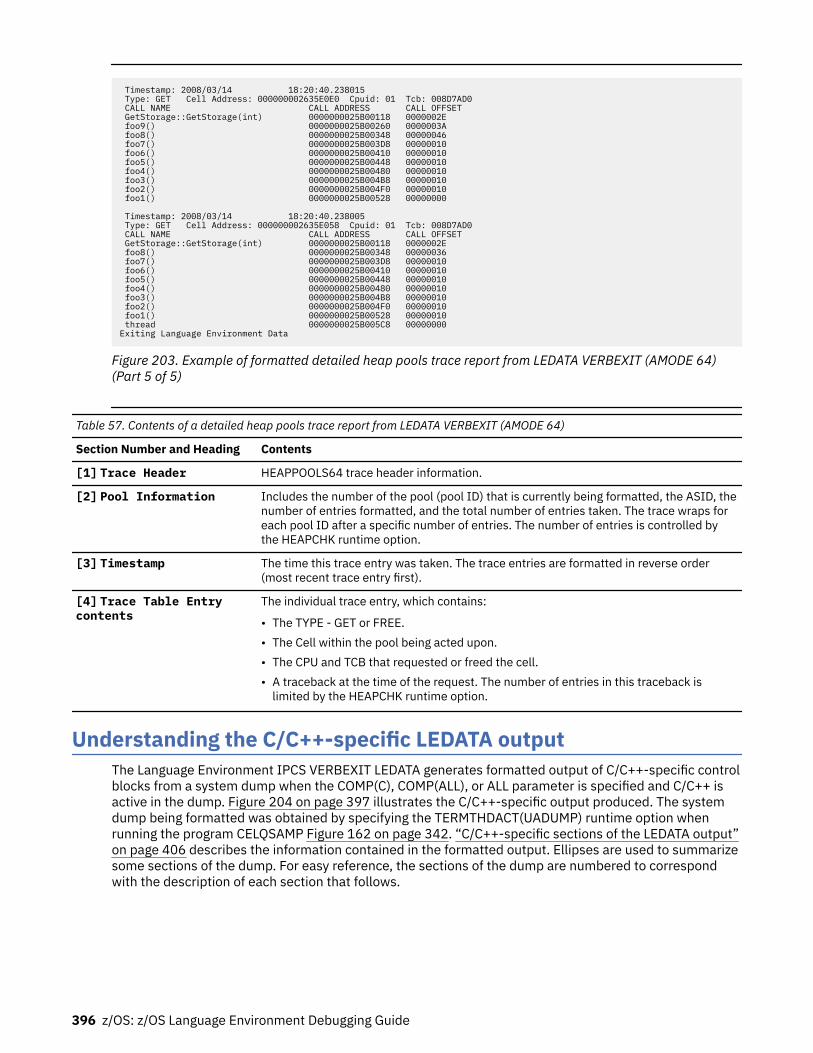
Timestamp: 2008/03/14 18:20:40.238015 Type: GET Cell Address: 000000002635E0E0 Cpuid: 01 Tcb: 008D7AD0 CALL NAME CALL ADDRESS CALL OFFSET GetStorage::GetStorage(int) 0000000025B00118 0000002E foo9() 0000000025B00260 0000003A foo8() 0000000025B00348 00000046 foo7() 0000000025B003D8 00000010 foo6() 0000000025B00410 00000010 foo5() 0000000025B00448 00000010 foo4() 0000000025B00480 00000010 foo3() 0000000025B004B8 00000010 foo2() 0000000025B004F0 00000010 foo1() 0000000025B00528 00000000 Timestamp: 2008/03/14 18:20:40.238005 Type: GET Cell Address: 000000002635E058 Cpuid: 01 Tcb: 008D7AD0 CALL NAME CALL ADDRESS CALL OFFSET GetStorage::GetStorage(int) 0000000025B00118 0000002E foo8() 0000000025B00348 00000036 foo7() 0000000025B003D8 00000010 foo6() 0000000025B00410 00000010 foo5() 0000000025B00448 00000010 foo4() 0000000025B00480 00000010 foo3() 0000000025B004B8 00000010 foo2() 0000000025B004F0 00000010 foo1() 0000000025B00528 00000010 thread 0000000025B005C8 00000000 Exiting Language Environment Data
Figure 203. Example of formatted detailed heap pools trace report from LEDATA VERBEXIT (AMODE 64)(Part 5 of 5)
Table 57. Contents of a detailed heap pools trace report from LEDATA VERBEXIT (AMODE 64)
Section Number and Heading Contents
[1] Trace Header HEAPPOOLS64 trace header information.
[2] Pool Information Includes the number of the pool (pool ID) that is currently being formatted, the ASID, thenumber of entries formatted, and the total number of entries taken. The trace wraps foreach pool ID after a specific number of entries. The number of entries is controlled bythe HEAPCHK runtime option.
[3] Timestamp The time this trace entry was taken. The trace entries are formatted in reverse order(most recent trace entry first).
[4] Trace Table Entrycontents
The individual trace entry, which contains:
• The TYPE - GET or FREE.• The Cell within the pool being acted upon.• The CPU and TCB that requested or freed the cell.• A traceback at the time of the request. The number of entries in this traceback is
limited by the HEAPCHK runtime option.
Understanding the C/C++-specific LEDATA outputThe Language Environment IPCS VERBEXIT LEDATA generates formatted output of C/C++-specific controlblocks from a system dump when the COMP(C), COMP(ALL), or ALL parameter is specified and C/C++ isactive in the dump. Figure 204 on page 397 illustrates the C/C++-specific output produced. The systemdump being formatted was obtained by specifying the TERMTHDACT(UADUMP) runtime option whenrunning the program CELQSAMP Figure 162 on page 342. “C/C++-specific sections of the LEDATA output”on page 406 describes the information contained in the formatted output. Ellipses are used to summarizesome sections of the dump. For easy reference, the sections of the dump are numbered to correspondwith the description of each section that follows.
396 z/OS: z/OS Language Environment Debugging Guide
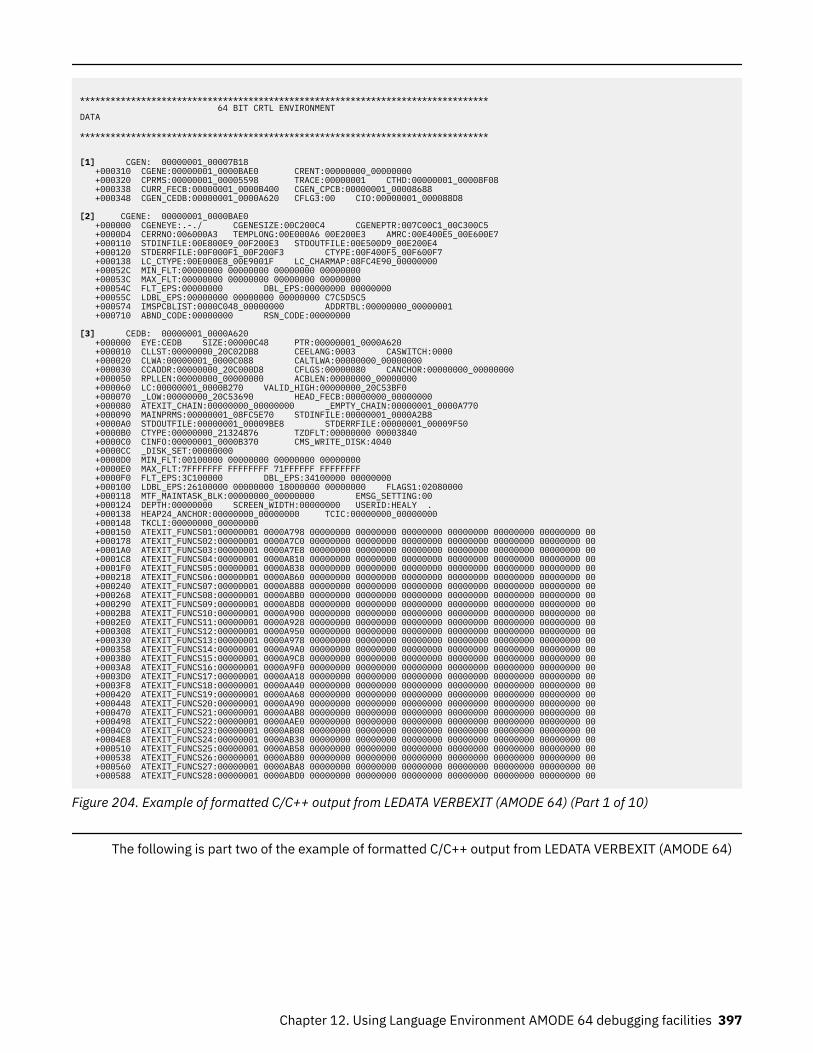
******************************************************************************** 64 BIT CRTL ENVIRONMENT DATA ******************************************************************************** [1] CGEN: 00000001_00007B18 +000310 CGENE:00000001_0000BAE0 CRENT:00000000_00000000 +000320 CPRMS:00000001_00005598 TRACE:00000001 CTHD:00000001_00008F08 +000338 CURR_FECB:00000001_0000B400 CGEN_CPCB:00000001_00008688 +000348 CGEN_CEDB:00000001_0000A620 CFLG3:00 CIO:00000001_000088D8 [2] CGENE: 00000001_0000BAE0 +000000 CGENEYE:.-./ CGENESIZE:00C200C4 CGENEPTR:007C00C1_00C300C5 +0000D4 CERRNO:006000A3 TEMPLONG:00E000A6 00E200E3 AMRC:00E400E5_00E600E7 +000110 STDINFILE:00E800E9_00F200E3 STDOUTFILE:00E500D9_00E200E4 +000120 STDERRFILE:00F000F1_00F200F3 CTYPE:00F400F5_00F600F7 +000138 LC_CTYPE:00E000E8_00E9001F LC_CHARMAP:08FC4E90_00000000 +00052C MIN_FLT:00000000 00000000 00000000 00000000 +00053C MAX_FLT:00000000 00000000 00000000 00000000 +00054C FLT_EPS:00000000 DBL_EPS:00000000 00000000 +00055C LDBL_EPS:00000000 00000000 00000000 C7C5D5C5 +000574 IMSPCBLIST:0000C048_00000000 ADDRTBL:00000000_00000001 +000710 ABND_CODE:00000000 RSN_CODE:00000000
[3] CEDB: 00000001_0000A620 +000000 EYE:CEDB SIZE:00000C48 PTR:00000001_0000A620 +000010 CLLST:00000000_20C02DB8 CEELANG:0003 CASWITCH:0000 +000020 CLWA:00000001_0000C088 CALTLWA:00000000_00000000 +000030 CCADDR:00000000_20C000D8 CFLGS:00000080 CANCHOR:00000000_00000000 +000050 RPLLEN:00000000_00000000 ACBLEN:00000000_00000000 +000060 LC:00000001_0000B270 VALID_HIGH:00000000_20C53BF0 +000070 _LOW:00000000_20C53690 HEAD_FECB:00000000_00000000 +000080 ATEXIT_CHAIN:00000000_00000000 _EMPTY_CHAIN:00000001_0000A770 +000090 MAINPRMS:00000001_08FC5E70 STDINFILE:00000001_0000A2B8 +0000A0 STDOUTFILE:00000001_00009BE8 STDERRFILE:00000001_00009F50 +0000B0 CTYPE:00000000_21324876 TZDFLT:00000000 00003840 +0000C0 CINFO:00000001_0000B370 CMS_WRITE_DISK:4040 +0000CC _DISK_SET:00000000 +0000D0 MIN_FLT:00100000 00000000 00000000 00000000 +0000E0 MAX_FLT:7FFFFFFF FFFFFFFF 71FFFFFF FFFFFFFF +0000F0 FLT_EPS:3C100000 DBL_EPS:34100000 00000000 +000100 LDBL_EPS:26100000 00000000 18000000 00000000 FLAGS1:02080000 +000118 MTF_MAINTASK_BLK:00000000_00000000 EMSG_SETTING:00 +000124 DEPTH:00000000 SCREEN_WIDTH:00000000 USERID:HEALY . +000138 HEAP24_ANCHOR:00000000_00000000 TCIC:00000000_00000000 +000148 TKCLI:00000000_00000000 +000150 ATEXIT_FUNCS01:00000001 0000A798 00000000 00000000 00000000 00000000 00000000 00000000 00 +000178 ATEXIT_FUNCS02:00000001 0000A7C0 00000000 00000000 00000000 00000000 00000000 00000000 00 +0001A0 ATEXIT_FUNCS03:00000001 0000A7E8 00000000 00000000 00000000 00000000 00000000 00000000 00 +0001C8 ATEXIT_FUNCS04:00000001 0000A810 00000000 00000000 00000000 00000000 00000000 00000000 00 +0001F0 ATEXIT_FUNCS05:00000001 0000A838 00000000 00000000 00000000 00000000 00000000 00000000 00 +000218 ATEXIT_FUNCS06:00000001 0000A860 00000000 00000000 00000000 00000000 00000000 00000000 00 +000240 ATEXIT_FUNCS07:00000001 0000A888 00000000 00000000 00000000 00000000 00000000 00000000 00 +000268 ATEXIT_FUNCS08:00000001 0000A8B0 00000000 00000000 00000000 00000000 00000000 00000000 00 +000290 ATEXIT_FUNCS09:00000001 0000A8D8 00000000 00000000 00000000 00000000 00000000 00000000 00 +0002B8 ATEXIT_FUNCS10:00000001 0000A900 00000000 00000000 00000000 00000000 00000000 00000000 00 +0002E0 ATEXIT_FUNCS11:00000001 0000A928 00000000 00000000 00000000 00000000 00000000 00000000 00 +000308 ATEXIT_FUNCS12:00000001 0000A950 00000000 00000000 00000000 00000000 00000000 00000000 00 +000330 ATEXIT_FUNCS13:00000001 0000A978 00000000 00000000 00000000 00000000 00000000 00000000 00 +000358 ATEXIT_FUNCS14:00000001 0000A9A0 00000000 00000000 00000000 00000000 00000000 00000000 00 +000380 ATEXIT_FUNCS15:00000001 0000A9C8 00000000 00000000 00000000 00000000 00000000 00000000 00 +0003A8 ATEXIT_FUNCS16:00000001 0000A9F0 00000000 00000000 00000000 00000000 00000000 00000000 00 +0003D0 ATEXIT_FUNCS17:00000001 0000AA18 00000000 00000000 00000000 00000000 00000000 00000000 00 +0003F8 ATEXIT_FUNCS18:00000001 0000AA40 00000000 00000000 00000000 00000000 00000000 00000000 00 +000420 ATEXIT_FUNCS19:00000001 0000AA68 00000000 00000000 00000000 00000000 00000000 00000000 00 +000448 ATEXIT_FUNCS20:00000001 0000AA90 00000000 00000000 00000000 00000000 00000000 00000000 00 +000470 ATEXIT_FUNCS21:00000001 0000AAB8 00000000 00000000 00000000 00000000 00000000 00000000 00 +000498 ATEXIT_FUNCS22:00000001 0000AAE0 00000000 00000000 00000000 00000000 00000000 00000000 00 +0004C0 ATEXIT_FUNCS23:00000001 0000AB08 00000000 00000000 00000000 00000000 00000000 00000000 00 +0004E8 ATEXIT_FUNCS24:00000001 0000AB30 00000000 00000000 00000000 00000000 00000000 00000000 00 +000510 ATEXIT_FUNCS25:00000001 0000AB58 00000000 00000000 00000000 00000000 00000000 00000000 00 +000538 ATEXIT_FUNCS26:00000001 0000AB80 00000000 00000000 00000000 00000000 00000000 00000000 00 +000560 ATEXIT_FUNCS27:00000001 0000ABA8 00000000 00000000 00000000 00000000 00000000 00000000 00 +000588 ATEXIT_FUNCS28:00000001 0000ABD0 00000000 00000000 00000000 00000000 00000000 00000000 00
Figure 204. Example of formatted C/C++ output from LEDATA VERBEXIT (AMODE 64) (Part 1 of 10)
The following is part two of the example of formatted C/C++ output from LEDATA VERBEXIT (AMODE 64)
Chapter 12. Using Language Environment AMODE 64 debugging facilities 397
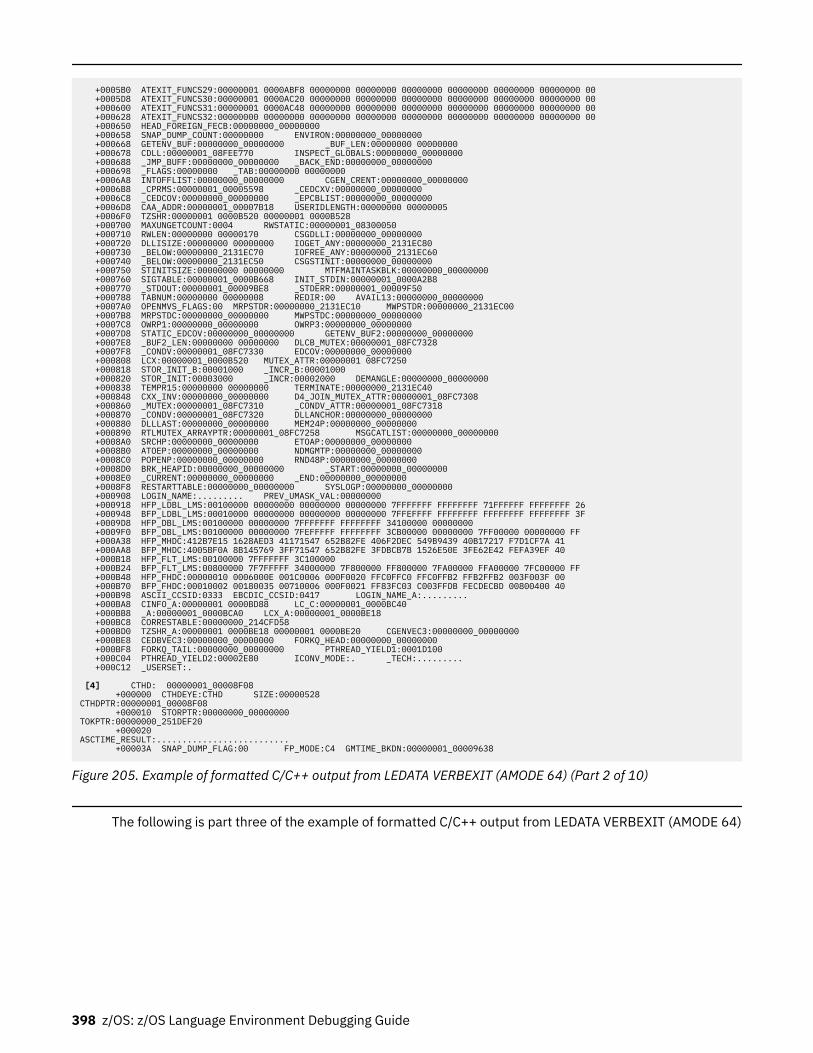
+0005B0 ATEXIT_FUNCS29:00000001 0000ABF8 00000000 00000000 00000000 00000000 00000000 00000000 00 +0005D8 ATEXIT_FUNCS30:00000001 0000AC20 00000000 00000000 00000000 00000000 00000000 00000000 00 +000600 ATEXIT_FUNCS31:00000001 0000AC48 00000000 00000000 00000000 00000000 00000000 00000000 00 +000628 ATEXIT_FUNCS32:00000000 00000000 00000000 00000000 00000000 00000000 00000000 00000000 00 +000650 HEAD_FOREIGN_FECB:00000000_00000000 +000658 SNAP_DUMP_COUNT:00000000 ENVIRON:00000000_00000000 +000668 GETENV_BUF:00000000_00000000 _BUF_LEN:00000000 00000000 +000678 CDLL:00000001_08FEE770 INSPECT_GLOBALS:00000000_00000000 +000688 _JMP_BUFF:00000000_00000000 _BACK_END:00000000_00000000 +000698 _FLAGS:00000000 _TAB:00000000 00000000 +0006A8 INTOFFLIST:00000000_00000000 CGEN_CRENT:00000000_00000000 +0006B8 _CPRMS:00000001_00005598 _CEDCXV:00000000_00000000 +0006C8 _CEDCOV:00000000_00000000 _EPCBLIST:00000000_00000000 +0006D8 CAA_ADDR:00000001_00007B18 USERIDLENGTH:00000000 00000005 +0006F0 TZSHR:00000001 0000B520 00000001 0000B528 +000700 MAXUNGETCOUNT:0004 RWSTATIC:00000001_08300050 +000710 RWLEN:00000000 00000170 CSGDLLI:00000000_00000000 +000720 DLLISIZE:00000000 00000000 IOGET_ANY:00000000_2131EC80 +000730 _BELOW:00000000_2131EC70 IOFREE_ANY:00000000_2131EC60 +000740 _BELOW:00000000_2131EC50 CSGSTINIT:00000000_00000000 +000750 STINITSIZE:00000000 00000000 MTFMAINTASKBLK:00000000_00000000 +000760 SIGTABLE:00000001_0000B668 INIT_STDIN:00000001_0000A2B8 +000770 _STDOUT:00000001_00009BE8 _STDERR:00000001_00009F50 +000788 TABNUM:00000000 00000008 REDIR:00 AVAIL13:00000000_00000000 +0007A0 OPENMVS_FLAGS:00 MRPSTDR:00000000_2131EC10 MWPSTDR:00000000_2131EC00 +0007B8 MRPSTDC:00000000_00000000 MWPSTDC:00000000_00000000 +0007C8 OWRP1:00000000_00000000 OWRP3:00000000_00000000 +0007D8 STATIC_EDCOV:00000000_00000000 GETENV_BUF2:00000000_00000000 +0007E8 _BUF2_LEN:00000000 00000000 DLCB_MUTEX:00000001_08FC7328 +0007F8 _CONDV:00000001_08FC7330 EDCOV:00000000_00000000 +000808 LCX:00000001_0000B520 MUTEX_ATTR:00000001 08FC7250 +000818 STOR_INIT_B:00001000 _INCR_B:00001000 +000820 STOR_INIT:00003000 _INCR:00002000 DEMANGLE:00000000_00000000 +000838 TEMPR15:00000000 00000000 TERMINATE:00000000_2131EC40 +000848 CXX_INV:00000000_00000000 D4_JOIN_MUTEX_ATTR:00000001_08FC7308 +000860 _MUTEX:00000001_08FC7310 _CONDV_ATTR:00000001_08FC7318 +000870 _CONDV:00000001_08FC7320 DLLANCHOR:00000000_00000000 +000880 DLLLAST:00000000_00000000 MEM24P:00000000_00000000 +000890 RTLMUTEX_ARRAYPTR:00000001_08FC7258 MSGCATLIST:00000000_00000000 +0008A0 SRCHP:00000000_00000000 ETOAP:00000000_00000000 +0008B0 ATOEP:00000000_00000000 NDMGMTP:00000000_00000000 +0008C0 POPENP:00000000_00000000 RND48P:00000000_00000000 +0008D0 BRK_HEAPID:00000000_00000000 _START:00000000_00000000 +0008E0 _CURRENT:00000000_00000000 _END:00000000_00000000 +0008F8 RESTARTTABLE:00000000_00000000 SYSLOGP:00000000_00000000 +000908 LOGIN_NAME:......... PREV_UMASK_VAL:00000000 +000918 HFP_LDBL_LMS:00100000 00000000 00000000 00000000 7FFFFFFF FFFFFFFF 71FFFFFF FFFFFFFF 26 +000948 BFP_LDBL_LMS:00010000 00000000 00000000 00000000 7FFEFFFF FFFFFFFF FFFFFFFF FFFFFFFF 3F +0009D8 HFP_DBL_LMS:00100000 00000000 7FFFFFFF FFFFFFFF 34100000 00000000 +0009F0 BFP_DBL_LMS:00100000 00000000 7FEFFFFF FFFFFFFF 3CB00000 00000000 7FF00000 00000000 FF +000A38 HFP_MHDC:412B7E15 1628AED3 41171547 652B82FE 406F2DEC 549B9439 40B17217 F7D1CF7A 41 +000AA8 BFP_MHDC:4005BF0A 8B145769 3FF71547 652B82FE 3FDBCB7B 1526E50E 3FE62E42 FEFA39EF 40 +000B18 HFP_FLT_LMS:00100000 7FFFFFFF 3C100000 +000B24 BFP_FLT_LMS:00800000 7F7FFFFF 34000000 7F800000 FF800000 7FA00000 FFA00000 7FC00000 FF +000B48 HFP_FHDC:00000010 0006000E 001C0006 000F0020 FFC0FFC0 FFC0FFB2 FFB2FFB2 003F003F 00 +000B70 BFP_FHDC:00010002 00180035 00710006 000F0021 FF83FC03 C003FFDB FECDECBD 00800400 40 +000B98 ASCII_CCSID:0333 EBCDIC_CCSID:0417 LOGIN_NAME_A:......... +000BA8 CINFO_A:00000001 0000BD88 LC_C:00000001_0000BC40 +000BB8 _A:00000001_0000BCA0 LCX_A:00000001_0000BE18 +000BC8 CORRESTABLE:00000000_214CFD58 +000BD0 TZSHR_A:00000001 0000BE18 00000001 0000BE20 CGENVEC3:00000000_00000000 +000BE8 CEDBVEC3:00000000_00000000 FORKQ_HEAD:00000000_00000000 +000BF8 FORKQ_TAIL:00000000_00000000 PTHREAD_YIELD1:0001D100 +000C04 PTHREAD_YIELD2:00002E80 ICONV_MODE:. _TECH:......... +000C12 _USERSET:.
[4] CTHD: 00000001_00008F08 +000000 CTHDEYE:CTHD SIZE:00000528 CTHDPTR:00000001_00008F08 +000010 STORPTR:00000000_00000000 TOKPTR:00000000_251DEF20 +000020 ASCTIME_RESULT:.......................... +00003A SNAP_DUMP_FLAG:00 FP_MODE:C4 GMTIME_BKDN:00000001_00009638
Figure 205. Example of formatted C/C++ output from LEDATA VERBEXIT (AMODE 64) (Part 2 of 10)
The following is part three of the example of formatted C/C++ output from LEDATA VERBEXIT (AMODE 64)
398 z/OS: z/OS Language Environment Debugging Guide
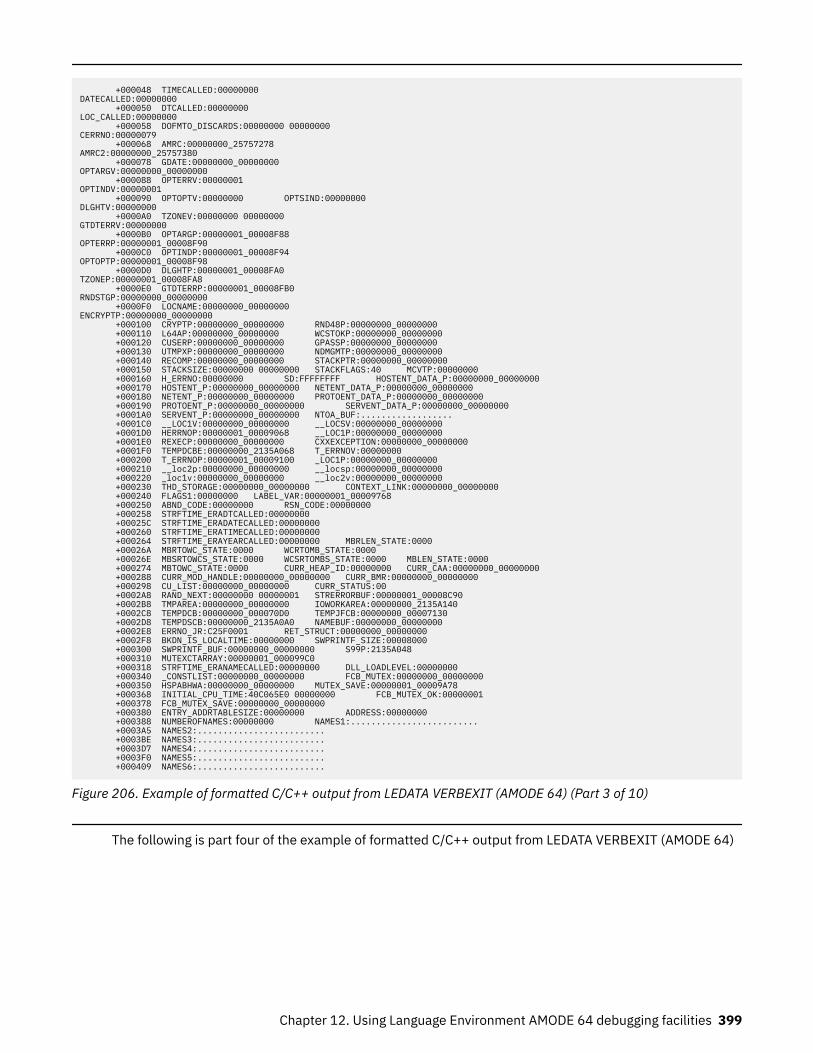
+000048 TIMECALLED:00000000 DATECALLED:00000000 +000050 DTCALLED:00000000 LOC_CALLED:00000000 +000058 DOFMTO_DISCARDS:00000000 00000000 CERRNO:00000079 +000068 AMRC:00000000_25757278 AMRC2:00000000_25757380 +000078 GDATE:00000000_00000000 OPTARGV:00000000_00000000 +000088 OPTERRV:00000001 OPTINDV:00000001 +000090 OPTOPTV:00000000 OPTSIND:00000000 DLGHTV:00000000 +0000A0 TZONEV:00000000 00000000 GTDTERRV:00000000 +0000B0 OPTARGP:00000001_00008F88 OPTERRP:00000001_00008F90 +0000C0 OPTINDP:00000001_00008F94 OPTOPTP:00000001_00008F98 +0000D0 DLGHTP:00000001_00008FA0 TZONEP:00000001_00008FA8 +0000E0 GTDTERRP:00000001_00008FB0 RNDSTGP:00000000_00000000 +0000F0 LOCNAME:00000000_00000000 ENCRYPTP:00000000_00000000 +000100 CRYPTP:00000000_00000000 RND48P:00000000_00000000 +000110 L64AP:00000000_00000000 WCSTOKP:00000000_00000000 +000120 CUSERP:00000000_00000000 GPASSP:00000000_00000000 +000130 UTMPXP:00000000_00000000 NDMGMTP:00000000_00000000 +000140 RECOMP:00000000_00000000 STACKPTR:00000000_00000000 +000150 STACKSIZE:00000000 00000000 STACKFLAGS:40 MCVTP:00000000 +000160 H_ERRNO:00000000 SD:FFFFFFFF HOSTENT_DATA_P:00000000_00000000 +000170 HOSTENT_P:00000000_00000000 NETENT_DATA_P:00000000_00000000 +000180 NETENT_P:00000000_00000000 PROTOENT_DATA_P:00000000_00000000 +000190 PROTOENT_P:00000000_00000000 SERVENT_DATA_P:00000000_00000000 +0001A0 SERVENT_P:00000000_00000000 NTOA_BUF:.................. +0001C0 __LOC1V:00000000_00000000 __LOCSV:00000000_00000000 +0001D0 HERRNOP:00000001_00009068 __LOC1P:00000000_00000000 +0001E0 REXECP:00000000_00000000 CXXEXCEPTION:00000000_00000000 +0001F0 TEMPDCBE:00000000_2135A068 T_ERRNOV:00000000 +000200 T_ERRNOP:00000001_00009100 _LOC1P:00000000_00000000 +000210 __loc2p:00000000_00000000 __locsp:00000000_00000000 +000220 _loc1v:00000000_00000000 __loc2v:00000000_00000000 +000230 THD_STORAGE:00000000_00000000 CONTEXT_LINK:00000000_00000000 +000240 FLAGS1:00000000 LABEL_VAR:00000001_00009768 +000250 ABND_CODE:00000000 RSN_CODE:00000000 +000258 STRFTIME_ERADTCALLED:00000000 +00025C STRFTIME_ERADATECALLED:00000000 +000260 STRFTIME_ERATIMECALLED:00000000 +000264 STRFTIME_ERAYEARCALLED:00000000 MBRLEN_STATE:0000 +00026A MBRTOWC_STATE:0000 WCRTOMB_STATE:0000 +00026E MBSRTOWCS_STATE:0000 WCSRTOMBS_STATE:0000 MBLEN_STATE:0000 +000274 MBTOWC_STATE:0000 CURR_HEAP_ID:00000000 CURR_CAA:00000000_00000000 +000288 CURR_MOD_HANDLE:00000000_00000000 CURR_BMR:00000000_00000000 +000298 CU_LIST:00000000_00000000 CURR_STATUS:00 +0002A8 RAND_NEXT:00000000 00000001 STRERRORBUF:00000001_00008C90 +0002B8 TMPAREA:00000000_00000000 IOWORKAREA:00000000_2135A140 +0002C8 TEMPDCB:00000000_000070D0 TEMPJFCB:00000000_00007130 +0002D8 TEMPDSCB:00000000_2135A0A0 NAMEBUF:00000000_00000000 +0002E8 ERRNO_JR:C25F0001 RET_STRUCT:00000000_00000000 +0002F8 BKDN_IS_LOCALTIME:00000000 SWPRINTF_SIZE:00008000 +000300 SWPRINTF_BUF:00000000_00000000 S99P:2135A048 +000310 MUTEXCTARRAY:00000001_000099C0 +000318 STRFTIME_ERANAMECALLED:00000000 DLL_LOADLEVEL:00000000 +000340 _CONSTLIST:00000000_00000000 FCB_MUTEX:00000000_00000000 +000350 HSPABHWA:00000000_00000000 MUTEX_SAVE:00000001_00009A78 +000368 INITIAL_CPU_TIME:40C065E0 00000000 FCB_MUTEX_OK:00000001 +000378 FCB_MUTEX_SAVE:00000000_00000000 +000380 ENTRY_ADDRTABLESIZE:00000000 ADDRESS:00000000 +000388 NUMBEROFNAMES:00000000 NAMES1:......................... +0003A5 NAMES2:......................... +0003BE NAMES3:......................... +0003D7 NAMES4:......................... +0003F0 NAMES5:......................... +000409 NAMES6:.........................
Figure 206. Example of formatted C/C++ output from LEDATA VERBEXIT (AMODE 64) (Part 3 of 10)
The following is part four of the example of formatted C/C++ output from LEDATA VERBEXIT (AMODE 64)
Chapter 12. Using Language Environment AMODE 64 debugging facilities 399
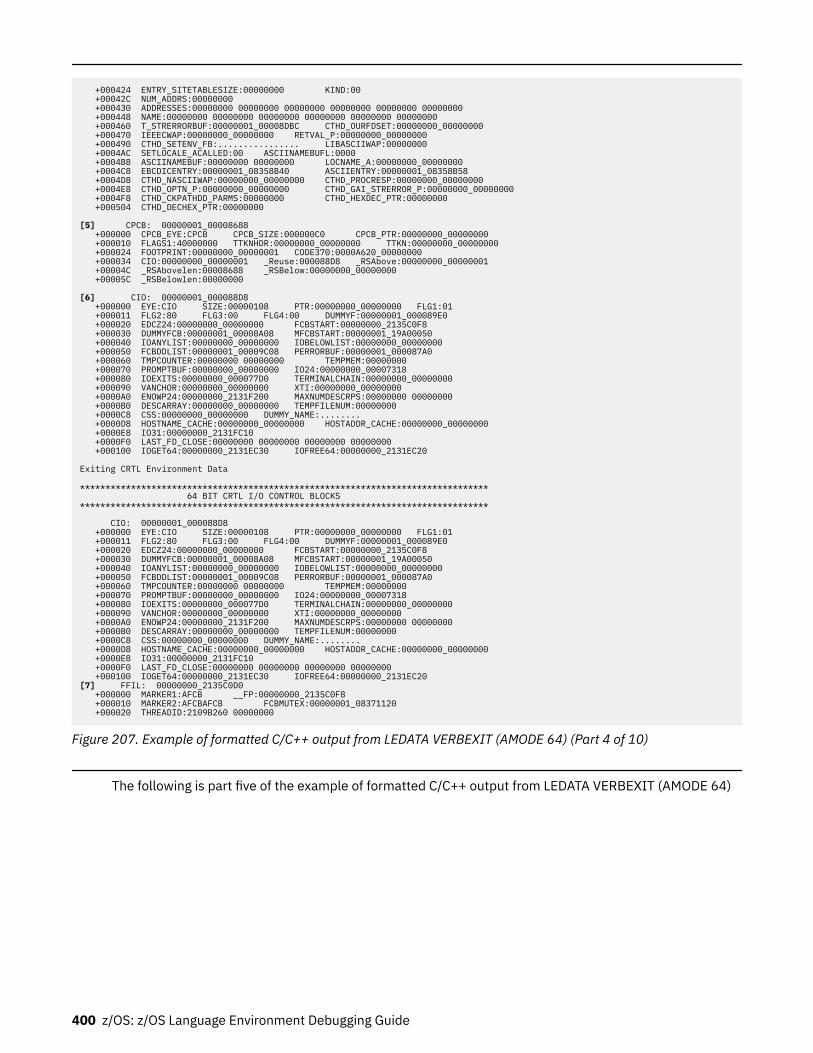
+000424 ENTRY_SITETABLESIZE:00000000 KIND:00 +00042C NUM_ADDRS:00000000 +000430 ADDRESSES:00000000 00000000 00000000 00000000 00000000 00000000 +000448 NAME:00000000 00000000 00000000 00000000 00000000 00000000 +000460 T_STRERRORBUF:00000001_00008DBC CTHD_OURFDSET:00000000_00000000 +000470 IEEECWAP:00000000_00000000 RETVAL_P:00000000_00000000 +000490 CTHD_SETENV_FB:................ LIBASCIIWAP:00000000 +0004AC SETLOCALE_ACALLED:00 ASCIINAMEBUFL:0000 +0004B8 ASCIINAMEBUF:00000000 00000000 LOCNAME_A:00000000_00000000 +0004C8 EBCDICENTRY:00000001_08358B40 ASCIIENTRY:00000001_08358B58 +0004D8 CTHD_NASCIIWAP:00000000_00000000 CTHD_PROCRESP:00000000_00000000 +0004E8 CTHD_OPTN_P:00000000_00000000 CTHD_GAI_STRERROR_P:00000000_00000000 +0004F8 CTHD_CKPATHDD_PARMS:00000000 CTHD_HEXDEC_PTR:00000000 +000504 CTHD_DECHEX_PTR:00000000
[5] CPCB: 00000001_00008688 +000000 CPCB_EYE:CPCB CPCB_SIZE:000000C0 CPCB_PTR:00000000_00000000 +000010 FLAGS1:40000000 TTKNHDR:00000000_00000000 TTKN:00000000_00000000 +000024 FOOTPRINT:00000000_00000001 CODE370:0000A620_00000000 +000034 CIO:00000000_00000001 _Reuse:000088D8 _RSAbove:00000000_00000001 +00004C _RSAbovelen:00008688 _RSBelow:00000000_00000000 +00005C _RSBelowlen:00000000 [6] CIO: 00000001_000088D8 +000000 EYE:CIO SIZE:00000108 PTR:00000000_00000000 FLG1:01 +000011 FLG2:80 FLG3:00 FLG4:00 DUMMYF:00000001_000089E0 +000020 EDCZ24:00000000_00000000 FCBSTART:00000000_2135C0F8 +000030 DUMMYFCB:00000001_00008A08 MFCBSTART:00000001_19A00050 +000040 IOANYLIST:00000000_00000000 IOBELOWLIST:00000000_00000000 +000050 FCBDDLIST:00000001_00009C08 PERRORBUF:00000001_000087A0 +000060 TMPCOUNTER:00000000 00000000 TEMPMEM:00000000 +000070 PROMPTBUF:00000000_00000000 IO24:00000000_00007318 +000080 IOEXITS:00000000_000077D0 TERMINALCHAIN:00000000_00000000 +000090 VANCHOR:00000000_00000000 XTI:00000000_00000000 +0000A0 ENOWP24:00000000_2131F200 MAXNUMDESCRPS:00000000 00000000 +0000B0 DESCARRAY:00000000_00000000 TEMPFILENUM:00000000 +0000C8 CSS:00000000_00000000 DUMMY_NAME:........ +0000D8 HOSTNAME_CACHE:00000000_00000000 HOSTADDR_CACHE:00000000_00000000 +0000E8 IO31:00000000_2131FC10 +0000F0 LAST_FD_CLOSE:00000000 00000000 00000000 00000000 +000100 IOGET64:00000000_2131EC30 IOFREE64:00000000_2131EC20
Exiting CRTL Environment Data
******************************************************************************** 64 BIT CRTL I/O CONTROL BLOCKS********************************************************************************
CIO: 00000001_000088D8 +000000 EYE:CIO SIZE:00000108 PTR:00000000_00000000 FLG1:01 +000011 FLG2:80 FLG3:00 FLG4:00 DUMMYF:00000001_000089E0 +000020 EDCZ24:00000000_00000000 FCBSTART:00000000_2135C0F8 +000030 DUMMYFCB:00000001_00008A08 MFCBSTART:00000001_19A00050 +000040 IOANYLIST:00000000_00000000 IOBELOWLIST:00000000_00000000 +000050 FCBDDLIST:00000001_00009C08 PERRORBUF:00000001_000087A0 +000060 TMPCOUNTER:00000000 00000000 TEMPMEM:00000000 +000070 PROMPTBUF:00000000_00000000 IO24:00000000_00007318 +000080 IOEXITS:00000000_000077D0 TERMINALCHAIN:00000000_00000000 +000090 VANCHOR:00000000_00000000 XTI:00000000_00000000 +0000A0 ENOWP24:00000000_2131F200 MAXNUMDESCRPS:00000000 00000000 +0000B0 DESCARRAY:00000000_00000000 TEMPFILENUM:00000000 +0000C8 CSS:00000000_00000000 DUMMY_NAME:........ +0000D8 HOSTNAME_CACHE:00000000_00000000 HOSTADDR_CACHE:00000000_00000000 +0000E8 IO31:00000000_2131FC10 +0000F0 LAST_FD_CLOSE:00000000 00000000 00000000 00000000 +000100 IOGET64:00000000_2131EC30 IOFREE64:00000000_2131EC20[7] FFIL: 00000000_2135C0D0 +000000 MARKER1:AFCB __FP:00000000_2135C0F8 +000010 MARKER2:AFCBAFCB FCBMUTEX:00000001_08371120 +000020 THREADID:2109B260 00000000
Figure 207. Example of formatted C/C++ output from LEDATA VERBEXIT (AMODE 64) (Part 4 of 10)
The following is part five of the example of formatted C/C++ output from LEDATA VERBEXIT (AMODE 64)
400 z/OS: z/OS Language Environment Debugging Guide
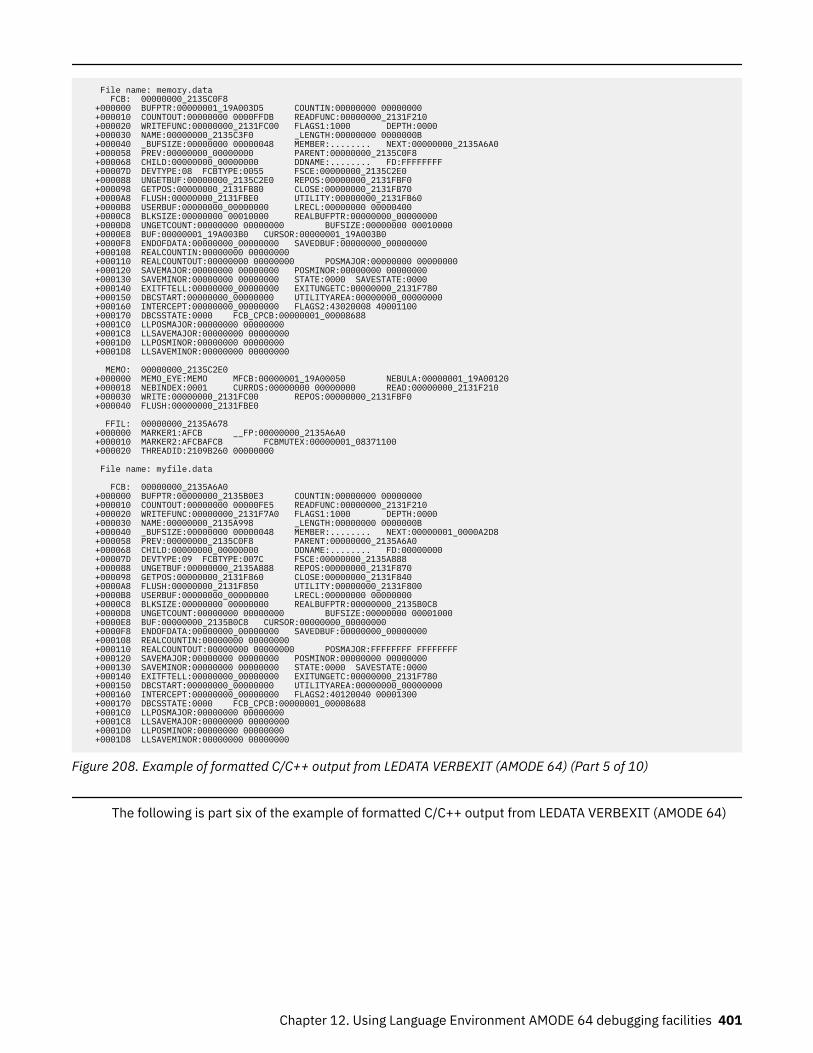
File name: memory.data FCB: 00000000_2135C0F8 +000000 BUFPTR:00000001_19A003D5 COUNTIN:00000000 00000000 +000010 COUNTOUT:00000000 0000FFDB READFUNC:00000000_2131F210 +000020 WRITEFUNC:00000000_2131FC00 FLAGS1:1000 DEPTH:0000 +000030 NAME:00000000_2135C3F0 _LENGTH:00000000 0000000B +000040 _BUFSIZE:00000000 00000048 MEMBER:........ NEXT:00000000_2135A6A0 +000058 PREV:00000000_00000000 PARENT:00000000_2135C0F8 +000068 CHILD:00000000_00000000 DDNAME:........ FD:FFFFFFFF +00007D DEVTYPE:08 FCBTYPE:0055 FSCE:00000000_2135C2E0 +000088 UNGETBUF:00000000_2135C2E0 REPOS:00000000_2131FBF0 +000098 GETPOS:00000000_2131FB80 CLOSE:00000000_2131FB70 +0000A8 FLUSH:00000000_2131FBE0 UTILITY:00000000_2131FB60 +0000B8 USERBUF:00000000_00000000 LRECL:00000000 00000400 +0000C8 BLKSIZE:00000000 00010000 REALBUFPTR:00000000_00000000 +0000D8 UNGETCOUNT:00000000 00000000 BUFSIZE:00000000 00010000 +0000E8 BUF:00000001_19A003B0 CURSOR:00000001_19A003B0 +0000F8 ENDOFDATA:00000000_00000000 SAVEDBUF:00000000_00000000 +000108 REALCOUNTIN:00000000 00000000 +000110 REALCOUNTOUT:00000000 00000000 POSMAJOR:00000000 00000000 +000120 SAVEMAJOR:00000000 00000000 POSMINOR:00000000 00000000 +000130 SAVEMINOR:00000000 00000000 STATE:0000 SAVESTATE:0000 +000140 EXITFTELL:00000000_00000000 EXITUNGETC:00000000_2131F780 +000150 DBCSTART:00000000_00000000 UTILITYAREA:00000000_00000000 +000160 INTERCEPT:00000000_00000000 FLAGS2:43020008 40001100 +000170 DBCSSTATE:0000 FCB_CPCB:00000001_00008688 +0001C0 LLPOSMAJOR:00000000 00000000 +0001C8 LLSAVEMAJOR:00000000 00000000 +0001D0 LLPOSMINOR:00000000 00000000 +0001D8 LLSAVEMINOR:00000000 00000000
MEMO: 00000000_2135C2E0 +000000 MEMO_EYE:MEMO MFCB:00000001_19A00050 NEBULA:00000001_19A00120 +000018 NEBINDEX:0001 CURRDS:00000000 00000000 READ:00000000_2131F210 +000030 WRITE:00000000_2131FC00 REPOS:00000000_2131FBF0 +000040 FLUSH:00000000_2131FBE0
FFIL: 00000000_2135A678 +000000 MARKER1:AFCB __FP:00000000_2135A6A0 +000010 MARKER2:AFCBAFCB FCBMUTEX:00000001_08371100 +000020 THREADID:2109B260 00000000
File name: myfile.data
FCB: 00000000_2135A6A0 +000000 BUFPTR:00000000_2135B0E3 COUNTIN:00000000 00000000 +000010 COUNTOUT:00000000 00000FE5 READFUNC:00000000_2131F210 +000020 WRITEFUNC:00000000_2131F7A0 FLAGS1:1000 DEPTH:0000 +000030 NAME:00000000_2135A998 _LENGTH:00000000 0000000B +000040 _BUFSIZE:00000000 00000048 MEMBER:........ NEXT:00000001_0000A2D8 +000058 PREV:00000000_2135C0F8 PARENT:00000000_2135A6A0 +000068 CHILD:00000000_00000000 DDNAME:........ FD:00000000 +00007D DEVTYPE:09 FCBTYPE:007C FSCE:00000000_2135A888 +000088 UNGETBUF:00000000_2135A888 REPOS:00000000_2131F870 +000098 GETPOS:00000000_2131F860 CLOSE:00000000_2131F840 +0000A8 FLUSH:00000000_2131F850 UTILITY:00000000_2131F800 +0000B8 USERBUF:00000000_00000000 LRECL:00000000 00000000 +0000C8 BLKSIZE:00000000 00000000 REALBUFPTR:00000000_2135B0C8 +0000D8 UNGETCOUNT:00000000 00000000 BUFSIZE:00000000 00001000 +0000E8 BUF:00000000_2135B0C8 CURSOR:00000000_00000000 +0000F8 ENDOFDATA:00000000_00000000 SAVEDBUF:00000000_00000000 +000108 REALCOUNTIN:00000000 00000000 +000110 REALCOUNTOUT:00000000 00000000 POSMAJOR:FFFFFFFF FFFFFFFF +000120 SAVEMAJOR:00000000 00000000 POSMINOR:00000000 00000000 +000130 SAVEMINOR:00000000 00000000 STATE:0000 SAVESTATE:0000 +000140 EXITFTELL:00000000_00000000 EXITUNGETC:00000000_2131F780 +000150 DBCSTART:00000000_00000000 UTILITYAREA:00000000_00000000 +000160 INTERCEPT:00000000_00000000 FLAGS2:40120040 00001300 +000170 DBCSSTATE:0000 FCB_CPCB:00000001_00008688 +0001C0 LLPOSMAJOR:00000000 00000000 +0001C8 LLSAVEMAJOR:00000000 00000000 +0001D0 LLPOSMINOR:00000000 00000000 +0001D8 LLSAVEMINOR:00000000 00000000
Figure 208. Example of formatted C/C++ output from LEDATA VERBEXIT (AMODE 64) (Part 5 of 10)
The following is part six of the example of formatted C/C++ output from LEDATA VERBEXIT (AMODE 64)
Chapter 12. Using Language Environment AMODE 64 debugging facilities 401
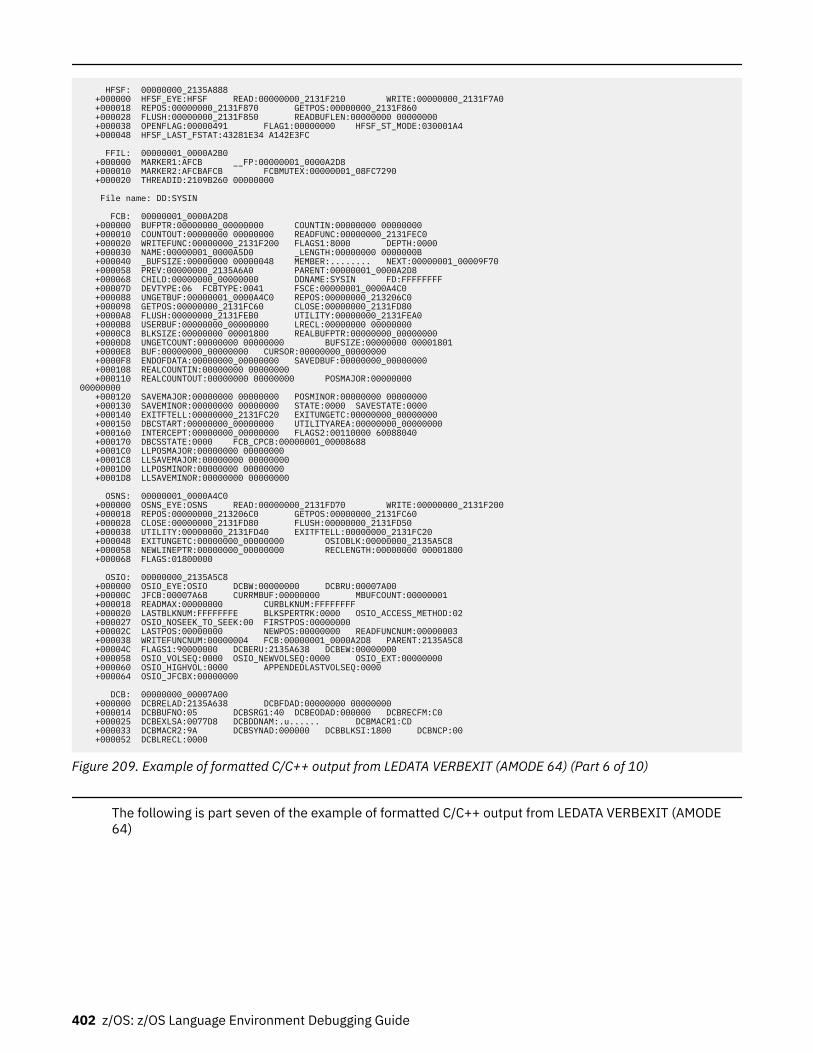
HFSF: 00000000_2135A888 +000000 HFSF_EYE:HFSF READ:00000000_2131F210 WRITE:00000000_2131F7A0 +000018 REPOS:00000000_2131F870 GETPOS:00000000_2131F860 +000028 FLUSH:00000000_2131F850 READBUFLEN:00000000 00000000 +000038 OPENFLAG:00000491 FLAG1:00000000 HFSF_ST_MODE:030001A4 +000048 HFSF_LAST_FSTAT:43281E34 A142E3FC
FFIL: 00000001_0000A2B0 +000000 MARKER1:AFCB __FP:00000001_0000A2D8 +000010 MARKER2:AFCBAFCB FCBMUTEX:00000001_08FC7290 +000020 THREADID:2109B260 00000000
File name: DD:SYSIN
FCB: 00000001_0000A2D8 +000000 BUFPTR:00000000_00000000 COUNTIN:00000000 00000000 +000010 COUNTOUT:00000000 00000000 READFUNC:00000000_2131FEC0 +000020 WRITEFUNC:00000000_2131F200 FLAGS1:8000 DEPTH:0000 +000030 NAME:00000001_0000A5D0 _LENGTH:00000000 0000000B +000040 _BUFSIZE:00000000 00000048 MEMBER:........ NEXT:00000001_00009F70 +000058 PREV:00000000_2135A6A0 PARENT:00000001_0000A2D8 +000068 CHILD:00000000_00000000 DDNAME:SYSIN FD:FFFFFFFF +00007D DEVTYPE:06 FCBTYPE:0041 FSCE:00000001_0000A4C0 +000088 UNGETBUF:00000001_0000A4C0 REPOS:00000000_213206C0 +000098 GETPOS:00000000_2131FC60 CLOSE:00000000_2131FD80 +0000A8 FLUSH:00000000_2131FEB0 UTILITY:00000000_2131FEA0 +0000B8 USERBUF:00000000_00000000 LRECL:00000000 00000000 +0000C8 BLKSIZE:00000000 00001800 REALBUFPTR:00000000_00000000 +0000D8 UNGETCOUNT:00000000 00000000 BUFSIZE:00000000 00001801 +0000E8 BUF:00000000_00000000 CURSOR:00000000_00000000 +0000F8 ENDOFDATA:00000000_00000000 SAVEDBUF:00000000_00000000 +000108 REALCOUNTIN:00000000 00000000 +000110 REALCOUNTOUT:00000000 00000000 POSMAJOR:00000000 00000000 +000120 SAVEMAJOR:00000000 00000000 POSMINOR:00000000 00000000 +000130 SAVEMINOR:00000000 00000000 STATE:0000 SAVESTATE:0000 +000140 EXITFTELL:00000000_2131FC20 EXITUNGETC:00000000_00000000 +000150 DBCSTART:00000000_00000000 UTILITYAREA:00000000_00000000 +000160 INTERCEPT:00000000_00000000 FLAGS2:00110000 60088040 +000170 DBCSSTATE:0000 FCB_CPCB:00000001_00008688 +0001C0 LLPOSMAJOR:00000000 00000000 +0001C8 LLSAVEMAJOR:00000000 00000000 +0001D0 LLPOSMINOR:00000000 00000000 +0001D8 LLSAVEMINOR:00000000 00000000
OSNS: 00000001_0000A4C0 +000000 OSNS_EYE:OSNS READ:00000000_2131FD70 WRITE:00000000_2131F200 +000018 REPOS:00000000_213206C0 GETPOS:00000000_2131FC60 +000028 CLOSE:00000000_2131FD80 FLUSH:00000000_2131FD50 +000038 UTILITY:00000000_2131FD40 EXITFTELL:00000000_2131FC20 +000048 EXITUNGETC:00000000_00000000 OSIOBLK:00000000_2135A5C8 +000058 NEWLINEPTR:00000000_00000000 RECLENGTH:00000000 00001800 +000068 FLAGS:01800000
OSIO: 00000000_2135A5C8 +000000 OSIO_EYE:OSIO DCBW:00000000 DCBRU:00007A00 +00000C JFCB:00007A68 CURRMBUF:00000000 MBUFCOUNT:00000001 +000018 READMAX:00000000 CURBLKNUM:FFFFFFFF +000020 LASTBLKNUM:FFFFFFFE BLKSPERTRK:0000 OSIO_ACCESS_METHOD:02 +000027 OSIO_NOSEEK_TO_SEEK:00 FIRSTPOS:00000000 +00002C LASTPOS:00000000 NEWPOS:00000000 READFUNCNUM:00000003 +000038 WRITEFUNCNUM:00000004 FCB:00000001_0000A2D8 PARENT:2135A5C8 +00004C FLAGS1:90000000 DCBERU:2135A638 DCBEW:00000000 +000058 OSIO_VOLSEQ:0000 OSIO_NEWVOLSEQ:0000 OSIO_EXT:00000000 +000060 OSIO_HIGHVOL:0000 APPENDEDLASTVOLSEQ:0000 +000064 OSIO_JFCBX:00000000
DCB: 00000000_00007A00 +000000 DCBRELAD:2135A638 DCBFDAD:00000000 00000000 +000014 DCBBUFNO:05 DCBSRG1:40 DCBEODAD:000000 DCBRECFM:C0 +000025 DCBEXLSA:0077D8 DCBDDNAM:.u...... DCBMACR1:CD +000033 DCBMACR2:9A DCBSYNAD:000000 DCBBLKSI:1800 DCBNCP:00 +000052 DCBLRECL:0000
Figure 209. Example of formatted C/C++ output from LEDATA VERBEXIT (AMODE 64) (Part 6 of 10)
The following is part seven of the example of formatted C/C++ output from LEDATA VERBEXIT (AMODE64)
402 z/OS: z/OS Language Environment Debugging Guide
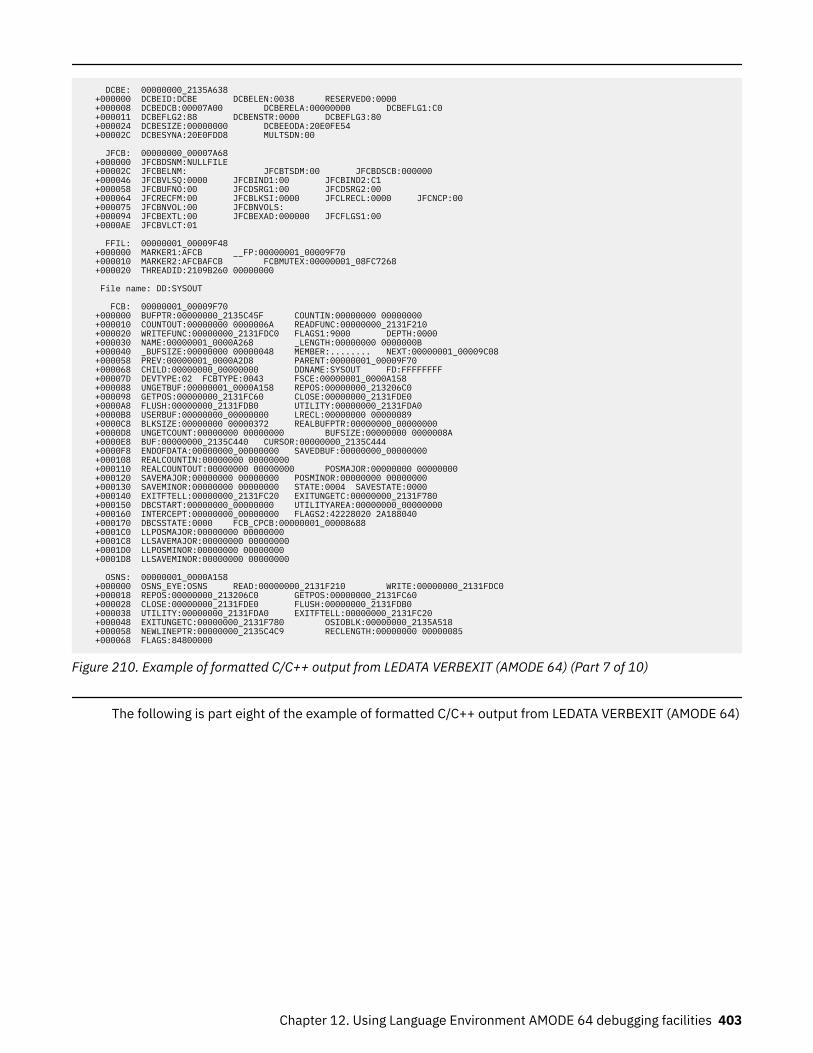
DCBE: 00000000_2135A638 +000000 DCBEID:DCBE DCBELEN:0038 RESERVED0:0000 +000008 DCBEDCB:00007A00 DCBERELA:00000000 DCBEFLG1:C0 +000011 DCBEFLG2:88 DCBENSTR:0000 DCBEFLG3:80 +000024 DCBESIZE:00000000 DCBEEODA:20E0FE54 +00002C DCBESYNA:20E0FDD8 MULTSDN:00
JFCB: 00000000_00007A68 +000000 JFCBDSNM:NULLFILE +00002C JFCBELNM: JFCBTSDM:00 JFCBDSCB:000000 +000046 JFCBVLSQ:0000 JFCBIND1:00 JFCBIND2:C1 +000058 JFCBUFNO:00 JFCDSRG1:00 JFCDSRG2:00 +000064 JFCRECFM:00 JFCBLKSI:0000 JFCLRECL:0000 JFCNCP:00 +000075 JFCBNVOL:00 JFCBNVOLS: +000094 JFCBEXTL:00 JFCBEXAD:000000 JFCFLGS1:00 +0000AE JFCBVLCT:01
FFIL: 00000001_00009F48 +000000 MARKER1:AFCB __FP:00000001_00009F70 +000010 MARKER2:AFCBAFCB FCBMUTEX:00000001_08FC7268 +000020 THREADID:2109B260 00000000
File name: DD:SYSOUT
FCB: 00000001_00009F70 +000000 BUFPTR:00000000_2135C45F COUNTIN:00000000 00000000 +000010 COUNTOUT:00000000 0000006A READFUNC:00000000_2131F210 +000020 WRITEFUNC:00000000_2131FDC0 FLAGS1:9000 DEPTH:0000 +000030 NAME:00000001_0000A268 _LENGTH:00000000 0000000B +000040 _BUFSIZE:00000000 00000048 MEMBER:........ NEXT:00000001_00009C08 +000058 PREV:00000001_0000A2D8 PARENT:00000001_00009F70 +000068 CHILD:00000000_00000000 DDNAME:SYSOUT FD:FFFFFFFF +00007D DEVTYPE:02 FCBTYPE:0043 FSCE:00000001_0000A158 +000088 UNGETBUF:00000001_0000A158 REPOS:00000000_213206C0 +000098 GETPOS:00000000_2131FC60 CLOSE:00000000_2131FDE0 +0000A8 FLUSH:00000000_2131FDB0 UTILITY:00000000_2131FDA0 +0000B8 USERBUF:00000000_00000000 LRECL:00000000 00000089 +0000C8 BLKSIZE:00000000 00000372 REALBUFPTR:00000000_00000000 +0000D8 UNGETCOUNT:00000000 00000000 BUFSIZE:00000000 0000008A +0000E8 BUF:00000000_2135C440 CURSOR:00000000_2135C444 +0000F8 ENDOFDATA:00000000_00000000 SAVEDBUF:00000000_00000000 +000108 REALCOUNTIN:00000000 00000000 +000110 REALCOUNTOUT:00000000 00000000 POSMAJOR:00000000 00000000 +000120 SAVEMAJOR:00000000 00000000 POSMINOR:00000000 00000000 +000130 SAVEMINOR:00000000 00000000 STATE:0004 SAVESTATE:0000 +000140 EXITFTELL:00000000_2131FC20 EXITUNGETC:00000000_2131F780 +000150 DBCSTART:00000000_00000000 UTILITYAREA:00000000_00000000 +000160 INTERCEPT:00000000_00000000 FLAGS2:42228020 2A188040 +000170 DBCSSTATE:0000 FCB_CPCB:00000001_00008688 +0001C0 LLPOSMAJOR:00000000 00000000 +0001C8 LLSAVEMAJOR:00000000 00000000 +0001D0 LLPOSMINOR:00000000 00000000 +0001D8 LLSAVEMINOR:00000000 00000000
OSNS: 00000001_0000A158 +000000 OSNS_EYE:OSNS READ:00000000_2131F210 WRITE:00000000_2131FDC0 +000018 REPOS:00000000_213206C0 GETPOS:00000000_2131FC60 +000028 CLOSE:00000000_2131FDE0 FLUSH:00000000_2131FDB0 +000038 UTILITY:00000000_2131FDA0 EXITFTELL:00000000_2131FC20 +000048 EXITUNGETC:00000000_2131F780 OSIOBLK:00000000_2135A518 +000058 NEWLINEPTR:00000000_2135C4C9 RECLENGTH:00000000 00000085 +000068 FLAGS:84800000
Figure 210. Example of formatted C/C++ output from LEDATA VERBEXIT (AMODE 64) (Part 7 of 10)
The following is part eight of the example of formatted C/C++ output from LEDATA VERBEXIT (AMODE 64)
Chapter 12. Using Language Environment AMODE 64 debugging facilities 403
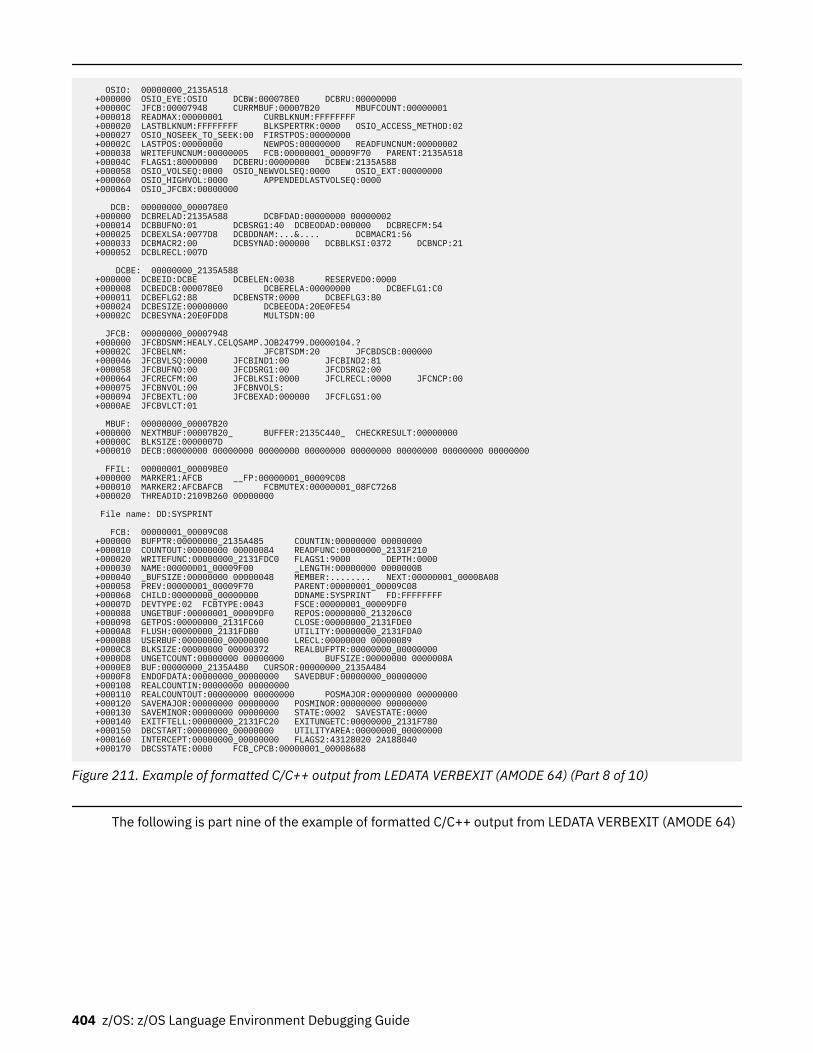
OSIO: 00000000_2135A518 +000000 OSIO_EYE:OSIO DCBW:000078E0 DCBRU:00000000 +00000C JFCB:00007948 CURRMBUF:00007B20 MBUFCOUNT:00000001 +000018 READMAX:00000001 CURBLKNUM:FFFFFFFF +000020 LASTBLKNUM:FFFFFFFF BLKSPERTRK:0000 OSIO_ACCESS_METHOD:02 +000027 OSIO_NOSEEK_TO_SEEK:00 FIRSTPOS:00000000 +00002C LASTPOS:00000000 NEWPOS:00000000 READFUNCNUM:00000002 +000038 WRITEFUNCNUM:00000005 FCB:00000001_00009F70 PARENT:2135A518 +00004C FLAGS1:80000000 DCBERU:00000000 DCBEW:2135A588 +000058 OSIO_VOLSEQ:0000 OSIO_NEWVOLSEQ:0000 OSIO_EXT:00000000 +000060 OSIO_HIGHVOL:0000 APPENDEDLASTVOLSEQ:0000 +000064 OSIO_JFCBX:00000000
DCB: 00000000_000078E0 +000000 DCBRELAD:2135A588 DCBFDAD:00000000 00000002 +000014 DCBBUFNO:01 DCBSRG1:40 DCBEODAD:000000 DCBRECFM:54 +000025 DCBEXLSA:0077D8 DCBDDNAM:...&.... DCBMACR1:56 +000033 DCBMACR2:00 DCBSYNAD:000000 DCBBLKSI:0372 DCBNCP:21 +000052 DCBLRECL:007D
DCBE: 00000000_2135A588 +000000 DCBEID:DCBE DCBELEN:0038 RESERVED0:0000 +000008 DCBEDCB:000078E0 DCBERELA:00000000 DCBEFLG1:C0 +000011 DCBEFLG2:88 DCBENSTR:0000 DCBEFLG3:80 +000024 DCBESIZE:00000000 DCBEEODA:20E0FE54 +00002C DCBESYNA:20E0FDD8 MULTSDN:00
JFCB: 00000000_00007948 +000000 JFCBDSNM:HEALY.CELQSAMP.JOB24799.D0000104.? +00002C JFCBELNM: JFCBTSDM:20 JFCBDSCB:000000 +000046 JFCBVLSQ:0000 JFCBIND1:00 JFCBIND2:81 +000058 JFCBUFNO:00 JFCDSRG1:00 JFCDSRG2:00 +000064 JFCRECFM:00 JFCBLKSI:0000 JFCLRECL:0000 JFCNCP:00 +000075 JFCBNVOL:00 JFCBNVOLS: +000094 JFCBEXTL:00 JFCBEXAD:000000 JFCFLGS1:00 +0000AE JFCBVLCT:01
MBUF: 00000000_00007B20 +000000 NEXTMBUF:00007B20_ BUFFER:2135C440_ CHECKRESULT:00000000 +00000C BLKSIZE:0000007D +000010 DECB:00000000 00000000 00000000 00000000 00000000 00000000 00000000 00000000
FFIL: 00000001_00009BE0 +000000 MARKER1:AFCB __FP:00000001_00009C08 +000010 MARKER2:AFCBAFCB FCBMUTEX:00000001_08FC7268 +000020 THREADID:2109B260 00000000
File name: DD:SYSPRINT
FCB: 00000001_00009C08 +000000 BUFPTR:00000000_2135A485 COUNTIN:00000000 00000000 +000010 COUNTOUT:00000000 00000084 READFUNC:00000000_2131F210 +000020 WRITEFUNC:00000000_2131FDC0 FLAGS1:9000 DEPTH:0000 +000030 NAME:00000001_00009F00 _LENGTH:00000000 0000000B +000040 _BUFSIZE:00000000 00000048 MEMBER:........ NEXT:00000001_00008A08 +000058 PREV:00000001_00009F70 PARENT:00000001_00009C08 +000068 CHILD:00000000_00000000 DDNAME:SYSPRINT FD:FFFFFFFF +00007D DEVTYPE:02 FCBTYPE:0043 FSCE:00000001_00009DF0 +000088 UNGETBUF:00000001_00009DF0 REPOS:00000000_213206C0 +000098 GETPOS:00000000_2131FC60 CLOSE:00000000_2131FDE0 +0000A8 FLUSH:00000000_2131FDB0 UTILITY:00000000_2131FDA0 +0000B8 USERBUF:00000000_00000000 LRECL:00000000 00000089 +0000C8 BLKSIZE:00000000 00000372 REALBUFPTR:00000000_00000000 +0000D8 UNGETCOUNT:00000000 00000000 BUFSIZE:00000000 0000008A +0000E8 BUF:00000000_2135A480 CURSOR:00000000_2135A484 +0000F8 ENDOFDATA:00000000_00000000 SAVEDBUF:00000000_00000000 +000108 REALCOUNTIN:00000000 00000000 +000110 REALCOUNTOUT:00000000 00000000 POSMAJOR:00000000 00000000 +000120 SAVEMAJOR:00000000 00000000 POSMINOR:00000000 00000000 +000130 SAVEMINOR:00000000 00000000 STATE:0002 SAVESTATE:0000 +000140 EXITFTELL:00000000_2131FC20 EXITUNGETC:00000000_2131F780 +000150 DBCSTART:00000000_00000000 UTILITYAREA:00000000_00000000 +000160 INTERCEPT:00000000_00000000 FLAGS2:43128020 2A188040 +000170 DBCSSTATE:0000 FCB_CPCB:00000001_00008688
Figure 211. Example of formatted C/C++ output from LEDATA VERBEXIT (AMODE 64) (Part 8 of 10)
The following is part nine of the example of formatted C/C++ output from LEDATA VERBEXIT (AMODE 64)
404 z/OS: z/OS Language Environment Debugging Guide
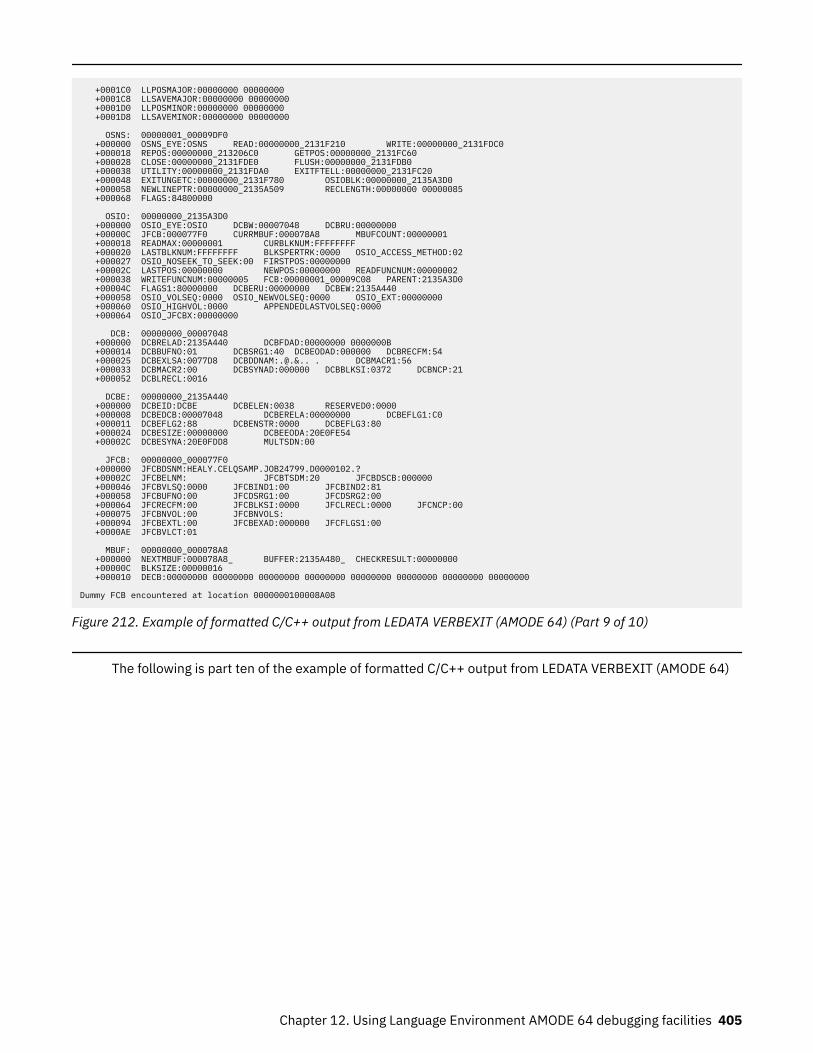
+0001C0 LLPOSMAJOR:00000000 00000000 +0001C8 LLSAVEMAJOR:00000000 00000000 +0001D0 LLPOSMINOR:00000000 00000000 +0001D8 LLSAVEMINOR:00000000 00000000
OSNS: 00000001_00009DF0 +000000 OSNS_EYE:OSNS READ:00000000_2131F210 WRITE:00000000_2131FDC0 +000018 REPOS:00000000_213206C0 GETPOS:00000000_2131FC60 +000028 CLOSE:00000000_2131FDE0 FLUSH:00000000_2131FDB0 +000038 UTILITY:00000000_2131FDA0 EXITFTELL:00000000_2131FC20 +000048 EXITUNGETC:00000000_2131F780 OSIOBLK:00000000_2135A3D0 +000058 NEWLINEPTR:00000000_2135A509 RECLENGTH:00000000 00000085 +000068 FLAGS:84800000
OSIO: 00000000_2135A3D0 +000000 OSIO_EYE:OSIO DCBW:00007048 DCBRU:00000000 +00000C JFCB:000077F0 CURRMBUF:000078A8 MBUFCOUNT:00000001 +000018 READMAX:00000001 CURBLKNUM:FFFFFFFF +000020 LASTBLKNUM:FFFFFFFF BLKSPERTRK:0000 OSIO_ACCESS_METHOD:02 +000027 OSIO_NOSEEK_TO_SEEK:00 FIRSTPOS:00000000 +00002C LASTPOS:00000000 NEWPOS:00000000 READFUNCNUM:00000002 +000038 WRITEFUNCNUM:00000005 FCB:00000001_00009C08 PARENT:2135A3D0 +00004C FLAGS1:80000000 DCBERU:00000000 DCBEW:2135A440 +000058 OSIO_VOLSEQ:0000 OSIO_NEWVOLSEQ:0000 OSIO_EXT:00000000 +000060 OSIO_HIGHVOL:0000 APPENDEDLASTVOLSEQ:0000 +000064 OSIO_JFCBX:00000000
DCB: 00000000_00007048 +000000 DCBRELAD:2135A440 DCBFDAD:00000000 0000000B +000014 DCBBUFNO:01 DCBSRG1:40 DCBEODAD:000000 DCBRECFM:54 +000025 DCBEXLSA:0077D8 DCBDDNAM:.@.&.. . DCBMACR1:56 +000033 DCBMACR2:00 DCBSYNAD:000000 DCBBLKSI:0372 DCBNCP:21 +000052 DCBLRECL:0016
DCBE: 00000000_2135A440 +000000 DCBEID:DCBE DCBELEN:0038 RESERVED0:0000 +000008 DCBEDCB:00007048 DCBERELA:00000000 DCBEFLG1:C0 +000011 DCBEFLG2:88 DCBENSTR:0000 DCBEFLG3:80 +000024 DCBESIZE:00000000 DCBEEODA:20E0FE54 +00002C DCBESYNA:20E0FDD8 MULTSDN:00
JFCB: 00000000_000077F0 +000000 JFCBDSNM:HEALY.CELQSAMP.JOB24799.D0000102.? +00002C JFCBELNM: JFCBTSDM:20 JFCBDSCB:000000 +000046 JFCBVLSQ:0000 JFCBIND1:00 JFCBIND2:81 +000058 JFCBUFNO:00 JFCDSRG1:00 JFCDSRG2:00 +000064 JFCRECFM:00 JFCBLKSI:0000 JFCLRECL:0000 JFCNCP:00 +000075 JFCBNVOL:00 JFCBNVOLS: +000094 JFCBEXTL:00 JFCBEXAD:000000 JFCFLGS1:00 +0000AE JFCBVLCT:01
MBUF: 00000000_000078A8 +000000 NEXTMBUF:000078A8_ BUFFER:2135A480_ CHECKRESULT:00000000 +00000C BLKSIZE:00000016 +000010 DECB:00000000 00000000 00000000 00000000 00000000 00000000 00000000 00000000
Dummy FCB encountered at location 0000000100008A08
Figure 212. Example of formatted C/C++ output from LEDATA VERBEXIT (AMODE 64) (Part 9 of 10)
The following is part ten of the example of formatted C/C++ output from LEDATA VERBEXIT (AMODE 64)
Chapter 12. Using Language Environment AMODE 64 debugging facilities 405
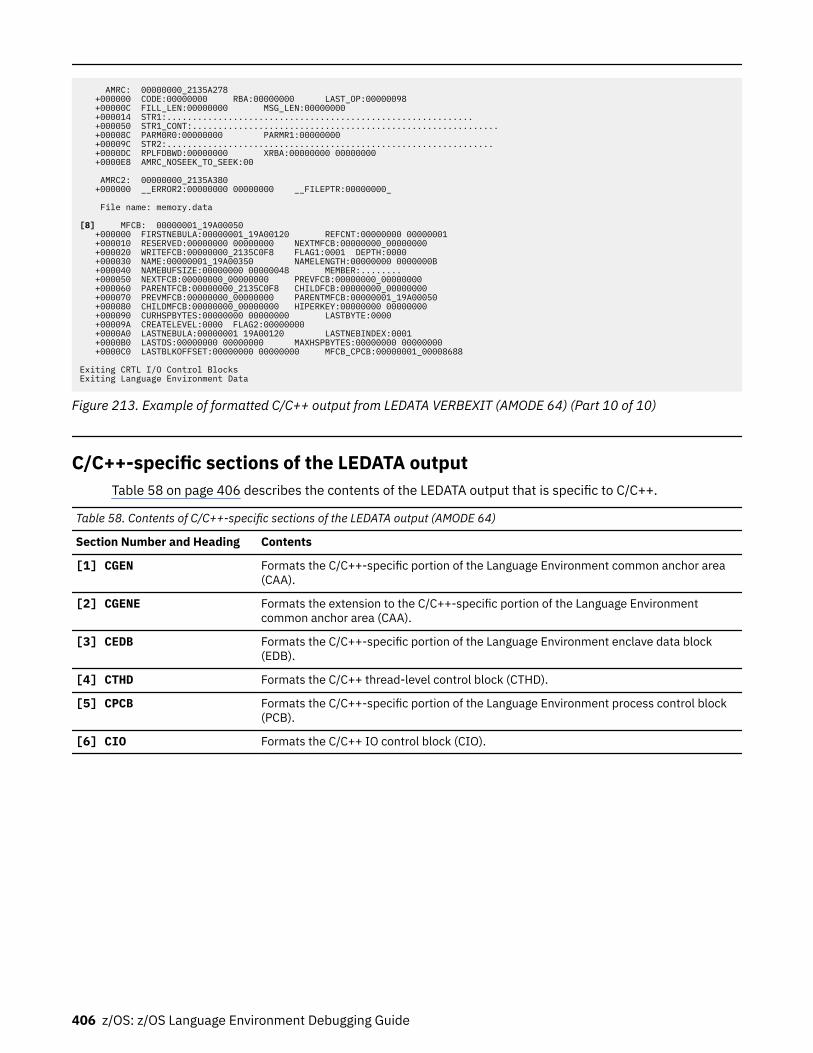
AMRC: 00000000_2135A278 +000000 CODE:00000000 RBA:00000000 LAST_OP:00000098 +00000C FILL_LEN:00000000 MSG_LEN:00000000 +000014 STR1:............................................................ +000050 STR1_CONT:............................................................ +00008C PARM0R0:00000000 PARMR1:00000000 +00009C STR2:................................................................ +0000DC RPLFDBWD:00000000 XRBA:00000000 00000000 +0000E8 AMRC_NOSEEK_TO_SEEK:00
AMRC2: 00000000_2135A380 +000000 __ERROR2:00000000 00000000 __FILEPTR:00000000_
File name: memory.data
[8] MFCB: 00000001_19A00050 +000000 FIRSTNEBULA:00000001_19A00120 REFCNT:00000000 00000001 +000010 RESERVED:00000000 00000000 NEXTMFCB:00000000_00000000 +000020 WRITEFCB:00000000_2135C0F8 FLAG1:0001 DEPTH:0000 +000030 NAME:00000001_19A00350 NAMELENGTH:00000000 0000000B +000040 NAMEBUFSIZE:00000000 00000048 MEMBER:........ +000050 NEXTFCB:00000000_00000000 PREVFCB:00000000_00000000 +000060 PARENTFCB:00000000_2135C0F8 CHILDFCB:00000000_00000000 +000070 PREVMFCB:00000000_00000000 PARENTMFCB:00000001_19A00050 +000080 CHILDMFCB:00000000_00000000 HIPERKEY:00000000 00000000 +000090 CURHSPBYTES:00000000 00000000 LASTBYTE:0000 +00009A CREATELEVEL:0000 FLAG2:00000000 +0000A0 LASTNEBULA:00000001 19A00120 LASTNEBINDEX:0001 +0000B0 LASTDS:00000000 00000000 MAXHSPBYTES:00000000 00000000 +0000C0 LASTBLKOFFSET:00000000 00000000 MFCB_CPCB:00000001_00008688
Exiting CRTL I/O Control BlocksExiting Language Environment Data
Figure 213. Example of formatted C/C++ output from LEDATA VERBEXIT (AMODE 64) (Part 10 of 10)
C/C++-specific sections of the LEDATA outputTable 58 on page 406 describes the contents of the LEDATA output that is specific to C/C++.
Table 58. Contents of C/C++-specific sections of the LEDATA output (AMODE 64)
Section Number and Heading Contents
[1] CGEN Formats the C/C++-specific portion of the Language Environment common anchor area(CAA).
[2] CGENE Formats the extension to the C/C++-specific portion of the Language Environmentcommon anchor area (CAA).
[3] CEDB Formats the C/C++-specific portion of the Language Environment enclave data block(EDB).
[4] CTHD Formats the C/C++ thread-level control block (CTHD).
[5] CPCB Formats the C/C++-specific portion of the Language Environment process control block(PCB).
[6] CIO Formats the C/C++ IO control block (CIO).
406 z/OS: z/OS Language Environment Debugging Guide
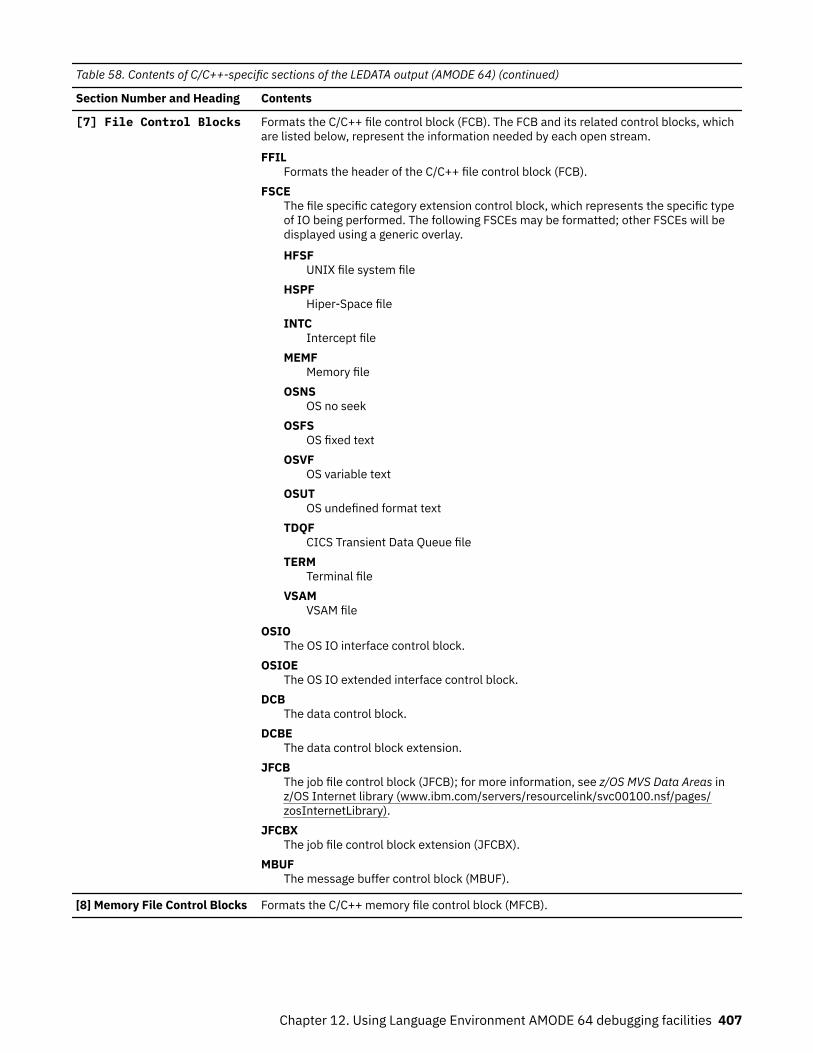
Table 58. Contents of C/C++-specific sections of the LEDATA output (AMODE 64) (continued)
Section Number and Heading Contents
[7] File Control Blocks Formats the C/C++ file control block (FCB). The FCB and its related control blocks, whichare listed below, represent the information needed by each open stream.
FFILFormats the header of the C/C++ file control block (FCB).
FSCEThe file specific category extension control block, which represents the specific typeof IO being performed. The following FSCEs may be formatted; other FSCEs will bedisplayed using a generic overlay.
HFSFUNIX file system file
HSPFHiper-Space file
INTCIntercept file
MEMFMemory file
OSNSOS no seek
OSFSOS fixed text
OSVFOS variable text
OSUTOS undefined format text
TDQFCICS Transient Data Queue file
TERMTerminal file
VSAMVSAM file
OSIOThe OS IO interface control block.
OSIOEThe OS IO extended interface control block.
DCBThe data control block.
DCBEThe data control block extension.
JFCBThe job file control block (JFCB); for more information, see z/OS MVS Data Areas inz/OS Internet library (www.ibm.com/servers/resourcelink/svc00100.nsf/pages/zosInternetLibrary).
JFCBXThe job file control block extension (JFCBX).
MBUFThe message buffer control block (MBUF).
[8] Memory File Control Blocks Formats the C/C++ memory file control block (MFCB).
Chapter 12. Using Language Environment AMODE 64 debugging facilities 407
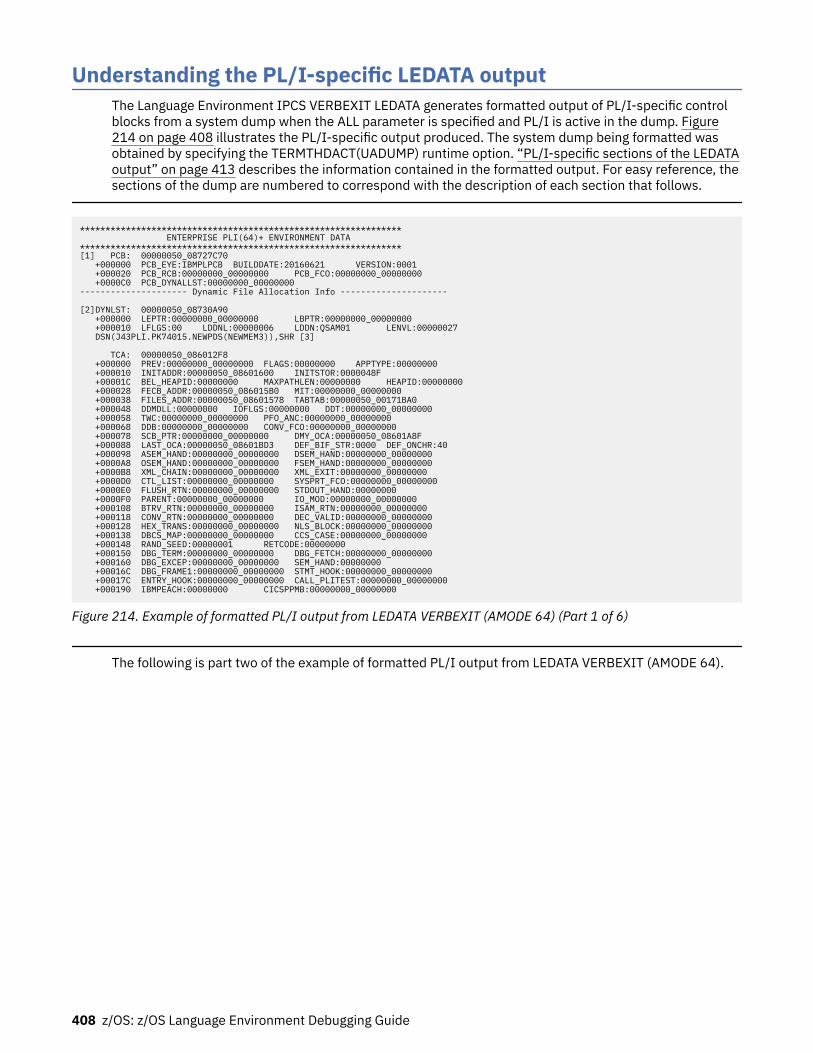
Understanding the PL/I-specific LEDATA outputThe Language Environment IPCS VERBEXIT LEDATA generates formatted output of PL/I-specific controlblocks from a system dump when the ALL parameter is specified and PL/I is active in the dump. Figure214 on page 408 illustrates the PL/I-specific output produced. The system dump being formatted wasobtained by specifying the TERMTHDACT(UADUMP) runtime option. “PL/I-specific sections of the LEDATAoutput” on page 413 describes the information contained in the formatted output. For easy reference, thesections of the dump are numbered to correspond with the description of each section that follows.
*************************************************************** ENTERPRISE PLI(64)+ ENVIRONMENT DATA***************************************************************[1] PCB: 00000050_08727C70 +000000 PCB_EYE:IBMPLPCB BUILDDATE:20160621 VERSION:0001 +000020 PCB_RCB:00000000_00000000 PCB_FCO:00000000_00000000 +0000C0 PCB_DYNALLST:00000000_00000000--------------------- Dynamic File Allocation Info ---------------------
[2]DYNLST: 00000050_08730A90 +000000 LEPTR:00000000_00000000 LBPTR:00000000_00000000 +000010 LFLGS:00 LDDNL:00000006 LDDN:QSAM01 LENVL:00000027 DSN(J43PLI.PK74015.NEWPDS(NEWMEM3)),SHR [3]
TCA: 00000050_086012F8 +000000 PREV:00000000_00000000 FLAGS:00000000 APPTYPE:00000000 +000010 INITADDR:00000050_08601600 INITSTOR:0000048F +00001C BEL_HEAPID:00000000 MAXPATHLEN:00000000 HEAPID:00000000 +000028 FECB_ADDR:00000050_086015B0 MIT:00000000_00000000 +000038 FILES_ADDR:00000050_08601578 TABTAB:00000050_00171BA0 +000048 DDMDLL:00000000 IOFLGS:00000000 DDT:00000000_00000000 +000058 TWC:00000000_00000000 PFO_ANC:00000000_00000000 +000068 DDB:00000000_00000000 CONV_FCO:00000000_00000000 +000078 SCB_PTR:00000000_00000000 DMY_OCA:00000050_08601A8F +000088 LAST_OCA:00000050_08601BD3 DEF_BIF_STR:0000 DEF_ONCHR:40 +000098 ASEM_HAND:00000000_00000000 DSEM_HAND:00000000_00000000 +0000A8 OSEM_HAND:00000000_00000000 FSEM_HAND:00000000_00000000 +0000B8 XML_CHAIN:00000000_00000000 XML_EXIT:00000000_00000000 +0000D0 CTL_LIST:00000000_00000000 SYSPRT_FCO:00000000_00000000 +0000E0 FLUSH_RTN:00000000_00000000 STDOUT_HAND:00000000 +0000F0 PARENT:00000000_00000000 IO_MOD:00000000_00000000 +000108 BTRV_RTN:00000000_00000000 ISAM_RTN:00000000_00000000 +000118 CONV_RTN:00000000_00000000 DEC_VALID:00000000_00000000 +000128 HEX_TRANS:00000000_00000000 NLS_BLOCK:00000000_00000000 +000138 DBCS_MAP:00000000_00000000 CCS_CASE:00000000_00000000 +000148 RAND_SEED:00000001 RETCODE:00000000 +000150 DBG_TERM:00000000_00000000 DBG_FETCH:00000000_00000000 +000160 DBG_EXCEP:00000000_00000000 SEM_HAND:00000000 +00016C DBG_FRAME1:00000000_00000000 STMT_HOOK:00000000_00000000 +00017C ENTRY_HOOK:00000000_00000000 CALL_PLITEST:00000000_00000000 +000190 IBMPEACH:00000000 CICSPPMB:00000000_00000000
Figure 214. Example of formatted PL/I output from LEDATA VERBEXIT (AMODE 64) (Part 1 of 6)
The following is part two of the example of formatted PL/I output from LEDATA VERBEXIT (AMODE 64).
408 z/OS: z/OS Language Environment Debugging Guide
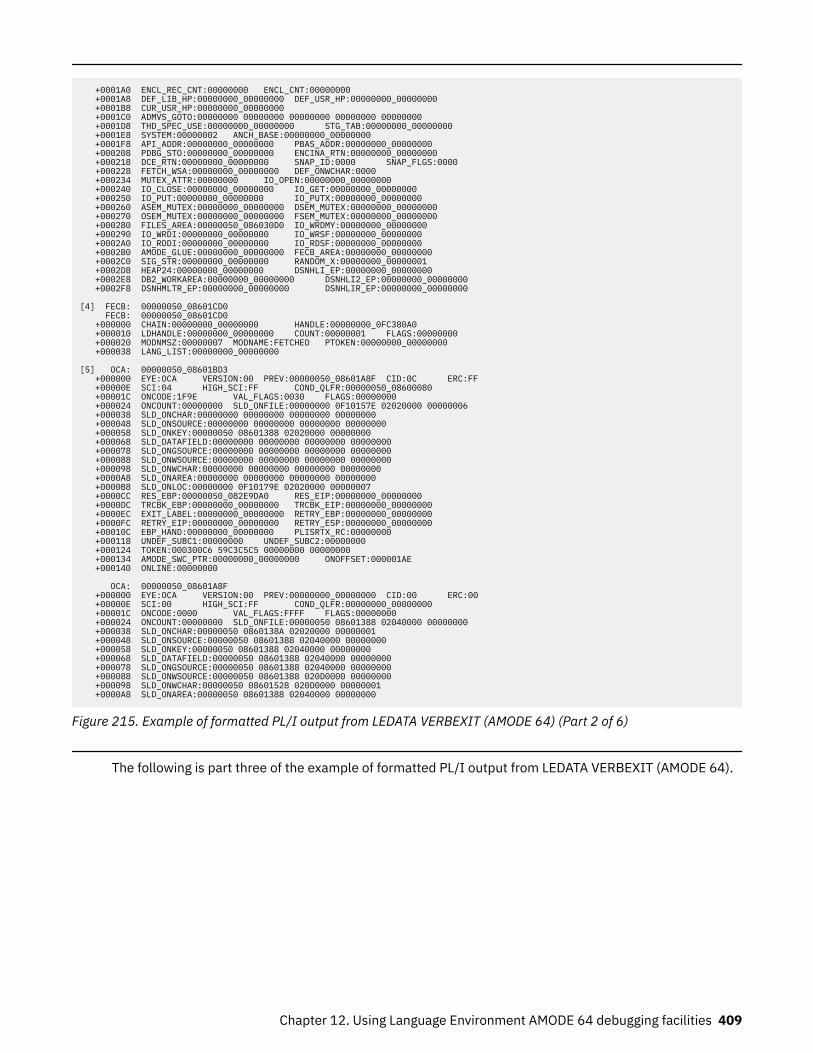
+0001A0 ENCL_REC_CNT:00000000 ENCL_CNT:00000000 +0001A8 DEF_LIB_HP:00000000_00000000 DEF_USR_HP:00000000_00000000 +0001B8 CUR_USR_HP:00000000_00000000 +0001C0 ADMVS_GOTO:00000000 00000000 00000000 00000000 00000000 +0001D8 THD_SPEC_USE:00000000_00000000 STG_TAB:00000000_00000000 +0001E8 SYSTEM:00000002 ANCH_BASE:00000000_00000000 +0001F8 API_ADDR:00000000_00000000 PBAS_ADDR:00000000_00000000 +000208 PDBG_STO:00000000_00000000 ENCINA_RTN:00000000_00000000 +000218 DCE_RTN:00000000_00000000 SNAP_ID:0000 SNAP_FLGS:0000 +000228 FETCH_WSA:00000000_00000000 DEF_ONWCHAR:0000 +000234 MUTEX_ATTR:00000000 IO_OPEN:00000000_00000000 +000240 IO_CLOSE:00000000_00000000 IO_GET:00000000_00000000 +000250 IO_PUT:00000000_00000000 IO_PUTX:00000000_00000000 +000260 ASEM_MUTEX:00000000_00000000 DSEM_MUTEX:00000000_00000000 +000270 OSEM_MUTEX:00000000_00000000 FSEM_MUTEX:00000000_00000000 +000280 FILES_AREA:00000050_086030D0 IO_WRDMY:00000000_00000000 +000290 IO_WRDI:00000000_00000000 IO_WRSF:00000000_00000000 +0002A0 IO_RDDI:00000000_00000000 IO_RDSF:00000000_00000000 +0002B0 AMODE_GLUE:00000000_00000000 FECB_AREA:00000000_00000000 +0002C0 SIG_STR:00000000_00000000 RANDOM_X:00000000_00000001 +0002D8 HEAP24:00000000_00000000 DSNHLI_EP:00000000_00000000 +0002E8 DB2_WORKAREA:00000000_00000000 DSNHLI2_EP:00000000_00000000 +0002F8 DSNHMLTR_EP:00000000_00000000 DSNHLIR_EP:00000000_00000000
[4] FECB: 00000050_08601CD0 FECB: 00000050_08601CD0 +000000 CHAIN:00000000_00000000 HANDLE:00000000_0FC380A0 +000010 LDHANDLE:00000000_00000000 COUNT:00000001 FLAGS:00000000 +000020 MODNMSZ:00000007 MODNAME:FETCHED PTOKEN:00000000_00000000 +000038 LANG_LIST:00000000_00000000
[5] OCA: 00000050_08601BD3 +000000 EYE:OCA VERSION:00 PREV:00000050_08601A8F CID:0C ERC:FF +00000E SCI:04 HIGH_SCI:FF COND_QLFR:00000050_08600080 +00001C ONCODE:1F9E VAL_FLAGS:0030 FLAGS:00000000 +000024 ONCOUNT:00000000 SLD_ONFILE:00000000 0F10157E 02020000 00000006 +000038 SLD_ONCHAR:00000000 00000000 00000000 00000000 +000048 SLD_ONSOURCE:00000000 00000000 00000000 00000000 +000058 SLD_ONKEY:00000050 08601388 02020000 00000000 +000068 SLD_DATAFIELD:00000000 00000000 00000000 00000000 +000078 SLD_ONGSOURCE:00000000 00000000 00000000 00000000 +000088 SLD_ONWSOURCE:00000000 00000000 00000000 00000000 +000098 SLD_ONWCHAR:00000000 00000000 00000000 00000000 +0000A8 SLD_ONAREA:00000000 00000000 00000000 00000000 +0000B8 SLD_ONLOC:00000000 0F10179E 02020000 00000007 +0000CC RES_EBP:00000050_082E9DA0 RES_EIP:00000000_00000000 +0000DC TRCBK_EBP:00000000_00000000 TRCBK_EIP:00000000_00000000 +0000EC EXIT_LABEL:00000000_00000000 RETRY_EBP:00000000_00000000 +0000FC RETRY_EIP:00000000_00000000 RETRY_ESP:00000000_00000000 +00010C EBP_HAND:00000000_00000000 PLISRTX_RC:00000000 +000118 UNDEF_SUBC1:00000000 UNDEF_SUBC2:00000000 +000124 TOKEN:000300C6 59C3C5C5 00000000 00000000 +000134 AMODE_SWC_PTR:00000000_00000000 ONOFFSET:000001AE +000140 ONLINE:00000000
OCA: 00000050_08601A8F +000000 EYE:OCA VERSION:00 PREV:00000000_00000000 CID:00 ERC:00 +00000E SCI:00 HIGH_SCI:FF COND_QLFR:00000000_00000000 +00001C ONCODE:0000 VAL_FLAGS:FFFF FLAGS:00000000 +000024 ONCOUNT:00000000 SLD_ONFILE:00000050 08601388 02040000 00000000 +000038 SLD_ONCHAR:00000050 0860138A 02020000 00000001 +000048 SLD_ONSOURCE:00000050 08601388 02040000 00000000 +000058 SLD_ONKEY:00000050 08601388 02040000 00000000 +000068 SLD_DATAFIELD:00000050 08601388 02040000 00000000 +000078 SLD_ONGSOURCE:00000050 08601388 02040000 00000000 +000088 SLD_ONWSOURCE:00000050 08601388 020D0000 00000000 +000098 SLD_ONWCHAR:00000050 08601528 020D0000 00000001 +0000A8 SLD_ONAREA:00000050 08601388 02040000 00000000
Figure 215. Example of formatted PL/I output from LEDATA VERBEXIT (AMODE 64) (Part 2 of 6)
The following is part three of the example of formatted PL/I output from LEDATA VERBEXIT (AMODE 64).
Chapter 12. Using Language Environment AMODE 64 debugging facilities 409
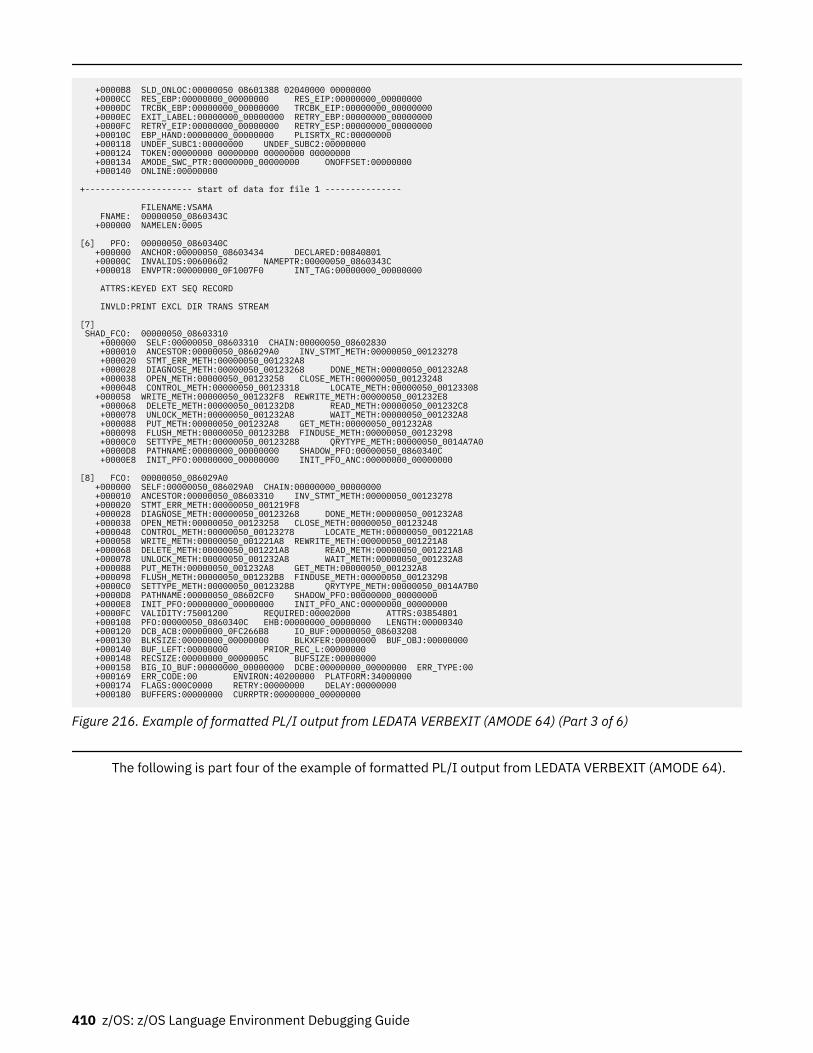
+0000B8 SLD_ONLOC:00000050 08601388 02040000 00000000 +0000CC RES_EBP:00000000_00000000 RES_EIP:00000000_00000000 +0000DC TRCBK_EBP:00000000_00000000 TRCBK_EIP:00000000_00000000 +0000EC EXIT_LABEL:00000000_00000000 RETRY_EBP:00000000_00000000 +0000FC RETRY_EIP:00000000_00000000 RETRY_ESP:00000000_00000000 +00010C EBP_HAND:00000000_00000000 PLISRTX_RC:00000000 +000118 UNDEF_SUBC1:00000000 UNDEF_SUBC2:00000000 +000124 TOKEN:00000000 00000000 00000000 00000000 +000134 AMODE_SWC_PTR:00000000_00000000 ONOFFSET:00000000 +000140 ONLINE:00000000
+--------------------- start of data for file 1 ---------------
FILENAME:VSAMA FNAME: 00000050_0860343C +000000 NAMELEN:0005
[6] PFO: 00000050_0860340C +000000 ANCHOR:00000050_08603434 DECLARED:00840801 +00000C INVALIDS:00600602 NAMEPTR:00000050_0860343C +000018 ENVPTR:00000000_0F1007F0 INT_TAG:00000000_00000000 ATTRS:KEYED EXT SEQ RECORD INVLD:PRINT EXCL DIR TRANS STREAM
[7] SHAD_FCO: 00000050_08603310 +000000 SELF:00000050_08603310 CHAIN:00000050_08602830 +000010 ANCESTOR:00000050_086029A0 INV_STMT_METH:00000050_00123278 +000020 STMT_ERR_METH:00000050_001232A8 +000028 DIAGNOSE_METH:00000050_00123268 DONE_METH:00000050_001232A8 +000038 OPEN_METH:00000050_00123258 CLOSE_METH:00000050_00123248 +000048 CONTROL_METH:00000050_00123318 LOCATE_METH:00000050_00123308 +000058 WRITE_METH:00000050_001232F8 REWRITE_METH:00000050_001232E8 +000068 DELETE_METH:00000050_001232D8 READ_METH:00000050_001232C8 +000078 UNLOCK_METH:00000050_001232A8 WAIT_METH:00000050_001232A8 +000088 PUT_METH:00000050_001232A8 GET_METH:00000050_001232A8 +000098 FLUSH_METH:00000050_001232B8 FINDUSE_METH:00000050_00123298 +0000C0 SETTYPE_METH:00000050_00123288 QRYTYPE_METH:00000050_0014A7A0 +0000D8 PATHNAME:00000000_00000000 SHADOW_PFO:00000050_0860340C +0000E8 INIT_PFO:00000000_00000000 INIT_PFO_ANC:00000000_00000000
[8] FCO: 00000050_086029A0 +000000 SELF:00000050_086029A0 CHAIN:00000000_00000000 +000010 ANCESTOR:00000050_08603310 INV_STMT_METH:00000050_00123278 +000020 STMT_ERR_METH:00000050_001219F8 +000028 DIAGNOSE_METH:00000050_00123268 DONE_METH:00000050_001232A8 +000038 OPEN_METH:00000050_00123258 CLOSE_METH:00000050_00123248 +000048 CONTROL_METH:00000050_00123278 LOCATE_METH:00000050_001221A8 +000058 WRITE_METH:00000050_001221A8 REWRITE_METH:00000050_001221A8 +000068 DELETE_METH:00000050_001221A8 READ_METH:00000050_001221A8 +000078 UNLOCK_METH:00000050_001232A8 WAIT_METH:00000050_001232A8 +000088 PUT_METH:00000050_001232A8 GET_METH:00000050_001232A8 +000098 FLUSH_METH:00000050_001232B8 FINDUSE_METH:00000050_00123298 +0000C0 SETTYPE_METH:00000050_00123288 QRYTYPE_METH:00000050_0014A7B0 +0000D8 PATHNAME:00000050_08602CF0 SHADOW_PFO:00000000_00000000 +0000E8 INIT_PFO:00000000_00000000 INIT_PFO_ANC:00000000_00000000 +0000FC VALIDITY:75001200 REQUIRED:00002000 ATTRS:03854801 +000108 PFO:00000050_0860340C EHB:00000000_00000000 LENGTH:00000340 +000120 DCB_ACB:00000000_0FC266B8 IO_BUF:00000050_08603208 +000130 BLKSIZE:00000000_00000000 BLKXFER:00000000 BUF_OBJ:00000000 +000140 BUF_LEFT:00000000 PRIOR_REC_L:00000000 +000148 RECSIZE:00000000_0000005C BUFSIZE:00000000 +000158 BIG_IO_BUF:00000000_00000000 DCBE:00000000_00000000 ERR_TYPE:00 +000169 ERR_CODE:00 ENVIRON:40200000 PLATFORM:34000000 +000174 FLAGS:000C0000 RETRY:00000000 DELAY:00000000 +000180 BUFFERS:00000000 CURRPTR:00000000_00000000
Figure 216. Example of formatted PL/I output from LEDATA VERBEXIT (AMODE 64) (Part 3 of 6)
The following is part four of the example of formatted PL/I output from LEDATA VERBEXIT (AMODE 64).
410 z/OS: z/OS Language Environment Debugging Guide
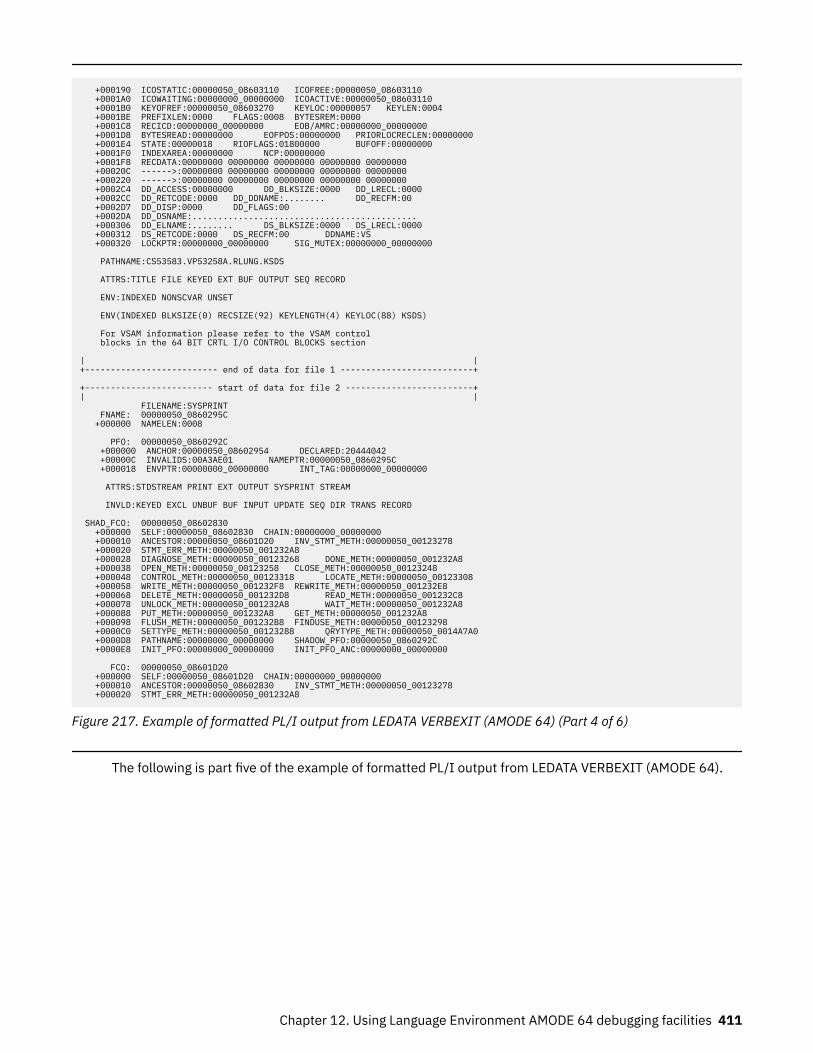
+000190 ICOSTATIC:00000050_08603110 ICOFREE:00000050_08603110 +0001A0 ICOWAITING:00000000_00000000 ICOACTIVE:00000050_08603110 +0001B0 KEYOFREF:00000050_08603270 KEYLOC:00000057 KEYLEN:0004 +0001BE PREFIXLEN:0000 FLAGS:0008 BYTESREM:0000 +0001C8 RECICD:00000000_00000000 EOB/AMRC:00000000_00000000 +0001D8 BYTESREAD:00000000 EOFPOS:00000000 PRIORLOCRECLEN:00000000 +0001E4 STATE:00000018 RIOFLAGS:01800000 BUFOFF:00000000 +0001F0 INDEXAREA:00000000 NCP:00000000 +0001F8 RECDATA:00000000 00000000 00000000 00000000 00000000 +00020C ------>:00000000 00000000 00000000 00000000 00000000 +000220 ------>:00000000 00000000 00000000 00000000 00000000 +0002C4 DD_ACCESS:00000000 DD_BLKSIZE:0000 DD_LRECL:0000 +0002CC DD_RETCODE:0000 DD_DDNAME:........ DD_RECFM:00 +0002D7 DD_DISP:0000 DD_FLAGS:00 +0002DA DD_DSNAME:............................................ +000306 DD_ELNAME:........ DS_BLKSIZE:0000 DS_LRECL:0000 +000312 DS_RETCODE:0000 DS_RECFM:00 DDNAME:VS +000320 LOCKPTR:00000000_00000000 SIG_MUTEX:00000000_00000000 PATHNAME:CS53583.VP53258A.RLUNG.KSDS ATTRS:TITLE FILE KEYED EXT BUF OUTPUT SEQ RECORD ENV:INDEXED NONSCVAR UNSET ENV(INDEXED BLKSIZE(0) RECSIZE(92) KEYLENGTH(4) KEYLOC(88) KSDS) For VSAM information please refer to the VSAM control blocks in the 64 BIT CRTL I/O CONTROL BLOCKS section | |+-------------------------- end of data for file 1 --------------------------+ +------------------------- start of data for file 2 -------------------------+| | FILENAME:SYSPRINT FNAME: 00000050_0860295C +000000 NAMELEN:0008
PFO: 00000050_0860292C +000000 ANCHOR:00000050_08602954 DECLARED:20444042 +00000C INVALIDS:00A3AE01 NAMEPTR:00000050_0860295C +000018 ENVPTR:00000000_00000000 INT_TAG:00000000_00000000 ATTRS:STDSTREAM PRINT EXT OUTPUT SYSPRINT STREAM INVLD:KEYED EXCL UNBUF BUF INPUT UPDATE SEQ DIR TRANS RECORD
SHAD_FCO: 00000050_08602830 +000000 SELF:00000050_08602830 CHAIN:00000000_00000000 +000010 ANCESTOR:00000050_08601D20 INV_STMT_METH:00000050_00123278 +000020 STMT_ERR_METH:00000050_001232A8 +000028 DIAGNOSE_METH:00000050_00123268 DONE_METH:00000050_001232A8 +000038 OPEN_METH:00000050_00123258 CLOSE_METH:00000050_00123248 +000048 CONTROL_METH:00000050_00123318 LOCATE_METH:00000050_00123308 +000058 WRITE_METH:00000050_001232F8 REWRITE_METH:00000050_001232E8 +000068 DELETE_METH:00000050_001232D8 READ_METH:00000050_001232C8 +000078 UNLOCK_METH:00000050_001232A8 WAIT_METH:00000050_001232A8 +000088 PUT_METH:00000050_001232A8 GET_METH:00000050_001232A8 +000098 FLUSH_METH:00000050_001232B8 FINDUSE_METH:00000050_00123298 +0000C0 SETTYPE_METH:00000050_00123288 QRYTYPE_METH:00000050_0014A7A0 +0000D8 PATHNAME:00000000_00000000 SHADOW_PFO:00000050_0860292C +0000E8 INIT_PFO:00000000_00000000 INIT_PFO_ANC:00000000_00000000 FCO: 00000050_08601D20 +000000 SELF:00000050_08601D20 CHAIN:00000000_00000000 +000010 ANCESTOR:00000050_08602830 INV_STMT_METH:00000050_00123278 +000020 STMT_ERR_METH:00000050_001232A8
Figure 217. Example of formatted PL/I output from LEDATA VERBEXIT (AMODE 64) (Part 4 of 6)
The following is part five of the example of formatted PL/I output from LEDATA VERBEXIT (AMODE 64).
Chapter 12. Using Language Environment AMODE 64 debugging facilities 411
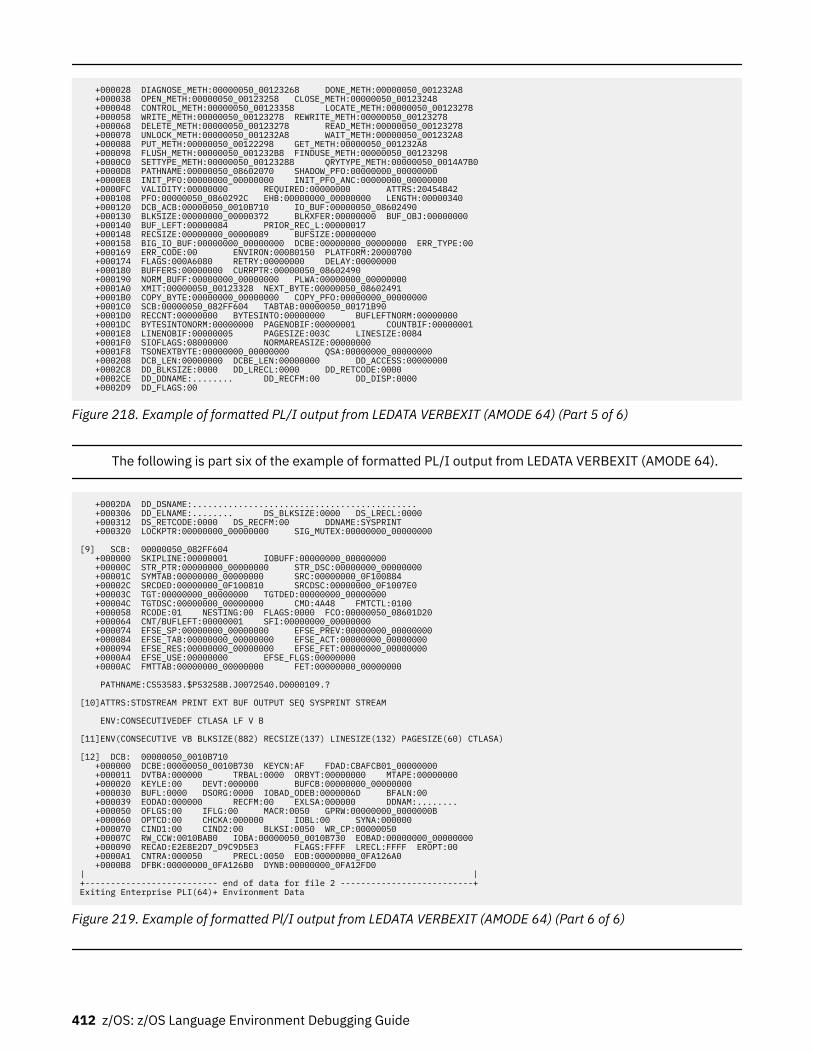
+000028 DIAGNOSE_METH:00000050_00123268 DONE_METH:00000050_001232A8 +000038 OPEN_METH:00000050_00123258 CLOSE_METH:00000050_00123248 +000048 CONTROL_METH:00000050_00123358 LOCATE_METH:00000050_00123278 +000058 WRITE_METH:00000050_00123278 REWRITE_METH:00000050_00123278 +000068 DELETE_METH:00000050_00123278 READ_METH:00000050_00123278 +000078 UNLOCK_METH:00000050_001232A8 WAIT_METH:00000050_001232A8 +000088 PUT_METH:00000050_00122298 GET_METH:00000050_001232A8 +000098 FLUSH_METH:00000050_001232B8 FINDUSE_METH:00000050_00123298 +0000C0 SETTYPE_METH:00000050_00123288 QRYTYPE_METH:00000050_0014A7B0 +0000D8 PATHNAME:00000050_08602070 SHADOW_PFO:00000000_00000000 +0000E8 INIT_PFO:00000000_00000000 INIT_PFO_ANC:00000000_00000000 +0000FC VALIDITY:00000000 REQUIRED:00000000 ATTRS:20454842 +000108 PFO:00000050_0860292C EHB:00000000_00000000 LENGTH:00000340 +000120 DCB_ACB:00000050_0010B710 IO_BUF:00000050_08602490 +000130 BLKSIZE:00000000_00000372 BLKXFER:00000000 BUF_OBJ:00000000 +000140 BUF_LEFT:00000084 PRIOR_REC_L:00000017 +000148 RECSIZE:00000000_00000089 BUFSIZE:00000000 +000158 BIG_IO_BUF:00000000_00000000 DCBE:00000000_00000000 ERR_TYPE:00 +000169 ERR_CODE:00 ENVIRON:00080150 PLATFORM:20000700 +000174 FLAGS:000A6080 RETRY:00000000 DELAY:00000000 +000180 BUFFERS:00000000 CURRPTR:00000050_08602490 +000190 NORM_BUFF:00000000_00000000 PLWA:00000000_00000000 +0001A0 XMIT:00000050_00123328 NEXT_BYTE:00000050_08602491 +0001B0 COPY_BYTE:00000000_00000000 COPY_PFO:00000000_00000000 +0001C0 SCB:00000050_082FF604 TABTAB:00000050_00171B90 +0001D0 RECCNT:00000000 BYTESINTO:00000000 BUFLEFTNORM:00000000 +0001DC BYTESINTONORM:00000000 PAGENOBIF:00000001 COUNTBIF:00000001 +0001E8 LINENOBIF:00000005 PAGESIZE:003C LINESIZE:0084 +0001F0 SIOFLAGS:08000000 NORMAREASIZE:00000000 +0001F8 TSONEXTBYTE:00000000_00000000 QSA:00000000_00000000 +000208 DCB_LEN:00000000 DCBE_LEN:00000000 DD_ACCESS:00000000 +0002C8 DD_BLKSIZE:0000 DD_LRECL:0000 DD_RETCODE:0000 +0002CE DD_DDNAME:........ DD_RECFM:00 DD_DISP:0000 +0002D9 DD_FLAGS:00
Figure 218. Example of formatted PL/I output from LEDATA VERBEXIT (AMODE 64) (Part 5 of 6)
The following is part six of the example of formatted PL/I output from LEDATA VERBEXIT (AMODE 64).
+0002DA DD_DSNAME:............................................ +000306 DD_ELNAME:........ DS_BLKSIZE:0000 DS_LRECL:0000 +000312 DS_RETCODE:0000 DS_RECFM:00 DDNAME:SYSPRINT +000320 LOCKPTR:00000000_00000000 SIG_MUTEX:00000000_00000000
[9] SCB: 00000050_082FF604 +000000 SKIPLINE:00000001 IOBUFF:00000000_00000000 +00000C STR_PTR:00000000_00000000 STR_DSC:00000000_00000000 +00001C SYMTAB:00000000_00000000 SRC:00000000_0F100884 +00002C SRCDED:00000000_0F100810 SRCDSC:00000000_0F1007E0 +00003C TGT:00000000_00000000 TGTDED:00000000_00000000 +00004C TGTDSC:00000000_00000000 CMD:4A48 FMTCTL:0100 +000058 RCODE:01 NESTING:00 FLAGS:0000 FCO:00000050_08601D20 +000064 CNT/BUFLEFT:00000001 SFI:00000000_00000000 +000074 EFSE_SP:00000000_00000000 EFSE_PREV:00000000_00000000 +000084 EFSE_TAB:00000000_00000000 EFSE_ACT:00000000_00000000 +000094 EFSE_RES:00000000_00000000 EFSE_FET:00000000_00000000 +0000A4 EFSE_USE:00000000 EFSE_FLGS:00000000 +0000AC FMTTAB:00000000_00000000 FET:00000000_00000000
PATHNAME:CS53583.$P53258B.J0072540.D0000109.?
[10]ATTRS:STDSTREAM PRINT EXT BUF OUTPUT SEQ SYSPRINT STREAM
ENV:CONSECUTIVEDEF CTLASA LF V B
[11]ENV(CONSECUTIVE VB BLKSIZE(882) RECSIZE(137) LINESIZE(132) PAGESIZE(60) CTLASA)
[12] DCB: 00000050_0010B710 +000000 DCBE:00000050_0010B730 KEYCN:AF FDAD:CBAFCB01_00000000 +000011 DVTBA:000000 TRBAL:0000 ORBYT:00000000 MTAPE:00000000 +000020 KEYLE:00 DEVT:000000 BUFCB:00000000_00000000 +000030 BUFL:0000 DSORG:0000 IOBAD_ODEB:0000006D BFALN:00 +000039 EODAD:000000 RECFM:00 EXLSA:000000 DDNAM:........ +000050 OFLGS:00 IFLG:00 MACR:0050 GPRW:00000000_0000000B +000060 OPTCD:00 CHCKA:000000 IOBL:00 SYNA:000000 +000070 CIND1:00 CIND2:00 BLKSI:0050 WR_CP:00000050 +00007C RW_CCW:0010BAB0 IOBA:00000050_0010B730 EOBAD:00000000_00000000 +000090 RECAD:E2E8E2D7_D9C9D5E3 FLAGS:FFFF LRECL:FFFF EROPT:00 +0000A1 CNTRA:000050 PRECL:0050 EOB:00000000_0FA126A0 +0000B8 DFBK:00000000_0FA126B0 DYNB:00000000_0FA12FD0 | |+-------------------------- end of data for file 2 --------------------------+Exiting Enterprise PLI(64)+ Environment Data
Figure 219. Example of formatted Pl/I output from LEDATA VERBEXIT (AMODE 64) (Part 6 of 6)
412 z/OS: z/OS Language Environment Debugging Guide
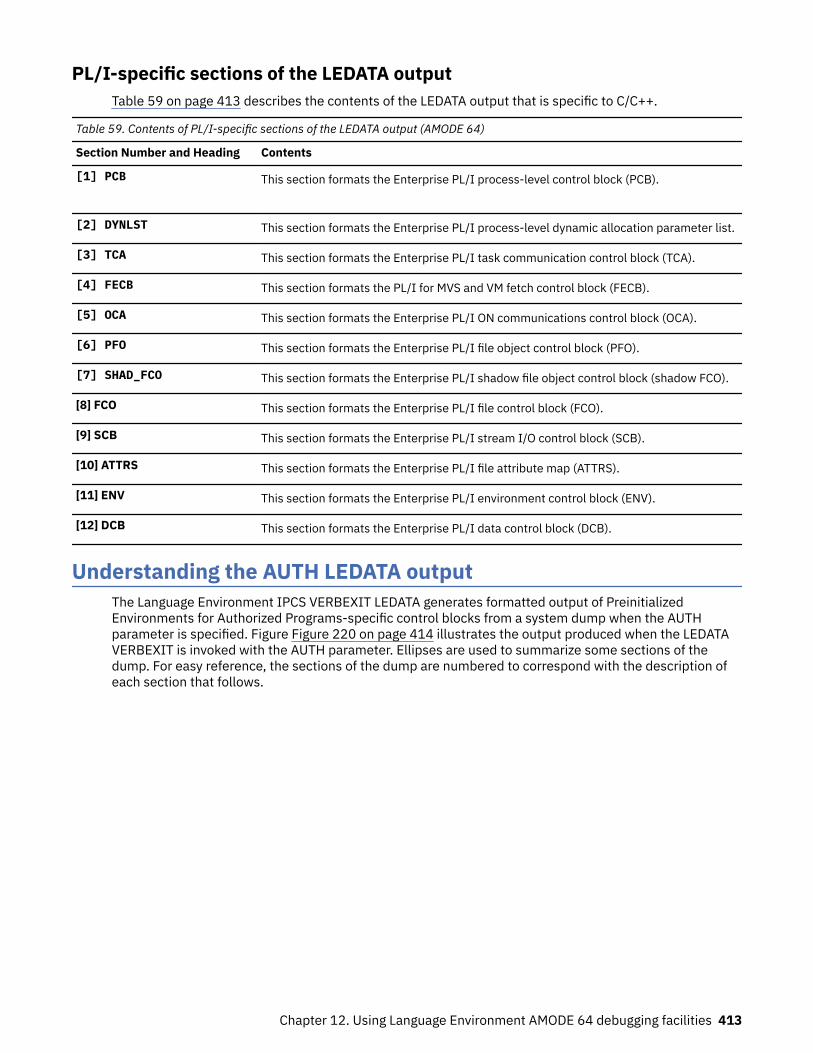
PL/I-specific sections of the LEDATA outputTable 59 on page 413 describes the contents of the LEDATA output that is specific to C/C++.
Table 59. Contents of PL/I-specific sections of the LEDATA output (AMODE 64)
Section Number and Heading Contents
[1] PCB This section formats the Enterprise PL/I process-level control block (PCB).
[2] DYNLST This section formats the Enterprise PL/I process-level dynamic allocation parameter list.
[3] TCA This section formats the Enterprise PL/I task communication control block (TCA).
[4] FECB This section formats the PL/I for MVS and VM fetch control block (FECB).
[5] OCA This section formats the Enterprise PL/I ON communications control block (OCA).
[6] PFO This section formats the Enterprise PL/I file object control block (PFO).
[7] SHAD_FCO This section formats the Enterprise PL/I shadow file object control block (shadow FCO).
[8] FCO This section formats the Enterprise PL/I file control block (FCO).
[9] SCB This section formats the Enterprise PL/I stream I/O control block (SCB).
[10] ATTRS This section formats the Enterprise PL/I file attribute map (ATTRS).
[11] ENV This section formats the Enterprise PL/I environment control block (ENV).
[12] DCB This section formats the Enterprise PL/I data control block (DCB).
Understanding the AUTH LEDATA outputThe Language Environment IPCS VERBEXIT LEDATA generates formatted output of PreinitializedEnvironments for Authorized Programs-specific control blocks from a system dump when the AUTHparameter is specified. Figure Figure 220 on page 414 illustrates the output produced when the LEDATAVERBEXIT is invoked with the AUTH parameter. Ellipses are used to summarize some sections of thedump. For easy reference, the sections of the dump are numbered to correspond with the description ofeach section that follows.
Chapter 12. Using Language Environment AMODE 64 debugging facilities 413
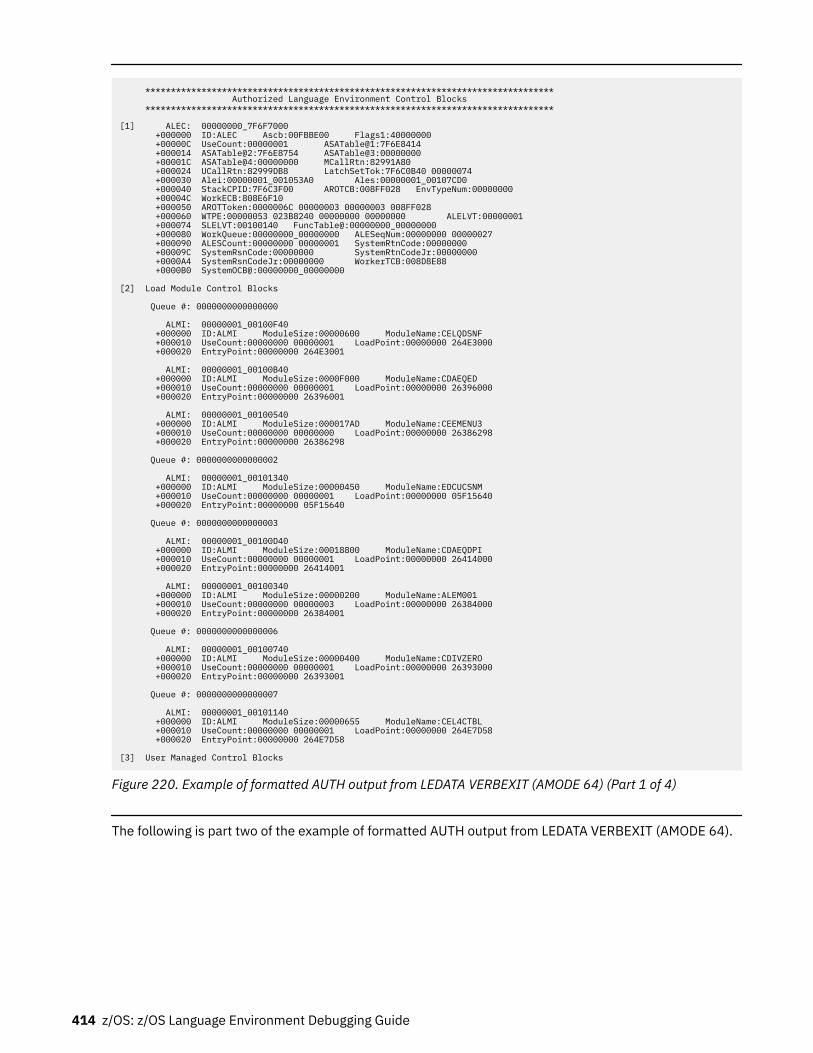
******************************************************************************** Authorized Language Environment Control Blocks ******************************************************************************** [1] ALEC: 00000000_7F6F7000 +000000 ID:ALEC Ascb:00FBBE00 Flags1:40000000 +00000C UseCount:00000001 ASATable@1:7F6E8414 +000014 ASATable@2:7F6E8754 ASATable@3:00000000 +00001C ASATable@4:00000000 MCallRtn:82991A80 +000024 UCallRtn:82999DB8 LatchSetTok:7F6C0B40 00000074 +000030 Alei:00000001_001053A0 Ales:00000001_00107CD0 +000040 StackCPID:7F6C3F00 AROTCB:008FF028 EnvTypeNum:00000000 +00004C WorkECB:808E6F10 +000050 AROTToken:0000006C 00000003 00000003 008FF028 +000060 WTPE:00000053 023B8240 00000000 00000000 ALELVT:00000001 +000074 SLELVT:00100140 FuncTable@:00000000_00000000 +000080 WorkQueue:00000000_00000000 ALESeqNum:00000000 00000027 +000090 ALESCount:00000000 00000001 SystemRtnCode:00000000 +00009C SystemRsnCode:00000000 SystemRtnCodeJr:00000000 +0000A4 SystemRsnCodeJr:00000000 WorkerTCB:008D8E88 +0000B0 SystemOCB@:00000000_00000000 [2] Load Module Control Blocks Queue #: 0000000000000000 ALMI: 00000001_00100F40 +000000 ID:ALMI ModuleSize:00000600 ModuleName:CELQDSNF +000010 UseCount:00000000 00000001 LoadPoint:00000000 264E3000 +000020 EntryPoint:00000000 264E3001 ALMI: 00000001_00100B40 +000000 ID:ALMI ModuleSize:0000F000 ModuleName:CDAEQED +000010 UseCount:00000000 00000001 LoadPoint:00000000 26396000 +000020 EntryPoint:00000000 26396001 ALMI: 00000001_00100540 +000000 ID:ALMI ModuleSize:000017AD ModuleName:CEEMENU3 +000010 UseCount:00000000 00000000 LoadPoint:00000000 26386298 +000020 EntryPoint:00000000 26386298 Queue #: 0000000000000002 ALMI: 00000001_00101340 +000000 ID:ALMI ModuleSize:00000450 ModuleName:EDCUCSNM +000010 UseCount:00000000 00000001 LoadPoint:00000000 05F15640 +000020 EntryPoint:00000000 05F15640 Queue #: 0000000000000003 ALMI: 00000001_00100D40 +000000 ID:ALMI ModuleSize:00018800 ModuleName:CDAEQDPI +000010 UseCount:00000000 00000001 LoadPoint:00000000 26414000 +000020 EntryPoint:00000000 26414001 ALMI: 00000001_00100340 +000000 ID:ALMI ModuleSize:00000200 ModuleName:ALEM001 +000010 UseCount:00000000 00000003 LoadPoint:00000000 26384000 +000020 EntryPoint:00000000 26384001 Queue #: 0000000000000006 ALMI: 00000001_00100740 +000000 ID:ALMI ModuleSize:00000400 ModuleName:CDIVZERO +000010 UseCount:00000000 00000001 LoadPoint:00000000 26393000 +000020 EntryPoint:00000000 26393001 Queue #: 0000000000000007 ALMI: 00000001_00101140 +000000 ID:ALMI ModuleSize:00000655 ModuleName:CEL4CTBL +000010 UseCount:00000000 00000001 LoadPoint:00000000 264E7D58 +000020 EntryPoint:00000000 264E7D58 [3] User Managed Control Blocks
Figure 220. Example of formatted AUTH output from LEDATA VERBEXIT (AMODE 64) (Part 1 of 4)
The following is part two of the example of formatted AUTH output from LEDATA VERBEXIT (AMODE 64).
414 z/OS: z/OS Language Environment Debugging Guide
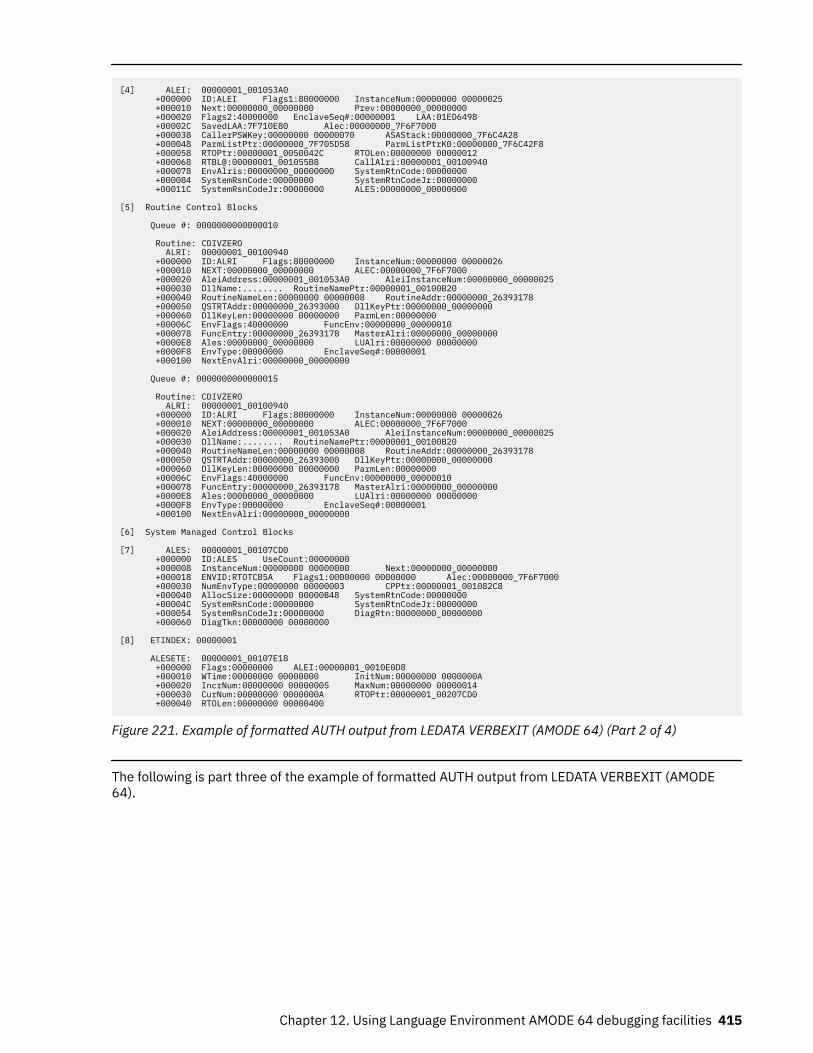
[4] ALEI: 00000001_001053A0 +000000 ID:ALEI Flags1:80000000 InstanceNum:00000000 00000025 +000010 Next:00000000_00000000 Prev:00000000_00000000 +000020 Flags2:40000000 EnclaveSeq#:00000001 LAA:01ED6498 +00002C SavedLAA:7F710E80 Alec:00000000_7F6F7000 +000038 CallerPSWKey:00000000 00000070 ASAStack:00000000_7F6C4A28 +000048 ParmListPtr:00000000_7F705D58 ParmListPtrK0:00000000_7F6C42F8 +000058 RTOPtr:00000001_0050042C RTOLen:00000000 00000012 +000068 RTBL@:00000001_001055B8 CallAlri:00000001_00100940 +000078 EnvAlris:00000000_00000000 SystemRtnCode:00000000 +000084 SystemRsnCode:00000000 SystemRtnCodeJr:00000000 +00011C SystemRsnCodeJr:00000000 ALES:00000000_00000000 [5] Routine Control Blocks Queue #: 0000000000000010 Routine: CDIVZERO ALRI: 00000001_00100940 +000000 ID:ALRI Flags:80000000 InstanceNum:00000000 00000026 +000010 NEXT:00000000_00000000 ALEC:00000000_7F6F7000 +000020 AleiAddress:00000001_001053A0 AleiInstanceNum:00000000_00000025 +000030 DllName:........ RoutineNamePtr:00000001_00100B20 +000040 RoutineNameLen:00000000 00000008 RoutineAddr:00000000_26393178 +000050 QSTRTAddr:00000000_26393000 DllKeyPtr:00000000_00000000 +000060 DllKeyLen:00000000 00000000 ParmLen:00000000 +00006C EnvFlags:40000000 FuncEnv:00000000_00000010 +000078 FuncEntry:00000000_26393178 MasterAlri:00000000_00000000 +0000E8 Ales:00000000_00000000 LUAlri:00000000 00000000 +0000F8 EnvType:00000000 EnclaveSeq#:00000001 +000100 NextEnvAlri:00000000_00000000 Queue #: 0000000000000015 Routine: CDIVZERO ALRI: 00000001_00100940 +000000 ID:ALRI Flags:80000000 InstanceNum:00000000 00000026 +000010 NEXT:00000000_00000000 ALEC:00000000_7F6F7000 +000020 AleiAddress:00000001_001053A0 AleiInstanceNum:00000000_00000025 +000030 DllName:........ RoutineNamePtr:00000001_00100B20 +000040 RoutineNameLen:00000000 00000008 RoutineAddr:00000000_26393178 +000050 QSTRTAddr:00000000_26393000 DllKeyPtr:00000000_00000000 +000060 DllKeyLen:00000000 00000000 ParmLen:00000000 +00006C EnvFlags:40000000 FuncEnv:00000000_00000010 +000078 FuncEntry:00000000_26393178 MasterAlri:00000000_00000000 +0000E8 Ales:00000000_00000000 LUAlri:00000000 00000000 +0000F8 EnvType:00000000 EnclaveSeq#:00000001 +000100 NextEnvAlri:00000000_00000000 [6] System Managed Control Blocks [7] ALES: 00000001_00107CD0 +000000 ID:ALES UseCount:00000000 +000008 InstanceNum:00000000 00000000 Next:00000000_00000000 +000018 ENVID:RTOTCB5A Flags1:00000000 00000000 Alec:00000000_7F6F7000 +000030 NumEnvType:00000000 00000003 CPPtr:00000001_001082C8 +000040 AllocSize:00000000 00000B48 SystemRtnCode:00000000 +00004C SystemRsnCode:00000000 SystemRtnCodeJr:00000000 +000054 SystemRsnCodeJr:00000000 DiagRtn:00000000_00000000 +000060 DiagTkn:00000000 00000000 [8] ETINDEX: 00000001 ALESETE: 00000001_00107E18 +000000 Flags:00000000 ALEI:00000001_0010E0D8 +000010 WTime:00000000 00000000 InitNum:00000000 0000000A +000020 IncrNum:00000000 00000005 MaxNum:00000000 00000014 +000030 CurNum:00000000 0000000A RTOPtr:00000001_00207CD0 +000040 RTOLen:00000000 00000400
Figure 221. Example of formatted AUTH output from LEDATA VERBEXIT (AMODE 64) (Part 2 of 4)
The following is part three of the example of formatted AUTH output from LEDATA VERBEXIT (AMODE64).
Chapter 12. Using Language Environment AMODE 64 debugging facilities 415
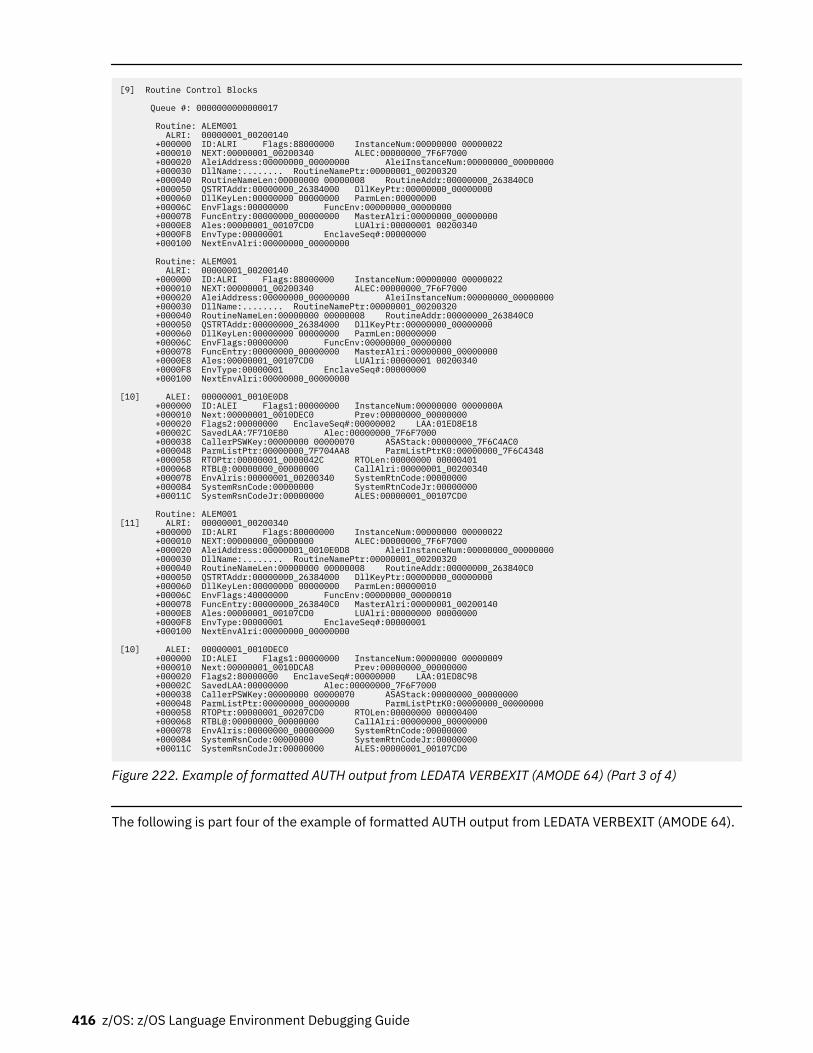
[9] Routine Control Blocks Queue #: 0000000000000017 Routine: ALEM001 ALRI: 00000001_00200140 +000000 ID:ALRI Flags:88000000 InstanceNum:00000000 00000022 +000010 NEXT:00000001_00200340 ALEC:00000000_7F6F7000 +000020 AleiAddress:00000000_00000000 AleiInstanceNum:00000000_00000000 +000030 DllName:........ RoutineNamePtr:00000001_00200320 +000040 RoutineNameLen:00000000 00000008 RoutineAddr:00000000_263840C0 +000050 QSTRTAddr:00000000_26384000 DllKeyPtr:00000000_00000000 +000060 DllKeyLen:00000000 00000000 ParmLen:00000000 +00006C EnvFlags:00000000 FuncEnv:00000000_00000000 +000078 FuncEntry:00000000_00000000 MasterAlri:00000000_00000000 +0000E8 Ales:00000001_00107CD0 LUAlri:00000001 00200340 +0000F8 EnvType:00000001 EnclaveSeq#:00000000 +000100 NextEnvAlri:00000000_00000000 Routine: ALEM001 ALRI: 00000001_00200140 +000000 ID:ALRI Flags:88000000 InstanceNum:00000000 00000022 +000010 NEXT:00000001_00200340 ALEC:00000000_7F6F7000 +000020 AleiAddress:00000000_00000000 AleiInstanceNum:00000000_00000000 +000030 DllName:........ RoutineNamePtr:00000001_00200320 +000040 RoutineNameLen:00000000 00000008 RoutineAddr:00000000_263840C0 +000050 QSTRTAddr:00000000_26384000 DllKeyPtr:00000000_00000000 +000060 DllKeyLen:00000000 00000000 ParmLen:00000000 +00006C EnvFlags:00000000 FuncEnv:00000000_00000000 +000078 FuncEntry:00000000_00000000 MasterAlri:00000000_00000000 +0000E8 Ales:00000001_00107CD0 LUAlri:00000001 00200340 +0000F8 EnvType:00000001 EnclaveSeq#:00000000 +000100 NextEnvAlri:00000000_00000000 [10] ALEI: 00000001_0010E0D8 +000000 ID:ALEI Flags1:00000000 InstanceNum:00000000 0000000A +000010 Next:00000001_0010DEC0 Prev:00000000_00000000 +000020 Flags2:00000000 EnclaveSeq#:00000002 LAA:01ED8E18 +00002C SavedLAA:7F710E80 Alec:00000000_7F6F7000 +000038 CallerPSWKey:00000000 00000070 ASAStack:00000000_7F6C4AC0 +000048 ParmListPtr:00000000_7F704AA8 ParmListPtrK0:00000000_7F6C4348 +000058 RTOPtr:00000001_0000042C RTOLen:00000000 00000401 +000068 RTBL@:00000000_00000000 CallAlri:00000001_00200340 +000078 EnvAlris:00000001_00200340 SystemRtnCode:00000000 +000084 SystemRsnCode:00000000 SystemRtnCodeJr:00000000 +00011C SystemRsnCodeJr:00000000 ALES:00000001_00107CD0 Routine: ALEM001[11] ALRI: 00000001_00200340 +000000 ID:ALRI Flags:80000000 InstanceNum:00000000 00000022 +000010 NEXT:00000000_00000000 ALEC:00000000_7F6F7000 +000020 AleiAddress:00000001_0010E0D8 AleiInstanceNum:00000000_00000000 +000030 DllName:........ RoutineNamePtr:00000001_00200320 +000040 RoutineNameLen:00000000 00000008 RoutineAddr:00000000_263840C0 +000050 QSTRTAddr:00000000_26384000 DllKeyPtr:00000000_00000000 +000060 DllKeyLen:00000000 00000000 ParmLen:00000010 +00006C EnvFlags:40000000 FuncEnv:00000000_00000010 +000078 FuncEntry:00000000_263840C0 MasterAlri:00000001_00200140 +0000E8 Ales:00000001_00107CD0 LUAlri:00000000 00000000 +0000F8 EnvType:00000001 EnclaveSeq#:00000001 +000100 NextEnvAlri:00000000_00000000 [10] ALEI: 00000001_0010DEC0 +000000 ID:ALEI Flags1:00000000 InstanceNum:00000000 00000009 +000010 Next:00000001_0010DCA8 Prev:00000000_00000000 +000020 Flags2:80000000 EnclaveSeq#:00000000 LAA:01ED8C98 +00002C SavedLAA:00000000 Alec:00000000_7F6F7000 +000038 CallerPSWKey:00000000 00000070 ASAStack:00000000_00000000 +000048 ParmListPtr:00000000_00000000 ParmListPtrK0:00000000_00000000 +000058 RTOPtr:00000001_00207CD0 RTOLen:00000000 00000400 +000068 RTBL@:00000000_00000000 CallAlri:00000000_00000000 +000078 EnvAlris:00000000_00000000 SystemRtnCode:00000000 +000084 SystemRsnCode:00000000 SystemRtnCodeJr:00000000 +00011C SystemRsnCodeJr:00000000 ALES:00000001_00107CD0
Figure 222. Example of formatted AUTH output from LEDATA VERBEXIT (AMODE 64) (Part 3 of 4)
The following is part four of the example of formatted AUTH output from LEDATA VERBEXIT (AMODE 64).
416 z/OS: z/OS Language Environment Debugging Guide
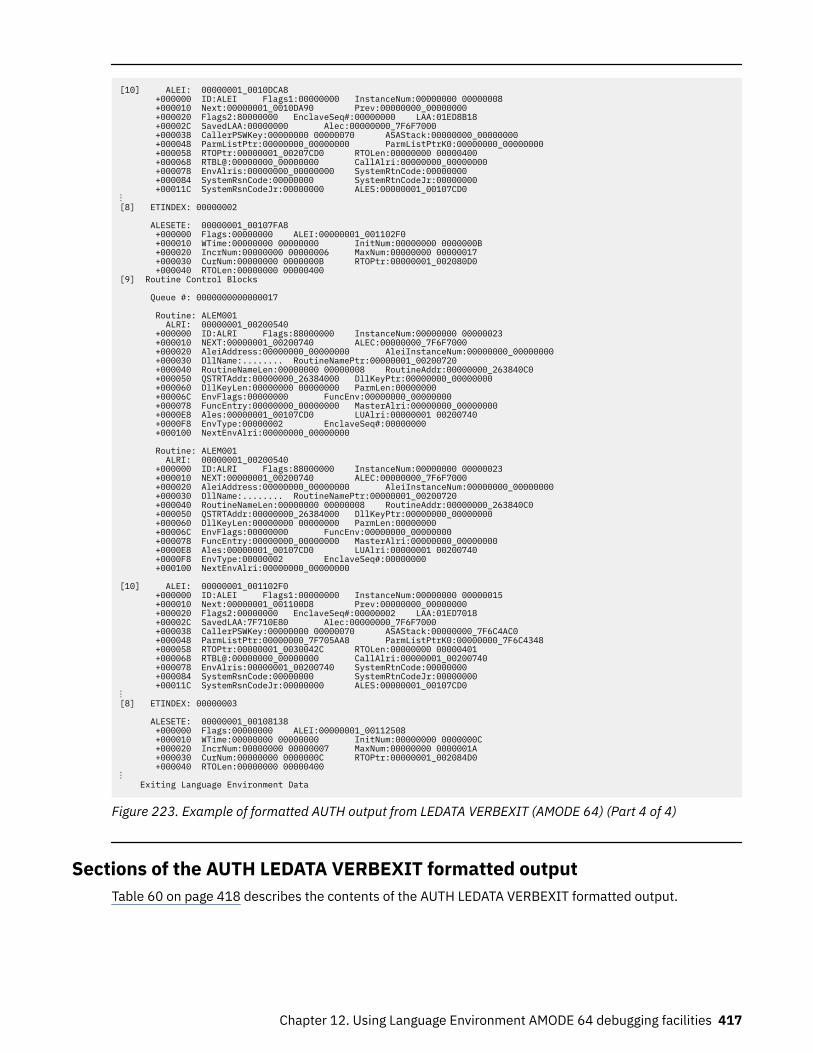
[10] ALEI: 00000001_0010DCA8 +000000 ID:ALEI Flags1:00000000 InstanceNum:00000000 00000008 +000010 Next:00000001_0010DA90 Prev:00000000_00000000 +000020 Flags2:80000000 EnclaveSeq#:00000000 LAA:01ED8B18 +00002C SavedLAA:00000000 Alec:00000000_7F6F7000 +000038 CallerPSWKey:00000000 00000070 ASAStack:00000000_00000000 +000048 ParmListPtr:00000000_00000000 ParmListPtrK0:00000000_00000000 +000058 RTOPtr:00000001_00207CD0 RTOLen:00000000 00000400 +000068 RTBL@:00000000_00000000 CallAlri:00000000_00000000 +000078 EnvAlris:00000000_00000000 SystemRtnCode:00000000 +000084 SystemRsnCode:00000000 SystemRtnCodeJr:00000000 +00011C SystemRsnCodeJr:00000000 ALES:00000001_00107CD0⋮[8] ETINDEX: 00000002 ALESETE: 00000001_00107FA8 +000000 Flags:00000000 ALEI:00000001_001102F0 +000010 WTime:00000000 00000000 InitNum:00000000 0000000B +000020 IncrNum:00000000 00000006 MaxNum:00000000 00000017 +000030 CurNum:00000000 0000000B RTOPtr:00000001_002080D0 +000040 RTOLen:00000000 00000400[9] Routine Control Blocks Queue #: 0000000000000017 Routine: ALEM001 ALRI: 00000001_00200540 +000000 ID:ALRI Flags:88000000 InstanceNum:00000000 00000023 +000010 NEXT:00000001_00200740 ALEC:00000000_7F6F7000 +000020 AleiAddress:00000000_00000000 AleiInstanceNum:00000000_00000000 +000030 DllName:........ RoutineNamePtr:00000001_00200720 +000040 RoutineNameLen:00000000 00000008 RoutineAddr:00000000_263840C0 +000050 QSTRTAddr:00000000_26384000 DllKeyPtr:00000000_00000000 +000060 DllKeyLen:00000000 00000000 ParmLen:00000000 +00006C EnvFlags:00000000 FuncEnv:00000000_00000000 +000078 FuncEntry:00000000_00000000 MasterAlri:00000000_00000000 +0000E8 Ales:00000001_00107CD0 LUAlri:00000001 00200740 +0000F8 EnvType:00000002 EnclaveSeq#:00000000 +000100 NextEnvAlri:00000000_00000000 Routine: ALEM001 ALRI: 00000001_00200540 +000000 ID:ALRI Flags:88000000 InstanceNum:00000000 00000023 +000010 NEXT:00000001_00200740 ALEC:00000000_7F6F7000 +000020 AleiAddress:00000000_00000000 AleiInstanceNum:00000000_00000000 +000030 DllName:........ RoutineNamePtr:00000001_00200720 +000040 RoutineNameLen:00000000 00000008 RoutineAddr:00000000_263840C0 +000050 QSTRTAddr:00000000_26384000 DllKeyPtr:00000000_00000000 +000060 DllKeyLen:00000000 00000000 ParmLen:00000000 +00006C EnvFlags:00000000 FuncEnv:00000000_00000000 +000078 FuncEntry:00000000_00000000 MasterAlri:00000000_00000000 +0000E8 Ales:00000001_00107CD0 LUAlri:00000001 00200740 +0000F8 EnvType:00000002 EnclaveSeq#:00000000 +000100 NextEnvAlri:00000000_00000000 [10] ALEI: 00000001_001102F0 +000000 ID:ALEI Flags1:00000000 InstanceNum:00000000 00000015 +000010 Next:00000001_001100D8 Prev:00000000_00000000 +000020 Flags2:00000000 EnclaveSeq#:00000002 LAA:01ED7018 +00002C SavedLAA:7F710E80 Alec:00000000_7F6F7000 +000038 CallerPSWKey:00000000 00000070 ASAStack:00000000_7F6C4AC0 +000048 ParmListPtr:00000000_7F705AA8 ParmListPtrK0:00000000_7F6C4348 +000058 RTOPtr:00000001_0030042C RTOLen:00000000 00000401 +000068 RTBL@:00000000_00000000 CallAlri:00000001_00200740 +000078 EnvAlris:00000001_00200740 SystemRtnCode:00000000 +000084 SystemRsnCode:00000000 SystemRtnCodeJr:00000000 +00011C SystemRsnCodeJr:00000000 ALES:00000001_00107CD0⋮[8] ETINDEX: 00000003 ALESETE: 00000001_00108138 +000000 Flags:00000000 ALEI:00000001_00112508 +000010 WTime:00000000 00000000 InitNum:00000000 0000000C +000020 IncrNum:00000000 00000007 MaxNum:00000000 0000001A +000030 CurNum:00000000 0000000C RTOPtr:00000001_002084D0 +000040 RTOLen:00000000 00000400⋮ Exiting Language Environment Data
Figure 223. Example of formatted AUTH output from LEDATA VERBEXIT (AMODE 64) (Part 4 of 4)
Sections of the AUTH LEDATA VERBEXIT formatted outputTable 60 on page 418 describes the contents of the AUTH LEDATA VERBEXIT formatted output.
Chapter 12. Using Language Environment AMODE 64 debugging facilities 417
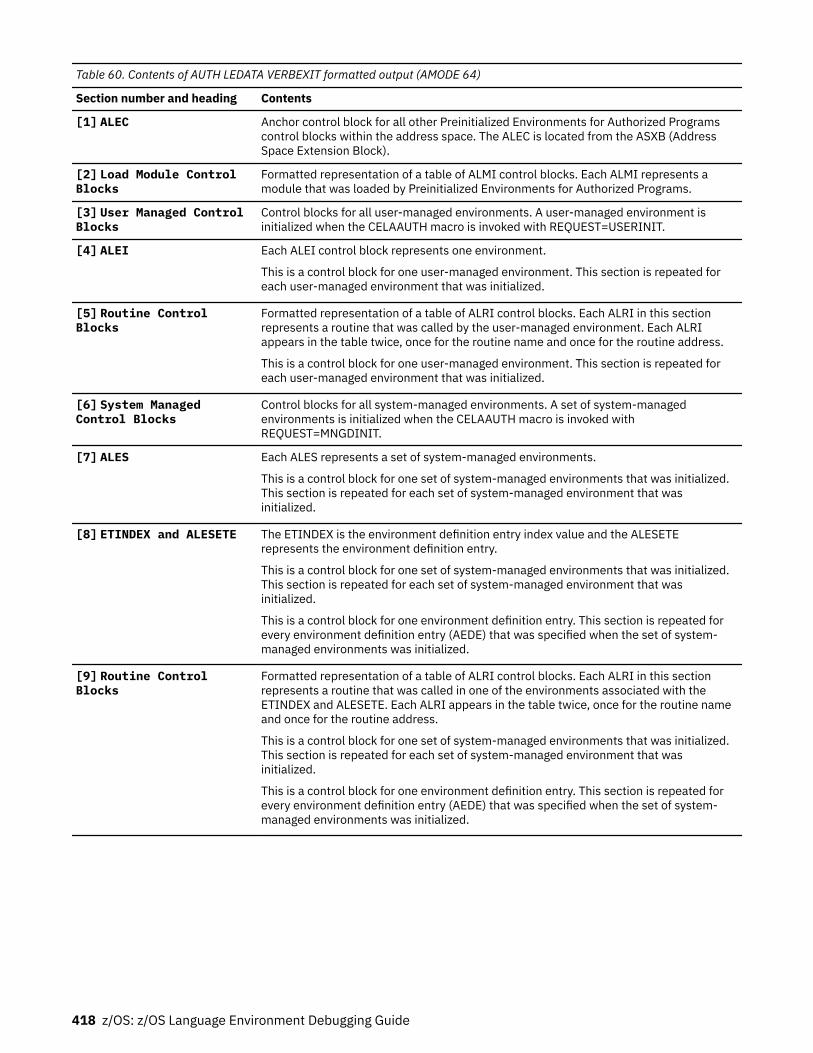
Table 60. Contents of AUTH LEDATA VERBEXIT formatted output (AMODE 64)
Section number and heading Contents
[1] ALEC Anchor control block for all other Preinitialized Environments for Authorized Programscontrol blocks within the address space. The ALEC is located from the ASXB (AddressSpace Extension Block).
[2] Load Module ControlBlocks
Formatted representation of a table of ALMI control blocks. Each ALMI represents amodule that was loaded by Preinitialized Environments for Authorized Programs.
[3] User Managed ControlBlocks
Control blocks for all user-managed environments. A user-managed environment isinitialized when the CELAAUTH macro is invoked with REQUEST=USERINIT.
[4] ALEI Each ALEI control block represents one environment.
This is a control block for one user-managed environment. This section is repeated foreach user-managed environment that was initialized.
[5] Routine ControlBlocks
Formatted representation of a table of ALRI control blocks. Each ALRI in this sectionrepresents a routine that was called by the user-managed environment. Each ALRIappears in the table twice, once for the routine name and once for the routine address.
This is a control block for one user-managed environment. This section is repeated foreach user-managed environment that was initialized.
[6] System ManagedControl Blocks
Control blocks for all system-managed environments. A set of system-managedenvironments is initialized when the CELAAUTH macro is invoked withREQUEST=MNGDINIT.
[7] ALES Each ALES represents a set of system-managed environments.
This is a control block for one set of system-managed environments that was initialized.This section is repeated for each set of system-managed environment that wasinitialized.
[8] ETINDEX and ALESETE The ETINDEX is the environment definition entry index value and the ALESETErepresents the environment definition entry.
This is a control block for one set of system-managed environments that was initialized.This section is repeated for each set of system-managed environment that wasinitialized.
This is a control block for one environment definition entry. This section is repeated forevery environment definition entry (AEDE) that was specified when the set of system-managed environments was initialized.
[9] Routine ControlBlocks
Formatted representation of a table of ALRI control blocks. Each ALRI in this sectionrepresents a routine that was called in one of the environments associated with theETINDEX and ALESETE. Each ALRI appears in the table twice, once for the routine nameand once for the routine address.
This is a control block for one set of system-managed environments that was initialized.This section is repeated for each set of system-managed environment that wasinitialized.
This is a control block for one environment definition entry. This section is repeated forevery environment definition entry (AEDE) that was specified when the set of system-managed environments was initialized.
418 z/OS: z/OS Language Environment Debugging Guide
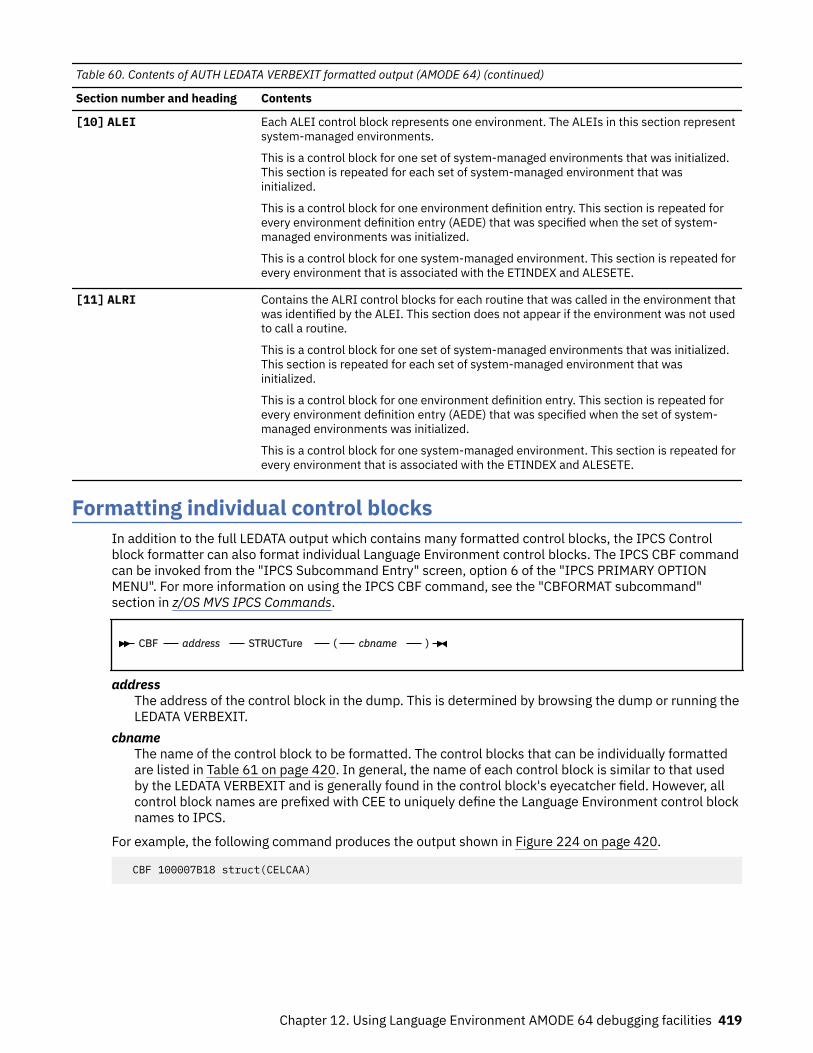
Table 60. Contents of AUTH LEDATA VERBEXIT formatted output (AMODE 64) (continued)
Section number and heading Contents
[10] ALEI Each ALEI control block represents one environment. The ALEIs in this section representsystem-managed environments.
This is a control block for one set of system-managed environments that was initialized.This section is repeated for each set of system-managed environment that wasinitialized.
This is a control block for one environment definition entry. This section is repeated forevery environment definition entry (AEDE) that was specified when the set of system-managed environments was initialized.
This is a control block for one system-managed environment. This section is repeated forevery environment that is associated with the ETINDEX and ALESETE.
[11] ALRI Contains the ALRI control blocks for each routine that was called in the environment thatwas identified by the ALEI. This section does not appear if the environment was not usedto call a routine.
This is a control block for one set of system-managed environments that was initialized.This section is repeated for each set of system-managed environment that wasinitialized.
This is a control block for one environment definition entry. This section is repeated forevery environment definition entry (AEDE) that was specified when the set of system-managed environments was initialized.
This is a control block for one system-managed environment. This section is repeated forevery environment that is associated with the ETINDEX and ALESETE.
Formatting individual control blocksIn addition to the full LEDATA output which contains many formatted control blocks, the IPCS Controlblock formatter can also format individual Language Environment control blocks. The IPCS CBF commandcan be invoked from the "IPCS Subcommand Entry" screen, option 6 of the "IPCS PRIMARY OPTIONMENU". For more information on using the IPCS CBF command, see the "CBFORMAT subcommand"section in z/OS MVS IPCS Commands.
CBF address STRUCTure ( cbname )
addressThe address of the control block in the dump. This is determined by browsing the dump or running theLEDATA VERBEXIT.
cbnameThe name of the control block to be formatted. The control blocks that can be individually formattedare listed in Table 61 on page 420. In general, the name of each control block is similar to that usedby the LEDATA VERBEXIT and is generally found in the control block's eyecatcher field. However, allcontrol block names are prefixed with CEE to uniquely define the Language Environment control blocknames to IPCS.
For example, the following command produces the output shown in Figure 224 on page 420.
CBF 100007B18 struct(CELCAA)
Chapter 12. Using Language Environment AMODE 64 debugging facilities 419
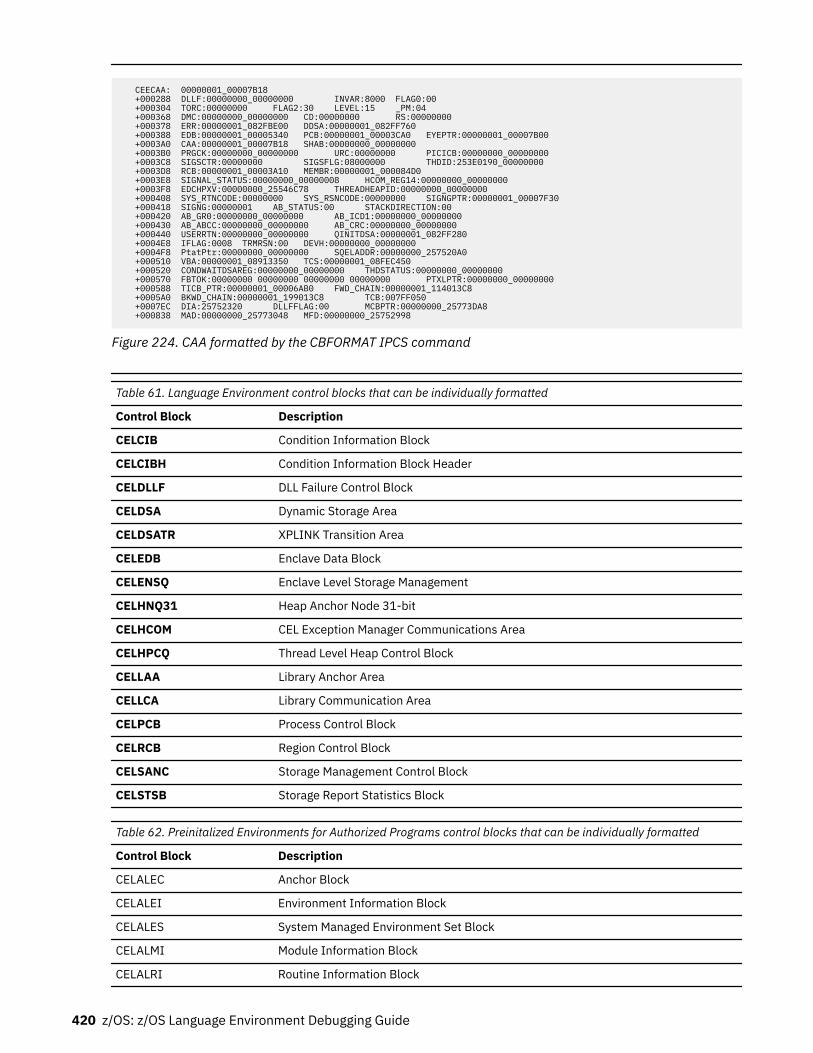
CEECAA: 00000001_00007B18 +000288 DLLF:00000000_00000000 INVAR:8000 FLAG0:00 +000304 TORC:00000000 FLAG2:30 LEVEL:15 _PM:04 +000368 DMC:00000000_00000000 CD:00000000 RS:00000000 +000378 ERR:00000001_082FBE00 DDSA:00000001_082FF760 +000388 EDB:00000001_00005340 PCB:00000001_00003CA0 EYEPTR:00000001_00007B00 +0003A0 CAA:00000001_00007B18 SHAB:00000000_00000000 +0003B0 PRGCK:00000000_00000000 URC:00000000 PICICB:00000000_00000000 +0003C8 SIGSCTR:00000000 SIGSFLG:08000000 THDID:253E0190_00000000 +0003D8 RCB:00000001_00003A10 MEMBR:00000001_000084D0 +0003E8 SIGNAL_STATUS:00000000_00000008 HCOM_REG14:00000000_00000000 +0003F8 EDCHPXV:00000000_25546C78 THREADHEAPID:00000000_00000000 +000408 SYS_RTNCODE:00000000 SYS_RSNCODE:00000000 SIGNGPTR:00000001_00007F30 +000418 SIGNG:00000001 AB_STATUS:00 STACKDIRECTION:00 +000420 AB_GR0:00000000_00000000 AB_ICD1:00000000_00000000 +000430 AB_ABCC:00000000_00000000 AB_CRC:00000000_00000000 +000440 USERRTN:00000000_00000000 QINITDSA:00000001_082FF280 +0004E8 IFLAG:0008 TRMRSN:00 DEVH:00000000_00000000 +0004F8 PtatPtr:00000000_00000000 SQELADDR:00000000_257520A0 +000510 VBA:00000001_08913350 TCS:00000001_08FEC450 +000520 CONDWAITDSAREG:00000000_00000000 THDSTATUS:00000000_00000000 +000570 FBTOK:00000000 00000000 00000000 00000000 PTXLPTR:00000000_00000000 +000588 TICB_PTR:00000001_00006AB0 FWD_CHAIN:00000001_114013C8 +0005A0 BKWD_CHAIN:00000001_199013C8 TCB:007FF050 +0007EC DIA:25752320 DLLFFLAG:00 MCBPTR:00000000_25773DA8 +000838 MAD:00000000_25773048 MFD:00000000_25752998
Figure 224. CAA formatted by the CBFORMAT IPCS command
Table 61. Language Environment control blocks that can be individually formatted
Control Block Description
CELCIB Condition Information Block
CELCIBH Condition Information Block Header
CELDLLF DLL Failure Control Block
CELDSA Dynamic Storage Area
CELDSATR XPLINK Transition Area
CELEDB Enclave Data Block
CELENSQ Enclave Level Storage Management
CELHNQ31 Heap Anchor Node 31-bit
CELHCOM CEL Exception Manager Communications Area
CELHPCQ Thread Level Heap Control Block
CELLAA Library Anchor Area
CELLCA Library Communication Area
CELPCB Process Control Block
CELRCB Region Control Block
CELSANC Storage Management Control Block
CELSTSB Storage Report Statistics Block
Table 62. Preinitalized Environments for Authorized Programs control blocks that can be individually formatted
Control Block Description
CELALEC Anchor Block
CELALEI Environment Information Block
CELALES System Managed Environment Set Block
CELALMI Module Information Block
CELALRI Routine Information Block
420 z/OS: z/OS Language Environment Debugging Guide
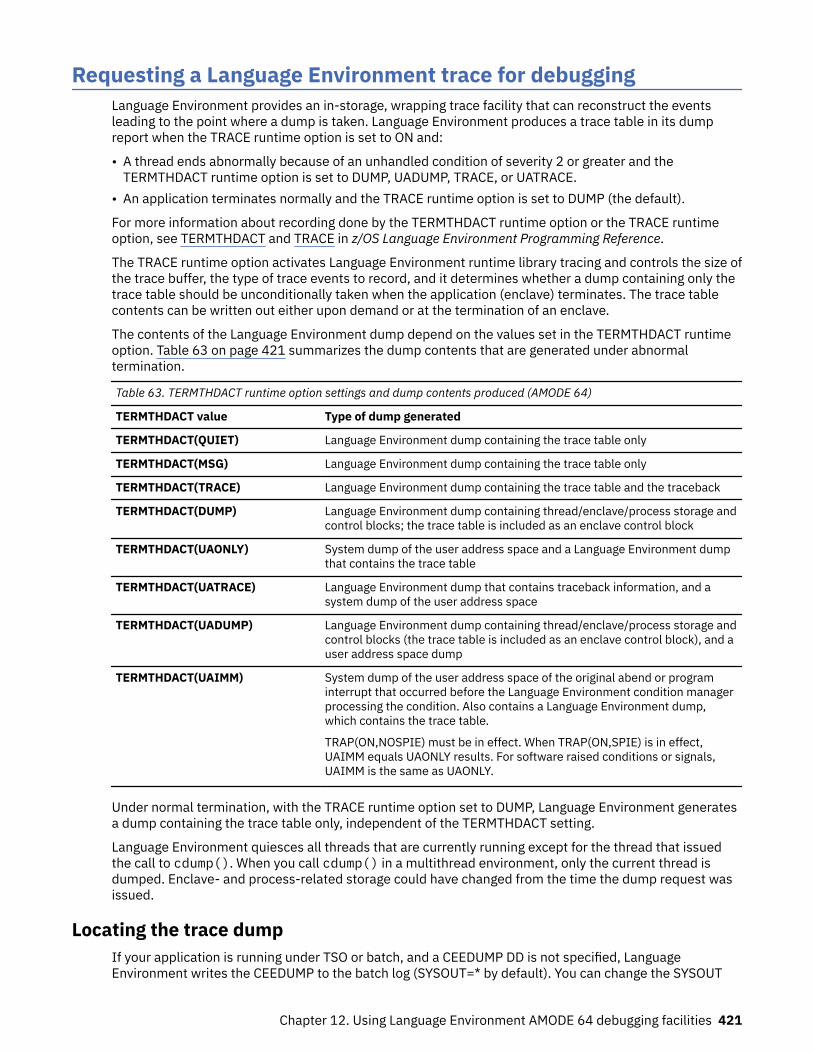
Requesting a Language Environment trace for debuggingLanguage Environment provides an in-storage, wrapping trace facility that can reconstruct the eventsleading to the point where a dump is taken. Language Environment produces a trace table in its dumpreport when the TRACE runtime option is set to ON and:
• A thread ends abnormally because of an unhandled condition of severity 2 or greater and theTERMTHDACT runtime option is set to DUMP, UADUMP, TRACE, or UATRACE.
• An application terminates normally and the TRACE runtime option is set to DUMP (the default).
For more information about recording done by the TERMTHDACT runtime option or the TRACE runtimeoption, see TERMTHDACT and TRACE in z/OS Language Environment Programming Reference.
The TRACE runtime option activates Language Environment runtime library tracing and controls the size ofthe trace buffer, the type of trace events to record, and it determines whether a dump containing only thetrace table should be unconditionally taken when the application (enclave) terminates. The trace tablecontents can be written out either upon demand or at the termination of an enclave.
The contents of the Language Environment dump depend on the values set in the TERMTHDACT runtimeoption. Table 63 on page 421 summarizes the dump contents that are generated under abnormaltermination.
Table 63. TERMTHDACT runtime option settings and dump contents produced (AMODE 64)
TERMTHDACT value Type of dump generated
TERMTHDACT(QUIET) Language Environment dump containing the trace table only
TERMTHDACT(MSG) Language Environment dump containing the trace table only
TERMTHDACT(TRACE) Language Environment dump containing the trace table and the traceback
TERMTHDACT(DUMP) Language Environment dump containing thread/enclave/process storage andcontrol blocks; the trace table is included as an enclave control block
TERMTHDACT(UAONLY) System dump of the user address space and a Language Environment dumpthat contains the trace table
TERMTHDACT(UATRACE) Language Environment dump that contains traceback information, and asystem dump of the user address space
TERMTHDACT(UADUMP) Language Environment dump containing thread/enclave/process storage andcontrol blocks (the trace table is included as an enclave control block), and auser address space dump
TERMTHDACT(UAIMM) System dump of the user address space of the original abend or programinterrupt that occurred before the Language Environment condition managerprocessing the condition. Also contains a Language Environment dump,which contains the trace table.
TRAP(ON,NOSPIE) must be in effect. When TRAP(ON,SPIE) is in effect,UAIMM equals UAONLY results. For software raised conditions or signals,UAIMM is the same as UAONLY.
Under normal termination, with the TRACE runtime option set to DUMP, Language Environment generatesa dump containing the trace table only, independent of the TERMTHDACT setting.
Language Environment quiesces all threads that are currently running except for the thread that issuedthe call to cdump(). When you call cdump() in a multithread environment, only the current thread isdumped. Enclave- and process-related storage could have changed from the time the dump request wasissued.
Locating the trace dumpIf your application is running under TSO or batch, and a CEEDUMP DD is not specified, LanguageEnvironment writes the CEEDUMP to the batch log (SYSOUT=* by default). You can change the SYSOUT
Chapter 12. Using Language Environment AMODE 64 debugging facilities 421
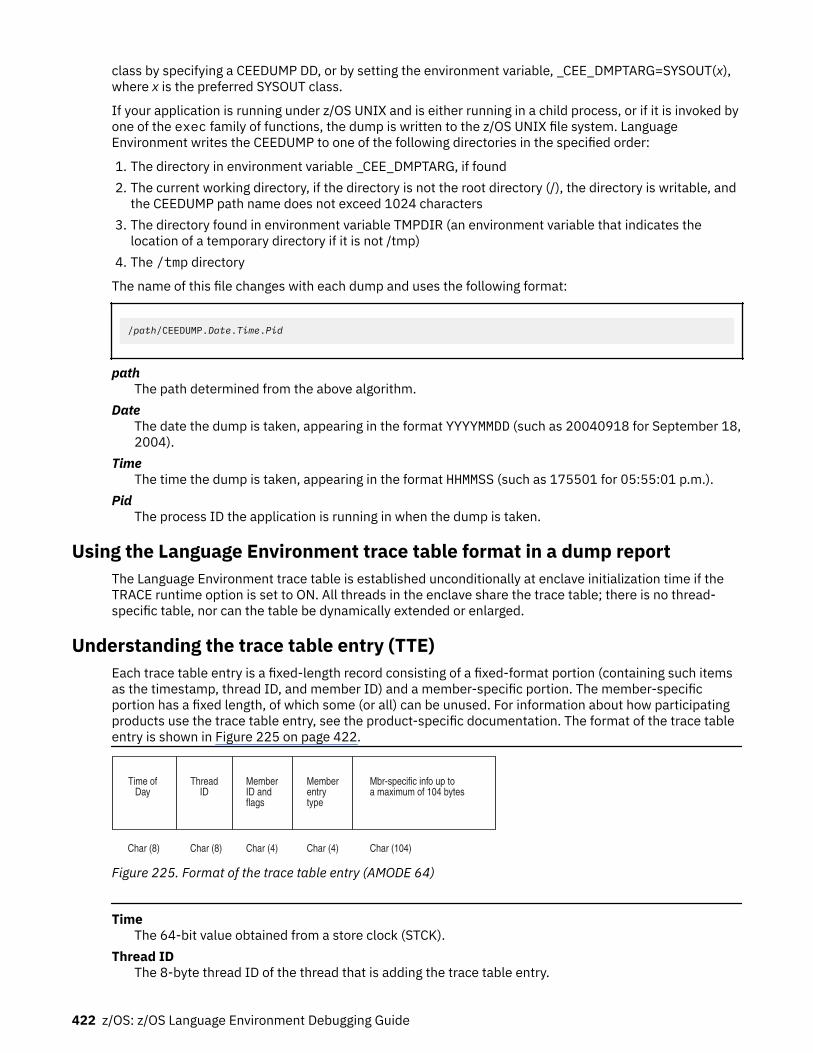
class by specifying a CEEDUMP DD, or by setting the environment variable, _CEE_DMPTARG=SYSOUT(x),where x is the preferred SYSOUT class.
If your application is running under z/OS UNIX and is either running in a child process, or if it is invoked byone of the exec family of functions, the dump is written to the z/OS UNIX file system. LanguageEnvironment writes the CEEDUMP to one of the following directories in the specified order:
1. The directory in environment variable _CEE_DMPTARG, if found2. The current working directory, if the directory is not the root directory (/), the directory is writable, and
the CEEDUMP path name does not exceed 1024 characters3. The directory found in environment variable TMPDIR (an environment variable that indicates the
location of a temporary directory if it is not /tmp)4. The /tmp directory
The name of this file changes with each dump and uses the following format:
/path/CEEDUMP.Date.Time.Pid
pathThe path determined from the above algorithm.
DateThe date the dump is taken, appearing in the format YYYYMMDD (such as 20040918 for September 18,2004).
TimeThe time the dump is taken, appearing in the format HHMMSS (such as 175501 for 05:55:01 p.m.).
PidThe process ID the application is running in when the dump is taken.
Using the Language Environment trace table format in a dump reportThe Language Environment trace table is established unconditionally at enclave initialization time if theTRACE runtime option is set to ON. All threads in the enclave share the trace table; there is no thread-specific table, nor can the table be dynamically extended or enlarged.
Understanding the trace table entry (TTE)Each trace table entry is a fixed-length record consisting of a fixed-format portion (containing such itemsas the timestamp, thread ID, and member ID) and a member-specific portion. The member-specificportion has a fixed length, of which some (or all) can be unused. For information about how participatingproducts use the trace table entry, see the product-specific documentation. The format of the trace tableentry is shown in Figure 225 on page 422.
Char (104)Char (4)Char (4)Char (8)Char (8)
Mbr-specific info up toa maximum of 104 bytes
Memberentrytype
MemberID andflags
ThreadID
Time ofDay
Figure 225. Format of the trace table entry (AMODE 64)
TimeThe 64-bit value obtained from a store clock (STCK).
Thread IDThe 8-byte thread ID of the thread that is adding the trace table entry.
422 z/OS: z/OS Language Environment Debugging Guide
Member ID and FlagsContains 2 fields:Member ID
The 1-byte member ID of the member making the trace table entry, as follows:ID
Name01
CEL03
C/C++08
Reserved11
Enterprise PL/I12
SocketsFlags
24 flags reserved for internal use.Member Entry Type
A number that indicates the type of the member-specific trace information that follows the field. Touniquely identify the information contained in a specific TTE, you must consider Member ID as well asMember Entry Type.
Member-Specific InformationBased on the member ID and the member entry type, this field contains the specific information forthe entry, up to 104 bytes. For C/C++, the entry type of 1 is a record that records an invocation of abase C runtime library function. The entry consists of the name of the invoking function and the nameof the invoked function. Entry type 2 is a record that records the return from the base library function.It contains the returned value and the value of errno.
Member-specific information in the trace table entryGlobal tracing is activated by using the LE=n suboption of the TRACE runtime option. This requests allLanguage Environment members to generate trace records in the trace table. The settings for the globaltrace events are:Level
Description0
No global trace1
Trace all runtime library (RTL) function entry and exits2
Trace all RTL mutex init/destroy and lock/unlock3
Trace all RTL function entry and exits, and all mutex init/destroy and lock/unlock8
Trace all RTL storage allocation/deallocation
When LE=1 is specifiedTable 64 on page 424 shows the C/C++ records that may be generated. For a detailed description of theserecords, see “C/C++ contents of the Language Environment trace tables” on page 449.
Chapter 12. Using Language Environment AMODE 64 debugging facilities 423
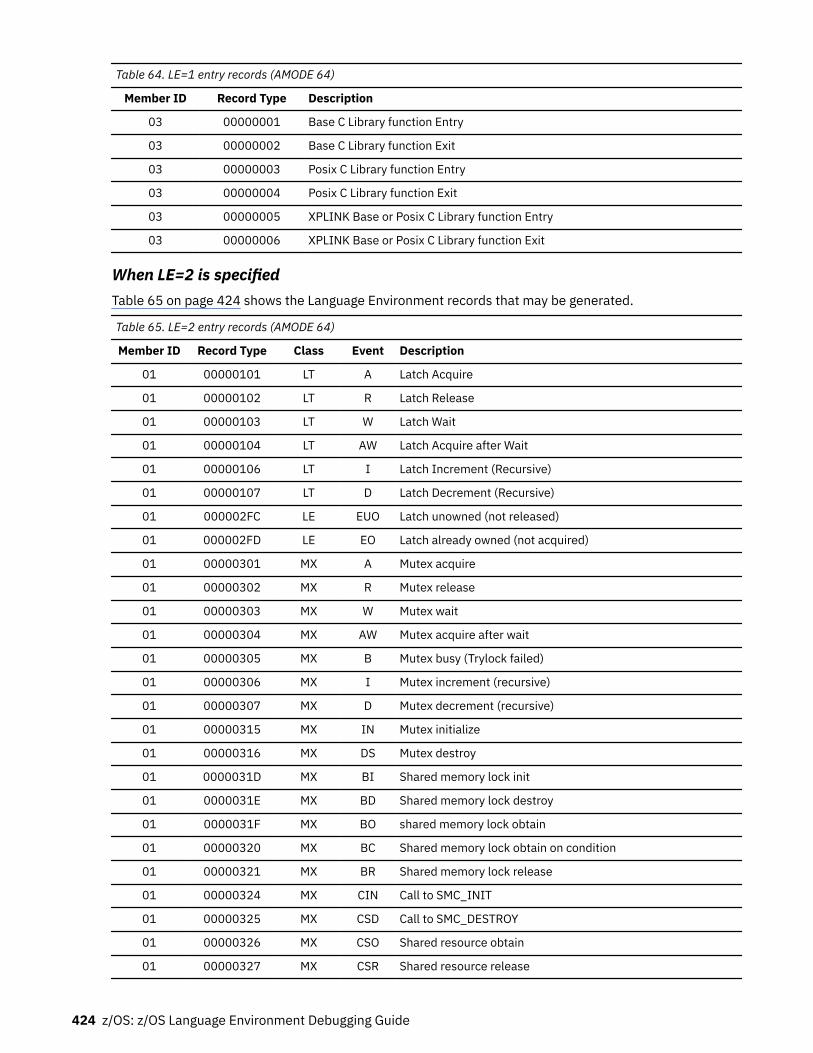
Table 64. LE=1 entry records (AMODE 64)
Member ID Record Type Description
03 00000001 Base C Library function Entry
03 00000002 Base C Library function Exit
03 00000003 Posix C Library function Entry
03 00000004 Posix C Library function Exit
03 00000005 XPLINK Base or Posix C Library function Entry
03 00000006 XPLINK Base or Posix C Library function Exit
When LE=2 is specifiedTable 65 on page 424 shows the Language Environment records that may be generated.
Table 65. LE=2 entry records (AMODE 64)
Member ID Record Type Class Event Description
01 00000101 LT A Latch Acquire
01 00000102 LT R Latch Release
01 00000103 LT W Latch Wait
01 00000104 LT AW Latch Acquire after Wait
01 00000106 LT I Latch Increment (Recursive)
01 00000107 LT D Latch Decrement (Recursive)
01 000002FC LE EUO Latch unowned (not released)
01 000002FD LE EO Latch already owned (not acquired)
01 00000301 MX A Mutex acquire
01 00000302 MX R Mutex release
01 00000303 MX W Mutex wait
01 00000304 MX AW Mutex acquire after wait
01 00000305 MX B Mutex busy (Trylock failed)
01 00000306 MX I Mutex increment (recursive)
01 00000307 MX D Mutex decrement (recursive)
01 00000315 MX IN Mutex initialize
01 00000316 MX DS Mutex destroy
01 0000031D MX BI Shared memory lock init
01 0000031E MX BD Shared memory lock destroy
01 0000031F MX BO shared memory lock obtain
01 00000320 MX BC Shared memory lock obtain on condition
01 00000321 MX BR Shared memory lock release
01 00000324 MX CIN Call to SMC_INIT
01 00000325 MX CSD Call to SMC_DESTROY
01 00000326 MX CSO Shared resource obtain
01 00000327 MX CSR Shared resource release
424 z/OS: z/OS Language Environment Debugging Guide
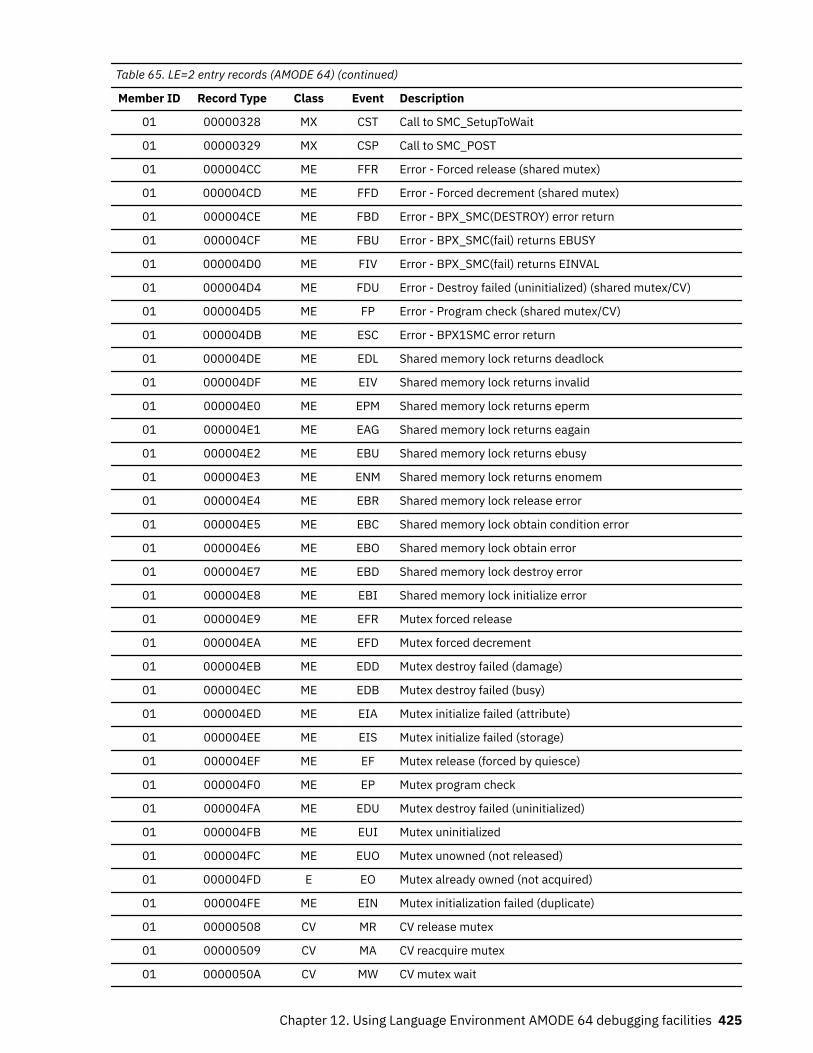
Table 65. LE=2 entry records (AMODE 64) (continued)
Member ID Record Type Class Event Description
01 00000328 MX CST Call to SMC_SetupToWait
01 00000329 MX CSP Call to SMC_POST
01 000004CC ME FFR Error - Forced release (shared mutex)
01 000004CD ME FFD Error - Forced decrement (shared mutex)
01 000004CE ME FBD Error - BPX_SMC(DESTROY) error return
01 000004CF ME FBU Error - BPX_SMC(fail) returns EBUSY
01 000004D0 ME FIV Error - BPX_SMC(fail) returns EINVAL
01 000004D4 ME FDU Error - Destroy failed (uninitialized) (shared mutex/CV)
01 000004D5 ME FP Error - Program check (shared mutex/CV)
01 000004DB ME ESC Error - BPX1SMC error return
01 000004DE ME EDL Shared memory lock returns deadlock
01 000004DF ME EIV Shared memory lock returns invalid
01 000004E0 ME EPM Shared memory lock returns eperm
01 000004E1 ME EAG Shared memory lock returns eagain
01 000004E2 ME EBU Shared memory lock returns ebusy
01 000004E3 ME ENM Shared memory lock returns enomem
01 000004E4 ME EBR Shared memory lock release error
01 000004E5 ME EBC Shared memory lock obtain condition error
01 000004E6 ME EBO Shared memory lock obtain error
01 000004E7 ME EBD Shared memory lock destroy error
01 000004E8 ME EBI Shared memory lock initialize error
01 000004E9 ME EFR Mutex forced release
01 000004EA ME EFD Mutex forced decrement
01 000004EB ME EDD Mutex destroy failed (damage)
01 000004EC ME EDB Mutex destroy failed (busy)
01 000004ED ME EIA Mutex initialize failed (attribute)
01 000004EE ME EIS Mutex initialize failed (storage)
01 000004EF ME EF Mutex release (forced by quiesce)
01 000004F0 ME EP Mutex program check
01 000004FA ME EDU Mutex destroy failed (uninitialized)
01 000004FB ME EUI Mutex uninitialized
01 000004FC ME EUO Mutex unowned (not released)
01 000004FD E EO Mutex already owned (not acquired)
01 000004FE ME EIN Mutex initialization failed (duplicate)
01 00000508 CV MR CV release mutex
01 00000509 CV MA CV reacquire mutex
01 0000050A CV MW CV mutex wait
Chapter 12. Using Language Environment AMODE 64 debugging facilities 425
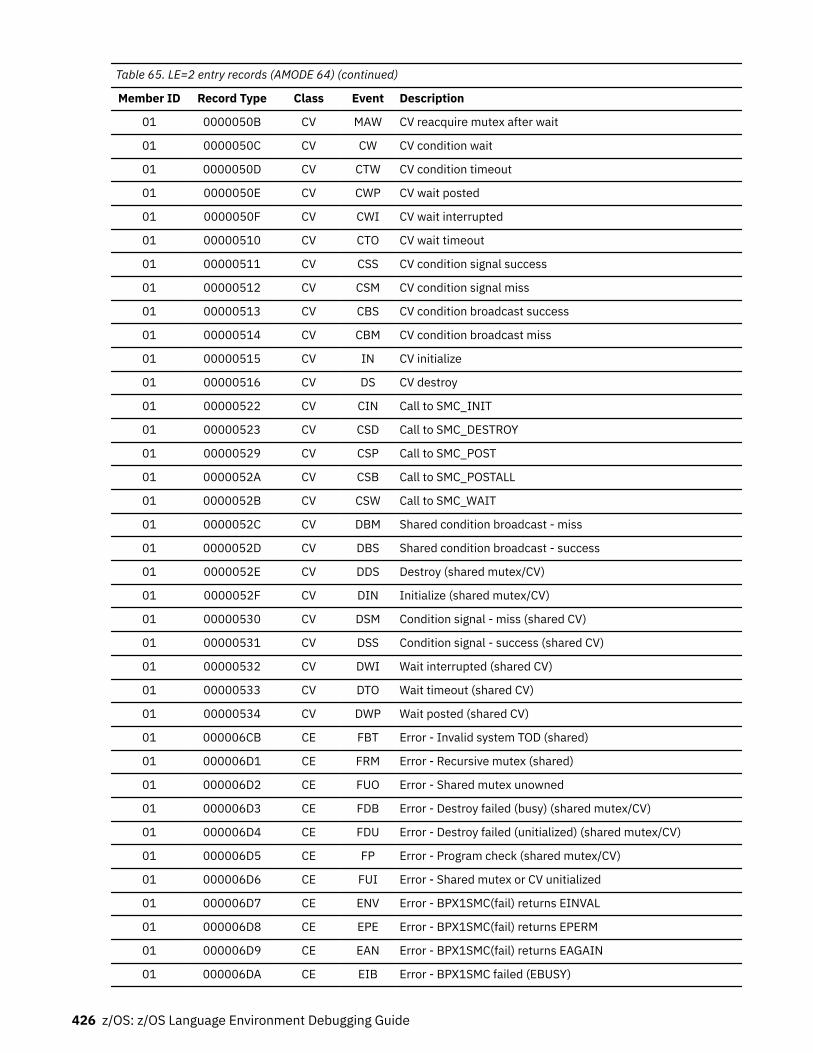
Table 65. LE=2 entry records (AMODE 64) (continued)
Member ID Record Type Class Event Description
01 0000050B CV MAW CV reacquire mutex after wait
01 0000050C CV CW CV condition wait
01 0000050D CV CTW CV condition timeout
01 0000050E CV CWP CV wait posted
01 0000050F CV CWI CV wait interrupted
01 00000510 CV CTO CV wait timeout
01 00000511 CV CSS CV condition signal success
01 00000512 CV CSM CV condition signal miss
01 00000513 CV CBS CV condition broadcast success
01 00000514 CV CBM CV condition broadcast miss
01 00000515 CV IN CV initialize
01 00000516 CV DS CV destroy
01 00000522 CV CIN Call to SMC_INIT
01 00000523 CV CSD Call to SMC_DESTROY
01 00000529 CV CSP Call to SMC_POST
01 0000052A CV CSB Call to SMC_POSTALL
01 0000052B CV CSW Call to SMC_WAIT
01 0000052C CV DBM Shared condition broadcast - miss
01 0000052D CV DBS Shared condition broadcast - success
01 0000052E CV DDS Destroy (shared mutex/CV)
01 0000052F CV DIN Initialize (shared mutex/CV)
01 00000530 CV DSM Condition signal - miss (shared CV)
01 00000531 CV DSS Condition signal - success (shared CV)
01 00000532 CV DWI Wait interrupted (shared CV)
01 00000533 CV DTO Wait timeout (shared CV)
01 00000534 CV DWP Wait posted (shared CV)
01 000006CB CE FBT Error - Invalid system TOD (shared)
01 000006D1 CE FRM Error - Recursive mutex (shared)
01 000006D2 CE FUO Error - Shared mutex unowned
01 000006D3 CE FDB Error - Destroy failed (busy) (shared mutex/CV)
01 000006D4 CE FDU Error - Destroy failed (unitialized) (shared mutex/CV)
01 000006D5 CE FP Error - Program check (shared mutex/CV)
01 000006D6 CE FUI Error - Shared mutex or CV unitialized
01 000006D7 CE ENV Error - BPX1SMC(fail) returns EINVAL
01 000006D8 CE EPE Error - BPX1SMC(fail) returns EPERM
01 000006D9 CE EAN Error - BPX1SMC(fail) returns EAGAIN
01 000006DA CE EIB Error - BPX1SMC failed (EBUSY)
426 z/OS: z/OS Language Environment Debugging Guide
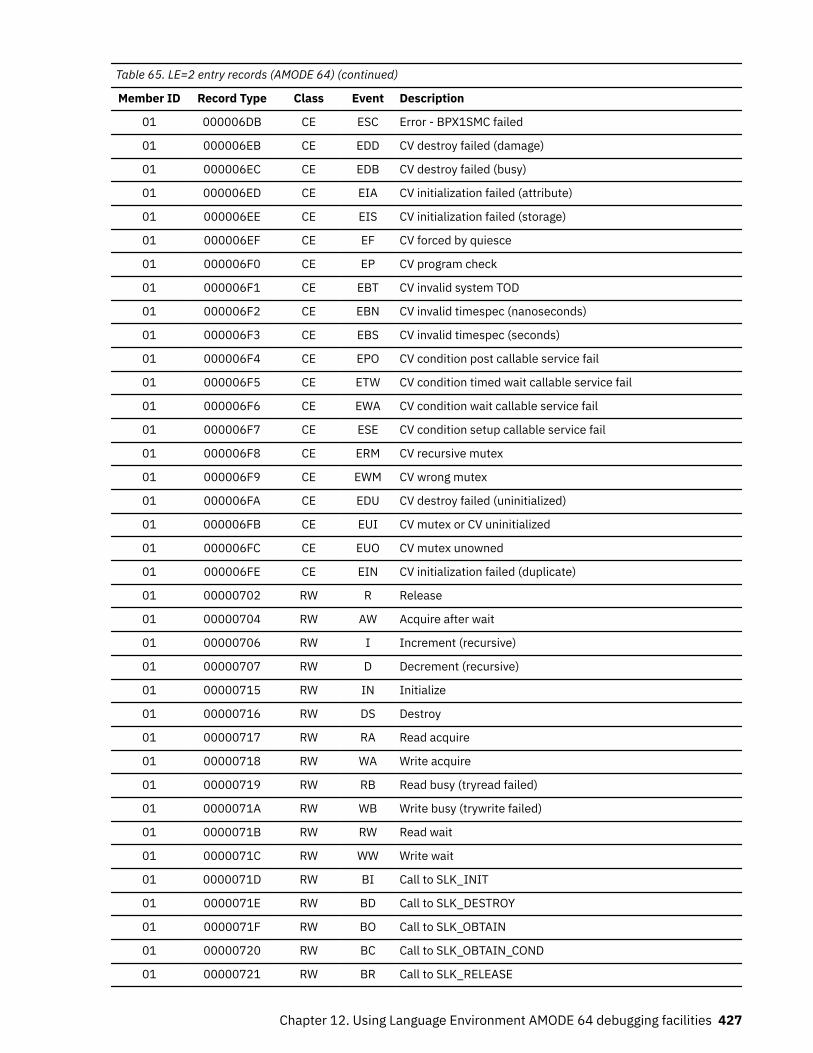
Table 65. LE=2 entry records (AMODE 64) (continued)
Member ID Record Type Class Event Description
01 000006DB CE ESC Error - BPX1SMC failed
01 000006EB CE EDD CV destroy failed (damage)
01 000006EC CE EDB CV destroy failed (busy)
01 000006ED CE EIA CV initialization failed (attribute)
01 000006EE CE EIS CV initialization failed (storage)
01 000006EF CE EF CV forced by quiesce
01 000006F0 CE EP CV program check
01 000006F1 CE EBT CV invalid system TOD
01 000006F2 CE EBN CV invalid timespec (nanoseconds)
01 000006F3 CE EBS CV invalid timespec (seconds)
01 000006F4 CE EPO CV condition post callable service fail
01 000006F5 CE ETW CV condition timed wait callable service fail
01 000006F6 CE EWA CV condition wait callable service fail
01 000006F7 CE ESE CV condition setup callable service fail
01 000006F8 CE ERM CV recursive mutex
01 000006F9 CE EWM CV wrong mutex
01 000006FA CE EDU CV destroy failed (uninitialized)
01 000006FB CE EUI CV mutex or CV uninitialized
01 000006FC CE EUO CV mutex unowned
01 000006FE CE EIN CV initialization failed (duplicate)
01 00000702 RW R Release
01 00000704 RW AW Acquire after wait
01 00000706 RW I Increment (recursive)
01 00000707 RW D Decrement (recursive)
01 00000715 RW IN Initialize
01 00000716 RW DS Destroy
01 00000717 RW RA Read acquire
01 00000718 RW WA Write acquire
01 00000719 RW RB Read busy (tryread failed)
01 0000071A RW WB Write busy (trywrite failed)
01 0000071B RW RW Read wait
01 0000071C RW WW Write wait
01 0000071D RW BI Call to SLK_INIT
01 0000071E RW BD Call to SLK_DESTROY
01 0000071F RW BO Call to SLK_OBTAIN
01 00000720 RW BC Call to SLK_OBTAIN_COND
01 00000721 RW BR Call to SLK_RELEASE
Chapter 12. Using Language Environment AMODE 64 debugging facilities 427
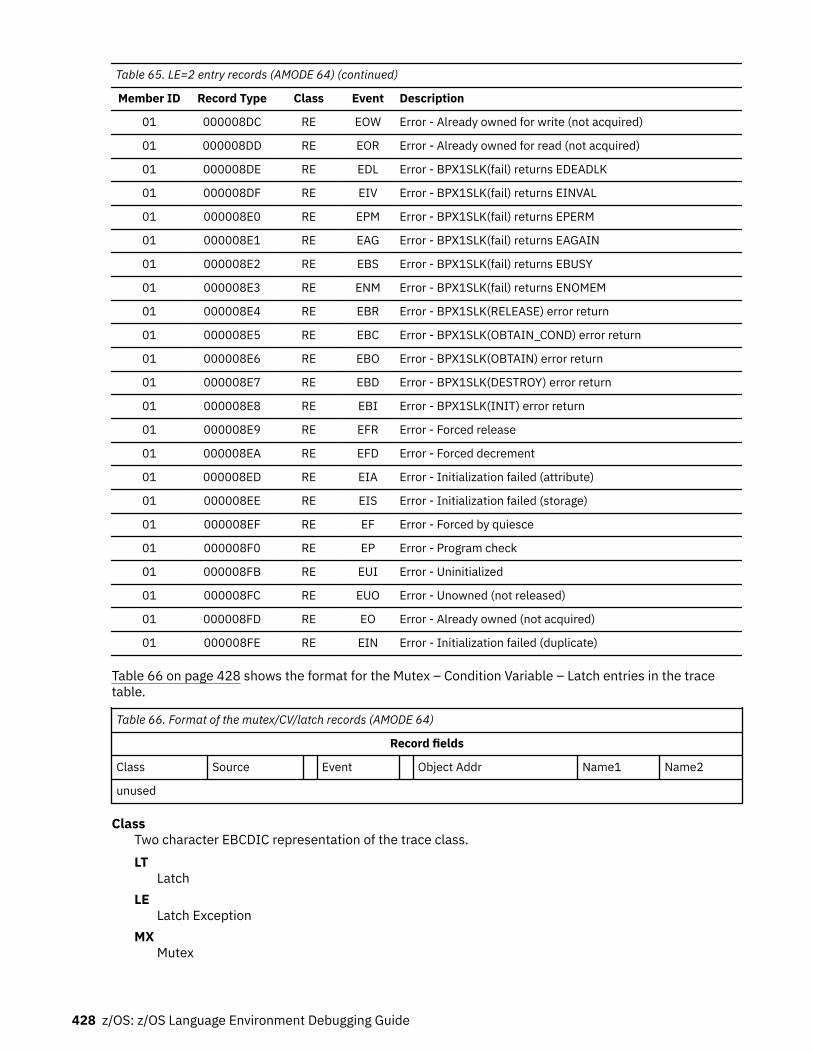
Table 65. LE=2 entry records (AMODE 64) (continued)
Member ID Record Type Class Event Description
01 000008DC RE EOW Error - Already owned for write (not acquired)
01 000008DD RE EOR Error - Already owned for read (not acquired)
01 000008DE RE EDL Error - BPX1SLK(fail) returns EDEADLK
01 000008DF RE EIV Error - BPX1SLK(fail) returns EINVAL
01 000008E0 RE EPM Error - BPX1SLK(fail) returns EPERM
01 000008E1 RE EAG Error - BPX1SLK(fail) returns EAGAIN
01 000008E2 RE EBS Error - BPX1SLK(fail) returns EBUSY
01 000008E3 RE ENM Error - BPX1SLK(fail) returns ENOMEM
01 000008E4 RE EBR Error - BPX1SLK(RELEASE) error return
01 000008E5 RE EBC Error - BPX1SLK(OBTAIN_COND) error return
01 000008E6 RE EBO Error - BPX1SLK(OBTAIN) error return
01 000008E7 RE EBD Error - BPX1SLK(DESTROY) error return
01 000008E8 RE EBI Error - BPX1SLK(INIT) error return
01 000008E9 RE EFR Error - Forced release
01 000008EA RE EFD Error - Forced decrement
01 000008ED RE EIA Error - Initialization failed (attribute)
01 000008EE RE EIS Error - Initialization failed (storage)
01 000008EF RE EF Error - Forced by quiesce
01 000008F0 RE EP Error - Program check
01 000008FB RE EUI Error - Uninitialized
01 000008FC RE EUO Error - Unowned (not released)
01 000008FD RE EO Error - Already owned (not acquired)
01 000008FE RE EIN Error - Initialization failed (duplicate)
Table 66 on page 428 shows the format for the Mutex – Condition Variable – Latch entries in the tracetable.
Table 66. Format of the mutex/CV/latch records (AMODE 64)
Record fields
Class Source Event Object Addr Name1 Name2
unused
ClassTwo character EBCDIC representation of the trace class.LT
LatchLE
Latch ExceptionMX
Mutex
428 z/OS: z/OS Language Environment Debugging Guide
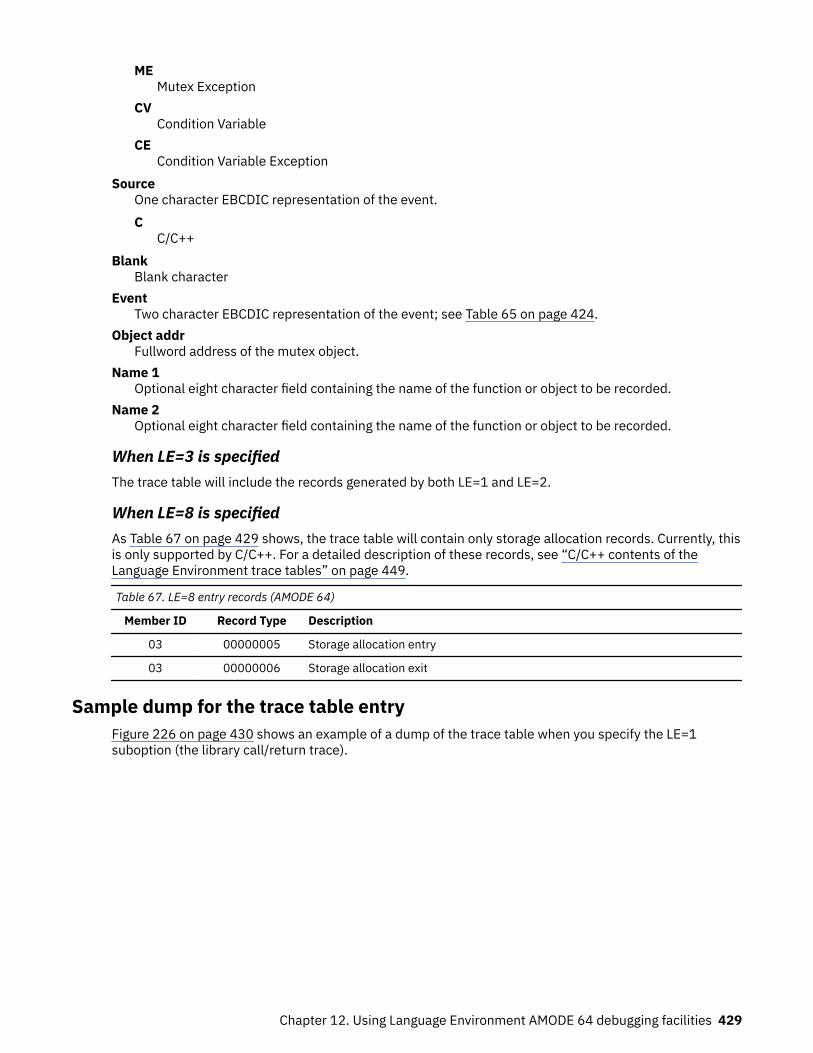
MEMutex Exception
CVCondition Variable
CECondition Variable Exception
SourceOne character EBCDIC representation of the event.C
C/C++Blank
Blank characterEvent
Two character EBCDIC representation of the event; see Table 65 on page 424.Object addr
Fullword address of the mutex object.Name 1
Optional eight character field containing the name of the function or object to be recorded.Name 2
Optional eight character field containing the name of the function or object to be recorded.
When LE=3 is specifiedThe trace table will include the records generated by both LE=1 and LE=2.
When LE=8 is specifiedAs Table 67 on page 429 shows, the trace table will contain only storage allocation records. Currently, thisis only supported by C/C++. For a detailed description of these records, see “C/C++ contents of theLanguage Environment trace tables” on page 449.
Table 67. LE=8 entry records (AMODE 64)
Member ID Record Type Description
03 00000005 Storage allocation entry
03 00000006 Storage allocation exit
Sample dump for the trace table entryFigure 226 on page 430 shows an example of a dump of the trace table when you specify the LE=1suboption (the library call/return trace).
Chapter 12. Using Language Environment AMODE 64 debugging facilities 429
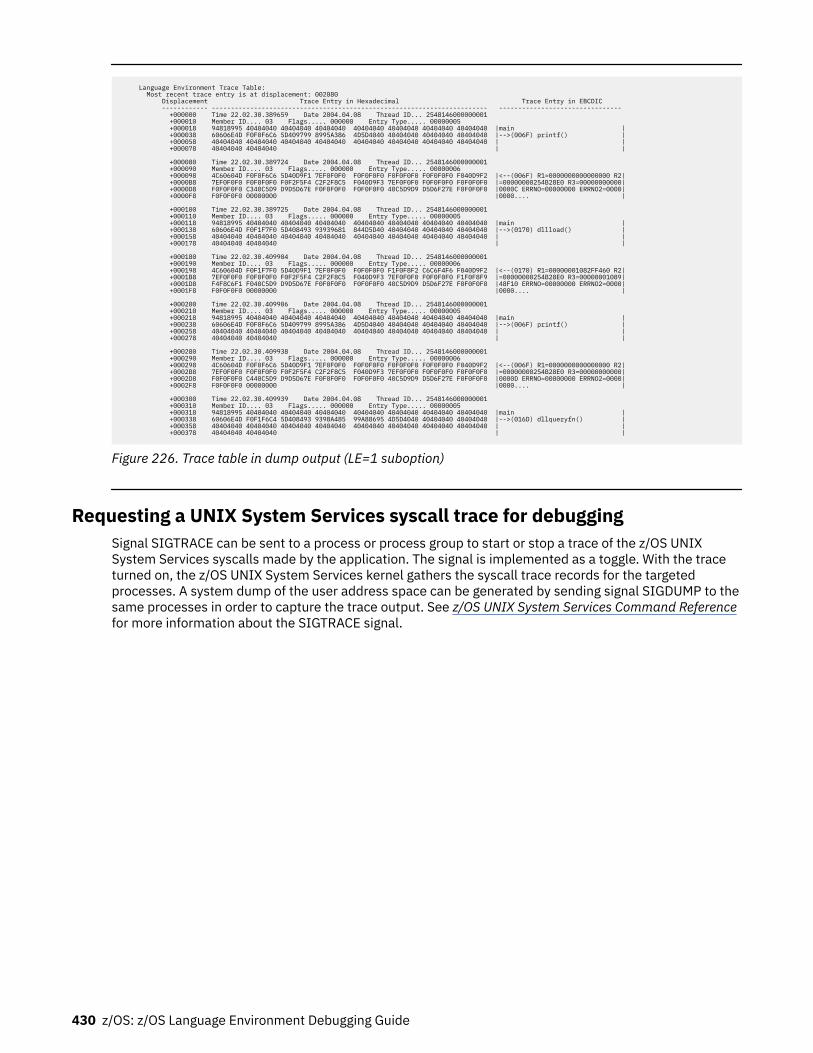
Language Environment Trace Table: Most recent trace entry is at displacement: 002080 Displacement Trace Entry in Hexadecimal Trace Entry in EBCDIC ------------ ------------------------------------------------------------------------ -------------------------------- +000000 Time 22.02.30.389659 Date 2004.04.08 Thread ID... 2548146000000001 +000010 Member ID.... 03 Flags..... 000000 Entry Type..... 00000005 +000018 94818995 40404040 40404040 40404040 40404040 40404040 40404040 40404040 |main | +000038 60606E4D F0F0F6C6 5D409799 8995A386 4D5D4040 40404040 40404040 40404040 |-->(006F) printf() | +000058 40404040 40404040 40404040 40404040 40404040 40404040 40404040 40404040 | | +000078 40404040 40404040 | |
+000080 Time 22.02.30.389724 Date 2004.04.08 Thread ID... 2548146000000001 +000090 Member ID.... 03 Flags..... 000000 Entry Type..... 00000006 +000098 4C60604D F0F0F6C6 5D40D9F1 7EF0F0F0 F0F0F0F0 F0F0F0F0 F0F0F0F0 F040D9F2 |<--(006F) R1=0000000000000000 R2| +0000B8 7EF0F0F0 F0F0F0F0 F0F2F5F4 C2F2F8C5 F040D9F3 7EF0F0F0 F0F0F0F0 F0F0F0F0 |=00000000254B28E0 R3=00000000000| +0000D8 F0F0F0F0 C340C5D9 D9D5D67E F0F0F0F0 F0F0F0F0 40C5D9D9 D5D6F27E F0F0F0F0 |0000C ERRNO=00000000 ERRNO2=0000| +0000F8 F0F0F0F0 00000000 |0000.... |
+000100 Time 22.02.30.389725 Date 2004.04.08 Thread ID... 2548146000000001 +000110 Member ID.... 03 Flags..... 000000 Entry Type..... 00000005 +000118 94818995 40404040 40404040 40404040 40404040 40404040 40404040 40404040 |main | +000138 60606E4D F0F1F7F0 5D408493 93939681 844D5D40 40404040 40404040 40404040 |-->(0170) dllload() | +000158 40404040 40404040 40404040 40404040 40404040 40404040 40404040 40404040 | | +000178 40404040 40404040 | |
+000180 Time 22.02.30.409904 Date 2004.04.08 Thread ID... 2548146000000001 +000190 Member ID.... 03 Flags..... 000000 Entry Type..... 00000006 +000198 4C60604D F0F1F7F0 5D40D9F1 7EF0F0F0 F0F0F0F0 F1F0F8F2 C6C6F4F6 F040D9F2 |<--(0170) R1=00000001082FF460 R2| +0001B8 7EF0F0F0 F0F0F0F0 F0F2F5F4 C2F2F8C5 F040D9F3 7EF0F0F0 F0F0F0F0 F1F0F8F9 |=00000000254B28E0 R3=00000001089| +0001D8 F4F8C6F1 F040C5D9 D9D5D67E F0F0F0F0 F0F0F0F0 40C5D9D9 D5D6F27E F0F0F0F0 |48F10 ERRNO=00000000 ERRNO2=0000| +0001F8 F0F0F0F0 00000000 |0000.... |
+000200 Time 22.02.30.409906 Date 2004.04.08 Thread ID... 2548146000000001 +000210 Member ID.... 03 Flags..... 000000 Entry Type..... 00000005 +000218 94818995 40404040 40404040 40404040 40404040 40404040 40404040 40404040 |main | +000238 60606E4D F0F0F6C6 5D409799 8995A386 4D5D4040 40404040 40404040 40404040 |-->(006F) printf() | +000258 40404040 40404040 40404040 40404040 40404040 40404040 40404040 40404040 | | +000278 40404040 40404040 | |
+000280 Time 22.02.30.409938 Date 2004.04.08 Thread ID... 2548146000000001 +000290 Member ID.... 03 Flags..... 000000 Entry Type..... 00000006 +000298 4C60604D F0F0F6C6 5D40D9F1 7EF0F0F0 F0F0F0F0 F0F0F0F0 F0F0F0F0 F040D9F2 |<--(006F) R1=0000000000000000 R2| +0002B8 7EF0F0F0 F0F0F0F0 F0F2F5F4 C2F2F8C5 F040D9F3 7EF0F0F0 F0F0F0F0 F0F0F0F0 |=00000000254B28E0 R3=00000000000| +0002D8 F0F0F0F0 C440C5D9 D9D5D67E F0F0F0F0 F0F0F0F0 40C5D9D9 D5D6F27E F0F0F0F0 |0000D ERRNO=00000000 ERRNO2=0000| +0002F8 F0F0F0F0 00000000 |0000.... |
+000300 Time 22.02.30.409939 Date 2004.04.08 Thread ID... 2548146000000001 +000310 Member ID.... 03 Flags..... 000000 Entry Type..... 00000005 +000318 94818995 40404040 40404040 40404040 40404040 40404040 40404040 40404040 |main | +000338 60606E4D F0F1F6C4 5D408493 9398A485 99A88695 4D5D4040 40404040 40404040 |-->(016D) dllqueryfn() | +000358 40404040 40404040 40404040 40404040 40404040 40404040 40404040 40404040 | | +000378 40404040 40404040 | |
Figure 226. Trace table in dump output (LE=1 suboption)
Requesting a UNIX System Services syscall trace for debuggingSignal SIGTRACE can be sent to a process or process group to start or stop a trace of the z/OS UNIXSystem Services syscalls made by the application. The signal is implemented as a toggle. With the traceturned on, the z/OS UNIX System Services kernel gathers the syscall trace records for the targetedprocesses. A system dump of the user address space can be generated by sending signal SIGDUMP to thesame processes in order to capture the trace output. See z/OS UNIX System Services Command Referencefor more information about the SIGTRACE signal.
430 z/OS: z/OS Language Environment Debugging Guide
Chapter 13. Debugging AMODE 64 C/C++ routines
This section provides specific information to help you debug AMODE 64 applications that contain one ormore C/C++ routines. It includes the following topics:
• Debugging C/C++ I/O routines• Using XL C/C++ compiler listings• Generating a Language Environment dump of a C/C++ routine• Finding C/C++ information in a Language Environment dump• Debugging example of C/C++ routines
There are several debugging features that are unique to C/C++ routines. Before examining the C/C++techniques to find errors, you might want to consider the following areas of potential problems:
• To prevent errors that may result from differences in LP64 default argument types, include functionprototypes for all C/C++ function calls. For C/C++ runtime library functions, see Library functions in z/OSXL C/C++ Runtime Library Reference.
Note: malloc() is an example of a RTL function which needs this prototype to work correctly in LP64applications.
• If you are using the fetch() function, see fetch() in z/OS XL C/C++ Programming Guide to ensure thatyou are creating the fetchable module correctly.
• If you are using DLLs, see Building and using Dynamic Link Libraries (DLLs) in z/OS XL C/C++Programming Guide to ensure that you are using the DLL correctly.
• Ensure that the entry point of the load module is CELQSTRT. • If you suspect that you are using uninitialized storage, you may want to use the STORAGE runtime
option.• You should avoid:
– Incorrect casting– Referencing an array element with a subscript outside the declared bounds– Copying a string to a target with a shorter length than the source string– Declaring but not initializing a pointer variable, or using a pointer to allocated storage that has already
been freed
If a routine exception occurred and you need more information than the condition handler provided, runyour routine with the following runtime options, TRAP(ON, NOSPIE) and TERMTHDACT(UAIMM). Settingthese runtime options generates a system dump of the user address space of the original abend orprogram interrupt prior to the Language Environment condition manager processing the condition. Afterthe system dump is taken by the operating system the Language Environment condition managercontinues processing.
Debugging C/C++ programsYou can use C/C++ conventions such as __amrc and perror() when you debug C/C++ programs.
Using the __amrc and __amrc2 structures to debug input/output__amrc, a structure defined in stdio.h, can help you determine the cause of errors resulting from an I/Ooperation, because it contains diagnostic information (for example, the return code from a failed VSAMoperation). There are two structures:
• __amrc (defined by type __amrc_type
© Copyright IBM Corp. 1991, 2020 431
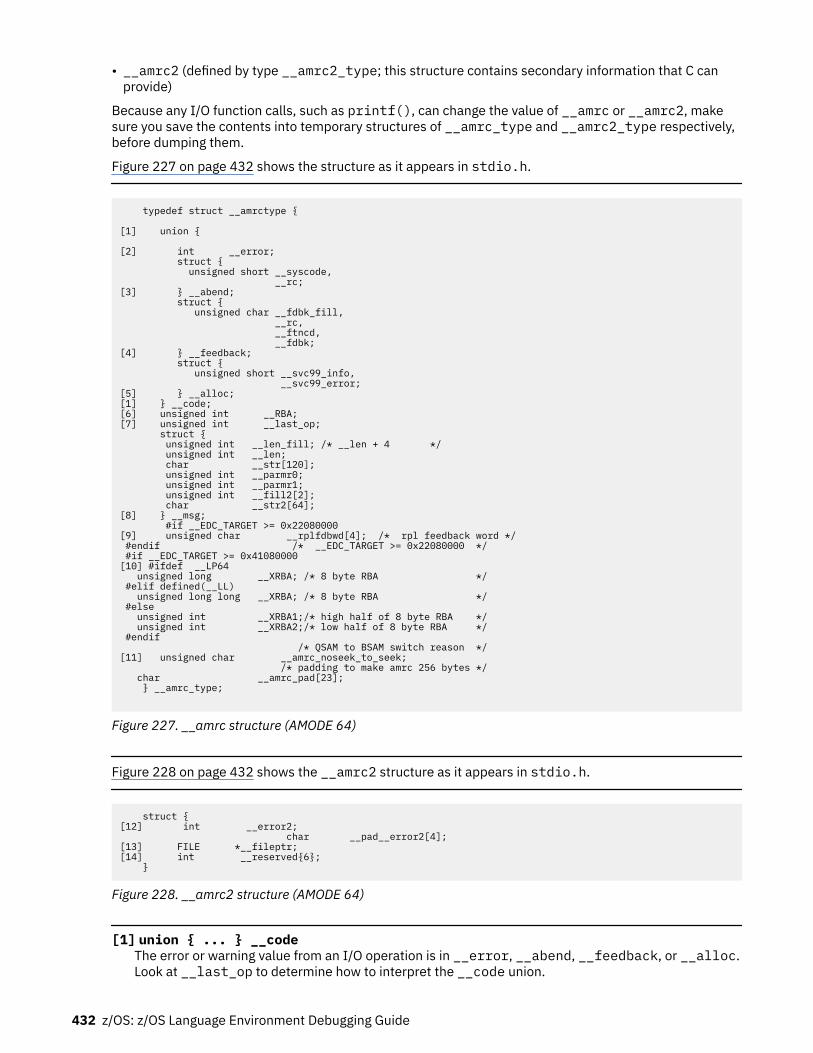
• __amrc2 (defined by type __amrc2_type; this structure contains secondary information that C canprovide)
Because any I/O function calls, such as printf(), can change the value of __amrc or __amrc2, makesure you save the contents into temporary structures of __amrc_type and __amrc2_type respectively,before dumping them.
Figure 227 on page 432 shows the structure as it appears in stdio.h.
typedef struct __amrctype {
[1] union {
[2] int __error; struct { unsigned short __syscode, __rc;[3] } __abend; struct { unsigned char __fdbk_fill, __rc, __ftncd, __fdbk;[4] } __feedback; struct { unsigned short __svc99_info, __svc99_error;[5] } __alloc;[1] } __code;[6] unsigned int __RBA;[7] unsigned int __last_op; struct { unsigned int __len_fill; /* __len + 4 */ unsigned int __len; char __str[120]; unsigned int __parmr0; unsigned int __parmr1; unsigned int __fill2[2]; char __str2[64];[8] } __msg; #if __EDC_TARGET >= 0x22080000[9] unsigned char __rplfdbwd[4]; /* rpl feedback word */ #endif /* __EDC_TARGET >= 0x22080000 */ #if __EDC_TARGET >= 0x41080000 [10] #ifdef __LP64 unsigned long __XRBA; /* 8 byte RBA */ #elif defined(__LL) unsigned long long __XRBA; /* 8 byte RBA */ #else unsigned int __XRBA1;/* high half of 8 byte RBA */ unsigned int __XRBA2;/* low half of 8 byte RBA */ #endif /* QSAM to BSAM switch reason */[11] unsigned char __amrc_noseek_to_seek; /* padding to make amrc 256 bytes */ char __amrc_pad[23]; } __amrc_type;
Figure 227. __amrc structure (AMODE 64)
Figure 228 on page 432 shows the __amrc2 structure as it appears in stdio.h.
struct {[12] int __error2; char __pad__error2[4];[13] FILE *__fileptr;[14] int __reserved{6}; }
Figure 228. __amrc2 structure (AMODE 64)
[1] union { ... } __codeThe error or warning value from an I/O operation is in __error, __abend, __feedback, or __alloc.Look at __last_op to determine how to interpret the __code union.
432 z/OS: z/OS Language Environment Debugging Guide
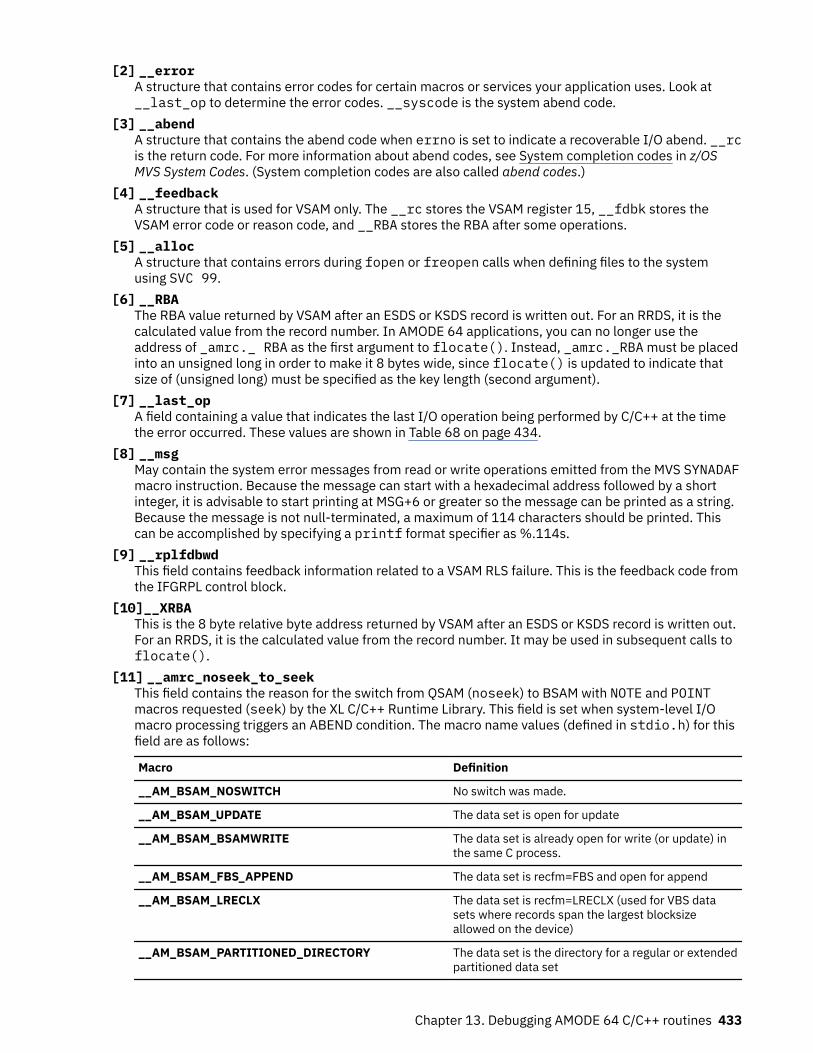
[2] __errorA structure that contains error codes for certain macros or services your application uses. Look at__last_op to determine the error codes. __syscode is the system abend code.
[3] __abendA structure that contains the abend code when errno is set to indicate a recoverable I/O abend. __rcis the return code. For more information about abend codes, see System completion codes in z/OSMVS System Codes. (System completion codes are also called abend codes.)
[4] __feedbackA structure that is used for VSAM only. The __rc stores the VSAM register 15, __fdbk stores theVSAM error code or reason code, and __RBA stores the RBA after some operations.
[5] __allocA structure that contains errors during fopen or freopen calls when defining files to the systemusing SVC 99.
[6] __RBAThe RBA value returned by VSAM after an ESDS or KSDS record is written out. For an RRDS, it is thecalculated value from the record number. In AMODE 64 applications, you can no longer use theaddress of _amrc._ RBA as the first argument to flocate(). Instead, _amrc._RBA must be placedinto an unsigned long in order to make it 8 bytes wide, since flocate() is updated to indicate thatsize of (unsigned long) must be specified as the key length (second argument).
[7] __last_opA field containing a value that indicates the last I/O operation being performed by C/C++ at the timethe error occurred. These values are shown in Table 68 on page 434.
[8] __msgMay contain the system error messages from read or write operations emitted from the MVS SYNADAFmacro instruction. Because the message can start with a hexadecimal address followed by a shortinteger, it is advisable to start printing at MSG+6 or greater so the message can be printed as a string.Because the message is not null-terminated, a maximum of 114 characters should be printed. Thiscan be accomplished by specifying a printf format specifier as %.114s.
[9] __rplfdbwdThis field contains feedback information related to a VSAM RLS failure. This is the feedback code fromthe IFGRPL control block.
[10]__XRBAThis is the 8 byte relative byte address returned by VSAM after an ESDS or KSDS record is written out.For an RRDS, it is the calculated value from the record number. It may be used in subsequent calls toflocate().
[11] __amrc_noseek_to_seekThis field contains the reason for the switch from QSAM (noseek) to BSAM with NOTE and POINTmacros requested (seek) by the XL C/C++ Runtime Library. This field is set when system-level I/Omacro processing triggers an ABEND condition. The macro name values (defined in stdio.h) for thisfield are as follows:
Macro Definition
__AM_BSAM_NOSWITCH No switch was made.
__AM_BSAM_UPDATE The data set is open for update
__AM_BSAM_BSAMWRITE The data set is already open for write (or update) inthe same C process.
__AM_BSAM_FBS_APPEND The data set is recfm=FBS and open for append
__AM_BSAM_LRECLX The data set is recfm=LRECLX (used for VBS datasets where records span the largest blocksizeallowed on the device)
__AM_BSAM_PARTITIONED_DIRECTORY The data set is the directory for a regular or extendedpartitioned data set
Chapter 13. Debugging AMODE 64 C/C++ routines 433
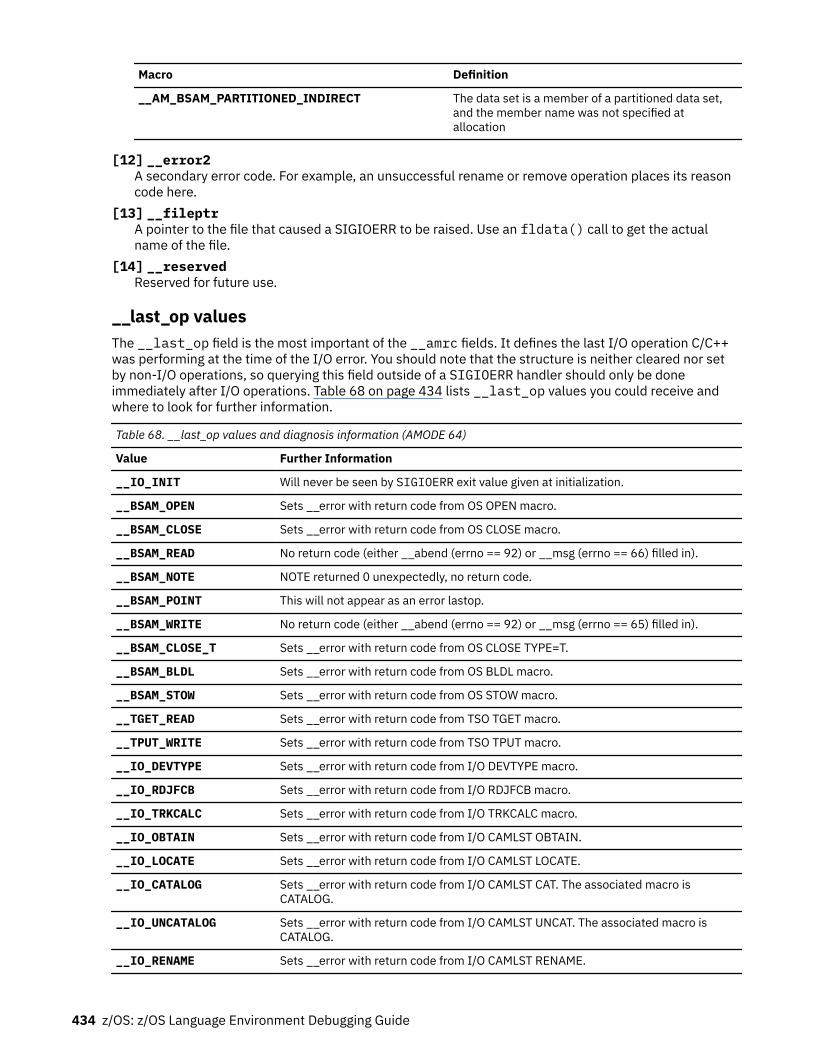
Macro Definition
__AM_BSAM_PARTITIONED_INDIRECT The data set is a member of a partitioned data set,and the member name was not specified atallocation
[12] __error2A secondary error code. For example, an unsuccessful rename or remove operation places its reasoncode here.
[13] __fileptrA pointer to the file that caused a SIGIOERR to be raised. Use an fldata() call to get the actualname of the file.
[14] __reservedReserved for future use.
__last_op valuesThe __last_op field is the most important of the __amrc fields. It defines the last I/O operation C/C++was performing at the time of the I/O error. You should note that the structure is neither cleared nor setby non-I/O operations, so querying this field outside of a SIGIOERR handler should only be doneimmediately after I/O operations. Table 68 on page 434 lists __last_op values you could receive andwhere to look for further information.
Table 68. __last_op values and diagnosis information (AMODE 64)
Value Further Information
__IO_INIT Will never be seen by SIGIOERR exit value given at initialization.
__BSAM_OPEN Sets __error with return code from OS OPEN macro.
__BSAM_CLOSE Sets __error with return code from OS CLOSE macro.
__BSAM_READ No return code (either __abend (errno == 92) or __msg (errno == 66) filled in).
__BSAM_NOTE NOTE returned 0 unexpectedly, no return code.
__BSAM_POINT This will not appear as an error lastop.
__BSAM_WRITE No return code (either __abend (errno == 92) or __msg (errno == 65) filled in).
__BSAM_CLOSE_T Sets __error with return code from OS CLOSE TYPE=T.
__BSAM_BLDL Sets __error with return code from OS BLDL macro.
__BSAM_STOW Sets __error with return code from OS STOW macro.
__TGET_READ Sets __error with return code from TSO TGET macro.
__TPUT_WRITE Sets __error with return code from TSO TPUT macro.
__IO_DEVTYPE Sets __error with return code from I/O DEVTYPE macro.
__IO_RDJFCB Sets __error with return code from I/O RDJFCB macro.
__IO_TRKCALC Sets __error with return code from I/O TRKCALC macro.
__IO_OBTAIN Sets __error with return code from I/O CAMLST OBTAIN.
__IO_LOCATE Sets __error with return code from I/O CAMLST LOCATE.
__IO_CATALOG Sets __error with return code from I/O CAMLST CAT. The associated macro isCATALOG.
__IO_UNCATALOG Sets __error with return code from I/O CAMLST UNCAT. The associated macro isCATALOG.
__IO_RENAME Sets __error with return code from I/O CAMLST RENAME.
434 z/OS: z/OS Language Environment Debugging Guide
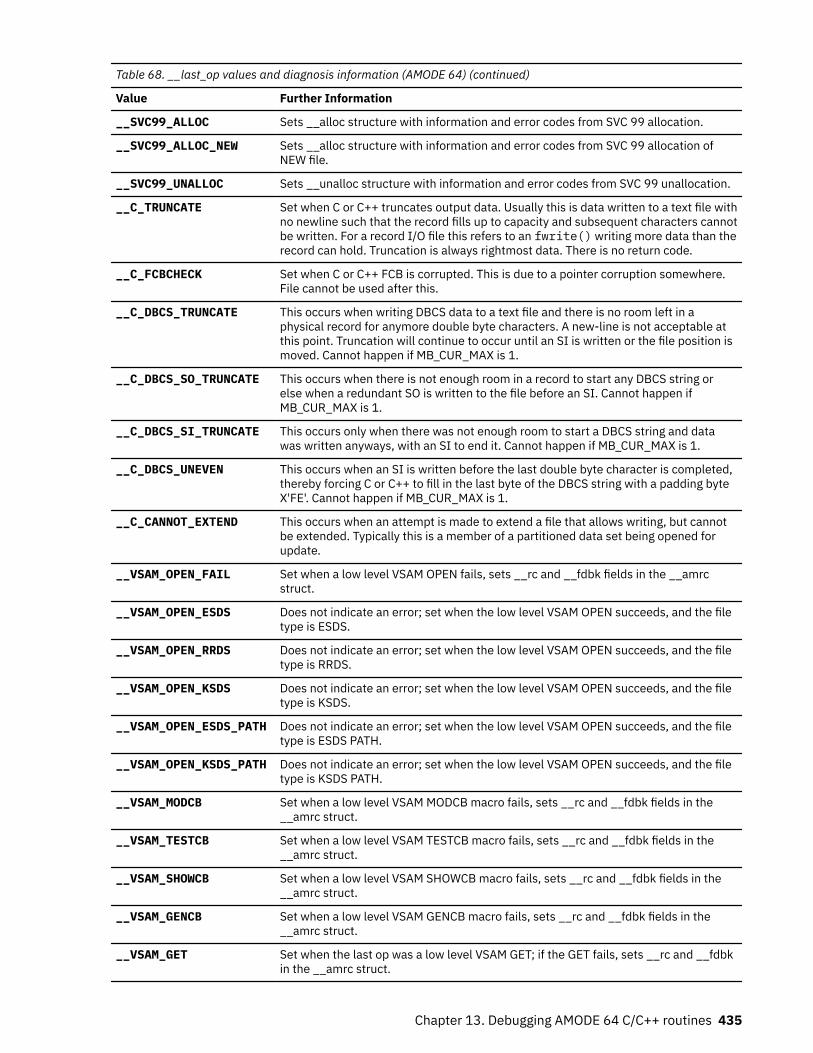
Table 68. __last_op values and diagnosis information (AMODE 64) (continued)
Value Further Information
__SVC99_ALLOC Sets __alloc structure with information and error codes from SVC 99 allocation.
__SVC99_ALLOC_NEW Sets __alloc structure with information and error codes from SVC 99 allocation ofNEW file.
__SVC99_UNALLOC Sets __unalloc structure with information and error codes from SVC 99 unallocation.
__C_TRUNCATE Set when C or C++ truncates output data. Usually this is data written to a text file withno newline such that the record fills up to capacity and subsequent characters cannotbe written. For a record I/O file this refers to an fwrite() writing more data than therecord can hold. Truncation is always rightmost data. There is no return code.
__C_FCBCHECK Set when C or C++ FCB is corrupted. This is due to a pointer corruption somewhere.File cannot be used after this.
__C_DBCS_TRUNCATE This occurs when writing DBCS data to a text file and there is no room left in aphysical record for anymore double byte characters. A new-line is not acceptable atthis point. Truncation will continue to occur until an SI is written or the file position ismoved. Cannot happen if MB_CUR_MAX is 1.
__C_DBCS_SO_TRUNCATE This occurs when there is not enough room in a record to start any DBCS string orelse when a redundant SO is written to the file before an SI. Cannot happen ifMB_CUR_MAX is 1.
__C_DBCS_SI_TRUNCATE This occurs only when there was not enough room to start a DBCS string and datawas written anyways, with an SI to end it. Cannot happen if MB_CUR_MAX is 1.
__C_DBCS_UNEVEN This occurs when an SI is written before the last double byte character is completed,thereby forcing C or C++ to fill in the last byte of the DBCS string with a padding byteX'FE'. Cannot happen if MB_CUR_MAX is 1.
__C_CANNOT_EXTEND This occurs when an attempt is made to extend a file that allows writing, but cannotbe extended. Typically this is a member of a partitioned data set being opened forupdate.
__VSAM_OPEN_FAIL Set when a low level VSAM OPEN fails, sets __rc and __fdbk fields in the __amrcstruct.
__VSAM_OPEN_ESDS Does not indicate an error; set when the low level VSAM OPEN succeeds, and the filetype is ESDS.
__VSAM_OPEN_RRDS Does not indicate an error; set when the low level VSAM OPEN succeeds, and the filetype is RRDS.
__VSAM_OPEN_KSDS Does not indicate an error; set when the low level VSAM OPEN succeeds, and the filetype is KSDS.
__VSAM_OPEN_ESDS_PATH Does not indicate an error; set when the low level VSAM OPEN succeeds, and the filetype is ESDS PATH.
__VSAM_OPEN_KSDS_PATH Does not indicate an error; set when the low level VSAM OPEN succeeds, and the filetype is KSDS PATH.
__VSAM_MODCB Set when a low level VSAM MODCB macro fails, sets __rc and __fdbk fields in the__amrc struct.
__VSAM_TESTCB Set when a low level VSAM TESTCB macro fails, sets __rc and __fdbk fields in the__amrc struct.
__VSAM_SHOWCB Set when a low level VSAM SHOWCB macro fails, sets __rc and __fdbk fields in the__amrc struct.
__VSAM_GENCB Set when a low level VSAM GENCB macro fails, sets __rc and __fdbk fields in the__amrc struct.
__VSAM_GET Set when the last op was a low level VSAM GET; if the GET fails, sets __rc and __fdbkin the __amrc struct.
Chapter 13. Debugging AMODE 64 C/C++ routines 435
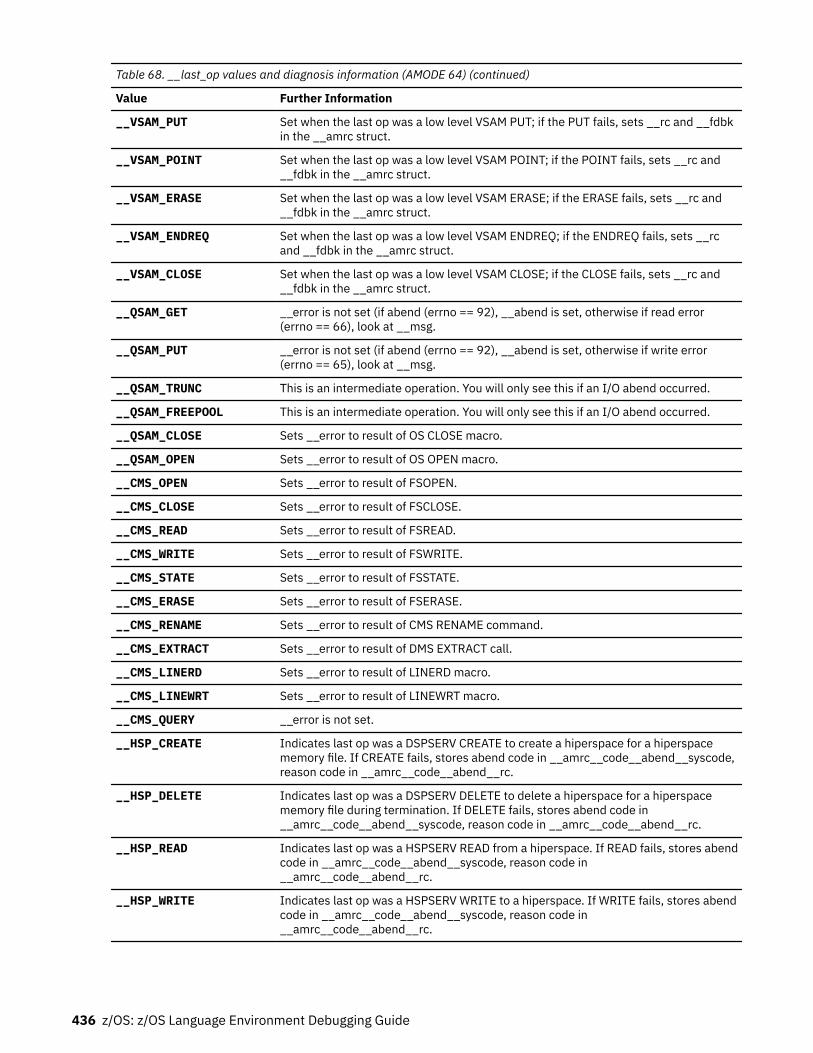
Table 68. __last_op values and diagnosis information (AMODE 64) (continued)
Value Further Information
__VSAM_PUT Set when the last op was a low level VSAM PUT; if the PUT fails, sets __rc and __fdbkin the __amrc struct.
__VSAM_POINT Set when the last op was a low level VSAM POINT; if the POINT fails, sets __rc and__fdbk in the __amrc struct.
__VSAM_ERASE Set when the last op was a low level VSAM ERASE; if the ERASE fails, sets __rc and__fdbk in the __amrc struct.
__VSAM_ENDREQ Set when the last op was a low level VSAM ENDREQ; if the ENDREQ fails, sets __rcand __fdbk in the __amrc struct.
__VSAM_CLOSE Set when the last op was a low level VSAM CLOSE; if the CLOSE fails, sets __rc and__fdbk in the __amrc struct.
__QSAM_GET __error is not set (if abend (errno == 92), __abend is set, otherwise if read error(errno == 66), look at __msg.
__QSAM_PUT __error is not set (if abend (errno == 92), __abend is set, otherwise if write error(errno == 65), look at __msg.
__QSAM_TRUNC This is an intermediate operation. You will only see this if an I/O abend occurred.
__QSAM_FREEPOOL This is an intermediate operation. You will only see this if an I/O abend occurred.
__QSAM_CLOSE Sets __error to result of OS CLOSE macro.
__QSAM_OPEN Sets __error to result of OS OPEN macro.
__CMS_OPEN Sets __error to result of FSOPEN.
__CMS_CLOSE Sets __error to result of FSCLOSE.
__CMS_READ Sets __error to result of FSREAD.
__CMS_WRITE Sets __error to result of FSWRITE.
__CMS_STATE Sets __error to result of FSSTATE.
__CMS_ERASE Sets __error to result of FSERASE.
__CMS_RENAME Sets __error to result of CMS RENAME command.
__CMS_EXTRACT Sets __error to result of DMS EXTRACT call.
__CMS_LINERD Sets __error to result of LINERD macro.
__CMS_LINEWRT Sets __error to result of LINEWRT macro.
__CMS_QUERY __error is not set.
__HSP_CREATE Indicates last op was a DSPSERV CREATE to create a hiperspace for a hiperspacememory file. If CREATE fails, stores abend code in __amrc__code__abend__syscode,reason code in __amrc__code__abend__rc.
__HSP_DELETE Indicates last op was a DSPSERV DELETE to delete a hiperspace for a hiperspacememory file during termination. If DELETE fails, stores abend code in__amrc__code__abend__syscode, reason code in __amrc__code__abend__rc.
__HSP_READ Indicates last op was a HSPSERV READ from a hiperspace. If READ fails, stores abendcode in __amrc__code__abend__syscode, reason code in__amrc__code__abend__rc.
__HSP_WRITE Indicates last op was a HSPSERV WRITE to a hiperspace. If WRITE fails, stores abendcode in __amrc__code__abend__syscode, reason code in__amrc__code__abend__rc.
436 z/OS: z/OS Language Environment Debugging Guide
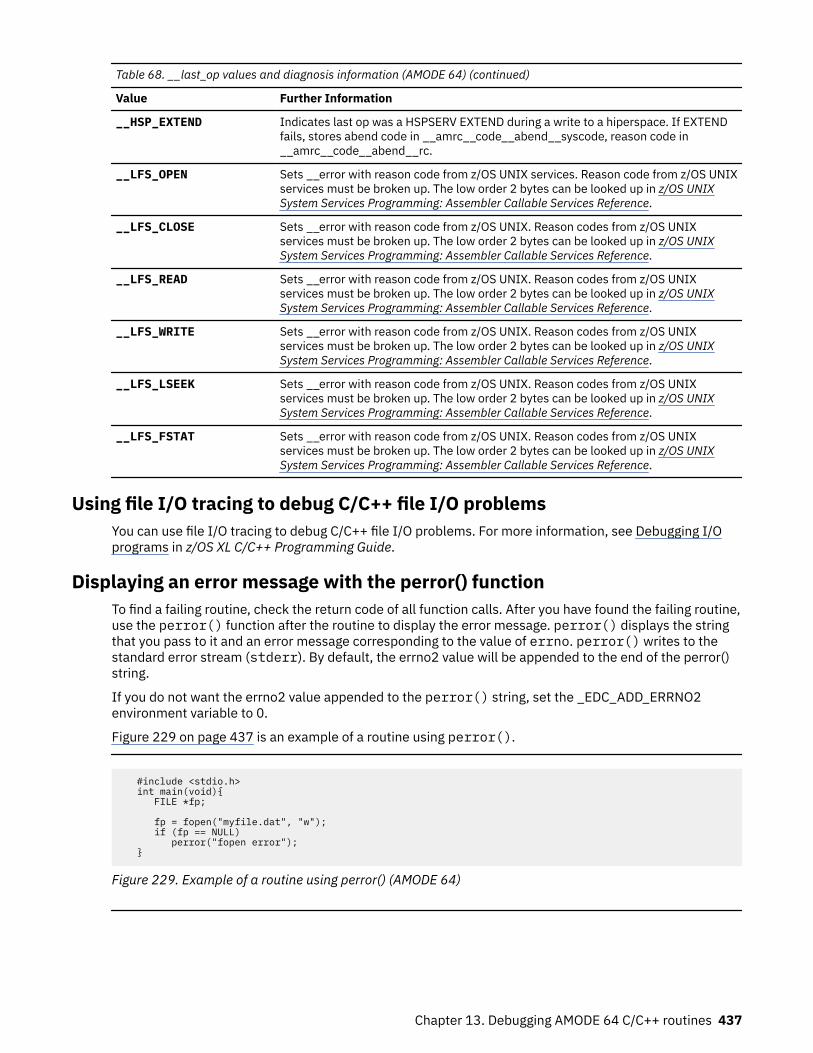
Table 68. __last_op values and diagnosis information (AMODE 64) (continued)
Value Further Information
__HSP_EXTEND Indicates last op was a HSPSERV EXTEND during a write to a hiperspace. If EXTENDfails, stores abend code in __amrc__code__abend__syscode, reason code in__amrc__code__abend__rc.
__LFS_OPEN Sets __error with reason code from z/OS UNIX services. Reason code from z/OS UNIXservices must be broken up. The low order 2 bytes can be looked up in z/OS UNIXSystem Services Programming: Assembler Callable Services Reference.
__LFS_CLOSE Sets __error with reason code from z/OS UNIX. Reason codes from z/OS UNIXservices must be broken up. The low order 2 bytes can be looked up in z/OS UNIXSystem Services Programming: Assembler Callable Services Reference.
__LFS_READ Sets __error with reason code from z/OS UNIX. Reason codes from z/OS UNIXservices must be broken up. The low order 2 bytes can be looked up in z/OS UNIXSystem Services Programming: Assembler Callable Services Reference.
__LFS_WRITE Sets __error with reason code from z/OS UNIX. Reason codes from z/OS UNIXservices must be broken up. The low order 2 bytes can be looked up in z/OS UNIXSystem Services Programming: Assembler Callable Services Reference.
__LFS_LSEEK Sets __error with reason code from z/OS UNIX. Reason codes from z/OS UNIXservices must be broken up. The low order 2 bytes can be looked up in z/OS UNIXSystem Services Programming: Assembler Callable Services Reference.
__LFS_FSTAT Sets __error with reason code from z/OS UNIX. Reason codes from z/OS UNIXservices must be broken up. The low order 2 bytes can be looked up in z/OS UNIXSystem Services Programming: Assembler Callable Services Reference.
Using file I/O tracing to debug C/C++ file I/O problemsYou can use file I/O tracing to debug C/C++ file I/O problems. For more information, see Debugging I/Oprograms in z/OS XL C/C++ Programming Guide.
Displaying an error message with the perror() functionTo find a failing routine, check the return code of all function calls. After you have found the failing routine,use the perror() function after the routine to display the error message. perror() displays the stringthat you pass to it and an error message corresponding to the value of errno. perror() writes to thestandard error stream (stderr). By default, the errno2 value will be appended to the end of the perror()string.
If you do not want the errno2 value appended to the perror() string, set the _EDC_ADD_ERRNO2environment variable to 0.
Figure 229 on page 437 is an example of a routine using perror().
#include <stdio.h> int main(void){ FILE *fp;
fp = fopen("myfile.dat", "w"); if (fp == NULL) perror("fopen error"); }
Figure 229. Example of a routine using perror() (AMODE 64)
Chapter 13. Debugging AMODE 64 C/C++ routines 437
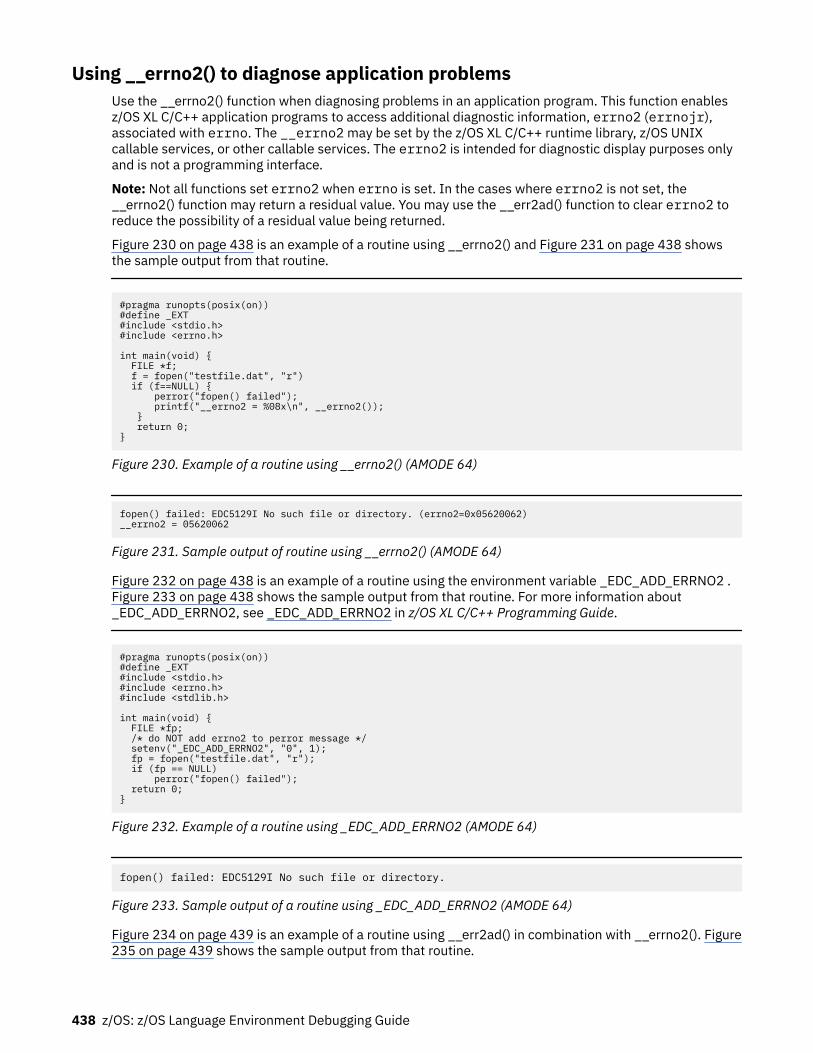
Using __errno2() to diagnose application problemsUse the __errno2() function when diagnosing problems in an application program. This function enablesz/OS XL C/C++ application programs to access additional diagnostic information, errno2 (errnojr),associated with errno. The __errno2 may be set by the z/OS XL C/C++ runtime library, z/OS UNIXcallable services, or other callable services. The errno2 is intended for diagnostic display purposes onlyand is not a programming interface.
Note: Not all functions set errno2 when errno is set. In the cases where errno2 is not set, the__errno2() function may return a residual value. You may use the __err2ad() function to clear errno2 toreduce the possibility of a residual value being returned.
Figure 230 on page 438 is an example of a routine using __errno2() and Figure 231 on page 438 showsthe sample output from that routine.
#pragma runopts(posix(on))#define _EXT#include <stdio.h>#include <errno.h>
int main(void) { FILE *f; f = fopen("testfile.dat", "r") if (f==NULL) { perror("fopen() failed"); printf("__errno2 = %08x\n", __errno2()); } return 0;}
Figure 230. Example of a routine using __errno2() (AMODE 64)
fopen() failed: EDC5129I No such file or directory. (errno2=0x05620062)__errno2 = 05620062
Figure 231. Sample output of routine using __errno2() (AMODE 64)
Figure 232 on page 438 is an example of a routine using the environment variable _EDC_ADD_ERRNO2 .Figure 233 on page 438 shows the sample output from that routine. For more information about_EDC_ADD_ERRNO2, see _EDC_ADD_ERRNO2 in z/OS XL C/C++ Programming Guide.
#pragma runopts(posix(on))#define _EXT#include <stdio.h>#include <errno.h>#include <stdlib.h>
int main(void) { FILE *fp; /* do NOT add errno2 to perror message */ setenv("_EDC_ADD_ERRNO2", "0", 1); fp = fopen("testfile.dat", "r"); if (fp == NULL) perror("fopen() failed"); return 0;}
Figure 232. Example of a routine using _EDC_ADD_ERRNO2 (AMODE 64)
fopen() failed: EDC5129I No such file or directory.
Figure 233. Sample output of a routine using _EDC_ADD_ERRNO2 (AMODE 64)
Figure 234 on page 439 is an example of a routine using __err2ad() in combination with __errno2(). Figure235 on page 439 shows the sample output from that routine.
438 z/OS: z/OS Language Environment Debugging Guide
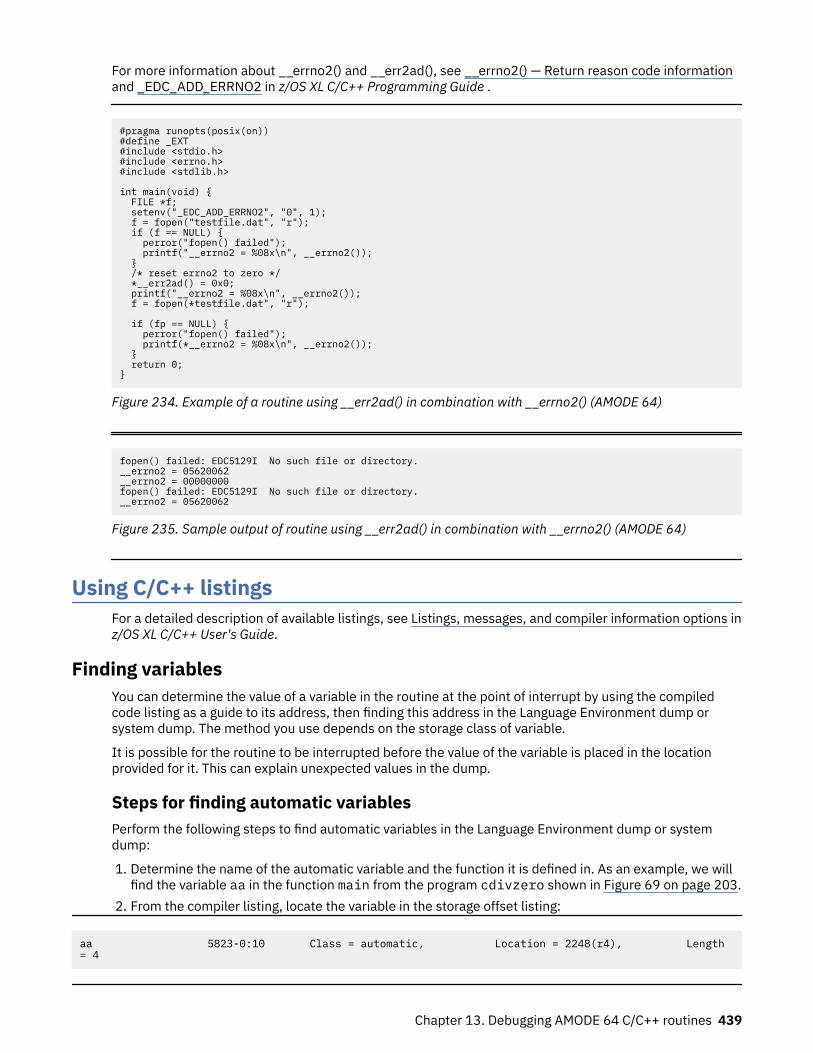
For more information about __errno2() and __err2ad(), see __errno2() — Return reason code informationand _EDC_ADD_ERRNO2 in z/OS XL C/C++ Programming Guide .
#pragma runopts(posix(on))#define _EXT#include <stdio.h>#include <errno.h>#include <stdlib.h>
int main(void) { FILE *f; setenv("_EDC_ADD_ERRNO2", "0", 1); f = fopen("testfile.dat", "r"); if (f == NULL) { perror("fopen() failed"); printf("__errno2 = %08x\n", __errno2()); } /* reset errno2 to zero */ *__err2ad() = 0x0; printf("__errno2 = %08x\n", __errno2()); f = fopen(*testfile.dat", "r"); if (fp == NULL) { perror("fopen() failed"); printf(*__errno2 = %08x\n", __errno2()); } return 0;}
Figure 234. Example of a routine using __err2ad() in combination with __errno2() (AMODE 64)
fopen() failed: EDC5129I No such file or directory.__errno2 = 05620062__errno2 = 00000000 fopen() failed: EDC5129I No such file or directory.__errno2 = 05620062
Figure 235. Sample output of routine using __err2ad() in combination with __errno2() (AMODE 64)
Using C/C++ listingsFor a detailed description of available listings, see Listings, messages, and compiler information options inz/OS XL C/C++ User's Guide.
Finding variablesYou can determine the value of a variable in the routine at the point of interrupt by using the compiledcode listing as a guide to its address, then finding this address in the Language Environment dump orsystem dump. The method you use depends on the storage class of variable.
It is possible for the routine to be interrupted before the value of the variable is placed in the locationprovided for it. This can explain unexpected values in the dump.
Steps for finding automatic variablesPerform the following steps to find automatic variables in the Language Environment dump or systemdump:
1. Determine the name of the automatic variable and the function it is defined in. As an example, we willfind the variable aa in the function main from the program cdivzero shown in Figure 69 on page 203.
2. From the compiler listing, locate the variable in the storage offset listing:
aa 5823-0:10 Class = automatic, Location = 2248(r4), Length = 4
Chapter 13. Debugging AMODE 64 C/C++ routines 439
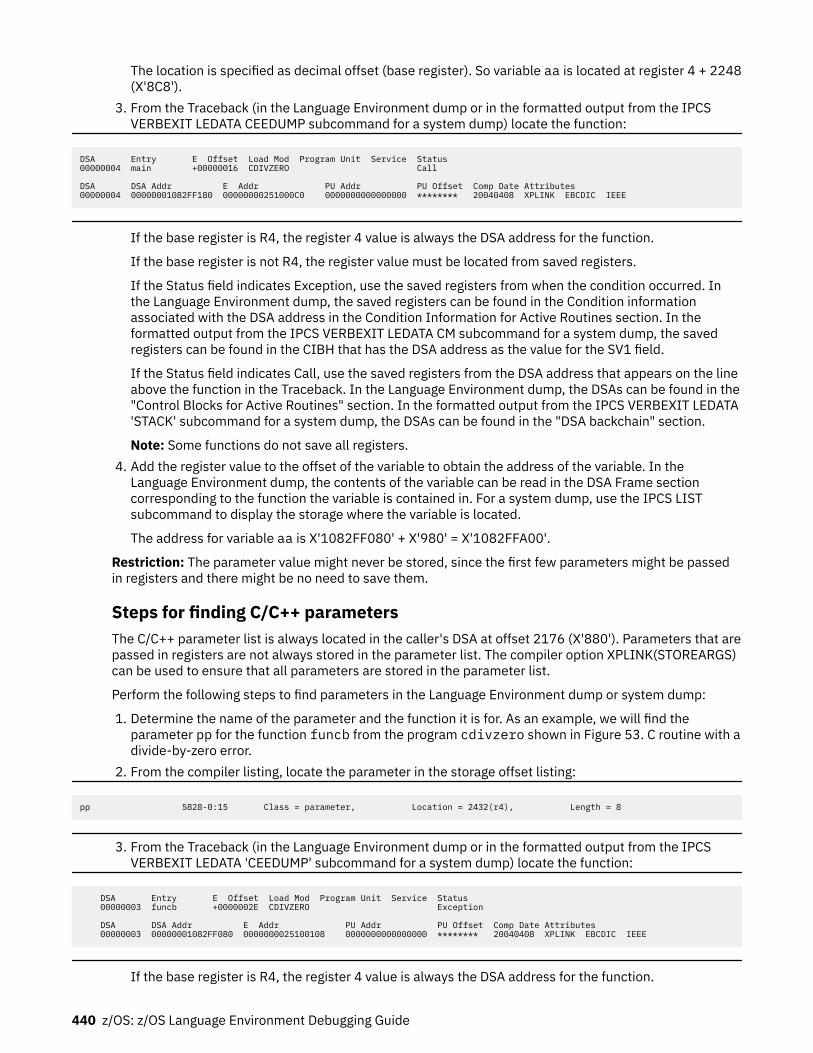
The location is specified as decimal offset (base register). So variable aa is located at register 4 + 2248(X'8C8').
3. From the Traceback (in the Language Environment dump or in the formatted output from the IPCSVERBEXIT LEDATA CEEDUMP subcommand for a system dump) locate the function:
DSA Entry E Offset Load Mod Program Unit Service Status00000004 main +00000016 CDIVZERO Call
DSA DSA Addr E Addr PU Addr PU Offset Comp Date Attributes00000004 00000001082FF180 00000000251000C0 0000000000000000 ******** 20040408 XPLINK EBCDIC IEEE
If the base register is R4, the register 4 value is always the DSA address for the function.
If the base register is not R4, the register value must be located from saved registers.
If the Status field indicates Exception, use the saved registers from when the condition occurred. Inthe Language Environment dump, the saved registers can be found in the Condition informationassociated with the DSA address in the Condition Information for Active Routines section. In theformatted output from the IPCS VERBEXIT LEDATA CM subcommand for a system dump, the savedregisters can be found in the CIBH that has the DSA address as the value for the SV1 field.
If the Status field indicates Call, use the saved registers from the DSA address that appears on the lineabove the function in the Traceback. In the Language Environment dump, the DSAs can be found in the"Control Blocks for Active Routines" section. In the formatted output from the IPCS VERBEXIT LEDATA'STACK' subcommand for a system dump, the DSAs can be found in the "DSA backchain" section.
Note: Some functions do not save all registers.4. Add the register value to the offset of the variable to obtain the address of the variable. In the
Language Environment dump, the contents of the variable can be read in the DSA Frame sectioncorresponding to the function the variable is contained in. For a system dump, use the IPCS LISTsubcommand to display the storage where the variable is located.
The address for variable aa is X'1082FF080' + X'980' = X'1082FFA00'.
Restriction: The parameter value might never be stored, since the first few parameters might be passedin registers and there might be no need to save them.
Steps for finding C/C++ parametersThe C/C++ parameter list is always located in the caller's DSA at offset 2176 (X'880'). Parameters that arepassed in registers are not always stored in the parameter list. The compiler option XPLINK(STOREARGS)can be used to ensure that all parameters are stored in the parameter list.
Perform the following steps to find parameters in the Language Environment dump or system dump:
1. Determine the name of the parameter and the function it is for. As an example, we will find theparameter pp for the function funcb from the program cdivzero shown in Figure 53. C routine with adivide-by-zero error.
2. From the compiler listing, locate the parameter in the storage offset listing:
pp 5828-0:15 Class = parameter, Location = 2432(r4), Length = 8
3. From the Traceback (in the Language Environment dump or in the formatted output from the IPCSVERBEXIT LEDATA 'CEEDUMP' subcommand for a system dump) locate the function:
DSA Entry E Offset Load Mod Program Unit Service Status 00000003 funcb +0000002E CDIVZERO Exception
DSA DSA Addr E Addr PU Addr PU Offset Comp Date Attributes 00000003 00000001082FF080 0000000025100108 0000000000000000 ******** 20040408 XPLINK EBCDIC IEEE
If the base register is R4, the register 4 value is always the DSA address for the function.
440 z/OS: z/OS Language Environment Debugging Guide
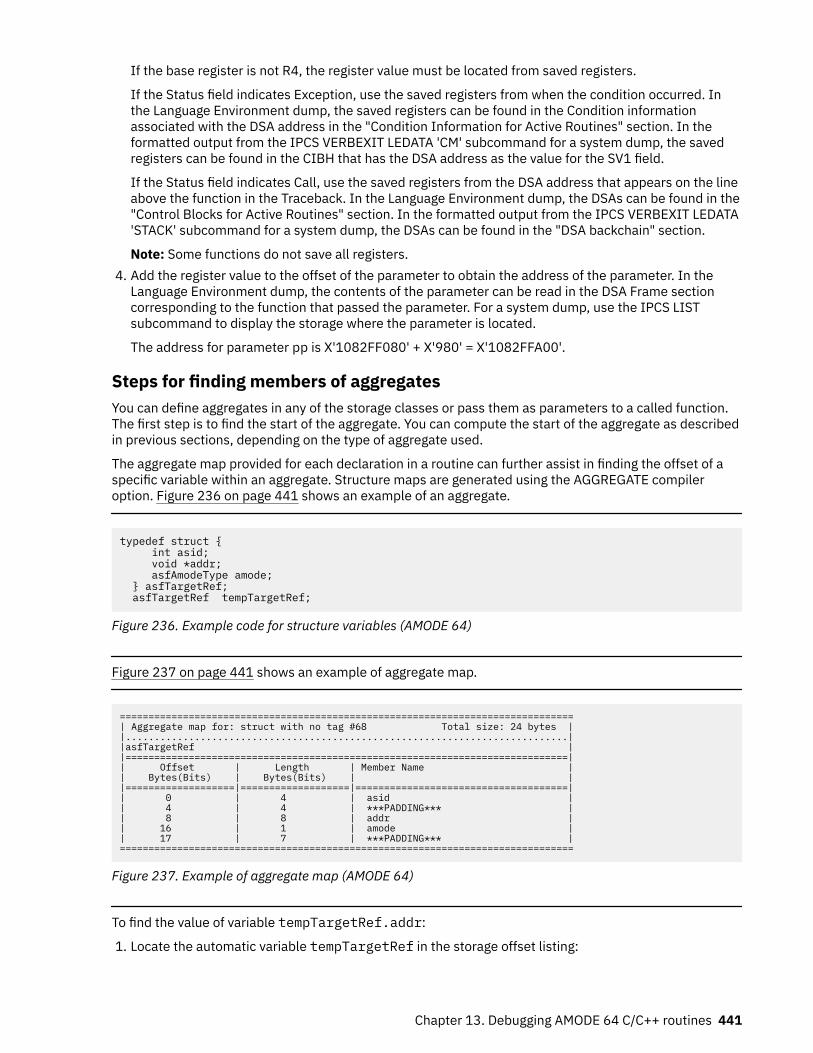
If the base register is not R4, the register value must be located from saved registers.
If the Status field indicates Exception, use the saved registers from when the condition occurred. Inthe Language Environment dump, the saved registers can be found in the Condition informationassociated with the DSA address in the "Condition Information for Active Routines" section. In theformatted output from the IPCS VERBEXIT LEDATA 'CM' subcommand for a system dump, the savedregisters can be found in the CIBH that has the DSA address as the value for the SV1 field.
If the Status field indicates Call, use the saved registers from the DSA address that appears on the lineabove the function in the Traceback. In the Language Environment dump, the DSAs can be found in the"Control Blocks for Active Routines" section. In the formatted output from the IPCS VERBEXIT LEDATA'STACK' subcommand for a system dump, the DSAs can be found in the "DSA backchain" section.
Note: Some functions do not save all registers.4. Add the register value to the offset of the parameter to obtain the address of the parameter. In the
Language Environment dump, the contents of the parameter can be read in the DSA Frame sectioncorresponding to the function that passed the parameter. For a system dump, use the IPCS LISTsubcommand to display the storage where the parameter is located.
The address for parameter pp is X'1082FF080' + X'980' = X'1082FFA00'.
Steps for finding members of aggregatesYou can define aggregates in any of the storage classes or pass them as parameters to a called function.The first step is to find the start of the aggregate. You can compute the start of the aggregate as describedin previous sections, depending on the type of aggregate used.
The aggregate map provided for each declaration in a routine can further assist in finding the offset of aspecific variable within an aggregate. Structure maps are generated using the AGGREGATE compileroption. Figure 236 on page 441 shows an example of an aggregate.
typedef struct { int asid; void *addr; asfAmodeType amode; } asfTargetRef; asfTargetRef tempTargetRef;
Figure 236. Example code for structure variables (AMODE 64)
Figure 237 on page 441 shows an example of aggregate map.
===============================================================================| Aggregate map for: struct with no tag #68 Total size: 24 bytes ||.............................................................................||asfTargetRef ||=============================================================================|| Offset | Length | Member Name || Bytes(Bits) | Bytes(Bits) | ||===================|===================|=====================================|| 0 | 4 | asid || 4 | 4 | ***PADDING*** || 8 | 8 | addr || 16 | 1 | amode || 17 | 7 | ***PADDING*** |===============================================================================
Figure 237. Example of aggregate map (AMODE 64)
To find the value of variable tempTargetRef.addr:
1. Locate the automatic variable tempTargetRef in the storage offset listing:
Chapter 13. Debugging AMODE 64 C/C++ routines 441
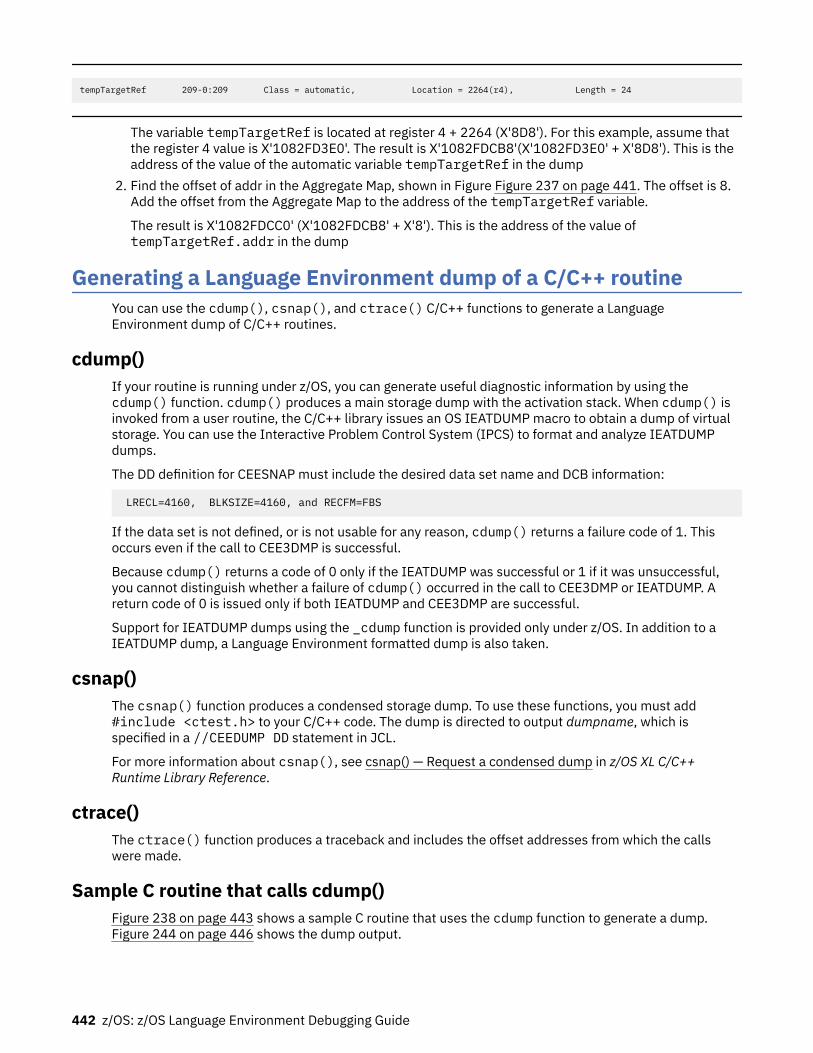
tempTargetRef 209-0:209 Class = automatic, Location = 2264(r4), Length = 24
The variable tempTargetRef is located at register 4 + 2264 (X'8D8'). For this example, assume thatthe register 4 value is X'1082FD3E0'. The result is X'1082FDCB8'(X'1082FD3E0' + X'8D8'). This is theaddress of the value of the automatic variable tempTargetRef in the dump
2. Find the offset of addr in the Aggregate Map, shown in Figure Figure 237 on page 441. The offset is 8.Add the offset from the Aggregate Map to the address of the tempTargetRef variable.
The result is X'1082FDCC0' (X'1082FDCB8' + X'8'). This is the address of the value oftempTargetRef.addr in the dump
Generating a Language Environment dump of a C/C++ routineYou can use the cdump(), csnap(), and ctrace() C/C++ functions to generate a LanguageEnvironment dump of C/C++ routines.
cdump()If your routine is running under z/OS, you can generate useful diagnostic information by using thecdump() function. cdump() produces a main storage dump with the activation stack. When cdump() isinvoked from a user routine, the C/C++ library issues an OS IEATDUMP macro to obtain a dump of virtualstorage. You can use the Interactive Problem Control System (IPCS) to format and analyze IEATDUMPdumps.
The DD definition for CEESNAP must include the desired data set name and DCB information:
LRECL=4160, BLKSIZE=4160, and RECFM=FBS
If the data set is not defined, or is not usable for any reason, cdump() returns a failure code of 1. Thisoccurs even if the call to CEE3DMP is successful.
Because cdump() returns a code of 0 only if the IEATDUMP was successful or 1 if it was unsuccessful,you cannot distinguish whether a failure of cdump() occurred in the call to CEE3DMP or IEATDUMP. Areturn code of 0 is issued only if both IEATDUMP and CEE3DMP are successful.
Support for IEATDUMP dumps using the _cdump function is provided only under z/OS. In addition to aIEATDUMP dump, a Language Environment formatted dump is also taken.
csnap()The csnap() function produces a condensed storage dump. To use these functions, you must add#include <ctest.h> to your C/C++ code. The dump is directed to output dumpname, which isspecified in a //CEEDUMP DD statement in JCL.
For more information about csnap(), see csnap() — Request a condensed dump in z/OS XL C/C++Runtime Library Reference.
ctrace()The ctrace() function produces a traceback and includes the offset addresses from which the callswere made.
Sample C routine that calls cdump()Figure 238 on page 443 shows a sample C routine that uses the cdump function to generate a dump.Figure 244 on page 446 shows the dump output.
442 z/OS: z/OS Language Environment Debugging Guide
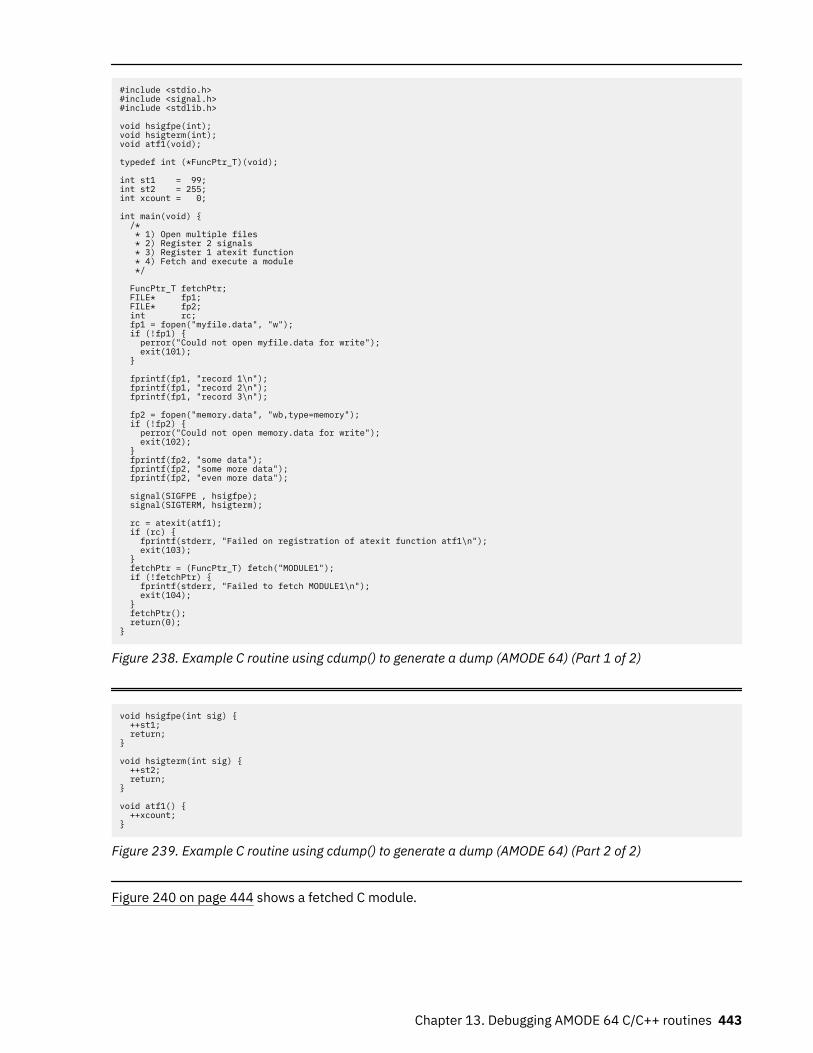
#include <stdio.h>#include <signal.h>#include <stdlib.h>
void hsigfpe(int);void hsigterm(int);void atf1(void);
typedef int (*FuncPtr_T)(void);
int st1 = 99;int st2 = 255;int xcount = 0;
int main(void) { /* * 1) Open multiple files * 2) Register 2 signals * 3) Register 1 atexit function * 4) Fetch and execute a module */
FuncPtr_T fetchPtr; FILE* fp1; FILE* fp2; int rc; fp1 = fopen("myfile.data", "w"); if (!fp1) { perror("Could not open myfile.data for write"); exit(101); }
fprintf(fp1, "record 1\n"); fprintf(fp1, "record 2\n"); fprintf(fp1, "record 3\n");
fp2 = fopen("memory.data", "wb,type=memory"); if (!fp2) { perror("Could not open memory.data for write"); exit(102); } fprintf(fp2, "some data"); fprintf(fp2, "some more data"); fprintf(fp2, "even more data");
signal(SIGFPE , hsigfpe); signal(SIGTERM, hsigterm);
rc = atexit(atf1); if (rc) { fprintf(stderr, "Failed on registration of atexit function atf1\n"); exit(103); } fetchPtr = (FuncPtr_T) fetch("MODULE1"); if (!fetchPtr) { fprintf(stderr, "Failed to fetch MODULE1\n"); exit(104); } fetchPtr(); return(0);}
Figure 238. Example C routine using cdump() to generate a dump (AMODE 64) (Part 1 of 2)
void hsigfpe(int sig) { ++st1; return;}
void hsigterm(int sig) { ++st2; return;}
void atf1() { ++xcount;}
Figure 239. Example C routine using cdump() to generate a dump (AMODE 64) (Part 2 of 2)
Figure 240 on page 444 shows a fetched C module.
Chapter 13. Debugging AMODE 64 C/C++ routines 443
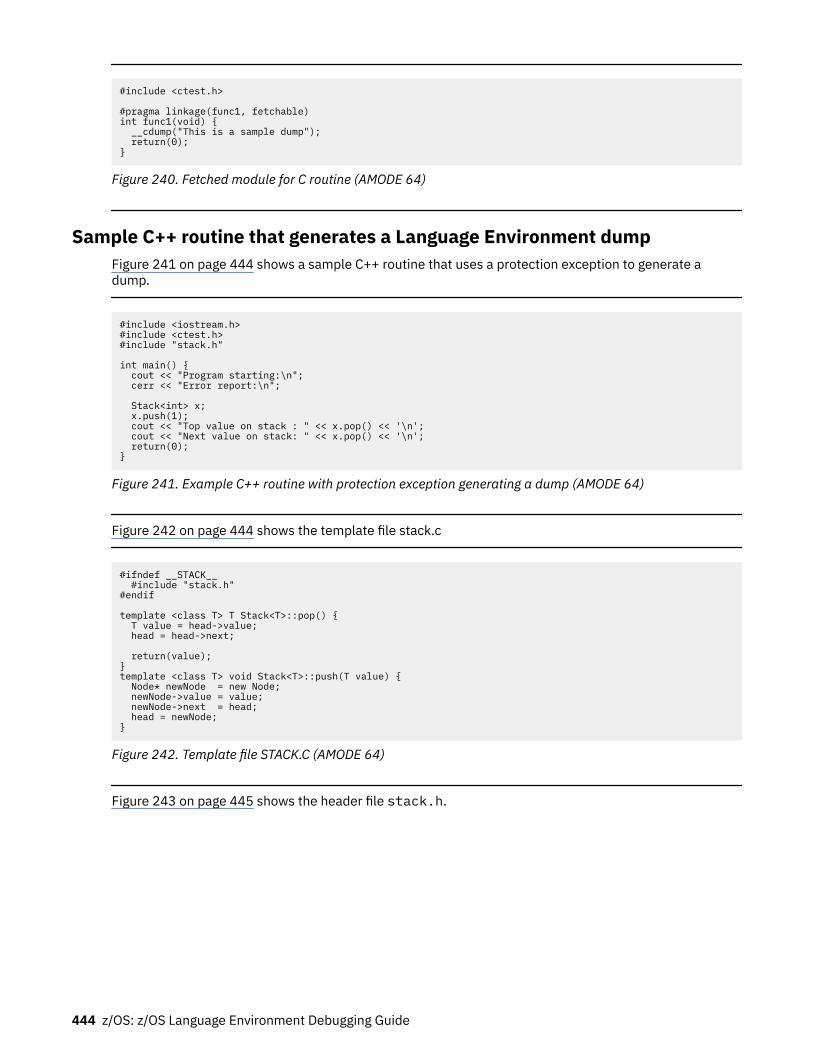
#include <ctest.h>
#pragma linkage(func1, fetchable)int func1(void) { __cdump("This is a sample dump"); return(0);}
Figure 240. Fetched module for C routine (AMODE 64)
Sample C++ routine that generates a Language Environment dumpFigure 241 on page 444 shows a sample C++ routine that uses a protection exception to generate adump.
#include <iostream.h>#include <ctest.h>#include "stack.h"
int main() { cout << "Program starting:\n"; cerr << "Error report:\n";
Stack<int> x; x.push(1); cout << "Top value on stack : " << x.pop() << '\n'; cout << "Next value on stack: " << x.pop() << '\n'; return(0);}
Figure 241. Example C++ routine with protection exception generating a dump (AMODE 64)
Figure 242 on page 444 shows the template file stack.c
#ifndef __STACK__ #include "stack.h"#endif
template <class T> T Stack<T>::pop() { T value = head->value; head = head->next;
return(value);}template <class T> void Stack<T>::push(T value) { Node* newNode = new Node; newNode->value = value; newNode->next = head; head = newNode;}
Figure 242. Template file STACK.C (AMODE 64)
Figure 243 on page 445 shows the header file stack.h.
444 z/OS: z/OS Language Environment Debugging Guide
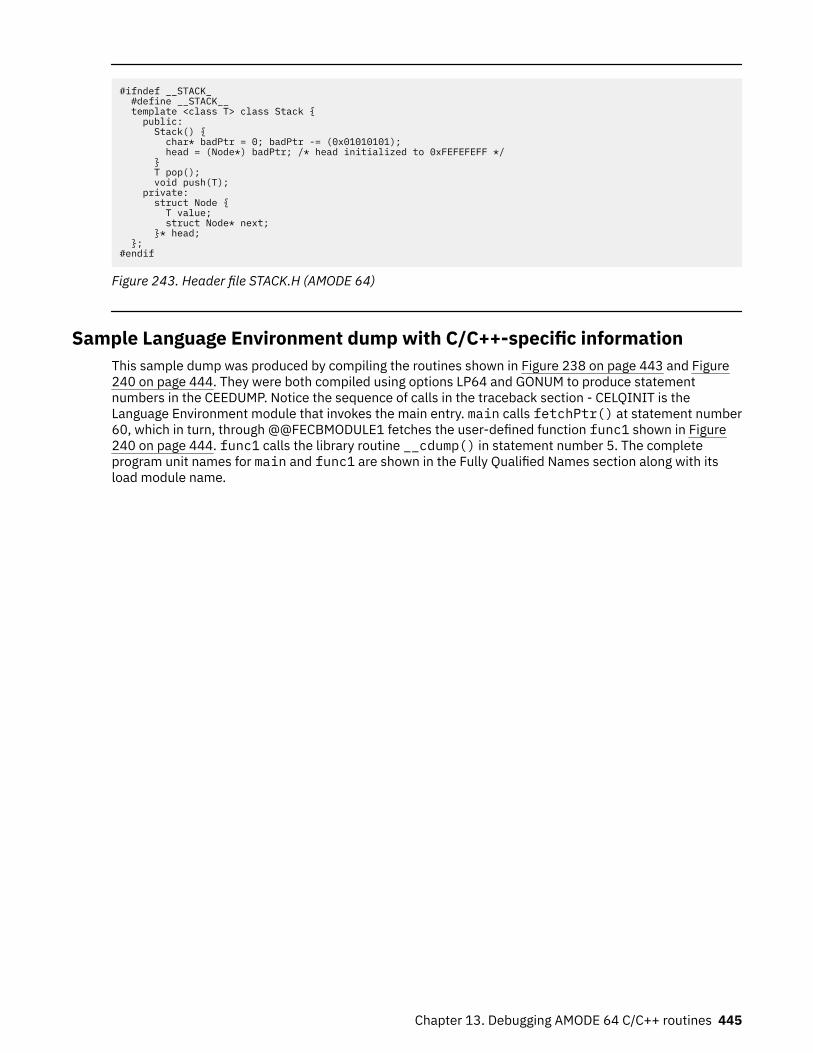
#ifndef __STACK_ #define __STACK__ template <class T> class Stack { public: Stack() { char* badPtr = 0; badPtr -= (0x01010101); head = (Node*) badPtr; /* head initialized to 0xFEFEFEFF */ } T pop(); void push(T); private: struct Node { T value; struct Node* next; }* head; };#endif
Figure 243. Header file STACK.H (AMODE 64)
Sample Language Environment dump with C/C++-specific informationThis sample dump was produced by compiling the routines shown in Figure 238 on page 443 and Figure240 on page 444. They were both compiled using options LP64 and GONUM to produce statementnumbers in the CEEDUMP. Notice the sequence of calls in the traceback section - CELQINIT is theLanguage Environment module that invokes the main entry. main calls fetchPtr() at statement number60, which in turn, through @@FECBMODULE1 fetches the user-defined function func1 shown in Figure240 on page 444. func1 calls the library routine __cdump() in statement number 5. The completeprogram unit names for main and func1 are shown in the Fully Qualified Names section along with itsload module name.
Chapter 13. Debugging AMODE 64 C/C++ routines 445
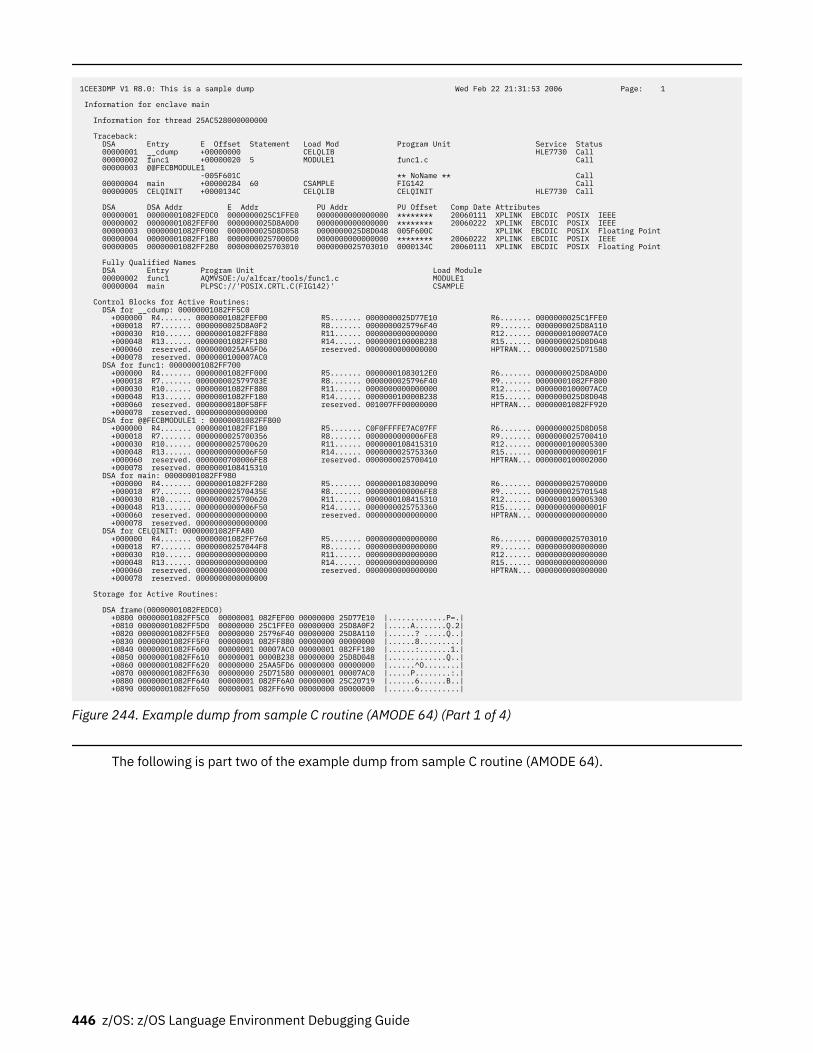
1CEE3DMP V1 R8.0: This is a sample dump Wed Feb 22 21:31:53 2006 Page: 1
Information for enclave main
Information for thread 25AC528000000000
Traceback: DSA Entry E Offset Statement Load Mod Program Unit Service Status 00000001 __cdump +00000000 CELQLIB HLE7730 Call 00000002 func1 +00000020 5 MODULE1 func1.c Call 00000003 @@FECBMODULE1 -005F601C ** NoName ** Call 00000004 main +00000284 60 CSAMPLE FIG142 Call 00000005 CELQINIT +0000134C CELQLIB CELQINIT HLE7730 Call
DSA DSA Addr E Addr PU Addr PU Offset Comp Date Attributes 00000001 00000001082FEDC0 0000000025C1FFE0 0000000000000000 ******** 20060111 XPLINK EBCDIC POSIX IEEE 00000002 00000001082FEF00 0000000025D8A0D0 0000000000000000 ******** 20060222 XPLINK EBCDIC POSIX IEEE 00000003 00000001082FF000 0000000025D8D058 0000000025D8D048 005F600C XPLINK EBCDIC POSIX Floating Point 00000004 00000001082FF180 00000000257000D0 0000000000000000 ******** 20060222 XPLINK EBCDIC POSIX IEEE 00000005 00000001082FF280 0000000025703010 0000000025703010 0000134C 20060111 XPLINK EBCDIC POSIX Floating Point
Fully Qualified Names DSA Entry Program Unit Load Module 00000002 func1 AQMVSOE:/u/alfcar/tools/func1.c MODULE1 00000004 main PLPSC://'POSIX.CRTL.C(FIG142)' CSAMPLE
Control Blocks for Active Routines: DSA for __cdump: 00000001082FF5C0 +000000 R4....... 00000001082FEF00 R5....... 0000000025D77E10 R6....... 0000000025C1FFE0 +000018 R7....... 0000000025D8A0F2 R8....... 0000000025796F40 R9....... 0000000025D8A110 +000030 R10...... 00000001082FF880 R11...... 0000000000000000 R12...... 0000000100007AC0 +000048 R13...... 00000001082FF180 R14...... 000000010000B238 R15...... 0000000025D8D048 +000060 reserved. 0000000025AA5FD6 reserved. 0000000000000000 HPTRAN... 0000000025D71580 +000078 reserved. 0000000100007AC0 DSA for func1: 00000001082FF700 +000000 R4....... 00000001082FF000 R5....... 00000001083012E0 R6....... 0000000025D8A0D0 +000018 R7....... 000000002579703E R8....... 0000000025796F40 R9....... 00000001082FF800 +000030 R10...... 00000001082FF880 R11...... 0000000000000000 R12...... 0000000100007AC0 +000048 R13...... 00000001082FF180 R14...... 000000010000B238 R15...... 0000000025D8D048 +000060 reserved. 00000000180F58FF reserved. 001007FF00000000 HPTRAN... 00000001082FF920 +000078 reserved. 0000000000000000 DSA for @@FECBMODULE1 : 00000001082FF800 +000000 R4....... 00000001082FF180 R5....... C0F0FFFFE7AC07FF R6....... 0000000025D8D058 +000018 R7....... 0000000025700356 R8....... 0000000000006FE8 R9....... 0000000025700410 +000030 R10...... 0000000025700620 R11...... 0000000108415310 R12...... 0000000100005300 +000048 R13...... 0000000000006F50 R14...... 0000000025753360 R15...... 000000000000001F +000060 reserved. 0000000700006FE8 reserved. 0000000025700410 HPTRAN... 0000000100002000 +000078 reserved. 0000000108415310 DSA for main: 00000001082FF980 +000000 R4....... 00000001082FF280 R5....... 0000000108300090 R6....... 00000000257000D0 +000018 R7....... 000000002570435E R8....... 0000000000006FE8 R9....... 0000000025701548 +000030 R10...... 0000000025700620 R11...... 0000000108415310 R12...... 0000000100005300 +000048 R13...... 0000000000006F50 R14...... 0000000025753360 R15...... 000000000000001F +000060 reserved. 0000000000000000 reserved. 0000000000000000 HPTRAN... 0000000000000000 +000078 reserved. 0000000000000000 DSA for CELQINIT: 00000001082FFA80 +000000 R4....... 00000001082FF760 R5....... 0000000000000000 R6....... 0000000025703010 +000018 R7....... 00000000257044F8 R8....... 0000000000000000 R9....... 0000000000000000 +000030 R10...... 0000000000000000 R11...... 0000000000000000 R12...... 0000000000000000 +000048 R13...... 0000000000000000 R14...... 0000000000000000 R15...... 0000000000000000 +000060 reserved. 0000000000000000 reserved. 0000000000000000 HPTRAN... 0000000000000000 +000078 reserved. 0000000000000000
Storage for Active Routines:
DSA frame(00000001082FEDC0) +0800 00000001082FF5C0 00000001 082FEF00 00000000 25D77E10 |.............P=.| +0810 00000001082FF5D0 00000000 25C1FFE0 00000000 25D8A0F2 |.....A.......Q.2| +0820 00000001082FF5E0 00000000 25796F40 00000000 25D8A110 |......? .....Q..| +0830 00000001082FF5F0 00000001 082FF880 00000000 00000000 |......8.........| +0840 00000001082FF600 00000001 00007AC0 00000001 082FF180 |......:.......1.| +0850 00000001082FF610 00000001 0000B238 00000000 25D8D048 |.............Q..| +0860 00000001082FF620 00000000 25AA5FD6 00000000 00000000 |......^O........| +0870 00000001082FF630 00000000 25D71580 00000001 00007AC0 |.....P........:.| +0880 00000001082FF640 00000001 082FF6A0 00000000 25C20719 |......6......B..| +0890 00000001082FF650 00000001 082FF690 00000000 00000000 |......6.........|
Figure 244. Example dump from sample C routine (AMODE 64) (Part 1 of 4)
The following is part two of the example dump from sample C routine (AMODE 64).
446 z/OS: z/OS Language Environment Debugging Guide
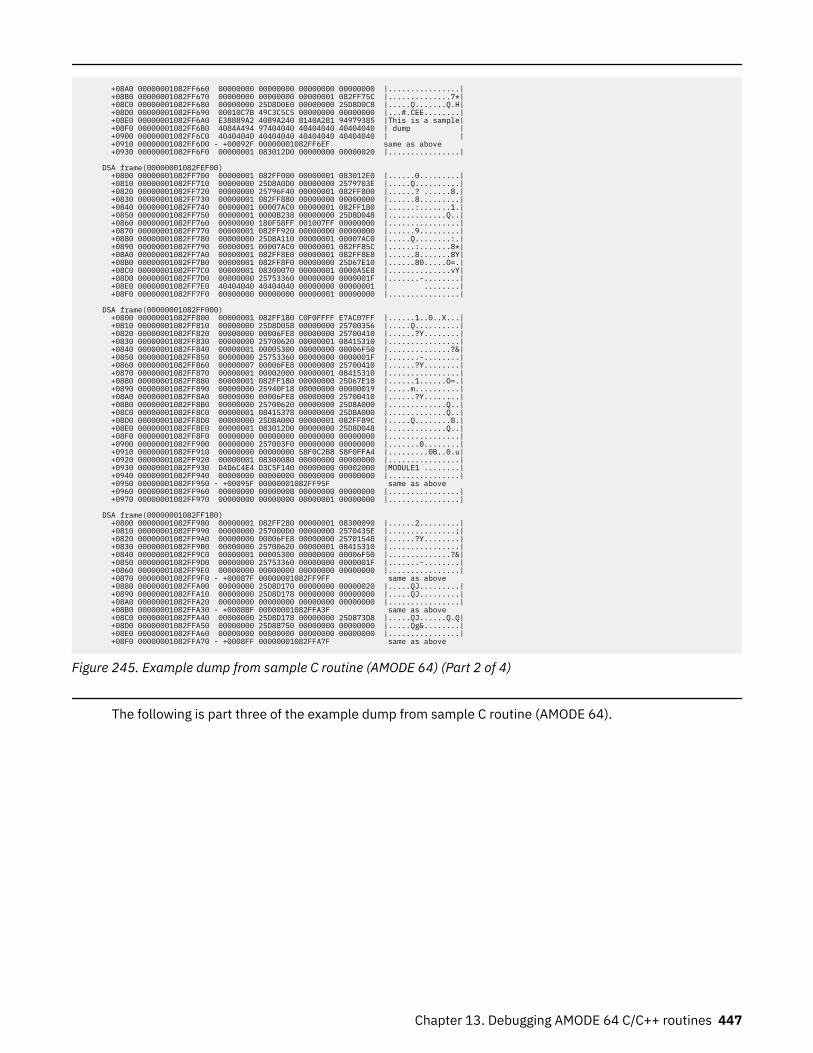
+08A0 00000001082FF660 00000000 00000000 00000000 00000000 |................| +08B0 00000001082FF670 00000000 00000000 00000001 082FF75C |..............7*| +08C0 00000001082FF680 00000000 25D8D0E0 00000000 25D8D0C8 |.....Q.......Q.H| +08D0 00000001082FF690 00010C7B 49C3C5C5 00000000 00000000 |...#.CEE........| +08E0 00000001082FF6A0 E38889A2 4089A240 8140A281 94979385 |This is a sample| +08F0 00000001082FF6B0 4084A494 97404040 40404040 40404040 | dump | +0900 00000001082FF6C0 40404040 40404040 40404040 40404040 | | +0910 00000001082FF6D0 - +00092F 00000001082FF6EF same as above +0930 00000001082FF6F0 00000001 083012D0 00000000 00000020 |................|
DSA frame(00000001082FEF00) +0800 00000001082FF700 00000001 082FF000 00000001 083012E0 |......0.........| +0810 00000001082FF710 00000000 25D8A0D0 00000000 2579703E |.....Q..........| +0820 00000001082FF720 00000000 25796F40 00000001 082FF800 |......? ......8.| +0830 00000001082FF730 00000001 082FF880 00000000 00000000 |......8.........| +0840 00000001082FF740 00000001 00007AC0 00000001 082FF180 |......:.......1.| +0850 00000001082FF750 00000001 0000B238 00000000 25D8D048 |.............Q..| +0860 00000001082FF760 00000000 180F58FF 001007FF 00000000 |................| +0870 00000001082FF770 00000001 082FF920 00000000 00000000 |......9.........| +0880 00000001082FF780 00000000 25D8A110 00000001 00007AC0 |.....Q........:.| +0890 00000001082FF790 00000001 00007AC0 00000001 082FF85C |......:.......8*| +08A0 00000001082FF7A0 00000001 082FF8E0 00000001 082FF8E8 |......8.......8Y| +08B0 00000001082FF7B0 00000001 082FF8F0 00000000 25D67E10 |......80.....O=.| +08C0 00000001082FF7C0 00000001 08300070 00000001 0000A5E8 |..............vY| +08D0 00000001082FF7D0 00000000 25753360 00000000 0000001F |.......-........| +08E0 00000001082FF7E0 40404040 40404040 00000000 00000001 | ........| +08F0 00000001082FF7F0 00000000 00000000 00000001 00000000 |................|
DSA frame(00000001082FF000) +0800 00000001082FF800 00000001 082FF180 C0F0FFFF E7AC07FF |......1..0..X...| +0810 00000001082FF810 00000000 25D8D058 00000000 25700356 |.....Q..........| +0820 00000001082FF820 00000000 00006FE8 00000000 25700410 |......?Y........| +0830 00000001082FF830 00000000 25700620 00000001 08415310 |................| +0840 00000001082FF840 00000001 00005300 00000000 00006F50 |..............?&| +0850 00000001082FF850 00000000 25753360 00000000 0000001F |.......-........| +0860 00000001082FF860 00000007 00006FE8 00000000 25700410 |......?Y........| +0870 00000001082FF870 00000001 00002000 00000001 08415310 |................| +0880 00000001082FF880 00000001 082FF180 00000000 25D67E10 |......1......O=.| +0890 00000001082FF890 00000000 25940F18 00000000 00000019 |.....m..........| +08A0 00000001082FF8A0 00000000 00006FE8 00000000 25700410 |......?Y........| +08B0 00000001082FF8B0 00000000 25700620 00000000 25D8A000 |.............Q..| +08C0 00000001082FF8C0 00000001 08415378 00000000 25D8A000 |.............Q..| +08D0 00000001082FF8D0 00000000 25D8A000 00000001 082FF89C |.....Q........8.| +08E0 00000001082FF8E0 00000001 083012D0 00000000 25D8D048 |.............Q..| +08F0 00000001082FF8F0 00000000 00000000 00000000 00000000 |................| +0900 00000001082FF900 00000000 257003F0 00000000 00000000 |.......0........| +0910 00000001082FF910 00000000 00000000 58F0C2B8 58F0FFA4 |.........0B..0.u| +0920 00000001082FF920 00000001 08300080 00000000 00000000 |................| +0930 00000001082FF930 D4D6C4E4 D3C5F140 00000000 00002000 |MODULE1 ........| +0940 00000001082FF940 00000000 00000000 00000000 00000000 |................| +0950 00000001082FF950 - +00095F 00000001082FF95F same as above +0960 00000001082FF960 00000000 00000008 00000000 00000000 |................| +0970 00000001082FF970 00000000 00000000 00000001 00000000 |................|
DSA frame(00000001082FF180) +0800 00000001082FF980 00000001 082FF280 00000001 08300090 |......2.........| +0810 00000001082FF990 00000000 257000D0 00000000 2570435E |...............;| +0820 00000001082FF9A0 00000000 00006FE8 00000000 25701548 |......?Y........| +0830 00000001082FF9B0 00000000 25700620 00000001 08415310 |................| +0840 00000001082FF9C0 00000001 00005300 00000000 00006F50 |..............?&| +0850 00000001082FF9D0 00000000 25753360 00000000 0000001F |.......-........| +0860 00000001082FF9E0 00000000 00000000 00000000 00000000 |................| +0870 00000001082FF9F0 - +00087F 00000001082FF9FF same as above +0880 00000001082FFA00 00000000 25D8D170 00000000 00000020 |.....QJ.........| +0890 00000001082FFA10 00000000 25D8D178 00000000 00000000 |.....QJ.........| +08A0 00000001082FFA20 00000000 00000000 00000000 00000000 |................| +08B0 00000001082FFA30 - +0008BF 00000001082FFA3F same as above +08C0 00000001082FFA40 00000000 25D8D178 00000000 25D873D8 |.....QJ......Q.Q| +08D0 00000001082FFA50 00000000 25D88750 00000000 00000000 |.....Qg&........| +08E0 00000001082FFA60 00000000 00000000 00000000 00000000 |................| +08F0 00000001082FFA70 - +0008FF 00000001082FFA7F same as above
Figure 245. Example dump from sample C routine (AMODE 64) (Part 2 of 4)
The following is part three of the example dump from sample C routine (AMODE 64).
Chapter 13. Debugging AMODE 64 C/C++ routines 447
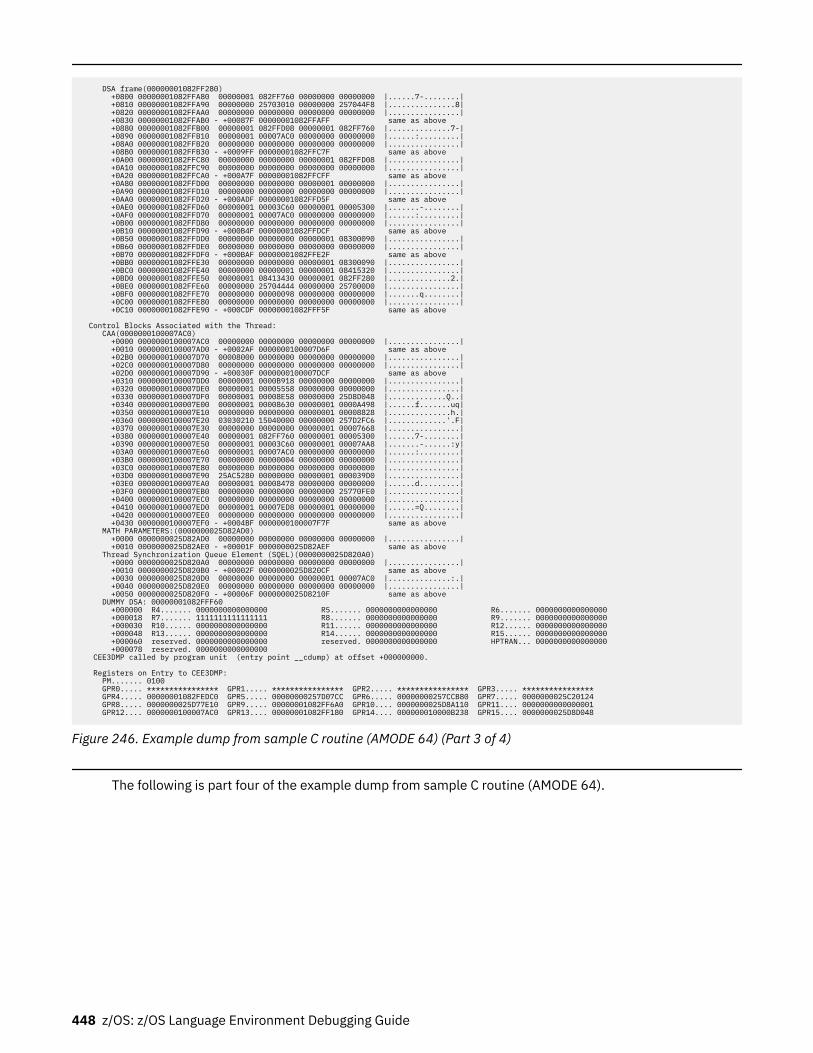
DSA frame(00000001082FF280) +0800 00000001082FFA80 00000001 082FF760 00000000 00000000 |......7-........| +0810 00000001082FFA90 00000000 25703010 00000000 257044F8 |...............8| +0820 00000001082FFAA0 00000000 00000000 00000000 00000000 |................| +0830 00000001082FFAB0 - +00087F 00000001082FFAFF same as above +0880 00000001082FFB00 00000001 082FFD08 00000001 082FF760 |..............7-| +0890 00000001082FFB10 00000001 00007AC0 00000000 00000000 |......:.........| +08A0 00000001082FFB20 00000000 00000000 00000000 00000000 |................| +08B0 00000001082FFB30 - +0009FF 00000001082FFC7F same as above +0A00 00000001082FFC80 00000000 00000000 00000001 082FFD08 |................| +0A10 00000001082FFC90 00000000 00000000 00000000 00000000 |................| +0A20 00000001082FFCA0 - +000A7F 00000001082FFCFF same as above +0A80 00000001082FFD00 00000000 00000000 00000001 00000000 |................| +0A90 00000001082FFD10 00000000 00000000 00000000 00000000 |................| +0AA0 00000001082FFD20 - +000ADF 00000001082FFD5F same as above +0AE0 00000001082FFD60 00000001 00003C60 00000001 00005300 |.......-........| +0AF0 00000001082FFD70 00000001 00007AC0 00000000 00000000 |......:.........| +0B00 00000001082FFD80 00000000 00000000 00000000 00000000 |................| +0B10 00000001082FFD90 - +000B4F 00000001082FFDCF same as above +0B50 00000001082FFDD0 00000000 00000000 00000001 08300090 |................| +0B60 00000001082FFDE0 00000000 00000000 00000000 00000000 |................| +0B70 00000001082FFDF0 - +000BAF 00000001082FFE2F same as above +0BB0 00000001082FFE30 00000000 00000000 00000001 08300090 |................| +0BC0 00000001082FFE40 00000000 00000001 00000001 08415320 |................| +0BD0 00000001082FFE50 00000001 08413430 00000001 082FF280 |..............2.| +0BE0 00000001082FFE60 00000000 25704444 00000000 257000D0 |................| +0BF0 00000001082FFE70 00000000 00000098 00000000 00000000 |.......q........| +0C00 00000001082FFE80 00000000 00000000 00000000 00000000 |................| +0C10 00000001082FFE90 - +000CDF 00000001082FFF5F same as above
Control Blocks Associated with the Thread: CAA(0000000100007AC0) +0000 0000000100007AC0 00000000 00000000 00000000 00000000 |................| +0010 0000000100007AD0 - +0002AF 0000000100007D6F same as above +02B0 0000000100007D70 00008000 00000000 00000000 00000000 |................| +02C0 0000000100007D80 00000000 00000000 00000000 00000000 |................| +02D0 0000000100007D90 - +00030F 0000000100007DCF same as above +0310 0000000100007DD0 00000001 0000B918 00000000 00000000 |................| +0320 0000000100007DE0 00000001 00005558 00000000 00000000 |................| +0330 0000000100007DF0 00000001 00008E58 00000000 25D8D048 |.............Q..| +0340 0000000100007E00 00000001 00008630 00000001 0000A498 |......f.......uq| +0350 0000000100007E10 00000000 00000000 00000001 00008828 |..............h.| +0360 0000000100007E20 03030210 15040000 00000000 257D2FC6 |.............'.F| +0370 0000000100007E30 00000000 00000000 00000001 00007668 |................| +0380 0000000100007E40 00000001 082FF760 00000001 00005300 |......7-........| +0390 0000000100007E50 00000001 00003C60 00000001 00007AA8 |.......-......:y| +03A0 0000000100007E60 00000001 00007AC0 00000000 00000000 |......:.........| +03B0 0000000100007E70 00000000 00000004 00000000 00000000 |................| +03C0 0000000100007E80 00000000 00000000 00000000 00000000 |................| +03D0 0000000100007E90 25AC5280 00000000 00000001 000039D0 |................| +03E0 0000000100007EA0 00000001 00008478 00000000 00000000 |......d.........| +03F0 0000000100007EB0 00000000 00000000 00000000 25770FE0 |................| +0400 0000000100007EC0 00000000 00000000 00000000 00000000 |................| +0410 0000000100007ED0 00000001 00007ED8 00000001 00000000 |......=Q........| +0420 0000000100007EE0 00000000 00000000 00000000 00000000 |................| +0430 0000000100007EF0 - +0004BF 0000000100007F7F same as above MATH PARAMETERS:(0000000025D82AD0) +0000 0000000025D82AD0 00000000 00000000 00000000 00000000 |................| +0010 0000000025D82AE0 - +00001F 0000000025D82AEF same as above Thread Synchronization Queue Element (SQEL)(0000000025D820A0) +0000 0000000025D820A0 00000000 00000000 00000000 00000000 |................| +0010 0000000025D820B0 - +00002F 0000000025D820CF same as above +0030 0000000025D820D0 00000000 00000000 00000001 00007AC0 |..............:.| +0040 0000000025D820E0 00000000 00000000 00000000 00000000 |................| +0050 0000000025D820F0 - +00006F 0000000025D8210F same as above DUMMY DSA: 00000001082FFF60 +000000 R4....... 0000000000000000 R5....... 0000000000000000 R6....... 0000000000000000 +000018 R7....... 1111111111111111 R8....... 0000000000000000 R9....... 0000000000000000 +000030 R10...... 0000000000000000 R11...... 0000000000000000 R12...... 0000000000000000 +000048 R13...... 0000000000000000 R14...... 0000000000000000 R15...... 0000000000000000 +000060 reserved. 0000000000000000 reserved. 0000000000000000 HPTRAN... 0000000000000000 +000078 reserved. 0000000000000000 CEE3DMP called by program unit (entry point __cdump) at offset +000000000.
Registers on Entry to CEE3DMP: PM....... 0100 GPR0..... **************** GPR1..... **************** GPR2..... **************** GPR3..... **************** GPR4..... 00000001082FEDC0 GPR5..... 00000000257D07CC GPR6..... 00000000257CCB80 GPR7..... 0000000025C20124 GPR8..... 0000000025D77E10 GPR9..... 00000001082FF6A0 GPR10.... 0000000025D8A110 GPR11.... 0000000000000001 GPR12.... 0000000100007AC0 GPR13.... 00000001082FF180 GPR14.... 000000010000B238 GPR15.... 0000000025D8D048
Figure 246. Example dump from sample C routine (AMODE 64) (Part 3 of 4)
The following is part four of the example dump from sample C routine (AMODE 64).
448 z/OS: z/OS Language Environment Debugging Guide
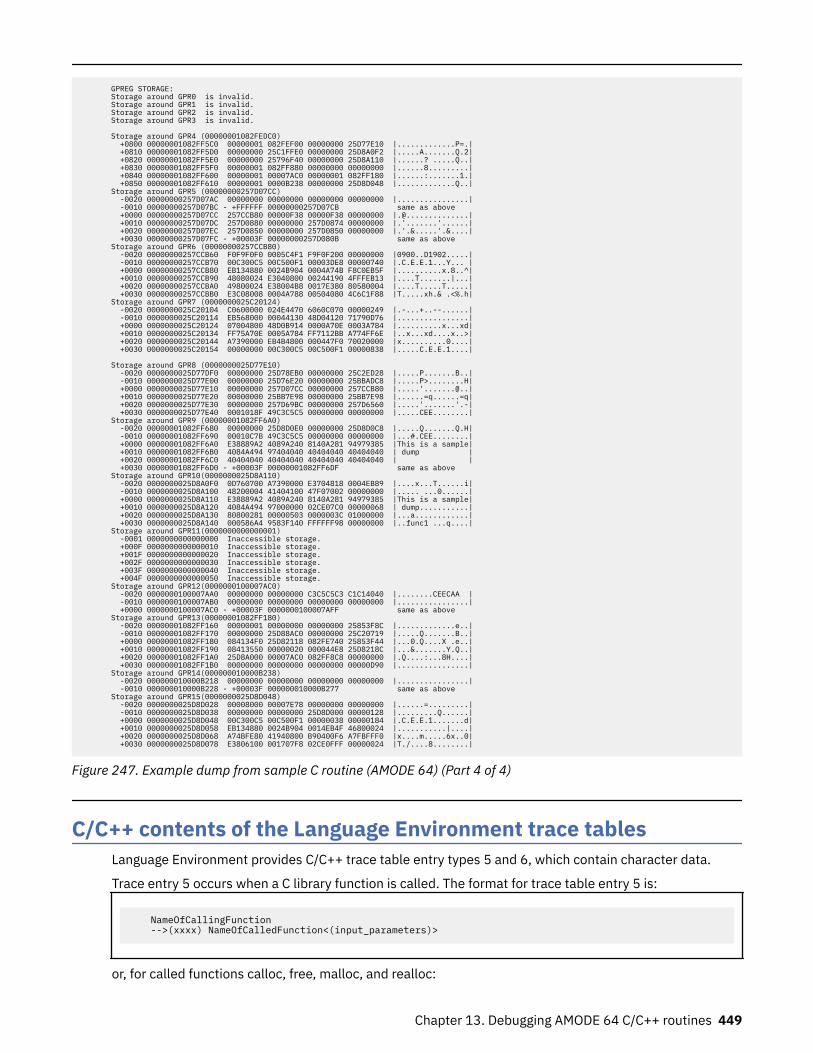
GPREG STORAGE: Storage around GPR0 is invalid. Storage around GPR1 is invalid. Storage around GPR2 is invalid. Storage around GPR3 is invalid.
Storage around GPR4 (00000001082FEDC0) +0800 00000001082FF5C0 00000001 082FEF00 00000000 25D77E10 |.............P=.| +0810 00000001082FF5D0 00000000 25C1FFE0 00000000 25D8A0F2 |.....A.......Q.2| +0820 00000001082FF5E0 00000000 25796F40 00000000 25D8A110 |......? .....Q..| +0830 00000001082FF5F0 00000001 082FF880 00000000 00000000 |......8.........| +0840 00000001082FF600 00000001 00007AC0 00000001 082FF180 |......:.......1.| +0850 00000001082FF610 00000001 0000B238 00000000 25D8D048 |.............Q..| Storage around GPR5 (00000000257D07CC) -0020 00000000257D07AC 00000000 00000000 00000000 00000000 |................| -0010 00000000257D07BC - +FFFFFF 00000000257D07CB same as above +0000 00000000257D07CC 257CCB80 00000F38 00000F38 00000000 |.@..............| +0010 00000000257D07DC 257D0880 00000000 257D0874 00000000 |.'.......'......| +0020 00000000257D07EC 257D0850 00000000 257D0850 00000000 |.'.&.....'.&....| +0030 00000000257D07FC - +00003F 00000000257D080B same as above Storage around GPR6 (00000000257CCB80) -0020 00000000257CCB60 F0F9F0F0 0005C4F1 F9F0F200 00000000 |0900..D1902.....| -0010 00000000257CCB70 00C300C5 00C500F1 00003DE8 00000740 |.C.E.E.1...Y... | +0000 00000000257CCB80 EB134880 0024B904 0004A74B F8C0EB5F |..........x.8..^| +0010 00000000257CCB90 48080024 E3040800 00244190 4FFFEB13 |....T.......|...| +0020 00000000257CCBA0 49800024 E38004B8 0017E380 80580004 |....T.....T.....| +0030 00000000257CCBB0 E3C08008 0004A788 00504080 4C6C1F88 |T.....xh.& .<%.h| Storage around GPR7 (0000000025C20124) -0020 0000000025C20104 C0600000 024E4470 6060C070 00000249 |.-...+..--......| -0010 0000000025C20114 EB568000 00044130 48D04120 71790D76 |................| +0000 0000000025C20124 07004800 48D0B914 0000A70E 0003A784 |..........x...xd| +0010 0000000025C20134 FF75A70E 0005A784 FF7112BB A774FF6E |..x...xd....x..>| +0020 0000000025C20144 A7390000 EB4B4800 000447F0 70020000 |x..........0....| +0030 0000000025C20154 00000000 00C300C5 00C500F1 00000838 |.....C.E.E.1....|
Storage around GPR8 (0000000025D77E10) -0020 0000000025D77DF0 00000000 25D78EB0 00000000 25C2ED28 |.....P.......B..| -0010 0000000025D77E00 00000000 25D76E20 00000000 25BBADC8 |.....P>........H| +0000 0000000025D77E10 00000000 257D07CC 00000000 257CCB80 |.....'.......@..| +0010 0000000025D77E20 00000000 25BB7E98 00000000 25BB7E98 |......=q......=q| +0020 0000000025D77E30 00000000 257D69BC 00000000 257D6560 |.....'.......'.-| +0030 0000000025D77E40 0001018F 49C3C5C5 00000000 00000000 |.....CEE........| Storage around GPR9 (00000001082FF6A0) -0020 00000001082FF680 00000000 25D8D0E0 00000000 25D8D0C8 |.....Q.......Q.H| -0010 00000001082FF690 00010C7B 49C3C5C5 00000000 00000000 |...#.CEE........| +0000 00000001082FF6A0 E38889A2 4089A240 8140A281 94979385 |This is a sample| +0010 00000001082FF6B0 4084A494 97404040 40404040 40404040 | dump | +0020 00000001082FF6C0 40404040 40404040 40404040 40404040 | | +0030 00000001082FF6D0 - +00003F 00000001082FF6DF same as above Storage around GPR10(0000000025D8A110) -0020 0000000025D8A0F0 0D760700 A7390000 E3704818 0004EB89 |....x...T......i| -0010 0000000025D8A100 48200004 41404100 47F07002 00000000 |..... ...0......| +0000 0000000025D8A110 E38889A2 4089A240 8140A281 94979385 |This is a sample| +0010 0000000025D8A120 4084A494 97000000 02CE07C0 00000068 | dump...........| +0020 0000000025D8A130 80800281 00000503 0000003C 01000000 |...a............| +0030 0000000025D8A140 000586A4 9583F140 FFFFFF98 00000000 |..func1 ...q....| Storage around GPR11(0000000000000001) -0001 0000000000000000 Inaccessible storage. +000F 0000000000000010 Inaccessible storage. +001F 0000000000000020 Inaccessible storage. +002F 0000000000000030 Inaccessible storage. +003F 0000000000000040 Inaccessible storage. +004F 0000000000000050 Inaccessible storage. Storage around GPR12(0000000100007AC0) -0020 0000000100007AA0 00000000 00000000 C3C5C5C3 C1C14040 |........CEECAA | -0010 0000000100007AB0 00000000 00000000 00000000 00000000 |................| +0000 0000000100007AC0 - +00003F 0000000100007AFF same as above Storage around GPR13(00000001082FF180) -0020 00000001082FF160 00000001 00000000 00000000 25853F8C |.............e..| -0010 00000001082FF170 00000000 25D88AC0 00000000 25C20719 |.....Q.......B..| +0000 00000001082FF180 084134F0 25D82118 082FE740 25853F44 |...0.Q....X .e..| +0010 00000001082FF190 08413550 00000020 000044E8 25D8218C |...&.......Y.Q..| +0020 00000001082FF1A0 25D8A000 00007AC0 082FF8C8 00000000 |.Q....:...8H....| +0030 00000001082FF1B0 00000000 00000000 00000000 00000D90 |................| Storage around GPR14(000000010000B238) -0020 000000010000B218 00000000 00000000 00000000 00000000 |................| -0010 000000010000B228 - +00003F 000000010000B277 same as above Storage around GPR15(0000000025D8D048) -0020 0000000025D8D028 00008000 00007E78 00000000 00000000 |......=.........| -0010 0000000025D8D038 00000000 00000000 25D8D000 00000128 |.........Q......| +0000 0000000025D8D048 00C300C5 00C500F1 00000038 00000184 |.C.E.E.1.......d| +0010 0000000025D8D058 EB134880 0024B904 0014EB4F 46800024 |...........|....| +0020 0000000025D8D068 A74BFE80 41940800 B90400F6 A7FBFFF0 |x....m.....6x..0| +0030 0000000025D8D078 E3806100 001707F8 02CE0FFF 00000024 |T./....8........|
Figure 247. Example dump from sample C routine (AMODE 64) (Part 4 of 4)
C/C++ contents of the Language Environment trace tablesLanguage Environment provides C/C++ trace table entry types 5 and 6, which contain character data.
Trace entry 5 occurs when a C library function is called. The format for trace table entry 5 is:
NameOfCallingFunction -->(xxxx) NameOfCalledFunction<(input_parameters)>
or, for called functions calloc, free, malloc, and realloc:
Chapter 13. Debugging AMODE 64 C/C++ routines 449
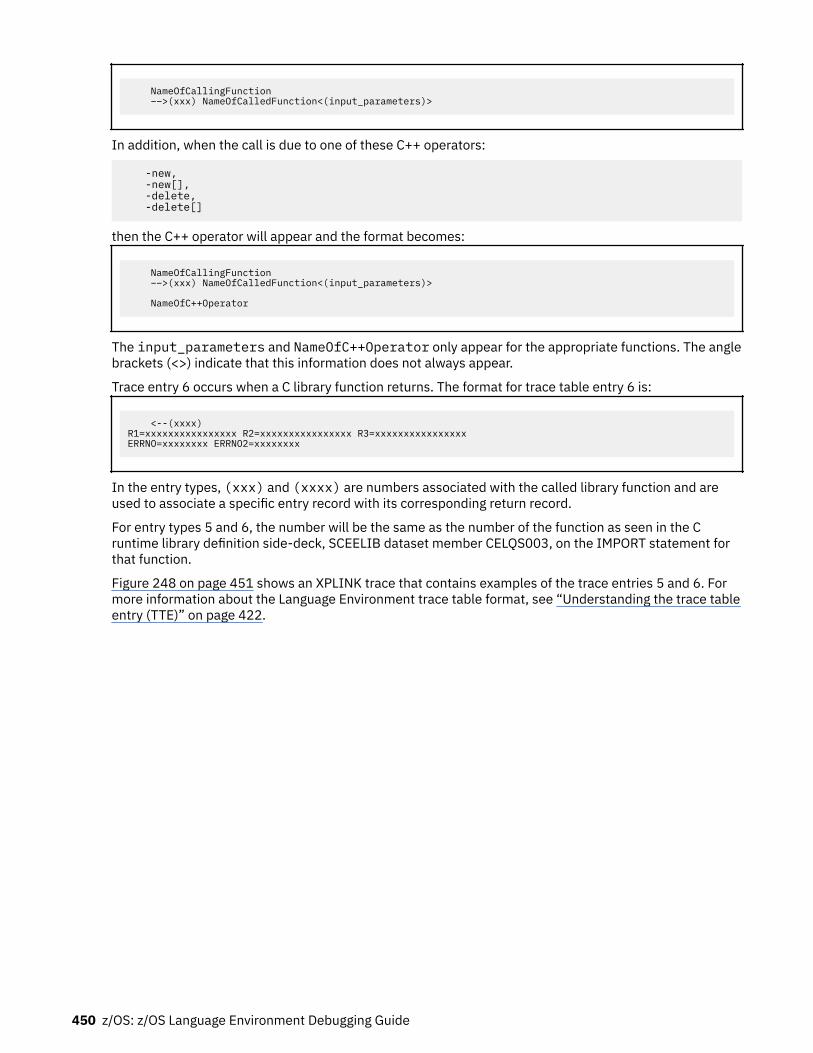
NameOfCallingFunction ––>(xxx) NameOfCalledFunction<(input_parameters)>
In addition, when the call is due to one of these C++ operators:
-new, -new[], -delete, -delete[]
then the C++ operator will appear and the format becomes:
NameOfCallingFunction ––>(xxx) NameOfCalledFunction<(input_parameters)> NameOfC++Operator
The input_parameters and NameOfC++Operator only appear for the appropriate functions. The anglebrackets (<>) indicate that this information does not always appear.
Trace entry 6 occurs when a C library function returns. The format for trace table entry 6 is:
<--(xxxx)R1=xxxxxxxxxxxxxxxx R2=xxxxxxxxxxxxxxxx R3=xxxxxxxxxxxxxxxxERRNO=xxxxxxxx ERRNO2=xxxxxxxx
In the entry types, (xxx) and (xxxx) are numbers associated with the called library function and areused to associate a specific entry record with its corresponding return record.
For entry types 5 and 6, the number will be the same as the number of the function as seen in the Cruntime library definition side-deck, SCEELIB dataset member CELQS003, on the IMPORT statement forthat function.
Figure 248 on page 451 shows an XPLINK trace that contains examples of the trace entries 5 and 6. Formore information about the Language Environment trace table format, see “Understanding the trace tableentry (TTE)” on page 422.
450 z/OS: z/OS Language Environment Debugging Guide
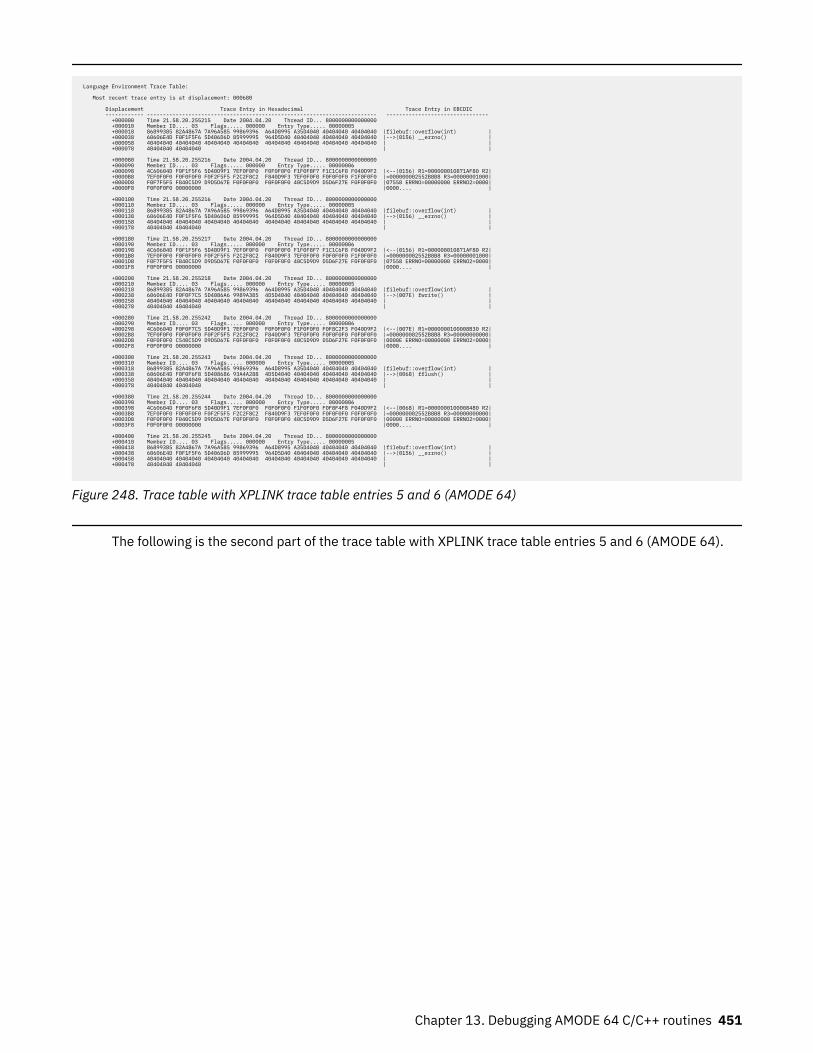
Language Environment Trace Table:
Most recent trace entry is at displacement: 000680
Displacement Trace Entry in Hexadecimal Trace Entry in EBCDIC ------------ ------------------------------------------------------------------------ -------------------------------- +000000 Time 21.58.20.255215 Date 2004.04.20 Thread ID... 8000000000000000 +000010 Member ID.... 03 Flags..... 000000 Entry Type..... 00000005 +000018 86899385 82A4867A 7A96A585 99869396 A64D8995 A35D4040 40404040 40404040 |filebuf::overflow(int) | +000038 60606E4D F0F1F5F6 5D406D6D 85999995 964D5D40 40404040 40404040 40404040 |-->(0156) __errno() | +000058 40404040 40404040 40404040 40404040 40404040 40404040 40404040 40404040 | | +000078 40404040 40404040 | |
+000080 Time 21.58.20.255216 Date 2004.04.20 Thread ID... 8000000000000000 +000090 Member ID.... 03 Flags..... 000000 Entry Type..... 00000006 +000098 4C60604D F0F1F5F6 5D40D9F1 7EF0F0F0 F0F0F0F0 F1F0F8F7 F1C1C6F8 F040D9F2 |<--(0156) R1=000000010871AF80 R2| +0000B8 7EF0F0F0 F0F0F0F0 F0F2F5F5 F2C2F8C2 F840D9F3 7EF0F0F0 F0F0F0F0 F1F0F0F0 |=000000002552B8B8 R3=00000001000| +0000D8 F0F7F5F5 F840C5D9 D9D5D67E F0F0F0F0 F0F0F0F0 40C5D9D9 D5D6F27E F0F0F0F0 |07558 ERRNO=00000000 ERRNO2=0000| +0000F8 F0F0F0F0 00000000 |0000.... |
+000100 Time 21.58.20.255216 Date 2004.04.20 Thread ID... 8000000000000000 +000110 Member ID.... 03 Flags..... 000000 Entry Type..... 00000005 +000118 86899385 82A4867A 7A96A585 99869396 A64D8995 A35D4040 40404040 40404040 |filebuf::overflow(int) | +000138 60606E4D F0F1F5F6 5D406D6D 85999995 964D5D40 40404040 40404040 40404040 |-->(0156) __errno() | +000158 40404040 40404040 40404040 40404040 40404040 40404040 40404040 40404040 | | +000178 40404040 40404040 | |
+000180 Time 21.58.20.255217 Date 2004.04.20 Thread ID... 8000000000000000 +000190 Member ID.... 03 Flags..... 000000 Entry Type..... 00000006 +000198 4C60604D F0F1F5F6 5D40D9F1 7EF0F0F0 F0F0F0F0 F1F0F8F7 F1C1C6F8 F040D9F2 |<--(0156) R1=000000010871AF80 R2| +0001B8 7EF0F0F0 F0F0F0F0 F0F2F5F5 F2C2F8C2 F840D9F3 7EF0F0F0 F0F0F0F0 F1F0F0F0 |=000000002552B8B8 R3=00000001000| +0001D8 F0F7F5F5 F840C5D9 D9D5D67E F0F0F0F0 F0F0F0F0 40C5D9D9 D5D6F27E F0F0F0F0 |07558 ERRNO=00000000 ERRNO2=0000| +0001F8 F0F0F0F0 00000000 |0000.... |
+000200 Time 21.58.20.255218 Date 2004.04.20 Thread ID... 8000000000000000 +000210 Member ID.... 03 Flags..... 000000 Entry Type..... 00000005 +000218 86899385 82A4867A 7A96A585 99869396 A64D8995 A35D4040 40404040 40404040 |filebuf::overflow(int) | +000238 60606E4D F0F0F7C5 5D4086A6 9989A385 4D5D4040 40404040 40404040 40404040 |-->(007E) fwrite() | +000258 40404040 40404040 40404040 40404040 40404040 40404040 40404040 40404040 | | +000278 40404040 40404040 | |
+000280 Time 21.58.20.255242 Date 2004.04.20 Thread ID... 8000000000000000 +000290 Member ID.... 03 Flags..... 000000 Entry Type..... 00000006 +000298 4C60604D F0F0F7C5 5D40D9F1 7EF0F0F0 F0F0F0F0 F1F0F0F0 F0F8C2F3 F040D9F2 |<--(007E) R1=0000000100008B30 R2| +0002B8 7EF0F0F0 F0F0F0F0 F0F2F5F5 F2C2F8C2 F840D9F3 7EF0F0F0 F0F0F0F0 F0F0F0F0 |=000000002552B8B8 R3=00000000000| +0002D8 F0F0F0F0 C540C5D9 D9D5D67E F0F0F0F0 F0F0F0F0 40C5D9D9 D5D6F27E F0F0F0F0 |0000E ERRNO=00000000 ERRNO2=0000| +0002F8 F0F0F0F0 00000000 |0000.... |
+000300 Time 21.58.20.255243 Date 2004.04.20 Thread ID... 8000000000000000 +000310 Member ID.... 03 Flags..... 000000 Entry Type..... 00000005 +000318 86899385 82A4867A 7A96A585 99869396 A64D8995 A35D4040 40404040 40404040 |filebuf::overflow(int) | +000338 60606E4D F0F0F6F8 5D408686 93A4A288 4D5D4040 40404040 40404040 40404040 |-->(0068) fflush() | +000358 40404040 40404040 40404040 40404040 40404040 40404040 40404040 40404040 | | +000378 40404040 40404040 | |
+000380 Time 21.58.20.255244 Date 2004.04.20 Thread ID... 8000000000000000 +000390 Member ID.... 03 Flags..... 000000 Entry Type..... 00000006 +000398 4C60604D F0F0F6F8 5D40D9F1 7EF0F0F0 F0F0F0F0 F1F0F0F0 F0F8F4F8 F040D9F2 |<--(0068) R1=0000000100008480 R2| +0003B8 7EF0F0F0 F0F0F0F0 F0F2F5F5 F2C2F8C2 F840D9F3 7EF0F0F0 F0F0F0F0 F0F0F0F0 |=000000002552B8B8 R3=00000000000| +0003D8 F0F0F0F0 F040C5D9 D9D5D67E F0F0F0F0 F0F0F0F0 40C5D9D9 D5D6F27E F0F0F0F0 |00000 ERRNO=00000000 ERRNO2=0000| +0003F8 F0F0F0F0 00000000 |0000.... |
+000400 Time 21.58.20.255245 Date 2004.04.20 Thread ID... 8000000000000000 +000410 Member ID.... 03 Flags..... 000000 Entry Type..... 00000005 +000418 86899385 82A4867A 7A96A585 99869396 A64D8995 A35D4040 40404040 40404040 |filebuf::overflow(int) | +000438 60606E4D F0F1F5F6 5D406D6D 85999995 964D5D40 40404040 40404040 40404040 |-->(0156) __errno() | +000458 40404040 40404040 40404040 40404040 40404040 40404040 40404040 40404040 | | +000478 40404040 40404040 | |
Figure 248. Trace table with XPLINK trace table entries 5 and 6 (AMODE 64)
The following is the second part of the trace table with XPLINK trace table entries 5 and 6 (AMODE 64).
Chapter 13. Debugging AMODE 64 C/C++ routines 451
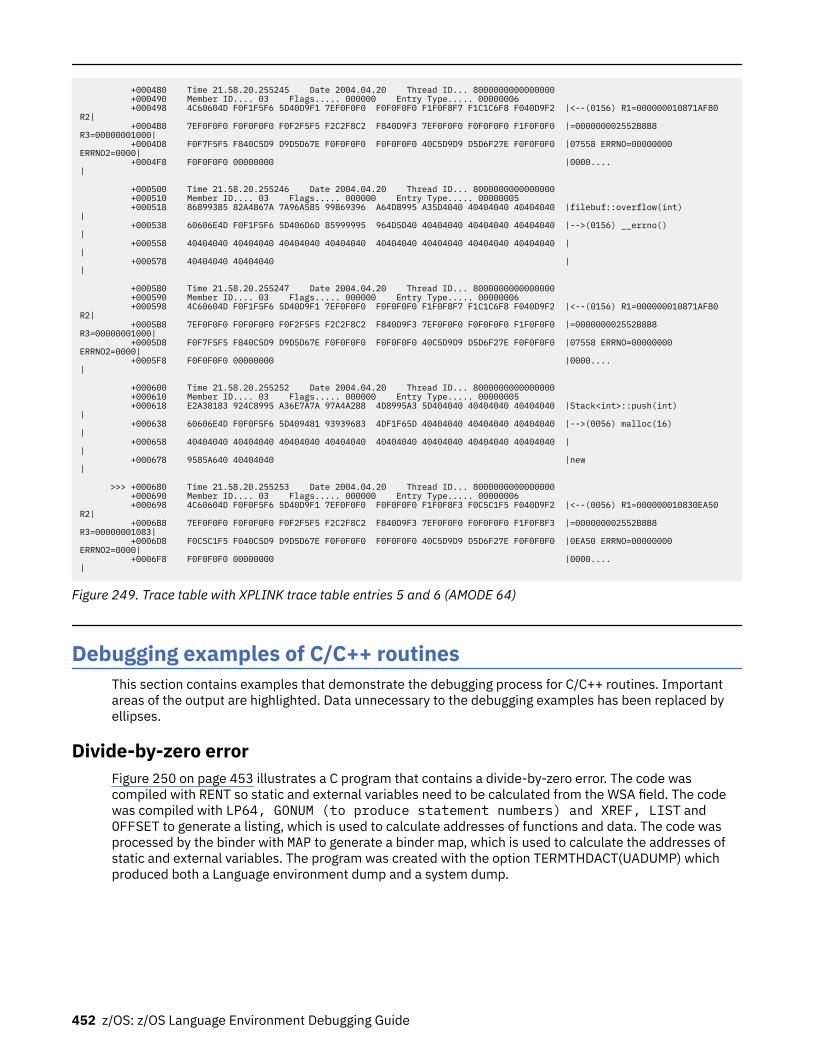
+000480 Time 21.58.20.255245 Date 2004.04.20 Thread ID... 8000000000000000 +000490 Member ID.... 03 Flags..... 000000 Entry Type..... 00000006 +000498 4C60604D F0F1F5F6 5D40D9F1 7EF0F0F0 F0F0F0F0 F1F0F8F7 F1C1C6F8 F040D9F2 |<--(0156) R1=000000010871AF80 R2| +0004B8 7EF0F0F0 F0F0F0F0 F0F2F5F5 F2C2F8C2 F840D9F3 7EF0F0F0 F0F0F0F0 F1F0F0F0 |=000000002552B8B8 R3=00000001000| +0004D8 F0F7F5F5 F840C5D9 D9D5D67E F0F0F0F0 F0F0F0F0 40C5D9D9 D5D6F27E F0F0F0F0 |07558 ERRNO=00000000 ERRNO2=0000| +0004F8 F0F0F0F0 00000000 |0000.... |
+000500 Time 21.58.20.255246 Date 2004.04.20 Thread ID... 8000000000000000 +000510 Member ID.... 03 Flags..... 000000 Entry Type..... 00000005 +000518 86899385 82A4867A 7A96A585 99869396 A64D8995 A35D4040 40404040 40404040 |filebuf::overflow(int) | +000538 60606E4D F0F1F5F6 5D406D6D 85999995 964D5D40 40404040 40404040 40404040 |-->(0156) __errno() | +000558 40404040 40404040 40404040 40404040 40404040 40404040 40404040 40404040 | | +000578 40404040 40404040 | |
+000580 Time 21.58.20.255247 Date 2004.04.20 Thread ID... 8000000000000000 +000590 Member ID.... 03 Flags..... 000000 Entry Type..... 00000006 +000598 4C60604D F0F1F5F6 5D40D9F1 7EF0F0F0 F0F0F0F0 F1F0F8F7 F1C1C6F8 F040D9F2 |<--(0156) R1=000000010871AF80 R2| +0005B8 7EF0F0F0 F0F0F0F0 F0F2F5F5 F2C2F8C2 F840D9F3 7EF0F0F0 F0F0F0F0 F1F0F0F0 |=000000002552B8B8 R3=00000001000| +0005D8 F0F7F5F5 F840C5D9 D9D5D67E F0F0F0F0 F0F0F0F0 40C5D9D9 D5D6F27E F0F0F0F0 |07558 ERRNO=00000000 ERRNO2=0000| +0005F8 F0F0F0F0 00000000 |0000.... |
+000600 Time 21.58.20.255252 Date 2004.04.20 Thread ID... 8000000000000000 +000610 Member ID.... 03 Flags..... 000000 Entry Type..... 00000005 +000618 E2A38183 924C8995 A36E7A7A 97A4A288 4D8995A3 5D404040 40404040 40404040 |Stack<int>::push(int) | +000638 60606E4D F0F0F5F6 5D409481 93939683 4DF1F65D 40404040 40404040 40404040 |-->(0056) malloc(16) | +000658 40404040 40404040 40404040 40404040 40404040 40404040 40404040 40404040 | | +000678 9585A640 40404040 |new |
>>> +000680 Time 21.58.20.255253 Date 2004.04.20 Thread ID... 8000000000000000 +000690 Member ID.... 03 Flags..... 000000 Entry Type..... 00000006 +000698 4C60604D F0F0F5F6 5D40D9F1 7EF0F0F0 F0F0F0F0 F1F0F8F3 F0C5C1F5 F040D9F2 |<--(0056) R1=000000010830EA50 R2| +0006B8 7EF0F0F0 F0F0F0F0 F0F2F5F5 F2C2F8C2 F840D9F3 7EF0F0F0 F0F0F0F0 F1F0F8F3 |=000000002552B8B8 R3=00000001083| +0006D8 F0C5C1F5 F040C5D9 D9D5D67E F0F0F0F0 F0F0F0F0 40C5D9D9 D5D6F27E F0F0F0F0 |0EA50 ERRNO=00000000 ERRNO2=0000| +0006F8 F0F0F0F0 00000000 |0000.... |
Figure 249. Trace table with XPLINK trace table entries 5 and 6 (AMODE 64)
Debugging examples of C/C++ routinesThis section contains examples that demonstrate the debugging process for C/C++ routines. Importantareas of the output are highlighted. Data unnecessary to the debugging examples has been replaced byellipses.
Divide-by-zero errorFigure 250 on page 453 illustrates a C program that contains a divide-by-zero error. The code wascompiled with RENT so static and external variables need to be calculated from the WSA field. The codewas compiled with LP64, GONUM (to produce statement numbers) and XREF, LIST andOFFSET to generate a listing, which is used to calculate addresses of functions and data. The code wasprocessed by the binder with MAP to generate a binder map, which is used to calculate the addresses ofstatic and external variables. The program was created with the option TERMTHDACT(UADUMP) whichproduced both a Language environment dump and a system dump.
452 z/OS: z/OS Language Environment Debugging Guide
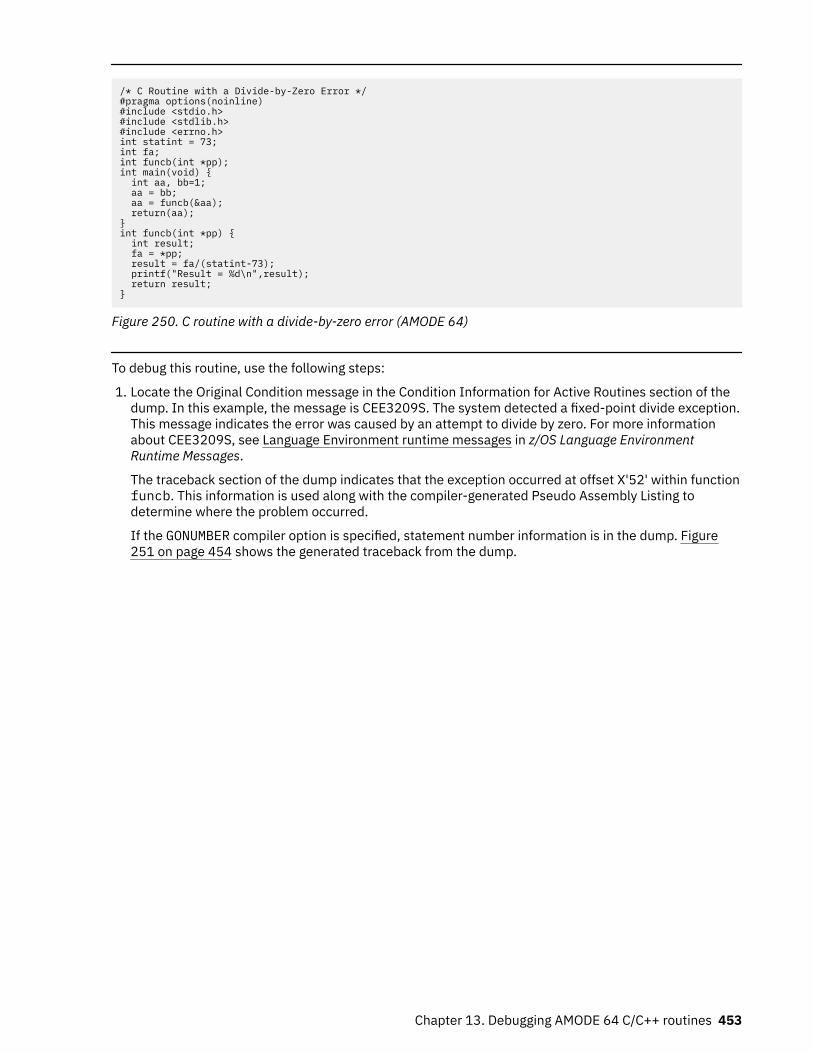
/* C Routine with a Divide-by-Zero Error */#pragma options(noinline)#include <stdio.h>#include <stdlib.h>#include <errno.h>int statint = 73;int fa;int funcb(int *pp);int main(void) { int aa, bb=1; aa = bb; aa = funcb(&aa); return(aa);}int funcb(int *pp) { int result; fa = *pp; result = fa/(statint-73); printf("Result = %d\n",result); return result;}
Figure 250. C routine with a divide-by-zero error (AMODE 64)
To debug this routine, use the following steps:
1. Locate the Original Condition message in the Condition Information for Active Routines section of thedump. In this example, the message is CEE3209S. The system detected a fixed-point divide exception.This message indicates the error was caused by an attempt to divide by zero. For more informationabout CEE3209S, see Language Environment runtime messages in z/OS Language EnvironmentRuntime Messages.
The traceback section of the dump indicates that the exception occurred at offset X'52' within functionfuncb. This information is used along with the compiler-generated Pseudo Assembly Listing todetermine where the problem occurred.
If the GONUMBER compiler option is specified, statement number information is in the dump. Figure251 on page 454 shows the generated traceback from the dump.
Chapter 13. Debugging AMODE 64 C/C++ routines 453
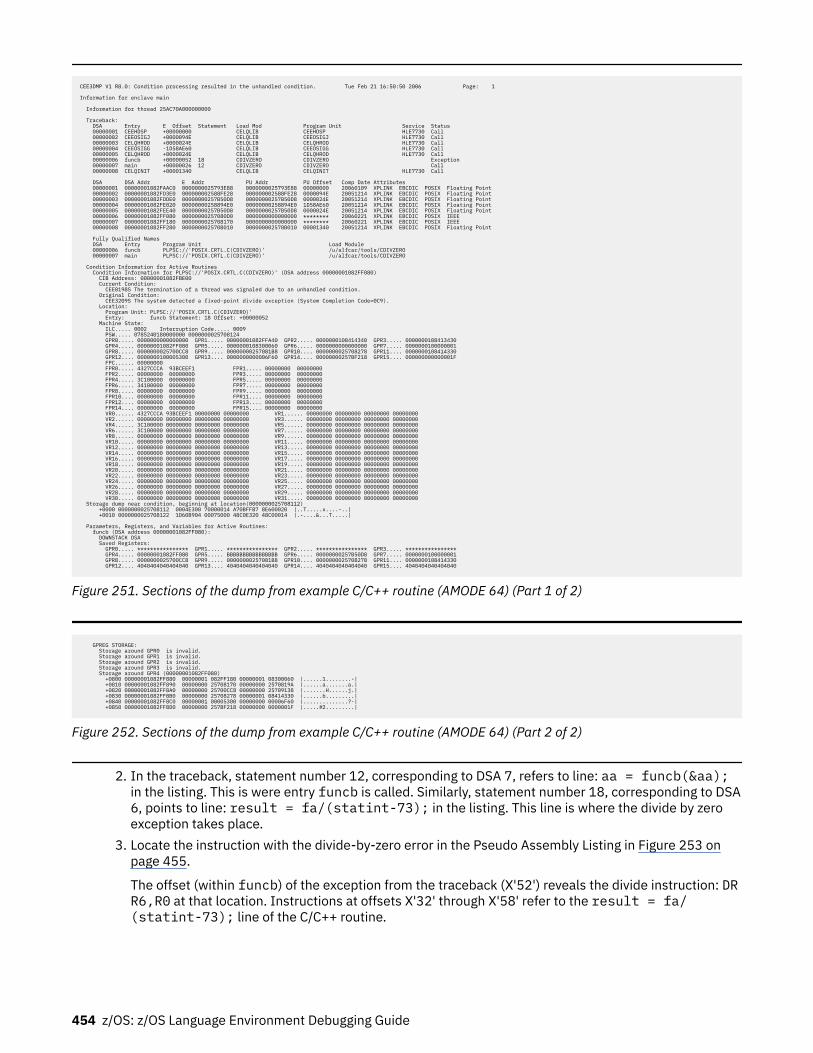
CEE3DMP V1 R8.0: Condition processing resulted in the unhandled condition. Tue Feb 21 16:50:50 2006 Page: 1
Information for enclave main
Information for thread 25AC70A000000000
Traceback: DSA Entry E Offset Statement Load Mod Program Unit Service Status 00000001 CEEHDSP +00000000 CELQLIB CEEHDSP HLE7730 Call 00000002 CEEOSIGJ +0000094E CELQLIB CEEOSIGJ HLE7730 Call 00000003 CELQHROD +0000024E CELQLIB CELQHROD HLE7730 Call 00000004 CEEOSIGG -1D58AE60 CELQLIB CEEOSIGG HLE7730 Call 00000005 CELQHROD +0000024E CELQLIB CELQHROD HLE7730 Call 00000006 funcb +00000052 18 CDIVZERO CDIVZERO Exception 00000007 main +00000026 12 CDIVZERO CDIVZERO Call 00000008 CELQINIT +00001340 CELQLIB CELQINIT HLE7730 Call
DSA DSA Addr E Addr PU Addr PU Offset Comp Date Attributes 00000001 00000001082FAAC0 0000000025793E88 0000000025793E88 00000000 20060109 XPLINK EBCDIC POSIX Floating Point 00000002 00000001082FD3E0 000000002588FE28 000000002588FE28 0000094E 20051214 XPLINK EBCDIC POSIX Floating Point 00000003 00000001082FDDE0 00000000257B50D8 00000000257B50D8 0000024E 20051214 XPLINK EBCDIC POSIX Floating Point 00000004 00000001082FE020 00000000258894E0 00000000258894E0 1D58AE60 20051214 XPLINK EBCDIC POSIX Floating Point 00000005 00000001082FEE40 00000000257B50D8 00000000257B50D8 0000024E 20051214 XPLINK EBCDIC POSIX Floating Point 00000006 00000001082FF080 00000000257080D0 0000000000000000 ******** 20060221 XPLINK EBCDIC POSIX IEEE 00000007 00000001082FF180 0000000025708170 0000000000000000 ******** 20060221 XPLINK EBCDIC POSIX IEEE 00000008 00000001082FF280 000000002570B010 000000002570B010 00001340 20051214 XPLINK EBCDIC POSIX Floating Point
Fully Qualified Names DSA Entry Program Unit Load Module 00000006 funcb PLPSC://'POSIX.CRTL.C(CDIVZERO)' /u/alfcar/tools/CDIVZERO 00000007 main PLPSC://'POSIX.CRTL.C(CDIVZERO)' /u/alfcar/tools/CDIVZERO
Condition Information for Active Routines Condition Information for PLPSC://'POSIX.CRTL.C(CDIVZERO)' (DSA address 00000001082FF080) CIB Address: 00000001082FBE00 Current Condition: CEE0198S The termination of a thread was signaled due to an unhandled condition. Original Condition: CEE3209S The system detected a fixed-point divide exception (System Completion Code=0C9). Location: Program Unit: PLPSC://'POSIX.CRTL.C(CDIVZERO)' Entry: funcb Statement: 18 Offset: +00000052 Machine State: ILC..... 0002 Interruption Code..... 0009 PSW..... 0785240180000000 0000000025708124 GPR0..... 0000000000000000 GPR1..... 00000001082FFA40 GPR2..... 0000000108414340 GPR3..... 0000000108413430 GPR4..... 00000001082FF080 GPR5..... 0000000108300060 GPR6..... 0000000000000000 GPR7..... 0000000100000001 GPR8..... 0000000025700CC8 GPR9..... 00000000257081B8 GPR10.... 0000000025708278 GPR11.... 0000000108414330 GPR12.... 0000000100005300 GPR13.... 0000000000006F60 GPR14.... 00000000257BF218 GPR15.... 000000000000001F FPC...... 00000000 FPR0..... 4327CCCA 93BCEEF1 FPR1..... 00000000 00000000 FPR2..... 00000000 00000000 FPR3..... 00000000 00000000 FPR4..... 3C100000 00000000 FPR5..... 00000000 00000000 FPR6..... 34100000 00000000 FPR7..... 00000000 00000000 FPR8..... 00000000 00000000 FPR9..... 00000000 00000000 FPR10.... 00000000 00000000 FPR11.... 00000000 00000000 FPR12.... 00000000 00000000 FPR13.... 00000000 00000000 FPR14.... 00000000 00000000 FPR15.... 00000000 00000000 VR0...... 4327CCCA 93BCEEF1 00000000 00000000 VR1...... 00000000 00000000 00000000 00000000 VR2...... 00000000 00000000 00000000 00000000 VR3...... 00000000 00000000 00000000 00000000 VR4...... 3C100000 00000000 00000000 00000000 VR5...... 00000000 00000000 00000000 00000000 VR6...... 3C100000 00000000 00000000 00000000 VR7...... 00000000 00000000 00000000 00000000 VR8...... 00000000 00000000 00000000 00000000 VR9...... 00000000 00000000 00000000 00000000 VR10..... 00000000 00000000 00000000 00000000 VR11..... 00000000 00000000 00000000 00000000 VR12..... 00000000 00000000 00000000 00000000 VR13..... 00000000 00000000 00000000 00000000 VR14..... 00000000 00000000 00000000 00000000 VR15..... 00000000 00000000 00000000 00000000 VR16..... 00000000 00000000 00000000 00000000 VR17..... 00000000 00000000 00000000 00000000 VR18..... 00000000 00000000 00000000 00000000 VR19..... 00000000 00000000 00000000 00000000 VR20..... 00000000 00000000 00000000 00000000 VR21..... 00000000 00000000 00000000 00000000 VR22..... 00000000 00000000 00000000 00000000 VR23..... 00000000 00000000 00000000 00000000 VR24..... 00000000 00000000 00000000 00000000 VR25..... 00000000 00000000 00000000 00000000 VR26..... 00000000 00000000 00000000 00000000 VR27..... 00000000 00000000 00000000 00000000 VR28..... 00000000 00000000 00000000 00000000 VR29..... 00000000 00000000 00000000 00000000 VR30..... 00000000 00000000 00000000 00000000 VR31..... 00000000 00000000 00000000 00000000 Storage dump near condition, beginning at location(0000000025708112) +0000 0000000025708112 0004E300 70000014 A70BFFB7 8E600020 |..T.....x....-..| +0010 0000000025708122 1D60B904 00075000 48C0E320 48C00014 |.-....&...T.....|
Parameters, Registers, and Variables for Active Routines: funcb (DSA address 00000001082FF080): DOWNSTACK DSA Saved Registers: GPR0..... **************** GPR1..... **************** GPR2..... **************** GPR3..... **************** GPR4..... 00000001082FF080 GPR5..... BBBBBBBBBBBBBBBB GPR6..... 00000000257B50D8 GPR7..... 0000000100000001 GPR8..... 0000000025700CC8 GPR9..... 00000000257081B8 GPR10.... 0000000025708278 GPR11.... 0000000108414330 GPR12.... 4040404040404040 GPR13.... 4040404040404040 GPR14.... 4040404040404040 GPR15.... 4040404040404040
Figure 251. Sections of the dump from example C/C++ routine (AMODE 64) (Part 1 of 2)
GPREG STORAGE: Storage around GPR0 is invalid. Storage around GPR1 is invalid. Storage around GPR2 is invalid. Storage around GPR3 is invalid. Storage around GPR4 (00000001082FF080) +0800 00000001082FF880 00000001 082FF180 00000001 08300060 |......1........-| +0810 00000001082FF890 00000000 25708170 00000000 2570819A |......a.......a.| +0820 00000001082FF8A0 00000000 25700CC8 00000000 25709138 |.......H......j.| +0830 00000001082FF8B0 00000000 25708278 00000001 08414330 |......b.........| +0840 00000001082FF8C0 00000001 00005300 00000000 00006F60 |..............?-| +0850 00000001082FF8D0 00000000 257BF218 00000000 0000001F |.....#2.........|
Figure 252. Sections of the dump from example C/C++ routine (AMODE 64) (Part 2 of 2)
2. In the traceback, statement number 12, corresponding to DSA 7, refers to line: aa = funcb(&aa);in the listing. This is were entry funcb is called. Similarly, statement number 18, corresponding to DSA6, points to line: result = fa/(statint-73); in the listing. This line is where the divide by zeroexception takes place.
3. Locate the instruction with the divide-by-zero error in the Pseudo Assembly Listing in Figure 253 onpage 455.
The offset (within funcb) of the exception from the traceback (X'52') reveals the divide instruction: DRR6,R0 at that location. Instructions at offsets X'32' through X'58' refer to the result = fa/(statint-73); line of the C/C++ routine.
454 z/OS: z/OS Language Environment Debugging Guide
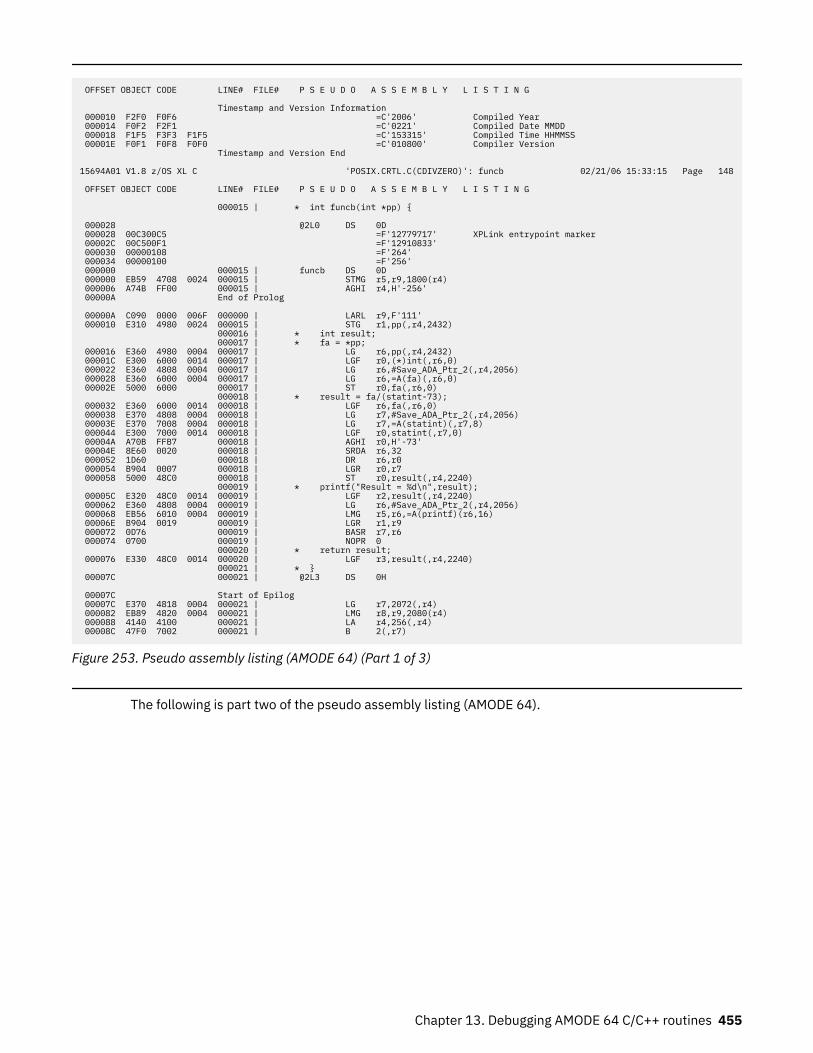
OFFSET OBJECT CODE LINE# FILE# P S E U D O A S S E M B L Y L I S T I N G
Timestamp and Version Information 000010 F2F0 F0F6 =C'2006' Compiled Year 000014 F0F2 F2F1 =C'0221' Compiled Date MMDD 000018 F1F5 F3F3 F1F5 =C'153315' Compiled Time HHMMSS 00001E F0F1 F0F8 F0F0 =C'010800' Compiler Version Timestamp and Version End
15694A01 V1.8 z/OS XL C 'POSIX.CRTL.C(CDIVZERO)': funcb 02/21/06 15:33:15 Page 148
OFFSET OBJECT CODE LINE# FILE# P S E U D O A S S E M B L Y L I S T I N G
000015 | * int funcb(int *pp) {
000028 @2L0 DS 0D 000028 00C300C5 =F'12779717' XPLink entrypoint marker 00002C 00C500F1 =F'12910833' 000030 00000108 =F'264' 000034 00000100 =F'256' 000000 000015 | funcb DS 0D 000000 EB59 4708 0024 000015 | STMG r5,r9,1800(r4) 000006 A74B FF00 000015 | AGHI r4,H'-256' 00000A End of Prolog
00000A C090 0000 006F 000000 | LARL r9,F'111' 000010 E310 4980 0024 000015 | STG r1,pp(,r4,2432) 000016 | * int result; 000017 | * fa = *pp; 000016 E360 4980 0004 000017 | LG r6,pp(,r4,2432) 00001C E300 6000 0014 000017 | LGF r0,(*)int(,r6,0) 000022 E360 4808 0004 000017 | LG r6,#Save_ADA_Ptr_2(,r4,2056) 000028 E360 6000 0004 000017 | LG r6,=A(fa)(,r6,0) 00002E 5000 6000 000017 | ST r0,fa(,r6,0) 000018 | * result = fa/(statint-73); 000032 E360 6000 0014 000018 | LGF r6,fa(,r6,0) 000038 E370 4808 0004 000018 | LG r7,#Save_ADA_Ptr_2(,r4,2056) 00003E E370 7008 0004 000018 | LG r7,=A(statint)(,r7,8) 000044 E300 7000 0014 000018 | LGF r0,statint(,r7,0) 00004A A70B FFB7 000018 | AGHI r0,H'-73' 00004E 8E60 0020 000018 | SRDA r6,32 000052 1D60 000018 | DR r6,r0 000054 B904 0007 000018 | LGR r0,r7 000058 5000 48C0 000018 | ST r0,result(,r4,2240) 000019 | * printf("Result = %d\n",result); 00005C E320 48C0 0014 000019 | LGF r2,result(,r4,2240) 000062 E360 4808 0004 000019 | LG r6,#Save_ADA_Ptr_2(,r4,2056) 000068 EB56 6010 0004 000019 | LMG r5,r6,=A(printf)(r6,16) 00006E B904 0019 000019 | LGR r1,r9 000072 0D76 000019 | BASR r7,r6 000074 0700 000019 | NOPR 0 000020 | * return result; 000076 E330 48C0 0014 000020 | LGF r3,result(,r4,2240) 000021 | * } 00007C 000021 | @2L3 DS 0H
00007C Start of Epilog 00007C E370 4818 0004 000021 | LG r7,2072(,r4) 000082 EB89 4820 0004 000021 | LMG r8,r9,2080(r4) 000088 4140 4100 000021 | LA r4,256(,r4) 00008C 47F0 7002 000021 | B 2(,r7)
Figure 253. Pseudo assembly listing (AMODE 64) (Part 1 of 3)
The following is part two of the pseudo assembly listing (AMODE 64).
Chapter 13. Debugging AMODE 64 C/C++ routines 455
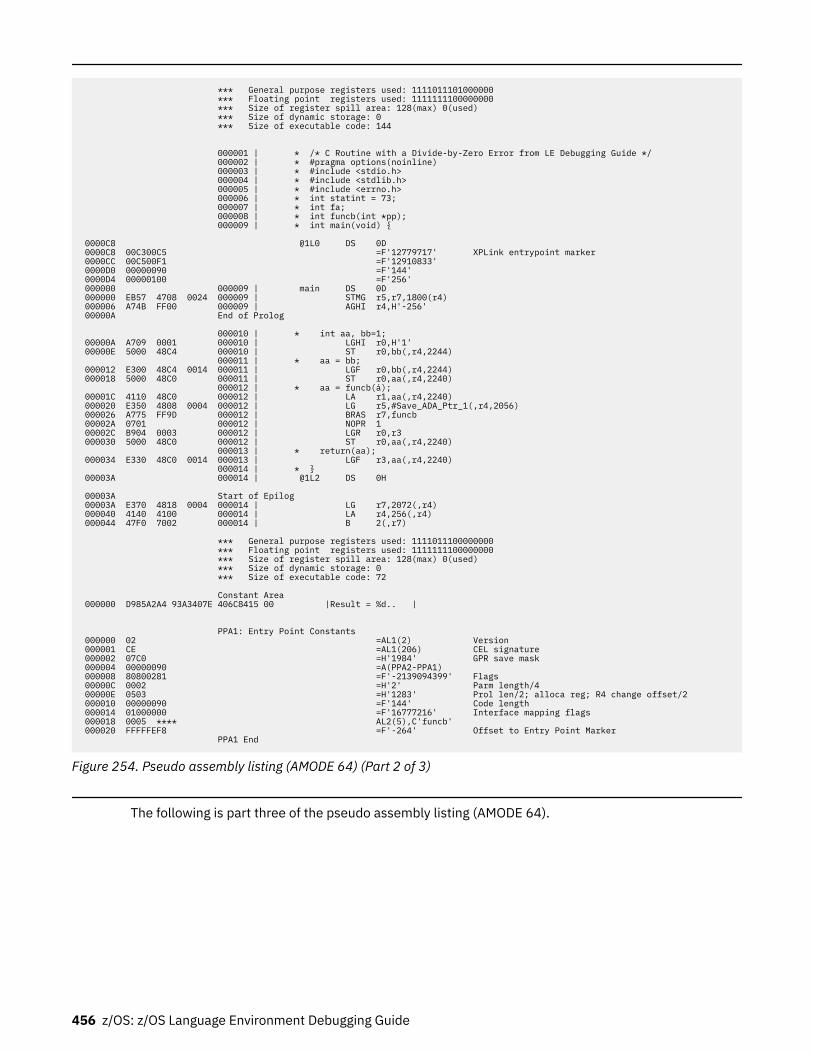
*** General purpose registers used: 1111011101000000 *** Floating point registers used: 1111111100000000 *** Size of register spill area: 128(max) 0(used) *** Size of dynamic storage: 0 *** Size of executable code: 144
000001 | * /* C Routine with a Divide-by-Zero Error from LE Debugging Guide */ 000002 | * #pragma options(noinline) 000003 | * #include <stdio.h> 000004 | * #include <stdlib.h> 000005 | * #include <errno.h> 000006 | * int statint = 73; 000007 | * int fa; 000008 | * int funcb(int *pp); 000009 | * int main(void) {
0000C8 @1L0 DS 0D 0000C8 00C300C5 =F'12779717' XPLink entrypoint marker 0000CC 00C500F1 =F'12910833' 0000D0 00000090 =F'144' 0000D4 00000100 =F'256' 000000 000009 | main DS 0D 000000 EB57 4708 0024 000009 | STMG r5,r7,1800(r4) 000006 A74B FF00 000009 | AGHI r4,H'-256' 00000A End of Prolog
000010 | * int aa, bb=1; 00000A A709 0001 000010 | LGHI r0,H'1' 00000E 5000 48C4 000010 | ST r0,bb(,r4,2244) 000011 | * aa = bb; 000012 E300 48C4 0014 000011 | LGF r0,bb(,r4,2244) 000018 5000 48C0 000011 | ST r0,aa(,r4,2240) 000012 | * aa = funcb(á); 00001C 4110 48C0 000012 | LA r1,aa(,r4,2240) 000020 E350 4808 0004 000012 | LG r5,#Save_ADA_Ptr_1(,r4,2056) 000026 A775 FF9D 000012 | BRAS r7,funcb 00002A 0701 000012 | NOPR 1 00002C B904 0003 000012 | LGR r0,r3 000030 5000 48C0 000012 | ST r0,aa(,r4,2240) 000013 | * return(aa); 000034 E330 48C0 0014 000013 | LGF r3,aa(,r4,2240) 000014 | * } 00003A 000014 | @1L2 DS 0H
00003A Start of Epilog 00003A E370 4818 0004 000014 | LG r7,2072(,r4) 000040 4140 4100 000014 | LA r4,256(,r4) 000044 47F0 7002 000014 | B 2(,r7)
*** General purpose registers used: 1111011100000000 *** Floating point registers used: 1111111100000000 *** Size of register spill area: 128(max) 0(used) *** Size of dynamic storage: 0 *** Size of executable code: 72
Constant Area 000000 D985A2A4 93A3407E 406C8415 00 |Result = %d.. |
PPA1: Entry Point Constants 000000 02 =AL1(2) Version 000001 CE =AL1(206) CEL signature 000002 07C0 =H'1984' GPR save mask 000004 00000090 =A(PPA2-PPA1) 000008 80800281 =F'-2139094399' Flags 00000C 0002 =H'2' Parm length/4 00000E 0503 =H'1283' Prol len/2; alloca reg; R4 change offset/2 000010 00000090 =F'144' Code length 000014 01000000 =F'16777216' Interface mapping flags 000018 0005 **** AL2(5),C'funcb' 000020 FFFFFEF8 =F'-264' Offset to Entry Point Marker PPA1 End
Figure 254. Pseudo assembly listing (AMODE 64) (Part 2 of 3)
The following is part three of the pseudo assembly listing (AMODE 64).
456 z/OS: z/OS Language Environment Debugging Guide
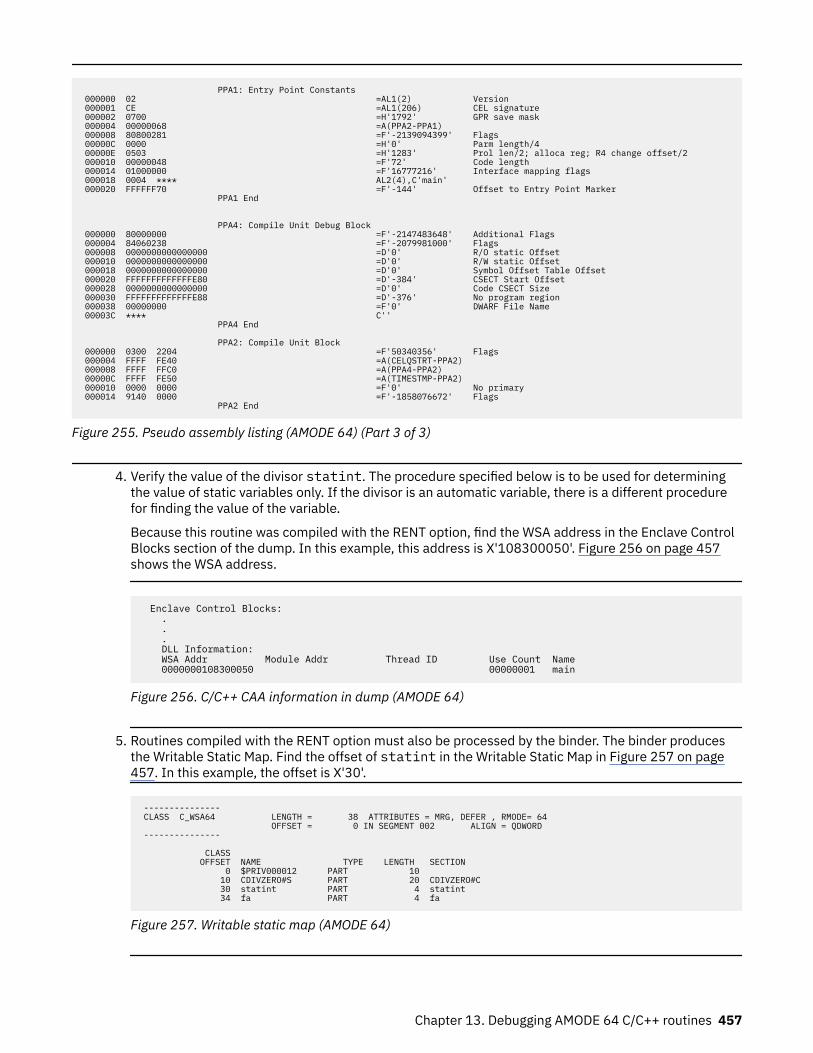
PPA1: Entry Point Constants 000000 02 =AL1(2) Version 000001 CE =AL1(206) CEL signature 000002 0700 =H'1792' GPR save mask 000004 00000068 =A(PPA2-PPA1) 000008 80800281 =F'-2139094399' Flags 00000C 0000 =H'0' Parm length/4 00000E 0503 =H'1283' Prol len/2; alloca reg; R4 change offset/2 000010 00000048 =F'72' Code length 000014 01000000 =F'16777216' Interface mapping flags 000018 0004 **** AL2(4),C'main' 000020 FFFFFF70 =F'-144' Offset to Entry Point Marker PPA1 End
PPA4: Compile Unit Debug Block 000000 80000000 =F'-2147483648' Additional Flags 000004 84060238 =F'-2079981000' Flags 000008 0000000000000000 =D'0' R/O static Offset 000010 0000000000000000 =D'0' R/W static Offset 000018 0000000000000000 =D'0' Symbol Offset Table Offset 000020 FFFFFFFFFFFFFE80 =D'-384' CSECT Start Offset 000028 0000000000000000 =D'0' Code CSECT Size 000030 FFFFFFFFFFFFFE88 =D'-376' No program region 000038 00000000 =F'0' DWARF File Name 00003C **** C'' PPA4 End
PPA2: Compile Unit Block 000000 0300 2204 =F'50340356' Flags 000004 FFFF FE40 =A(CELQSTRT-PPA2) 000008 FFFF FFC0 =A(PPA4-PPA2) 00000C FFFF FE50 =A(TIMESTMP-PPA2) 000010 0000 0000 =F'0' No primary 000014 9140 0000 =F'-1858076672' Flags PPA2 End
Figure 255. Pseudo assembly listing (AMODE 64) (Part 3 of 3)
4. Verify the value of the divisor statint. The procedure specified below is to be used for determiningthe value of static variables only. If the divisor is an automatic variable, there is a different procedurefor finding the value of the variable.
Because this routine was compiled with the RENT option, find the WSA address in the Enclave ControlBlocks section of the dump. In this example, this address is X'108300050'. Figure 256 on page 457shows the WSA address.
Enclave Control Blocks: . . . DLL Information: WSA Addr Module Addr Thread ID Use Count Name 0000000108300050 00000001 main
Figure 256. C/C++ CAA information in dump (AMODE 64)
5. Routines compiled with the RENT option must also be processed by the binder. The binder producesthe Writable Static Map. Find the offset of statint in the Writable Static Map in Figure 257 on page457. In this example, the offset is X'30'.
--------------- CLASS C_WSA64 LENGTH = 38 ATTRIBUTES = MRG, DEFER , RMODE= 64 OFFSET = 0 IN SEGMENT 002 ALIGN = QDWORD ---------------
CLASS OFFSET NAME TYPE LENGTH SECTION 0 $PRIV000012 PART 10 10 CDIVZERO#S PART 20 CDIVZERO#C 30 statint PART 4 statint 34 fa PART 4 fa
Figure 257. Writable static map (AMODE 64)
Chapter 13. Debugging AMODE 64 C/C++ routines 457
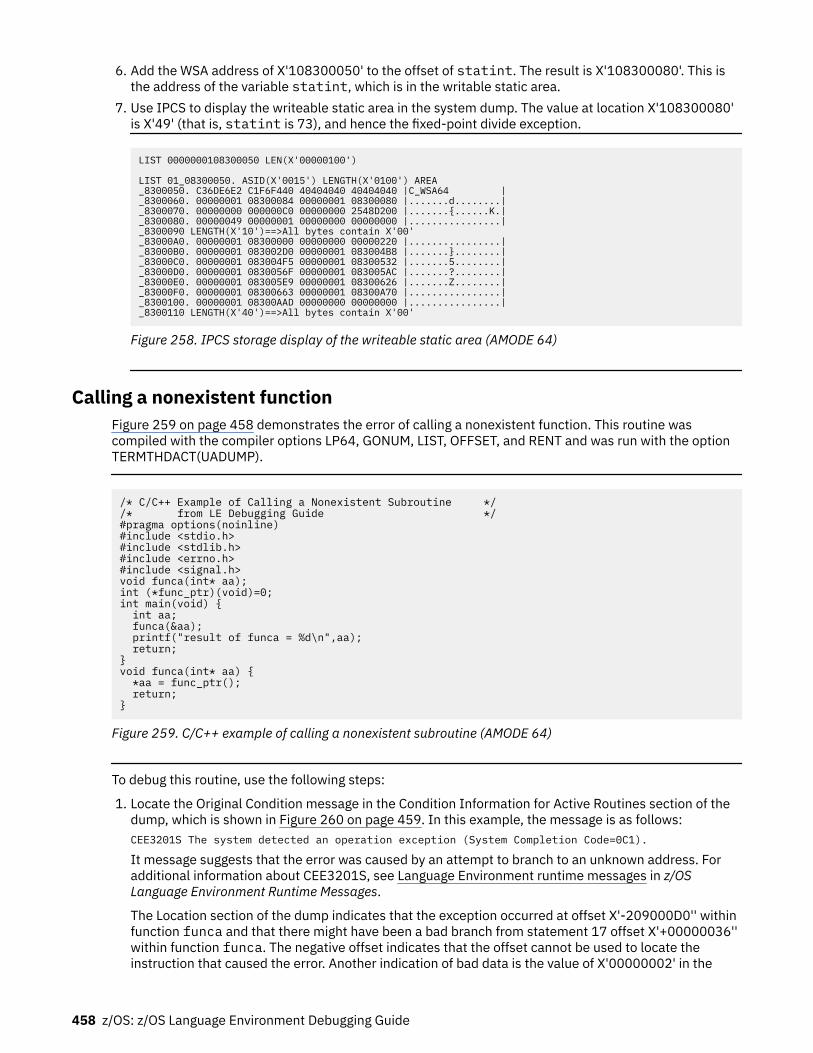
6. Add the WSA address of X'108300050' to the offset of statint. The result is X'108300080'. This isthe address of the variable statint, which is in the writable static area.
7. Use IPCS to display the writeable static area in the system dump. The value at location X'108300080'is X'49' (that is, statint is 73), and hence the fixed-point divide exception.
LIST 0000000108300050 LEN(X'00000100')
LIST 01_08300050. ASID(X'0015') LENGTH(X'0100') AREA_8300050. C36DE6E2 C1F6F440 40404040 40404040 |C_WSA64 |_8300060. 00000001 08300084 00000001 08300080 |.......d........|_8300070. 00000000 000000C0 00000000 2548D200 |.......{......K.|_8300080. 00000049 00000001 00000000 00000000 |................|_8300090 LENGTH(X'10')==>All bytes contain X'00'_83000A0. 00000001 08300000 00000000 00000220 |................|_83000B0. 00000001 083002D0 00000001 083004B8 |.......}........|_83000C0. 00000001 083004F5 00000001 08300532 |.......5........|_83000D0. 00000001 0830056F 00000001 083005AC |.......?........|_83000E0. 00000001 083005E9 00000001 08300626 |.......Z........|_83000F0. 00000001 08300663 00000001 08300A70 |................|_8300100. 00000001 08300AAD 00000000 00000000 |................|_8300110 LENGTH(X'40')==>All bytes contain X'00'
Figure 258. IPCS storage display of the writeable static area (AMODE 64)
Calling a nonexistent functionFigure 259 on page 458 demonstrates the error of calling a nonexistent function. This routine wascompiled with the compiler options LP64, GONUM, LIST, OFFSET, and RENT and was run with the optionTERMTHDACT(UADUMP).
/* C/C++ Example of Calling a Nonexistent Subroutine *//* from LE Debugging Guide */#pragma options(noinline)#include <stdio.h>#include <stdlib.h>#include <errno.h>#include <signal.h>void funca(int* aa);int (*func_ptr)(void)=0;int main(void) { int aa; funca(&aa); printf("result of funca = %d\n",aa); return;}void funca(int* aa) { *aa = func_ptr(); return;}
Figure 259. C/C++ example of calling a nonexistent subroutine (AMODE 64)
To debug this routine, use the following steps:
1. Locate the Original Condition message in the Condition Information for Active Routines section of thedump, which is shown in Figure 260 on page 459. In this example, the message is as follows:CEE3201S The system detected an operation exception (System Completion Code=0C1).
It message suggests that the error was caused by an attempt to branch to an unknown address. Foradditional information about CEE3201S, see Language Environment runtime messages in z/OSLanguage Environment Runtime Messages.
The Location section of the dump indicates that the exception occurred at offset X'-209000D0'' withinfunction funca and that there might have been a bad branch from statement 17 offset X'+00000036''within function funca. The negative offset indicates that the offset cannot be used to locate theinstruction that caused the error. Another indication of bad data is the value of X'00000002' in the
458 z/OS: z/OS Language Environment Debugging Guide
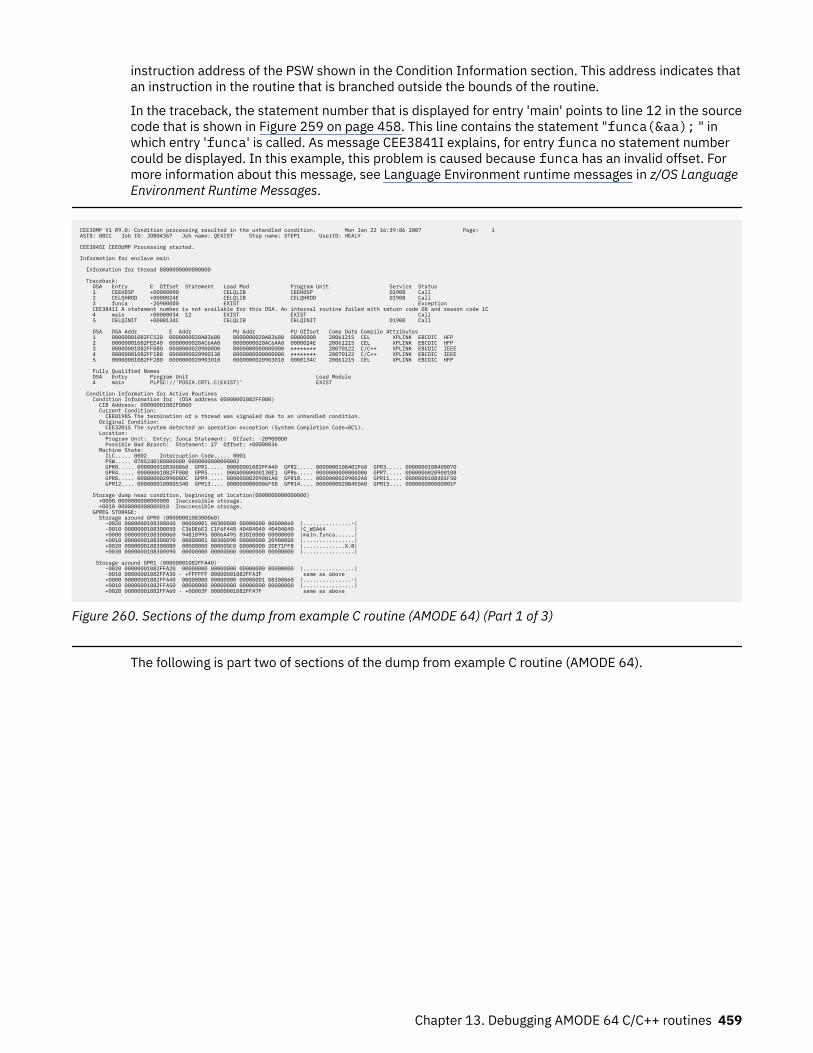
instruction address of the PSW shown in the Condition Information section. This address indicates thatan instruction in the routine that is branched outside the bounds of the routine.
In the traceback, the statement number that is displayed for entry 'main' points to line 12 in the sourcecode that is shown in Figure 259 on page 458. This line contains the statement "funca(&aa); " inwhich entry 'funca' is called. As message CEE3841I explains, for entry funca no statement numbercould be displayed. In this example, this problem is caused because funca has an invalid offset. Formore information about this message, see Language Environment runtime messages in z/OS LanguageEnvironment Runtime Messages.
CEE3DMP V1 R9.0: Condition processing resulted in the unhandled condition. Mon Jan 22 16:39:06 2007 Page: 1 ASID: 00CC Job ID: JOB04367 Job name: QEXIST Step name: STEP1 UserID: HEALY CEE3845I CEEDUMP Processing started. Information for enclave main Information for thread 8000000000000000 Traceback: DSA Entry E Offset Statement Load Mod Program Unit Service Status 1 CEEHDSP +00000000 CELQLIB CEEHDSP D1908 Call 2 CELQHROD +0000024E CELQLIB CELQHROD D1908 Call 3 funca -209000D0 EXIST Exception CEE3841I A statement number is not available for this DSA. An internal routine failed with return code 08 and reason code 1C 4 main +00000034 12 EXIST EXIST Call 5 CELQINIT +0000134C CELQLIB CELQINIT D1908 Call DSA DSA Addr E Addr PU Addr PU Offset Comp Date Compile Attributes 1 00000001082FC520 0000000020AB3680 0000000020AB3680 00000000 20061215 CEL XPLINK EBCDIC HFP 2 00000001082FEE40 0000000020AC6AA0 0000000020AC6AA0 0000024E 20061215 CEL XPLINK EBCDIC HFP 3 00000001082FF080 00000000209000D0 0000000000000000 ******** 20070122 C/C++ XPLINK EBCDIC IEEE 4 00000001082FF180 0000000020900138 0000000000000000 ******** 20070122 C/C++ XPLINK EBCDIC IEEE 5 00000001082FF280 0000000020903010 0000000020903010 0000134C 20061215 CEL XPLINK EBCDIC HFP Fully Qualified Names DSA Entry Program Unit Load Module 4 main PLPSC://'POSIX.CRTL.C(EXIST)' EXIST Condition Information for Active Routines Condition Information for (DSA address 00000001082FF080) CIB Address: 00000001082FD860 Current Condition: CEE0198S The termination of a thread was signaled due to an unhandled condition. Original Condition: CEE3201S The system detected an operation exception (System Completion Code=0C1). Location: Program Unit: Entry: funca Statement: Offset: -209000D0 Possible Bad Branch: Statement: 17 Offset: +00000036 Machine State: ILC..... 0002 Interruption Code..... 0001 PSW..... 0785240180000000 0000000000000002 GPR0..... 0000000108300060 GPR1..... 00000001082FFA40 GPR2..... 0000000108401F60 GPR3..... 0000000108400070 GPR4..... 00000001082FF080 GPR5..... 000A0000000130E1 GPR6..... 0000000000000000 GPR7..... 0000000020900108 GPR8..... 00000000209000DC GPR9..... 00000000209001A0 GPR10.... 00000000209002A8 GPR11.... 0000000108401F50 GPR12.... 0000000100005340 GPR13.... 0000000000006F58 GPR14.... 0000000020B4E0A0 GPR15.... 000000000000001F Storage dump near condition, beginning at location(0000000000000000) +0000 0000000000000000 Inaccessible storage. +0010 0000000000000010 Inaccessible storage. GPREG STORAGE: Storage around GPR0 (0000000108300060) -0020 0000000108300040 00000001 08300000 00000000 00000060 |...............-| -0010 0000000108300050 C36DE6E2 C1F6F440 40404040 40404040 |C_WSA64 | +0000 0000000108300060 94818995 0086A495 83810000 00000000 |main.funca......| +0010 0000000108300070 00000001 08300090 00000000 209000D0 |................| +0020 0000000108300080 00000000 000000C0 00000000 20E71FF8 |.............X.8| +0030 0000000108300090 00000000 00000000 00000000 00000000 |................| Storage around GPR1 (00000001082FFA40) -0020 00000001082FFA20 00000000 00000000 00000000 00000000 |................| -0010 00000001082FFA30 - +FFFFFF 00000001082FFA3F same as above +0000 00000001082FFA40 00000000 00000000 00000001 08300060 |...............-| +0010 00000001082FFA50 00000000 00000000 00000000 00000000 |................| +0020 00000001082FFA60 - +00003F 00000001082FFA7F same as above
Figure 260. Sections of the dump from example C routine (AMODE 64) (Part 1 of 3)
The following is part two of sections of the dump from example C routine (AMODE 64).
Chapter 13. Debugging AMODE 64 C/C++ routines 459
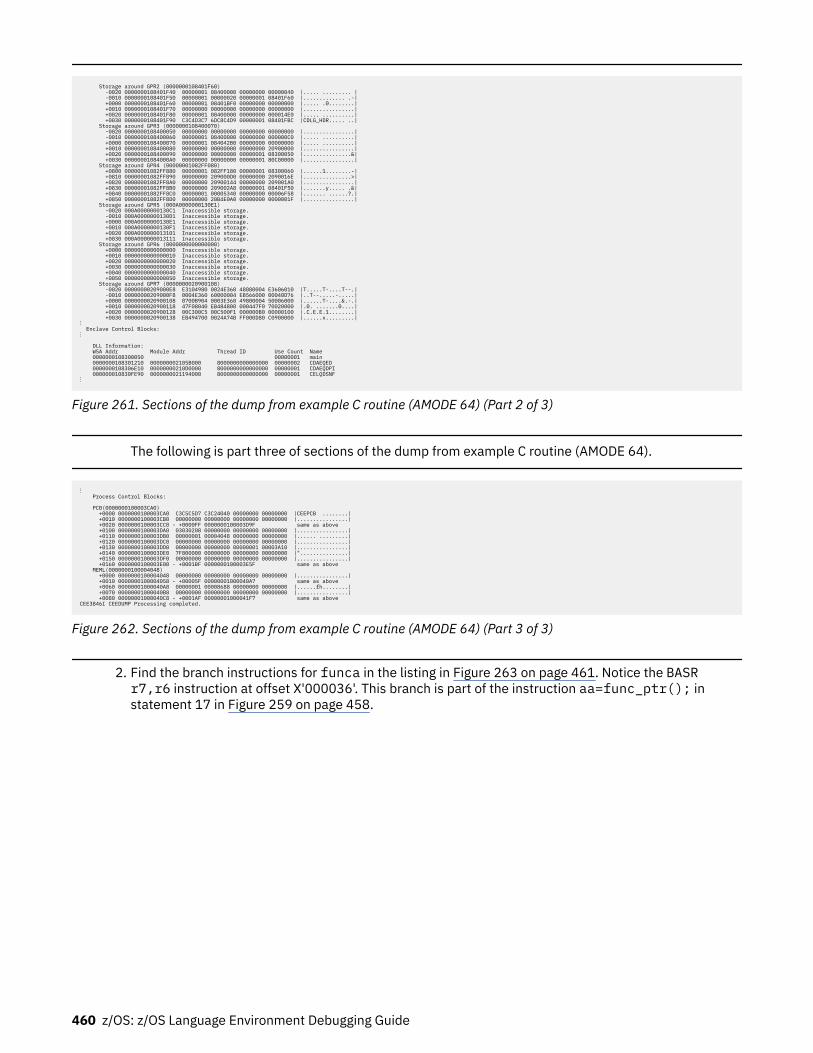
Storage around GPR2 (0000000108401F60) -0020 0000000108401F40 00000001 08400000 00000000 00000040 |..... ......... | -0010 0000000108401F50 00000001 00000020 00000001 08401F60 |............. .-| +0000 0000000108401F60 00000001 08401BF0 00000000 00000000 |..... .0........| +0010 0000000108401F70 00000000 00000000 00000000 00000000 |................| +0020 0000000108401F80 00000001 08400000 00000000 000014E0 |..... ..........| +0030 0000000108401F90 C3C4D3C7 6DC8C4D9 00000001 08401FBC |CDLG_HDR..... ..| Storage around GPR3 (0000000108400070) -0020 0000000108400050 00000000 00000000 00000000 00000000 |................| -0010 0000000108400060 00000001 08400000 00000000 000000C0 |..... ..........| +0000 0000000108400070 00000001 084042B0 00000000 00000000 |..... ..........| +0010 0000000108400080 00000000 00000000 00000000 20900000 |................| +0020 0000000108400090 00000000 00000000 00000001 08300050 |...............&| +0030 00000001084000A0 00000000 00000000 00000001 80C00000 |................| Storage around GPR4 (00000001082FF080) +0800 00000001082FF880 00000001 082FF180 00000001 08300060 |......1........-| +0810 00000001082FF890 00000000 209000D0 00000000 2090016E |...............>| +0820 00000001082FF8A0 00000000 20900144 00000000 209001A0 |................| +0830 00000001082FF8B0 00000000 209002A8 00000001 08401F50 |.......y..... .&| +0840 00000001082FF8C0 00000001 00005340 00000000 00006F58 |....... ......?.| +0850 00000001082FF8D0 00000000 20B4E0A0 00000000 0000001F |................| Storage around GPR5 (000A0000000130E1) -0020 000A0000000130C1 Inaccessible storage. -0010 000A0000000130D1 Inaccessible storage. +0000 000A0000000130E1 Inaccessible storage. +0010 000A0000000130F1 Inaccessible storage. +0020 000A000000013101 Inaccessible storage. +0030 000A000000013111 Inaccessible storage. Storage around GPR6 (0000000000000000) +0000 0000000000000000 Inaccessible storage. +0010 0000000000000010 Inaccessible storage. +0020 0000000000000020 Inaccessible storage. +0030 0000000000000030 Inaccessible storage. +0040 0000000000000040 Inaccessible storage. +0050 0000000000000050 Inaccessible storage. Storage around GPR7 (0000000020900108) -0020 00000000209000E8 E3104980 0024E360 48080004 E3606010 |T.....T-....T--.| -0010 00000000209000F8 0004E360 60000004 EB566000 00040D76 |..T--.....-.....| +0000 0000000020900108 0700B904 0003E360 49800004 50006000 |......T-....&.-.| +0010 0000000020900118 47F08040 EB484800 000447F0 70020000 |.0. .......0....| +0020 0000000020900128 00C300C5 00C500F1 000000B0 00000100 |.C.E.E.1........| +0030 0000000020900138 EB494700 0024A74B FF000D80 C0900000 |......x.........| ⋮ Enclave Control Blocks: ⋮ DLL Information: WSA Addr Module Addr Thread ID Use Count Name 0000000108300050 00000001 main 0000000108301210 000000002105B000 8000000000000000 00000002 CDAEQED 0000000108306E10 00000000210D0000 8000000000000000 00000001 CDAEQDPI 000000010830FE90 0000000021194000 8000000000000000 00000001 CELQDSNF ⋮
Figure 261. Sections of the dump from example C routine (AMODE 64) (Part 2 of 3)
The following is part three of sections of the dump from example C routine (AMODE 64).
⋮ Process Control Blocks: PCB(0000000100003CA0) +0000 0000000100003CA0 C3C5C5D7 C3C24040 00000000 00000000 |CEEPCB ........| +0010 0000000100003CB0 00000000 00000000 00000000 00000000 |................| +0020 0000000100003CC0 - +0000FF 0000000100003D9F same as above +0100 0000000100003DA0 03030208 00000000 00000000 00000000 |................| +0110 0000000100003DB0 00000001 00004048 00000000 00000000 |...... .........| +0120 0000000100003DC0 00000000 00000000 00000000 00000000 |................| +0130 0000000100003DD0 00000000 00000000 00000001 00003A10 |................| +0140 0000000100003DE0 7F800000 00000000 00000000 00000000 |"...............| +0150 0000000100003DF0 00000000 00000000 00000000 00000000 |................| +0160 0000000100003E00 - +0001BF 0000000100003E5F same as above MEML(0000000100004048) +0000 0000000100004048 00000000 00000000 00000000 00000000 |................| +0010 0000000100004058 - +00005F 00000001000040A7 same as above +0060 00000001000040A8 00000001 00008688 00000000 00000000 |......fh........| +0070 00000001000040B8 00000000 00000000 00000000 00000000 |................| +0080 00000001000040C8 - +0001AF 00000001000041F7 same as above CEE3846I CEEDUMP Processing completed.
Figure 262. Sections of the dump from example C routine (AMODE 64) (Part 3 of 3)
2. Find the branch instructions for funca in the listing in Figure 263 on page 461. Notice the BASRr7,r6 instruction at offset X'000036'. This branch is part of the instruction aa=func_ptr(); instatement 17 in Figure 259 on page 458.
460 z/OS: z/OS Language Environment Debugging Guide
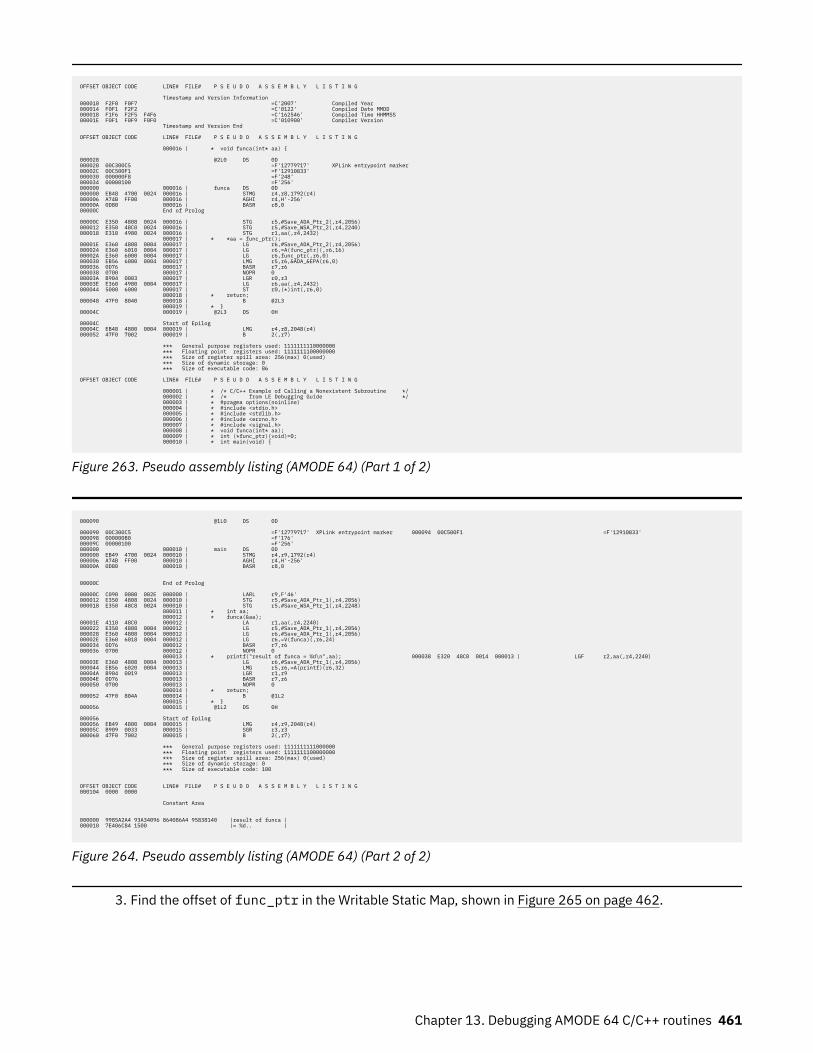
OFFSET OBJECT CODE LINE# FILE# P S E U D O A S S E M B L Y L I S T I N G Timestamp and Version Information 000010 F2F0 F0F7 =C'2007' Compiled Year 000014 F0F1 F2F2 =C'0122' Compiled Date MMDD 000018 F1F6 F2F5 F4F6 =C'162546' Compiled Time HHMMSS 00001E F0F1 F0F9 F0F0 =C'010900' Compiler Version Timestamp and Version End OFFSET OBJECT CODE LINE# FILE# P S E U D O A S S E M B L Y L I S T I N G 000016 | * void funca(int* aa) { 000028 @2L0 DS 0D 000028 00C300C5 =F'12779717' XPLink entrypoint marker 00002C 00C500F1 =F'12910833' 000030 000000F8 =F'248' 000034 00000100 =F'256' 000000 000016 | funca DS 0D 000000 EB48 4700 0024 000016 | STMG r4,r8,1792(r4) 000006 A74B FF00 000016 | AGHI r4,H'-256' 00000A 0D80 000016 | BASR r8,0 00000C End of Prolog 00000C E350 4808 0024 000016 | STG r5,#Save_ADA_Ptr_2(,r4,2056) 000012 E350 48C0 0024 000016 | STG r5,#Save_WSA_Ptr_2(,r4,2240) 000018 E310 4980 0024 000016 | STG r1,aa(,r4,2432) 000017 | * *aa = func_ptr(); 00001E E360 4808 0004 000017 | LG r6,#Save_ADA_Ptr_2(,r4,2056) 000024 E360 6010 0004 000017 | LG r6,=A(func_ptr)(,r6,16) 00002A E360 6000 0004 000017 | LG r6,func_ptr(,r6,0) 000030 EB56 6000 0004 000017 | LMG r5,r6,&ADA_&EPA(r6,0) 000036 0D76 000017 | BASR r7,r6 000038 0700 000017 | NOPR 0 00003A B904 0003 000017 | LGR r0,r3 00003E E360 4980 0004 000017 | LG r6,aa(,r4,2432) 000044 5000 6000 000017 | ST r0,(*)int(,r6,0) 000018 | * return; 000048 47F0 8040 000018 | B @2L3 000019 | * } 00004C 000019 | @2L3 DS 0H 00004C Start of Epilog 00004C EB48 4800 0004 000019 | LMG r4,r8,2048(r4) 000052 47F0 7002 000019 | B 2(,r7) *** General purpose registers used: 1111111110000000 *** Floating point registers used: 1111111100000000 *** Size of register spill area: 256(max) 0(used) *** Size of dynamic storage: 0 *** Size of executable code: 86
OFFSET OBJECT CODE LINE# FILE# P S E U D O A S S E M B L Y L I S T I N G 000001 | * /* C/C++ Example of Calling a Nonexistent Subroutine */ 000002 | * /* from LE Debugging Guide */ 000003 | * #pragma options(noinline) 000004 | * #include <stdio.h> 000005 | * #include <stdlib.h> 000006 | * #include <errno.h> 000007 | * #include <signal.h> 000008 | * void funca(int* aa); 000009 | * int (*func_ptr)(void)=0; 000010 | * int main(void) {
Figure 263. Pseudo assembly listing (AMODE 64) (Part 1 of 2)
000090 @1L0 DS 0D 000090 00C300C5 =F'12779717' XPLink entrypoint marker 000094 00C500F1 =F'12910833'000098 000000B0 =F'176'00009C 00000100 =F'256'000000 000010 | main DS 0D 000000 EB49 4700 0024 000010 | STMG r4,r9,1792(r4)000006 A74B FF00 000010 | AGHI r4,H'-256'00000A 0D80 000010 | BASR r8,0
00000C End of Prolog
00000C C090 0000 002E 000000 | LARL r9,F'46'000012 E350 4808 0024 000010 | STG r5,#Save_ADA_Ptr_1(,r4,2056)000018 E350 48C8 0024 000010 | STG r5,#Save_WSA_Ptr_1(,r4,2248) 000011 | * int aa; 000012 | * funca(&aa); 00001E 4110 48C0 000012 | LA r1,aa(,r4,2240)000022 E350 4808 0004 000012 | LG r5,#Save_ADA_Ptr_1(,r4,2056)000028 E360 4808 0004 000012 | LG r6,#Save_ADA_Ptr_1(,r4,2056)00002E E360 6018 0004 000012 | LG r6,=V(funca)(,r6,24)000034 0D76 000012 | BASR r7,r6000036 0700 000012 | NOPR 0 000013 | * printf("result of funca = %d\n",aa); 000038 E320 48C0 0014 000013 | LGF r2,aa(,r4,2240)00003E E360 4808 0004 000013 | LG r6,#Save_ADA_Ptr_1(,r4,2056)000044 EB56 6020 0004 000013 | LMG r5,r6,=A(printf)(r6,32)00004A B904 0019 000013 | LGR r1,r900004E 0D76 000013 | BASR r7,r6000050 0700 000013 | NOPR 0 000014 | * return; 000052 47F0 804A 000014 | B @1L2 000015 | * } 000056 000015 | @1L2 DS 0H 000056 Start of Epilog 000056 EB49 4800 0004 000015 | LMG r4,r9,2048(r4)00005C B909 0033 000015 | SGR r3,r3000060 47F0 7002 000015 | B 2(,r7) *** General purpose registers used: 1111111111000000 *** Floating point registers used: 1111111100000000 *** Size of register spill area: 256(max) 0(used) *** Size of dynamic storage: 0 *** Size of executable code: 100 OFFSET OBJECT CODE LINE# FILE# P S E U D O A S S E M B L Y L I S T I N G 000104 0000 0000 Constant Area
000000 9985A2A4 93A34096 864086A4 95838140 |result of funca |000010 7E406C84 1500 |= %d.. |
Figure 264. Pseudo assembly listing (AMODE 64) (Part 2 of 2)
3. Find the offset of func_ptr in the Writable Static Map, shown in Figure 265 on page 462.
Chapter 13. Debugging AMODE 64 C/C++ routines 461
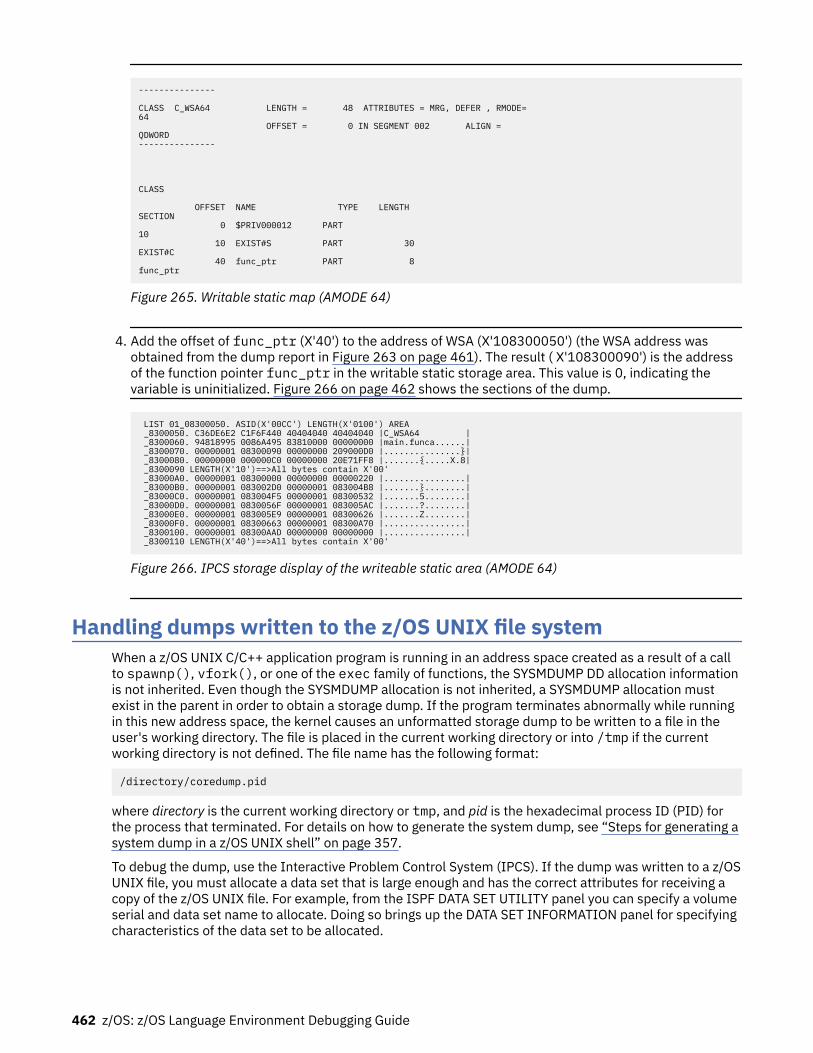
--------------- CLASS C_WSA64 LENGTH = 48 ATTRIBUTES = MRG, DEFER , RMODE= 64 OFFSET = 0 IN SEGMENT 002 ALIGN = QDWORD --------------- CLASS OFFSET NAME TYPE LENGTH SECTION 0 $PRIV000012 PART 10 10 EXIST#S PART 30 EXIST#C 40 func_ptr PART 8 func_ptr
Figure 265. Writable static map (AMODE 64)
4. Add the offset of func_ptr (X'40') to the address of WSA (X'108300050') (the WSA address wasobtained from the dump report in Figure 263 on page 461). The result ( X'108300090') is the addressof the function pointer func_ptr in the writable static storage area. This value is 0, indicating thevariable is uninitialized. Figure 266 on page 462 shows the sections of the dump.
LIST 01_08300050. ASID(X'00CC') LENGTH(X'0100') AREA _8300050. C36DE6E2 C1F6F440 40404040 40404040 |C_WSA64 | _8300060. 94818995 0086A495 83810000 00000000 |main.funca......| _8300070. 00000001 08300090 00000000 209000D0 |...............}| _8300080. 00000000 000000C0 00000000 20E71FF8 |.......{.....X.8| _8300090 LENGTH(X'10')==>All bytes contain X'00' _83000A0. 00000001 08300000 00000000 00000220 |................| _83000B0. 00000001 083002D0 00000001 083004B8 |.......}........| _83000C0. 00000001 083004F5 00000001 08300532 |.......5........| _83000D0. 00000001 0830056F 00000001 083005AC |.......?........| _83000E0. 00000001 083005E9 00000001 08300626 |.......Z........| _83000F0. 00000001 08300663 00000001 08300A70 |................| _8300100. 00000001 08300AAD 00000000 00000000 |................| _8300110 LENGTH(X'40')==>All bytes contain X'00'
Figure 266. IPCS storage display of the writeable static area (AMODE 64)
Handling dumps written to the z/OS UNIX file systemWhen a z/OS UNIX C/C++ application program is running in an address space created as a result of a callto spawnp(), vfork(), or one of the exec family of functions, the SYSMDUMP DD allocation informationis not inherited. Even though the SYSMDUMP allocation is not inherited, a SYSMDUMP allocation mustexist in the parent in order to obtain a storage dump. If the program terminates abnormally while runningin this new address space, the kernel causes an unformatted storage dump to be written to a file in theuser's working directory. The file is placed in the current working directory or into /tmp if the currentworking directory is not defined. The file name has the following format:
/directory/coredump.pid
where directory is the current working directory or tmp, and pid is the hexadecimal process ID (PID) forthe process that terminated. For details on how to generate the system dump, see “Steps for generating asystem dump in a z/OS UNIX shell” on page 357.
To debug the dump, use the Interactive Problem Control System (IPCS). If the dump was written to a z/OSUNIX file, you must allocate a data set that is large enough and has the correct attributes for receiving acopy of the z/OS UNIX file. For example, from the ISPF DATA SET UTILITY panel you can specify a volumeserial and data set name to allocate. Doing so brings up the DATA SET INFORMATION panel for specifyingcharacteristics of the data set to be allocated.
462 z/OS: z/OS Language Environment Debugging Guide
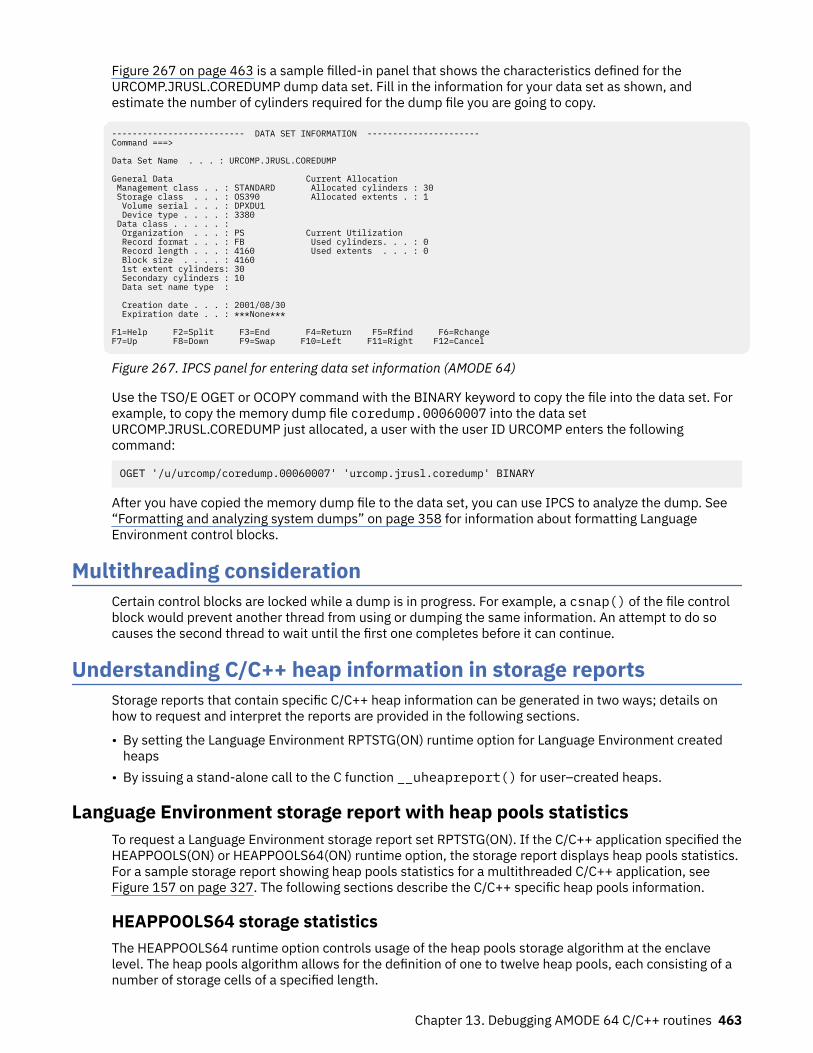
Figure 267 on page 463 is a sample filled-in panel that shows the characteristics defined for theURCOMP.JRUSL.COREDUMP dump data set. Fill in the information for your data set as shown, andestimate the number of cylinders required for the dump file you are going to copy.
-------------------------- DATA SET INFORMATION ----------------------Command ===>
Data Set Name . . . : URCOMP.JRUSL.COREDUMP
General Data Current Allocation Management class . . : STANDARD Allocated cylinders : 30 Storage class . . . : OS390 Allocated extents . : 1 Volume serial . . . : DPXDU1 Device type . . . . : 3380 Data class . . . . . : Organization . . . : PS Current Utilization Record format . . . : FB Used cylinders. . . : 0 Record length . . . : 4160 Used extents . . . : 0 Block size . . . . : 4160 1st extent cylinders: 30 Secondary cylinders : 10 Data set name type :
Creation date . . . : 2001/08/30 Expiration date . . : ***None***
F1=Help F2=Split F3=End F4=Return F5=Rfind F6=RchangeF7=Up F8=Down F9=Swap F10=Left F11=Right F12=Cancel
Figure 267. IPCS panel for entering data set information (AMODE 64)
Use the TSO/E OGET or OCOPY command with the BINARY keyword to copy the file into the data set. Forexample, to copy the memory dump file coredump.00060007 into the data setURCOMP.JRUSL.COREDUMP just allocated, a user with the user ID URCOMP enters the followingcommand:
OGET '/u/urcomp/coredump.00060007' 'urcomp.jrusl.coredump' BINARY
After you have copied the memory dump file to the data set, you can use IPCS to analyze the dump. See“Formatting and analyzing system dumps” on page 358 for information about formatting LanguageEnvironment control blocks.
Multithreading considerationCertain control blocks are locked while a dump is in progress. For example, a csnap() of the file controlblock would prevent another thread from using or dumping the same information. An attempt to do socauses the second thread to wait until the first one completes before it can continue.
Understanding C/C++ heap information in storage reportsStorage reports that contain specific C/C++ heap information can be generated in two ways; details onhow to request and interpret the reports are provided in the following sections.
• By setting the Language Environment RPTSTG(ON) runtime option for Language Environment createdheaps
• By issuing a stand-alone call to the C function __uheapreport() for user–created heaps.
Language Environment storage report with heap pools statisticsTo request a Language Environment storage report set RPTSTG(ON). If the C/C++ application specified theHEAPPOOLS(ON) or HEAPPOOLS64(ON) runtime option, the storage report displays heap pools statistics.For a sample storage report showing heap pools statistics for a multithreaded C/C++ application, seeFigure 157 on page 327. The following sections describe the C/C++ specific heap pools information.
HEAPPOOLS64 storage statisticsThe HEAPPOOLS64 runtime option controls usage of the heap pools storage algorithm at the enclavelevel. The heap pools algorithm allows for the definition of one to twelve heap pools, each consisting of anumber of storage cells of a specified length.
Chapter 13. Debugging AMODE 64 C/C++ routines 463
Note: The use of an alternative vendor heap manager (VHM) overrides the use of the HEAPPOOLS64runtime option.
HEAPPOOLS64 statistics• Pool p size: ssss Get requests: gggg
pnumber of the pool. When there are multiple pools for a cell size, the pools are numbered using theformat aa.bbbaa
number for the cell sizebbb
number for the pool within the cell sizessss
cell size specified for the poolgggg
number of storage requests that were satisfied from this pool• Successful Get Heap requests: xxxx-yyyy n
xxxxlow side of the 8 byte range
yyyyhigh side of the 8 byte range
nnumber of requests in the 8 byte range
• Requests greater than the largest cell size — the number of storage requests that are not satisfied byheap pools.
Note: Values displayed in the HEAPPOOLS64 statistics report are not serialized when collected; therefore,the values are not necessarily exact.
HEAPPOOLS64 summaryThe HEAPPOOLS64 summary displays a report of the HEAPPOOLS64 statistics and provides suggestedcell sizes.
Specified Cell Sizethe size of the cell specified in the HEAPPOOLS64 runtime option
Element Sizethe size of the cell plus any additional storage needed for control information or to maintain alignment
Cells Per Extentthe cell pool count specified by the HEAPPOOLS64 runtime option. When there is more than one poolfor a cell size, the count is divided by the number of pools.
Extents Allocatedthe number of times that each pool allocated an extent in order to optimize storage usage. Theextents allocated needs to be either one or two. If the number of extents allocated is too high,increase the cell count for the pool.
Maximum Cells Usedthe maximum number of cells used for each pool.
Cells In Usethe number of cells that were never freed. A large number in this field could indicate a storage leak.
Suggested Cell Sizessizes that are calculated to optimally use storage (assuming that the application will __malloc/__freewith the same frequency). The suggested cell sizes are given with no cell counts because the usage of
464 z/OS: z/OS Language Environment Debugging Guide
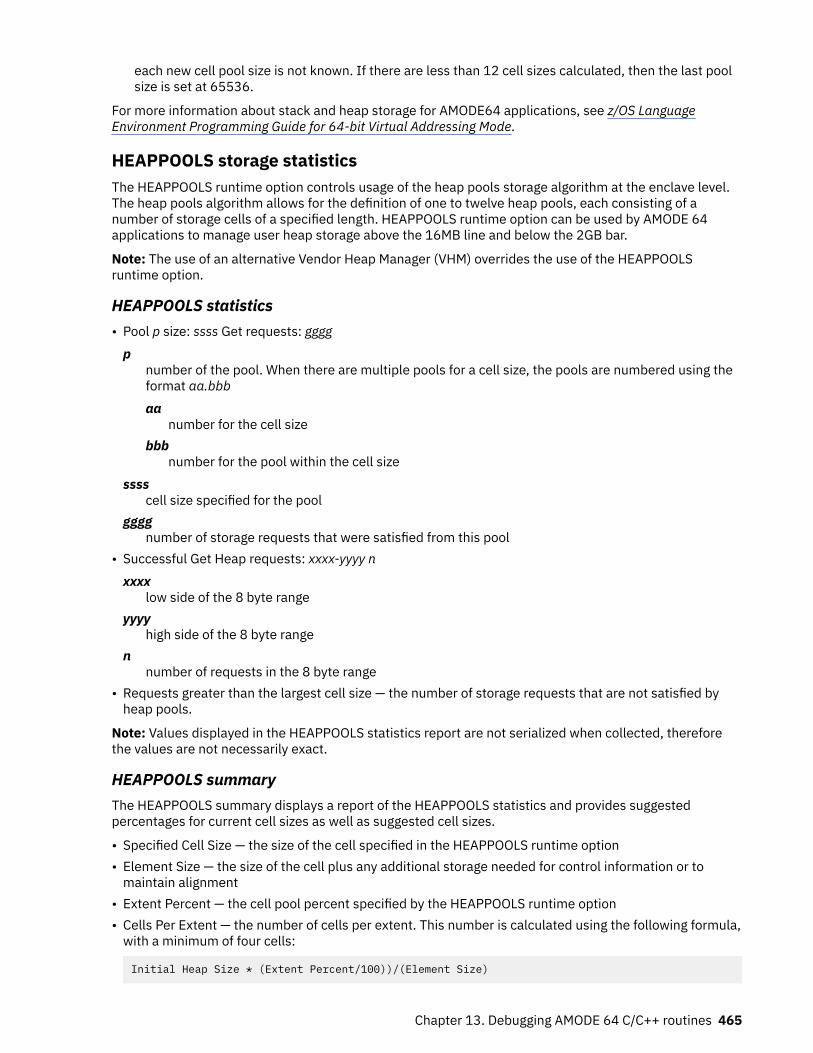
each new cell pool size is not known. If there are less than 12 cell sizes calculated, then the last poolsize is set at 65536.
For more information about stack and heap storage for AMODE64 applications, see z/OS LanguageEnvironment Programming Guide for 64-bit Virtual Addressing Mode.
HEAPPOOLS storage statisticsThe HEAPPOOLS runtime option controls usage of the heap pools storage algorithm at the enclave level.The heap pools algorithm allows for the definition of one to twelve heap pools, each consisting of anumber of storage cells of a specified length. HEAPPOOLS runtime option can be used by AMODE 64applications to manage user heap storage above the 16MB line and below the 2GB bar.
Note: The use of an alternative Vendor Heap Manager (VHM) overrides the use of the HEAPPOOLSruntime option.
HEAPPOOLS statistics• Pool p size: ssss Get requests: gggg
pnumber of the pool. When there are multiple pools for a cell size, the pools are numbered using theformat aa.bbbaa
number for the cell sizebbb
number for the pool within the cell sizessss
cell size specified for the poolgggg
number of storage requests that were satisfied from this pool• Successful Get Heap requests: xxxx-yyyy n
xxxxlow side of the 8 byte range
yyyyhigh side of the 8 byte range
nnumber of requests in the 8 byte range
• Requests greater than the largest cell size — the number of storage requests that are not satisfied byheap pools.
Note: Values displayed in the HEAPPOOLS statistics report are not serialized when collected, thereforethe values are not necessarily exact.
HEAPPOOLS summaryThe HEAPPOOLS summary displays a report of the HEAPPOOLS statistics and provides suggestedpercentages for current cell sizes as well as suggested cell sizes.
• Specified Cell Size — the size of the cell specified in the HEAPPOOLS runtime option• Element Size — the size of the cell plus any additional storage needed for control information or to
maintain alignment• Extent Percent — the cell pool percent specified by the HEAPPOOLS runtime option• Cells Per Extent — the number of cells per extent. This number is calculated using the following formula,
with a minimum of four cells:
Initial Heap Size * (Extent Percent/100))/(Element Size)
Chapter 13. Debugging AMODE 64 C/C++ routines 465
Note: Having a small number of cells per extent is not suggested because the pool can allocate manyextents, which causes the HEAPPOOLS algorithm to perform inefficiently.
• Extents Allocated — the number of times that each pool allocated an extent.
To optimize storage usage, the extents allocated need to be either one or two. If the number of extentsallocated is too high, increase the percentage for the pool.
• Maximum Cells Used — the maximum number of cells used for each pool.• Cells In Use — the number of cells that were never freed.
A large number in this field can indicate a storage leak.• Suggested Percentages for current Cell Sizes — percentages calculated to find the optimal size of the
cell pool extent. The calculation is based on the following formula:
(Maximum Cells Used * (Element Size) * 100) / Initial Heap SizeWith a minimum of 1% and a maximum of 90%
Make sure that your cell pool extents are neither too large nor too small. If your percentages are toolarge then additional, unreferenced virtual storage will be allocated, thereby causing the program toexhaust the region size. If the percentages are too small then the HEAPPOOLS algorithm will runinefficiently.
• Suggested Cell Sizes — sizes that are calculated to optimally use storage (assuming that the applicationwill __malloc/__free with the same frequency).
Note: The suggested cell sizes are given with no percentages because the usage of each new cell poolsize is not known. If there are less than 12 cell sizes calculated and the last calculated cell size issmaller than the largest cell size currently in effect, the largest cell size currently in effect is used for thelast suggested cell size.
For more information about stack and heap storage, see Stack and heap storage in z/OS LanguageEnvironment Programming Guide for 64-bit Virtual Addressing Mode.
C function __uheapreport() storage reportTo generate a user-created heap storage report use the C function, __uheapreport(). Use theinformation in the report to assist with tuning your application's use of the user-created heap.
For more information about the __uheapreport() function, see __uheapreport() — Produce a storagereport for a user-created heap in z/OS XL C/C++ Runtime Library Reference.
For tuning tips, see Tuning heap storage in z/OS Language Environment Programming Guide.
466 z/OS: z/OS Language Environment Debugging Guide
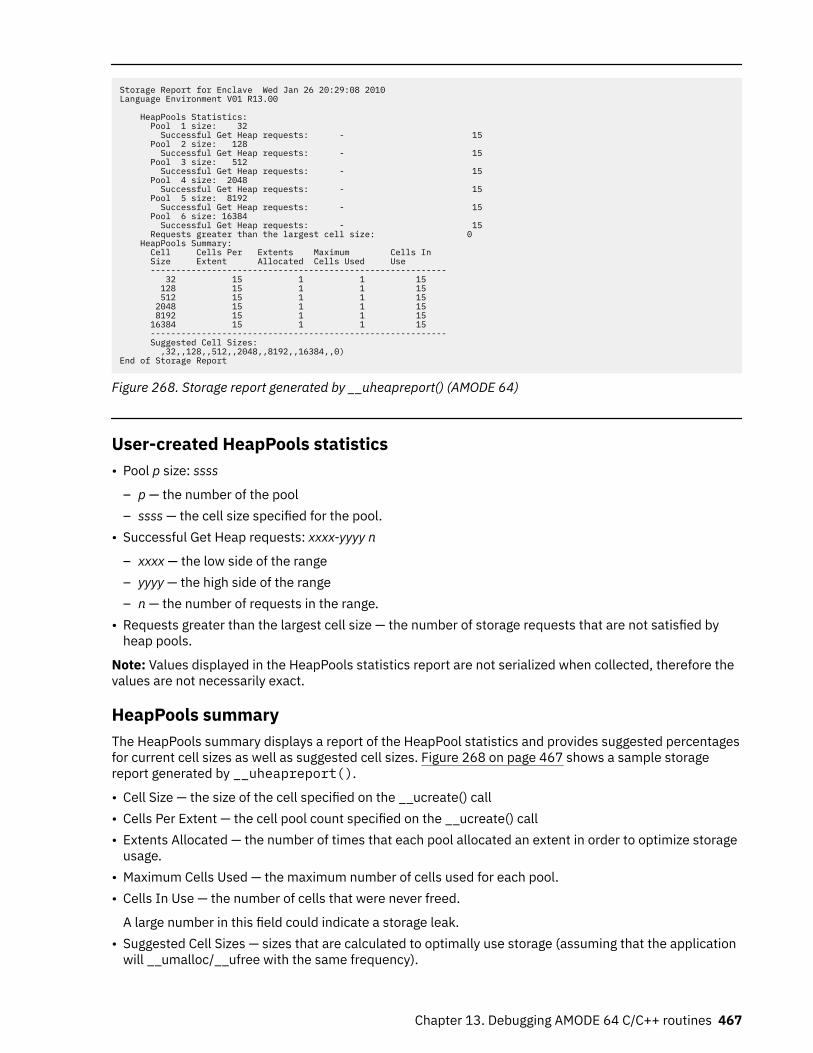
Storage Report for Enclave Wed Jan 26 20:29:08 2010Language Environment V01 R13.00
HeapPools Statistics: Pool 1 size: 32 Successful Get Heap requests: - 15 Pool 2 size: 128 Successful Get Heap requests: - 15 Pool 3 size: 512 Successful Get Heap requests: - 15 Pool 4 size: 2048 Successful Get Heap requests: - 15 Pool 5 size: 8192 Successful Get Heap requests: - 15 Pool 6 size: 16384 Successful Get Heap requests: - 15 Requests greater than the largest cell size: 0 HeapPools Summary: Cell Cells Per Extents Maximum Cells In Size Extent Allocated Cells Used Use ---------------------------------------------------------- 32 15 1 1 15 128 15 1 1 15 512 15 1 1 15 2048 15 1 1 15 8192 15 1 1 15 16384 15 1 1 15 ---------------------------------------------------------- Suggested Cell Sizes: ,32,,128,,512,,2048,,8192,,16384,,0)End of Storage Report
Figure 268. Storage report generated by __uheapreport() (AMODE 64)
User-created HeapPools statistics• Pool p size: ssss
– p — the number of the pool– ssss — the cell size specified for the pool.
• Successful Get Heap requests: xxxx-yyyy n
– xxxx — the low side of the range– yyyy — the high side of the range– n — the number of requests in the range.
• Requests greater than the largest cell size — the number of storage requests that are not satisfied byheap pools.
Note: Values displayed in the HeapPools statistics report are not serialized when collected, therefore thevalues are not necessarily exact.
HeapPools summaryThe HeapPools summary displays a report of the HeapPool statistics and provides suggested percentagesfor current cell sizes as well as suggested cell sizes. Figure 268 on page 467 shows a sample storagereport generated by __uheapreport().
• Cell Size — the size of the cell specified on the __ucreate() call• Cells Per Extent — the cell pool count specified on the __ucreate() call• Extents Allocated — the number of times that each pool allocated an extent in order to optimize storage
usage.• Maximum Cells Used — the maximum number of cells used for each pool.• Cells In Use — the number of cells that were never freed.
A large number in this field could indicate a storage leak.• Suggested Cell Sizes — sizes that are calculated to optimally use storage (assuming that the application
will __umalloc/__ufree with the same frequency).
Chapter 13. Debugging AMODE 64 C/C++ routines 467
The suggested cell sizes are given with no cell counts because the usage of each new cell pool size isnot known. If there are less than 12 cell sizes calculated, then the last pool size is set at 65536.
468 z/OS: z/OS Language Environment Debugging Guide
Part 4. Debugging Language Environment AMODE 31and AMODE 64 interoperability applications
This part provides specific information for debugging applications written to make use of LanguageEnvironment AMODE 31 and AMODE 64 interoperability.
© Copyright IBM Corp. 1991, 2020 469

470 z/OS: z/OS Language Environment Debugging Guide
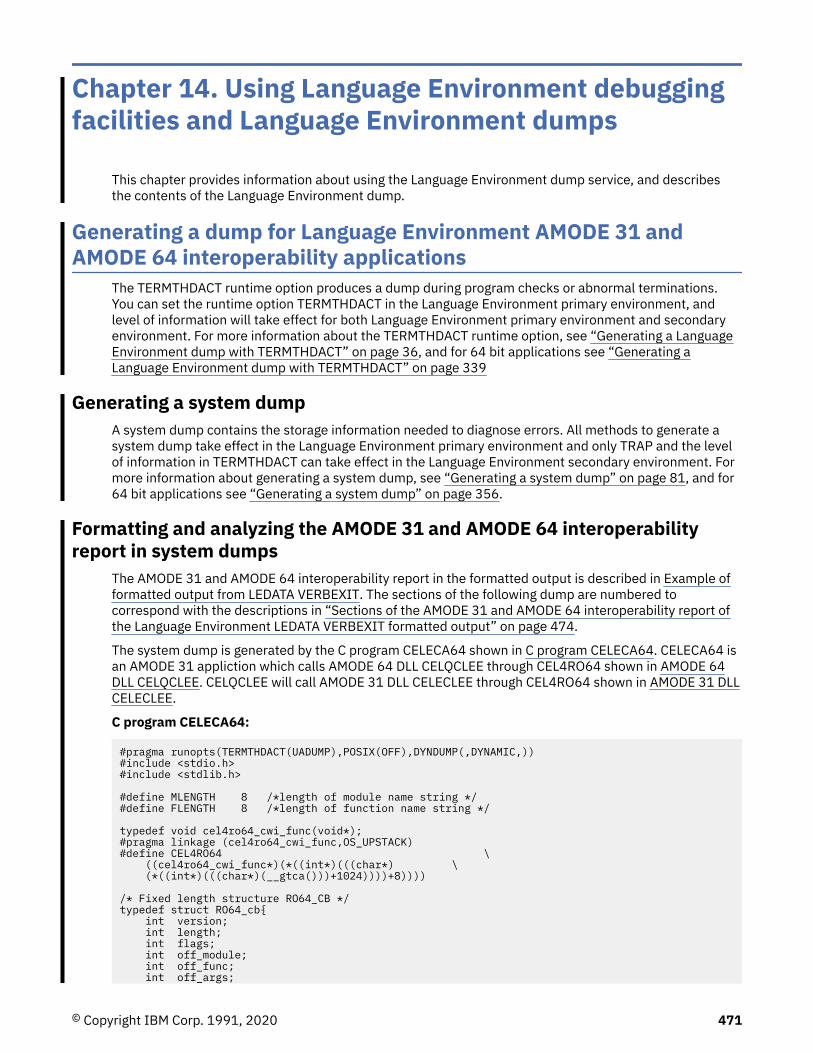
Chapter 14. Using Language Environment debuggingfacilities and Language Environment dumps
This chapter provides information about using the Language Environment dump service, and describesthe contents of the Language Environment dump.
Generating a dump for Language Environment AMODE 31 andAMODE 64 interoperability applications
The TERMTHDACT runtime option produces a dump during program checks or abnormal terminations.You can set the runtime option TERMTHDACT in the Language Environment primary environment, andlevel of information will take effect for both Language Environment primary environment and secondaryenvironment. For more information about the TERMTHDACT runtime option, see “Generating a LanguageEnvironment dump with TERMTHDACT” on page 36, and for 64 bit applications see “Generating aLanguage Environment dump with TERMTHDACT” on page 339
Generating a system dumpA system dump contains the storage information needed to diagnose errors. All methods to generate asystem dump take effect in the Language Environment primary environment and only TRAP and the levelof information in TERMTHDACT can take effect in the Language Environment secondary environment. Formore information about generating a system dump, see “Generating a system dump” on page 81, and for64 bit applications see “Generating a system dump” on page 356.
Formatting and analyzing the AMODE 31 and AMODE 64 interoperabilityreport in system dumps
The AMODE 31 and AMODE 64 interoperability report in the formatted output is described in Example offormatted output from LEDATA VERBEXIT. The sections of the following dump are numbered tocorrespond with the descriptions in “Sections of the AMODE 31 and AMODE 64 interoperability report ofthe Language Environment LEDATA VERBEXIT formatted output” on page 474.
The system dump is generated by the C program CELECA64 shown in C program CELECA64. CELECA64 isan AMODE 31 appliction which calls AMODE 64 DLL CELQCLEE through CEL4RO64 shown in AMODE 64DLL CELQCLEE. CELQCLEE will call AMODE 31 DLL CELECLEE through CEL4RO64 shown in AMODE 31 DLLCELECLEE.
C program CELECA64:
#pragma runopts(TERMTHDACT(UADUMP),POSIX(OFF),DYNDUMP(,DYNAMIC,))#include <stdio.h>#include <stdlib.h>
#define MLENGTH 8 /*length of module name string */#define FLENGTH 8 /*length of function name string */
typedef void cel4ro64_cwi_func(void*);#pragma linkage (cel4ro64_cwi_func,OS_UPSTACK)#define CEL4RO64 \ ((cel4ro64_cwi_func*)(*((int*)(((char*) \ (*((int*)(((char*)(__gtca()))+1024))))+8))))
/* Fixed length structure RO64_CB */typedef struct RO64_cb{ int version; int length; int flags; int off_module; int off_func; int off_args;
© Copyright IBM Corp. 1991, 2020 471
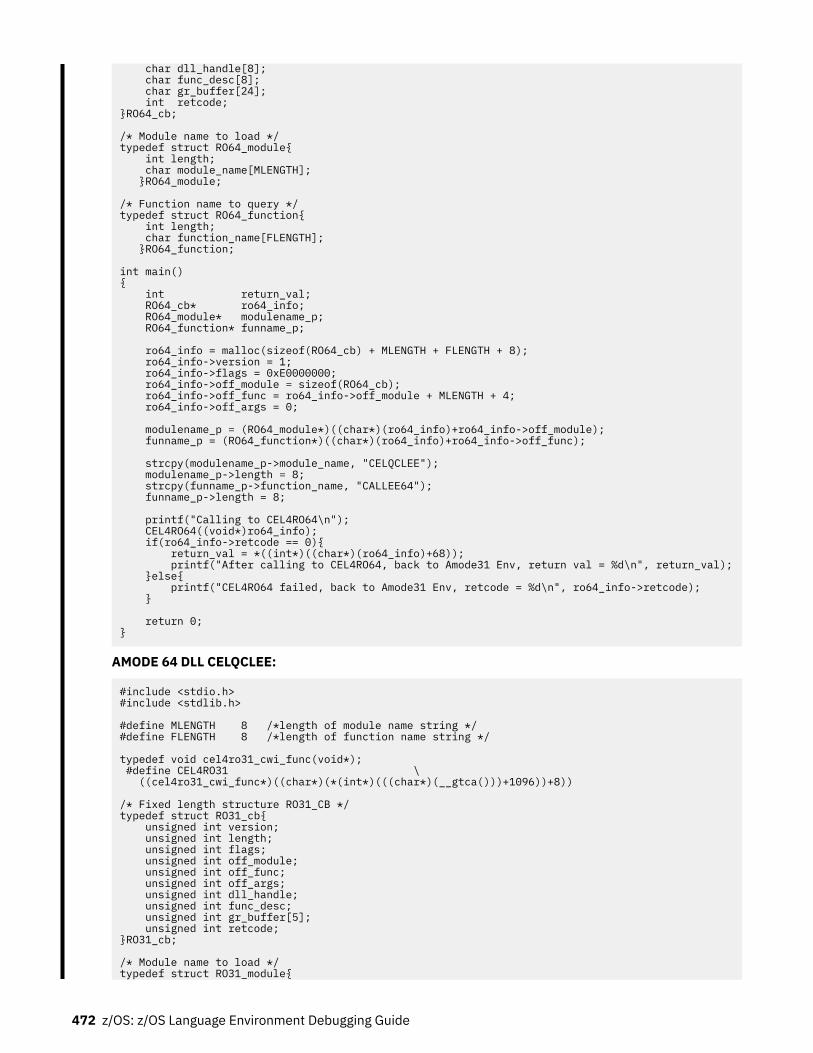
char dll_handle[8]; char func_desc[8]; char gr_buffer[24]; int retcode;}RO64_cb;
/* Module name to load */typedef struct RO64_module{ int length; char module_name[MLENGTH]; }RO64_module;
/* Function name to query */typedef struct RO64_function{ int length; char function_name[FLENGTH]; }RO64_function;
int main(){ int return_val; RO64_cb* ro64_info; RO64_module* modulename_p; RO64_function* funname_p;
ro64_info = malloc(sizeof(RO64_cb) + MLENGTH + FLENGTH + 8); ro64_info->version = 1; ro64_info->flags = 0xE0000000; ro64_info->off_module = sizeof(RO64_cb); ro64_info->off_func = ro64_info->off_module + MLENGTH + 4; ro64_info->off_args = 0;
modulename_p = (RO64_module*)((char*)(ro64_info)+ro64_info->off_module); funname_p = (RO64_function*)((char*)(ro64_info)+ro64_info->off_func);
strcpy(modulename_p->module_name, "CELQCLEE"); modulename_p->length = 8; strcpy(funname_p->function_name, "CALLEE64"); funname_p->length = 8;
printf("Calling to CEL4RO64\n"); CEL4RO64((void*)ro64_info); if(ro64_info->retcode == 0){ return_val = *((int*)((char*)(ro64_info)+68)); printf("After calling to CEL4RO64, back to Amode31 Env, return val = %d\n", return_val); }else{ printf("CEL4RO64 failed, back to Amode31 Env, retcode = %d\n", ro64_info->retcode); }
return 0;}
AMODE 64 DLL CELQCLEE:
#include <stdio.h>#include <stdlib.h>
#define MLENGTH 8 /*length of module name string */#define FLENGTH 8 /*length of function name string */
typedef void cel4ro31_cwi_func(void*); #define CEL4RO31 \ ((cel4ro31_cwi_func*)((char*)(*(int*)(((char*)(__gtca()))+1096))+8)) /* Fixed length structure RO31_CB */typedef struct RO31_cb{ unsigned int version; unsigned int length; unsigned int flags; unsigned int off_module; unsigned int off_func; unsigned int off_args; unsigned int dll_handle; unsigned int func_desc; unsigned int gr_buffer[5]; unsigned int retcode;}RO31_cb;
/* Module name to load */typedef struct RO31_module{
472 z/OS: z/OS Language Environment Debugging Guide
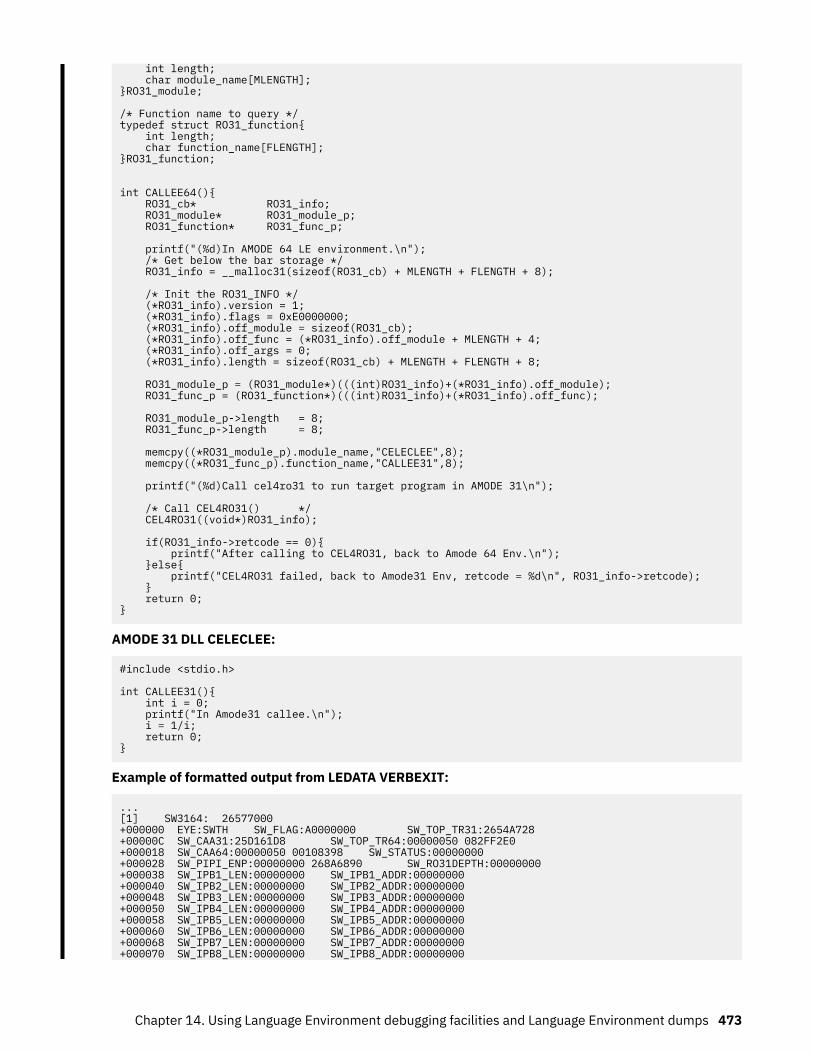
int length; char module_name[MLENGTH];}RO31_module;
/* Function name to query */typedef struct RO31_function{ int length; char function_name[FLENGTH];}RO31_function;
int CALLEE64(){ RO31_cb* RO31_info; RO31_module* RO31_module_p; RO31_function* RO31_func_p; printf("(%d)In AMODE 64 LE environment.\n"); /* Get below the bar storage */ RO31_info = __malloc31(sizeof(RO31_cb) + MLENGTH + FLENGTH + 8);
/* Init the RO31_INFO */ (*RO31_info).version = 1; (*RO31_info).flags = 0xE0000000; (*RO31_info).off_module = sizeof(RO31_cb); (*RO31_info).off_func = (*RO31_info).off_module + MLENGTH + 4; (*RO31_info).off_args = 0; (*RO31_info).length = sizeof(RO31_cb) + MLENGTH + FLENGTH + 8;
RO31_module_p = (RO31_module*)(((int)RO31_info)+(*RO31_info).off_module); RO31_func_p = (RO31_function*)(((int)RO31_info)+(*RO31_info).off_func);
RO31_module_p->length = 8; RO31_func_p->length = 8; memcpy((*RO31_module_p).module_name,"CELECLEE",8); memcpy((*RO31_func_p).function_name,"CALLEE31",8); printf("(%d)Call cel4ro31 to run target program in AMODE 31\n");
/* Call CEL4RO31() */ CEL4RO31((void*)RO31_info); if(RO31_info->retcode == 0){ printf("After calling to CEL4RO31, back to Amode 64 Env.\n"); }else{ printf("CEL4RO31 failed, back to Amode31 Env, retcode = %d\n", RO31_info->retcode); } return 0;}
AMODE 31 DLL CELECLEE:
#include <stdio.h>
int CALLEE31(){ int i = 0; printf("In Amode31 callee.\n"); i = 1/i; return 0;}
Example of formatted output from LEDATA VERBEXIT:
...[1] SW3164: 26577000 +000000 EYE:SWTH SW_FLAG:A0000000 SW_TOP_TR31:2654A728 +00000C SW_CAA31:25D161D8 SW_TOP_TR64:00000050 082FF2E0 +000018 SW_CAA64:00000050 00108398 SW_STATUS:00000000 +000028 SW_PIPI_ENP:00000000 268A6890 SW_RO31DEPTH:00000000+000038 SW_IPB1_LEN:00000000 SW_IPB1_ADDR:00000000 +000040 SW_IPB2_LEN:00000000 SW_IPB2_ADDR:00000000 +000048 SW_IPB3_LEN:00000000 SW_IPB3_ADDR:00000000 +000050 SW_IPB4_LEN:00000000 SW_IPB4_ADDR:00000000 +000058 SW_IPB5_LEN:00000000 SW_IPB5_ADDR:00000000 +000060 SW_IPB6_LEN:00000000 SW_IPB6_ADDR:00000000 +000068 SW_IPB7_LEN:00000000 SW_IPB7_ADDR:00000000 +000070 SW_IPB8_LEN:00000000 SW_IPB8_ADDR:00000000
Chapter 14. Using Language Environment debugging facilities and Language Environment dumps 473
+000078 SW_IPB9_LEN:00000000 SW_IPB9_ADDR:00000000 +000080 SW_IPB10_LEN:00000000 SW_IPB10_ADDR:00000000
Sections of the AMODE 31 and AMODE 64 interoperability report of theLanguage Environment LEDATA VERBEXIT formatted output
Table 69 on page 474 lists the sections of the LEDATA VERBEXIT output, which appear independently ofthe Language Environment-conforming languages used.
Table 69. Contents of the LEDATA VERBEXIT formatted output
Section number and heading Contents
[1] SW3164 Formats the contents of the Language Environment SW3164 control block. For a description of the fields in the SW3164, seeLanguage Environment vendor interfaces for AMODE 31 and AMODE 64 interoperability in z/OS Language Environment VendorInterfaces.
474 z/OS: z/OS Language Environment Debugging Guide
Appendix A. Diagnosing problems with LanguageEnvironment
This section provides information for diagnosing problems in the Language Environment product. It helpsyou determine if a correction for a product failure similar to yours has been previously documented. If theproblem has not been previously reported, it tells you how to open a problem management record (PMR)to report the problem to IBM, and if the problem is with an IBM product, what documentation you needfor an Authorized Program Analysis Report (APAR).
Diagnosis checklistStep through each of the items in the diagnosis checklist below to see if they apply to your problem. Thechecklist is designed to either solve your problem or help you gather the diagnostic information requiredfor determining the source of the error. It can also help you confirm that the suspected failure is not a usererror; that is, it was not caused by incorrect usage of the Language Environment product or by an error inthe logic of the routine.
1. If your failing application contains programs that were changed since they last ran successfully,review the output of the compile or assembly (listings) for any unresolved errors.
2. If there have not been any changes in your applications, check the output (job or console logs, CICStransient (CESE) queues) for any messages from the failing run.
3. Check the message prefix to identify the system or subsystem that issued the message. This can helpyou determine the cause of the problem. Following are some of the prefixes and their respectiveorigins.EDC
The prefix for C/C++ messages. The following series of messages are from the C/C++ runtimecomponent of Language Environment: 5000 (except for 5500, which are from the DSECT utility),6000, and 7000.
IGZThe prefix for messages from the COBOL runtime component of Language Environment.
FORThe prefix for messages from the Fortran runtime component of Language Environment.
IBMThe prefix for messages from the PL/I runtime component of Language Environment.
CEEThe prefix for messages from the common runtime component of Language Environment.
4. For any messages received, check for recommendations in the "Programmer Response" sections ofthe messages in this information.
5. Verify that abends are caused by product failures and not by program errors. See the appropriatechapters in this manual for a list of Language Environment-related abend codes.
6. Your installation may have received an IBM Program Temporary Fix (PTF) for the problem. Verify thatyou have received all issued PTFs and have installed them, so that your installation is at the mostcurrent maintenance level.
7. The preventive service planning (PSP) bucket, an online database available to IBM customers throughIBM service channels, gives information about product installation problems and other problems.Check to see whether it contains information related to your problem.
8. Narrow the source of the error.
• If a Language Environment dump is available, locate the traceback in the Language Environmentdump for the source of the problem.
© Copyright IBM Corp. 1991, 2020 475
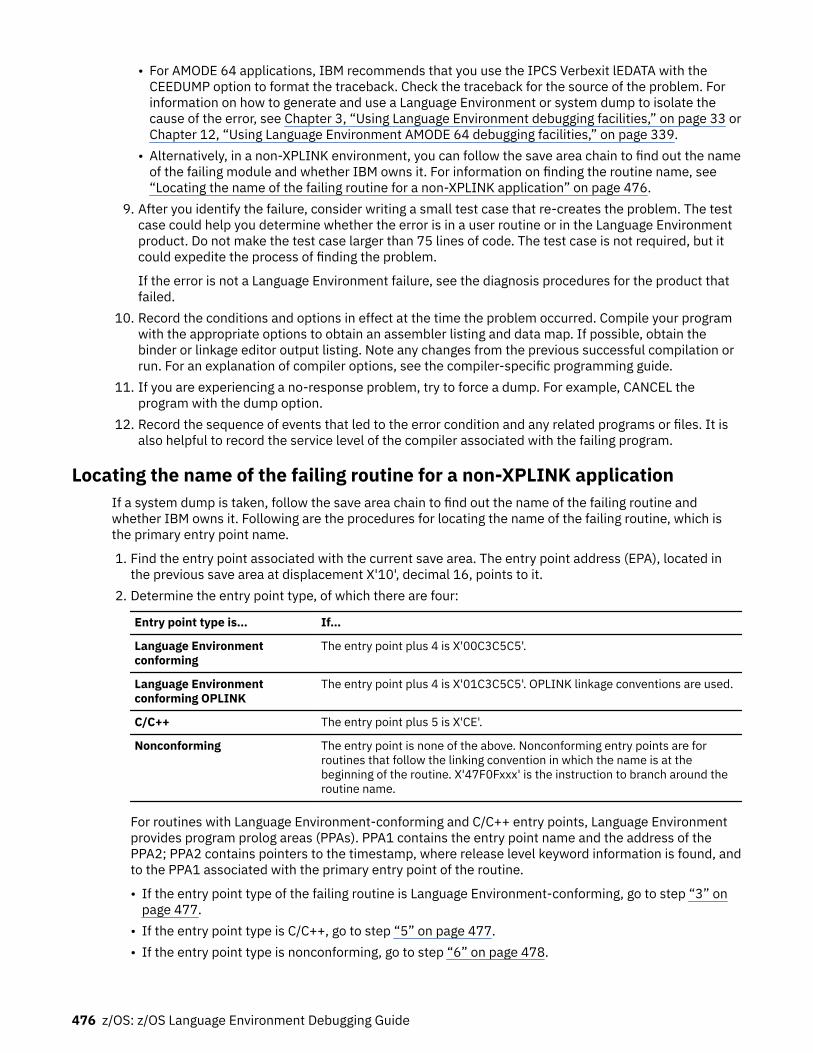
• For AMODE 64 applications, IBM recommends that you use the IPCS Verbexit lEDATA with theCEEDUMP option to format the traceback. Check the traceback for the source of the problem. Forinformation on how to generate and use a Language Environment or system dump to isolate thecause of the error, see Chapter 3, “Using Language Environment debugging facilities,” on page 33 orChapter 12, “Using Language Environment AMODE 64 debugging facilities,” on page 339.
• Alternatively, in a non-XPLINK environment, you can follow the save area chain to find out the nameof the failing module and whether IBM owns it. For information on finding the routine name, see“Locating the name of the failing routine for a non-XPLINK application” on page 476.
9. After you identify the failure, consider writing a small test case that re-creates the problem. The testcase could help you determine whether the error is in a user routine or in the Language Environmentproduct. Do not make the test case larger than 75 lines of code. The test case is not required, but itcould expedite the process of finding the problem.
If the error is not a Language Environment failure, see the diagnosis procedures for the product thatfailed.
10. Record the conditions and options in effect at the time the problem occurred. Compile your programwith the appropriate options to obtain an assembler listing and data map. If possible, obtain thebinder or linkage editor output listing. Note any changes from the previous successful compilation orrun. For an explanation of compiler options, see the compiler-specific programming guide.
11. If you are experiencing a no-response problem, try to force a dump. For example, CANCEL theprogram with the dump option.
12. Record the sequence of events that led to the error condition and any related programs or files. It isalso helpful to record the service level of the compiler associated with the failing program.
Locating the name of the failing routine for a non-XPLINK applicationIf a system dump is taken, follow the save area chain to find out the name of the failing routine andwhether IBM owns it. Following are the procedures for locating the name of the failing routine, which isthe primary entry point name.
1. Find the entry point associated with the current save area. The entry point address (EPA), located inthe previous save area at displacement X'10', decimal 16, points to it.
2. Determine the entry point type, of which there are four:
Entry point type is… If…
Language Environmentconforming
The entry point plus 4 is X'00C3C5C5'.
Language Environmentconforming OPLINK
The entry point plus 4 is X'01C3C5C5'. OPLINK linkage conventions are used.
C/C++ The entry point plus 5 is X'CE'.
Nonconforming The entry point is none of the above. Nonconforming entry points are forroutines that follow the linking convention in which the name is at thebeginning of the routine. X'47F0Fxxx' is the instruction to branch around theroutine name.
For routines with Language Environment-conforming and C/C++ entry points, Language Environmentprovides program prolog areas (PPAs). PPA1 contains the entry point name and the address of thePPA2; PPA2 contains pointers to the timestamp, where release level keyword information is found, andto the PPA1 associated with the primary entry point of the routine.
• If the entry point type of the failing routine is Language Environment-conforming, go to step “3” onpage 477.
• If the entry point type is C/C++, go to step “5” on page 477.• If the entry point type is nonconforming, go to step “6” on page 478.
476 z/OS: z/OS Language Environment Debugging Guide
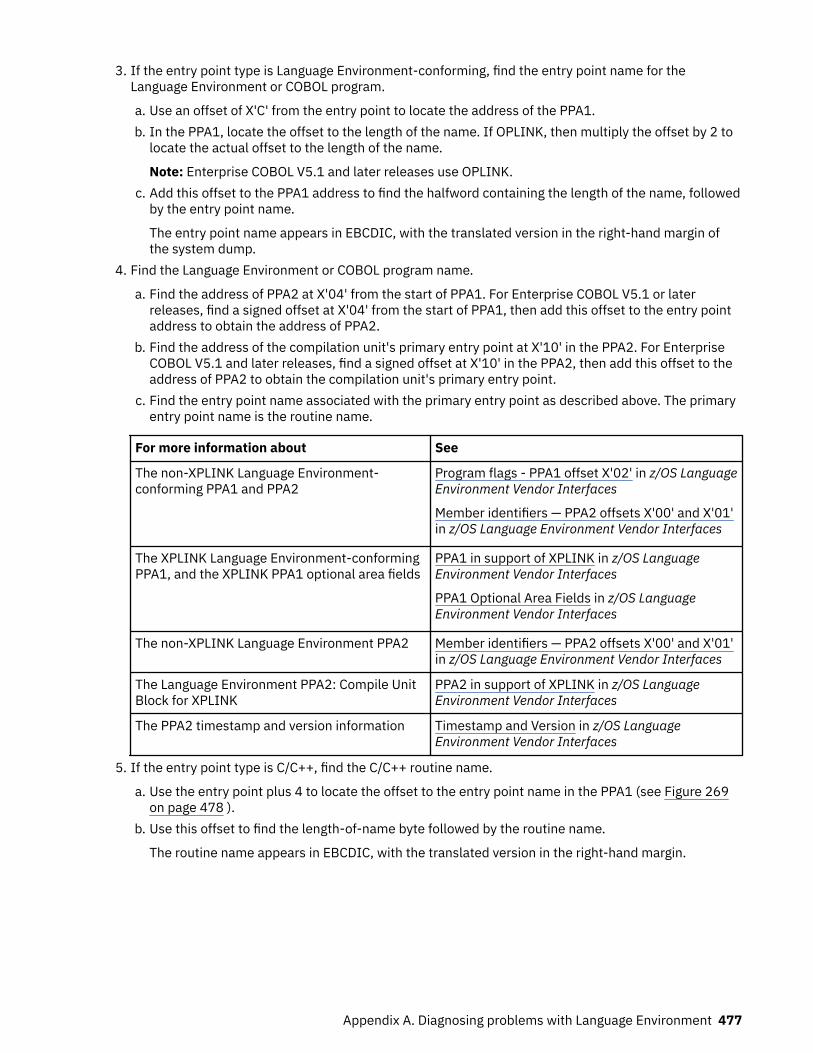
3. If the entry point type is Language Environment-conforming, find the entry point name for theLanguage Environment or COBOL program.
a. Use an offset of X'C' from the entry point to locate the address of the PPA1.b. In the PPA1, locate the offset to the length of the name. If OPLINK, then multiply the offset by 2 to
locate the actual offset to the length of the name.
Note: Enterprise COBOL V5.1 and later releases use OPLINK.c. Add this offset to the PPA1 address to find the halfword containing the length of the name, followed
by the entry point name.
The entry point name appears in EBCDIC, with the translated version in the right-hand margin ofthe system dump.
4. Find the Language Environment or COBOL program name.
a. Find the address of PPA2 at X'04' from the start of PPA1. For Enterprise COBOL V5.1 or laterreleases, find a signed offset at X'04' from the start of PPA1, then add this offset to the entry pointaddress to obtain the address of PPA2.
b. Find the address of the compilation unit's primary entry point at X'10' in the PPA2. For EnterpriseCOBOL V5.1 and later releases, find a signed offset at X'10' in the PPA2, then add this offset to theaddress of PPA2 to obtain the compilation unit's primary entry point.
c. Find the entry point name associated with the primary entry point as described above. The primaryentry point name is the routine name.
For more information about See
The non-XPLINK Language Environment-conforming PPA1 and PPA2
Program flags - PPA1 offset X'02' in z/OS LanguageEnvironment Vendor Interfaces
Member identifiers — PPA2 offsets X'00' and X'01'in z/OS Language Environment Vendor Interfaces
The XPLINK Language Environment-conformingPPA1, and the XPLINK PPA1 optional area fields
PPA1 in support of XPLINK in z/OS LanguageEnvironment Vendor Interfaces
PPA1 Optional Area Fields in z/OS LanguageEnvironment Vendor Interfaces
The non-XPLINK Language Environment PPA2 Member identifiers — PPA2 offsets X'00' and X'01'in z/OS Language Environment Vendor Interfaces
The Language Environment PPA2: Compile UnitBlock for XPLINK
PPA2 in support of XPLINK in z/OS LanguageEnvironment Vendor Interfaces
The PPA2 timestamp and version information Timestamp and Version in z/OS LanguageEnvironment Vendor Interfaces
5. If the entry point type is C/C++, find the C/C++ routine name.
a. Use the entry point plus 4 to locate the offset to the entry point name in the PPA1 (see Figure 269on page 478 ).
b. Use this offset to find the length-of-name byte followed by the routine name.
The routine name appears in EBCDIC, with the translated version in the right-hand margin.
Appendix A. Diagnosing problems with Language Environment 477
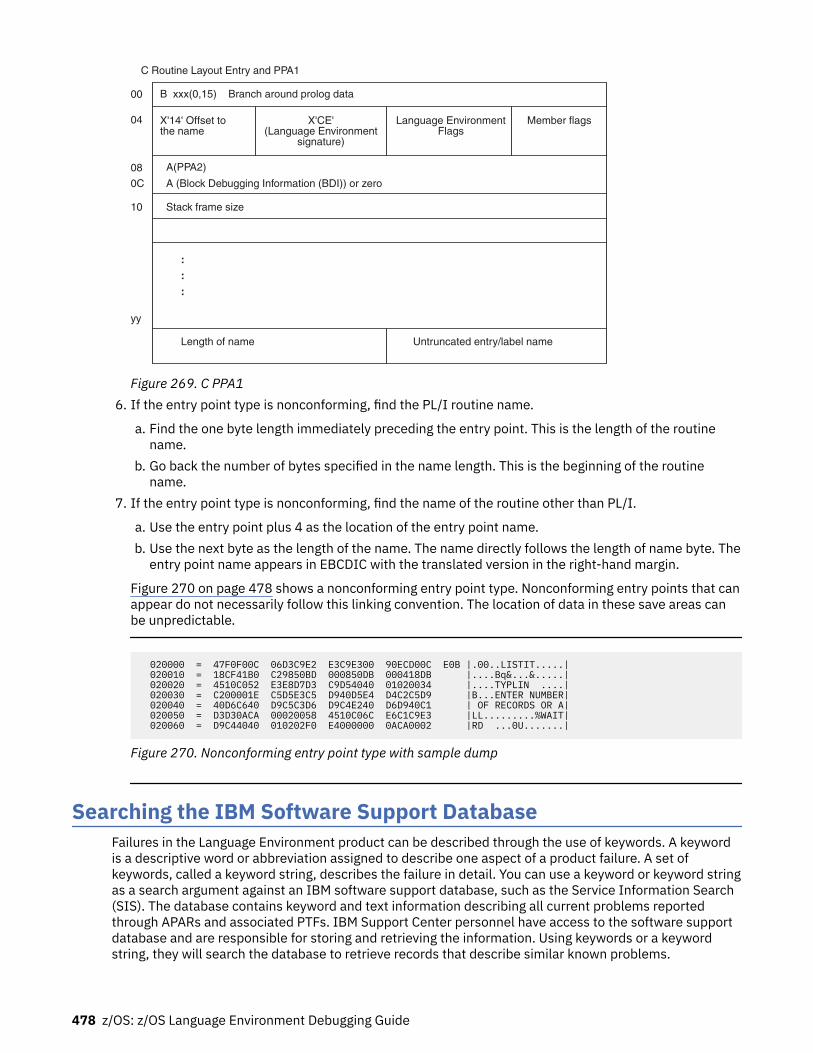
yy
B xxx(0,15) Branch around prolog data
08
00
Untruncated entry/label name
04
0C
10
A (Block Debugging Information (BDI)) or zero
Stack frame size
Member flagsLanguage EnvironmentFlags
X'CE'(Language Environment
signature)
X'14' Offset tothe name
C Routine Layout Entry and PPA1
:
:
:
Length of name
A(PPA2)
Figure 269. C PPA16. If the entry point type is nonconforming, find the PL/I routine name.
a. Find the one byte length immediately preceding the entry point. This is the length of the routinename.
b. Go back the number of bytes specified in the name length. This is the beginning of the routinename.
7. If the entry point type is nonconforming, find the name of the routine other than PL/I.
a. Use the entry point plus 4 as the location of the entry point name.b. Use the next byte as the length of the name. The name directly follows the length of name byte. The
entry point name appears in EBCDIC with the translated version in the right-hand margin.
Figure 270 on page 478 shows a nonconforming entry point type. Nonconforming entry points that canappear do not necessarily follow this linking convention. The location of data in these save areas canbe unpredictable.
020000 = 47F0F00C 06D3C9E2 E3C9E300 90ECD00C E0B |.00..LISTIT.....| 020010 = 18CF41B0 C29850BD 000850DB 000418DB |....Bq&...&.....| 020020 = 4510C052 E3E8D7D3 C9D54040 01020034 |....TYPLIN ....| 020030 = C200001E C5D5E3C5 D940D5E4 D4C2C5D9 |B...ENTER NUMBER| 020040 = 40D6C640 D9C5C3D6 D9C4E240 D6D940C1 | OF RECORDS OR A| 020050 = D3D30ACA 00020058 4510C06C E6C1C9E3 |LL.........%WAIT| 020060 = D9C44040 010202F0 E4000000 0ACA0002 |RD ...0U.......|
Figure 270. Nonconforming entry point type with sample dump
Searching the IBM Software Support DatabaseFailures in the Language Environment product can be described through the use of keywords. A keywordis a descriptive word or abbreviation assigned to describe one aspect of a product failure. A set ofkeywords, called a keyword string, describes the failure in detail. You can use a keyword or keyword stringas a search argument against an IBM software support database, such as the Service Information Search(SIS). The database contains keyword and text information describing all current problems reportedthrough APARs and associated PTFs. IBM Support Center personnel have access to the software supportdatabase and are responsible for storing and retrieving the information. Using keywords or a keywordstring, they will search the database to retrieve records that describe similar known problems.
478 z/OS: z/OS Language Environment Debugging Guide
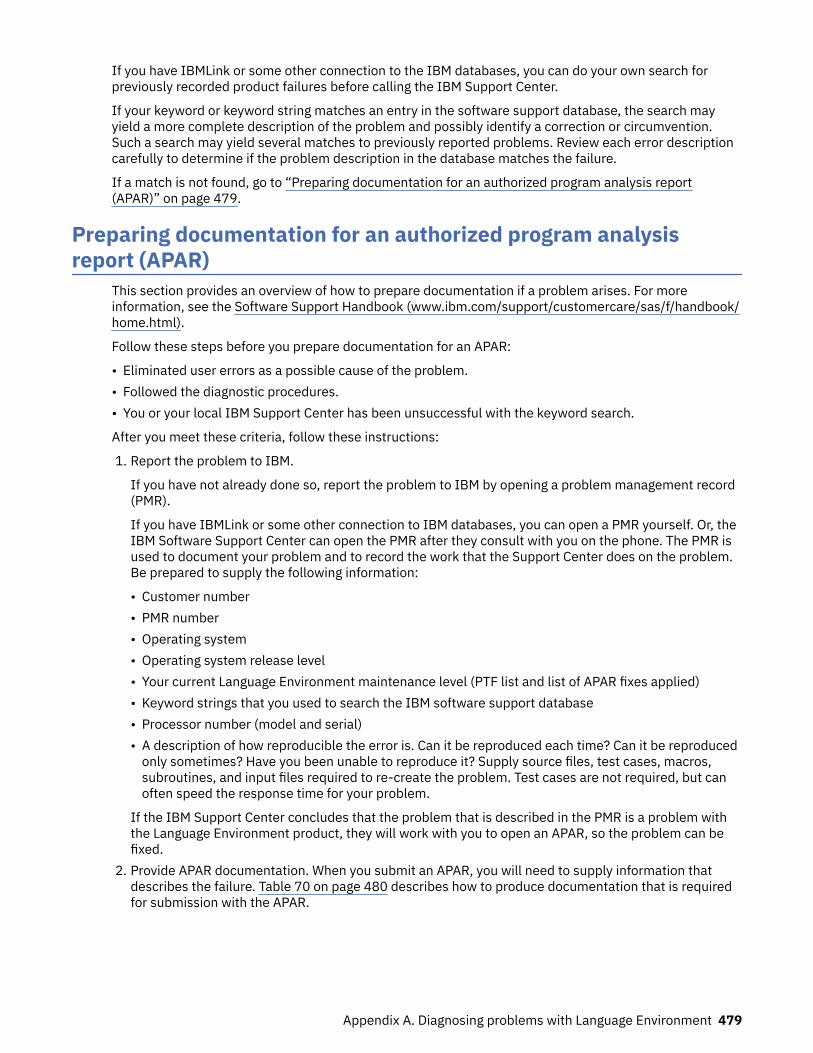
If you have IBMLink or some other connection to the IBM databases, you can do your own search forpreviously recorded product failures before calling the IBM Support Center.
If your keyword or keyword string matches an entry in the software support database, the search mayyield a more complete description of the problem and possibly identify a correction or circumvention.Such a search may yield several matches to previously reported problems. Review each error descriptioncarefully to determine if the problem description in the database matches the failure.
If a match is not found, go to “Preparing documentation for an authorized program analysis report(APAR)” on page 479.
Preparing documentation for an authorized program analysisreport (APAR)
This section provides an overview of how to prepare documentation if a problem arises. For moreinformation, see the Software Support Handbook (www.ibm.com/support/customercare/sas/f/handbook/home.html).
Follow these steps before you prepare documentation for an APAR:
• Eliminated user errors as a possible cause of the problem.• Followed the diagnostic procedures.• You or your local IBM Support Center has been unsuccessful with the keyword search.
After you meet these criteria, follow these instructions:
1. Report the problem to IBM.
If you have not already done so, report the problem to IBM by opening a problem management record(PMR).
If you have IBMLink or some other connection to IBM databases, you can open a PMR yourself. Or, theIBM Software Support Center can open the PMR after they consult with you on the phone. The PMR isused to document your problem and to record the work that the Support Center does on the problem.Be prepared to supply the following information:
• Customer number• PMR number• Operating system• Operating system release level• Your current Language Environment maintenance level (PTF list and list of APAR fixes applied)• Keyword strings that you used to search the IBM software support database• Processor number (model and serial)• A description of how reproducible the error is. Can it be reproduced each time? Can it be reproduced
only sometimes? Have you been unable to reproduce it? Supply source files, test cases, macros,subroutines, and input files required to re-create the problem. Test cases are not required, but canoften speed the response time for your problem.
If the IBM Support Center concludes that the problem that is described in the PMR is a problem withthe Language Environment product, they will work with you to open an APAR, so the problem can befixed.
2. Provide APAR documentation. When you submit an APAR, you will need to supply information thatdescribes the failure. Table 70 on page 480 describes how to produce documentation that is requiredfor submission with the APAR.
Appendix A. Diagnosing problems with Language Environment 479
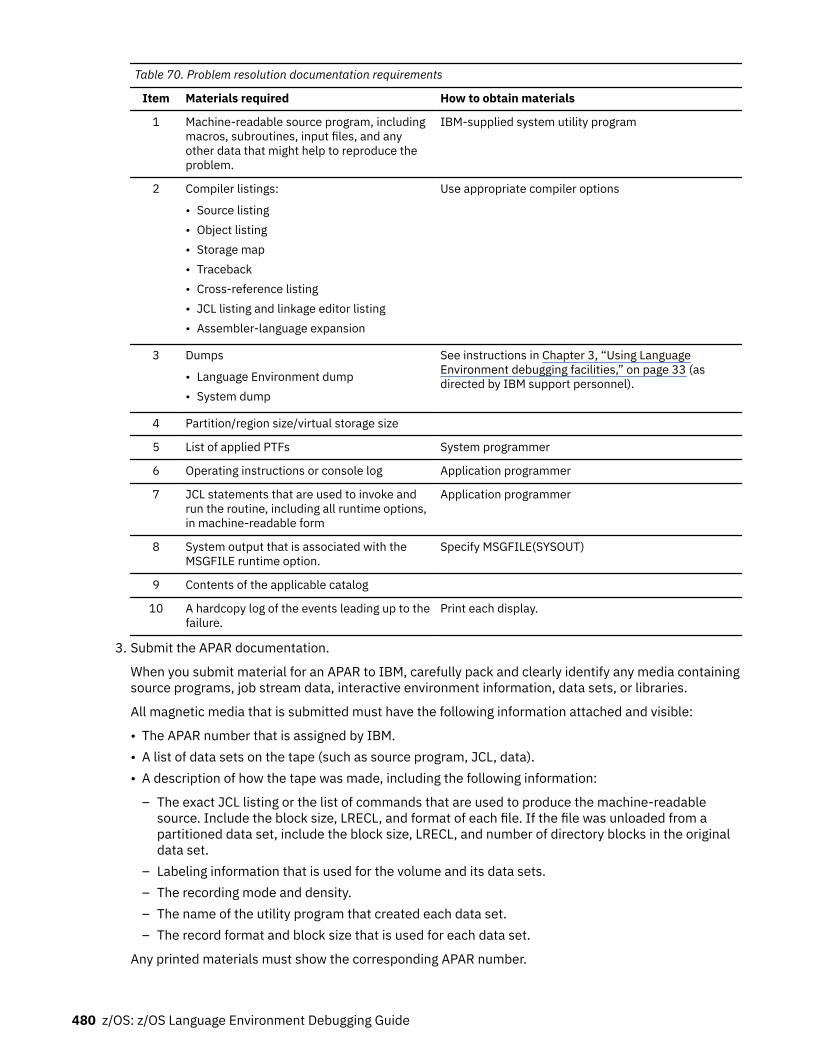
Table 70. Problem resolution documentation requirements
Item Materials required How to obtain materials
1 Machine-readable source program, includingmacros, subroutines, input files, and anyother data that might help to reproduce theproblem.
IBM-supplied system utility program
2 Compiler listings:
• Source listing• Object listing• Storage map• Traceback• Cross-reference listing• JCL listing and linkage editor listing• Assembler-language expansion
Use appropriate compiler options
3 Dumps
• Language Environment dump• System dump
See instructions in Chapter 3, “Using LanguageEnvironment debugging facilities,” on page 33 (asdirected by IBM support personnel).
4 Partition/region size/virtual storage size
5 List of applied PTFs System programmer
6 Operating instructions or console log Application programmer
7 JCL statements that are used to invoke andrun the routine, including all runtime options,in machine-readable form
Application programmer
8 System output that is associated with theMSGFILE runtime option.
Specify MSGFILE(SYSOUT)
9 Contents of the applicable catalog
10 A hardcopy log of the events leading up to thefailure.
Print each display.
3. Submit the APAR documentation.
When you submit material for an APAR to IBM, carefully pack and clearly identify any media containingsource programs, job stream data, interactive environment information, data sets, or libraries.
All magnetic media that is submitted must have the following information attached and visible:
• The APAR number that is assigned by IBM.• A list of data sets on the tape (such as source program, JCL, data).• A description of how the tape was made, including the following information:
– The exact JCL listing or the list of commands that are used to produce the machine-readablesource. Include the block size, LRECL, and format of each file. If the file was unloaded from apartitioned data set, include the block size, LRECL, and number of directory blocks in the originaldata set.
– Labeling information that is used for the volume and its data sets.– The recording mode and density.– The name of the utility program that created each data set.– The record format and block size that is used for each data set.
Any printed materials must show the corresponding APAR number.
480 z/OS: z/OS Language Environment Debugging Guide
The IBM service personnel will inform you of the mailing address of the service center nearest you.
If an electronic link with IBM Service is available, use this link to send diagnostic information to IBMService.
After the APAR is opened and the fix is produced, the description of the problem and the fix will be in thesoftware support database in SIS, accessible through ServiceLink.
Appendix A. Diagnosing problems with Language Environment 481

482 z/OS: z/OS Language Environment Debugging Guide
Appendix B. Accessibility
Accessible publications for this product are offered through IBM Documentation (www.ibm.com/docs/en/zos).
If you experience difficulty with the accessibility of any z/OS information, send a detailed message to theContact the z/OS team web page (www.ibm.com/systems/campaignmail/z/zos/contact_z) or use thefollowing mailing address.
IBM CorporationAttention: MHVRCFS Reader CommentsDepartment H6MA, Building 7072455 South RoadPoughkeepsie, NY 12601-5400United States
Accessibility features
Accessibility features help users who have physical disabilities such as restricted mobility or limited visionuse software products successfully. The accessibility features in z/OS can help users do the followingtasks:
• Run assistive technology such as screen readers and screen magnifier software.• Operate specific or equivalent features by using the keyboard.• Customize display attributes such as color, contrast, and font size.
Consult assistive technologiesAssistive technology products such as screen readers function with the user interfaces found in z/OS.Consult the product information for the specific assistive technology product that is used to access z/OSinterfaces.
Keyboard navigation of the user interfaceYou can access z/OS user interfaces with TSO/E or ISPF. The following information describes how to useTSO/E and ISPF, including the use of keyboard shortcuts and function keys (PF keys). Each guide includesthe default settings for the PF keys.
• z/OS TSO/E Primer• z/OS TSO/E User's Guide• z/OS ISPF User's Guide Vol I
Dotted decimal syntax diagramsSyntax diagrams are provided in dotted decimal format for users who access IBM Documentation with ascreen reader. In dotted decimal format, each syntax element is written on a separate line. If two or moresyntax elements are always present together (or always absent together), they can appear on the sameline because they are considered a single compound syntax element.
Each line starts with a dotted decimal number; for example, 3 or 3.1 or 3.1.1. To hear these numberscorrectly, make sure that the screen reader is set to read out punctuation. All the syntax elements thathave the same dotted decimal number (for example, all the syntax elements that have the number 3.1)
© Copyright IBM Corp. 1991, 2020 483
are mutually exclusive alternatives. If you hear the lines 3.1 USERID and 3.1 SYSTEMID, your syntaxcan include either USERID or SYSTEMID, but not both.
The dotted decimal numbering level denotes the level of nesting. For example, if a syntax element withdotted decimal number 3 is followed by a series of syntax elements with dotted decimal number 3.1, allthe syntax elements numbered 3.1 are subordinate to the syntax element numbered 3.
Certain words and symbols are used next to the dotted decimal numbers to add information about thesyntax elements. Occasionally, these words and symbols might occur at the beginning of the elementitself. For ease of identification, if the word or symbol is a part of the syntax element, it is preceded by thebackslash (\) character. The * symbol is placed next to a dotted decimal number to indicate that thesyntax element repeats. For example, syntax element *FILE with dotted decimal number 3 is given theformat 3 \* FILE. Format 3* FILE indicates that syntax element FILE repeats. Format 3* \* FILEindicates that syntax element * FILE repeats.
Characters such as commas, which are used to separate a string of syntax elements, are shown in thesyntax just before the items they separate. These characters can appear on the same line as each item, oron a separate line with the same dotted decimal number as the relevant items. The line can also showanother symbol to provide information about the syntax elements. For example, the lines 5.1*, 5.1LASTRUN, and 5.1 DELETE mean that if you use more than one of the LASTRUN and DELETE syntaxelements, the elements must be separated by a comma. If no separator is given, assume that you use ablank to separate each syntax element.
If a syntax element is preceded by the % symbol, it indicates a reference that is defined elsewhere. Thestring that follows the % symbol is the name of a syntax fragment rather than a literal. For example, theline 2.1 %OP1 means that you must refer to separate syntax fragment OP1.
The following symbols are used next to the dotted decimal numbers.? indicates an optional syntax element
The question mark (?) symbol indicates an optional syntax element. A dotted decimal numberfollowed by the question mark symbol (?) indicates that all the syntax elements with a correspondingdotted decimal number, and any subordinate syntax elements, are optional. If there is only one syntaxelement with a dotted decimal number, the ? symbol is displayed on the same line as the syntaxelement, (for example 5? NOTIFY). If there is more than one syntax element with a dotted decimalnumber, the ? symbol is displayed on a line by itself, followed by the syntax elements that areoptional. For example, if you hear the lines 5 ?, 5 NOTIFY, and 5 UPDATE, you know that thesyntax elements NOTIFY and UPDATE are optional. That is, you can choose one or none of them.The ? symbol is equivalent to a bypass line in a railroad diagram.
! indicates a default syntax elementThe exclamation mark (!) symbol indicates a default syntax element. A dotted decimal numberfollowed by the ! symbol and a syntax element indicate that the syntax element is the default optionfor all syntax elements that share the same dotted decimal number. Only one of the syntax elementsthat share the dotted decimal number can specify the ! symbol. For example, if you hear the lines 2?FILE, 2.1! (KEEP), and 2.1 (DELETE), you know that (KEEP) is the default option for theFILE keyword. In the example, if you include the FILE keyword, but do not specify an option, thedefault option KEEP is applied. A default option also applies to the next higher dotted decimalnumber. In this example, if the FILE keyword is omitted, the default FILE(KEEP) is used. However, ifyou hear the lines 2? FILE, 2.1, 2.1.1! (KEEP), and 2.1.1 (DELETE), the default optionKEEP applies only to the next higher dotted decimal number, 2.1 (which does not have an associatedkeyword), and does not apply to 2? FILE. Nothing is used if the keyword FILE is omitted.
* indicates an optional syntax element that is repeatableThe asterisk or glyph (*) symbol indicates a syntax element that can be repeated zero or more times. Adotted decimal number followed by the * symbol indicates that this syntax element can be used zeroor more times; that is, it is optional and can be repeated. For example, if you hear the line 5.1* dataarea, you know that you can include one data area, more than one data area, or no data area. If youhear the lines 3* , 3 HOST, 3 STATE, you know that you can include HOST, STATE, bothtogether, or nothing.
Notes:
484 z/OS: z/OS Language Environment Debugging Guide
1. If a dotted decimal number has an asterisk (*) next to it and there is only one item with that dotteddecimal number, you can repeat that same item more than once.
2. If a dotted decimal number has an asterisk next to it and several items have that dotted decimalnumber, you can use more than one item from the list, but you cannot use the items more thanonce each. In the previous example, you can write HOST STATE, but you cannot write HOST HOST.
3. The * symbol is equivalent to a loopback line in a railroad syntax diagram.
+ indicates a syntax element that must be includedThe plus (+) symbol indicates a syntax element that must be included at least once. A dotted decimalnumber followed by the + symbol indicates that the syntax element must be included one or moretimes. That is, it must be included at least once and can be repeated. For example, if you hear the line6.1+ data area, you must include at least one data area. If you hear the lines 2+, 2 HOST, and2 STATE, you know that you must include HOST, STATE, or both. Similar to the * symbol, the +symbol can repeat a particular item if it is the only item with that dotted decimal number. The +symbol, like the * symbol, is equivalent to a loopback line in a railroad syntax diagram.
Appendix B. Accessibility 485

486 z/OS: z/OS Language Environment Debugging Guide
Notices
This information was developed for products and services that are offered in the USA or elsewhere.
IBM may not offer the products, services, or features discussed in this document in other countries.Consult your local IBM representative for information on the products and services currently available inyour area. Any reference to an IBM product, program, or service is not intended to state or imply that onlythat IBM product, program, or service may be used. Any functionally equivalent product, program, orservice that does not infringe any IBM intellectual property right may be used instead. However, it is theuser's responsibility to evaluate and verify the operation of any non-IBM product, program, or service.
IBM may have patents or pending patent applications covering subject matter described in thisdocument. The furnishing of this document does not grant you any license to these patents. You can sendlicense inquiries, in writing, to:
IBM Director of LicensingIBM CorporationNorth Castle Drive, MD-NC119Armonk, NY 10504-1785United States of America
For license inquiries regarding double-byte character set (DBCS) information, contact the IBM IntellectualProperty Department in your country or send inquiries, in writing, to:
Intellectual Property LicensingLegal and Intellectual Property LawIBM Japan Ltd.19-21, Nihonbashi-Hakozakicho, Chuo-kuTokyo 103-8510, Japan
The following paragraph does not apply to the United Kingdom or any other country where suchprovisions are inconsistent with local law: INTERNATIONAL BUSINESS MACHINES CORPORATIONPROVIDES THIS PUBLICATION "AS IS" WITHOUT WARRANTY OF ANY KIND, EITHER EXPRESS ORIMPLIED, INCLUDING, BUT NOT LIMITED TO, THE IMPLIED WARRANTIES OF NON-INFRINGEMENT,MERCHANTABILITY OR FITNESS FOR A PARTICULAR PURPOSE. Some states do not allow disclaimer ofexpress or implied warranties in certain transactions, therefore, this statement may not apply to you.
This information could include technical inaccuracies or typographical errors. Changes are periodicallymade to the information herein; these changes will be incorporated in new editions of the publication.IBM may make improvements and/or changes in the product(s) and/or the program(s) described in thispublication at any time without notice.
This information could include missing, incorrect, or broken hyperlinks. Hyperlinks are maintained in onlythe HTML plug-in output for IBM Documentation. Use of hyperlinks in other output formats of thisinformation is at your own risk.
Any references in this information to non-IBM websites are provided for convenience only and do not inany manner serve as an endorsement of those websites. The materials at those websites are not part ofthe materials for this IBM product and use of those websites is at your own risk.
IBM may use or distribute any of the information you supply in any way it believes appropriate withoutincurring any obligation to you.
Licensees of this program who wish to have information about it for the purpose of enabling: (i) theexchange of information between independently created programs and other programs (including thisone) and (ii) the mutual use of the information which has been exchanged, should contact:
IBM CorporationSite Counsel2455 South Road
© Copyright IBM Corp. 1991, 2020 487
Poughkeepsie, NY 12601-5400USA
Such information may be available, subject to appropriate terms and conditions, including in some cases,payment of a fee.
The licensed program described in this document and all licensed material available for it are provided byIBM under terms of the IBM Customer Agreement, IBM International Program License Agreement or anyequivalent agreement between us.
Any performance data contained herein was determined in a controlled environment. Therefore, theresults obtained in other operating environments may vary significantly. Some measurements may havebeen made on development-level systems and there is no guarantee that these measurements will be thesame on generally available systems. Furthermore, some measurements may have been estimatedthrough extrapolation. Actual results may vary. Users of this document should verify the applicable datafor their specific environment.
Information concerning non-IBM products was obtained from the suppliers of those products, theirpublished announcements or other publicly available sources. IBM has not tested those products andcannot confirm the accuracy of performance, compatibility or any other claims related to non-IBMproducts. Questions on the capabilities of non-IBM products should be addressed to the suppliers ofthose products.
All statements regarding IBM's future direction or intent are subject to change or withdrawal withoutnotice, and represent goals and objectives only.
This information contains examples of data and reports used in daily business operations. To illustratethem as completely as possible, the examples include the names of individuals, companies, brands, andproducts. All of these names are fictitious and any similarity to the names and addresses used by anactual business enterprise is entirely coincidental.
COPYRIGHT LICENSE:
This information contains sample application programs in source language, which illustrate programmingtechniques on various operating platforms. You may copy, modify, and distribute these sample programsin any form without payment to IBM, for the purposes of developing, using, marketing or distributingapplication programs conforming to the application programming interface for the operating platform forwhich the sample programs are written. These examples have not been thoroughly tested under allconditions. IBM, therefore, cannot guarantee or imply reliability, serviceability, or function of theseprograms. The sample programs are provided "AS IS", without warranty of any kind. IBM shall not beliable for any damages arising out of your use of the sample programs.
Terms and conditions for product documentationPermissions for the use of these publications are granted subject to the following terms and conditions.
ApplicabilityThese terms and conditions are in addition to any terms of use for the IBM website.
Personal useYou may reproduce these publications for your personal, noncommercial use provided that all proprietarynotices are preserved. You may not distribute, display or make derivative work of these publications, orany portion thereof, without the express consent of IBM.
Commercial useYou may reproduce, distribute and display these publications solely within your enterprise provided thatall proprietary notices are preserved. You may not make derivative works of these publications, or
488 z/OS: z/OS Language Environment Debugging Guide
reproduce, distribute or display these publications or any portion thereof outside your enterprise, withoutthe express consent of IBM.
RightsExcept as expressly granted in this permission, no other permissions, licenses or rights are granted, eitherexpress or implied, to the publications or any information, data, software or other intellectual propertycontained therein.
IBM reserves the right to withdraw the permissions granted herein whenever, in its discretion, the use ofthe publications is detrimental to its interest or, as determined by IBM, the above instructions are notbeing properly followed.
You may not download, export or re-export this information except in full compliance with all applicablelaws and regulations, including all United States export laws and regulations.
IBM MAKES NO GUARANTEE ABOUT THE CONTENT OF THESE PUBLICATIONS. THE PUBLICATIONS AREPROVIDED "AS-IS" AND WITHOUT WARRANTY OF ANY KIND, EITHER EXPRESSED OR IMPLIED,INCLUDING BUT NOT LIMITED TO IMPLIED WARRANTIES OF MERCHANTABILITY, NON-INFRINGEMENT,AND FITNESS FOR A PARTICULAR PURPOSE.
IBM Online Privacy StatementIBM Software products, including software as a service solutions, ("Software Offerings") may use cookiesor other technologies to collect product usage information, to help improve the end user experience, totailor interactions with the end user, or for other purposes. In many cases no personally identifiableinformation is collected by the Software Offerings. Some of our Software Offerings can help enable you tocollect personally identifiable information. If this Software Offering uses cookies to collect personallyidentifiable information, specific information about this offering’s use of cookies is set forth below.
Depending upon the configurations deployed, this Software Offering may use session cookies that collecteach user’s name, email address, phone number, or other personally identifiable information for purposesof enhanced user usability and single sign-on configuration. These cookies can be disabled, but disablingthem will also eliminate the functionality they enable.
If the configurations deployed for this Software Offering provide you as customer the ability to collectpersonally identifiable information from end users via cookies and other technologies, you should seekyour own legal advice about any laws applicable to such data collection, including any requirements fornotice and consent.
For more information about the use of various technologies, including cookies, for these purposes, seeIBM’s Privacy Policy at ibm.com/privacy and IBM’s Online Privacy Statement at ibm.com/privacy/details inthe section entitled “Cookies, Web Beacons and Other Technologies,” and the “IBM Software Productsand Software-as-a-Service Privacy Statement” at ibm.com/software/info/product-privacy.
Policy for unsupported hardwareVarious z/OS elements, such as DFSMSdfp, JES2, JES3, and MVS, contain code that supports specifichardware servers or devices. In some cases, this device-related element support remains in the producteven after the hardware devices pass their announced End of Service date. z/OS may continue to serviceelement code; however, it will not provide service related to unsupported hardware devices. Softwareproblems related to these devices will not be accepted for service, and current service activity will cease ifa problem is determined to be associated with out-of-support devices. In such cases, fixes will not beissued.
Minimum supported hardwareThe minimum supported hardware for z/OS releases identified in z/OS announcements can subsequentlychange when service for particular servers or devices is withdrawn. Likewise, the levels of other softwareproducts supported on a particular release of z/OS are subject to the service support lifecycle of those
Notices 489
products. Therefore, z/OS and its product publications (for example, panels, samples, messages, andproduct documentation) can include references to hardware and software that is no longer supported.
• For information about software support lifecycle, see: IBM Lifecycle Support for z/OS (www.ibm.com/software/support/systemsz/lifecycle)
• For information about currently-supported IBM hardware, contact your IBM representative.
Programming interface informationThis publication documents information NOT intended to be used as a Programming Interface ofLanguage Environment in z/OS.
TrademarksIBM, the IBM logo, and ibm.com are trademarks or registered trademarks of International BusinessMachines Corp., registered in many jurisdictions worldwide. Other product and service names might betrademarks of IBM or other companies. A current list of IBM trademarks is available on the Web atCopyright and Trademark information (www.ibm.com/legal/copytrade.shtml).
Adobe, Acrobat, and PostScript are either registered trademarks or trademarks of Adobe SystemsIncorporated in the United States, other countries, or both.
Java and all Java-based trademarks and logos are trademarks or registered trademarks of Oracle and/orits affiliates.
UNIX is a registered trademark of The Open Group in the United States and other countries.
Other company, product, and service names might be trademarks or service marks of others.
490 z/OS: z/OS Language Environment Debugging Guide
Index
Special Characters__abend 164, 432__alloc 164, 432__amrc 164, 432__cabend() function 331, 337, 356__code 164, 432__error 164, 432__feedback 164, 432__last_op 164, 432__le_cib_get() function 331__le_message_get_and_and_write() function 324, 333__le_message_get() function 333__le_msg_write() function 324, 333__msg 165, 433__reset_exception_handler() function 331__set_exception_handler() function 331, 332_BPXK_MDUMP 83_EDC_ADD_ERRNO2 169, 438
Numerics64-bit applications 323, 335, 339, 431
Aabend codes
< 4000 28, 336>= 4000 28, 3364093 335passing to operating system 23system, example of 30, 337user-specified, example of 30, 337user, example of 30, 337, 338using 30, 337
abendsinternal, table of output 318Language Environment 30, 315requested by assembler user exit 23system 30, 338under CICS 315user 30, 338
ABPERC runtime optionfunction 8generating a system dump and 81modifying condition handling behavior and 21
ABTERMENC runtime optionusing 23
accessibilitycontact IBM 483features 483
AGGREGATE compiler option 4, 6AMODE 64 applications
classifying errors 335debugging C/C++ 431preparing for debugging 323using debugging 339
anywhere heapstatistics 18
APAR (Authorized Program Analysis Report)documentation 479
application program interfaces (API) 331, 333application programs
debugginghandling a storage dump written to a z/OS UNIX file213, 462
argumentin dump 62
arguments, registers, and variables for active routines 60,355assembler language
user exitfor CICS 317generating a system dump with 81, 356modifying condition handling behavior and 23using 22, 23
assistive technologies 483atexit
information in dump 186automatic variables
locating in dump 274, 300
Bbase locator
for working storage 230in dump 230
below heapstatistics 18
BLOCKS option of CEE3DMP callable service 35
CC library function
trace table entries for 449C return codes to CICS 315C/C++
__amrcexample of structure 164, 432information in dump 187
__msg 165, 433atexit
information in dump 186cdump() function 178, 442compiler options 3debugging examples 203, 210, 452dump
information in 186parameter in 175structure variables, locating in 176system, structures in 176
filecontrol block information 187status and attributes in dump 187
Index 491
C/C++ (continued)functions
calling dump, example 178, 442cdump() 40, 178, 341, 442csnap() 40, 178, 179, 341, 442ctrace() 40, 178, 179, 341, 442fetch() 163, 431fopen() 165, 433perror() 163, 169, 431, 437printf() 164, 432to produce dump output 40, 341
memory file control block 187stdio.h 164, 432timestamp 177
CAA (common anchor area) 64, 355, 360, 362, 374, 406call chain 62CALL statement
CDUMP/CPDUMP 249DUMP/PDUMP 247SDUMP 249
callable services 20case 1 condition token 25, 333case 2 condition token 25, 333cdump() function 178, 336, 442CEE prefix 27, 29, 335, 337CEE3ABD—terminate enclave with an abend
generating a dump and 81handling user abends and 20, 30modifying condition handling behavior and 20
CEE3DMP—generate dumpgenerating a Language Environment dump with 33options 34relationship to PLIDUMP 268, 296syntax 34
CEE3GRO—returns location offset 20CEE3SRP—set resume point 20CEEBXITA assembler user exit 22, 23CEECXITA assembler user exit 317CEEDCOD—decompose a condition token 25CEEDUMP—Language Environment Dump Service
control blocks 104, 373locating 151
CEEDUMPs, controlling access 149CEEHDLR—register user condition handler 22CEEHDLR—register user exception handler 332CEEMGET—get a message 25CEEMOUT—dispatch a message 24CEEMRCE—move resume cursor to designated label 20CEEMRCR—move resume cursor relative to handle cursor 20CEEMSG—get, format, and dispatch a message 25CEESGL—signal a condition 25CEESTART 163CEL prefix 335CELQSTRT 431character
data dump 249CHECK runtime option
function 8modifying condition handling behavior and 21
CHECKOUT compiler option 4CICS
abendsapplication, from an EXEC CICS command 318, 319
debugging for 313
CICS (continued)debugging information, table of locations 313destination control table (DCT) 313example traceback in CESE transient data queue 313examples of output 313nonzero reason code returned, table of output 318reason codes 315register and program status word contents 314return codes
Language Environment 315runtime messages 313transaction
dump 314rollback 317
class test 224classifying errors table 27, 335CLLE (COBOL load list entry) 229COBCOM control block 233COBOL
base locator for working storage 230C-specific common anchor area (C-CAA) 186compiler options 5debugging examples 233, 239dump
external data in 230file information in 230linkage section in 230local variables in 227routine information in 227run unit storage in 232signal information in 186stack frames for active routines in 227working storage in 230
errors 223listings 225memory file control block 186program class storage 230return codes to CICS 315routine
calling Language Environment dump service 226COBVEC control block 233command
syntax diagrams xxviiiCOMMAREA (Communication Area) 314compiler options
C 3COBOL 5Fortran 5LP64 323, 431PL/I 6
conditioninformation
for active routines 59, 355in dump 59, 355
POSIX 25unhandled 26, 334
condition handlingbehavior, modifying 20user-written condition handler 20, 22
condition information block (CIB) 62, 75condition manager 26, 334CONDITION option of CEE3DMP callable service 36, 62condition token
case 1 25, 333
492 z/OS: z/OS Language Environment Debugging Guide
condition token (continued)case 2 25, 333example of 26, 333
conditions, nested 25, 334contact
z/OS 483control block
for active routines 60, 355csnap() function 179, 442ctrace() function 179, 336, 442
Ddata
map listing 226values 62
DCB (data control block) 229DCT (destination control table) 313DEBUG runtime option 8debugging
C, examples 203, 210, 452COBOL, examples 233, 239for CICS 313Fortran, examples 254, 255PL/I, examples 277, 283, 303, 307tool 33, 339
DEPTHCONDLMT runtime optionfunction 8, 323modifying condition handling behavior and 21wait/loop error and 28
diagnosis checklist 475display
errnojr_value 31DISPLAY statement 24, 223displays
errnojr_value 31divide-by-zero error 203, 239, 255, 283, 286, 307, 311, 452DSA (dynamic save area) 62dummy DSA 62dump
an area of storage 249date in 55, 352dynamically allocated storage in 61storage
written to a z/OS UNIX file 213, 462symbolic 249
DUMP suboption of TERMTHDACT runtime option 36, 339DUMP/PDUMP routine
format specifications 248output 248usage considerations 248
DYNDUMPs, controlling access 149
EECB (enclave control block) 61, 356EDB (enclave data block) 61, 356EDC prefix 27, 29, 335, 337edcmtext shell command 31EIB (exec interface block) 314enclave
identifier in dump 56, 352member list 55–62, 356
enclave (continued)storage 61termination
behavior, establishing 23entry information 55, 352ENTRY option of CEE3DMP callable service 36entry point
name of active routines in dump 353ERRCOUNT runtime option
function 8modifying condition handling behavior and 21wait/loop error and 28
errno 186errnojr_value
displaying 31error
determining source of 475message while Language Environment was handlinganother error 25, 334unanticipated 335
ESD compiler option 7examples
application abends from 318, 319C routines 203, 210, 452calling a nonexistent subroutine 235, 281, 306COBOL routines 233, 239divide-by-zero error 203, 239, 255, 283, 286, 307, 311,452Fortran routines 254, 255output under CICS 313PL/I routines 277, 283, 303, 307SUBSCRIPTRANGE error 233, 277, 303
exception handlingbehavior, modifying 331user-written exception handler 331
EXEC CICS DUMP statements 314external data
for COBOL programs in dump 230
Ffeedback xxxifetch
fetch information in dump 186fetch() function 163, 431fetchable module 163, 431file
for COBOL, in dump 230status key 223
file control block (FCB) 187FILES option of CEE3DMP callable service 35FLAG compiler option 4floating point registers
in dump 56fopen() function 165, 433FOR prefix 27, 29Fortran
compiler options 5debugging examples 254, 255dump services 247errors, determining the source of 245listings 246
Index 493
Ggeneral purpose registers 56GMAREA 229GONUMBER compiler option 4
HHANDLE ABEND EXEC CICS command 313header files, C
ctest.h 178, 442errno.h 203, 452stdio.h 164, 432stdlib.h 203, 452
heap pooltrace report 360
heap poolstrace report 115, 392
heap storagecreated by CEECRHP callable service 19in LEDATA Output
reports 109, 384storage in dump 61user 16
HEAP64 runtime option 326HEAPCHK runtime option
function 8, 111, 323, 386HeapPools
storage statistics 467HEAPPOOLS
storage statisticsuser-created, __uheapreport() 466user-created, _uheapreport 216
trace report 86, 115HEAPPOOLS runtime option 326HEAPPOOLS64
storage statistics 464HEAPPOOLS64 runtime option 326HEAPZONE runtime option
function 8HEAPZONES runtime option 323
II/O
conventions 163, 431IBM prefix 27, 29IGZ prefix 27, 29INFOMSGFILTER runtime option
function 8, 324INITIALIZE statement 224instance specific information (ISI) 334instruction length counter (ILC) in dump 59, 355Inter-procedural Analysis (IPA) 323interactive problem control system (IPCS)
analyzing a storage dump 213, 462cbf command 419VERBEXIT 358, 359, 362, 396, 408
interoperabilityformatting and analyzing system dump reports 471generating system dump 471report of LEDATA VERBEXIT formatted output 474
interoperability applications 471
interoperabliity applicationspreparing for debugging 471
INTERRUPT compiler optionfunction 7
INTERRUPT runtime option 8interruption code in dump 59, 355IOHEAP64 runtime option 326ITBLK in dump 233
Kkeyboard
navigation 483PF keys 483shortcut keys 483
LLAA (library anchor area) 420language constructs 223Language Environment
content, new xxxivreturn codes to CICS 315summary of changes for V2R3 xxxiii, xxxivsymbolic feedback code 25, 333
Language Environment dumpC information in 185CEEDUMP 8, 33, 323COBOL information in 228default options 34example traceback in 61, 356Fortran information in 252multiple enclaves and 79options
BLOCKS 35CONDITION 36, 62ENCLAVE 34ENTRY 36FILES 35FNAME 35NOBLOCKS 35NOCONDITION 36NOENTRY 36NOFILES 35NOSTORAGE 35NOTRACEBACK 35NOVARIABLES 35PAGESIZE(n) 35STACKFRAME 35STORAGE 35THREAD 35TRACEBACK 35, 62VARIABLES 35, 62
outputfor C routines 181for COBOL program 225for Fortran routines 252for PL/I routines 268, 296information for multiple enclaves 40, 341
PL/I information in 270, 298section descriptions 54, 352TERMTHDACT suboptions 38, 340title 55, 352
494 z/OS: z/OS Language Environment Debugging Guide
Language Environment dump (continued)traceback with condition information
C routine 181, 445COBOL program 227Fortran routine 245, 252, 253Language Environment routine 54, 352PL/I routine 268, 296
using C functions 40, 341using CDUMP/CPDUMP subroutine 247using CEE3DMP callable service 33, 54, 352using DUMP/PDUMP subroutine 247using PLIDUMP subroutine 40, 268, 296using SDUMP subroutine 247using TERMTHDACT runtime option 36, 339
LCA (library communication area) 420LEDATA
IPCS VerbexitC/C++ Output 118COBOL Output 138Parameters 85understanding output 88
IPCS VERBEXITC/C++ Output 396Parameters 359PL/I Output 408Understanding Output 362
LIBHEAP64 runtime option 326linkage section
for COBOL programs in dump 230LIST compiler option 4, 5, 7listings generated by compiler
COBOL 225Fortran 246PL/I 262, 290
LMESSAGE compiler option 7local
variables 60LP64
compiler option 323, 431
Mmachine state information
in dump 59, 355MAP compiler option 5, 7MEMCHECK VHM memory leak analysis tool 218MEMLIMIT storage parameter 335memory file control block (MFCB) 186, 187message
classifying errors and 28, 336runtime, CICS 313user-created 24using in your routine 24
modulefetchable 163, 431
module name prefixes, Language Environment 27, 335MSG suboption
of TERMTHDACT 36, 339MSGFILE runtime option
function 8runtime messages and 28, 336
MSGQ runtime option 8
Nnavigation
keyboard 483nested condition 25, 334no response (wait/loop) 28, 336NOBLOCKS option of CEE3DMP callable service 35NOCONDITION option of CEE3DMP callable service 36NOENTRY option of CEE3DMP callable service 36NOFILES option of CEE3DMP callable service 35NOSTORAGE option of CEE3DMP callable service 35NOTRACEBACK option of CEE3DMP callable service 35NOVARIABLES option of CEE3DMP callable service 35
OOFFSET compiler option 4, 5, 7optimizing
C 3, 62COBOL 5Fortran 250PL/I 6
optionsC compiler 3COBOL compiler 5defaults for dump 37, 340determining runtime in effect 9, 11, 324Fortran compiler 5Language Environment runtime 8, 323PL/I compiler 6, 7
out-of-storage conditionvirtual storage 335
OUTDD compiler option 5output
incorrect 28, 336missing 28, 336
Ppage number
in dump 55, 352PAGESIZE(n) option of CEE3DMP callable service 35parameter
checking value of 23PCB (process-level control block) 413perror() function 169perror()function 437PL/I
address of interrupt, finding in dump 272, 299CAA address, finding in dump 276, 302common anchor area (CAA) 276, 302compiler listings
object code listing 266static storage map 265variable storage map 266
compiler optionsgenerating listings with 262, 290list of 6
CSECT 265debugging examples 277, 283, 303, 307dump
error type, finding in 272, 299parameter list, finding contents in 275, 301
Index 495
PL/I (continued)dump (continued)
PL/I information, finding in 270, 275, 298, 301PLIDUMP subroutine and 268, 296statement number, finding in 272, 299timestamp, finding in 275variables, finding in 274, 300
ERROR ON-unit 260, 272, 288, 299errors 259, 261, 287, 289floating-point register 260, 288object code listing 266ON statement control block 266static storage listing 265SUBSCRIPTRANGE condition 260, 261, 277, 281, 288,289, 303, 305
PLIDUMP subroutine 269, 296PMR (problem management record) 479pointer
variable 163, 431PPA 476preventive service planning (PSP) bucket 475printf() function 24, 164, 432problem management record (PMR) 479procedure division listings 226process
control block 61, 356member list 55–62, 356
process control block (PCB) 55–62, 356PROFILE runtime option
function 9, 324program
class storage 230program prolog area 476program status word (PSW) 59, 355PSP (preventive service planning) bucket 475
QQUIET suboption of TERMTHDACT runtime option 36, 339
Rreason code
nonzero returned to CICS 318under CICS 315
registers 0–15in dump 56
release numberin dump 55, 352
request parameter list (RPL) 187return code
bad or nonzero 28nonzero 336
routinescommon errors in 27
RPTOPTS runtime option 9RPTSTG runtime option 11, 326run unit
COBOL 232level control block 232storage in dump 61, 232
runtimemessages
runtime (continued)messages (continued)
under CICS 313runtime options
determining those in effect 9, 11, 324sample options report 9specifying 23
Sscope
terminator 223SDUMP routine
description 249format specifications 250output 249usage considerations 250
sending to IBMreader comments xxxi
service routinesCDUMP/CPDUMP 249DUMP/PDUMP 247SDUMP 249
SET statement 224shortcut keys 483signal information in dump 186sorted cross-reference listing 226SOURCE compiler option 4, 5, 7stack
frame 62frame format 62, 63
STACK64 runtime option 326STACKFRAME option of CEE3DMP callable service 35statement numbers
in dump 55, 352static
variables in dump 274, 300writable map 173, 176, 177
statusof routines in dump 353
stderr 24, 336, 339, 340stdio.h 164, 432stdout 24storage
evaluating use of 11, 326for active routines 60, 355leak detecting 61, 111, 356, 386report 11, 326statistics 16, 18
STORAGE compiler option 7storage dump
written to a z/OS UNIX file 213, 462STORAGE option of CEE3DMP callable service 35STORAGE runtime option 9, 324structure
map 176variable example code 176
summary of changesLanguage Environment
V2R3 xxxiii, xxxivz/OS Language Environment Debugging Guide xxxiii
symbolicfeedback code 25, 333
symbolic dumps
496 z/OS: z/OS Language Environment Debugging Guide
symbolic dumps (continued)how to call under Fortran 249
symbolic feedback codeusing the 26
syntax diagramshow to read xxviii
system abendwith TRAP(OFF) 28, 336with TRAP(ON) 28, 336
system dumpgenerating
in z/OS UNIX shell 83
Ttask global table (TGT) 229TERMINAL compiler option 4, 7TERMTHDACT runtime option
function 8, 36, 281, 306, 323, 339generating a dump and 21, 332modifying condition handling behavior and 9, 324suboptions 36, 339
TEST compiler option 4–6TEST runtime option 9, 324text file name prefixes, Language Environment 27, 335THDCOM in dump 233THREAD option of CEE3DMP callable service 35THREADSTACK64 runtime option 326time
in dump 55, 352TRACE runtime option
function 9, 324trace table 151, 422
TRACE suboption of TERMTHDACT runtime option 36, 339TRACEBACK option of CEE3DMP callable service 35, 62transaction
dump 314rollback 317rollback effects of assembler user exit on 317work area 314
TRAP runtime optionfunction 9, 324Language Environment condition handling and 21, 81,356Language Environment exception handling and 332
UUADUMP suboption of TERMTHDACT runtime option 21, 37,332, 340UAIMM suboption of TERMTHDACT runtime option 21, 37,332, 340UAONLY suboption of TERMTHDACT runtime option 21, 37,332, 339UATRACE suboption of TERMTHDACT runtime option 21, 37,332, 339unhandled conditions
establishing enclave termination behavior for 23USE EXCEPTION/ERROR declaratives 224USE FOR DEBUGGING declarative 224, 225user
abendcode 28, 336
user (continued)exit 23heap
statistics 18stack
statistics 16user interface
ISPF 483TSO/E 483
user-specified abends 30, 337USRHDLR runtime option 8, 22, 323utility and service subroutines
CDUMP/CPDUMP 249DUMP/PDUMP 247SDUMP 249
Vvariables
in Language Environment dump 62structure example code 176
VARIABLES option of CEE3DMP callable service 35, 62VBREF compiler option 5verb cross-reference 226VERBEXIT
LEDATA 84, 358version number
in dump 55, 352
Wworking storage
in dump 60, 230, 355Writable Static Area 172
XXPLINK
downward-growing stack 63finding XPLINK information in a dump 195stack frame format 62, 63storage statistics 17trace table entries for 195
XREF compiler option 5, 7XUFLOW runtime option
function 9modifying condition handling behavior and 22
Zz/OS Language Environment Debugging Guide
content, changed xxxiiicontent, deleted xxxiiicontent, new xxxiiisummary of changes xxxiii
z/OS UNIX System ServicesC application program and 213, 462generating a system dump 83
Index 497

498 z/OS: z/OS Language Environment Debugging Guide

IBM®
Product Number: 5650-ZOS
GA32-0908-40
Related Documents