INTERNATIONAL ECONOMIC REVIEW Vol. 40, No. 2, May 1999 DEBT CONCENTRATION AND BARGAINING POWER: LARGE BANKS, SMALL BANKS, AND SECONDARY MARKET PRICES* ¨ ² BY RAQUEL FERNANDEZ AND S ¸ULE OZLER ´ New York Uni ¤ ersity, NBER, and CEPR, U.S.A. Koc ¸ Uni ¤ ersity and UCLA, U.S.A. Commerical bank debts of developing countries are held by large interna- tional banks and smaller domestic banks. This paper investigates how debt concentration }the proportion of a country’s debt held by large banks relative to small banks }affects the secondary market price for these loans. We find that countries with higher concentrations have higher secondary-market prices. We explain this empirical finding in a bargaining model that endogenizes the maximum penalty that banks can credibly impose on a recalcitrant debtor. We show that the banks’ bargaining power increases with the degree of debt concentration, thus increasing repayment and secondary-market prices. 1. INTRODUCTION Secondary-market prices for government and government-guaranteed debt are often referred to as indicators of the value of the outstanding debt of developing countries. These prices are used to assess the merits of various plans to deal with the debt crisis, the effect of debt forgiveness, or the impact of debt buybacks. 1 It is therefore important to understand what factors influence the value of a country’s debt and hence secondary-market prices. Theoretical models stress such elements as the rate of impatience of various parties, the seizure technology of creditors, the possible existence of other repeated relationships, and the importance of future credit markets to the debtors. 2 Empirical studies, on the other hand, tend to focus on factors associated with a country’s economic performance, such as GNP per capita and the extent of indebtedness. 3 * Manuscript received July 1994; revised November 1997. This is a substantially revised version of an earlier paper entitled, ‘‘Debt Concentration and Secondary Market Prices: A Theoretical and Empirical Analysis.’’ ² We thank Trudy Cameron, Michael Dooley, Insan Tunali, Paul Milgrom, and especially an anonymous referee for helpful comments. Raquel Fernandez acknowledges many helpful discussions ´ during the period when the author was a Visiting Scholar at the World Bank and financial support ¨ from the C.V. Starr Center. S ¸ule Ozler acknowledges an NBER Ford Foundation Fellowship. Both authors gratefully acknowledge NSF support. 1 For an extensive discussion of various debt plans and secondary markets, see Classens et al. Ž . 1990 . 2 ¨ Ž . Ž . Ž . See, for example, Bulow and Rogoff 1989b , Eaton and Gersovitz 1981 , Ozler 1989 , Ž . Ž . Fernandez and Rosenthal 1990 , and Cole and Kehoe 1997 . ´ 3 Ž . Ž . Ž . Ž . See, for example, Berg and Sachs 1989 , Cohen 1988 , Hajivassiliou 1988 , Huizinga 1989 , Ž . Ž . Sachs and Huizinga 1987 , and Purcell and Orlanski 1988 . 333

Welcome message from author
This document is posted to help you gain knowledge. Please leave a comment to let me know what you think about it! Share it to your friends and learn new things together.
Transcript
INTERNATIONAL ECONOMIC REVIEWVol. 40, No. 2, May 1999
DEBT CONCENTRATION AND BARGAINING POWER: LARGEBANKS, SMALL BANKS, AND SECONDARY MARKET PRICES*
¨ †BY RAQUEL FERNANDEZ AND SULE OZLER´
New York Uni ersity, NBER, and CEPR, U.S.A.Koc Uni ersity and UCLA, U.S.A.
Commerical bank debts of developing countries are held by large interna-tional banks and smaller domestic banks. This paper investigates how debtconcentration}the proportion of a country’s debt held by large banks relativeto small banks}affects the secondary market price for these loans. We findthat countries with higher concentrations have higher secondary-market prices.We explain this empirical finding in a bargaining model that endogenizes themaximum penalty that banks can credibly impose on a recalcitrant debtor. Weshow that the banks’ bargaining power increases with the degree of debtconcentration, thus increasing repayment and secondary-market prices.
1. INTRODUCTION
Secondary-market prices for government and government-guaranteed debt areoften referred to as indicators of the value of the outstanding debt of developingcountries. These prices are used to assess the merits of various plans to deal with thedebt crisis, the effect of debt forgiveness, or the impact of debt buybacks.1 It istherefore important to understand what factors influence the value of a country’sdebt and hence secondary-market prices. Theoretical models stress such elements asthe rate of impatience of various parties, the seizure technology of creditors, thepossible existence of other repeated relationships, and the importance of futurecredit markets to the debtors.2 Empirical studies, on the other hand, tend to focuson factors associated with a country’s economic performance, such as GNP percapita and the extent of indebtedness.3
* Manuscript received July 1994; revised November 1997.This is a substantially revised version of an earlier paper entitled, ‘‘Debt Concentration and
Secondary Market Prices: A Theoretical and Empirical Analysis.’’† We thank Trudy Cameron, Michael Dooley, Insan Tunali, Paul Milgrom, and especially an
anonymous referee for helpful comments. Raquel Fernandez acknowledges many helpful discussions´during the period when the author was a Visiting Scholar at the World Bank and financial support
¨from the C.V. Starr Center. Sule Ozler acknowledges an NBER Ford Foundation Fellowship. Bothauthors gratefully acknowledge NSF support.
1 For an extensive discussion of various debt plans and secondary markets, see Classens et al.Ž .1990 .
2 ¨Ž . Ž . Ž .See, for example, Bulow and Rogoff 1989b , Eaton and Gersovitz 1981 , Ozler 1989 ,Ž . Ž .Fernandez and Rosenthal 1990 , and Cole and Kehoe 1997 .´
3 Ž . Ž . Ž . Ž .See, for example, Berg and Sachs 1989 , Cohen 1988 , Hajivassiliou 1988 , Huizinga 1989 ,Ž . Ž .Sachs and Huizinga 1987 , and Purcell and Orlanski 1988 .
333

´ ¨FERNANDEZ AND OZLER334
For the most part, neither theoretical nor empirical work has examined howvariations across countries in the characteristics of its creditor banks can helpexplain the magnitude of secondary-market prices.4 Creditor banks, however, are farfrom being a uniform group. They are subject to different capital requirements, taxsystems, and accounting practices by nationality; they have different degrees ofexposure to international debt; and they have different relationships with the debtorcountries.5 This paper focuses on this last characteristic by examining how differ-ences in the degree to which a country’s debt is split between large money centerbanks and the numerous smaller domestic banks affects secondary-market prices.Although both types of banks have been involved in the making and rescheduling ofsovereign loans, there are many important differences between these classes ofbanks. Whereas large banks often have branches in developing countries and aconsiderable portion of their profit is derived from other business with thesecountries and their customers, the smaller banks, by way of contrast, only enteredthe international arena in the credit boom of the seventies and do not otherwisehave extensive links with the debtor countries.
In this paper we argue that the differences between large versus small banksmatter. To investigate this claim, we examine how the degree to which debt is
Žconcentrated in the hands of the large international banks relative to small.domestic banks affects secondary-market prices. Our empirical investigation indi-
cates that as the degree of concentration increases, the discount in the secondaryŽ .market decreases or, equivalently, secondary-market prices increase . We provide
an explanation for this by constructing a bargaining model that is able to capture theintuition that the banks’ bargaining power increases with the degree of concentra-tion of a country’s debt.
In our empirical analysis we measure the degree of concentration of a particularcountry’s debt by scaling large banks’ exposure to this country by the exposure of allsmaller banks to the same country.6 We employ quarterly data over the 1986]1988period for 41 countries, of which 21 countries’ debts traded in the market. Weattempt to control for countries’ repayment prospects by using economic indicatorsof borrowers, as well as other relevant characteristics of the creditors, such as theircapital and exposure. Since not all countries’ debt was traded, a sample-selectionmodel is estimated in a one-step maximum-likelihood procedure.
Our main empirical finding is that higher debt concentration leads to lowersecondary-market discounts. The magnitude of this impact is significant. Our estima-tions suggest that an increase of concentration from its sample mean of 5 by 2.2Ž .1 standard deviation decreases discounts by nearly 8 cents on the dollar fromtheir sample mean of about 47 cents.
4 Ž . Ž .Significant exceptions are Demirguc-Kunt and Diwan 1990 , Fernandez and Kaaret 1992 ,´¨ Ž . Ž .Ozler and Huizinga 1992 , and Dooley and Stone 1993 . For a recent review of the sovereign debt
Ž .literature, see Eaton and Fernandez 1995 .´5 Ž .See Lipson 1985 for an excellent account of how differences among banks matter to the
rescheduling process.6 The distinction between exposure and concentration is that a large bank that is equally exposed
Ž .to two countries i.e., owns equal amounts of both countries’ debt can have very differentconcentrations of those debts, since the latter depends on the magnitude of each country’s totaloutstanding debt.

DEBT CONCENTRATION AND BARGAINING POWER 335
To explain our empirical findings, we construct a theoretical model of thesovereign-debt-renegotiation process that possesses three fundamental characteris-
Ž .tics: 1 a country’s motivation to repay its debt is its fear of being penalized by itsŽ . Ž .creditors, 2 penalizing a country is costly for the banks, and 3 although the
amount repaid by a country is shared pro rata by all banks, large banks face agreater than pro rata cost in penalizing a country. The last can be regarded as aconsequence of the damage that the penalties inflict on these banks’ extensivebusiness interests with these countries. We show that in equilibrium a country repaysan amount that is an increasing function of the proportion of its debt that is ownedby the large banks. Thus secondary-market prices are an increasing function of debt
Ž .concentration or, equivalently, discounts decrease with increased concentration .This paper is organized as follows: In Section 2 we present an empirical investiga-
tion of secondary-market discounts. Section 3 develops a bargaining model betweenthe creditor banks and the debtor country, and Section 4 examines alternativeexplanations and concludes.
2. EMPIRICAL ISSUES
2.1. Estimation Method. Not all indebted countries have had their debt tradedin the secondary market, so discounts are observed only for those countries whosedebts have been traded in this market. This suggests that a sample-selection model isthe correct specification of discounts.7 We leave the discussion of the variablesemployed and the sample characteristics to the next section, and here we describethe selection model employed with the following equations:
2.1 T*sX b quŽ . 1 1 1
2.2 D*sX b quŽ . 2 2 2
DsD* if T*)0
Ds0 if T*F0
where
T*sa latent variable that describes occurrence of trading at a discount in thesecondary market
D*sa latent variable that is observed when T*)0Ž .Dssecondary-market discount, defined as 1yprice , where price is the sec-
ondary-market price of $1 of debtX svariables relevant for occurrence of trading in the secondary market1
X svariables relevant for pricing of debt in the secondary market2
u and u are i.i.d. drawings from a bivariate normal distribution with zero mean,1 2
standard deviations s and s and covariance s 2 , and r 2ss 2 rs s . Note that if1 2 12 12 1 2
there is at least one common element in b and b , s can be identified. If there is1 2 1
7 If, instead, OLS is employed, the resulting estimates could be biased and inconsistent.

´ ¨FERNANDEZ AND OZLER336
no constraint on the parameters, however, the model is identified by setting s s1.81
In our implementation we set s s1 and use one-step maximum-likelihood estima-1
tion, which yields consistent and efficient estimates.
Ž . Ž .2.2. Empirical Specification and Data. We use Eqs. 2.1 and 2.2 to investigatethe relation between secondary-market discounts and debt concentration. In thissection we discuss the variables employed as well as the characteristics of oursample.
The data are for the period 1986]1988 and contain quarterly information on 41developing countries, based on data availability. The debt of 21 countries traded at adiscount. A cursory inspection of trends suggests that almost all countries whosedebt was traded reached rescheduling agreements with commercial banks, unlike theremaining countries.9
We employ several characteristics of borrower countries in both the discountequation and in the trading equation. Since these equations are reduced-formspecifications, exogenous factors influencing lender and borrower behavior shouldbe included. The variables used for this purpose are borrower-country economiccharacteristics. These indicators are introduced in an attempt to measure variablessuggested by theoretical work, such as the extent of costs that a defaulting countrycan suffer. The set of base-country indicators we employ here is traditional in theempirical literature in this area and has been used, for example, in studies thatattempt to predict the occurrence of repayment difficulties or that investigate creditterms.10 They are the debt-to-exports ratio, reserves-to-imports ratio, real GNP percapita, and the rate of inflation.
We also include some lender characteristics. Banks’ capital and the exposure ofŽ .large banks to a particular country i.e., the amount loaned to a country have been
demonstrated to be important determinants of secondary-market prices: An increasein the exposure of large U.S. banks to a particular country leads to an increase in thesecondary-market price of the country’s debt, while strengthening of bank capitalleads to a decrease in these prices.11
This study introduces the degree of debt concentration as an additional determi-nant of secondary-market discounts. In our empirical analysis we are restricted todata for U.S. banks only, since bank exposure data for individual countries areavailable only for these in a systematic way. Since U.S. banks historically have beenthe major players in the market, however, one may argue that not having othercountries’ banks in the data may not be a major defect.
8 This is Amemiya’s type 2 tobit model. A description of the model and its identificationŽ .conditions are in Amemiya 1985, pp. 385]386 .
9 Only 2% of countries whose debts traded during 1986]1988 have not reached some reschedul-ing agreement since the inception of such formal agreements in the late 1970s.
10 ¨Ž . ŽFor a review, see Eaton and Taylor 1986 ; recent studies on credit terms include Ozler 1991,.1993 . Studies on secondary-market discounts are noted in footnote 4. For work that employs
¨measures of political instability among the determinants of the level of debt accumulation, see OzlerŽ .and Tabellini 1997 .
11 ¨ Ž .See Ozler and Huizinga 1992 . The authors suggest that their findings are explained by thepresence of a deposit insurance system.

DEBT CONCENTRATION AND BARGAINING POWER 337
To compute debt concentration, we use exposure data compiled by the FederalReserve Board. These data categorize banks as the largest 9, the next largest 15, andremaining U.S. banks.12 Largeness is measured by the asset size of the banks.Accordingly, one possible measure of concentration these data permit is the expo-sure to a country of the largest 9 U.S. banks scaled by the exposure of the U.S. banksthat are not in the largest 24. We give this variable the name Con1. An alternativemeasure of concentration, called Con2, is calculated by scaling the exposure of thelargest 9 U.S. banks to the total outstanding private debt of a country. Including thisvariable allows us to attempt to control for the presence of smaller non-U.S. banksin negotiations.
Tables 1 and 2 summarize several features of our sample. Table 1 presents themeans and standard deviations of the repayment indicators employed separately forthe two groups of countries in our sample. A cursory look at the data suggests thatthe debt of countries with bad repayment prospects is more likely to be traded at adiscount in the secondary market.
TABLE 1SAMPLE CHARACTERISTICS: COUNTRY INDICATORS
For countries whose assets are . . . *Traded Not Traded
standard standardmean deviation mean deviation
Debtrexports 4.02 2.47 2.62 2.22Reservesrimports 1.20 1.00 1.03 0.74Real GNP 1.30 0.76 2.03 2.05Inflation 0.10 0.13 0.02 0.03DebtrGNP 0.71 0.34 0.40 0.16ReservesrGNP 0.22 0.18 0.39 0.64ImportsrGNP 0.22 0.11 0.37 0.37
* The countries whose debt is traded in the secondary market are Argentina, Bolivia, Brazil,Chile, Colombia, Costa Rica, Dominican Republic, Ecuador, Honduras, Ivory Coast, Jamaica,Mexico, Morocco, Panama, Peru, Philippines, Turkey, Uruguay, Venezuela, Yugoslavia, and Zaire.The remaining countries in our sample are Cameroon, Egypt, El Salvador, Ethiopia, Greece,Hungary, India, Indonesia, Israel, Jordan, Kenya, Korea, Pakistan, Paraguay, Portugal, Singapore,Sri Lanka, Thailand, Trinidad and Tobago, and Tunisia.
ŽVARIABLE DEFINITIONS AND SOURCES: Variables that are not noted as quarterly are measured.annually.
Ž .Debtrexports: Ratio of total public outstanding debt to exports exports are quarterlyŽ .Reservesrimports: Ratio of total reserves to imports both quarterly
Real GNP: GNP per capita in thousands of 1986 U.S. dollarsŽ .Inflation: Rate of inflation quarterly
DebtrGNP: Total public debt to GNP ratioŽ .ImportsrGNP: Imports to GNP ratio imports are quarterlyŽ .ReservesrGNP: Reserves to GNP ratio reserves are quarterlyŽ . Ž .SOURCES: International Financial Statistics IMF , World Debt Tables The World Bank .
12 So, although our model will suggest taking the banks with the largest exposure to each countryindividually, data availability forces us to maintain the same set of banks. Our belief is that thisshould not be too problematic, since the large international money center banks tend to be majorplayers in all loans to developing countries.

´ ¨FERNANDEZ AND OZLER338
TABLE 2SAMPLE CHARACTERISTICS: DISCOUNTS, CONCENTRATION, AND EXPOSURE
Ž . Ž . Ž . Ž . Ž . Ž . Ž .Country 1 2 3 4 5 6 7
Argentina 53.33 18.76 7.38 1.00 0.87 2.82 6.48Bolivia 91.32 2.01 3.04 1.01 0.05 18.32 0.04Brazil 41.03 13.66 5.45 1.44 0.60 2.43 15.86Chile 36.92 4.77 3.98 0.88 0.81 2.44 3.92Columbia 23.90 10.15 5.10 0.75 0.38 2.00 1.52Costa Rica 70.80 14.96 2.91 0.51 0.36 9.49 0.20Dominican Republic 65.42 11.91 5.50 0.57 0.60 7.05 0.28Ecuador 54.33 19.40 2.87 0.60 0.34 4.31 1.17Honduras 67.29 8.42 1.74 0.75 0.11 8.46 0.05Ivory Coast 43.95 21.64 5.84 1.30 0.09 5.57 0.28Jamaica 59.72 4.99 6.95 1.20 0.48 9.43 0.12Mexico 46.73 5.11 2.68 0.42 0.63 2.38 13.29Morocco 38.77 9.45 7.99 1.62 0.43 3.16 0.59Panama 49.14 21.37 3.55 0.90 0.49 5.97 0.54Peru 87.75 6.47 2.92 0.35 0.18 18.64 0.57Philippines 40.38 8.30 8.97 1.45 0.44 3.04 3.37Turkey 2.53 0.65 5.52 1.05 0.15 1.47 1.15Uruguay 36.12 4.73 8.53 0.72 0.90 2.91 0.68Venezuela 35.96 12.33 5.96 0.24 0.52 2.15 6.14Yugoslavia 34.97 15.91 4.14 0.45 0.17 2.46 1.24Zaire 77.91 2.81 6.78 0.97 0.02 13.89 0.007
NOTES:Ž . Ž .Col 1 : Average discount in the secondary market 100ybid price over the 1986]1988 period.Ž .Col 2 : Standard deviation of the discounts.Ž . Ž .Col 3 : Concentration Con1 : Exposure of top 9 U.S. banks scaled by the exposure of U.S. banks
that are not in the top 24. The variable is computed as an average over the 1986]1988period.
Ž .Col 4 : Standard deviation of Con1.Ž .Col 5 : Con2: Exposure of top 9 U.S. banks scaled by total outstanding private debt of the country.
The variable is computed as an average over the 1986]1988 period.Ž .Col 6 : Percentage difference between the bid and ask prices in the secondary market.Ž .Col 7 : The exposure of the top 9 U.S. banks in U.S.$ billion.
Ž .SOURCES: Indicati e Prices for Less De¨eloped Country Bank Loans Salomon Brothers , CountryŽ . Ž .Exposure Lending Sur ey Federal Reserve Board , World Debt Tables The World Bank .
Table 2 presents some summary information for the 21 countries whose debt wastraded at a discount in the market over the 1986]1988 period. This table presentsdiscounts, measures of concentration, spreads between bid and ask prices in the
Ž .secondary market, and bank exposure. The discounts displayed in column 1 arecalculated using bid prices. The mean discount for all countries over the period
Ž .1986]1988 is 47.35 with a standard deviation of 22.73 .Ž . 13The concentration variable Con1 is presented in column 3 . The sample mean
is 5.14 with a standard deviation of 2.20. Note that there is a significant amount ofvariation in this variable over time on an individual country basis. This can beverified by taking the ratio of the standard deviation to the average value of con-
13 Concentration was computed as 174 and 30 for Zambia and Malawi, respectively, which areextraordinarily high relative to the sample mean. Furthermore, the measure showed a very highdegree of volatility between quarters. The Con2 measure of concentration for these countriesshowed qualitatively similar features. These characteristics persuaded us not to include thesecountries in the analysis reported below.

DEBT CONCENTRATION AND BARGAINING POWER 339
Ž .centration on an individual country basis column 4 divided by column 3 in Table 2 .ŽThe lowest values for this ratio are 4 and 8% for Venezuela and Uruguay,
. Žrespectively , and the highest two values are 43 and 33% for Honduras and Bolivia,
. Ž . Ž .respectively . Furthermore, columns 3 and 6 indicate that borrowers with highdiscounts have low levels of concentration. The partial correlation coefficientbetween discounts and concentration is significantly different from zero, and its
Ž .magnitude of y.24 supports the view that discounts prices and debt concentrationŽ .are negatively positively correlated.
ŽFurther inspection of Table 2 indicates that secondary-market spreads calculatedas the percentage difference between the offer and bid prices quoted in the
. Ž .secondary market are large for some countries, as can be seen in column 6 . Thisobservation suggests that an investigation of secondary-market prices based solely onthe bid prices may be misleading.14 We address this by calculating discounts usingthe average of bid and ask prices. Alternatively, in a specification where discountsare calculated using only bid prices, the spreads are introduced as an explanatoryvariable.
Ž .Large banks’ exposure by country is presented in column 7 of Table 2. Cursoryevidence suggests that concentration is not a mere proxy for exposure: The partial
Ž .correlation between concentration and exposure is small .004 and not statisticallysignificant.
2.3. Estimation Results. In this section we present results from the one-stepmaximum-likelihood estimates of the discount and trading equations described inthe preceding section. The results here are for a base specification; some sensitivityissues are discussed later. The primary result of our empirical investigation is thatthe discount in the secondary market decreases with increased debt concentration.
Table 3 presents estimation results for both the discount and trading equations.Unless otherwise indicated, we employ natural logarithms of discounts, wherediscount is computed as 1 minus the average of bid and ask prices as a way tocontrol for variations in market liquidity.
The first two columns of Table 3 present specifications that do not incorporatethe concentration variable but use country characteristics and year indicators in boththe discount and trading equations. The difference between these two columns iswhether a rescheduling agreement indicator is employed solely in the trading
15 Ž .equation or in both the trading and discount equations. The results in column 2indicate that this variable appears to affect the occurrence of trading in the
Ž .secondary market but not the extent of the discount. The findings in columns 1 andŽ .2 also indicate that country characteristics, with the exception of the debt-to-ex-
14 A couple of countries whose debt was traded in the secondary market are excluded from thesample because of very high spreads. For example, Sudan had a spread of 61% and Liberia a spreadof 37%.
15 The rescheduling agreement dummy variable takes the value of 1 if there was a reschedulingagreement in the preceding quarter. The mean value of this variable for the group of countrieswhose debts are not traded in the secondary market is .005 with a standard deviation of .07. For the21-country group with traded debts, however, the mean value is .10 with a standard deviation of .3.

´ ¨FERNANDEZ AND OZLER340
TABLE 3SECONDARY-MARKET DEBT*
Nobs: Traded in secondary mkts225; not tradeds208Ž . Ž . Ž . Ž . Ž . Ž .Variable 1 2 3 4 5 6
†Estimates of the Discount EquationŽ .Dependent variable: log discount
‡Debtrexports 0.0012 0.0013 0.0011 0.0010 0.0008 0.0009Ž . Ž . Ž . Ž . Ž . Ž .0.0004 0.0004 0.0004 0.0004 0.0003 0.0004
Reservesrimport 0.0009 0.0010 0.0007 0.0008 0.0017 0.0015Ž . Ž . Ž . Ž . Ž . Ž .0.0009 0.0009 0.0009 0.0007 0.0009 0.0010
Real GNP y0.1855 y0.1868 y0.1845 y0.0797 y0.0405 y0.0677Ž . Ž . Ž . Ž . Ž . Ž .0.1349 0.1358 0.1201 0.1036 0.1454 0.1455
Inflation 0.0070 0.0084 0.0069 0.0061 0.0102 0.0098Ž . Ž . Ž . Ž . Ž . Ž .0.0103 0.0109 0.0094 0.0060 0.0112 0.0100
Rescheduling 0.2335Ž .agreement 0.3485
Years1987 0.1436 0.1377 0.1543 0.1381 y0.4245 y0.3897Ž . Ž . Ž . Ž . Ž . Ž .0.1007 0.1009 0.0997 0.0853 0.2072 0.3214
Years1988 0.5015 0.5113 0.5830 0.4773 y0.2499 y0.2256Ž . Ž . Ž . Ž . Ž . Ž .0.1660 0.1689 0.1593 0.1376 0.2958 0.3032
Logconcentration y0.4193 y0.3075 y0.3290 y0.3135
Ž . Ž . Ž . Ž .0.1752 0.1495 0.1475 0.1455Log
exposure y0.1489 y0.1127Ž . Ž .0.0572 0.0456
Logcapital 6.0917 4.8507
Ž . Ž .2.1343 1.9877Bid-ask spread 0.0464 0.0356
Ž . Ž .0.0109 0.0135Constant 3.0618 2.9715 5.6027 4.3504 y100.43 y95.19
Ž . Ž . Ž . Ž . Ž . Ž .0.3181 0.3347 0.6595 0.9746 37.77 35.75
Estimates of the Trading EquationDebtrexports 0.0012 0.0012 0.0012 0.0012 0.0012 0.0012
Ž . Ž . Ž . Ž . Ž . Ž .0.0003 0.0003 0.0003 0.0003 0.0003 0.0003Reservesrimport 0.0009 0.0008 0.0008 0.0008 0.0008 0.0008
Ž . Ž . Ž . Ž . Ž . Ž .0.0008 0.0008 0.0008 0.0008 0.0008 0.0008Real GNP y0.2441 y0.2436 y0.2437 y0.2418 y0.2431 y0.2419
Ž . Ž . Ž . Ž . Ž . Ž .0.1085 0.1082 0.1120 0.1105 0.1064 0.1075Inflation 0.1360 0.1384 0.1372 0.1395 0.1404 0.1400
Ž . Ž . Ž . Ž . Ž . Ž .0.0269 0.0272 0.0272 0.0275 0.0270 0.0271Rescheduling 1.8672 1.8630 1.8526 1.8279 1.8110 1.8099
Ž . Ž . Ž . Ž . Ž . Ž .agreement 0.6540 0.6538 0.6595 0.6677 0.6683 0.6681Years1987 y0.0990 y0.0985 y0.0990 y0.0983 y0.1006 y0.0999
Ž . Ž . Ž . Ž . Ž . Ž .0.1661 0.1661 0.1658 0.1658 0.1659 0.1658Years1988 y0.1269 y0.1362 y0.1319 y0.1428 y0.1435 y0.1468
Ž . Ž . Ž . Ž . Ž . Ž .0.1890 0.1893 0.1890 0.1918 0.1908 0.1907Constant y0.6939 y0.6951 y0.6953 y0.7009 y0.6990 y0.7025
Ž . Ž . Ž . Ž . Ž . Ž .0.1926 0.1924 0.1960 0.1960 0.1939 0.1933r 0.1300 0.1304 0.1580 0.1256 0.1532 0.1675
Ž . Ž . Ž . Ž . Ž . Ž .0.3579 0.3582 0.3378 0.3472 0.2634 0.2899Log-likelihood y441.79 y440.77 y433.77 y396.22 y418.22 y398.38
Ž . Ž .* One-step maximum-likelihood estimates of Eqs. 2.1 and 2.2 . Standard errors are in parenthe-ses.
† The discount rate is measured as 100 less the average of bid and ask prices in specificationsŽ . Ž . Ž . Ž .1]3 and 5 . In columns 4 and 6 , the discount rate is calculated as 100 less the bid price.
‡ The ratios and inflation are in percent. Real per capita GNP, exposure, and capital are inthousands of 1986 U.S. dollars. In these specifications, concentration, exposure, capital, and theexplained variable are in logs.

DEBT CONCENTRATION AND BARGAINING POWER 341
ports ratio, are not significant determinants of the discount.16 The occurrence oftrading, however, is significantly affected by country repayment indicators such asGNP per capita and rate of inflation.
Ž .Next, the variable of interest, the natural log of concentration Con1 , is intro-duced in the discount equation. We use the one-quarter lagged value of this variableout of concern with potential endogeneity, an issue that we return to in the section
Ž .on sensitivity. As presented in column 3 , we find that higher concentration has astatistically significant negative impact on discounts. The parameter estimate is neary0.42, and the standard error is 0.17. Incorporation of this variable does not alterthe parameter estimates of the remaining variables. It should be noted here thatthese findings continue to hold irrespective of whether the rescheduling variable isincluded in the discount equation or not.
As an alternative to using the average of bid and ask prices, we employ one-quarterlagged values of the spreads between the bid and ask prices as an additional
Ž .explanatory variable. In this specification, presented in column 4 , discounts arecalculated using the bid prices only. The concentration variable is found to have anegative and significant impact, as before. The magnitude of the impact is now y.30.
Next, we report results from incorporating the one-period lagged values of theŽ .natural logs of bank exposure and bank capital to the specifications in columns 3
Ž . Ž .and 4 . In column 5 we present results when discounts are calculated using theaverage of bid and ask prices. The concentration variable remains negative and
17 Ž .statistically significant. In column 6 we report results when the spread betweenbid and ask prices is explicitly introduced to the specification. The concentrationcoefficient is y0.31, and the standard error is 0.14.
The main finding that emerges from Table 3 is that discounts are negatively andstatistically significantly affected by debt concentration. The magnitude of theimpact of concentration is sizable. For example, consider a parameter estimate ofy.40 for concentration. This estimate indicates that evaluated at the mean of our
Ž .sample near 47 and 5 for discount and concentration, respectively , a 1-standard-de-Ž .viation increase in concentration near 2.2 decreases the discount by 8 cents on a
dollar. Among the country repayment indicators, only the debt-to-exports ratio is asignificant determinant of discounts.
The evidence for sample selection does not appear strong, since in all thespecifications presented the estimated correlation between the error terms of thetwo equations is not large and is statistically insignificant, as indicated by r. Hencewe also used OLS to estimate these specifications for the countries whose debt was
16 Ž .Consistent with our finding, Stone 1991 indicates that changes in secondary-market prices areinsensitive to changes in country-specific macroeconomic aggregates, such as exports, reserves, andimports. The finding that macro indicators do not affect secondary-market prices is in contrast to therole played by these indicators in studies of credit terms on new loans and in predicting reschedul-ings. To understand the sources of these differences, a further investigation of the nature of variousdebt markets and instruments should be undertaken.
17 Incorporating exposure and capital variables influences the parameter estimates of the re-serves-to-imports ratio and real GNP. This suggests the presence of omitted variables bias inspecifications that do not incorporate these variables. Also note that incorporating bank capitalmakes the year indicators insignificant and influences the intercept term. The sample mean of thecapital variable is 47 billion U.S. dollars.

´ ¨FERNANDEZ AND OZLER342
traded. The point estimates for all the explanatory variables obtained are similar tothe maximum-likelihood estimates, but the standard errors we obtain using OLS aregenerally smaller.
2.4. Sensiti ity Analysis. In this subsection we report several other results thatattest to the robustness of the estimates in Table 3. Since estimation results of thespecifications described below yield similar coefficients and standard errors to thosereported in Table 3, the discussion below focuses primarily on the concentrationvariable.
A. Simultaneity. In principle, some of the explanatory variables in our specifi-cation could be correlated with the error term. In particular, concentration could becorrelated with the error term, since the magnitude of discounts, or quality of theborrowers, could affect the desire of large banks to alter their holdings of debt.Dealing with this potential endogeneity in an econometrically satisfactory way wouldrequire the joint estimation of the discounts equation with the concentrationvariable, which is a complex system of structural equations. It is extremely difficultto do this with the roughly 400 observations we have.
One might argue, however, that using one-quarter lagged values of the concentra-tion variable to attempt to control for this problem, as we have done, is unsatisfac-
Ž .tory. To address this objection, we use specification 6 of Table 3 and incorporatethe beginning-of-sample value of concentration. The results for the discount equa-
Ž .tion are reported in the first column of Table 4. An inspection of column 1indicates that little changes with this modification. The concentration variable isestimated with a parameter value of y0.45 and a standard error of 0.16. It mightstill be argued, however, that by the start of the sample the large banks alreadycould have sold off loans that they thought were less good and kept the ones thatwere better. In order to address this concern, we use data on concentration from anearlier period. Specifically, we compute the concentration variable using data for the
Ž .last quarter of 1983. As reported in column 2 of Table 4, the concentration variableis estimated with a parameter value of y0.42 and a standard error of 0.16. This isnot surprising given that the correlation between concentrations in the last quarterof 1983 and the first quarter of 1986 is 0.82.
B. Specification. One could question our specification of the error term on thegrounds that country-specific effects have not been taken into account and hencethat concentration is merely picking up this effect. To address this concern, country-
Ž .specific dummy variables are introduced. As reported in column 3 of Table 4, wefind that concentration remains statistically significant.18
We also consider sensitivity to functional form selection and omitted-variablesŽ .bias. For this purpose, we use specification 6 of Table 3 and continue reporting
results based on maximum-likelihood estimates. To investigate the sensitivity tofunctional form selection, we specify both discounts and concentration in levels, not
18 Ž .The estimation results in column 3 are based on less stringent convergence criteria than theearlier results presented due to difficulty in reaching stable values. Specifically, the convergencecriteria for the gradient, function, and parameter values, which were 0.1E]3, 0.1E]5, and 0.1E]5,respectively, in earlier estimations are all set to 0.001.

DEBT CONCENTRATION AND BARGAINING POWER 343
TABLE 4ALTERNATIVE SPECIFICATIONS*
Nobs: Traded in secondary mkts225; not tradeds208†Ž . Ž . Ž .Variable 1 2 3
‡Estimates of the Discount EquationŽ .Dependent variable: log discount
§Debtrexports 0.0011 0.0010 0.0008Ž . Ž . Ž .0.0004 0.0004 0.0005
Reservesrimport 0.0015 0.0016 0.0022Ž . Ž . Ž .0.0011 0.0010 0.0019
Real GNP y0.0737 y0.0622 y0.0672Ž . Ž . Ž .0.1360 0.1492 0.1692
Inflation 0.0100 0.0101 0.0092Ž . Ž . Ž .0.0110 0.0112 0.0144
Years1987 y0.3968 y0.3989 y0.3903Ž . Ž . Ž .0.3742 0.3611 0.2807
Years1988 y0.2255 y0.2119 y0.2422Ž . Ž . Ž .0.3000 0.2972 0.2456
¶Log concentration y0.4547 y0.4232 y0.3186Ž . Ž . Ž .0.1640 0.1601 0.1587
Log exposure y0.1211 y0.1118 y0.1411Ž . Ž . Ž .0.0442 0.0396 0.0426
Log capital 4.6310 4.3886 4.9827Ž . Ž . Ž .1.9942 1.9665 1.9777
Bid-ask spread 0.0321 0.0345 0.0342Ž . Ž . Ž .0.0128 0.0131 0.0168
Constant y98.33 y100.29 y58.76Ž . Ž . Ž .35.66 38.01 18.15
r 0.1726 0.1632 0.1229Ž . Ž . Ž .0.2885 0.2982 0.3251
Log-likelihood y386.87 y389.32 y320.22
Ž .* Here we report estimates of only the discount equation from a one-step MLE of Eqs. 2.1 andŽ .2.2 . Standard errors are in parentheses.
† Ž .The specification in column 3 includes country dummy variables, which are not reported here.‡ In all specifications, the discount is computed as 100 minus the bid price.§ The ratios and inflation are in percent. Real per capita GNP, exposure, and capital are in
thousands of 1986 U.S. dollars. In these specifications, concentration, exposure, capital, and theexplained variable are in logs.
¶ Ž .Concentration is measured for the first quarter of 1986 in column 1 ; it is measured for theŽ . Ž .final quarter of 1983 in column 2 . In column 3 , one-quarter lagged values of the concentration
variable are used.
in natural logarithms. The concentration variable is estimated to be statisticallysignificant with a standard error of .007 and a parameter value of y.03.
We consider the possibility of omitted-variables bias by employing data on theshare of concessional loans from multilateral and bilateral creditors. The concentra-tion variable remains statistically significant and of a similar order of magnitude.The concessional loan share variable itself has a small negative coefficient that is notstatistically different from zero.
Lastly, since there is no clear reason to exclude the concentration variable fromthe trading equation, we incorporate it there as well. We find that it is not estimatedto be statistically significant in the trading equation and that the magnitude of itseffect on discounts is not altered.
´ ¨FERNANDEZ AND OZLER344
C. Measurement. In order to establish that the results are not a consequence ofa particular choice of economic indicators as measures of country risk, we employalternative specifications for country characteristics. In particular, we use debt,imports, and reserves, all scaled by GNP. We also use our alternative measure of theconcentration variable, Con2. This variable is found to have a statistically significant
Žimpact on the discounts as well, although with a smaller parameter estimate nearly.one-third of the estimates reported in Tables 3 and 4 .
3. A MODEL OF SOVEREIGN-DEBT RENEGOTIATION
In this section we develop a model of sovereign-debt renegotiation that is able toprovide an explanation for why the secondary-market price of a country’s debt
Žincreases with the proportion of this debt held by the large money center banks i.e.,.with greater concentration .
There are probably several explanations that can be given for this relationship.While we have not tested our particular story, our empirical findings lend it support,and we think that it is useful to show that this relationship can be derived in a modelof sovereign-debt renegotiation. In Section 4 we discuss the relative merits of severalalternative explanations.
The explanation that we present relies on an asymmetry between the benefitsobtained by large banks from ‘‘tough’’ bargaining and the costs they incur fromdoing so. We will argue that although large banks share in any repayment obtainedin a pro rata fashion,19 they would bear more than a proportional share of the costassociated with any punishment that would be meted out to the country if the latterfailed to pay. This means, first, that threats of severely punishing a defaulting
Ž .country may not be credible since punishment is costly and, second, that themaximum credible punishment will depend on the proportion of the payments thatgoes to the large banks relative to the proportion of the costs that the latter wouldhave to bear from carrying out such threats.
For simplicity, we divide banks into one of two groups}large banks and smallbanks. Large and small banks have different relationships with the debtor countries.The large banks not only make long-term loans to countries, they also provide
Ž .services to their domestic customers e.g., trade credits to enable trade. They oftenhave branches in these countries, and a considerable portion of their profit isderived from other business with these countries and their customers. The smallbanks, on the other hand, only entered the international arena temporarily in thecredit boom of the 1970s and do not otherwise have extensive links with the debtorcountries. Consequently, most actions taken to punish a debtor country, such asrestriction of trade credits, must be undertaken by the large creditors. However, thisalso implies that actions taken to punish the country are bound to be more costly forthe large international banks than for the small banks.20 Thus, when banks threaten
19 This is a requirement that is included in all debt contracts to avoid the possibility that a bankwould try to settle its own debt with the country independently, effectively making its debt senior tothat of other banks.
20 ŽDespite the fact that debt contracts require some costs to be shared pro rata e.g., court.expenses , there are many costs that are not written into these contracts.
DEBT CONCENTRATION AND BARGAINING POWER 345
to penalize a country for lack of repayment, the cost of carrying out this threat issomething that the large banks will have to consider.
Modeling the debt-renegotiation process to take account of the cost of punishingrecalcitrant debtors and endogenizing the penalty level is a departure from the rest
21 Ž .of the literature. In Bulow and Rogoff 1989a , for example, banks always have anincentive to penalize a defaulting country because by doing so banks obtain animmediate net benefit, namely, a certain percentage of the country’s traded output.22
In our model, by contrast, there is an equilibrium in which the banks never penalizethe country. This equilibrium exists because banks cannot commit to penalties,punishment is costly, and penalties do not guarantee eventual repayment. Theeconomics that underlies these two different modeling strategies concerns thenature of the punishments that banks can apply. If these penalties consist primarilyof the seizure of traded goods that can be immediately translated into a net benefit
Ž .for the banks independently of whether or not the country repays , then the Bulowand Rogoff model of debt renegotiation is best able to capture this. If, however,penalties cannot be committed to and do not, in and of themselves, provide a netbenefit to creditors, such as in the case of the negation of trade credits andror
Žsanctions applied by the creditor countries’ government or even exclusion from.future credit markets , then a model of costly penalties is more appropriate. We
choose to work with the latter conceptualization of penalties. We now turn to amore formal description of our model.
Ž3.1. The Model. We construct a sequential bargaining model which modifies,.as in Fernandez and Glazer 1991, the original Rubinstein 1982 bargaining model .
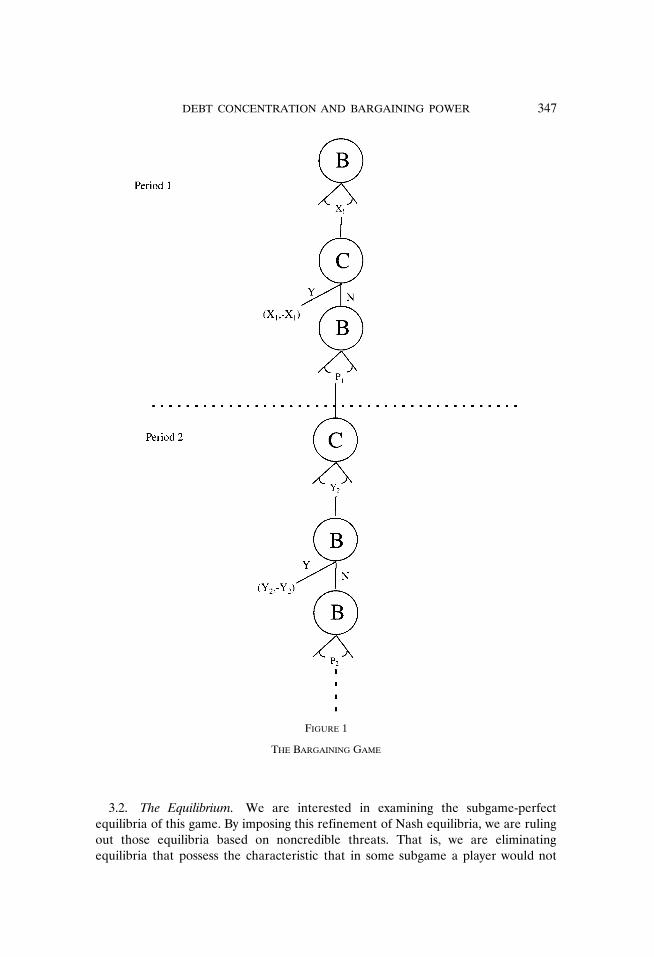
ŽTwo parties, one consisting of the large creditor banks which we will henceforth call.the large bank B and the other consisting of the debtor country C, are engaged in
negotiating over how much of its debt the country should repay.23 In order tosimplify an already complex problem, we consider repayment of the debt to beonce-and-for-all and not over a number of periods.24 D)0 is the amount of the
� 4country’s outstanding debt. Bargaining takes place over discrete time tg 1, 2, . . . .In every odd period the large bank offers a debt settlement x , 0Fx FD, specifyingt t
the amount the banks demand to be repaid. The country then responds by eitherŽ . Ž .accepting the offer Y or rejecting it N . If the country accepts the offer,
negotiations are over. The country then pays the banks x , and the remainder of thet
debt, Dyx , is forgiven. If the country rejects the offer, the large bank must decidet
21 Ž .See also Fernandez and Glazer 1990 .´22 Bulow and Rogoff suggest that their results also can be extended to costly punishments,
although implicit in their argument is that banks can commit to bearing small costs.23 We assume that all the large banks act as one agent, ignoring any problems that may exist
within this coalition. That small banks are not included in the negotiating process is not problematic,since in reality only large banks sit on the creditor committees formed to negotiate with a problemdebtor.
24 Ž .Bulow and Rogoff 1989a deal with this problem by imposing conditions on the discountfactors of the two parties and specifying a time horizon after which all production in the countryceases.

´ ¨FERNANDEZ AND OZLER346
on the level of punishment p it wishes to inflict on the country that period. AftertŽ .the country is punished the punishment can be zero , time advances one period.
In every even period it is the country’s turn to make a debt-settlement offer yt
specifying the amount that the country is willing to repay. The bank then respondsŽ . Ž .by either accepting Y or rejecting N the offer. Once again, an acceptance
indicates the end of negotiations, and the country pays the banks y and the lattert
forgive the remainder Dyy . A rejection leaves the bank with a punishment-levelt
decision for that period p . After the country is punished, time advances one period.t
This game can continue for a potentially infinite number of periods. See Figure 1 fora representation of the extensive form of this game.25
Ž .It is costly for the large bank to punish the country. The cost c p can be thoughtt
of as the cost to the operations of the large bank within that country and to the lossin the profits derived from servicing domestic clients who do business with that
Ž .country. c p is assumed to be an increasing, continuous, convex function of thetŽ . Ž .punishment level with c9 0 s0 and c9 ` s`.
The fundamental asymmetry between the large creditor banks and the many smallbanks lies in the bearing of the preceding costs. Although both large and small banksshare pro rata in any repayment by the country, the costs incurred in punishing thecountry are not shared pro rata. For simplicity, we assume that the large banks bearall the costs of punishing the defaulting country.26 Hence, if the large banks achievean agreement of Z from the country and a is the fraction of that country’s debt
Ž .owned by the large banks, then aZ is the payment received by B and 1ya Z goesto the small banks. Any cost incurred in obtaining this agreement is borne in itsentirety by B.
We now turn to a discussion of each party’s payoff. The large bank is assumed tomaximize the discounted value of its share of the country’s payment net of the cost itincurs in punishing the latter. The large bank’s payoff from a settlement Z reachedin period T is
Ty1ty1 Ty13.1 y d c p qd aZŽ . Ž .Ý b t b
ts1
where 0-d -1 is the banks’ common discount factor.b
The country attempts to minimize the discounted value of its punishments andpayment. Consequently, its payoff from a settlement Z in period T is
Ty1ty1 Ty13.2 y d p yd ZŽ . Ý c t c
ts1
where 0-d -1 is the country’s discount factor.c
25 We have not modeled the small banks’ decision as to whether they wish to participate in thedebt-forgiveness agreement. Note, however, that they will indeed wish to participate because theyare assumed not to possess the ability to punish the debtor singlehandedly. In reality, this bargaining
Ž .process is more complex see Lipson 1985 .26 What is essential is that the large banks’ share of the costs be greater than their share of the
country’s repayment.
DEBT CONCENTRATION AND BARGAINING POWER 347
FIGURE 1
THE BARGAINING GAME
3.2. The Equilibrium. We are interested in examining the subgame-perfectequilibria of this game. By imposing this refinement of Nash equilibria, we are rulingout those equilibria based on noncredible threats. That is, we are eliminatingequilibria that possess the characteristic that in some subgame a player would not

´ ¨FERNANDEZ AND OZLER348
actually find the sequence of actions dictated by its strategy to be a best response tothe other players’ strategy as of that same subgame.
The game described earlier has many subgame-perfect equilibria, including someinefficient ones.27 It is not of interest here to characterize these fully. Instead, weconcentrate exclusively on the subgame-perfect equilibrium most favorable to thelarge banks. A defense for doing so is that were one to model a larger game in whichthe initial loan is decided on, then this equilibrium also would be the Pareto superiorequilibrium. It is the equilibrium that, by threatening the country with the largestpunishment, thereby permits the greatest initial loan to be made in equilibrium. We
Žfirst turn to the description of an equilibrium that supports zero repayment and.hence zero lending in the bigger game , since it will prove useful to the understand-
ing of the Pareto superior equilibrium.One efficient equilibrium of our game is for the country not to repay any part of
its debt and for the banks never to punish the country for this behavior. To see whythis is an equilibrium, note that if B never threatens to punish, the country neverhas an incentive to repay. Any deviation by the bank, that is, any positive level ofpunishment, simply will be ignored by the country, since in the following period thecountry’s best response is to repay zero given its expectation of no future punish-ments in response to this behavior. It should be clear that such an equilibriumcannot support a positive loan in the larger game.
We now turn to a description of the Pareto superior subgame-perfect equilibrium.Let p be the level of p that satisfies
c p 1yd dŽ . Ž .b c3.3 saŽ . 2p db
Furthermore, let x and y be defined by˜ ˜
p d p˜ ˜b3.4 xs ys sd xŽ . ˜ ˜ ˜b1yd d 1yd db c b c
Analogously, x and y are the values of x and y obtained when psp. Note that Eq.˜ ˜ ˜Ž .3.4 gives the solutions to a Rubinstein bargaining problem in which the countryincurs a cost of p from rejecting an offer.˜
Consider the following pair of strategies: In the first period the large bank makes28an offer x. If this offer is rejected, the bank punishes the country by the amount p.
In every even period, if in all preceding odd periods the bank has punished thecountry’s rejection of its offer by the amount p, then the bank accepts any offer
27 Ž .For a particular illustration of this point, see Fernandez and Glazer 1991 .28 We are assuming that we are in a debt-crisis situation, that is, D)x, so that even in the most
favorable equilibrium for the banks the country does not repay its entire debt. It is not difficult toconstruct a larger game, modeling the initial loan decision such that there is uncertainty prior to the
w Ž . xmaking of the loan say, as to the c p function so that D)x is the result of an unfavorable shockto the bank’s cost function. Alternatively, one can parameterize the relative cost to the country of aunit of repayment versus a unit of punishment and interpret the debt crisis as a shock that makesrepayment relatively more costly for the country.

DEBT CONCENTRATION AND BARGAINING POWER 349
greater than or equal to y and rejects any offer strictly smaller than y. If, however,in some preceding odd period p differed from p, then the bank accepts any offert
yG0.In every odd period, subject to prior compliance with the odd-period punishment
behavior described earlier, the bank offers x. Once again, any prior deviation fromthe odd-period punishment behavior implies that in all subsequent odd periods thebank offers xs0, that is, complete forgiveness of the debt. Note that the bank neverpunishes the country on even periods and that p is a function of a and so therefore
Ž . Ž .are xsx a and ysy a .The country’s strategy in the first period is to accept any offer xFx. In every even
period, if in all preceding odd periods the bank has punished the country by anamount p, the country offers ysy. If in some preceding odd period punishment hasbeen of a different magnitude, the country offers ys0. In every odd period, subjectto the bank’s prior compliance with the odd-period punishment rule, the countryaccepts any offer of xFx and rejects any offer strictly greater than x. Once again,any deviation by the bank from this behavior implies that in all subsequent evenperiods the country rejects any offer strictly greater than zero and accepts xs0.
It is not difficult to check that this is a pair of subgame-perfect-equilibriumstrategies. The play of these strategies has the bank making an offer of x in the firstperiod that the country accepts.29
We next turn to an explanation of the preceding results. Ignoring for the momentany restriction on the level of punishment given by subgame perfection, note thatwhat the bank might wish to do is to threaten to severely punish the country by anamount, say, p, unless the latter repays its entire debt. If the country were to˜‘‘believe’’ this threat, it would repay the debt in its entirety as long as the discountedŽ . Ž .absolute value of being punished forever every odd period from now until infinity
Ž 2.y1were greater than the value of the debt, that is, p 1yd GD. Let us examine,˜ c
however, the subgame in which the country rejects this offer. The bank’s payoff fromŽ .carrying out its threat would at most be yc p qad D. If this payoff were negative,˜ b
however, the bank’s strategy would not be subgame perfect, since it could alwayschoose not to impose the punishment and obtain a payoff no smaller than zero. Thussubgame perfection requires that punishment in this strategy be no greater than thep that satisfies
3.5 yc p qad ys0Ž . Ž . ˜b
Ž . Ž .Using this restriction and Eq. 3.4 to solve for p results in Eq. 3.3 .
THEOREM. A country’s debt repayment and, therefore, the ¨alue of a share of acountry’s debt in the equilibrium outcome generated by the strategies described earlier isan increasing function of the fraction of its debt held by the large banks.
29 It can be shown that this strategy yields the highest payoff for the large bank. For a similarŽ .proof, see Fernandez and Glazer 1991 .´

´ ¨FERNANDEZ AND OZLER350
Ž .PROOF. Use of the implicit function rule on Eq. 3.3 yields
dp)0
da
Ž .By Eq. 3.4 , x is an increasing function of p. Thus, as a increases, the level ofpunishment that is credible increases and with it the country’s payment, the largebank’s payoff, and the value of a share of debt.
The theorem establishes that as the degree of concentration of a country’s debtincreases, so does the amount of debt that will be repaid. The intuition behind thisresult is straightforward: As the degree of concentration increases, the paymentreceived by the large bank for a given punishment level increases accordingly. This
Žmeans that the large bank can increase its punishment threat and thus total.repayment , since its ability to obtain a greater share of any payment allows it to
credibly withstand a greater cost of punishment.
3.3. Discussion of Equilibrium. A few things should be noted about the equilib-rium that we have just described. First, note that this equilibrium would not exist ina finite-horizon version of our model, since, come the last period, the large bankwould have no incentive to penalize the country because this would not yield anyrepayment and yet would be costly. Thus the whole equilibrium would unravel. Thisis not a troubling feature of our model. It simply points to the fact that models witha known finite horizon and models with a potentially infinite horizon yield qualita-tively different results, as we should expect.30 Should the equilibria differ, the rightway to model sovereign-debt negotiations is with a potentially infinite horizon, sincenothing about the economics of this problem implies a known finite horizon.
Second, the fact that the threat of punishment solely in odd periods yields agreater payoff than a strategy that would, say, threaten punishment in every periodmay, at first blush, appear puzzling. Surely, one might reason, the country has moreto fear when it is penalized every period rather than intermittently. The intuitionbehind why the odd-period punishment rule yields the large bank its greatest payofflies in the asymmetry that this behavior creates between the bank’s cost of rejectingthe country’s offer and the country’s cost of rejecting the bank’s offer. Were thebank to threaten punishment in every period, it would have to take into account thatrejecting the country’s offer is costly not only because it delays repayment for atleast one more period but also because it must punish the country that period. Withthe odd-period punishment strategy, on the other hand, only the country must takeinto consideration the penalty on rejecting the other party’s offer. More formally,were the bank to penalize every period, in equilibrium the offers x and y must have
Ž .the property that ysd xyc p , whereas under the odd-period punishment ruleb
ysd x.31b
Third, one may wonder given the implications of this model whether there is notan incentive for large banks to own the entire stock of debt by buying up the debt
30 Ž .See Rubinstein 1991 for further discussion of this point.31 Ž .See Fernandez and Glazer 1991 for an in-depth discussion of this point.´

DEBT CONCENTRATION AND BARGAINING POWER 351
owned by the smaller banks. While this incentive exists, one also can make plausiblearguments for why this may not be feasible in equilibrium. For example, free-riderproblems may not permit large banks to hold the entire stock of a country’s debt forreasons similar to why a raider’s takeover attempts fail in Grossman and HartŽ . 321980 . That is, each small bank would prefer to hold out and reap the rewards ofthe increased value of the debt rather than be bought up at some intermediate price.There also may be significant moral hazard problems involved with buying up largeportions of a country’s debt at any point in time, since the large banks may have asignificant amount of private information about the repayment prospects of acountry. Thus large banks might attempt to bring down prices with bad news about acountry’s repayment prospects prior to buying up additional debt. In addition,regulatory and optimal portfolio considerations may make this outcome suboptimalfor the large banks. Banks could be reluctant to buy debt at secondary-market pricesbecause it might imply that the debt of the country would have to be marked tomarket, which would force the bank to provision against possible losses.33
Last, one may ask why large banks do not choose a concentration of 1 with allcountries given that increased concentration improves their bargaining power. Wedo not have a definitive answer to this question, although one very likely possibilityis again regulatory and optimal portfolio considerations}this would be seen as avery risky strategy both by the bank and by regulators. The debt crisis can beinterpreted as a large correlated positive shock to the cost of paying debt relative tobeing punished across developing economies due to the increase in the price of oil,terms-of-trade deterioration, and high world real interest rates. Thus, while in
Žexpected value terms the concentration chosen initially was optimal also subject to.portfolio and regulatory considerations , ex post it no longer is. An alternative
Ž .explanation, as Lipson’s 1985 account makes clear, is that the sheer volume ofsyndicated loan activity during the heyday of lending meant that it was very hard tokeep track of a country’s liabilities and their ownership. Thus it might well be thatthe degree of concentration of a country’s debt was something that was difficult forany set of banks to control.34
4. ALTERNATIVES AND CONCLUSIONS
4.1. Alternati e Explanations. Several alternative explanations could be offeredto explain why we might see a positive relationship between debt concentration andsecondary-market prices. A first hypothesis is that debt repayments to privatecommercial lenders during the debt crisis were financed partly by grants and loans at
32 Free-rider problems also arise with respect to debt forgiveness and the granting of new loans,Ž . Ž .as analyzed in Krugman 1988 and Sachs 1984 . A model and a more comprehensive analysis of this
Ž .problem are in our prior working paper Fernandez and Ozler 1991 .´33 Ž .See Hay and Bouchet 1989 for a description of the tax, accounting, and regulatory treatment
of sovereign debt.34 Ž .Lipson 1985 also suggests that in the bargaining problem between small banks and large
Ž .banks, there was an unwritten rule against buying out small banks see also Cline 1984 . SeeŽ .Fernandez and Kaaret 1992 for an attempt to model the bargaining between the small and large´
banks on debt forgiveness and its effect on the outcome of sovereign-debt negotiations.

´ ¨FERNANDEZ AND OZLER352
Ž .subsidized rates from international financial institutions IFIs . If large banks arebetter at lobbying their national governments and IFIs, one might think that thesewould lead to the observed positive relationship. Note that the model underlying thishypothesis would be very similar to the one presented here. In particular, the drivingforce for the result would be the same, that is, the asymmetry between the divisionof benefits from reaching an agreement and the cost of lobbying the government.Nonetheless, as noted in our empirical section, including the share of concessionalloans from multilateral and bilateral creditors as an explanatory variable does notalter the original results in our empirical work. The concentration variable remainssignificant and of a similar order of magnitude. The concessional loan share variableitself has a small negative coefficient that is not statistically different from zero.Thus, while plausible, the evidence does not support this particular story.
A second alternative argues that when debt is more concentrated, the secondarymarket is more liquid because large banks are more active participants. This shouldlead to higher prices. This possibility is dealt with in our empirical section byincluding the bid-ask spread, a measure of illiquidity, as an explanatory variable. Theconcentration variable remained statistically significant.
A different alternative hypothesis is that large banks have private informationŽ .relative to small banks as to the degree of creditworthiness of the debtor. In thiscase, observing a large concentration of debt in the hands of large banks signalsgreater creditworthiness than that implied by the standard, publicly available indica-tors. We have attempted to control for this possibility by estimating our equationusing 1983 concentration values rather than the one-quarter lagged values of thisvariable. This procedure yielded results similar to those of our original estimation.Nonetheless, it is difficult to completely rebut this hypothesis without a full-fledgedmodel for how initial concentration is chosen and the accompanying informationstructure. The following theoretical consideration, however, leads us to believe thatprivate information is unlikely to explain our results. If large banks have privateinformation about a country’s riskiness, one would think that, ceteris paribus, largebanks would have greater exposure to countries that were more creditworthy. That is,for example, if large banks had private information that Brazilian debt was betterthan Uruguayan debt, this would lead them to desire to hold more Brazilian than
Ž .Uruguayan debt i.e., greater exposure to Brazil than to Uruguay . Only if Braziliandebt were of equal or smaller size than Uruguayan debt would this also imply arelationship between concentration and secondary-market prices. One might worry,however, that concentration is nonetheless proxying for exposure in our regressions.This is not the case, since exposure and concentration are not correlated in the data.Furthermore, as we have noted in the empirical section, although exposure is asignificant determinant of discounts, concentration remains significant when bothvariables are included in the specification.
A last alternative is that when debt is concentrated in the hands of a few largecreditors, the free-rider problems associated with providing debt forgiveness arelikely to be less severe, Pareto-improving debt-reduction agreements are more likelyto be reached, and secondary-market prices are accordingly higher. This explanationdoes provide the positive relationship between debt and secondary-market prices,but it is very similar to ours. Small banks can be thought of as free-riding in their
Žunwillingness to punish the debtor each one of them is marginal and hence does not
DEBT CONCENTRATION AND BARGAINING POWER 353
.put in the ‘‘right’’ amount of resources to punish the debtor or in their unwilling-ness to grant concessions, again due to their marginal nature.
4.2. Concluding Remarks. Evaluations, both normative and positive, of differentschemes to deal with the debt crisis rely on secondary-market prices as indicators ofthe expected value of a country’s repayments. It is therefore important to under-stand the nature of the factors that affect them. In this paper we argue that thedegree of concentration of a country’s debt in the hands of the largest U.S. banksaffects a country’s repayment prospects and hence secondary-market prices.
We conduct an empirical analysis of secondary-market discounts and considerconcentration as a potential determinant of discounts. Our empirical findings
Ž .indicate that concentration indeed has a negative positive effect on secondary-Ž .market discounts prices . We explain our finding by constructing a bargaining
model that distinguishes between large money center banks and small domesticbanks and the asymmetry between the share of benefits relative to costs borne bythe large banks and endogenizes the maximum penalty that banks can crediblythreaten to impose on a country. We show that the percentage of a country’s debtheld by the large banks affects the value of that country’s debt: The higher theconcentration of the debt, the higher is the valuation. Although we do not provide atest of the specific model, we examine and discard several alternative explanations.
ŽFurthermore, while it is possible to come up with other stories e.g., free-riding on.the part of the small banks that yield the same correlation, the models that underlie
these alternative explanations are quite similar to the one that we have spelled out.Our finding of a positive effect of debt concentration on secondary-market prices
has a number of important implications for policy making and theoretical debates. Afirst point is that secondary-market prices are not influenced solely by the ‘‘good’’ or‘‘bad’’ economic situation of the debtor countries. Factors that influence the behav-
Žior of the creditors in their negotiations with the debtor also matter i.e., largecreditors’ share in the benefits of negotiation relative to their share of potential
.costs . Furthermore, our empirical finding of the relative unimportance of countrycharacteristics argues that more research should be done to understand the differentroles that creditor characteristics play in determining secondary-market prices.Second, the degree of debt concentration is likely to be affected by the structure ofthe banking system, the regulatory systems in the lender countries, and portfolioconsiderations. The contribution of each of these factors to debt concentration, andhence to secondary-market prices, should be taken into account when assessing thevalue of debt-forgiveness programs, debt-equity swaps, and virtually any otherscheme that relies on secondary-market prices. Last, various plans to deal with debtproblems, both past and future ones, may affect debt concentration. Our study
Ž .cautions that these may have perhaps unintended effects on the bargaining powerof the banks vis-a-vis the country and on the valuation of the remaining debt.`
REFERENCES
Ž .AMEMIYA, T., Ad¨anced Econometrics Cambridge, Mass.: Harvard, 1985 .BERG, A. AND J. SACHS, ‘‘The Debt Crisis: Structural Explanations of Country Performance,’’ Journal
Ž .of De¨elopment Economics 29 1989 , 271]306.
´ ¨FERNANDEZ AND OZLER354
BULOW, J. AND K. ROGOFF, ‘‘Sovereign Debt: Is to Forgive to Forget,’’ American Economic Re¨iewŽ .79 1989a , 43]50.
}}} AND }}}, ‘‘A Constant Recontracting Model of Sovereign Debt,’’ Journal of PoliticalŽ .Economy 97 1989b , 155]178.
CLASSENS, S., I. DIWAN, K. FROOT, AND P. KRUGMAN, ‘‘Market-Based Debt Reduction for Develop-ing Countries: Principles and Prospects,’’ mimeo, World Bank, 1990.
ŽCLINE, W., International Debt: Systemic Risk and Policy Response Cambridge, Mass.: MIT Press for.the Institute for International Economics, 1984 .
COHEN, D., ‘‘Is the Discount on the Secondary Market a Case for LDC Debt Relief?,’’ PPR WorkingPaper No. 132, World Bank, 1988.
COLE, H. AND P. KEHOE, ‘‘Reputation Spillover Across Relationships with Enduring and TransientŽ .Benefits: Reviving Reputation Models of Debt,’’ International Economic Re¨iew 1997 .
}}} AND }}}, ‘‘Models of Sovereign Debt: Partial vs. General Reputations,’’ InternationalŽ .Economic Re¨iew 39 1998 , 55]70.
DEMIRGUC-KUNT, A. AND I. DIWAN, ‘‘The Menu Approach to Developing Country External Debt:An Analysis of Commercial Banks’ Choice Behavior,’’ mimeo, World Bank, 1990.
DOOLEY, M. AND M. STONE, ‘‘Endogenous Creditor Seniority and External Debt Values,’’ IMF StaffŽ .Papers 40 June 1993 , 395]413.
EATON, J. AND M. GERSOVITZ, ‘‘Debt with Potential Repudiation: Theory and Estimation,’’ Re¨iewŽ .of Economic Studies 48 1981 , 289]309.
}}} AND R. FERNANDEZ, ‘‘Sovereign Debt,’’ in G. Grossman and K. Rogoff, eds., Handbook ofŽ .International Economics, vol. 3 Amsterdam: Elsevier Science, 1995 , 2031]2077.
}}} AND L. TAYLOR, ‘‘Developing Country Finance and Debt,’’ Journal of De¨elopment Eco-Ž .nomics 22 1986 , 209]265.
FERNANDEZ, R. AND J. GLAZER, ‘‘Striking for a Bargain Between Two Completely Informed Agents,’’´Ž .American Economic Re¨iew 81 1991 , 240]252.
}}} AND }}}, ‘‘The Scope for Collusive Behavior Among Debtor Countries,’’ Journal ofŽ .De¨elopment Economics 32 1990 , 297]313.
}}} AND D. KAARET, ‘‘Bank Heterogeneity, Reputation and Debt Renegotiation,’’ InternationalŽ .Economic Re¨iew 33 1992 , 60]78.
}}} AND S. OZLER, ‘‘Debt Concentration and Secondary Market Prices: A Theoretical andEmpirical Analysis,’’ NBER Working Paper No. 3654, 1991.
}}} AND R. ROSENTHAL, ‘‘Strategic Models of Sovereign Debt Renegotiations,’’ Re¨iew ofŽ .Economic Studies 57 1990 , 331]349.
GROSSMAN, S. AND O. HART, ‘‘Takeover Bids, the Free-Rider Problem, and the Theory of theŽ .Corporation,’’ Bell Journal of Economics 11 1980 , 42]64.
HAJIVASSILIOU, V., ‘‘Do Secondary Markets Believe in Life After Debt?’’ in H. Ishrat and I. Diwan,Ž .eds., Dealing with the Debt Crisis Washington, D.C.: World Bank, 1989 , 276]292.
HAY, J. AND M. BOUCHET, ‘‘The Tax, Accounting, and Regulatory Treatment of Sovereign Debt,’’Debt Management and Financial Advisory Services Department Staff Working Paper, WorldBank, 1989.
HUIZINGA, H., ‘‘The Commercial Bank Claims on Developing Countries: How Have Banks BeenŽAffected?’’ in H. Ishrat and I. Diwan, eds., Dealing with the Debt Crisis Washington, D.C.:
.World Bank, 1989 , 129]143.KRUGMAN, P., ‘‘International Debt Strategies in an Uncertain World,’’ in G. Smith and J. Cudding-
Žton, eds., International Debt and the De¨eloping Countries Washington, D.C.: World Bank,.1985 , 79]100.
LIPSON, C. ‘‘Bankers’ Dilemmas: Private Cooperation in Rescheduling Sovereign Debts,’’ WorldŽ .Politics 38 1985 , 200]225.
OZLER, S., ‘‘On the Relation Between Reschedulings and Bank Value,’’ American Economic Re¨iewŽ .79 1989 , 1117]1131.
}}}, ‘‘Evolution of Credit Terms: An Empirical Study of Commercial Bank Lending to Develop-Ž .ing Countries,’’ Journal of De¨elopment Economics 38 1992 , 79]98.
Ž .}}}, ‘‘Have Commercial Banks Ignored History?’’ American Economic Re¨iew 83 1993 , 608]620.}}} AND H. HUIZINGA, ‘‘Secondary Market Prices for Developing Country Debt: The Role of
Creditor Country Factors,’’ NBER Working Paper No. 3961, January 1992.

DEBT CONCENTRATION AND BARGAINING POWER 355
}}} AND G. TABELLINI, ‘‘External Debt and Political Instability,’’ NBER Working Paper No.3772, July 1991. Revised July 1997.
PURCELL, J. AND D. ORLANSKI, ‘‘Developing Country Loans: A New Valuation Model for SecondaryMarket Trading,’’ Corporate Bond Research, Salomon Brothers, Inc., June 1988.
Ž .RUBINSTEIN, A., ‘‘Perfect Equilibrium in a Bargaining Model,’’ Econometrica 50 1982 , 97]110.Ž .}}}, ‘‘Comments on the Interpretation of Game Theory,’’ Econometrica 59 1991 , 909]924.
SACHS, J., ‘‘Theoretical Issues in International Borrowing,’’ Princeton Studies in InternationalFinance No. 54, July 1984.
}}} AND H. HUIZINGA, ‘‘U.S. Commercial Banks and the Developing-Country Debt Crisis,’’Ž .Brookings Papers on Economic Acti ity 2 1987 , 555]606.
STONE, M., ‘‘Sovereign Debt Secondary Market Returns,’’ Journal of International Money and FinanceŽ .10 1991 , S100]S122.
Related Documents
![Mikael Stenström [Modo de compatibilidad]...Data sufficiency policy: contingency triggers (20 banks, 75% top 5 banks’ concentration ratio) Governance and processes: €STR published](https://static.cupdf.com/doc/110x72/5e901915315b5c47597cd129/mikael-stenstrm-modo-de-compatibilidad-data-sufficiency-policy-contingency.jpg)