KRC Research is also available on Bloomberg KRCS<GO>, Thomson First Call, Reuters, Factset and Capital IQ India Equity Research I Media &Entertainment Initiating coverage DB Corp Limited INR: 235 Multi language Player BUY Price Outlook (INR): 278 Market Data February 05, 2010 Shares outs (Cr) 18.15 Equity Cap (Rs. Cr) 181.5 Mkt Cap (Rs. Cr) 4,265 52 Wk H/L (Rs) 274.6/207.4 Avg Vol (1yr avg) 22,28,203 Face Value (Re) 10.0 Bloomberg Code DBCL. IN Market Info: SENSEX 15,857 NIFTY 4,732 Price Performance 84.0 86.0 88.0 90.0 92.0 94.0 96.0 98.0 100.0 102.0 6-Jan 10-Jan 14-Jan 18-Jan 22-Jan 26-Jan DBCORP Sensex Share Holding pattern (%) Particulars Dec-09 Sep-09 Chg Promoters 86.4 92.8 (6.4) Institutions 2.5 7.1 (4.6) FII 7.1 - 7.1 Public/Others 4.0 .01 3.9 Total 100.0 - - Analyst : Rohit Maheshwari [email protected] ℡ 91-22-6696 5574 DB Corp, part of Bhaskar group and among one of the leading Print media companies of the country in local languages which provides an opportunity to harness the fastest growing market. The promoters hold 86.4% stake in the company. Investment Rationale Emerging growth in Sub-Urban areas The market size of Print Media advertisement industry is expected to reach ~Rs 17,430 crore by CY13 growing at a CAGR of 10%. We expect major growth to come from regional languages as metro are well past their peak period but Tier-II and Tier-III cities with increasing consumerism will see higher corporate spending to tap the growing market. DB corp with strong presence in regional markets would be the key beneficiary. Diversified Portfolio leds cross selling opportunities DB Corp is one of the largest print media company’s with 31 production units spread across 3 regions: Northern, Central and Western states, publishing 48 editions in multiple languages. Print, Radio, Internet, SMS & below the line marketing services provides the company cross selling opportunities and higher bargaining power with advertisers. Sustainable business model with proven capabilities Lower cover price and diversified presence across regions act as an entry barrier for new players and provides sustainability to company’s business model. Going forward, We believe company has better ability to penetrate new regions than its peers on account of a) Lower average cover prices than industry, b) printing in multiple languages – English, Hindi & Gujarati and c) innovative marketing strategy. Strengthens balance sheet as editions mature As on March, 09, 16 out of total 48 editions are in its emerging stage (less than 4 years of operation) and have incurred Profit before tax (PBT) loss of Rs 58 crore. We believe major loss making editions like Amristar, Jalandhar & Rajkot would breakeven by FY10. Emerging editions turning profitable, would lead to a) Huge cash flows & b) lesser impact on financials while entering into new markets. Valuations & Views At the CMP of Rs 235, the stock is trading at 16.9x FY11E EPS of 13.9 and 13.8x FY12 P/E EPS of Rs 17.0. We initiate our coverage on DB Corp assigning a BUY rating to the stock with 12-month target price of Rs 278.0, based on our SOTP valuation, representing upside potential of 18.3%. Key Financials Particulars (Rs in crore) FY09 FY10E FY11E FY12E Revenues 961.0 1092.7 1262.7 1474.3 EBITDA 147.3 370.6 433.3 515.4 Net Profit 47.6 203.7 252.0 308.5 EPS 2.6 11.2 13.9 17.0 P/E 89.6 20.9 16.9 13.8 P/BV 13.2 5.3 4.1 3.2 EV/EBITDA 32.1 12.8 10.9 9.2 ROE 23.48% 38.03% 28.14% 26.55% www.krchoksey.com ℡ 91-22-6696 5555 91-22-6691 9569

Welcome message from author
This document is posted to help you gain knowledge. Please leave a comment to let me know what you think about it! Share it to your friends and learn new things together.
Transcript

KRC Research is also available on Bloomberg KRCS<GO>, Thomson First Call, Reuters, Factset and Capital IQ
India Equity Research I Media &Entertainment Initiating coverage
DB Corp Limited INR: 235
Multi language Player BUY
Price Outlook (INR): 278
Market Data February 05, 2010
Shares outs (Cr) 18.15
Equity Cap (Rs. Cr) 181.5
Mkt Cap (Rs. Cr) 4,265
52 Wk H/L (Rs) 274.6/207.4
Avg Vol (1yr avg) 22,28,203
Face Value (Re) 10.0
Bloomberg Code DBCL. IN
Market Info: SENSEX 15,857
NIFTY 4,732
Price Performance
84.086.088.090.092.094.096.098.0
100.0102.0
6-Ja
n
10-J
an
14-J
an
18-J
an
22-J
an
26-J
an
DBCORP Sensex
Share Holding pattern (%)
Particulars Dec-09 Sep-09 Chg
Promoters 86.4 92.8 (6.4)
Institutions 2.5 7.1 (4.6)
FII 7.1 - 7.1
Public/Others 4.0 .01 3.9
Total 100.0 - - Analyst :
Rohit Maheshwari
℡ 91-22-6696 5574
DB Corp, part of Bhaskar group and among one of the leading Print media companies of the
country in local languages which provides an opportunity to harness the fastest growing
market. The promoters hold 86.4% stake in the company.
Investment Rationale
Emerging growth in Sub-Urban areas The market size of Print Media advertisement industry is expected to reach ~Rs 17,430 crore by CY13 growing at a CAGR of 10%. We expect major growth to come from regional languages as metro are well past their peak period but Tier-II and Tier-III cities with increasing consumerism will see higher corporate spending to tap the growing market. DB corp with strong presence in regional markets would be the key beneficiary. Diversified Portfolio leds cross selling opportunities DB Corp is one of the largest print media company’s with 31 production units spread across 3 regions: Northern, Central and Western states, publishing 48 editions in multiple languages. Print, Radio, Internet, SMS & below the line marketing services provides the company cross selling opportunities and higher bargaining power with advertisers. Sustainable business model with proven capabilities Lower cover price and diversified presence across regions act as an entry barrier for new players and provides sustainability to company’s business model. Going forward, We believe company has better ability to penetrate new regions than its peers on account of a) Lower average cover prices than industry, b) printing in multiple languages – English, Hindi & Gujarati and c) innovative marketing strategy. Strengthens balance sheet as editions mature As on March, 09, 16 out of total 48 editions are in its emerging stage (less than 4 years of operation) and have incurred Profit before tax (PBT) loss of Rs 58 crore. We believe major loss making editions like Amristar, Jalandhar & Rajkot would breakeven by FY10. Emerging editions turning profitable, would lead to a) Huge cash flows & b) lesser impact on financials while entering into new markets. Valuations & Views At the CMP of Rs 235, the stock is trading at 16.9x FY11E EPS of 13.9 and 13.8x FY12 P/E EPS of Rs 17.0. We initiate our coverage on DB Corp assigning a BUY rating to the stock with 12-month target price of Rs 278.0, based on our SOTP valuation, representing upside potential of 18.3%. Key Financials
Particulars (Rs in crore) FY09 FY10E FY11E FY12E
Revenues 961.0 1092.7 1262.7 1474.3
EBITDA 147.3 370.6 433.3 515.4
Net Profit 47.6 203.7 252.0 308.5
EPS 2.6 11.2 13.9 17.0
P/E 89.6 20.9 16.9 13.8
P/BV 13.2 5.3 4.1 3.2
EV/EBITDA 32.1 12.8 10.9 9.2
ROE 23.48% 38.03% 28.14% 26.55%
www.krchoksey.com
℡ 91-22-6696 5555
91-22-6691 9569

DB Corp Limited
2 KRC Equity Research
Table of Contect
COMPANY OVERVIEW .......................................................................................................................................................3
MANAGEMENT PROFILE................................................................................................................. 5
INDUSTRY OVERVIEW .......................................................................................................................................................6
PRINT AND MEDIA .............................................................................................................................................................7
BUSINESS MODEL ...................................................................................................................... 8
GROWTH DRIVERS ............................................................................................................................................................9
INCREASING LITERACY RATE ............................................................................................................ 9
LOW MEDIA PENETRATION .............................................................................................................10
LOWER ADVERTISING SPENDS AS % OF GDP ............................................................................................10
NEWSPRINT .....................................................................................................................................................................11
RADIO INDUSTRY ............................................................................................................................................................14
INVESTMENT RATIONALE ...............................................................................................................................................15
EMERGING SUB-URBAN DEMOGRAPHICS- A GREAT POSITIVE .............................................................................15
DIVERSIFIED PORTFOLIO ACROSS MEDIA SPACE PROVIDES CROSS SELLING OPPORTUNITIES ..................................................17
WELL CONNECTED TO END USERS AND ADVERTISERS.....................................................................................18
SUSTAINABLE BUSINESS MODEL WITH PROVEN INNOVATIVE STRATEGY ....................................................................19
STRENGTHENS BALANCE SHEET AS EDITIONS MATURE ....................................................................................21
VALUATION .....................................................................................................................................................................22
KEY RISKS ........................................................................................................................................................................23
NEWSPRINT PRICES ...................................................................................................................23
SLOWDOWN IN AD REVENUE GROWTH .................................................................................................23
DELAY IN BREAKEVEN OF EMERGING EDITIONS...........................................................................................23
FINANCIAL OUTLOOK (PRINT BUSINESS) ......................................................................................................................24
DB Corp Limited
3 KRC Equity Research
DB Corp part of
diversified business
conglomerate, which
currently owns 86%
stake in the
company.
Dainik Bhaskar,
flagship newspaper,
with a total average
daily readership of
1.2 crore.
Company Overview
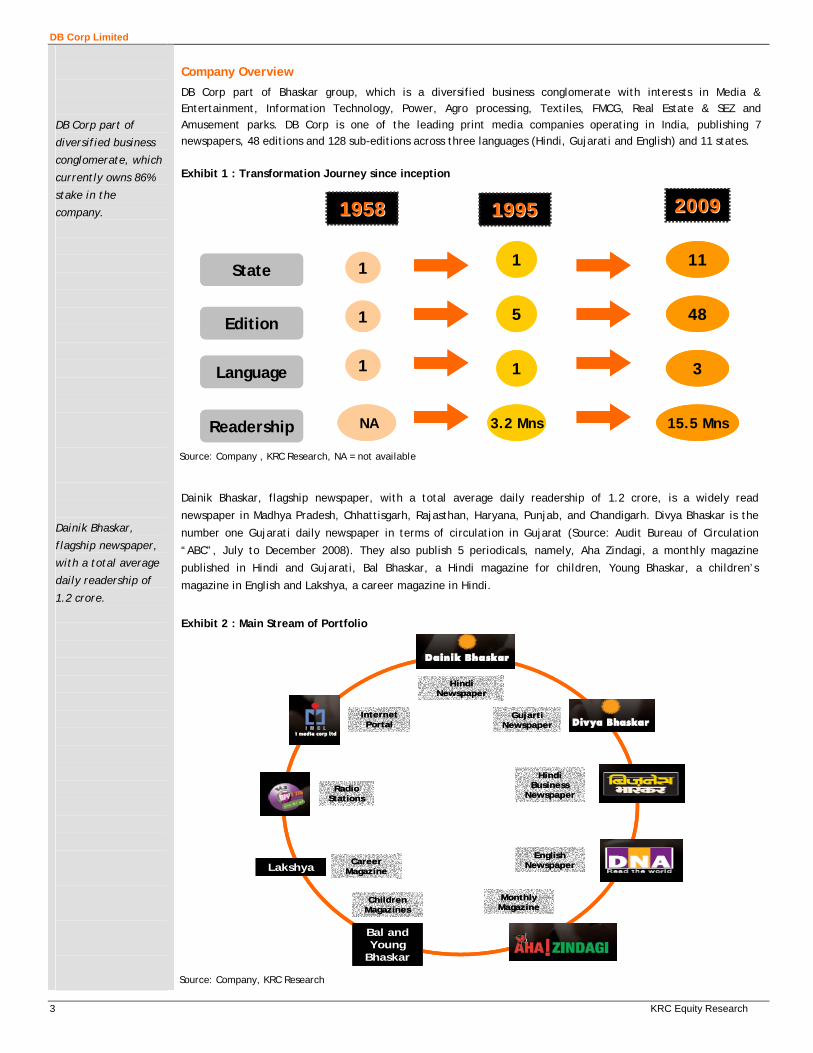
DB Corp part of Bhaskar group, which is a diversified business conglomerate with interests in Media & Entertainment, Information Technology, Power, Agro processing, Textiles, FMCG, Real Estate & SEZ and Amusement parks. DB Corp is one of the leading print media companies operating in India, publishing 7 newspapers, 48 editions and 128 sub-editions across three languages (Hindi, Gujarati and English) and 11 states. Exhibit 1 : Transformation Journey since inception
19581958 19951995 20092009
Language
Readership
State
Edition
1
1
1
1
5
1
3.2 Mns
11
48
3
15.5 MnsNA
19581958 19951995 20092009
Language
Readership
State
Edition
1
1
1
1
5
1
3.2 Mns
11
48
3
15.5 MnsNA
Source: Company , KRC Research, NA = not available
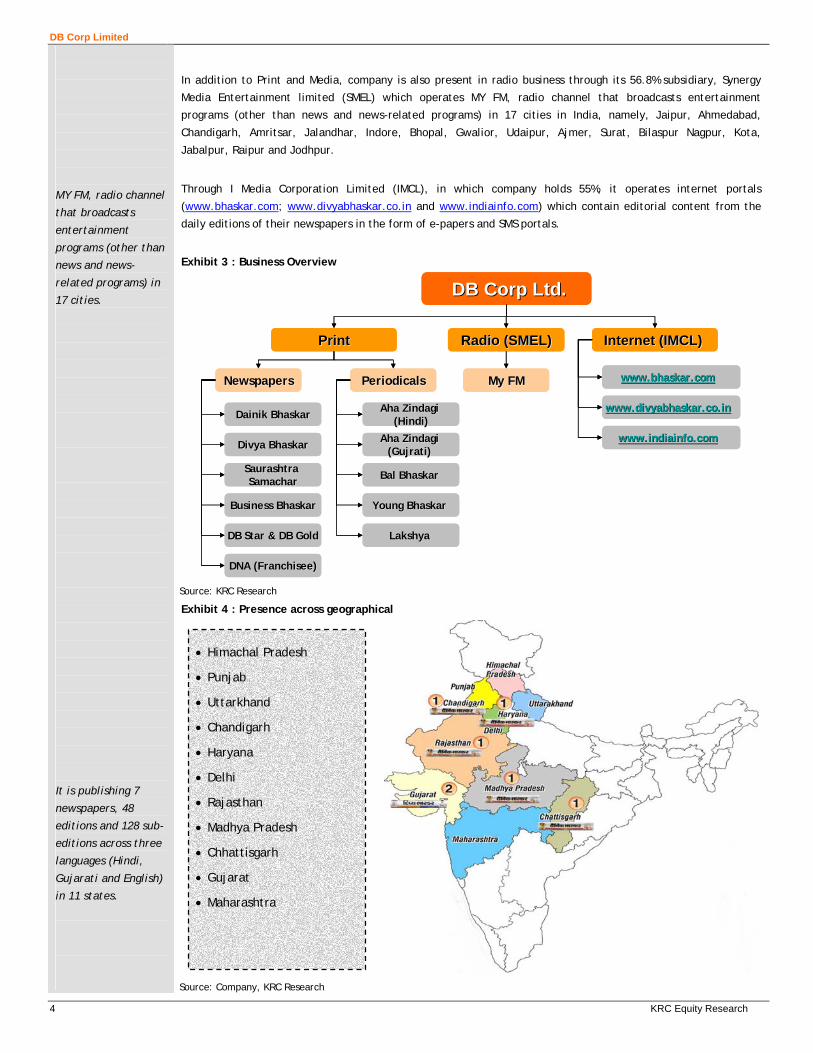
Dainik Bhaskar, flagship newspaper, with a total average daily readership of 1.2 crore, is a widely read
newspaper in Madhya Pradesh, Chhattisgarh, Rajasthan, Haryana, Punjab, and Chandigarh. Divya Bhaskar is the
number one Gujarati daily newspaper in terms of circulation in Gujarat (Source: Audit Bureau of Circulation
“ABC”, July to December 2008). They also publish 5 periodicals, namely, Aha Zindagi, a monthly magazine
published in Hindi and Gujarati, Bal Bhaskar, a Hindi magazine for children, Young Bhaskar, a children’s
magazine in English and Lakshya, a career magazine in Hindi.
Exhibit 2 : Main Stream of Portfolio
Hindi Newspaper
Gujarti Newspaper
Hindi Business
NewspaperRadio
Stations
Internet Portal
English Newspaper
Monthly Magazine
Bal and Young
Bhaskar
Children Magazines
LakshyaCareer
Magazine
Hindi Newspaper
Gujarti Newspaper
Hindi Business
NewspaperRadio
Stations
Internet Portal
English Newspaper
Monthly Magazine
Bal and Young
Bhaskar
Children Magazines
LakshyaCareer
Magazine
Source: Company, KRC Research
DB Corp Limited
4 KRC Equity Research
MY FM, radio channel
that broadcasts
entertainment
programs (other than
news and news-
related programs) in
17 cities.
It is publishing 7
newspapers, 48
editions and 128 sub-
editions across three
languages (Hindi,
Gujarati and English)
in 11 states.
In addition to Print and Media, company is also present in radio business through its 56.8% subsidiary, Synergy
Media Entertainment limited (SMEL) which operates MY FM, radio channel that broadcasts entertainment
programs (other than news and news-related programs) in 17 cities in India, namely, Jaipur, Ahmedabad,
Chandigarh, Amritsar, Jalandhar, Indore, Bhopal, Gwalior, Udaipur, Ajmer, Surat, Bilaspur Nagpur, Kota,
Jabalpur, Raipur and Jodhpur.
Through I Media Corporation Limited (IMCL), in which company holds 55%, it operates internet portals
(www.bhaskar.com; www.divyabhaskar.co.in and www.indiainfo.com) which contain editorial content from the
daily editions of their newspapers in the form of e-papers and SMS portals.
Exhibit 3 : Business Overview
DB Corp Ltd.DB Corp Ltd.
PrintPrint Radio (SMEL)Radio (SMEL) Internet (IMCL) Internet (IMCL)
NewspapersNewspapers PeriodicalsPeriodicals My FMMy FM
Dainik BhaskarDainik Bhaskar
Divya BhaskarDivya Bhaskar
Saurashtra Saurashtra SamacharSamachar
Business BhaskarBusiness Bhaskar
DB Star & DB GoldDB Star & DB Gold
DNA (Franchisee)DNA (Franchisee)
Aha Zindagi Aha Zindagi (Hindi)(Hindi)
Aha Zindagi Aha Zindagi (Gujrati) (Gujrati)
Bal Bhaskar Bal Bhaskar
Young Bhaskar Young Bhaskar
Lakshya Lakshya
www.bhaskar.comwww.bhaskar.com
www.divyabhaskar.co.inwww.divyabhaskar.co.in
www.indiainfo.comwww.indiainfo.com
Source: KRC Research
Exhibit 4 : Presence across geographical
Source: Company, KRC Research
• Himachal Pradesh
• Punjab
• Uttarkhand
• Chandigarh
• Haryana
• Delhi
• Rajasthan
• Madhya Pradesh
• Chhattisgarh
• Gujarat
• Maharashtra

DB Corp Limited
5 KRC Equity Research
Management with
wide experience and
expertise.
Management Profile
Chairman - Ramesh Chandra Agarwal (65 years) – December 10, 2005 - He holds a post graduate degree
in Political Science and ~42 years of experience in the publishing and newspaper business Currently he is also the
Chairman of the Federation of Indian Chambers of Commerce and Industry of the Madhya Pradesh. He has
recently been awarded the Rajeev Gandhi Life time Achievement Award in Journalism. Besides, he has been
recipient of various awards in past and has been held as within 50 most powerful Business houses by India Today
Magazine in 2003, 2006 and 2007. .
Managing Director and CEO- Sudhir Agarwal (42 years) - December 10, 2005 - He holds a bachelor’s
degree in science. He has been part of the organization for ~21 years. He is also a director of several group
companies. Due to his aggressive leadership qualities, the company is considered as one of the fastest growing
media groups by various analyst and investors, which has spread from 1 state in 1995 to 11 states, from 5 editions
to 48 Editions.
Non-Executive Director - Girish Agarwal (38 years) – October 27, 1995 - He holds a bachelor’s degree
in commerce and ~17 years of experience in the publishing business. Currently, he heads the marketing and
related operations of the company. He holds distinction of being the youngest chairman of INS for Madhya
Pradesh region. He was also awarded the Entrepreneur of the Year for the year 2006 by Ernst & Young.
Non-Executive Director - Pawan Agarwal (35 years) – December 10, 2005 - He holds bachelor’s
degree in industrial engineering and ~11 years of experience in the publishing business. Currently, he heads entire
production & information and technology department of the company.
Non-Executive Director – Niten Malhan (38 years) – December 12, 2006 - He is managing director of
Warburg Pincus India Private Ltd. He holds a degree in computer science from IIT Delhi and masters in business
administration from the IIM - Ahmedabad.
Non-Executive independent Director – Ajay Piramal (54 years) – November 28, 2007 - He holds an
honours graduate degree in science, post graduate degree from Jamnalal Bajaj Institute of Management Studies,
Mumbai and management programme from Harvard University. He heads the Piramal Enterprises Group.
Non-Executive independent Director – Piyush Pandey (54 years) - November 28, 2007 - He holds a
post graduate degree in history and ~27 years of experience in the field of advertising. Mr. Piyush Pandey is the
only Indian to have won a double gold at Cannes and a triple grand prize at London International Advertising
Awards held in 2002.
Non-Executive independent Director – Kailash Chandra Chowdhary (54 years) - November 28, 2007 He holds a bachelor’s degree in commerce and associate member of the Institute of Chartered Accountants
of India. He is a retired banker with ~40 years of experience in finance, management and banking operations. He
was the executive director and managing director of several top public banks.
Non-Executive independent Director – Ashwani Singhal (48 years) - November 28, 2007 – He holds a
bachelor degree in commerce and ~26 years of experience in non-ferrous metallurgical industry.
Non-Executive independent Director – Harish Bijoor (48 years) - November 28, 2007 – He holds an
under graduate and post graduate degree in arts and ~27 years of experience in marketing and brand
management. He is currently a member of the Coffee Board of India and planning group sub- committee of the
Union Planning Commission of India, focusing on the plantation category in India.

DB Corp Limited
6 KRC Equity Research
Indian M&E industry
expected to register
5 year CAGR of 12.5%
to Rs 1,05,170 crore.
Advertising revenue
is the key growth
driver of the
industry. It has a
market share of 38%
in total Indian M&E
industry.
Industry Overview
Over the past 3 years (CY05 to CY08), the Indian media industry grew at an average rate of 13.8% on the back of
strong growth in Indian economy, rise in discretionary spending by domestic consumers and greater competition
among corporates for attracting consumers led to higher advertising spend. Since the last quarter of CY09,
market environment became more challenging for the advertising market as economic slowdown forced
corporates to curtail their advertising budget. Along with that, for an individual player, greater fragmentation of
audience across media and distribution platforms lead to more complexities in addressing its target consumer
base.
Exhibit 5: Segmental Break-up of M&E Industry
Other includes (break-up of Mkt share 9.2%)
Music (1.2%), Animation (3.0%), Gaming (1.1%), Internet advertising (1.1%) and Outdoor (2.8%)
Media & EntertainmentMedia & Entertainment
Television Print Film Radio Others Total
Market Share2008 41.2% 29.5% 18.7% 1.4% 9.2% 100%
Market Size(Rs in crore) 24,050 17,260 10,930 840 5,350 58,430
2005-2008CAGR 13.8% 13.8% 17.8% 19.7% 18.1% 17.2%
Market Size2013E 47,260 26,600 16,860 1,630 12,820 1,05,170
Market Share2013E 44.9% 25.3% 16.0% 1.5% 12.2% 100%
2008-2013CAGR 14.5% 9.0% 9.1% 14.2% 19.1% 12.5%
Market SizeRs 58,430 crore
Media & EntertainmentMedia & Entertainment
Television Print Film Radio Others TotalTelevision Print Film Radio Others Total
Market Share2008 41.2% 29.5% 18.7% 1.4% 9.2% 100%
Market Size(Rs in crore) 24,050 17,260 10,930 840 5,350 58,430
2005-2008CAGR 13.8% 13.8% 17.8% 19.7% 18.1% 17.2%
Market Size2013E 47,260 26,600 16,860 1,630 12,820 1,05,170
Market Share2013E 44.9% 25.3% 16.0% 1.5% 12.2% 100%
2008-2013CAGR 14.5% 9.0% 9.1% 14.2% 19.1% 12.5%
Market SizeRs 58,430 crore
Source : FICCI-KPMG report , KRC Research
Advertising revenues is one of the main growth drivers for M& E industry. Over the past 3 years, the segment has
registered CAGR of 17.1% to 22,160 crore in CY08. Going forward, we expect advertising industry to register a
CAGR growth of 12.2% over next 5 years and the growth driver would be:
• Favorable demographics
• Strong Long Fundamental
• Low Advertising to GDP ratio
• Low Media Penetration

DB Corp Limited
7 KRC Equity Research
Indian print media is
a highly fragmented
industry.
In past 3 years, print
industry has grown at
a CAGR 18.7% to Rs
17,260 crore.
Higher contribution
with low inventory
volume with higher
advertisement rates
as compared to
regional dailies.
.
Print and Media
Indian print media industry is highly fragmented with Hindi languages newspapers accounting for highest share of
44.6% of the registered dailies followed by English which a share of 7.4%. Other regional languages account for
the rest. Though the circulation and publication of English newspapers is only 7.4%, they account for almost ~50%
of corporate spending on advertising; as readers of English newspapers are considered to be in higher income
bracket having higher purchasing power.
In past 3 years, print industry has grown at a CAGR 18.7% to Rs 17,260 crore; however the performance of the
sector is impacted by the economic slowdown in the recent times. Advertising revenue increased by 8.2% to Rs
10,840 crore and Circulation revenue by 7.4% y-o-y to Rs 6,430 crore in CY08.
Exhibit 6: Advertisement Volume Breakup - Languages
25%
34%
10%
8%
6%
17%
English Hindi Tamil Marathi Malayam Other
Source: Crisil, KRC Research Exhibit 7: Advertisement Revenue Breakup - Languages
12%3%6%
4%50%
25%English Hindi Tamil Marathi Malayam Other
Source: Crisil, KRC Research
As compared to broadcasting segment, it has been adversely affected due to higher exposure to real estate, auto
and travel, and lower FMCG contribution. Further, enhanced competition has also led to fall in average cover
prices which countered the rise in circulation volumes for the players.

DB Corp Limited
8 KRC Equity Research
In CY08, print
advertising was
affect due to higher
exposure towards
Real estate, Auto and
BFSI.
Print Media industry
business model
involves twofold
stream of revenues:
advertising (62.7%)
and circulation
(37.3%)
Exhibit 8: Top 10 Sectors contributing to Print Media advertising pie
3.0%2.0%3.0% 3.0% 4.0% 5.0% 7.0%
10.0%
12.0%
15.0%
36.0%
Education Services BFSI Auto
Retail Durables Pers. Acces. Corp./brand Image
Pers. Health. Media Others
Source: Crisil, KRC Research Business Model The Print Media industry business model involves twofold stream of revenues: advertising and circulation. While
advertising revenues are generated from sale of advertising space in a publication, circulation revenues are a
function of the number of copies sold and pricing of the publication. The industry is currently passing through one
of its most dynamic phases with most of the players expanding their footprints beyond traditional regions. In the
past few years, this segment has seen strong FDI inflows.
Exhibit 9: Business Model of Print and Media Industry
• Level of advertising in the newspaper• Readership profile and Positioning pf
the newspaper.• Size of readership, that is reach• Geographical coverage of the
newspaper• Advertising mix
Print & MediaPrint & Media
News Papers Magazines
Revenue StreamRevenue Stream
Advertising Circulation
Factor
Market Size &Share (2008)
Rs 10,830 crore (62.7%) Rs 6,430 crore (37.3%)
Growth3 yr CAGR
16.0% 10.5%
Function Sale of advertising space in a publication No. of copies sold and pricing of the publication.
Market Size &Share (2013) Rs 17,430 crore (65.5%) Rs 9,170 crore (34.5%)
• Price of the newspaper• Intensity of competition among newspaper
in a market.• Quality, relevance and credibility of
content.• Brand Strength.• Distribution muscle.
2008: Rs 17,260 crore
Market share91.9%
2013: Rs 26,600 crore
Market share8.1%
5 year CAGR9.0%

DB Corp Limited
9 KRC Equity Research
The growth of 9%
would mainly be
driven by advertising
segment which
contributes ~65% to
overall print industry
revenue
68.5% of India’s
population lives in
rural areas, where
literacy rate is only
62% leading to low
penetration of
newspapers.
Source: Crisil, KRC Research
Growth Drivers
According to FICCI-KPMG report 2008, Print industry is expected to register 5 year CAGR of 9.0% to Rs 26,600
crore. The growth of 9% would mainly be driven by advertising segment which contributes ~65% to overall print
industry revenue and rest by circulation. Advertising revenue expected to register 5 year CAGR of 10% to Rs
17,430 crore and circulation revenue of 7% to Rs 9,170. The growth drivers for the industry would be increasing
literacy rate; Low media penetration and Low advertising spend as % of GDP.
Exhibit 10: Growth drivers
Increasing Increasing Literacy Literacy
Rate Rate
Low Low Media Media
PenetrationPenetration
Growth Growth DriversDrivers
Lower Advtg Lower Advtg spends spends
as % of GDPas % of GDP
Increasing Increasing Literacy Literacy
Rate Rate
Low Low Media Media
PenetrationPenetration
Growth Growth DriversDrivers
Lower Advtg Lower Advtg spends spends
as % of GDPas % of GDP
Growth Growth DriversDrivers
Lower Advtg Lower Advtg spends spends
as % of GDPas % of GDP
Source : KRC Research Increasing Literacy rate
68.5% of India’s population lives in rural areas, where literacy rate is only 62% leading to low penetration of
newspapers. But as government has allocated a lot of resources towards reform in education sector, it will lead
to faster growth in regional print. We expect average literacy rate to reach ~75% by FY12, which will lead to an
increase of 7.4% in circulation revenue to Rs 8,570 crore by FY12.
This is also supported by the fact that both the readership surveys, Indian Readership Survey (IRS) and National
Readership Survey (NRS), have reiterated dominance of language publications over those of national publications
in future. Readership figures of IRS 2008 Round 2 (R2) also corroborates this fact with The Times of India (ToI)
being the only English newspaper among the top 10 dailies in India.
Exhibit 11: Current Indian Scenario of literacy rate and Population Distribution among Urban and Rural Areas
Particulars (in Crore) Urban Rural Total
Populations 26.8 58.4 85.2
Literacy % 83.0% 62.0% 68.0%
Readership (% of literates) 42.0% 21.0% 29.0%
Literates people 22.2 36.2 57.9
Readership (% of literates) 9.3 7.6 16.8
31.5%
68.5%
Rura l Urban
Source: Company, KRC Research, Age group 12+

DB Corp Limited
10 KRC Equity Research
Total readership base
of ~25 crore out of
more than 120 crore
population in India
Indian advertising as
% of GDP is lower
than average of 0.83
Indian advertising as
% of GDP is low due
to low per capital
income and literacy
rate.
Low media Penetration
With a readership base of over 25 crore, India is the second largest print Market in the world. However, this
market is still under penetrated for a country with a population in excess of 120 crore and is also highly
fragmented with over 60,000 newspapers printed in 22 languages. The low penetration of the print market
provides a significant growth opportunity as 35.9 crore people who can read and understand their language do not
read any publication.
With an 85% reach in the urban markets (SEC A and B) but an abysmal 33% for rural markets (SEC C, D and E), we
believe that a major growth opportunity lies in the vernacular segment. It should also be noted that, each
regional daily is read by almost 7-9 readers compared to 2-3 readers for English dailies, indicating the potential
for higher circulation as affordability improves.
Lower advertising spends as % of GDP
India is having lowest ratio of advertising as % of GDP among the developed countries like US and UK and
developing countries like China.
Exhibit 12: Indian Advertising as % of GDP as compared to other countries
1.34
0.95
0.540.47
0.30
0.50
0.70
0.90
1.10
1.30
1.50
US UK China India
Adv
t. %
of
GD
P
Source : FICCI-KPMG report , KRC Research
As observed in Exhibit 8, India is having Lowest ratio as compared to other nations on back of lower per capital
income and literacy rate.
Exhibit 13: Indian Per capital income as compared to developed and developing countries
1,011 2,461
45,577 45,845
500
10,500
20,500
30,500
40,500
50,500
India China UK US
USD
Source : FICCI-KPMG report , KRC Research
However, we feel the ratio to improve going forward from 0.47% to 0.51% by 2013 on account of increasing
domestic per capita income, also evident from the fact that this ratio improved significantly from ~0.30% in 2000
to ~0.47% in 2009 as per capita income increased.

DB Corp Limited
11 KRC Equity Research
Newsprint prices
constitutes ~50% of
total operating
expenditure
The increase in the
prices for 2008 was
mainly due to choppy
currency market,
high crude oil prices
and consolidation in
the newsprint
industry
Newsprint Overview
Newsprint is the essential input used for production of printed newspapers and so its prices have direct impact on
cost of production of print media companies. Newsprint prices vary with quality; it’s a freely traded commodity
in the international markets and exhibits price volatility. India imports almost 70% of its newsprint requirement.
English newspapers generally use higher quality and mostly imported newsprint compared to the regional players
which use a mix of imported and domestic newsprint. Out of the top 3 companies in Print and Media, ratio of
Imported: Domestic newsprint use stands at 80:20 for Deccan Chronicle, 69:31 for HT Media and 80:20 for Jagran
Prakashan.
Exhibit 15: Cost structure of Print Media Industry
12.6%
31.3%
50.4%
Cost of raw material Employee Cost Other expenditure
Source : KRC Research
In 2008, Print media industry went through a tough time due to volatile global newsprint prices. In the first two
quarters of 2008 newsprint contracts were signed at $660 and $760 per tonne, which fell to $520 in the
subsequent quarter but climbed again to $960 towards the end of the year, within striking distance of the historic
high of $1,000 it hit during the last quarter of 1995. The increase in the prices was mainly due to choppy currency
market, high crude oil prices and consolidation in the newsprint industry. The effect of high newsprint prices
could be seen from the shrink in the margins of top Indian companies in Print and Media sector during last
financial year. (Refer to Exhibit 17 )
Exhibit 14: Growth in India's per capita income and Expected Advertising as % of GDP
7.0%
2.1%
5.6% 8.0%
8.2%7.6%
5.6%
8,000
13,000
18,000
23,000
28,000
FY03
FY04
FY05
FY06
FY07
FY08
FY09
Rs.
per
Capi
ta In
com
e
1.0%
2.0%3.0%
4.0%5.0%
6.0%
7.0%8.0%
9.0%
Per Capita Income Growth
0.51%0.51%
0.50%0.49%
0.48%
0.51%
0.48%
0.50%
0.52%
0.46%
0.47%
0.48%
0.49%
0.50%
0.51%
0.52%
0.53%
FY05
FY06
FY07
FY08
FY09
FY10
E
FY11
E
FY12
E
FY13
E
Adv.
% o
f G
DP
Source : FICCI-KPMG report , KRC Research

DB Corp Limited
12 KRC Equity Research
Sharp increase in
newsprint prices
would impact more
DCHL and DB Corp
than HT Media and
JPL.
Exhibit 16: Newsprint Prices
450
500
550
600
650
700
750
800
Jan-
06
May
-06
Sep-
06
Jan-
07
May
-07
Sep-
07
Jan-
08
May
-08
Sep-
08
Jan-
09
May
-09
Sep-
09
Jan-
10
Source : Bloomberg, KRC Research
Exhibit 17: Impact Analysis of Newsprint prices on Indian Companies
HT media
Particulars FY09 FY08 % Change
Newsprint Cost/MT 34,334.0 27,597.9 24.4%
Cost of Raw Material (Rs in crore) 540.2 455.8 18.5%
Total Operating expenditure ((Rs in crore) 1,148.0 963.3 19.2%
Newsprint % of Total Oper. Exp. 47.1% 47.3%
OPM (%) excluding Other income 12.7% 18.8%
NPM (%) 6.4% 12.2%
Jagran
Particulars FY09 FY08 % Change
Newsprint Cost/MT 28,897.5 25,321.3 14.1%
Cost of Raw Material (Rs in crore) 289.77 250.53 15.7%
Total Operating expenditure (Rs in crore) 666.7 585.9 13.8%
Newsprint % of Total Oper. Exp. 43.5% 42.8%
OPM (%) excluding Other income 19.0% 21.8%
NPM (%) 11.1% 13.1%
Deccan Chronicle
Particulars FY09 FY08 % Change
Newsprint Cost/MT 40,693.4 27,196.4 49.6%
Cost of Raw Material (Rs in crore) 396.6 206.3 92.2%
Total Operating expenditure (Rs in crore) 649.7 401.2 61.9%
Newsprint % of Total Oper. Exp. 61.0% 51.4%
OPM (%) excluding Other income 38.2% 67.2%
NPM (%) 17.2% 34.8%

DB Corp Limited
13 KRC Equity Research
We believe newsprint
prices to be at ~$500
- $525 tonne for FY10
and $575-$600 tonne
for FY11.
DB Corporation Limited
Particulars FY09 FY08 % Change
Newsprint Cost/MT 29,684.8 25,752.8 15.27%
Cost of Raw Material (Rs in crore) 407.4 336.5 21.07%
Total Operating expenditure (Rs in crore) 770.6 647.5 61.90%
Newsprint % of Total Oper. Exp. 52.9% 51.9%
OPM (%) excluding Other income 16.3% 22.8%
NPM (%) 7.4% 12.1%
Source : Company data , KRC Research
Outlook - Newsprint
Currently the newsprint prices are at ~6 years lows, having fallen by more than ~35% in the past 7 months. We
expect prices to remain subdued in the near future due to low demand from US market as the economy has still
not recovered from the meltdown it went through in past one and half years, increased Chinese supply in the
market as China had excess capacity due to fall in Chinese demand after Olympics and sharp fall in oil prices
which constitutes almost 20% of new print cost. We believe newsprint prices to be at ~$500 - $525 tonne for FY10
and $575-600 tonne for FY11. Any sharp bounce back would impact operating performance of DCHL and DB Corp
more than Jagran and HT Media because of higher % of raw material as operating expenditure.
Exhibit 18: Growth Drivers and Key Challenges for Print Industry
Growth Drivers Key Challenges
Sustained growth in advertisement revenues due to increased
advertising spends by the emerging sectors such as Education,
Organized Retail and Telecom
Increased competition from news channel as well as
new media like internet and mobile
Improving literacy rate Adverse impact on advertising revenue due to
economic slowdown
Optimization of cover prices leading to improved penetration
and growth in sales volumes Continuous rise in newsprint costs
More launches in the niche segment like newspaper supplement
and specialty magazines, by players
Continuing decline in readership figures, especially in
case of magazines
Source : FICCI- PWC , KRC Research

DB Corp Limited
14 KRC Equity Research
Radio advertising
spends account for
~1.4% of the global
advertising spends
and 3.79% of the
total advertising
spends in India.
Radio Industry
Radio advertising spends account for ~1.4% of the global advertising spends and 3.79% of the total advertising
spends in India. Over the past three years, radio industry has registered a CAGR of 19.7%, growing to Rs 840 crore
in CY08, propelled by the emergence of the private FM industry in India.
Radio as a business segment became viable only after the implementation of Phase 2 of radio policy. In phase 2,
government rationalized the licensing fee by fixing it at 4% of the gross revenues (or 10% of the Reserve OTEF,
whichever was higher), before this policy change there were only 21 private stations operational but after this it
has increased to ~ 248 stations. According to KPMG FICCI report, radio industry is expected to register 5 year
CAGR of 14.2% to Rs 1,630 crore by CY13.
Exhibit 20: Growth Drivers and Key Challenges for Radio Industry
Growth Drivers Key Challenges
Increase in the number of radio stations, ~700 new licenses
expected to be issued to Private FM stations in Phase 3
Adverse impact on revenue due to a possibly prolonged
slowdown in the economy
Expected regulatory reforms that are likely to improve
profitability and stimulate foreign investments.
Overcrowding of FM stations especially in metros and
inability/reluctance of the stations to differentiate in terms
of content
Emergence of robust audience measurement tools which
could further catalyze growth in radio advertising spends Stiff competition from print for local advertisements
Growth in locally targeted advertising on radio
Source : FICCI- PWC , KRC Research
Exhibit 19: Radio market share to increase from 3.8% in 2008 to 4.1% over next 5 years
2.8%
3.8%
7.3%37.2%
48.9%
Television Print
Radio Internet Advertising
O utdoor
43.9%
39.2%7.4%
4.1%
5.4%
Television Print
Radio Internet Advertising
Outdoor
DB Corp Limited
15 KRC Equity Research
Sub-urban population
in Tier-II and Tier-III
cities has registered
higher 4-CAGR of
3.5% Vs 2.2% in Tier-I
cities
Ratio of English
advertising rates over
Hindi has decline
from 12x to 9x in last
5 years.
Investment Rationale
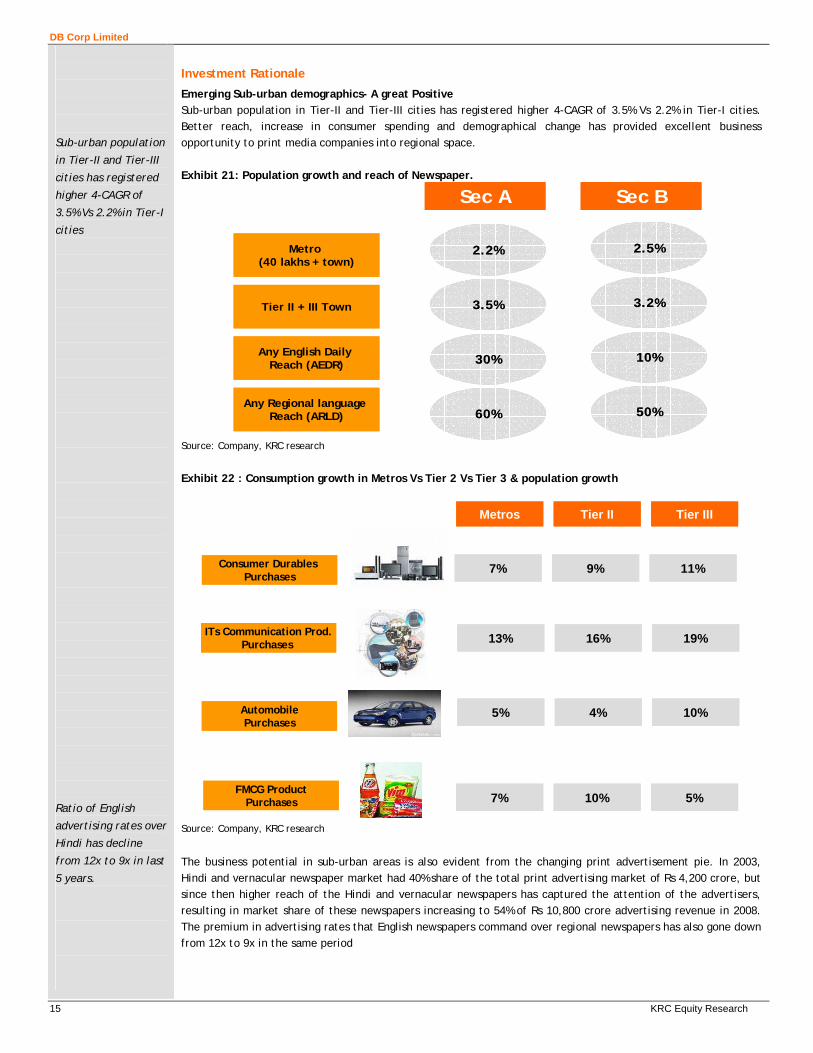
Emerging Sub-urban demographics- A great Positive Sub-urban population in Tier-II and Tier-III cities has registered higher 4-CAGR of 3.5% Vs 2.2% in Tier-I cities. Better reach, increase in consumer spending and demographical change has provided excellent business opportunity to print media companies into regional space. Exhibit 21: Population growth and reach of Newspaper.
Sec A Sec B
Metro (40 lakhs + town)
Tier II + III Town
Any English Daily Reach (AEDR)
Any Regional language Reach (ARLD)
2.2%
3.5%
30%
60%
2.5%
3.2%
10%
50%
Sec A Sec B
Metro (40 lakhs + town)
Tier II + III Town
Any English Daily Reach (AEDR)
Any Regional language Reach (ARLD)
2.2%
3.5%
30%
60%
2.5%
3.2%
10%
50%
Source: Company, KRC research
Exhibit 22 : Consumption growth in Metros Vs Tier 2 Vs Tier 3 & population growth
Consumer Durables Purchases
ITs Communication Prod.Purchases
AutomobilePurchases
FMCG ProductPurchases
Metros Tier II Tier III
7% 9% 11%
13% 16% 19%
5% 4% 10%
7% 10% 5%
Consumer Durables Purchases
ITs Communication Prod.Purchases
AutomobilePurchases
FMCG ProductPurchases
Metros Tier II Tier III
7% 9% 11%
13% 16% 19%
5% 4% 10%
7% 10% 5%
Source: Company, KRC research
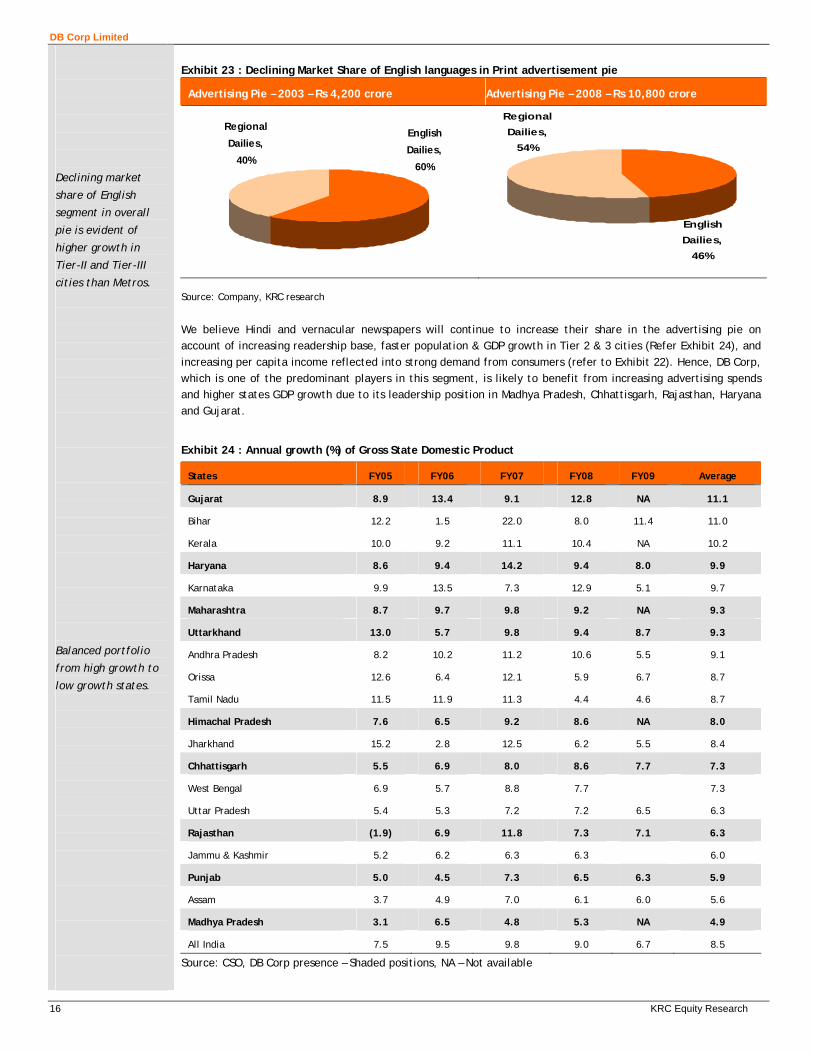
The business potential in sub-urban areas is also evident from the changing print advertisement pie. In 2003, Hindi and vernacular newspaper market had 40% share of the total print advertising market of Rs 4,200 crore, but since then higher reach of the Hindi and vernacular newspapers has captured the attention of the advertisers, resulting in market share of these newspapers increasing to 54% of Rs 10,800 crore advertising revenue in 2008. The premium in advertising rates that English newspapers command over regional newspapers has also gone down from 12x to 9x in the same period
DB Corp Limited
16 KRC Equity Research
Declining market
share of English
segment in overall
pie is evident of
higher growth in
Tier-II and Tier-III
cities than Metros.
Balanced portfolio
from high growth to
low growth states.
Exhibit 23 : Declining Market Share of English languages in Print advertisement pie
Advertising Pie – 2003 – Rs 4,200 crore Advertising Pie – 2008 – Rs 10,800 crore
English
Dailies,
60%
Regional
Dailies,
40%
Regional
Dailies,
54%
English
Dailies,
46%
Source: Company, KRC research
We believe Hindi and vernacular newspapers will continue to increase their share in the advertising pie on account of increasing readership base, faster population & GDP growth in Tier 2 & 3 cities (Refer Exhibit 24), and increasing per capita income reflected into strong demand from consumers (refer to Exhibit 22). Hence, DB Corp, which is one of the predominant players in this segment, is likely to benefit from increasing advertising spends and higher states GDP growth due to its leadership position in Madhya Pradesh, Chhattisgarh, Rajasthan, Haryana and Gujarat.
Exhibit 24 : Annual growth (%) of Gross State Domestic Product
States FY05 FY06 FY07 FY08 FY09 Average
Gujarat 8.9 13.4 9.1 12.8 NA 11.1
Bihar 12.2 1.5 22.0 8.0 11.4 11.0
Kerala 10.0 9.2 11.1 10.4 NA 10.2
Haryana 8.6 9.4 14.2 9.4 8.0 9.9
Karnataka 9.9 13.5 7.3 12.9 5.1 9.7
Maharashtra 8.7 9.7 9.8 9.2 NA 9.3
Uttarkhand 13.0 5.7 9.8 9.4 8.7 9.3
Andhra Pradesh 8.2 10.2 11.2 10.6 5.5 9.1
Orissa 12.6 6.4 12.1 5.9 6.7 8.7
Tamil Nadu 11.5 11.9 11.3 4.4 4.6 8.7
Himachal Pradesh 7.6 6.5 9.2 8.6 NA 8.0
Jharkhand 15.2 2.8 12.5 6.2 5.5 8.4
Chhattisgarh 5.5 6.9 8.0 8.6 7.7 7.3
West Bengal 6.9 5.7 8.8 7.7 7.3
Uttar Pradesh 5.4 5.3 7.2 7.2 6.5 6.3
Rajasthan (1.9) 6.9 11.8 7.3 7.1 6.3
Jammu & Kashmir 5.2 6.2 6.3 6.3 6.0
Punjab 5.0 4.5 7.3 6.5 6.3 5.9
Assam 3.7 4.9 7.0 6.1 6.0 5.6
Madhya Pradesh 3.1 6.5 4.8 5.3 NA 4.9
All India 7.5 9.5 9.8 9.0 6.7 8.5
Source: CSO, DB Corp presence – Shaded positions, NA – Not available
DB Corp Limited
17 KRC Equity Research
Cross selling
opportunities arises
because of presence
in internet and radio
other than Print.
24% of total urban
and semi-urban
populations of India
are located in
Bhaskar’s Market.
Gap between No. 1
and No.2 is narrowing
down in the states
where DB Corp is at
No.2.
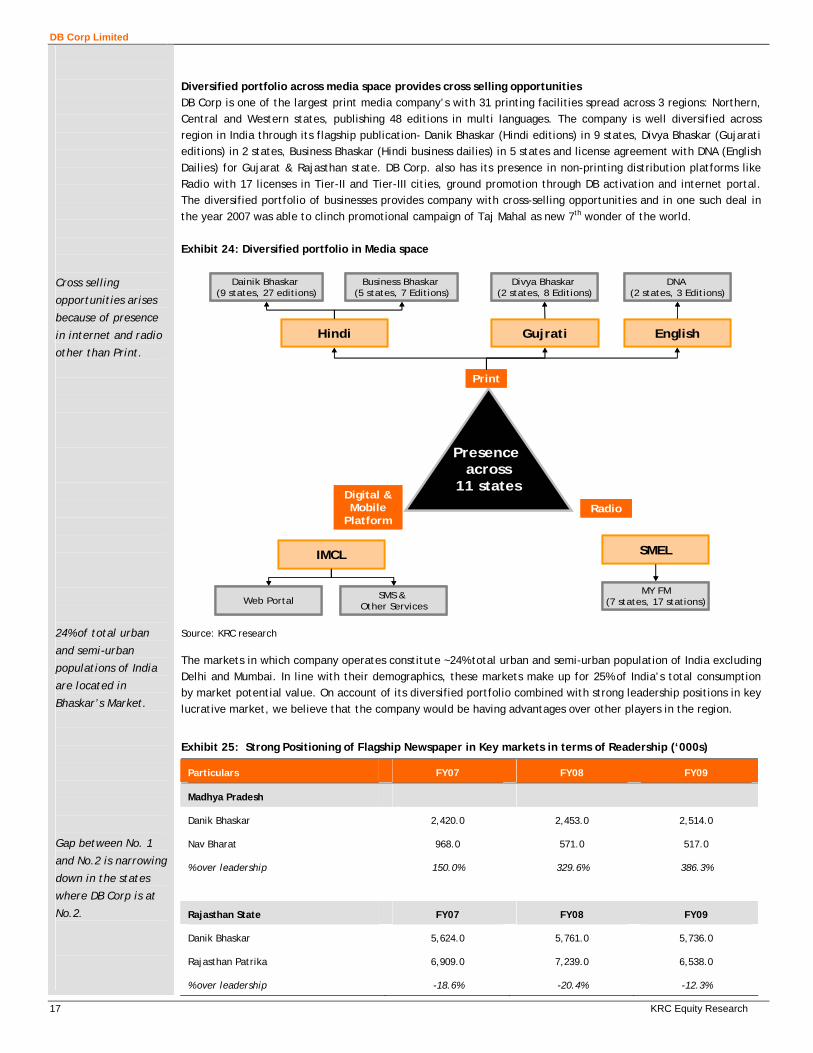
Diversified portfolio across media space provides cross selling opportunities DB Corp is one of the largest print media company’s with 31 printing facilities spread across 3 regions: Northern, Central and Western states, publishing 48 editions in multi languages. The company is well diversified across region in India through its flagship publication- Danik Bhaskar (Hindi editions) in 9 states, Divya Bhaskar (Gujarati editions) in 2 states, Business Bhaskar (Hindi business dailies) in 5 states and license agreement with DNA (English Dailies) for Gujarat & Rajasthan state. DB Corp. also has its presence in non-printing distribution platforms like Radio with 17 licenses in Tier-II and Tier-III cities, ground promotion through DB activation and internet portal. The diversified portfolio of businesses provides company with cross-selling opportunities and in one such deal in the year 2007 was able to clinch promotional campaign of Taj Mahal as new 7th wonder of the world. Exhibit 24: Diversified portfolio in Media space
Presence across
11 statesDigital & Mobile
Platform
Radio
Hindi Gujrati English
Dainik Bhaskar (9 states, 27 editions)
Business Bhaskar (5 states, 7 Editions)
Web Portal SMS & Other Services
IMCL
MY FM(7 states, 17 stations)
SMEL
Divya Bhaskar (2 states, 8 Editions)
DNA (2 states, 3 Editions)
Presence across
11 statesDigital & Mobile
Platform
Radio
Hindi Gujrati English
Dainik Bhaskar (9 states, 27 editions)
Business Bhaskar (5 states, 7 Editions)
Web Portal SMS & Other Services
IMCL
MY FM(7 states, 17 stations)
SMEL
Divya Bhaskar (2 states, 8 Editions)
DNA (2 states, 3 Editions)
Source: KRC research The markets in which company operates constitute ~24% total urban and semi-urban population of India excluding Delhi and Mumbai. In line with their demographics, these markets make up for 25% of India’s total consumption by market potential value. On account of its diversified portfolio combined with strong leadership positions in key lucrative market, we believe that the company would be having advantages over other players in the region.
Exhibit 25: Strong Positioning of Flagship Newspaper in Key markets in terms of Readership (‘000s)
Particulars FY07 FY08 FY09
Madhya Pradesh
Danik Bhaskar 2,420.0 2,453.0 2,514.0
Nav Bharat 968.0 571.0 517.0
% over leadership 150.0% 329.6% 386.3%
Rajasthan State FY07 FY08 FY09
Danik Bhaskar 5,624.0 5,761.0 5,736.0
Rajasthan Patrika 6,909.0 7,239.0 6,538.0
% over leadership -18.6% -20.4% -12.3%

DB Corp Limited
18 KRC Equity Research
Gap between No. 1
and No.2 is widening
in the states where
DB Corp is leader.
Well spreaded across
30 cities with 31
printing facilities and
total installed
capacity of 1.94
million per hour.
Chhattisgarh State FY07 FY08 FY09
Danik Bhaskar 5,624.0 5,761.0 5,736.0
Nav Bharat 740.0 864.0 687.0
% over leadership 660.0% 566.8% 734.9%
Haryana State FY07 FY08 FY09
Danik Bhaskar 1,478.0 1,320.0 1,335.0
Danik Jagran 957.0 925.0 920.0
% over leadership 54.4% 42.7% 45.1%
Union territory of Chandigarh FY07 FY08 FY09
Danik Bhaskar 216.0 218.0 199.0
Tribune 87.0 68.0 84.0
% over leadership 148.3% 220.6% 136.9%
Punjab Kesari 31 31 23
% over leadership 596.8% 603.2% 765.2%
Source: Company, KRC research
Well connected to end users and advertisers DB Corp is well spread across 30 cities with 31 printing facilities and total installed capacity of ~1.94 million copies per hour. The company also performs Job work to utilize excess capacity leading to better capacity utilizations; this combined with strong infrastructure helps the company to charge lower average cover prices of Rs 2.5 and higher pagination of 20.5 pages as compared to industry average Rs 3.75 and pagination of 20 pages.
Exhibit 26: Printing Facilities and Installed Capacity
Printing Plants (Total – 31 printing Capacity) Installed Capacity (Total – 1.94 millions/ hour)
Rajasthan
, 12
MPCG, 7Gujarat, 7
PCH, 5
Rajasthan,
0.64
MPCG, 0.49
Gujarat,
0.43
PCH, 0.38
Source: Company, KRC research, MPCG – Madhya Pradesh and Chhattisgarh, PCH – Punjab, Chandigarh, Haryana
They are well connected to end users through strong distribution network with 74 distribution centers, 3,263
agents, 3,650 sub-agents, 18,709 vendors and 12,937 sub-vendors as of September 30, 2009. Because of its strong
distribution network platform they are able to register much faster growth than any other Hindi daily in terms of
readership. (Refer to Exhibit). In span of 10 years, company has registered a readership growth of 384% to 15.5
million. The readership base was expanded on back of increase in its presence from 1 state to 11 states, edition
from 11 to 48 and languages from 1 to 3. Over the years, the company has also developed strong credentials with
large number of advertisement agencies which helps the company achieve high ad-revenue growth.
DB Corp Limited
19 KRC Equity Research
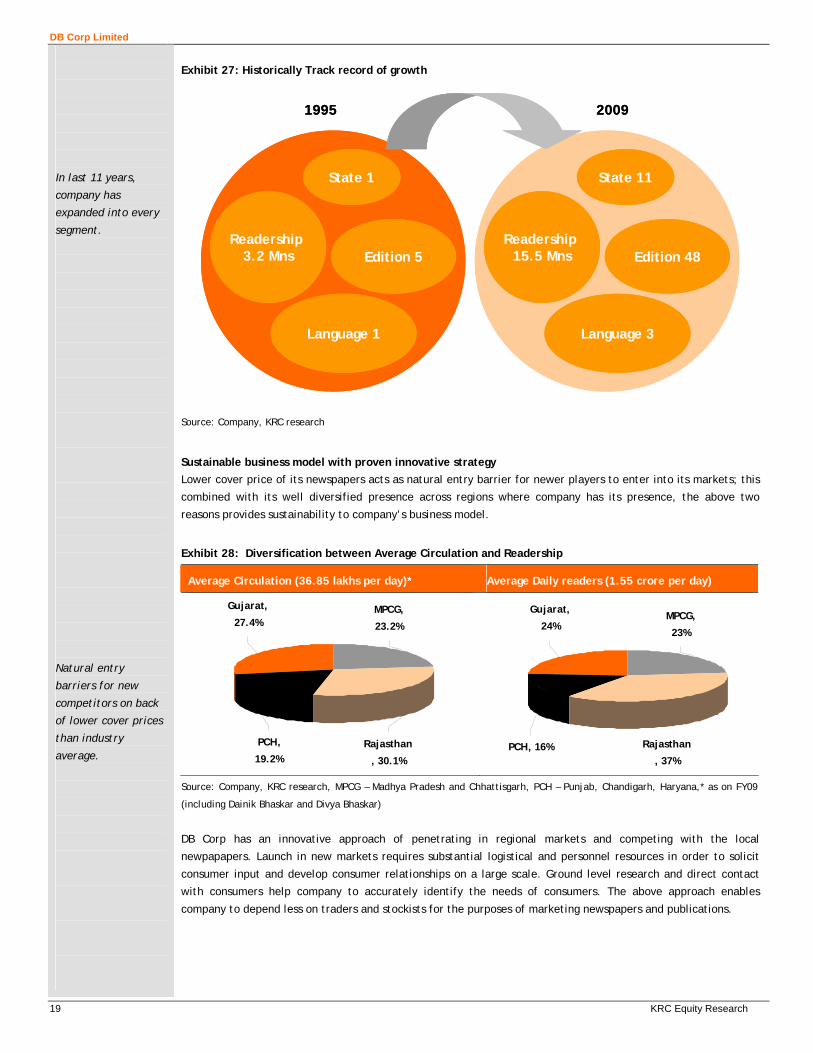
In last 11 years,
company has
expanded into every
segment.
Natural entry
barriers for new
competitors on back
of lower cover prices
than industry
average.
Exhibit 27: Historically Track record of growth
State 1
Edition 5
Language 1
Readership 3.2 Mns
State 11
Edition 48
Language 3
Readership 15.5 Mns
1995 2009
State 1
Edition 5
Language 1
Readership 3.2 Mns
State 1
Edition 5
Language 1
Readership 3.2 Mns
State 11
Edition 48
Language 3
Readership 15.5 Mns
State 11
Edition 48
Language 3
Readership 15.5 Mns
1995 2009
Source: Company, KRC research
Sustainable business model with proven innovative strategy Lower cover price of its newspapers acts as natural entry barrier for newer players to enter into its markets; this
combined with its well diversified presence across regions where company has its presence, the above two
reasons provides sustainability to company’s business model.
Exhibit 28: Diversification between Average Circulation and Readership
Average Circulation (36.85 lakhs per day)* Average Daily readers (1.55 crore per day)
PCH,
19.2%
Gujarat,
27.4%MPCG,
23.2%
Rajasthan
, 30.1%
Rajasthan
, 37%
MPCG,
23%
Gujarat,
24%
PCH, 16%
Source: Company, KRC research, MPCG – Madhya Pradesh and Chhattisgarh, PCH – Punjab, Chandigarh, Haryana,* as on FY09
(including Dainik Bhaskar and Divya Bhaskar)
DB Corp has an innovative approach of penetrating in regional markets and competing with the local
newpapapers. Launch in new markets requires substantial logistical and personnel resources in order to solicit
consumer input and develop consumer relationships on a large scale. Ground level research and direct contact
with consumers help company to accurately identify the needs of consumers. The above approach enables
company to depend less on traders and stockists for the purposes of marketing newspapers and publications.

DB Corp Limited
20 KRC Equity Research
Proven innovative
strategy to penetrate
newer markets.
Gujarat, an example
of proven innovative
strategy and case
study for IIM-A.
Exhibit 29: Launch Strategy in New Markets
Stage 1Stage 1 Conducting Market Research
General Market Data
Competition Analysis
Comprehensive analysis on End users
Analysis of existing Newspaper editions
Readership gap between No.1 and No.2
Door-to-door contact Programme to design their dream newspaper
Creating awareness & need of newspapers
Stage 2Stage 2 Preparation of semi furnish product
Preparing the outline and design of the newspaper according to need of end users
Feedback of end-users on the outline newspaper
Stage 3Stage 3 Marketing & Launch Campaign
Advertising through various media platforms and creating Brand Awareness of DB Corp edition.
Pre-launch order booking by having door-to-door contact programme and attractive pricing
LAUNCHLAUNCH
Source: Company, KRC research The success of this strategy is very clear with their growth story in Gujarat, where company has received a pre-
launch conformation for 4.52 lakhs copies from very first day, thus making Divya Bhaskar the No.1 from the day
of its launch. They are not only aggressive on day of launch but it clocked a 32% increase in readership, within a
span of 3 years. Traditionally, we have observed in print industry, that national players used to operate in their
core market segments, however, the DB Corp was the first listed entity to break the tradition and penetrate the
Gujarat market which was dominated by Gujarat Samachar, an 80 years old edition. So, we believe company’s
innovative strategy and lower cover price provides it an edge over other regional players to penetrate in to new
markets.
DB Corp Limited
21 KRC Equity Research
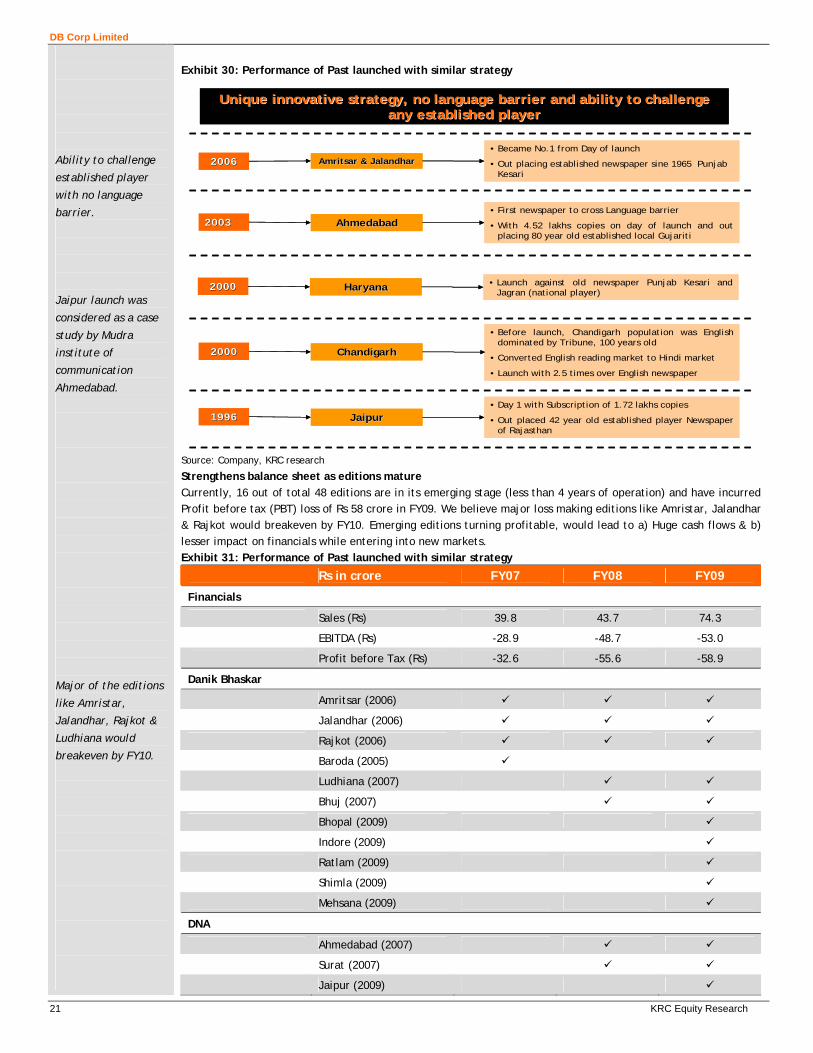
Ability to challenge
established player
with no language
barrier.
Jaipur launch was
considered as a case
study by Mudra
institute of
communication
Ahmedabad.
Major of the editions
like Amristar,
Jalandhar, Rajkot &
Ludhiana would
breakeven by FY10.
Exhibit 30: Performance of Past launched with similar strategy
20062006 Amritsar & JalandharAmritsar & Jalandhar• Became No.1 from Day of launch
• Out placing established newspaper sine 1965 Punjab Kesari
20032003 AhmedabadAhmedabad• First newspaper to cross Language barrier
• With 4.52 lakhs copies on day of launch and out placing 80 year old established local Gujariti
20002000 HaryanaHaryana • Launch against old newspaper Punjab Kesari and Jagran (national player)
20002000 ChandigarhChandigarh
• Before launch, Chandigarh population was English dominated by Tribune, 100 years old
• Converted English reading market to Hindi market
• Launch with 2.5 times over English newspaper
19961996 JaipurJaipur• Day 1 with Subscription of 1.72 lakhs copies
• Out placed 42 year old established player Newspaper of Rajasthan
Unique innovative strategy, no language barrier and ability to cUnique innovative strategy, no language barrier and ability to challenge hallenge any established playerany established player
Source: Company, KRC research
Strengthens balance sheet as editions mature Currently, 16 out of total 48 editions are in its emerging stage (less than 4 years of operation) and have incurred Profit before tax (PBT) loss of Rs 58 crore in FY09. We believe major loss making editions like Amristar, Jalandhar & Rajkot would breakeven by FY10. Emerging editions turning profitable, would lead to a) Huge cash flows & b) lesser impact on financials while entering into new markets. Exhibit 31: Performance of Past launched with similar strategy
Rs in crore FY07 FY08 FY09
Financials
Sales (Rs) 39.8 43.7 74.3
EBITDA (Rs) -28.9 -48.7 -53.0
Profit before Tax (Rs) -32.6 -55.6 -58.9
Danik Bhaskar
Amritsar (2006)
Jalandhar (2006)
Rajkot (2006)
Baroda (2005)
Ludhiana (2007)
Bhuj (2007)
Bhopal (2009)
Indore (2009)
Ratlam (2009)
Shimla (2009)
Mehsana (2009)
DNA
Ahmedabad (2007)
Surat (2007)
Jaipur (2009)

DB Corp Limited
22 KRC Equity Research
Valued company on
sum-of-total-parts,
arriving at target
price of Rs 278,
representing upside
potential of 18.3%
We have used FCFE
model for valuation
with cost of equity of
12% and terminal
growth rate of 3%.
Business Bhaskar 2009
Valuation
DB corp, part of diversified business conglomerate Bhaskar group, has presence into Print, Radio, Internet and Event management. We have valued the company using SOTP methodology dividing the business into two parts core (Print) and non-core business. Further, core business is valued by DCF & Price earning, giving equal weight and non-core business by EV/licenses. (Refer to Exhibit 32) At the CMP of Rs 235, the stock is trading at 16.9x FY11E EPS of 13.9 and 17.0x FY12 P/E EPS of Rs 13.8. We initiate our coverage on DB Corp assigning a BUY rating to the stock with 12-month target price of Rs 278.0, based on our SOTP valuation, representing upside potential of 18.3%.
Exhibit 32:Sum-Of-The-Parts Valuation
Business Methodology Weight Value (Rs in
Crore) Value/Share Remark
Print Media DCF 50.0% 2,349.7 129.4 4 stage FCFE growth model with cost of
equity 12% and terminal growth of 3%
P/E 50.0% 2,606.7 143.6 Valued 20x on FY11E EPS, premium to
global peers.
Radio EV/Licenses 87.0 4.8 50% discount to ENIL EV/Licenses of
FY12
SOTP Value 278.0
CMP (Rs) 235.0
Upside/
Downside (%) 18.3%
Exhibit 33: Free Cash Flow to Equity
Particulars FY11E FY12E FY13E FY14E FY15E
Net income 260.7 315.4 370.5 430.4 494.2
Add: Depreciation & Amortization 42.0 47.6 46.1 43.6 41.2
Operating cash flow before change in WC 302.6 363.0 416.6 474.0 535.4
Change in Working capital -29.1 -8.7 -7.4 -6.9 -2.8
Capital expenditure 68.9 41.6 10.0 10.0 10.0
Debt/repayment issued -73.4 -35.9 -35.9 -35.9 -24.4
Internet losses -5.0 -5.0 -5.0 -5.0 -5.0
Free cash flow to Equity (FCFE) 264.0 355.0 378.3 436.2 513.2
Present Value of FCFE 235.8 283.1 269.4 277.4 291.5
Cost of Equity (Ke) 12.0%
Terminal growth rate 3.0%
Sum - PV of FCFE (Rs in crore) 1357.2
PV of terminal Value (Rs in crore) 3342.2
Total Value (Rs in crore) 4699.4
No of Shares outstanding (in crore) 18.2
Value per Share 258.9
Source: KRC research

DB Corp Limited
23 KRC Equity Research
Key Risks
Newsprint Prices Newsprint is an essential input used in production of printed newspapers, ~ which had accounts ~53% of total operating expenditure. So, any sharp increase in Newsprint prices going forward would negatively impact the margins of DB corp. However, we do not expect any sharp movement in raw material prices as FY09 because of excess capacity within European countries and competition from Canadian & Russian manufactures Slowdown in Ad Revenue Growth An economic slowdown could slow growth in print ad revenue, which will impact our estimates. Further a shift in ad spends from Print to TV or any other media could impact DB Corp negatively. Delay in breakeven of emerging editions We had expected emerging edition to breakeven by FY11, if not, then this would further impact on margins & ROE, while entering into new markets

DB Corp Limited
24 KRC Equity Research
Operating revenue
expected to register
15.0% CAGR from Rs
920.6 crore in F09 to
Rs 1,218 crore in
FY121
The CAGR growth of
15.0% mainly driven
from advertising
segment, expected to
register 16.3% CAGR
to Rs 943.9 crore in
FY11.
In FY10, profit grew
expected to increase
by 3 times mainly on
account of lower
newsprint prices and
16 editions incurring
lower losses.
Operating margin to
sustain at current
levels, higher growth
in Bhaskar’s markets
with improvement in
advertisement space.
Higher equity base
and repayment of
Debt lead D/E ratio
declined from 1.64 in
FY09 to 0.31in FY10.
Financial Outlook
Exhibit 34: Revenue Mix Exhibit 35: Operational performance
76%
20%
4%
Advertisement Circulation Other Operating
-
300
600
900
1,200
1,500
FY09
FY10
E
FY11
E
FY12
E
Rs i
n cr
ore
Operating Income EBITDA PAT
Exhibit 36: Segmental Performance (y-o-y growth) Exhibit 37: % y-o-y Change in Revenue, EBITDA and PAT
0.0%
5.0%
10.0%
15.0%
20.0%
25.0%
30.0%
35.0%
40.0%
45.0%
FY09
FY10
E
FY11
E
FY12
E
Advertising Income Circulation income Other operating income
-50.0%
0.0%
50.0%
100.0%
150.0%
200.0%
250.0%
FY09
FY10
E
FY11
E
FY12
E
Operating Income EBITDA PAT
Exhibit 38: Cost Structure Exhibit 39: Profitability
0.0%
20.0%
40.0%
60.0%
80.0%
100.0%
FY09
FY10
E
FY11
E
FY12
E
Raw Material Consumed Operating ExpensesPersonnel Expenses Admin, Selling ExpensesOther expenses
16.3%
35.4% 35.6% 36.2%
7.5%
20.4% 21.4% 22.2%
0.0%
5.0%
10.0%
15.0%
20.0%
25.0%
30.0%
35.0%
40.0%
FY09 FY10E FY11E FY12E
OPM (%) NPM(%)
Exhibit 40: ROE Vs ROCE Exhibit 41: Leverage
23.5%
38.0%
28.1% 26.6%
19.5%
37.0% 35.5% 35.9%
0.0%
5.0%
10.0%
15.0%
20.0%
25.0%
30.0%
35.0%
40.0%
FY09
FY10
E
FY11
E
FY12
E
ROE (%) ROCE (%)
1.64
0.170.100.31
4.41
12.22
26.98
45.12
0.00
0.20
0.40
0.60
0.80
1.00
1.20
1.40
1.60
1.80
FY09
FY10
E
FY11
E
FY12
E
0.00
5.00
10.00
15.00
20.00
25.00
30.00
35.00
40.00
45.00
50.00
Debt/Equity (x) Interest Coverage ratio (x)
DB Corp Limited
25 KRC Equity Research
Source: KRC Research
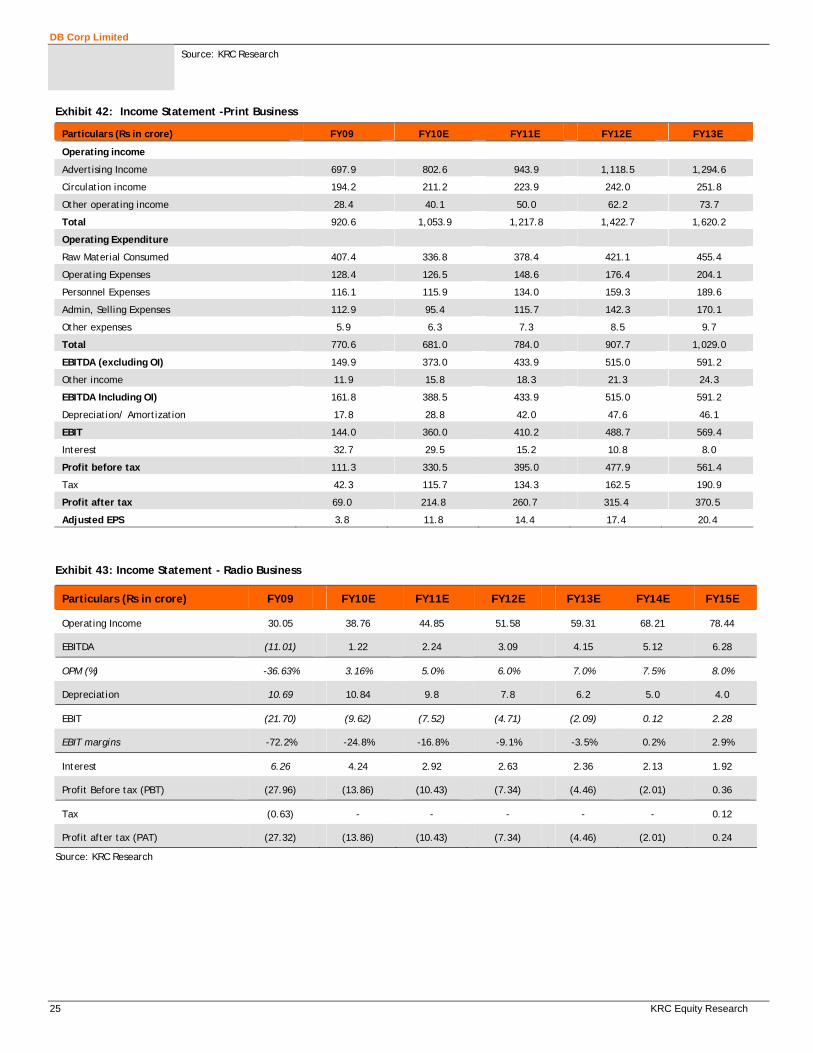
Exhibit 42: Income Statement -Print Business
Particulars (Rs in crore) FY09 FY10E FY11E FY12E FY13E
Operating income
Advertising Income 697.9 802.6 943.9 1,118.5 1,294.6
Circulation income 194.2 211.2 223.9 242.0 251.8
Other operating income 28.4 40.1 50.0 62.2 73.7
Total 920.6 1,053.9 1,217.8 1,422.7 1,620.2
Operating Expenditure
Raw Material Consumed 407.4 336.8 378.4 421.1 455.4
Operating Expenses 128.4 126.5 148.6 176.4 204.1
Personnel Expenses 116.1 115.9 134.0 159.3 189.6
Admin, Selling Expenses 112.9 95.4 115.7 142.3 170.1
Other expenses 5.9 6.3 7.3 8.5 9.7
Total 770.6 681.0 784.0 907.7 1,029.0
EBITDA (excluding OI) 149.9 373.0 433.9 515.0 591.2
Other income 11.9 15.8 18.3 21.3 24.3
EBITDA Including OI) 161.8 388.5 433.9 515.0 591.2
Depreciation/ Amortization 17.8 28.8 42.0 47.6 46.1
EBIT 144.0 360.0 410.2 488.7 569.4
Interest 32.7 29.5 15.2 10.8 8.0
Profit before tax 111.3 330.5 395.0 477.9 561.4
Tax 42.3 115.7 134.3 162.5 190.9
Profit after tax 69.0 214.8 260.7 315.4 370.5
Adjusted EPS 3.8 11.8 14.4 17.4 20.4
Exhibit 43: Income Statement - Radio Business
Particulars (Rs in crore) FY09 FY10E FY11E FY12E FY13E FY14E FY15E
Operating Income 30.05 38.76 44.85 51.58 59.31 68.21 78.44
EBITDA (11.01) 1.22 2.24 3.09 4.15 5.12 6.28
OPM (%) -36.63% 3.16% 5.0% 6.0% 7.0% 7.5% 8.0%
Depreciation 10.69 10.84 9.8 7.8 6.2 5.0 4.0
EBIT (21.70) (9.62) (7.52) (4.71) (2.09) 0.12 2.28
EBIT margins -72.2% -24.8% -16.8% -9.1% -3.5% 0.2% 2.9%
Interest 6.26 4.24 2.92 2.63 2.36 2.13 1.92
Profit Before tax (PBT) (27.96) (13.86) (10.43) (7.34) (4.46) (2.01) 0.36
Tax (0.63) - - - - - 0.12
Profit after tax (PAT) (27.32) (13.86) (10.43) (7.34) (4.46) (2.01) 0.24
Source: KRC Research

DB Corp Limited
26 KRC Equity Research
Exhibit 44: Balance Sheet
Particulars (Rs in crore) FY09 FY10E FY11E FY12E FY13E
Sources of Fund
Share capital 168.8 181.5 181.5 181.5 181.5
Reserve & Surplus 154.4 625.2 864.6 1148.2 1476.2
Net worth 323.2 806.7 1046.1 1329.7 1657.7
Secured Loan 509.6 226.7 153.4 117.4 81.5
Unsecured loan 21.9 21.9 21.9 21.9 21.9
Deferred tax liab. 39.3 39.3 39.3 39.3 39.3
Total 893.9 1094.6 1260.7 1508.3 1800.4
Application of Fund
Gross Fixed Assets 358.9 610.9 815.2 856.8 866.8
Less: Accum Depn 73.6 102.4 144.4 192.0 238.1
Net block 285.3 508.5 670.9 664.8 628.7
Capital WIP 270.8 135.4 0.0 0.0 0.0
Investments 94.3 123.3 143.6 170.2 200.2
Current Assets
Inventories 71.1 78.8 90.9 106.0 120.5
Sundry Debtors 170.1 199.2 229.4 267.0 302.9
Cash and Bank Balances 40.3 70.1 159.7 378.2 669.0
Loan and advances 147.5 172.5 194.5 194.5 194.5
Sub-total 429.0 520.7 674.5 945.7 1287.0
Current liability & Prov.
Current Liability 168.9 171.1 199.4 234.9 269.7
Provisions 38.3 43.9 50.7 59.3 67.5
Net Current Assets 221.7 305.7 424.5 651.6 949.8
Mis Expenditure 21.7 21.7 21.7 21.7 21.7
Total 893.9 1094.6 1260.7 1508.3 1800.4
Exhibit 45: Cash Flow Statement
Particulars (Rs in crore) FY09 FY10E FY11E FY12E FY13E
CF flow from Operating activities
Earning Before tax 111.3 330.5 395.0 477.9 561.4
Add: Interest 32.7 29.5 15.2 10.8 8.0
Add: Depreciation 17.8 28.8 42.0 47.6 46.1
Cash before chg in WC 152.7 388.8 452.1 536.3 615.5
Inc./Dec. in Debtors -2.0 -29.1 -30.2 -37.6 -35.9
Inc./Dec. in Inventories -3.9 -7.7 -12.1 -15.1 -14.5
Inc./Dec. in other CA -21.6 -25.0 -22.0 0.0 0.0
Inc./Dec. in CL 21.3 30.5 28.3 35.5 34.8
Inc/ Dec in Provisions 0.6 5.6 6.8 8.5 8.2
Taxes Paid -34.5 -115.7 -134.3 -162.5 -190.9
Sub- Total 112.5 247.2 288.7 365.2 417.2
Cash Flow from Investing Activities
Sale/(Purch) of investments -17.7 -28.9 -20.4 -26.5 -30.0
Sale/(Purch) of Fixed Assets -292.3 -116.6 -68.9 -41.6 -10.0
Sub- Total -289.59 -145.5 -89.3 -68.1 -40.0
Cash Flow from Financing Activities
Interest Payments -32.7 -29.5 -15.2 -10.8 -8.0
Equity Raised 0.0 240.4 0.0 0.0 0.0
Debt raised/ (repayments) 228.6 -282.8 -73.4 -35.9 -35.9
Dividend paid -9.9 0.0 -21.2 -31.9 -42.5
Sub- Total 177.3 -71.9 -109.8 -78.6 -86.3
Net changes in Cash & Cash equivalents 0.3 29.8 89.6 218.5 290.8
DB Corp Limited
27 KRC Equity Research
Opening Balance 33.8 40.3 70.1 159.7 378.2
Closing balance 40.3 70.1 159.7 378.2 669.0
Source: KRC Research
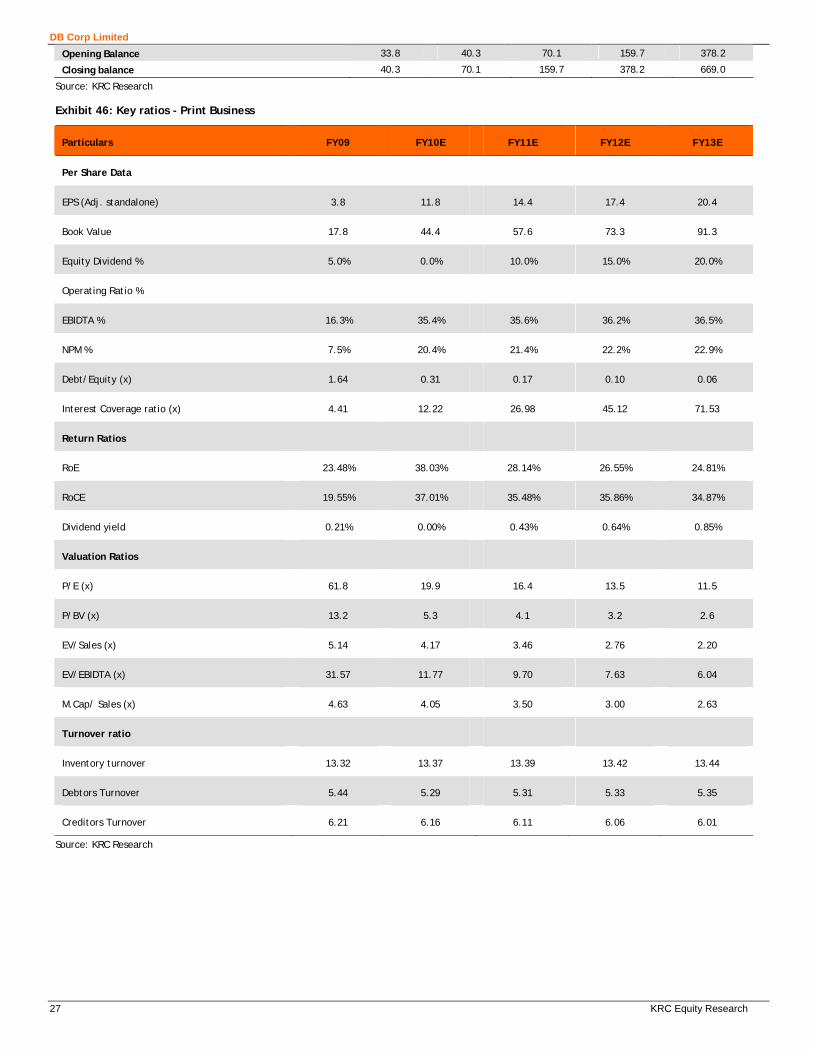
Exhibit 46: Key ratios - Print Business
Particulars FY09 FY10E FY11E FY12E FY13E
Per Share Data
EPS (Adj. standalone) 3.8 11.8 14.4 17.4 20.4
Book Value 17.8 44.4 57.6 73.3 91.3
Equity Dividend % 5.0% 0.0% 10.0% 15.0% 20.0%
Operating Ratio %
EBIDTA % 16.3% 35.4% 35.6% 36.2% 36.5%
NPM % 7.5% 20.4% 21.4% 22.2% 22.9%
Debt/Equity (x) 1.64 0.31 0.17 0.10 0.06
Interest Coverage ratio (x) 4.41 12.22 26.98 45.12 71.53
Return Ratios
RoE 23.48% 38.03% 28.14% 26.55% 24.81%
RoCE 19.55% 37.01% 35.48% 35.86% 34.87%
Dividend yield 0.21% 0.00% 0.43% 0.64% 0.85%
Valuation Ratios
P/E (x) 61.8 19.9 16.4 13.5 11.5
P/BV (x) 13.2 5.3 4.1 3.2 2.6
EV/Sales (x) 5.14 4.17 3.46 2.76 2.20
EV/EBIDTA (x) 31.57 11.77 9.70 7.63 6.04
M.Cap/ Sales (x) 4.63 4.05 3.50 3.00 2.63
Turnover ratio
Inventory turnover 13.32 13.37 13.39 13.42 13.44
Debtors Turnover 5.44 5.29 5.31 5.33 5.35
Creditors Turnover 6.21 6.16 6.11 6.06 6.01
Source: KRC Research
DB Corp Limited
28 KRC Equity Research
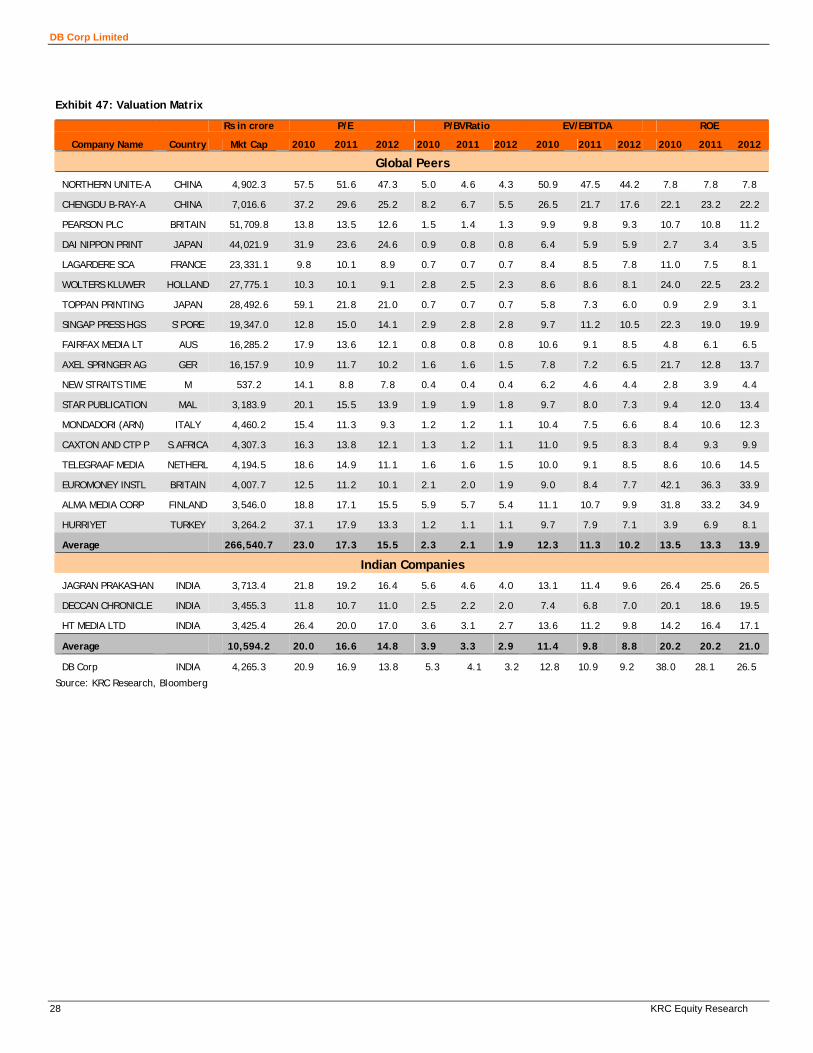
Exhibit 47: Valuation Matrix
Rs in crore P/E P/BVRatio EV/EBITDA ROE
Company Name Country Mkt Cap 2010 2011 2012 2010 2011 2012 2010 2011 2012 2010 2011 2012
Global Peers
NORTHERN UNITE-A CHINA 4,902.3 57.5 51.6 47.3 5.0 4.6 4.3 50.9 47.5 44.2 7.8 7.8 7.8
CHENGDU B-RAY-A CHINA 7,016.6 37.2 29.6 25.2 8.2 6.7 5.5 26.5 21.7 17.6 22.1 23.2 22.2
PEARSON PLC BRITAIN 51,709.8 13.8 13.5 12.6 1.5 1.4 1.3 9.9 9.8 9.3 10.7 10.8 11.2
DAI NIPPON PRINT JAPAN 44,021.9 31.9 23.6 24.6 0.9 0.8 0.8 6.4 5.9 5.9 2.7 3.4 3.5
LAGARDERE SCA FRANCE 23,331.1 9.8 10.1 8.9 0.7 0.7 0.7 8.4 8.5 7.8 11.0 7.5 8.1
WOLTERS KLUWER HOLLAND 27,775.1 10.3 10.1 9.1 2.8 2.5 2.3 8.6 8.6 8.1 24.0 22.5 23.2
TOPPAN PRINTING JAPAN 28,492.6 59.1 21.8 21.0 0.7 0.7 0.7 5.8 7.3 6.0 0.9 2.9 3.1
SINGAP PRESS HGS S’PORE 19,347.0 12.8 15.0 14.1 2.9 2.8 2.8 9.7 11.2 10.5 22.3 19.0 19.9
FAIRFAX MEDIA LT AUS 16,285.2 17.9 13.6 12.1 0.8 0.8 0.8 10.6 9.1 8.5 4.8 6.1 6.5
AXEL SPRINGER AG GER 16,157.9 10.9 11.7 10.2 1.6 1.6 1.5 7.8 7.2 6.5 21.7 12.8 13.7
NEW STRAITS TIME M 537.2 14.1 8.8 7.8 0.4 0.4 0.4 6.2 4.6 4.4 2.8 3.9 4.4
STAR PUBLICATION MAL 3,183.9 20.1 15.5 13.9 1.9 1.9 1.8 9.7 8.0 7.3 9.4 12.0 13.4
MONDADORI (ARN) ITALY 4,460.2 15.4 11.3 9.3 1.2 1.2 1.1 10.4 7.5 6.6 8.4 10.6 12.3
CAXTON AND CTP P S.AFRICA 4,307.3 16.3 13.8 12.1 1.3 1.2 1.1 11.0 9.5 8.3 8.4 9.3 9.9
TELEGRAAF MEDIA NETHERL 4,194.5 18.6 14.9 11.1 1.6 1.6 1.5 10.0 9.1 8.5 8.6 10.6 14.5
EUROMONEY INSTL BRITAIN 4,007.7 12.5 11.2 10.1 2.1 2.0 1.9 9.0 8.4 7.7 42.1 36.3 33.9
ALMA MEDIA CORP FINLAND 3,546.0 18.8 17.1 15.5 5.9 5.7 5.4 11.1 10.7 9.9 31.8 33.2 34.9
HURRIYET TURKEY 3,264.2 37.1 17.9 13.3 1.2 1.1 1.1 9.7 7.9 7.1 3.9 6.9 8.1
Average 266,540.7 23.0 17.3 15.5 2.3 2.1 1.9 12.3 11.3 10.2 13.5 13.3 13.9
Indian Companies
JAGRAN PRAKASHAN INDIA 3,713.4 21.8 19.2 16.4 5.6 4.6 4.0 13.1 11.4 9.6 26.4 25.6 26.5
DECCAN CHRONICLE INDIA 3,455.3 11.8 10.7 11.0 2.5 2.2 2.0 7.4 6.8 7.0 20.1 18.6 19.5
HT MEDIA LTD INDIA 3,425.4 26.4 20.0 17.0 3.6 3.1 2.7 13.6 11.2 9.8 14.2 16.4 17.1
Average 10,594.2 20.0 16.6 14.8 3.9 3.3 2.9 11.4 9.8 8.8 20.2 20.2 21.0
DB Corp INDIA 4,265.3 20.9 16.9 13.8 5.3 4.1 3.2 12.8 10.9 9.2 38.0 28.1 26.5
Source: KRC Research, Bloomberg

DB Corp Limited
29 KRC Equity Research
Rajiv Choksey Co-Head Institutional Equities [email protected] +91-22-6653 5135
Anuj Choksey Co-Head Institutional Equities [email protected] +91-22-6696 5500
Maulik Patel Head Research [email protected] +91-22-6696 5574
DB Corporation
230
235240
245250
255
260265
270
6-Ja
n
10-J
an
14-J
an
18-J
an
22-J
an
26-J
an
Rating Legend
Our Rating Upside
Strong Buy More than 25%
Buy 15% - 25%
Hold 10% - 15%
Reduce Nil – 10%
Sell Less than 0%
Other Stocks in the sector under our active coverage: Media and Entertainment
Ticker Company Recom As of Return Bmk Outper BARR
Summary Coverage 5 Avg Rating: 4.2 75.4% 24.5% 50.96%
SUNTV IN Sun TV Network Ltd hold 01/21/10 97.24% 39.55% 57.69% 5th
HTML IN HT Media Ltd buy 01/20/10 20.05% -1.23% 21.28%
Z IN Zee Entertainment Enterprises Ltd hold 01/19/10 29.77% 12.05% 17.72%
JAGP IN Jagran Prakashan Ltd hold 01/05/10 151.49% 47.74% 103.75% 4th
PVRL IN PVR Ltd buy 01/05/10 98.14% 44.82% 53.32% 1st

DB Corp Limited
30 KRC Equity Research
Disclaimer: This publication has been prepared solely for information purpose and does not constitute a solicitation to any person to buy or sell a
security. While the information contained therein has been obtained from sources believed to be reliable, investors are advised to
satisfy themselves before making any investments. Kisan Ratilal Choksey Shares & Sec Pvt Ltd., does not bear any responsibility for the
authentication of the information contained in the reports and consequently, is not liable for any decisions taken based on the same.
Further, KRC Research Reports only provide information updates and analysis. All opinion for buying and selling are available to investors
when they are registered clients of KRC Investment Advisory Services. As per SEBI requirements it is stated that, Kisan Ratilal Choksey
Shares & Sec Pvt Ltd., and/or individuals thereof may have positions in securities referred herein and may make purchases or sale
thereof while this report is in circulation.
Please send your feedback to [email protected]
Visit us at www.krchoksey.com
Kisan Ratilal Choksey Shares and Securities Pvt. Ltd.
Registered Office: 1102, Stock Exchange Tower, Dalal Street, Fort, Mumbai – 400 001.
Phone: 91-22-6633 5000; Fax: 91-22-6633 8060.
Branch Office: ABHISHEK, 5th Floor, Link Road, Dalia Industrial Estate, Andheri (W), Mumbai – 400 058.
Phone: 91-22-6696 5555; Fax: 91-22-6691 9576.
Related Documents