TO DOWNLOAD A COPY OF THIS POSTER, VISIT WWW.WATERS.COM/POSTERS ©2017 Waters Corporation OVERVIEW Annular geometry ion mobility separation device gives increased space charge capacity (~50x over a SRIG) Trap filling simulations via solution of the Poisson equation show the requirement for an interface that evenly fills the trapping volume Novel “pancake” ion guides allow even filling of, and extraction from, the annular device INTRODUCTION In conventional ion mobility mass spectrometry (IM-MS) ions are released into the ion mobility separator (IMS) in discrete packets. One method to improve the duty cycle of the device is trapping of the ions prior to the IMS. As ion sources get brighter, and IMS drift times get longer, the space charge capacity of the trap increasingly limits the utilisation of the ion beam. Furthermore, space charge effects within the IMS can have deleterious effects on resolution and transmission. One approach to alleviating space charge effects is to increase the trapping volume, thus reducing the charge density. In standard T-Wave IM the ions are confined in a 5mm diameter stacked ring ion guide (SRIG, Figure 1a). Alternate phases of RF are applied to the rings to give RF confinement. Recently an extended geometry has been implemented [1] in which ions are confined in a 50mmx5mm slot, greatly increasing the trapping volume (Figure 1b). In this system we apply alternate phases of RF to a series of top/bottom plate electrodes to give confinement in the y-axis, while a DC voltage on the edge electrodes gives confinement in the x-axis. If we take an extended slot geometry, remove the DC edge electrodes and fold it around on itself we arrive at an annular geometry which gives us a large trapping volume in a compact physical space (Figure 1c). While the full annular system makes best use of the available space a half annular system is also possible, again with DC edge electrodes for confinement at the open edges. This geometry offers about half the capacity of the full annular system, however it is more straightforward to manufacture (Figure 1d). SIMULATION OF A NOVEL ANNULAR GEOMETRY ION MOBILITY TRAP AND SEPARATION DEVICE WITH HIGH SPACE CHARGE CAPACITY David Langridge, Martin Green, Kevin Giles Waters Corporation, Wilmslow, UK METHODS SIMION 8.1 [2] was used to solve the Poisson equation in 2D. The Poisson equation is periodically re-solved (refined) to generate a new space charge field. For accurate results we require that the distance ions move between successive refines is less than 1 grid unit of the charge density grid. Between refines, the ions move under the influence of the total electric field in the system, given by the sum of the space charge field, an RF effective potential field and a static DC field. Collisions with the background gas were modelled using the SDS method [3]. The fields for the RF effective potential and the DC electrodes need only be calculated once for a given geometry, then scaled by the applied voltage (and RF frequency / ion m/z for the RF effective potential). As we solve the Poisson equation in 2D we obtain a linear charge density (LCD), this can be equated to a number of charges if we define a z-axis extent for the trapping volume. For the trap filling calculations we periodically spawn new ions into the system with each ion representing a portion of the total linear charge density. Unless otherwise indicated calculations presented here were performed with: 125V 0-p 2.5MHz RF, +50V on the DC edge electrodes, 2.5 torr N 2 buffer gas, mass 556 z=+1 ions. The RF electrodes are segmented in the z-axis with an electrode width of 0.5mm and a gap of 1mm. RESULTS Trap capacity Figure 2 shows several equilibrium charge density distributions for mass 556 z=+1 ions. Note that for all systems we simulate only a quarter of the system due to the x-y symmetry, the total LCD is therefore scaled up by a factor of 4. Figure 2a shows the charge density in a SRIG (Figure 1a) for a total linear charge density of 1.44e-15 C/mm, or 9e3 charges/mm. At this low level of charge the ion distribution is not significantly different from the thermal distribution in the absence of space charge. Figure 2b shows the charge density in a SRIG with LCD 1.44e-12 C/ mm, or 9e6 charges/mm, 1000 times more charge than Figure 2a. Due to the mutual charge repulsion the ions are distributed in a narrow ring with a maximum at radius ~2.1mm. This is likely to be close to the space charge limit for this system. We would expect some heating effects as the ions are forced up close to the steep-sided RF walls. Figure 2c shows the charge density for an extended slot system (Figure 1b) with LCD 1e-11 C/mm, or 6.25e7 charges/mm. The ions are compressed into a narrow band between the mutual charge repulsion and the steep sided RF barrier. The peak charge density and y-axis maximum of this band matches the SRIG result from Figure 2b, hence we estimate these systems as being equally filled. The space charge capacity of the extended plates system is therefore around 7x greater than the SRIG. For the annular system (Figure 1c) we scale up from 44mm to 324mm, therefore we would expect an increase in the space charge capacity of ~7x over the extended slot, or ~50x over a SRIG. The space charge capacity of the half annular system (Figure 1d) is therefore about 25x greater than a SRIG. Trap filling Conventionally the IMS trap is filled from an incoming axial ion beam, this is effectively a point fill. If we take the same approach to filling an extended geometry trap we are not able to fully utilise the increased charge capacity due to the relatively high pressure in the IMS (2.5 torr N 2 ). Diffusion and space charge effects cause the ions to spread across References 1. Kevin Giles et. al., 63rd ASMS conference, St. Louis, 2015. 2. SIMION 3D v8.1, Scientific Instrument Services Ltd. 3. Appelhans, A.D., Dahl, D.A., Int. J. Mass Spectrom. 244, 1–14 (2005). the trapping volume, however, due to the low mobility of the ions, the trapping volume is not evenly filled. Figure 3 shows the charge density distribution for a point filled extended slot system (in this case the system is 100mm wide in x). The total charge injected is 8e-13 C/mm over 10 ms, we plot the charge density at 2.5, 5, 7.5 and 10ms. This linear charge density equals 1e7 charges in a 2mm axial trapping volume. The fill rate of 1e9 charges/second is a typical source current. After 10ms fill time the charge density is at a maximum near x=0 and declines linearly out to around x=25mm. Clearly we are not evenly filling the trapping volume and there would be no advantage from having a trap with a total x-axis dimension greater than 50mm. Ion mobility separation For an IMS scan we accumulate ions at the entrance end of the annular IMS, this can be done with a DC barrier voltage applied to selected ring electrodes. At the start of the IMS cycle the DC barrier voltage is dropped to allow the ion packet to pass into the T-Wave drive region where they undergo ion mobility separation. Alternatively, the device can be operated in a pass-through mode. In this case ions are not trapped at the entrance end of the annular IMS hence we transmit a continuous beam of ions. Figure 8 shows simulated drift time peaks for two ion species defined to match the isomeric reverse peptides GRGDS and SDGRG (mass 492, z=+2, ccs= 211.7 Å 2 and 222.7 Å 2 respectively) . The drift length in the annular IMS was 250mm, with an 800 m/s 30V T-Wave applied. The drift time is measured from the trap release time until the ions have passed from the exit pancake into the exit SRIG. We obtain a mobility resolution of ~40 compared to 45 from the annular IMS alone, a loss of ~12%. We expect to be able to reduce this with further optimisation of the exit pancake geometry and voltage settings. Calculations of transmission through the system show losses of less than 0.1% over a wide m/z range of ions. Losses generally increase at high m/z, however various parameters can be tuned to reduce these losses if desired, e.g. DC voltage offsets and RF frequency / voltage. CONCLUSION An annular geometry ion mobility separation device with an increased space charge capacity, ~50x over a SRIG. Simulation of space charge via solution of the Poisson equation demonstrates the need for an interface to evenly fill the annular volume. Novel “Pancake” ion guides allow even filling of, and extraction from, the annular ion guide. A split deflection lens allows control of the angular distribution of the ion beam. Simulated drift peaks show that the pancake ion guides exhibit good transmission characteristics and lead to only a small reduction in ion mobility resolution. Figure 4 illustrates the pressure dependence of this effect, showing the same point fill trap simulation except at 0.1 torr N 2 . After 10ms the trap is near evenly filled out to ~42mm where the DC edge plate voltage contains the ions. The peak charge density is about 5x higher in the high pressure vs the low pressure case. Pancake ion guides To make full use of the annular trap capacity we therefore require an interface that takes an incident axial ion beam and distributes it evenly around the annular trapping volume. We also need an exit interface to bring the annular beam back down to an axial beam to be passed on to the rest of the analyser. This is achieved via novel “pancake” ion guides at the entrance / exit of the annular IMS. These ion guides are formed from concentric ring electrodes with alternate phases of RF applied to give RF confinement. We apply a DC gradient to move ions radially outward on the entrance pancake, and radially inward on the exit pancake. DC offsets are used to transmit ions into and out of the pancake ion guides. Figure 5 shows a slice through the cylindrically symmetric system, with the motion of a trace ion taken from a SIMION simulation. Figure 6 shows DC potential energy surfaces for: a) the entrance region, b) the exit region and c) the entrance pancake. The corrugations in the entrance SRIG and the annular IMS are a static time slice of the T- Wave voltages. While in this case we have simulated a T-wave drive in the annular IMS a DC gradient is equally possible. Due to the cylindrical symmetry ions are equally likely to take any angular path across the entrance pancake ion guide, hence we evenly fill the annular guide. For the half annular system this would result in a loss of about 50% of the ion beam. To overcome this issue a deflection lens is used to guide the ions. The first ring electrode of the entrance pancake is split into four quadrants, application of small DC bias voltages to these quadrants allows steering of the incoming ion beam onto the entrance pancake and thus control of the angular distribution of ions. Figure 7 shows a SIMION simulation where the deflection lens voltages are varied to send three trace ions in different directions. Sweeping or stepping the deflection lens voltages allows us to evenly fill the majority of the half annular trapping volume without loss of ions. Figure 2. Equilibrium charge density distributions for a) SRIG with 1.44e -15 C/mm LCD, b) SRIG with 1.44e-12 C/mm LCD, c) extended slot system with 1e-11 C/mm LCD. Figure 6. DC potential energy surfaces for a) entrance region, b) exit re- gion, c) entrance pancake. The corrugations in the entrance / exit regions are static time slices of T-Wave voltages. a) b) c) Figure 3. Charge density distribution for a point fill extended slot system at 2.5 torr N 2 , plotted at 2.5, 5, 7.5 and 10ms. Total charge is 8e-13 C/ mm after 10ms. Figure 4. Charge density distribution for a point fill extended slot system at 0.1 torr N 2 , plotted at 2.5, 5, 7.5 and 10ms. Total charge is 8e-13 C/ mm after 10ms. Figure 1. Plate geometries for a) SRIG, b) linear extended slot ion guide, c) annular ion guide, d) half annular ion guide. Figure 7. SIMION simulation showing the operation of the deflection lens. For each trace ion the deflection lens voltages were adjusted to direct the ions in the chosen direction. Figure 8. Drift time plots for the full system for the doubly charged re- verse peptide ions. Figure 5. x/y section from a cylindrically symmetric SIMION model of the full system with the various regions labelled. An example ion trace is shown travelling through the system. Entrance SRIG Exit SRIG Entrance pancake Exit pancake Annular IMS

Welcome message from author
This document is posted to help you gain knowledge. Please leave a comment to let me know what you think about it! Share it to your friends and learn new things together.
Transcript
TO DOWNLOAD A COPY OF THIS POSTER, VISIT WWW.WATERS.COM/POSTERS ©2017 Waters Corporation
OVERVIEW
Annular geometry ion mobility separation device gives
increased space charge capacity (~50x over a SRIG)
Trap filling simulations via solution of the Poisson
equation show the requirement for an interface that
evenly fills the trapping volume
Novel “pancake” ion guides allow even filling of, and
extraction from, the annular device
INTRODUCTION
In conventional ion mobility mass spectrometry (IM-MS) ions are
released into the ion mobility separator (IMS) in discrete packets. One
method to improve the duty cycle of the device is trapping of the ions
prior to the IMS. As ion sources get brighter, and IMS drift times get
longer, the space charge capacity of the trap increasingly limits the
utilisation of the ion beam. Furthermore, space charge effects within the
IMS can have deleterious effects on resolution and transmission.
One approach to alleviating space charge effects is to increase the
trapping volume, thus reducing the charge density. In standard T-Wave
IM the ions are confined in a 5mm diameter stacked ring ion guide
(SRIG, Figure 1a). Alternate phases of RF are applied to the rings to
give RF confinement. Recently an extended geometry has been
implemented [1] in which ions are confined in a 50mmx5mm slot, greatly
increasing the trapping volume (Figure 1b). In this system we apply
alternate phases of RF to a series of top/bottom plate electrodes to give
confinement in the y-axis, while a DC voltage on the edge electrodes
gives confinement in the x-axis.
If we take an extended slot geometry, remove the DC edge electrodes
and fold it around on itself we arrive at an annular geometry which gives
us a large trapping volume in a compact physical space (Figure 1c).
While the full annular system makes best use of the available space a
half annular system is also possible, again with DC edge electrodes for
confinement at the open edges. This geometry offers about half the
capacity of the full annular system, however it is more straightforward to
manufacture (Figure 1d).
SIMULATION OF A NOVEL ANNULAR GEOMETRY ION MOBILITY TRAP AND SEPARATION DEVICE WITH HIGH SPACE CHARGE CAPACITY
David Langridge, Martin Green, Kevin Giles Waters Corporation, Wilmslow, UK
METHODS
SIMION 8.1 [2] was used to solve the Poisson equation in 2D. The
Poisson equation is periodically re-solved (refined) to generate a new
space charge field. For accurate results we require that the distance
ions move between successive refines is less than 1 grid unit of the
charge density grid.
Between refines, the ions move under the influence of the total electric
field in the system, given by the sum of the space charge field, an RF
effective potential field and a static DC field. Collisions with the
background gas were modelled using the SDS method [3]. The fields for
the RF effective potential and the DC electrodes need only be
calculated once for a given geometry, then scaled by the applied
voltage (and RF frequency / ion m/z for the RF effective potential).
As we solve the Poisson equation in 2D we obtain a linear charge
density (LCD), this can be equated to a number of charges if we define
a z-axis extent for the trapping volume. For the trap filling calculations
we periodically spawn new ions into the system with each ion
representing a portion of the total linear charge density.
Unless otherwise indicated calculations presented here were performed
with: 125V0-p 2.5MHz RF, +50V on the DC edge electrodes, 2.5 torr N2
buffer gas, mass 556 z=+1 ions. The RF electrodes are segmented in
the z-axis with an electrode width of 0.5mm and a gap of 1mm.
RESULTS
Trap capacity
Figure 2 shows several equilibrium charge density distributions for
mass 556 z=+1 ions. Note that for all systems we simulate only a
quarter of the system due to the x-y symmetry, the total LCD is therefore
scaled up by a factor of 4.
Figure 2a shows the charge density in a SRIG (Figure 1a) for a total
linear charge density of 1.44e-15 C/mm, or 9e3 charges/mm. At this low
level of charge the ion distribution is not significantly different from the
thermal distribution in the absence of space charge.
Figure 2b shows the charge density in a SRIG with LCD 1.44e-12 C/
mm, or 9e6 charges/mm, 1000 times more charge than Figure 2a. Due
to the mutual charge repulsion the ions are distributed in a narrow ring
with a maximum at radius ~2.1mm. This is likely to be close to the
space charge limit for this system. We would expect some heating
effects as the ions are forced up close to the steep-sided RF walls.
Figure 2c shows the charge density for an extended slot system
(Figure 1b) with LCD 1e-11 C/mm, or 6.25e7 charges/mm. The ions are
compressed into a narrow band between the mutual charge repulsion
and the steep sided RF barrier. The peak charge density and y-axis
maximum of this band matches the SRIG result from Figure 2b, hence
we estimate these systems as being equally filled. The space charge
capacity of the extended plates system is therefore around 7x greater
than the SRIG.
For the annular system (Figure 1c) we scale up from 44mm to 324mm,
therefore we would expect an increase in the space charge capacity of
~7x over the extended slot, or ~50x over a SRIG. The space charge
capacity of the half annular system (Figure 1d) is therefore about 25x
greater than a SRIG.
Trap filling
Conventionally the IMS trap is filled from an incoming axial ion beam,
this is effectively a point fill. If we take the same approach to filling an
extended geometry trap we are not able to fully utilise the increased
charge capacity due to the relatively high pressure in the IMS (2.5 torr
N2). Diffusion and space charge effects cause the ions to spread across
References
1. Kevin Giles et. al., 63rd ASMS conference, St. Louis, 2015.
2. SIMION 3D v8.1, Scientific Instrument Services Ltd.
3. Appelhans, A.D., Dahl, D.A., Int. J. Mass Spectrom. 244, 1–14 (2005).
the trapping volume, however, due to the low mobility of the ions, the
trapping volume is not evenly filled.
Figure 3 shows the charge density distribution for a point filled extended
slot system (in this case the system is 100mm wide in x). The total
charge injected is 8e-13 C/mm over 10 ms, we plot the charge density
at 2.5, 5, 7.5 and 10ms. This linear charge density equals 1e7 charges
in a 2mm axial trapping volume. The fill rate of 1e9 charges/second is a
typical source current.
After 10ms fill time the charge density is at a maximum near x=0 and
declines linearly out to around x=25mm. Clearly we are not evenly filling
the trapping volume and there would be no advantage from having a
trap with a total x-axis dimension greater than 50mm.
Ion mobility separation
For an IMS scan we accumulate ions at the entrance end of the annular
IMS, this can be done with a DC barrier voltage applied to selected ring
electrodes. At the start of the IMS cycle the DC barrier voltage is
dropped to allow the ion packet to pass into the T-Wave drive region
where they undergo ion mobility separation. Alternatively, the device
can be operated in a pass-through mode. In this case ions are not
trapped at the entrance end of the annular IMS hence we transmit a
continuous beam of ions.
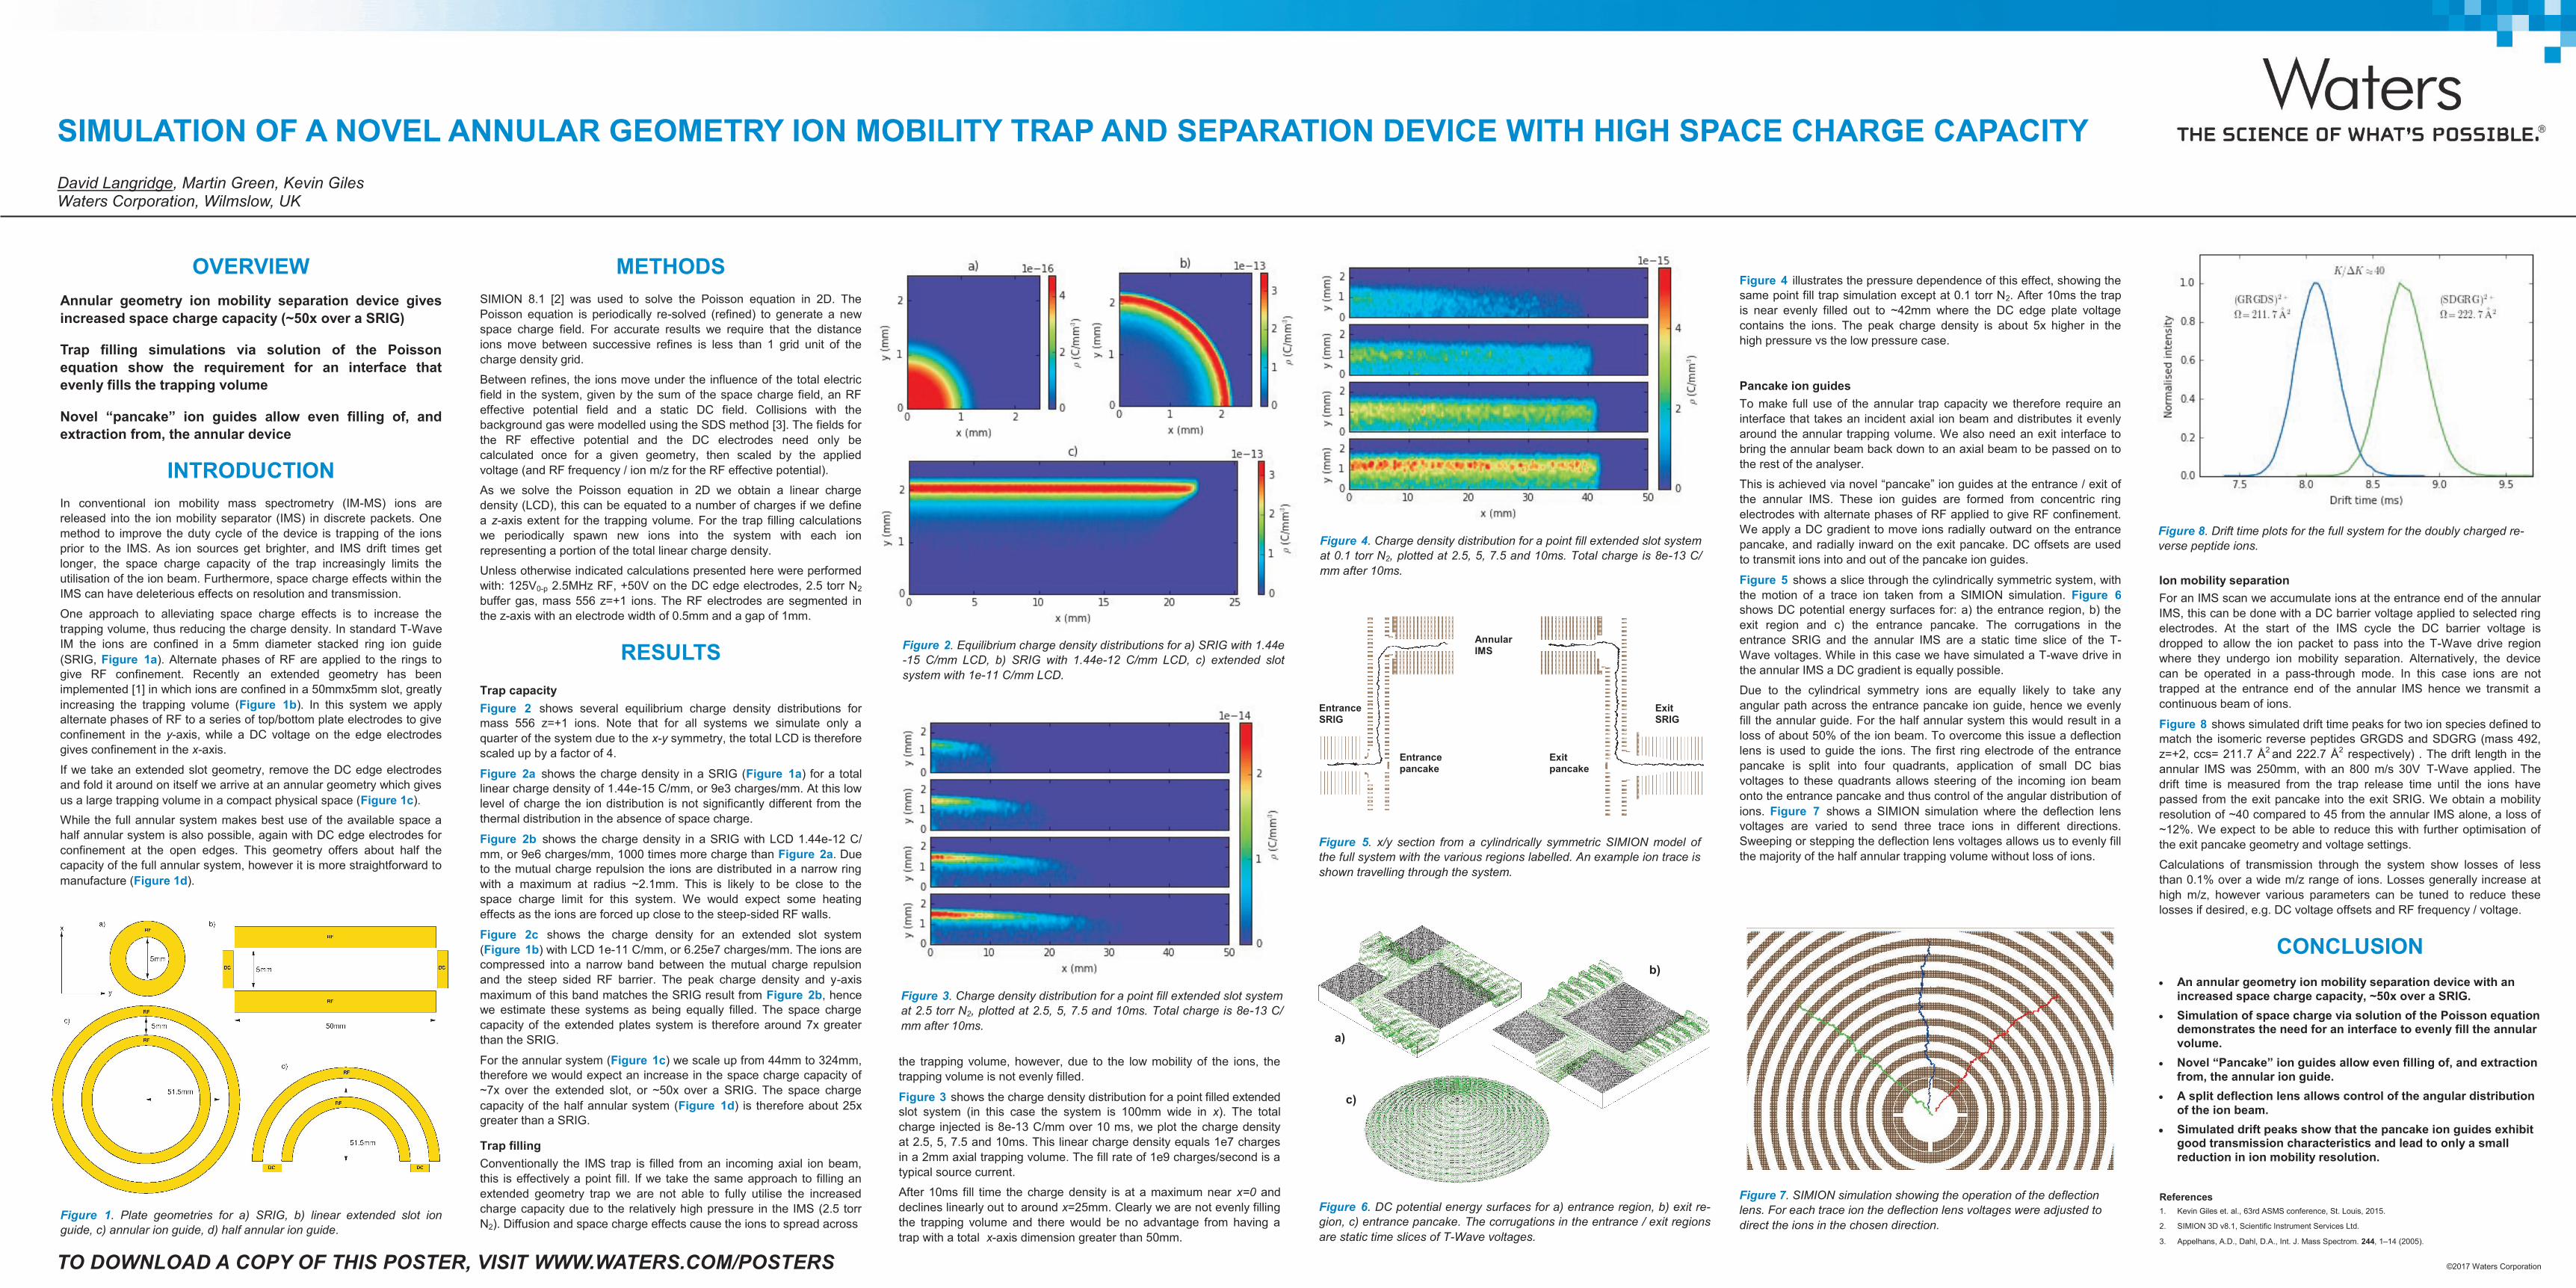
Figure 8 shows simulated drift time peaks for two ion species defined to
match the isomeric reverse peptides GRGDS and SDGRG (mass 492,
z=+2, ccs= 211.7 Å2 and 222.7 Å
2 respectively) . The drift length in the
annular IMS was 250mm, with an 800 m/s 30V T-Wave applied. The
drift time is measured from the trap release time until the ions have
passed from the exit pancake into the exit SRIG. We obtain a mobility
resolution of ~40 compared to 45 from the annular IMS alone, a loss of
~12%. We expect to be able to reduce this with further optimisation of
the exit pancake geometry and voltage settings.
Calculations of transmission through the system show losses of less
than 0.1% over a wide m/z range of ions. Losses generally increase at
high m/z, however various parameters can be tuned to reduce these
losses if desired, e.g. DC voltage offsets and RF frequency / voltage.
CONCLUSION
An annular geometry ion mobility separation device with an
increased space charge capacity, ~50x over a SRIG.
Simulation of space charge via solution of the Poisson equation demonstrates the need for an interface to evenly fill the annular
volume.
Novel “Pancake” ion guides allow even filling of, and extraction
from, the annular ion guide.
A split deflection lens allows control of the angular distribution
of the ion beam.
Simulated drift peaks show that the pancake ion guides exhibit good transmission characteristics and lead to only a small
reduction in ion mobility resolution.
Figure 4 illustrates the pressure dependence of this effect, showing the
same point fill trap simulation except at 0.1 torr N2. After 10ms the trap
is near evenly filled out to ~42mm where the DC edge plate voltage
contains the ions. The peak charge density is about 5x higher in the
high pressure vs the low pressure case.
Pancake ion guides
To make full use of the annular trap capacity we therefore require an
interface that takes an incident axial ion beam and distributes it evenly
around the annular trapping volume. We also need an exit interface to
bring the annular beam back down to an axial beam to be passed on to
the rest of the analyser.
This is achieved via novel “pancake” ion guides at the entrance / exit of
the annular IMS. These ion guides are formed from concentric ring
electrodes with alternate phases of RF applied to give RF confinement.
We apply a DC gradient to move ions radially outward on the entrance
pancake, and radially inward on the exit pancake. DC offsets are used
to transmit ions into and out of the pancake ion guides.
Figure 5 shows a slice through the cylindrically symmetric system, with
the motion of a trace ion taken from a SIMION simulation. Figure 6
shows DC potential energy surfaces for: a) the entrance region, b) the
exit region and c) the entrance pancake. The corrugations in the
entrance SRIG and the annular IMS are a static time slice of the T-
Wave voltages. While in this case we have simulated a T-wave drive in
the annular IMS a DC gradient is equally possible.
Due to the cylindrical symmetry ions are equally likely to take any
angular path across the entrance pancake ion guide, hence we evenly
fill the annular guide. For the half annular system this would result in a
loss of about 50% of the ion beam. To overcome this issue a deflection
lens is used to guide the ions. The first ring electrode of the entrance
pancake is split into four quadrants, application of small DC bias
voltages to these quadrants allows steering of the incoming ion beam
onto the entrance pancake and thus control of the angular distribution of
ions. Figure 7 shows a SIMION simulation where the deflection lens
voltages are varied to send three trace ions in different directions.
Sweeping or stepping the deflection lens voltages allows us to evenly fill
the majority of the half annular trapping volume without loss of ions.
Figure 2. Equilibrium charge density distributions for a) SRIG with 1.44e
-15 C/mm LCD, b) SRIG with 1.44e-12 C/mm LCD, c) extended slot
system with 1e-11 C/mm LCD.
Figure 6. DC potential energy surfaces for a) entrance region, b) exit re-
gion, c) entrance pancake. The corrugations in the entrance / exit regions
are static time slices of T-Wave voltages.
a)
b)
c)
Figure 3. Charge density distribution for a point fill extended slot system
at 2.5 torr N2, plotted at 2.5, 5, 7.5 and 10ms. Total charge is 8e-13 C/
mm after 10ms.
Figure 4. Charge density distribution for a point fill extended slot system
at 0.1 torr N2, plotted at 2.5, 5, 7.5 and 10ms. Total charge is 8e-13 C/
mm after 10ms.
Figure 1. Plate geometries for a) SRIG, b) linear extended slot ion
guide, c) annular ion guide, d) half annular ion guide.
Figure 7. SIMION simulation showing the operation of the deflection
lens. For each trace ion the deflection lens voltages were adjusted to
direct the ions in the chosen direction.
Figure 8. Drift time plots for the full system for the doubly charged re-
verse peptide ions.
Figure 5. x/y section from a cylindrically symmetric SIMION model of
the full system with the various regions labelled. An example ion trace is
shown travelling through the system.
Entrance SRIG
Exit SRIG
Entrance pancake
Exit pancake
Annular IMS
Related Documents