David L. Winter for the PHENIX Collaboration High-p T Particle Production with Respect to the Reaction Plane Winter Workshop on Nuclear Dynamics La Jolla, CA 12 March – 18 March 2006

David L. Winter for the PHENIX Collaboration High-p T Particle Production with Respect to the Reaction Plane Winter Workshop on Nuclear Dynamics La Jolla,
Dec 22, 2015
Welcome message from author
This document is posted to help you gain knowledge. Please leave a comment to let me know what you think about it! Share it to your friends and learn new things together.
Transcript

David L. Winterfor the PHENIX Collaboration
High-pT Particle Production with Respect to the Reaction Plane
Winter Workshop on Nuclear DynamicsLa Jolla, CA
12 March – 18 March 2006

13 March 2006 D.Winter: High-Pt Production wrt Reaction Plane 2
Outline
• Physics Motivation
• Measurement Method
• PHENIX Results
• Models
• Summary
13 March 2006 D.Winter: High-Pt Production wrt Reaction Plane 3
RAA and v2 at high pT
PHENIX preliminary
0 RAA appears flat for pT>3.0 GeV/c
Large v2 at high pT
Examples of theoretical studies:• Gyulassy, Vitev, Wang, PRL 86: 2537, 2001 • Shuryak, Phys. Rev. C: 027902 (2002)• Drees, Feng, Jia, Phys. Rev. C:71
034909 (2005)
scaled,)(Yield
scaled),(Yield
pp
AARAA
13 March 2006 D.Winter: High-Pt Production wrt Reaction Plane 4
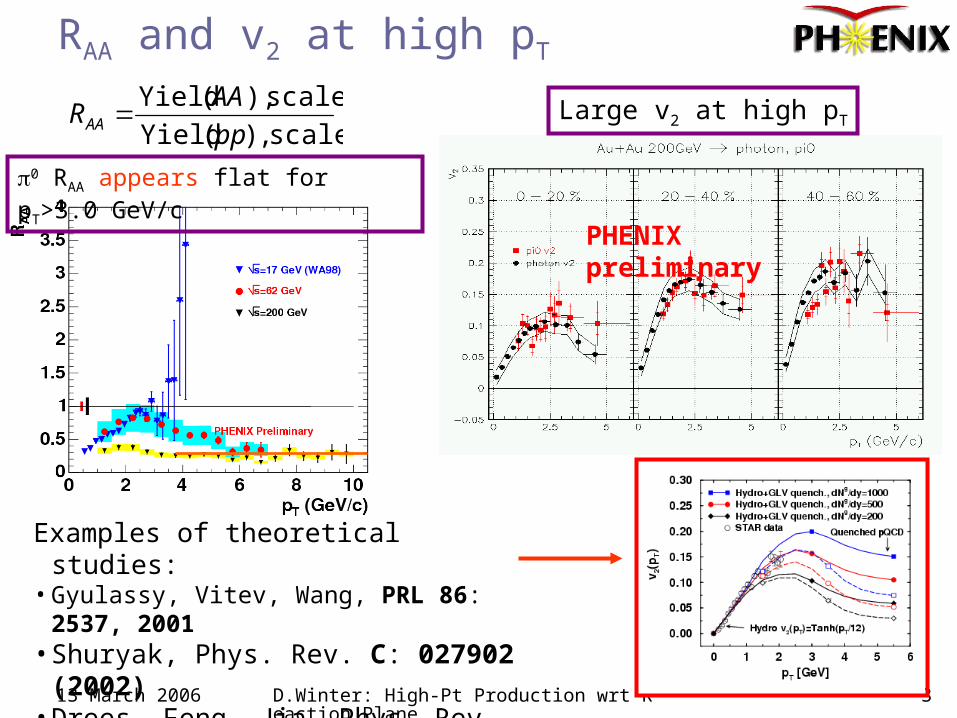
Physics Motivation• How well do we understand the origin of
azimuthal anisotropy (v2) at high pT?• The “usual” explanations
– Arises from azimuthal variation in energy loss– Which is in turn due to geometry: spatial anisotropy of
parton density in non-central collisions.• 0s provide ideal “laboratory” to probe this
physics at high pT:– Expected to be less subject to effects of
recombination– High pT acceptance
• Studying anisotropy out to high pT provides powerful tool for studying transition from soft to hard physics at pT >~ 3 GeV/c

13 March 2006 D.Winter: High-Pt Production wrt Reaction Plane 5
The PHENIX Detector• Pioneering High-Energy Nuclear Interaction eXperiment
Two central arms for measuring hadrons, photons and electrons
Two forward arms for measuring muons
Event characterization detectors in center
PHENIX (image ca. Jan 1999)

13 March 2006 D.Winter: High-Pt Production wrt Reaction Plane 6
Measuring 0s in PHENIX
• In Run 4, PHENIX recorded 1.5 Billion AuAu Collisions– Data presented here represents ~
1B of those events• For measuring , 0s, we have 8
EmCal sectors• Two technologies
– PbSc: Sampling – PbGl: Cerenkov
0
• In a given pT, centrality, and reaction plane bin, we:– Form pairs of clusters– Subtract mixed event background– Integrate counts in mass window – (Determined by fit to Gaussian)

13 March 2006 D.Winter: High-Pt Production wrt Reaction Plane 7
Measuring the R.P. in PHENIX
• Use the Beam-Beam Counters @ 3<||<4, azimuthally symmetric
• Measure charged particle multiplicity as function of
• Event-by-event determination• 2 independent measurements from north and
south counters – estimates resolution
x
yz
React
ion
Plane
Reaction plane

13 March 2006 D.Winter: High-Pt Production wrt Reaction Plane 8
Reaction Plane Biases?
– Can hard scattering bias the reaction plane measurement ?
– Evaluate using Pythia:• Calculate between pions in (central arm)• And charged particles in (BBC)
• For different pion pT bins.
35.0
43
dn/d
d
3<
<
4 Au-Au dn/d*2v2
10-20% 133
20-30% 122
30-40% 91.6
40-50% 5.81.3
Much larger than hard scattering correlation.
Black: pT > 2Red: pT > 4Blue: pT > 10

13 March 2006 D.Winter: High-Pt Production wrt Reaction Plane 9
Relative Yields wrt Reaction Plane
• Measure 0 dN/dpT in 6 bins over [0,/2].– Correct yields for reaction plane resolution
• Multiply the ratio
• With previously measured RAA RAA()
x
yz
dN
d1 2v2 cos2( R )
AAAA RRr )(Yield)(Yield
React
ion
Plane

13 March 2006 D.Winter: High-Pt Production wrt Reaction Plane 10
But first… accounting for the detector
• Reaction Plane as measured has resolution
• Fit raw yield() raw v2
• Correct raw v2 for resolution• Correct raw yield() with
Measure RP withBeam-Beam Counters
)cos(2SN BBCBBC
)2cos(1
)2cos(1
2
2
raw
corr
v
v
20-30%2<pt<2.5

13 March 2006 D.Winter: High-Pt Production wrt Reaction Plane 11
From Relative Yields to RAA
MultiplyBy inclusive
RAA
Red: Sys. Due to resolution correctionBlue: Error on RAA
Yield
)(Yield
0
/2

13 March 2006 D.Winter: High-Pt Production wrt Reaction Plane 12
Centrality dependence of 0 RAA

13 March 2006 D.Winter: High-Pt Production wrt Reaction Plane 13
RAA(,pT) vs. pT (Cent. Dependence)
Grey bands: Error in RAA
In-plane
Out-of-plane

13 March 2006 D.Winter: High-Pt Production wrt Reaction Plane 14
RAA(,pT) vs. Npart
In-plane
Out-of-plane
Grey Bands: Inclusive RAA w/ Error

13 March 2006 D.Winter: High-Pt Production wrt Reaction Plane 15
0 v2
Red: Sys. error (abs)
Large v2 at high pT!

13 March 2006 D.Winter: High-Pt Production wrt Reaction Plane 16
Compare with charged hadrons

13 March 2006 D.Winter: High-Pt Production wrt Reaction Plane 17
Energy Loss and Path Length
• Suppose energy loss is dominant mechanism at high pT
• These two (coupled) parameters both give handles on the parton’s path length through medium:– Centrality
– Angle with respect to Reaction Plane
• Can we find an equivalent single parameter?– Have to depend on density of partons, – Need to include time-dependence/formation time in
13 March 2006 D.Winter: High-Pt Production wrt Reaction Plane 18
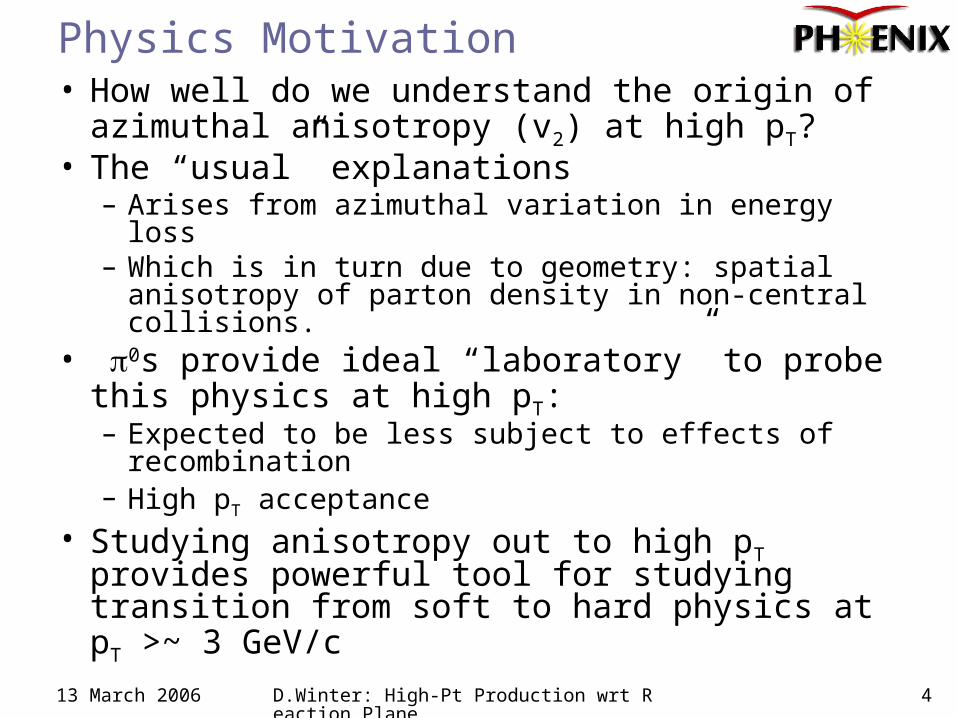
Geometry and “Canonical” Energy Loss• Initial parton (areal) density
• Intrinsic energy loss:
• Assume:
• Calculate:
• Further refine with Glauber MC sampling of path origin to take into account fluctuations in hard-scattering center
• This quantity should contain all geometric effects, and therefore E should be proportional it.
dA
dn
dA
dn partcolor
0init
colorcolor )( Tx
0
0initcolor )(
L
LLld
2LE
Participant Density
Y
X

13 March 2006 D.Winter: High-Pt Production wrt Reaction Plane 19
RAA vs. “L dL”
10-20 % Centrality
20-30 % Centrality
30-40 % Centrality
40-50 % Centrality
50-60 % Centrality
Angular and centrality dependence described by single
curve!!

13 March 2006 D.Winter: High-Pt Production wrt Reaction Plane 20
• Calculations based on Arnold, Moore, Yaffe (AMY) formalism– JHEP 0305:51 2003
• Energy loss only (BDMS++)• High-pT
– v2 appears to decrease to energy loss calculation
• Low(er)-pT
– Something additional going on…
• While the data appear to approach the energy loss limit at high pT, there is something extra going on in 3-6 GeV/c region
0 v2 Theory Comparison: AMY (Turbide et al.)

13 March 2006 D.Winter: High-Pt Production wrt Reaction Plane 21
0 v2 Theory Comparison: D.Molnar• Molnar Parton Cascade (MPC)
– nucl-th/0503051• Contains:
– Corona effects– Energy loss due to interactions– pT boost due to interactions
• Consistency would suggest:– QGP?– sQGP?
• Model shown here is for one set of parameters
– Can larger opacity reproduce the v2?
High-pT “slopes” consistent

13 March 2006 D.Winter: High-Pt Production wrt Reaction Plane 22
Summary• While RAA(pT) appears to be flat out to high pT,
RAA(,pT) reveals both pT- and angle-dependent substructure
• For the first time we see a clear decrease in the 0 v2 at high pT – to a non-zero value!
• Non-zero high-pT v2 is consistent with energy loss calculations
• Comparison of high-pT (>7.0 GeV/c) behavior of v2 with models points to pQCD + energy loss as dominant sources– What’s responsible for larger v2 at intermediate pT?
• Partons pushed to higher pT (à la Molnar)?• Larger energy loss crossing the flow field (Wiedemann et
al)?• Collisional energy loss?• Flow + recombination?

13 March 2006 D.Winter: High-Pt Production wrt Reaction Plane 23
Backups

13 March 2006 D.Winter: High-Pt Production wrt Reaction Plane 24
“Zooming in” on MinBias h±
Minimum-Bias s=200Au+Au

13 March 2006 D.Winter: High-Pt Production wrt Reaction Plane 25
Goal: Combine centrality and angle dependence into one geometric picture
First approach: calculate a simple length (L) assuming an elliptical shape
Next level: include variation in density using a Glauber model and plot RAA() vs. 0 L/ dL
Even Better: include fluctuations in L within Glauber Model and plot RAA() vs. 0 Leff/ dL (with the effective length Leff)
Geometric pictures and path length
Related Documents