Date, 2012 Location PROFIT MASTERY A Focus on Unit Profitability Profit Mastery Agent

Date, 2012 Location PROFIT MASTERY A Focus on Unit Profitability Profit Mastery Agent.
Dec 22, 2015
Welcome message from author
This document is posted to help you gain knowledge. Please leave a comment to let me know what you think about it! Share it to your friends and learn new things together.
Transcript

Date, 2012
Location
PROFIT MASTERYA Focus on Unit Profitability
Profit Mastery Agent

2
Profit Mastery®
Education- Live- Live/Facilitated Video Programs - Profit Mastery University
Web Based Hi-Def Streaming Video (Self-Study)
Information- Industry Benchmarking Studies- Bookkeeping Services
Accountability- Performance Group Facilitation
Provides the FOUNDATION
Creates the YARDSTICK
Establishes the DISCIPLINE
1

3
Profit Mastery History
Proven in over 25 years of Programs
Trained over .5 million Entrepreneurs
Delivered on 3 continents in 8 languages
Serving Business Networks, Banks, Associations and the ASBDC
Now offered online in a streaming video format, available 24/7/365

4
Profit Mastery is Unique
A Financial Training Program that...
Drives Improved Profitability
Increased Cash Flow
Improves “Bankability!”
Is Available Through

5
Business Owner’s Roles
70 - 80%
FAIL!
Sales
&M
arketing
Production
HR
Finance
Purchasing
QC
/Cust. S
vc.C
ollections
Janitor
8 yrs?
Winners
Losers
1/4
3/4

6
Profit Mastery Basics
Measure
FINANCIAL PERFORMANCE

7
WHAT GETS MEASURED, GETS MANAGED
andWhat Gets Managed
Gets Done!
Profit Mastery Basics

8
Profit Mastery Content:
7 Steps to Businesses Success
1. Plan Properly 2. Monitor Financial position The Scorecard The Roadmap 3. Price, Volume, Cost 4. Manage Cash Flow 5. Manage Growth 6. Dealing With Banks 7. Planning for Transition
2

9
Tests….
VC = 70%FC = $144,000TP = $60,000
1) Needed Sales
2) If FC $1.00, what sales required ______
How does a Business make a Profit?
Answer these two questions:

10
Profit Mastery
Section 2 Monitor Financial position
1. Plan Properly 2. Monitor Financial position The Scorecard The Roadmap 3. Price-Volume-Costs 4. Manage Cash Flow 5. Manage Growth 6. Banks7. Planning for Transition

11
Assets = Liabilities + Net Worth
Balance Sheet
Uses of Profits:
To pay for new assets To pay off debt To pay out to the owners
Sales
Income Statement
Net Profit
Financial Operating Cycle
Efficiency
Cash Profit3

12
Scorecard
Ratio Analysis Spreadsheet
Year 1
Year 2
Year 3 Industry Composite
Calculations, Trends, or
Observations
BALANCE SHEET RATIOS: Stability (or “Staying Power”)
1. Current Current Assets
Current Liabilities 1.7 1.1 0.99 1.8 726,100
734,400
2. Quick Cash + Accts. Rec.
Current Liabilities 0.8 0.5 0.38 0.8 282,300
734,400
3. Debt-to-Worth Total Liabilities
Net Worth 1.5 1.4 2.68 1.2 823,700
307,300
INCOME STATEMENT RATIOS: Profitability (or “Earning Power”)
4. Gross Margin Gross Profit
Sales 21% 20% 18.5% 22.2% 400,000
2,160,000
5. Net Margin Net Profit Before Tax
Sales 3.5% 3.0% 0.29% 3.2% 6,300
2,160,000
ASSET MANAGEMENT RATIOS: Overall Efficiency Ratios
6. Sales-to-Assets Sales
Total Assets 2.3 2.3 1.9 2.4 2,160,000
1,131,000
7. Return on Assets Net Profit Before Tax
Total Assets 8.2% 6.9% 0.56% 6.9% 6,300
1,131,000
8. Return on Investment
Net Profit Before Tax
Net Worth 20.9% 16.5% 2.0% 15.8% 6,300
307,300
ASSET MANAGEMENT RATIOS: Working Capital Cycle Ratios
9. Inventory Turnover
Cost of Goods Sold
Inventory 5.6 8.1 4.2 4.9 1,760,000
419,000
10. Inventory Turn-Days
360
Inventory Turnover 64 44 86 74 360
4.2
11. Accounts Receivable
Turnover Sales
Accounts Receivable 8.9 10 8 8.5 2,160,000 270,000
12. Accounts Receivable
Turn-Days 360
Accts. Rec. Turnover 40 36 45 43 360
8
13. Accounts Payable
Turnover Cost of Goods Sold
Accounts Payable 12 10.4 5.7 9.8 1,760,000
310,100
14. Average Payment
Period 360
Accts. Pay. Turnover 30 34 63 37 360
5.7
4

13
INCOME STATEMENT RATIOS: Profitability (or “Earning Power”)
Y-1 Y-2 Y-3 Industry
4. Gross Margin Gross Profit 21% 20% 18.5% 22.2% 400,000Sales 2,160,000
5. Net Margin Net Profit Before Tax 3.5% 3.0% .29% 3.82% 6,300 Sales 2,160,000
Profit Mastery Scorecard
For every $1 of (bottom #), there is $X of (top #)
5

14
What’s their Low Gross Margin costing?
Their Margin in Year 3: 18.5%
Their Peers’ Margin: 22.2%
Difference +/- 4%
Sales in Year 3: $2,000,000 X margin difference: X .04
Margin $ Left on the Table: $80,000
Primary Impact: Profit
Low Gross Margin5

15
ASSET MANAGEMENT RATIOS: Working Capital Cycle Ratios
Y-1 Y-2 Y-3 Industry
9. Inventory Cost of Goods Sold 5.6 8.1 4.2 4.9 1,760,000Turnover Inventory 419,000
10. Inventory 360 64 44 86 74 360Turn-Days Inventory Turnover 4.2
11. Accounts Receivable Sales 8.9 10 8 8.5 2,160,000Turnover Accounts Receivable 270,000
12. Accounts Receivable 360 40 36 45 43 360Turn-Days Accts. Rec. Turnover 8
13. Accounts Payable Cost of Goods Sold 12 10.4 5.7 9.8 1,760,000Turnover Accounts Payable 310,100
14. Average Payment 360 30 34 63 37 360Period Accts. Pay. Turnover 5.7
Profit Mastery Scorecard6

16
Too Much Inventory
Industry achieves 4.9 turnsTheir COGS was $1,760,000
COGS
Target Inv. Turns
$1,760,000
4.9= $359,000
– Targeted Inventory –$359,000
Actual Inventory $419,000
How much too much? $60,000
Primary Impact: Cash
6

17
$126,000 (C)
$10,000(P)
$60,000(C) $16,000(C)
$38,000(P)
$80,000(P)
$7,000(P)
$22,000(P)$10,000 (P)
$15,000 (P) / $4,000 (P)
7

18
Profit Mastery Assessment
Gross Profit Cash NPBT
Cascade Office Systems
Hidden Costs $19,000
Totals $ 202,000 $106,000
Discounts $10,000
Labor Productivity 38,000
Buying 10,000
Pricing 22,000
$80,000
Inventory $ 60,000A/R $ 16,000
Refinance Bldg. $ 126,000
Interest $ 7,000
8

19
Profit Mastery
Section 3 Price-Volume-Costs
1. Plan Properly 2. Monitor Financial position The Scorecard The Roadmap 3. Price-Volume-Costs 4. Manage Cash Flow 5. Manage Growth 6. Banks7. Planning for Transition

20
Price-Volume-Costs
Your employee breaks something that costs $50, how much in sales do you need to do to cover those lost $$$?You are hiring a new part-time store person for $24K. How much in increased sales do you need before they actually contribute anything?You dream of a new location that will cost you $250,000. What sales will you need to make a return on your investment?
21
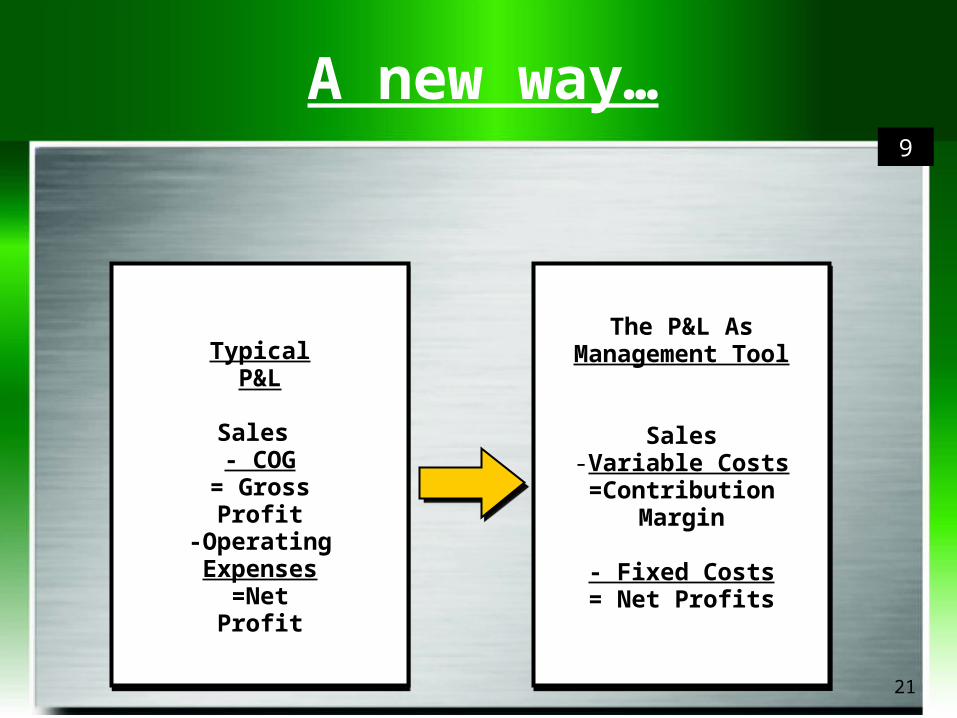
A new way…
Typical P&L
Sales - COG
= Gross Profit
-Operating Expenses=Net Profit
The P&L As Management Tool
Sales-Variable Costs
=Contribution Margin
- Fixed Costs= Net Profits
9

23
Tests….
Sales= 100%VC = 70%CM =
FC = $144,000TP = $ 60,000 $
1) Needed Sales =
2) If FC $1.00, what sales required? ____
How does a Business make a Profit?
Answer these two questions:

24
Profit Mastery
Section 4 Manage Cash Flow
1. Plan Properly 2. Monitor Financial position The Scorecard The Roadmap 3. Price-Volume-Costs 4. Manage Cash Flow 5. Manage Growth 6. Banks7. Planning for Transition

25
Cash Flow Worksheet11

26
Cash Flow Worksheet12

27
Cash Flow Worksheet13

28
14

29
Profit Mastery
Section 5 Manage Growth
1. Plan Properly 2. Monitor Financial position The Scorecard The Roadmap 3. Price-Volume-Costs 4. Manage Cash Flow 5. Manage Growth 6. Banks7. Planning for Transition

30
Financial Gap: at $600,00015

31
Financial Gap: at $900,000
Balance Sheet RatiosAt $600,000 At $900,000
Current 2.18 1.33Quick 1.0 .61Debt-To-Worth .95 1.48
$777,000Total Liabilities and Net Worth$777,000Total Assets
Percent of Sales*
Percent of Sales*
313,000Net Worth345,000Total Fixed Assets
464,000Total Liabilities120,000Land/Building
140,000Long Term Liabilities25%225,000Equipment
$324,000Total Current
Liabilities$432,000 Total Current Assets
7%63,000Accruals26%234,000Inventory
15%135,000Accounts Payable
18%162,000Accounts Receivable
Financial Gap$126,000Note Payable4%$36,000Cash
16

32
Managed Financial Gap Percent of Sales* Percent of Sales*
Cash $36,000 Note Payable $ 0Financial
Gap
Accounts Receivable 112,500 Accounts Payable 75,000
Inventory 157,000 Accruals 63,000
Total Current Assets$306,000
Total Current Liabilities$138,000
Equipment 225,000 Long Term Liabilities 200,000
Land/Building 120,000 Total Liabilities 338,000
Total Fixed Assets 345,000 Net Worth 313,000
Total Assets $651,000Total Liabilities and Net Worth $651,000
Balance Sheet Ratios At $600,000 At $900,000 At $900,000(MANAGED)
Current Current Assets 2.18 1.33 2.22 Current Liability
Quick Cash + A/R 1.00 0.61 1.08 Current Liability
Debt-to-Worth Total Liability 0.95 1.48 1.08 Net Worth
17

33
Balance Sheet (CF) Checklist
Manage current assetsRestructure debtMake more profitSell existing unproductive assetsCurtail expansionLease fixed assetsImplement sale-leaseback of existing fixed assetsAccept more riskDon’t grow (use pricing, etc. to limit growth)Get new equity
18
34
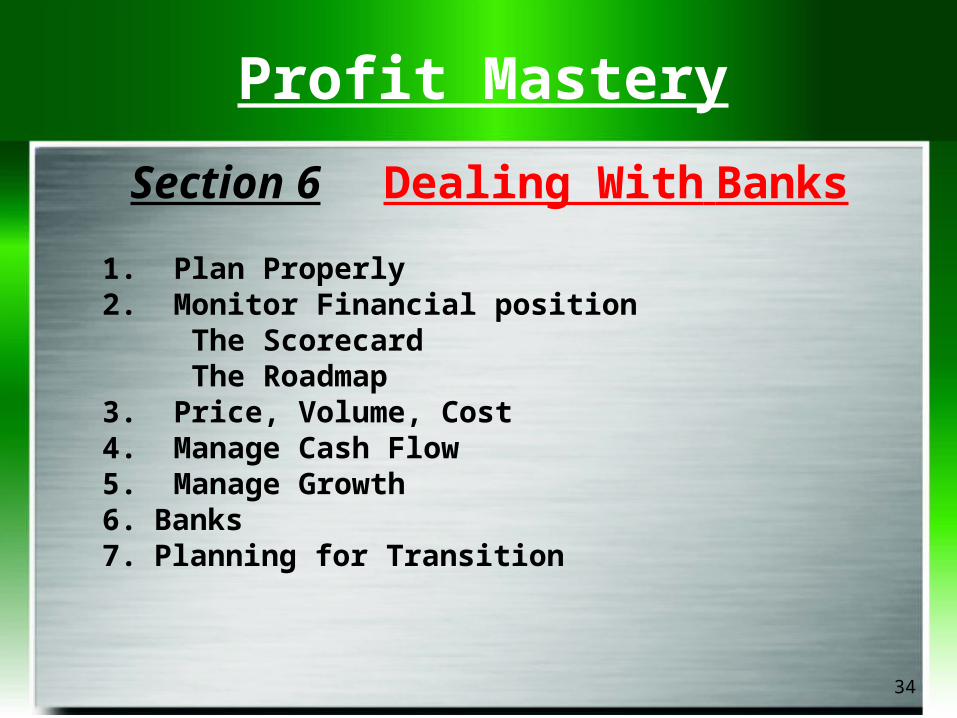
Profit Mastery
Section 6 Dealing With Banks
1. Plan Properly 2. Monitor Financial position The Scorecard The Roadmap 3. Price, Volume, Cost 4. Manage Cash Flow 5. Manage Growth 6. Banks 7. Planning for Transition
35
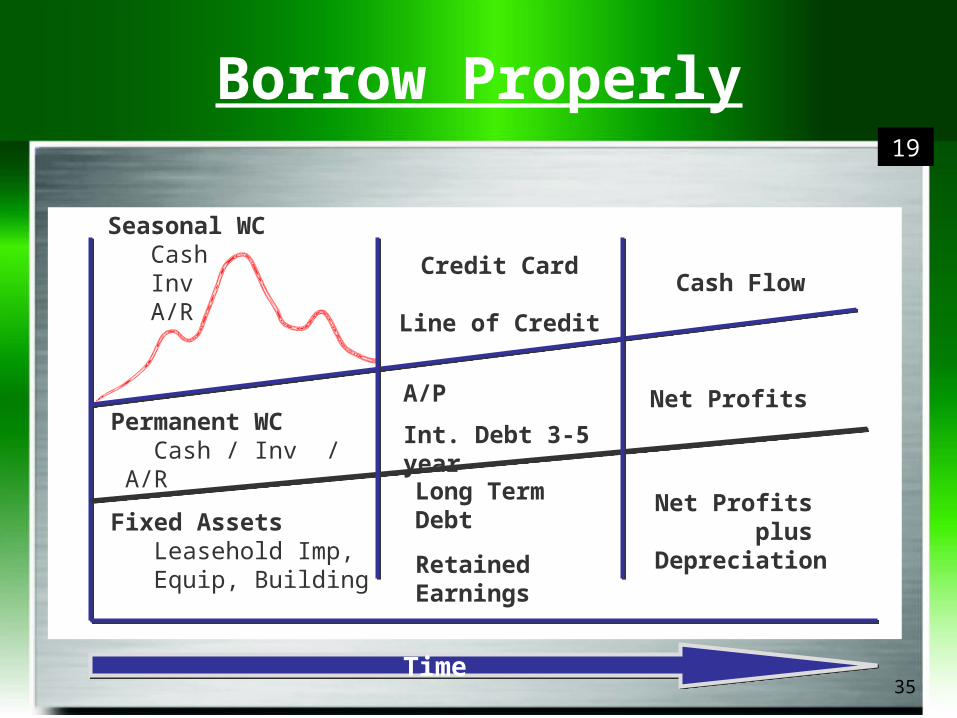
Borrow Properly19
Fixed Assets Leasehold Imp, Equip, Building
Permanent WC Cash / Inv / A/R
Seasonal WC Cash Inv A/R
Credit Card
Line of Credit
A/P
Int. Debt 3-5 year
Long Term Debt
Retained Earnings
Cash Flow
Net Profits
Net Profits plusDepreciation
TimeTime

37
Borrow Properly
Cash Flow Pays Back Short-Term Debt
Net Profit Pays Back Long-Term Debt
19
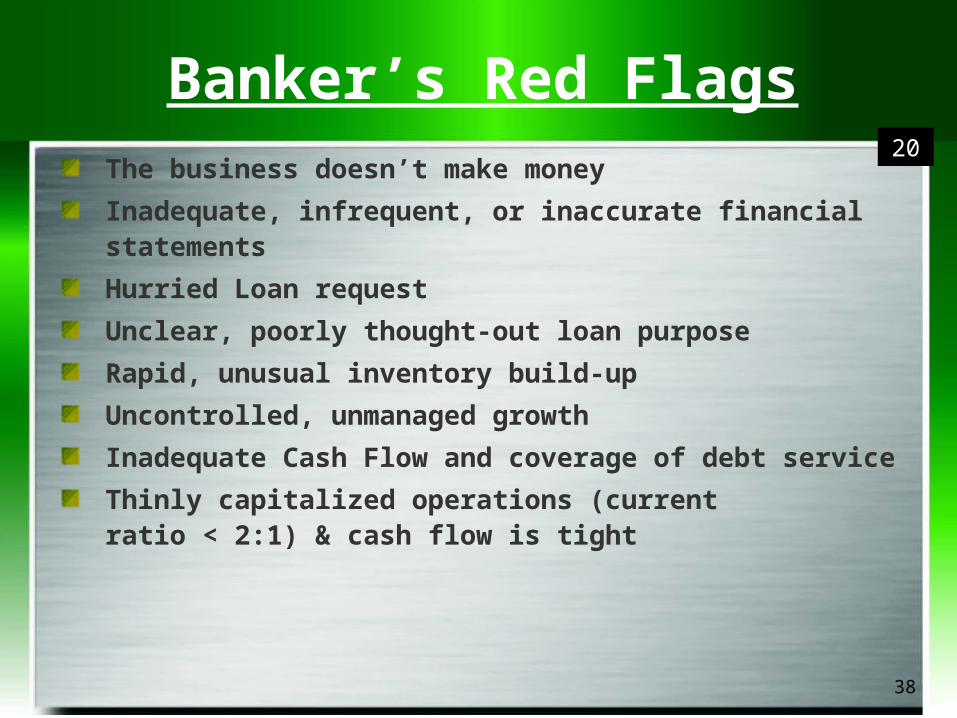
38
Banker’s Red FlagsThe business doesn’t make money
Inadequate, infrequent, or inaccurate financial statements
Hurried Loan request
Unclear, poorly thought-out loan purpose
Rapid, unusual inventory build-up
Uncontrolled, unmanaged growth
Inadequate Cash Flow and coverage of debt service
Thinly capitalized operations (current ratio < 2:1) & cash flow is tight
20

40
Banker’s Red Flags (cont)
Multiple entities that are not clearly divided
for P and L and cash flow purposes
Starting/buying a business with no previous background
Any significant management change:– Owner to kids or internal management– Significant owner health issue
20

41
Business Killers
Divorce – Owner or key employees
50/50 partners
Retired in place
Absentee owner
Overuse of Credit Cards
Permanent, incompetent employees
Big imbalance between business and personal time
Lack of training/expertise – Business, Succession
Expensive or destructive hobbies
Rapid growth - Expansion
New technology
Embezzlement
Family transition
21
42
Profit Mastery
Section 7 Planning for Transition
1. Plan Properly 2. Monitor Financial position The Scorecard The Roadmap 3. Price, Volume, Cost 4. Manage Cash Flow 5. Manage Growth 6. Banks 7. Planning for Transition

43
Plan for Transition
• Sell or Merge
• Liquidate
• Keep it and Pass it on
PLAN!
Critical Decisions22
44
Who Benefits from PM?
Business Owners who do not have adequate financial information
Business Owners who have the “want to” improve their financial performance

45
The Benefits for Owners
Profit Mastery provides Owners:More cash flow and profits
Improved success rate
Proven and practical content
Better understanding of a bank’s loan requirements and makes businesses more “bankable”

47
Why Don’t More Business Owners Do This ? 23
“Don’t have the time”
“Don’t know how”
“If it was important, my CPA would do it”
“It’s not fun”
“I’m more of a crisis manager”

48

49
Does It Work?
Strongly endorsed by participants.
Substantially improves financial literacy.
Enhances a participant’s relationship with the sponsoring bank.
Key Findings from 5,000 participants of Canadian Imperial Bank of Commerce Profit Mastery Program

50
BRS Support
Marketing and Program Logistical Support
Timelines, Marketing Materials, Administrative Guide
Contact with BRS Program Coach
Sales clinics via teleconference

51
Testimonial
“The Profit Mastery series is an amazing course that provided me the financial insight on how I can better control my company’s profits and cash flow. The series would be great for a start-up or a well established business trying to understand how to make a profit.
The Road Map chart and the exercises we did as a group helped me pinpoint areas in all of our departments where we can improve our performance. All business owners should take this series.”
Russ Sorkness, PresidentSorkness AviationKent, Washington

52
Testimonial
“I’ve used Profit Mastery to improve my margin and understand how a small improvement can have a huge impact on my profitability. I take the Biz FIT test once a year and the loan proposal is a great template for our companies to use.”
Jim Sunderland James & Sons
Chicago, Ill

53
Profit Mastery
• It’s all about ABILITY:
ControlABILITY
BankABILITY
SustainABILITY
and the outcome…?
ProfitABILITY
24

54
Profit Mastery
…and that is achieved by:
Knowledge Driven
Financial Performance
24

55
Thank you!
Rod Bristol 206.284.5102 ext 13Vice President of Business Development 800.488.3520 toll
freeBusiness Resource Services 206-282-4092 (fax)200 First Ave West, Suite 301 206.427.5333 (cell)Seattle WA 98119 [email protected]
Follow us on Facebook!www.facebook.com/profitmastery
Related Documents


