Data-Mining Twitter and the Autism Spectrum Disorder: A Pilot Study Adham Beykikhoshk † Ognjen Arandjelovi´ c † Dinh Phung † Svetha Venkatesh † Terry Caelli ‡ † Centre for Pattern Recognition and Data Analytics ‡ National ICT Australia (NICTA) Deakin Univeristy, Australia Melbourne, Australia Abstract The autism spectrum disorder (ASD) is increasingly be- ing recognized as a major public health issue which affects approximately 0.5-0.6% of the population. Promoting the general awareness of the disorder, increasing the engage- ment with the affected individuals and their carers, and un- derstanding the success of penetration of the current clini- cal recommendations in the target communities, is crucial in driving research as well as policy. The aim of the present work is to investigate if Twitter, as a highly popular platform for information exchange, can be used as a data-mining source which could aid in the aforementioned challenges. Specifically, using a large data set of harvested tweets, we present a series of experiments which examine a range of linguistic and semantic aspects of messages posted by indi- viduals interested in ASD. Our findings, the first of their na- ture in the published scientific literature, strongly motivate additional research on this topic and present a methodolog- ical basis for further work. 1. Introduction In this paper we describe the first study of Twitter as a medium for mining data pertaining to the population af- fected by the autism spectrum disorder (ASD). Considering the well-known challenge of reaching and engaging with this specific target population, it is clear that our work and findings pave the way for further work of outstanding poten- tial benefit to public health. These benefits include the en- richment of the corpus of knowledge of the condition itself by the medical community, and the increased understanding of the practices and concerns of those affected by ASD. 1.1. Related previous work While this is the first work exploring the possibility of using Twitter data for the extraction of ASD-related infor- mation, the broad idea of data-mining Twitter is not new and has been employed successfully in a variety of applica- tions. At the same time it is important to stress at the very outset that most of the previous work on this topic has not been automatic, that is, analysis was performed by humans. This is a laborious process which severely limits how much data can be processed. Additionally, the use of human in- telligence rather than computer-based methods means that in the case of many reported results, it is not clear that the same results could be obtained automatically due to a pos- sible semantic gap. A popular research direction focuses on various forms of prediction based on tweet sentiments [14] inferred from the tweet’s emoticons [4] or using linguistics-based classi- fiers [1]. For example, Asur and Huberman [2] showed that tweet posting rate can be used to forecast film box office revenues, while Baucom et al. [3] used sentiment to anal- yse the relationship between the content of tweets and the outcomes of NBA Playoff games. Bollen et al. [5] showed that tweet sentiments, aggregately seen as a reflection of public mood levels, can be be used to predict the incidence of socio-political, cultural, and economic events. Mitchell et al. [16] used geo-tagged tweets across the United States to estimate localized changes in a variety of sociometric in- dices such as happiness, the level of education, and obesity rates. The quasi-realtime nature of Twitter also makes it a po- tentially valuable resource for the detection and manage- ment of emergency situations [26]. For example, Robinson et al. [23] described an earthquake detection system, while Sakaki et al. [24] used a spatio-temporal model of tweet frequencies to infer the location of the epicentre of an earth- quake. Closer in spirit to the nature of work in the present paper is the corpus of work on the use of Twitter in the domain of health care. For example, Paul and Dredze [20] used tweets to extract words related to symptoms and treatments, and a topic model to associate them with the correspond- ing ailments. In their subsequent work [19], the model was extended to track the spread of illnesses over time, mea- sure behavioural risk factors, and analyse symptoms and medication usage. The use of LDA-based health topic mod- elling topics was explored by Prier et al. [21]. Dementia- related tweets were the focus of work by Robillard et al.

Welcome message from author
This document is posted to help you gain knowledge. Please leave a comment to let me know what you think about it! Share it to your friends and learn new things together.
Transcript
Data-Mining Twitter and the Autism Spectrum Disorder: A Pilot Study
Adham Beykikhoshk† Ognjen Arandjelovic† Dinh Phung† Svetha Venkatesh† Terry Caelli‡† Centre for Pattern Recognition and Data Analytics ‡ National ICT Australia (NICTA)
Deakin Univeristy, Australia Melbourne, Australia
Abstract
The autism spectrum disorder (ASD) is increasingly be-ing recognized as a major public health issue which affectsapproximately 0.5-0.6% of the population. Promoting thegeneral awareness of the disorder, increasing the engage-ment with the affected individuals and their carers, and un-derstanding the success of penetration of the current clini-cal recommendations in the target communities, is crucialin driving research as well as policy. The aim of the presentwork is to investigate if Twitter, as a highly popular platformfor information exchange, can be used as a data-miningsource which could aid in the aforementioned challenges.Specifically, using a large data set of harvested tweets, wepresent a series of experiments which examine a range oflinguistic and semantic aspects of messages posted by indi-viduals interested in ASD. Our findings, the first of their na-ture in the published scientific literature, strongly motivateadditional research on this topic and present a methodolog-ical basis for further work.
1. Introduction
In this paper we describe the first study of Twitter as amedium for mining data pertaining to the population af-fected by the autism spectrum disorder (ASD). Consideringthe well-known challenge of reaching and engaging withthis specific target population, it is clear that our work andfindings pave the way for further work of outstanding poten-tial benefit to public health. These benefits include the en-richment of the corpus of knowledge of the condition itselfby the medical community, and the increased understandingof the practices and concerns of those affected by ASD.
1.1. Related previous work
While this is the first work exploring the possibility ofusing Twitter data for the extraction of ASD-related infor-mation, the broad idea of data-mining Twitter is not newand has been employed successfully in a variety of applica-tions. At the same time it is important to stress at the very
outset that most of the previous work on this topic has notbeen automatic, that is, analysis was performed by humans.This is a laborious process which severely limits how muchdata can be processed. Additionally, the use of human in-telligence rather than computer-based methods means thatin the case of many reported results, it is not clear that thesame results could be obtained automatically due to a pos-sible semantic gap.
A popular research direction focuses on various formsof prediction based on tweet sentiments [14] inferred fromthe tweet’s emoticons [4] or using linguistics-based classi-fiers [1]. For example, Asur and Huberman [2] showed thattweet posting rate can be used to forecast film box officerevenues, while Baucom et al. [3] used sentiment to anal-yse the relationship between the content of tweets and theoutcomes of NBA Playoff games. Bollen et al. [5] showedthat tweet sentiments, aggregately seen as a reflection ofpublic mood levels, can be be used to predict the incidenceof socio-political, cultural, and economic events. Mitchellet al. [16] used geo-tagged tweets across the United Statesto estimate localized changes in a variety of sociometric in-dices such as happiness, the level of education, and obesityrates.
The quasi-realtime nature of Twitter also makes it a po-tentially valuable resource for the detection and manage-ment of emergency situations [26]. For example, Robinsonet al. [23] described an earthquake detection system, whileSakaki et al. [24] used a spatio-temporal model of tweetfrequencies to infer the location of the epicentre of an earth-quake.
Closer in spirit to the nature of work in the present paperis the corpus of work on the use of Twitter in the domainof health care. For example, Paul and Dredze [20] usedtweets to extract words related to symptoms and treatments,and a topic model to associate them with the correspond-ing ailments. In their subsequent work [19], the model wasextended to track the spread of illnesses over time, mea-sure behavioural risk factors, and analyse symptoms andmedication usage. The use of LDA-based health topic mod-elling topics was explored by Prier et al. [21]. Dementia-related tweets were the focus of work by Robillard et al.
[22] who collected relevant tweets over a 24h period usingkeyword filtering and used them to discover the dominantchatter themes. Similarly, Scanfeld et al. [25] used Twit-ter to analyse the patterns of antibiotic use. Jashnisky et al.[13] studied the relationship between Twitter conversationsdeemed to reflect high suicide risk and actual suicide ratesin the United States. They demonstrated that high risk in-dividuals may be recognized from their social media status.Lastly, Himelboim and Han [12] examined the connectivitypatterns of Twitter users interacting within a specific onlinecommunity of cancer-affected individuals.
In contrast to the sporadic studies on different diseasesdescribed above, the use of Twitter data in the managementof highly contagious diseases like influenza has attracted amore concentrated research effort. For example, Culotta [8]investigated whether the frequency of influenza epidemic-related tweets can be related to ‘ground truth’ data fromcentres for disease control and prediction. Achrekar et al.[11] showed that the emergence and the spread of epidemicinfluenza can be predicted and tracked from the locationand demographic information of users of relevant tweets. Asimilar approach was also described by Li and Cardie [15].Yet further evidence of the power of Twitter data was pre-sented by Chew and Eysenbach [6] who demonstrated thatthe spatio-temporal distribution of relevant tweet frequen-cies during the 2009 H1N1 outbreak closely matches thedisease spreading pattern.
Although the use of Twitter for data-mining informationrelated to ASD has not been explored yet, there has beensome preliminary work on the use of other social mediaand ASD. For example, Newton et al. [17] used Linguis-tic Inquiry and Word Count (LIWC) dictionaries to com-pare writing patterns of individuals with ASD and those ofneuro-typical bloggers.
2. Experimental findings and discussionHaving outlined the motivation and our ultimate vision
for this work, and placed it in context of previous researchon data-mining social media, we now turn our attention tothe main contribution of the present paper. We start by de-scribing the data set we used for our analysis.
2.1. Data acquisition
Twitter’s Terms of Service explicitly prohibits the shar-ing or redistribution of tweets. Consequently, there was nostandard public data set that we would use for this study.Instead, we collected a large data set ourselves.
Twitter API offers different means of retrieving tweets.In particular, we used its ‘search’ and ’streaming’ functions.The former allows the retrieval of historical tweets based onthe presence of specific keywords and meta-data constraints(e.g. on the language or user location). After being posted,a tweet can be obtained in this manner for up to a week. The
streaming API allows a quasi-realtime retrieval of tweets asthey are posted, retrieving a sample of approximately 1%of all tweets. The search API was most valuable for us forcollecting ASD-related content, as we will describe in detailshortly. Conversely, the streaming API allowed us to obtain‘control’ data, unrelated to ASD, since this set could not bewell characterized a priori using a compact set of keywords.
We collected only tweets posted in English. To facilitatea comparative analysis, we collected two non-overlappingdata sets. The first of these, which we will refer to as theASD subset, comprises tweets which concern ASD. Specif-ically, we defined the ASD subset as comprising tweetswhich contain any of the five keywords “autism”, “adhd”,“autismawareness”, “asperger”, and “aspie”, and the con-trol subset as comprising all other tweets. In total thisresulted in a corpus of 944,568 ASD-related tweets col-lected in the period starting on 26 August 2013 and end-ing on 25 November 2013 (i.e. 13 consecutive weeks). Ofthese, 663,744 were original tweets which were producedby 258,657 unique users, with the remaining 30% of themessages being re-tweets.
It is important to observe that it is not our claim thattweets in the ASD subset were necessarily posted by indi-viduals suffering from ASD. While some of the messagesin this subset do fall into this category, the subset will alsoinclude posts by individuals affected by ASD in a loosersense, e.g. parents or carers of those who suffer from ASD.
2.1.1 Pre-processing
Much of the work in the present paper concerns the analysisof topics discussed by means of Twitter. In this context itis beneficial to have different inflections of the same wordnormalized and represented by a single term. In linguisticsthis process is referred to as lemmatization and we applyit automatically using the freely available TweetNLP soft-ware package [18]. In addition, we remove the so-called‘stop words’ which do not carry much meaning themselves(e.g. articles and connectives), as well as all punctuationmarks and emoticons. Thus, to illustrate with an example,the tweet:
Looks like we will have more #autism researchhappening for children in #EarlyIntervention nextyear! :-) #VisualSupports #MobileTech
after our pre-processing becomes:
look like autism research happen child in earlyin-tervention visualsupports mobiletech
2.2. Methods and results
2.2.1 Zipf’s law
The first experiment we conducted was set to find out iftweets, both in the ASD corpus as well as the control group,
obey the so-called Zipf’s law. In its general form, this lawposits that the frequency of an ‘event’ Pi is approximatelya power function of its frequency rank ri, i.e. Pi ∝ rai .More specifically, ri is the rank of the event Pi when eventsare ordered by their frequency of occurrence from high tolow. This regularity is observed in a variety of domains suchas information retrieval and quantitative linguistics [7]. Inquantitative linguistics and indeed in the present work, anevent corresponds to the usage of a particular word.
Evidence from previous work suggests that conventionaltexts, such as newspapers or books, do result in a Zipfiandistribution of word frequencies [7]. However, it is not clearfrom this that the same applies to tweets. Firstly, tweets arerestricted in length to 140 characters which by itself mayalter linguistic characteristics of posted messages. In ad-dition, the nature of Twitter as a communication mediuminvariably introduces a self-selecting aspect: neither can thecorpus of Twitter users be considered to be a random samplefrom the population, nor can the memetic content of tweetsbe expected to match that of texts examined by previouswork, such as newspapers and books.
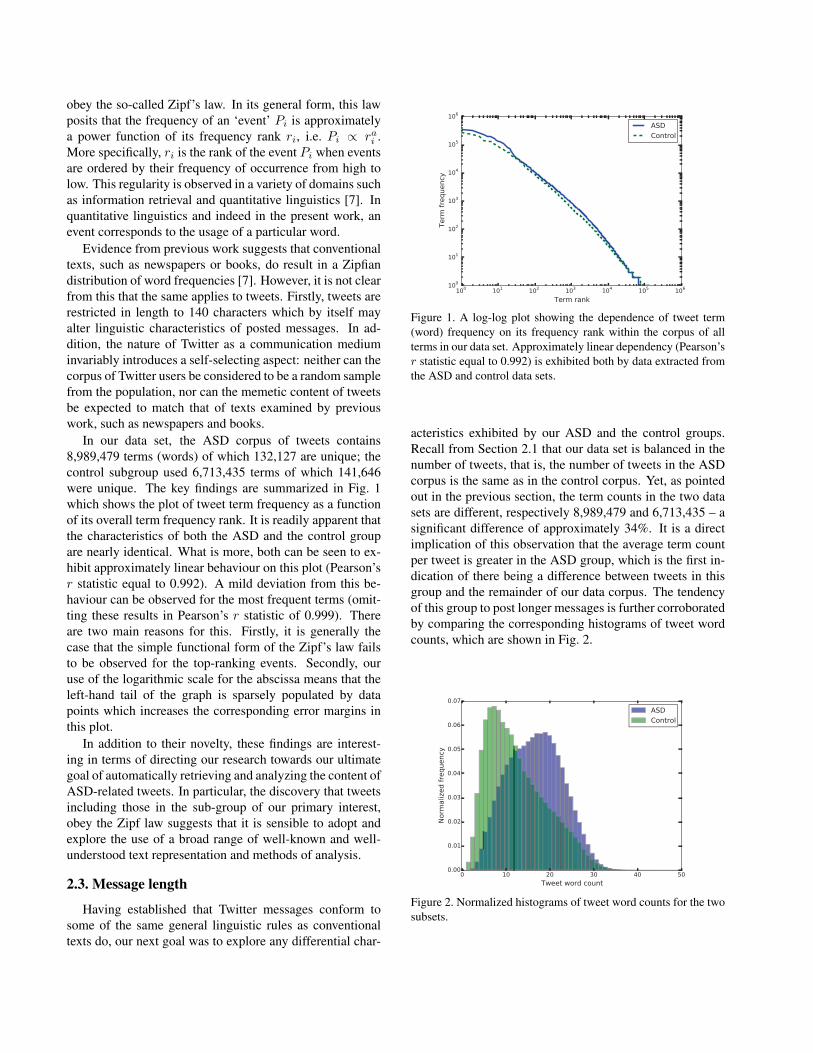
In our data set, the ASD corpus of tweets contains8,989,479 terms (words) of which 132,127 are unique; thecontrol subgroup used 6,713,435 terms of which 141,646were unique. The key findings are summarized in Fig. 1which shows the plot of tweet term frequency as a functionof its overall term frequency rank. It is readily apparent thatthe characteristics of both the ASD and the control groupare nearly identical. What is more, both can be seen to ex-hibit approximately linear behaviour on this plot (Pearson’sr statistic equal to 0.992). A mild deviation from this be-haviour can be observed for the most frequent terms (omit-ting these results in Pearson’s r statistic of 0.999). Thereare two main reasons for this. Firstly, it is generally thecase that the simple functional form of the Zipf’s law failsto be observed for the top-ranking events. Secondly, ouruse of the logarithmic scale for the abscissa means that theleft-hand tail of the graph is sparsely populated by datapoints which increases the corresponding error margins inthis plot.
In addition to their novelty, these findings are interest-ing in terms of directing our research towards our ultimategoal of automatically retrieving and analyzing the content ofASD-related tweets. In particular, the discovery that tweetsincluding those in the sub-group of our primary interest,obey the Zipf law suggests that it is sensible to adopt andexplore the use of a broad range of well-known and well-understood text representation and methods of analysis.
2.3. Message length
Having established that Twitter messages conform tosome of the same general linguistic rules as conventionaltexts do, our next goal was to explore any differential char-
Figure 1. A log-log plot showing the dependence of tweet term(word) frequency on its frequency rank within the corpus of allterms in our data set. Approximately linear dependency (Pearson’sr statistic equal to 0.992) is exhibited both by data extracted fromthe ASD and control data sets.
acteristics exhibited by our ASD and the control groups.Recall from Section 2.1 that our data set is balanced in thenumber of tweets, that is, the number of tweets in the ASDcorpus is the same as in the control corpus. Yet, as pointedout in the previous section, the term counts in the two datasets are different, respectively 8,989,479 and 6,713,435 – asignificant difference of approximately 34%. It is a directimplication of this observation that the average term countper tweet is greater in the ASD group, which is the first in-dication of there being a difference between tweets in thisgroup and the remainder of our data corpus. The tendencyof this group to post longer messages is further corroboratedby comparing the corresponding histograms of tweet wordcounts, which are shown in Fig. 2.
Figure 2. Normalized histograms of tweet word counts for the twosubsets.
2.4. Content analysis
Our next aim was to explore if the most talked about top-ics in the ASD community differ from those of the controldata set.
2.4.1 Word frequency
In the first experiment we approached this task by compar-ing the most frequently used words in the two data sets.These words can be seen as a simple cumulative proxy forthe actual content of individual messages. The key resultsare illustrated in Fig. 3(a) and Fig. 3(b) which show 100most frequent words in respectively the ASD and controldata sets, displayed as so-called ‘word-clouds’ whereby thefrequency of a particular word is encoded by the corre-sponding font size. We used a linear scale, the font size thusbeing proportional to the corresponding word’s frequency ina data set.
As readily observed from Fig. 3 the most commonly usedwords in the two groups of tweets reveal a substantial dif-ference in the nature of discussed topics. A more thoroughexamination reveals even further meaningful patterns coher-ent with the existing literature on the ASD. In particular,observe the presence of a large number of words in the plotcorresponding to the ASD group which are related to chil-dren such as ‘children’, ’kids’, ’child’, and ’son’, for exam-ple. There are a number of reasons why this is unsurprising.Firstly, the diagnosis of the ASD is usually made in earlychildhood so it is reasonable to expect that the parents con-fronting this new challenge would have increased initiativeat seeking help from the community of parents in a similarsituation. In addition, while undoubtedly always vulnera-ble, the vulnerability of individuals on the autism spectrumis the greatest while they are young which is when they needthe most support from their guardians and therapists e.g. atacquiring the skills needed to progress thorough the educa-tional system and integrate in the society.
It is also interesting to observe the high frequency of thewords ‘son’ and ‘boy’ in the ASD data (top-right section ofthe word cloud), and the absence of the equivalent femalesex words ’daughter’ and ‘girl’. This example illustrateswell how the content of tweets can be used to extract somerather subtle information. In particular in this case our find-ings are consistent with the understanding of the medicalcommunity and a body of evidence which shows that boysare nearly five times more likely to suffer from autism thangirls [9].
In contrast, the most frequently used words in the con-trol group do not seem to follow any particular pattern orfocus of interest, and instead pertain to more general ev-eryday interests and activities. Lastly, it is interesting toobserve that the set of words in Fig. 3(a) appears to containmore nouns than Fig. 3(b), and fewer verbs. This suggests a
different nature of information exchange in the ASD groupwhich appears more focused on issues (syndromes, disor-ders, interventions, support, help, and so on) and individu-als (mostly children), both being described by nouns, whilethe users who posted tweets of the control group seems tobe more interested in what it is that they are or will be do-ing (like, want, go, think, and so on). We will explore thisquantitatively in more detail in Section 2.4.3.
2.4.2 Hashtag analysis
An alternative proxy for tweet content can be found in user-designated tags, the so-called ‘hashtags’. These can be rec-ognized by the leading special character ‘#’ (the hash sign)and are by convention understood to be meta-data labels insome manner connected with the content of the tweet whichcontains them. As before, we summarize our findings asword-clouds of the 100 most frequent hashtags in the ASDand control data sets in Fig. 4(a) and Fig. 4(b).
As in the previous analysis of the most frequently usedterms, the difference between the two data sets is read-ily apparent. Unsurprisingly, most of the hashtags in theASD data set pertain to health issues, some of which areipso facto ASD related, such as ‘mentalhealth’ and ‘psy-chology’, while others are less obviously so. Examplesof the latter include ‘fibromyalgia’ and ‘vaccines’. Fi-bromyalgia is a class of disorders related to the body’s pro-cessing of pain which recent evidence suggests may havea potential connection with the ASD [10]. Similarly, al-though now discredited, previous research had suggested acausal link between children being vaccinated and devel-oping autism [27]. These examples are further evidence ofthe type of powerful information which can be harvestedfrom Twitter. In particular, it shows that it is possible todata-mine tweets to provide feedback to medical practition-ers on the concerns of the ASD community, the penetration(or lack thereof) of relevant public health recommendations(e.g. ABA or the applied behaviour analysis), or the adop-tion of treatments of questionable efficacy (e.g. homeopa-thy, gluten-free diet).
Much like the word-cloud in Fig. 3(a), the hashtag word-cloud in Fig. 4(a) contains many references to various top-ics pertaining to the support of individuals on the autismspectrum. However, the nature of the two sets of terms issomewhat different. While the most frequently used termsmostly referred to the issues themselves, the correspondinghashtags mostly refer to particular support groups. For ex-ample, ‘autismspeaks’ (centre-left position within the word-cloud) is a US-based autism advocacy organisation, ‘thi-sisautism’ (centre-right position within the word-cloud) aTwitter stream used to share autism-related experienced,and ‘AS2DC’ (top-right corner of the word-cloud) an actionsummit on autism held in Washington D. C.

(a) ASD ‘word-cloud’(b) Control ‘word-cloud’
Figure 3. The most frequent words in the (a) ASD and (b) control data sets, shown as so-called ‘word-clouds’. The font size used to displaya particular word is proportional to the corresponding word’s frequency in the data set.
(a) ASD hashtags ‘word-cloud’(b) Control hashtags ‘word-cloud’
Figure 4. The most frequent hashtags in the (a) ASD and (b) control data sets, shown as so-called ‘word-clouds’. The font size used todisplay a particular word is proportional to the corresponding word’s frequency in the data set. Note that the hashtags corresponding to thesearch keywords have been removed before producing the ASD word-cloud.
2.4.3 Part of speech analysis
In Section 2.4.1, in the discussion of our findings in thecomparative analysis of the most frequently used words inthe ASD and control tweets, we observed that the ASDtweets appeared to contain a greater proportion of nounsand a smaller proportion of verbs than the control tweets.This observation led us to investigate this matter in furtherdetail. In particular, we compared the usage of differentparts of speech (POS) in the two data sets.
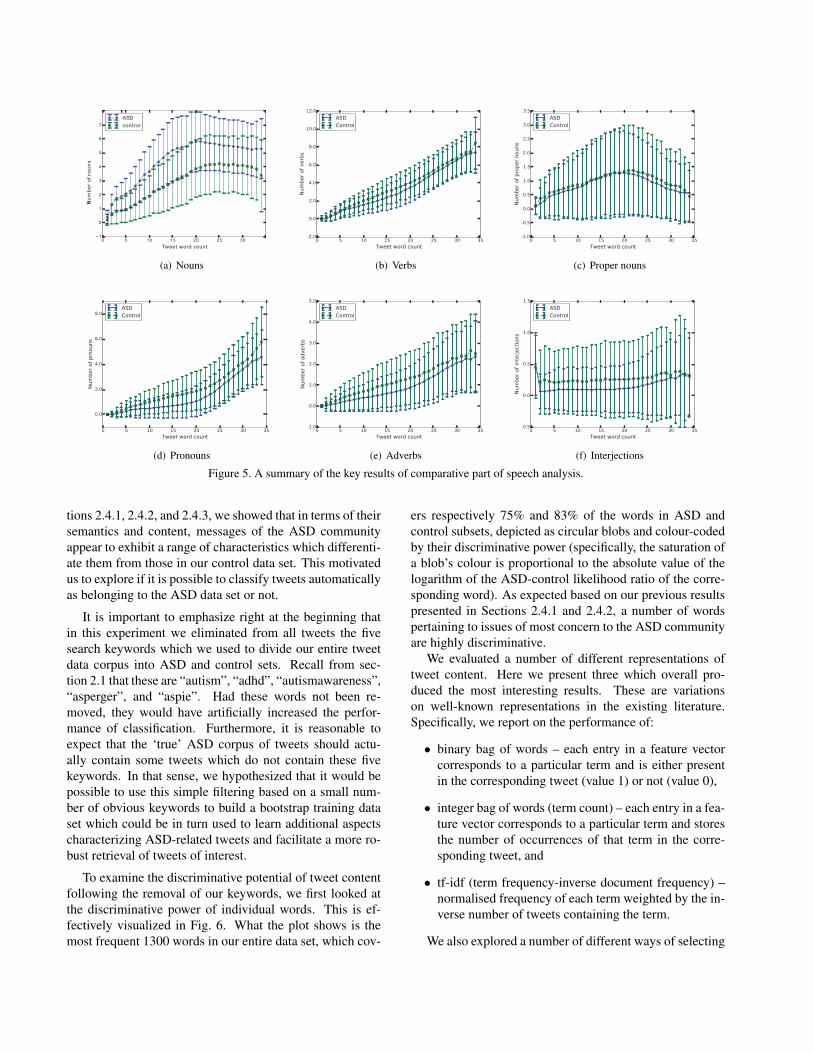
We used the free TweetNLP software package [18],trained on Twitter data, to tag automatically all terms inour entire data set according to their POS type. A selectedset of the most interesting results is shown in the plots inFig. 5. The first thing to observe from the entire corpusof results is that there is a consistent difference betweenthe ASD and control tweets. This is witnessed by the factthat in each of the plots the same relative behaviour is ex-hibited regardless of the tweet length. Secondly, note byobserving the plots in Fig. 5(a) and Fig. 5(b) that our hy-pothesis from Section 2.4.1 is confirmed. For the averagetweet length (as counted by the number of words in the mes-
sage) of 15-20 terms, the number of nouns in the ASD dataset is about twice the number of nouns in the control dataset. The difference in the number of verbs, while not assubstantial, is also significant – for the average length mes-sage, the control data set contains approximately 20% moreverbs. Interestingly, the number of proper nouns does notappear to differ significantly between the two groups. Thisis perhaps somewhat surprising, as it could be expected thatthe control group would engage more in the discussion ofso-called celebrities. A more thorough, manual examina-tion of relevant tweets reveals the reason – while the ASDgroup does engage in less chatter about celebrities, this isoffset by the substantial attention that autistic people, spe-cific autism activists, or politicians commenting or actingon autism-related issues receive.
2.5. Automatic message categorization
In Section 2.2.1 we provided evidence that tweets, in-cluding those made by the community interested in theASD, obey some of the same general regularities whenit comes to the pattern of word usage. Then, start-ing in Section 2.3 and corroborating this further in Sec-
(a) Nouns (b) Verbs (c) Proper nouns
(d) Pronouns (e) Adverbs (f) Interjections
Figure 5. A summary of the key results of comparative part of speech analysis.
tions 2.4.1, 2.4.2, and 2.4.3, we showed that in terms of theirsemantics and content, messages of the ASD communityappear to exhibit a range of characteristics which differenti-ate them from those in our control data set. This motivatedus to explore if it is possible to classify tweets automaticallyas belonging to the ASD data set or not.
It is important to emphasize right at the beginning thatin this experiment we eliminated from all tweets the fivesearch keywords which we used to divide our entire tweetdata corpus into ASD and control sets. Recall from sec-tion 2.1 that these are “autism”, “adhd”, “autismawareness”,“asperger”, and “aspie”. Had these words not been re-moved, they would have artificially increased the perfor-mance of classification. Furthermore, it is reasonable toexpect that the ‘true’ ASD corpus of tweets should actu-ally contain some tweets which do not contain these fivekeywords. In that sense, we hypothesized that it would bepossible to use this simple filtering based on a small num-ber of obvious keywords to build a bootstrap training dataset which could be in turn used to learn additional aspectscharacterizing ASD-related tweets and facilitate a more ro-bust retrieval of tweets of interest.
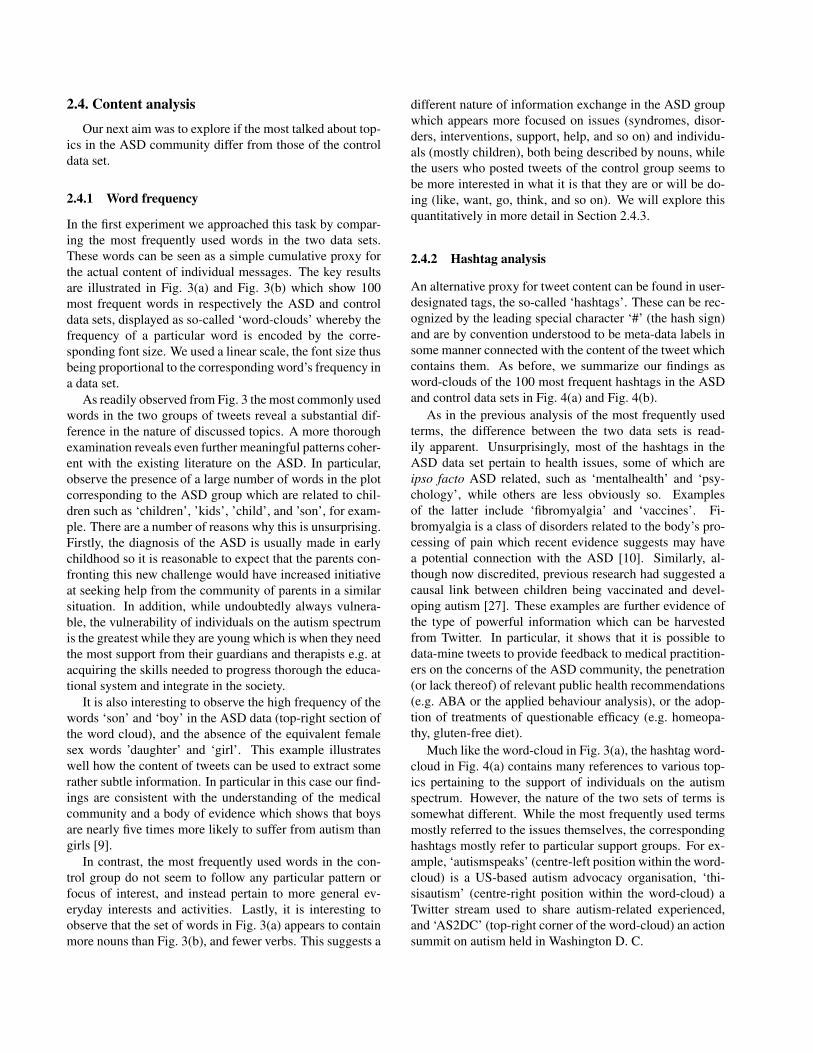
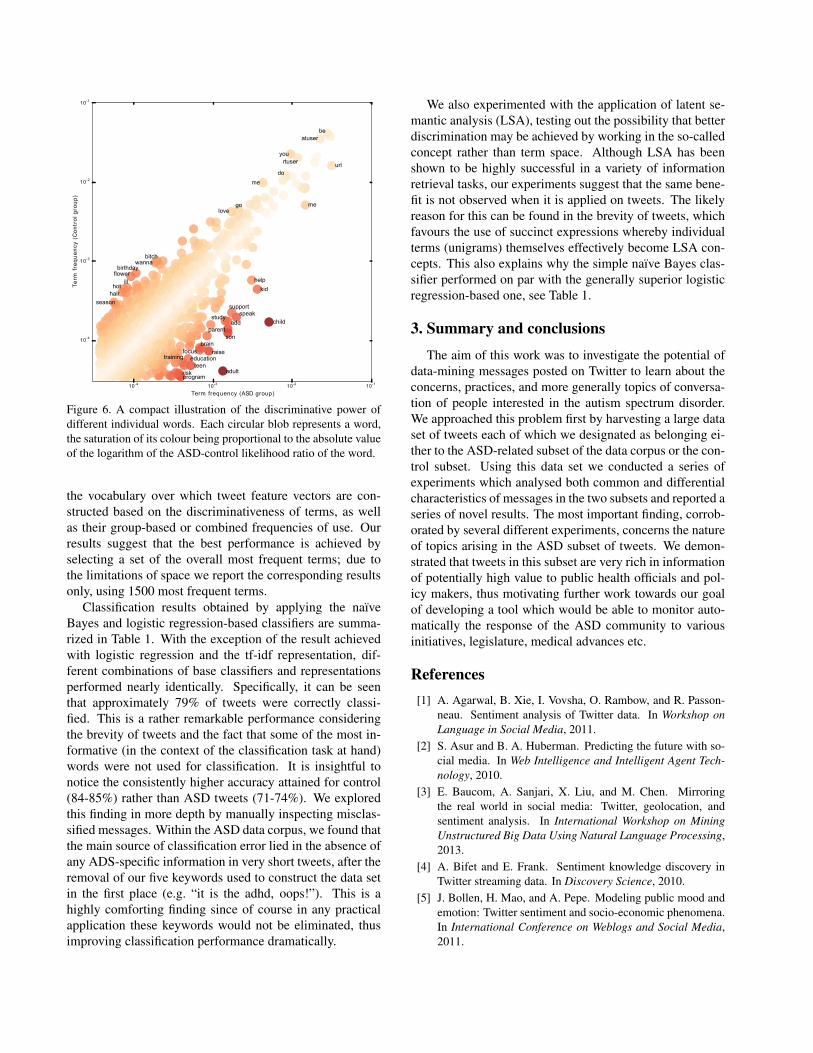
To examine the discriminative potential of tweet contentfollowing the removal of our keywords, we first looked atthe discriminative power of individual words. This is ef-fectively visualized in Fig. 6. What the plot shows is themost frequent 1300 words in our entire data set, which cov-
ers respectively 75% and 83% of the words in ASD andcontrol subsets, depicted as circular blobs and colour-codedby their discriminative power (specifically, the saturation ofa blob’s colour is proportional to the absolute value of thelogarithm of the ASD-control likelihood ratio of the corre-sponding word). As expected based on our previous resultspresented in Sections 2.4.1 and 2.4.2, a number of wordspertaining to issues of most concern to the ASD communityare highly discriminative.
We evaluated a number of different representations oftweet content. Here we present three which overall pro-duced the most interesting results. These are variationson well-known representations in the existing literature.Specifically, we report on the performance of:
• binary bag of words – each entry in a feature vectorcorresponds to a particular term and is either presentin the corresponding tweet (value 1) or not (value 0),
• integer bag of words (term count) – each entry in a fea-ture vector corresponds to a particular term and storesthe number of occurrences of that term in the corre-sponding tweet, and
• tf-idf (term frequency-inverse document frequency) –normalised frequency of each term weighted by the in-verse number of tweets containing the term.
We also explored a number of different ways of selecting
10-4 10-3 10-2 10-1
Term frequency (ASD group)
10-4
10-3
10-2
10-1
Term
frequency(Controlgroup)
beatuser
rtuseryou
me
lovego
do
child
adult
help
kid
me
url
sonparent
supportspeak
studyadd
program
raisebrain
focuseducationteen
risk
training
season
hairhot
ill
birthdaywanna
bitch
flower
Figure 6. A compact illustration of the discriminative power ofdifferent individual words. Each circular blob represents a word,the saturation of its colour being proportional to the absolute valueof the logarithm of the ASD-control likelihood ratio of the word.
the vocabulary over which tweet feature vectors are con-structed based on the discriminativeness of terms, as wellas their group-based or combined frequencies of use. Ourresults suggest that the best performance is achieved byselecting a set of the overall most frequent terms; due tothe limitations of space we report the corresponding resultsonly, using 1500 most frequent terms.
Classification results obtained by applying the naıveBayes and logistic regression-based classifiers are summa-rized in Table 1. With the exception of the result achievedwith logistic regression and the tf-idf representation, dif-ferent combinations of base classifiers and representationsperformed nearly identically. Specifically, it can be seenthat approximately 79% of tweets were correctly classi-fied. This is a rather remarkable performance consideringthe brevity of tweets and the fact that some of the most in-formative (in the context of the classification task at hand)words were not used for classification. It is insightful tonotice the consistently higher accuracy attained for control(84-85%) rather than ASD tweets (71-74%). We exploredthis finding in more depth by manually inspecting misclas-sified messages. Within the ASD data corpus, we found thatthe main source of classification error lied in the absence ofany ADS-specific information in very short tweets, after theremoval of our five keywords used to construct the data setin the first place (e.g. “it is the adhd, oops!”). This is ahighly comforting finding since of course in any practicalapplication these keywords would not be eliminated, thusimproving classification performance dramatically.
We also experimented with the application of latent se-mantic analysis (LSA), testing out the possibility that betterdiscrimination may be achieved by working in the so-calledconcept rather than term space. Although LSA has beenshown to be highly successful in a variety of informationretrieval tasks, our experiments suggest that the same bene-fit is not observed when it is applied on tweets. The likelyreason for this can be found in the brevity of tweets, whichfavours the use of succinct expressions whereby individualterms (unigrams) themselves effectively become LSA con-cepts. This also explains why the simple naıve Bayes clas-sifier performed on par with the generally superior logisticregression-based one, see Table 1.
3. Summary and conclusions
The aim of this work was to investigate the potential ofdata-mining messages posted on Twitter to learn about theconcerns, practices, and more generally topics of conversa-tion of people interested in the autism spectrum disorder.We approached this problem first by harvesting a large dataset of tweets each of which we designated as belonging ei-ther to the ASD-related subset of the data corpus or the con-trol subset. Using this data set we conducted a series ofexperiments which analysed both common and differentialcharacteristics of messages in the two subsets and reported aseries of novel results. The most important finding, corrob-orated by several different experiments, concerns the natureof topics arising in the ASD subset of tweets. We demon-strated that tweets in this subset are very rich in informationof potentially high value to public health officials and pol-icy makers, thus motivating further work towards our goalof developing a tool which would be able to monitor auto-matically the response of the ASD community to variousinitiatives, legislature, medical advances etc.
References[1] A. Agarwal, B. Xie, I. Vovsha, O. Rambow, and R. Passon-
neau. Sentiment analysis of Twitter data. In Workshop onLanguage in Social Media, 2011.
[2] S. Asur and B. A. Huberman. Predicting the future with so-cial media. In Web Intelligence and Intelligent Agent Tech-nology, 2010.
[3] E. Baucom, A. Sanjari, X. Liu, and M. Chen. Mirroringthe real world in social media: Twitter, geolocation, andsentiment analysis. In International Workshop on MiningUnstructured Big Data Using Natural Language Processing,2013.
[4] A. Bifet and E. Frank. Sentiment knowledge discovery inTwitter streaming data. In Discovery Science, 2010.
[5] J. Bollen, H. Mao, and A. Pepe. Modeling public mood andemotion: Twitter sentiment and socio-economic phenomena.In International Conference on Weblogs and Social Media,2011.
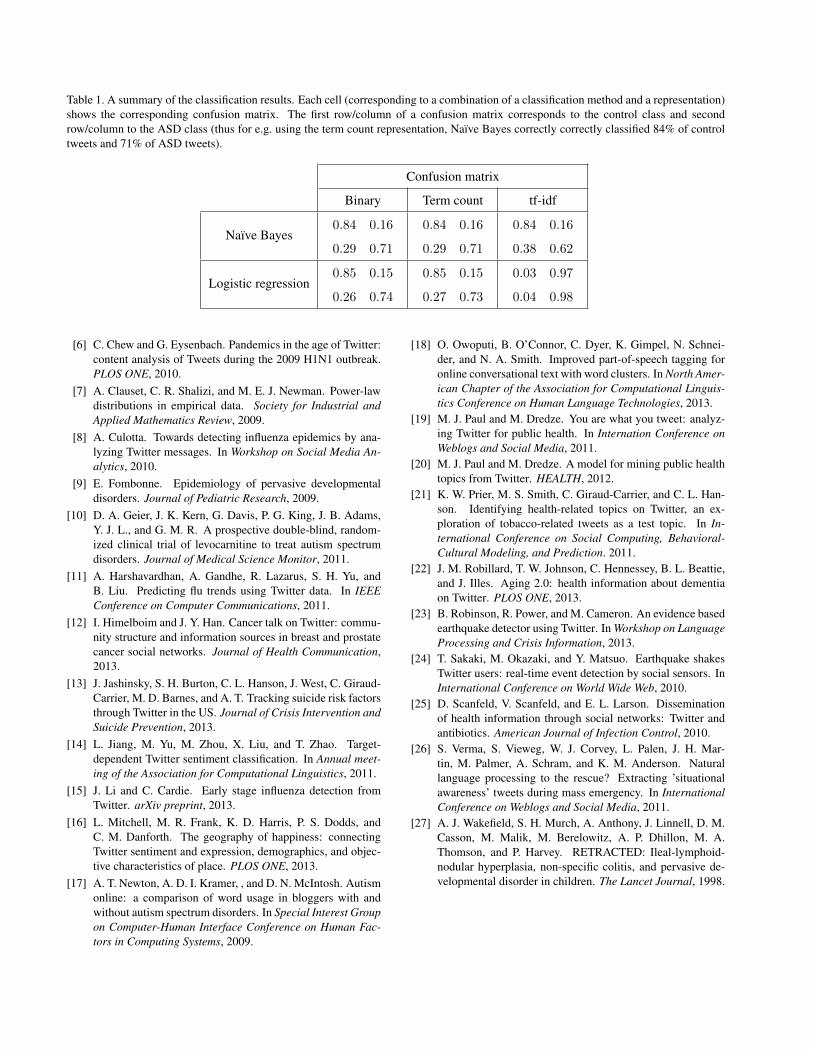
Table 1. A summary of the classification results. Each cell (corresponding to a combination of a classification method and a representation)shows the corresponding confusion matrix. The first row/column of a confusion matrix corresponds to the control class and secondrow/column to the ASD class (thus for e.g. using the term count representation, Naıve Bayes correctly correctly classified 84% of controltweets and 71% of ASD tweets).
Confusion matrix
Binary Term count tf-idf
Naıve Bayes0.84 0.16
0.29 0.71
0.84 0.16
0.29 0.71
0.84 0.16
0.38 0.62
Logistic regression0.85 0.15
0.26 0.74
0.85 0.15
0.27 0.73
0.03 0.97
0.04 0.98
[6] C. Chew and G. Eysenbach. Pandemics in the age of Twitter:content analysis of Tweets during the 2009 H1N1 outbreak.PLOS ONE, 2010.
[7] A. Clauset, C. R. Shalizi, and M. E. J. Newman. Power-lawdistributions in empirical data. Society for Industrial andApplied Mathematics Review, 2009.
[8] A. Culotta. Towards detecting influenza epidemics by ana-lyzing Twitter messages. In Workshop on Social Media An-alytics, 2010.
[9] E. Fombonne. Epidemiology of pervasive developmentaldisorders. Journal of Pediatric Research, 2009.
[10] D. A. Geier, J. K. Kern, G. Davis, P. G. King, J. B. Adams,Y. J. L., and G. M. R. A prospective double-blind, random-ized clinical trial of levocarnitine to treat autism spectrumdisorders. Journal of Medical Science Monitor, 2011.
[11] A. Harshavardhan, A. Gandhe, R. Lazarus, S. H. Yu, andB. Liu. Predicting flu trends using Twitter data. In IEEEConference on Computer Communications, 2011.
[12] I. Himelboim and J. Y. Han. Cancer talk on Twitter: commu-nity structure and information sources in breast and prostatecancer social networks. Journal of Health Communication,2013.
[13] J. Jashinsky, S. H. Burton, C. L. Hanson, J. West, C. Giraud-Carrier, M. D. Barnes, and A. T. Tracking suicide risk factorsthrough Twitter in the US. Journal of Crisis Intervention andSuicide Prevention, 2013.
[14] L. Jiang, M. Yu, M. Zhou, X. Liu, and T. Zhao. Target-dependent Twitter sentiment classification. In Annual meet-ing of the Association for Computational Linguistics, 2011.
[15] J. Li and C. Cardie. Early stage influenza detection fromTwitter. arXiv preprint, 2013.
[16] L. Mitchell, M. R. Frank, K. D. Harris, P. S. Dodds, andC. M. Danforth. The geography of happiness: connectingTwitter sentiment and expression, demographics, and objec-tive characteristics of place. PLOS ONE, 2013.
[17] A. T. Newton, A. D. I. Kramer, , and D. N. McIntosh. Autismonline: a comparison of word usage in bloggers with andwithout autism spectrum disorders. In Special Interest Groupon Computer-Human Interface Conference on Human Fac-tors in Computing Systems, 2009.
[18] O. Owoputi, B. O’Connor, C. Dyer, K. Gimpel, N. Schnei-der, and N. A. Smith. Improved part-of-speech tagging foronline conversational text with word clusters. In North Amer-ican Chapter of the Association for Computational Linguis-tics Conference on Human Language Technologies, 2013.
[19] M. J. Paul and M. Dredze. You are what you tweet: analyz-ing Twitter for public health. In Internation Conference onWeblogs and Social Media, 2011.
[20] M. J. Paul and M. Dredze. A model for mining public healthtopics from Twitter. HEALTH, 2012.
[21] K. W. Prier, M. S. Smith, C. Giraud-Carrier, and C. L. Han-son. Identifying health-related topics on Twitter, an ex-ploration of tobacco-related tweets as a test topic. In In-ternational Conference on Social Computing, Behavioral-Cultural Modeling, and Prediction. 2011.
[22] J. M. Robillard, T. W. Johnson, C. Hennessey, B. L. Beattie,and J. Illes. Aging 2.0: health information about dementiaon Twitter. PLOS ONE, 2013.
[23] B. Robinson, R. Power, and M. Cameron. An evidence basedearthquake detector using Twitter. In Workshop on LanguageProcessing and Crisis Information, 2013.
[24] T. Sakaki, M. Okazaki, and Y. Matsuo. Earthquake shakesTwitter users: real-time event detection by social sensors. InInternational Conference on World Wide Web, 2010.
[25] D. Scanfeld, V. Scanfeld, and E. L. Larson. Disseminationof health information through social networks: Twitter andantibiotics. American Journal of Infection Control, 2010.
[26] S. Verma, S. Vieweg, W. J. Corvey, L. Palen, J. H. Mar-tin, M. Palmer, A. Schram, and K. M. Anderson. Naturallanguage processing to the rescue? Extracting ’situationalawareness’ tweets during mass emergency. In InternationalConference on Weblogs and Social Media, 2011.
[27] A. J. Wakefield, S. H. Murch, A. Anthony, J. Linnell, D. M.Casson, M. Malik, M. Berelowitz, A. P. Dhillon, M. A.Thomson, and P. Harvey. RETRACTED: Ileal-lymphoid-nodular hyperplasia, non-specific colitis, and pervasive de-velopmental disorder in children. The Lancet Journal, 1998.
Related Documents