Data mining methods for classification of Medium-Chain Acyl-CoA dehydrogenase deficiency (MCADD) using non-derivatized tandem MS neonatal screening data Tim Van den Bulcke a,⇑ , Paul Vanden Broucke a , Viviane Van Hoof b,c,d , Kristien Wouters a , Seppe Vanden Broucke a , Geert Smits a , Elke Smits a , Sam Proesmans d , Toon Van Genechten d , François Eyskens b,d,e a i-ICT, University Hospital Antwerp, Wilrijkstraat 10, 2650 Edegem, Belgium b Provinciaal Centrum voor de Opsporing van Metabole Aandoeningen (PCMA), Antwerpen, Belgium c Dept. of Clinical Chemistry, University Hospital Antwerp, Edegem, Belgium d Faculty of Medicine, University Antwerp, Antwerpen, Belgium e Dept. of Paediatrics/Metabolic Diseases, University Hospital Antwerp, Edegem, Belgium article info Article history: Received 15 July 2010 Available online 15 December 2010 Keywords: Data mining Rare diseases MCADD Medium-Chain Acyl-CoA dehydrogenase Logistic regression abstract Newborn screening programs for severe metabolic disorders using tandem mass spectrometry are widely used. Medium-Chain Acyl-CoA dehydrogenase deficiency (MCADD) is the most prevalent mitochondrial fatty acid oxidation defect (1:15,000 newborns) and it has been proven that early detection of this met- abolic disease decreases mortality and improves the outcome. In previous studies, data mining methods on derivatized tandem MS datasets have shown high classification accuracies. However, no machine learning methods currently have been applied to datasets based on non-derivatized screening methods. A dataset with 44,159 blood samples was collected using a non-derivatized screening method as part of a systematic newborn screening by the PCMA screening center (Belgium). Twelve MCADD cases were present in this partially MCADD-enriched dataset. We extended three data mining methods, namely C4.5 decision trees, logistic regression and ridge logistic regression, with a parameter and threshold opti- mization method and evaluated their applicability as a diagnostic support tool. Within a stratified cross- validation setting, a grid search was performed for each model for a wide range of model parameters, included variables and classification thresholds. The best performing model used ridge logistic regression and achieved a sensitivity of 100%, a specific- ity of 99.987% and a positive predictive value of 32% (recalibrated for a real population), obtained in a stratified cross-validation setting. These results were further validated on an independent test set. Using a method that combines ridge logistic regression with variable selection and threshold optimization, a significantly improved performance was achieved compared to the current state-of-the-art for deriva- tized data, while retaining more interpretability and requiring less variables. The results indicate the potential value of data mining methods as a diagnostic support tool. Ó 2010 Elsevier Inc. All rights reserved. 1. Introduction The early diagnosis of rare diseases constitutes a great challenge in current medicine. Currently rare diseases are often diagnosed too late, resulting in a decline in life expectancy and quality of life, and an increase in healthcare costs. The large variety of rare dis- eases makes that – although each disease affects only a small num- ber of people – it still affects a large population. As such, the total number of patients suffering from a rare disease in Europe is around 30 million [1]. Early detection and diagnosis of metabolic disorders and of rare diseases in general, are of crucial importance for the further outcome of the patient. As such, statistical and machine learning methods could be of great value as a diagnostic support tool for doctors and medical personnel. 1.1. MCADD This study focuses on MCADD (Medium-Chain Acyl-CoA dehy- drogenase deficiency), the most frequent metabolic disorder of mitochondrial fatty acid oxidation [2]. There are four categories of fatty acids, differentiated by their carbon chain length: short 1532-0464/$ - see front matter Ó 2010 Elsevier Inc. All rights reserved. doi:10.1016/j.jbi.2010.12.001 ⇑ Corresponding author. E-mail address: [email protected] (T. Van den Bulcke). Journal of Biomedical Informatics 44 (2011) 319–325 Contents lists available at ScienceDirect Journal of Biomedical Informatics journal homepage: www.elsevier.com/locate/yjbin

Welcome message from author
This document is posted to help you gain knowledge. Please leave a comment to let me know what you think about it! Share it to your friends and learn new things together.
Transcript
Journal of Biomedical Informatics 44 (2011) 319–325
Contents lists available at ScienceDirect
Journal of Biomedical Informatics
journal homepage: www.elsevier .com/locate /y jb in
Data mining methods for classification of Medium-Chain Acyl-CoAdehydrogenase deficiency (MCADD) using non-derivatized tandem MS neonatalscreening data
Tim Van den Bulcke a,⇑, Paul Vanden Broucke a, Viviane Van Hoof b,c,d, Kristien Wouters a,Seppe Vanden Broucke a, Geert Smits a, Elke Smits a, Sam Proesmans d, Toon Van Genechten d,François Eyskens b,d,e
a i-ICT, University Hospital Antwerp, Wilrijkstraat 10, 2650 Edegem, Belgiumb Provinciaal Centrum voor de Opsporing van Metabole Aandoeningen (PCMA), Antwerpen, Belgiumc Dept. of Clinical Chemistry, University Hospital Antwerp, Edegem, Belgiumd Faculty of Medicine, University Antwerp, Antwerpen, Belgiume Dept. of Paediatrics/Metabolic Diseases, University Hospital Antwerp, Edegem, Belgium
a r t i c l e i n f o
Article history:Received 15 July 2010Available online 15 December 2010
Keywords:Data miningRare diseasesMCADDMedium-Chain Acyl-CoA dehydrogenaseLogistic regression
1532-0464/$ - see front matter � 2010 Elsevier Inc. Adoi:10.1016/j.jbi.2010.12.001
⇑ Corresponding author.E-mail address: [email protected] (T. Van
a b s t r a c t
Newborn screening programs for severe metabolic disorders using tandem mass spectrometry are widelyused. Medium-Chain Acyl-CoA dehydrogenase deficiency (MCADD) is the most prevalent mitochondrialfatty acid oxidation defect (1:15,000 newborns) and it has been proven that early detection of this met-abolic disease decreases mortality and improves the outcome. In previous studies, data mining methodson derivatized tandem MS datasets have shown high classification accuracies. However, no machinelearning methods currently have been applied to datasets based on non-derivatized screening methods.
A dataset with 44,159 blood samples was collected using a non-derivatized screening method as part ofa systematic newborn screening by the PCMA screening center (Belgium). Twelve MCADD cases werepresent in this partially MCADD-enriched dataset. We extended three data mining methods, namelyC4.5 decision trees, logistic regression and ridge logistic regression, with a parameter and threshold opti-mization method and evaluated their applicability as a diagnostic support tool. Within a stratified cross-validation setting, a grid search was performed for each model for a wide range of model parameters,included variables and classification thresholds.
The best performing model used ridge logistic regression and achieved a sensitivity of 100%, a specific-ity of 99.987% and a positive predictive value of 32% (recalibrated for a real population), obtained in astratified cross-validation setting. These results were further validated on an independent test set. Usinga method that combines ridge logistic regression with variable selection and threshold optimization, asignificantly improved performance was achieved compared to the current state-of-the-art for deriva-tized data, while retaining more interpretability and requiring less variables. The results indicate thepotential value of data mining methods as a diagnostic support tool.
� 2010 Elsevier Inc. All rights reserved.
1. Introduction
The early diagnosis of rare diseases constitutes a great challengein current medicine. Currently rare diseases are often diagnosedtoo late, resulting in a decline in life expectancy and quality of life,and an increase in healthcare costs. The large variety of rare dis-eases makes that – although each disease affects only a small num-ber of people – it still affects a large population. As such, the totalnumber of patients suffering from a rare disease in Europe is
ll rights reserved.
den Bulcke).
around 30 million [1]. Early detection and diagnosis of metabolicdisorders and of rare diseases in general, are of crucial importancefor the further outcome of the patient. As such, statistical andmachine learning methods could be of great value as a diagnosticsupport tool for doctors and medical personnel.
1.1. MCADD
This study focuses on MCADD (Medium-Chain Acyl-CoA dehy-drogenase deficiency), the most frequent metabolic disorder ofmitochondrial fatty acid oxidation [2]. There are four categoriesof fatty acids, differentiated by their carbon chain length: short

320 T. Van den Bulcke et al. / Journal of Biomedical Informatics 44 (2011) 319–325
(C2–4), medium (C4–12), long (C12–20) and very long (>C20). Theenzymes responsible for their b-oxidation are respectively SCAD,MCAD, LCAD and VLCAD (small, medium, long and very long chainacyl-Co-A dehydrogenase).
Our body preferentially metabolizes carbohydrates, but only alimited stock of carbohydrates is available and after a fasting per-iod of 9–10 h (e.g. a normal night of sleep), the body switches toenergy production from fatty acids. Defects of mitochondrial fattyacid b-oxidation therefore lead to a disturbed or inhibited energyproduction of fatty acids. Inherited defects fall into three groups:(a) those associated with the carnitine mediated transport intothe mitochondria; (b) those of the matrix enzymes (such asMCAD); and (c) those affecting the activity of membrane-boundenzymes of long-chain fatty acid oxidation.
In case of MCADD, the production of the MCAD enzyme is ab-sent or reduced. As such, the b-oxidation of the fatty acids C4and higher fails and they can subsequently not be used as an en-ergy source. The symptomatic MCADD-patient shows a clinical pic-ture strongly resembling Reye’s syndrome with hepatomegaly andstupor associated with hypoketonemia, hypoglycemia, hypocarn-itinemia, increased transaminsase and mild hyperammonemia[3]. Lipids that cannot be used precipitate in liver, heart, kidneys.These patients present themselves over the years with hepatomeg-aly or hepatic steatosis, cardiomyopathy, encephalopathy anddecreased muscle tone. 10–20% of the patients develop rhabdomy-olysis in the first three years of life, even when adequatelytreated [4].
The early diagnosis of MCADD – and metabolic diseases in gen-eral – is crucial for the further outcome and prognosis of the pa-tient. If the diagnosis is made early, the quality of life can besubstantially improved. With supplementation of acylcarnitineand a diet high in carbohydrates and low in fats and fasting periodsnot longer than 6 h, the prognosis for the MCADD patient is veryfavorable [4]. Through early diagnosis of MCADD, the risk of deathduring derailment reduces to zero and the neurological rest lesions(epilepsy, paralysis, behavioral disorders, developmental disor-ders) after decompensation are halved [4]. There is thus animportant role for preventive medicine where a metabolic diseaseis transformed into a metabolic disorder by means of simplemeasures (prevention of fasting and rapid care of sober states) thatprevent the development of the disease. These children should befollowed in the first 5–7 years of life to avoid decompensation. Thiscan be done by the general practitioner and does not require aspecialized center.
1.2. MCADD screening
MCADD in infants can be detected via a blood sample which istaken within a few days after birth using a heel prick test. The heelprick is performed systematically for all newborns in many devel-oped countries (e.g. Denmark, The Netherlands, Germany, Belgiumand Luxembourg). The blood sample is subsequently analyzedusing tandem mass spectrometry. Depending on the screening cen-ter, a derivatized [5] or non-derivatized [6] screening method isused. A sample spectrum is shown in Fig. 1 for both a normaland an MCAD-deficient person.
An increase of the specific acylcarnitine values above estab-lished (device-specific) cut-off points usually results in a secondblood analysis, carried out when the child is 8 weeks old. Thissecond analysis includes the determination of acylcarnitine values– with tandem mass spectrometry – and the fatty acid profile inplasma. Then the organic acids and glycines in urine are deter-mined [7]. If this second test shows no normalization of theacylcarnitine values, there is need for further review by enzymaticstudies and/or DNA analysis.
Many screening centers currently use a derivatized screeningmethod [5]. However, the PCMA as well as some other screeningcenters in Europe, have switched to using a non-derivatizedscreening method [6]. The key difference is that the derivatizatonstep which requires heating of the dried analytes with dry,acidified (3 N) butanol, is no longer needed. The non-derivatizedmethod requires less processing steps, leads to faster extractiontimes and has a lower cost for reagents [8].
While both methods show strong correlation among the differ-ent measured analytes, it was reported that several analytesshowed consistent bias (C0, C2, C10, C16, Gly and Arg) for thenon-derivatized method compared to the derivatized method [9].For four instances this bias was due to higher recovery (C2, C10,C16 and Arg) and for the two others (C0 and Gly) this was due toa lower recovery. This bias can potentially affect the performanceof data mining algorithms and may also lead to slightly differentmodels or model parameters compared to models for derivatizeddata.
1.3. Data mining methods for MCADD classification
Several statistical techniques have been published to establishcutoff values on acylcarnitine values for MCADD classification[10–13]. A comparison of different data mining algorithms for clas-sification of MCADD and other metabolic disorders on derivatizedtandem MS neonatal data was done by Baumgartner et al.[14,15]. A feature selection approach for MCADD classification byHo et al. [16] can be considered as the current state-of-the art datamining method with respect to performance. They reported sensi-tivity and specificity values of 100% and 99.901% respectively on adataset of derivatized tandem MS neonatal data in Heidelberg.
This study is the first application of machine learning tech-niques on non-derivatized neonatal screening data. We appliedC4.5 decision trees, logistic regression and ridge logistic regressionusing a grid search approach to optimize model parameter settings,included variables and classification thresholds. Our results usingridge logistic regression show a significantly better performancecompared to the current state-of-the-art method for derivatizedMS data [16] while our method requires less variable measure-ments and retains more interpretability.
2. Materials and methods
2.1. Dataset
An anonymized dataset of 44,159 blood samples was collectedand analyzed using a non-derivatized tandem MS screening meth-od [6] containing 12 MCADD cases. The dataset consists of two sep-arate parts, each measured using a different screening system.
The first part is used as training data for learning the classifica-tion models. It was obtained as part of a systematic screening fornewborns by the PCMA screening center (Belgium) during the firsthalf of 2009. It consists of 32,109 samples and was collected usingthe Quattro micro screening system. This dataset was further en-riched with blood samples of all MCADD cases that occurred be-tween 2003 and 2009 at the PCMA screening center, resulting ina total of 9 MCADD samples. These 9 MCADD cases were furtherconfirmed with a genetic test and to our best knowledge, nounidentified MCADD cases are present in the dataset.
The second part of the dataset is used as an independent test set.It was analyzed using a different screening system (Xevo QT MS)and consists of 12,050 samples (collected between June 2010 andSeptember 2010). This dataset contained no MCADD cases fromthe general population and has been enriched with three spikedblood samples that were provided by the Centre for Disease
225 250 275 300 325 350 375 400 425 450 475 5000
100
0
100C2 carnitine
C3 carnitine
C16 carnitine
Normal
MCAD deficiencyC8 carnitine
C10:1 carnitineC6 carnitine
%
%
m/z
m/z
Fig. 1. Tandem MS spectrum for a normal (upper) vs. MCAD deficient (lower) blood sample.
T. Van den Bulcke et al. / Journal of Biomedical Informatics 44 (2011) 319–325 321
Control (CDC) as external quality controls. These CDC samples aredesigned to resemble a real MCADD blood sample and any screen-ing center should identify them as positive MCADD cases. Whilesome quantitative differences exist between the CDC samplesand real MCADD cases, the most relevant acylcarnitine measure-ments are comparable. Both sets can therefore be considered suffi-ciently similar for the presented analyses in this study. We refer toSupplementary File 1 for a detailed comparison between the CDCcontrol samples and real MCADD samples.
The measured parameters for each blood sample are the fattyacid concentrations C0, C3, C5, C5DC, C6, C8, C10, C10:1, C14:1,C16 and concentration ratio’s C3/C2, C5DC/C8, C5DC/C16, C8/C2,C8/C10, C8/C12. These measures were further enriched with allpossible derived ratios for combinations of the primary concentra-tions, such as C0/C6, C8/C16, leading to 45 additional variables. Allconcentrations and ratio’s were log10-transformed for the analysis,leading to approximate normal distributions with heavy tails forthe concentrations. These measured parameters are the predictorvariables and are denoted as X, the binary outcome is denoted asMCADD (0 = no MCADD; 1 = MCADD).
2.2. Machine learning methods
Three data mining methods were compared: decision trees, lo-gistic regression and ridge logistic regression. For each of thesemethods, models were constructed starting from various subsetsof the original and derived variables, as shown in Table 1.
In decision trees, a (usually binary) classification tree is con-structed and a class is assigned to each leaf node. In each internalnode, a simple decision rule – usually involving a single variablethat is above or below a specific threshold – decides for takingthe left or right branch. A decision tree is usually learned fromthe data by iteratively splitting nodes into child nodes by meansof a splitting criterion that maximizes information gain or someother measure that tends to separate the two classes into separatenodes. Decision trees can be overfitted to the data and are there-fore usually pruned (i.e. some branches are removed from the tree).One of the most well known and often used algorithms is C4.5 [17],which is used in our experiments.
Binary logistic regression [18] is a widely used statistical tech-nique that constructs a hyperplane between two datasets whichseparates the two classes. The risk or probability for havingMCADD is defined by Eq. (1), where z is defined as a linear function
of its predictors x (Eq. (2)). For performing a classification, a cutofffor the probability f(z) is often set at 0.5. In our experimental setuphowever, this cutoff is also optimized.
PðMCADD ¼ truejX ¼ xÞ ¼ f ðzÞ ¼ ez
ez þ 1ð1Þ
Z ¼ b0 þ b1x1 þ b2x2 þ b3x3 þ . . .þþbkxk ð2Þ
Ridge logistic regression [19] extends logistic regression by introduc-ing an additional ridge parameter k in the model. An additional pen-alty term, k||b||2, is added to the log-likelihood where b is the vectorof the regression coefficients. For k = 0, the model behaves as logis-tic regression. For larger values of k, larger model coefficients arepenalized and generally tend to be closer to 0. As such, the modelcoefficients are somewhat biased, whereas the coefficients obtainedwith normal logistic regression are unbiased estimators of the truecoefficients. When the predictor variables are collinear or near col-linear, the variances of these coefficients are however much smallerthan for logistic regression and the overall error for ridge logisticregression will therefore be lower (see also ‘bias-variance tradeoff’in [20]).
2.3. Experimental setup
The overall experimental setup is shown in pseudo code in Ta-ble 2 and is defined as follows. We evaluated three data miningmethods (decision trees, logistic regression and ridge logisticregression) for a range of model parameters (such as the ridgeparameter for the regression, the confidence threshold for pruningin decision trees etc.) and for different subsets of variables thatwere included in the model (Table 1).
For each of the combinations model/variable set, an N-foldstratified cross-validation was performed where N is the numberof MCADD cases in the dataset. A regular cross-validation wouldresult in an uneven balancing of the MCADD cases over the differ-ent folds, therefore a stratified N-fold cross-validation was used,resulting in 1 MCADD case for each fold. This procedure was re-peated 10 times for different randomizations of the dataset andthe results were averaged.
While the main output of the classification algorithms is usuallya binary classification (0 = no MCADD; 1 = MCADD), we will use theprobability of being classified as MCADD as the primary output ofthe algorithm. This enables us to further improve the performanceby choosing an optimal probability threshold value (within the

Table 1Selected subsets of variables that were evaluated for each of the models andparameter settings. Set 1 includes all measured concentrations and ratios that areused in the newborn screening at the PCMA screening center. Set 2 extends this set byalso calculating all other possible ratios between these concentrations and addingthem to the variable list. Set 3 includes only measured concentrations, without anyratios. Sets 4–20 include various subsets of variables that are associated with MCADD.
322 T. Van den Bulcke et al. / Journal of Biomedical Informatics 44 (2011) 319–325
cross-validation loop) to maximize the sensitivity such that allMCADD cases are correctly identified while keeping the numberof false positives minimal.
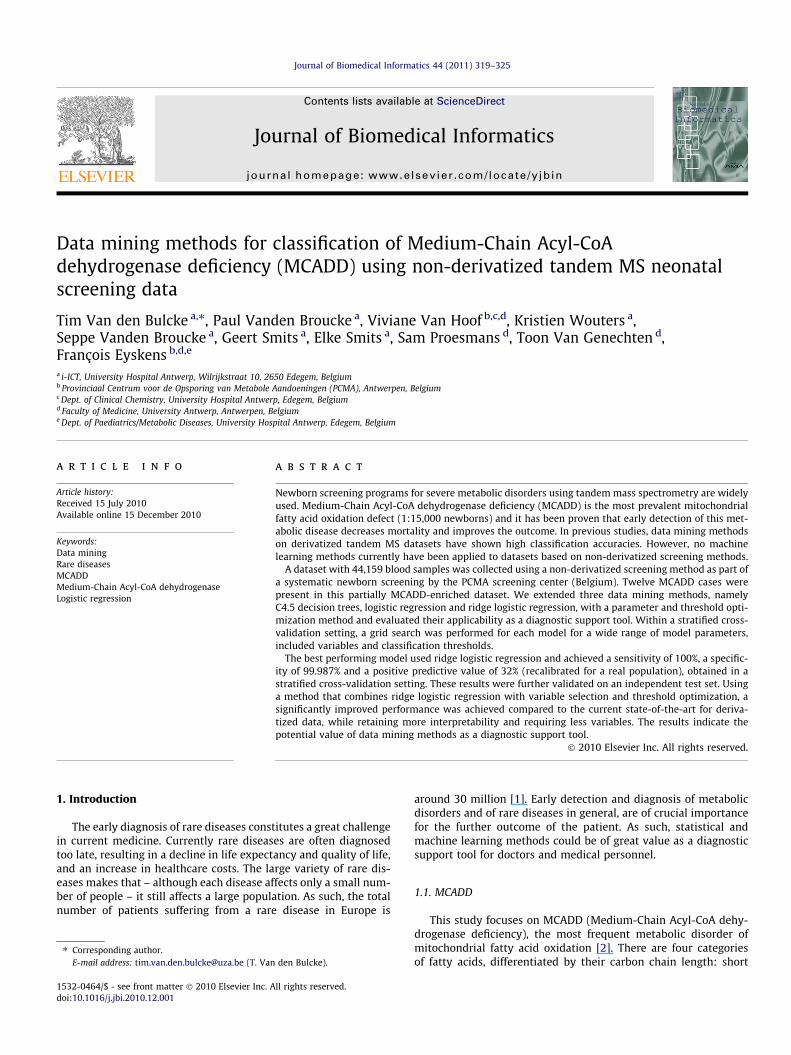
A straightforward choice of this threshold would be to select thethreshold value where all MCADD cases in the training set are iden-tified as positive and the number of false positives in the trainingset is minimal, called thresholdTRAIN. This threshold value is how-ever likely to be too conservative and will fail to identify someMCADD cases in the test set. In order to accommodate for this, anadjustment factor is defined that introduces an additional marginon this threshold, which is illustrated in Fig. 2. All predicted prob-abilities P(MCADD = true|X = x) are sorted and thresholdTRAIN is theprobability threshold value such that all actual MCADD cases areequal or above this threshold. We define K as the total number ofcases that is equal or above this threshold. This index K is multi-plied with an adjustment factor FADJ, leading to a new thresholdthresholdOPT. This is the (FADJ � K)th element in the sortedP(MCADD = true|X = x) vector, where (FADJ � K) is rounded to thenearest integer.
The following performance measures were used to evaluate themodels: sensitivity = TP/(TP + FN), specificity = TN/(TN + FP) and posi-tive predictive value (PPV) = TP/(TP + FP) where TP indicates thenumber of true positives, TN the number of true negatives, FP thenumber of false positives and FN the number of false negatives.As explained below, calculations of PPV were corrected for the trueMCADD prevalence.
3. Results
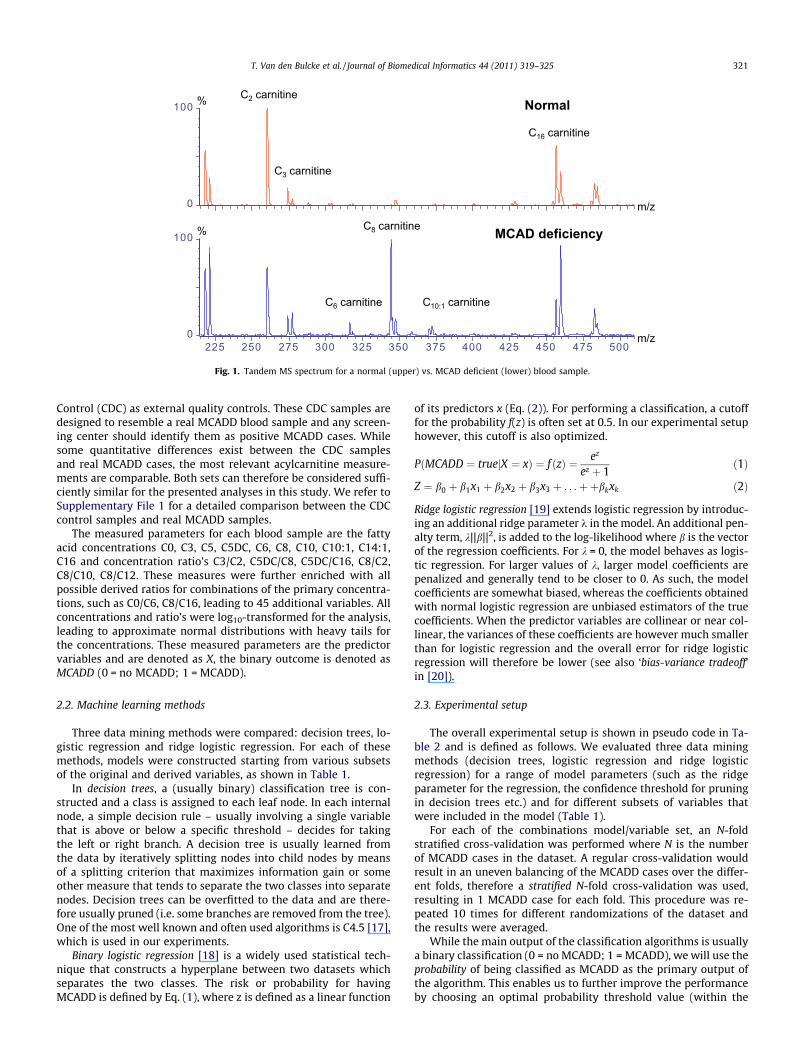
The models were evaluated for a broad range of adjustment fac-tors (0.5–5) and model parameter settings. The best models to-gether with their associated parameter settings are shown inTable 3. Model A is the best decision tree model; model B showsthe best model for logistic regression with only C8 as a predictorvariable; model C is the best model with logistic regression forall possible variable sets; and model D is the overall best model,namely a ridge logistic regression model.
Previously reported performance measures for MCADD predic-tion (Baumgartner et al. [14]); Ho et al. [16]) do not accurately re-flect the expected performance on datasets of real populations:both studies calculate performances on datasets which are en-riched with MCADD cases (or which are depleted with non-MCADD cases), leading to highly biased performance measuressuch as the positive predictive value (PPV). The PPV was thereforerecalculated to assess how many false positives we would encoun-ter in a real population. In order to allow a fair comparison, anMCADD prevalence of 1/15,000 is used for all studies to recalculatethe PPV. Because the training data was highly enriched for MCADDcases, the calculated PPV values for a real population are signifi-cantly different from the reported PPV values in the respectivepublications. Since the dataset enrichment has no effect on sensi-tivity and specificity measures, no recalculation of these measureswas required. The performance measures shown in Table 3 are de-rived from the cross-validation analysis on the training data in therespective studies. The reason is that both studies included part ofthe training data in their test sets and the reported results maytherefore be slightly too optimistic for the test data. Using thetraining data and recalibrating the results more accurately reflectsthe true expected performance.
3.1. Decision tree models
Firstly, a number of decision tree models were evaluated. Thebest performing decision tree model was model A, which achieveshigh sensitivity (98.889%) but does not identify all MCADD casesin a cross-validation setting. The selected variables in the modelwere C8, C10 and C8/C2, which are known to be indicative forMCADD. The decision tree model of Baumgartner et al. [14], modelE, also included C8 and C10 but excluded the C8/C2 ratio in favor ofthe C16 concentration. The PPV of our best model (19.21%) is sig-nificantly higher than the current state of the art decision treemodel [14] (1.30%). The differences in performance (PPV) betweenour method and current state-of-the-art could be either due to thenature of the dataset, due to the different methodology or a com-bination of both (see Section 4). From a medical perspective, stillan unacceptably high number of MCADD patients are diagnosedas healthy using the decision tree method (>1%). Decision treeswere also less robust w.r.t. variations in parameter settings andvariable selection choices, leading to larger variations in sensitivityand specificity compared to logistic regression for the range ofevaluated models (results not shown). These two undesired prop-erties make decision trees less appropriate choices for modelingMCADD.
3.2. Logistic regression analysis using only C8
Secondly, a series of logistic regression analyses were per-formed with one single parameter C8, the predominant metaboliteassociated with MCADD. The best model, namely model B (Table 3),resulted in good predictions: 100% of the MCADD cases were iden-tified in the cross-validation setting with an average specificity of99.965% over the different randomizations. Comparing the resultswith a normal logistic regression (without threshold optimization)for the same dataset (model H), we see that our threshold optimi-zation strategy increases sensitivity from 62.5% to 100%, whiledecreasing the PPV (22.9–15.9%) and specificity (99.988–99.965%). This result confirms that statistical models that onlyuse C8 as a predictor can already achieve a high classificationaccuracy [14]. This is also illustrated in Fig. 3 which shows thelog-concentration of C8 for MCADD (red diamonds) and normal(black dots) cases.

Table 2Pseudo code of the experimental setup.
for each data mining method M:for each set of model parameters P:
for each set of variables V:for each randomization R:
for each cross-validation-fold F:testData = rowSubset(dataset, select = fold F, rand = R)trainDataAllColumns = rowSubset(dataset, select = all except fold F, rand = R)trainData = colSubset(trainDataAllColumns, V)model = train(M, trainData)trainProbabilities[F] = predict(model, trainData)thresholdTrain = calcThresholdTrain(trainProbabilities[F], trainData)testProbabilities[F] = predict(model, testData)for each adjustment factor FADJ:
measures[M, P, V, R, F, FADJ] = calcMeasures(testProbabilities, FADJ � thresholdTRAIN)measuresAggr = aggregate(measures, F, type = sum) # sum the results overall CV-foldsmeasuresAvg = aggregate(measuresAggr, R, type = mean) # average over the different randomizationsmodelA = select (M, P, V, FADJ) for which
measuresAvg[k].M() = = ‘‘C4.5’’ andmeasuresAvg.specificity() is maximal andmeasuresAvg.sensitivity() = = max(measuresAvg[M = ’’C4.5’’].sensitivity())
modelB = select (M, P, V, FADJ) from measuresAvg[k] for whichmeasuresAvg[k].specificity() is maximal andmeasuresAvg[k].sensitivity() = = max(measuresAvg[M = ’’Logistic’’, P = ‘‘k = 0’’, V = ’’C8’’].sensitivity())
modelC = select (M, P, V, FADJ) from measuresAvg[k] for whichmeasuresAvg[k].M() = = ‘‘Logistic’’ and measuresAvg[k].P() = = ‘‘k = 0’’ andmeasuresAvg[k].specificity() is maximal andmeasuresAvg[k].sensitivity() = = max(measuresAvg[M = ’’Logistic’’, P = ‘‘k = 0’’].sensitivity())
modelD = bestModel = select (M, P, V, FADJ) from measuresAvg[k] for whichmeasuresAvg[k].specificity() is maximal andmeasuresAvg[k].sensitivity() = = max(measuresAvg.sensitivity())
T. Van den Bulcke et al. / Journal of Biomedical Informatics 44 (2011) 319–325 323
3.3. Logistic regression analysis using all variable sets
The positive predictive value and specificity can be furtherincreased by including more variables in the regression modelwithout reducing the sensitivity. The best performing logisticregression model for all of the variable sets (without using ridgeregression), is model C (Table 3). A number of additional variablesto C8 are included, namely C8/C2, C6/C8, C6/C10 and C8/C10, thatare known to be predictive for MCADD [16]. By including thesevariables, the (recalibrated) PPV is increased from 15.92% to23.41% while retaining 100% sensitivity.
3.4. Ridge logistic regression
The overall best model, namely model D, uses ridge logisticregression [19] and includes the same set of variables as model C.Compared to logistic regression, the recalibrated PPV was furtherincreased to 33.90% while the sensitivity remained at 100%, there-by outperforming the current state-of-the-art methods on deriva-tized datasets. The PPV for our independent test dataset (28.67%)confirms that this high performance is not due to overfitting. Byusing ridge regression, the contribution of less predictive variablesand highly correlated variables in the model are reduced, therebyreducing overfitting of the model.
4. Discussion
In this study, the performance of a number of data miningmethods were compared for predicting MCADD classificationbased on acylcarnitine measurements. In situations where thereis a large asymmetry between misclassifying a positive vs. a nega-tive sample, cost-based classifiers [21] are frequently used whichoptimize a loss function rather than minimizing the overall mis-classification rate. While this approach is certainly applicable, itwas not used in this study. Rather we have chosen to directly opti-
mize the probability cutoff, which is more directly linked to ourgoal of maximizing the sensitivity.
The current state of the art method for the derivatized screeningmethod was developed by Ho et al. [16] and is shown as model F inTable 3. The model by Ho et al. that is based on derivatized screen-ing data (model E, Table 3) uses seven different variables, namelyC4, C5:1, C8, C10, C14OH, C16OH and C18:1. While the modelachieves 100% sensitivity, the expected positive predictive valuefor a real population is low (6.3%). The model uses complex fea-tures to classify MCADD, as shown in Eq. (3), and is thereforeslightly more difficult to interpret. The best performing model inour analysis requires less variable measurements, namely 5, andachieves a strongly improved performance (sensitivity = 100%;PPV = 33.90%).
ðC8� C4þ C5 : 1þ C10Þ > 0:004 andC8þ C18 : 1
C14OHþ C16OH> �2:012 ð3Þ
As stated, there are quantitative differences between the measure-ments for the derivatized screening and non-derivatized screeningmethods which may affect the performance of the data miningmethods. The differences in performance (PPV) between our meth-od and current state-of-the-art could be due to the nature of thedataset (non-derivatized), due to the different methodology ordue to a combination of both. It is difficult to answer this questionconclusively. We do observe that our threshold optimization meth-od strongly improves performance of logistic regression on thesame non-derivatized dataset (Table 3, model H vs. model B). Thisindicates that at least part of the performance difference betweenour models and current state-of-the-art on derivatized datasetscan be explained due to our methodology.
Some remarks are necessary regarding the optimal value for theadjustment factor FADJ. Because we have only a small sample (ninecases) of the full distribution of MCADD cases, we do not have suf-ficient measurements from the tails of this full distribution. Our
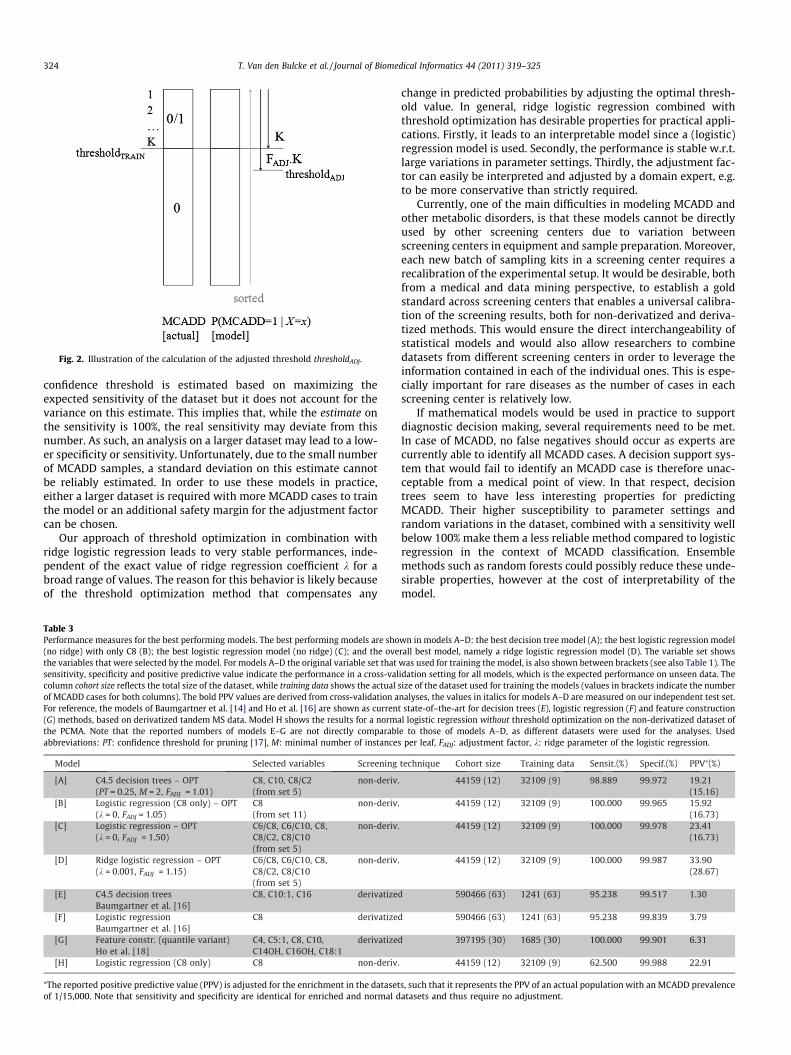
Fig. 2. Illustration of the calculation of the adjusted threshold thresholdADJ.
324 T. Van den Bulcke et al. / Journal of Biomedical Informatics 44 (2011) 319–325
confidence threshold is estimated based on maximizing theexpected sensitivity of the dataset but it does not account for thevariance on this estimate. This implies that, while the estimate onthe sensitivity is 100%, the real sensitivity may deviate from thisnumber. As such, an analysis on a larger dataset may lead to a low-er specificity or sensitivity. Unfortunately, due to the small numberof MCADD samples, a standard deviation on this estimate cannotbe reliably estimated. In order to use these models in practice,either a larger dataset is required with more MCADD cases to trainthe model or an additional safety margin for the adjustment factorcan be chosen.
Our approach of threshold optimization in combination withridge logistic regression leads to very stable performances, inde-pendent of the exact value of ridge regression coefficient k for abroad range of values. The reason for this behavior is likely becauseof the threshold optimization method that compensates any
Table 3Performance measures for the best performing models. The best performing models are sho(no ridge) with only C8 (B); the best logistic regression model (no ridge) (C); and the ovethe variables that were selected by the model. For models A–D the original variable set thatsensitivity, specificity and positive predictive value indicate the performance in a cross-valcolumn cohort size reflects the total size of the dataset, while training data shows the actualof MCADD cases for both columns). The bold PPV values are derived from cross-validation aFor reference, the models of Baumgartner et al. [14] and Ho et al. [16] are shown as curren(G) methods, based on derivatized tandem MS data. Model H shows the results for a normathe PCMA. Note that the reported numbers of models E–G are not directly comparablabbreviations: PT: confidence threshold for pruning [17], M: minimal number of instances
⁄The reported positive predictive value (PPV) is adjusted for the enrichment in the datasetof 1/15,000. Note that sensitivity and specificity are identical for enriched and normal d
change in predicted probabilities by adjusting the optimal thresh-old value. In general, ridge logistic regression combined withthreshold optimization has desirable properties for practical appli-cations. Firstly, it leads to an interpretable model since a (logistic)regression model is used. Secondly, the performance is stable w.r.t.large variations in parameter settings. Thirdly, the adjustment fac-tor can easily be interpreted and adjusted by a domain expert, e.g.to be more conservative than strictly required.
Currently, one of the main difficulties in modeling MCADD andother metabolic disorders, is that these models cannot be directlyused by other screening centers due to variation betweenscreening centers in equipment and sample preparation. Moreover,each new batch of sampling kits in a screening center requires arecalibration of the experimental setup. It would be desirable, bothfrom a medical and data mining perspective, to establish a goldstandard across screening centers that enables a universal calibra-tion of the screening results, both for non-derivatized and deriva-tized methods. This would ensure the direct interchangeability ofstatistical models and would also allow researchers to combinedatasets from different screening centers in order to leverage theinformation contained in each of the individual ones. This is espe-cially important for rare diseases as the number of cases in eachscreening center is relatively low.
If mathematical models would be used in practice to supportdiagnostic decision making, several requirements need to be met.In case of MCADD, no false negatives should occur as experts arecurrently able to identify all MCADD cases. A decision support sys-tem that would fail to identify an MCADD case is therefore unac-ceptable from a medical point of view. In that respect, decisiontrees seem to have less interesting properties for predictingMCADD. Their higher susceptibility to parameter settings andrandom variations in the dataset, combined with a sensitivity wellbelow 100% make them a less reliable method compared to logisticregression in the context of MCADD classification. Ensemblemethods such as random forests could possibly reduce these unde-sirable properties, however at the cost of interpretability of themodel.
wn in models A–D: the best decision tree model (A); the best logistic regression modelrall best model, namely a ridge logistic regression model (D). The variable set showswas used for training the model, is also shown between brackets (see also Table 1). Theidation setting for all models, which is the expected performance on unseen data. Thesize of the dataset used for training the models (values in brackets indicate the numbernalyses, the values in italics for models A–D are measured on our independent test set.t state-of–the-art for decision trees (E), logistic regression (F) and feature constructionl logistic regression without threshold optimization on the non-derivatized dataset of
e to those of models A–D, as different datasets were used for the analyses. Usedper leaf, FADJ: adjustment factor, k: ridge parameter of the logistic regression.
s, such that it represents the PPV of an actual population with an MCADD prevalenceatasets and thus require no adjustment.

Fig. 3. Log-concentration of C8 acylcarnitines for MCADD cases (red diamonds) andnormal cases (black circles). (For interpretation of the references to colour in thisfigure legend, the reader is referred to the web version of this article.)
T. Van den Bulcke et al. / Journal of Biomedical Informatics 44 (2011) 319–325 325
5. Conclusions
We have applied the first data mining methods for modelingMCAD deficiency using non-derivatized tandem MS datasets. Threedifferent data mining methods were evaluated for a broad range ofmodel parameters, namely decision trees, logistic regression andridge logistic regression. The best performing model is a ridge lo-gistic regression model that shows a significantly better perfor-mance compared to the current state of the art for the derivatizedscreening method while retaining more interpretability andrequiring a lower number of acylcarnitine measurements. Asensitivity of 100%, a specificity of 99.987% and a positive predic-tive value of 33.90% (recalibrated for a real population) wereachieved in a stratified cross-validation setting for non-derivatizedscreening data, outperforming current state-of-the-art methods forMCADD prediction on derivatized data. Our analysis was per-formed on a relatively small dataset of 44,159 cases with 12MCADD cases. A further confirmation of these results on largerderivatized and non-derivatized screening datasets is thereforedesired. The results indicate the potential value of data miningmethods as a diagnostic support tool and show that strong classi-fication performances are achieved for non-derivatized tandem MSdata using a method that combines ridge logistic regression withvariable selection and threshold optimization.
Conflict of interest
Nothing to report.
Authors contributions
Conception and design: FE, TVDB, PVB; provision of study mate-rial: FE, PVB; data analysis and interpretation: TVDB, PVB, KW;
manuscript writing: TVDB, PVB, FE, VVH, TVG, SP; final approval:TVDB, PVB, VVH, SVB, KW, GS, ES, SP, TVG, FE.
Acknowledgments
This research was funded by University Hospital Antwerp andProvinciaal Centrum voor de Opsporing van Metabole Aandoenin-gen (PCMA). The PCMA has kindly provided us with the screeningdatasets. We would like to thank the reviewers for their mostvaluable feedback and suggestions.
Appendix A. Supplementary material
Supplementary data associated with this article can be found, inthe online version, at doi:10.1016/j.jbi.2010.12.001.
References
[1] Fischer A, Borensztein P, Roussel C. The European rare diseases therapeuticinitiative. PLoS Med 2005;2(9).
[2] Kompare M, Rizzo W. Mitochondrial fatty-acid oxidation disorders. SeminPediatr Neurol 2008;15(3):140–9.
[3] Wilcken B. Fatty acid oxidation disorders: outcome and long-term prognosis. JInherit Metab Dis 2010.
[4] Van Hove JL, Zhang W, Kahler SG, Roe CR, Chen YT, Terada N, et al. Medium-chain acyl-CoA dehydrogenase (MCAD) deficiency: diagnosis by acylcarnitineanalysis in blood. Am J Hum Genet 1993;52(5):958–66.
[5] Chace D, Hillman S, Van Hove J, Naylor E. Rapid diagnosis of MCAD deficiency:quantitative analysis of octanoylcarnitine and other acylcarnitines in newbornblood spots by tandem mass spectrometry. Clin Chem 1997;43(11):2106–13.
[6] Nagy K, Tákats Z, Pollreisz F, Szabó T, Vékey K. Direct tandem massspectrometric analysis of amino acids in dried blood spots without chemicalderivatization for neonatal screening. Rapid Commun Mass Spectrom2003;17(9):983–90.
[7] Matern D, Rinaldo P. Medium-chain acyl-coenzyme a dehydrogenasedeficiency. PLoS Genet 2005.
[8] Eyskens FJM, Philips E. Newborn mass screening using tandem massspectrometry: results of the validation and comparison of two methods(derivatized/non-derivatized). J Inherit Metab Dis 2007;30(Suppl. 1) [3].
[9] http://las.perkinelmer.com/content/RelatedMaterials/Posters/SPS_MSMSCom-parison.pdf [accessed 05.07.10].
[10] Chace D, Kalas T, Naylor E. Use of tandem mass spectrometry for multianalytescreening of dried blood specimens from newborns. Clin Chem2003;49(11):1797–817.
[11] Clayton P, Doig M, Ghafari S, Meaney C, Taylor C, Leonard J, et al. Screening formedium chain acyl-CoA dehydrogenase deficiency using electrosprayionisation tandem mass spectrometry. Arch Dis Child 1998;79(2):109–15.
[12] Pourfarzam M, Morris A, Appleton M, Craft A, Bartlett K. Neonatal screening formedium-chain acyl-CoA dehydrogenase deficiency. Lancet 2001;358(9287):1063–4.
[13] Okun J. A method for quantitative acylcarnitine profiling in human skinfibroblasts using unlabelled palmitic acid: diagnosis of fatty acid oxidationdisorders and differentiation between biochemical phenotypes of MCADdeficiency. Biochim Biophys Acta 2002;1584(2–3):91–8.
[14] Baumgartner C, Böhm C, Baumgartner D. Modelling of classification rules onmetabolic patterns including machine learning and expert knowledge. JBiomed Inform 2005;38(2):89–98.
[15] Baumgartner C, Bohm C, Baumgartner D, Marini G, Weinberger K, OlgemollerB, et al. Supervised machine learning techniques for the classification ofmetabolic disorders in newborns. Bioinformatics 2004;20(17):2985–96.
[16] Ho S, Lukacs Z, Hoffmann G, Lindner M, Wetter T. Feature construction canimprove diagnostic criteria for high-dimensional metabolic data in newbornscreening for medium-chain acyl-CoA dehydrogenase deficiency. Clin Chem2007;53(7):1330–7.
[17] Quinlan R. C45: programs for machine learning. Morgan Kaufmann; 1993.[18] Hosmer D, Lemeshow S. Applied logistic regression. Wiley-Interscience
Publication; 2000.[19] Le Cessie S, Van Houwelingen JC. Ridge estimators in logistic regression. Appl
Stat 1992;41(1):191–201.[20] Hastie T, Tibshirani R, Friedman J. The elements of statistical learning. Data
mining, inference, and prediction. Springer; 2009.[21] Domingos P. MetaCost: a general method for making classifiers cost-sensitive.
KDD. 155-164. San Diego, California, United States: ACM; 1999.
Related Documents