Page | 1 [Type text] Project Submitted By: Name VIDYA NAND JHA Stream IT, 3 rd Year Section B Group II Class Roll 083 University Roll 10900211092 University Reg. NO 11090110208 MOB 9748062585

Welcome message from author
This document is posted to help you gain knowledge. Please leave a comment to let me know what you think about it! Share it to your friends and learn new things together.
Transcript
P a g e | 1
[Type text]
Project Submitted By:
Name VIDYA NAND JHA
Stream IT, 3rd Year
Section B
Group II
Class Roll 083
University Roll 10900211092
University Reg. NO 11090110208
MOB 9748062585
P a g e | 2
ACKNOWLEDGEMENT
I would like to express my special thanks of
gratitude to Mr. CHANDAN BANERJEE, as well as
our mentor who gave me the golden opportunity to
do this wonderful seminar on the topic (Data
Clustering).I came to know about so many new
things. I am really thankful to them.
Secondly i would also like to thank my friends who
helped me a lot in finalizing this seminar within the
limited time frame.
.

P a g e | 3
Table of contents
ABSTRACT 04
INTRODUCTION 05
TYPES OF CLUSTERING 11
APPLICATION 30
CONCLUSION 31
REFERENCES 32
P a g e | 4
ABSTRACT
We know that fast retrieval of relevant
information from the database has been a
significant issue. Different techniques has been
developed for this purpose this one of them is
Data Clustering.
In this paper data clustering is discussed along
with different clustering method and analysis,
Like k-means, Hierarchical, Model-based and
Density-based clustering.
We also discussed application of data clustering
like Data Mining.
P a g e | 5
INTRODUCTION
Cluster: Cluster is just an ordered list of object
with similar characteristics. A cluster is
comprised of a number of similar objects
collected or grouped together. Everitt (1974)
documents some of the following definition of
cluster.
1. A cluster is a set of entities which are alike
and entities from different clusters are not
alike.
2. A cluster is an aggregation of point in the
test space such that the distance between two
points in the cluster is less than the distance
between point in the cluster and any point not
in it.
P a g e | 6
Data Clustering: The process of grouping a set
of physical or abstract objects into classes of
similar objects is called clustering.
We can also say that data clustering is method
in which we make cluster of similar object that
are similar in characteristics
Some example of clustering
1. Clustering images based on their perceptual
similarities.
2. Clustering webpage based on their content.
3. Clustering web search results.
4. Clustering user in social network site based
on their properties.

P a g e | 7
5. Image segmentation
Clustering pixel
Choice of similarities measure is very important
for clustering.Similarity is inversely related to
distance. Different way exits to measure
distances .
P a g e | 8
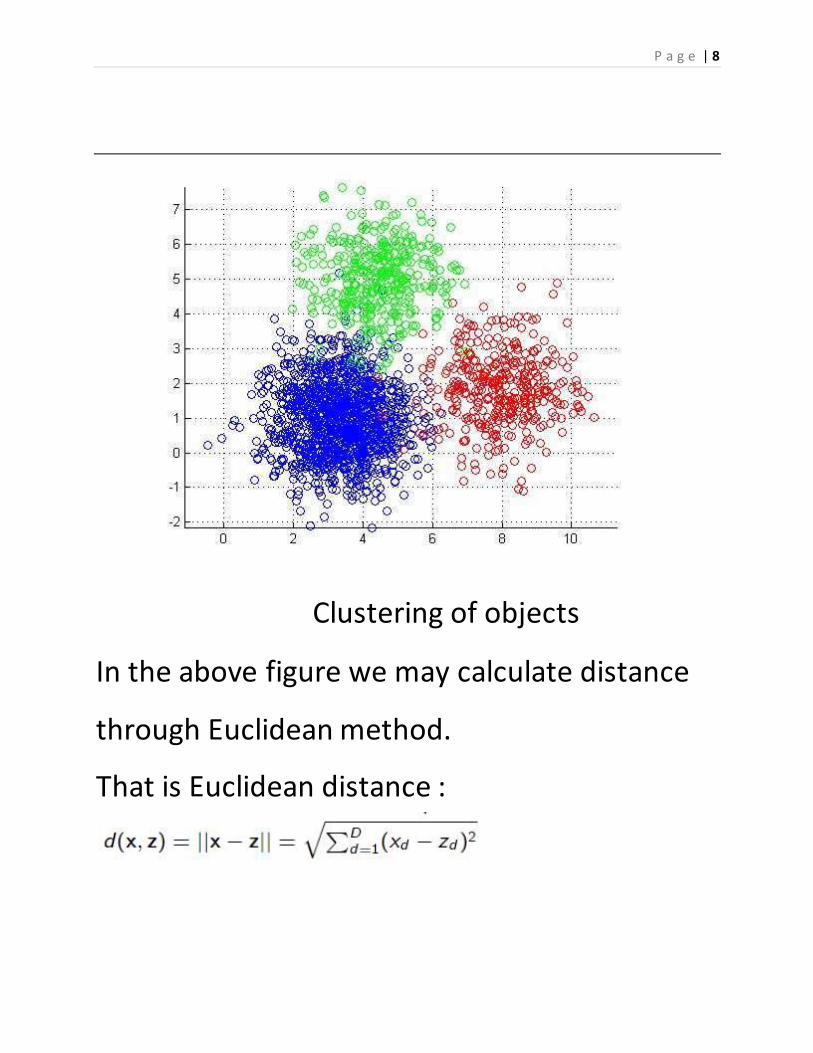
Clustering of objects
In the above figure we may calculate distance
through Euclidean method.
That is Euclidean distance :
P a g e | 9
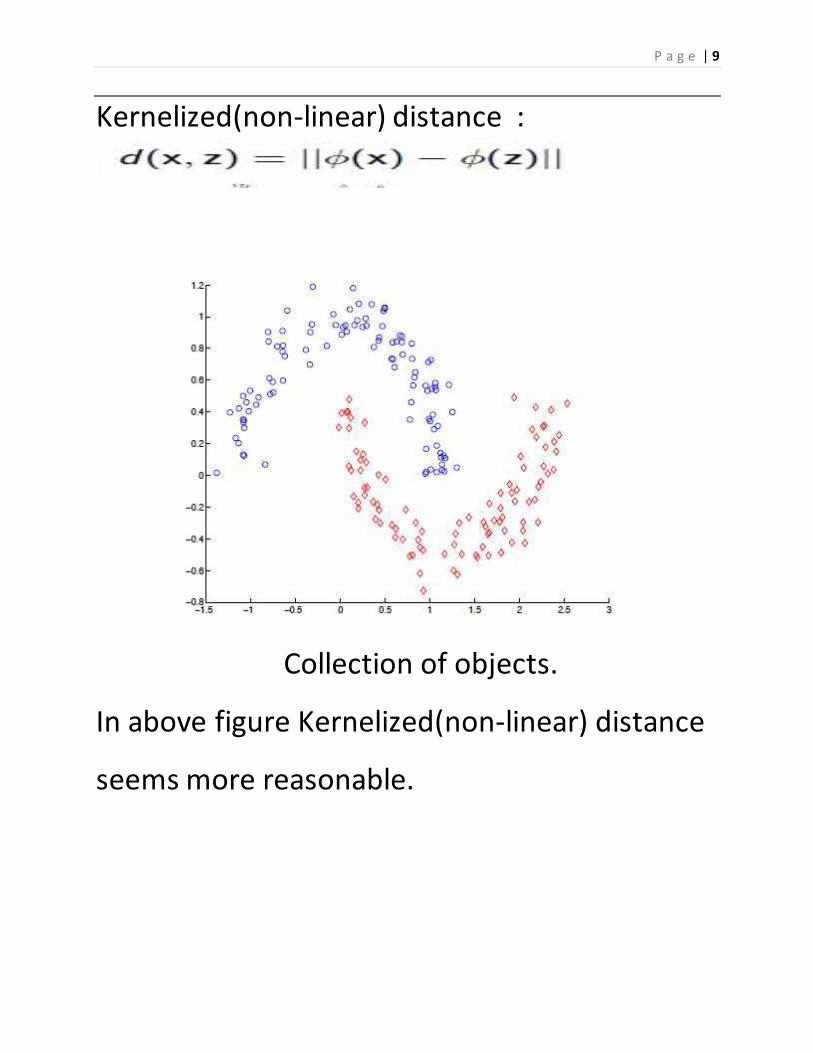
Kernelized(non-linear) distance :
Collection of objects.
In above figure Kernelized(non-linear) distance
seems more reasonable.

P a g e | 10
WHAT IS GOOD CLUSTERING?
A good clustering is one that achieves
1) High within-cluster similarity
2) Low inter-cluster similarity

P a g e | 11
2. TYPES OF CLUSTERING METHODS
There are many clustering methods
available, and each of them may give a
different grouping of a dataset. The
choice of a particular method will
depend on the type of output desired.
The known performance of method with
particular types of data, the hardware
and software facilities available and the
size of the dataset. In general, clustering
methods may be divided into two
categories based on the cluster structure
which they produce. The non-
hierarchical methods divide a dataset of
N objects into M clusters, with or
without overlap.
P a g e | 12
2.1 PARTITIONING
What is K-Means Clustering?
Simply speaking it is an algorithm to classify or
to group your objects based on
attributes/features into K number of group. K is
positive integer number. The grouping is done
by minimizing the sum of squares of distances
between data and the corresponding cluster
centroid. Thus, the purpose of K-mean
clustering is to classify the data,
Example: Suppose we have 4 objects as your
training data point and each object have 2
attributes. Each attribute represents coordinate
of the object
.
P a g e | 13
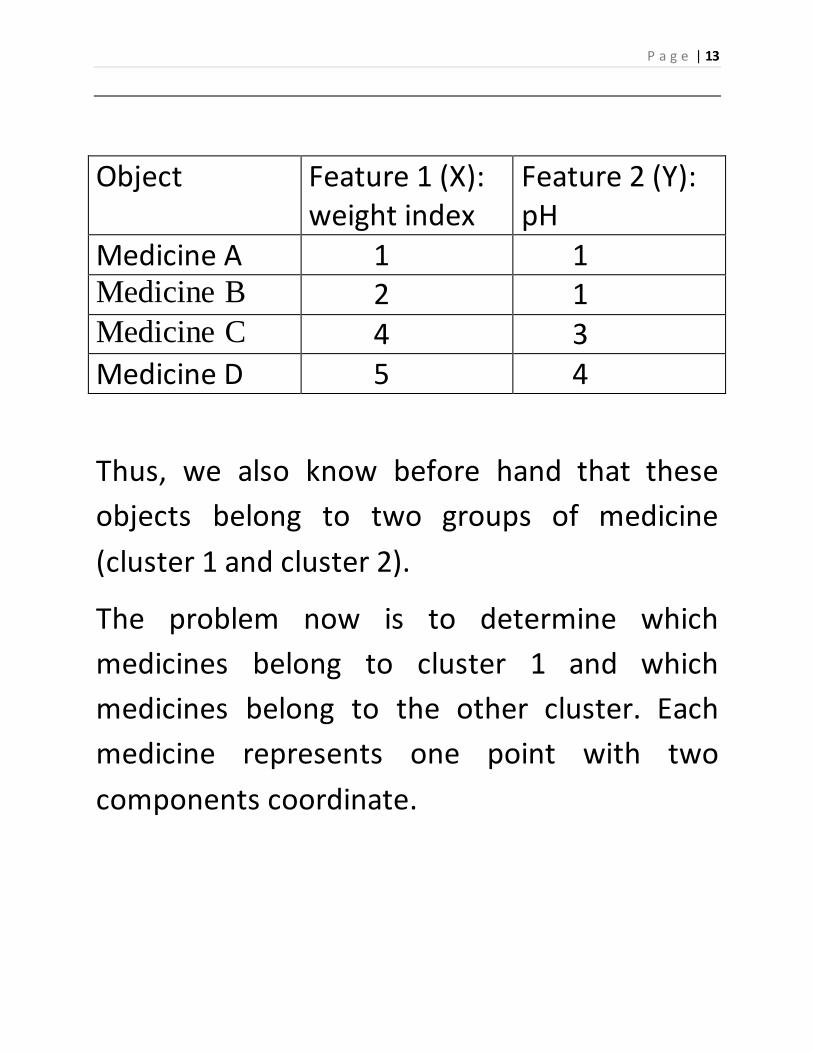
Object Feature 1 (X): weight index
Feature 2 (Y): pH
Medicine A 1 1 Medicine B 2 1 Medicine C 4 3 Medicine D 5 4
Thus, we also know before hand that these
objects belong to two groups of medicine
(cluster 1 and cluster 2).
The problem now is to determine which
medicines belong to cluster 1 and which
medicines belong to the other cluster. Each
medicine represents one point with two
components coordinate.
P a g e | 14
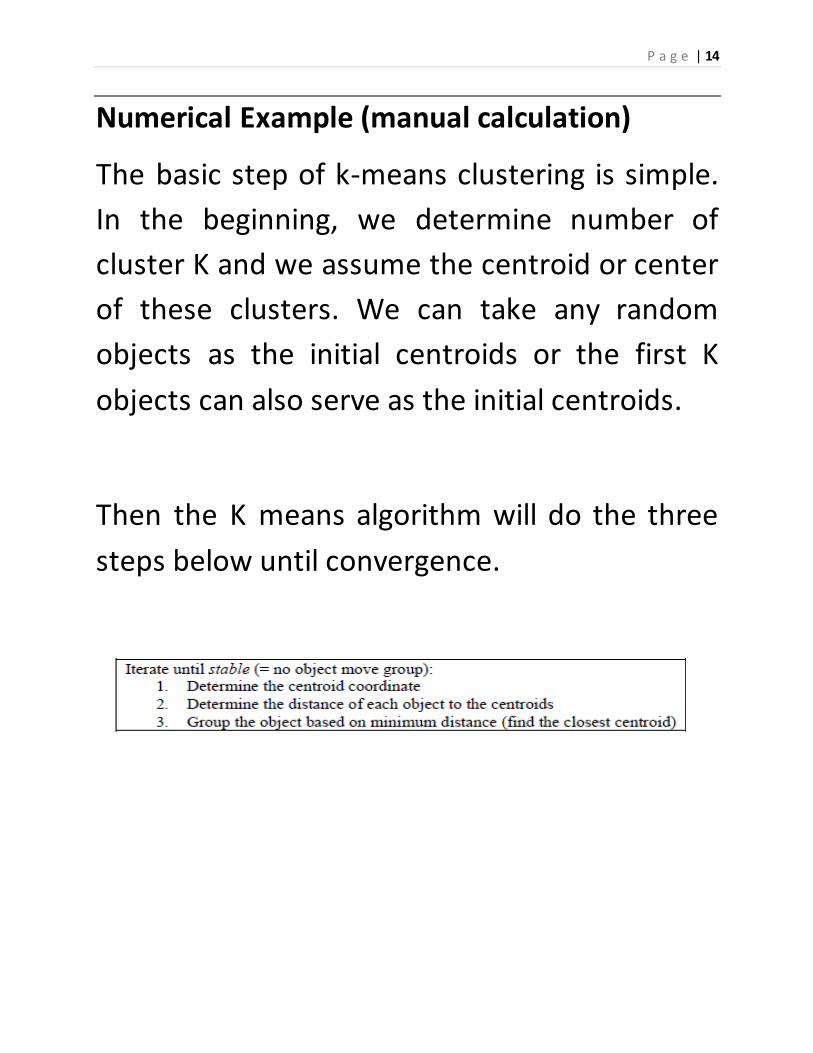
Numerical Example (manual calculation)
The basic step of k-means clustering is simple.
In the beginning, we determine number of
cluster K and we assume the centroid or center
of these clusters. We can take any random
objects as the initial centroids or the first K
objects can also serve as the initial centroids.
Then the K means algorithm will do the three
steps below until convergence.

P a g e | 15
Suppose we have several objects (4 types of
medicines) and each object have two attributes
or features as

P a g e | 16
shown in table below. Our goal is to group
these objects into K=2 group of medicine based
on the two
features (pH and weight index).
Objects Feature 1 (X): weight index
Feature 2 (Y): pH
Medicine A 1 1
Medicine B 2 1
Medicine C 4 3
Medicine D 5 4
Each medicine represents one point with two
features (X, Y) that we can represent it as
coordinate in a feature space as shown in the
figure .

P a g e | 17
1.Initial value of centroids: Suppose we use
medicine A and medicine B as the first
centroids. Let 1 c and 2 c denote the coordinate
of the centroids, then c1 = (1,1) and 2 c = (2,1).
2. Objects-Centroids distance: we calculate the
distance between cluster centroid to each
object. Let ususe Euclidean distance, then we
have distance matrix at iteration 0 is
P a g e | 18
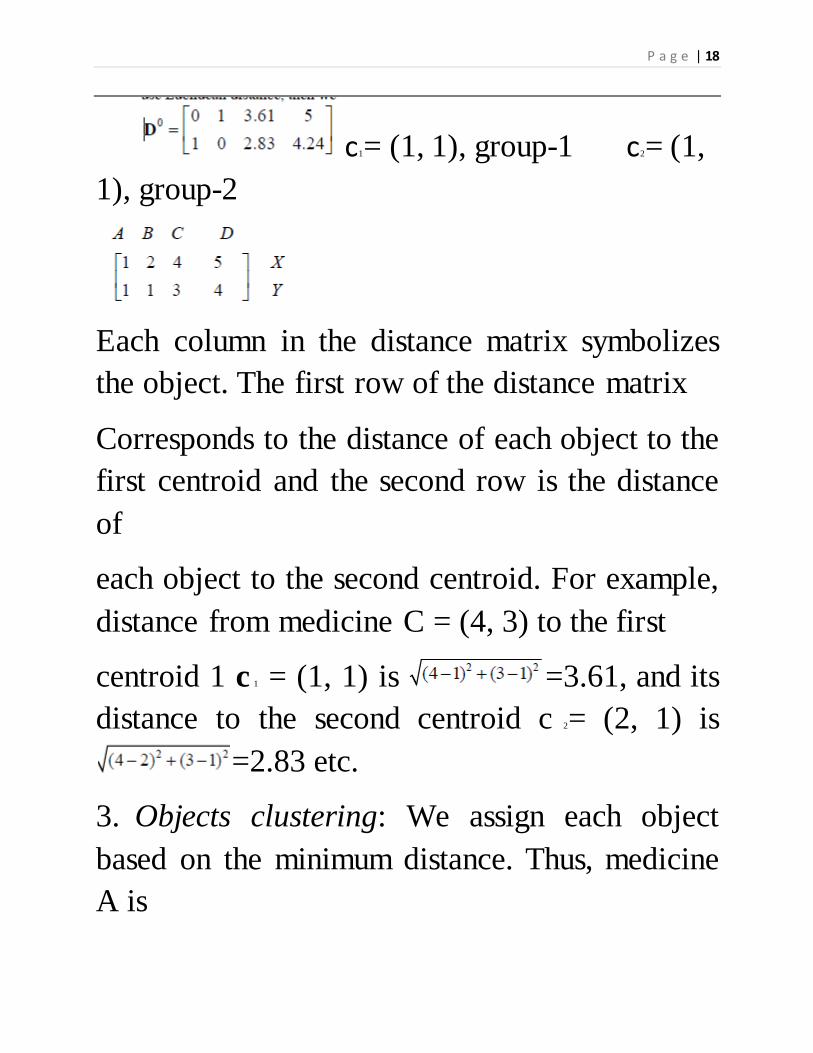
c1= (1, 1), group-1 c2= (1,
1), group-2
Each column in the distance matrix symbolizes
the object. The first row of the distance matrix
Corresponds to the distance of each object to the
first centroid and the second row is the distance
of
each object to the second centroid. For example,
distance from medicine C = (4, 3) to the first
centroid 1 c 1 = (1, 1) is =3.61, and its
distance to the second centroid c 2= (2, 1) is
=2.83 etc.
3. Objects clustering: We assign each object
based on the minimum distance. Thus, medicine
A is

P a g e | 19
assigned to group 1, medicine B to group 2,
medicine C to group 2 and medicine D to group
2. The element of Group matrix below is 1 if
and only if the object is assigned to that group
4. Iteration-1, determine centroids: Knowing the
members of each group, now we compute the
new centroid of each group based on these new
memberships. Group 1 only has one member
thus the centroid remains in c1 = (1, 1).
Group 2 now has three members, thus the
centroid is the average
Co-ordinate among the
three members:

P a g e | 20
.
This is figure shows that c1 = (1, 1) and

P a g e | 21
5.Iteration-1, Objects-Centroids distances: The
next step is to compute the distance of all
objects to
the new centroids. Similar to step 2, we have
distance matrix at iteration 1 is
6. Iteration-1, Objects clustering: Similar to step
3, we assign each object based on the minimum

P a g e | 22
distance. Based on the new distance matrix, we
move the medicine B to Group 1 while all the
other objects remain.The Group matrix is show
7. Iteration 2, determine centroids: Now we
repeat step 4 to calculate the new centroids
coordinate based on the clustering of previous
iteration. Group1 and group 2 both has two
members, thus the new centroids are
.

P a g e | 23
8. Iteration-2, Objects-Centroids distances:
Repeat step 2 again, we have new distance
matrix at
iteration 2 as

P a g e | 24
9. Iteration-2, Objects clustering: Again, we
assign each object based on the minimum
distance
We obtain result thatG2 = G1 . Comparing the
grouping of last iteration and this iteration
reveals that the objects does not move group
anymore. Thus, the computation of the k-mean
clustering has reached its stability and no more
P a g e | 25
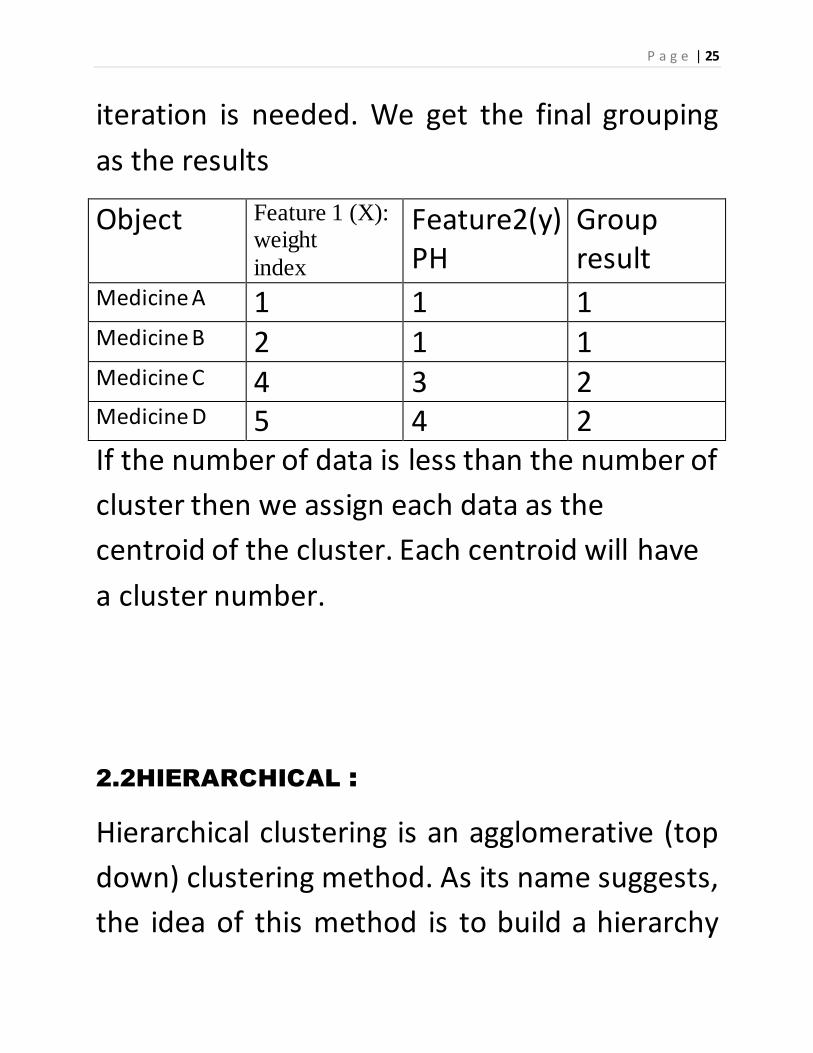
iteration is needed. We get the final grouping
as the results
Object Feature 1 (X): weight
index
Feature2(y) PH
Group result
Medicine A 1 1 1 Medicine B 2 1 1 Medicine C 4 3 2 Medicine D 5 4 2 If the number of data is less than the number of
cluster then we assign each data as the
centroid of the cluster. Each centroid will have
a cluster number.
2.2HIERARCHICAL :
Hierarchical clustering is an agglomerative (top
down) clustering method. As its name suggests,
the idea of this method is to build a hierarchy
P a g e | 26
of clusters, showing relations between the
individual members and merging clusters of
data based on similarity.
In the first step of clustering, the algorithm will
look for the two most similar data points and
merge them to create a new "pseudo-
datapoint", which represents the average of the
two merged datapoints. Each iterative step
takes the next two closest datapoints (or
pseduo-datapoints) and merges them. This
proces is generally continued until there is one
large cluster containing all the original
datapoints.
An example of agglomerative clustering using
colours.
The example below demonstrates the
agglomerative clustering using colours. In the
P a g e | 27
first stages, the red and orange are combined
to make reddish-orange. Green and blue are
similar to each other and are merged to form
aqua. Next, the reddish-orange and yellow are
the closest colours, and create a light orange.
Now we have three remaining colours: light
orange, the original purple and aqua. The
hierarchical clustering algorithm is only
interested in finding the closest relationship at
each stage regardless of the degree of
similarity. So in this case, the light orange and
purple are more similar than the any other
combination.
We are now left with the orange-purple
mixture and aqua. They are now the most
similar samples left and

P a g e | 28
so form a final cluster. The resulting tree shows
the overall similarity of the original samples .
.
P a g e | 29
3. APPLICATION
Data clustering has immense number of
applications in every field of life. One has to
cluster a lot of thing on the basis of similarity
either consciously or unconsciously. So the
history of data clustering is old as the history of
mankind.
In computer field also, use of data clustering
has its own value. Specially in the field of
information retrieval data clustering plays an
important role. Some of the applications are
listed below.

P a g e | 30
4. CONCLUSION
This paper, we try to give the basic concept of
clustering by first providing the definition and
clustering and then the definition of some
related terms. We give some examples to
elaborate the concept. Then we give different
approaches to data clustering and also
discussed some algorithms to implement that
approaches. The partitioning method and
hierarchical method of clustering were
explained. The applications of clustering are
also discussed with the examples of medical
images database, data mining using data
clustering and finally the case study of windows
NT. So we try to prove the importance of
clustering in every area of computer science.
We also try to prove that clustering is not
something really typical to databases but it has
its applications in the fields like networking.
P a g e | 31
5. REFERENCES
http://members.tripod.com/asim_saeed/paper
.htm
http://www-
users.cs.umn.edu/~kumar/dmbook/dmslides/c
hap8_basic_cluster_analysis.pdf.
http://people.revoledu.com/kardi/tutorial/kMe
an/index.html

P a g e | 32
Related Documents