VINA EKA WULANDARI [ G2AOO9193 ] DAFTAR PUSTAKA 1. WHO. Maternal Mortality in 2005. Geneva : Departement of Reproductive Health and Research WHO; 2007. 2. WHO. Maternal Mortality in 2000. Geneva : Departement of Reproductive Health and Research WHO ; 2003. 3. Yuli Kusumawati: Faktor Risiko Yang Berpengaruh Terhadap Persalinan Dengan Tindakan ; 2006. 4. Elmiaty Zen . Universitas Sumatera Utara : Determinan Rujukan Persalinan Kegawatdaruratan Obstetri oleh Bidan Praktek Swasta di Kota Medan ; 2003. 5. Novi Khila Firani. Universitas Brawijaya : Hubungan Antara Tingkat Pendidikan Ibu Hamil Dengan Perilaku Ibu Dalam Memilih Penolong Persalinan ; 1996. 6. Titiek Rahmawati, S. Keb. Prestasi Pustaka : Dasar-Dasar Kebidanan ;2012. 7. Nurhadiyah A. Ritonga . Tanjung Balai : Manajemen Unit Gawat Darurat Pada Penanganan Kasus Kegawatdaruratan Obstetri di Rumah Sakit Tengku Mansyur ; 2005-2006. 8. adlun. Feryanto Ahmad . Salemba medika : Asuhan Kebidanan Patologis ; 2011. 9. Universitas Sumatera Utara : Hubungan Kompetensi Bidan Dalam Pelaksanaan Asuhan Persalinan,PDF. 10. Vitricya Purnama Sari : Angka Kematian Ibu ( AKI ) Kategori Pasien Obstetri di ICU dan HCU Rumah Sakit Kariadi Semarang ; 2010-2012.

Welcome message from author
This document is posted to help you gain knowledge. Please leave a comment to let me know what you think about it! Share it to your friends and learn new things together.
Transcript

VINA EKA WULANDARI [ G2AOO9193 ]
DAFTAR PUSTAKA
1. WHO. Maternal Mortality in 2005. Geneva : Departement of Reproductive Health
and Research WHO; 2007.
2. WHO. Maternal Mortality in 2000. Geneva : Departement of Reproductive Health
and Research WHO ; 2003.
3. Yuli Kusumawati: Faktor Risiko Yang Berpengaruh Terhadap Persalinan Dengan
Tindakan ; 2006.
4. Elmiaty Zen . Universitas Sumatera Utara : Determinan Rujukan Persalinan
Kegawatdaruratan Obstetri oleh Bidan Praktek Swasta di Kota Medan ; 2003.
5. Novi Khila Firani. Universitas Brawijaya : Hubungan Antara Tingkat Pendidikan Ibu
Hamil Dengan Perilaku Ibu Dalam Memilih Penolong Persalinan ; 1996.
6. Titiek Rahmawati, S. Keb. Prestasi Pustaka : Dasar-Dasar Kebidanan ;2012.
7. Nurhadiyah A. Ritonga . Tanjung Balai : Manajemen Unit Gawat Darurat Pada
Penanganan Kasus Kegawatdaruratan Obstetri di Rumah Sakit Tengku Mansyur ;
2005-2006.
8. adlun. Feryanto Ahmad . Salemba medika : Asuhan Kebidanan Patologis ; 2011.
9. Universitas Sumatera Utara : Hubungan Kompetensi Bidan Dalam Pelaksanaan
Asuhan Persalinan,PDF.
10. Vitricya Purnama Sari : Angka Kematian Ibu ( AKI ) Kategori Pasien Obstetri di ICU
dan HCU Rumah Sakit Kariadi Semarang ; 2010-2012.
VINA EKA WULANDARI [ G2AOO9193 ]
11. Fox NS, Bavshar V, Saltzman DH, Rebarber A, Chasen ST. Influence of Maternal
Body Mass Index on the Clinical Estimation of Fetal Weight in Term Pregnancies.
Obstet Gynecol. 2009.
12. Mochtar R. Perdarahan postpartum. Dalam : Lutan D, editor. Sinopsis Obstetri. Ed II.
Jakarta : EGC; 1998.
13. Cunningham FG, Gant NF, Leveno KJ, Gilstrap III LC, Hauth JC, Wenstrom KD.
Gangguan hipertensi dalam kehamilan. Dalam : Obstetri William vol 1. Ed. 21.
Jakarta : EGC; 2005.
14. Cunningham FG, Gant NF, Leveno KJ, Gilstrap III LC, Wenstrom KD. Perdarahan
obstetri. Dalam : Obstetri William vol 1. Ed. 21. Jakarta : EGC ; 2005.

VINA EKA WULANDARI [ G2AOO9193 ]
LAMPIRAN

VINA EKA WULANDARI [ G2AOO9193 ]
Crosstabs
Usia Ibu * Diagnosis 1
0 0 0 0 0
,0% ,0% ,0% ,0% ,0%
,0% ,0% ,0% ,0% ,0%
,0% ,0% ,0% ,0% ,0%
1 1 1 0 0
1,5% 1,5% 1,5% ,0% ,0%
100,0% 100,0% 100,0% ,0% ,0%
1,0% 1,0% 1,0% ,0% ,0%
0 0 0 1 1
,0% ,0% ,0% 4,2% 4,2%
,0% ,0% ,0% 100,0% 100,0%
,0% ,0% ,0% 1,0% 1,0%
1 1 1 1 1
1,0% 1,0% 1,0% 1,0% 1,0%
100,0% 100,0% 100,0% 100,0% 100,0%
1,0% 1,0% 1,0% 1,0% 1,0%
Count
% within Usia Ibu
% within Diagnosis 1
% of Total
Count
% within Usia Ibu
% within Diagnosis 1
% of Total
Count
% within Usia Ibu
% within Diagnosis 1
% of Total
Count
% within Usia Ibu
% within Diagnosis 1
% of Total
< 20 tahun
20-35 tahun
> 35 tahun
UsiaIbu
Total
CPDEklamsia
berat
Hamil lewatbulan (
Serotinus) Hipertensi
Infeksi karenakeluar lendir
putih bau darivagina
Chi-Square Tests
34,759a 38 ,620
32,020 38 ,742
97
Pearson Chi-Square
Likelihood Ratio
N of Valid Cases
Value dfAsymp. Sig.
(2-sided)
56 cells (93,3%) have expected count less than 5. Theminimum expected count is ,05.
a.

VINA EKA WULANDARI [ G2AOO9193 ]
Symmetric Measures
,514 ,620
97
Contingency CoefficientNominal by Nominal
N of Valid Cases
Value Approx. Sig.
Not assuming the null hypothesis.a.
Using the asymptotic standard error assuming the null hypothesis.b.
Nilai sig = 0,620 > 0,05 maka tidak ada hubungan umur dengandiagnosis1Bila ditemukan pada kasus lain didapatkan nilai sig < 0,05 makaada hubungan antar variabel
Usia Ibu * Diagnosis 2
Crosstab
0 0 0 0 0 0 0 0 0 1 0 0
,0% ,0% ,0% ,0% ,0% ,0% ,0% ,0% ,0% 20,0% ,0% ,0% ,0%
,0% ,0% ,0% ,0% ,0% ,0% ,0% ,0% ,0% 20,0% ,0% ,0% ,0%
,0% ,0% ,0% ,0% ,0% ,0% ,0% ,0% ,0% 1,0% ,0% ,0% ,0%
2 0 3 1 0 1 0 1 1 4 5 1
2,9% ,0% 4,4% 1,5% ,0% 1,5% ,0% 1,5% 1,5% 5,9% 7,4% 1,5% 1,5%
100,0% ,0% 100,0% 50,0% ,0% 100,0% ,0% 50,0%100,0% 80,0% 83,3%100,0% 50,0%
2,1% ,0% 3,1% 1,0% ,0% 1,0% ,0% 1,0% 1,0% 4,1% 5,2% 1,0% 1,0%
0 2 0 1 1 0 1 1 0 0 1 0
,0% 8,3% ,0% 4,2% 4,2% ,0% 4,2% 4,2% ,0% ,0% 4,2% ,0% 4,2%
,0%100,0% ,0% 50,0%100,0% ,0% 100,0% 50,0% ,0% ,0% 16,7% ,0% 50,0%
,0% 2,1% ,0% 1,0% 1,0% ,0% 1,0% 1,0% ,0% ,0% 1,0% ,0% 1,0%
2 2 3 2 1 1 1 2 1 5 6 1
2,1% 2,1% 3,1% 2,1% 1,0% 1,0% 1,0% 2,1% 1,0% 5,2% 6,2% 1,0% 2,1%
100,0%100,0% 100,0%100,0%100,0% 100,0% 100,0%100,0%100,0% 100,0% 100,0%100,0%100,0%
2,1% 2,1% 3,1% 2,1% 1,0% 1,0% 1,0% 2,1% 1,0% 5,2% 6,2% 1,0% 2,1%
Count
% within Usia Ibu
% within Diagnosis 2
% of Total
Count
% within Usia Ibu
% within Diagnosis 2
% of Total
Count
% within Usia Ibu
% within Diagnosis 2
% of Total
Count
% within Usia Ibu
% within Diagnosis 2
% of Total
< 20 tahun
20-35 tahun
> 35 tahun
UsiaIbu
Total
AnemiaEklamsia
beratFetal distressGemelliHidramionHipertensigestasionalInduksi gagalKPD
PanggulsempitPartus macet
Partusprematureimminens PEB PER
Diagnosis 2

VINA EKA WULANDARI [ G2AOO9193 ]
Chi-Square Tests
35,162a 38 ,601
35,274 38 ,596
97
Pearson Chi-Square
Likelihood Ratio
N of Valid Cases
Value dfAsymp. Sig.
(2-sided)
58 cells (96,7%) have expected count less than 5. Theminimum expected count is ,05.
a.
Symmetric Measures
,516 ,601
97
Contingency CoefficientNominal by Nominal
N of Valid Cases
Value Approx. Sig.
Not assuming the null hypothesis.a.
Using the asymptotic standard error assuming the null hypothesis.b.
Usia Ibu * Diagnosis 3
Crosstab
0 0 0 1 0 0 0 0 0 4 5
,0% ,0% ,0% 20,0% ,0% ,0% ,0% ,0% ,0% 80,0%100,0%
,0% ,0% ,0%100,0% ,0% ,0% ,0% ,0% ,0% 4,5% 5,2%
,0% ,0% ,0% 1,0% ,0% ,0% ,0% ,0% ,0% 4,1% 5,2%
0 1 1 0 1 0 0 0 1 64 68
,0% 1,5% 1,5% ,0% 1,5% ,0% ,0% ,0% 1,5% 94,1%100,0%
,0% 100,0%100,0% ,0%100,0% ,0% ,0% ,0%100,0% 72,7% 70,1%
,0% 1,0% 1,0% ,0% 1,0% ,0% ,0% ,0% 1,0% 66,0% 70,1%
1 0 0 0 0 1 1 1 0 20 24
4,2% ,0% ,0% ,0% ,0% 4,2% 4,2% 4,2% ,0% 83,3%100,0%
100,0% ,0% ,0% ,0% ,0%100,0% 100,0% 100,0% ,0% 22,7% 24,7%
1,0% ,0% ,0% ,0% ,0% 1,0% 1,0% 1,0% ,0% 20,6% 24,7%
1 1 1 1 1 1 1 1 1 88 97
1,0% 1,0% 1,0% 1,0% 1,0% 1,0% 1,0% 1,0% 1,0% 90,7%100,0%
100,0% 100,0%100,0%100,0%100,0%100,0% 100,0% 100,0%100,0%100,0%100,0%
1,0% 1,0% 1,0% 1,0% 1,0% 1,0% 1,0% 1,0% 1,0% 90,7%100,0%
Count
% within Usia Ibu
% within Diagnosis 3
% of Total
Count
% within Usia Ibu
% within Diagnosis 3
% of Total
Count
% within Usia Ibu
% within Diagnosis 3
% of Total
Count
% within Usia Ibu
% within Diagnosis 3
% of Total
< 20 tahun
20-35 tahun
> 35 tahun
UsiaIbu
Total
GemelliJanin besarKPD Obesitas PEB PER
Presentasijanin letak
lintang
Presentasijanin letaksungsang
Tali pusatmelilitTidak ada
Diagnosis 3
Total
VINA EKA WULANDARI [ G2AOO9193 ]
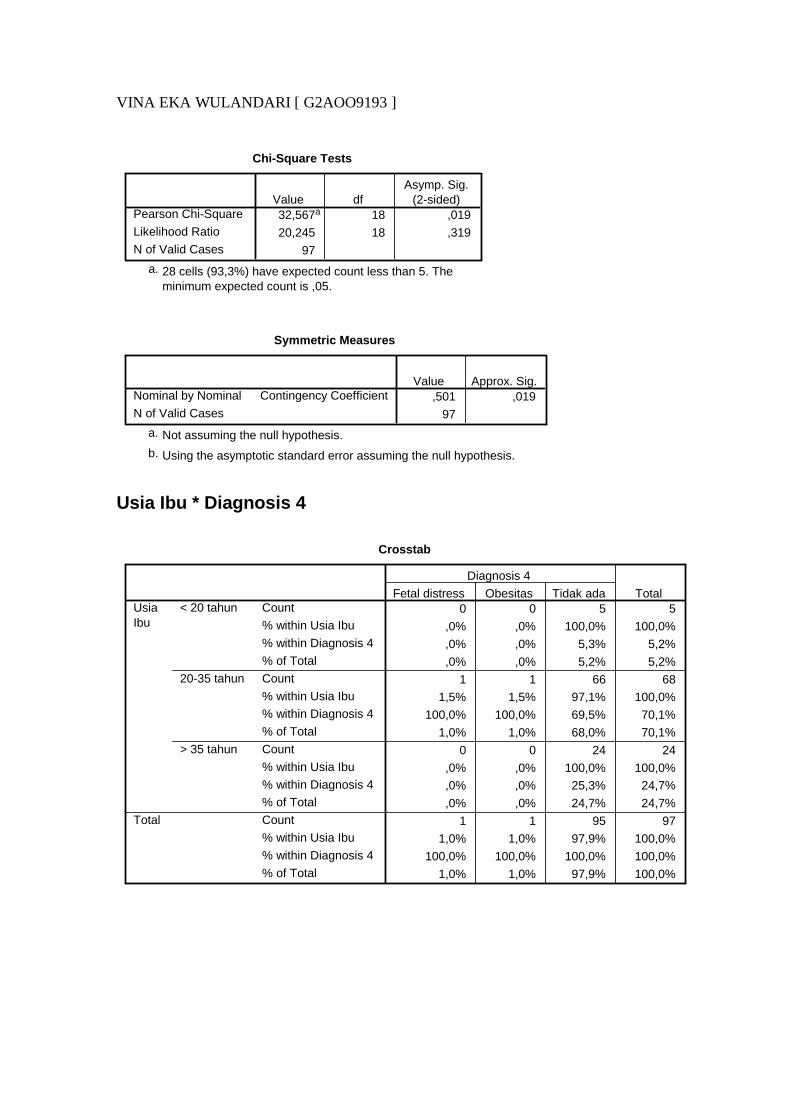
Chi-Square Tests
32,567a 18 ,019
20,245 18 ,319
97
Pearson Chi-Square
Likelihood Ratio
N of Valid Cases
Value dfAsymp. Sig.
(2-sided)
28 cells (93,3%) have expected count less than 5. Theminimum expected count is ,05.
a.
Symmetric Measures
,501 ,019
97
Contingency CoefficientNominal by Nominal
N of Valid Cases
Value Approx. Sig.
Not assuming the null hypothesis.a.
Using the asymptotic standard error assuming the null hypothesis.b.
Usia Ibu * Diagnosis 4
Crosstab
0 0 5 5
,0% ,0% 100,0% 100,0%
,0% ,0% 5,3% 5,2%
,0% ,0% 5,2% 5,2%
1 1 66 68
1,5% 1,5% 97,1% 100,0%
100,0% 100,0% 69,5% 70,1%
1,0% 1,0% 68,0% 70,1%
0 0 24 24
,0% ,0% 100,0% 100,0%
,0% ,0% 25,3% 24,7%
,0% ,0% 24,7% 24,7%
1 1 95 97
1,0% 1,0% 97,9% 100,0%
100,0% 100,0% 100,0% 100,0%
1,0% 1,0% 97,9% 100,0%
Count
% within Usia Ibu
% within Diagnosis 4
% of Total
Count
% within Usia Ibu
% within Diagnosis 4
% of Total
Count
% within Usia Ibu
% within Diagnosis 4
% of Total
Count
% within Usia Ibu
% within Diagnosis 4
% of Total
< 20 tahun
20-35 tahun
> 35 tahun
UsiaIbu
Total
Fetal distress Obesitas Tidak ada
Diagnosis 4
Total

VINA EKA WULANDARI [ G2AOO9193 ]
Chi-Square Tests
,871a 4 ,929
1,439 4 ,837
97
Pearson Chi-Square
Likelihood Ratio
N of Valid Cases
Value dfAsymp. Sig.
(2-sided)
7 cells (77,8%) have expected count less than 5. Theminimum expected count is ,05.
a.
Symmetric Measures
,094 ,929
97
Contingency CoefficientNominal by Nominal
N of Valid Cases
Value Approx. Sig.
Not assuming the null hypothesis.a.
Using the asymptotic standard error assuming the null hypothesis.b.
Usia Kehamilan * Diagnosis 1

VINA EKA WULANDARI [ G2AOO9193 ]
0 0 0 0 0
,0% ,0% ,0% ,0% ,0%
,0% ,0% ,0% ,0% ,0%
,0% ,0% ,0% ,0% ,0%
0 0 0 0 0
,0% ,0% ,0% ,0% ,0%
,0% ,0% ,0% ,0% ,0%
,0% ,0% ,0% ,0% ,0%
0 0 0 0 0
,0% ,0% ,0% ,0% ,0%
,0% ,0% ,0% ,0% ,0%
,0% ,0% ,0% ,0% ,0%
0 0 0 0 0
,0% ,0% ,0% ,0% ,0%
,0% ,0% ,0% ,0% ,0%
,0% ,0% ,0% ,0% ,0%
0 0 0 0 0
,0% ,0% ,0% ,0% ,0%
,0% ,0% ,0% ,0% ,0%
,0% ,0% ,0% ,0% ,0%
0 0 0 0 0
,0% ,0% ,0% ,0% ,0%
,0% ,0% ,0% ,0% ,0%
,0% ,0% ,0% ,0% ,0%
0 0 0 0 0
,0% ,0% ,0% ,0% ,0%
,0% ,0% ,0% ,0% ,0%
,0% ,0% ,0% ,0% ,0%
0 1 0 1 0
,0% 3,4% ,0% 3,4% ,0%
,0% 100,0% ,0% 100,0% ,0%
,0% 1,0% ,0% 1,0% ,0%
1 0 0 0 0
3,6% ,0% ,0% ,0% ,0%
100,0% ,0% ,0% ,0% ,0%
1,0% ,0% ,0% ,0% ,0%
0 0 0 0 1
,0% ,0% ,0% ,0% 20,0%
,0% ,0% ,0% ,0% 100,0%
,0% ,0% ,0% ,0% 1,0%
0 0 1 0 0
,0% ,0% 16,7% ,0% ,0%
,0% ,0% 100,0% ,0% ,0%
,0% ,0% 1,0% ,0% ,0%
0 0 0 0 0
,0% ,0% ,0% ,0% ,0%
Count
% within Usia Kehamilan
% within Diagnosis 1
% of Total
Count
% within Usia Kehamilan
% within Diagnosis 1
% of Total
Count
% within Usia Kehamilan
% within Diagnosis 1
% of Total
Count
% within Usia Kehamilan
% within Diagnosis 1
% of Total
Count
% within Usia Kehamilan
% within Diagnosis 1
% of Total
Count
% within Usia Kehamilan
% within Diagnosis 1
% of Total
Count
% within Usia Kehamilan
% within Diagnosis 1
% of Total
Count
% within Usia Kehamilan
% within Diagnosis 1
% of Total
Count
% within Usia Kehamilan
% within Diagnosis 1
% of Total
Count
% within Usia Kehamilan
% within Diagnosis 1
% of Total
Count
% within Usia Kehamilan
% within Diagnosis 1
% of Total
Count
% within Usia Kehamilan
32
33
34
35
36
37
38
39
40
41
42
43
UsiaKehamilan
CPDEklamsia
berat
Hamil lewatbulan (
Serotinus) Hipertensi
Infeksi karenakeluar lendir
putih bau darivagina

VINA EKA WULANDARI [ G2AOO9193 ]
Chi-Square Tests
221,206a 209 ,268
113,868 209 1,000
97
Pearson Chi-Square
Likelihood Ratio
N of Valid Cases
Value dfAsymp. Sig.
(2-sided)
236 cells (98,3%) have expected count less than 5. Theminimum expected count is ,01.
a.
Symmetric Measures
,834 ,268
97
Contingency CoefficientNominal by Nominal
N of Valid Cases
Value Approx. Sig.
Not assuming the null hypothesis.a.
Using the asymptotic standard error assuming the null hypothesis.b.
Usia Kehamilan * Diagnosis 2
VINA EKA WULANDARI [ G2AOO9193 ]
0 0 0 0 0
,0% ,0% ,0% ,0% ,0%
,0% ,0% ,0% ,0% ,0%
,0% ,0% ,0% ,0% ,0%
0 0 0 0 0
,0% ,0% ,0% ,0% ,0%
,0% ,0% ,0% ,0% ,0%
,0% ,0% ,0% ,0% ,0%
0 0 0 0 0
,0% ,0% ,0% ,0% ,0%
,0% ,0% ,0% ,0% ,0%
,0% ,0% ,0% ,0% ,0%
0 0 0 0 0
,0% ,0% ,0% ,0% ,0%
,0% ,0% ,0% ,0% ,0%
,0% ,0% ,0% ,0% ,0%
0 0 0 1 0
,0% ,0% ,0% 100,0% ,0%
,0% ,0% ,0% 50,0% ,0%
,0% ,0% ,0% 1,0% ,0%
0 0 0 0 0
,0% ,0% ,0% ,0% ,0%
,0% ,0% ,0% ,0% ,0%
,0% ,0% ,0% ,0% ,0%
0 0 2 0 1
,0% ,0% 14,3% ,0% 7,1%
,0% ,0% 66,7% ,0% 100,0%
,0% ,0% 2,1% ,0% 1,0%
1 1 1 0 0
3,4% 3,4% 3,4% ,0% ,0%
50,0% 50,0% 33,3% ,0% ,0%
1,0% 1,0% 1,0% ,0% ,0%
1 1 0 1 0
3,6% 3,6% ,0% 3,6% ,0%
50,0% 50,0% ,0% 50,0% ,0%
1,0% 1,0% ,0% 1,0% ,0%
0 0 0 0 0
,0% ,0% ,0% ,0% ,0%
,0% ,0% ,0% ,0% ,0%
,0% ,0% ,0% ,0% ,0%
0 0 0 0 0
,0% ,0% ,0% ,0% ,0%
,0% ,0% ,0% ,0% ,0%
,0% ,0% ,0% ,0% ,0%
0 0 0 0 0
,0% ,0% ,0% ,0% ,0%
,0% ,0% ,0% ,0% ,0%
Count
% within Usia Kehamilan
% within Diagnosis 2
% of Total
Count
% within Usia Kehamilan
% within Diagnosis 2
% of Total
Count
% within Usia Kehamilan
% within Diagnosis 2
% of Total
Count
% within Usia Kehamilan
% within Diagnosis 2
% of Total
Count
% within Usia Kehamilan
% within Diagnosis 2
% of Total
Count
% within Usia Kehamilan
% within Diagnosis 2
% of Total
Count
% within Usia Kehamilan
% within Diagnosis 2
% of Total
Count
% within Usia Kehamilan
% within Diagnosis 2
% of Total
Count
% within Usia Kehamilan
% within Diagnosis 2
% of Total
Count
% within Usia Kehamilan
% within Diagnosis 2
% of Total
Count
% within Usia Kehamilan
% within Diagnosis 2
% of Total
Count
% within Usia Kehamilan
% within Diagnosis 2
32
33
34
35
36
37
38
39
40
41
42
43
UsiaKehamilan
AnemiaEklamsia
berat Fetal distress Gemelli Hidramion
VINA EKA WULANDARI [ G2AOO9193 ]
Chi-Square Tests
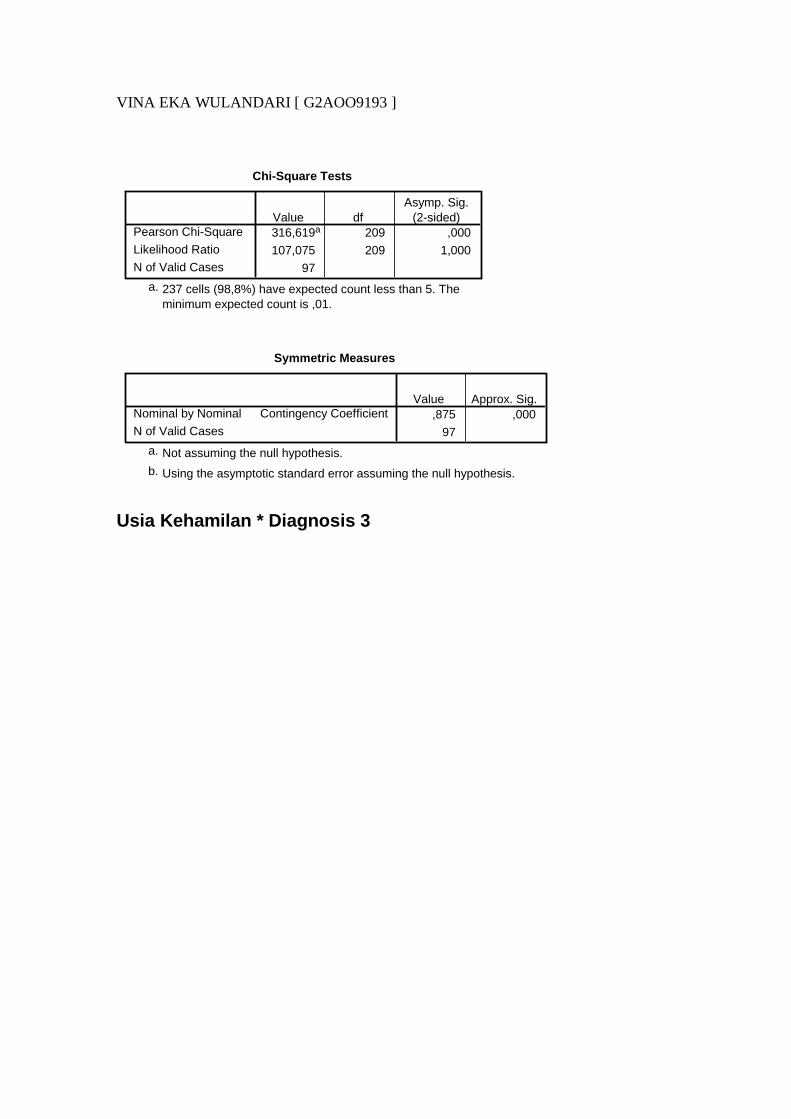
316,619a 209 ,000
107,075 209 1,000
97
Pearson Chi-Square
Likelihood Ratio
N of Valid Cases
Value dfAsymp. Sig.
(2-sided)
237 cells (98,8%) have expected count less than 5. Theminimum expected count is ,01.
a.
Symmetric Measures
,875 ,000
97
Contingency CoefficientNominal by Nominal
N of Valid Cases
Value Approx. Sig.
Not assuming the null hypothesis.a.
Using the asymptotic standard error assuming the null hypothesis.b.
Usia Kehamilan * Diagnosis 3
VINA EKA WULANDARI [ G2AOO9193 ]
Crosstab
1 0 0 0 0
50,0% ,0% ,0% ,0% ,0%
100,0% ,0% ,0% ,0% ,0%
1,0% ,0% ,0% ,0% ,0%
0 0 0 0 0
,0% ,0% ,0% ,0% ,0%
,0% ,0% ,0% ,0% ,0%
,0% ,0% ,0% ,0% ,0%
0 0 0 0 0
,0% ,0% ,0% ,0% ,0%
,0% ,0% ,0% ,0% ,0%
,0% ,0% ,0% ,0% ,0%
0 0 0 0 0
,0% ,0% ,0% ,0% ,0%
,0% ,0% ,0% ,0% ,0%
,0% ,0% ,0% ,0% ,0%
0 0 0 0 0
,0% ,0% ,0% ,0% ,0%
,0% ,0% ,0% ,0% ,0%
,0% ,0% ,0% ,0% ,0%
0 0 0 0 0
,0% ,0% ,0% ,0% ,0%
,0% ,0% ,0% ,0% ,0%
,0% ,0% ,0% ,0% ,0%
0 0 0 0 0
,0% ,0% ,0% ,0% ,0%
,0% ,0% ,0% ,0% ,0%
,0% ,0% ,0% ,0% ,0%
0 0 0 0 0
,0% ,0% ,0% ,0% ,0%
,0% ,0% ,0% ,0% ,0%
,0% ,0% ,0% ,0% ,0%
0 0 1 1 1
,0% ,0% 3,6% 3,6% 3,6%
,0% ,0% 100,0% 100,0% 100,0% 100,0%
,0% ,0% 1,0% 1,0% 1,0%
0 1 0 0 0
,0% 20,0% ,0% ,0% ,0%
,0% 100,0% ,0% ,0% ,0%
,0% 1,0% ,0% ,0% ,0%
0 0 0 0 0
,0% ,0% ,0% ,0% ,0%
,0% ,0% ,0% ,0% ,0%
,0% ,0% ,0% ,0% ,0%
0 0 0 0 0
,0% ,0% ,0% ,0% ,0%
,0% ,0% ,0% ,0% ,0%
Count
% within Usia Kehamilan
% within Diagnosis 3
% of Total
Count
% within Usia Kehamilan
% within Diagnosis 3
% of Total
Count
% within Usia Kehamilan
% within Diagnosis 3
% of Total
Count
% within Usia Kehamilan
% within Diagnosis 3
% of Total
Count
% within Usia Kehamilan
% within Diagnosis 3
% of Total
Count
% within Usia Kehamilan
% within Diagnosis 3
% of Total
Count
% within Usia Kehamilan
% within Diagnosis 3
% of Total
Count
% within Usia Kehamilan
% within Diagnosis 3
% of Total
Count
% within Usia Kehamilan
% within Diagnosis 3
% of Total
Count
% within Usia Kehamilan
% within Diagnosis 3
% of Total
Count
% within Usia Kehamilan
% within Diagnosis 3
% of Total
Count
% within Usia Kehamilan
% within Diagnosis 3
32
33
34
35
36
37
38
39
40
41
42
43
UsiaKehamilan
Gemelli Janin besar KPD Obesitas PEB PER
Diagnosis 3

VINA EKA WULANDARI [ G2AOO9193 ]
Chi-Square Tests
83,615a 99 ,866
31,767 99 1,000
97
Pearson Chi-Square
Likelihood Ratio
N of Valid Cases
Value dfAsymp. Sig.
(2-sided)
115 cells (95,8%) have expected count less than 5. Theminimum expected count is ,01.
a.
Symmetric Measures
,680 ,866
97
Contingency CoefficientNominal by Nominal
N of Valid Cases
Value Approx. Sig.
Not assuming the null hypothesis.a.
Using the asymptotic standard error assuming the null hypothesis.b.
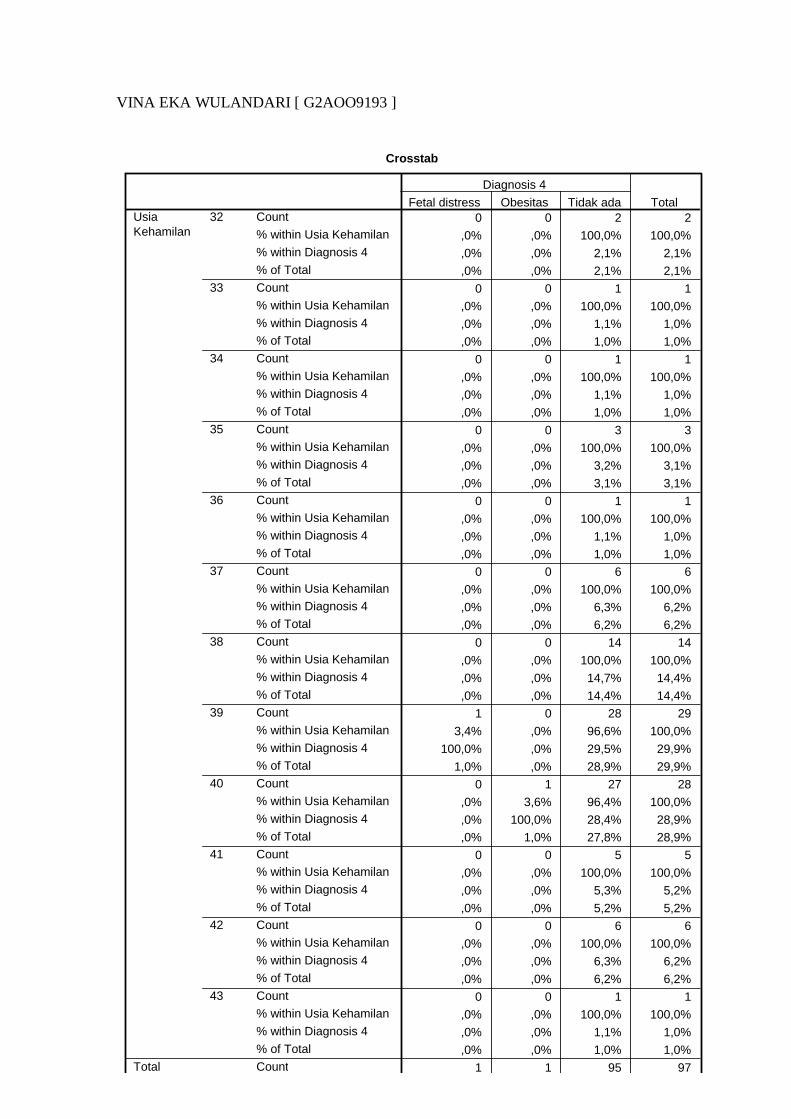
Usia Kehamilan * Diagnosis 4
VINA EKA WULANDARI [ G2AOO9193 ]
Crosstab
0 0 2 2
,0% ,0% 100,0% 100,0%
,0% ,0% 2,1% 2,1%
,0% ,0% 2,1% 2,1%
0 0 1 1
,0% ,0% 100,0% 100,0%
,0% ,0% 1,1% 1,0%
,0% ,0% 1,0% 1,0%
0 0 1 1
,0% ,0% 100,0% 100,0%
,0% ,0% 1,1% 1,0%
,0% ,0% 1,0% 1,0%
0 0 3 3
,0% ,0% 100,0% 100,0%
,0% ,0% 3,2% 3,1%
,0% ,0% 3,1% 3,1%
0 0 1 1
,0% ,0% 100,0% 100,0%
,0% ,0% 1,1% 1,0%
,0% ,0% 1,0% 1,0%
0 0 6 6
,0% ,0% 100,0% 100,0%
,0% ,0% 6,3% 6,2%
,0% ,0% 6,2% 6,2%
0 0 14 14
,0% ,0% 100,0% 100,0%
,0% ,0% 14,7% 14,4%
,0% ,0% 14,4% 14,4%
1 0 28 29
3,4% ,0% 96,6% 100,0%
100,0% ,0% 29,5% 29,9%
1,0% ,0% 28,9% 29,9%
0 1 27 28
,0% 3,6% 96,4% 100,0%
,0% 100,0% 28,4% 28,9%
,0% 1,0% 27,8% 28,9%
0 0 5 5
,0% ,0% 100,0% 100,0%
,0% ,0% 5,3% 5,2%
,0% ,0% 5,2% 5,2%
0 0 6 6
,0% ,0% 100,0% 100,0%
,0% ,0% 6,3% 6,2%
,0% ,0% 6,2% 6,2%
0 0 1 1
,0% ,0% 100,0% 100,0%
,0% ,0% 1,1% 1,0%
,0% ,0% 1,0% 1,0%
1 1 95 97
Count
% within Usia Kehamilan
% within Diagnosis 4
% of Total
Count
% within Usia Kehamilan
% within Diagnosis 4
% of Total
Count
% within Usia Kehamilan
% within Diagnosis 4
% of Total
Count
% within Usia Kehamilan
% within Diagnosis 4
% of Total
Count
% within Usia Kehamilan
% within Diagnosis 4
% of Total
Count
% within Usia Kehamilan
% within Diagnosis 4
% of Total
Count
% within Usia Kehamilan
% within Diagnosis 4
% of Total
Count
% within Usia Kehamilan
% within Diagnosis 4
% of Total
Count
% within Usia Kehamilan
% within Diagnosis 4
% of Total
Count
% within Usia Kehamilan
% within Diagnosis 4
% of Total
Count
% within Usia Kehamilan
% within Diagnosis 4
% of Total
Count
% within Usia Kehamilan
% within Diagnosis 4
% of Total
Count
32
33
34
35
36
37
38
39
40
41
42
43
UsiaKehamilan
Total
Fetal distress Obesitas Tidak ada
Diagnosis 4
Total

VINA EKA WULANDARI [ G2AOO9193 ]
Chi-Square Tests
4,839a 22 1,000
4,929 22 1,000
97
Pearson Chi-Square
Likelihood Ratio
N of Valid Cases
Value dfAsymp. Sig.
(2-sided)
31 cells (86,1%) have expected count less than 5. Theminimum expected count is ,01.
a.
Symmetric Measures
,218 1,000
97
Contingency CoefficientNominal by Nominal
N of Valid Cases
Value Approx. Sig.
Not assuming the null hypothesis.a.
Using the asymptotic standard error assuming the null hypothesis.b.
kategori paritas * Diagnosis 1
0 1 1 1
,0% 2,4% 2,4% 2,4%
,0% 100,0% 100,0% 100,0%
,0% 1,0% 1,0% 1,0%
1 0 0 0
2,0% ,0% ,0% ,0%
100,0% ,0% ,0% ,0%
1,0% ,0% ,0% ,0%
0 0 0 0
,0% ,0% ,0% ,0%
,0% ,0% ,0% ,0%
,0% ,0% ,0% ,0%
1 1 1 1
1,0% 1,0% 1,0% 1,0%
100,0% 100,0% 100,0% 100,0%
1,0% 1,0% 1,0% 1,0%
Count
% within kategori paritas
% within Diagnosis 1
% of Total
Count
% within kategori paritas
% within Diagnosis 1
% of Total
Count
% within kategori paritas
% within Diagnosis 1
% of Total
Count
% within kategori paritas
% within Diagnosis 1
% of Total
primipara (0-1)
multipara (2-4)
grande multipara (>4)
kategoriparitas
Total
CPDEklamsia
berat
Hamil lewatbulan (
Serotinus) Hipertensi

VINA EKA WULANDARI [ G2AOO9193 ]
Chi-Square Tests
29,596a 38 ,833
31,192 38 ,775
97
Pearson Chi-Square
Likelihood Ratio
N of Valid Cases
Value dfAsymp. Sig.
(2-sided)
55 cells (91,7%) have expected count less than 5. Theminimum expected count is ,04.
a.
Symmetric Measures
,484 ,833
97
Contingency CoefficientNominal by Nominal
N of Valid Cases
Value Approx. Sig.
Not assuming the null hypothesis.a.
Using the asymptotic standard error assuming the null hypothesis.b.
kategori paritas * Diagnosis 2
2 0 1 0
4,8% ,0% 2,4% ,0%
100,0% ,0% 33,3% ,0%
2,1% ,0% 1,0% ,0%
0 1 2 2
,0% 2,0% 3,9% 3,9%
,0% 50,0% 66,7% 100,0%
,0% 1,0% 2,1% 2,1%
0 1 0 0
,0% 25,0% ,0% ,0%
,0% 50,0% ,0% ,0%
,0% 1,0% ,0% ,0%
2 2 3 2
2,1% 2,1% 3,1% 2,1%
100,0% 100,0% 100,0% 100,0%
2,1% 2,1% 3,1% 2,1%
Count
% within kategori paritas
% within Diagnosis 2
% of Total
Count
% within kategori paritas
% within Diagnosis 2
% of Total
Count
% within kategori paritas
% within Diagnosis 2
% of Total
Count
% within kategori paritas
% within Diagnosis 2
% of Total
primipara (0-1)
multipara (2-4)
grande multipara (>4)
kategoriparitas
Total
AnemiaEklamsia
berat Fetal distress Gemelli
VINA EKA WULANDARI [ G2AOO9193 ]
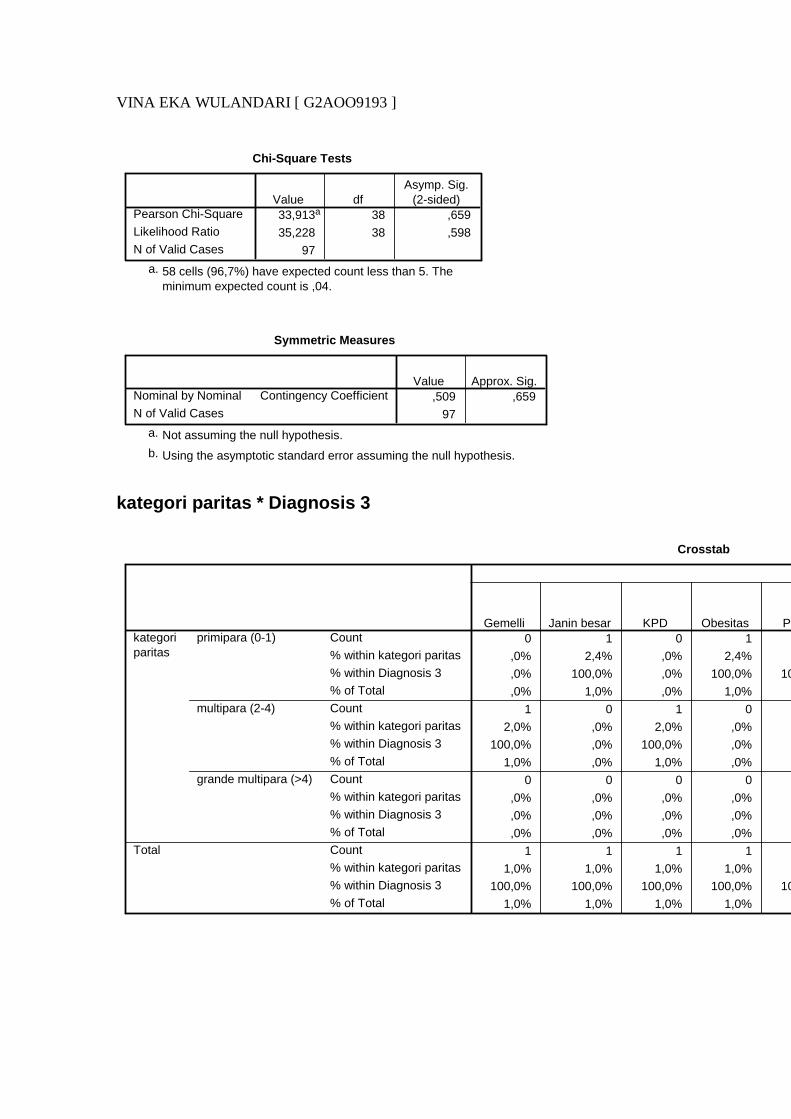
Chi-Square Tests
33,913a 38 ,659
35,228 38 ,598
97
Pearson Chi-Square
Likelihood Ratio
N of Valid Cases
Value dfAsymp. Sig.
(2-sided)
58 cells (96,7%) have expected count less than 5. Theminimum expected count is ,04.
a.
Symmetric Measures
,509 ,659
97
Contingency CoefficientNominal by Nominal
N of Valid Cases
Value Approx. Sig.
Not assuming the null hypothesis.a.
Using the asymptotic standard error assuming the null hypothesis.b.
kategori paritas * Diagnosis 3
Crosstab
0 1 0 1
,0% 2,4% ,0% 2,4%
,0% 100,0% ,0% 100,0% 100,0%
,0% 1,0% ,0% 1,0%
1 0 1 0
2,0% ,0% 2,0% ,0%
100,0% ,0% 100,0% ,0%
1,0% ,0% 1,0% ,0%
0 0 0 0
,0% ,0% ,0% ,0%
,0% ,0% ,0% ,0%
,0% ,0% ,0% ,0%
1 1 1 1
1,0% 1,0% 1,0% 1,0%
100,0% 100,0% 100,0% 100,0% 100,0%
1,0% 1,0% 1,0% 1,0%
Count
% within kategori paritas
% within Diagnosis 3
% of Total
Count
% within kategori paritas
% within Diagnosis 3
% of Total
Count
% within kategori paritas
% within Diagnosis 3
% of Total
Count
% within kategori paritas
% within Diagnosis 3
% of Total
primipara (0-1)
multipara (2-4)
grande multipara (>4)
kategoriparitas
Total
Gemelli Janin besar KPD Obesitas PEB

VINA EKA WULANDARI [ G2AOO9193 ]
Chi-Square Tests
32,217a 18 ,021
18,344 18 ,433
97
Pearson Chi-Square
Likelihood Ratio
N of Valid Cases
Value dfAsymp. Sig.
(2-sided)
28 cells (93,3%) have expected count less than 5. Theminimum expected count is ,04.
a.
Symmetric Measures
,499 ,021
97
Contingency CoefficientNominal by Nominal
N of Valid Cases
Value Approx. Sig.
Not assuming the null hypothesis.a.
Using the asymptotic standard error assuming the null hypothesis.b.
kategori paritas * Diagnosis 4
Crosstab
0 0 42 42
,0% ,0% 100,0% 100,0%
,0% ,0% 44,2% 43,3%
,0% ,0% 43,3% 43,3%
1 1 49 51
2,0% 2,0% 96,1% 100,0%
100,0% 100,0% 51,6% 52,6%
1,0% 1,0% 50,5% 52,6%
0 0 4 4
,0% ,0% 100,0% 100,0%
,0% ,0% 4,2% 4,1%
,0% ,0% 4,1% 4,1%
1 1 95 97
1,0% 1,0% 97,9% 100,0%
100,0% 100,0% 100,0% 100,0%
1,0% 1,0% 97,9% 100,0%
Count
% within kategori paritas
% within Diagnosis 4
% of Total
Count
% within kategori paritas
% within Diagnosis 4
% of Total
Count
% within kategori paritas
% within Diagnosis 4
% of Total
Count
% within kategori paritas
% within Diagnosis 4
% of Total
primipara (0-1)
multipara (2-4)
grande multipara (>4)
kategoriparitas
Total
Fetal distress Obesitas Tidak ada
Diagnosis 4
Total

VINA EKA WULANDARI [ G2AOO9193 ]
Chi-Square Tests
1,842a 4 ,765
2,609 4 ,625
97
Pearson Chi-Square
Likelihood Ratio
N of Valid Cases
Value dfAsymp. Sig.
(2-sided)
7 cells (77,8%) have expected count less than 5. Theminimum expected count is ,04.
a.
Symmetric Measures
,137 ,765
97
Contingency CoefficientNominal by Nominal
N of Valid Cases
Value Approx. Sig.
Not assuming the null hypothesis.a.
Using the asymptotic standard error assuming the null hypothesis.b.
Riwayat Partus * Diagnosis 1

VINA EKA WULANDARI [ G2AOO9193 ]
0 1 1 1
,0% 1,5% 1,5% 1,5%
,0% 100,0% 100,0% 100,0%
,0% 1,0% 1,0% 1,0%
1 0 0 0
3,7% ,0% ,0% ,0%
100,0% ,0% ,0% ,0%
1,0% ,0% ,0% ,0%
0 0 0 0
,0% ,0% ,0% ,0%
,0% ,0% ,0% ,0%
,0% ,0% ,0% ,0%
0 0 0 0
,0% ,0% ,0% ,0%
,0% ,0% ,0% ,0%
,0% ,0% ,0% ,0%
1 1 1 1
1,0% 1,0% 1,0% 1,0%
100,0% 100,0% 100,0% 100,0%
1,0% 1,0% 1,0% 1,0%
Count
% within Riwayat Partus
% within Diagnosis 1
% of Total
Count
% within Riwayat Partus
% within Diagnosis 1
% of Total
Count
% within Riwayat Partus
% within Diagnosis 1
% of Total
Count
% within Riwayat Partus
% within Diagnosis 1
% of Total
Count
% within Riwayat Partus
% within Diagnosis 1
% of Total
Riwayat obstetri baik
Riwayat obstetri buruk
Riwayat osbtetri baik
Riwayat osbtetri buruk
RiwayatPartus
Total
CPDEklamsia
berat
Hamil lewatbulan (
Serotinus) Hipertensi
Chi-Square Tests
39,749a 57 ,960
30,705 57 ,998
97
Pearson Chi-Square
Likelihood Ratio
N of Valid Cases
Value dfAsymp. Sig.
(2-sided)
75 cells (93,8%) have expected count less than 5. Theminimum expected count is ,02.
a.

VINA EKA WULANDARI [ G2AOO9193 ]
Symmetric Measures
,539 ,960
97
Contingency CoefficientNominal by Nominal
N of Valid Cases
Value Approx. Sig.
Not assuming the null hypothesis.a.
Using the asymptotic standard error assuming the null hypothesis.b.
Riwayat Partus * Diagnosis 2
1 0 2 1
1,5% ,0% 3,1% 1,5%
50,0% ,0% 66,7% 50,0%
1,0% ,0% 2,1% 1,0%
1 2 0 1
3,7% 7,4% ,0% 3,7%
50,0% 100,0% ,0% 50,0%
1,0% 2,1% ,0% 1,0%
0 0 0 0
,0% ,0% ,0% ,0%
,0% ,0% ,0% ,0%
,0% ,0% ,0% ,0%
0 0 1 0
,0% ,0% 33,3% ,0%
,0% ,0% 33,3% ,0%
,0% ,0% 1,0% ,0%
2 2 3 2
2,1% 2,1% 3,1% 2,1%
100,0% 100,0% 100,0% 100,0%
2,1% 2,1% 3,1% 2,1%
Count
% within Riwayat Partus
% within Diagnosis 2
% of Total
Count
% within Riwayat Partus
% within Diagnosis 2
% of Total
Count
% within Riwayat Partus
% within Diagnosis 2
% of Total
Count
% within Riwayat Partus
% within Diagnosis 2
% of Total
Count
% within Riwayat Partus
% within Diagnosis 2
% of Total
Riwayat obstetri baik
Riwayat obstetri buruk
Riwayat osbtetri baik
Riwayat osbtetri buruk
RiwayatPartus
Total
AnemiaEklamsia
berat Fetal distress Gemelli

VINA EKA WULANDARI [ G2AOO9193 ]
Chi-Square Tests
32,166a 57 ,997
31,040 57 ,998
97
Pearson Chi-Square
Likelihood Ratio
N of Valid Cases
Value dfAsymp. Sig.
(2-sided)
78 cells (97,5%) have expected count less than 5. Theminimum expected count is ,02.
a.
Symmetric Measures
,499 ,997
97
Contingency CoefficientNominal by Nominal
N of Valid Cases
Value Approx. Sig.
Not assuming the null hypothesis.a.
Using the asymptotic standard error assuming the null hypothesis.b.
Riwayat Partus * Diagnosis 3

VINA EKA WULANDARI [ G2AOO9193 ]
Crosstab
0 1 1 1
,0% 1,5% 1,5% 1,5%
,0% 100,0% 100,0% 100,0% 100,0%
,0% 1,0% 1,0% 1,0%
1 0 0 0
3,7% ,0% ,0% ,0%
100,0% ,0% ,0% ,0%
1,0% ,0% ,0% ,0%
0 0 0 0
,0% ,0% ,0% ,0%
,0% ,0% ,0% ,0%
,0% ,0% ,0% ,0%
0 0 0 0
,0% ,0% ,0% ,0%
,0% ,0% ,0% ,0%
,0% ,0% ,0% ,0%
1 1 1 1
1,0% 1,0% 1,0% 1,0%
100,0% 100,0% 100,0% 100,0% 100,0%
1,0% 1,0% 1,0% 1,0%
Count
% within Riwayat Partus
% within Diagnosis 3
% of Total
Count
% within Riwayat Partus
% within Diagnosis 3
% of Total
Count
% within Riwayat Partus
% within Diagnosis 3
% of Total
Count
% within Riwayat Partus
% within Diagnosis 3
% of Total
Count
% within Riwayat Partus
% within Diagnosis 3
% of Total
Riwayat obstetri baik
Riwayat obstetri buruk
Riwayat osbtetri baik
Riwayat osbtetri buruk
RiwayatPartus
Total
Gemelli Janin besar KPD Obesitas PEB
Chi-Square Tests
8,705a 27 1,000
10,792 27 ,998
97
Pearson Chi-Square
Likelihood Ratio
N of Valid Cases
Value dfAsymp. Sig.
(2-sided)
38 cells (95,0%) have expected count less than 5. Theminimum expected count is ,02.
a.
Symmetric Measures
,287 1,000
97
Contingency CoefficientNominal by Nominal
N of Valid Cases
Value Approx. Sig.
Not assuming the null hypothesis.a.
Using the asymptotic standard error assuming the null hypothesis.b.
VINA EKA WULANDARI [ G2AOO9193 ]
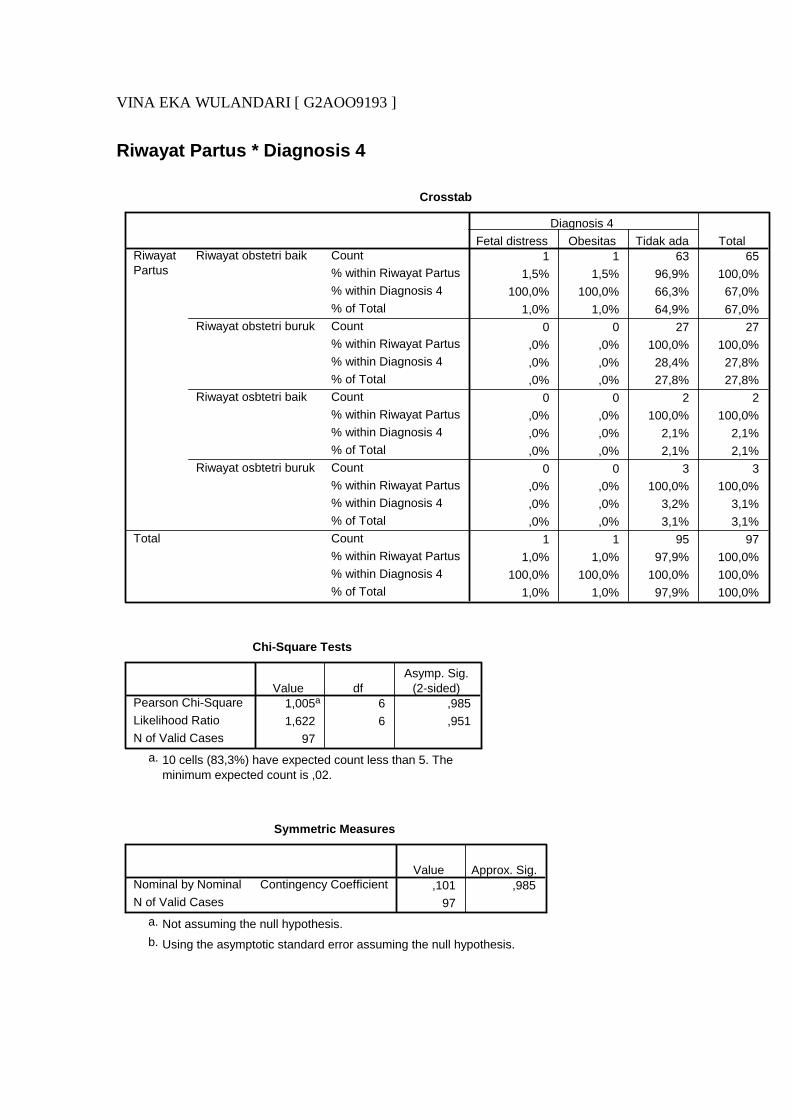
Riwayat Partus * Diagnosis 4
Crosstab
1 1 63 65
1,5% 1,5% 96,9% 100,0%
100,0% 100,0% 66,3% 67,0%
1,0% 1,0% 64,9% 67,0%
0 0 27 27
,0% ,0% 100,0% 100,0%
,0% ,0% 28,4% 27,8%
,0% ,0% 27,8% 27,8%
0 0 2 2
,0% ,0% 100,0% 100,0%
,0% ,0% 2,1% 2,1%
,0% ,0% 2,1% 2,1%
0 0 3 3
,0% ,0% 100,0% 100,0%
,0% ,0% 3,2% 3,1%
,0% ,0% 3,1% 3,1%
1 1 95 97
1,0% 1,0% 97,9% 100,0%
100,0% 100,0% 100,0% 100,0%
1,0% 1,0% 97,9% 100,0%
Count
% within Riwayat Partus
% within Diagnosis 4
% of Total
Count
% within Riwayat Partus
% within Diagnosis 4
% of Total
Count
% within Riwayat Partus
% within Diagnosis 4
% of Total
Count
% within Riwayat Partus
% within Diagnosis 4
% of Total
Count
% within Riwayat Partus
% within Diagnosis 4
% of Total
Riwayat obstetri baik
Riwayat obstetri buruk
Riwayat osbtetri baik
Riwayat osbtetri buruk
RiwayatPartus
Total
Fetal distress Obesitas Tidak ada
Diagnosis 4
Total
Chi-Square Tests
1,005a 6 ,985
1,622 6 ,951
97
Pearson Chi-Square
Likelihood Ratio
N of Valid Cases
Value dfAsymp. Sig.
(2-sided)
10 cells (83,3%) have expected count less than 5. Theminimum expected count is ,02.
a.
Symmetric Measures
,101 ,985
97
Contingency CoefficientNominal by Nominal
N of Valid Cases
Value Approx. Sig.
Not assuming the null hypothesis.a.
Using the asymptotic standard error assuming the null hypothesis.b.

VINA EKA WULANDARI [ G2AOO9193 ]
BB * Diagnosis 1
Crosstab
0 0 0 0 0 1 2 0 0 0 0 0 0 0 0 0 0 0 0 0 3
,0% ,0% ,0% ,0% ,0% 33,3% 66,7% ,0% ,0% ,0% ,0% ,0% ,0% ,0% ,0% ,0% ,0% ,0% ,0% ,0% 100,0%
,0% ,0% ,0% ,0% ,0% 5,0% 6,3% ,0% ,0% ,0% ,0% ,0% ,0% ,0% ,0% ,0% ,0% ,0% ,0% ,0% 3,1%
,0% ,0% ,0% ,0% ,0% 1,0% 2,1% ,0% ,0% ,0% ,0% ,0% ,0% ,0% ,0% ,0% ,0% ,0% ,0% ,0% 3,1%
0 0 0 0 0 1 0 0 0 0 0 0 0 0 0 0 0 0 0 1 2
,0% ,0% ,0% ,0% ,0% 50,0% ,0% ,0% ,0% ,0% ,0% ,0% ,0% ,0% ,0% ,0% ,0% ,0% ,0% 50,0% 100,0%
,0% ,0% ,0% ,0% ,0% 5,0% ,0% ,0% ,0% ,0% ,0% ,0% ,0% ,0% ,0% ,0% ,0% ,0% ,0% 25,0% 2,1%
,0% ,0% ,0% ,0% ,0% 1,0% ,0% ,0% ,0% ,0% ,0% ,0% ,0% ,0% ,0% ,0% ,0% ,0% ,0% 1,0% 2,1%
0 0 0 0 0 1 0 0 0 0 0 0 0 0 0 0 0 0 0 0 1
,0% ,0% ,0% ,0% ,0% 100,0% ,0% ,0% ,0% ,0% ,0% ,0% ,0% ,0% ,0% ,0% ,0% ,0% ,0% ,0% 100,0%
,0% ,0% ,0% ,0% ,0% 5,0% ,0% ,0% ,0% ,0% ,0% ,0% ,0% ,0% ,0% ,0% ,0% ,0% ,0% ,0% 1,0%
,0% ,0% ,0% ,0% ,0% 1,0% ,0% ,0% ,0% ,0% ,0% ,0% ,0% ,0% ,0% ,0% ,0% ,0% ,0% ,0% 1,0%
0 0 1 0 0 2 1 0 1 0 0 0 0 0 1 0 1 1 0 0 8
,0% ,0% 12,5% ,0% ,0% 25,0% 12,5% ,0% 12,5% ,0% ,0% ,0% ,0% ,0% 12,5% ,0% 12,5% 12,5% ,0% ,0% 100,0%
,0% ,0% 100,0% ,0% ,0% 10,0% 3,1% ,0% 10,0% ,0% ,0% ,0% ,0% ,0% 25,0% ,0% 20,0% 33,3% ,0% ,0% 8,2%
,0% ,0% 1,0% ,0% ,0% 2,1% 1,0% ,0% 1,0% ,0% ,0% ,0% ,0% ,0% 1,0% ,0% 1,0% 1,0% ,0% ,0% 8,2%
0 0 0 0 0 1 0 0 0 0 0 0 0 0 0 0 0 0 0 0 1
,0% ,0% ,0% ,0% ,0% 100,0% ,0% ,0% ,0% ,0% ,0% ,0% ,0% ,0% ,0% ,0% ,0% ,0% ,0% ,0% 100,0%
,0% ,0% ,0% ,0% ,0% 5,0% ,0% ,0% ,0% ,0% ,0% ,0% ,0% ,0% ,0% ,0% ,0% ,0% ,0% ,0% 1,0%
,0% ,0% ,0% ,0% ,0% 1,0% ,0% ,0% ,0% ,0% ,0% ,0% ,0% ,0% ,0% ,0% ,0% ,0% ,0% ,0% 1,0%
0 1 0 0 0 1 0 0 1 0 0 1 0 0 0 0 0 0 0 0 4
,0% 25,0% ,0% ,0% ,0% 25,0% ,0% ,0% 25,0% ,0% ,0% 25,0% ,0% ,0% ,0% ,0% ,0% ,0% ,0% ,0% 100,0%
,0% 100,0% ,0% ,0% ,0% 5,0% ,0% ,0% 10,0% ,0% ,0% 33,3% ,0% ,0% ,0% ,0% ,0% ,0% ,0% ,0% 4,1%
,0% 1,0% ,0% ,0% ,0% 1,0% ,0% ,0% 1,0% ,0% ,0% 1,0% ,0% ,0% ,0% ,0% ,0% ,0% ,0% ,0% 4,1%
0 0 0 0 0 1 2 0 1 0 0 0 0 1 0 0 0 0 0 0 5
,0% ,0% ,0% ,0% ,0% 20,0% 40,0% ,0% 20,0% ,0% ,0% ,0% ,0% 20,0% ,0% ,0% ,0% ,0% ,0% ,0% 100,0%
,0% ,0% ,0% ,0% ,0% 5,0% 6,3% ,0% 10,0% ,0% ,0% ,0% ,0% 100,0% ,0% ,0% ,0% ,0% ,0% ,0% 5,2%
,0% ,0% ,0% ,0% ,0% 1,0% 2,1% ,0% 1,0% ,0% ,0% ,0% ,0% 1,0% ,0% ,0% ,0% ,0% ,0% ,0% 5,2%
0 0 0 0 0 0 1 0 0 0 0 0 0 0 0 0 0 0 1 0 2
,0% ,0% ,0% ,0% ,0% ,0% 50,0% ,0% ,0% ,0% ,0% ,0% ,0% ,0% ,0% ,0% ,0% ,0% 50,0% ,0% 100,0%
,0% ,0% ,0% ,0% ,0% ,0% 3,1% ,0% ,0% ,0% ,0% ,0% ,0% ,0% ,0% ,0% ,0% ,0% 100,0% ,0% 2,1%
,0% ,0% ,0% ,0% ,0% ,0% 1,0% ,0% ,0% ,0% ,0% ,0% ,0% ,0% ,0% ,0% ,0% ,0% 1,0% ,0% 2,1%
0 0 0 0 0 2 4 0 1 2 0 1 0 0 1 0 0 1 0 1 13
,0% ,0% ,0% ,0% ,0% 15,4% 30,8% ,0% 7,7% 15,4% ,0% 7,7% ,0% ,0% 7,7% ,0% ,0% 7,7% ,0% 7,7% 100,0%
,0% ,0% ,0% ,0% ,0% 10,0% 12,5% ,0% 10,0% 66,7% ,0% 33,3% ,0% ,0% 25,0% ,0% ,0% 33,3% ,0% 25,0% 13,4%
,0% ,0% ,0% ,0% ,0% 2,1% 4,1% ,0% 1,0% 2,1% ,0% 1,0% ,0% ,0% 1,0% ,0% ,0% 1,0% ,0% 1,0% 13,4%
0 0 0 0 0 0 0 0 0 0 0 0 0 0 0 0 0 1 0 0 1
,0% ,0% ,0% ,0% ,0% ,0% ,0% ,0% ,0% ,0% ,0% ,0% ,0% ,0% ,0% ,0% ,0% 100,0% ,0% ,0% 100,0%
,0% ,0% ,0% ,0% ,0% ,0% ,0% ,0% ,0% ,0% ,0% ,0% ,0% ,0% ,0% ,0% ,0% 33,3% ,0% ,0% 1,0%
,0% ,0% ,0% ,0% ,0% ,0% ,0% ,0% ,0% ,0% ,0% ,0% ,0% ,0% ,0% ,0% ,0% 1,0% ,0% ,0% 1,0%
0 0 0 0 0 0 1 0 0 0 0 0 0 0 0 0 0 0 0 0 1
,0% ,0% ,0% ,0% ,0% ,0% 100,0% ,0% ,0% ,0% ,0% ,0% ,0% ,0% ,0% ,0% ,0% ,0% ,0% ,0% 100,0%
,0% ,0% ,0% ,0% ,0% ,0% 3,1% ,0% ,0% ,0% ,0% ,0% ,0% ,0% ,0% ,0% ,0% ,0% ,0% ,0% 1,0%
,0% ,0% ,0% ,0% ,0% ,0% 1,0% ,0% ,0% ,0% ,0% ,0% ,0% ,0% ,0% ,0% ,0% ,0% ,0% ,0% 1,0%
0 0 0 0 1 2 2 0 0 0 0 0 0 0 0 0 0 0 0 0 5
,0% ,0% ,0% ,0% 20,0% 40,0% 40,0% ,0% ,0% ,0% ,0% ,0% ,0% ,0% ,0% ,0% ,0% ,0% ,0% ,0% 100,0%
,0% ,0% ,0% ,0% 100,0% 10,0% 6,3% ,0% ,0% ,0% ,0% ,0% ,0% ,0% ,0% ,0% ,0% ,0% ,0% ,0% 5,2%
,0% ,0% ,0% ,0% 1,0% 2,1% 2,1% ,0% ,0% ,0% ,0% ,0% ,0% ,0% ,0% ,0% ,0% ,0% ,0% ,0% 5,2%
0 0 0 0 0 1 1 0 0 0 0 0 0 0 0 0 0 0 0 0 2
,0% ,0% ,0% ,0% ,0% 50,0% 50,0% ,0% ,0% ,0% ,0% ,0% ,0% ,0% ,0% ,0% ,0% ,0% ,0% ,0% 100,0%
,0% ,0% ,0% ,0% ,0% 5,0% 3,1% ,0% ,0% ,0% ,0% ,0% ,0% ,0% ,0% ,0% ,0% ,0% ,0% ,0% 2,1%
,0% ,0% ,0% ,0% ,0% 1,0% 1,0% ,0% ,0% ,0% ,0% ,0% ,0% ,0% ,0% ,0% ,0% ,0% ,0% ,0% 2,1%
1 0 0 1 0 1 3 0 1 1 0 1 1 0 0 0 1 0 0 1 12
8,3% ,0% ,0% 8,3% ,0% 8,3% 25,0% ,0% 8,3% 8,3% ,0% 8,3% 8,3% ,0% ,0% ,0% 8,3% ,0% ,0% 8,3% 100,0%
100,0% ,0% ,0% 100,0% ,0% 5,0% 9,4% ,0% 10,0% 33,3% ,0% 33,3% 100,0% ,0% ,0% ,0% 20,0% ,0% ,0% 25,0% 12,4%
1,0% ,0% ,0% 1,0% ,0% 1,0% 3,1% ,0% 1,0% 1,0% ,0% 1,0% 1,0% ,0% ,0% ,0% 1,0% ,0% ,0% 1,0% 12,4%
0 0 0 0 0 0 0 1 1 0 0 0 0 0 1 0 0 0 0 0 3
,0% ,0% ,0% ,0% ,0% ,0% ,0% 33,3% 33,3% ,0% ,0% ,0% ,0% ,0% 33,3% ,0% ,0% ,0% ,0% ,0% 100,0%
,0% ,0% ,0% ,0% ,0% ,0% ,0% 100,0% 10,0% ,0% ,0% ,0% ,0% ,0% 25,0% ,0% ,0% ,0% ,0% ,0% 3,1%
,0% ,0% ,0% ,0% ,0% ,0% ,0% 1,0% 1,0% ,0% ,0% ,0% ,0% ,0% 1,0% ,0% ,0% ,0% ,0% ,0% 3,1%
0 0 0 0 0 0 3 0 0 0 0 0 0 0 0 0 1 0 0 0 4
,0% ,0% ,0% ,0% ,0% ,0% 75,0% ,0% ,0% ,0% ,0% ,0% ,0% ,0% ,0% ,0% 25,0% ,0% ,0% ,0% 100,0%
,0% ,0% ,0% ,0% ,0% ,0% 9,4% ,0% ,0% ,0% ,0% ,0% ,0% ,0% ,0% ,0% 20,0% ,0% ,0% ,0% 4,1%
,0% ,0% ,0% ,0% ,0% ,0% 3,1% ,0% ,0% ,0% ,0% ,0% ,0% ,0% ,0% ,0% 1,0% ,0% ,0% ,0% 4,1%
0 0 0 0 0 1 5 0 0 0 0 0 0 0 0 1 0 0 0 0 7
,0% ,0% ,0% ,0% ,0% 14,3% 71,4% ,0% ,0% ,0% ,0% ,0% ,0% ,0% ,0% 14,3% ,0% ,0% ,0% ,0% 100,0%
,0% ,0% ,0% ,0% ,0% 5,0% 15,6% ,0% ,0% ,0% ,0% ,0% ,0% ,0% ,0% 33,3% ,0% ,0% ,0% ,0% 7,2%
,0% ,0% ,0% ,0% ,0% 1,0% 5,2% ,0% ,0% ,0% ,0% ,0% ,0% ,0% ,0% 1,0% ,0% ,0% ,0% ,0% 7,2%
0 0 0 0 0 0 3 0 1 0 0 0 0 0 0 1 1 0 0 0 6
,0% ,0% ,0% ,0% ,0% ,0% 50,0% ,0% 16,7% ,0% ,0% ,0% ,0% ,0% ,0% 16,7% 16,7% ,0% ,0% ,0% 100,0%
,0% ,0% ,0% ,0% ,0% ,0% 9,4% ,0% 10,0% ,0% ,0% ,0% ,0% ,0% ,0% 33,3% 20,0% ,0% ,0% ,0% 6,2%
,0% ,0% ,0% ,0% ,0% ,0% 3,1% ,0% 1,0% ,0% ,0% ,0% ,0% ,0% ,0% 1,0% 1,0% ,0% ,0% ,0% 6,2%
0 0 0 0 0 0 1 0 0 0 0 0 0 0 0 0 0 0 0 0 1
,0% ,0% ,0% ,0% ,0% ,0% 100,0% ,0% ,0% ,0% ,0% ,0% ,0% ,0% ,0% ,0% ,0% ,0% ,0% ,0% 100,0%
,0% ,0% ,0% ,0% ,0% ,0% 3,1% ,0% ,0% ,0% ,0% ,0% ,0% ,0% ,0% ,0% ,0% ,0% ,0% ,0% 1,0%
,0% ,0% ,0% ,0% ,0% ,0% 1,0% ,0% ,0% ,0% ,0% ,0% ,0% ,0% ,0% ,0% ,0% ,0% ,0% ,0% 1,0%
0 0 0 0 0 3 1 0 0 0 0 0 0 0 0 0 1 0 0 1 6
,0% ,0% ,0% ,0% ,0% 50,0% 16,7% ,0% ,0% ,0% ,0% ,0% ,0% ,0% ,0% ,0% 16,7% ,0% ,0% 16,7% 100,0%
,0% ,0% ,0% ,0% ,0% 15,0% 3,1% ,0% ,0% ,0% ,0% ,0% ,0% ,0% ,0% ,0% 20,0% ,0% ,0% 25,0% 6,2%
,0% ,0% ,0% ,0% ,0% 3,1% 1,0% ,0% ,0% ,0% ,0% ,0% ,0% ,0% ,0% ,0% 1,0% ,0% ,0% 1,0% 6,2%
0 0 0 0 0 0 0 0 1 0 0 0 0 0 0 1 0 0 0 0 2
,0% ,0% ,0% ,0% ,0% ,0% ,0% ,0% 50,0% ,0% ,0% ,0% ,0% ,0% ,0% 50,0% ,0% ,0% ,0% ,0% 100,0%
,0% ,0% ,0% ,0% ,0% ,0% ,0% ,0% 10,0% ,0% ,0% ,0% ,0% ,0% ,0% 33,3% ,0% ,0% ,0% ,0% 2,1%
,0% ,0% ,0% ,0% ,0% ,0% ,0% ,0% 1,0% ,0% ,0% ,0% ,0% ,0% ,0% 1,0% ,0% ,0% ,0% ,0% 2,1%
0 0 0 0 0 0 0 0 1 0 0 0 0 0 0 0 0 0 0 0 1
,0% ,0% ,0% ,0% ,0% ,0% ,0% ,0% 100,0% ,0% ,0% ,0% ,0% ,0% ,0% ,0% ,0% ,0% ,0% ,0% 100,0%
,0% ,0% ,0% ,0% ,0% ,0% ,0% ,0% 10,0% ,0% ,0% ,0% ,0% ,0% ,0% ,0% ,0% ,0% ,0% ,0% 1,0%
,0% ,0% ,0% ,0% ,0% ,0% ,0% ,0% 1,0% ,0% ,0% ,0% ,0% ,0% ,0% ,0% ,0% ,0% ,0% ,0% 1,0%
0 0 0 0 0 0 1 0 0 0 0 0 0 0 1 0 0 0 0 0 2
,0% ,0% ,0% ,0% ,0% ,0% 50,0% ,0% ,0% ,0% ,0% ,0% ,0% ,0% 50,0% ,0% ,0% ,0% ,0% ,0% 100,0%
,0% ,0% ,0% ,0% ,0% ,0% 3,1% ,0% ,0% ,0% ,0% ,0% ,0% ,0% 25,0% ,0% ,0% ,0% ,0% ,0% 2,1%
,0% ,0% ,0% ,0% ,0% ,0% 1,0% ,0% ,0% ,0% ,0% ,0% ,0% ,0% 1,0% ,0% ,0% ,0% ,0% ,0% 2,1%
0 0 0 0 0 1 0 0 0 0 0 0 0 0 0 0 0 0 0 0 1
,0% ,0% ,0% ,0% ,0% 100,0% ,0% ,0% ,0% ,0% ,0% ,0% ,0% ,0% ,0% ,0% ,0% ,0% ,0% ,0% 100,0%
,0% ,0% ,0% ,0% ,0% 5,0% ,0% ,0% ,0% ,0% ,0% ,0% ,0% ,0% ,0% ,0% ,0% ,0% ,0% ,0% 1,0%
,0% ,0% ,0% ,0% ,0% 1,0% ,0% ,0% ,0% ,0% ,0% ,0% ,0% ,0% ,0% ,0% ,0% ,0% ,0% ,0% 1,0%
0 0 0 0 0 1 0 0 1 0 0 0 0 0 0 0 0 0 0 0 2
,0% ,0% ,0% ,0% ,0% 50,0% ,0% ,0% 50,0% ,0% ,0% ,0% ,0% ,0% ,0% ,0% ,0% ,0% ,0% ,0% 100,0%
,0% ,0% ,0% ,0% ,0% 5,0% ,0% ,0% 10,0% ,0% ,0% ,0% ,0% ,0% ,0% ,0% ,0% ,0% ,0% ,0% 2,1%
,0% ,0% ,0% ,0% ,0% 1,0% ,0% ,0% 1,0% ,0% ,0% ,0% ,0% ,0% ,0% ,0% ,0% ,0% ,0% ,0% 2,1%
0 0 0 0 0 0 0 0 0 0 1 0 0 0 0 0 0 0 0 0 1
,0% ,0% ,0% ,0% ,0% ,0% ,0% ,0% ,0% ,0% 100,0% ,0% ,0% ,0% ,0% ,0% ,0% ,0% ,0% ,0% 100,0%
,0% ,0% ,0% ,0% ,0% ,0% ,0% ,0% ,0% ,0% 100,0% ,0% ,0% ,0% ,0% ,0% ,0% ,0% ,0% ,0% 1,0%
Count
% within BB
% within Diagnosis 1
% of Total
Count
% within BB
% within Diagnosis 1
% of Total
Count
% within BB
% within Diagnosis 1
% of Total
Count
% within BB
% within Diagnosis 1
% of Total
Count
% within BB
% within Diagnosis 1
% of Total
Count
% within BB
% within Diagnosis 1
% of Total
Count
% within BB
% within Diagnosis 1
% of Total
Count
% within BB
% within Diagnosis 1
% of Total
Count
% within BB
% within Diagnosis 1
% of Total
Count
% within BB
% within Diagnosis 1
% of Total
Count
% within BB
% within Diagnosis 1
% of Total
Count
% within BB
% within Diagnosis 1
% of Total
Count
% within BB
% within Diagnosis 1
% of Total
Count
% within BB
% within Diagnosis 1
% of Total
Count
% within BB
% within Diagnosis 1
% of Total
Count
% within BB
% within Diagnosis 1
% of Total
Count
% within BB
% within Diagnosis 1
% of Total
Count
% within BB
% within Diagnosis 1
% of Total
Count
% within BB
% within Diagnosis 1
% of Total
Count
% within BB
% within Diagnosis 1
% of Total
Count
% within BB
% within Diagnosis 1
% of Total
Count
% within BB
% within Diagnosis 1
% of Total
Count
% within BB
% within Diagnosis 1
% of Total
Count
% within BB
% within Diagnosis 1
% of Total
Count
% within BB
% within Diagnosis 1
% of Total
Count
% within BB
% within Diagnosis 1
40
43
44
45
46
47
48
49
50
51
52
53
54
55
56
57
58
60
61
63
65
67
68
69
80
81
BB
CPD
Eklamsia
berat
Hamil lewatbulan (
Serotinus) Hipertensi
Infeksi karena
keluar lendirputih bau dari
vagina KPD Partus macet
Partussungsang
spontaneus PEB PER
Perdarahan
antepartum
Perdarahan
antepartum
akibatplasenta
previa totalis
Perdarahan
postpartum PPI
Preeklamsia
berat
Presentasijanin letak
lintang
Presentasijanin letak
sungsang Serotinus
Tali pusat
melilit Tidak ada
Diagnosis 1
Total
Chi-Square Tests
456,509a 494 ,886
194,093 494 1,000
97
Pearson Chi-Square
Likelihood Ratio
N of Valid Cases
Value dfAsymp. Sig.
(2-sided)
540 cells (100,0%) have expected count less than 5.The minimum expected count is ,01.
a.
Symmetric Measures
,908 ,886
97
Contingency CoefficientNominal by Nominal
N of Valid Cases
Value Approx. Sig.
Not assuming the null hypothesis.a.
Using the asymptotic standard error assuming the null hypothesis.b.
BB * Diagnosis 2
Crosstab
0 0 0 0 0 0 0 0 0 0 0 0 0 0 0 0 1 0 0 2 3
,0% ,0% ,0% ,0% ,0% ,0% ,0% ,0% ,0% ,0% ,0% ,0% ,0% ,0% ,0% ,0% 33,3% ,0% ,0% 66,7% 100,0%
,0% ,0% ,0% ,0% ,0% ,0% ,0% ,0% ,0% ,0% ,0% ,0% ,0% ,0% ,0% ,0% 33,3% ,0% ,0% 3,4% 3,1%
,0% ,0% ,0% ,0% ,0% ,0% ,0% ,0% ,0% ,0% ,0% ,0% ,0% ,0% ,0% ,0% 1,0% ,0% ,0% 2,1% 3,1%
1 0 0 0 0 0 0 0 0 0 1 0 0 0 0 0 0 0 0 0 2
50,0% ,0% ,0% ,0% ,0% ,0% ,0% ,0% ,0% ,0% 50,0% ,0% ,0% ,0% ,0% ,0% ,0% ,0% ,0% ,0% 100,0%
50,0% ,0% ,0% ,0% ,0% ,0% ,0% ,0% ,0% ,0% 16,7% ,0% ,0% ,0% ,0% ,0% ,0% ,0% ,0% ,0% 2,1%
1,0% ,0% ,0% ,0% ,0% ,0% ,0% ,0% ,0% ,0% 1,0% ,0% ,0% ,0% ,0% ,0% ,0% ,0% ,0% ,0% 2,1%
0 0 0 0 0 0 0 0 0 0 1 0 0 0 0 0 0 0 0 0 1
,0% ,0% ,0% ,0% ,0% ,0% ,0% ,0% ,0% ,0% 100,0% ,0% ,0% ,0% ,0% ,0% ,0% ,0% ,0% ,0% 100,0%
,0% ,0% ,0% ,0% ,0% ,0% ,0% ,0% ,0% ,0% 16,7% ,0% ,0% ,0% ,0% ,0% ,0% ,0% ,0% ,0% 1,0%
,0% ,0% ,0% ,0% ,0% ,0% ,0% ,0% ,0% ,0% 1,0% ,0% ,0% ,0% ,0% ,0% ,0% ,0% ,0% ,0% 1,0%
0 0 0 0 0 0 0 0 0 1 1 0 0 0 0 0 1 0 0 5 8
,0% ,0% ,0% ,0% ,0% ,0% ,0% ,0% ,0% 12,5% 12,5% ,0% ,0% ,0% ,0% ,0% 12,5% ,0% ,0% 62,5% 100,0%
,0% ,0% ,0% ,0% ,0% ,0% ,0% ,0% ,0% 20,0% 16,7% ,0% ,0% ,0% ,0% ,0% 33,3% ,0% ,0% 8,5% 8,2%
,0% ,0% ,0% ,0% ,0% ,0% ,0% ,0% ,0% 1,0% 1,0% ,0% ,0% ,0% ,0% ,0% 1,0% ,0% ,0% 5,2% 8,2%
0 0 0 0 0 0 0 0 0 0 0 0 0 0 0 0 0 0 0 1 1
,0% ,0% ,0% ,0% ,0% ,0% ,0% ,0% ,0% ,0% ,0% ,0% ,0% ,0% ,0% ,0% ,0% ,0% ,0% 100,0% 100,0%
,0% ,0% ,0% ,0% ,0% ,0% ,0% ,0% ,0% ,0% ,0% ,0% ,0% ,0% ,0% ,0% ,0% ,0% ,0% 1,7% 1,0%
,0% ,0% ,0% ,0% ,0% ,0% ,0% ,0% ,0% ,0% ,0% ,0% ,0% ,0% ,0% ,0% ,0% ,0% ,0% 1,0% 1,0%
0 0 2 0 0 0 0 0 0 0 0 0 0 1 0 0 0 0 0 1 4
,0% ,0% 50,0% ,0% ,0% ,0% ,0% ,0% ,0% ,0% ,0% ,0% ,0% 25,0% ,0% ,0% ,0% ,0% ,0% 25,0% 100,0%
,0% ,0% 66,7% ,0% ,0% ,0% ,0% ,0% ,0% ,0% ,0% ,0% ,0% 100,0% ,0% ,0% ,0% ,0% ,0% 1,7% 4,1%
,0% ,0% 2,1% ,0% ,0% ,0% ,0% ,0% ,0% ,0% ,0% ,0% ,0% 1,0% ,0% ,0% ,0% ,0% ,0% 1,0% 4,1%
0 0 0 0 0 0 0 0 0 0 1 0 0 0 0 0 0 0 1 3 5
,0% ,0% ,0% ,0% ,0% ,0% ,0% ,0% ,0% ,0% 20,0% ,0% ,0% ,0% ,0% ,0% ,0% ,0% 20,0% 60,0% 100,0%
,0% ,0% ,0% ,0% ,0% ,0% ,0% ,0% ,0% ,0% 16,7% ,0% ,0% ,0% ,0% ,0% ,0% ,0% 50,0% 5,1% 5,2%
,0% ,0% ,0% ,0% ,0% ,0% ,0% ,0% ,0% ,0% 1,0% ,0% ,0% ,0% ,0% ,0% ,0% ,0% 1,0% 3,1% 5,2%
0 0 0 0 0 0 0 0 0 0 0 0 0 0 0 0 0 0 0 2 2
,0% ,0% ,0% ,0% ,0% ,0% ,0% ,0% ,0% ,0% ,0% ,0% ,0% ,0% ,0% ,0% ,0% ,0% ,0% 100,0% 100,0%
,0% ,0% ,0% ,0% ,0% ,0% ,0% ,0% ,0% ,0% ,0% ,0% ,0% ,0% ,0% ,0% ,0% ,0% ,0% 3,4% 2,1%
,0% ,0% ,0% ,0% ,0% ,0% ,0% ,0% ,0% ,0% ,0% ,0% ,0% ,0% ,0% ,0% ,0% ,0% ,0% 2,1% 2,1%
0 0 0 0 1 0 0 1 0 2 0 0 0 0 1 0 0 0 0 8 13
,0% ,0% ,0% ,0% 7,7% ,0% ,0% 7,7% ,0% 15,4% ,0% ,0% ,0% ,0% 7,7% ,0% ,0% ,0% ,0% 61,5% 100,0%
,0% ,0% ,0% ,0% 100,0% ,0% ,0% 50,0% ,0% 40,0% ,0% ,0% ,0% ,0% 100,0% ,0% ,0% ,0% ,0% 13,6% 13,4%
,0% ,0% ,0% ,0% 1,0% ,0% ,0% 1,0% ,0% 2,1% ,0% ,0% ,0% ,0% 1,0% ,0% ,0% ,0% ,0% 8,2% 13,4%
0 0 0 0 0 0 0 0 0 0 0 0 0 0 0 0 0 0 0 1 1
,0% ,0% ,0% ,0% ,0% ,0% ,0% ,0% ,0% ,0% ,0% ,0% ,0% ,0% ,0% ,0% ,0% ,0% ,0% 100,0% 100,0%
,0% ,0% ,0% ,0% ,0% ,0% ,0% ,0% ,0% ,0% ,0% ,0% ,0% ,0% ,0% ,0% ,0% ,0% ,0% 1,7% 1,0%
,0% ,0% ,0% ,0% ,0% ,0% ,0% ,0% ,0% ,0% ,0% ,0% ,0% ,0% ,0% ,0% ,0% ,0% ,0% 1,0% 1,0%
0 0 0 0 0 0 0 0 1 1 0 0 0 0 0 0 1 0 0 2 5
,0% ,0% ,0% ,0% ,0% ,0% ,0% ,0% 20,0% 20,0% ,0% ,0% ,0% ,0% ,0% ,0% 20,0% ,0% ,0% 40,0% 100,0%
,0% ,0% ,0% ,0% ,0% ,0% ,0% ,0% 100,0% 20,0% ,0% ,0% ,0% ,0% ,0% ,0% 33,3% ,0% ,0% 3,4% 5,2%
,0% ,0% ,0% ,0% ,0% ,0% ,0% ,0% 1,0% 1,0% ,0% ,0% ,0% ,0% ,0% ,0% 1,0% ,0% ,0% 2,1% 5,2%
0 0 0 0 0 0 0 0 0 0 0 0 1 0 0 0 0 0 0 1 2
,0% ,0% ,0% ,0% ,0% ,0% ,0% ,0% ,0% ,0% ,0% ,0% 50,0% ,0% ,0% ,0% ,0% ,0% ,0% 50,0% 100,0%
,0% ,0% ,0% ,0% ,0% ,0% ,0% ,0% ,0% ,0% ,0% ,0% 50,0% ,0% ,0% ,0% ,0% ,0% ,0% 1,7% 2,1%
,0% ,0% ,0% ,0% ,0% ,0% ,0% ,0% ,0% ,0% ,0% ,0% 1,0% ,0% ,0% ,0% ,0% ,0% ,0% 1,0% 2,1%
1 0 0 0 0 0 1 0 0 1 0 1 0 0 0 0 0 0 0 8 12
8,3% ,0% ,0% ,0% ,0% ,0% 8,3% ,0% ,0% 8,3% ,0% 8,3% ,0% ,0% ,0% ,0% ,0% ,0% ,0% 66,7% 100,0%
50,0% ,0% ,0% ,0% ,0% ,0% 100,0% ,0% ,0% 20,0% ,0% 100,0% ,0% ,0% ,0% ,0% ,0% ,0% ,0% 13,6% 12,4%
1,0% ,0% ,0% ,0% ,0% ,0% 1,0% ,0% ,0% 1,0% ,0% 1,0% ,0% ,0% ,0% ,0% ,0% ,0% ,0% 8,2% 12,4%
0 1 0 0 0 0 0 0 0 0 0 0 0 0 0 0 0 0 0 2 3
,0% 33,3% ,0% ,0% ,0% ,0% ,0% ,0% ,0% ,0% ,0% ,0% ,0% ,0% ,0% ,0% ,0% ,0% ,0% 66,7% 100,0%
,0% 50,0% ,0% ,0% ,0% ,0% ,0% ,0% ,0% ,0% ,0% ,0% ,0% ,0% ,0% ,0% ,0% ,0% ,0% 3,4% 3,1%
,0% 1,0% ,0% ,0% ,0% ,0% ,0% ,0% ,0% ,0% ,0% ,0% ,0% ,0% ,0% ,0% ,0% ,0% ,0% 2,1% 3,1%
0 0 0 0 0 0 0 0 0 0 0 0 0 0 0 0 0 0 1 3 4
,0% ,0% ,0% ,0% ,0% ,0% ,0% ,0% ,0% ,0% ,0% ,0% ,0% ,0% ,0% ,0% ,0% ,0% 25,0% 75,0% 100,0%
,0% ,0% ,0% ,0% ,0% ,0% ,0% ,0% ,0% ,0% ,0% ,0% ,0% ,0% ,0% ,0% ,0% ,0% 50,0% 5,1% 4,1%
,0% ,0% ,0% ,0% ,0% ,0% ,0% ,0% ,0% ,0% ,0% ,0% ,0% ,0% ,0% ,0% ,0% ,0% 1,0% 3,1% 4,1%
0 0 1 0 0 0 0 0 0 0 0 0 0 0 0 0 0 0 0 6 7
,0% ,0% 14,3% ,0% ,0% ,0% ,0% ,0% ,0% ,0% ,0% ,0% ,0% ,0% ,0% ,0% ,0% ,0% ,0% 85,7% 100,0%
,0% ,0% 33,3% ,0% ,0% ,0% ,0% ,0% ,0% ,0% ,0% ,0% ,0% ,0% ,0% ,0% ,0% ,0% ,0% 10,2% 7,2%
,0% ,0% 1,0% ,0% ,0% ,0% ,0% ,0% ,0% ,0% ,0% ,0% ,0% ,0% ,0% ,0% ,0% ,0% ,0% 6,2% 7,2%
0 0 0 0 0 0 0 0 0 0 0 0 0 0 0 0 0 0 0 6 6
,0% ,0% ,0% ,0% ,0% ,0% ,0% ,0% ,0% ,0% ,0% ,0% ,0% ,0% ,0% ,0% ,0% ,0% ,0% 100,0% 100,0%
,0% ,0% ,0% ,0% ,0% ,0% ,0% ,0% ,0% ,0% ,0% ,0% ,0% ,0% ,0% ,0% ,0% ,0% ,0% 10,2% 6,2%
,0% ,0% ,0% ,0% ,0% ,0% ,0% ,0% ,0% ,0% ,0% ,0% ,0% ,0% ,0% ,0% ,0% ,0% ,0% 6,2% 6,2%
0 0 0 0 0 0 0 0 0 0 0 0 0 0 0 0 0 0 0 1 1
,0% ,0% ,0% ,0% ,0% ,0% ,0% ,0% ,0% ,0% ,0% ,0% ,0% ,0% ,0% ,0% ,0% ,0% ,0% 100,0% 100,0%
,0% ,0% ,0% ,0% ,0% ,0% ,0% ,0% ,0% ,0% ,0% ,0% ,0% ,0% ,0% ,0% ,0% ,0% ,0% 1,7% 1,0%
,0% ,0% ,0% ,0% ,0% ,0% ,0% ,0% ,0% ,0% ,0% ,0% ,0% ,0% ,0% ,0% ,0% ,0% ,0% 1,0% 1,0%
0 1 0 0 0 0 0 0 0 0 0 0 0 0 0 1 0 1 0 3 6
,0% 16,7% ,0% ,0% ,0% ,0% ,0% ,0% ,0% ,0% ,0% ,0% ,0% ,0% ,0% 16,7% ,0% 16,7% ,0% 50,0% 100,0%
,0% 50,0% ,0% ,0% ,0% ,0% ,0% ,0% ,0% ,0% ,0% ,0% ,0% ,0% ,0% 100,0% ,0% 100,0% ,0% 5,1% 6,2%
,0% 1,0% ,0% ,0% ,0% ,0% ,0% ,0% ,0% ,0% ,0% ,0% ,0% ,0% ,0% 1,0% ,0% 1,0% ,0% 3,1% 6,2%
0 0 0 1 0 0 0 0 0 0 0 0 1 0 0 0 0 0 0 0 2
,0% ,0% ,0% 50,0% ,0% ,0% ,0% ,0% ,0% ,0% ,0% ,0% 50,0% ,0% ,0% ,0% ,0% ,0% ,0% ,0% 100,0%
,0% ,0% ,0% 50,0% ,0% ,0% ,0% ,0% ,0% ,0% ,0% ,0% 50,0% ,0% ,0% ,0% ,0% ,0% ,0% ,0% 2,1%
,0% ,0% ,0% 1,0% ,0% ,0% ,0% ,0% ,0% ,0% ,0% ,0% 1,0% ,0% ,0% ,0% ,0% ,0% ,0% ,0% 2,1%
0 0 0 1 0 0 0 0 0 0 0 0 0 0 0 0 0 0 0 0 1
,0% ,0% ,0% 100,0% ,0% ,0% ,0% ,0% ,0% ,0% ,0% ,0% ,0% ,0% ,0% ,0% ,0% ,0% ,0% ,0% 100,0%
,0% ,0% ,0% 50,0% ,0% ,0% ,0% ,0% ,0% ,0% ,0% ,0% ,0% ,0% ,0% ,0% ,0% ,0% ,0% ,0% 1,0%
,0% ,0% ,0% 1,0% ,0% ,0% ,0% ,0% ,0% ,0% ,0% ,0% ,0% ,0% ,0% ,0% ,0% ,0% ,0% ,0% 1,0%
0 0 0 0 0 1 0 0 0 0 0 0 0 0 0 0 0 0 0 1 2
,0% ,0% ,0% ,0% ,0% 50,0% ,0% ,0% ,0% ,0% ,0% ,0% ,0% ,0% ,0% ,0% ,0% ,0% ,0% 50,0% 100,0%
,0% ,0% ,0% ,0% ,0% 100,0% ,0% ,0% ,0% ,0% ,0% ,0% ,0% ,0% ,0% ,0% ,0% ,0% ,0% 1,7% 2,1%
,0% ,0% ,0% ,0% ,0% 1,0% ,0% ,0% ,0% ,0% ,0% ,0% ,0% ,0% ,0% ,0% ,0% ,0% ,0% 1,0% 2,1%
0 0 0 0 0 0 0 0 0 0 1 0 0 0 0 0 0 0 0 0 1
,0% ,0% ,0% ,0% ,0% ,0% ,0% ,0% ,0% ,0% 100,0% ,0% ,0% ,0% ,0% ,0% ,0% ,0% ,0% ,0% 100,0%
,0% ,0% ,0% ,0% ,0% ,0% ,0% ,0% ,0% ,0% 16,7% ,0% ,0% ,0% ,0% ,0% ,0% ,0% ,0% ,0% 1,0%
,0% ,0% ,0% ,0% ,0% ,0% ,0% ,0% ,0% ,0% 1,0% ,0% ,0% ,0% ,0% ,0% ,0% ,0% ,0% ,0% 1,0%
0 0 0 0 0 0 0 1 0 0 1 0 0 0 0 0 0 0 0 0 2
,0% ,0% ,0% ,0% ,0% ,0% ,0% 50,0% ,0% ,0% 50,0% ,0% ,0% ,0% ,0% ,0% ,0% ,0% ,0% ,0% 100,0%
,0% ,0% ,0% ,0% ,0% ,0% ,0% 50,0% ,0% ,0% 16,7% ,0% ,0% ,0% ,0% ,0% ,0% ,0% ,0% ,0% 2,1%
,0% ,0% ,0% ,0% ,0% ,0% ,0% 1,0% ,0% ,0% 1,0% ,0% ,0% ,0% ,0% ,0% ,0% ,0% ,0% ,0% 2,1%
0 0 0 0 0 0 0 0 0 0 0 0 0 0 0 0 0 0 0 1 1
,0% ,0% ,0% ,0% ,0% ,0% ,0% ,0% ,0% ,0% ,0% ,0% ,0% ,0% ,0% ,0% ,0% ,0% ,0% 100,0% 100,0%
,0% ,0% ,0% ,0% ,0% ,0% ,0% ,0% ,0% ,0% ,0% ,0% ,0% ,0% ,0% ,0% ,0% ,0% ,0% 1,7% 1,0%
,0% ,0% ,0% ,0% ,0% ,0% ,0% ,0% ,0% ,0% ,0% ,0% ,0% ,0% ,0% ,0% ,0% ,0% ,0% 1,0% 1,0%
Count
% within BB
% within Diagnosis 2
% of T otal
Count
% within BB
% within Diagnosis 2
% of T otal
Count
% within BB
% within Diagnosis 2
% of T otal
Count
% within BB
% within Diagnosis 2
% of T otal
Count
% within BB
% within Diagnosis 2
% of T otal
Count
% within BB
% within Diagnosis 2
% of T otal
Count
% within BB
% within Diagnosis 2
% of T otal
Count
% within BB
% within Diagnosis 2
% of T otal
Count
% within BB
% within Diagnosis 2
% of T otal
Count
% within BB
% within Diagnosis 2
% of T otal
Count
% within BB
% within Diagnosis 2
% of T otal
Count
% within BB
% within Diagnosis 2
% of T otal
Count
% within BB
% within Diagnosis 2
% of T otal
Count
% within BB
% within Diagnosis 2
% of T otal
Count
% within BB
% within Diagnosis 2
% of T otal
Count
% within BB
% within Diagnosis 2
% of T otal
Count
% within BB
% within Diagnosis 2
% of T otal
Count
% within BB
% within Diagnosis 2
% of T otal
Count
% within BB
% within Diagnosis 2
% of T otal
Count
% within BB
% within Diagnosis 2
% of T otal
Count
% within BB
% within Diagnosis 2
% of T otal
Count
% within BB
% within Diagnosis 2
% of T otal
Count
% within BB
% within Diagnosis 2
% of T otal
Count
% within BB
% within Diagnosis 2
% of T otal
Count
% within BB
% within Diagnosis 2
% of T otal
Count
% within BB
% within Diagnosis 2
% of T otal
40
43
44
45
46
47
48
49
50
51
52
53
54
55
56
57
58
60
61
63
65
67
68
69
80
81
BBAnemia
Eklamsiaberat Fetal dis tress Gemell i Hidramion
Hipertensigestas ional Induksi gagal KPD
Panggulsempit Partus macet
Partus
prematureimminens PEB PER PPI
Presentas ijanin bokong
Presentas i
janin letaklintang
Presentas i
janin letaksungsang
Presentas isungsang Serotinus T idak ada
Diagnosis 2
T otal
VINA EKA WULANDARI [ G2AOO9193 ]
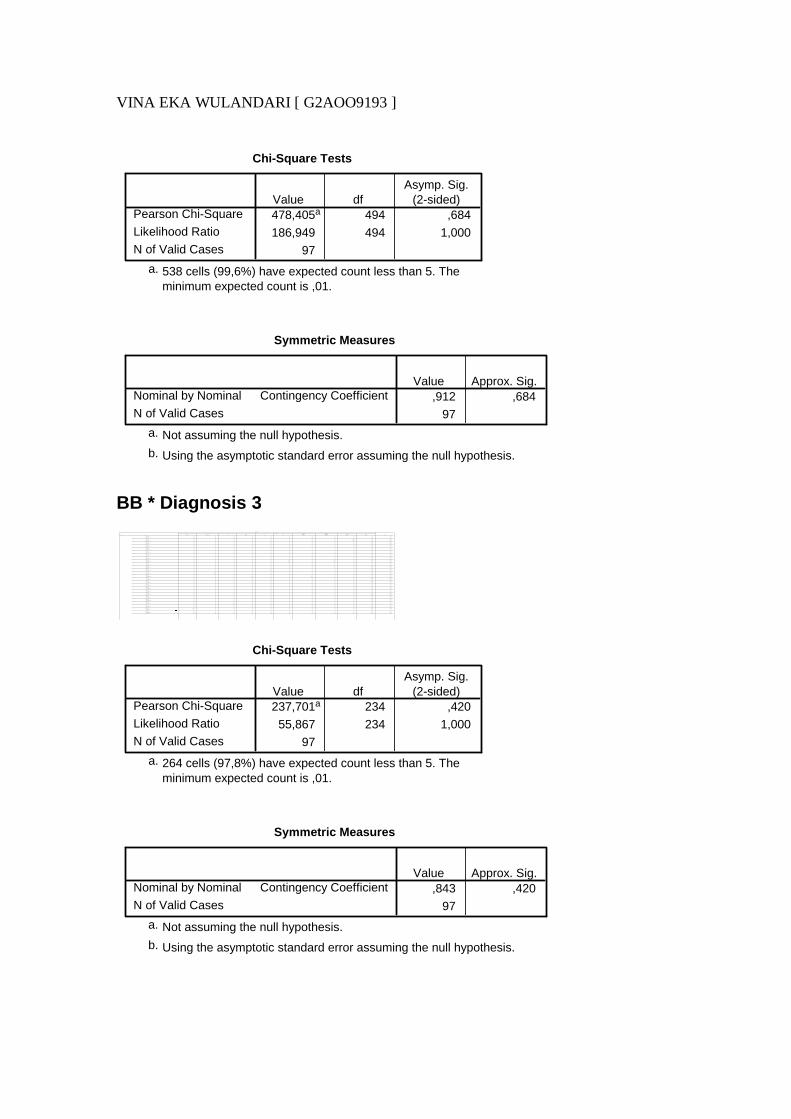
Chi-Square Tests
478,405a 494 ,684
186,949 494 1,000
97
Pearson Chi-Square
Likelihood Ratio
N of Valid Cases
Value dfAsymp. Sig.
(2-sided)
538 cells (99,6%) have expected count less than 5. Theminimum expected count is ,01.
a.
Symmetric Measures
,912 ,684
97
Contingency CoefficientNominal by Nominal
N of Valid Cases
Value Approx. Sig.
Not assuming the null hypothesis.a.
Using the asymptotic standard error assuming the null hypothesis.b.
BB * Diagnosis 3
Crosstab
0 0 0 0 0 0 0 0 0 3 3
,0% ,0% ,0% ,0% ,0% ,0% ,0% ,0% ,0% 100,0% 100,0%,0% ,0% ,0% ,0% ,0% ,0% ,0% ,0% ,0% 3,4% 3,1%
,0% ,0% ,0% ,0% ,0% ,0% ,0% ,0% ,0% 3,1% 3,1%
0 0 0 0 0 0 0 0 1 1 2
,0% ,0% ,0% ,0% ,0% ,0% ,0% ,0% 50,0% 50,0% 100,0%,0% ,0% ,0% ,0% ,0% ,0% ,0% ,0% 100,0% 1,1% 2,1%
,0% ,0% ,0% ,0% ,0% ,0% ,0% ,0% 1,0% 1,0% 2,1%
0 0 0 0 0 0 0 0 0 1 1
,0% ,0% ,0% ,0% ,0% ,0% ,0% ,0% ,0% 100,0% 100,0%,0% ,0% ,0% ,0% ,0% ,0% ,0% ,0% ,0% 1,1% 1,0%
,0% ,0% ,0% ,0% ,0% ,0% ,0% ,0% ,0% 1,0% 1,0%
0 0 0 0 0 0 0 0 0 8 8,0% ,0% ,0% ,0% ,0% ,0% ,0% ,0% ,0% 100,0% 100,0%
,0% ,0% ,0% ,0% ,0% ,0% ,0% ,0% ,0% 9,1% 8,2%
,0% ,0% ,0% ,0% ,0% ,0% ,0% ,0% ,0% 8,2% 8,2%
0 0 0 0 0 0 0 0 0 1 1,0% ,0% ,0% ,0% ,0% ,0% ,0% ,0% ,0% 100,0% 100,0%
,0% ,0% ,0% ,0% ,0% ,0% ,0% ,0% ,0% 1,1% 1,0%
,0% ,0% ,0% ,0% ,0% ,0% ,0% ,0% ,0% 1,0% 1,0%
0 0 0 0 0 0 0 0 0 4 4,0% ,0% ,0% ,0% ,0% ,0% ,0% ,0% ,0% 100,0% 100,0%
,0% ,0% ,0% ,0% ,0% ,0% ,0% ,0% ,0% 4,5% 4,1%
,0% ,0% ,0% ,0% ,0% ,0% ,0% ,0% ,0% 4,1% 4,1%
0 0 0 0 0 0 0 0 0 5 5,0% ,0% ,0% ,0% ,0% ,0% ,0% ,0% ,0% 100,0% 100,0%
,0% ,0% ,0% ,0% ,0% ,0% ,0% ,0% ,0% 5,7% 5,2%
,0% ,0% ,0% ,0% ,0% ,0% ,0% ,0% ,0% 5,2% 5,2%0 0 0 0 0 0 0 0 0 2 2
,0% ,0% ,0% ,0% ,0% ,0% ,0% ,0% ,0% 100,0% 100,0%
,0% ,0% ,0% ,0% ,0% ,0% ,0% ,0% ,0% 2,3% 2,1%
,0% ,0% ,0% ,0% ,0% ,0% ,0% ,0% ,0% 2,1% 2,1%0 0 0 0 0 1 0 1 0 11 13
,0% ,0% ,0% ,0% ,0% 7,7% ,0% 7,7% ,0% 84,6% 100,0%
,0% ,0% ,0% ,0% ,0% 100,0% ,0% 100,0% ,0% 12,5% 13,4%
,0% ,0% ,0% ,0% ,0% 1,0% ,0% 1,0% ,0% 11,3% 13,4%0 0 0 0 0 0 0 0 0 1 1
,0% ,0% ,0% ,0% ,0% ,0% ,0% ,0% ,0% 100,0% 100,0%
,0% ,0% ,0% ,0% ,0% ,0% ,0% ,0% ,0% 1,1% 1,0%
,0% ,0% ,0% ,0% ,0% ,0% ,0% ,0% ,0% 1,0% 1,0%0 0 0 0 0 0 0 0 0 1 1
,0% ,0% ,0% ,0% ,0% ,0% ,0% ,0% ,0% 100,0% 100,0%
,0% ,0% ,0% ,0% ,0% ,0% ,0% ,0% ,0% 1,1% 1,0%
,0% ,0% ,0% ,0% ,0% ,0% ,0% ,0% ,0% 1,0% 1,0%0 0 0 0 1 0 0 0 0 4 5
,0% ,0% ,0% ,0% 20,0% ,0% ,0% ,0% ,0% 80,0% 100,0%
,0% ,0% ,0% ,0% 100,0% ,0% ,0% ,0% ,0% 4,5% 5,2%,0% ,0% ,0% ,0% 1,0% ,0% ,0% ,0% ,0% 4,1% 5,2%
0 1 0 0 0 0 0 0 0 1 2
,0% 50,0% ,0% ,0% ,0% ,0% ,0% ,0% ,0% 50,0% 100,0%
,0% 100,0% ,0% ,0% ,0% ,0% ,0% ,0% ,0% 1,1% 2,1%,0% 1,0% ,0% ,0% ,0% ,0% ,0% ,0% ,0% 1,0% 2,1%
0 0 0 1 0 0 1 0 0 10 12
,0% ,0% ,0% 8,3% ,0% ,0% 8,3% ,0% ,0% 83,3% 100,0%
,0% ,0% ,0% 100,0% ,0% ,0% 100,0% ,0% ,0% 11,4% 12,4%,0% ,0% ,0% 1,0% ,0% ,0% 1,0% ,0% ,0% 10,3% 12,4%
0 0 0 0 0 0 0 0 0 3 3
,0% ,0% ,0% ,0% ,0% ,0% ,0% ,0% ,0% 100,0% 100,0%
,0% ,0% ,0% ,0% ,0% ,0% ,0% ,0% ,0% 3,4% 3,1%,0% ,0% ,0% ,0% ,0% ,0% ,0% ,0% ,0% 3,1% 3,1%
0 0 0 0 0 0 0 0 0 4 4
,0% ,0% ,0% ,0% ,0% ,0% ,0% ,0% ,0% 100,0% 100,0%,0% ,0% ,0% ,0% ,0% ,0% ,0% ,0% ,0% 4,5% 4,1%
,0% ,0% ,0% ,0% ,0% ,0% ,0% ,0% ,0% 4,1% 4,1%
0 0 0 0 0 0 0 0 0 7 7
,0% ,0% ,0% ,0% ,0% ,0% ,0% ,0% ,0% 100,0% 100,0%,0% ,0% ,0% ,0% ,0% ,0% ,0% ,0% ,0% 8,0% 7,2%
,0% ,0% ,0% ,0% ,0% ,0% ,0% ,0% ,0% 7,2% 7,2%
0 0 0 0 0 0 0 0 0 6 6
,0% ,0% ,0% ,0% ,0% ,0% ,0% ,0% ,0% 100,0% 100,0%,0% ,0% ,0% ,0% ,0% ,0% ,0% ,0% ,0% 6,8% 6,2%
,0% ,0% ,0% ,0% ,0% ,0% ,0% ,0% ,0% 6,2% 6,2%
0 0 0 0 0 0 0 0 0 1 1
,0% ,0% ,0% ,0% ,0% ,0% ,0% ,0% ,0% 100,0% 100,0%,0% ,0% ,0% ,0% ,0% ,0% ,0% ,0% ,0% 1,1% 1,0%
,0% ,0% ,0% ,0% ,0% ,0% ,0% ,0% ,0% 1,0% 1,0%
0 0 0 0 0 0 0 0 0 6 6,0% ,0% ,0% ,0% ,0% ,0% ,0% ,0% ,0% 100,0% 100,0%
,0% ,0% ,0% ,0% ,0% ,0% ,0% ,0% ,0% 6,8% 6,2%
,0% ,0% ,0% ,0% ,0% ,0% ,0% ,0% ,0% 6,2% 6,2%
0 0 0 0 0 0 0 0 0 2 2,0% ,0% ,0% ,0% ,0% ,0% ,0% ,0% ,0% 100,0% 100,0%
,0% ,0% ,0% ,0% ,0% ,0% ,0% ,0% ,0% 2,3% 2,1%
,0% ,0% ,0% ,0% ,0% ,0% ,0% ,0% ,0% 2,1% 2,1%
0 0 0 0 0 0 0 0 0 1 1,0% ,0% ,0% ,0% ,0% ,0% ,0% ,0% ,0% 100,0% 100,0%
,0% ,0% ,0% ,0% ,0% ,0% ,0% ,0% ,0% 1,1% 1,0%
,0% ,0% ,0% ,0% ,0% ,0% ,0% ,0% ,0% 1,0% 1,0%
0 0 1 0 0 0 0 0 0 1 2,0% ,0% 50,0% ,0% ,0% ,0% ,0% ,0% ,0% 50,0% 100,0%
,0% ,0% 100,0% ,0% ,0% ,0% ,0% ,0% ,0% 1,1% 2,1%
,0% ,0% 1,0% ,0% ,0% ,0% ,0% ,0% ,0% 1,0% 2,1%0 0 0 0 0 0 0 0 0 1 1
,0% ,0% ,0% ,0% ,0% ,0% ,0% ,0% ,0% 100,0% 100,0%
,0% ,0% ,0% ,0% ,0% ,0% ,0% ,0% ,0% 1,1% 1,0%
,0% ,0% ,0% ,0% ,0% ,0% ,0% ,0% ,0% 1,0% 1,0%1 0 0 0 0 0 0 0 0 1 2
50,0% ,0% ,0% ,0% ,0% ,0% ,0% ,0% ,0% 50,0% 100,0%
100,0% ,0% ,0% ,0% ,0% ,0% ,0% ,0% ,0% 1,1% 2,1%
1,0% ,0% ,0% ,0% ,0% ,0% ,0% ,0% ,0% 1,0% 2,1%0 0 0 0 0 0 0 0 0 1 1
,0% ,0% ,0% ,0% ,0% ,0% ,0% ,0% ,0% 100,0% 100,0%
,0% ,0% ,0% ,0% ,0% ,0% ,0% ,0% ,0% 1,1% 1,0%
,0% ,0% ,0% ,0% ,0% ,0% ,0% ,0% ,0% 1,0% 1,0%
Count% within BB
% within Diagnos is 3
% of Total
Count% within BB
% within Diagnos is 3
% of Total
Count% within BB
% within Diagnos is 3
% of TotalCount
% within BB
% within Diagnos is 3
% of TotalCount
% within BB
% within Diagnos is 3
% of TotalCount
% within BB
% within Diagnos is 3
% of TotalCount
% within BB
% within Diagnos is 3
% of TotalCount
% within BB
% within Diagnos is 3% of Total
Count
% within BB
% within Diagnos is 3% of Total
Count
% within BB
% within Diagnos is 3% of Total
Count
% within BB
% within Diagnos is 3% of Total
Count
% within BB% within Diagnos is 3
% of Total
Count
% within BB% within Diagnos is 3
% of Total
Count
% within BB% within Diagnos is 3
% of Total
Count
% within BB% within Diagnos is 3
% of Total
Count% within BB
% within Diagnos is 3
% of Total
Count% within BB
% within Diagnos is 3
% of Total
Count% within BB
% within Diagnos is 3
% of Total
Count% within BB
% within Diagnos is 3
% of TotalCount
% within BB
% within Diagnos is 3
% of TotalCount
% within BB
% within Diagnos is 3
% of TotalCount
% within BB
% within Diagnos is 3
% of TotalCount
% within BB
% within Diagnos is 3% of Total
Count
% within BB
% within Diagnos is 3% of Total
Count
% within BB
% within Diagnos is 3% of Total
Count
% within BB
% within Diagnos is 3% of Total
40
43
44
45
46
47
48
49
50
51
52
53
54
55
56
57
58
60
61
63
65
67
68
69
80
81
BB
Gemell i Janin besar KPD Obesitas PEB PER
Presentas ijanin letak
lintang
Presentas ijanin letaksungsang
Tali pusatmeli l i t Tidak ada
Diagnos is 3
Total
Chi-Square Tests
237,701a 234 ,420
55,867 234 1,000
97
Pearson Chi-Square
Likelihood Ratio
N of Valid Cases
Value dfAsymp. Sig.
(2-sided)
264 cells (97,8%) have expected count less than 5. Theminimum expected count is ,01.
a.
Symmetric Measures
,843 ,420
97
Contingency CoefficientNominal by Nominal
N of Valid Cases
Value Approx. Sig.
Not assuming the null hypothesis.a.
Using the asymptotic standard error assuming the null hypothesis.b.
VINA EKA WULANDARI [ G2AOO9193 ]
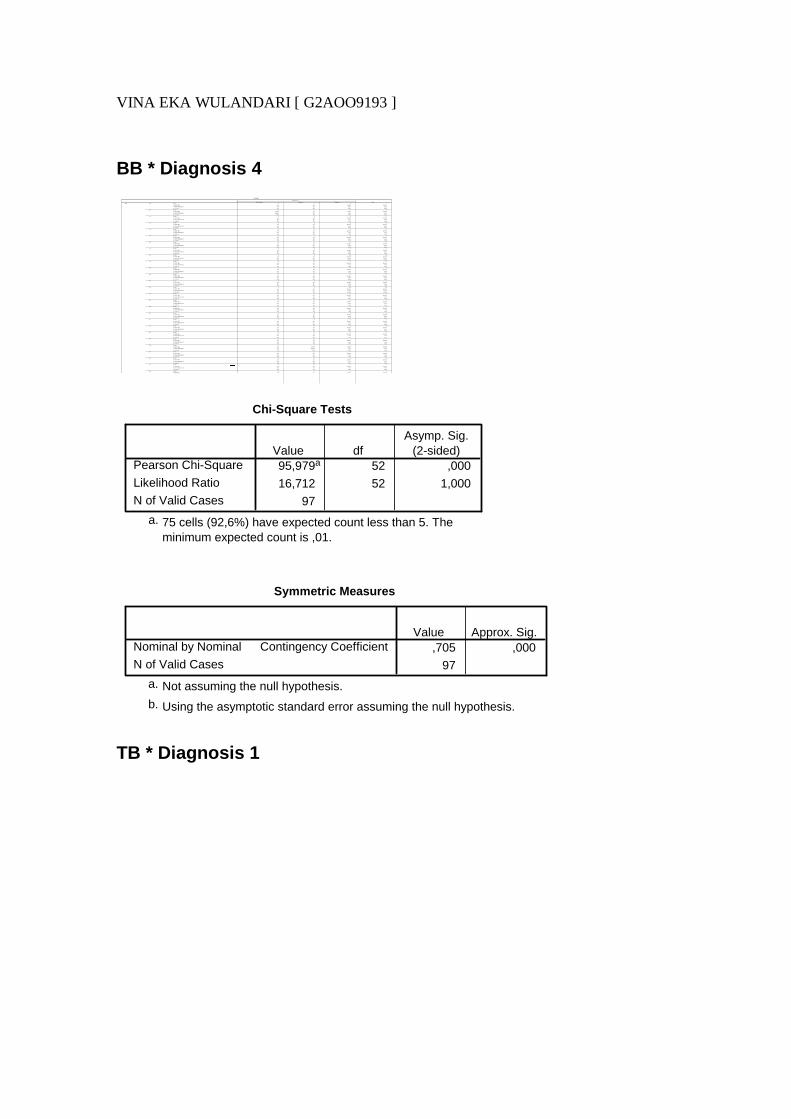
BB * Diagnosis 4
Crosstab
0 0 3 3
,0% ,0% 100,0% 100,0%
,0% ,0% 3,2% 3,1%
,0% ,0% 3,1% 3,1%
1 0 1 2
50,0% ,0% 50,0% 100,0%
100,0% ,0% 1,1% 2,1%
1,0% ,0% 1,0% 2,1%
0 0 1 1
,0% ,0% 100,0% 100,0%
,0% ,0% 1,1% 1,0%
,0% ,0% 1,0% 1,0%
0 0 8 8
,0% ,0% 100,0% 100,0%
,0% ,0% 8,4% 8,2%
,0% ,0% 8,2% 8,2%
0 0 1 1
,0% ,0% 100,0% 100,0%
,0% ,0% 1,1% 1,0%
,0% ,0% 1,0% 1,0%
0 0 4 4
,0% ,0% 100,0% 100,0%
,0% ,0% 4,2% 4,1%
,0% ,0% 4,1% 4,1%
0 0 5 5
,0% ,0% 100,0% 100,0%
,0% ,0% 5,3% 5,2%
,0% ,0% 5,2% 5,2%
0 0 2 2
,0% ,0% 100,0% 100,0%
,0% ,0% 2,1% 2,1%
,0% ,0% 2,1% 2,1%
0 0 13 13
,0% ,0% 100,0% 100,0%
,0% ,0% 13,7% 13,4%
,0% ,0% 13,4% 13,4%
0 0 1 1
,0% ,0% 100,0% 100,0%
,0% ,0% 1,1% 1,0%
,0% ,0% 1,0% 1,0%
0 0 1 1
,0% ,0% 100,0% 100,0%
,0% ,0% 1,1% 1,0%
,0% ,0% 1,0% 1,0%
0 0 5 5
,0% ,0% 100,0% 100,0%
,0% ,0% 5,3% 5,2%
,0% ,0% 5,2% 5,2%
0 0 2 2
,0% ,0% 100,0% 100,0%
,0% ,0% 2,1% 2,1%
,0% ,0% 2,1% 2,1%
0 0 12 12
,0% ,0% 100,0% 100,0%
,0% ,0% 12,6% 12,4%
,0% ,0% 12,4% 12,4%
0 0 3 3
,0% ,0% 100,0% 100,0%
,0% ,0% 3,2% 3,1%
,0% ,0% 3,1% 3,1%
0 0 4 4
,0% ,0% 100,0% 100,0%
,0% ,0% 4,2% 4,1%
,0% ,0% 4,1% 4,1%
0 0 7 7
,0% ,0% 100,0% 100,0%
,0% ,0% 7,4% 7,2%
,0% ,0% 7,2% 7,2%
0 0 6 6
,0% ,0% 100,0% 100,0%
,0% ,0% 6,3% 6,2%
,0% ,0% 6,2% 6,2%
0 0 1 1
,0% ,0% 100,0% 100,0%
,0% ,0% 1,1% 1,0%
,0% ,0% 1,0% 1,0%
0 0 6 6
,0% ,0% 100,0% 100,0%
,0% ,0% 6,3% 6,2%
,0% ,0% 6,2% 6,2%
0 0 2 2
,0% ,0% 100,0% 100,0%
,0% ,0% 2,1% 2,1%
,0% ,0% 2,1% 2,1%
0 0 1 1
,0% ,0% 100,0% 100,0%
,0% ,0% 1,1% 1,0%
,0% ,0% 1,0% 1,0%
0 1 1 2
,0% 50,0% 50,0% 100,0%
,0% 100,0% 1,1% 2,1%
,0% 1,0% 1,0% 2,1%
0 0 1 1
,0% ,0% 100,0% 100,0%
,0% ,0% 1,1% 1,0%
,0% ,0% 1,0% 1,0%
0 0 2 2
,0% ,0% 100,0% 100,0%
,0% ,0% 2,1% 2,1%
,0% ,0% 2,1% 2,1%
0 0 1 1
,0% ,0% 100,0% 100,0%
,0% ,0% 1,1% 1,0%
,0% ,0% 1,0% 1,0%
0 0 1 1
,0% ,0% 100,0% 100,0%
Count
% within BB
% within Diagnosis 4
% of Total
Count
% within BB
% within Diagnosis 4
% of Total
Count
% within BB
% within Diagnosis 4
% of Total
Count
% within BB
% within Diagnosis 4
% of Total
Count
% within BB
% within Diagnosis 4
% of Total
Count
% within BB
% within Diagnosis 4
% of Total
Count
% within BB
% within Diagnosis 4
% of Total
Count
% within BB
% within Diagnosis 4
% of Total
Count
% within BB
% within Diagnosis 4
% of Total
Count
% within BB
% within Diagnosis 4
% of Total
Count
% within BB
% within Diagnosis 4
% of Total
Count
% within BB
% within Diagnosis 4
% of Total
Count
% within BB
% within Diagnosis 4
% of Total
Count
% within BB
% within Diagnosis 4
% of Total
Count
% within BB
% within Diagnosis 4
% of Total
Count
% within BB
% within Diagnosis 4
% of Total
Count
% within BB
% within Diagnosis 4
% of Total
Count
% within BB
% within Diagnosis 4
% of Total
Count
% within BB
% within Diagnosis 4
% of Total
Count
% within BB
% within Diagnosis 4
% of Total
Count
% within BB
% within Diagnosis 4
% of Total
Count
% within BB
% within Diagnosis 4
% of Total
Count
% within BB
% within Diagnosis 4
% of Total
Count
% within BB
% within Diagnosis 4
% of Total
Count
% within BB
% within Diagnosis 4
% of Total
Count
% within BB
% within Diagnosis 4
% of Total
Count
% within BB
40
43
44
45
46
47
48
49
50
51
52
53
54
55
56
57
58
60
61
63
65
67
68
69
80
81
83
BBFetal distress Obesitas Tidak ada
Diagnosis 4
Total
Chi-Square Tests
95,979a 52 ,000
16,712 52 1,000
97
Pearson Chi-Square
Likelihood Ratio
N of Valid Cases
Value dfAsymp. Sig.
(2-sided)
75 cells (92,6%) have expected count less than 5. Theminimum expected count is ,01.
a.
Symmetric Measures
,705 ,000
97
Contingency CoefficientNominal by Nominal
N of Valid Cases
Value Approx. Sig.
Not assuming the null hypothesis.a.
Using the asymptotic standard error assuming the null hypothesis.b.
TB * Diagnosis 1

VINA EKA WULANDARI [ G2AOO9193 ]
0 0 0 0 0
,0% ,0% ,0% ,0% ,0% ,0%
,0% ,0% ,0% ,0% ,0% ,0%
,0% ,0% ,0% ,0% ,0% ,0%
0 0 0 0 0
,0% ,0% ,0% ,0% ,0% ,0%
,0% ,0% ,0% ,0% ,0% ,0%
,0% ,0% ,0% ,0% ,0% ,0%
0 0 0 0 0
,0% ,0% ,0% ,0% ,0% ,0%
,0% ,0% ,0% ,0% ,0% ,0%
,0% ,0% ,0% ,0% ,0% ,0%
0 0 0 0 0
,0% ,0% ,0% ,0% ,0% ,0%
,0% ,0% ,0% ,0% ,0% ,0%
,0% ,0% ,0% ,0% ,0% ,0%
0 0 0 0 0
,0% ,0% ,0% ,0% ,0% ,0%
,0% ,0% ,0% ,0% ,0% ,0%
,0% ,0% ,0% ,0% ,0% ,0%
0 0 0 0 0
,0% ,0% ,0% ,0% ,0% 7,1%
,0% ,0% ,0% ,0% ,0% 5,0%
,0% ,0% ,0% ,0% ,0% 1,0%
0 0 0 0 0
,0% ,0% ,0% ,0% ,0% 25,0%
,0% ,0% ,0% ,0% ,0% 5,0%
,0% ,0% ,0% ,0% ,0% 1,0%
0 0 0 0 0
,0% ,0% ,0% ,0% ,0% 25,0%
,0% ,0% ,0% ,0% ,0% 5,0%
,0% ,0% ,0% ,0% ,0% 1,0%
0 0 0 0 0
,0% ,0% ,0% ,0% ,0% 28,6%
,0% ,0% ,0% ,0% ,0% 20,0%
,0% ,0% ,0% ,0% ,0% 4,1%
0 0 0 0 0
,0% ,0% ,0% ,0% ,0% ,0%
,0% ,0% ,0% ,0% ,0% ,0%
,0% ,0% ,0% ,0% ,0% ,0%
0 0 1 0 0
,0% ,0% 4,8% ,0% ,0% 28,6%
,0% ,0% 100,0% ,0% ,0% 30,0%
,0% ,0% 1,0% ,0% ,0% 6,2%
1 0 0 0 1
12,5% ,0% ,0% ,0% 12,5% 25,0%
Count
% within TB
% within Diagnosis 1
% of Total
Count
% within TB
% within Diagnosis 1
% of Total
Count
% within TB
% within Diagnosis 1
% of Total
Count
% within TB
% within Diagnosis 1
% of Total
Count
% within TB
% within Diagnosis 1
% of Total
Count
% within TB
% within Diagnosis 1
% of Total
Count
% within TB
% within Diagnosis 1
% of Total
Count
% within TB
% within Diagnosis 1
% of Total
Count
% within TB
% within Diagnosis 1
% of Total
Count
% within TB
% within Diagnosis 1
% of Total
Count
% within TB
% within Diagnosis 1
% of Total
Count
% within TB
143
145
147
148
149
150
151
152
153
154
155
156
TBCPD
Eklamsiaberat
Hamil lewatbulan (
Serotinus) Hipertensi
Infeksi karenakeluar lendir
putih bau darivagina KPD
VINA EKA WULANDARI [ G2AOO9193 ]
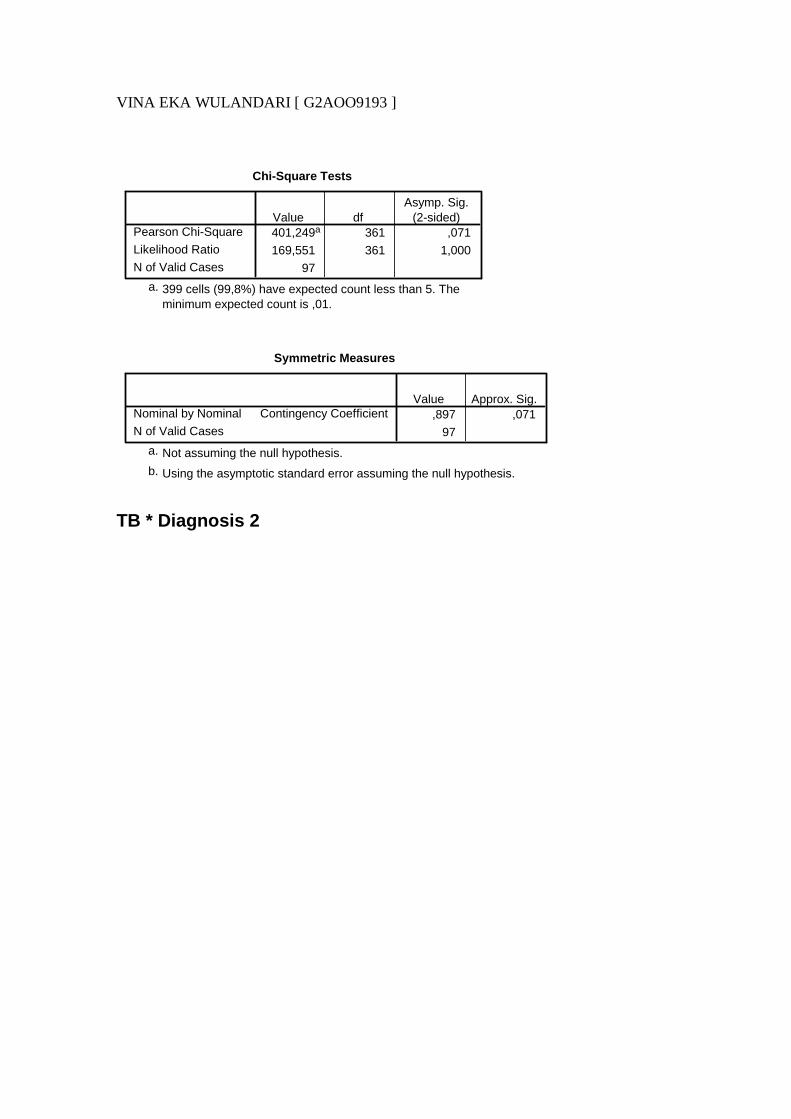
Chi-Square Tests
401,249a 361 ,071
169,551 361 1,000
97
Pearson Chi-Square
Likelihood Ratio
N of Valid Cases
Value dfAsymp. Sig.
(2-sided)
399 cells (99,8%) have expected count less than 5. Theminimum expected count is ,01.
a.
Symmetric Measures
,897 ,071
97
Contingency CoefficientNominal by Nominal
N of Valid Cases
Value Approx. Sig.
Not assuming the null hypothesis.a.
Using the asymptotic standard error assuming the null hypothesis.b.
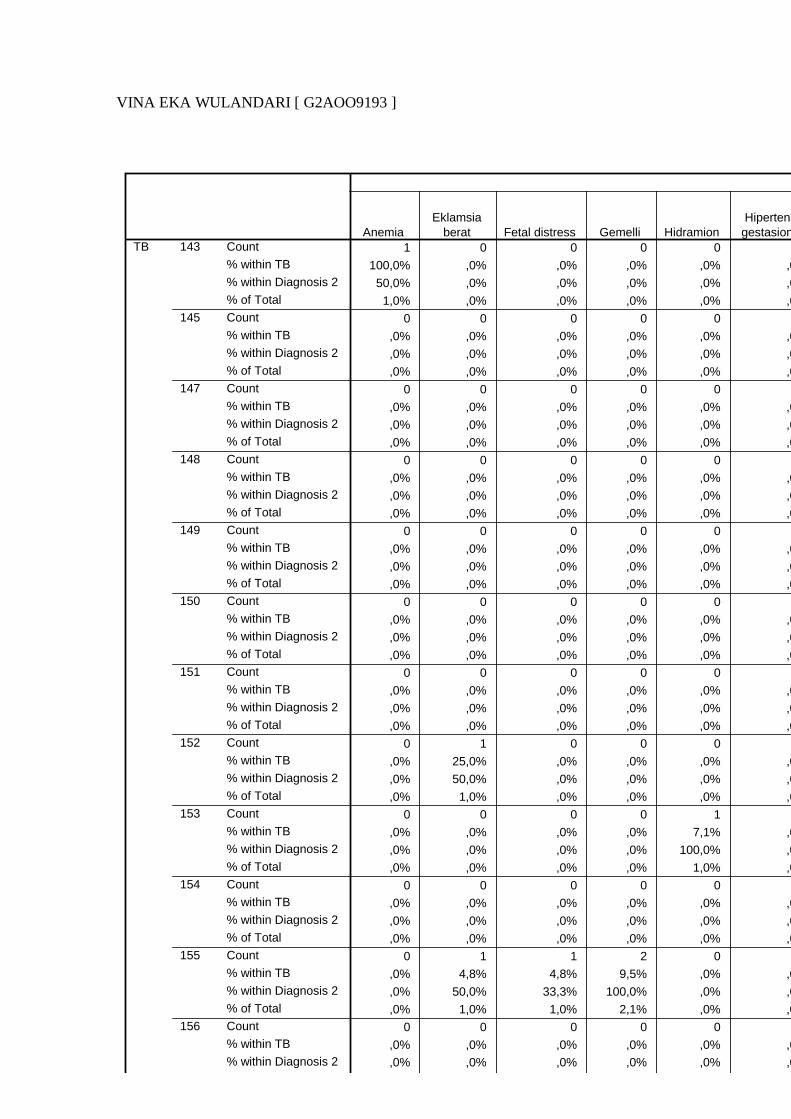
TB * Diagnosis 2
VINA EKA WULANDARI [ G2AOO9193 ]
1 0 0 0 0
100,0% ,0% ,0% ,0% ,0% ,0%
50,0% ,0% ,0% ,0% ,0% ,0%
1,0% ,0% ,0% ,0% ,0% ,0%
0 0 0 0 0
,0% ,0% ,0% ,0% ,0% ,0%
,0% ,0% ,0% ,0% ,0% ,0%
,0% ,0% ,0% ,0% ,0% ,0%
0 0 0 0 0
,0% ,0% ,0% ,0% ,0% ,0%
,0% ,0% ,0% ,0% ,0% ,0%
,0% ,0% ,0% ,0% ,0% ,0%
0 0 0 0 0
,0% ,0% ,0% ,0% ,0% ,0%
,0% ,0% ,0% ,0% ,0% ,0%
,0% ,0% ,0% ,0% ,0% ,0%
0 0 0 0 0
,0% ,0% ,0% ,0% ,0% ,0%
,0% ,0% ,0% ,0% ,0% ,0%
,0% ,0% ,0% ,0% ,0% ,0%
0 0 0 0 0
,0% ,0% ,0% ,0% ,0% ,0%
,0% ,0% ,0% ,0% ,0% ,0%
,0% ,0% ,0% ,0% ,0% ,0%
0 0 0 0 0
,0% ,0% ,0% ,0% ,0% ,0%
,0% ,0% ,0% ,0% ,0% ,0%
,0% ,0% ,0% ,0% ,0% ,0%
0 1 0 0 0
,0% 25,0% ,0% ,0% ,0% ,0%
,0% 50,0% ,0% ,0% ,0% ,0%
,0% 1,0% ,0% ,0% ,0% ,0%
0 0 0 0 1
,0% ,0% ,0% ,0% 7,1% ,0%
,0% ,0% ,0% ,0% 100,0% ,0%
,0% ,0% ,0% ,0% 1,0% ,0%
0 0 0 0 0
,0% ,0% ,0% ,0% ,0% ,0%
,0% ,0% ,0% ,0% ,0% ,0%
,0% ,0% ,0% ,0% ,0% ,0%
0 1 1 2 0
,0% 4,8% 4,8% 9,5% ,0% ,0%
,0% 50,0% 33,3% 100,0% ,0% ,0%
,0% 1,0% 1,0% 2,1% ,0% ,0%
0 0 0 0 0
,0% ,0% ,0% ,0% ,0% ,0%
,0% ,0% ,0% ,0% ,0% ,0%
Count
% within TB
% within Diagnosis 2
% of Total
Count
% within TB
% within Diagnosis 2
% of Total
Count
% within TB
% within Diagnosis 2
% of Total
Count
% within TB
% within Diagnosis 2
% of Total
Count
% within TB
% within Diagnosis 2
% of Total
Count
% within TB
% within Diagnosis 2
% of Total
Count
% within TB
% within Diagnosis 2
% of Total
Count
% within TB
% within Diagnosis 2
% of Total
Count
% within TB
% within Diagnosis 2
% of Total
Count
% within TB
% within Diagnosis 2
% of Total
Count
% within TB
% within Diagnosis 2
% of Total
Count
% within TB
% within Diagnosis 2
143
145
147
148
149
150
151
152
153
154
155
156
TBAnemia
Eklamsiaberat Fetal distress Gemelli Hidramion
Hipertensigestasional

VINA EKA WULANDARI [ G2AOO9193 ]
Chi-Square Tests
465,013a 361 ,000
149,795 361 1,000
97
Pearson Chi-Square
Likelihood Ratio
N of Valid Cases
Value dfAsymp. Sig.
(2-sided)
397 cells (99,3%) have expected count less than 5. Theminimum expected count is ,01.
a.
Symmetric Measures
,910 ,000
97
Contingency CoefficientNominal by Nominal
N of Valid Cases
Value Approx. Sig.
Not assuming the null hypothesis.a.
Using the asymptotic standard error assuming the null hypothesis.b.
TB * Diagnosis 3

VINA EKA WULANDARI [ G2AOO9193 ]
Crosstab
0 0 0 0 0 0
,0% ,0% ,0% ,0% ,0% ,0%
,0% ,0% ,0% ,0% ,0% ,0%
,0% ,0% ,0% ,0% ,0% ,0%
0 0 0 0 0 0
,0% ,0% ,0% ,0% ,0% ,0%
,0% ,0% ,0% ,0% ,0% ,0%
,0% ,0% ,0% ,0% ,0% ,0%
0 0 0 0 0 0
,0% ,0% ,0% ,0% ,0% ,0%
,0% ,0% ,0% ,0% ,0% ,0%
,0% ,0% ,0% ,0% ,0% ,0%
0 0 0 0 0 0
,0% ,0% ,0% ,0% ,0% ,0%
,0% ,0% ,0% ,0% ,0% ,0%
,0% ,0% ,0% ,0% ,0% ,0%
0 0 0 0 0 0
,0% ,0% ,0% ,0% ,0% ,0%
,0% ,0% ,0% ,0% ,0% ,0%
,0% ,0% ,0% ,0% ,0% ,0%
0 0 0 0 0 1
,0% ,0% ,0% ,0% ,0% 7,1%
,0% ,0% ,0% ,0% ,0% 100,0%
,0% ,0% ,0% ,0% ,0% 1,0%
0 0 0 0 1 0
,0% ,0% ,0% ,0% 25,0% ,0%
,0% ,0% ,0% ,0% 100,0% ,0%
,0% ,0% ,0% ,0% 1,0% ,0%
0 0 0 0 0 0
,0% ,0% ,0% ,0% ,0% ,0%
,0% ,0% ,0% ,0% ,0% ,0%
,0% ,0% ,0% ,0% ,0% ,0%
0 1 0 0 0 0
,0% 7,1% ,0% ,0% ,0% ,0%
,0% 100,0% ,0% ,0% ,0% ,0%
,0% 1,0% ,0% ,0% ,0% ,0%
0 0 0 1 0 0
,0% ,0% ,0% 100,0% ,0% ,0%
,0% ,0% ,0% 100,0% ,0% ,0%
,0% ,0% ,0% 1,0% ,0% ,0%
0 0 0 0 0 0
,0% ,0% ,0% ,0% ,0% ,0%
,0% ,0% ,0% ,0% ,0% ,0%
,0% ,0% ,0% ,0% ,0% ,0%
0 0 0 0 0 0
,0% ,0% ,0% ,0% ,0% ,0%
,0% ,0% ,0% ,0% ,0% ,0%
Count
% within TB
% within Diagnosis 3
% of Total
Count
% within TB
% within Diagnosis 3
% of Total
Count
% within TB
% within Diagnosis 3
% of Total
Count
% within TB
% within Diagnosis 3
% of Total
Count
% within TB
% within Diagnosis 3
% of Total
Count
% within TB
% within Diagnosis 3
% of Total
Count
% within TB
% within Diagnosis 3
% of Total
Count
% within TB
% within Diagnosis 3
% of Total
Count
% within TB
% within Diagnosis 3
% of Total
Count
% within TB
% within Diagnosis 3
% of Total
Count
% within TB
% within Diagnosis 3
% of Total
Count
% within TB
% within Diagnosis 3
143
145
147
148
149
150
151
152
153
154
155
156
TBGemelli Janin besar KPD Obesitas PEB PER
Diagnosis 3

VINA EKA WULANDARI [ G2AOO9193 ]
Chi-Square Tests
302,062a 171 ,000
57,303 171 1,000
97
Pearson Chi-Square
Likelihood Ratio
N of Valid Cases
Value dfAsymp. Sig.
(2-sided)
194 cells (97,0%) have expected count less than 5. Theminimum expected count is ,01.
a.
Symmetric Measures
,870 ,000
97
Contingency CoefficientNominal by Nominal
N of Valid Cases
Value Approx. Sig.
Not assuming the null hypothesis.a.
Using the asymptotic standard error assuming the null hypothesis.b.
TB * Diagnosis 4
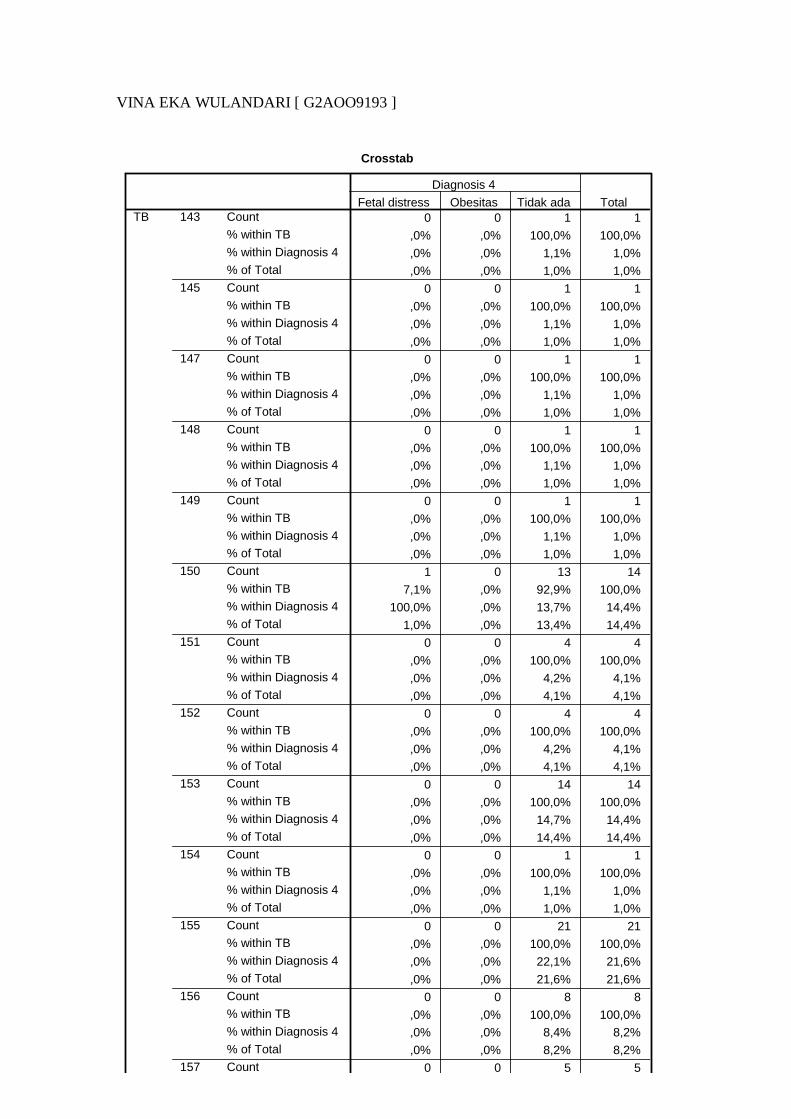
VINA EKA WULANDARI [ G2AOO9193 ]
Crosstab
0 0 1 1
,0% ,0% 100,0% 100,0%
,0% ,0% 1,1% 1,0%
,0% ,0% 1,0% 1,0%
0 0 1 1
,0% ,0% 100,0% 100,0%
,0% ,0% 1,1% 1,0%
,0% ,0% 1,0% 1,0%
0 0 1 1
,0% ,0% 100,0% 100,0%
,0% ,0% 1,1% 1,0%
,0% ,0% 1,0% 1,0%
0 0 1 1
,0% ,0% 100,0% 100,0%
,0% ,0% 1,1% 1,0%
,0% ,0% 1,0% 1,0%
0 0 1 1
,0% ,0% 100,0% 100,0%
,0% ,0% 1,1% 1,0%
,0% ,0% 1,0% 1,0%
1 0 13 14
7,1% ,0% 92,9% 100,0%
100,0% ,0% 13,7% 14,4%
1,0% ,0% 13,4% 14,4%
0 0 4 4
,0% ,0% 100,0% 100,0%
,0% ,0% 4,2% 4,1%
,0% ,0% 4,1% 4,1%
0 0 4 4
,0% ,0% 100,0% 100,0%
,0% ,0% 4,2% 4,1%
,0% ,0% 4,1% 4,1%
0 0 14 14
,0% ,0% 100,0% 100,0%
,0% ,0% 14,7% 14,4%
,0% ,0% 14,4% 14,4%
0 0 1 1
,0% ,0% 100,0% 100,0%
,0% ,0% 1,1% 1,0%
,0% ,0% 1,0% 1,0%
0 0 21 21
,0% ,0% 100,0% 100,0%
,0% ,0% 22,1% 21,6%
,0% ,0% 21,6% 21,6%
0 0 8 8
,0% ,0% 100,0% 100,0%
,0% ,0% 8,4% 8,2%
,0% ,0% 8,2% 8,2%
0 0 5 5
Count
% within TB
% within Diagnosis 4
% of Total
Count
% within TB
% within Diagnosis 4
% of Total
Count
% within TB
% within Diagnosis 4
% of Total
Count
% within TB
% within Diagnosis 4
% of Total
Count
% within TB
% within Diagnosis 4
% of Total
Count
% within TB
% within Diagnosis 4
% of Total
Count
% within TB
% within Diagnosis 4
% of Total
Count
% within TB
% within Diagnosis 4
% of Total
Count
% within TB
% within Diagnosis 4
% of Total
Count
% within TB
% within Diagnosis 4
% of Total
Count
% within TB
% within Diagnosis 4
% of Total
Count
% within TB
% within Diagnosis 4
% of Total
Count
143
145
147
148
149
150
151
152
153
154
155
156
157
TBFetal distress Obesitas Tidak ada
Diagnosis 4
Total
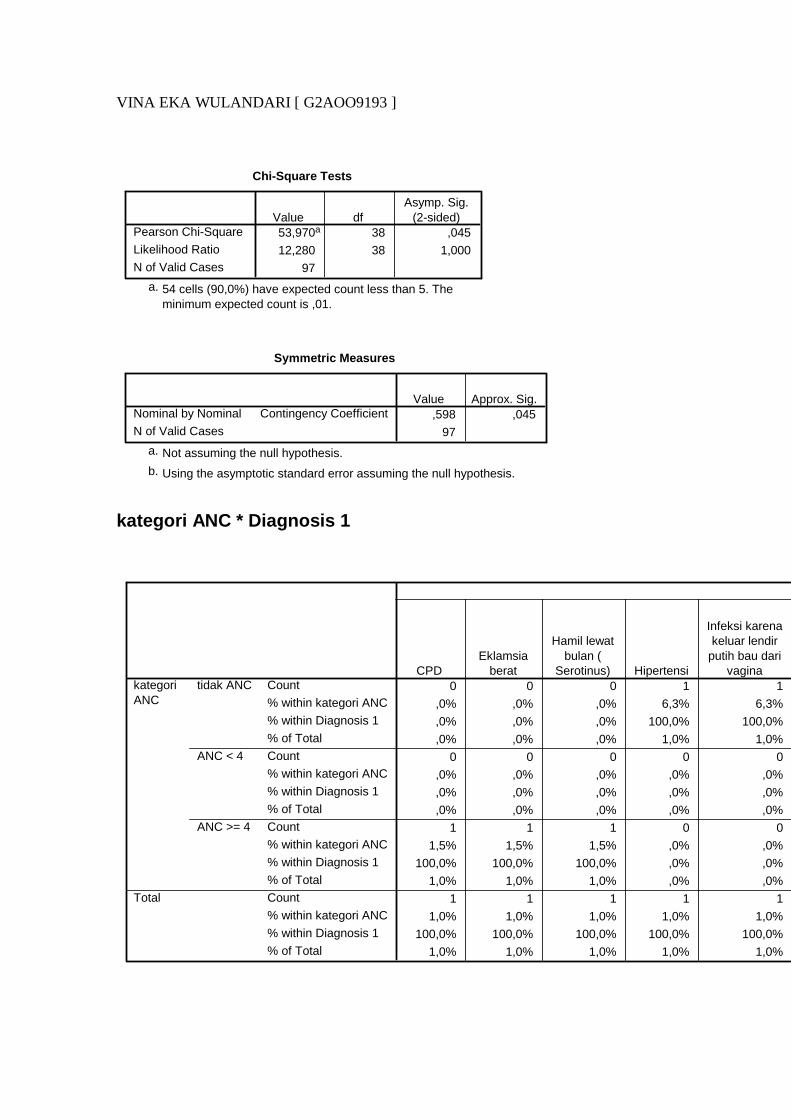
VINA EKA WULANDARI [ G2AOO9193 ]
Chi-Square Tests
53,970a 38 ,045
12,280 38 1,000
97
Pearson Chi-Square
Likelihood Ratio
N of Valid Cases
Value dfAsymp. Sig.
(2-sided)
54 cells (90,0%) have expected count less than 5. Theminimum expected count is ,01.
a.
Symmetric Measures
,598 ,045
97
Contingency CoefficientNominal by Nominal
N of Valid Cases
Value Approx. Sig.
Not assuming the null hypothesis.a.
Using the asymptotic standard error assuming the null hypothesis.b.
kategori ANC * Diagnosis 1
0 0 0 1 1
,0% ,0% ,0% 6,3% 6,3%
,0% ,0% ,0% 100,0% 100,0%
,0% ,0% ,0% 1,0% 1,0%
0 0 0 0 0
,0% ,0% ,0% ,0% ,0%
,0% ,0% ,0% ,0% ,0%
,0% ,0% ,0% ,0% ,0%
1 1 1 0 0
1,5% 1,5% 1,5% ,0% ,0%
100,0% 100,0% 100,0% ,0% ,0%
1,0% 1,0% 1,0% ,0% ,0%
1 1 1 1 1
1,0% 1,0% 1,0% 1,0% 1,0%
100,0% 100,0% 100,0% 100,0% 100,0%
1,0% 1,0% 1,0% 1,0% 1,0%
Count
% within kategori ANC
% within Diagnosis 1
% of Total
Count
% within kategori ANC
% within Diagnosis 1
% of Total
Count
% within kategori ANC
% within Diagnosis 1
% of Total
Count
% within kategori ANC
% within Diagnosis 1
% of Total
tidak ANC
ANC < 4
ANC >= 4
kategoriANC
Total
CPDEklamsia
berat
Hamil lewatbulan (
Serotinus) Hipertensi
Infeksi karenakeluar lendir
putih bau darivagina
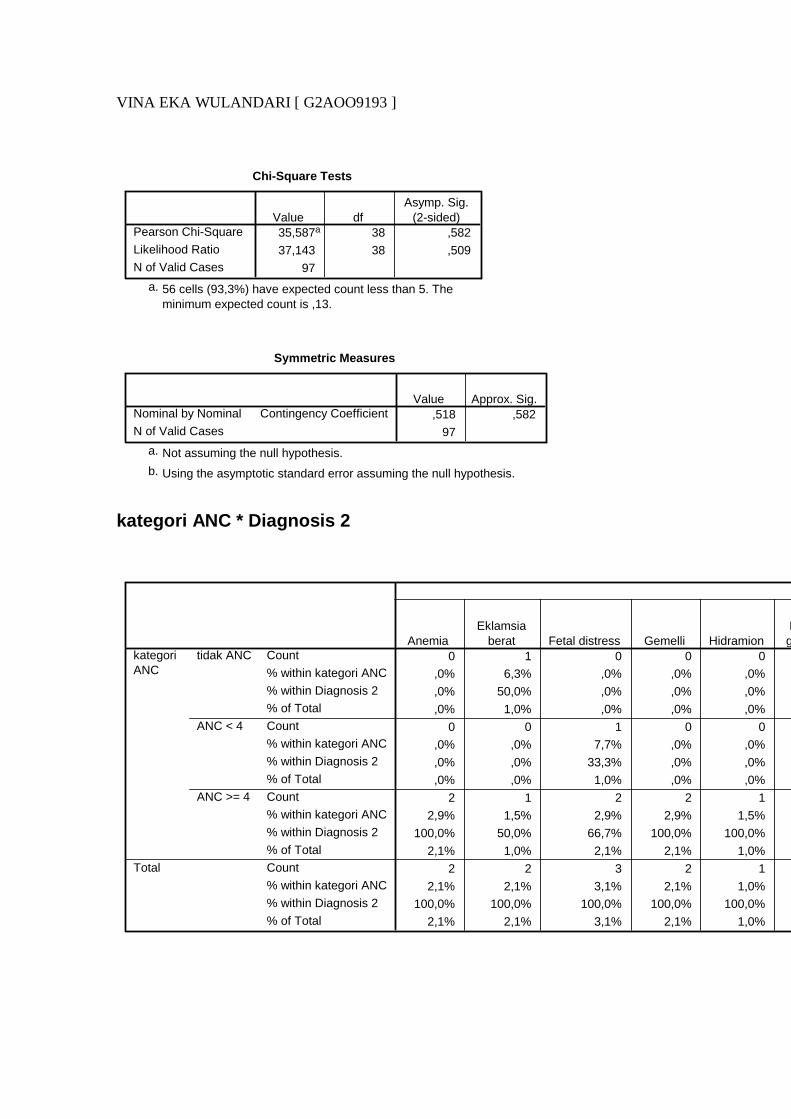
VINA EKA WULANDARI [ G2AOO9193 ]
Chi-Square Tests
35,587a 38 ,582
37,143 38 ,509
97
Pearson Chi-Square
Likelihood Ratio
N of Valid Cases
Value dfAsymp. Sig.
(2-sided)
56 cells (93,3%) have expected count less than 5. Theminimum expected count is ,13.
a.
Symmetric Measures
,518 ,582
97
Contingency CoefficientNominal by Nominal
N of Valid Cases
Value Approx. Sig.
Not assuming the null hypothesis.a.
Using the asymptotic standard error assuming the null hypothesis.b.
kategori ANC * Diagnosis 2
0 1 0 0 0
,0% 6,3% ,0% ,0% ,0%
,0% 50,0% ,0% ,0% ,0%
,0% 1,0% ,0% ,0% ,0%
0 0 1 0 0
,0% ,0% 7,7% ,0% ,0%
,0% ,0% 33,3% ,0% ,0%
,0% ,0% 1,0% ,0% ,0%
2 1 2 2 1
2,9% 1,5% 2,9% 2,9% 1,5%
100,0% 50,0% 66,7% 100,0% 100,0%
2,1% 1,0% 2,1% 2,1% 1,0%
2 2 3 2 1
2,1% 2,1% 3,1% 2,1% 1,0%
100,0% 100,0% 100,0% 100,0% 100,0%
2,1% 2,1% 3,1% 2,1% 1,0%
Count
% within kategori ANC
% within Diagnosis 2
% of Total
Count
% within kategori ANC
% within Diagnosis 2
% of Total
Count
% within kategori ANC
% within Diagnosis 2
% of Total
Count
% within kategori ANC
% within Diagnosis 2
% of Total
tidak ANC
ANC < 4
ANC >= 4
kategoriANC
Total
AnemiaEklamsia
berat Fetal distress Gemelli HidramionHipertensigestasional

VINA EKA WULANDARI [ G2AOO9193 ]
Chi-Square Tests
43,153a 38 ,260
38,368 38 ,453
97
Pearson Chi-Square
Likelihood Ratio
N of Valid Cases
Value dfAsymp. Sig.
(2-sided)
57 cells (95,0%) have expected count less than 5. Theminimum expected count is ,13.
a.
Symmetric Measures
,555 ,260
97
Contingency CoefficientNominal by Nominal
N of Valid Cases
Value Approx. Sig.
Not assuming the null hypothesis.a.
Using the asymptotic standard error assuming the null hypothesis.b.
kategori ANC * Diagnosis 3
Crosstab
0 0 1 0 0
,0% ,0% 6,3% ,0% ,0%
,0% ,0% 100,0% ,0% ,0%
,0% ,0% 1,0% ,0% ,0%
0 0 0 0 0
,0% ,0% ,0% ,0% ,0% 7,7%
,0% ,0% ,0% ,0% ,0% 100,0%
,0% ,0% ,0% ,0% ,0% 1,0%
1 1 0 1 1
1,5% 1,5% ,0% 1,5% 1,5%
100,0% 100,0% ,0% 100,0% 100,0%
1,0% 1,0% ,0% 1,0% 1,0%
1 1 1 1 1
1,0% 1,0% 1,0% 1,0% 1,0% 1,0%
100,0% 100,0% 100,0% 100,0% 100,0% 100,0%
1,0% 1,0% 1,0% 1,0% 1,0% 1,0%
Count
% within kategori ANC
% within Diagnosis 3
% of Total
Count
% within kategori ANC
% within Diagnosis 3
% of Total
Count
% within kategori ANC
% within Diagnosis 3
% of Total
Count
% within kategori ANC
% within Diagnosis 3
% of Total
tidak ANC
ANC < 4
ANC >= 4
kategoriANC
Total
Gemelli Janin besar KPD Obesitas PEB PER
Diagnosis 3

VINA EKA WULANDARI [ G2AOO9193 ]
Chi-Square Tests
19,169a 18 ,381
15,514 18 ,626
97
Pearson Chi-Square
Likelihood Ratio
N of Valid Cases
Value dfAsymp. Sig.
(2-sided)
27 cells (90,0%) have expected count less than 5. Theminimum expected count is ,13.
a.
Symmetric Measures
,406 ,381
97
Contingency CoefficientNominal by Nominal
N of Valid Cases
Value Approx. Sig.
Not assuming the null hypothesis.a.
Using the asymptotic standard error assuming the null hypothesis.b.
kategori ANC * Diagnosis 4
Crosstab
0 1 15 16
,0% 6,3% 93,8% 100,0%
,0% 100,0% 15,8% 16,5%
,0% 1,0% 15,5% 16,5%
0 0 13 13
,0% ,0% 100,0% 100,0%
,0% ,0% 13,7% 13,4%
,0% ,0% 13,4% 13,4%
1 0 67 68
1,5% ,0% 98,5% 100,0%
100,0% ,0% 70,5% 70,1%
1,0% ,0% 69,1% 70,1%
1 1 95 97
1,0% 1,0% 97,9% 100,0%
100,0% 100,0% 100,0% 100,0%
1,0% 1,0% 97,9% 100,0%
Count
% within kategori ANC
% within Diagnosis 4
% of Total
Count
% within kategori ANC
% within Diagnosis 4
% of Total
Count
% within kategori ANC
% within Diagnosis 4
% of Total
Count
% within kategori ANC
% within Diagnosis 4
% of Total
tidak ANC
ANC < 4
ANC >= 4
kategoriANC
Total
Fetal distress Obesitas Tidak ada
Diagnosis 4
Total

VINA EKA WULANDARI [ G2AOO9193 ]
Chi-Square Tests
5,526a 4 ,237
4,352 4 ,360
97
Pearson Chi-Square
Likelihood Ratio
N of Valid Cases
Value dfAsymp. Sig.
(2-sided)
6 cells (66,7%) have expected count less than 5. Theminimum expected count is ,13.
a.
Symmetric Measures
,232 ,237
97
Contingency CoefficientNominal by Nominal
N of Valid Cases
Value Approx. Sig.
Not assuming the null hypothesis.a.
Using the asymptotic standard error assuming the null hypothesis.b.
TT * Diagnosis 1
0 0 0 1 1
,0% ,0% ,0% 5,9% 5,9% 23,5%
,0% ,0% ,0% 100,0% 100,0% 20,0%
,0% ,0% ,0% 1,0% 1,0% 4,1%
1 1 1 0 0
1,3% 1,3% 1,3% ,0% ,0% 20,0%
100,0% 100,0% 100,0% ,0% ,0% 80,0%
1,0% 1,0% 1,0% ,0% ,0% 16,5%
1 1 1 1 1
1,0% 1,0% 1,0% 1,0% 1,0% 20,6%
100,0% 100,0% 100,0% 100,0% 100,0% 100,0%
1,0% 1,0% 1,0% 1,0% 1,0% 20,6%
Count
% within TT
% within Diagnosis 1
% of Total
Count
% within TT
% within Diagnosis 1
% of Total
Count
% within TT
% within Diagnosis 1
% of Total
TT (-)
TT (+)
TT
Total
CPDEklamsia
berat
Hamil lewatbulan (
Serotinus) Hipertensi
Infeksi karenakeluar lendir
putih bau darivagina KPD
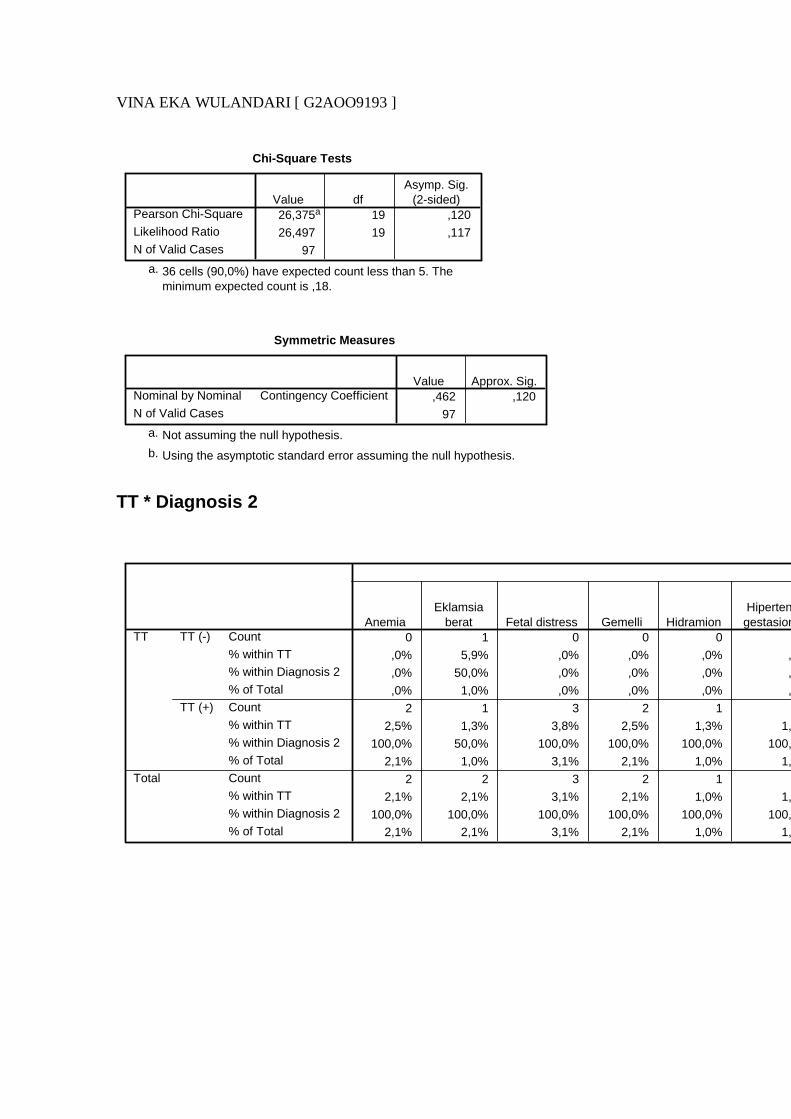
VINA EKA WULANDARI [ G2AOO9193 ]
Chi-Square Tests
26,375a 19 ,120
26,497 19 ,117
97
Pearson Chi-Square
Likelihood Ratio
N of Valid Cases
Value dfAsymp. Sig.
(2-sided)
36 cells (90,0%) have expected count less than 5. Theminimum expected count is ,18.
a.
Symmetric Measures
,462 ,120
97
Contingency CoefficientNominal by Nominal
N of Valid Cases
Value Approx. Sig.
Not assuming the null hypothesis.a.
Using the asymptotic standard error assuming the null hypothesis.b.
TT * Diagnosis 2
0 1 0 0 0
,0% 5,9% ,0% ,0% ,0% ,0%
,0% 50,0% ,0% ,0% ,0% ,0%
,0% 1,0% ,0% ,0% ,0% ,0%
2 1 3 2 1
2,5% 1,3% 3,8% 2,5% 1,3% 1,3%
100,0% 50,0% 100,0% 100,0% 100,0% 100,0%
2,1% 1,0% 3,1% 2,1% 1,0% 1,0%
2 2 3 2 1
2,1% 2,1% 3,1% 2,1% 1,0% 1,0%
100,0% 100,0% 100,0% 100,0% 100,0% 100,0%
2,1% 2,1% 3,1% 2,1% 1,0% 1,0%
Count
% within TT
% within Diagnosis 2
% of Total
Count
% within TT
% within Diagnosis 2
% of Total
Count
% within TT
% within Diagnosis 2
% of Total
TT (-)
TT (+)
TT
Total
AnemiaEklamsia
berat Fetal distress Gemelli HidramionHipertensigestasional
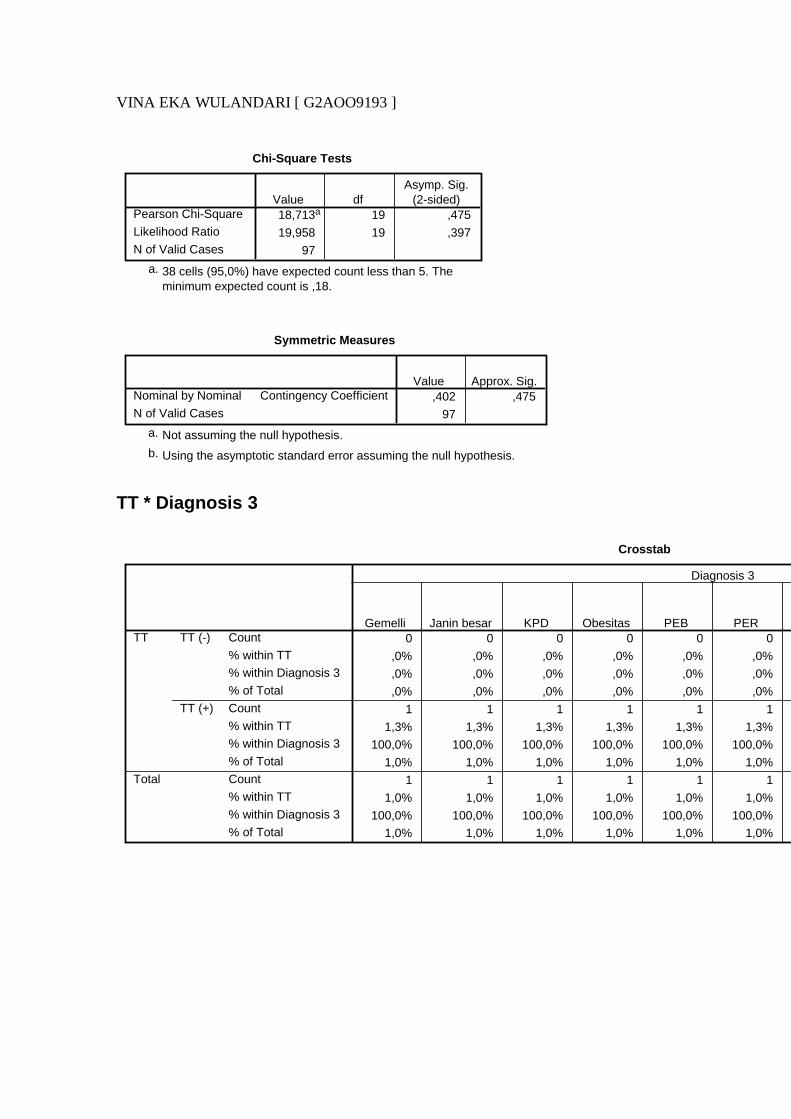
VINA EKA WULANDARI [ G2AOO9193 ]
Chi-Square Tests
18,713a 19 ,475
19,958 19 ,397
97
Pearson Chi-Square
Likelihood Ratio
N of Valid Cases
Value dfAsymp. Sig.
(2-sided)
38 cells (95,0%) have expected count less than 5. Theminimum expected count is ,18.
a.
Symmetric Measures
,402 ,475
97
Contingency CoefficientNominal by Nominal
N of Valid Cases
Value Approx. Sig.
Not assuming the null hypothesis.a.
Using the asymptotic standard error assuming the null hypothesis.b.
TT * Diagnosis 3
Crosstab
0 0 0 0 0 0
,0% ,0% ,0% ,0% ,0% ,0%
,0% ,0% ,0% ,0% ,0% ,0%
,0% ,0% ,0% ,0% ,0% ,0%
1 1 1 1 1 1
1,3% 1,3% 1,3% 1,3% 1,3% 1,3%
100,0% 100,0% 100,0% 100,0% 100,0% 100,0%
1,0% 1,0% 1,0% 1,0% 1,0% 1,0%
1 1 1 1 1 1
1,0% 1,0% 1,0% 1,0% 1,0% 1,0%
100,0% 100,0% 100,0% 100,0% 100,0% 100,0%
1,0% 1,0% 1,0% 1,0% 1,0% 1,0%
Count
% within TT
% within Diagnosis 3
% of Total
Count
% within TT
% within Diagnosis 3
% of Total
Count
% within TT
% within Diagnosis 3
% of Total
TT (-)
TT (+)
TT
Total
Gemelli Janin besar KPD Obesitas PEB PER
Diagnosis 3

VINA EKA WULANDARI [ G2AOO9193 ]
Chi-Square Tests
6,432a 9 ,696
6,592 9 ,680
97
Pearson Chi-Square
Likelihood Ratio
N of Valid Cases
Value dfAsymp. Sig.
(2-sided)
18 cells (90,0%) have expected count less than 5. Theminimum expected count is ,18.
a.
Symmetric Measures
,249 ,696
97
Contingency CoefficientNominal by Nominal
N of Valid Cases
Value Approx. Sig.
Not assuming the null hypothesis.a.
Using the asymptotic standard error assuming the null hypothesis.b.
TT * Diagnosis 4
Crosstab
0 0 17 17
,0% ,0% 100,0% 100,0%
,0% ,0% 17,9% 17,5%
,0% ,0% 17,5% 17,5%
1 1 78 80
1,3% 1,3% 97,5% 100,0%
100,0% 100,0% 82,1% 82,5%
1,0% 1,0% 80,4% 82,5%
1 1 95 97
1,0% 1,0% 97,9% 100,0%
100,0% 100,0% 100,0% 100,0%
1,0% 1,0% 97,9% 100,0%
Count
% within TT
% within Diagnosis 4
% of Total
Count
% within TT
% within Diagnosis 4
% of Total
Count
% within TT
% within Diagnosis 4
% of Total
TT (-)
TT (+)
TT
Total
Fetal distress Obesitas Tidak ada
Diagnosis 4
Total

VINA EKA WULANDARI [ G2AOO9193 ]
Chi-Square Tests
,434a 2 ,805
,780 2 ,677
97
Pearson Chi-Square
Likelihood Ratio
N of Valid Cases
Value dfAsymp. Sig.
(2-sided)
4 cells (66,7%) have expected count less than 5. Theminimum expected count is ,18.
a.
Symmetric Measures
,067 ,805
97
Contingency CoefficientNominal by Nominal
N of Valid Cases
Value Approx. Sig.
Not assuming the null hypothesis.a.
Using the asymptotic standard error assuming the null hypothesis.b.
kategori riwayat KB * Diagnosis 1
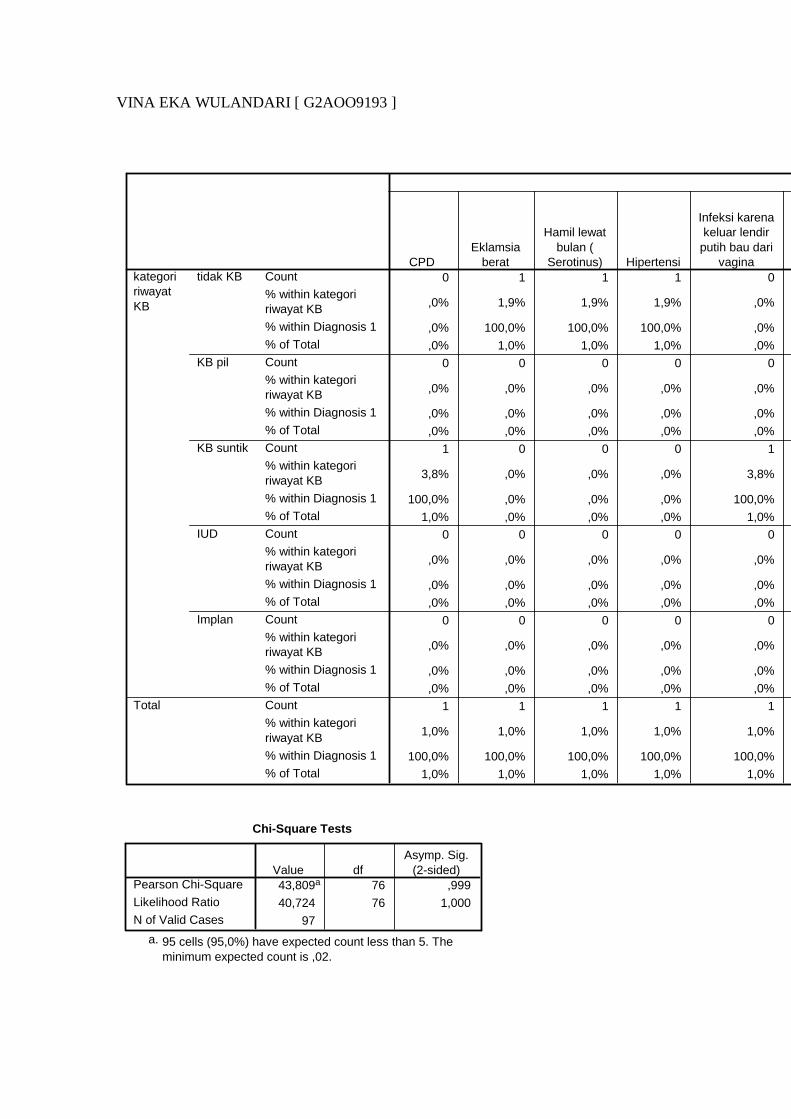
VINA EKA WULANDARI [ G2AOO9193 ]
0 1 1 1 0
,0% 1,9% 1,9% 1,9% ,0%
,0% 100,0% 100,0% 100,0% ,0%
,0% 1,0% 1,0% 1,0% ,0%
0 0 0 0 0
,0% ,0% ,0% ,0% ,0%
,0% ,0% ,0% ,0% ,0%
,0% ,0% ,0% ,0% ,0%
1 0 0 0 1
3,8% ,0% ,0% ,0% 3,8%
100,0% ,0% ,0% ,0% 100,0%
1,0% ,0% ,0% ,0% 1,0%
0 0 0 0 0
,0% ,0% ,0% ,0% ,0%
,0% ,0% ,0% ,0% ,0%
,0% ,0% ,0% ,0% ,0%
0 0 0 0 0
,0% ,0% ,0% ,0% ,0%
,0% ,0% ,0% ,0% ,0%
,0% ,0% ,0% ,0% ,0%
1 1 1 1 1
1,0% 1,0% 1,0% 1,0% 1,0%
100,0% 100,0% 100,0% 100,0% 100,0%
1,0% 1,0% 1,0% 1,0% 1,0%
Count
% within kategoririwayat KB
% within Diagnosis 1
% of Total
Count
% within kategoririwayat KB
% within Diagnosis 1
% of Total
Count
% within kategoririwayat KB
% within Diagnosis 1
% of Total
Count
% within kategoririwayat KB
% within Diagnosis 1
% of Total
Count
% within kategoririwayat KB
% within Diagnosis 1
% of Total
Count
% within kategoririwayat KB
% within Diagnosis 1
% of Total
tidak KB
KB pil
KB suntik
IUD
Implan
kategoririwayatKB
Total
CPDEklamsia
berat
Hamil lewatbulan (
Serotinus) Hipertensi
Infeksi karenakeluar lendir
putih bau darivagina
Chi-Square Tests
43,809a 76 ,999
40,724 76 1,000
97
Pearson Chi-Square
Likelihood Ratio
N of Valid Cases
Value dfAsymp. Sig.
(2-sided)
95 cells (95,0%) have expected count less than 5. Theminimum expected count is ,02.
a.

VINA EKA WULANDARI [ G2AOO9193 ]
Symmetric Measures
,558 ,999
97
Contingency CoefficientNominal by Nominal
N of Valid Cases
Value Approx. Sig.
Not assuming the null hypothesis.a.
Using the asymptotic standard error assuming the null hypothesis.b.
kategori riwayat KB * Diagnosis 2

VINA EKA WULANDARI [ G2AOO9193 ]
2 0 1 0 0
3,8% ,0% 1,9% ,0% ,0%
100,0% ,0% 33,3% ,0% ,0%
2,1% ,0% 1,0% ,0% ,0%
0 1 1 0 0
,0% 7,1% 7,1% ,0% ,0%
,0% 50,0% 33,3% ,0% ,0%
,0% 1,0% 1,0% ,0% ,0%
0 1 1 2 1
,0% 3,8% 3,8% 7,7% 3,8%
,0% 50,0% 33,3% 100,0% 100,0%
,0% 1,0% 1,0% 2,1% 1,0%
0 0 0 0 0
,0% ,0% ,0% ,0% ,0%
,0% ,0% ,0% ,0% ,0%
,0% ,0% ,0% ,0% ,0%
0 0 0 0 0
,0% ,0% ,0% ,0% ,0%
,0% ,0% ,0% ,0% ,0%
,0% ,0% ,0% ,0% ,0%
2 2 3 2 1
2,1% 2,1% 3,1% 2,1% 1,0%
100,0% 100,0% 100,0% 100,0% 100,0%
2,1% 2,1% 3,1% 2,1% 1,0%
Count
% within kategoririwayat KB
% within Diagnosis 2
% of Total
Count
% within kategoririwayat KB
% within Diagnosis 2
% of Total
Count
% within kategoririwayat KB
% within Diagnosis 2
% of Total
Count
% within kategoririwayat KB
% within Diagnosis 2
% of Total
Count
% within kategoririwayat KB
% within Diagnosis 2
% of Total
Count
% within kategoririwayat KB
% within Diagnosis 2
% of Total
tidak KB
KB pil
KB suntik
IUD
Implan
kategoririwayatKB
Total
AnemiaEklamsia
berat Fetal distress Gemelli HidramionHipertensigestasional
Chi-Square Tests
63,440a 76 ,848
54,584 76 ,970
97
Pearson Chi-Square
Likelihood Ratio
N of Valid Cases
Value dfAsymp. Sig.
(2-sided)
97 cells (97,0%) have expected count less than 5. Theminimum expected count is ,02.
a.

VINA EKA WULANDARI [ G2AOO9193 ]
Symmetric Measures
,629 ,848
97
Contingency CoefficientNominal by Nominal
N of Valid Cases
Value Approx. Sig.
Not assuming the null hypothesis.a.
Using the asymptotic standard error assuming the null hypothesis.b.
kategori riwayat KB * Diagnosis 3
Crosstab
0 1 0 1 1
,0% 1,9% ,0% 1,9% 1,9% 1,9%
,0% 100,0% ,0% 100,0% 100,0% 100,0%
,0% 1,0% ,0% 1,0% 1,0% 1,0%
0 0 1 0 0
,0% ,0% 7,1% ,0% ,0% ,0%
,0% ,0% 100,0% ,0% ,0% ,0%
,0% ,0% 1,0% ,0% ,0% ,0%
1 0 0 0 0
3,8% ,0% ,0% ,0% ,0% ,0%
100,0% ,0% ,0% ,0% ,0% ,0%
1,0% ,0% ,0% ,0% ,0% ,0%
0 0 0 0 0
,0% ,0% ,0% ,0% ,0% ,0%
,0% ,0% ,0% ,0% ,0% ,0%
,0% ,0% ,0% ,0% ,0% ,0%
0 0 0 0 0
,0% ,0% ,0% ,0% ,0% ,0%
,0% ,0% ,0% ,0% ,0% ,0%
,0% ,0% ,0% ,0% ,0% ,0%
1 1 1 1 1
1,0% 1,0% 1,0% 1,0% 1,0% 1,0%
100,0% 100,0% 100,0% 100,0% 100,0% 100,0%
1,0% 1,0% 1,0% 1,0% 1,0% 1,0%
Count
% within kategoririwayat KB
% within Diagnosis 3
% of Total
Count
% within kategoririwayat KB
% within Diagnosis 3
% of Total
Count
% within kategoririwayat KB
% within Diagnosis 3
% of Total
Count
% within kategoririwayat KB
% within Diagnosis 3
% of Total
Count
% within kategoririwayat KB
% within Diagnosis 3
% of Total
Count
% within kategoririwayat KB
% within Diagnosis 3
% of Total
tidak KB
KB pil
KB suntik
IUD
Implan
kategoririwayatKB
Total
Gemelli Janin besar KPD Obesitas PEB PER
Diagnosis 3

VINA EKA WULANDARI [ G2AOO9193 ]
Chi-Square Tests
18,518a 36 ,993
18,074 36 ,994
97
Pearson Chi-Square
Likelihood Ratio
N of Valid Cases
Value dfAsymp. Sig.
(2-sided)
47 cells (94,0%) have expected count less than 5. Theminimum expected count is ,02.
a.
Symmetric Measures
,400 ,993
97
Contingency CoefficientNominal by Nominal
N of Valid Cases
Value Approx. Sig.
Not assuming the null hypothesis.a.
Using the asymptotic standard error assuming the null hypothesis.b.
kategori riwayat KB * Diagnosis 4

VINA EKA WULANDARI [ G2AOO9193 ]
Crosstab
0 0 52 52
,0% ,0% 100,0% 100,0%
,0% ,0% 54,7% 53,6%
,0% ,0% 53,6% 53,6%
0 1 13 14
,0% 7,1% 92,9% 100,0%
,0% 100,0% 13,7% 14,4%
,0% 1,0% 13,4% 14,4%
1 0 25 26
3,8% ,0% 96,2% 100,0%
100,0% ,0% 26,3% 26,8%
1,0% ,0% 25,8% 26,8%
0 0 3 3
,0% ,0% 100,0% 100,0%
,0% ,0% 3,2% 3,1%
,0% ,0% 3,1% 3,1%
0 0 2 2
,0% ,0% 100,0% 100,0%
,0% ,0% 2,1% 2,1%
,0% ,0% 2,1% 2,1%
1 1 95 97
1,0% 1,0% 97,9% 100,0%
100,0% 100,0% 100,0% 100,0%
1,0% 1,0% 97,9% 100,0%
Count
% within kategoririwayat KB
% within Diagnosis 4
% of Total
Count
% within kategoririwayat KB
% within Diagnosis 4
% of Total
Count
% within kategoririwayat KB
% within Diagnosis 4
% of Total
Count
% within kategoririwayat KB
% within Diagnosis 4
% of Total
Count
% within kategoririwayat KB
% within Diagnosis 4
% of Total
Count
% within kategoririwayat KB
% within Diagnosis 4
% of Total
tidak KB
KB pil
KB suntik
IUD
Implan
kategoririwayatKB
Total
Fetal distress Obesitas Tidak ada
Diagnosis 4
Total
Chi-Square Tests
8,729a 8 ,366
6,575 8 ,583
97
Pearson Chi-Square
Likelihood Ratio
N of Valid Cases
Value dfAsymp. Sig.
(2-sided)
12 cells (80,0%) have expected count less than 5. Theminimum expected count is ,02.
a.

VINA EKA WULANDARI [ G2AOO9193 ]
Symmetric Measures
,287 ,366
97
Contingency CoefficientNominal by Nominal
N of Valid Cases
Value Approx. Sig.
Not assuming the null hypothesis.a.
Using the asymptotic standard error assuming the null hypothesis.b.
Riwayat penyakit * Diagnosis 1

VINA EKA WULANDARI [ G2AOO9193 ]
0 0 0 0
,0% ,0% ,0% ,0%
,0% ,0% ,0% ,0%
,0% ,0% ,0% ,0%
0 0 0 0
,0% ,0% ,0% ,0%
,0% ,0% ,0% ,0%
,0% ,0% ,0% ,0%
0 0 0 0
,0% ,0% ,0% ,0%
,0% ,0% ,0% ,0%
,0% ,0% ,0% ,0%
0 0 0 0
,0% ,0% ,0% ,0%
,0% ,0% ,0% ,0%
,0% ,0% ,0% ,0%
0 0 0 0
,0% ,0% ,0% ,0%
,0% ,0% ,0% ,0%
,0% ,0% ,0% ,0%
0 0 0 0
,0% ,0% ,0% ,0%
,0% ,0% ,0% ,0%
,0% ,0% ,0% ,0%
0 0 0 0
,0% ,0% ,0% ,0%
,0% ,0% ,0% ,0%
,0% ,0% ,0% ,0%
0 0 0 0
,0% ,0% ,0% ,0%
,0% ,0% ,0% ,0%
,0% ,0% ,0% ,0%
0 0 0 0
,0% ,0% ,0% ,0%
,0% ,0% ,0% ,0%
,0% ,0% ,0% ,0%
0 0 0 0
,0% ,0% ,0% ,0%
,0% ,0% ,0% ,0%
,0% ,0% ,0% ,0%
0 0 0 0
,0% ,0% ,0% ,0%
,0% ,0% ,0% ,0%
,0% ,0% ,0% ,0%
1 1 1 1
1,2% 1,2% 1,2% 1,2%
Count
% within Riwayat penyakit
% within Diagnosis 1
% of Total
Count
% within Riwayat penyakit
% within Diagnosis 1
% of Total
Count
% within Riwayat penyakit
% within Diagnosis 1
% of Total
Count
% within Riwayat penyakit
% within Diagnosis 1
% of Total
Count
% within Riwayat penyakit
% within Diagnosis 1
% of Total
Count
% within Riwayat penyakit
% within Diagnosis 1
% of Total
Count
% within Riwayat penyakit
% within Diagnosis 1
% of Total
Count
% within Riwayat penyakit
% within Diagnosis 1
% of Total
Count
% within Riwayat penyakit
% within Diagnosis 1
% of Total
Count
% within Riwayat penyakit
% within Diagnosis 1
% of Total
Count
% within Riwayat penyakit
% within Diagnosis 1
% of Total
Count
% within Riwayat penyakit
Asma
CPD
HBSAg(+)
Hema uteri
Hipertensi
Hipertensi kronis
Jantung
Jantung iskemik
Sinus aritmia
Suspek hipertiroid
TB paru
Tidak ada
Riwayatpenyakit
CPDEklamsia
berat
Hamil lewatbulan (
Serotinus) Hipertensi

VINA EKA WULANDARI [ G2AOO9193 ]
Chi-Square Tests
161,505a 209 ,994
55,910 209 1,000
97
Pearson Chi-Square
Likelihood Ratio
N of Valid Cases
Value dfAsymp. Sig.
(2-sided)
237 cells (98,8%) have expected count less than 5. Theminimum expected count is ,01.
a.
Symmetric Measures
,790 ,994
97
Contingency CoefficientNominal by Nominal
N of Valid Cases
Value Approx. Sig.
Not assuming the null hypothesis.a.
Using the asymptotic standard error assuming the null hypothesis.b.
Riwayat penyakit * Diagnosis 2
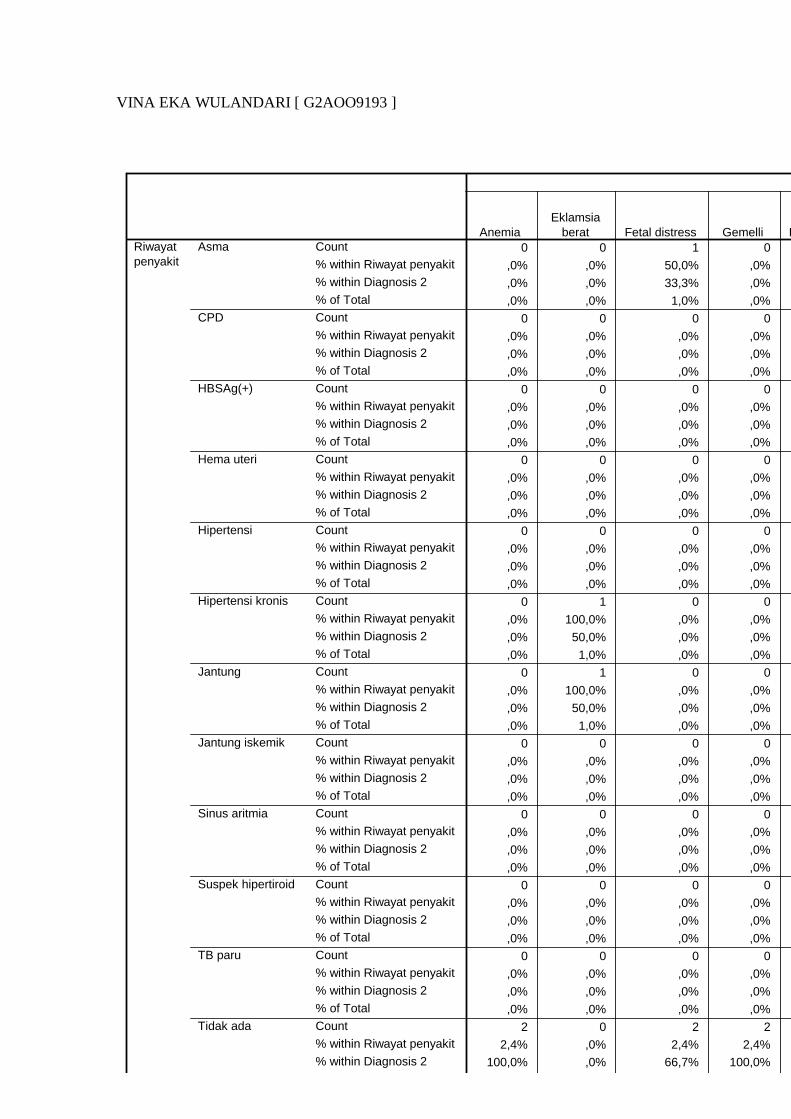
VINA EKA WULANDARI [ G2AOO9193 ]
0 0 1 0
,0% ,0% 50,0% ,0%
,0% ,0% 33,3% ,0%
,0% ,0% 1,0% ,0%
0 0 0 0
,0% ,0% ,0% ,0%
,0% ,0% ,0% ,0%
,0% ,0% ,0% ,0%
0 0 0 0
,0% ,0% ,0% ,0%
,0% ,0% ,0% ,0%
,0% ,0% ,0% ,0%
0 0 0 0
,0% ,0% ,0% ,0%
,0% ,0% ,0% ,0%
,0% ,0% ,0% ,0%
0 0 0 0
,0% ,0% ,0% ,0%
,0% ,0% ,0% ,0%
,0% ,0% ,0% ,0%
0 1 0 0
,0% 100,0% ,0% ,0%
,0% 50,0% ,0% ,0%
,0% 1,0% ,0% ,0%
0 1 0 0
,0% 100,0% ,0% ,0%
,0% 50,0% ,0% ,0%
,0% 1,0% ,0% ,0%
0 0 0 0
,0% ,0% ,0% ,0%
,0% ,0% ,0% ,0%
,0% ,0% ,0% ,0%
0 0 0 0
,0% ,0% ,0% ,0%
,0% ,0% ,0% ,0%
,0% ,0% ,0% ,0%
0 0 0 0
,0% ,0% ,0% ,0%
,0% ,0% ,0% ,0%
,0% ,0% ,0% ,0%
0 0 0 0
,0% ,0% ,0% ,0%
,0% ,0% ,0% ,0%
,0% ,0% ,0% ,0%
2 0 2 2
2,4% ,0% 2,4% 2,4%
100,0% ,0% 66,7% 100,0%
Count
% within Riwayat penyakit
% within Diagnosis 2
% of Total
Count
% within Riwayat penyakit
% within Diagnosis 2
% of Total
Count
% within Riwayat penyakit
% within Diagnosis 2
% of Total
Count
% within Riwayat penyakit
% within Diagnosis 2
% of Total
Count
% within Riwayat penyakit
% within Diagnosis 2
% of Total
Count
% within Riwayat penyakit
% within Diagnosis 2
% of Total
Count
% within Riwayat penyakit
% within Diagnosis 2
% of Total
Count
% within Riwayat penyakit
% within Diagnosis 2
% of Total
Count
% within Riwayat penyakit
% within Diagnosis 2
% of Total
Count
% within Riwayat penyakit
% within Diagnosis 2
% of Total
Count
% within Riwayat penyakit
% within Diagnosis 2
% of Total
Count
% within Riwayat penyakit
% within Diagnosis 2
Asma
CPD
HBSAg(+)
Hema uteri
Hipertensi
Hipertensi kronis
Jantung
Jantung iskemik
Sinus aritmia
Suspek hipertiroid
TB paru
Tidak ada
Riwayatpenyakit
AnemiaEklamsia
berat Fetal distress Gemelli Hidramion

VINA EKA WULANDARI [ G2AOO9193 ]
Chi-Square Tests
135,332a 209 1,000
37,772 209 1,000
97
Pearson Chi-Square
Likelihood Ratio
N of Valid Cases
Value dfAsymp. Sig.
(2-sided)
238 cells (99,2%) have expected count less than 5. Theminimum expected count is ,01.
a.
Symmetric Measures
,763 1,000
97
Contingency CoefficientNominal by Nominal
N of Valid Cases
Value Approx. Sig.
Not assuming the null hypothesis.a.
Using the asymptotic standard error assuming the null hypothesis.b.
Riwayat penyakit * Diagnosis 3

VINA EKA WULANDARI [ G2AOO9193 ]
Crosstab
0 0 0 0
,0% ,0% ,0% ,0% ,0%
,0% ,0% ,0% ,0% ,0%
,0% ,0% ,0% ,0% ,0%
0 0 0 0
,0% ,0% ,0% ,0% ,0%
,0% ,0% ,0% ,0% ,0%
,0% ,0% ,0% ,0% ,0%
0 0 0 0
,0% ,0% ,0% ,0% 100,0%
,0% ,0% ,0% ,0% 100,0%
,0% ,0% ,0% ,0% 1,0%
0 0 0 0
,0% ,0% ,0% ,0% ,0%
,0% ,0% ,0% ,0% ,0%
,0% ,0% ,0% ,0% ,0%
0 0 0 0
,0% ,0% ,0% ,0% ,0%
,0% ,0% ,0% ,0% ,0%
,0% ,0% ,0% ,0% ,0%
0 0 0 0
,0% ,0% ,0% ,0% ,0%
,0% ,0% ,0% ,0% ,0%
,0% ,0% ,0% ,0% ,0%
0 0 0 0
,0% ,0% ,0% ,0% ,0%
,0% ,0% ,0% ,0% ,0%
,0% ,0% ,0% ,0% ,0%
0 0 0 0
,0% ,0% ,0% ,0% ,0%
,0% ,0% ,0% ,0% ,0%
,0% ,0% ,0% ,0% ,0%
0 0 0 0
,0% ,0% ,0% ,0% ,0%
,0% ,0% ,0% ,0% ,0%
,0% ,0% ,0% ,0% ,0%
0 0 0 0
,0% ,0% ,0% ,0% ,0%
,0% ,0% ,0% ,0% ,0%
,0% ,0% ,0% ,0% ,0%
0 0 0 0
,0% ,0% ,0% ,0% ,0%
,0% ,0% ,0% ,0% ,0%
,0% ,0% ,0% ,0% ,0%
1 1 1 1
1,2% 1,2% 1,2% 1,2% ,0%
100,0% 100,0% 100,0% 100,0% ,0%
Count
% within Riwayat penyakit
% within Diagnosis 3
% of Total
Count
% within Riwayat penyakit
% within Diagnosis 3
% of Total
Count
% within Riwayat penyakit
% within Diagnosis 3
% of Total
Count
% within Riwayat penyakit
% within Diagnosis 3
% of Total
Count
% within Riwayat penyakit
% within Diagnosis 3
% of Total
Count
% within Riwayat penyakit
% within Diagnosis 3
% of Total
Count
% within Riwayat penyakit
% within Diagnosis 3
% of Total
Count
% within Riwayat penyakit
% within Diagnosis 3
% of Total
Count
% within Riwayat penyakit
% within Diagnosis 3
% of Total
Count
% within Riwayat penyakit
% within Diagnosis 3
% of Total
Count
% within Riwayat penyakit
% within Diagnosis 3
% of Total
Count
% within Riwayat penyakit
% within Diagnosis 3
Asma
CPD
HBSAg(+)
Hema uteri
Hipertensi
Hipertensi kronis
Jantung
Jantung iskemik
Sinus aritmia
Suspek hipertiroid
TB paru
Tidak ada
Riwayatpenyakit
Gemelli Janin besar KPD Obesitas PEB

VINA EKA WULANDARI [ G2AOO9193 ]
Chi-Square Tests
98,141a 99 ,505
13,178 99 1,000
97
Pearson Chi-Square
Likelihood Ratio
N of Valid Cases
Value dfAsymp. Sig.
(2-sided)
119 cells (99,2%) have expected count less than 5. Theminimum expected count is ,01.
a.
Symmetric Measures
,709 ,505
97
Contingency CoefficientNominal by Nominal
N of Valid Cases
Value Approx. Sig.
Not assuming the null hypothesis.a.
Using the asymptotic standard error assuming the null hypothesis.b.
Riwayat penyakit * Diagnosis 4

VINA EKA WULANDARI [ G2AOO9193 ]
Crosstab
0 0 2 2
,0% ,0% 100,0% 100,0%
,0% ,0% 2,1% 2,1%
,0% ,0% 2,1% 2,1%
0 0 1 1
,0% ,0% 100,0% 100,0%
,0% ,0% 1,1% 1,0%
,0% ,0% 1,0% 1,0%
0 0 1 1
,0% ,0% 100,0% 100,0%
,0% ,0% 1,1% 1,0%
,0% ,0% 1,0% 1,0%
0 0 1 1
,0% ,0% 100,0% 100,0%
,0% ,0% 1,1% 1,0%
,0% ,0% 1,0% 1,0%
0 0 1 1
,0% ,0% 100,0% 100,0%
,0% ,0% 1,1% 1,0%
,0% ,0% 1,0% 1,0%
0 0 1 1
,0% ,0% 100,0% 100,0%
,0% ,0% 1,1% 1,0%
,0% ,0% 1,0% 1,0%
0 0 1 1
,0% ,0% 100,0% 100,0%
,0% ,0% 1,1% 1,0%
,0% ,0% 1,0% 1,0%
0 0 1 1
,0% ,0% 100,0% 100,0%
,0% ,0% 1,1% 1,0%
,0% ,0% 1,0% 1,0%
0 0 1 1
,0% ,0% 100,0% 100,0%
,0% ,0% 1,1% 1,0%
,0% ,0% 1,0% 1,0%
0 0 1 1
,0% ,0% 100,0% 100,0%
,0% ,0% 1,1% 1,0%
,0% ,0% 1,0% 1,0%
0 0 1 1
,0% ,0% 100,0% 100,0%
,0% ,0% 1,1% 1,0%
,0% ,0% 1,0% 1,0%
1 1 83 85
1,2% 1,2% 97,6% 100,0%
100,0% 100,0% 87,4% 87,6%
1,0% 1,0% 85,6% 87,6%
1 1 95 97
Count
% within Riwayat penyakit
% within Diagnosis 4
% of Total
Count
% within Riwayat penyakit
% within Diagnosis 4
% of Total
Count
% within Riwayat penyakit
% within Diagnosis 4
% of Total
Count
% within Riwayat penyakit
% within Diagnosis 4
% of Total
Count
% within Riwayat penyakit
% within Diagnosis 4
% of Total
Count
% within Riwayat penyakit
% within Diagnosis 4
% of Total
Count
% within Riwayat penyakit
% within Diagnosis 4
% of Total
Count
% within Riwayat penyakit
% within Diagnosis 4
% of Total
Count
% within Riwayat penyakit
% within Diagnosis 4
% of Total
Count
% within Riwayat penyakit
% within Diagnosis 4
% of Total
Count
% within Riwayat penyakit
% within Diagnosis 4
% of Total
Count
% within Riwayat penyakit
% within Diagnosis 4
% of Total
Count
Asma
CPD
HBSAg(+)
Hema uteri
Hipertensi
Hipertensi kronis
Jantung
Jantung iskemik
Sinus aritmia
Suspek hipertiroid
TB paru
Tidak ada
Riwayatpenyakit
Total
Fetal distress Obesitas Tidak ada
Diagnosis 4
Total

VINA EKA WULANDARI [ G2AOO9193 ]
Chi-Square Tests
,288a 22 1,000
,534 22 1,000
97
Pearson Chi-Square
Likelihood Ratio
N of Valid Cases
Value dfAsymp. Sig.
(2-sided)
35 cells (97,2%) have expected count less than 5. Theminimum expected count is ,01.
a.
Symmetric Measures
,054 1,000
97
Contingency CoefficientNominal by Nominal
N of Valid Cases
Value Approx. Sig.
Not assuming the null hypothesis.a.
Using the asymptotic standard error assuming the null hypothesis.b.
Kategori tekanan darah * Diagnosis 1

VINA EKA WULANDARI [ G2AOO9193 ]
0 0 0 0 0
,0% ,0% ,0% ,0% ,0%
,0% ,0% ,0% ,0% ,0%
,0% ,0% ,0% ,0% ,0%
1 0 1 0 1
2,1% ,0% 2,1% ,0% 2,1%
100,0% ,0% 100,0% ,0% 100,0%
1,0% ,0% 1,0% ,0% 1,0%
0 1 0 1 0
,0% 2,2% ,0% 2,2% ,0%
,0% 100,0% ,0% 100,0% ,0%
,0% 1,0% ,0% 1,0% ,0%
1 1 1 1 1
1,0% 1,0% 1,0% 1,0% 1,0%
100,0% 100,0% 100,0% 100,0% 100,0%
1,0% 1,0% 1,0% 1,0% 1,0%
Count
% within Kategoritekanan darah
% within Diagnosis 1
% of Total
Count
% within Kategoritekanan darah
% within Diagnosis 1
% of Total
Count
% within Kategoritekanan darah
% within Diagnosis 1
% of Total
Count
% within Kategoritekanan darah
% within Diagnosis 1
% of Total
rendah
normal
tinggi
Kategoritekanandarah
Total
CPDEklamsia
berat
Hamil lewatbulan (
Serotinus) Hipertensi
Infeksi karenakeluar lendir
putih bau darivagina
Chi-Square Tests
45,086a 38 ,200
48,342 38 ,121
97
Pearson Chi-Square
Likelihood Ratio
N of Valid Cases
Value dfAsymp. Sig.
(2-sided)
56 cells (93,3%) have expected count less than 5. Theminimum expected count is ,04.
a.
Symmetric Measures
,563 ,200
97
Contingency CoefficientNominal by Nominal
N of Valid Cases
Value Approx. Sig.
Not assuming the null hypothesis.a.
Using the asymptotic standard error assuming the null hypothesis.b.
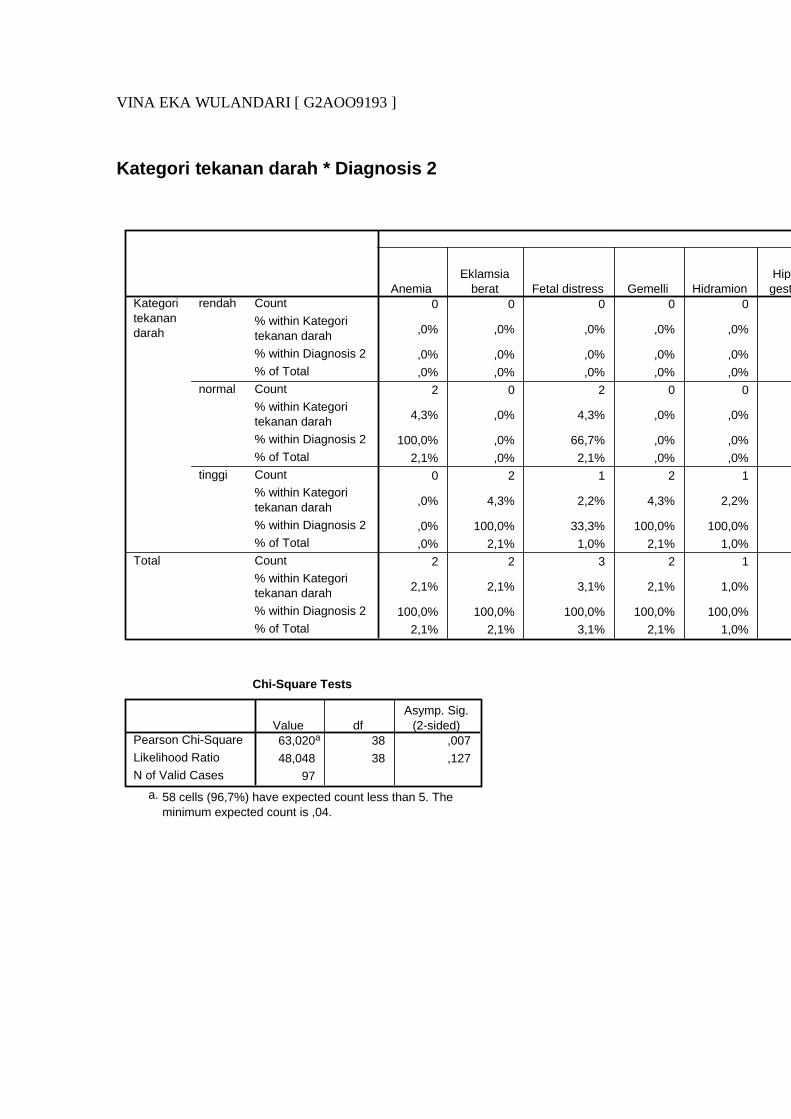
VINA EKA WULANDARI [ G2AOO9193 ]
Kategori tekanan darah * Diagnosis 2
0 0 0 0 0
,0% ,0% ,0% ,0% ,0%
,0% ,0% ,0% ,0% ,0%
,0% ,0% ,0% ,0% ,0%
2 0 2 0 0
4,3% ,0% 4,3% ,0% ,0%
100,0% ,0% 66,7% ,0% ,0%
2,1% ,0% 2,1% ,0% ,0%
0 2 1 2 1
,0% 4,3% 2,2% 4,3% 2,2%
,0% 100,0% 33,3% 100,0% 100,0%
,0% 2,1% 1,0% 2,1% 1,0%
2 2 3 2 1
2,1% 2,1% 3,1% 2,1% 1,0%
100,0% 100,0% 100,0% 100,0% 100,0%
2,1% 2,1% 3,1% 2,1% 1,0%
Count
% within Kategoritekanan darah
% within Diagnosis 2
% of Total
Count
% within Kategoritekanan darah
% within Diagnosis 2
% of Total
Count
% within Kategoritekanan darah
% within Diagnosis 2
% of Total
Count
% within Kategoritekanan darah
% within Diagnosis 2
% of Total
rendah
normal
tinggi
Kategoritekanandarah
Total
AnemiaEklamsia
berat Fetal distress Gemelli HidramionHipertensigestasional
Chi-Square Tests
63,020a 38 ,007
48,048 38 ,127
97
Pearson Chi-Square
Likelihood Ratio
N of Valid Cases
Value dfAsymp. Sig.
(2-sided)
58 cells (96,7%) have expected count less than 5. Theminimum expected count is ,04.
a.
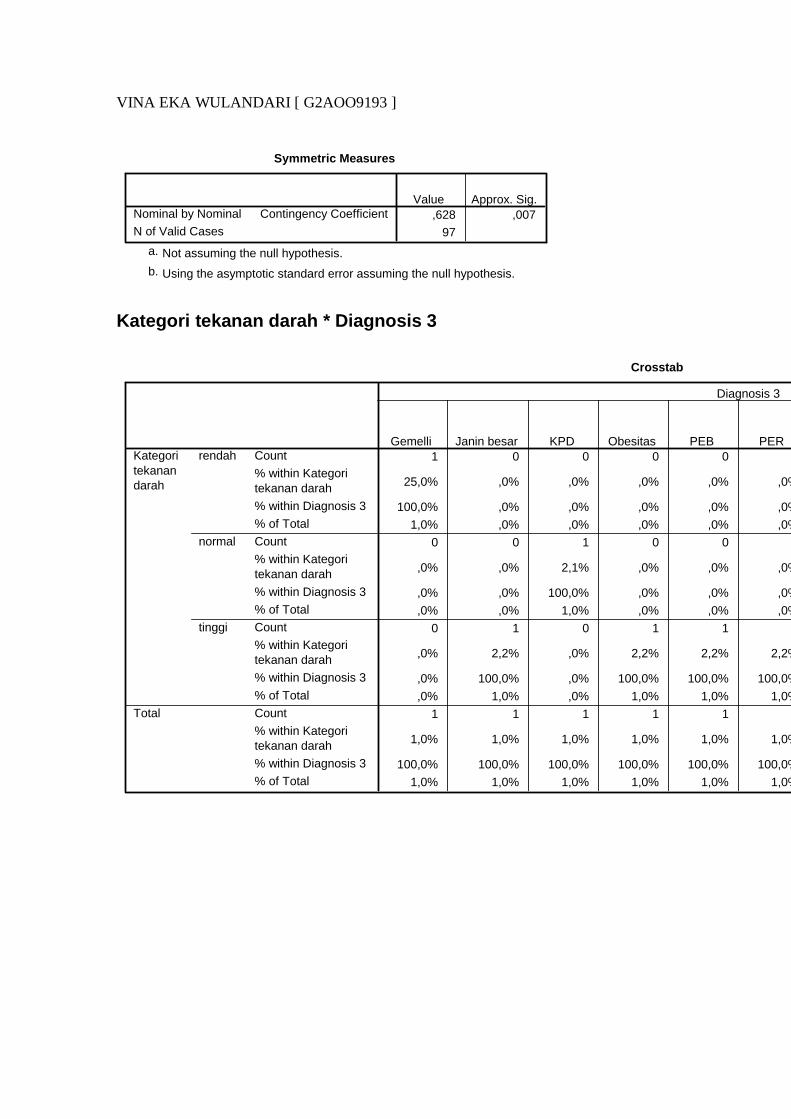
VINA EKA WULANDARI [ G2AOO9193 ]
Symmetric Measures
,628 ,007
97
Contingency CoefficientNominal by Nominal
N of Valid Cases
Value Approx. Sig.
Not assuming the null hypothesis.a.
Using the asymptotic standard error assuming the null hypothesis.b.
Kategori tekanan darah * Diagnosis 3
Crosstab
1 0 0 0 0
25,0% ,0% ,0% ,0% ,0% ,0%
100,0% ,0% ,0% ,0% ,0% ,0%
1,0% ,0% ,0% ,0% ,0% ,0%
0 0 1 0 0
,0% ,0% 2,1% ,0% ,0% ,0%
,0% ,0% 100,0% ,0% ,0% ,0%
,0% ,0% 1,0% ,0% ,0% ,0%
0 1 0 1 1
,0% 2,2% ,0% 2,2% 2,2% 2,2%
,0% 100,0% ,0% 100,0% 100,0% 100,0%
,0% 1,0% ,0% 1,0% 1,0% 1,0%
1 1 1 1 1
1,0% 1,0% 1,0% 1,0% 1,0% 1,0%
100,0% 100,0% 100,0% 100,0% 100,0% 100,0%
1,0% 1,0% 1,0% 1,0% 1,0% 1,0%
Count
% within Kategoritekanan darah
% within Diagnosis 3
% of Total
Count
% within Kategoritekanan darah
% within Diagnosis 3
% of Total
Count
% within Kategoritekanan darah
% within Diagnosis 3
% of Total
Count
% within Kategoritekanan darah
% within Diagnosis 3
% of Total
rendah
normal
tinggi
Kategoritekanandarah
Total
Gemelli Janin besar KPD Obesitas PEB PER
Diagnosis 3
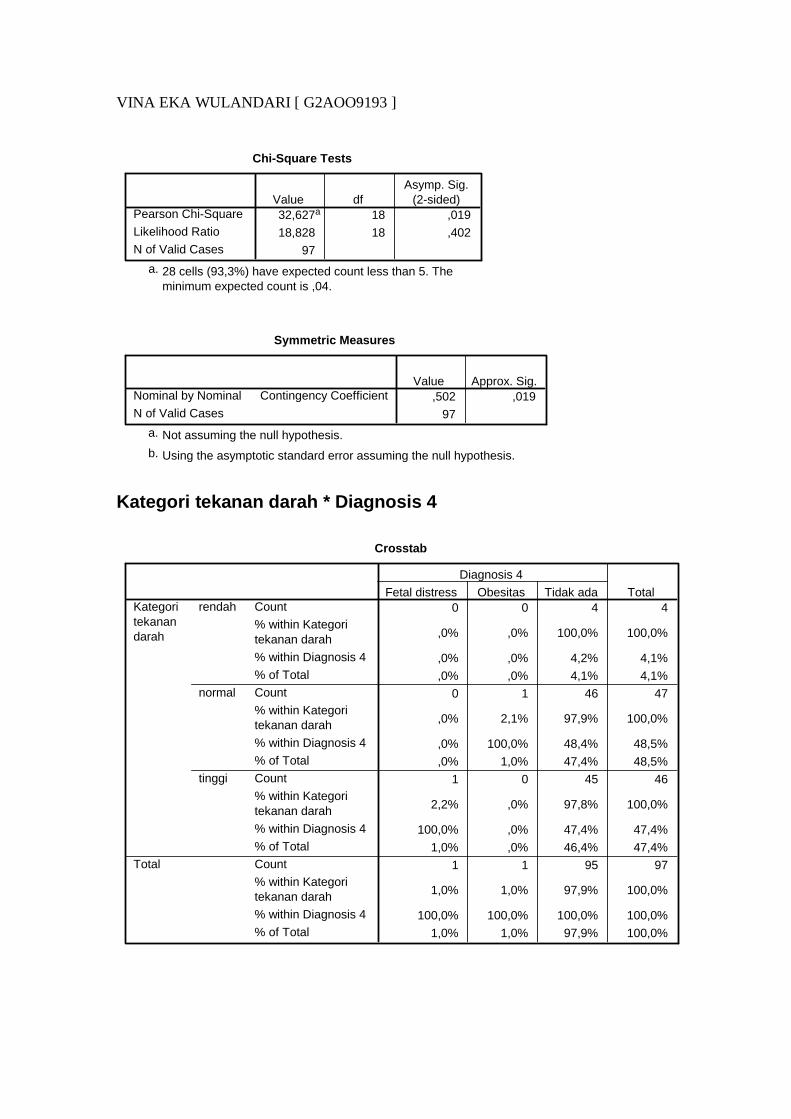
VINA EKA WULANDARI [ G2AOO9193 ]
Chi-Square Tests
32,627a 18 ,019
18,828 18 ,402
97
Pearson Chi-Square
Likelihood Ratio
N of Valid Cases
Value dfAsymp. Sig.
(2-sided)
28 cells (93,3%) have expected count less than 5. Theminimum expected count is ,04.
a.
Symmetric Measures
,502 ,019
97
Contingency CoefficientNominal by Nominal
N of Valid Cases
Value Approx. Sig.
Not assuming the null hypothesis.a.
Using the asymptotic standard error assuming the null hypothesis.b.
Kategori tekanan darah * Diagnosis 4
Crosstab
0 0 4 4
,0% ,0% 100,0% 100,0%
,0% ,0% 4,2% 4,1%
,0% ,0% 4,1% 4,1%
0 1 46 47
,0% 2,1% 97,9% 100,0%
,0% 100,0% 48,4% 48,5%
,0% 1,0% 47,4% 48,5%
1 0 45 46
2,2% ,0% 97,8% 100,0%
100,0% ,0% 47,4% 47,4%
1,0% ,0% 46,4% 47,4%
1 1 95 97
1,0% 1,0% 97,9% 100,0%
100,0% 100,0% 100,0% 100,0%
1,0% 1,0% 97,9% 100,0%
Count
% within Kategoritekanan darah
% within Diagnosis 4
% of Total
Count
% within Kategoritekanan darah
% within Diagnosis 4
% of Total
Count
% within Kategoritekanan darah
% within Diagnosis 4
% of Total
Count
% within Kategoritekanan darah
% within Diagnosis 4
% of Total
rendah
normal
tinggi
Kategoritekanandarah
Total
Fetal distress Obesitas Tidak ada
Diagnosis 4
Total

VINA EKA WULANDARI [ G2AOO9193 ]
Chi-Square Tests
2,174a 4 ,704
2,943 4 ,567
97
Pearson Chi-Square
Likelihood Ratio
N of Valid Cases
Value dfAsymp. Sig.
(2-sided)
7 cells (77,8%) have expected count less than 5. Theminimum expected count is ,04.
a.
Symmetric Measures
,148 ,704
97
Contingency CoefficientNominal by Nominal
N of Valid Cases
Value Approx. Sig.
Not assuming the null hypothesis.a.
Using the asymptotic standard error assuming the null hypothesis.b.
HR * Diagnosis 1
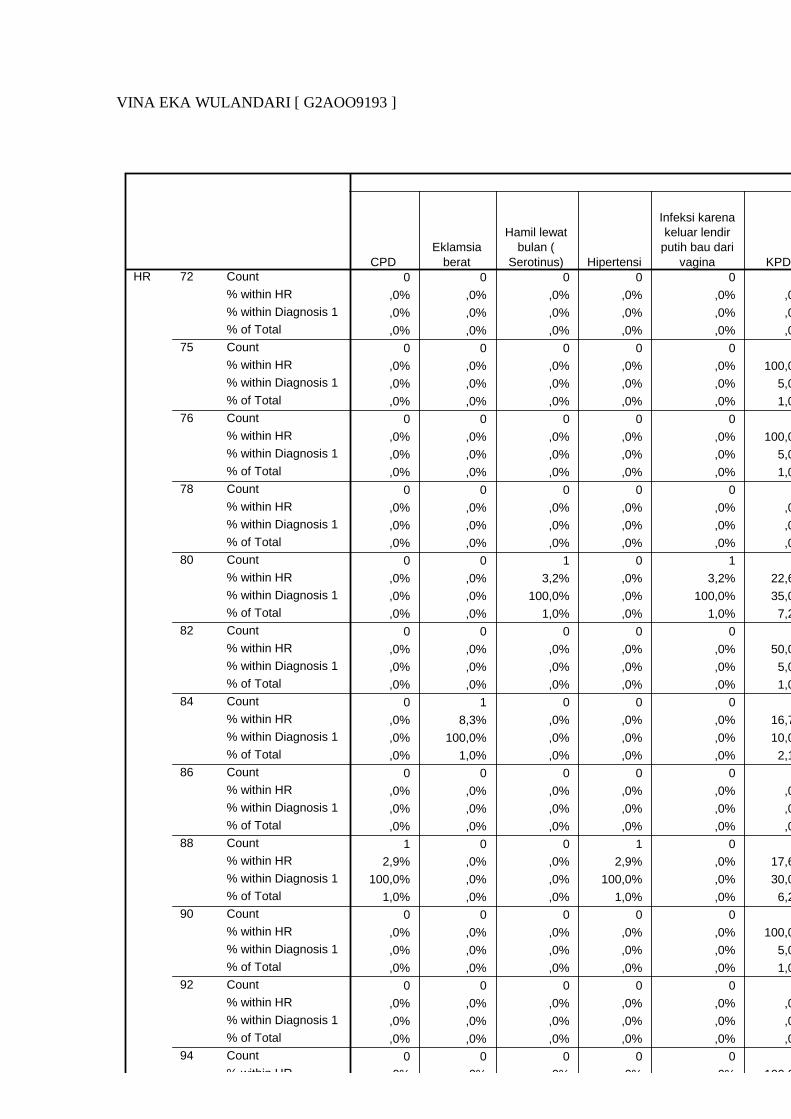
VINA EKA WULANDARI [ G2AOO9193 ]
0 0 0 0 0
,0% ,0% ,0% ,0% ,0% ,0%
,0% ,0% ,0% ,0% ,0% ,0%
,0% ,0% ,0% ,0% ,0% ,0%
0 0 0 0 0
,0% ,0% ,0% ,0% ,0% 100,0%
,0% ,0% ,0% ,0% ,0% 5,0%
,0% ,0% ,0% ,0% ,0% 1,0%
0 0 0 0 0
,0% ,0% ,0% ,0% ,0% 100,0%
,0% ,0% ,0% ,0% ,0% 5,0%
,0% ,0% ,0% ,0% ,0% 1,0%
0 0 0 0 0
,0% ,0% ,0% ,0% ,0% ,0%
,0% ,0% ,0% ,0% ,0% ,0%
,0% ,0% ,0% ,0% ,0% ,0%
0 0 1 0 1
,0% ,0% 3,2% ,0% 3,2% 22,6%
,0% ,0% 100,0% ,0% 100,0% 35,0%
,0% ,0% 1,0% ,0% 1,0% 7,2%
0 0 0 0 0
,0% ,0% ,0% ,0% ,0% 50,0%
,0% ,0% ,0% ,0% ,0% 5,0%
,0% ,0% ,0% ,0% ,0% 1,0%
0 1 0 0 0
,0% 8,3% ,0% ,0% ,0% 16,7%
,0% 100,0% ,0% ,0% ,0% 10,0%
,0% 1,0% ,0% ,0% ,0% 2,1%
0 0 0 0 0
,0% ,0% ,0% ,0% ,0% ,0%
,0% ,0% ,0% ,0% ,0% ,0%
,0% ,0% ,0% ,0% ,0% ,0%
1 0 0 1 0
2,9% ,0% ,0% 2,9% ,0% 17,6%
100,0% ,0% ,0% 100,0% ,0% 30,0%
1,0% ,0% ,0% 1,0% ,0% 6,2%
0 0 0 0 0
,0% ,0% ,0% ,0% ,0% 100,0%
,0% ,0% ,0% ,0% ,0% 5,0%
,0% ,0% ,0% ,0% ,0% 1,0%
0 0 0 0 0
,0% ,0% ,0% ,0% ,0% ,0%
,0% ,0% ,0% ,0% ,0% ,0%
,0% ,0% ,0% ,0% ,0% ,0%
0 0 0 0 0
,0% ,0% ,0% ,0% ,0% 100,0%
Count
% within HR
% within Diagnosis 1
% of Total
Count
% within HR
% within Diagnosis 1
% of Total
Count
% within HR
% within Diagnosis 1
% of Total
Count
% within HR
% within Diagnosis 1
% of Total
Count
% within HR
% within Diagnosis 1
% of Total
Count
% within HR
% within Diagnosis 1
% of Total
Count
% within HR
% within Diagnosis 1
% of Total
Count
% within HR
% within Diagnosis 1
% of Total
Count
% within HR
% within Diagnosis 1
% of Total
Count
% within HR
% within Diagnosis 1
% of Total
Count
% within HR
% within Diagnosis 1
% of Total
Count
% within HR
72
75
76
78
80
82
84
86
88
90
92
94
HRCPD
Eklamsiaberat
Hamil lewatbulan (
Serotinus) Hipertensi
Infeksi karenakeluar lendir
putih bau darivagina KPD

VINA EKA WULANDARI [ G2AOO9193 ]
Chi-Square Tests
198,243a 285 1,000
109,941 285 1,000
97
Pearson Chi-Square
Likelihood Ratio
N of Valid Cases
Value dfAsymp. Sig.
(2-sided)
316 cells (98,8%) have expected count less than 5. Theminimum expected count is ,01.
a.
Symmetric Measures
,819 1,000
97
Contingency CoefficientNominal by Nominal
N of Valid Cases
Value Approx. Sig.
Not assuming the null hypothesis.a.
Using the asymptotic standard error assuming the null hypothesis.b.
HR * Diagnosis 2

VINA EKA WULANDARI [ G2AOO9193 ]
0 1 0 0 0
,0% 33,3% ,0% ,0% ,0% ,0%
,0% 50,0% ,0% ,0% ,0% ,0%
,0% 1,0% ,0% ,0% ,0% ,0%
0 0 1 0 0
,0% ,0% 100,0% ,0% ,0% ,0%
,0% ,0% 33,3% ,0% ,0% ,0%
,0% ,0% 1,0% ,0% ,0% ,0%
0 0 0 0 0
,0% ,0% ,0% ,0% ,0% ,0%
,0% ,0% ,0% ,0% ,0% ,0%
,0% ,0% ,0% ,0% ,0% ,0%
0 0 0 0 0
,0% ,0% ,0% ,0% ,0% ,0%
,0% ,0% ,0% ,0% ,0% ,0%
,0% ,0% ,0% ,0% ,0% ,0%
0 0 1 1 0
,0% ,0% 3,2% 3,2% ,0% 3,2%
,0% ,0% 33,3% 50,0% ,0% 100,0%
,0% ,0% 1,0% 1,0% ,0% 1,0%
0 0 0 0 0
,0% ,0% ,0% ,0% ,0% ,0%
,0% ,0% ,0% ,0% ,0% ,0%
,0% ,0% ,0% ,0% ,0% ,0%
0 0 1 0 0
,0% ,0% 8,3% ,0% ,0% ,0%
,0% ,0% 33,3% ,0% ,0% ,0%
,0% ,0% 1,0% ,0% ,0% ,0%
0 0 0 0 0
,0% ,0% ,0% ,0% ,0% ,0%
,0% ,0% ,0% ,0% ,0% ,0%
,0% ,0% ,0% ,0% ,0% ,0%
2 1 0 1 0
5,9% 2,9% ,0% 2,9% ,0% ,0%
100,0% 50,0% ,0% 50,0% ,0% ,0%
2,1% 1,0% ,0% 1,0% ,0% ,0%
0 0 0 0 0
,0% ,0% ,0% ,0% ,0% ,0%
,0% ,0% ,0% ,0% ,0% ,0%
,0% ,0% ,0% ,0% ,0% ,0%
0 0 0 0 1
,0% ,0% ,0% ,0% 50,0% ,0%
,0% ,0% ,0% ,0% 100,0% ,0%
,0% ,0% ,0% ,0% 1,0% ,0%
0 0 0 0 0
,0% ,0% ,0% ,0% ,0% ,0%
,0% ,0% ,0% ,0% ,0% ,0%
Count
% within HR
% within Diagnosis 2
% of Total
Count
% within HR
% within Diagnosis 2
% of Total
Count
% within HR
% within Diagnosis 2
% of Total
Count
% within HR
% within Diagnosis 2
% of Total
Count
% within HR
% within Diagnosis 2
% of Total
Count
% within HR
% within Diagnosis 2
% of Total
Count
% within HR
% within Diagnosis 2
% of Total
Count
% within HR
% within Diagnosis 2
% of Total
Count
% within HR
% within Diagnosis 2
% of Total
Count
% within HR
% within Diagnosis 2
% of Total
Count
% within HR
% within Diagnosis 2
% of Total
Count
% within HR
% within Diagnosis 2
72
75
76
78
80
82
84
86
88
90
92
94
HRAnemia
Eklamsiaberat Fetal distress Gemelli Hidramion
Hipertensigestasional

VINA EKA WULANDARI [ G2AOO9193 ]
Chi-Square Tests
466,982a 285 ,000
116,468 285 1,000
97
Pearson Chi-Square
Likelihood Ratio
N of Valid Cases
Value dfAsymp. Sig.
(2-sided)
317 cells (99,1%) have expected count less than 5. Theminimum expected count is ,01.
a.
Symmetric Measures
,910 ,000
97
Contingency CoefficientNominal by Nominal
N of Valid Cases
Value Approx. Sig.
Not assuming the null hypothesis.a.
Using the asymptotic standard error assuming the null hypothesis.b.
HR * Diagnosis 3

VINA EKA WULANDARI [ G2AOO9193 ]
Crosstab
0 0 0 0 0 0
,0% ,0% ,0% ,0% ,0% ,0%
,0% ,0% ,0% ,0% ,0% ,0%
,0% ,0% ,0% ,0% ,0% ,0%
0 0 0 0 0 0
,0% ,0% ,0% ,0% ,0% ,0%
,0% ,0% ,0% ,0% ,0% ,0%
,0% ,0% ,0% ,0% ,0% ,0%
0 0 0 0 0 0
,0% ,0% ,0% ,0% ,0% ,0%
,0% ,0% ,0% ,0% ,0% ,0%
,0% ,0% ,0% ,0% ,0% ,0%
0 0 0 0 0 0
,0% ,0% ,0% ,0% ,0% ,0%
,0% ,0% ,0% ,0% ,0% ,0%
,0% ,0% ,0% ,0% ,0% ,0%
1 0 1 1 0 0
3,2% ,0% 3,2% 3,2% ,0% ,0%
100,0% ,0% 100,0% 100,0% ,0% ,0%
1,0% ,0% 1,0% 1,0% ,0% ,0%
0 0 0 0 0 0
,0% ,0% ,0% ,0% ,0% ,0%
,0% ,0% ,0% ,0% ,0% ,0%
,0% ,0% ,0% ,0% ,0% ,0%
0 0 0 0 0 0
,0% ,0% ,0% ,0% ,0% ,0%
,0% ,0% ,0% ,0% ,0% ,0%
,0% ,0% ,0% ,0% ,0% ,0%
0 0 0 0 0 0
,0% ,0% ,0% ,0% ,0% ,0%
,0% ,0% ,0% ,0% ,0% ,0%
,0% ,0% ,0% ,0% ,0% ,0%
0 0 0 0 0 1
,0% ,0% ,0% ,0% ,0% 2,9%
,0% ,0% ,0% ,0% ,0% 100,0%
,0% ,0% ,0% ,0% ,0% 1,0%
0 0 0 0 1 0
,0% ,0% ,0% ,0% 100,0% ,0%
,0% ,0% ,0% ,0% 100,0% ,0%
,0% ,0% ,0% ,0% 1,0% ,0%
0 0 0 0 0 0
,0% ,0% ,0% ,0% ,0% ,0%
,0% ,0% ,0% ,0% ,0% ,0%
,0% ,0% ,0% ,0% ,0% ,0%
0 1 0 0 0 0
,0% 100,0% ,0% ,0% ,0% ,0%
,0% 100,0% ,0% ,0% ,0% ,0%
Count
% within HR
% within Diagnosis 3
% of Total
Count
% within HR
% within Diagnosis 3
% of Total
Count
% within HR
% within Diagnosis 3
% of Total
Count
% within HR
% within Diagnosis 3
% of Total
Count
% within HR
% within Diagnosis 3
% of Total
Count
% within HR
% within Diagnosis 3
% of Total
Count
% within HR
% within Diagnosis 3
% of Total
Count
% within HR
% within Diagnosis 3
% of Total
Count
% within HR
% within Diagnosis 3
% of Total
Count
% within HR
% within Diagnosis 3
% of Total
Count
% within HR
% within Diagnosis 3
% of Total
Count
% within HR
% within Diagnosis 3
72
75
76
78
80
82
84
86
88
90
92
94
HRGemelli Janin besar KPD Obesitas PEB PER
Diagnosis 3

VINA EKA WULANDARI [ G2AOO9193 ]
Chi-Square Tests
213,017a 135 ,000
39,410 135 1,000
97
Pearson Chi-Square
Likelihood Ratio
N of Valid Cases
Value dfAsymp. Sig.
(2-sided)
157 cells (98,1%) have expected count less than 5. Theminimum expected count is ,01.
a.
Symmetric Measures
,829 ,000
97
Contingency CoefficientNominal by Nominal
N of Valid Cases
Value Approx. Sig.
Not assuming the null hypothesis.a.
Using the asymptotic standard error assuming the null hypothesis.b.
HR * Diagnosis 4

VINA EKA WULANDARI [ G2AOO9193 ]
Crosstab
0 0 3 3
,0% ,0% 100,0% 100,0%
,0% ,0% 3,2% 3,1%
,0% ,0% 3,1% 3,1%
0 0 1 1
,0% ,0% 100,0% 100,0%
,0% ,0% 1,1% 1,0%
,0% ,0% 1,0% 1,0%
0 0 1 1
,0% ,0% 100,0% 100,0%
,0% ,0% 1,1% 1,0%
,0% ,0% 1,0% 1,0%
0 0 3 3
,0% ,0% 100,0% 100,0%
,0% ,0% 3,2% 3,1%
,0% ,0% 3,1% 3,1%
0 1 30 31
,0% 3,2% 96,8% 100,0%
,0% 100,0% 31,6% 32,0%
,0% 1,0% 30,9% 32,0%
0 0 2 2
,0% ,0% 100,0% 100,0%
,0% ,0% 2,1% 2,1%
,0% ,0% 2,1% 2,1%
1 0 11 12
8,3% ,0% 91,7% 100,0%
100,0% ,0% 11,6% 12,4%
1,0% ,0% 11,3% 12,4%
0 0 1 1
,0% ,0% 100,0% 100,0%
,0% ,0% 1,1% 1,0%
,0% ,0% 1,0% 1,0%
0 0 34 34
,0% ,0% 100,0% 100,0%
,0% ,0% 35,8% 35,1%
,0% ,0% 35,1% 35,1%
0 0 1 1
,0% ,0% 100,0% 100,0%
,0% ,0% 1,1% 1,0%
,0% ,0% 1,0% 1,0%
0 0 2 2
,0% ,0% 100,0% 100,0%
,0% ,0% 2,1% 2,1%
,0% ,0% 2,1% 2,1%
0 0 1 1
,0% ,0% 100,0% 100,0%
,0% ,0% 1,1% 1,0%
,0% ,0% 1,0% 1,0%
0 0 2 2
Count
% within HR
% within Diagnosis 4
% of Total
Count
% within HR
% within Diagnosis 4
% of Total
Count
% within HR
% within Diagnosis 4
% of Total
Count
% within HR
% within Diagnosis 4
% of Total
Count
% within HR
% within Diagnosis 4
% of Total
Count
% within HR
% within Diagnosis 4
% of Total
Count
% within HR
% within Diagnosis 4
% of Total
Count
% within HR
% within Diagnosis 4
% of Total
Count
% within HR
% within Diagnosis 4
% of Total
Count
% within HR
% within Diagnosis 4
% of Total
Count
% within HR
% within Diagnosis 4
% of Total
Count
% within HR
% within Diagnosis 4
% of Total
Count
72
75
76
78
80
82
84
86
88
90
92
94
96
HRFetal distress Obesitas Tidak ada
Diagnosis 4
Total

VINA EKA WULANDARI [ G2AOO9193 ]
Chi-Square Tests
9,288a 30 1,000
6,538 30 1,000
97
Pearson Chi-Square
Likelihood Ratio
N of Valid Cases
Value dfAsymp. Sig.
(2-sided)
45 cells (93,8%) have expected count less than 5. Theminimum expected count is ,01.
a.
Symmetric Measures
,296 1,000
97
Contingency CoefficientNominal by Nominal
N of Valid Cases
Value Approx. Sig.
Not assuming the null hypothesis.a.
Using the asymptotic standard error assuming the null hypothesis.b.
RR * Diagnosis 1

VINA EKA WULANDARI [ G2AOO9193 ]
0 0 0 0 0
,0% ,0% ,0% ,0% ,0% 100,0%
,0% ,0% ,0% ,0% ,0% 5,0%
,0% ,0% ,0% ,0% ,0% 1,0%
0 0 0 0 0
,0% ,0% ,0% ,0% ,0% 100,0%
,0% ,0% ,0% ,0% ,0% 5,0%
,0% ,0% ,0% ,0% ,0% 1,0%
0 0 0 0 0
,0% ,0% ,0% ,0% ,0% ,0%
,0% ,0% ,0% ,0% ,0% ,0%
,0% ,0% ,0% ,0% ,0% ,0%
1 0 1 0 1
1,4% ,0% 1,4% ,0% 1,4% 18,6%
100,0% ,0% 100,0% ,0% 100,0% 65,0%
1,0% ,0% 1,0% ,0% 1,0% 13,4%
0 0 0 1 0
,0% ,0% ,0% 10,0% ,0% 20,0%
,0% ,0% ,0% 100,0% ,0% 10,0%
,0% ,0% ,0% 1,0% ,0% 2,1%
0 0 0 0 0
,0% ,0% ,0% ,0% ,0% 30,0%
,0% ,0% ,0% ,0% ,0% 15,0%
,0% ,0% ,0% ,0% ,0% 3,1%
0 1 0 0 0
,0% 100,0% ,0% ,0% ,0% ,0%
,0% 100,0% ,0% ,0% ,0% ,0%
,0% 1,0% ,0% ,0% ,0% ,0%
0 0 0 0 0
,0% ,0% ,0% ,0% ,0% ,0%
,0% ,0% ,0% ,0% ,0% ,0%
,0% ,0% ,0% ,0% ,0% ,0%
0 0 0 0 0
,0% ,0% ,0% ,0% ,0% ,0%
,0% ,0% ,0% ,0% ,0% ,0%
,0% ,0% ,0% ,0% ,0% ,0%
0 0 0 0 0
,0% ,0% ,0% ,0% ,0% ,0%
,0% ,0% ,0% ,0% ,0% ,0%
,0% ,0% ,0% ,0% ,0% ,0%
1 1 1 1 1
1,0% 1,0% 1,0% 1,0% 1,0% 20,6%
100,0% 100,0% 100,0% 100,0% 100,0% 100,0%
1,0% 1,0% 1,0% 1,0% 1,0% 20,6%
Count
% within RR
% within Diagnosis 1
% of Total
Count
% within RR
% within Diagnosis 1
% of Total
Count
% within RR
% within Diagnosis 1
% of Total
Count
% within RR
% within Diagnosis 1
% of Total
Count
% within RR
% within Diagnosis 1
% of Total
Count
% within RR
% within Diagnosis 1
% of Total
Count
% within RR
% within Diagnosis 1
% of Total
Count
% within RR
% within Diagnosis 1
% of Total
Count
% within RR
% within Diagnosis 1
% of Total
Count
% within RR
% within Diagnosis 1
% of Total
Count
% within RR
% within Diagnosis 1
% of Total
16
17
18
20
22
24
25
26
30
36
RR
Total
CPDEklamsia
berat
Hamil lewatbulan (
Serotinus) Hipertensi
Infeksi karenakeluar lendir
putih bau darivagina KPD

VINA EKA WULANDARI [ G2AOO9193 ]
Chi-Square Tests
177,703a 171 ,347
63,188 171 1,000
97
Pearson Chi-Square
Likelihood Ratio
N of Valid Cases
Value dfAsymp. Sig.
(2-sided)
197 cells (98,5%) have expected count less than 5. Theminimum expected count is ,01.
a.
Symmetric Measures
,804 ,347
97
Contingency CoefficientNominal by Nominal
N of Valid Cases
Value Approx. Sig.
Not assuming the null hypothesis.a.
Using the asymptotic standard error assuming the null hypothesis.b.
RR * Diagnosis 2

VINA EKA WULANDARI [ G2AOO9193 ]
0 0 0 0 0
,0% ,0% ,0% ,0% ,0% ,0%
,0% ,0% ,0% ,0% ,0% ,0%
,0% ,0% ,0% ,0% ,0% ,0%
0 0 1 0 0
,0% ,0% 100,0% ,0% ,0% ,0%
,0% ,0% 33,3% ,0% ,0% ,0%
,0% ,0% 1,0% ,0% ,0% ,0%
0 0 0 0 0
,0% ,0% ,0% ,0% ,0% ,0%
,0% ,0% ,0% ,0% ,0% ,0%
,0% ,0% ,0% ,0% ,0% ,0%
1 2 1 1 1
1,4% 2,9% 1,4% 1,4% 1,4% 1,4%
50,0% 100,0% 33,3% 50,0% 100,0% 100,0%
1,0% 2,1% 1,0% 1,0% 1,0% 1,0%
0 0 0 0 0
,0% ,0% ,0% ,0% ,0% ,0%
,0% ,0% ,0% ,0% ,0% ,0%
,0% ,0% ,0% ,0% ,0% ,0%
1 0 0 0 0
10,0% ,0% ,0% ,0% ,0% ,0%
50,0% ,0% ,0% ,0% ,0% ,0%
1,0% ,0% ,0% ,0% ,0% ,0%
0 0 1 0 0
,0% ,0% 100,0% ,0% ,0% ,0%
,0% ,0% 33,3% ,0% ,0% ,0%
,0% ,0% 1,0% ,0% ,0% ,0%
0 0 0 0 0
,0% ,0% ,0% ,0% ,0% ,0%
,0% ,0% ,0% ,0% ,0% ,0%
,0% ,0% ,0% ,0% ,0% ,0%
0 0 0 0 0
,0% ,0% ,0% ,0% ,0% ,0%
,0% ,0% ,0% ,0% ,0% ,0%
,0% ,0% ,0% ,0% ,0% ,0%
0 0 0 1 0
,0% ,0% ,0% 100,0% ,0% ,0%
,0% ,0% ,0% 50,0% ,0% ,0%
,0% ,0% ,0% 1,0% ,0% ,0%
2 2 3 2 1
2,1% 2,1% 3,1% 2,1% 1,0% 1,0%
100,0% 100,0% 100,0% 100,0% 100,0% 100,0%
2,1% 2,1% 3,1% 2,1% 1,0% 1,0%
Count
% within RR
% within Diagnosis 2
% of Total
Count
% within RR
% within Diagnosis 2
% of Total
Count
% within RR
% within Diagnosis 2
% of Total
Count
% within RR
% within Diagnosis 2
% of Total
Count
% within RR
% within Diagnosis 2
% of Total
Count
% within RR
% within Diagnosis 2
% of Total
Count
% within RR
% within Diagnosis 2
% of Total
Count
% within RR
% within Diagnosis 2
% of Total
Count
% within RR
% within Diagnosis 2
% of Total
Count
% within RR
% within Diagnosis 2
% of Total
Count
% within RR
% within Diagnosis 2
% of Total
16
17
18
20
22
24
25
26
30
36
RR
Total
AnemiaEklamsia
berat Fetal distress Gemelli HidramionHipertensigestasional

VINA EKA WULANDARI [ G2AOO9193 ]
Chi-Square Tests
264,325a 171 ,000
68,723 171 1,000
97
Pearson Chi-Square
Likelihood Ratio
N of Valid Cases
Value dfAsymp. Sig.
(2-sided)
197 cells (98,5%) have expected count less than 5. Theminimum expected count is ,01.
a.
Symmetric Measures
,855 ,000
97
Contingency CoefficientNominal by Nominal
N of Valid Cases
Value Approx. Sig.
Not assuming the null hypothesis.a.
Using the asymptotic standard error assuming the null hypothesis.b.
RR * Diagnosis 3
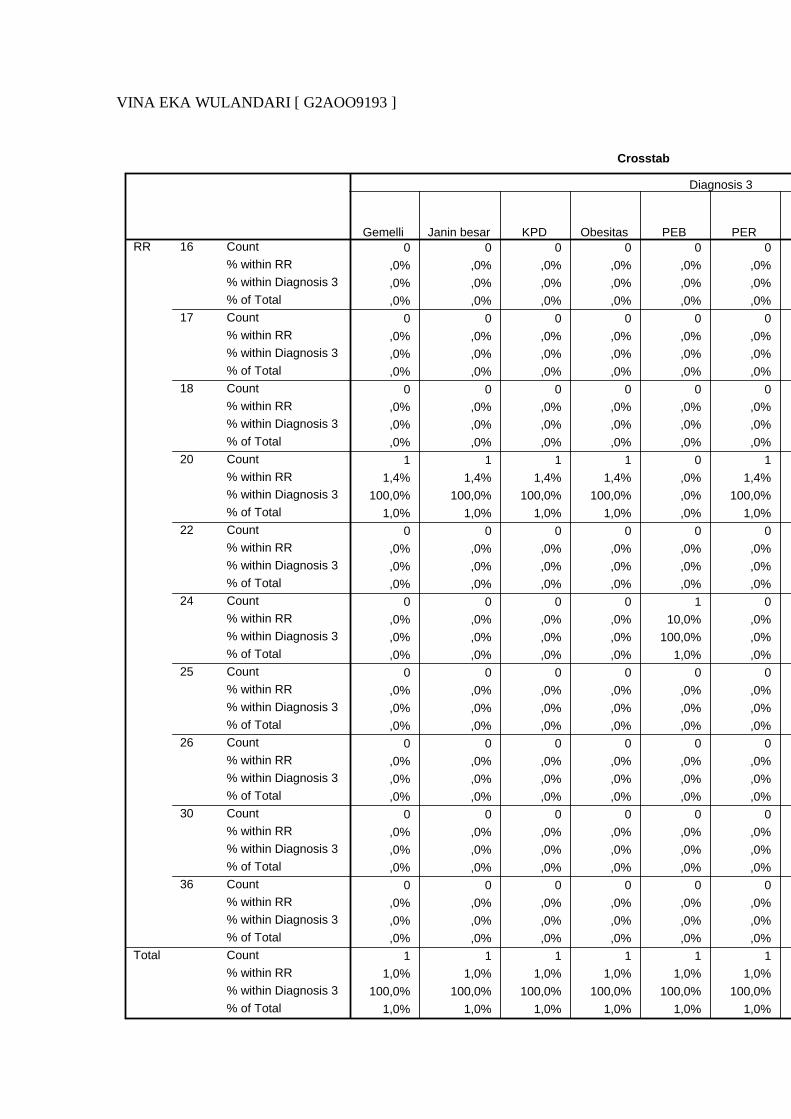
VINA EKA WULANDARI [ G2AOO9193 ]
Crosstab
0 0 0 0 0 0
,0% ,0% ,0% ,0% ,0% ,0%
,0% ,0% ,0% ,0% ,0% ,0%
,0% ,0% ,0% ,0% ,0% ,0%
0 0 0 0 0 0
,0% ,0% ,0% ,0% ,0% ,0%
,0% ,0% ,0% ,0% ,0% ,0%
,0% ,0% ,0% ,0% ,0% ,0%
0 0 0 0 0 0
,0% ,0% ,0% ,0% ,0% ,0%
,0% ,0% ,0% ,0% ,0% ,0%
,0% ,0% ,0% ,0% ,0% ,0%
1 1 1 1 0 1
1,4% 1,4% 1,4% 1,4% ,0% 1,4%
100,0% 100,0% 100,0% 100,0% ,0% 100,0%
1,0% 1,0% 1,0% 1,0% ,0% 1,0%
0 0 0 0 0 0
,0% ,0% ,0% ,0% ,0% ,0%
,0% ,0% ,0% ,0% ,0% ,0%
,0% ,0% ,0% ,0% ,0% ,0%
0 0 0 0 1 0
,0% ,0% ,0% ,0% 10,0% ,0%
,0% ,0% ,0% ,0% 100,0% ,0%
,0% ,0% ,0% ,0% 1,0% ,0%
0 0 0 0 0 0
,0% ,0% ,0% ,0% ,0% ,0%
,0% ,0% ,0% ,0% ,0% ,0%
,0% ,0% ,0% ,0% ,0% ,0%
0 0 0 0 0 0
,0% ,0% ,0% ,0% ,0% ,0%
,0% ,0% ,0% ,0% ,0% ,0%
,0% ,0% ,0% ,0% ,0% ,0%
0 0 0 0 0 0
,0% ,0% ,0% ,0% ,0% ,0%
,0% ,0% ,0% ,0% ,0% ,0%
,0% ,0% ,0% ,0% ,0% ,0%
0 0 0 0 0 0
,0% ,0% ,0% ,0% ,0% ,0%
,0% ,0% ,0% ,0% ,0% ,0%
,0% ,0% ,0% ,0% ,0% ,0%
1 1 1 1 1 1
1,0% 1,0% 1,0% 1,0% 1,0% 1,0%
100,0% 100,0% 100,0% 100,0% 100,0% 100,0%
1,0% 1,0% 1,0% 1,0% 1,0% 1,0%
Count
% within RR
% within Diagnosis 3
% of Total
Count
% within RR
% within Diagnosis 3
% of Total
Count
% within RR
% within Diagnosis 3
% of Total
Count
% within RR
% within Diagnosis 3
% of Total
Count
% within RR
% within Diagnosis 3
% of Total
Count
% within RR
% within Diagnosis 3
% of Total
Count
% within RR
% within Diagnosis 3
% of Total
Count
% within RR
% within Diagnosis 3
% of Total
Count
% within RR
% within Diagnosis 3
% of Total
Count
% within RR
% within Diagnosis 3
% of Total
Count
% within RR
% within Diagnosis 3
% of Total
16
17
18
20
22
24
25
26
30
36
RR
Total
Gemelli Janin besar KPD Obesitas PEB PER
Diagnosis 3
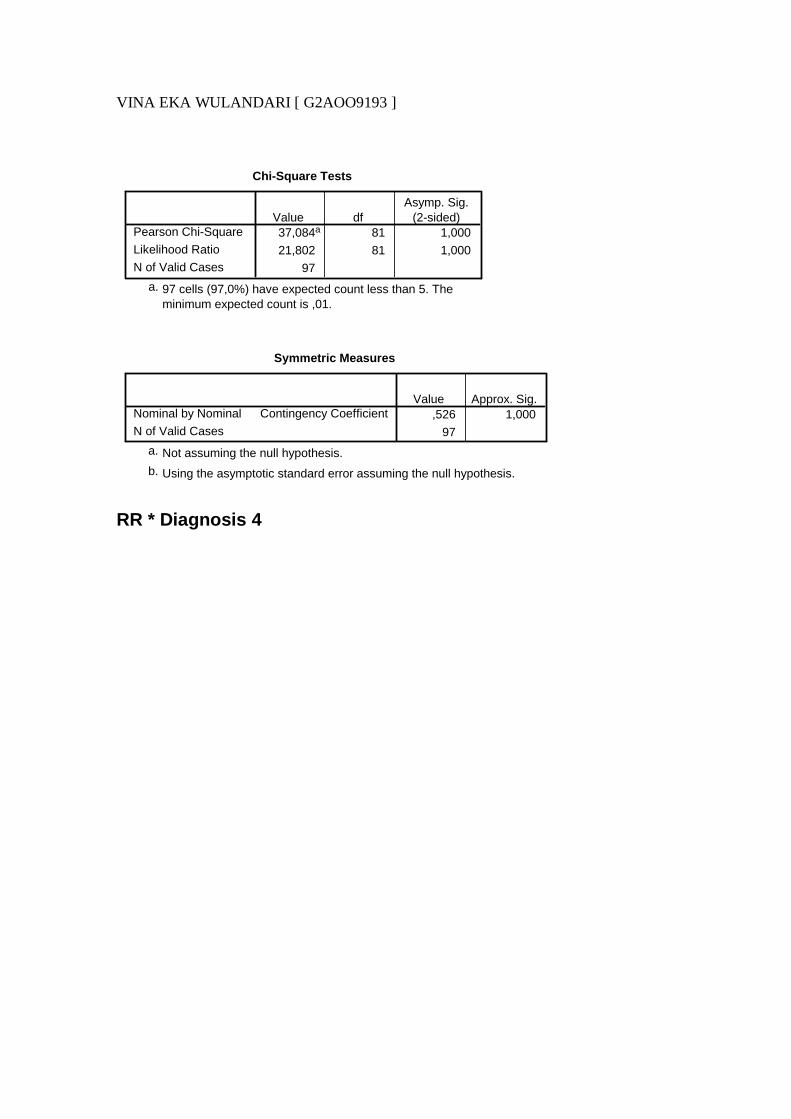
VINA EKA WULANDARI [ G2AOO9193 ]
Chi-Square Tests
37,084a 81 1,000
21,802 81 1,000
97
Pearson Chi-Square
Likelihood Ratio
N of Valid Cases
Value dfAsymp. Sig.
(2-sided)
97 cells (97,0%) have expected count less than 5. Theminimum expected count is ,01.
a.
Symmetric Measures
,526 1,000
97
Contingency CoefficientNominal by Nominal
N of Valid Cases
Value Approx. Sig.
Not assuming the null hypothesis.a.
Using the asymptotic standard error assuming the null hypothesis.b.
RR * Diagnosis 4

VINA EKA WULANDARI [ G2AOO9193 ]
Crosstab
0 0 1 1
,0% ,0% 100,0% 100,0%
,0% ,0% 1,1% 1,0%
,0% ,0% 1,0% 1,0%
0 0 1 1
,0% ,0% 100,0% 100,0%
,0% ,0% 1,1% 1,0%
,0% ,0% 1,0% 1,0%
0 0 1 1
,0% ,0% 100,0% 100,0%
,0% ,0% 1,1% 1,0%
,0% ,0% 1,0% 1,0%
0 1 69 70
,0% 1,4% 98,6% 100,0%
,0% 100,0% 72,6% 72,2%
,0% 1,0% 71,1% 72,2%
1 0 9 10
10,0% ,0% 90,0% 100,0%
100,0% ,0% 9,5% 10,3%
1,0% ,0% 9,3% 10,3%
0 0 10 10
,0% ,0% 100,0% 100,0%
,0% ,0% 10,5% 10,3%
,0% ,0% 10,3% 10,3%
0 0 1 1
,0% ,0% 100,0% 100,0%
,0% ,0% 1,1% 1,0%
,0% ,0% 1,0% 1,0%
0 0 1 1
,0% ,0% 100,0% 100,0%
,0% ,0% 1,1% 1,0%
,0% ,0% 1,0% 1,0%
0 0 1 1
,0% ,0% 100,0% 100,0%
,0% ,0% 1,1% 1,0%
,0% ,0% 1,0% 1,0%
0 0 1 1
,0% ,0% 100,0% 100,0%
,0% ,0% 1,1% 1,0%
,0% ,0% 1,0% 1,0%
1 1 95 97
1,0% 1,0% 97,9% 100,0%
100,0% 100,0% 100,0% 100,0%
1,0% 1,0% 97,9% 100,0%
Count
% within RR
% within Diagnosis 4
% of Total
Count
% within RR
% within Diagnosis 4
% of Total
Count
% within RR
% within Diagnosis 4
% of Total
Count
% within RR
% within Diagnosis 4
% of Total
Count
% within RR
% within Diagnosis 4
% of Total
Count
% within RR
% within Diagnosis 4
% of Total
Count
% within RR
% within Diagnosis 4
% of Total
Count
% within RR
% within Diagnosis 4
% of Total
Count
% within RR
% within Diagnosis 4
% of Total
Count
% within RR
% within Diagnosis 4
% of Total
Count
% within RR
% within Diagnosis 4
% of Total
16
17
18
20
22
24
25
26
30
36
RR
Total
Fetal distress Obesitas Tidak ada
Diagnosis 4
Total

VINA EKA WULANDARI [ G2AOO9193 ]
Chi-Square Tests
9,160a 18 ,956
5,273 18 ,998
97
Pearson Chi-Square
Likelihood Ratio
N of Valid Cases
Value dfAsymp. Sig.
(2-sided)
27 cells (90,0%) have expected count less than 5. Theminimum expected count is ,01.
a.
Symmetric Measures
,294 ,956
97
Contingency CoefficientNominal by Nominal
N of Valid Cases
Value Approx. Sig.
Not assuming the null hypothesis.a.
Using the asymptotic standard error assuming the null hypothesis.b.
Suhu * Diagnosis 1

VINA EKA WULANDARI [ G2AOO9193 ]
0 0 0 0 0
,0% ,0% ,0% ,0% ,0% 50,0%
,0% ,0% ,0% ,0% ,0% 20,0%
,0% ,0% ,0% ,0% ,0% 4,1%
1 0 1 0 1
1,4% ,0% 1,4% ,0% 1,4% 20,3%
100,0% ,0% 100,0% ,0% 100,0% 75,0%
1,0% ,0% 1,0% ,0% 1,0% 15,5%
0 0 0 0 0
,0% ,0% ,0% ,0% ,0% 16,7%
,0% ,0% ,0% ,0% ,0% 5,0%
,0% ,0% ,0% ,0% ,0% 1,0%
0 0 0 0 0
,0% ,0% ,0% ,0% ,0% ,0%
,0% ,0% ,0% ,0% ,0% ,0%
,0% ,0% ,0% ,0% ,0% ,0%
0 1 0 1 0
,0% 16,7% ,0% 16,7% ,0% ,0%
,0% 100,0% ,0% 100,0% ,0% ,0%
,0% 1,0% ,0% 1,0% ,0% ,0%
0 0 0 0 0
,0% ,0% ,0% ,0% ,0% ,0%
,0% ,0% ,0% ,0% ,0% ,0%
,0% ,0% ,0% ,0% ,0% ,0%
1 1 1 1 1
1,0% 1,0% 1,0% 1,0% 1,0% 20,6%
100,0% 100,0% 100,0% 100,0% 100,0% 100,0%
1,0% 1,0% 1,0% 1,0% 1,0% 20,6%
Count
% within Suhu
% within Diagnosis 1
% of Total
Count
% within Suhu
% within Diagnosis 1
% of Total
Count
% within Suhu
% within Diagnosis 1
% of Total
Count
% within Suhu
% within Diagnosis 1
% of Total
Count
% within Suhu
% within Diagnosis 1
% of Total
Count
% within Suhu
% within Diagnosis 1
% of Total
Count
% within Suhu
% within Diagnosis 1
% of Total
36
37
38
39
39
40
Suhu
Total
CPDEklamsia
berat
Hamil lewatbulan (
Serotinus) Hipertensi
Infeksi karenakeluar lendir
putih bau darivagina KPD
Chi-Square Tests
77,636a 95 ,903
48,586 95 1,000
97
Pearson Chi-Square
Likelihood Ratio
N of Valid Cases
Value dfAsymp. Sig.
(2-sided)
117 cells (97,5%) have expected count less than 5. Theminimum expected count is ,01.
a.

VINA EKA WULANDARI [ G2AOO9193 ]
Symmetric Measures
,667 ,903
97
Contingency CoefficientNominal by Nominal
N of Valid Cases
Value Approx. Sig.
Not assuming the null hypothesis.a.
Using the asymptotic standard error assuming the null hypothesis.b.
Suhu * Diagnosis 2
0 0 0 0 0
,0% ,0% ,0% ,0% ,0% ,0%
,0% ,0% ,0% ,0% ,0% ,0%
,0% ,0% ,0% ,0% ,0% ,0%
1 2 2 1 1
1,4% 2,7% 2,7% 1,4% 1,4% 1,4%
50,0% 100,0% 66,7% 50,0% 100,0% 100,0%
1,0% 2,1% 2,1% 1,0% 1,0% 1,0%
1 0 0 0 0
16,7% ,0% ,0% ,0% ,0% ,0%
50,0% ,0% ,0% ,0% ,0% ,0%
1,0% ,0% ,0% ,0% ,0% ,0%
0 0 0 0 0
,0% ,0% ,0% ,0% ,0% ,0%
,0% ,0% ,0% ,0% ,0% ,0%
,0% ,0% ,0% ,0% ,0% ,0%
0 0 1 1 0
,0% ,0% 16,7% 16,7% ,0% ,0%
,0% ,0% 33,3% 50,0% ,0% ,0%
,0% ,0% 1,0% 1,0% ,0% ,0%
0 0 0 0 0
,0% ,0% ,0% ,0% ,0% ,0%
,0% ,0% ,0% ,0% ,0% ,0%
,0% ,0% ,0% ,0% ,0% ,0%
2 2 3 2 1
2,1% 2,1% 3,1% 2,1% 1,0% 1,0%
100,0% 100,0% 100,0% 100,0% 100,0% 100,0%
2,1% 2,1% 3,1% 2,1% 1,0% 1,0%
Count
% within Suhu
% within Diagnosis 2
% of Total
Count
% within Suhu
% within Diagnosis 2
% of Total
Count
% within Suhu
% within Diagnosis 2
% of Total
Count
% within Suhu
% within Diagnosis 2
% of Total
Count
% within Suhu
% within Diagnosis 2
% of Total
Count
% within Suhu
% within Diagnosis 2
% of Total
Count
% within Suhu
% within Diagnosis 2
% of Total
36
37
38
39
39
40
Suhu
Total
AnemiaEklamsia
berat Fetal distress Gemelli HidramionHipertensigestasional

VINA EKA WULANDARI [ G2AOO9193 ]
Chi-Square Tests
81,257a 95 ,841
47,886 95 1,000
97
Pearson Chi-Square
Likelihood Ratio
N of Valid Cases
Value dfAsymp. Sig.
(2-sided)
119 cells (99,2%) have expected count less than 5. Theminimum expected count is ,01.
a.
Symmetric Measures
,675 ,841
97
Contingency CoefficientNominal by Nominal
N of Valid Cases
Value Approx. Sig.
Not assuming the null hypothesis.a.
Using the asymptotic standard error assuming the null hypothesis.b.
Suhu * Diagnosis 3

VINA EKA WULANDARI [ G2AOO9193 ]
Crosstab
0 0 0 0 0 0
,0% ,0% ,0% ,0% ,0% ,0%
,0% ,0% ,0% ,0% ,0% ,0%
,0% ,0% ,0% ,0% ,0% ,0%
1 1 1 1 1 1
1,4% 1,4% 1,4% 1,4% 1,4% 1,4%
100,0% 100,0% 100,0% 100,0% 100,0% 100,0%
1,0% 1,0% 1,0% 1,0% 1,0% 1,0%
0 0 0 0 0 0
,0% ,0% ,0% ,0% ,0% ,0%
,0% ,0% ,0% ,0% ,0% ,0%
,0% ,0% ,0% ,0% ,0% ,0%
0 0 0 0 0 0
,0% ,0% ,0% ,0% ,0% ,0%
,0% ,0% ,0% ,0% ,0% ,0%
,0% ,0% ,0% ,0% ,0% ,0%
0 0 0 0 0 0
,0% ,0% ,0% ,0% ,0% ,0%
,0% ,0% ,0% ,0% ,0% ,0%
,0% ,0% ,0% ,0% ,0% ,0%
0 0 0 0 0 0
,0% ,0% ,0% ,0% ,0% ,0%
,0% ,0% ,0% ,0% ,0% ,0%
,0% ,0% ,0% ,0% ,0% ,0%
1 1 1 1 1 1
1,0% 1,0% 1,0% 1,0% 1,0% 1,0%
100,0% 100,0% 100,0% 100,0% 100,0% 100,0%
1,0% 1,0% 1,0% 1,0% 1,0% 1,0%
Count
% within Suhu
% within Diagnosis 3
% of Total
Count
% within Suhu
% within Diagnosis 3
% of Total
Count
% within Suhu
% within Diagnosis 3
% of Total
Count
% within Suhu
% within Diagnosis 3
% of Total
Count
% within Suhu
% within Diagnosis 3
% of Total
Count
% within Suhu
% within Diagnosis 3
% of Total
Count
% within Suhu
% within Diagnosis 3
% of Total
36
37
38
39
39
40
Suhu
Total
Gemelli Janin besar KPD Obesitas PEB PER
Diagnosis 3
Chi-Square Tests
17,870a 45 1,000
10,109 45 1,000
97
Pearson Chi-Square
Likelihood Ratio
N of Valid Cases
Value dfAsymp. Sig.
(2-sided)
56 cells (93,3%) have expected count less than 5. Theminimum expected count is ,01.
a.

VINA EKA WULANDARI [ G2AOO9193 ]
Symmetric Measures
,394 1,000
97
Contingency CoefficientNominal by Nominal
N of Valid Cases
Value Approx. Sig.
Not assuming the null hypothesis.a.
Using the asymptotic standard error assuming the null hypothesis.b.
Suhu * Diagnosis 4
Crosstab
0 0 8 8
,0% ,0% 100,0% 100,0%
,0% ,0% 8,4% 8,2%
,0% ,0% 8,2% 8,2%
1 1 72 74
1,4% 1,4% 97,3% 100,0%
100,0% 100,0% 75,8% 76,3%
1,0% 1,0% 74,2% 76,3%
0 0 6 6
,0% ,0% 100,0% 100,0%
,0% ,0% 6,3% 6,2%
,0% ,0% 6,2% 6,2%
0 0 1 1
,0% ,0% 100,0% 100,0%
,0% ,0% 1,1% 1,0%
,0% ,0% 1,0% 1,0%
0 0 6 6
,0% ,0% 100,0% 100,0%
,0% ,0% 6,3% 6,2%
,0% ,0% 6,2% 6,2%
0 0 2 2
,0% ,0% 100,0% 100,0%
,0% ,0% 2,1% 2,1%
,0% ,0% 2,1% 2,1%
1 1 95 97
1,0% 1,0% 97,9% 100,0%
100,0% 100,0% 100,0% 100,0%
1,0% 1,0% 97,9% 100,0%
Count
% within Suhu
% within Diagnosis 4
% of Total
Count
% within Suhu
% within Diagnosis 4
% of Total
Count
% within Suhu
% within Diagnosis 4
% of Total
Count
% within Suhu
% within Diagnosis 4
% of Total
Count
% within Suhu
% within Diagnosis 4
% of Total
Count
% within Suhu
% within Diagnosis 4
% of Total
Count
% within Suhu
% within Diagnosis 4
% of Total
36
37
38
39
39
40
Suhu
Total
Fetal distress Obesitas Tidak ada
Diagnosis 4
Total

VINA EKA WULANDARI [ G2AOO9193 ]
Chi-Square Tests
,635a 10 1,000
1,096 10 1,000
97
Pearson Chi-Square
Likelihood Ratio
N of Valid Cases
Value dfAsymp. Sig.
(2-sided)
14 cells (77,8%) have expected count less than 5. Theminimum expected count is ,01.
a.
Symmetric Measures
,081 1,000
97
Contingency CoefficientNominal by Nominal
N of Valid Cases
Value Approx. Sig.
Not assuming the null hypothesis.a.
Using the asymptotic standard error assuming the null hypothesis.b.
Panggul Sempit * Diagnosis 1
1 1 1 1 1
1,2% 1,2% 1,2% 1,2% 1,2%
100,0% 100,0% 100,0% 100,0% 100,0%
1,0% 1,0% 1,0% 1,0% 1,0%
0 0 0 0 0
,0% ,0% ,0% ,0% ,0%
,0% ,0% ,0% ,0% ,0%
,0% ,0% ,0% ,0% ,0%
1 1 1 1 1
1,0% 1,0% 1,0% 1,0% 1,0%
100,0% 100,0% 100,0% 100,0% 100,0%
1,0% 1,0% 1,0% 1,0% 1,0%
Count
% within Panggul Sempit
% within Diagnosis 1
% of Total
Count
% within Panggul Sempit
% within Diagnosis 1
% of Total
Count
% within Panggul Sempit
% within Diagnosis 1
% of Total
tidak
ya
PanggulSempit
Total
CPDEklamsia
berat
Hamil lewatbulan (
Serotinus) Hipertensi
Infeksi karenakeluar lendir
putih bau darivagina

VINA EKA WULANDARI [ G2AOO9193 ]
Chi-Square Tests
21,647a 19 ,302
23,481 19 ,217
97
Pearson Chi-Square
Likelihood Ratio
N of Valid Cases
Value dfAsymp. Sig.
(2-sided)
37 cells (92,5%) have expected count less than 5. Theminimum expected count is ,12.
a.
Symmetric Measures
,427 ,302
97
Contingency CoefficientNominal by Nominal
N of Valid Cases
Value Approx. Sig.
Not assuming the null hypothesis.a.
Using the asymptotic standard error assuming the null hypothesis.b.
Panggul Sempit * Diagnosis 2
2 2 3 2 1
2,4% 2,4% 3,5% 2,4% 1,2%
100,0% 100,0% 100,0% 100,0% 100,0%
2,1% 2,1% 3,1% 2,1% 1,0%
0 0 0 0 0
,0% ,0% ,0% ,0% ,0%
,0% ,0% ,0% ,0% ,0%
,0% ,0% ,0% ,0% ,0%
2 2 3 2 1
2,1% 2,1% 3,1% 2,1% 1,0%
100,0% 100,0% 100,0% 100,0% 100,0%
2,1% 2,1% 3,1% 2,1% 1,0%
Count
% within Panggul Sempit
% within Diagnosis 2
% of Total
Count
% within Panggul Sempit
% within Diagnosis 2
% of Total
Count
% within Panggul Sempit
% within Diagnosis 2
% of Total
tidak
ya
PanggulSempit
Total
AnemiaEklamsia
berat Fetal distress Gemelli HidramionHipertensigestasional
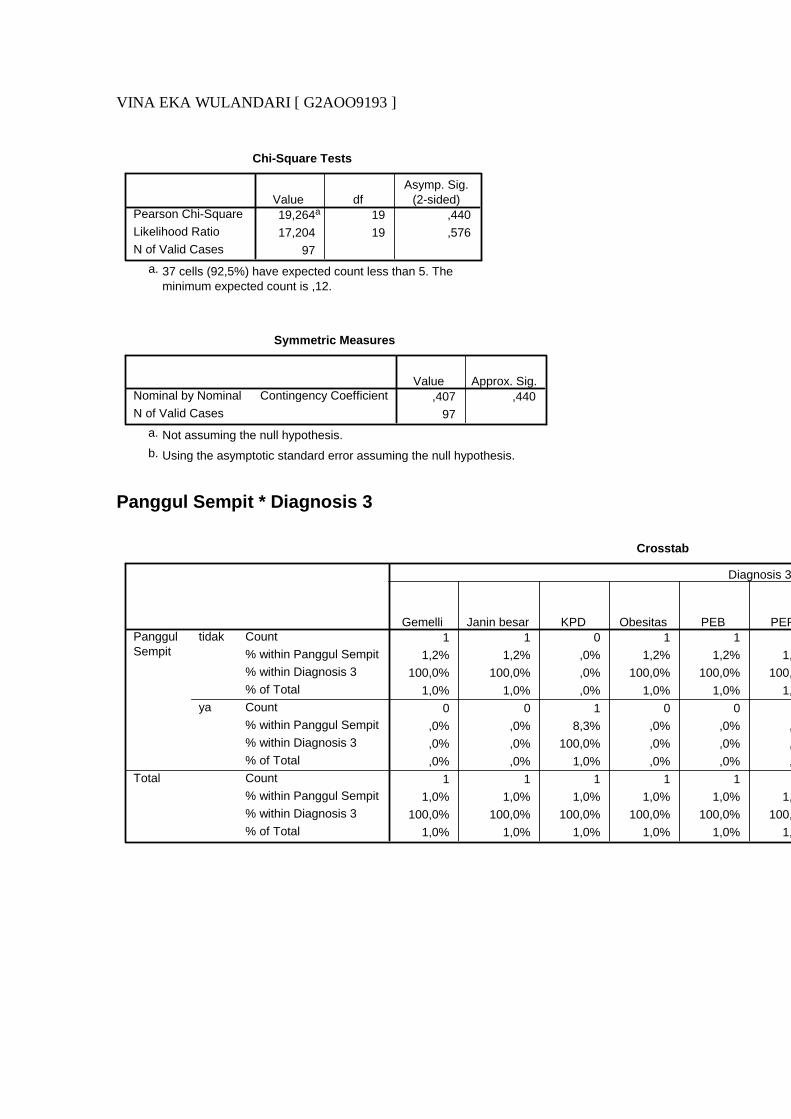
VINA EKA WULANDARI [ G2AOO9193 ]
Chi-Square Tests
19,264a 19 ,440
17,204 19 ,576
97
Pearson Chi-Square
Likelihood Ratio
N of Valid Cases
Value dfAsymp. Sig.
(2-sided)
37 cells (92,5%) have expected count less than 5. Theminimum expected count is ,12.
a.
Symmetric Measures
,407 ,440
97
Contingency CoefficientNominal by Nominal
N of Valid Cases
Value Approx. Sig.
Not assuming the null hypothesis.a.
Using the asymptotic standard error assuming the null hypothesis.b.
Panggul Sempit * Diagnosis 3
Crosstab
1 1 0 1 1
1,2% 1,2% ,0% 1,2% 1,2% 1,2%
100,0% 100,0% ,0% 100,0% 100,0% 100,0%
1,0% 1,0% ,0% 1,0% 1,0% 1,0%
0 0 1 0 0
,0% ,0% 8,3% ,0% ,0% ,0%
,0% ,0% 100,0% ,0% ,0% ,0%
,0% ,0% 1,0% ,0% ,0% ,0%
1 1 1 1 1
1,0% 1,0% 1,0% 1,0% 1,0% 1,0%
100,0% 100,0% 100,0% 100,0% 100,0% 100,0%
1,0% 1,0% 1,0% 1,0% 1,0% 1,0%
Count
% within Panggul Sempit
% within Diagnosis 3
% of Total
Count
% within Panggul Sempit
% within Diagnosis 3
% of Total
Count
% within Panggul Sempit
% within Diagnosis 3
% of Total
tidak
ya
PanggulSempit
Total
Gemelli Janin besar KPD Obesitas PEB PER
Diagnosis 3
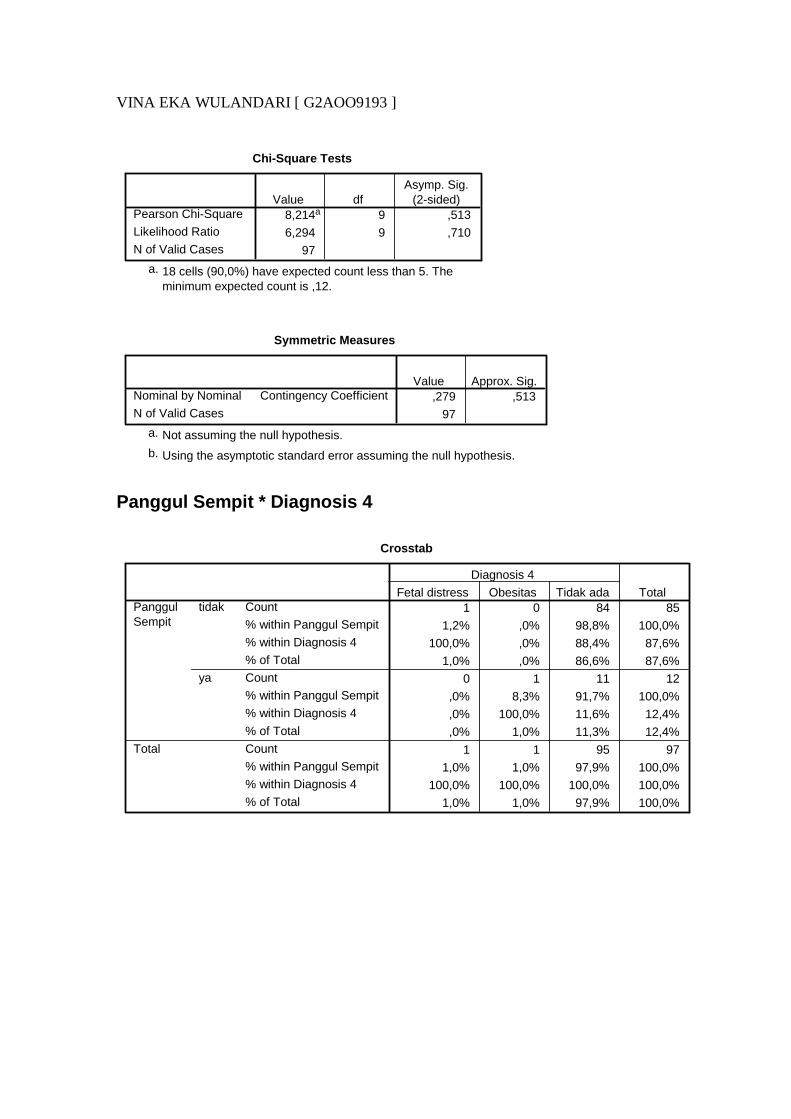
VINA EKA WULANDARI [ G2AOO9193 ]
Chi-Square Tests
8,214a 9 ,513
6,294 9 ,710
97
Pearson Chi-Square
Likelihood Ratio
N of Valid Cases
Value dfAsymp. Sig.
(2-sided)
18 cells (90,0%) have expected count less than 5. Theminimum expected count is ,12.
a.
Symmetric Measures
,279 ,513
97
Contingency CoefficientNominal by Nominal
N of Valid Cases
Value Approx. Sig.
Not assuming the null hypothesis.a.
Using the asymptotic standard error assuming the null hypothesis.b.
Panggul Sempit * Diagnosis 4
Crosstab
1 0 84 85
1,2% ,0% 98,8% 100,0%
100,0% ,0% 88,4% 87,6%
1,0% ,0% 86,6% 87,6%
0 1 11 12
,0% 8,3% 91,7% 100,0%
,0% 100,0% 11,6% 12,4%
,0% 1,0% 11,3% 12,4%
1 1 95 97
1,0% 1,0% 97,9% 100,0%
100,0% 100,0% 100,0% 100,0%
1,0% 1,0% 97,9% 100,0%
Count
% within Panggul Sempit
% within Diagnosis 4
% of Total
Count
% within Panggul Sempit
% within Diagnosis 4
% of Total
Count
% within Panggul Sempit
% within Diagnosis 4
% of Total
tidak
ya
PanggulSempit
Total
Fetal distress Obesitas Tidak ada
Diagnosis 4
Total
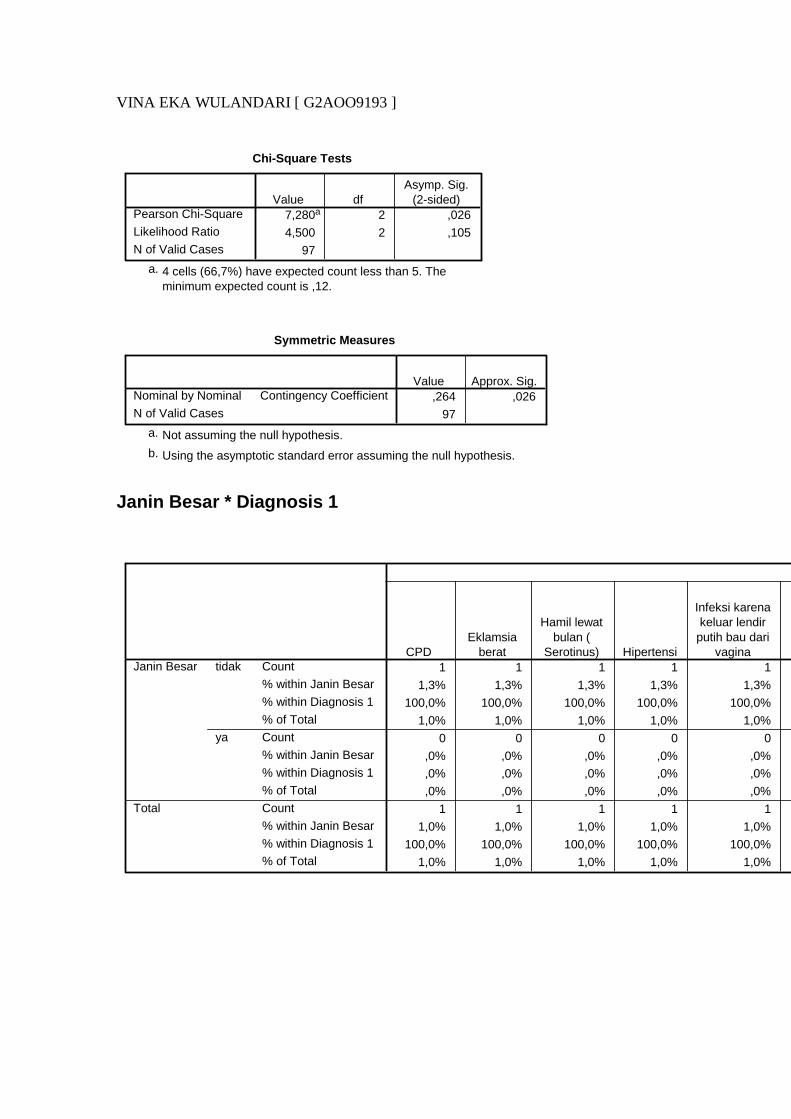
VINA EKA WULANDARI [ G2AOO9193 ]
Chi-Square Tests
7,280a 2 ,026
4,500 2 ,105
97
Pearson Chi-Square
Likelihood Ratio
N of Valid Cases
Value dfAsymp. Sig.
(2-sided)
4 cells (66,7%) have expected count less than 5. Theminimum expected count is ,12.
a.
Symmetric Measures
,264 ,026
97
Contingency CoefficientNominal by Nominal
N of Valid Cases
Value Approx. Sig.
Not assuming the null hypothesis.a.
Using the asymptotic standard error assuming the null hypothesis.b.
Janin Besar * Diagnosis 1
1 1 1 1 1
1,3% 1,3% 1,3% 1,3% 1,3%
100,0% 100,0% 100,0% 100,0% 100,0%
1,0% 1,0% 1,0% 1,0% 1,0%
0 0 0 0 0
,0% ,0% ,0% ,0% ,0%
,0% ,0% ,0% ,0% ,0%
,0% ,0% ,0% ,0% ,0%
1 1 1 1 1
1,0% 1,0% 1,0% 1,0% 1,0%
100,0% 100,0% 100,0% 100,0% 100,0%
1,0% 1,0% 1,0% 1,0% 1,0%
Count
% within Janin Besar
% within Diagnosis 1
% of Total
Count
% within Janin Besar
% within Diagnosis 1
% of Total
Count
% within Janin Besar
% within Diagnosis 1
% of Total
tidak
ya
Janin Besar
Total
CPDEklamsia
berat
Hamil lewatbulan (
Serotinus) Hipertensi
Infeksi karenakeluar lendir
putih bau darivagina

VINA EKA WULANDARI [ G2AOO9193 ]
Chi-Square Tests
32,818a 19 ,025
36,267 19 ,010
97
Pearson Chi-Square
Likelihood Ratio
N of Valid Cases
Value dfAsymp. Sig.
(2-sided)
36 cells (90,0%) have expected count less than 5. Theminimum expected count is ,19.
a.
Symmetric Measures
,503 ,025
97
Contingency CoefficientNominal by Nominal
N of Valid Cases
Value Approx. Sig.
Not assuming the null hypothesis.a.
Using the asymptotic standard error assuming the null hypothesis.b.
Janin Besar * Diagnosis 2
1 2 3 2 1
1,3% 2,5% 3,8% 2,5% 1,3%
50,0% 100,0% 100,0% 100,0% 100,0%
1,0% 2,1% 3,1% 2,1% 1,0%
1 0 0 0 0
5,6% ,0% ,0% ,0% ,0%
50,0% ,0% ,0% ,0% ,0%
1,0% ,0% ,0% ,0% ,0%
2 2 3 2 1
2,1% 2,1% 3,1% 2,1% 1,0%
100,0% 100,0% 100,0% 100,0% 100,0%
2,1% 2,1% 3,1% 2,1% 1,0%
Count
% within Janin Besar
% within Diagnosis 2
% of Total
Count
% within Janin Besar
% within Diagnosis 2
% of Total
Count
% within Janin Besar
% within Diagnosis 2
% of Total
tidak
ya
Janin Besar
Total
AnemiaEklamsia
berat Fetal distress Gemelli HidramionHipertensigestasional
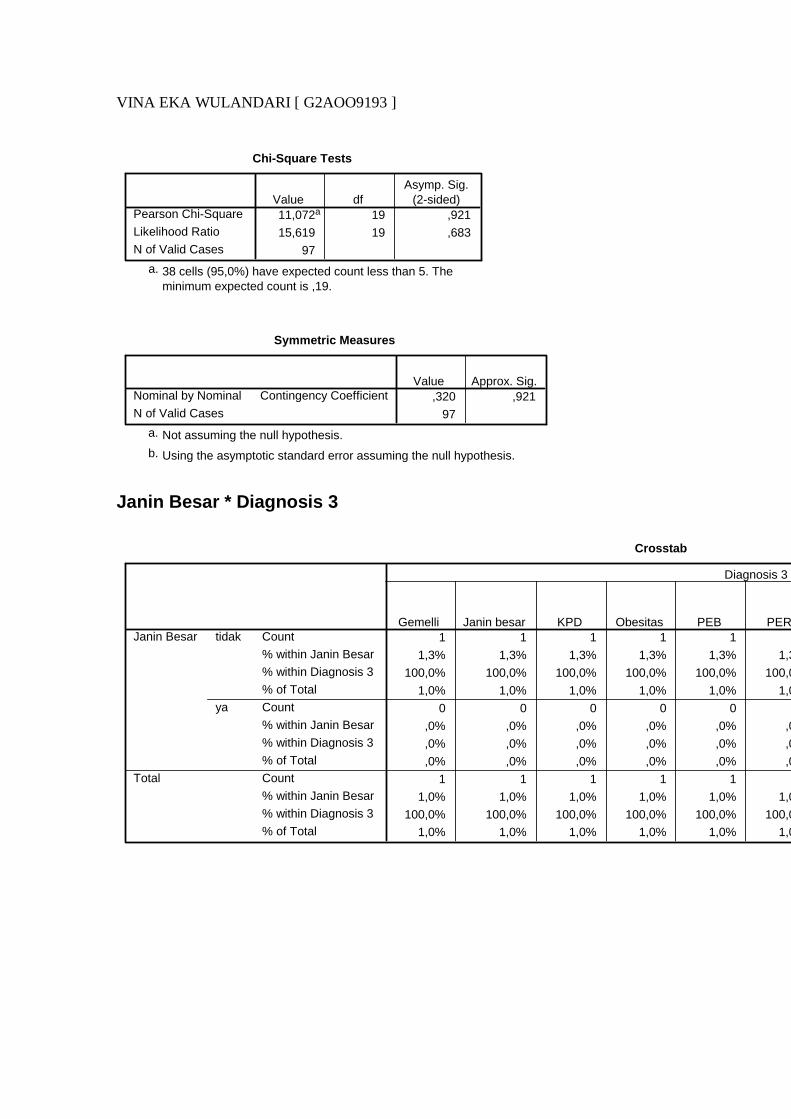
VINA EKA WULANDARI [ G2AOO9193 ]
Chi-Square Tests
11,072a 19 ,921
15,619 19 ,683
97
Pearson Chi-Square
Likelihood Ratio
N of Valid Cases
Value dfAsymp. Sig.
(2-sided)
38 cells (95,0%) have expected count less than 5. Theminimum expected count is ,19.
a.
Symmetric Measures
,320 ,921
97
Contingency CoefficientNominal by Nominal
N of Valid Cases
Value Approx. Sig.
Not assuming the null hypothesis.a.
Using the asymptotic standard error assuming the null hypothesis.b.
Janin Besar * Diagnosis 3
Crosstab
1 1 1 1 1
1,3% 1,3% 1,3% 1,3% 1,3% 1,3%
100,0% 100,0% 100,0% 100,0% 100,0% 100,0%
1,0% 1,0% 1,0% 1,0% 1,0% 1,0%
0 0 0 0 0
,0% ,0% ,0% ,0% ,0% ,0%
,0% ,0% ,0% ,0% ,0% ,0%
,0% ,0% ,0% ,0% ,0% ,0%
1 1 1 1 1
1,0% 1,0% 1,0% 1,0% 1,0% 1,0%
100,0% 100,0% 100,0% 100,0% 100,0% 100,0%
1,0% 1,0% 1,0% 1,0% 1,0% 1,0%
Count
% within Janin Besar
% within Diagnosis 3
% of Total
Count
% within Janin Besar
% within Diagnosis 3
% of Total
Count
% within Janin Besar
% within Diagnosis 3
% of Total
tidak
ya
Janin Besar
Total
Gemelli Janin besar KPD Obesitas PEB PER
Diagnosis 3

VINA EKA WULANDARI [ G2AOO9193 ]
Chi-Square Tests
2,260a 9 ,987
3,899 9 ,918
97
Pearson Chi-Square
Likelihood Ratio
N of Valid Cases
Value dfAsymp. Sig.
(2-sided)
18 cells (90,0%) have expected count less than 5. Theminimum expected count is ,19.
a.
Symmetric Measures
,151 ,987
97
Contingency CoefficientNominal by Nominal
N of Valid Cases
Value Approx. Sig.
Not assuming the null hypothesis.a.
Using the asymptotic standard error assuming the null hypothesis.b.
Janin Besar * Diagnosis 4
Crosstab
1 1 77 79
1,3% 1,3% 97,5% 100,0%
100,0% 100,0% 81,1% 81,4%
1,0% 1,0% 79,4% 81,4%
0 0 18 18
,0% ,0% 100,0% 100,0%
,0% ,0% 18,9% 18,6%
,0% ,0% 18,6% 18,6%
1 1 95 97
1,0% 1,0% 97,9% 100,0%
100,0% 100,0% 100,0% 100,0%
1,0% 1,0% 97,9% 100,0%
Count
% within Janin Besar
% within Diagnosis 4
% of Total
Count
% within Janin Besar
% within Diagnosis 4
% of Total
Count
% within Janin Besar
% within Diagnosis 4
% of Total
tidak
ya
Janin Besar
Total
Fetal distress Obesitas Tidak ada
Diagnosis 4
Total

VINA EKA WULANDARI [ G2AOO9193 ]
Chi-Square Tests
,465a 2 ,792
,831 2 ,660
97
Pearson Chi-Square
Likelihood Ratio
N of Valid Cases
Value dfAsymp. Sig.
(2-sided)
4 cells (66,7%) have expected count less than 5. Theminimum expected count is ,19.
a.
Symmetric Measures
,069 ,792
97
Contingency CoefficientNominal by Nominal
N of Valid Cases
Value Approx. Sig.
Not assuming the null hypothesis.a.
Using the asymptotic standard error assuming the null hypothesis.b.
Obesitas * Diagnosis 1
1 1 1 1 1
1,0% 1,0% 1,0% 1,0% 1,0% 20,8%
100,0% 100,0% 100,0% 100,0% 100,0% 100,0%
1,0% 1,0% 1,0% 1,0% 1,0% 20,6%
0 0 0 0 0
,0% ,0% ,0% ,0% ,0%
,0% ,0% ,0% ,0% ,0%
,0% ,0% ,0% ,0% ,0%
1 1 1 1 1
1,0% 1,0% 1,0% 1,0% 1,0% 20,6%
100,0% 100,0% 100,0% 100,0% 100,0% 100,0%
1,0% 1,0% 1,0% 1,0% 1,0% 20,6%
Count
% within Obesitas
% within Diagnosis 1
% of Total
Count
% within Obesitas
% within Diagnosis 1
% of Total
Count
% within Obesitas
% within Diagnosis 1
% of Total
tidak
ya
Obesitas
Total
CPDEklamsia
berat
Hamil lewatbulan (
Serotinus) Hipertensi
Infeksi karenakeluar lendir
putih bau darivagina KPD

VINA EKA WULANDARI [ G2AOO9193 ]
Chi-Square Tests
8,791a 19 ,977
4,637 19 1,000
97
Pearson Chi-Square
Likelihood Ratio
N of Valid Cases
Value dfAsymp. Sig.
(2-sided)
37 cells (92,5%) have expected count less than 5. Theminimum expected count is ,01.
a.
Symmetric Measures
,288 ,977
97
Contingency CoefficientNominal by Nominal
N of Valid Cases
Value Approx. Sig.
Not assuming the null hypothesis.a.
Using the asymptotic standard error assuming the null hypothesis.b.
Obesitas * Diagnosis 2
2 2 3 2 1
2,1% 2,1% 3,1% 2,1% 1,0%
100,0% 100,0% 100,0% 100,0% 100,0% 100,0%
2,1% 2,1% 3,1% 2,1% 1,0%
0 0 0 0 0
,0% ,0% ,0% ,0% ,0%
,0% ,0% ,0% ,0% ,0%
,0% ,0% ,0% ,0% ,0%
2 2 3 2 1
2,1% 2,1% 3,1% 2,1% 1,0%
100,0% 100,0% 100,0% 100,0% 100,0% 100,0%
2,1% 2,1% 3,1% 2,1% 1,0%
Count
% within Obesitas
% within Diagnosis 2
% of Total
Count
% within Obesitas
% within Diagnosis 2
% of Total
Count
% within Obesitas
% within Diagnosis 2
% of Total
tidak
ya
Obesitas
Total
AnemiaEklamsia
berat Fetal distress Gemelli HidramionHipertensigestasional
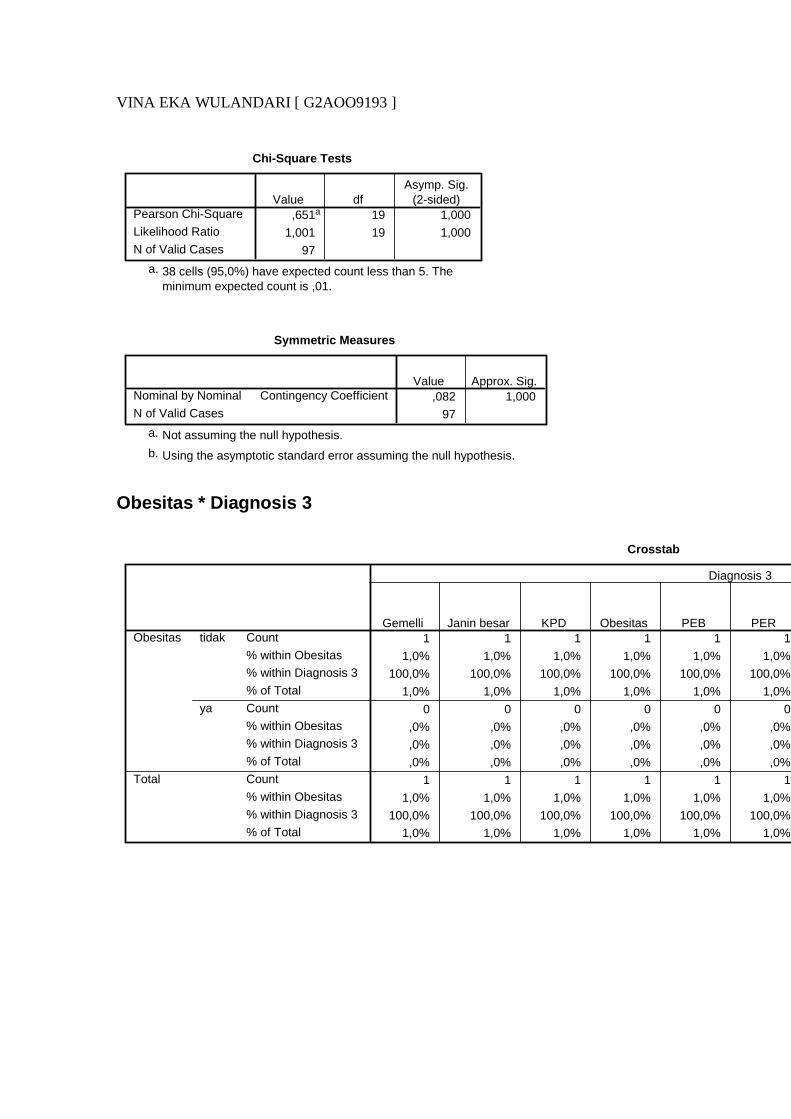
VINA EKA WULANDARI [ G2AOO9193 ]
Chi-Square Tests
,651a 19 1,000
1,001 19 1,000
97
Pearson Chi-Square
Likelihood Ratio
N of Valid Cases
Value dfAsymp. Sig.
(2-sided)
38 cells (95,0%) have expected count less than 5. Theminimum expected count is ,01.
a.
Symmetric Measures
,082 1,000
97
Contingency CoefficientNominal by Nominal
N of Valid Cases
Value Approx. Sig.
Not assuming the null hypothesis.a.
Using the asymptotic standard error assuming the null hypothesis.b.
Obesitas * Diagnosis 3
Crosstab
1 1 1 1 1 1
1,0% 1,0% 1,0% 1,0% 1,0% 1,0%
100,0% 100,0% 100,0% 100,0% 100,0% 100,0%
1,0% 1,0% 1,0% 1,0% 1,0% 1,0%
0 0 0 0 0 0
,0% ,0% ,0% ,0% ,0% ,0%
,0% ,0% ,0% ,0% ,0% ,0%
,0% ,0% ,0% ,0% ,0% ,0%
1 1 1 1 1 1
1,0% 1,0% 1,0% 1,0% 1,0% 1,0%
100,0% 100,0% 100,0% 100,0% 100,0% 100,0%
1,0% 1,0% 1,0% 1,0% 1,0% 1,0%
Count
% within Obesitas
% within Diagnosis 3
% of Total
Count
% within Obesitas
% within Diagnosis 3
% of Total
Count
% within Obesitas
% within Diagnosis 3
% of Total
tidak
ya
Obesitas
Total
Gemelli Janin besar KPD Obesitas PEB PER
Diagnosis 3
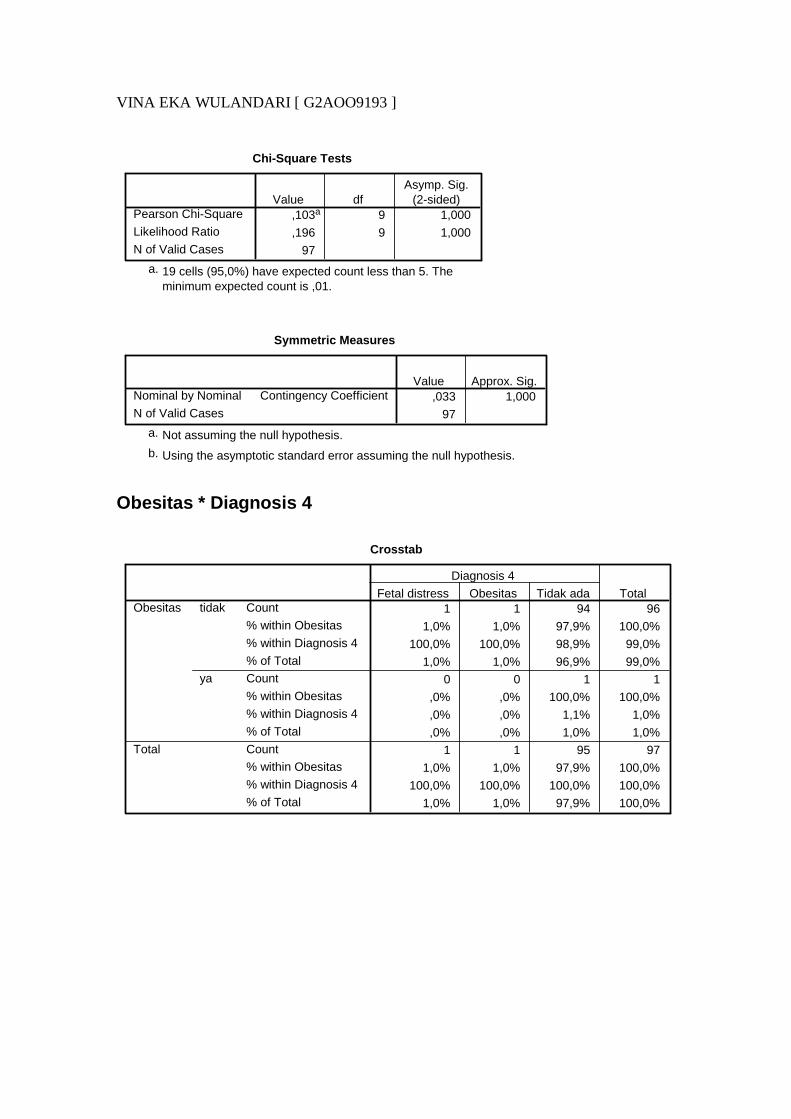
VINA EKA WULANDARI [ G2AOO9193 ]
Chi-Square Tests
,103a 9 1,000
,196 9 1,000
97
Pearson Chi-Square
Likelihood Ratio
N of Valid Cases
Value dfAsymp. Sig.
(2-sided)
19 cells (95,0%) have expected count less than 5. Theminimum expected count is ,01.
a.
Symmetric Measures
,033 1,000
97
Contingency CoefficientNominal by Nominal
N of Valid Cases
Value Approx. Sig.
Not assuming the null hypothesis.a.
Using the asymptotic standard error assuming the null hypothesis.b.
Obesitas * Diagnosis 4
Crosstab
1 1 94 96
1,0% 1,0% 97,9% 100,0%
100,0% 100,0% 98,9% 99,0%
1,0% 1,0% 96,9% 99,0%
0 0 1 1
,0% ,0% 100,0% 100,0%
,0% ,0% 1,1% 1,0%
,0% ,0% 1,0% 1,0%
1 1 95 97
1,0% 1,0% 97,9% 100,0%
100,0% 100,0% 100,0% 100,0%
1,0% 1,0% 97,9% 100,0%
Count
% within Obesitas
% within Diagnosis 4
% of Total
Count
% within Obesitas
% within Diagnosis 4
% of Total
Count
% within Obesitas
% within Diagnosis 4
% of Total
tidak
ya
Obesitas
Total
Fetal distress Obesitas Tidak ada
Diagnosis 4
Total

VINA EKA WULANDARI [ G2AOO9193 ]
Chi-Square Tests
,021a 2 ,989
,042 2 ,979
97
Pearson Chi-Square
Likelihood Ratio
N of Valid Cases
Value dfAsymp. Sig.
(2-sided)
5 cells (83,3%) have expected count less than 5. Theminimum expected count is ,01.
a.
Symmetric Measures
,015 ,989
97
Contingency CoefficientNominal by Nominal
N of Valid Cases
Value Approx. Sig.
Not assuming the null hypothesis.a.
Using the asymptotic standard error assuming the null hypothesis.b.
Tindakan * Diagnosis 1

VINA EKA WULANDARI [ G2AOO9193 ]
0 0 0 0
,0% ,0% ,0% ,0%
,0% ,0% ,0% ,0%
,0% ,0% ,0% ,0%
1 0 0 0
10,0% ,0% ,0% ,0%
100,0% ,0% ,0% ,0%
1,0% ,0% ,0% ,0%
0 1 1 1
,0% 1,3% 1,3% 1,3%
,0% 100,0% 100,0% 100,0% 100,0%
,0% 1,0% 1,0% 1,0%
0 0 0 0
,0% ,0% ,0% ,0%
,0% ,0% ,0% ,0%
,0% ,0% ,0% ,0%
0 0 0 0
,0% ,0% ,0% ,0%
,0% ,0% ,0% ,0%
,0% ,0% ,0% ,0%
1 1 1 1
1,0% 1,0% 1,0% 1,0%
100,0% 100,0% 100,0% 100,0% 100,0%
1,0% 1,0% 1,0% 1,0%
Count
% within Tindakan
% within Diagnosis 1
% of Total
Count
% within Tindakan
% within Diagnosis 1
% of Total
Count
% within Tindakan
% within Diagnosis 1
% of Total
Count
% within Tindakan
% within Diagnosis 1
% of Total
Count
% within Tindakan
% within Diagnosis 1
% of Total
Count
% within Tindakan
% within Diagnosis 1
% of Total
MgSo4, Vakum
Partus spontan
Sectio Caesaria
Transfusi
Vakum
Tindakan
Total
CPDEklamsia
berat
Hamil lewatbulan (
Serotinus) Hipertensi
Infeksi karenakeluar lendir
putih bau darivagina
Chi-Square Tests
163,057a 76 ,000
62,148 76 ,874
97
Pearson Chi-Square
Likelihood Ratio
N of Valid Cases
Value dfAsymp. Sig.
(2-sided)
97 cells (97,0%) have expected count less than 5. Theminimum expected count is ,01.
a.
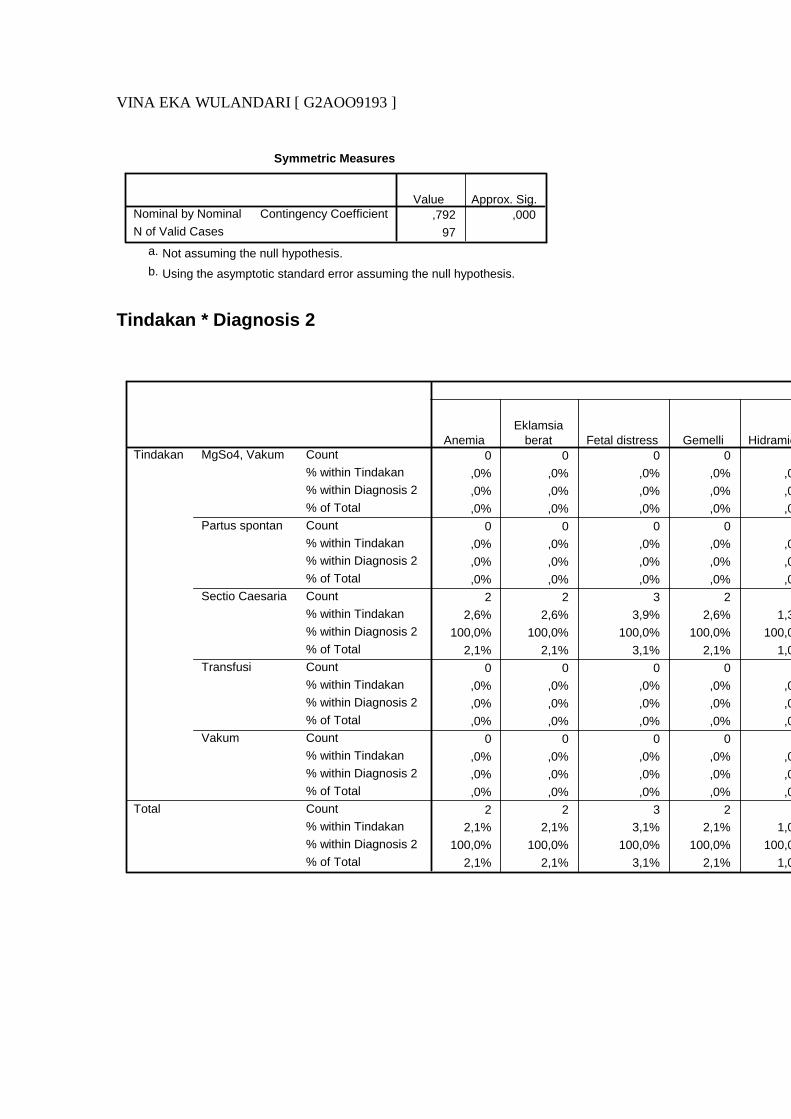
VINA EKA WULANDARI [ G2AOO9193 ]
Symmetric Measures
,792 ,000
97
Contingency CoefficientNominal by Nominal
N of Valid Cases
Value Approx. Sig.
Not assuming the null hypothesis.a.
Using the asymptotic standard error assuming the null hypothesis.b.
Tindakan * Diagnosis 2
0 0 0 0
,0% ,0% ,0% ,0% ,0%
,0% ,0% ,0% ,0% ,0%
,0% ,0% ,0% ,0% ,0%
0 0 0 0
,0% ,0% ,0% ,0% ,0%
,0% ,0% ,0% ,0% ,0%
,0% ,0% ,0% ,0% ,0%
2 2 3 2
2,6% 2,6% 3,9% 2,6% 1,3%
100,0% 100,0% 100,0% 100,0% 100,0%
2,1% 2,1% 3,1% 2,1% 1,0%
0 0 0 0
,0% ,0% ,0% ,0% ,0%
,0% ,0% ,0% ,0% ,0%
,0% ,0% ,0% ,0% ,0%
0 0 0 0
,0% ,0% ,0% ,0% ,0%
,0% ,0% ,0% ,0% ,0%
,0% ,0% ,0% ,0% ,0%
2 2 3 2
2,1% 2,1% 3,1% 2,1% 1,0%
100,0% 100,0% 100,0% 100,0% 100,0%
2,1% 2,1% 3,1% 2,1% 1,0%
Count
% within Tindakan
% within Diagnosis 2
% of Total
Count
% within Tindakan
% within Diagnosis 2
% of Total
Count
% within Tindakan
% within Diagnosis 2
% of Total
Count
% within Tindakan
% within Diagnosis 2
% of Total
Count
% within Tindakan
% within Diagnosis 2
% of Total
Count
% within Tindakan
% within Diagnosis 2
% of Total
MgSo4, Vakum
Partus spontan
Sectio Caesaria
Transfusi
Vakum
Tindakan
Total
AnemiaEklamsia
berat Fetal distress Gemelli Hidramion
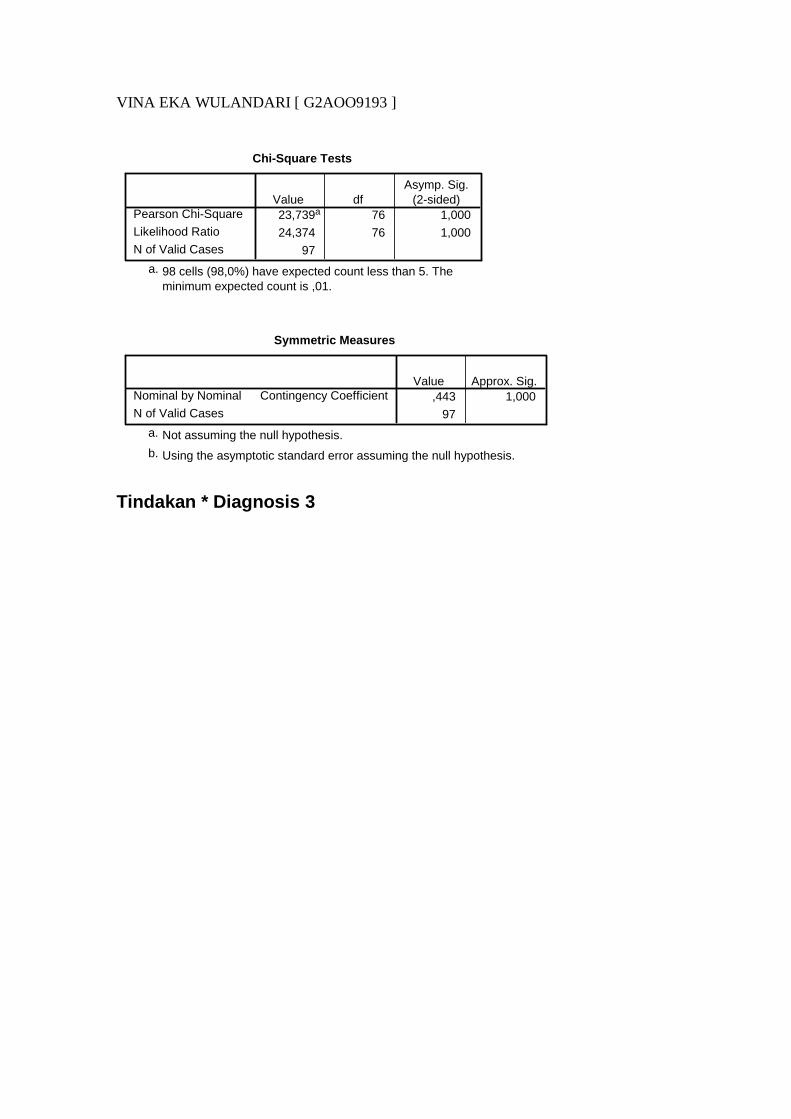
VINA EKA WULANDARI [ G2AOO9193 ]
Chi-Square Tests
23,739a 76 1,000
24,374 76 1,000
97
Pearson Chi-Square
Likelihood Ratio
N of Valid Cases
Value dfAsymp. Sig.
(2-sided)
98 cells (98,0%) have expected count less than 5. Theminimum expected count is ,01.
a.
Symmetric Measures
,443 1,000
97
Contingency CoefficientNominal by Nominal
N of Valid Cases
Value Approx. Sig.
Not assuming the null hypothesis.a.
Using the asymptotic standard error assuming the null hypothesis.b.
Tindakan * Diagnosis 3

VINA EKA WULANDARI [ G2AOO9193 ]
Crosstab
0 0 0 0 0
,0% ,0% ,0% ,0% ,0%
,0% ,0% ,0% ,0% ,0%
,0% ,0% ,0% ,0% ,0%
0 1 0 0 0
,0% 10,0% ,0% ,0% ,0%
,0% 100,0% ,0% ,0% ,0%
,0% 1,0% ,0% ,0% ,0%
1 0 1 1 1
1,3% ,0% 1,3% 1,3% 1,3%
100,0% ,0% 100,0% 100,0% 100,0%
1,0% ,0% 1,0% 1,0% 1,0%
0 0 0 0 0
,0% ,0% ,0% ,0% ,0%
,0% ,0% ,0% ,0% ,0%
,0% ,0% ,0% ,0% ,0%
0 0 0 0 0
,0% ,0% ,0% ,0% ,0%
,0% ,0% ,0% ,0% ,0%
,0% ,0% ,0% ,0% ,0%
1 1 1 1 1
1,0% 1,0% 1,0% 1,0% 1,0%
100,0% 100,0% 100,0% 100,0% 100,0%
1,0% 1,0% 1,0% 1,0% 1,0%
Count
% within Tindakan
% within Diagnosis 3
% of Total
Count
% within Tindakan
% within Diagnosis 3
% of Total
Count
% within Tindakan
% within Diagnosis 3
% of Total
Count
% within Tindakan
% within Diagnosis 3
% of Total
Count
% within Tindakan
% within Diagnosis 3
% of Total
Count
% within Tindakan
% within Diagnosis 3
% of Total
MgSo4, Vakum
Partus spontan
Sectio Caesaria
Transfusi
Vakum
Tindakan
Total
Gemelli Janin besar KPD Obesitas PEB
Diagnosis 3
Chi-Square Tests
10,884a 36 1,000
8,342 36 1,000
97
Pearson Chi-Square
Likelihood Ratio
N of Valid Cases
Value dfAsymp. Sig.
(2-sided)
47 cells (94,0%) have expected count less than 5. Theminimum expected count is ,01.
a.

VINA EKA WULANDARI [ G2AOO9193 ]
Symmetric Measures
,318 1,000
97
Contingency CoefficientNominal by Nominal
N of Valid Cases
Value Approx. Sig.
Not assuming the null hypothesis.a.
Using the asymptotic standard error assuming the null hypothesis.b.
Tindakan * Diagnosis 4
Crosstab
0 0 1 1
,0% ,0% 100,0% 100,0%
,0% ,0% 1,1% 1,0%
,0% ,0% 1,0% 1,0%
0 0 10 10
,0% ,0% 100,0% 100,0%
,0% ,0% 10,5% 10,3%
,0% ,0% 10,3% 10,3%
1 1 75 77
1,3% 1,3% 97,4% 100,0%
100,0% 100,0% 78,9% 79,4%
1,0% 1,0% 77,3% 79,4%
0 0 1 1
,0% ,0% 100,0% 100,0%
,0% ,0% 1,1% 1,0%
,0% ,0% 1,0% 1,0%
0 0 8 8
,0% ,0% 100,0% 100,0%
,0% ,0% 8,4% 8,2%
,0% ,0% 8,2% 8,2%
1 1 95 97
1,0% 1,0% 97,9% 100,0%
100,0% 100,0% 100,0% 100,0%
1,0% 1,0% 97,9% 100,0%
Count
% within Tindakan
% within Diagnosis 4
% of Total
Count
% within Tindakan
% within Diagnosis 4
% of Total
Count
% within Tindakan
% within Diagnosis 4
% of Total
Count
% within Tindakan
% within Diagnosis 4
% of Total
Count
% within Tindakan
% within Diagnosis 4
% of Total
Count
% within Tindakan
% within Diagnosis 4
% of Total
MgSo4, Vakum
Partus spontan
Sectio Caesaria
Transfusi
Vakum
Tindakan
Total
Fetal distress Obesitas Tidak ada
Diagnosis 4
Total
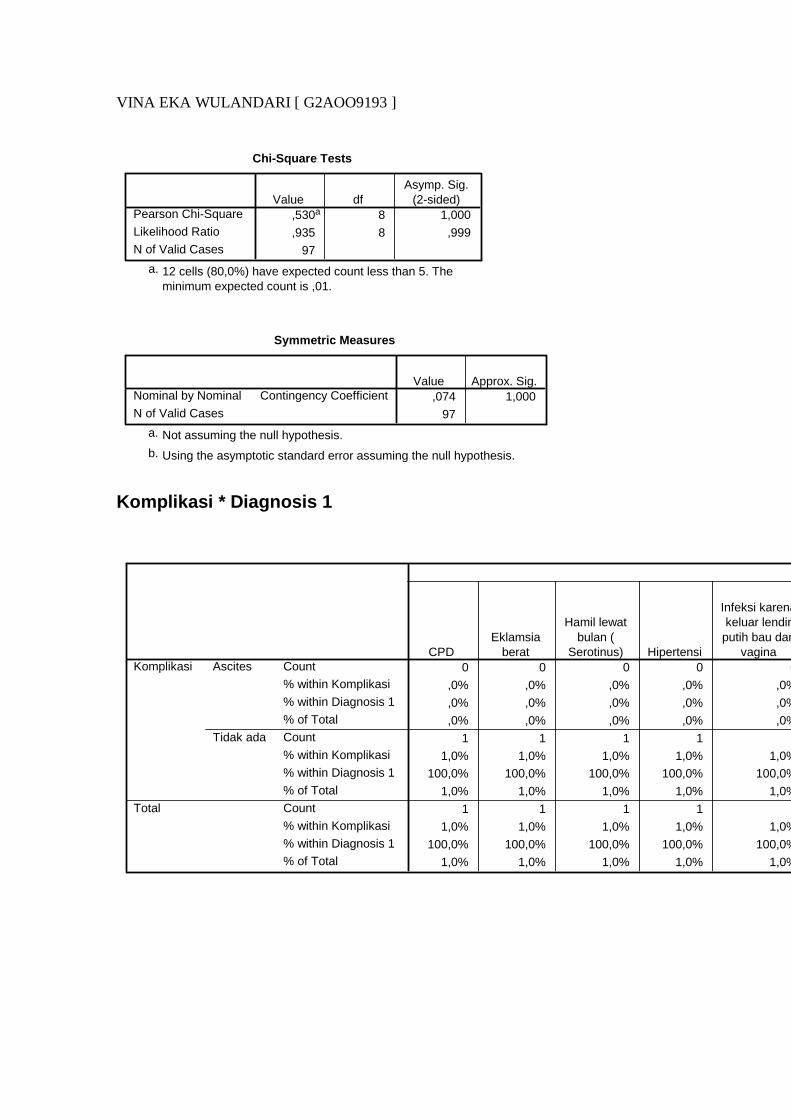
VINA EKA WULANDARI [ G2AOO9193 ]
Chi-Square Tests
,530a 8 1,000
,935 8 ,999
97
Pearson Chi-Square
Likelihood Ratio
N of Valid Cases
Value dfAsymp. Sig.
(2-sided)
12 cells (80,0%) have expected count less than 5. Theminimum expected count is ,01.
a.
Symmetric Measures
,074 1,000
97
Contingency CoefficientNominal by Nominal
N of Valid Cases
Value Approx. Sig.
Not assuming the null hypothesis.a.
Using the asymptotic standard error assuming the null hypothesis.b.
Komplikasi * Diagnosis 1
0 0 0 0 0
,0% ,0% ,0% ,0% ,0%
,0% ,0% ,0% ,0% ,0%
,0% ,0% ,0% ,0% ,0%
1 1 1 1 1
1,0% 1,0% 1,0% 1,0% 1,0%
100,0% 100,0% 100,0% 100,0% 100,0%
1,0% 1,0% 1,0% 1,0% 1,0%
1 1 1 1 1
1,0% 1,0% 1,0% 1,0% 1,0%
100,0% 100,0% 100,0% 100,0% 100,0%
1,0% 1,0% 1,0% 1,0% 1,0%
Count
% within Komplikasi
% within Diagnosis 1
% of Total
Count
% within Komplikasi
% within Diagnosis 1
% of Total
Count
% within Komplikasi
% within Diagnosis 1
% of Total
Ascites
Tidak ada
Komplikasi
Total
CPDEklamsia
berat
Hamil lewatbulan (
Serotinus) Hipertensi
Infeksi karenakeluar lendir
putih bau darivagina

VINA EKA WULANDARI [ G2AOO9193 ]
Chi-Square Tests
2,052a 19 1,000
2,239 19 1,000
97
Pearson Chi-Square
Likelihood Ratio
N of Valid Cases
Value dfAsymp. Sig.
(2-sided)
37 cells (92,5%) have expected count less than 5. Theminimum expected count is ,01.
a.
Symmetric Measures
,144 1,000
97
Contingency CoefficientNominal by Nominal
N of Valid Cases
Value Approx. Sig.
Not assuming the null hypothesis.a.
Using the asymptotic standard error assuming the null hypothesis.b.
Komplikasi * Diagnosis 2
0 0 0 0 0
,0% ,0% ,0% ,0% ,0%
,0% ,0% ,0% ,0% ,0%
,0% ,0% ,0% ,0% ,0%
2 2 3 2 1
2,1% 2,1% 3,1% 2,1% 1,0%
100,0% 100,0% 100,0% 100,0% 100,0%
2,1% 2,1% 3,1% 2,1% 1,0%
2 2 3 2 1
2,1% 2,1% 3,1% 2,1% 1,0%
100,0% 100,0% 100,0% 100,0% 100,0%
2,1% 2,1% 3,1% 2,1% 1,0%
Count
% within Komplikasi
% within Diagnosis 2
% of Total
Count
% within Komplikasi
% within Diagnosis 2
% of Total
Count
% within Komplikasi
% within Diagnosis 2
% of Total
Ascites
Tidak ada
Komplikasi
Total
AnemiaEklamsia
berat Fetal distress Gemelli Hidramion

VINA EKA WULANDARI [ G2AOO9193 ]
Chi-Square Tests
,651a 19 1,000
1,001 19 1,000
97
Pearson Chi-Square
Likelihood Ratio
N of Valid Cases
Value dfAsymp. Sig.
(2-sided)
38 cells (95,0%) have expected count less than 5. Theminimum expected count is ,01.
a.
Symmetric Measures
,082 1,000
97
Contingency CoefficientNominal by Nominal
N of Valid Cases
Value Approx. Sig.
Not assuming the null hypothesis.a.
Using the asymptotic standard error assuming the null hypothesis.b.
Komplikasi * Diagnosis 3
Crosstab
0 0 0 0 0
,0% ,0% ,0% ,0% ,0%
,0% ,0% ,0% ,0% ,0%
,0% ,0% ,0% ,0% ,0%
1 1 1 1 1
1,0% 1,0% 1,0% 1,0% 1,0%
100,0% 100,0% 100,0% 100,0% 100,0% 100,0%
1,0% 1,0% 1,0% 1,0% 1,0%
1 1 1 1 1
1,0% 1,0% 1,0% 1,0% 1,0%
100,0% 100,0% 100,0% 100,0% 100,0% 100,0%
1,0% 1,0% 1,0% 1,0% 1,0%
Count
% within Komplikasi
% within Diagnosis 3
% of Total
Count
% within Komplikasi
% within Diagnosis 3
% of Total
Count
% within Komplikasi
% within Diagnosis 3
% of Total
Ascites
Tidak ada
Komplikasi
Total
Gemelli Janin besar KPD Obesitas PEB PER
Diagnosis 3

VINA EKA WULANDARI [ G2AOO9193 ]
Chi-Square Tests
,103a 9 1,000
,196 9 1,000
97
Pearson Chi-Square
Likelihood Ratio
N of Valid Cases
Value dfAsymp. Sig.
(2-sided)
19 cells (95,0%) have expected count less than 5. Theminimum expected count is ,01.
a.
Symmetric Measures
,033 1,000
97
Contingency CoefficientNominal by Nominal
N of Valid Cases
Value Approx. Sig.
Not assuming the null hypothesis.a.
Using the asymptotic standard error assuming the null hypothesis.b.
Komplikasi * Diagnosis 4
Crosstab
0 0 1 1
,0% ,0% 100,0% 100,0%
,0% ,0% 1,1% 1,0%
,0% ,0% 1,0% 1,0%
1 1 94 96
1,0% 1,0% 97,9% 100,0%
100,0% 100,0% 98,9% 99,0%
1,0% 1,0% 96,9% 99,0%
1 1 95 97
1,0% 1,0% 97,9% 100,0%
100,0% 100,0% 100,0% 100,0%
1,0% 1,0% 97,9% 100,0%
Count
% within Komplikasi
% within Diagnosis 4
% of Total
Count
% within Komplikasi
% within Diagnosis 4
% of Total
Count
% within Komplikasi
% within Diagnosis 4
% of Total
Ascites
Tidak ada
Komplikasi
Total
Fetal distress Obesitas Tidak ada
Diagnosis 4
Total
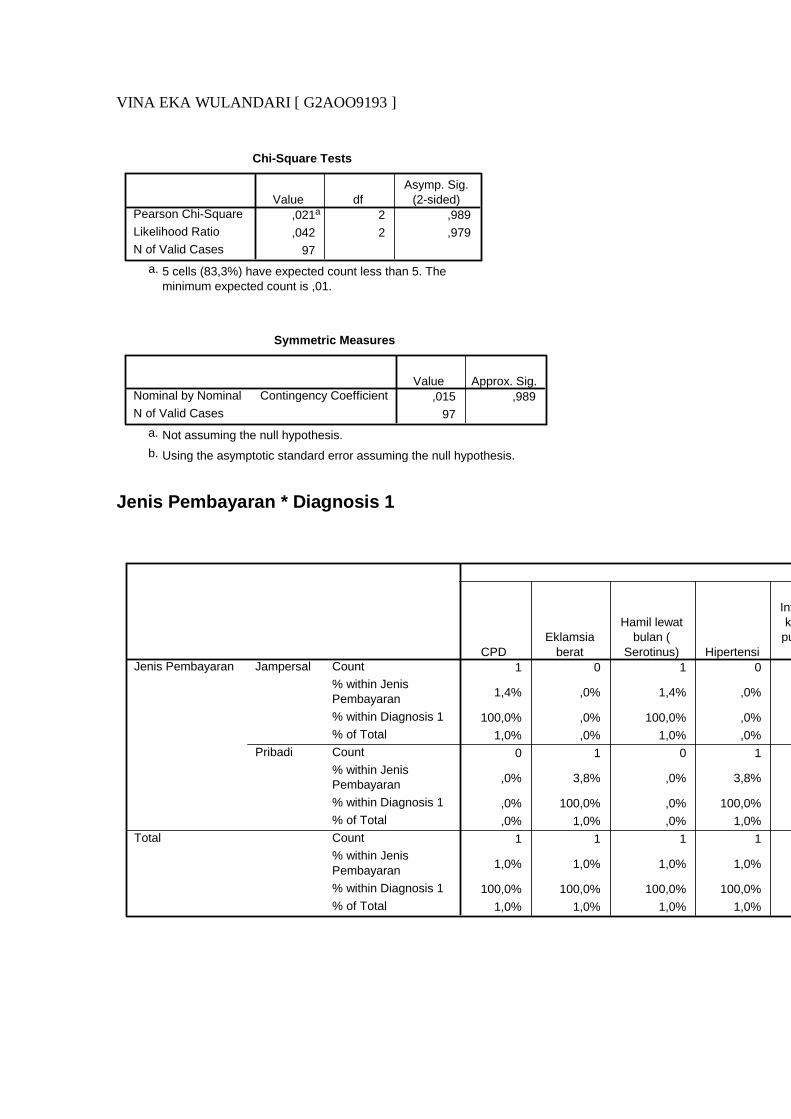
VINA EKA WULANDARI [ G2AOO9193 ]
Chi-Square Tests
,021a 2 ,989
,042 2 ,979
97
Pearson Chi-Square
Likelihood Ratio
N of Valid Cases
Value dfAsymp. Sig.
(2-sided)
5 cells (83,3%) have expected count less than 5. Theminimum expected count is ,01.
a.
Symmetric Measures
,015 ,989
97
Contingency CoefficientNominal by Nominal
N of Valid Cases
Value Approx. Sig.
Not assuming the null hypothesis.a.
Using the asymptotic standard error assuming the null hypothesis.b.
Jenis Pembayaran * Diagnosis 1
1 0 1 0
1,4% ,0% 1,4% ,0%
100,0% ,0% 100,0% ,0%
1,0% ,0% 1,0% ,0%
0 1 0 1
,0% 3,8% ,0% 3,8%
,0% 100,0% ,0% 100,0%
,0% 1,0% ,0% 1,0%
1 1 1 1
1,0% 1,0% 1,0% 1,0%
100,0% 100,0% 100,0% 100,0%
1,0% 1,0% 1,0% 1,0%
Count
% within JenisPembayaran
% within Diagnosis 1
% of Total
Count
% within JenisPembayaran
% within Diagnosis 1
% of Total
Count
% within JenisPembayaran
% within Diagnosis 1
% of Total
Jampersal
Pribadi
Jenis Pembayaran
Total
CPDEklamsia
berat
Hamil lewatbulan (
Serotinus) Hipertensi
Infeksi karenakeluar lendir
putih bau dari
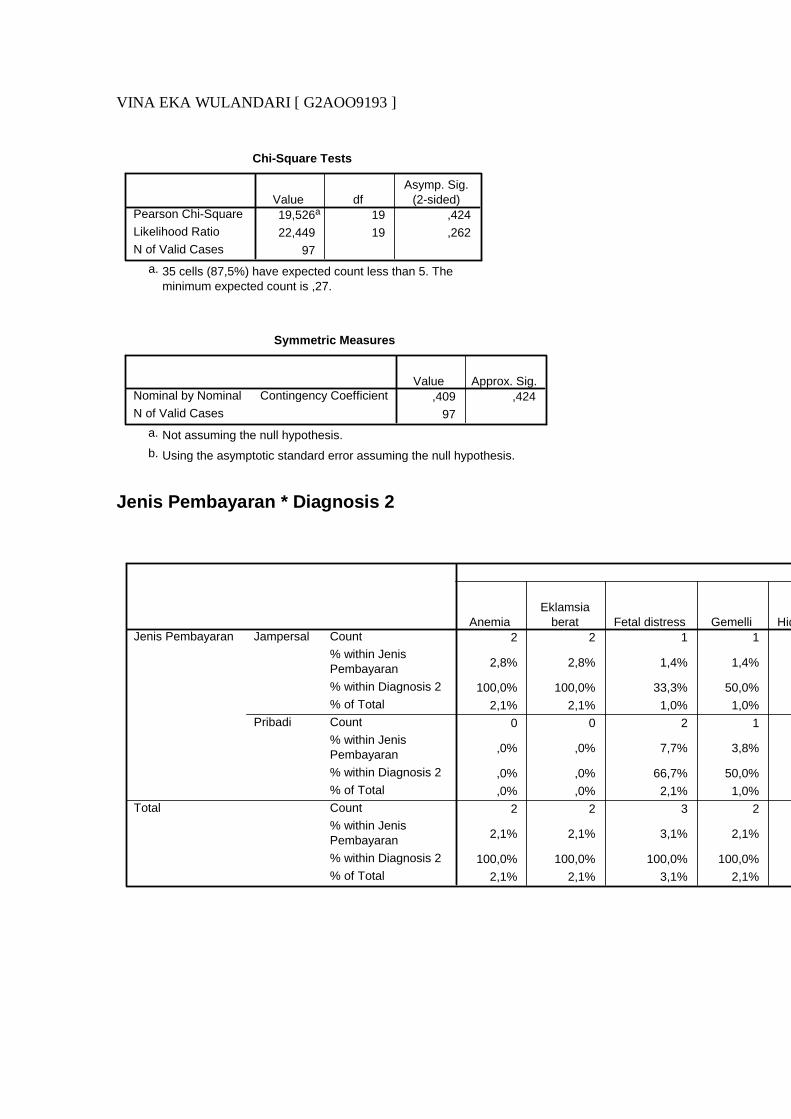
VINA EKA WULANDARI [ G2AOO9193 ]
Chi-Square Tests
19,526a 19 ,424
22,449 19 ,262
97
Pearson Chi-Square
Likelihood Ratio
N of Valid Cases
Value dfAsymp. Sig.
(2-sided)
35 cells (87,5%) have expected count less than 5. Theminimum expected count is ,27.
a.
Symmetric Measures
,409 ,424
97
Contingency CoefficientNominal by Nominal
N of Valid Cases
Value Approx. Sig.
Not assuming the null hypothesis.a.
Using the asymptotic standard error assuming the null hypothesis.b.
Jenis Pembayaran * Diagnosis 2
2 2 1 1
2,8% 2,8% 1,4% 1,4%
100,0% 100,0% 33,3% 50,0%
2,1% 2,1% 1,0% 1,0%
0 0 2 1
,0% ,0% 7,7% 3,8%
,0% ,0% 66,7% 50,0%
,0% ,0% 2,1% 1,0%
2 2 3 2
2,1% 2,1% 3,1% 2,1%
100,0% 100,0% 100,0% 100,0%
2,1% 2,1% 3,1% 2,1%
Count
% within JenisPembayaran
% within Diagnosis 2
% of Total
Count
% within JenisPembayaran
% within Diagnosis 2
% of Total
Count
% within JenisPembayaran
% within Diagnosis 2
% of Total
Jampersal
Pribadi
Jenis Pembayaran
Total
AnemiaEklamsia
berat Fetal distress Gemelli Hidramion

VINA EKA WULANDARI [ G2AOO9193 ]
Chi-Square Tests
23,843a 19 ,202
27,824 19 ,087
97
Pearson Chi-Square
Likelihood Ratio
N of Valid Cases
Value dfAsymp. Sig.
(2-sided)
38 cells (95,0%) have expected count less than 5. Theminimum expected count is ,27.
a.
Symmetric Measures
,444 ,202
97
Contingency CoefficientNominal by Nominal
N of Valid Cases
Value Approx. Sig.
Not assuming the null hypothesis.a.
Using the asymptotic standard error assuming the null hypothesis.b.
Jenis Pembayaran * Diagnosis 3
Crosstab
1 0 1 1
1,4% ,0% 1,4% 1,4% 1,4%
100,0% ,0% 100,0% 100,0% 100,0%
1,0% ,0% 1,0% 1,0% 1,0%
0 1 0 0
,0% 3,8% ,0% ,0% ,0%
,0% 100,0% ,0% ,0% ,0%
,0% 1,0% ,0% ,0% ,0%
1 1 1 1
1,0% 1,0% 1,0% 1,0% 1,0%
100,0% 100,0% 100,0% 100,0% 100,0%
1,0% 1,0% 1,0% 1,0% 1,0%
Count
% within JenisPembayaran
% within Diagnosis 3
% of Total
Count
% within JenisPembayaran
% within Diagnosis 3
% of Total
Count
% within JenisPembayaran
% within Diagnosis 3
% of Total
Jampersal
Pribadi
Jenis Pembayaran
Total
Gemelli Janin besar KPD Obesitas PEB
Diagnosis 3

VINA EKA WULANDARI [ G2AOO9193 ]
Chi-Square Tests
8,035a 9 ,531
9,645 9 ,380
97
Pearson Chi-Square
Likelihood Ratio
N of Valid Cases
Value dfAsymp. Sig.
(2-sided)
18 cells (90,0%) have expected count less than 5. Theminimum expected count is ,27.
a.
Symmetric Measures
,277 ,531
97
Contingency CoefficientNominal by Nominal
N of Valid Cases
Value Approx. Sig.
Not assuming the null hypothesis.a.
Using the asymptotic standard error assuming the null hypothesis.b.
Jenis Pembayaran * Diagnosis 4
Crosstab
1 1 69 71
1,4% 1,4% 97,2% 100,0%
100,0% 100,0% 72,6% 73,2%
1,0% 1,0% 71,1% 73,2%
0 0 26 26
,0% ,0% 100,0% 100,0%
,0% ,0% 27,4% 26,8%
,0% ,0% 26,8% 26,8%
1 1 95 97
1,0% 1,0% 97,9% 100,0%
100,0% 100,0% 100,0% 100,0%
1,0% 1,0% 97,9% 100,0%
Count
% within JenisPembayaran
% within Diagnosis 4
% of Total
Count
% within JenisPembayaran
% within Diagnosis 4
% of Total
Count
% within JenisPembayaran
% within Diagnosis 4
% of Total
Jampersal
Pribadi
Jenis Pembayaran
Total
Fetal distress Obesitas Tidak ada
Diagnosis 4
Total
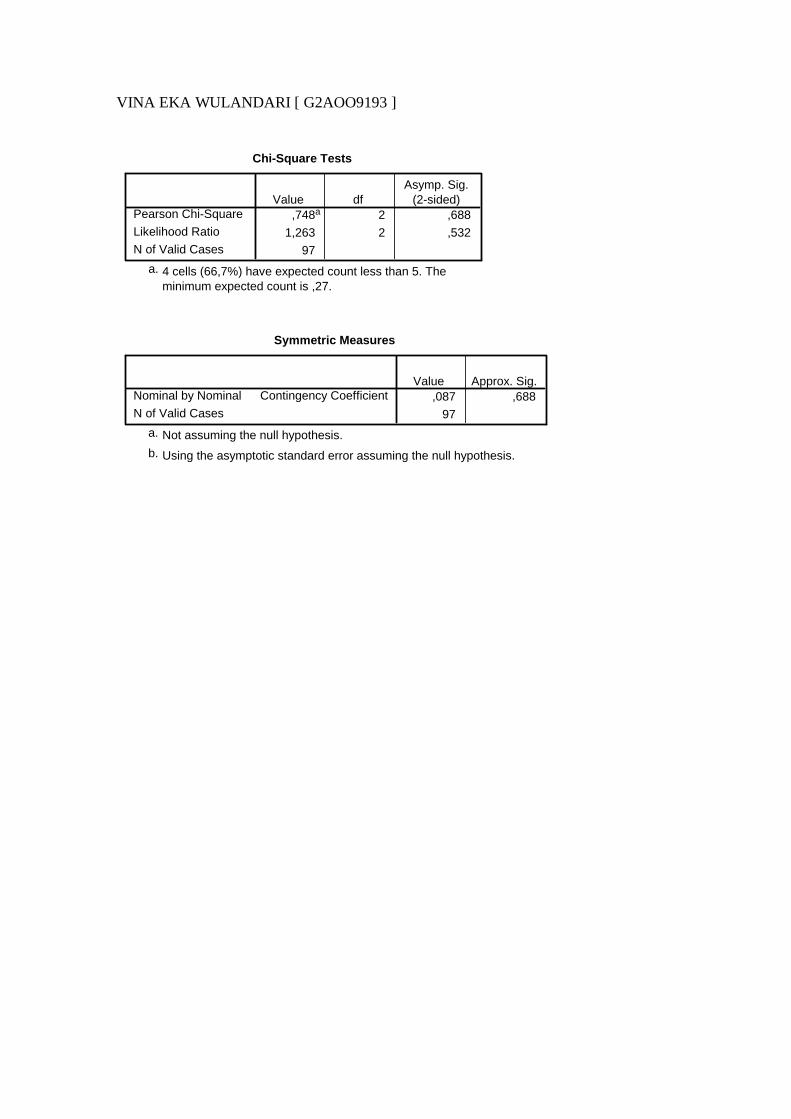
VINA EKA WULANDARI [ G2AOO9193 ]
Chi-Square Tests
,748a 2 ,688
1,263 2 ,532
97
Pearson Chi-Square
Likelihood Ratio
N of Valid Cases
Value dfAsymp. Sig.
(2-sided)
4 cells (66,7%) have expected count less than 5. Theminimum expected count is ,27.
a.
Symmetric Measures
,087 ,688
97
Contingency CoefficientNominal by Nominal
N of Valid Cases
Value Approx. Sig.
Not assuming the null hypothesis.a.
Using the asymptotic standard error assuming the null hypothesis.b.
Related Documents