Edelweiss Research is also available on www.edelresearch.com, Bloomberg EDEL <GO>, Thomson First Call, Reuters and Factset. Edelweiss Securities Limited Financials (INR mn) Year to March Q4FY17 Q4FY16 % change Q3FY17 % change FY16 FY17E FY18E Net sales 19,090 20,061 (4.8) 18,477 3.3 78,507 76,801 85,354 EBITDA 4,176 4,152 0.6 3,339 25.1 15,183 15,089 16,634 Adjusted Profit 3,331 3,315 0.5 2,938 13.4 12,512 12,769 14,472 Adj Dil. EPS (INR) 1.9 1.9 0.5 1.7 13.4 7.1 7.3 8.2 Diluted P/E(x) 40.4 39.5 34.9 EV/EBITDA (x) 33.2 33.4 29.9 ROAE (%) 33.2 28.3 27.5 Dabur India’s (Dabur) Q4FY17 revenue (down 4.8% YoY) came in line, while EBITDA and PAT (flattish YoY) surpassed estimates led by better‐ than‐expected margin. Despite strong base of 7% YoY, domestic volumes jumped 2.4% YoY (down 5.0% YoY in Q3FY17). Gross margin dipped by 163bps YoY, but EBITDA margin surged 115bps YoY led by 136bps YoY savings in ad spends and 100bps and 42bps YoY savings in staff and other expenses, respectively. Dabur gaining market shares in key categories— oral care, hair care, home care, skin, foods—is a positive and we envisage it to be key beneficiary of increasing herbal trend. Maintain ‘BUY’. Domestic business on recovery road; international operations tepid Dabur’s domestic business clocked overall growth of 0.1% YoY versus dip of 6.5% YoY in Q3FY17. While toothpaste, foods and health supplements jumped 9.0%, 7.9% and 5.0% YoY, respectively, growth in hair care, home care and OTC & ethicals dipped 4.0%, 6.5% and 4.0% YoY, respectively. However, market share gains sustained—garnered 30bps in hair oil, 100bps in toothpaste, 70bps in air fresheners, 100bps in mosquito repellent creams and 300bps YoY in juices. International business was impacted by currency devaluation in Egypt, Turkey & Nigeria and economic slowdown in MENA region—reported 4.5% YoY dip in constant currency growth (CCG; flattish in Q3FY17), though growth in local currency was strong. Q4FY17 conference call: Key takeaways GST will lead to destocking in Q1FY18—Dabur and distributors are largely ready for implementation, but lower down the chain preparedness is weak. The company’s rural growth surpassed overall growth in Q4FY17. Dabur has started regaining some of the lost share in honey; it believes the worst is behind in terms of competition from Patanjali. Shampoo portfolio continued to remain under pressure due to impact on wholesale channel—shifted Vatika to ayurvedic from current herbal positioning. Outlook and valuations: Positive; maintain ‘BUY’ We expect recovery in volumes and premiumisation on back of new launches and ayurvedic focus. Uptick in rural spending and government’s stimulus remain key triggers. The stock is trading at 29.8x FY19E EPS. We maintain ‘BUY /SO’ with a target price of INR327. RESULT UPDATE DABUR Volumes in revival mode; GST key monitorable EDELWEISS 4D RATINGS Absolute Rating BUY Rating Relative to Sector Outperform Risk Rating Relative to Sector Medium Sector Relative to Market Underweight MARKET DATA (R: DABU.BO, B: DABUR IN) CMP : INR 287 Target Price : INR 327 52‐week range (INR) : 320 / 259 Share in issue (mn) : 1,761.5 M cap (INR bn/USD mn) : 505 / 7,855 Avg. Daily Vol.BSE/NSE(‘000) : 1,509.7 SHARE HOLDING PATTERN (%) Current Q2FY17 Q1FY17 Promoters * 68.0 68.0 68.0 MF's, FI's & BK’s 5.8 5.6 5.6 FII's 20.0 19.8 19.8 Others 6.2 6.5 6.6 * Promoters pledged shares (% of share in issue) : Nil PRICE PERFORMANCE (%) Stock Nifty EW Consumer goods Index 1 month 4.3 2.2 2.1 3 months 3.4 7.7 9.8 12 months 6.3 18.6 22.4 Abneesh Roy +91 22 6620 3141 [email protected] Tanmay Sharma, CFA +91 22 4040 7586 [email protected] Alok Shah +91 22 6620 3040 [email protected] India Equity Research| Consumer Goods May 2, 2017

Welcome message from author
This document is posted to help you gain knowledge. Please leave a comment to let me know what you think about it! Share it to your friends and learn new things together.
Transcript
Edelweiss Research is also available on www.edelresearch.com, Bloomberg EDEL <GO>, Thomson First Call, Reuters and Factset. Edelweiss Securities Limited
Financials (INR mn)
Year to March Q4FY17 Q4FY16 % change Q3FY17 % change FY16 FY17E FY18E
Net sales 19,090 20,061 (4.8) 18,477 3.3 78,507 76,801 85,354
EBITDA 4,176 4,152 0.6 3,339 25.1 15,183 15,089 16,634
Adjusted Profit 3,331 3,315 0.5 2,938 13.4 12,512 12,769 14,472
Adj Dil. EPS (INR) 1.9 1.9 0.5 1.7 13.4 7.1 7.3 8.2
Diluted P/E (x) 40.4 39.5 34.9
EV/EBITDA (x) 33.2 33.4 29.9
ROAE (%) 33.2 28.3 27.5
Dabur India’s (Dabur) Q4FY17 revenue (down 4.8% YoY) came in line, while EBITDA and PAT (flattish YoY) surpassed estimates led by better‐than‐expected margin. Despite strong base of 7% YoY, domestic volumes jumped 2.4% YoY (down 5.0% YoY in Q3FY17). Gross margin dipped by 163bps YoY, but EBITDA margin surged 115bps YoY led by 136bps YoY savings in ad spends and 100bps and 42bps YoY savings in staff and other expenses, respectively. Dabur gaining market shares in key categories—oral care, hair care, home care, skin, foods—is a positive and we envisage it to be key beneficiary of increasing herbal trend. Maintain ‘BUY’.
Domestic business on recovery road; international operations tepid
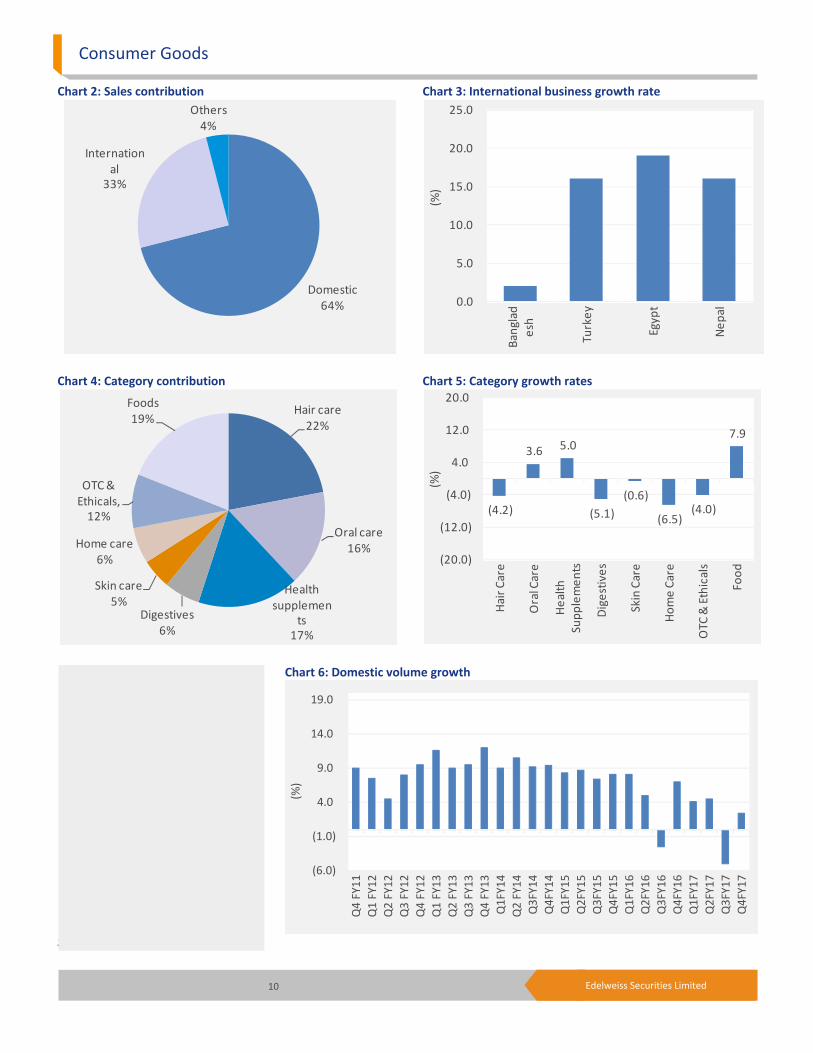
Dabur’s domestic business clocked overall growth of 0.1% YoY versus dip of 6.5% YoY in
Q3FY17. While toothpaste, foods and health supplements jumped 9.0%, 7.9% and 5.0%
YoY, respectively, growth in hair care, home care and OTC & ethicals dipped 4.0%, 6.5%
and 4.0% YoY, respectively. However, market share gains sustained—garnered 30bps
in hair oil, 100bps in toothpaste, 70bps in air fresheners, 100bps in mosquito
repellent creams and 300bps YoY in juices. International business was impacted by
currency devaluation in Egypt, Turkey & Nigeria and economic slowdown in MENA
region—reported 4.5% YoY dip in constant currency growth (CCG; flattish in Q3FY17),
though growth in local currency was strong.
Q4FY17 conference call: Key takeaways
GST will lead to destocking in Q1FY18—Dabur and distributors are largely ready for
implementation, but lower down the chain preparedness is weak. The company’s rural
growth surpassed overall growth in Q4FY17. Dabur has started regaining some of the
lost share in honey; it believes the worst is behind in terms of competition from
Patanjali. Shampoo portfolio continued to remain under pressure due to impact on
wholesale channel—shifted Vatika to ayurvedic from current herbal positioning.
Outlook and valuations: Positive; maintain ‘BUY’
We expect recovery in volumes and premiumisation on back of new launches and
ayurvedic focus. Uptick in rural spending and government’s stimulus remain key
triggers. The stock is trading at 29.8x FY19E EPS. We maintain ‘BUY /SO’ with a target
price of INR327.
RESULT UPDATE
DABUR Volumes in revival mode; GST key monitorable
EDELWEISS 4D RATINGS
Absolute Rating BUY
Rating Relative to Sector Outperform
Risk Rating Relative to Sector Medium
Sector Relative to Market Underweight
MARKET DATA (R: DABU.BO, B: DABUR IN)
CMP : INR 287
Target Price : INR 327
52‐week range (INR) : 320 / 259
Share in issue (mn) : 1,761.5
M cap (INR bn/USD mn) : 505 / 7,855
Avg. Daily Vol.BSE/NSE(‘000) : 1,509.7 SHARE HOLDING PATTERN (%)
Current Q2FY17 Q1FY17
Promoters *
68.0 68.0 68.0
MF's, FI's & BK’s 5.8 5.6 5.6
FII's 20.0 19.8 19.8
Others 6.2 6.5 6.6
* Promoters pledged shares (% of share in issue)
: Nil
PRICE PERFORMANCE (%)
Stock Nifty
EW Consumer goods Index
1 month 4.3 2.2 2.1
3 months 3.4 7.7 9.8
12 months 6.3 18.6 22.4
Abneesh Roy +91 22 6620 3141
Tanmay Sharma, CFA +91 22 4040 7586
Alok Shah +91 22 6620 3040
India Equity Research| Consumer Goods
May 2, 2017
Consumer Goods
2 Edelweiss Securities Limited
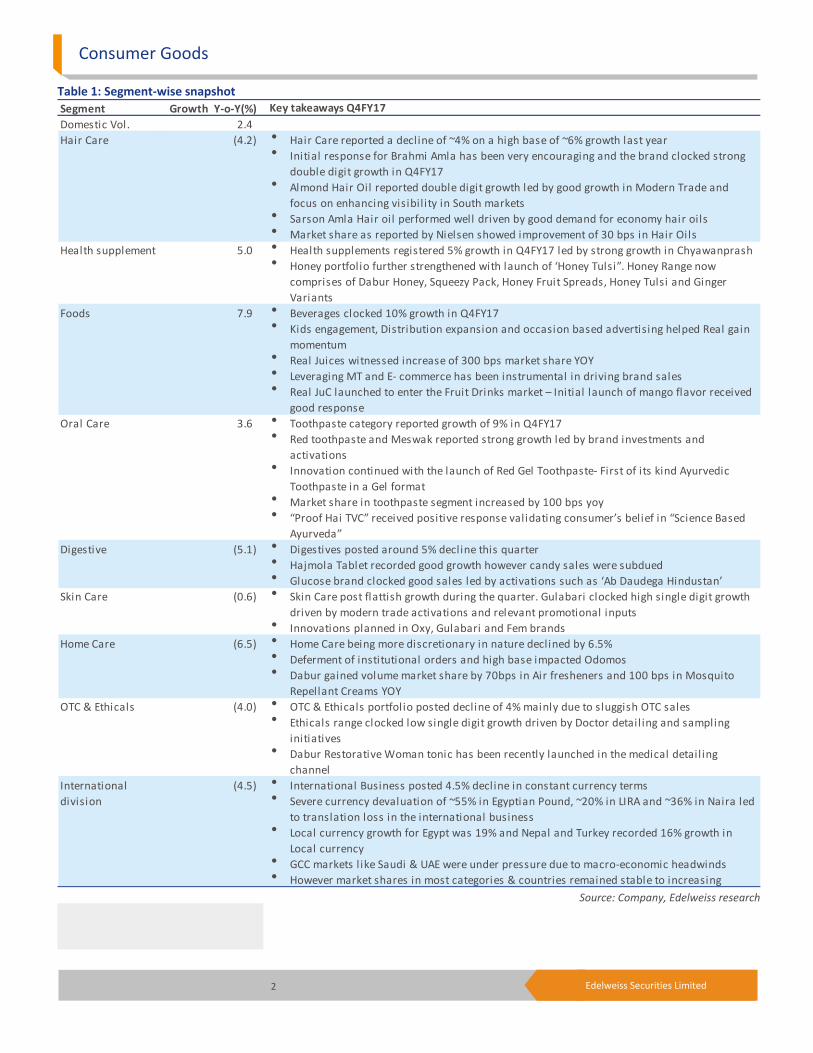
Table 1: Segment‐wise snapshot
Source: Company, Edelweiss research
Segment Growth Y‐o‐Y(%)
Domestic Vol. 2.4
Hair Care Hair Care reported a decline of ~4% on a high base of ~6% growth last year Initial response for Brahmi Amla has been very encouraging and the brand clocked strong
double digit growth in Q4FY17 Almond Hair Oil reported double digit growth led by good growth in Modern Trade and
focus on enhancing visibility in South markets Sarson Amla Hair oil performed well driven by good demand for economy hair oils Market share as reported by Nielsen showed improvement of 30 bps in Hair Oils
Health supplement 5.0 Health supplements registered 5% growth in Q4FY17 led by strong growth in Chyawanprash Honey portfolio further strengthened with launch of ‘Honey Tulsi”. Honey Range now
comprises of Dabur Honey, Squeezy Pack, Honey Fruit Spreads, Honey Tulsi and Ginger
Variants
Foods 7.9 Beverages clocked 10% growth in Q4FY17 Kids engagement, Distribution expansion and occasion based advertising helped Real gain
momentum Real Juices witnessed increase of 300 bps market share YOY Leveraging MT and E‐ commerce has been instrumental in driving brand sales Real JuC launched to enter the Fruit Drinks market – Initial launch of mango flavor received
good response
Oral Care 3.6 Toothpaste category reported growth of 9% in Q4FY17 Red toothpaste and Meswak reported strong growth led by brand investments and
activations Innovation continued with the launch of Red Gel Toothpaste‐ First of its kind Ayurvedic
Toothpaste in a Gel format Market share in toothpaste segment increased by 100 bps yoy “Proof Hai TVC” received positive response validating consumer’s belief in “Science Based
Ayurveda”
Digestive (5.1) Digestives posted around 5% decline this quarter Hajmola Tablet recorded good growth however candy sales were subdued Glucose brand clocked good sales led by activations such as ‘Ab Daudega Hindustan’
Skin Care (0.6) Skin Care post flattish growth during the quarter. Gulabari clocked high single digit growth
driven by modern trade activations and relevant promotional inputs Innovations planned in Oxy, Gulabari and Fem brands
Home Care (6.5) Home Care being more discretionary in nature declined by 6.5% Deferment of institutional orders and high base impacted Odomos Dabur gained volume market share by 70bps in Air fresheners and 100 bps in Mosquito
Repellant Creams YOY
OTC & Ethicals (4.0) OTC & Ethicals portfolio posted decline of 4% mainly due to sluggish OTC sales Ethicals range clocked low single digit growth driven by Doctor detail ing and sampling
initiatives Dabur Restorative Woman tonic has been recently launched in the medical detail ing
channel
(4.5) International Business posted 4.5% decline in constant currency terms Severe currency devaluation of ~55% in Egyptian Pound, ~20% in LIRA and ~36% in Naira led
to translation loss in the international business Local currency growth for Egypt was 19% and Nepal and Turkey recorded 16% growth in
Local currency GCC markets l ike Saudi & UAE were under pressure due to macro‐economic headwinds However market shares in most categories & countries remained stable to increasing
Key takeaways Q4FY17
(4.2)
International
division
Dabur
3 Edelweiss Securities Limited
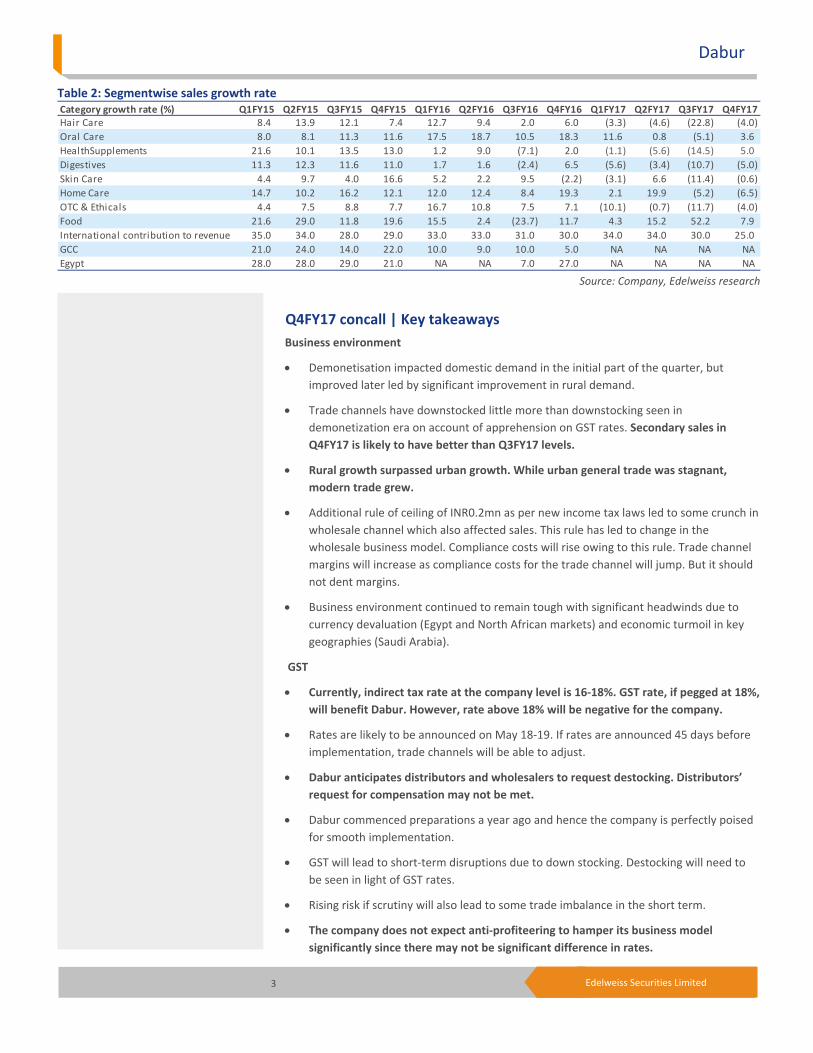
Table 2: Segmentwise sales growth rate
Source: Company, Edelweiss research
Q4FY17 concall | Key takeaways
Business environment
Demonetisation impacted domestic demand in the initial part of the quarter, but
improved later led by significant improvement in rural demand.
Trade channels have downstocked little more than downstocking seen in
demonetization era on account of apprehension on GST rates. Secondary sales in
Q4FY17 is likely to have better than Q3FY17 levels.
Rural growth surpassed urban growth. While urban general trade was stagnant,
modern trade grew.
Additional rule of ceiling of INR0.2mn as per new income tax laws led to some crunch in
wholesale channel which also affected sales. This rule has led to change in the
wholesale business model. Compliance costs will rise owing to this rule. Trade channel
margins will increase as compliance costs for the trade channel will jump. But it should
not dent margins.
Business environment continued to remain tough with significant headwinds due to
currency devaluation (Egypt and North African markets) and economic turmoil in key
geographies (Saudi Arabia).
GST
Currently, indirect tax rate at the company level is 16‐18%. GST rate, if pegged at 18%,
will benefit Dabur. However, rate above 18% will be negative for the company.
Rates are likely to be announced on May 18‐19. If rates are announced 45 days before
implementation, trade channels will be able to adjust.
Dabur anticipates distributors and wholesalers to request destocking. Distributors’
request for compensation may not be met.
Dabur commenced preparations a year ago and hence the company is perfectly poised
for smooth implementation.
GST will lead to short‐term disruptions due to down stocking. Destocking will need to
be seen in light of GST rates.
Rising risk if scrutiny will also lead to some trade imbalance in the short term.
The company does not expect anti‐profiteering to hamper its business model
significantly since there may not be significant difference in rates.
Category growth rate (%) Q1FY15 Q2FY15 Q3FY15 Q4FY15 Q1FY16 Q2FY16 Q3FY16 Q4FY16 Q1FY17 Q2FY17 Q3FY17 Q4FY17Hair Care 8.4 13.9 12.1 7.4 12.7 9.4 2.0 6.0 (3.3) (4.6) (22.8) (4.0)
Oral Care 8.0 8.1 11.3 11.6 17.5 18.7 10.5 18.3 11.6 0.8 (5.1) 3.6
HealthSupplements 21.6 10.1 13.5 13.0 1.2 9.0 (7.1) 2.0 (1.1) (5.6) (14.5) 5.0
Digestives 11.3 12.3 11.6 11.0 1.7 1.6 (2.4) 6.5 (5.6) (3.4) (10.7) (5.0)
Skin Care 4.4 9.7 4.0 16.6 5.2 2.2 9.5 (2.2) (3.1) 6.6 (11.4) (0.6)
Home Care 14.7 10.2 16.2 12.1 12.0 12.4 8.4 19.3 2.1 19.9 (5.2) (6.5)
OTC & Ethicals 4.4 7.5 8.8 7.7 16.7 10.8 7.5 7.1 (10.1) (0.7) (11.7) (4.0)
Food 21.6 29.0 11.8 19.6 15.5 2.4 (23.7) 11.7 4.3 15.2 52.2 7.9
International contribution to revenue 35.0 34.0 28.0 29.0 33.0 33.0 31.0 30.0 34.0 34.0 30.0 25.0
GCC 21.0 24.0 14.0 22.0 10.0 9.0 10.0 5.0 NA NA NA NA
Egypt 28.0 28.0 29.0 21.0 NA NA 7.0 27.0 NA NA NA NA
Consumer Goods
4 Edelweiss Securities Limited
The company expects down stocking in Q1FY18 and up‐stocking in Q2FY18, but this up‐
stocking may not be quick.
Demand will hinge on off take by consumers. If the wholesale channel is stuck, then
cash and carry may fill the void.
Overall growth
Domestic volumes jumped 2.4% YoY. Overall value growth was 0.7% YoY in the
domestic business.
Dabur is targeting 5‐10% volume growth in FY18. This growth will be slightly back‐
ended.
Overall growth was flattish in constant currency owing to currency devaluation.
The company effected marginal price hike in toothpaste, home care and chyawanprash.
Whole pricing change is expected post GST. A few companies are hiking prices now to
avoid the anti‐profiteering regime under GST.
Increase in infrastructure spending, rise in digital modes of advertisement should boost
sales.
International business declined due to economic slowdown in GCC markets and
currency impact.
Going forward, price hikes will be more to maintain margins and to nullify impact of
inflation.
Margins
Gross margins impacted by higher raw material prices and adverse currency impact.
Employee expenses fell 100bps YoY on account of reduction in variable payouts.
Cost control in overheads led to lower other expenses.
Oral care
Toothpaste category grew 9% in Q4FY17. Red toothpaste and Meswak reported strong
spurt led by brand investments and activations.
Market share in toothpaste segment increased 100bps YoY.
Launched Red Toothpaste in gel format.
Hair care
Hair care declined 4% YoY on a base of ~6% growth last year.
Hair oil category slipped 3%. Hair oil category, excluding amla category, is INR3.5bn.
Sarso, Amla, Vatika are an >INR1bn brand; Almond is sub‐INR0.5bn brand.
Initial response for Brahmi Amla has been encouraging and the brand clocked strong
double digit growth in Q4FY17.
Almond Hair Oil reported double digit growth led by good growth in modern trade and
focus on enhancing visibility in South markets.
Sarson Amla Hair Oil performed well, driven by good demand for economy hair oils.
Market share, as reported by Nielsen, improved 30bps in hair oils.
Dabur
5 Edelweiss Securities Limited
Shampoo category continued to see some stress. With respect to Dabur Vatika, natural
as a proposition has become more generic. Strategy is now to move Dabur Vatika as a
an ayurvedic product. Its market share is ~5.0‐5.3%. This category is decently profitable.
Home and skin care
Home care declined 6.5% YoY.
Dabur gained 70bps volume market share in air fresheners and 100bps in mosquito
repellant creams YoY.
Skin care posted flattish growth during the quarter. Gulabari clocked high single digit
growth driven by modern trade activations and relevant promotional inputs.
Plan is to increase retail presence for Gulabari and Fem.
Heatlhcare
Health supplements grew 5% YoY in Q4FY17 led by strong spurt in Chyawanprash. Late
winter boosted sales.
Honey sales declined marginally. Value proposition such as giving more for same price
is helping Dabur. Headroom for discounting is limited since honey prices have jumped.
Competitive intensity is not significant in the honey category. Dabur has the ability to
hold prices for the next 6‐8 months since it has sufficient quantity of raw honey
inventory. in Q1FY18 as well the company will not increase prices of honey.
Honey portfolio further strengthened with launch of ‘Honey Tulsi’.
Digestives fell around 5% YoY in Q4FY17—Hajmola Tablet recorded good growth;
however, candy sales were subdued.
OTC and ethicals
OTC & ethicals portfolio declined 4% YoY primarily due to sluggish OTC sales.
Ethicals range clocked low single digit growth driven by doctor detailing and sampling
initiatives.
Foods
Beverages grew 10% YoY in Q4FY17. Operating margins in juices slipped to 11% (14%
earlier) owing to higher raw material cost. Dabur is targeting operating margin of 14%;
however, it will depend on GST rates.
Real Juices gained 300bps market share YoY. Dabur’s market share is sustainable till
mid‐50% level. The company’s share in South is minuscule. The company could use
the Sri Lanka factory to source for South market.
Coconut water is doing well. The company is planning to ramp up production. Demand
spikes during epidemics.
Kiwi spread etc., is restricted to modern trade channel. The company is not investing
more in this product as of now. H2FY18 should see some investment in this product.
New fruit drink brand Ju C was added and it has been gaining good traction.
Consumer Goods
6 Edelweiss Securities Limited
Herbal space
Damage by Patanjali, especially in honey, is over. Dabur has rebalanced value
proposition. Toothpaste never faced headwinds, irrespective of Patanjali’s entry. The
company believes worst is behind in terms of competition from Patanjali.
With a slew of product launches, the company expects sales to improve.
International business
Growth was impacted on account of economic slowdown in Saudi Arabia, Dubai, Iraq &
Libya and currency depreciation in Egyptian Pound, Naira and Turkish Lira.
International business declined 4.5% YoY in constant currency.
Currency devaluation of ~55% in Egyptian Pound, ~20% in Lira and ~36% in Naira. Total
loss stood at INR790mn.
Base anniversarisation likely in mid November 2017. Subsequently, political turmoil will
need to be seen.
Egypt, Nepal, Turkey and Bangladesh currencies appreciated 19%, 16%, 16% and 2%,
respectively.
The company is planning to continue to focus on more use of digital and A&P to revive
sales.
Namaste
Sluggish owing to slower international sales.
Going forward, the company expects sales to ramp up.
New plant
Dabur commissioned a new manufacturing facility in Tezpur, Assam, in March 2017. It
has been set up at an investment of INR2.5bn. It is the company’s largest production
facility.
Entire range of Dabur's ayurvedic medicines, health supplements, hair oils, shampoos,
toothpastes, skin care and home care products will be manufactured in this plant.
Distribution
Urban wholesale is still in bad shape on account of liquidity crunch and scrutiny cases.
The wholesale channel will make a comeback once it becomes compliant with new
laws. Wholesale trajectory has been improving with March better than February and so
on. Super stockiest however are back.
Wherever there was high proportion of north centric wholesale channel, the volume
growth suffered.
Direct reach is expected to improve by 20%.Wholesale channel is ~32‐35%.
Ad spends and other expenses
Ad spends in 3 buckets: media, trade promotions and consumer promotions.
Significant curtailment in consumer promotion, slight curtailment in trade promotion
and sharp rise in media spend can be expected.
Dabur
7 Edelweiss Securities Limited
Directionally, the company cut back media spends in H2FY17, which will be back. But
consumer promotions were already planned for H2FY17 and which continued even
during demonetisation.
Break up of A&P: 40% for ad spends and 60% for promotions. In FY18, this proportion
will switch i.e., 60% ad spends and 40% promotions.
Promotions as % of sales have increased over the past few quarters.
Employee cost was lower largely owing to reduction in variable pay and stock options.
Variable payout for management is annual. Employee strength reduced marginally.
Dabur is working towards cost rationalization—in juice the company is working on
distribution process and networking and at the company level it is on account of
improved productivity and reduced incentives.
New plants
Tezpur plant enjoys 56% excise exemption for 10 years. Plus under DT, it enjoys Sec
80IE benefit.
Under GST, in the worst case the company will pay 70% tax.
In the near term, the company will continue to pay MAT for the next few years.
Competition
The INR is in comfortable zone so there should not be much strain on the juices
segment since the concentrate is imported.
Patanjali has expanded ayurvedic segment, especially in toothpaste and honey and this
has led to changing dynamics of the ayurveda segment. This has also led to increase in
market size. It is difficult to say if the size has plateaued. But it is sure that the
proportion will not reduce. With increase in ayurvedic market size, not many people
have benefitted. Players in the herbal space have not benefited since herbal and
ayurveda are different.
Inventory days
Inventory days in Q3FY17 at 35‐40 which are now at 25 days.
Others
Dabur does not see any change in ayurvedic product w.r.t. rule of prescription based
drugs for pharma companies.
Outlook and valuations: Positive; maintain ‘BUY’
Dabur is set to benefit from recovery in rural growth (aided by rural‐centric initiatives
announced in Budget), which contributes ~45% to total sales, and a good monsoon. Initially,
Patanjali’s entry had intensified competition for Dabur. However, now the company has
stopped losing market share and the competitive intensity has also waned. To capitalise on
this, the company will be launching ayurvedic‐based products in categories such as oral care,
hair care, health supplements, etc., which is envisaged to spur overall growth. Dabur has
countered rising competition by enhancing its promotional spending, which has helped
wrest back market share, though the company will now reduce its promotion spend and
focus more on media spends, which is a superior strategy and will increase overall visibility
of brands. The focus on bolstering its innovation pipeline, especially in natural segment, and
Consumer Goods
8 Edelweiss Securities Limited
premiumising the same will not only help the company gain share in naturals and ayurveda,
but also aid margin improvement. The focus on OTC & ethicals, health supplements and
foods businesses, further bolstered by Project CORE will play a key role in driving
premiumisation for Dabur. Project LEAD and rising coverage of doctors will boost healthcare
products. International business is expected to improve led by recovery in Namaste business,
though overall geopolitical conditions in the Middle East need to be closely monitored.
We assign target multiple of 34.0x FY19E EPS to arrive at a target price of INR327. We
maintain ‘BUY’ recommendation and rate the stock ‘Sector Outperformer’.
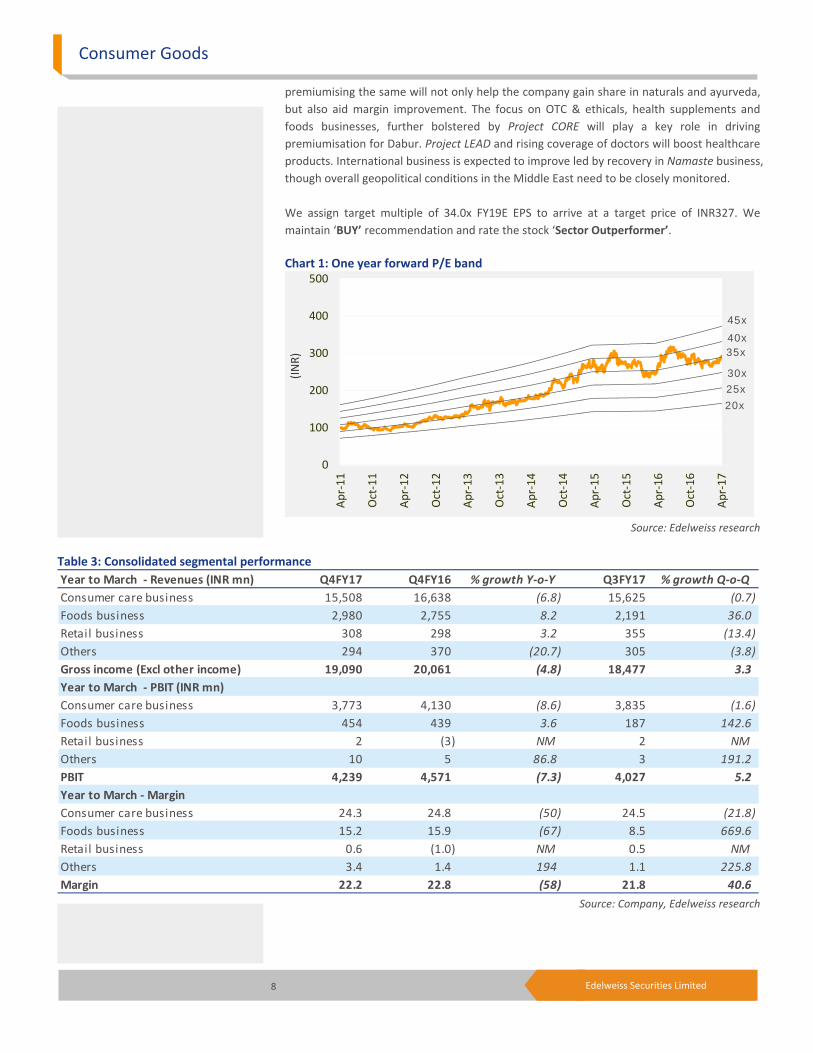
Chart 1: One year forward P/E band
Source: Edelweiss research
Table 3: Consolidated segmental performance
Source: Company, Edelweiss research
0
100
200
300
400
500
Apr‐11
Oct‐11
Apr‐12
Oct‐12
Apr‐13
Oct‐13
Apr‐14
Oct‐14
Apr‐15
Oct‐15
Apr‐16
Oct‐16
Apr‐17
(INR)
20x25x30x
35x40x45x
Year to March ‐ Revenues (INR mn) Q4FY17 Q4FY16 % growth Y‐o‐Y Q3FY17 % growth Q‐o‐Q
Consumer care business 15,508 16,638 (6.8) 15,625 (0.7)
Foods business 2,980 2,755 8.2 2,191 36.0
Retail business 308 298 3.2 355 (13.4)
Others 294 370 (20.7) 305 (3.8)
Gross income (Excl other income) 19,090 20,061 (4.8) 18,477 3.3
Consumer care business 3,773 4,130 (8.6) 3,835 (1.6)
Foods business 454 439 3.6 187 142.6
Retail business 2 (3) NM 2 NM
Others 10 5 86.8 3 191.2
PBIT 4,239 4,571 (7.3) 4,027 5.2
Consumer care business 24.3 24.8 (50) 24.5 (21.8)
Foods business 15.2 15.9 (67) 8.5 669.6
Retail business 0.6 (1.0) NM 0.5 NM
Others 3.4 1.4 194 1.1 225.8
Margin 22.2 22.8 (58) 21.8 40.6
Year to March ‐ PBIT (INR mn)
Year to March ‐ Margin
Dabur
9 Edelweiss Securities Limited
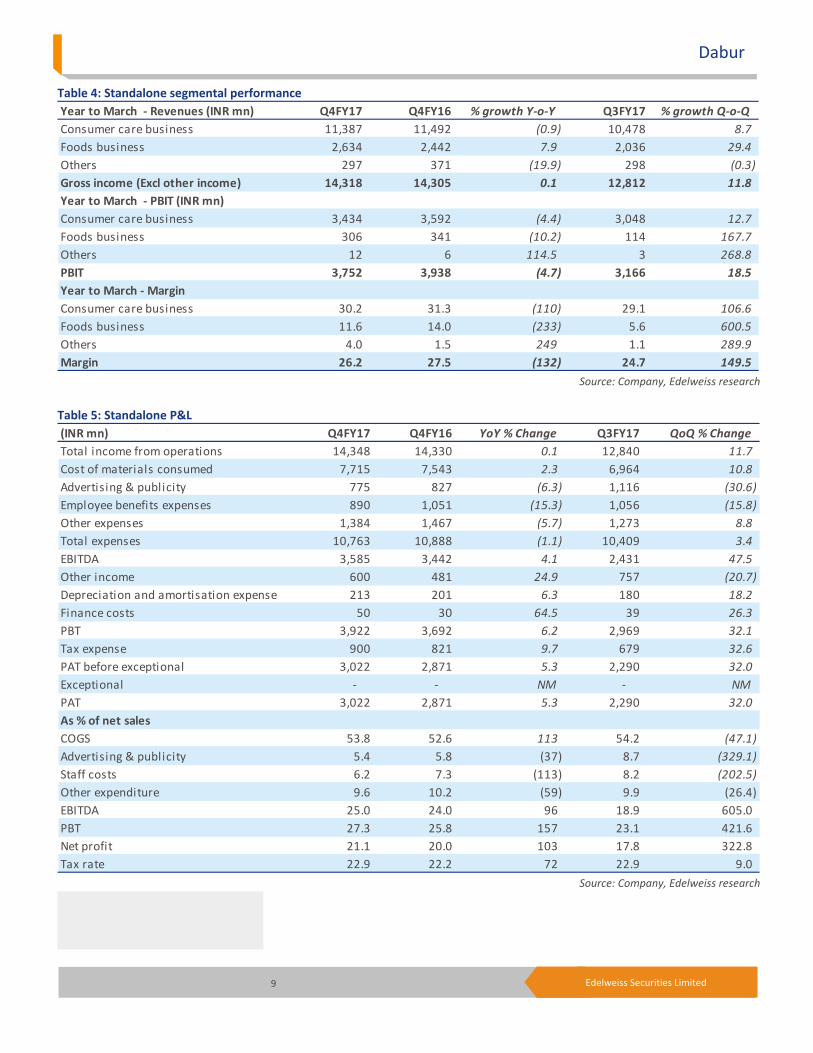
Table 4: Standalone segmental performance
Source: Company, Edelweiss research
Table 5: Standalone P&L
Source: Company, Edelweiss research
Year to March ‐ Revenues (INR mn) Q4FY17 Q4FY16 % growth Y‐o‐Y Q3FY17 % growth Q‐o‐Q
Consumer care business 11,387 11,492 (0.9) 10,478 8.7
Foods business 2,634 2,442 7.9 2,036 29.4
Others 297 371 (19.9) 298 (0.3)
Gross income (Excl other income) 14,318 14,305 0.1 12,812 11.8
Consumer care business 3,434 3,592 (4.4) 3,048 12.7
Foods business 306 341 (10.2) 114 167.7
Others 12 6 114.5 3 268.8
PBIT 3,752 3,938 (4.7) 3,166 18.5
Consumer care business 30.2 31.3 (110) 29.1 106.6
Foods business 11.6 14.0 (233) 5.6 600.5
Others 4.0 1.5 249 1.1 289.9
Margin 26.2 27.5 (132) 24.7 149.5
Year to March ‐ Margin
Year to March ‐ PBIT (INR mn)
(INR mn) Q4FY17 Q4FY16 YoY % Change Q3FY17 QoQ % Change
Total income from operations 14,348 14,330 0.1 12,840 11.7
Cost of materials consumed 7,715 7,543 2.3 6,964 10.8
Advertising & publicity 775 827 (6.3) 1,116 (30.6)
Employee benefits expenses 890 1,051 (15.3) 1,056 (15.8)
Other expenses 1,384 1,467 (5.7) 1,273 8.8
Total expenses 10,763 10,888 (1.1) 10,409 3.4
EBITDA 3,585 3,442 4.1 2,431 47.5
Other income 600 481 24.9 757 (20.7)
Depreciation and amortisation expense 213 201 6.3 180 18.2
Finance costs 50 30 64.5 39 26.3
PBT 3,922 3,692 6.2 2,969 32.1
Tax expense 900 821 9.7 679 32.6
PAT before exceptional 3,022 2,871 5.3 2,290 32.0
Exceptional ‐ ‐ NM ‐ NM
PAT 3,022 2,871 5.3 2,290 32.0
COGS 53.8 52.6 113 54.2 (47.1)
Advertising & publicity 5.4 5.8 (37) 8.7 (329.1)
Staff costs 6.2 7.3 (113) 8.2 (202.5)
Other expenditure 9.6 10.2 (59) 9.9 (26.4)
EBITDA 25.0 24.0 96 18.9 605.0
PBT 27.3 25.8 157 23.1 421.6
Net profit 21.1 20.0 103 17.8 322.8
Tax rate 22.9 22.2 72 22.9 9.0
As % of net sales
Consumer Goods
10 Edelweiss Securities Limited
Chart 2: Sales contribution Chart 3: International business growth rate
Chart 4: Category contribution Chart 5: Category growth rates
Chart 6: Domestic volume growth
Source: Company, Edelweiss research
Domestic64%
International
33%
Others4%
Hair care22%
Oral care16%
Health supplemen
ts17%
Digestives6%
Skin care5%
Home care6%
OTC & Ethicals, 12%
Foods19%
(6.0)
(1.0)
4.0
9.0
14.0
19.0
Q4 FY11
Q1 FY12
Q2 FY12
Q3 FY12
Q4 FY12
Q1 FY13
Q2 FY13
Q3 FY13
Q4 FY13
Q1FY14
Q2 FY14
Q3FY14
Q4FY14
Q1FY15
Q2FY15
Q3FY15
Q4FY15
Q1FY16
Q2FY16
Q3FY16
Q4FY16
Q1FY17
Q2FY17
Q3FY17
Q4FY17
(%)
(4.2)
3.6 5.0
(5.1)
(0.6)
(6.5)(4.0)
7.9
(20.0)
(12.0)
(4.0)
4.0
12.0
20.0
Hair Care
Oral Care
Health
Supplements
Digestives
Skin Care
Home Care
OTC
& Ethicals
Food
(%)
0.0
5.0
10.0
15.0
20.0
25.0
Banglad
esh
Turkey
Egypt
Nepal
(%)
Dabur
11 Edelweiss Securities Limited
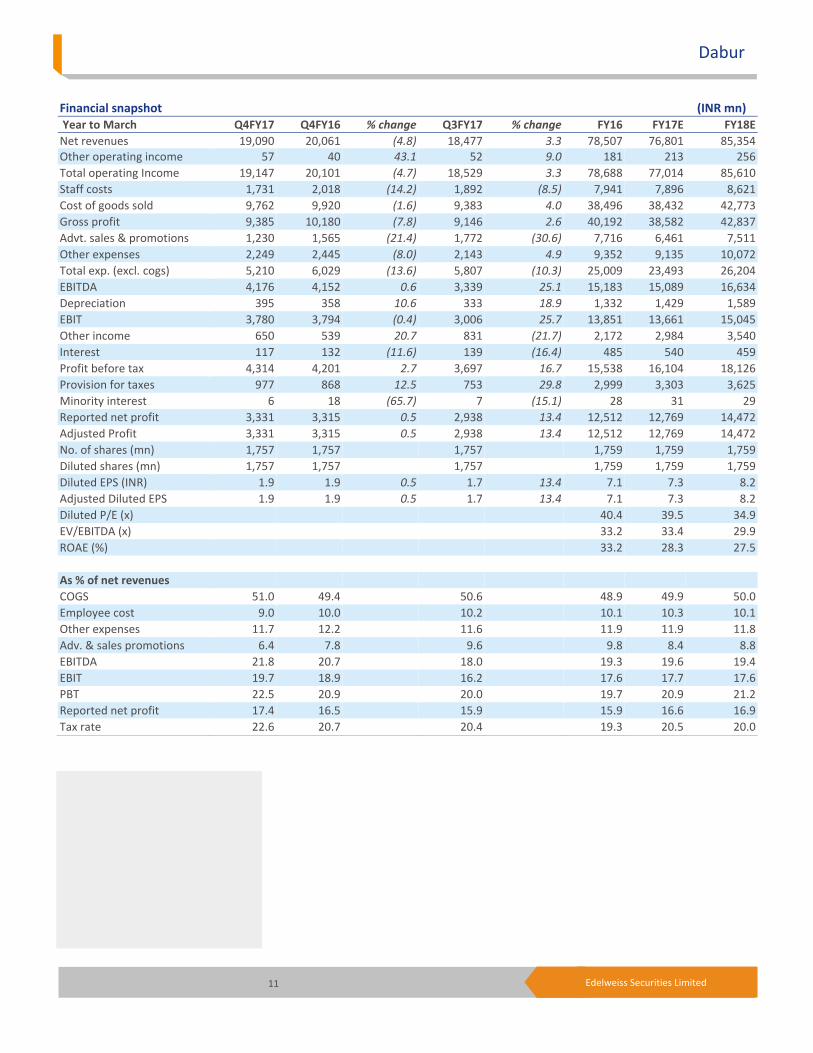
Financial snapshot (INR mn) Year to March Q4FY17 Q4FY16 % change Q3FY17 % change FY16 FY17E FY18E
Net revenues 19,090 20,061 (4.8) 18,477 3.3 78,507 76,801 85,354 Other operating income 57 40 43.1 52 9.0 181 213 256
Total operating Income 19,147 20,101 (4.7) 18,529 3.3 78,688 77,014 85,610
Staff costs 1,731 2,018 (14.2) 1,892 (8.5) 7,941 7,896 8,621
Cost of goods sold 9,762 9,920 (1.6) 9,383 4.0 38,496 38,432 42,773
Gross profit 9,385 10,180 (7.8) 9,146 2.6 40,192 38,582 42,837
Advt. sales & promotions 1,230 1,565 (21.4) 1,772 (30.6) 7,716 6,461 7,511
Other expenses 2,249 2,445 (8.0) 2,143 4.9 9,352 9,135 10,072
Total exp. (excl. cogs) 5,210 6,029 (13.6) 5,807 (10.3) 25,009 23,493 26,204
EBITDA 4,176 4,152 0.6 3,339 25.1 15,183 15,089 16,634
Depreciation 395 358 10.6 333 18.9 1,332 1,429 1,589
EBIT 3,780 3,794 (0.4) 3,006 25.7 13,851 13,661 15,045
Other income 650 539 20.7 831 (21.7) 2,172 2,984 3,540
Interest 117 132 (11.6) 139 (16.4) 485 540 459
Profit before tax 4,314 4,201 2.7 3,697 16.7 15,538 16,104 18,126
Provision for taxes 977 868 12.5 753 29.8 2,999 3,303 3,625
Minority interest 6 18 (65.7) 7 (15.1) 28 31 29
Reported net profit 3,331 3,315 0.5 2,938 13.4 12,512 12,769 14,472
Adjusted Profit 3,331 3,315 0.5 2,938 13.4 12,512 12,769 14,472
No. of shares (mn) 1,757 1,757 1,757 1,759 1,759 1,759
Diluted shares (mn) 1,757 1,757 1,757 1,759 1,759 1,759
Diluted EPS (INR) 1.9 1.9 0.5 1.7 13.4 7.1 7.3 8.2
Adjusted Diluted EPS 1.9 1.9 0.5 1.7 13.4 7.1 7.3 8.2
Diluted P/E (x) 40.4 39.5 34.9
EV/EBITDA (x) 33.2 33.4 29.9
ROAE (%) 33.2 28.3 27.5
As % of net revenues
COGS 51.0 49.4 50.6 48.9 49.9 50.0
Employee cost 9.0 10.0 10.2 10.1 10.3 10.1
Other expenses 11.7 12.2 11.6 11.9 11.9 11.8
Adv. & sales promotions 6.4 7.8 9.6 9.8 8.4 8.8
EBITDA 21.8 20.7 18.0 19.3 19.6 19.4
EBIT 19.7 18.9 16.2 17.6 17.7 17.6
PBT 22.5 20.9 20.0 19.7 20.9 21.2
Reported net profit 17.4 16.5 15.9 15.9 16.6 16.9
Tax rate 22.6 20.7 20.4 19.3 20.5 20.0
Consumer Goods
12 Edelweiss Securities Limited
Company Description
Dabur has two divisions in India (Consumer care division and Foods division) apart from its
international operations. Consumer care division (CCD) offers a wide range of products in
hair care, oral care, health supplements, digestives and candies, baby and skin care products
based on ayurveda, over‐the‐counter (OTC) products, Asavs, and branded ethical and classic
products. CHD division has been merged with CCD to leverage distribution. The second
division, Dabur Foods Ltd produces fruit juices, cooking pastes, sauces, and items for
institutional food purchases. Dabur is well placed among its Consumer Goods peers because
of its positioning as an Indian company whose products are derived from exotic sources
such as ancient ayurvedic texts and natural ingredients such as herbs.
The company has various brand leaders in different market segments ‐ Dabur
Chyawanprash, a health tonic, and Hajmola ‐ a digestive tablet. Real, launched during 1996‐
97, has also successfully become the leader in the market. Investment Theme
Dabur’s broad product portfolio provides a good play on Indian Consumer Goods spend by
virtue of its strong presence in less penetrated and high growth categories. Dabur’s
positioning on the ‘health and wellness’ platform, backed by its ANH
(ayurvedic/natural/herbal) image is very progressive. This, combined with its demonstrated
ability to create new categories and sub‐categories, makes it well‐placed to capture lifestyle
changes‐led growth in the Consumer Goods space. Dabur has also demonstrated its ability
to make and integrate smart acquisitions (Balsara) that complement its product portfolio
and thereby drive inorganic growth. Improvement in margins of foods and international
businesses are expected to result in improvement in margins for the consolidated
operations.
Key Risks
A slowdown in rural demand due to lower government spending or monsoon failure could
impact Dabur’s revenues significantly.
Further rise in competitive intensity in categories like Shampoo, Oral care, hair oils, juice
(ITC has come out with aggressive ads and national rollout) may put pressure on volumes.
13 Edelweiss Securities Limited
Dabur
Financial Statements
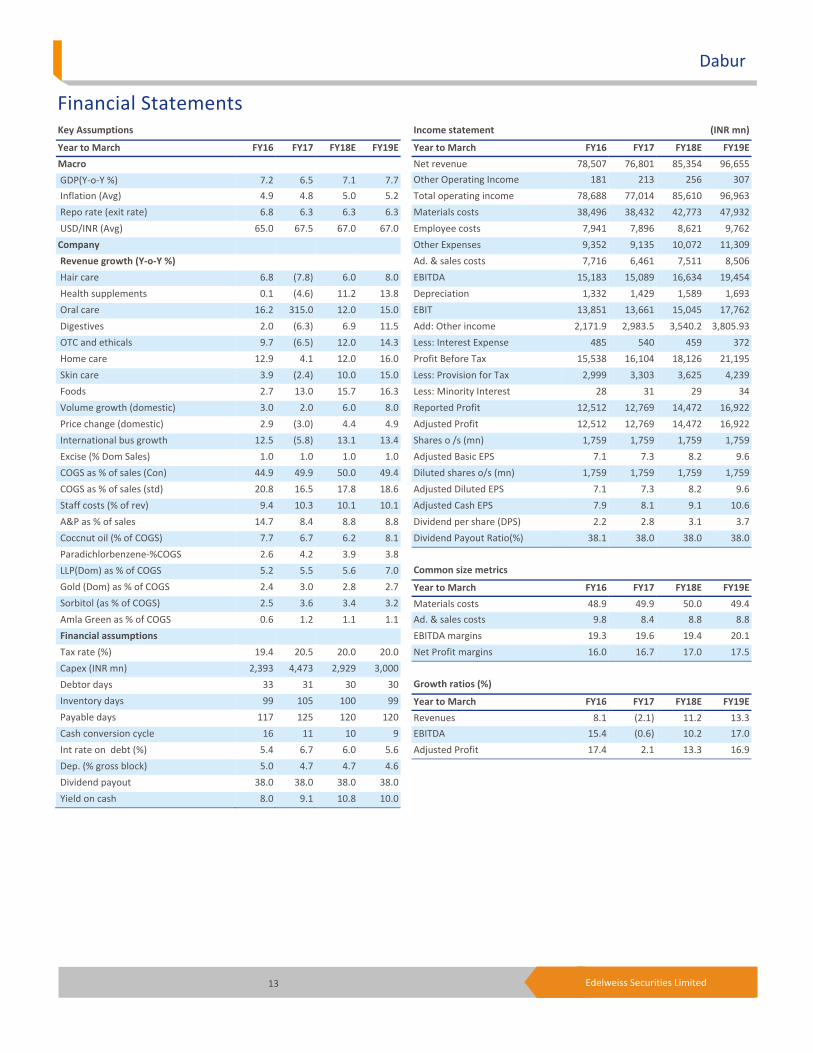
Income statement (INR mn)
Year to March FY16 FY17 FY18E FY19E
Net revenue 78,507 76,801 85,354 96,655
Other Operating Income 181 213 256 307
Total operating income 78,688 77,014 85,610 96,963
Materials costs 38,496 38,432 42,773 47,932
Employee costs 7,941 7,896 8,621 9,762
Other Expenses 9,352 9,135 10,072 11,309
Ad. & sales costs 7,716 6,461 7,511 8,506
EBITDA 15,183 15,089 16,634 19,454
Depreciation 1,332 1,429 1,589 1,693
EBIT 13,851 13,661 15,045 17,762
Add: Other income 2,171.9 2,983.5 3,540.2 3,805.93
Less: Interest Expense 485 540 459 372
Profit Before Tax 15,538 16,104 18,126 21,195
Less: Provision for Tax 2,999 3,303 3,625 4,239
Less: Minority Interest 28 31 29 34
Reported Profit 12,512 12,769 14,472 16,922
Adjusted Profit 12,512 12,769 14,472 16,922
Shares o /s (mn) 1,759 1,759 1,759 1,759
Adjusted Basic EPS 7.1 7.3 8.2 9.6
Diluted shares o/s (mn) 1,759 1,759 1,759 1,759
Adjusted Diluted EPS 7.1 7.3 8.2 9.6
Adjusted Cash EPS 7.9 8.1 9.1 10.6
Dividend per share (DPS) 2.2 2.8 3.1 3.7
Dividend Payout Ratio(%) 38.1 38.0 38.0 38.0
Common size metrics
Year to March FY16 FY17 FY18E FY19E
Materials costs 48.9 49.9 50.0 49.4
Ad. & sales costs 9.8 8.4 8.8 8.8
EBITDA margins 19.3 19.6 19.4 20.1
Net Profit margins 16.0 16.7 17.0 17.5
Growth ratios (%)
Year to March FY16 FY17 FY18E FY19E
Revenues 8.1 (2.1) 11.2 13.3
EBITDA 15.4 (0.6) 10.2 17.0
Adjusted Profit 17.4 2.1 13.3 16.9
Key Assumptions
Year to March FY16 FY17 FY18E FY19E
Macro
GDP(Y‐o‐Y %) 7.2 6.5 7.1 7.7
Inflation (Avg) 4.9 4.8 5.0 5.2
Repo rate (exit rate) 6.8 6.3 6.3 6.3
USD/INR (Avg) 65.0 67.5 67.0 67.0
Company
Revenue growth (Y‐o‐Y %)
Hair care 6.8 (7.8) 6.0 8.0
Health supplements 0.1 (4.6) 11.2 13.8
Oral care 16.2 315.0 12.0 15.0
Digestives 2.0 (6.3) 6.9 11.5
OTC and ethicals 9.7 (6.5) 12.0 14.3
Home care 12.9 4.1 12.0 16.0
Skin care 3.9 (2.4) 10.0 15.0
Foods 2.7 13.0 15.7 16.3
Volume growth (domestic) 3.0 2.0 6.0 8.0
Price change (domestic) 2.9 (3.0) 4.4 4.9
International bus growth 12.5 (5.8) 13.1 13.4
Excise (% Dom Sales) 1.0 1.0 1.0 1.0
COGS as % of sales (Con) 44.9 49.9 50.0 49.4
COGS as % of sales (std) 20.8 16.5 17.8 18.6
Staff costs (% of rev) 9.4 10.3 10.1 10.1
A&P as % of sales 14.7 8.4 8.8 8.8
Coccnut oil (% of COGS) 7.7 6.7 6.2 8.1
Paradichlorbenzene‐%COGS 2.6 4.2 3.9 3.8
LLP(Dom) as % of COGS 5.2 5.5 5.6 7.0
Gold (Dom) as % of COGS 2.4 3.0 2.8 2.7
Sorbitol (as % of COGS) 2.5 3.6 3.4 3.2
Amla Green as % of COGS 0.6 1.2 1.1 1.1
Financial assumptions
Tax rate (%) 19.4 20.5 20.0 20.0
Capex (INR mn) 2,393 4,473 2,929 3,000
Debtor days 33 31 30 30
Inventory days 99 105 100 99
Payable days 117 125 120 120
Cash conversion cycle 16 11 10 9
Int rate on debt (%) 5.4 6.7 6.0 5.6
Dep. (% gross block) 5.0 4.7 4.7 4.6
Dividend payout 38.0 38.0 38.0 38.0
Yield on cash 8.0 9.1 10.8 10.0
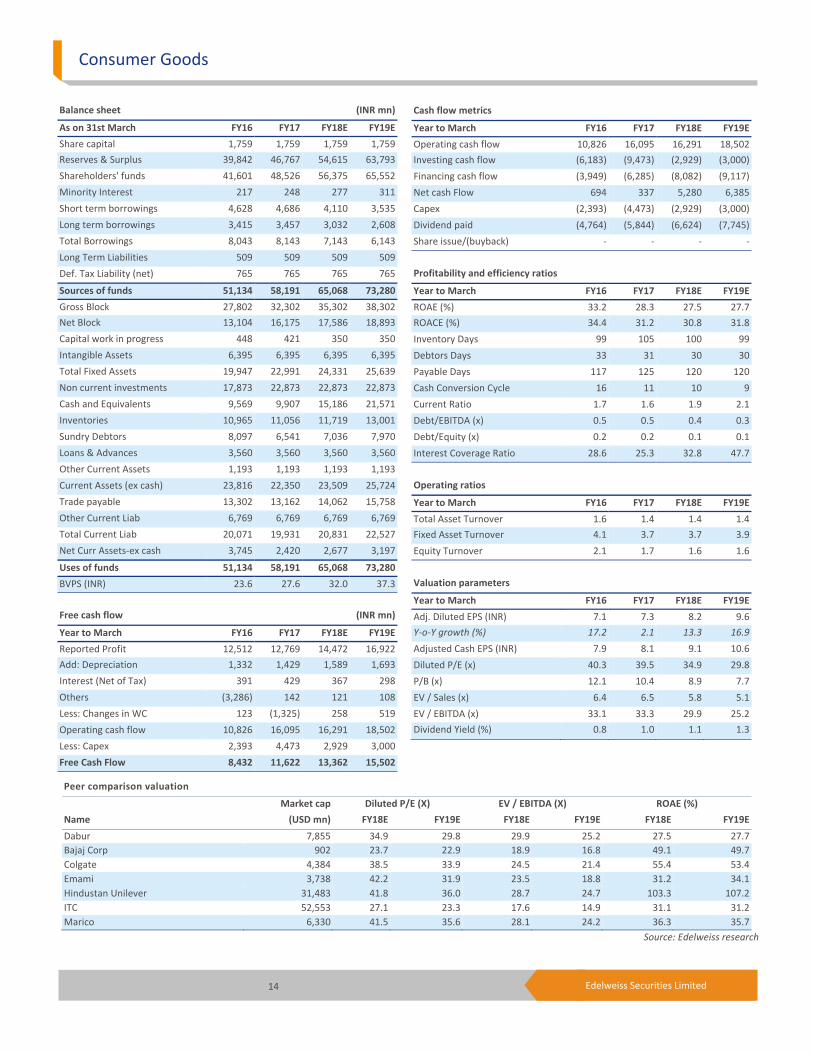
14 Edelweiss Securities Limited
Consumer Goods
Peer comparison valuation
Market cap Diluted P/E (X) EV / EBITDA (X) ROAE (%)
Name (USD mn) FY18E FY19E FY18E FY19E FY18E FY19E
Dabur 7,855 34.9 29.8 29.9 25.2 27.5 27.7
Bajaj Corp 902 23.7 22.9 18.9 16.8 49.1 49.7
Colgate 4,384 38.5 33.9 24.5 21.4 55.4 53.4
Emami 3,738 42.2 31.9 23.5 18.8 31.2 34.1
Hindustan Unilever 31,483 41.8 36.0 28.7 24.7 103.3 107.2
ITC 52,553 27.1 23.3 17.6 14.9 31.1 31.2
Marico 6,330 41.5 35.6 28.1 24.2 36.3 35.7
Source: Edelweiss research
Cash flow metrics
Year to March FY16 FY17 FY18E FY19E
Operating cash flow 10,826 16,095 16,291 18,502
Investing cash flow (6,183) (9,473) (2,929) (3,000)
Financing cash flow (3,949) (6,285) (8,082) (9,117)
Net cash Flow 694 337 5,280 6,385
Capex (2,393) (4,473) (2,929) (3,000)
Dividend paid (4,764) (5,844) (6,624) (7,745)
Share issue/(buyback) ‐ ‐ ‐ ‐
Profitability and efficiency ratios
Year to March FY16 FY17 FY18E FY19E
ROAE (%) 33.2 28.3 27.5 27.7
ROACE (%) 34.4 31.2 30.8 31.8
Inventory Days 99 105 100 99
Debtors Days 33 31 30 30
Payable Days 117 125 120 120
Cash Conversion Cycle 16 11 10 9
Current Ratio 1.7 1.6 1.9 2.1
Debt/EBITDA (x) 0.5 0.5 0.4 0.3
Debt/Equity (x) 0.2 0.2 0.1 0.1
Interest Coverage Ratio 28.6 25.3 32.8 47.7
Operating ratios
Year to March FY16 FY17 FY18E FY19E
Total Asset Turnover 1.6 1.4 1.4 1.4
Fixed Asset Turnover 4.1 3.7 3.7 3.9
Equity Turnover 2.1 1.7 1.6 1.6
Valuation parameters
Year to March FY16 FY17 FY18E FY19E
Adj. Diluted EPS (INR) 7.1 7.3 8.2 9.6
Y‐o‐Y growth (%) 17.2 2.1 13.3 16.9
Adjusted Cash EPS (INR) 7.9 8.1 9.1 10.6
Diluted P/E (x) 40.3 39.5 34.9 29.8
P/B (x) 12.1 10.4 8.9 7.7
EV / Sales (x) 6.4 6.5 5.8 5.1
EV / EBITDA (x) 33.1 33.3 29.9 25.2
Dividend Yield (%) 0.8 1.0 1.1 1.3
Balance sheet (INR mn)
As on 31st March FY16 FY17 FY18E FY19E
Share capital 1,759 1,759 1,759 1,759
Reserves & Surplus 39,842 46,767 54,615 63,793
Shareholders' funds 41,601 48,526 56,375 65,552
Minority Interest 217 248 277 311
Short term borrowings 4,628 4,686 4,110 3,535
Long term borrowings 3,415 3,457 3,032 2,608
Total Borrowings 8,043 8,143 7,143 6,143
Long Term Liabilities 509 509 509 509
Def. Tax Liability (net) 765 765 765 765
Sources of funds 51,134 58,191 65,068 73,280
Gross Block 27,802 32,302 35,302 38,302
Net Block 13,104 16,175 17,586 18,893
Capital work in progress 448 421 350 350
Intangible Assets 6,395 6,395 6,395 6,395
Total Fixed Assets 19,947 22,991 24,331 25,639
Non current investments 17,873 22,873 22,873 22,873
Cash and Equivalents 9,569 9,907 15,186 21,571
Inventories 10,965 11,056 11,719 13,001
Sundry Debtors 8,097 6,541 7,036 7,970
Loans & Advances 3,560 3,560 3,560 3,560
Other Current Assets 1,193 1,193 1,193 1,193
Current Assets (ex cash) 23,816 22,350 23,509 25,724
Trade payable 13,302 13,162 14,062 15,758
Other Current Liab 6,769 6,769 6,769 6,769
Total Current Liab 20,071 19,931 20,831 22,527
Net Curr Assets‐ex cash 3,745 2,420 2,677 3,197
Uses of funds 51,134 58,191 65,068 73,280
BVPS (INR) 23.6 27.6 32.0 37.3
Free cash flow (INR mn)
Year to March FY16 FY17 FY18E FY19E
Reported Profit 12,512 12,769 14,472 16,922
Add: Depreciation 1,332 1,429 1,589 1,693
Interest (Net of Tax) 391 429 367 298
Others (3,286) 142 121 108
Less: Changes in WC 123 (1,325) 258 519
Operating cash flow 10,826 16,095 16,291 18,502
Less: Capex 2,393 4,473 2,929 3,000
Free Cash Flow 8,432 11,622 13,362 15,502
15 Edelweiss Securities Limited
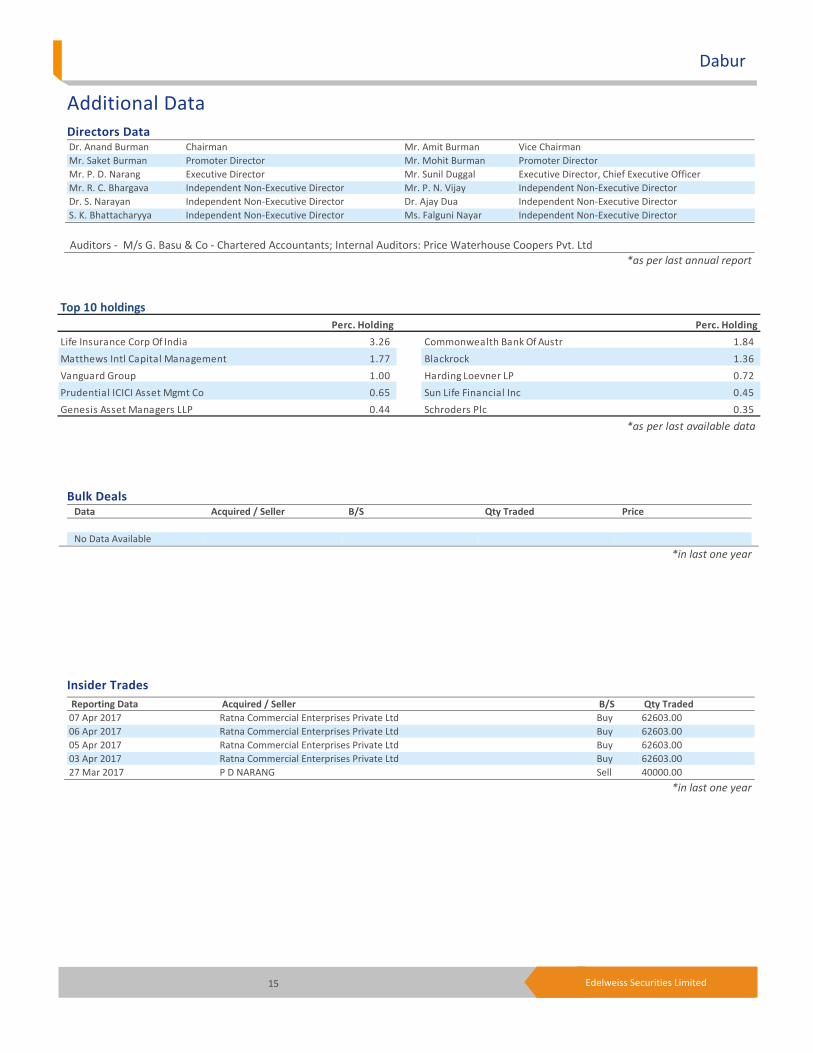
Dabur
Top 10 holdings
Perc. Holding Perc. Holding
Life Insurance Corp Of India 3.26 Commonwealth Bank Of Austr 1.84
Matthews Intl Capital Management 1.77 Blackrock 1.36
Vanguard Group 1.00 Harding Loevner LP 0.72
Prudential ICICI Asset Mgmt Co 0.65 Sun Life Financial Inc 0.45
Genesis Asset Managers LLP 0.44 Schroders Plc 0.35
*as per last available data
Insider Trades Reporting Data Acquired / Seller B/S Qty Traded
07 Apr 2017 Ratna Commercial Enterprises Private Ltd Buy 62603.00
06 Apr 2017 Ratna Commercial Enterprises Private Ltd Buy 62603.00
05 Apr 2017 Ratna Commercial Enterprises Private Ltd Buy 62603.00
03 Apr 2017 Ratna Commercial Enterprises Private Ltd Buy 62603.00
27 Mar 2017 P D NARANG Sell 40000.00
*in last one year
Bulk Deals Data Acquired / Seller B/S Qty Traded Price
No Data Available
*in last one year
Additional Data
Directors Data Dr. Anand Burman Chairman Mr. Amit Burman Vice Chairman
Mr. Saket Burman Promoter Director Mr. Mohit Burman Promoter Director
Mr. P. D. Narang Executive Director Mr. Sunil Duggal Executive Director, Chief Executive Officer
Mr. R. C. Bhargava Independent Non‐Executive Director Mr. P. N. Vijay Independent Non‐Executive Director
Dr. S. Narayan Independent Non‐Executive Director Dr. Ajay Dua Independent Non‐Executive Director
S. K. Bhattacharyya Independent Non‐Executive Director Ms. Falguni Nayar Independent Non‐Executive Director
Auditors ‐ M/s G. Basu & Co ‐ Chartered Accountants; Internal Auditors: Price Waterhouse Coopers Pvt. Ltd
*as per last annual report
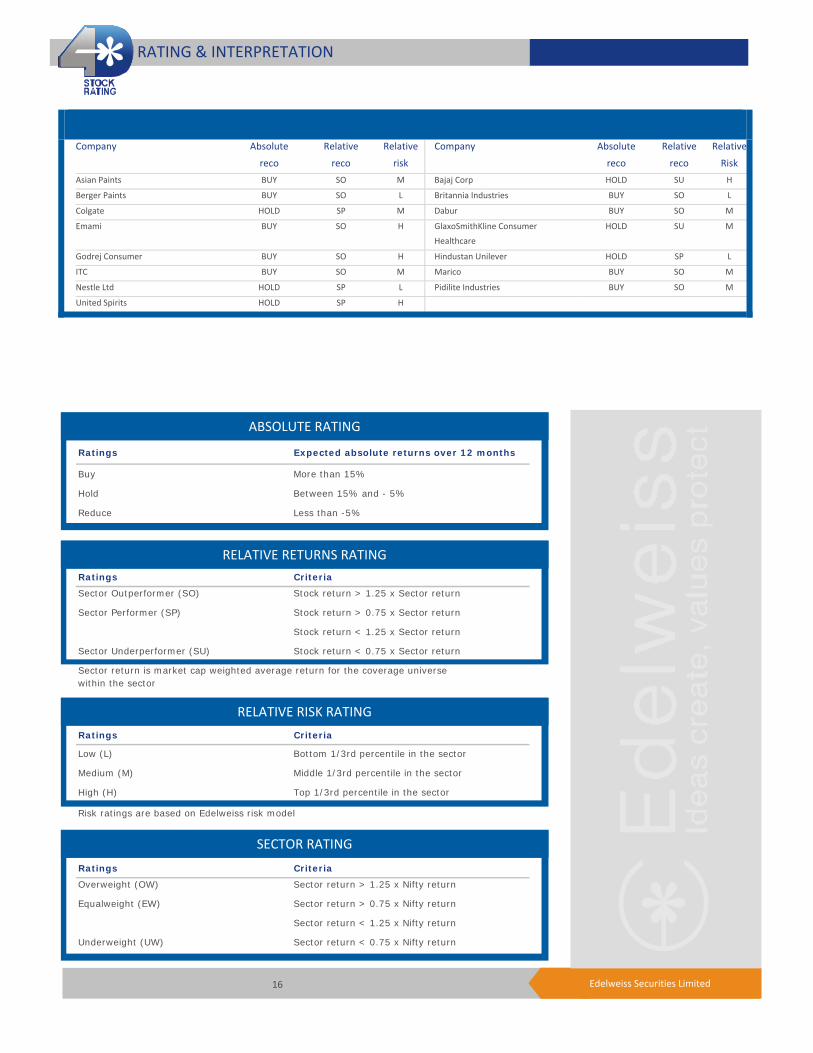
16 Edelweiss Securities Limited
Company Absolute
reco Relative
reco Relative
risk
Company Absolute
reco
Relative
reco
Relative
Risk
Asian Paints BUY SO M Bajaj Corp HOLD SU H
Berger Paints BUY SO L Britannia Industries BUY SO L
Colgate HOLD SP M Dabur BUY SO M
Emami BUY SO H GlaxoSmithKline Consumer
Healthcare
HOLD SU M
Godrej Consumer BUY SO H Hindustan Unilever HOLD SP L
ITC BUY SO M Marico BUY SO M
Nestle Ltd HOLD SP L Pidilite Industries BUY SO M
United Spirits HOLD SP H
RATING & INTERPRETATION
ABSOLUTE RATING
Ratings Expected absolute returns over 12 months
Buy More than 15%
Hold Between 15% and - 5%
Reduce Less than -5%
RELATIVE RETURNS RATING
Ratings Criteria
Sector Outperformer (SO) Stock return > 1.25 x Sector return
Sector Performer (SP) Stock return > 0.75 x Sector return
Stock return < 1.25 x Sector return
Sector Underperformer (SU) Stock return < 0.75 x Sector return
Sector return is market cap weighted average return for the coverage universe within the sector
RELATIVE RISK RATING
Ratings Criteria
Low (L) Bottom 1/3rd percentile in the sector
Medium (M) Middle 1/3rd percentile in the sector
High (H) Top 1/3rd percentile in the sector
Risk ratings are based on Edelweiss risk model
SECTOR RATING
Ratings Criteria
Overweight (OW) Sector return > 1.25 x Nifty return
Equalweight (EW) Sector return > 0.75 x Nifty return
Sector return < 1.25 x Nifty return
Underweight (UW) Sector return < 0.75 x Nifty return
17 Edelweiss Securities Limited
Dabur
Edelweiss Securities Limited, Edelweiss House, off C.S.T. Road, Kalina, Mumbai – 400 098.
Board: (91‐22) 4009 4400, Email: [email protected]
Aditya Narain
Head of Research
Coverage group(s) of stocks by primary analyst(s): Consumer Goods
Asian Paints, Bajaj Corp, Berger Paints, Britannia Industries, Colgate, Dabur, Godrej Consumer, Emami, Hindustan Unilever, ITC, Marico, Nestle Ltd, Pidilite Industries, GlaxoSmithKline Consumer Healthcare, United Spirits
Distribution of Ratings / Market Cap
Edelweiss Research Coverage Universe
Rating Distribution* 161 67 11 240* 1stocks under review
Market Cap (INR) 156 62 11
Date Company Title Price (INR) Recos
Recent Research
27‐Apr‐17 Consumer Goods
Prognosis: Sector Gauge; Sector Update
24‐Apr‐17 Consumer Goods
Edel Pulse : Deconstructing GST and its implementation; Sector Update
17‐Apr‐17 Bajaj Corp Cagey quarter amid DeMon aftermath; Result Update
402 Hold
> 50bn Between 10bn and 50 bn < 10bn
Buy Hold Reduce Total
Rating Interpretation
Buy appreciate more than 15% over a 12‐month period
Hold appreciate up to 15% over a 12‐month period
Reduce depreciate more than 5% over a 12‐month period
Rating Expected to
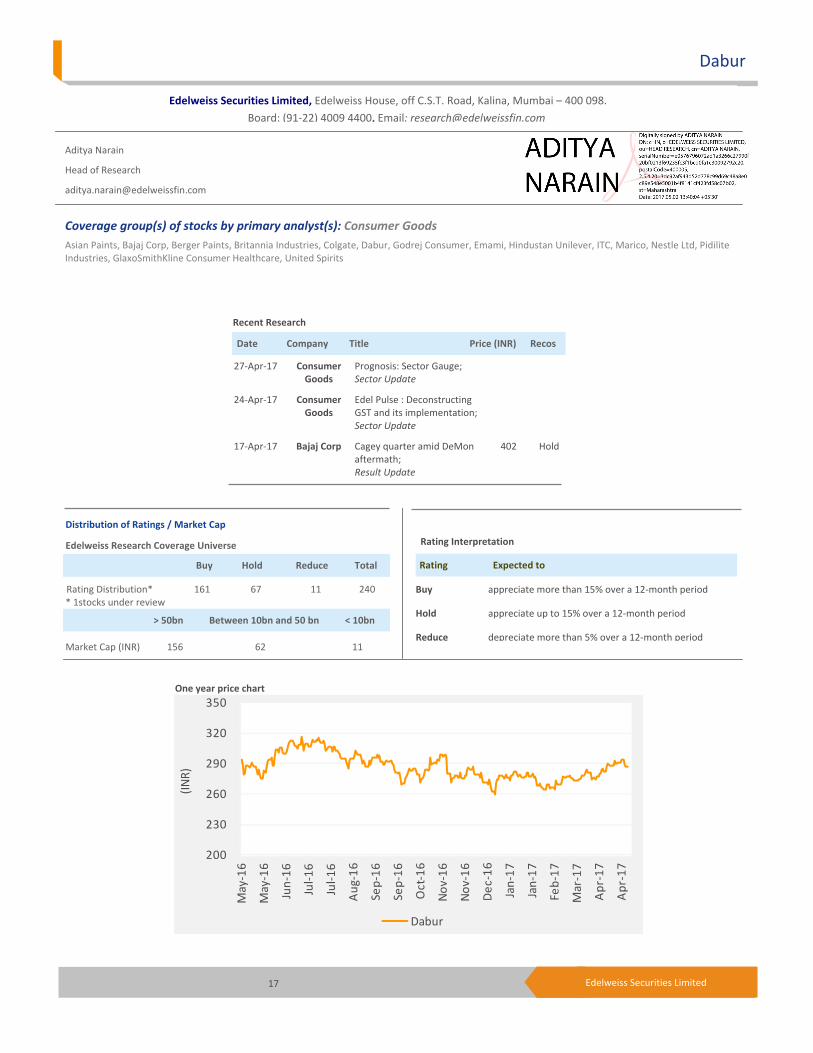
One year price chart
200
230
260
290
320
350
May‐16
May‐16
Jun‐16
Jul‐16
Jul‐16
Aug‐16
Sep‐16
Sep‐16
Oct‐16
Nov‐16
Nov‐16
Dec‐16
Jan‐17
Jan‐17
Feb‐17
Mar‐17
Apr‐17
Apr‐17
(INR)
Dabur
18 Edelweiss Securities Limited
Consumer Goods
DISCLAIMER
Edelweiss Securities Limited (“ESL” or “Research Entity”) is regulated by the Securities and Exchange Board of India (“SEBI”) and is licensed to carry on the business of broking, depository services and related activities. The business of ESL and its Associates (list available on www.edelweissfin.com) are organized around five broad business groups – Credit including Housing and SME Finance, Commodities, Financial Markets, Asset Management and Life Insurance.
This Report has been prepared by Edelweiss Securities Limited in the capacity of a Research Analyst having SEBI Registration No.INH200000121 and distributed as per SEBI (Research Analysts) Regulations 2014. This report does not constitute an offer or solicitation for the purchase or sale of any financial instrument or as an official confirmation of any transaction. Securities as defined in clause (h) of section 2 of the Securities Contracts (Regulation) Act, 1956 includes Financial Instruments and Currency Derivatives. The information contained herein is from publicly available data or other sources believed to be reliable. This report is provided for assistance only and is not intended to be and must not alone be taken as the basis for an investment decision. The user assumes the entire risk of any use made of this information. Each recipient of this report should make such investigation as it deems necessary to arrive at an independent evaluation of an investment in Securities referred to in this document (including the merits and risks involved), and should consult his own advisors to determine the merits and risks of such investment. The investment discussed or views expressed may not be suitable for all investors.
This information is strictly confidential and is being furnished to you solely for your information. This information should not be reproduced or redistributed or passed on directly or indirectly in any form to any other person or published, copied, in whole or in part, for any purpose. This report is not directed or intended for distribution to, or use by, any person or entity who is a citizen or resident of or located in any locality, state, country or other jurisdiction, where such distribution, publication, availability or use would be contrary to law, regulation or which would subject ESL and associates / group companies to any registration or licensing requirements within such jurisdiction. The distribution of this report in certain jurisdictions may be restricted by law, and persons in whose possession this report comes, should observe, any such restrictions. The information given in this report is as of the date of this report and there can be no assurance that future results or events will be consistent with this information. This information is subject to change without any prior notice. ESL reserves the right to make modifications and alterations to this statement as may be required from time to time. ESL or any of its associates / group companies shall not be in any way responsible for any loss or damage that may arise to any person from any inadvertent error in the information contained in this report. ESL is committed to providing independent and transparent recommendation to its clients. Neither ESL nor any of its associates, group companies, directors, employees, agents or representatives shall be liable for any damages whether direct, indirect, special or consequential including loss of revenue or lost profits that may arise from or in connection with the use of the information. Our proprietary trading and investment businesses may make investment decisions that are inconsistent with the recommendations expressed herein. Past performance is not necessarily a guide to future performance .The disclosures of interest statements incorporated in this report are provided solely to enhance the transparency and should not be treated as endorsement of the views expressed in the report. The information provided in these reports remains, unless otherwise stated, the copyright of ESL. All layout, design, original artwork, concepts and other Intellectual Properties, remains the property and copyright of ESL and may not be used in any form or for any purpose whatsoever by any party without the express written permission of the copyright holders.
ESL shall not be liable for any delay or any other interruption which may occur in presenting the data due to any reason including network (Internet) reasons or snags in the system, break down of the system or any other equipment, server breakdown, maintenance shutdown, breakdown of communication services or inability of the ESL to present the data. In no event shall ESL be liable for any damages, including without limitation direct or indirect, special, incidental, or consequential damages, losses or expenses arising in connection with the data presented by the ESL through this report.
We offer our research services to clients as well as our prospects. Though this report is disseminated to all the customers simultaneously, not all customers may receive this report at the same time. We will not treat recipients as customers by virtue of their receiving this report.
ESL and its associates, officer, directors, and employees, research analyst (including relatives) worldwide may: (a) from time to time, have long or short positions in, and buy or sell the Securities, mentioned herein or (b) be engaged in any other transaction involving such Securities and earn brokerage or other compensation or act as a market maker in the financial instruments of the subject company/company(ies) discussed herein or act as advisor or lender/borrower to such company(ies) or have other potential/material conflict of interest with respect to any recommendation and related information and opinions at the time of publication of research report or at the time of public appearance. ESL may have proprietary long/short position in the above mentioned scrip(s) and therefore should be considered as interested. The views provided herein are general in nature and do not consider risk appetite or investment objective of any particular investor; readers are requested to take independent professional advice before investing. This should not be construed as invitation or solicitation to do business with ESL.
19 Edelweiss Securities Limited
Dabur
ESL or its associates may have received compensation from the subject company in the past 12 months. ESL or its associates may have managed or co‐managed public offering of securities for the subject company in the past 12 months. ESL or its associates may have received compensation for investment banking or merchant banking or brokerage services from the subject company in the past 12 months. ESL or its associates may have received any compensation for products or services other than investment banking or merchant banking or brokerage services from the subject company in the past 12 months. ESL or its associates have not received any compensation or other benefits from the Subject Company or third party in connection with the research report. Research analyst or his/her relative or ESL’s associates may have financial interest in the subject company. ESL and/or its Group Companies, their Directors, affiliates and/or employees may have interests/ positions, financial or otherwise in the Securities/Currencies and other investment products mentioned in this report. ESL, its associates, research analyst and his/her relative may have other potential/material conflict of interest with respect to any recommendation and related information and opinions at the time of publication of research report or at the time of public appearance.
Participants in foreign exchange transactions may incur risks arising from several factors, including the following: ( i) exchange rates can be volatile and are subject to large fluctuations; ( ii) the value of currencies may be affected by numerous market factors, including world and national economic, political and regulatory events, events in equity and debt markets and changes in interest rates; and (iii) currencies may be subject to devaluation or government imposed exchange controls which could affect the value of the currency. Investors in securities such as ADRs and Currency Derivatives, whose values are affected by the currency of an underlying security, effectively assume currency risk.
Research analyst has served as an officer, director or employee of subject Company: No
ESL has financial interest in the subject companies: No
ESL’s Associates may have actual / beneficial ownership of 1% or more securities of the subject company at the end of the month immediately preceding the date of publication of research report.
Research analyst or his/her relative has actual/beneficial ownership of 1% or more securities of the subject company at the end of the month immediately preceding the date of publication of research report: No
ESL has actual/beneficial ownership of 1% or more securities of the subject company at the end of the month immediately preceding the date of publication of research report: No
Subject company may have been client during twelve months preceding the date of distribution of the research report.
There were no instances of non‐compliance by ESL on any matter related to the capital markets, resulting in significant and material disciplinary action during the last three years except that ESL had submitted an offer of settlement with Securities and Exchange commission, USA (SEC) and the same has been accepted by SEC without admitting or denying the findings in relation to their charges of non registration as a broker dealer.
A graph of daily closing prices of the securities is also available at www.nseindia.com
Analyst Certification:
The analyst for this report certifies that all of the views expressed in this report accurately reflect his or her personal views about the subject company or companies and its or their securities, and no part of his or her compensation was, is or will be, directly or indirectly related to specific recommendations or views expressed in this report.
Additional Disclaimers
Disclaimer for U.S. Persons
This research report is a product of Edelweiss Securities Limited, which is the employer of the research analyst(s) who has prepared the research report. The research analyst(s) preparing the research report is/are resident outside the United States (U.S.) and are not associated persons of any U.S. regulated broker‐dealer and therefore the analyst(s) is/are not subject to supervision by a U.S. broker‐dealer, and is/are not required to satisfy the regulatory licensing requirements of FINRA or required to otherwise comply with U.S. rules or regulations regarding, among other things, communications with a subject company, public appearances and trading securities held by a research analyst account.
This report is intended for distribution by Edelweiss Securities Limited only to "Major Institutional Investors" as defined by Rule 15a‐6(b)(4) of the U.S. Securities and Exchange Act, 1934 (the Exchange Act) and interpretations thereof by U.S. Securities and Exchange Commission (SEC) in reliance on Rule 15a 6(a)(2). If the recipient of this report is not a Major Institutional Investor as specified above, then it should not act upon this report and return the same to the sender. Further, this report may not be copied, duplicated and/or transmitted onward to any U.S. person, which is not the Major Institutional Investor.
20 Edelweiss Securities Limited
Consumer Goods
Access the entire repository of Edelweiss Research on www.edelresearch.com
In reliance on the exemption from registration provided by Rule 15a‐6 of the Exchange Act and interpretations thereof by the SEC in order to conduct certain business with Major Institutional Investors, Edelweiss Securities Limited has entered into an agreement with a U.S. registered broker‐dealer, Edelweiss Financial Services Inc. ("EFSI"). Transactions in securities discussed in this research report should be effected through Edelweiss Financial Services Inc. Disclaimer for U.K. Persons
The contents of this research report have not been approved by an authorised person within the meaning of the Financial Services and Markets Act 2000 ("FSMA"). In the United Kingdom, this research report is being distributed only to and is directed only at (a) persons who have professional experience in matters relating to investments falling within Article 19(5) of the FSMA (Financial Promotion) Order 2005 (the “Order”); (b) persons falling within Article 49(2)(a) to (d) of the Order (including high net worth companies and unincorporated associations); and (c) any other persons to whom it may otherwise lawfully be communicated (all such persons together being referred to as “relevant persons”). This research report must not be acted on or relied on by persons who are not relevant persons. Any investment or investment activity to which this research report relates is available only to relevant persons and will be engaged in only with relevant persons. Any person who is not a relevant person should not act or rely on this research report or any of its contents. This research report must not be distributed, published, reproduced or disclosed (in whole or in part) by recipients to any other person. Disclaimer for Canadian Persons
This research report is a product of Edelweiss Securities Limited ("ESL"), which is the employer of the research analysts who have prepared the research report. The research analysts preparing the research report are resident outside the Canada and are not associated persons of any Canadian registered adviser and/or dealer and, therefore, the analysts are not subject to supervision by a Canadian registered adviser and/or dealer, and are not required to satisfy the regulatory licensing requirements of the Ontario Securities Commission, other Canadian provincial securities regulators, the Investment Industry Regulatory Organization of Canada and are not required to otherwise comply with Canadian rules or regulations regarding, among other things, the research analysts' business or relationship with a subject company or trading of securities by a research analyst. This report is intended for distribution by ESL only to "Permitted Clients" (as defined in National Instrument 31‐103 ("NI 31‐103")) who are resident in the Province of Ontario, Canada (an "Ontario Permitted Client"). If the recipient of this report is not an Ontario Permitted Client, as specified above, then the recipient should not act upon this report and should return the report to the sender. Further, this report may not be copied, duplicated and/or transmitted onward to any Canadian person. ESL is relying on an exemption from the adviser and/or dealer registration requirements under NI 31‐103 available to certain international advisers and/or dealers. Please be advised that (i) ESL is not registered in the Province of Ontario to trade in securities nor is it registered in the Province of Ontario to provide advice with respect to securities; (ii) ESL's head office or principal place of business is located in India; (iii) all or substantially all of ESL's assets may be situated outside of Canada; (iv) there may be difficulty enforcing legal rights against ESL because of the above; and (v) the name and address of the ESL's agent for service of process in the Province of Ontario is: Bamac Services Inc., 181 Bay Street, Suite 2100, Toronto, Ontario M5J 2T3 Canada. Disclaimer for Singapore Persons
In Singapore, this report is being distributed by Edelweiss Investment Advisors Private Limited ("EIAPL") (Co. Reg. No. 201016306H) which is a holder of a capital markets services license and an exempt financial adviser in Singapore and (ii) solely to persons who qualify as "institutional investors" or "accredited investors" as defined in section 4A(1) of the Securities and Futures Act, Chapter 289 of Singapore ("the SFA"). Pursuant to regulations 33, 34, 35 and 36 of the Financial Advisers Regulations ("FAR"), sections 25, 27 and 36 of the Financial Advisers Act, Chapter 110 of Singapore shall not apply to EIAPL when providing any financial advisory services to an accredited investor (as defined in regulation 36 of the FAR. Persons in Singapore should contact EIAPL in respect of any matter arising from, or in connection with this publication/communication. This report is not suitable for private investors.
Copyright 2009 Edelweiss Research (Edelweiss Securities Ltd). All rights reserved
Related Documents