Document code: FOTL_241120183_2 Copyright © 2016 Firstobject Technologies Ltd. All rights reserved DABUR INDIA LTD Result Update (CONSOLIDATED BASIS): Q2 FY19 CMP: 399.00 NOV 24 th , 2018 Overweight ISIN:INE016A01026 Index Details SYNOPSIS Dabur India Limited is one of the worlds largest Ayurvedic and Natural Health Care Company. Consolidated net profit registered a growth of 4.09% and stood at Rs. 3775.20 mn in the current quarter as against Rs. 3626.70 mn in the corresponding period of the previous year. Consolidated revenue for the 2 nd quarter stood at Rs. 21249.70 mn from Rs. 19589.30 mn in the corresponding period of the previous year, up by 8.48%. During Q2 FY19, consolidated EBIDTA was Rs. 5320.40 mn as against Rs. 5042.20 mn in the corresponding period of the previous year. Consolidated PBT of the company for Q2 FY19 registered a growth of 5.00% at Rs. 4733.80 mn as against Rs. 4508.20 mn in the Q2 FY18. Revenue of the company registered at Rs. 42056.50 mn in H1 FY19 as against Rs. 37489.90 mn in H1 FY18, up by 12.18%. During H1 FY19, PAT rose by 12.75% at Rs. 7075.20 mn as compared to Rs. 6275.30 mn in H1 FY18. Growth in Domestic FMCG was 8.6% backed by one of the highest ever volume growth of 8.1%. Contribution of Domestic FMCG increased to 69.1% from 68.9% last year. Consolidated Operating Margin at 21.2% as compared to 21.4% in Q2 FY18. Net Sales and PAT of the company are expected to grow at a CAGR of 5% and 7% over 2017 to 2020E, respectively. Stock Data Sector Personal Products BSE Code 500096 Face Value 1.00 52wk. High / Low (Rs.) 490.70/312.45 Volume (2wk. Avg.) 127000 Market Cap (Rs. in mn.) 704753.70 Annual Estimated Results(A*: Actual / E*: Estimated) Years(Rs in mn) FY18A FY19E FY20E Net Sales 77483.40 83682.07 89539.82 EBITDA 19226.20 20484.74 21985.12 Net Profit 13722.80 14511.65 15566.82 EPS 7.79 8.22 8.81 P/E 51.22 48.56 45.27 Shareholding Pattern (%) As on Sep 2018 As on June 2018 Promoter 67.88 67.88 Public 32.12 32.12 Others -- -- 1 Year Comparative Graph DABUR INDIA LTD S&P BSE SENSEX PEER GROUPS CMP MARKET CAP EPS(TTM) P/E(X)(TTM) P/BV(X) DIVIDEND Company Name (Rs.) Rs. In mn. (Rs.) Ratio Ratio (%) Dabur India Ltd 399.00 704753.70 8.15 48.95 12.32 750.00 Hindustan Uniliver Ltd 1689.90 365804.02 26.48 63.82 51.69 2000.00 Godrej Consumer Products Ltd 708.10 723795.80 10.86 65.20 15.59 1200.00 Marico Ltd 353.30 456062.40 6.20 56.98 15.00 425.00

Welcome message from author
This document is posted to help you gain knowledge. Please leave a comment to let me know what you think about it! Share it to your friends and learn new things together.
Transcript

Document code: FOTL_241120183_2 Copyright © 2016 Firstobject Technologies Ltd. All rights reserved
DABUR INDIA LTDResult Update (CONSOLIDATED BASIS): Q2 FY19
CMP: 399.00 NOV 24th, 2018
Overweight ISIN:INE016A01026
Index DetailsSYNOPSIS
Dabur India Limited is one of the worlds largestAyurvedic and Natural Health Care Company.
Consolidated net profit registered a growth of 4.09%and stood at Rs. 3775.20 mn in the current quarteras against Rs. 3626.70 mn in the correspondingperiod of the previous year.
Consolidated revenue for the 2nd quarter stood at Rs.21249.70 mn from Rs. 19589.30 mn in thecorresponding period of the previous year, up by8.48%.
During Q2 FY19, consolidated EBIDTA was Rs.5320.40 mn as against Rs. 5042.20 mn in thecorresponding period of the previous year.
Consolidated PBT of the company for Q2 FY19registered a growth of 5.00% at Rs. 4733.80 mn asagainst Rs. 4508.20 mn in the Q2 FY18.
Revenue of the company registered at Rs. 42056.50mn in H1 FY19 as against Rs. 37489.90 mn in H1FY18, up by 12.18%.
During H1 FY19, PAT rose by 12.75% at Rs.7075.20 mn as compared to Rs. 6275.30 mn in H1FY18.
Growth in Domestic FMCG was 8.6% backed byone of the highest ever volume growth of 8.1%.
Contribution of Domestic FMCG increased to69.1% from 68.9% last year.
Consolidated Operating Margin at 21.2% ascompared to 21.4% in Q2 FY18.
Net Sales and PAT of the company are expected togrow at a CAGR of 5% and 7% over 2017 to 2020E,respectively.
Stock DataSector Personal ProductsBSE Code 500096Face Value 1.0052wk. High / Low (Rs.) 490.70/312.45Volume (2wk. Avg.) 127000Market Cap (Rs. in mn.) 704753.70
Annual Estimated Results(A*: Actual / E*: Estimated)Years(Rs in mn) FY18A FY19E FY20ENet Sales 77483.40 83682.07 89539.82EBITDA 19226.20 20484.74 21985.12Net Profit 13722.80 14511.65 15566.82EPS 7.79 8.22 8.81P/E 51.22 48.56 45.27
Shareholding Pattern (%)
As on Sep 2018 As on June 2018
Promoter 67.88 67.88
Public 32.12 32.12
Others -- --
1 Year Comparative Graph
DABUR INDIA LTD S&P BSE SENSEX
PEER GROUPS CMP MARKET CAP EPS(TTM) P/E(X)(TTM) P/BV(X) DIVIDENDCompany Name (Rs.) Rs. In mn. (Rs.) Ratio Ratio (%)Dabur India Ltd 399.00 704753.70 8.15 48.95 12.32 750.00Hindustan Uniliver Ltd 1689.90 365804.02 26.48 63.82 51.69 2000.00Godrej Consumer Products Ltd 708.10 723795.80 10.86 65.20 15.59 1200.00Marico Ltd 353.30 456062.40 6.20 56.98 15.00 425.00

Document code: FOTL_241120183_2 Copyright © 2016 Firstobject Technologies Ltd. All rights reserved
QUARTERLY HIGHLIGHTS (CONSOLIDATED BASIS)
Results updates- Q2 FY19,
(Rs in millions) Sep-18 Sep-17 % Change
Revenue 21249.70 19589.30 8.48%
Net Profit 3775.20 3626.70 4.09%
EPS 2.14 2.06 3.81%
PBIDT 5320.40 5042.20 5.52%
The consolidated net profit registered a growth of 4.09% and stood at Rs. 3775.20 million in the current quarter as against
Rs. 3626.70 million in the corresponding period of the previous year. Revenue for the 2nd quarter stood at Rs. 21249.70
million from Rs. 19589.30 million, up by 8.48% when compared with the prior year period. Reported earnings per share
of the company stood at Rs. 2.14 a share in the third quarter as compared to Rs. 2.06 per share in the corresponding
previous quarter. Profit before interest, depreciation and tax is Rs. 5320.40 million as against Rs. 5042.20 million in the
corresponding period of the previous year, up by 5.52%.
Break up of Expenditure
Break up ofExpenditure
Value in Rs. Million
Q2 FY19 Q2 FY18 %Change
Cost of MaterialsConsumed ( includeExcise Duty)
9188.10 7721.50 19%
Purchase of Stock inTrade 2127.80 1266.90 68%
Employee BenefitsExpense 2343.20 2037.30 15%
Depreciation &Amortization Expense 431.00 400.80 8%
Advertisement andPublicity 1335.00 1457.10 -8%
Others 2304.90 2124.50 8%

Document code: FOTL_241120183_2 Copyright © 2016 Firstobject Technologies Ltd. All rights reserved
Segment Revenue:
Q2 FY19 – Overview:
Growth in Domestic FMCG was 8.6% backed by one of the highest ever volume growth of 8.1%.
Contribution of Domestic FMCG increased to 69.1% from 68.9% last year.
Consolidated Operating Margin at 21.2% as compared to 21.4% in Q2 FY18.
Domestic FMCG – Category-wise Sales:
Category Highlights:
Home and Personal Care (HPC) – Q2 FY19:
HPC posted growth of 10.2% in Q2 FY19 at Rs. 7541 mn as against Rs. 6840 mn in Q2 FY18
Oral care recorded growth of 3.9% with toothpastes growing at 6.2%
Red Toothpaste Franchise continued its growth momentum with RTP growing by 19.5%
Document code: FOTL_241120183_2 Copyright © 2016 Firstobject Technologies Ltd. All rights reserved
Hair oil category grew by 11.1% with gain in market share of 120 basis points over previous year
Shampoos category reported strong growth of 49% led by on ground activations and visibility drives
Homecare category posted double digit growth of 10.9% with strong growth in Odonil and Sanifresh
Skin care recorded growth of 11.9% driven by double digit growth in Gulabari and Oxy bleaches
Healthcare (HC) – Q2 FY19:
Healthcare grew by 10.6% in Q2 FY19 at Rs. 4303 mn as compared to Rs. 3890 mn in Q2 FY18.
Health Supplements reported growth of 12.3% as Chyawanprash and Honey performed well
Chyawanprash grew by 11.8%
Dabur Honey grew by 12.8%
Digestives posted growth of 10.8% on the back of strong performance of Hajmola tablets and Pudin Hara
OTC category grew by 10% on the back of good growth in Lal Tail, Honitus and Shilajit
Ethicals portfolio reported growth of 6.1% led by Branded Ethicals and Roaks
Foods– Q2 FY19:
Food decreased from 18.8% in Q2 FY18 to 17.5% in Q2 FY19
Beverages grew by 1.5% - mainly impacted by shifting of the Diwali season to Q3
Q2 FY19 - Product Launches:
Dabur India Ltd Launched Odonil Zipper – New Fragrances Alluring Daffodil and Scintillating Rose.
Dabur India Ltd launched Honey Squeezy – New SKU 225 gm.
International Business – Q2 FY19:
International Business posted 8.9% growth with constant currency growth of 7%
Egypt business continues to do well with constant currency growth of 27% in Q2 FY18
SSA grew by 16% on constant currency basis, despite a slowdown in Nigeria
Turkey recorded 16% growth in constant currency terms; however was impacted by currency devaluation
GCC markets declined by 7% due to consumption pressure and sharp decline in categories
Namaste business reported growth of 4.4% in constant currency terms.

Document code: FOTL_241120183_2 Copyright © 2016 Firstobject Technologies Ltd. All rights reserved
COMPANY PROFILE
Dabur India Limited is one of India’s leading FMCG Companies. Building on a legacy of quality and experience for 134
years, Dabur is today India's most trusted name and one of the world’s largest Ayurvedic and Natural Health Care
Company. Dabur India's FMCG portfolio today includes five flagship brands with distinct brand identities — Dabur as the
master brand for natural healthcare products, Vatika for premium personal care, Hajmola for digestives, Réal for fruit-
based beverages, and Fem for fairness bleaches & skin care.
Document code: FOTL_241120183_2 Copyright © 2016 Firstobject Technologies Ltd. All rights reserved
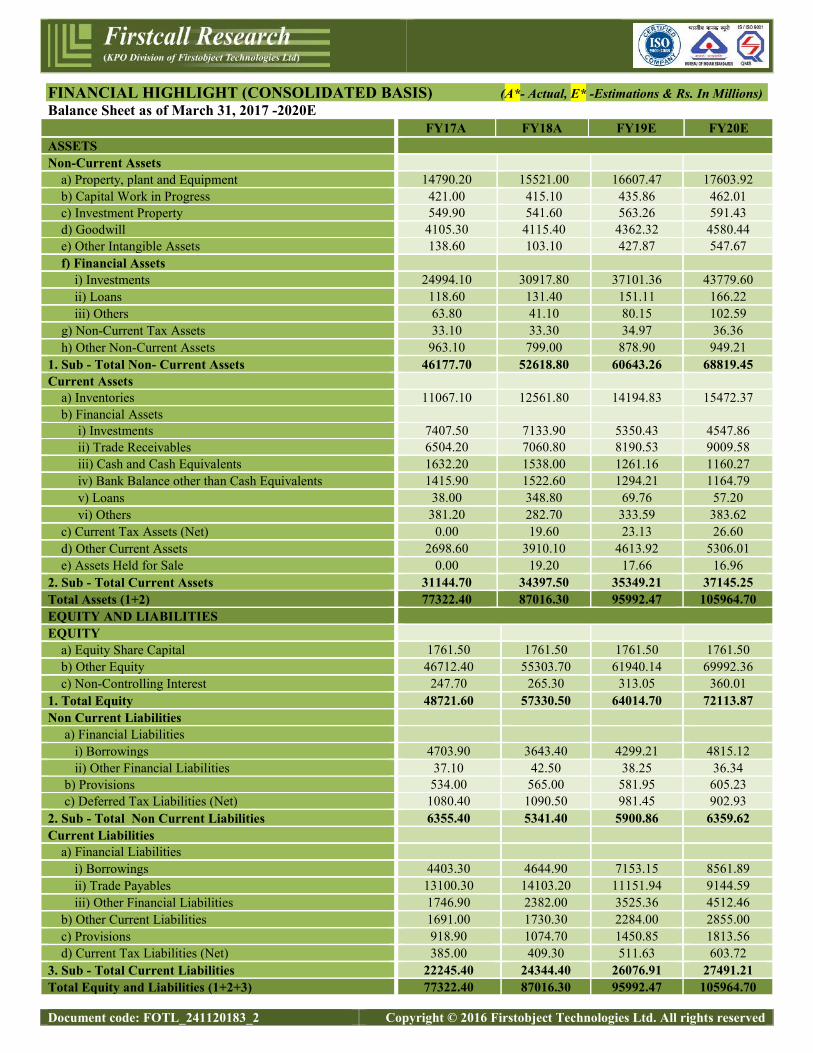
FINANCIAL HIGHLIGHT (CONSOLIDATED BASIS) (A*- Actual, E* -Estimations & Rs. In Millions)Balance Sheet as of March 31, 2017 -2020E
FY17A FY18A FY19E FY20EASSETSNon-Current Assets
a) Property, plant and Equipment 14790.20 15521.00 16607.47 17603.92b) Capital Work in Progress 421.00 415.10 435.86 462.01c) Investment Property 549.90 541.60 563.26 591.43d) Goodwill 4105.30 4115.40 4362.32 4580.44e) Other Intangible Assets 138.60 103.10 427.87 547.67f) Financial Assets
i) Investments 24994.10 30917.80 37101.36 43779.60ii) Loans 118.60 131.40 151.11 166.22iii) Others 63.80 41.10 80.15 102.59
g) Non-Current Tax Assets 33.10 33.30 34.97 36.36h) Other Non-Current Assets 963.10 799.00 878.90 949.21
1. Sub - Total Non- Current Assets 46177.70 52618.80 60643.26 68819.45Current Assets
a) Inventories 11067.10 12561.80 14194.83 15472.37b) Financial Assets
i) Investments 7407.50 7133.90 5350.43 4547.86ii) Trade Receivables 6504.20 7060.80 8190.53 9009.58iii) Cash and Cash Equivalents 1632.20 1538.00 1261.16 1160.27iv) Bank Balance other than Cash Equivalents 1415.90 1522.60 1294.21 1164.79v) Loans 38.00 348.80 69.76 57.20vi) Others 381.20 282.70 333.59 383.62
c) Current Tax Assets (Net) 0.00 19.60 23.13 26.60d) Other Current Assets 2698.60 3910.10 4613.92 5306.01e) Assets Held for Sale 0.00 19.20 17.66 16.96
2. Sub - Total Current Assets 31144.70 34397.50 35349.21 37145.25Total Assets (1+2) 77322.40 87016.30 95992.47 105964.70EQUITY AND LIABILITIESEQUITY
a) Equity Share Capital 1761.50 1761.50 1761.50 1761.50b) Other Equity 46712.40 55303.70 61940.14 69992.36c) Non-Controlling Interest 247.70 265.30 313.05 360.01
1. Total Equity 48721.60 57330.50 64014.70 72113.87Non Current Liabilities
a) Financial Liabilitiesi) Borrowings 4703.90 3643.40 4299.21 4815.12ii) Other Financial Liabilities 37.10 42.50 38.25 36.34
b) Provisions 534.00 565.00 581.95 605.23c) Deferred Tax Liabilities (Net) 1080.40 1090.50 981.45 902.93
2. Sub - Total Non Current Liabilities 6355.40 5341.40 5900.86 6359.62Current Liabilities
a) Financial Liabilitiesi) Borrowings 4403.30 4644.90 7153.15 8561.89ii) Trade Payables 13100.30 14103.20 11151.94 9144.59iii) Other Financial Liabilities 1746.90 2382.00 3525.36 4512.46
b) Other Current Liabilities 1691.00 1730.30 2284.00 2855.00c) Provisions 918.90 1074.70 1450.85 1813.56d) Current Tax Liabilities (Net) 385.00 409.30 511.63 603.72
3. Sub - Total Current Liabilities 22245.40 24344.40 26076.91 27491.21Total Equity and Liabilities (1+2+3) 77322.40 87016.30 95992.47 105964.70

Document code: FOTL_241120183_2 Copyright © 2016 Firstobject Technologies Ltd. All rights reserved
Annual Profit & Loss Statement for the period of 2017 to 2020E
Value(Rs.in.mn) FY17A FY18A FY19E FY20E
Description 12m 12m 12m 12mNet Sales 77014.40 77483.40 83682.07 89539.82Other Income 2983.50 3051.80 3204.39 3396.65Total Income 79997.90 80535.20 86886.46 92936.47Expenditure -61925.00 -61309.00 -66401.72 -70951.35Operating Profit 18072.90 19226.20 20484.74 21985.12Interest -540.30 -530.50 -610.08 -671.08Gross Profit 17532.60 18695.70 19874.66 21314.04Depreciation -1428.60 -1621.80 -1751.54 -1909.18Profit Before Tax 16104.00 17073.90 18123.12 19404.85Tax -3303.40 -3353.50 -3613.75 -3840.22Profit After Tax 12800.60 13720.40 14509.37 15564.63Share of Profit & Loss Assoc 2.50 2.40 2.28 2.19Net Profit 12803.10 13722.80 14511.65 15566.82Equity Capital 1761.50 1761.50 1766.30 1766.30Reserves 46712.40 55303.70 63599.26 73139.14Face value 1.00 1.00 1.00 1.00EPS 7.27 7.79 8.22 8.81
Quarterly Profit & Loss Statement for the period of 31st Mar, 2018 to 31st Dec, 2018E
Value(Rs.in.mn) 31-Mar-18 30-June-18 30-Sep-18 31-Dec-18E
Description 3m 3m 3m 3mNet sales 20329.10 20806.80 21249.70 20187.22Other Income 732.40 736.50 812.10 747.13
Total Income 21061.50 21543.30 22061.80 20934.35
Expenditure -15477.30 -16945.60 -16741.40 -15911.56
Operating profit 5584.20 4597.70 5320.40 5022.78Interest -132.40 -148.80 -155.60 -147.82
Gross profit 5451.80 4448.90 5164.80 4874.96
Depreciation -425.90 -427.30 -431.00 -452.55
Profit Before Tax 5025.90 4021.60 4733.80 4422.41
Tax -1052.30 -723.80 -961.30 -913.23
Profit After Tax 3973.60 3297.80 3772.50 3509.19Share of Profit & Loss of Assoc -1.80 2.20 2.70 2.03
Net Profit 3971.80 3300.00 3775.20 3511.21Equity Capital 1761.50 1766.30 1766.30 1766.30
Face Value 1.00 1.00 1.00 1.00
EPS 2.25 1.87 2.14 1.99

Document code: FOTL_241120183_2 Copyright © 2016 Firstobject Technologies Ltd. All rights reserved
Ratio Analysis
Particulars FY17A FY18A FY19E FY20E
EPS (Rs.) 7.27 7.79 8.22 8.81EBITDA Margin (%) 23.47% 24.81% 24.48% 24.55%PBT Margin (%) 20.91% 22.04% 21.66% 21.67%PAT Margin (%) 16.62% 17.71% 17.34% 17.38%P/E Ratio (x) 54.90 51.22 48.56 45.27ROE (%) 26.41% 24.04% 22.20% 20.78%ROCE (%) 28.91% 26.94% 24.39% 22.74%Debt Equity Ratio 0.19 0.15 0.18 0.18EV/EBITDA (x) 38.81 36.46 34.58 32.35Book Value (Rs.) 27.52 32.40 37.01 42.41P/BV 14.50 12.32 10.78 9.41
Charts

Document code: FOTL_241120183_2 Copyright © 2016 Firstobject Technologies Ltd. All rights reserved
OUTLOOK AND CONCLUSION
At the current market price of Rs. 399.00, the stock P/E ratio is at 48.56 x FY19E and 45.27 x FY20E respectively.
Earning per share (EPS) of the company for the earnings for FY19E and FY20E are seen at Rs. 8.22 and Rs. 8.81,
respectively.
Net Sales and PAT of the company are expected to grow at a CAGR of 5% and 7% over 2017 to 2020E, respectively.
On the basis of EV/EBITDA, the stock trades at 34.58 x for FY19E and 32.35 x for FY20E.
Price to Book Value of the stock is expected to be at 10.78 x and 9.41 x for FY19E and FY20E respectively.
Hence, we say that, we are Overweight in this particular scrip for Medium to Long term investment.
INDUSTRY OVERVIEW
Fast moving consumer goods (FMCG) is the 4th largest sector in the Indian economy. There are three main segments in
the sector – Food and Beverages, Healthcare and Household and Personal Care. The FMCG sector has grown from $31.6
billion in 2011 to $49 billion in 2016, according to India Brand Equity Foundation (IBEF) report on the FMCG industry.
Growing incomes, favourable demographics, easier access and changing lifestyles are the key growth drivers for the
consumer market. The FMCG industry is expected to reap the benefits of the government’s renewed focus on agriculture,
education, healthcare, infrastructure and employment in its Union Budget 2018-19. These initiatives are expected to
increase the disposable income in the hands of the common man, especially in the rural areas, which will be beneficial for
the sector.
The recent years have seen the emergence of a significant trend in the Indian consumer market: growing preference for
herbal and Ayurvedic products. The herbal or natural wave has been gaining traction in India, driven by resurgent pride
among the youth on Indian culture and Indian products. They have been showing greater willingness to embrace products

Document code: FOTL_241120183_2 Copyright © 2016 Firstobject Technologies Ltd. All rights reserved
that offer the tried-and-tested benefits of traditional Ayurveda, but presented in modern day and contemporary formats.
This trend has been gaining traction across the categories with leading MNCs also joining the bandwagon.
Companies with traditional herbal positioning and strong R&D are more likely to benefit disproportionately from this
trend. As the leading player in the Ayurveda and natural health and personal care market, Dabur has been working
towards making traditional Indian knowledge available in a form that appeals to the modern consumer.
India FMCG Business:
The India FMCG business includes the Consumer Care Business comprising key categories like Health Care
(encompassing Health Supplements, Digestives, OTC and Ethicals), Home & Personal Care (comprising Hair Care, Oral
Care, Skin Care and Home Care) and Foods. The company has a wide distribution network, covering over 6.3 million
retail outlets with a high penetration in both urban and rural markets. The India FMCG business, despite the strong
headwinds in the form of pre-GST jitters reported 8.1% growth during fiscal 2017-18.
Health Care:
Ayurveda-based products have been gaining traction in India over the past few years on account of rising awareness about
harmful effects of chemicals and allopathic medicines, coupled with increasing number of product innovations by
companies. The pace of growth is expected to continue in years to come with a growing number of young people
beginning to embrace this traditional medicine.
According to a TechSci Research report, “India Ayurvedic Products Market Forecast & Opportunities, 2011-2021”, the
Ayurvedic products market in India is projected to register a CAGR of 16% between 2016 and 2021. It says that the rising
health concerns and awareness of side-effects of allopathy are some of the major factors driving consumer preference for
Ayurvedic products in the country.
The Government has also been making concerted efforts towards encouraging and promoting usage of Ayurvedic
products through education and national awareness programmes. Various initiatives like celebration of the National
Ayurveda Day, seminars, conclaves and programmes for prevention and control of Diabetes and Non-Communicable
Diseases has increased awareness about this system of medicine among people.
As the country’s leading Science-based Ayurveda expert, Dabur has been at the forefront on carrying out collaborative
research and modern technology to further establish the benefits of various traditional Ayurvedic formulations, products
and ingredients. The Company constantly investing in not just updating and upgrading its Health Care portfolio, but also
towards making it more contemporary and in sync with the ever-changing needs and aspirations of the modernday
consumer. All this is being done while keeping the core of Ayurveda intact. The Dabur Research & Development Centre
(DRDC) has been undertaking, coordinating and promoting research on scientific lines in Ayurvedic Sciences. This
research work is executed by an able team of over 100 scientists and also through collaborative studies with various
universities, hospitals, research institutes and government bodies.
Dabur’s Health Care vertical today comprises Health Supplements, Digestives, Over-The-Counter (OTC) and Ayurvedic
Ethical products. This vertical contributed 31.7% to the India FMCG sales in 2017-18.
Document code: FOTL_241120183_2 Copyright © 2016 Firstobject Technologies Ltd. All rights reserved
Home & Personal Care:
Led by a widespread lifestyle shift, triggered mainly by environmental awareness, millennial trends and growing
awareness about health and wellness, many of today’s consumers are demanding natural or nature-based products in
categories such as personal care, household care and cosmetics. A survey carried out by Euro monitor International
reveals that over half of Indian consumers reported that ‘natural or organic’ features are known to influence their hair and
skin care purchase decisions. About 71% of consumers surveyed said that they would pick up a face cream or lotion
provided it claimed to be ‘natural’, while 38% said they would buy a shampoo or hair oil, if it was made with ‘botanical’
ingredients.
This points towards a growing across-the-board trend among Indian consumers for natural ingredients in personal care
products and an affinity and innate belief in the goodness of ancient Indian wisdom. For over a century, Dabur has been
offering consumers natural and Ayurveda-based personal care solutions. Dabur offers a rangeof product covering Hair
Care, Oral Care, Skin Care & Salon and Home Care. This vertical contributed 50.4% to the India FMCG sales.
Foods:
Dabur’s Foods business largely comprises packaged fruit juices & beverages with culinary pastes forming a small part of
the business. This business contributed 18.0% to the India FMCG Business. This business reported moderate growth
during 2017-18 as the category witnessed increased competitive intensity and increase in number of players at the
economy end of the market. Dabur is the pioneer in packaged fruit juice market in India and enjoys nearly 55% share of
the category with a range of products under the brands Real and Real Activ. With the widest and healthiest product range
in the industry, constant innovation and unwavering focus on quality, Dabur has maintained its lead despite the entry of
new players offering lower priced and discounted products.
The company increased its media spends and focused on enhancing its distribution footprint and penetration. During the
festive season, Real introduced an exclusive range of 13 specially crafted gift packs of Real fruit beverages, offering
consumers the option of gifting real health to their near and dear ones. The range has been eloquently designed to
communicate the goodness of fruits and the concept of ‘Festive Wishes of Good Health’.
Special utility pack options were also part of the offering, keeping up with the theme of offering consumers new, healthy
gifting options. These packs were well received by consumers. Gift packs of Real fruit juices are also available during
other festive seasons such as Rakhi, Eid and Christmas.
As part of its theme of offering ‘Health and Wellness’ the division had launched Active Coconut Water couple of years
ago. The brand saw strong growth this year supported by preference for natural beverages which offer nutrition in addition
to quenching thirst. The Mausambi juice variant which was launched last year received a good response and gained
saliency in the portfolio.
Retail Business – NewU:
Dabur operates in the specialized beauty retail business with its wholly-owned subsidiary, H&B Stores Ltd. This is a
chain of beauty retail stores under the brand ‘NewU’, offering a wide range of beauty care products covering cosmetics,
Document code: FOTL_241120183_2 Copyright © 2016 Firstobject Technologies Ltd. All rights reserved
fragrances, skin care, personal care and beauty and fashion accessories. NewU is today amongst the largest one-stop shop
for all beauty care needs with a range of domestic and exclusive international brands available at its stores.
Outlook:
The FMCG industry in India faced stress at the beginning of the fiscal year due to the implementation of GST but
recovered considerably in the later part of the year. That said, implementation of GST in India is a big positive for the
FMCG sector as it has enabled a unified tax structure, easier movement of goods across the country, conversion from
unorganized to organized sector and streamlining of tax structure across categories. While there are some near-term
inflationary pressures and challenges due to the increase in prices of crude oil and other raw materials, overall consumer
demand is resilient and the consumer industry is expected to grow at a good pace in the medium to long term.
Increasing preference for natural products, rising incomes and aspirations, low penetration of most of the categories and
changing lifestyle will be the drivers for the FMCG sector. Company, with its brands, infrastructure, capabilities and
management depth is well placed to leverage this opportunity. The Company has a strong product pipeline and has also
been aggressively investing in various communication and distribution initiatives to create and efficiently service demand
for its products.
International markets witnessed recovery after the slowdown on the back of low crude prices in the past few years.
Adverse currency movements in some markets like Egypt, Nigeria and Turkey impacted the company’s consolidated sales
growth although these markets have grown well in local currency terms. The translation impact is likely to reduce in fiscal
2018-19 as the currency depreciation has come into the base. Outlook for African markets remains positive. SAARC
region has been stable and performed well. The outlook for this region remains positive for the next fiscal.

Document code: FOTL_241120183_2 Copyright © 2016 Firstobject Technologies Ltd. All rights reserved
Disclosure Section
The information and opinions in Firstcall Research was prepared by our analysts and it does not constitute an offer orsolicitation for the purchase or sale of any financial instrument including any companies scrips or this is not an officialconfirmation of any transaction. The information contained herein is from publicly available secondary sources and dataor other secondary sources believed to be reliable but we do not represent that it is accurate or complete and it should notbe relied on as such. Firstcall Research or any of its affiliates shall not be in any way responsible for any loss or damagethat may arise to any person from any inadvertent error in the information contained in this report. Firstcall Research and/or its affiliates and/or employees will not be liable for the recipients’ investment decision based on this document.
Analyst Certification
The following analysts hereby state that their views about the companies and sectors are on best effort basis to the best oftheir knowledge. Unless otherwise stated, the individuals listed on the cover page of this report are research analysts. Theanalyst qualifications, sectors covered and their exposure if any are tabulated hereunder:
Name of the Analyst Qualifications SectorsCovered
Exposure/Interest tocompany/sector UnderCoverage in the CurrentReport
Dr.C.V.S.L. Kameswari M.Sc, PGDCA,M.B.A,Ph.D (Finance)
Pharma &Diversified
No Interest/ Exposure
U. Janaki Rao M.B.A CapitalGoods
No Interest/ Exposure
B. Anil Kumar M.B.A Auto, IT &FMCG
No Interest/ Exposure
V. Harini Priya M.B.A Diversified No Interest/ ExposureB. Srikanth M.B.A Diversified No Interest/ Exposure
Important Disclosures on Subject Companies
In the next 3 months, neither Firstcall Research nor the Entity expects to receive or intends to seek compensation for anyservices from the company under the current analytical research coverage. Within the last 12 months, Firstcall Researchhas not received any compensation for its products and services from the company under the current coverage. Within thelast 12 months, Firstcall Research has not provided or is providing any services to, or has any client relationship with, thecompany under current research coverage.
Within the last 12 months, Firstcall Research has neither provided or is providing any services to and/or in the past has notentered into an agreement to provide services or does not have a client relationship with the company under the researchcoverage.
Certain disclosures listed above are also for compliance with applicable regulations in various jurisdictions. FirstcallResearch does not assign ratings of Buy, Hold or Sell to the stocks we cover. Overweight, Equal-weight, No-Weight andUnderweight are not the equivalent of buy, hold and sell. Investors should carefully read the definitions of all weightsused in Firstcall Research. In addition, since Firstcall Research contains more complete information concerning theanalyst's views, investors should carefully read Firstcall Research, in its entirety, and not infer the contents from theweightages assigned alone. In any case, weightages (or research) should not be used or relied upon as investment advice.An investor's decision to buy or sell should depend on individual circumstances (such as the investor's own discretion, hisability of understanding the dynamics, existing holdings) and other considerations.

Document code: FOTL_241120183_2 Copyright © 2016 Firstobject Technologies Ltd. All rights reserved
Analyst Stock Weights
Overweight (O): The stock's total return is expected to exceed the average total return of the analyst's industry (orindustry team's) coverage universe, on a risk-adjusted basis, over the next 12-18 months.
Equal-weight (E): The stock's total return is expected to be in line with the average total return of the analyst's industry(or industry team's) coverage universe, on a risk-adjusted basis, over the next 12-18 months.
No-weight (NR): Currently the analyst does not have adequate conviction about the stock's total return relative to theaverage total return of the analyst's industry (or industry team's) coverage universe, on a risk-adjusted basis, over the next12-18 months.
Underweight (U): The stock's total return is expected to be below the average total return of the analyst's industry (orindustry team's) coverage universe, on a risk-adjusted basis, over the next 12-18 months.
Unless otherwise specified, the weights included in Firstcall Research does not indicate any price targets. The statisticalsummaries of Firstcall Research will only indicate the direction of the industry perception of the analyst and theinterpretations of analysts should be seen as statistical summaries of financial data of the companies with perceivedindustry direction in terms of weights.
Firstcall Research may not be distributed to the public media or quoted or used by the public media without the expresswritten consent of Firstcall Research. The reports of Firstcall Research are for Information purposes only and is not to beconstrued as a recommendation or a solicitation to trade in any securities/instruments. Firstcall Research is not abrokerage and does not execute transactions for clients in the securities/instruments.
Firstcall Research - Overall StatementS. No Particulars Remarks1 Comments on general trends in the securities market Full Compliance in Place2 Discussion is broad based and also broad based indices Full Compliance in Place3 Commentaries on economic, political or market conditions Full Compliance in Place4
Periodic reports or other communications not for public appearanceFull Compliance in Place
5 The reports are statistical summaries of financial data of the companies as and whereapplicable
Full Compliance in Place
6 Analysis relating to the sector concerned Full Compliance in Place7 No material is for public appearance Full Compliance in Place8 We are no intermediaries for anyone and neither our entity nor our analysts have any
interests in the reportsFull Compliance in Place
9 Our reports are password protected and contain all the required applicabledisclosures
Full Compliance in Place
10 Analysts as per the policy of the company are not entitled to take positions either fortrading or long term in the analytical view that they form as a part of their work
Full Compliance in Place
11 No conflict of interest and analysts are expected to maintain strict adherence to thecompany rules and regulations.
Full Compliance in Place
12As a matter of policy no analyst will be allowed to do personal trading or deal andeven if they do so they have to disclose the same to the company and take priorapproval of the company
Full Compliance in Place
13Our entity or any analyst shall not provide any promise or assurance of any favorableoutcome based on their reports on industry, company or sector or group
Full Compliance in Place

Document code: FOTL_241120183_2 Copyright © 2016 Firstobject Technologies Ltd. All rights reserved
14 Researchers maintain arms length/ Chinese wall distance from other employees ofthe entity
Full Compliance in Place
15No analyst will be allowed to cover or do any research where he has financial interest
Full Compliance in Place
16 Our entity does not do any reports upon receiving any compensation from anycompany
Full Compliance in Place
Firstcall Research Provides
Industry Research on all the Sectors and Equity Research on Major Companiesforming part of Listed and Unlisted Segments
For Further Details Contact:Mobile No: 09959010555
E-mail: [email protected]@firstcallresearch.comwww.firstcallresearch.com
Related Documents